Trade liberalization and manufacturing employment
68
EMPLOYMENT PAPER 2000/3 Trade liberalization and Trade liberalization and manufacturing employment manufacturing employment Ajit K. Ghose Ajit K. Ghose Senior economist Employment Strategy Department Employment Sector International Labour Office Geneva ISBN 92-2-112066-X ISSN 1020-5322 First Published 2000
-
Upload
khangminh22 -
Category
Documents
-
view
3 -
download
0
Transcript of Trade liberalization and manufacturing employment
EMPLOYMENT PAPER2000/3
Trade liberalization andTrade liberalization and
manufacturing employmentmanufacturing employment
Ajit K. GhoseAjit K. GhoseSenior economist
Employment Strategy Department
Employment SectorInternational Labour Office Geneva
ISBN 92-2-112066-XISSN 1020-5322
First Published 2000

Foreword
This paper is an output of the work on “global economic integration and employmentpolicy” being carried out by the Employment Strategy Department. It focusses on the changingpatterns of global trade flows and their consequences for manufacturing employment and wagesin industrialized and developing countries. These are issues of considerable current interest fornational policy makers, international organizations and the academic community alike. Althoughthe issues have received much attention from researchers in recent years, the knowledge-baseremains inadequate and no widely accepted conclusions have emerged. This paper, which is basedon substantive empirical analysis, is expected to contribute to the developing knowledge-base andthe ongoing international debates.
The main findings of the paper can be briefly stated as follows. In spite of the wide-spreadadoption of trade liberalization policies, significant advances in transport and communicationsystems and rapid growth of cross-border capital flows, world trade and GDP have recordeddecelerating growth over the past two decades. The reason very probably lies in the fact that alarge majority of the developing countries, given their inadequate physical and socialinfrastructure, have been unable to benefit from trade liberalization. Analysis of the changingpattern of world trade shows that the really significant recent development is the emergence of ahandful of developing economies as important exporters of manufactures. The employment andlabour market effects of trade liberalization, therefore, have basically been felt in industrializedeconomies and in a handful of developing economies. In the case of industrialized economies,growth of manufactured imports from developing countries has had a small adverse effect onmanufacturing employment but virtually no effect on wages. Thus unemployment and growingwage inequalities cannot really be attributed to trade. On the other hand, in those developingeconomies which emerged as important exporters of manufactures to industrialized countries,growth of trade had a large positive effect on manufacturing employment and wages. In some ofthese economies, moreover, growth of trade was also associated with declining wage inequality.Thus, on balance, the global effects of trade liberalization on manufacturing employment andwages appear to have been significantly positive even though there have been job-losers in bothindustrialized and developing economies. This means that the popular apprehensions about theeffects of trade liberalization, though not wholly unfounded, are grossly exaggerated. Thechallenges that must be confronted, the study suggests, are those of enabling many moredeveloping economies to benefit from trade liberalization and providing social assistance to job-losers in both industrialised and developing countries.
Werner SengenbergerDirector
Employment Strategy Department

Acknowledgement
The author is grateful to Ms. Smita Barbattini who provided invaluable assistance in dataprocessing and computational work. Thanks are also due to Ms. Tashi Kaul who provided helpfulresearch assistance. The author received helpful comments and suggestions from Peter Richards,Rolph van der Hoeven, Wouter van Ginneken and the participants of a seminar at the ILO. Noneof them should be held responsible for the views or errors in the paper.

Contents
Page
Foreword
Acknowledgement
1. Introduction . . . . . . . . . . . . . . . . . . . . . . . . . . . . . . . . . . . . . . . . . . . . . . . . . . . . . . . . . . . . . . . . . . . . 1
2. Trade and manufacturing employment: The basic trade-theoretic argument . . . . . . . . . . . . . . . . . . . . 3
3. Some doses of realism . . . . . . . . . . . . . . . . . . . . . . . . . . . . . . . . . . . . . . . . . . . . . . . . . . . . . . . . . . . . 53.1 Non-traded goods . . . . . . . . . . . . . . . . . . . . . . . . . . . . . . . . . . . . . . . . . . . . . . . . . . . . . . . . . 53.2 Surplus labour and dualism in developing countries . . . . . . . . . . . . . . . . . . . . . . . . . . . . . . . 53.3 International labour mobility . . . . . . . . . . . . . . . . . . . . . . . . . . . . . . . . . . . . . . . . . . . . . . . . 73.4 Aggregate employment in manufacturing . . . . . . . . . . . . . . . . . . . . . . . . . . . . . . . . . . . . . . 93.5 A summing up . . . . . . . . . . . . . . . . . . . . . . . . . . . . . . . . . . . . . . . . . . . . . . . . . . . . . . . . . . 10
4. The changing pattern of world trade . . . . . . . . . . . . . . . . . . . . . . . . . . . . . . . . . . . . . . . . . . . . . . . . 10
5. Trade and manufacturing employment: Empirical analysis . . . . . . . . . . . . . . . . . . . . . . . . . . . . . . . 155.1 Database and methodology . . . . . . . . . . . . . . . . . . . . . . . . . . . . . . . . . . . . . . . . . . . . . . . . 155.2 Factor content of exports and imports . . . . . . . . . . . . . . . . . . . . . . . . . . . . . . . . . . . . . . . . 175.3 Trade and employment . . . . . . . . . . . . . . . . . . . . . . . . . . . . . . . . . . . . . . . . . . . . . . . . . . . . 205.4 Trade and wages . . . . . . . . . . . . . . . . . . . . . . . . . . . . . . . . . . . . . . . . . . . . . . . . . . . . . . . . 29
6. Conclusions . . . . . . . . . . . . . . . . . . . . . . . . . . . . . . . . . . . . . . . . . . . . . . . . . . . . . . . . . . . . . . . . . . 34
Appendix I: Statistical Tables . . . . . . . . . . . . . . . . . . . . . . . . . . . . . . . . . . . . . . . . . . . . . . . . . . . . . . . . 37
Appendix II: Lists of Export-Oriented and Import-Competing Industries forDifferent Countries and Regions . . . . . . . . . . . . . . . . . . . . . . . . . . . . . . . . . . . . . . . . . . . . 50
References . . . . . . . . . . . . . . . . . . . . . . . . . . . . . . . . . . . . . . . . . . . . . . . . . . . . . . . . . . . . . . . . . . . . . . . . . . 62

1 The literature is large, but it will suffice here to mention a few of the relevant studies. See Wood, 1994and 1998; Slaughter, 1998; and Collins, ed., 1998. Useful summaries of the issues and the arguments are availablein Wood, 1995; IMF, 1997; and ILO, 1995.
2 Only one study (Wood, 1994) concludes that a large part of the change in the fortunes of the unskilledworkers in industrialized countries is explained by trade in manufactures with developing countries.
1. Introduction
It is widely believed that trade liberalization has been a major cause of the growinginequalities between skilled and unskilled labour in industrialized countries. Since the lateseventies, gaps between skilled and unskilled labour in terms of wages and/or unemployment rateshave been widening in these countries. This has also been a period when barriers to internationaltransactions have been progressively falling. Many economists argue that these developments arecausally linked. Trade liberalization, the argument runs, has led to a shift of production base forunskilled-labour-intensive manufactures from industrialized to developing countries, therebycausing a decline in the demand for unskilled labour in the former. This has led either to a declinein the wages of unskilled labour or, if there are wage rigidities, to a rise in the unemploymentrate of unskilled workers. There is also a fear (not always openly expressed) that thesedevelopments may not be just one-off in nature. Given the radically different age-structures ofpopulation, labour force growth will be much faster in developing than in industrialized countriesin the foreseeable future. This will mean a declining trend in the ratio of skilled to unskilledworkers in the world labour force. Given such a trend in an increasingly globalized world, manyfear that it will be difficult to halt the decline in the fortunes of unskilled workers in industrializedcountries.
The argument, derived from the standard theories of international trade, appears plausibleenough but is not in fact strongly supported by the empirical evidence available so far.1 There isvirtual consensus among economists that two-way trade in manufactures between theindustrialized countries of North America and Western Europe and the developing countries ofAsia and Latin America has been growing since the mid-eighties; that less skilled workers in theindustrialized world have been facing either declining real wages or rising unemployment or both;and that the growing gaps between skilled and unskilled workers in these countries are notadequately explained by the supply-side developments in their labour markets. But there is noconsensus on the idea that the changes in trade patterns in fact explain the labour marketdevelopments. In the first place, there are controversies on appropriate methodology of using theavailable statistical data for assessing the effects of trade on labour markets. Secondly, most of theestimates (irrespective of the methodologies used) show the effect of trade to have been rathersmall.2 Thirdly, the observed movements of relative prices do not seem to suggest trade as a majorcause of labour market changes. Finally, a competing hypothesis, which focuses on the nature ofautonomous technological change, appears to perform better in some respects in explaining thelabour market developments.
For economists, therefore, the question of linkage between trade liberalization and thegrowing inequalities between skilled and unskilled workers in industrialized countries remains anopen one. In popular perception, however, such a linkage tends to be treated as something already
2
3 Statements from well-known economists have sometimes served to deepen popular apprehensions. Hereis a statement from Paul A. Samuelson: “As the billions of people who live in East Asia and Latin Americaqualify for good, modern jobs, the half billion Europeans and North Americans who used to tower over the restof the world will find their upward progress in living standards encountering tough resistance.” Paul A.Samuelson quoted in Bhagwati and Dahejia, 1994.
4 Nobody doubts that achievement of minimum labour standards in all countries of the world andprevention of competitive debasement of labour standards are most desirable goals. What is open to doubt is thedesirability of linking the attainment of these goals with trade. Doubts arise not only because quick implementationof “labour standards conditionalities” is virtually impossible (obviously, improving labour standards is not likeadjusting budget deficits or exchange rates) but also because it is not at all clear what such “conditionalities” areexpected to achieve. As we shall see below, gains from trade arise not from differences among countries inabsolute labour standards but from differences in relative labour standards (for skilled vis-à-vis unskilled labour)which are determined by country-level labour supply conditions. In the most unlikely case where universalimplementation of minimum labour standards actually serves to equalize relative labour standards across countries,trade based on comparative advantage will simply not occur. If, on the other hand, such action only raises labourstandards for all types of workers without affecting relative labour standards, neither the nature nor the labourmarket effects of trade relations between industrialized and developing countries will change. In particular, thepossibility of competitive debasement of labour standards will not be eliminated. In reality, therefore,implementation of minimum labour standards for all countries will either serve as a protectionist measure or leavethe problems of unskilled workers in industrialized countries unaddressed.
5 See Standing, 1999 for a discussion of some of the schemes currently in operation in industrializedcountries.
6 One of the few to have done such work is Wood (1994). Even in his study, however, the analysis ofdeveloping country situations suffer from many more limitations than the analysis of industrialized countrysituations.
firmly established.3 Moreover, while economists (both proponents and opponents of theargument) are virtually unanimous in suggesting that the real solution to the problem (to the extentthat it exists) lies in “skilling the unskilled”, popular concerns have led to demands forprotectionism and for global implementation of minimum environmental and labour standards.4
Meanwhile, labour market policies in many industrialized countries have increasingly been gearedto cheapening unskilled labour for the employers through various forms of wage and employmentsubsidies, reform of social security and unemployment benefit systems, and flexibilization of labourmarkets.5
What is remarkable in all this is that debates on the subject have been largely about theeffects of trade liberalization on labour markets in industrialized countries. The rather obviousimplications of the same argument - that trade liberalization has had the effect of boostingmanufacturing employment in developing countries and that unskilled workers in developingcountries are the main beneficiaries of the process - have so far received inadequate attention ininvestigative work.6 Yet empirical substantiation of these propositions is obviously important fora balanced assessment of the ‘rights’ and ‘wrongs’ of trade liberalization. It is worth noting inthis context that there are in fact serious apprehensions among policy-makers in many developingcountries about the employment effects of trade liberalization. By emphasising globalcompetitiveness, many feel, trade liberalization may encourage growth of capital intensity in themanufacturing sector as a whole, thereby reducing its capacity to generate jobs. Export-orientedmanufacturing in developing countries is also often associated with low wages and poor workingconditions and this too is a matter of concern.

3
7 When developing countries export primary products and import manufactures, as they have traditionallydone, trade is in non-competing products. Trade in services is now growing, but there is a long way to go beforetwo-way trade in services begins to generate significant labour market effects.
8 As Freeman observes, “In the 1960s and 1970s, many in the third world feared that trade wouldimpoverish them, or push them to the periphery of the world economy; virtually no one in advanced countries wasconcerned about competition from less-developed countries. In the 1980s and 1990s, by contrast, most of the thirdworld has embraced the global economy; whereas many in the advanced world worry over the possible adverseeconomic effects of trade.” Freeman ,1995, p.15.
These concerns and apprehensions, together with the unresolved controversies, define thebackdrop for this paper. Its main objective is to study the effects of trade in manufactures betweenindustrialized and developing countries on employment and wages in manufacturing. Though themain focus of the paper is on developing countries, the experiences of two important industrializedcountries are also examined. Since the effects of trade in the two types of countries are thoughtto be symmetrical, it seems sensible to study them together. The reason for focussing onmanufactures is that the theoretical predictions apply only to trade in competing products and thiseffectively means trade in manufactures.7 Moreover, it is the growth of trade in manufactures thatgave rise to the current apprehensions and controversies. Trade between industrialized anddeveloping countries, after all, is nothing new. What is new is the expansion of manufacturedexports from developing countries. It is this development which explains why free trade, sostrongly advocated by the industrialized countries for so long, has suddenly become a source ofconcern in those very countries.8
It is appropriate to state here that the paper focuses on trade liberalization and not onglobalization. Expansion of trade is only one aspect of what is known as globalization; there areother equally important aspects such as growth of capital and technology flows. But capital andtechnology flows are considered in this paper only in so far as they contribute to expansion oftrade or modify the effects of trade on labour markets. As the recent economic crisis of East Asianand Latin American countries have shown, however, growth of capital flows has created seriousproblems of economic instability, particularly for developing countries; these problems, in turn,have thrown up important analytical and policy issues. Investigations into such issues lie outsidethe scope of this paper.
2. Trade and manufacturing employment:The basic trade-theoretic argument
The argument that growth of two-way trade in manufactures between industrialized anddeveloping economies - a relatively recent development - hurts unskilled workers in developedeconomies is derived from a textbook Heckscher-Ohlin-Samuelson-Stolper framework, with twocountries (North and South), two factors (skilled and unskilled workers) and two goods (skill-intensive and unskilled-labour-intensive manufactures). Both North (industrialized countries) andSouth (developing countries) are assumed to have access to similar technologies. Labour isassumed to be completely immobile across national frontiers and the main difference between thetwo countries is assumed to lie in the skill composition of the labour force. North has a higher

4
9 The standard Heckscher-Ohlin model in fact considers labour and capital as the two factors of productionand the comparative advantage is either in capital-intensive goods or in labour-intensive goods. But now capital,both as machines and as finance, is highly mobile; hence it seems inappropriate to suppose that supply of capitalin relation to labour can be a source of comparative advantage or disadvantage (though such a statement needs tobe qualified, as we shall see later).
10 There is no need to assume away the possibility that all prices and wages may be lower in absolute termsin South than in North.
11 The reference here is to some standard results in trade theory attributed to Stolper and Samuelson, 1941;and Samuelson, 1948 and 1949.
proportion of skilled workers in its labour force than South and hence has a potential comparativeadvantage in the production of skill-intensive manufactures. Correspondingly, South, with itsrelatively abundant supply of unskilled workers, has a potential comparative advantage in theproduction of labour-intensive manufactures.9
In the initial situation, characterized by trade barriers, both types of goods are producedin both countries in proportions determined by the composition of domestic demand. The relativeprices and wages are determined by the domestic labour supply conditions in each of the countries.Thus the relative wage of skilled labour and the relative price of the skill-intensive good are higherin South than in North.10 Abolition or lowering of trade barriers under such conditions leads toa fall in the relative price of labour-intensive manufactures in North and to a fall in the relativeprice of skill-intensive manufactures in South, and each country moves towards specialization inthe production of the good in which it has comparative advantage. Thus, in North, the productionof skill-intensive manufactures expands and the production of labour-intensive manufacturescontracts; the opposite happens in South.
In North, therefore, the demand for skilled labour rises and that of unskilled labour falls.So the relative wage of skilled labour will rise. Moreover, either the real wage of unskilled workerswill fall so that technological adaptations lead to a lowering of the ratio of skilled to unskilledworkers employed in the production of skill-intensive manufactures or, if labour marketinstitutions and regulations prevent downward flexibility of wages, the rate of unemployment ofunskilled workers will rise.
In South, the demand for unskilled labour rises and that of skilled labour falls. The resultis a rise in the relative wage of unskilled labour and skilled workers must either acceptunemployment or a lower real wage (so that skill-intensity of labour-intensive manufactures risesto ensure employment of surplus skilled workers).
It would seem, therefore, that South has a lot to gain and North has something to lose fromfree trade in manufactures. In South, employment-intensity of manufacturing output rises,employment opportunities for unskilled workers increase and wage inequality declines; all of thesechanges can be regarded as desirable. In North, on the other hand, all the changes seem to beundesirable: employment-intensity of manufacturing output falls, employment opportunities forunskilled workers decline and wage inequality rises.
A few qualifying remarks need to be added in order to put these conclusions in properperspective. First, the argument is only that free trade leads to a convergence of relative prices andwages, not that it leads to an equalization of absolute prices and wages.11 Absolute prices andwages can be (and generally are) substantially higher in North to start with and trade need notnecessarily alter this. Second, although trade leads to a rise in wage inequality in North and to afall in wage inequality in South, the result is not necessarily higher inequality in North compared
5
to South; all that happens is that a tendency towards North-South convergence in wage inequalityis generated. It must not be forgotten that wage inequality is assumed to have been higher in Southto start with. Finally, it is important to remember that the employment effects of trade liberalizationas stated above are relevant only when trade is based on comparative advantage. Not all trade isexplained by the factors emphasized by the Heckscher-Ohlin model. Much of the trade betweenNorth and South, for example, involves non-competing products; North exports manufactures andSouth exports primary products.
3. Some doses of realism
3.1 Non-traded goodsThe standard model focuses exclusively on traded goods sectors. This obscures an
important fact: many of the non-traded goods constitute part of the capital stock. Infrastructure -both physical (transportation, communications, electricity) and social (education, health, legalframework, institutions of financial and labour markets) - is a large part of the capital stock in anycountry. A country with a low level of infrastructure development is thus capital-poor. Moreover,although capital, as machines and as finance, is internationally mobile, this mobility cannot benefitcountries with undeveloped infrastructure. In principle, machines and finance could flow into theinfrastructure sector. In practice, this is unlikely; infrastructure takes a long time to construct andis not product-specific so that returns to investment are uncertain. Thus a country which is poorin terms of infrastructure development is most unlikely to attract capital flows; such a country isnot only presently capital-poor but is also likely to remain so. Trade liberalization is most unlikelyto enable such a country to emerge as an exporter of manufactures.
These observations suggest that trade liberalization need not open up fresh opportunitiesfor many developing countries which are poor in terms of infrastructure development; soundmacroeconomic policies, openness and fiscal incentives are not enough. As we shall see below,a large majority of the developing countries has in fact remained unaffected by the recent episodesof trade liberalization. All this, however, does not alter the effects of trade liberalization, predictedby the standard model, on employment and wages in the countries which are in a position toexpand manufactured exports.
3.2 Surplus labour and dualism in developing countriesOne assumption employed in deriving the conclusions above is that labour markets in
industrialized and developing countries are similar; indeed, both types of countries are assumedto have full employment. These are extremely inappropriate assumptions. In the real world,developing countries have surplus labour and dualistic economic structure. There are large gapsin wages and working conditions between what might be called formal and non-formal sectorsin these countries. Labour costs and relative wages of unskilled labour are substantially higher inthe formal sector where government regulations and institutions of collective bargaining usuallyplay a significant role in determining wages and employment conditions. In the non-agriculturalsector as a whole, on the other hand, there is substantial excess supply of unskilled workers inrelation to demand. Most unskilled workers work in the low-productivity non-formal sector where

6
12 These observations remain valid even if we accept Wood’s (1994) point that unskilled workers are thosewith basic general education and not those who are illiterate. The illiterate workers, according to Wood, “aregenerally unsuited to manufacturing and other modern activities, which require at least literacy or primaryschooling”. (p.49)
13 Strictly speaking labour market effects of this kind of trade is not under investigation here.
14 It should be emphasized that non-formal sector, as defined in this paper, is one where governmentregulations and collective bargaining institutions do not play any significant role in determining wages andworking conditions. It includes traditional as well as modern manufacturing enterprises which are often referredto as “small and medium enterprises” in the literature. To keep things in perspective, it should be said that wagesand working conditions in export-oriented manufacturing, generally speaking, seem poor when compared to thosein formal manufacturing but seem at the same time substantially better when compared to the rest of the non-formal sector.
they face serious underemployment and earn very low wages, and where government regulationsand institutions of collective bargaining are conspicuous by their absence.12
One consequence of this kind of labour market dualism is that neither the ratio of skilled tounskilled workers nor the relative wage of unskilled workers in South’s formal sector can beassumed to be significantly lower than those in North’s aggregate economy. South’s formalmanufacturing sector has been built through import substitution under protectionist policy regimes.It uses technologies imported from North and its employment conditions are governed byregulations and institutions rather than by forces of demand and supply. Not surprisingly, itusually produces skill-intensive import-competing goods for sale in the domestic market ratherthan labour-intensive goods for export to North. It is true that there has been growing involvementof transnational corporations (TNCs) in formal manufacturing sectors of developing countries inrecent periods. But such TNC investment has really been geared to supplying skill-intensive goodsto markets of individual or groups of developing countries. In order to realize economies of scalein production, large-scale facilities for production of components and for assembly operations areset up in a group of countries located in close geographical proximity of one another. Thus arisestrade among TNC subsidiaries and this largely intra-industry trade generally shows up as tradeamong developing countries. Only in a few cases (eg. post-NAFTA Mexico-US trade) does suchtrade show up as trade between industrialized and developing countries.13
The point is that, as a general rule, South’s formal manufacturing sector is typically import-competing. It enjoys no comparative advantage vis-à-vis North’s manufacturing sector and is notin a position to export its products to North. This means that South’s exports of labour-intensivemanufactures originate basically in the non-formal sector, at least in initial stages. This explainswhy export-oriented manufacturing production is so often associated with low wages and poorworking conditions.14 In these circumstances, North-South trade in manufactures would have thepredicted unfavourable effects on employment and wages of unskilled workers in North but couldconceivably fail to generate the predicted beneficial effects in South.
It is not difficult to see that the initial conditions of employment and labour supply inSouth’s non-formal sector could easily pre-empt the possibility of wage increases for unskilledworkers. There is no reason to suppose that emergence of export-oriented manufacturing issufficient to tighten the non-formal labour market; the scale and pace of growth of suchmanufacturing would clearly matter. It might seem, however, that employment opportunities fornon-formal sector workers would increase irrespective of what happens to wages. But even this
7
15 See Williamson, 1998.
16 See Skeldon, 1997, and Zlotnik, 1998.
17 Carrington and Detragiache, 1998.
is not certain. Since South’s formal sector is engaged in producing import-competing products inwhich North has potential comparative advantage, trade liberalization could adversely affect theoutput of that sector. This could mean redundancy not only for skilled workers but for unskilledworkers as well. Since the redundant unskilled workers from the formal sector are likely to moveinto the non-formal sector in search of work, it cannot even be argued a priori that employmentopportunities (at the prevailing wages) for unskilled workers would necessarily improve as a resultof trade liberalization. In principle, wage inequality could still decline since declining demand forskilled workers could put downward pressure on their wages. But, as already noted, wages ofskilled workers (who are mostly in the formal sector) in South are determined by governmentregulations and collective bargaining rather than by forces of demand and supply. Tradeliberalization, therefore, is most unlikely to reduce wage inequality except when it stimulatesexport-oriented manufacturing to such an extent that excess supply of unskilled labour in the non-formal sector is wiped out so that wages of unskilled workers begin to rise rapidly.
3.3 International labour mobilityIn the real world, labour is not immobile across national frontiers as assumed by the
Heckscher-Ohlin model. International migration exists, though the scale is not perhaps largeenough to warrant a relaxation of the assumption. Indeed, one of the major contrasts between thecurrent period of globalization and an earlier period (1880-1914) lies precisely in the area ofinternational migration. In the earlier period, massive migration of mostly unskilled workers fromthe-then labour-surplus economies of Europe (Denmark, Ireland, Italy, Norway and Sweden inparticular) to labour-scarce economies of the New World (Argentina, Australia, Canada and theUnited States in particular) helped the economic transformation of both sets of countries.15 Thecurrent period offers no such opportunities.
In today’s world, flows of both types of labour typically are (and will continue to be) fromSouth to North for relatively obvious reasons; wages of both skilled and unskilled labour aresubstantially higher in North (and will remain so in the foreseeable future). In fact, even though theoverall level of international migration has remained fairly stable in the post-war period, the levelof North-North migration has been declining while that of South-North migration has been risingat least since the mid-sixties.16 But South-North flow of unskilled labour has been increasinglyrestricted by North mainly because it has been viewed as a cause of unemployment, wage declineand social disruptions. Only the United States, alone among the industrialized countries, stillreceives a substantial inflow of unskilled migrants from developing countries. There are much lessrestrictions on South-North flow of skilled workers; this flow is substantial and has very probablybeen rising. One recent study 17 shows, for example, that 56 per cent of the migrants fromdeveloping countries in the United States had a secondary education and another 36 per cent hadtertiary education; the percentages are similar for the migrant population in Western Europe,Canada and Australia. This type of migration, often dubbed “brain-drain”, is a source of concernin South.

8
18 See Wood, 1994 for an elaboration of the point.
19 The experiences of countries such as Denmark, Ireland, Italy, Norway and Sweden in the late nineteenthand early twentieth centuries illustrate the point. See Williamson, 1998 for a discussion.
20 At least one study argues that immigration may have been a more important cause of declining wagesof unskilled workers in the United States than trade liberalization. See Borjas, Freeman and Katz, 1996.
21 See Haque and Kim, 1995 for an analysis.
In recent years, rapidly declining costs of travel and telecommunication have brought intoexistence a new kind of mobility - mobility of skills - that does not involve migration. Professionalskills can now be made available through consultancy services, periodic short visits of experts,electronic mail, video conferences, etc.; none of this requires the experts to reside in a particularcountry. Flow of skills of this type can in principle be either North-South or South-North preciselybecause permanent migration is not involved. The existence of such flows, however, essentiallyfacilitates transfer of technology and hence justifies the assumption that all trading economies haveaccess to similar technologies.18 Analytically, these flows are quite distinct from actual migrationof skilled workers and can be left out of account in considering the effects of international mobilityof labour.
Effects of international migration depend on its scale. Emigration of unskilled workers fromlabour-surplus South can potentially make it labour-scarce; this benefits unskilled workers in Southand strengthens the tendency for wage inequality to decline.19 In North, however, immigration ofunskilled workers can clearly accentuate the unfavourable effects of trade liberalization onemployment conditions of unskilled workers by augmenting supply at a time when demand isfalling.20 This also has the effect of strengthening the tendency for wage inequality to rise.
South-North migration of skilled workers has quite different effects. The increased demandfor skilled workers in North in the wake of trade liberalization can, in principle, be met throughimmigration from South. This could have the effect of moderating the growth of wage inequalityin North. The effect on unskilled workers in North is likely to be inconsequential. On the one hand,the ready availability of skilled workers from South would help expand production of skill-intensivegoods in the short run and thus create immediate opportunities for redeployment of some of theredundant unskilled workers from the import-competing sector. On the other hand, there is littleneed now for technological adaptations in the export-oriented sector that could facilitate absorptionof some of the redundant workers from the import-competing sectors.
But South-North migration of skilled workers has unfavourable consequences for South.21
In the first place, it reduces the already low ratio of skilled to unskilled workers. This may notalways matter in the short run but can obviously constrain economic transformation in the medium-term. In the short run, such migration counters the effect of any decline in demand for skilledworkers resulting from trade liberalization. Given the prevailing labour market conditions in South,this may actually increase wage inequality.
The conclusions that follow from this brief discussion are as follows. International mobilityof skilled workers is potentially good for North because it curbs the growth of wage inequalitywithout hurting unskilled workers; it is potentially bad for South because, apart from worseningthe skill composition of the work force, it might actually increase the already high wage inequality.International mobility of unskilled workers, on the other hand, is potentially bad for North becauseit hurts unskilled workers and thereby amplifies the growth of wage inequality; it is potentially goodfor South because it benefits unskilled workers there and hence can reduce wage inequality. Given

9
22 See Chenery and Strout, 1966, for elaboration on the notion of “foreign exchange constraint”.
that skilled workers are far more internationally mobile than unskilled workers in today’s world,it can be said that international migration tends to counter the effects of trade on wage inequalityin both North and South. It can also be said that the current pattern of international migration hasthe effect of widening the North-South gap in terms of skill composition of labour force.
3.4 Aggregate employment in manufacturingIn order to understand the effect of trade liberalization on aggregate employment in
manufacturing, the question of gains from trade needs to be probed. In textbook expositions,lowering of trade barriers automatically allows both countries to attain higher consumption levels,i.e., global aggregate demand for (and hence production of) both goods rises. But this is only apossibility, not a certainty. That trade-induced specialization increases global productive potentialis not in doubt. But it is certainly not obvious that such specialization also increases global demand.Since lowering of trade barriers leads to changes in both relative prices and income distribution,the net effect of trade on global demand for the products involved cannot in fact be predicted.
Some simple examples illustrate the point. Suppose that skilled workers consume only skill-intensive goods while unskilled workers consume only labour-intensive goods. In North, incomesof the skilled workers increase but the relative price of the skill-intensive good also rises so thatthe effect on domestic demand for the skill-intensive good is ambiguous. In South, the relativeprice of the skill-intensive good falls but incomes of the skilled workers also decline so that, onceagain, the effect on demand for the skill-intensive good is ambiguous. Exactly similar argumentscan be made in the case of the labour-intensive good.
What these simple examples suggest is that trade liberalization can conceivably beassociated with stagnation or even decline in the global demand for the goods involved even thoughthe export sectors of participating countries will experience demand growth. This means thatmanufacturing employment at the global level could decline. If this happens, manufacturingemployment will also decline in North where the employment elasticity falls as a result of tradeliberalization (because of the declining weight of labour-intensive manufacturing in totalmanufacturing); job losses in labour-intensive sectors cannot be fully neutralized by job gains inskill-intensive sectors. Manufacturing employment in South, where the employment elasticityshould rise as a result of trade liberalization (because of the growing weight of labour-intensivemanufacturing in total manufacturing), may still increase; the likelihood that job gains in labour-intensive manufacturing would exceed job losses in skill-intensive manufacturing is strong. But themagnitude of such gains is unlikely to be large when global demand for the labour-intensive goodfalls.
The observations above do not take account of the second-order effects of tradeliberalization. In the case of South, if trade liberalization stimulates export growth, then this mayease the “foreign exchange constraint” and thus stimulate growth of the manufacturing sector asa whole.22 It is also possible for this growth effect to be dominant so that employment increasesin all industries including import-competing industries. It is difficult to hypothesize this kind of agrowth effect in the case of North since a binding “foreign exchange constraint” cannot be plausiblyassumed.
Another possibility that must be reckoned with is that, in the wake of trade liberalization,capital from North may flow into the import-competing sector in South through activities of TNCs.

10
23 The discussion in this section is based on the statistical data presented in Appendix Tables 1.1-1.15.
24 Evidence and discussions are available in UNCTAD, 1997 and 1999; IMF, 1997; World Bank, 1999;and WTO, 1998.
This possibility is strong if there are large domestic or regional markets to exploit. Such capitalflows also create possibilities of employment growth in the manufacturing sector as a whole.
When these second-order effects (which would generally be lagged) are taken into account,it does seem that aggregate manufacturing employment cannot but substantially increase in South.This has two important implications. First, it can no longer be asserted that trade liberalizationreduces the demand for skilled workers in South. Second, a decline in South’s demand for the skill-intensive good exported by North becomes unlikely. On the whole, therefore, trade liberalizationshould increase global aggregate demand for manufactures, although a temporary decline cannotbe ruled out since adjustment lags are involved.
3.5 A summing-upThere are good reasons to think that growth of trade in manufactures with developing
countries will reduce real wages and/or employment of unskilled workers, increase wage inequalityand reduce employment elasticity in the manufacturing sector of industrialized countries. It is muchharder to find good reasons to expect symmetrical labour market consequences of trade indeveloping countries. The only theoretical conjecture that can be made with some confidence isthat the employment elasticity in manufacturing will rise. Given the existence of substantial surpluslabour and dualistic labour markets in these economies, growth of trade in manufactures mayneither increase wages of unskilled workers nor reduce wage inequality. International mobilityof labour, given its current characteristics, could counter the growth of wage inequality in Northbut further reduces the possibility of decline in wage inequality in South.
The effect of trade on aggregate employment in manufacturing cannot be predicted a priorifor either industrialized or developing countries. The only thing that can be said is that theprobability of aggregate employment rising is significantly higher for developing countries becausegrowth of exports increases the employment elasticity in manufacturing, eases the “foreignexchange constraint” and may induce capital inflows from North.
It is worth emphasising that trade in this context refers to trade based on Heckscher-Ohlincomparative advantage. Labour market effects of trade in manufactures arising in response toconsumer tastes for variety or from attempts by TNCs to reap benefits of increasing returns to scalemay well be different and are not being explored in this paper.
4. The changing pattern of world trade23
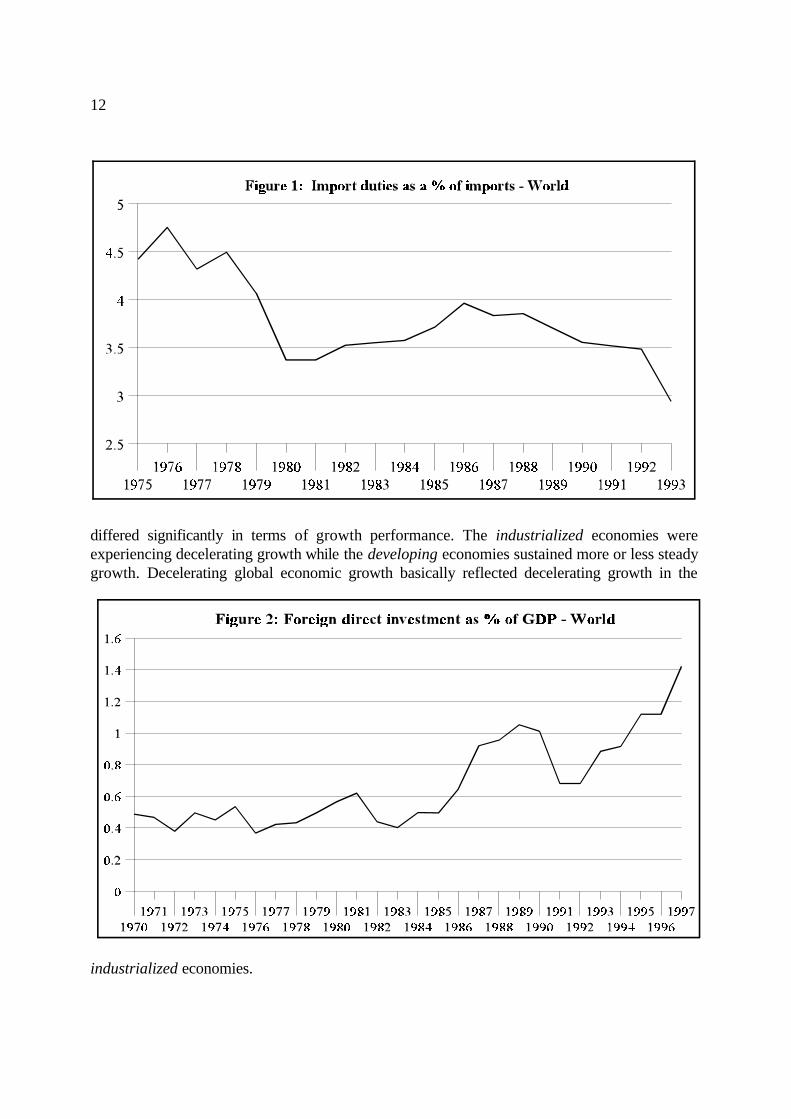
That a process of trade liberalization has been under way since the late seventies can hardlybe doubted. Both natural and policy barriers to trade have been falling.24 There have been fairlydramatic improvements in transport, telecommunication and information technologies. Mostgovernments have pursued trade liberalization policies. Tariffs have increasingly replacedquantitative restrictions and import duties have been declining in most countries of the world(Figure 1) since the late seventies; these processes, moreover, were bolstered by the agreements

11
25 The industrialized economies are defined, here and throughout the rest of the paper, to includeAustralia, Austria, Belgium, Canada, Denmark, Finland, France, Germany, Greece, Iceland, Ireland, Italy, Japan,Luxembourg, Netherlands, New Zealand, Norway, Portugal, Spain, Sweden, Switzerland, United Kingdom andUnited States.
26 The developing economies are defined, here and throughout the rest of the paper, to include allcountries of Asia-Pacific except Japan, Australia and New Zealand, and all countries of Latin America and Africa.
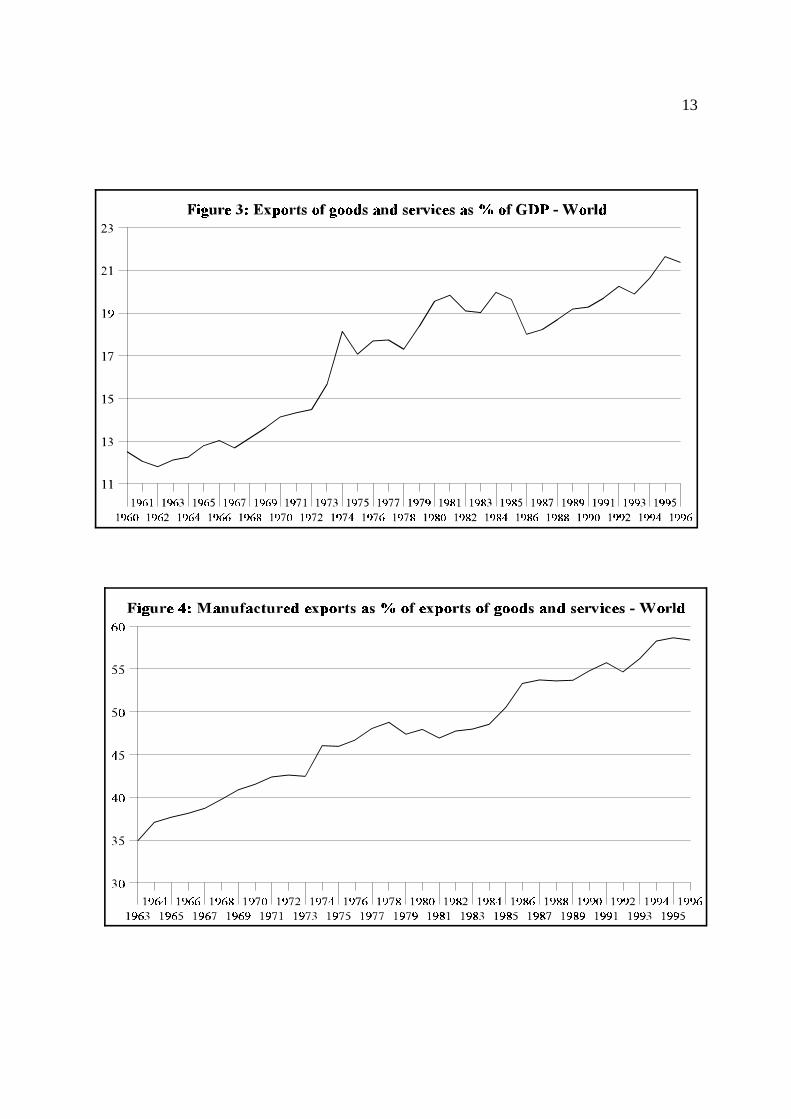
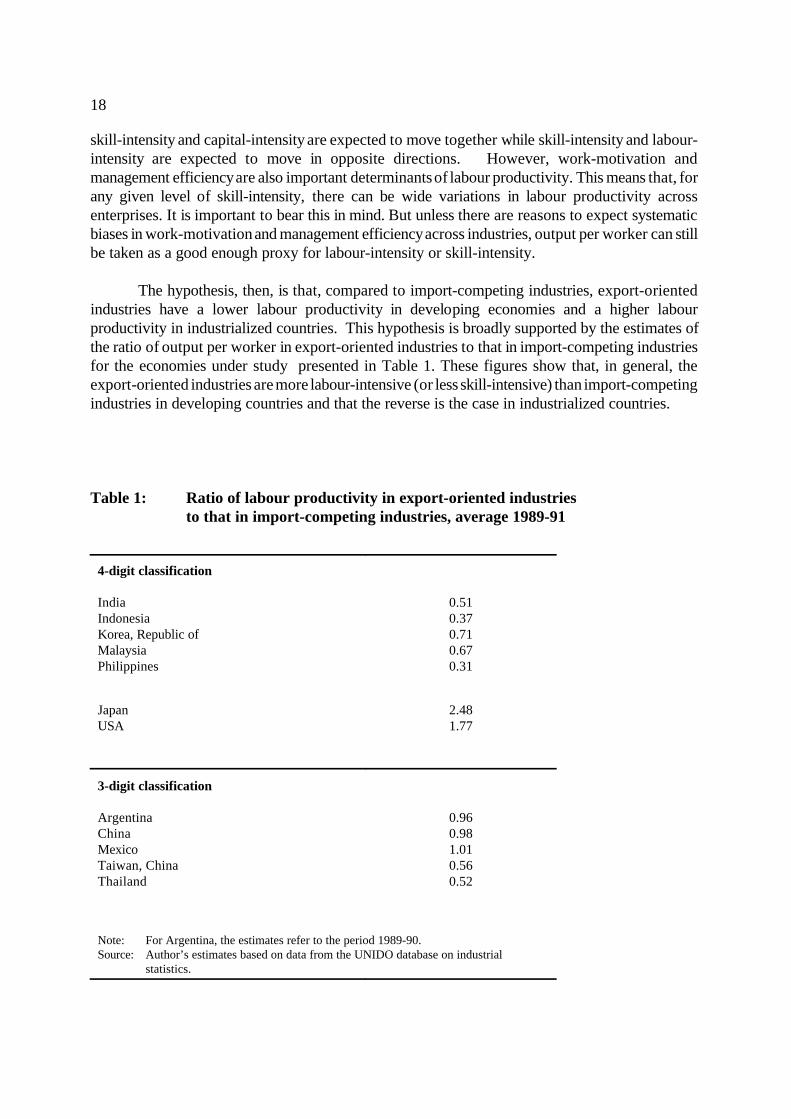
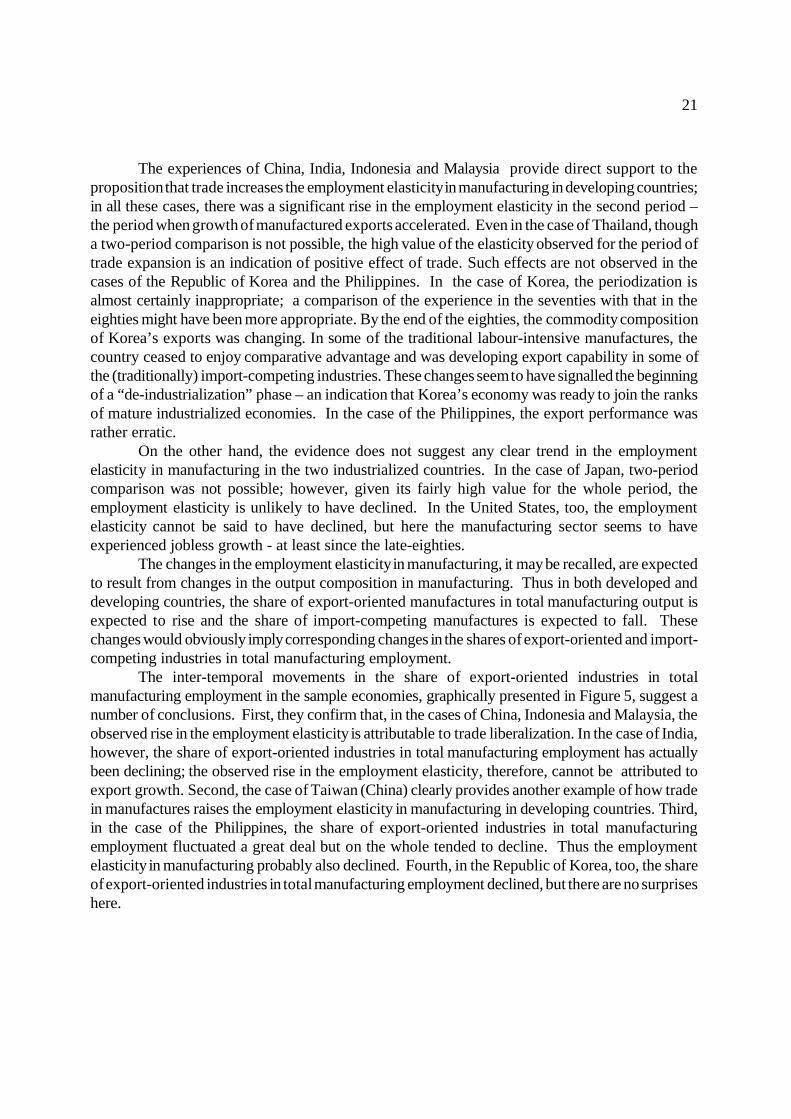
from the Uruguay Round of GATT negotiations and the establishment of WTO in 1994. Since themid-eighties, global capital flows have also shown a particularly sharp rise. As Figure 2 indicates,growth of flows of foreign direct investment was far sharper during 1985-95 than during 1970-85. The surprise is that these rather dramatic changes do not seem to have induced any dramaticchange in the growth of world trade. World exports grew faster than world GDP throughout theperiod 1960-96. As Figure 3 shows, however, though the share of exports in world GDP showeda rising trend, this was a steady, long-term trend. No significant deviation from the long-term trendis observed either in the eighties or in the nineties. Manufactured exports also grew faster thanother exports during 1960-96, but this trend too has been steady and long-term in character (Figure4). Thus both the rate and the pattern of growth of world trade appear to have been roughly thesame in the eighties and the nineties as they had been in the sixties and the seventies.
It must also be noted that throughout the period 1960-95, the growth of world GDP hasbeen steadily decelerating. This means that the rising share of exports in GDP did not necessarilymean accelerating or even stable growth of world trade. In fact, since the share of exports in GDPgrew at a steady pace over the long run, it is fairly obvious that the growth of world exports hasbeen decelerating in much the same way as the growth of world GDP. Increasing liberalization oftrade apparently has had no stimulating effect either on the growth of world exports or on thegrowth of world GDP. One is left wondering why trade-related issues have received so muchattention in recent years.
Things begin to look different once attention is focussed on trade relations betweenindustrialized and developing countries. Since the beginning of the eighties, the degree of export-orientation (as measured by the share of exports in GDP) of the industrialized economies25 haschanged little while the developing economies26 have become increasingly export-oriented. By themid-nineties, the developing economies were far more export-oriented than the industrialized economies. A consequence was that, since the late eighties, the developing economies steadilyincreased their share in world merchandise exports while the share of the industrialized economiesdeclined. More significantly, the share of manufactures in merchandise exports increased at a fasterrate for the developing economies than for the industrialized economies throughout the eightiesand the nineties. Thus the share of the developing economies in world export of manufacturessteadily increased – from 12 per cent in 1980 to 25 per cent in 1996 – while the share of theindustrialized economies steadily declined – from 83 per cent in 1980 to 72 per cent in 1996.
Three further observations can be usefully added. First, throughout the eighties and thenineties, trade liberalization was occurring basically in the developing economies since theindustrialized economies were already very open by then (though the use of non-tariff restrictionssuch as anti-dumping measures showed a tendency to rise in the latter). Second, the developingeconomies received an increasing share of global inflows of foreign direct investment particularlyin the nineties; this share rose from 23 per cent in 1970 to 31 per cent in 1995 and further to 38 percent in 1997. Correspondingly, the share of the industrialized economies declined from 76 per centin 1970 to 63 per cent in 1995 and further to 55 per cent in 1997. Third, the two groups also
12
differed significantly in terms of growth performance. The industrialized economies wereexperiencing decelerating growth while the developing economies sustained more or less steadygrowth. Decelerating global economic growth basically reflected decelerating growth in the
industrialized economies.
13

14
27 The thirteen developing economies are: Argentina, Brazil, China, Hong Kong (China), India, Indonesia,Republic of Korea, Malaysia, Mexico, the Philippines, Singapore, Taiwan (China) and Thailand. Several of thesecountries and regions are now regarded as industrialized, and the Republic of Korea and Mexico are members ofthe OECD.
It would appear that globalization is really about changing trade relations between theindustrialized and the developing economies rather than about rapid expansion of world trade assuch. Even this proposition, however, turns out to be incorrect on closer inspection. For, much ofthe observed changes in trade relations actually reflect shifts in the position of a small number ofdeveloping economies (henceforth referred to as the Group of 13 economies) in the global marketplace.27
The performance of the Group of 13 economies in terms of export expansion was indeedvery impressive. Between 1970 and 1995, the share of exports in GDP increased from just 8 percent to 31 per cent and the share of manufactures in total exports increased from 22 per cent to 66per cent. Their share in total exports from the developing economies increased from 39 per centin 1970 to 74 per cent in 1995, that in merchandise exports increased from 33 per cent in 1980 to72 per cent in 1996 and that in manufactured exports increased from 73 per cent in 1980 to 88 percent in 1996. Their share in total flow of foreign direct investment into developing economies rosefrom 47 per cent in 1970 to 82 per cent in 1995. Though a few of these economies sufferedeconomic fluctuations, on the whole they sustained higher growth than the rest of the worldthroughout the period 1960-95.
The recent episodes of trade liberalization and globalization, therefore, have been associatedwith dramatic changes not so much in economic relations between the industrialized and thedeveloping economies as in economic relations between the industrialized economies and a fewdynamic developing economies. The nature of economic relations between the industrializedeconomies and the rest of the developing world (i.e., excluding the Group of 13 economies) –henceforth referred to as the other developing economies – remains largely unaltered. For thelatter, the share of exports in GDP remained stable between 1975 and 1995. They made littleprogress in increasing manufactured exports and consequently remained exporters of primaryproducts and importers of manufactures. The international division of labour between them and theindustrialized economies underwent no major qualitative change.
An analysis of the changing patterns of trade in manufactures provide additional insights.Till the late-eighties, the importance of trade in manufactures among the industrialized economieswas rising and, correspondingly, the percentage of manufactured exports from the industrializedeconomies going to the developing economies was declining. The trends were in the oppositedirection in the nineties. The result was that in 1996, the shares of manufactured exports from theindustrialized economies going to, respectively, the industrialized (70 per cent) and the developingeconomies (26 per cent) were roughly the same as in 1980. An important change had neverthelessoccurred. Since the late-eighties, the Group of 13 economies became increasingly importantdestinations for manufactured exports from the industrialized economies; correspondingly, thepercentage of these exports going to the other developing economies remained virtually constant.
The share of manufactured exports from the Group of 13 economies going to theindustrialized economies increased till 1987 and then declined fairly steadily while the share goingto the other developing economies declined till 1987 and then remained roughly stable. Mostremarkably, trade in manufactures among the Group of 13 economies was growing at a consistently

15
28 The theoretical basis for this argument has already been stated. Empirical substantiation, thoughobviously important, is not attempted here.
rapid pace since the late-eighties. By 1996, the share of manufactured exports from the Group of13 economies going to the industrialized economies was 55 per cent, the share going to the Groupof 13 economies was 36 per cent and the share going to the other developing economies was only7 per cent.
It is worth noting that the pattern of trade between the Group of 13 economies and theother developing economies has come to resemble that between the industrialized economies andthe other developing economies. It is evident from the indicators of balance of trade inmanufactures that the other developing economies export mainly primary commodities to bothgroups and import mainly manufactures from both groups. Between the industrialized economiesand the Group of 13 economies, on the other hand, trade now occurs basically in manufactures andthis trade has been roughly balanced since the mid-eighties.
What these facts very clearly bring out is that, for empirical investigation into the issueswith which this paper is concerned, it is adequate to focus on the group of industrializedeconomies on the one hand and a group of just thirteen developing economies on the other.Globalization has not meant explosive growth of world trade, nor has it meant a radical change inthe age-old international division of labour between the industrialized and the developingeconomies. It has only underlined the emergence of a small number of the developing economiesas important players in the world economy.
The fact that a large majority of the developing countries derived little benefit from tradeliberalization is sometimes referred to as marginalization. It needs to be said that the term has aspecial meaning in the current context. It is not that a large majority of the developing countriesare getting poorer, nor that their exports have ceased to grow. But they have been unable to shifttheir export-base from primary commodities to manufactures; the most likely reason is the low levelof infrastructure development.28 They are getting marginalized in the sense that the importance oftheir exports in the world economy is declining.
5. Trade and manufacturing employment: Empirical analysis
5.1 Database and methodologyThe empirical analysis that follows is concerned with labour market effects of trade in
manufactures between the industrialized economies and the Group of 13 economies. The first stepin this analysis is identification of typical items of export and import for both groups of economies.This is particularly important in the context of this paper. Given that the theoretical propositionsat issue apply (strictly speaking) only to trade in manufactures between countries at different levelsof development, use of general indices such as the degree of export-orientation or of importpenetration for classifying industries or products for purposes of empirical analysis would clearlybe inappropriate. As noted above, a large part of the world trade in manufactures takes placeamong countries that are structurally similar; labour market effects of such trade, which is notbased on Heckscher-Ohlin comparative advantage, are not under investigation here. Serious efforts

16
29 The detailed (at 4-digit level of industrial classification) statistics on value and direction of trade havebeen compiled in a convenient format by STATCAN – the Statistical Office of Canada. These statistics were usedto compute, for each of the Group of 13 economies, total manufactured exports to the industrialized economies andthe share of each of the 4-digit items in the total. Similar calculations were done for the manufactured exports ofthe industrialized economies to the Group of 13 economies. The items were then arranged in descending order ofimportance (as indicated by the share of each of the items in total manufactured exports) and a cut-off point waschosen for each case. The items selected in this manner generally accounted for between 70 and 80 per cent of totalmanufactured exports. The exercise was carried out for four years – 1980, 1985, 1990 and 1995 – and the itemscommonly appearing in at least two of these four years were finally chosen as the typical items of export.
30 The database provides information on values of output, export and import for each of the 4-digitindustries.
31 Cut-off points had to be defined for determining significance or insignificance of the values of the index.For the purpose, two ratios were used as rough guidelines – the ratio of exports to output and the ratio of importsto output for the entire manufacturing sector. The underlying idea is that trade orientation of a particular branchof manufacturing can be defined only with reference to trade orientation of the manufacturing sector as a whole. Itwould obviously be absurd to use the same cut-off points for Korea (Rep) and China.
32 It needs to be stated, however, that although both sets of data were available at 4-digit level ofdisaggregation, they did not use the same classification scheme. Consequently, judgements on rough comparabilityof the categories had to be made. Though such judgements cannot obviously guarantee full accuracy, all effortswere made to reduce the level of inaccuracy. The final lists of export-oriented and import-competing industriesfor individual countries are presented in Appendix 2.
were, therefore, made to identify the typical items traded between the industrialized economies andthe Group of 13 economies.
The methodology and the database used to identify the typical items of export and importfor the economies under consideration can be briefly described as follows. From the detailedstatistics on value and direction of trade available from UN sources, the major manufactured items(at 4-digit level of classification) which the industrialized economies export to the Group of 13economies and those which the Group of 13 economies export to the industrialized economieswere first identified.29
A parallel exercise was carried out to categorize industries (at 4-digit level of dis-aggregation) as export-oriented or import-competing or others; the index used for the purpose was“net exports (exports – imports) as percentage of output”. The UNIDO database on demand-supply balance for 4-digit level industries was used for the purpose of this exercise.30 A significantpositive value for the index was taken to indicate export-orientation and a significant negative valuewas taken to indicate import-competition.31
The list of export-oriented industries for each of the economies, emerging from the secondexercise, was then compared with the list of important export items for the economy concerned,emerging from the first exercise, and a final list of export-oriented industries was derived from thiscomparison. Similarly, the list of import-competing industries for each of the economies, emergingfrom the second exercise, was compared with the list of export items of trading partners (theindustrialized economies in the case of the Group of 13 economies and vice versa), emerging fromthe first exercise, and a final list of import-competing industries was derived from this comparison.This methodology ensured exclusion of industries exporting to or competing with imports fromother economies within each of the two groups from the lists of “export-oriented” and “import-competing” industries.32

17
In the exercises described above, “food, beverages and tobacco” industries and petroleum-related industries were deliberately left out of account. The reason is that these tend to be resource-based industries and trade in them does not necessarily reflect comparative advantage inHeckscher-Ohlin sense. Keeping the analytical possibilities in view, manufacturing industries ineach of the economies were finally classified into five groups: “food, beverages and tobacco”,“petroleum and related”, “export-oriented”, “import-competing” and a residual group called“others”.
This five-fold classification of industries is used together with a different database – theUNIDO database on industrial statistics – to analyse the effects of trade in manufactures on labour.This database provides information on employment, wages, output and value added for 4-digitmanufacturing industries for a large number of countries. Unfortunately, however, reasonablycomplete data are available only for some of the relevant developing economies – India, Indonesia,Korea (Rep), Malaysia and the Philippines. In the case of the industrialized economies too, thedata on France, Germany and the United Kingdom were inadequate. Given these limitations, theanalysis using data for 4-digit manufacturing industries is carried out for seven economies – India,Indonesia, Japan, Korea (Rep), Malaysia, the Philippines and the United States.
The UNIDO database on industrial statistics, however, also provides information for 3-digitmanufacturing industries and reasonable amounts of data are available for Argentina, China,Mexico, Taiwan (China) and Thailand. Given the importance of the economies concerned, itseemed sensible to use these data. For the purpose, the five-fold classification of 4-digitmanufacturing industries had to be translated into a five-fold classification of 3-digit manufacturingindustries. This could be done only by applying a sort of “majority principle” – a 3-digit industrywas placed in one of the five categories if a majority of the corresponding 4-digit industriesbelonged to that category. It is obvious that there is a loss of accuracy involved. This cannot behelped. It has to be accepted that the results derived from the analysis of 3-digit manufacturingindustries are somewhat less reliable than those derived from the analysis of 4-digit manufacturingindustries.
It will be noted that Hong Kong (China) and Singapore are being left out of account. Thisis deliberate. One reason is that, being essentially port cities, these are rather exceptional cases.Another reason is that it is quite difficult in practice to classify industries in the requisite categories.In both cases, substantial parts of trade involve imports for re-export, but the available data do notdistinguish imports for re-export from other imports or re-exports from other exports. 5.2 Factor content of exports and imports
The point of departure for analysis of labour market effects of trade is the hypothesis thatdeveloping countries export unskilled-labour-intensive manufactures to industrialized countrieswhile industrialized countries export skill-intensive manufactures to developing countries. Empiricalinvestigation, therefore, should begin by substantiating this hypothesis. The problem that arises inthis context is that the database used in this paper provides information only on the number ofworkers employed in individual 3-digit or 4-digit industries. A proxy measure of labour-intensityor skill-intensity, therefore, had to be devised.
In order to derive such a proxy measure, we need to make an assumption: that, acrossindustries, output per worker rises as the ratio of skilled to unskilled workers employed inproduction rises. Such an assumption is widely used and both theoretical reasoning and empiricalevidence lend it plausibility. Workers working with more and better machines produce more, butthey also need to be more skilled if they are to work with more and better machines. This is why
18
skill-intensity and capital-intensity are expected to move together while skill-intensity and labour-intensity are expected to move in opposite directions. However, work-motivation andmanagement efficiency are also important determinants of labour productivity. This means that, forany given level of skill-intensity, there can be wide variations in labour productivity acrossenterprises. It is important to bear this in mind. But unless there are reasons to expect systematicbiases in work-motivation and management efficiency across industries, output per worker can stillbe taken as a good enough proxy for labour-intensity or skill-intensity.
The hypothesis, then, is that, compared to import-competing industries, export-orientedindustries have a lower labour productivity in developing economies and a higher labourproductivity in industrialized countries. This hypothesis is broadly supported by the estimates ofthe ratio of output per worker in export-oriented industries to that in import-competing industriesfor the economies under study presented in Table 1. These figures show that, in general, theexport-oriented industries are more labour-intensive (or less skill-intensive) than import-competingindustries in developing countries and that the reverse is the case in industrialized countries.
Table 1: Ratio of labour productivity in export-oriented industriesto that in import-competing industries, average 1989-91
4-digit classification
IndiaIndonesiaKorea, Republic ofMalaysiaPhilippines
0.510.370.710.670.31
JapanUSA
2.481.77
3-digit classification
ArgentinaChinaMexicoTaiwan, ChinaThailand
0.960.981.010.560.52
Note: For Argentina, the estimates refer to the period 1989-90.Source: Author’s estimates based on data from the UNIDO database on industrial
statistics.

19
33 See Feenstra and Hanson, 1997. Maquiladora enterprises are set up by TNCS in the areas borderingthe United States. They process inputs imported from the United States and other industrialized countries for re-exports to those countries. Trade liberalization and NAFTA have led to a rapid growth of such enterprises.
34 See, for example, Alarcon and Zepeda, 1997.
35 See Ravenga, 1995; Wood, 1997; Lora and Oliviera, 1998; and Harrison and Hanson, 1999.
36 The limitations of the available statistical data also prevents further meaningful explorations. Theavailable UNIDO data on Mexico exclude information on maquiladora enterprises while those on Argentina onlycover the period 1980-1991. Many of the trade liberalising reforms in Argentina were implemented in the post-1991 period.
37 See World Bank, 1997.
38 This argument, as we shall see, is strongly supported by all the other findings on China’s experience.
There are some odd cases, however, and some comments on these are in order. In the twoLatin American countries included in the sample, the gap in skill-intensity between export-orientedand import-competing industries is negligible. Since there are no strong reasons to suppose thatwork-motivation and management efficiency are consistently superior in export-oriented industries,the conclusion must be that the manufactured exports of the two Latin American economies areno more labour-intensive than their manufactured imports from the industrialized economies.Indeed, an inspection of the typical items of export of these countries shows that certain skill-intensive industries figure prominently among the export-oriented industries. One explanation liesin the fact that the export-oriented industries in these countries are dominated by TNC subsidiariesso that much of the exports fall into the category of intra-TNC trade. In the case of Mexico, forexample, there is evidence to suggest that skill-intensity in maquiladora enterprises is higher thanthat in other manufacturing enterprises.33 Studies have shown, moreover, that even in the non-maquiladora sector, most of the export-oriented enterprises are TNC subsidiaries and that thesetend to employ a relatively larger quantity of skilled labour than the domestic enterprises whichproduce mainly for the domestic market.34 It has also been argued that, in Latin America ingeneral, labour-intensive industries had been more heavily protected than skill-intensive industriesso that one of the effects of trade liberalization has been a relative decline of labour-intensiveindustries.35 Whatever the explanation, it seems clear that the basic premise of the standard trade-theoretic argument does not hold in the cases of Argentina and Mexico. Thus we have no reasonto expect the labour market effects of trade liberalization in these countries to be as predicted bytheory. These cases, therefore, are not pursued any further in the rest of this paper.36
The other odd case is China. In this case too, export-oriented industries do not appear, atfirst sight, to be significantly different from the import-competing industries in terms of labour- orskill-intensity. In terms of specific items, however, China’s exports and imports are not verydifferent from Thailand’s or India’s. This directs attention to the fact that China’s exports areproduced almost exclusively by foreign capital in special economic zones while the import-competing products are largely produced by state enterprises that are known to be inefficient andoverstaffed.37 Given these conditions, it can be plausibly argued that though China’s export-oriented industries are in fact more labour-intensive than its import-competing industries, this isnot reflected in the relative labour productivity of the export-oriented industries because work-motivation and management efficiency are systematically poorer in import-competing industries.38

20
5.3 Trade and employment A priori reasoning suggests that growth of trade in manufactures between industrialized
and developing countries should increase the employment elasticity in manufacturing in thelatter and reduce it in the former. Trade is expected to increase the share of export-orientedindustries and reduce the share of import-competing industries in manufacturing output. Thismeans a rise in the employment elasticity in developing countries (because export-orientedindustries are more labour-intensive than import-competing industries) and a fall in theemployment elasticity in industrialized countries (since import-competing industries are morelabour-intensive than export-oriented industries).
The reference periods used in constructing Table 2, which presents the estimates ofemployment elasticity, have been based on the observed behaviour of manufactured exports fromthe countries concerned. For most of the countries (including the United States of America),accelerated growth of manufactured exports commenced in the second half of the eighties. ForJapan and Korea, however, export growth was steady throughout the eighties and the nineties andreflected long-term trends.
Table 2: Employment elasticity: manufacturing sector
Period 1 Period 2 The full period
4-digit classification
IndiaIndonesiaKorea, Republic ofMalaysiaPhilippines
-0.28 (81-86) 0.60 (81-87) 0.50 (81-89)-0.28 (81-87)
-
0.35 (87-94)0.72 (88-96)0.00 (90-95)0.85 (88-95)0.00 (88-97)
0.16 (81-94)0.73 (81-96)0.22 (81-95)0.65 (81-95)
-
JapanUSA
-0.00 (88-95)
-0.00 (90-96)
0.20 (85-93) -
3-digit classification
ChinaTaiwan, ChinaThailand
0.27 (80-86) - -
0.53 (87-96) -
0.77 (86-94)
0.44 (80-96) - -
Note: The elasticities are estimated by dividing the rate of growth of employment by the rate of growth real output. In the case of Taiwan, China, no estimates could be derived because real output growth could not be estimated(for lack of a suitable deflator). In the cases of the Philippines and the USA, employment growth during therelevant periods was statistically insignificant.
Source: Based on the estimates presented in Table 3 and Appendix Table 1.17.
21
The experiences of China, India, Indonesia and Malaysia provide direct support to theproposition that trade increases the employment elasticity in manufacturing in developing countries;in all these cases, there was a significant rise in the employment elasticity in the second period –the period when growth of manufactured exports accelerated. Even in the case of Thailand, thougha two-period comparison is not possible, the high value of the elasticity observed for the period oftrade expansion is an indication of positive effect of trade. Such effects are not observed in thecases of the Republic of Korea and the Philippines. In the case of Korea, the periodization isalmost certainly inappropriate; a comparison of the experience in the seventies with that in theeighties might have been more appropriate. By the end of the eighties, the commodity compositionof Korea’s exports was changing. In some of the traditional labour-intensive manufactures, thecountry ceased to enjoy comparative advantage and was developing export capability in some ofthe (traditionally) import-competing industries. These changes seem to have signalled the beginningof a “de-industrialization” phase – an indication that Korea’s economy was ready to join the ranksof mature industrialized economies. In the case of the Philippines, the export performance wasrather erratic.
On the other hand, the evidence does not suggest any clear trend in the employmentelasticity in manufacturing in the two industrialized countries. In the case of Japan, two-periodcomparison was not possible; however, given its fairly high value for the whole period, theemployment elasticity is unlikely to have declined. In the United States, too, the employmentelasticity cannot be said to have declined, but here the manufacturing sector seems to haveexperienced jobless growth - at least since the late-eighties.
The changes in the employment elasticity in manufacturing, it may be recalled, are expectedto result from changes in the output composition in manufacturing. Thus in both developed anddeveloping countries, the share of export-oriented manufactures in total manufacturing output isexpected to rise and the share of import-competing manufactures is expected to fall. Thesechanges would obviously imply corresponding changes in the shares of export-oriented and import-competing industries in total manufacturing employment.
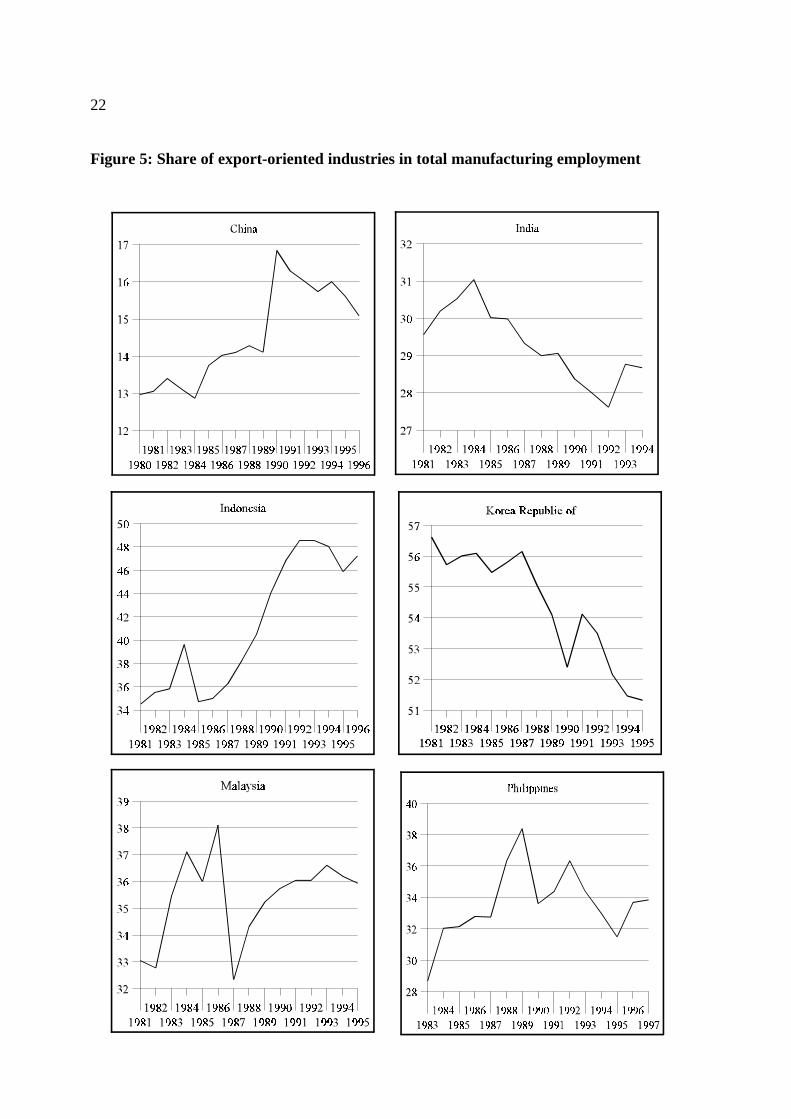
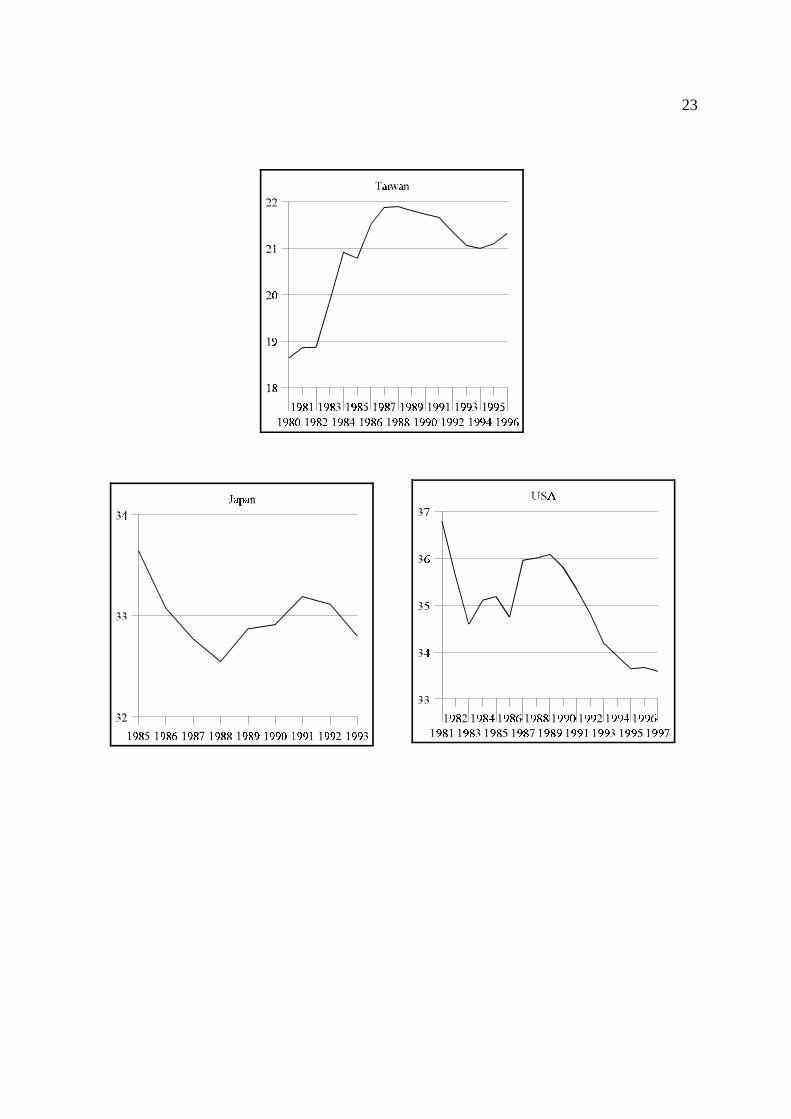
The inter-temporal movements in the share of export-oriented industries in totalmanufacturing employment in the sample economies, graphically presented in Figure 5, suggest anumber of conclusions. First, they confirm that, in the cases of China, Indonesia and Malaysia, theobserved rise in the employment elasticity is attributable to trade liberalization. In the case of India,however, the share of export-oriented industries in total manufacturing employment has actuallybeen declining; the observed rise in the employment elasticity, therefore, cannot be attributed toexport growth. Second, the case of Taiwan (China) clearly provides another example of how tradein manufactures raises the employment elasticity in manufacturing in developing countries. Third,in the case of the Philippines, the share of export-oriented industries in total manufacturingemployment fluctuated a great deal but on the whole tended to decline. Thus the employmentelasticity in manufacturing probably also declined. Fourth, in the Republic of Korea, too, the shareof export-oriented industries in total manufacturing employment declined, but there are no surpriseshere.
22
Figure 5: Share of export-oriented industries in total manufacturing employment
23

24
39 No data relating to petroleum and related industries are presented. These industries account for lessthan l per cent of manufacturing employment in all the countries under review.
Finally, in both Japan and the United States, the share of export-oriented industries in totalmanufacturing employment declined (the decline was much milder in Japan) even though the exportperformance of both countries was good. This is contrary to expectation; the effect of tradeliberalization seems to have been neutralized by other developments. At any rate, the trends in theemployment elasticity remain unclear in both cases.
The movements in the share of import-competing industries in total manufacturingemployment are graphically presented in Figure 6. In the two developed economies (Japan and theUnited States), this share declined as expected. But the really striking aspect brought into focusby the graphs is that, contrary to expectation, the share has been rising in most of the developingeconomies included in the sample; the exception is China where the share declined as expected.A closer inspection reveals some variations across countries. Thus in the Philippines, the share ofimport-competing industries was rising precisely during the period when the share of export-oriented industries was falling. In Indonesia too, the share of import-competing industries wasfalling for part of the period when the share of export-oriented industries was rising. In the caseof Korea (Rep.), the evidence is consistent with the idea that the comparative advantage has beenchanging. But these variations should not obscure the really important point: while trade inmanufactures with industrialized countries may have adverse effects on employment growth inimport-competing industries in developing countries, these are neither necessary nor lasting;simultaneous growth of employment in export-oriented and import-competing industries is in factquite typical. In industrialized countries, in contrast, the effect of trade with developing countrieson employment in import-competing industries seems to be necessarily adverse.
It thus appears that there is an important asymmetry between developing and industrializedeconomies: trade can actually stimulate employment growth in import-competing industries indeveloping economies while it necessarily has an adverse impact on employment in import-competing industries in industrialized countries. This asymmetry is demonstrated even more clearlyby the estimates of average annual growth rates of employment in the manufacturing sector as awhole and in its various segments in different periods presented in Table 3.39 In the sampledeveloping economies, trade liberalization seems to have universally stimulated employmentgrowth in the import-competing industries; there is no case where employment growth in import-competing industries slowed down in the wake of trade liberalization. In fact, it is quite clear thattrade liberalization generally led to an acceleration of employment growth in all branches ofmanufacturing. In some cases, as in India, the share of export-oriented industries in totalmanufacturing employment declined not because there was no acceleration in employment growthin export-oriented industries but because the acceleration was greater in other branches ofmanufacturing; the employment elasticity in manufacturing increased in India essentially becauseof the acceleration in the growth of “food, beverages and tobacco” industries (which are lesslabour-intensive than export-oriented industries but more labour-intensive than import-competingand other industries). In both Japan and the United States, on the other hand, employment in theimport-competing industries consistently declined.

25
Figure 6: Share of import-competing industries in total manufacturing employment

26

27
Table 3: Annual average rate of growth of employment
Export-oriented
industries
Import-competingindustries
Foodbeveragestobacco
Othermanufacturing
Totalmanufacturing
4-digit classification
India, 1981-861987-941981-94
Indonesia, 1981-871988-961981-96
Korea,Republic of, 1981-89
1990-951981-95
Malaysia, 1981-871988-951981-95
Philippines, 1983-871988-971983-87
0.01.90.0
11.111.713.1
5.60.01.8
0.012.88.1
2.00.0-
0.02.52.0
7.312.29.9
8.84.06.8
0.014.810.8
-5.55.6-
-6.23.20.0
10.55.26.7
3.40.01.2
0.04.32.0
0.00.0-
0.02.11.3
12.57.810.5
6.60.02.4
-4.510.95.9
0.00.0-
-1.62.41.1
10.89.310.5
6.00.02.5
-1.812.27.6
0.00.0-
Japan, 1985-891985-93
USA, 1981-891990-971988-951981-97
0.00.0
0.0-0.8-1.7-0.7
-0.9-0.7
-2.4-0.7-1.6-1.7
1.31.4
0.00.00.60.2
0.80.9
0.01.10.00.2
0.00.7
0.00.00.0-0.3
3-digit classification
China, 1980-861987-961980-96
Taiwan, China 1980-891990-961980-96
Thailand, 1982-861986-94
4.87.27.5
-6.0-0.81.7
4.714.4
2.35.34.5
4.01.52.9
-0.110.5
4.06.05.9
3.70.00.9
-4.211.4
3.49.37.7
1.6-1.5-1.4
-6.110.7
3.76.25.9
3.90.00.9
-1.912.2
Note: Growth rates for Thailand were estimated by using terminal values as continuous time-series were not available. Other growthrates are estimated by fitting regression equations. Statistically insignificant values are put as 0.0. In the case of Japan, the secondperiod (1990-93) was too short. In the case of the Philippines, there appeared to be a break in the series between 1987 and 1988.
Source: Author’s estimates based on data from the UNIDO database on industrial statistics.
28
40 These are the author’s estimates based on statistics derived from the UNIDO database. See AppendixTable 1.18.
41 These findings are in line with the predictions of some earlier studies that advocated trade liberalizationprecisely on these grounds. See, for example, Lydall, 1975, and Kruger et.al. 1981.
It is perhaps useful to reflect on possible reasons for the asymmetry. Two possible reasonswere suggested in the discussion of theoretical considerations above. First, trade might have theeffect of easing the foreign exchange constraint for developing countries; this stimulates growthof manufacturing in general. Second, trade liberalization could encourage inflows of foreign directinvestment into export-oriented as well as import-competing industries in developing economies.A third possible reason is that the income elasticity of demand for skill-intensive goods (import-competing goods in developing economies) is usually higher than that for labour-intensive goods(import-competing goods in industrialized countries). Finally, the existence of surplus labour inmost developing countries makes simultaneous growth of employment in all branches ofmanufacturing possible.
It must be recognized, however, that the decline in employment in import-competingindustries in the two industrialized countries is not wholly attributable to growth of trade withdeveloping countries. Employment in export-oriented industries, which would normally beexpected to grow as a result of growth of trade, actually recorded zero growth in Japan andnegative growth in the United States. This strongly suggests that there were factors other thantrade which reduced the employment intensity of production in both export-oriented and import-competing industries. Indeed, in the United States, these other factors seem to have been dominantduring 1988-95 (a period when export growth was fairly impressive) when employment declinedin both export-oriented and import-competing industries at roughly the same rate.
Another noteworthy fact is that the adverse effect of trade on manufacturing employmentin industrialized countries has been quite small. In the mid-eighties, the share of import-competingindustries in total manufacturing employment was less than 12 per cent in both the United Statesand Japan.40 Although employment in these industries has declined since then, it is clear from theevidence cited above that the decline has been nothing very dramatic. Moreover, even this declineis not wholly attributable to trade. Given these facts, trade with developing countries does notseem to explain even the trend in aggregate manufacturing employment. It is obviously absurd tohold trade responsible for the economy-wide unemployment problem in industrialized countries.It is not only that the adverse effect of trade on manufacturing employment is quite small. Theshare of manufacturing in total employment in these economies is also small. Even in the earlyeighties, this share was 24 per cent in Japan and 22 per cent in the United States.
The general conclusions suggested by the evidence are as follows. Growth of trade (inmanufactures) with developing economies does have a depressing effect on manufacturingemployment in industrialized economies, but the effect is quite small. Such trade, on the otherhand, has a large positive effect on manufacturing employment in developing economies because,apart from the fact that export-oriented industries are more labour-intensive than other industries,export expansion stimulates output growth in all branches of manufacturing (including import-competing industries).41
It is true that job losses affect the unskilled workers more than the skilled workers inindustrialized countries. In developing economies, on the other hand, job gains seem to accrue toboth skilled and unskilled workers though unskilled workers generally derive larger benefits(because more of them work in the export-oriented industries). Contrary to expectation, the

29
evidence does not suggest that the skilled workers in developing countries suffer job losses as aresult of trade liberalization.
5.4 Trade and wages The database being used here does not provide information on wage rates for skilled and
unskilled workers separately. Indeed, it does not provide information directly on wage rates at all.It only provides, for each 3-digit or 4-digit industry, total number of workers and the total amountpaid to them in wages and salaries. From these data, it is possible to estimate only the values ofaverage wage per worker in different branches of industry. Even such estimates are useful,however. In the case of developing economies, the ratio of unskilled to skilled workers employedin production is much higher in export-oriented industries than in import-oriented industries; thereverse is true in the case of industrialized economies. The ratio of wage per worker in import-competing industries to that in export-oriented industries, therefore, can be used as a measure,albeit imperfect, of wage differential between skilled and unskilled workers. A reduction in thisratio implies a widening wage differential in industrialized countries and a declining wagedifferential in developing countries; correspondingly, an increase in this ratio implies a decliningwage differential in industrialized countries and a widening wage differential in developingcountries.
The trade-theoretic argument leads us to expect that trade in manufactures betweenindustrialized and developing countries reduces the wage differential between skilled and unskilledworkers in developing countries and increases it in industrialized countries. However, as pointedout earlier, given the conditions of dualism and surplus labour prevailing in many developingcountries, decline in the wage differential is not logically inevitable. Besides, we now know thattrade does not necessarily reduce employment in import-competing industries in developingcountries. This further reduces the possibility of trade reducing the wage differential. Thus thehypothesis that is explored here can be stated as follows: trade reduces the ratio of wage perworker in import-competing industries to that in export-competing industries in industrializedcountries and may or may not reduce this ratio in developing countries.
The inter-temporal movements in the relevant wage ratio in different countries (in thesample) are graphically presented in Figure 7 and the relevant data are presented in Appendix Table1.19. In the case of the developing economies in the sample, the graphs confirm that trade may ormay not reduce wage inequality. The wage differential fell in Taiwan (China), Malaysia and theRepublic of Korea but rose in Indonesia and India. In the Philippines, it increased during 1986-91(when export performance was good and declined thereafter (when export performance waserratic); thus trade was actually associated with growing wage inequality. Thailand is notrepresented in the graphs but, as we shall see, there is evidence of declining wage inequality.

30
Figure 7: Ratio of wage per worker in import-competing industries to that in export-oriented industries

31
32
42 Cf. Collins, 1998, and Freeman, 1998.
The varying country experiences cannot be satisfactorily explained here; but they obviouslylend plausibility to the general argument that effects of trade on wage inequality in developingeconomies are conditioned by the degree of labour market dualism. Taiwan (China) and theRepublic of Korea have been promoting export-oriented manufacturing for a much longer periodthan the other countries and had ceased to be labour-surplus economies by the early eighties.Malaysia had started with a relatively small amount of surplus labour and, by the end of the eighties,had actually become a labour-scarce economy that was attracting migrant workers from theneighbouring countries (particularly Indonesia and the Philippines). Thailand too was beginning toattract migrant workers (particularly from neighbouring Myanmar) - an indication that the economywas becoming labour-scarce. The observed decline in the wage differential in these four countriesresulted from the growing tightness of the non-formal labour market and the associated decline inlabour market dualism. India, Indonesia and the Philippines, on the other hand, started with largestocks of surplus labour and remain labour-surplus economies to this day. The evidence suggeststhat the effects of trade were simply not strong enough to tighten the non-formal labour market inthese countries. Trade, moreover, did not adversely affect employment growth in the import-competing industries in any of these countries and there is no reason to suppose that the demandfor skilled labour declined. Given these circumstances, the observed decline in the relative wage ofunskilled workers does not seem particularly puzzling.
In the case of the two industrialized countries, there are some surprises. The graphs showthat the wage differential showed no particular trend in Japan and actually tended to fall in theUnited States. Thus the idea that trade with developing countries increases the relative wage ofskilled workers in industrialized countries receives no support from the evidence. The decliningtendency in the United States, it must be said, was rather weak and the differential increased quitesharply in the last two years (1996 and 1997) of the period covered. But 1988-95 was a period oftrade expansion and the wage differential narrowed precisely during this period. On the whole, theresults seem to contradict what has by now become the conventional wisdom in the United States.But the contradiction can be easily resolved. Research in the United States has indeed shown thatthe wage gap between skilled and unskilled workers increased substantially since the early eighties.But this research focussed on wage inequality in the economy as a whole rather than on wageinequality in the manufacturing sector.42 The evidence presented here suggests that wage inequalitygrew not within but outside the manufacturing sector. Growth of manufactured imports fromdeveloping countries, therefore, had very little to do with the growth of wage inequality. The factthat, in the case of Japan too, trade was not associated with growing wage differential adds strengthto this argument.
The estimates of average annual growth of real wages, presented in Table 4, allow us to addsome pertinent observations. In the developing economies, real wage growth was substantial in allbranches of manufacturing; the changes in wage inequality reflected differential rates of growthrather than wage decline for any particular group of workers. The same observations hold for Japanas well. But in the United States, real wages in all branches of manufacturing stagnated; indeed, theydeclined during 1988-95, a period when the economy performed fairly well in terms of both exportexpansion and growth of manufacturing output. The possibility that stagnation or decline in wagesaffected all workers - skilled and unskilled - in manufacturing cannot certainly be ruled out.

33
Table 4: Annual average rate of growth of real wage per worker
Export-oriented
industries
Import-competingindustries
Food beveragestobacco
Othermanufacturing
Totalmanufacturing
4-digit classification
India, 1981-861987-941981-94
Indonesia, 1981-871988-961981-96
Korea,Republic of 1981-89
1990-951981-95
Malaysia, 1981-871988-951981-95
Philippines, 1983-871988-971983-97
2.80.71.4
3.83.72.4
8.37.69.2
4.85.12.9
0.00.8-
4.02.02.5
6.00.02.5
7.66.38.0
5.43.52.0
0.00.0-
9.42.34.1
3.40.02.6
6.36.27.1
5.61.92.4
0.00.0-
2.80.01.5
5.20.01.9
7.17.78.7
3.22.31.7
0.02.2-
4.61.32.1
4.40.02.3
7.87.48.8
4.73.62.3
0.01.5-
Japan, 1985-891985-93
USA, 1981-891990-971988-951981-97
2.21.4
1.11.60.00.5
2.31.5
1.10.60.00.4
1.60.6
0.00.0-0.8-0.4
2.62.0
0.71.00.00.3
2.31.6
0.91.1-0.40.3
3-digit classification
Thailand, 1986-94 4.9 2.9 3.4 3.2 3.7
Note: Growth rates for Thailand were estimated by using terminal values as continuous time-series were not available. All other growth rates were estimated by fitting regression equations. Statistically insignificant estimates are putas 0.0. For China and Taiwan (China), real wages could not be estimated as no suitable deflators were availablefrom the sources used in this paper. In the case of Japan, the second period (1990-93) was too short.
Source: Author’s estimates based on nominal wage data from the UNIDO database on industrial statistics and consumerprice index from World Bank, World Development Indicators.

34
To sum up, the evidence examined here does not suggest that trade in manufacturesnecessarily increases wage inequality in industrialized countries and necessarily reduces it indeveloping countries. Growth of trade seems to have been associated with declining wageinequality in manufacturing in the United States and with unchanging wage inequality in Japan. Onthe other hand, expansion of trade was associated with growing wage inequality in severaldeveloping economies. In the case of these economies, it is possible to argue that surplus labourand labour market dualism neutralized the effect of trade on wage inequality. Empirically,moreover, it has been found that trade does not have any necessary adverse effect on employmentof skilled workers as predicted by theory. The observed behaviour of wage inequality inindustrialized economies, however, cannot be adequately explained here. Perhaps the mainexplanation is to be found in the important role that collective bargaining plays in determiningwages in manufacturing.
6. Conclusions
In theory, globalization should promote trade and stimulate growth of the world economy.In reality, there is little sign of all this happening. Trade barriers have come down, vastimprovements in transport and communication systems have occurred and international mobilityof capital has sharply increased. But world trade and GDP have recorded decelerating growth. Itseems undeniable too that dangers of economic instability have increased, particularly fordeveloping countries.
But trade liberalization should not be equated to globalization. The risks generated byglobalization arise from problems associated with short-term capital flows and not from tradeliberalization. On the other hand, there is evidence to suggest that the benefits of tradeliberalization outweigh the costs. One visible effect has been the emergence of a few developingeconomies - mostly in Asia - as important players in the world economy. These economies havebroken through the barriers of the long-established international division of labour to emerge asimportant producers and exporters of modern manufactures. However, for the vast majority ofdeveloping economies, which lack basic physical and social infrastructure, trade liberalization hasmeant very little. They are not in a position to benefit from the expansion of trade in manufacturesand have remained exporters of primary commodities. Their importance in the world economy hasarguably declined because the importance of primary commodities in world trade has declined. Allthis, to be sure, is a matter of concern, but that concern should lead us to focus on problems ofbuilding infrastructure in developing countries rather than to condemn trade liberalization.
Paradoxically, even the limited changes in the pattern of world trade have aroused fearsand apprehensions precisely in those countries which are in a position to benefit from them. Inindustrialized countries, growth of trade in manufactures with developing countries is heldresponsible for the problems of unemployment and growing inequalities. In developing countries,there are concerns about poor working conditions in export-oriented industries. The analysispresented in this paper suggests that these fears and concerns, though not without basis, aregrossly exaggerated.
Growth of trade in manufactures with developing countries has undoubtedly had someadverse effects on employment in unskilled-labour-intensive industries in industrialized countries.But the evidence from Japan and the United States shows that such effects have been too smallto explain even the trends in total manufacturing employment. Thus it is patently absurd toattribute the economy-wide unemployment in industrialized countries to trade in manufactures
35
43 Many economists have rejected the “North-South trade” explanation and have proposed a “bias intechnological change” explanation instead. Good summaries and references are available in Collins, ed., 1998.A “North-North trade” explanation has also been proposed. See, for example, Dinopoulos and Segerstrom, 1999.
with developing countries. Trade among industrialized countries could be much more plausiblyblamed. The fact that stagnation or decline in employment is observed even in skill-intensive(export-oriented) industries strongly suggests that there are factors (other than trade withdeveloping countries) operating to reduce employment-intensity of manufacturing in general.Given the overwhelming importance of trade among industrialized countries, it can be plausiblyhypothesized that competition associated with this trade has been the driving force behind labour-saving technological change which in turn has been responsible for the decline in employment-intensity in manufacturing.43 A similar hypothesis could be proposed for explaining employmenttrends in services. Economy-wide employment trends, after all, cannot be satisfactorily explainedby employment trends in manufacturing whose share in total employment is typically small inindustrialized countries.
Trade with developing countries cannot be held responsible for the growing wageinequality in industrialized countries either. The evidence from Japan and the United States doesnot show any consistent rise in “skill premium” in the manufacturing sector. This means that wageinequality grew basically outside the manufacturing sector and explanations very probably lie innew developments in the service sector.
The employment effects of trade in manufactures with industrialized countries arepotentially positive and large in developing countries. Export-oriented industries generally aremore labour-intensive than others; their growth, therefore, increases the employment-intensity ofmanufacturing in general. Contrary to theoretical prediction, moreover, skill-intensive (import-competing) industries do not necessarily decline in the wake of trade liberalization. Indeed, theevidence suggests that growth of export-oriented industries stimulates growth in all otherindustries including import-competing industries. On the whole, growth of manufactured exportsto industrialized countries increases demand for both unskilled and skilled workers in developingcountries.
The effects of trade on wages in developing countries, suggested by the evidence, are notso straightforward as predicted by the standard theory. Growth of trade, the evidence suggests,may either increase or reduce wage inequality depending upon the initial conditions prevailing inlabour markets. As a rule, developing countries have dualistic labour markets with a formalsegment, where government regulations and collective bargaining institutions determine wages andworking conditions, and a non-formal segment, where there is substantial excess supply ofunskilled labour and where neither government regulations nor collective bargaining institutionshave much influence. Export-oriented industries generally tend to rely on the non-formal segmentof the labour market. Wages of unskilled labour, therefore, begins to rise rapidly only aftersustained growth of export-oriented industries (together with associated growth of otherindustries) has wiped out the excess supply of unskilled labour in the non-formal segment. Tillsuch a stage is reached, skilled workers, who are mostly in the formal segment of the labourmarket, often succeed in getting higher wage rises (because they can reap the benefits ofgovernment regulations and collective bargaining institutions) so that wage inequality tends to rise.This possibility is strengthened if trade increases rather than reduce demand for skilled workers.In sum, growth of trade has a tendency to increase wage inequality in manufacturing in the shortrun; but if growth is sustained over a period, wage inequality declines not only in manufacturingbut also in the economy as whole.

36
These findings suggest that employment and labour market effects of North-South tradein manufactures are, on balance, significantly positive. Job losses in industrialized countries arequite small while job gains in developing countries are very substantial. Growth of such trade,moreover, does not necessarily increase wage dispersion in the manufacturing sector ofindustrialized countries and has the potential of reducing wage dispersion in developing countries.All this does not mean, of course, that there are no costs or that the costs should be ignored.Mechanisms have to be found for redeployment of the job-losers in industrialized countries. Evenin developing countries, where aggregate employment in manufacturing rises, there can be joblosses because of restructuring and mechanisms have to be found for redeployment of the job-losers. But the benefits of trade liberalization are clearly larger than the costs. The fact that thereare costs only emphasises the need for active labour market policies in both industrialized anddeveloping economies.
The observation that export-oriented industries in developing countries, at least in initialstages, are to be found mostly in the non-formal segment of the manufacturing sector imply thatthe concern about poor working conditions in these industries is not without foundation. But themeaning of “poor working conditions” needs to be properly understood. While there are reasonsto believe that working conditions in export-oriented industries are poorer than in industries in theformal segment, there are also reasons to believe that they are better than those in the rest of thenon-formal economy. This means that, for the workers concerned, growth of export-orientedindustries implies both increased employment opportunities and improved working conditions.It is difficult to find good reasons why, in this setting, there should be special concern aboutworking conditions in export-oriented industries alone. Working conditions need to be improvedgenerally and not just in export-oriented industries and encouraging growth of export-orientedindustries is actually one way of achieving such general improvement. It is quite clear that growthof trade, if sustained over a period, itself improves (or at least creates conditions for improvementin) working conditions. Indeed, improvement through this route is both durable and generalbecause it is achieved through a tightening of the labour market. Concern about poor workingconditions should lead us to think in terms of policy interventions which have the twin objectivesof stimulating growth of export-oriented industries and of stimulating demand for labour in thenon-formal economy through other measures.
The above conclusions about the effects of trade on employment and wages in developingeconomies, it must be said, are derived basically from an analysis of the experiences of theemerging Asian economies. For the two Latin American economies, originally included in thesample, it is found that the manufactured exports are no more labour-intensive than themanufactured imports. This finding, to the extent that it is valid, implies that trade in manufacturesbetween them and the industrialized economies is not based on Heckscher-Ohlin comparativeadvantage. This is why analysis of labour market effects of trade in these two economies has notbeen attempted. But the finding itself needs to be confirmed through detailed case studies.
A final remark concerns international mobility of labour. The scale of South-Northmigration currently is not large enough to substantially modify the labour market effects of trade,but skilled workers form a large (and possibly growing) majority of the migrants. This patternof international migration, if it persists, may make it difficult for many developing countries toimprove the skill composition of their labour force. Thus there is a danger that many developingeconomies will find it hard to get beyond specialization in primary commodities or labour-intensivemanufactures. This is an area which deserves attention from researchers.

APPENDIX 1
Statistical Tables
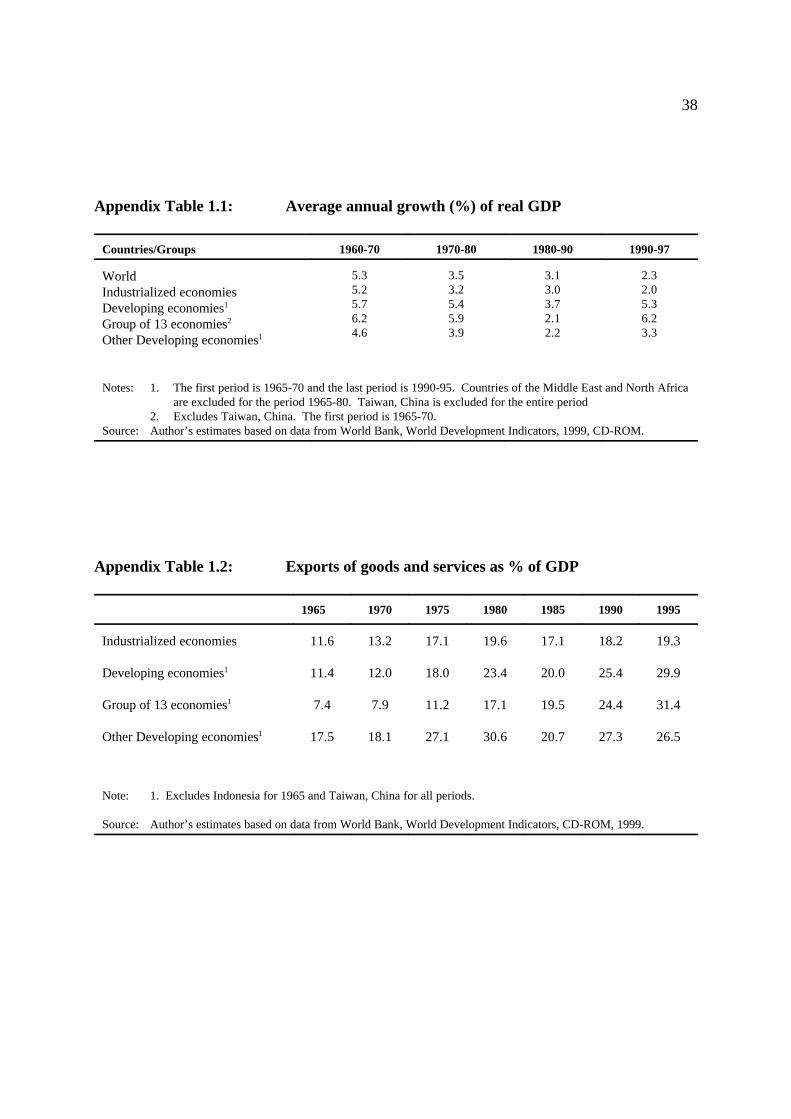
38
Appendix Table 1.1: Average annual growth (%) of real GDP
Countries/Groups 1960-70 1970-80 1980-90 1990-97
WorldIndustrialized economiesDeveloping economies1
Group of 13 economies2
Other Developing economies1
5.35.25.76.24.6
3.53.25.45.93.9
3.13.03.72.12.2
2.32.05.36.23.3
Notes: 1. The first period is 1965-70 and the last period is 1990-95. Countries of the Middle East and North Africaare excluded for the period 1965-80. Taiwan, China is excluded for the entire period
2. Excludes Taiwan, China. The first period is 1965-70.Source: Author’s estimates based on data from World Bank, World Development Indicators, 1999, CD-ROM.
Appendix Table 1.2: Exports of goods and services as % of GDP
1965 1970 1975 1980 1985 1990 1995
Industrialized economies
Developing economies1
Group of 13 economies1
Other Developing economies1
11.6
11.4
7.4
17.5
13.2
12.0
7.9
18.1
17.1
18.0
11.2
27.1
19.6
23.4
17.1
30.6
17.1
20.0
19.5
20.7
18.2
25.4
24.4
27.3
19.3
29.9
31.4
26.5
Note: 1. Excludes Indonesia for 1965 and Taiwan, China for all periods.
Source: Author’s estimates based on data from World Bank, World Development Indicators, CD-ROM, 1999.
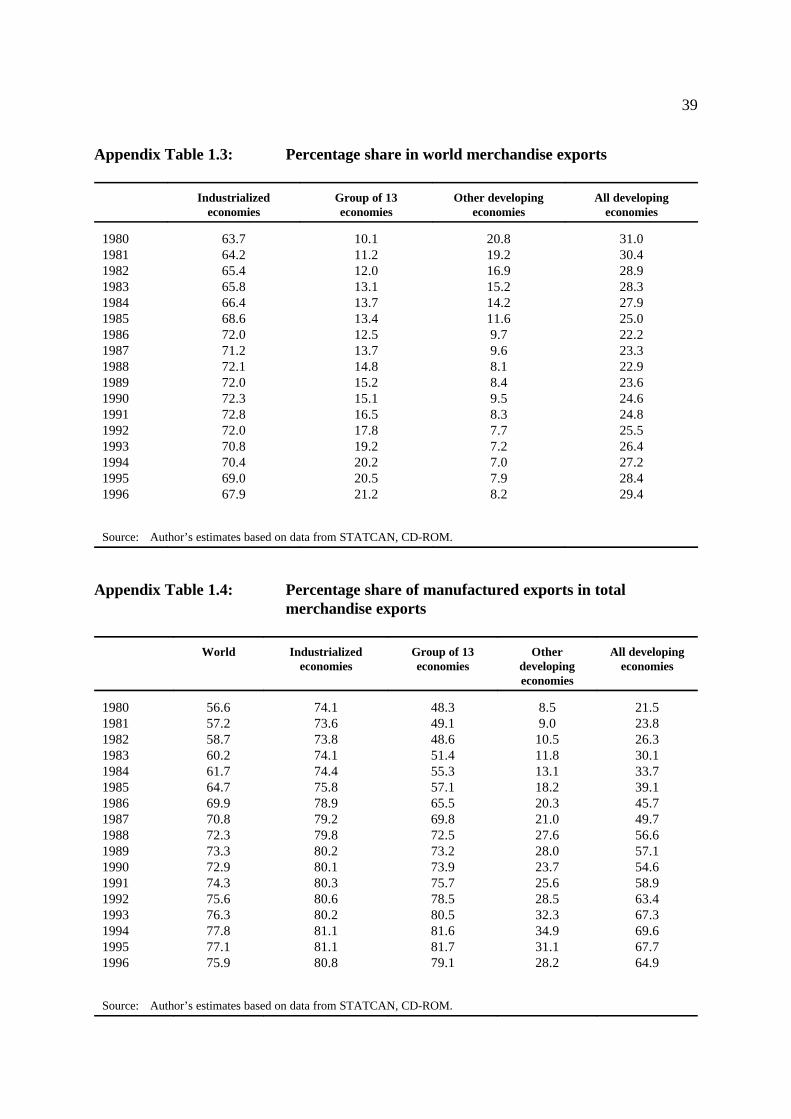
39
Appendix Table 1.3: Percentage share in world merchandise exports
Industrializedeconomies
Group of 13economies
Other developingeconomies
All developingeconomies
19801981198219831984198519861987198819891990199119921993199419951996
63.764.265.465.866.468.672.071.272.172.072.372.872.070.870.469.067.9
10.111.212.013.113.713.412.513.714.815.215.116.517.819.220.220.521.2
20.819.216.915.214.211.69.79.68.18.49.58.37.77.27.07.98.2
31.030.428.928.327.925.022.223.322.923.624.624.825.526.427.228.429.4
Source: Author’s estimates based on data from STATCAN, CD-ROM.
Appendix Table 1.4: Percentage share of manufactured exports in totalmerchandise exports
World Industrializedeconomies
Group of 13economies
Otherdevelopingeconomies
All developingeconomies
19801981198219831984198519861987198819891990199119921993199419951996
56.657.258.760.261.764.769.970.872.373.372.974.375.676.377.877.175.9
74.173.673.874.174.475.878.979.279.880.280.180.380.680.281.181.180.8
48.349.148.651.455.357.165.569.872.573.273.975.778.580.581.681.779.1
8.59.0
10.511.813.118.220.321.027.628.023.725.628.532.334.931.128.2
21.523.826.330.133.739.145.749.756.657.154.658.963.467.369.667.764.9
Source: Author’s estimates based on data from STATCAN, CD-ROM.

40
Appendix Table 1.5: Percentage share of groups of countries in world export of manufactures
Industrializedeconomies
Group of 13 economies Other developingeconomies
All developingeconomies
19801981198219831984198519861987198819891990199119921993199419951996
83.382.682.381.180.180.481.379.779.578.879.378.676.774.473.472.572.3
8.69.6
10.011.212.211.811.713.514.815.215.316.818.420.221.221.722.1
3.13.03.03.03.03.22.82.83.13.23.12.92.93.03.13.23.0
11.712.613.014.215.215.014.516.317.918.418.419.721.323.224.324.925.1
Source: Author’s estimates based on data from STATCAN, CD-ROM.

41
Appendix Table 1.6: Import duties as % of value of imports for selected countries
1975 1980 1985 1990 1995
AustraliaBelgiumCanadaFranceGermanyJapanNetherlandsSwedenUnited KingdomUnited States
BrazilIndiaIndonesiaKorea, Rep.MalaysiaMexicoPhilippinesSingaporeThailand
11.500.025.930.090.04...
0.112.690.844.37
...29.11
...8.469.41......
1.3414.35
8.530.014.590.110.022.290.011.540.112.97
16.5426.935.137.649.009.3013.430.9111.10
8.570.023.740.070.012.300.000.800.003.60
6.6244.144.308.418.686.4914.310.7213.44
7.860.012.860.020.002.650.001.010.113.37
10.5442.186.297.884.815.9814.520.3511.67
4.480.001.720.010.00
...0.000.980.092.59
8.6124.823.294.653.122.4014.380.238.02
Source: World Bank, World Development Indicators, CD-ROM, 1999.
Appendix Table 1.7: Percentage share in global flows of foreign direct investment
Industrialized economies Developing economies
19701977198119851991199519961997
75.975.175.677.772.362.956.555.5
22.724.123.722.324.831.037.538.0
Source: Author’s estimates based on data from World Bank, World Development Indicators, CD-ROM, 1999.

42
Appendix Table 1.8: Performance of Group of 13 economies
Percentage share of theGroup of 13 economiesin:
1970 1975 1980 1985 1990 1995 1996 1997
Total exports of goodsand services fromdeveloping countries
Total merchandiseexports from developingcountries
Total manufacturedexports from developingcountries
Total inflows of foreigndirect investment todeveloping countries
39.5
...
...
47.8
35.8
...
...
43.4
38.8
32.6
73.3
...
56.9
53.6
78.4
59.2
64.0
61.5
83.2
75.5
74.1
72.3
87.2
81.7
...
72.1
87.9
78.9
...
...
...
75.2
Note: 1. Data for Taiwan, China were not available.Source: Author’s estimates. Data on exports of goods and services are from the World Bank, World Development
Indicators, CD-ROM, 1999; and the data on merchandise exports and manufactured exports are from STATCAN,CD-ROM.
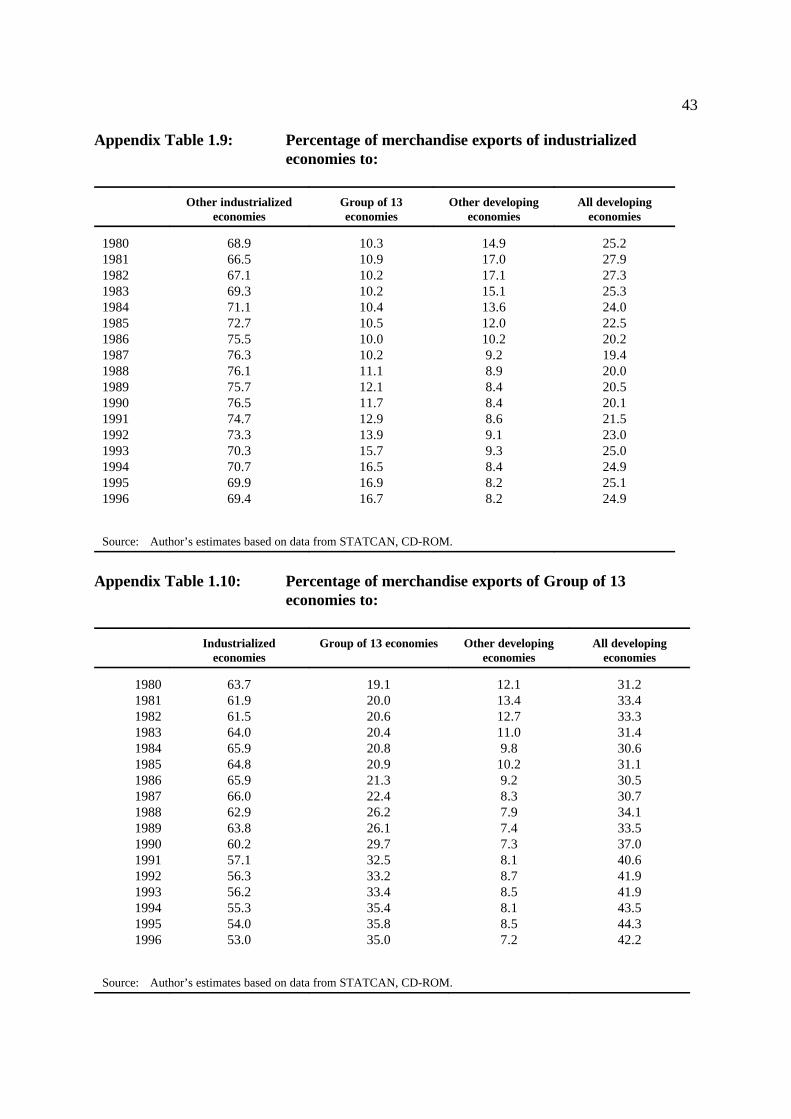
43
Appendix Table 1.9: Percentage of merchandise exports of industrializedeconomies to:
Other industrializedeconomies
Group of 13economies
Other developingeconomies
All developingeconomies
19801981198219831984198519861987198819891990199119921993199419951996
68.966.567.169.371.172.775.576.376.175.776.574.773.370.370.769.969.4
10.310.910.210.210.410.510.010.211.112.111.712.913.915.716.516.916.7
14.917.017.115.113.612.010.29.28.98.48.48.69.19.38.48.28.2
25.227.927.325.324.022.520.219.420.020.520.121.523.025.024.925.124.9
Source: Author’s estimates based on data from STATCAN, CD-ROM.
Appendix Table 1.10: Percentage of merchandise exports of Group of 13economies to:
Industrializedeconomies
Group of 13 economies Other developingeconomies
All developingeconomies
19801981198219831984198519861987198819891990199119921993199419951996
63.761.961.564.065.964.865.966.062.963.860.257.156.356.255.354.053.0
19.120.020.620.420.820.921.322.426.226.129.732.533.233.435.435.835.0
12.113.412.711.09.8
10.29.28.37.97.47.38.18.78.58.18.57.2
31.233.433.331.430.631.130.530.734.133.537.040.641.941.943.544.342.2
Source: Author’s estimates based on data from STATCAN, CD-ROM.

44
Appendix Table 1.11: Percentage of manufactured exports of industrializedeconomies to:
Other industrializedeconomies
Group of 13 economies Other developingeconomies
All developingeconomies
19801981198219831984198519861987198819891990199119921993199419951996
67.564.865.167.970.472.075.176.176.376.176.774.672.969.870.269.869.5
11.111.911.111.011.311.410.610.811.412.412.113.414.616.817.617.917.7
16.418.819.116.514.412.610.59.39.08.38.38.79.39.68.48.28.3
27.530.730.227.525.724.021.120.120.420.720.422.123.926.426.026.126.0
Source: Author’s estimates based on data from STATCAN, CD-ROM.
Appendix Table 1.12: Percentage of manufactured exports of the Group of 13economies to:
Industrializedeconomies
Group of 13 economies Other developingeconomies
All developingeconomies
19801981198219831984198519861987198819891990199119921993199419951996
60.660.460.964.765.965.466.867.063.464.860.256.756.356.455.354.655.4
20.921.621.120.521.621.521.622.627.426.730.833.934.334.336.036.236.2
16.216.615.713.09.9
10.29.28.37.77.27.08.08.48.07.77.97.1
37.138.236.833.531.531.730.830.935.133.937.841.942.742.343.744.143.3
Source: Author’s estimates based on data from STATCAN, CD-ROM.

45
Appendix Table 1.13: Percentage of merchandise exports of Other DevelopingEconomies to:
Industrialized economies Group of 13 economies Other Developingeconomies
All developingeconomies
19801981198219831984198519861987198819891990199119921993199419951996
70.069.767.966.267.270.570.265.563.967.569.569.765.259.660.459.960.9
10.511.711.912.512.09.9
10.511.09.99.4
11.812.213.517.016.016.514.1
11.311.512.211.812.612.310.110.210.110.39.6
10.810.813.412.611.910.5
21.823.224.124.324.622.220.621.220.019.721.423.024.330.428.628.424.6
Source: Author’s estimates based on data from STATCAN, CD-ROM.
Appendix Table 1.14: Percentage of manufactured exports of Other DevelopingEconomies to:
Industrialized economies Group of 13 economies Other Developingeconomies
19801981198219831984198519861987198819891990199119921993199419951996
37.131.531.933.331.233.934.832.229.030.227.022.319.817.917.517.717.6
6.04.84.44.44.95.65.14.84.64.14.13.94.34.64.64.33.7
56.963.763.762.363.960.560.163.066.456.768.973.875.977.577.978.078.7
Source: Author’s estimates based on data from STATCAN, CD-ROM.

46
Appendix Table 1.15: Ratio of the value of manufactured exports to that ofmanufactured imports
Of Industrialized economies tothat of Other Developing
economies
Of Group of 13 economies to thatof Other Developing economies
Of Industrializedeconomies to that of
Group of 13 economies
19801981198219831984198519861987198819891990199119921993199419951996
7.39.79.77.76.45.04.53.83.42.93.13.53.83.83.22.93.0
4.76.67.06.24.33.63.83.83.43.63.33.93.83.43.13.53.7
1.81.71.51.21.11.21.11.21.10.91.01.01.01.11.11.11.0
Source: Author’s estimates based on data from STATCAN, CD-ROM.
Appendix Table 1.16: Growth of manufacturing output
Period 1 Period 2 The full period
IndiaIndonesiaKorea, Republic ofMalaysiaPhilippines
5.6 (81-86)17.9 (80-87)12.0 (81-89)6.3 (81-87)0.0 (83-87)
6.9 (87-94)12.9 (88-96)10.1 (90-95)14.3 (88-95)4.6 (88-97)
7.0 (81-94)14.3 (80-96)11.2 (81-95)11.6 (81-95)
-
JapanUSA
0.0 (85-89)2.1 (88-95)
-5.3 (90-96)
3.5 (85-93)3.0 (87-96)
ChinaThailand
13.8 (80-86)-7.4 (82-86)
11.8 (87-96)15.8 (86-94)
13.3 (80-96)7.5 (82-94)
Note: The statistically insignificant values are put as 0.0. In the case of Japan, the second period (1990-93 was tooshort. In the case of the Philippines, there appears to be a break in the series between 1987 and 1988. In thecase of the United States, the price deflator for manufacturing was available only for the period 1987-96.
Source: Author’ estimates based on nominal output data from the UNIDO database on industrial statistics and pricedeflator from World Bank, World Development Indicators.
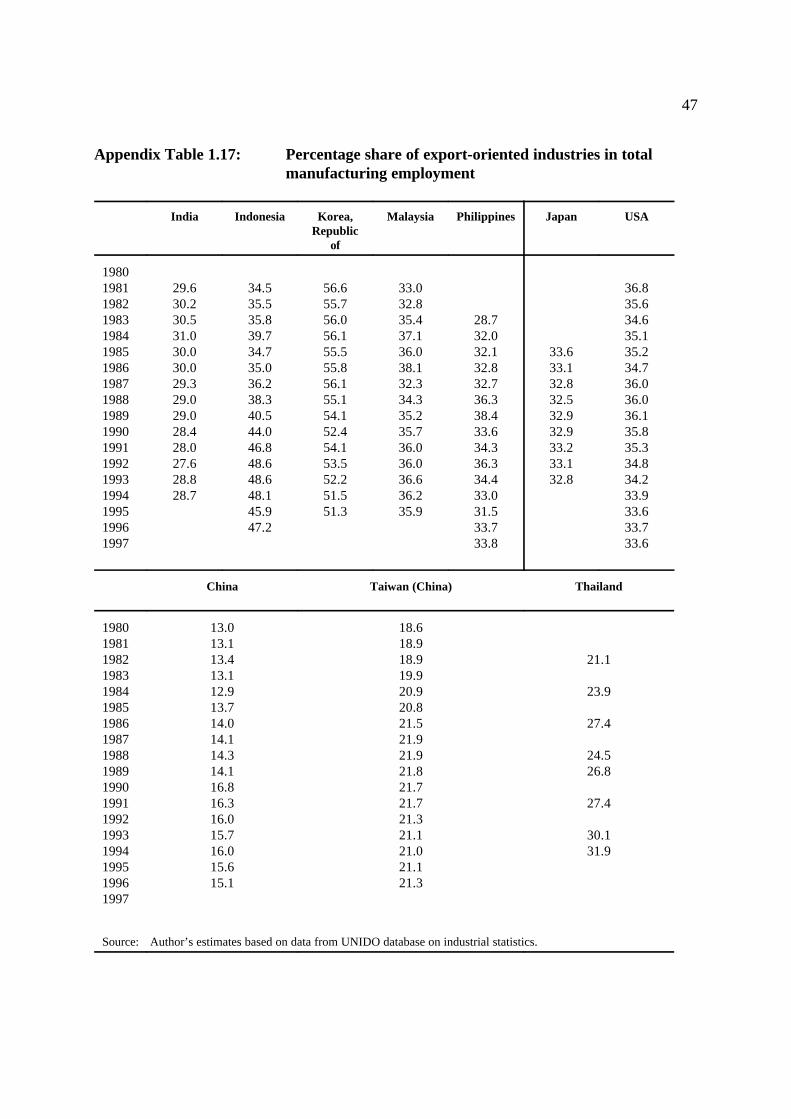
47
Appendix Table 1.17: Percentage share of export-oriented industries in totalmanufacturing employment
India Indonesia Korea,Republic
of
Malaysia Philippines Japan USA
198019811982198319841985198619871988198919901991199219931994199519961997
29.630.230.531.030.030.029.329.029.028.428.027.628.828.7
34.535.535.839.734.735.036.238.340.544.046.848.648.648.145.947.2
56.655.756.056.155.555.856.155.154.152.454.153.552.251.551.3
33.032.835.437.136.038.132.334.335.235.736.036.036.636.235.9
28.732.032.132.832.736.338.433.634.336.334.433.031.533.733.8
33.633.132.832.532.932.933.233.132.8
36.835.634.635.135.234.736.036.036.135.835.334.834.233.933.633.733.6
China Taiwan (China) Thailand
198019811982198319841985198619871988198919901991199219931994199519961997
13.013.113.413.112.913.714.014.114.314.116.816.316.015.716.015.615.1
18.618.918.919.920.920.821.521.921.921.821.721.721.321.121.021.121.3
21.1
23.9
27.4
24.526.8
27.4
30.131.9
Source: Author’s estimates based on data from UNIDO database on industrial statistics.

48
Appendix Table 1.18: Percentage share of import-competing industries in total manufacturing employment
India Indonesia Korea,Republic
of
Malaysia Philippines Japan USA
198019811982198319841985198619871988198919901991199219931994199519961997
12.813.413.913.914.714.214.814.514.714.915.015.014.614.7
12.011.811.410.410.510.19.89.59.58.99.28.8
10.010.711.211.7
9.29.59.39.49.49.8
10.410.911.712.213.914.014.615.215.6
21.922.323.523.723.522.926.027.128.229.630.531.031.632.532.1
19.018.816.616.516.115.815.615.116.619.920.922.426.122.622.5
11.611.511.411.311.111.110.910.610.3
13.212.813.012.311.711.411.711.511.311.211.211.011.010.810.710.610.6
China Taiwan (China) Thailand
198019811982198319841985198619871988198919901991199219931994199519961997
25.125.324.724.724.823.423.122.922.622.919.220.720.920.820.620.921.2
10.510.510.410.09.69.79.9
10.210.511.011.712.112.512.912.913.013.1
7.5
8.9
8.0
7.57.8
9.9
8.37.1
Source: Author’s estimates based on data from UNIDO database on industrial statistics.
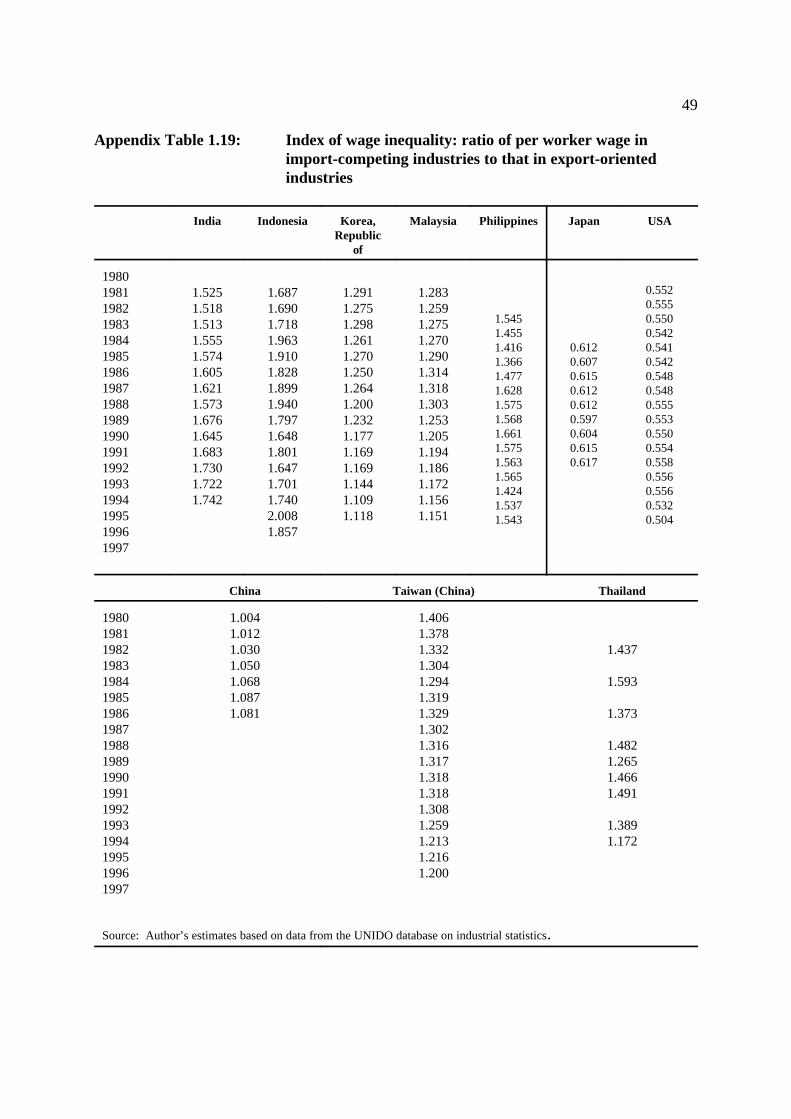
49
Appendix Table 1.19: Index of wage inequality: ratio of per worker wage inimport-competing industries to that in export-orientedindustries
India Indonesia Korea,Republic
of
Malaysia Philippines Japan USA
198019811982198319841985198619871988198919901991199219931994199519961997
1.5251.5181.5131.5551.5741.6051.6211.5731.6761.6451.6831.7301.7221.742
1.6871.6901.7181.9631.9101.8281.8991.9401.7971.6481.8011.6471.7011.7402.0081.857
1.2911.2751.2981.2611.2701.2501.2641.2001.2321.1771.1691.1691.1441.1091.118
1.2831.2591.2751.2701.2901.3141.3181.3031.2531.2051.1941.1861.1721.1561.151
1.5451.4551.4161.3661.4771.6281.5751.5681.6611.5751.5631.5651.4241.5371.543
0.6120.6070.6150.6120.6120.5970.6040.6150.617
0.5520.5550.5500.5420.5410.5420.5480.5480.5550.5530.5500.5540.5580.5560.5560.5320.504
China Taiwan (China) Thailand
198019811982198319841985198619871988198919901991199219931994199519961997
1.0041.0121.0301.0501.0681.0871.081
1.4061.3781.3321.3041.2941.3191.3291.3021.3161.3171.3181.3181.3081.2591.2131.2161.200
1.437
1.593
1.373
1.4821.2651.4661.491
1.3891.172
Source: Author’s estimates based on data from the UNIDO database on industrial statistics.
APPENDIX II
Lists of Export-Oriented and Import-Competing Industriesfor Different Countries and Regions

51
Argentina
Export-oriented industriesSpinning, weaving and finishing textileManufacture of wearing apparel, except footwearTanneries and leather finishingFur dressing and dyeing industriesManufacture of products of leather and leather substitutes, except footwear and wearingapparelManufacture of basic industrial chemicals except fertilizersManufacture of chemical products not elsewhere classifiedIron and steel basic industriesNon-ferrous metal basic industriesManufacture of cutlery, hand tools and general hardwareManufacture of engines and turbinesManufacture of office, computing and accounting machineryManufacture of jewellery and related articles
Import competing industriesManufactures of fertilizers and pesticidesManufacture of synthetic resins, plastic materials and man-made fibres except glassManufacture of drugs and medicinesManufacture of structural clay productsManufacture of agricultural machinery and equipmentManufacture of metal and wood working machineryManufacture of special industrial machinery and equipment except metal and wood workingmachineryMachinery and equipment except electrical n.e.c.Manufacture of electrical industrial machinery and apparatusManufacture of radio, television and communication equipment and apparatusManufacture of electrical appliances and housewaresManufacture of electrical apparatus and supplies n.e.c.Ship building and repairingManufacture of railroad equipmentManufactures of motor vehiclesManufacture of professional and scientific, and measuring and controlling equipment, n.e.c.Manufacture of photographic and optical goodsManufacture of watches and clocksManufacture of musical instruments
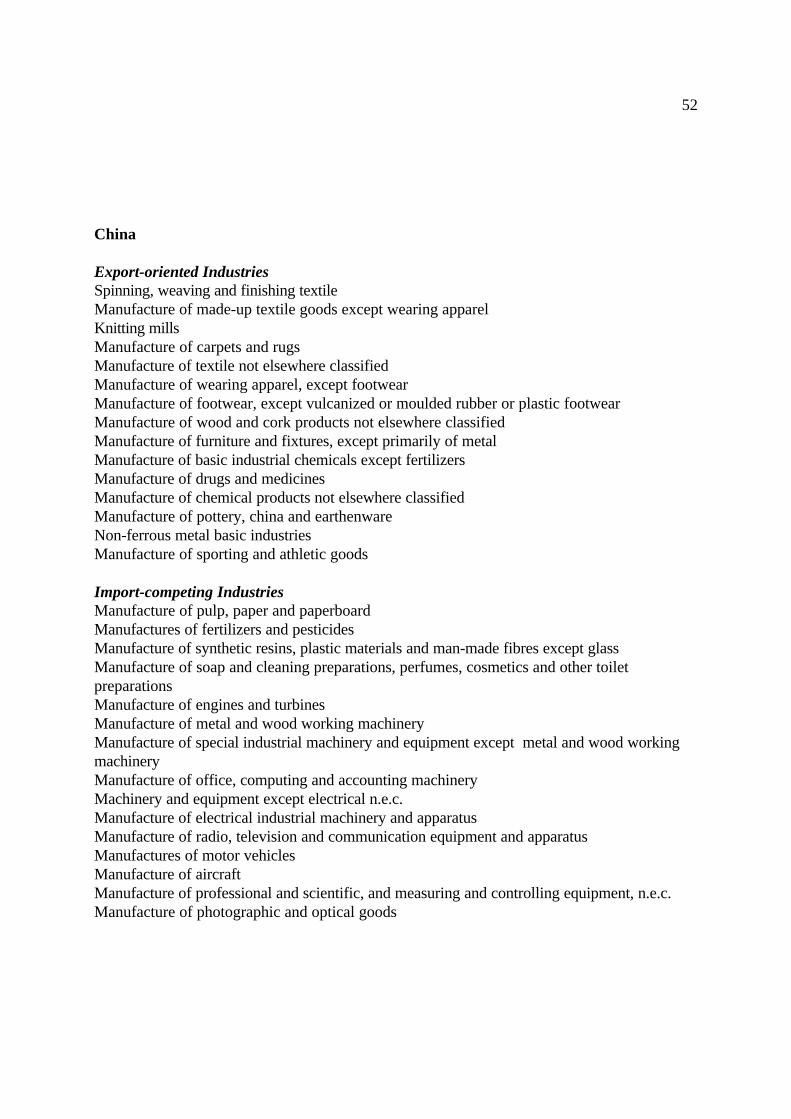
52
China
Export-oriented IndustriesSpinning, weaving and finishing textileManufacture of made-up textile goods except wearing apparelKnitting millsManufacture of carpets and rugsManufacture of textile not elsewhere classifiedManufacture of wearing apparel, except footwearManufacture of footwear, except vulcanized or moulded rubber or plastic footwearManufacture of wood and cork products not elsewhere classifiedManufacture of furniture and fixtures, except primarily of metalManufacture of basic industrial chemicals except fertilizersManufacture of drugs and medicinesManufacture of chemical products not elsewhere classifiedManufacture of pottery, china and earthenwareNon-ferrous metal basic industriesManufacture of sporting and athletic goods
Import-competing IndustriesManufacture of pulp, paper and paperboardManufactures of fertilizers and pesticidesManufacture of synthetic resins, plastic materials and man-made fibres except glassManufacture of soap and cleaning preparations, perfumes, cosmetics and other toiletpreparationsManufacture of engines and turbinesManufacture of metal and wood working machineryManufacture of special industrial machinery and equipment except metal and wood workingmachineryManufacture of office, computing and accounting machineryMachinery and equipment except electrical n.e.c.Manufacture of electrical industrial machinery and apparatusManufacture of radio, television and communication equipment and apparatusManufactures of motor vehiclesManufacture of aircraftManufacture of professional and scientific, and measuring and controlling equipment, n.e.c.Manufacture of photographic and optical goods
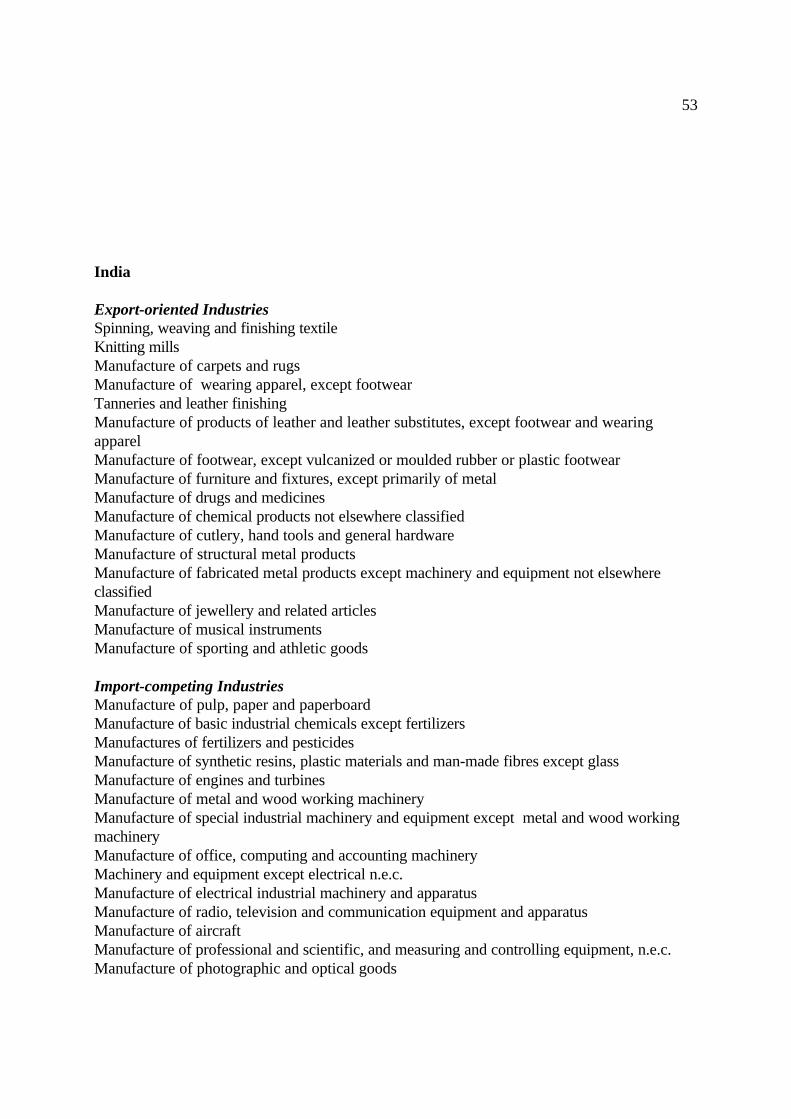
53
India
Export-oriented IndustriesSpinning, weaving and finishing textileKnitting millsManufacture of carpets and rugsManufacture of wearing apparel, except footwearTanneries and leather finishingManufacture of products of leather and leather substitutes, except footwear and wearingapparelManufacture of footwear, except vulcanized or moulded rubber or plastic footwearManufacture of furniture and fixtures, except primarily of metalManufacture of drugs and medicinesManufacture of chemical products not elsewhere classifiedManufacture of cutlery, hand tools and general hardwareManufacture of structural metal productsManufacture of fabricated metal products except machinery and equipment not elsewhereclassifiedManufacture of jewellery and related articlesManufacture of musical instrumentsManufacture of sporting and athletic goods
Import-competing IndustriesManufacture of pulp, paper and paperboardManufacture of basic industrial chemicals except fertilizersManufactures of fertilizers and pesticidesManufacture of synthetic resins, plastic materials and man-made fibres except glassManufacture of engines and turbinesManufacture of metal and wood working machineryManufacture of special industrial machinery and equipment except metal and wood workingmachineryManufacture of office, computing and accounting machineryMachinery and equipment except electrical n.e.c.Manufacture of electrical industrial machinery and apparatusManufacture of radio, television and communication equipment and apparatusManufacture of aircraftManufacture of professional and scientific, and measuring and controlling equipment, n.e.c.Manufacture of photographic and optical goods

54
Indonesia
Export-oriented IndustriesSpinning, weaving and finishing textileManufacture of made-up textile goods except wearing apparelManufacture of carpets and rugsManufacture of wearing apparel, except footwearManufacture of products of leather and leather substitutes, except footwear and wearingapparelManufacture of footwear, except vulcanized or moulded rubber or plastic footwearSawmills, planing and other wood millsManufacture of wood and cork products not elsewhere classifiedManufacture of furniture and fixtures, except primarily of metalManufacture of glass and glass productsNon-ferrous metal basic industriesManufacture of furniture and fixture primarily of metalManufacture of sporting and athletic goodsManufacturing industries n.e.c.
Import-competing IndustriesManufacture of pulp, paper and paperboard articles n.e.c.Manufacture of basic industrial chemicals except fertilizersManufacture of synthetic resins, plastic materials and man-made fibres except glassManufacture of chemical products not elsewhere classifiedIron and steel basic industriesManufacture of cutlery, hand tools and general hardwareManufacture of structural metal productsManufacture of engines and turbinesManufacture of agricultural machinery and equipmentManufacture of metal and wood working machineryManufacture of special industrial machinery and equipment except metal and wood workingmachineryManufacture of office, computing and accounting machineryMachinery and equipment except electrical n.e.c.Manufacture of electrical industrial machinery and apparatusManufacture of radio, television and communication equipment and apparatusManufacture of electrical appliances and housewaresShip building and repairingManufacture of railroad equipmentManufactures of motor vehiclesManufacture of professional and scientific, and measuring and controlling equipment, n.e.c.Manufacture of photographic and optical goodsManufacture of watches and clocksManufacture of musical instruments

55
Korea, Republic of
Export-oriented IndustriesSpinning, weaving and finishing textileManufacture of made-up textile goods except wearing apparelKnitting millsCordage, rope and twine industriesManufacture of textile not elsewhere classifiedManufacture of wearing apparel, except footwearManufacture of products of leather and leather substitutes, except footwear and wearingapparelManufacture of footwear, except vulcanized or moulded rubber or plastic footwearTyre and tube industriesIron and steel basic industriesManufacture of cutlery, hand tools and general hardwareManufacture of furniture and fixture primarily of metalManufacture of office, computing and accounting machineryManufacture of electrical industrial machinery and apparatusManufacture of radio, television and communication equipment and apparatusManufacture of electrical appliances and housewaresManufacture of electrical apparatus and supplies n.e.c.Ship building and repairingManufacture of motor vehiclesManufacture of motorcycles and bicyclesManufacture of musical instrumentsManufacture of sporting and athletic goodsManufacturing industries n.e.c.
Import-competing IndustriesFur dressing and dyeing industriesManufacture of pulp, paper and paperboardManufacture of pulp, paper and paperboard articles n.e.c.Manufacture of basic industrial chemicals except fertilizersManufacture of synthetic resins, plastic materials and man-made fibres except glassManufacture of chemical products not elsewhere classifiedNon-ferrous metal basic industriesManufacture of engines and turbinesManufacture of agricultural machinery and equipmentManufacture of metal and wood working machineryManufacture of special industrial machinery and equipment except metal and wood workingmachineryMachinery and equipment except electrical n.e.c.Manufacture of aircraftManufacture of professional and scientific, and measuring and controlling equipment, n.e.c.Manufacture of photographic and optical goods

56
Malaysia
Export-oriented IndustriesManufacture of wearing apparel, except footwearManufacture of products of leather and leather substitutes, except footwear and wearingapparelManufacture of footwear, except vulcanized or moulded rubber or plastic footwearManufacture of wooden and cane containers and small cane wareManufacture of wood and cork products not elsewhere classifiedManufacture of furniture and fixtures, except primarily of metalManufacture of rubber products n.e.c.Manufacture of pottery, china and earthenwareNon-ferrous metal basic industriesManufacture of furniture and fixture primarily of metalManufacture of office, computing and accounting machineryManufacture of radio, television and communication equipment and apparatusManufacture of electrical appliances and housewaresManufacture of sporting and athletic goods
Import-competing IndustriesManufacture of pulp, paper and paperboardManufacture of basic industrial chemicals except fertilizersManufactures of fertilizers and pesticidesManufacture of synthetic resins, plastic materials and man-made fibres except glassManufacture of drugs and medicinesManufacture of soap and cleaning preparations, perfumes, cosmetics and other toiletpreparationsManufacture of chemical products not elsewhere classifiedIron and steel basic industriesManufacture of cutlery, hand tools and general hardwareManufacture of fabricated metal products except machinery and equipment not elsewhereclassifiedManufacture of engines and turbinesMachinery and equipment except electrical n.e.c.Manufacture of electrical apparatus and supplies n.e.c.Ship building and repairingManufactures of motor vehiclesManufacture of motorcycles and bicyclesManufacture of photographic and optical goodsManufacture of watches and clocksManufacture of musical instruments
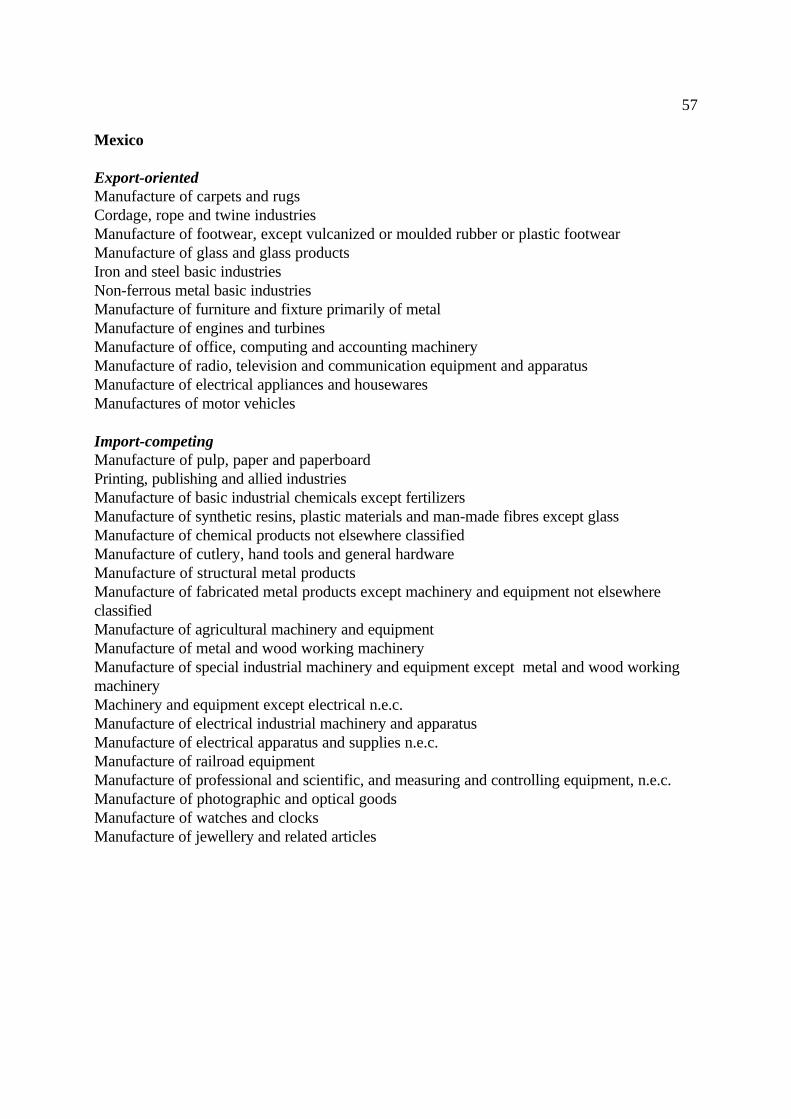
57
Mexico
Export-orientedManufacture of carpets and rugsCordage, rope and twine industriesManufacture of footwear, except vulcanized or moulded rubber or plastic footwearManufacture of glass and glass productsIron and steel basic industriesNon-ferrous metal basic industriesManufacture of furniture and fixture primarily of metalManufacture of engines and turbinesManufacture of office, computing and accounting machineryManufacture of radio, television and communication equipment and apparatusManufacture of electrical appliances and housewaresManufactures of motor vehicles
Import-competingManufacture of pulp, paper and paperboardPrinting, publishing and allied industriesManufacture of basic industrial chemicals except fertilizersManufacture of synthetic resins, plastic materials and man-made fibres except glassManufacture of chemical products not elsewhere classifiedManufacture of cutlery, hand tools and general hardwareManufacture of structural metal productsManufacture of fabricated metal products except machinery and equipment not elsewhereclassifiedManufacture of agricultural machinery and equipmentManufacture of metal and wood working machineryManufacture of special industrial machinery and equipment except metal and wood workingmachineryMachinery and equipment except electrical n.e.c.Manufacture of electrical industrial machinery and apparatusManufacture of electrical apparatus and supplies n.e.c.Manufacture of railroad equipmentManufacture of professional and scientific, and measuring and controlling equipment, n.e.c.Manufacture of photographic and optical goodsManufacture of watches and clocksManufacture of jewellery and related articles
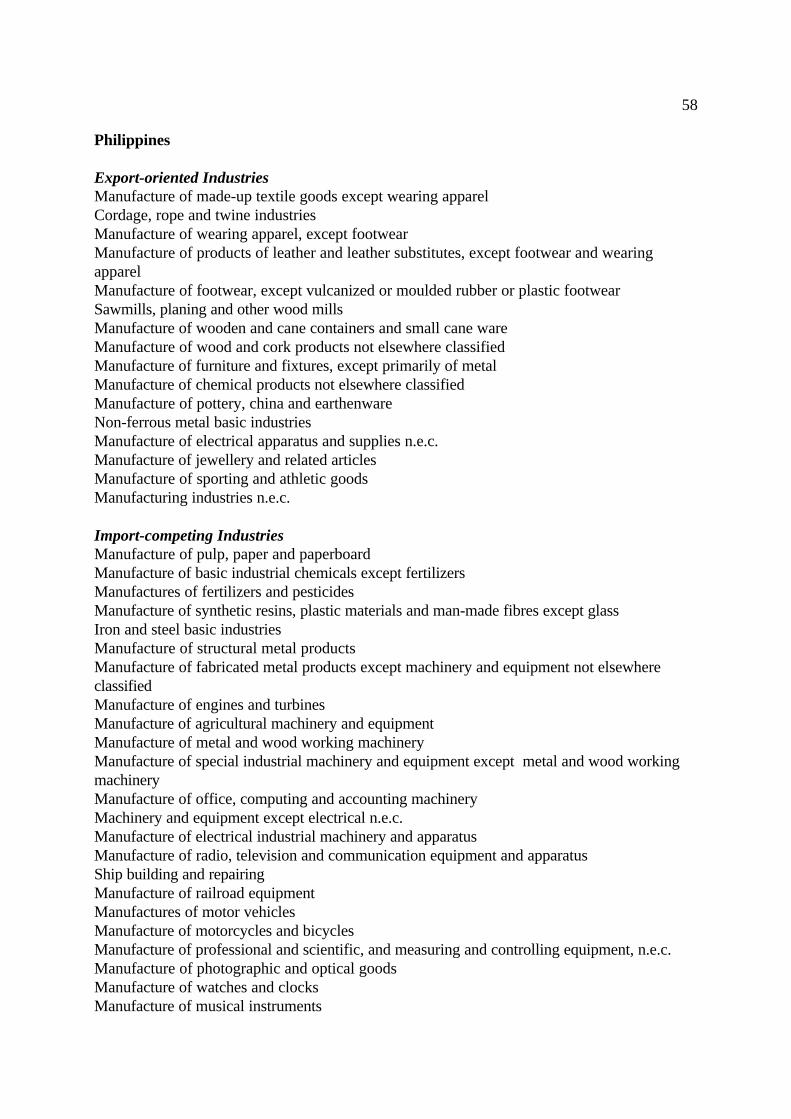
58
Philippines
Export-oriented IndustriesManufacture of made-up textile goods except wearing apparelCordage, rope and twine industriesManufacture of wearing apparel, except footwearManufacture of products of leather and leather substitutes, except footwear and wearingapparelManufacture of footwear, except vulcanized or moulded rubber or plastic footwearSawmills, planing and other wood millsManufacture of wooden and cane containers and small cane wareManufacture of wood and cork products not elsewhere classifiedManufacture of furniture and fixtures, except primarily of metalManufacture of chemical products not elsewhere classifiedManufacture of pottery, china and earthenwareNon-ferrous metal basic industriesManufacture of electrical apparatus and supplies n.e.c.Manufacture of jewellery and related articlesManufacture of sporting and athletic goodsManufacturing industries n.e.c.
Import-competing IndustriesManufacture of pulp, paper and paperboardManufacture of basic industrial chemicals except fertilizersManufactures of fertilizers and pesticidesManufacture of synthetic resins, plastic materials and man-made fibres except glassIron and steel basic industriesManufacture of structural metal productsManufacture of fabricated metal products except machinery and equipment not elsewhereclassifiedManufacture of engines and turbinesManufacture of agricultural machinery and equipmentManufacture of metal and wood working machineryManufacture of special industrial machinery and equipment except metal and wood workingmachineryManufacture of office, computing and accounting machineryMachinery and equipment except electrical n.e.c.Manufacture of electrical industrial machinery and apparatusManufacture of radio, television and communication equipment and apparatusShip building and repairingManufacture of railroad equipmentManufactures of motor vehiclesManufacture of motorcycles and bicyclesManufacture of professional and scientific, and measuring and controlling equipment, n.e.c.Manufacture of photographic and optical goodsManufacture of watches and clocksManufacture of musical instruments

59
Taiwan, China
Export-oriented IndustriesManufacture of wearing apparel, except footwearManufacture of footwear, except vulcanized or moulded rubber or plastic footwearManufacture of wood and cork products not elsewhere classifiedManufacture of furniture and fixtures, except primarily of metalManufacture of furniture and fixture primarily of metalManufacture of fabricated metal products except machinery and equipment not elsewhereclassifiedManufacture of metal and wood working machineryManufacture of special industrial machinery and equipment except metal and wood workingmachineryManufacture of office, computing and accounting machineryManufacture of radio, television and communication equipment and apparatusManufacture of electrical appliances and housewaresManufacture of electrical apparatus and supplies n.e.c.Manufacture of motorcycles and bicyclesManufacture of sporting and athletic goodsManufacturing industries n.e.c.
Import-competing IndustriesManufacture of pulp, paper and paperboardManufacture of basic industrial chemicals except fertilizersManufactures of fertilizers and pesticidesManufacture of synthetic resins, plastic materials and man-made fibres except glassManufacture of paints, varnishes and lacquersManufacture of drugs and medicinesManufacture of soap and cleaning preparations, perfumes, cosmetics and other toiletpreparationsManufacture of chemical products not elsewhere classifiedIron and steel basic industriesNon-ferrous metal basic industriesManufacture of structural metal productsManufacture of engines and turbinesManufacture of agricultural machinery and equipmentManufacture of special industrial machinery and equipment except metal and wood workingmachineryMachinery and equipment except electrical n.e.c.Manufacture of electrical industrial machinery and apparatusShip building and repairingManufactures of motor vehiclesManufacture of professional and scientific, and measuring and controlling equipment, n.e.c.Manufacture of photographic and optical goodsManufacture of watches and clocksManufacture of jewellery and related articles

60
Thailand
Export-oriented IndustriesManufacture of made-up textile goods except wearing apparelCordage, rope and twine industriesManufacture of wearing apparel, except footwearManufacture of products of leather and leather substitutes, except footwear and wearingapparelManufacture of footwear, except vulcanized or moulded rubber or plastic footwearSawmills, planing and other wood millsManufacture of wooden and cane containers and small cane wareManufacture of wood and cork products not elsewhere classifiedManufacture of furniture and fixtures, except primarily of metalManufacture of rubber products n.e.c.Manufacture of pottery, china and earthenwareNon-ferrous metal basic industriesManufacture of office, computing and accounting machineryManufacture of radio, television and communication equipment and apparatusManufacture of electrical appliances and housewaresManufacture of jewellery and related articles
Import-competing IndustriesManufacture of pulp, paper and paperboardManufacture of basic industrial chemicals except fertilizersManufactures of fertilizers and pesticidesManufacture of synthetic resins, plastic materials and man-made fibres except glassManufacture of drugs and medicinesManufacture of chemical products not elsewhere classifiedIron and steel basic industriesManufacture of cutlery, hand tools and general hardwareManufacture of structural metal productsManufacture of engines and turbinesManufacture of agricultural machinery and equipmentManufacture of metal and wood working machineryManufacture of special industrial machinery and equipment except metal and wood workingmachineryMachinery and equipment except electrical n.e.c.Manufacture of electrical industrial machinery and apparatusManufacture of electrical apparatus and supplies n.e.c.Ship building and repairingManufactures of motor vehiclesManufacture of professional and scientific, and measuring and controlling equipment, n.e.c.Manufacture of photographic and optical goodsManufacture of watches and clocks

61
Japan and the United States of America
Export-oriented industriesManufacture of pulp, paper and paperboardManufacture of basic industrial chemicals except fertilizersManufactures of fertilizers and pesticidesManufacture of synthetic resins, plastic materials and man-made fibres except glassManufacture of structural clay productsIron and steel basic industriesManufacture of engines and turbinesManufacture of agricultural machinery and equipmentManufacture of metal and wood working machineryManufacture of metal and wood working machineryManufacture of special industrial machinery and equipment except metal and wood workingmachineryManufacture of office, computing and accounting machineryMachinery and equipment except electrical n.e.c.Manufacture of electrical industrial machinery and apparatusManufacture of electrical appliances and housewaresShip building and repairingManufacture of railroad equipmentManufactures of motor vehiclesManufacture of aircraftManufacture of professional and scientific, and measuring and controlling equipment, n.e.c.Manufacture of photographic and optical goodsManufacture of watches and clocks
Import-competing industriesSpinning, weaving and finishing textileManufacture of carpets and rugsCordage, rope and twine industriesManufacture of wearing apparel, except footwearManufacture of products of leather and leather substitutes, except footwear and wearingapparelManufacture of footwear, except vulcanized or moulded rubber or plastic footwearManufacture of wooden and cane containers and small cane wareManufacture of wood and cork products not elsewhere classifiedManufacture of pottery, china and earthenwareNon-ferrous metal basic industriesManufacture of furniture and fixture primarily of metalManufacture of professional and scientific, and measuring and controlling equipment, n.e.c.Manufacture of jewellery and related articlesManufacture of musical instrumentsManufacture of sporting and athletic goods

62
References
Alarcon, Diana and Eduardo Zepeda, 1997, “Jobs, technology and skill requirements in a globalized economy: casestudy of Mexico”, Geneva: International Labour Office, processed.
Bhagwati, Jagdish and Vivek Dehejia, 1994, “Freer trade and wages of the unskilled: is Marx striking again ?” inBhagwati, Jagdish and Marvin H. Costers, eds., Trade and Wages: Levelling Wages Down ?, Washington:American Enterprise Institute.
Borjas, George J., Richard B. Freeman and Lawrence F. Katz, 1996, “Searching for the effect of immigration onthe labour market”, American Economic Review, vol. 86, no. 2.
Carrington, William J. and Enrica Detragiache, 1998, “How big is the brain drain?”, IMF Working Paper,Washington, D.C.
Chenery, H. B. and A. M. Strout, 1966, “Foreign assistance and economic development”, American EconomicReview, vol. 56.
Collins, Susan M., 1998, “Economic integration and the American worker: an overview”, in Collins, ed., 1998.
Collins, Susan M., ed., 1998, Imports, Exports and the American Worker, Washington D. C.: Brookings InstitutionPress.
Dinopoulos, Elias and Paul Segerstrom, 1999, “A Schumpeterian model of protection and relative wages”,American Economic Review, vol.89, no. 3.
Feenstra, Robert C. and Gordon H. Hanson, 1997, “Foreign direct investment and relative wages: evidence fromMexico’s maquiladoras”, Journal of International Economics, vol. 42, nos. 3/4.
Freeman, Richard B., 1995, “Are your wages set in Beijing?”, Journal of Economic Perspectives, vol.9, no. 3.
Freeman, Richard B., 1998, “Will globalization dominate U.S. labour market outcomes?”, in Collins, ed., 1998.
Harrison, Ann and Gordon Hanson, 1999, “Who gains from trade reform? Some remaining puzzles”, Journal ofDevelopment Economics, vol. 59, 125-154.
Haque, Nadeem U., and Se-Jik Kim, 1995, “Human capital flight: impact of migration on income and growth”,IMF Staff Papers, no. 42, pp. 577-607.
ILO (International Labour Organization), 1995, World Employment 1995, Geneva.
IMF (International Monetary Fund), 1997, World Economic Outlook, May 1997, Washington, D.C.
Krueger, Anne O., Hal B. Lary, Terry D. Monson, and Narongchai Akrasanee, eds., 1981, Trade and Employmentin Developing Countries, vol. 1: Individual Studies, Chicago: University of Chicago Press.
Lora, Eduardo and Mauricio Oliviera, 1998, “Macro policy and employment problems in Latin America”,Cartagena: Inter-American Development Bank Working Paper 372.
Lydall, H. F., 1975, Trade and Employment, Geneva: International Labour Organization.

63
Revenga, Ana, 1995, “Employment and wage effects of trade liberalization: the case of Mexican manufacturing”,Washington D. C.: World Bank Policy Research Working Paper 1524.
Samuelson, Paul A., 1948, “International trade and the equalization of factor prices”, Economic Journal, vol. 58,June.
Samuelson, Paul A., 1949, “International factor price equalization once again”, Economic Journal, vol. 59, June.
Skeldon, Ronald, 1997, Migration and Development: A Global Perspective, Harlow, UK: Addison WeselyLongman.
Slaughter, Matthew J., 1998, “International trade and labour market outcomes: results, questions and policyoptions”, Economic Journal, vol. 108, September.
Standing, Guy, 1999, Global Labour Flexibility: Seeking Distributive Justice, London: Macmillan.
Stolper, Wolfgang F. and Paul A. Samuelson, 1941, “Protection and real wages”, Review of Economic Studies, vol.9.
UNCTAD (United Nations Conference on Trade and Development), 1997, Trade and Development Report 1997,New York and Geneva.
UNCTAD (United Nations Conference on Trade and Development), 1999, Trade and Development Report 1999,New York and Geneva.
Williamson, Jeffrey G., 1998, “Globalization, labour markets and policy backlash in the past”, Journal of EconomicPerspectives, vol. 12, no. 4.
Wood, Adrian, 1994, North-South Trade, Employment and Inequality, Oxford: Clarendon Press.
Wood, Adrian, 1995, “How trade hurt unskilled workers”, Journal of Economic Perspectives, vol 9, no. 3.
Wood, Adrian, 1997, “Openness and wage inequality in developing countries: the Latin American challenge toEast Asian conventional wisdom”, World Bank Economic Review, vol. 11, no. 1.
Wood, Adrian, 1998, “Globalization and the rise of labour market inequalities”, Economic Journal, vol.108,September.
World Bank, 1997, China 2020: Development Challenges in the New Century, Washington, D.C.
World Bank, 1999, World Development Report 1999/2000, Washington, D.C.
WTO (World Trade Organization), 1998, Annual Report 1998, Geneva.
Zlotnik, Hania, 1998, “International migration: an overview”, Population and Development Review, vol. 24, no.3.

Copyright © International Labour Organization 2000
Publications of the International Labour Office enjoy copyright under Protocol 2 of the Universal CopyrightConvention. Nevertheless, short excerpts from them may be reproduced without authorization, on conditionthat the source is indicated. For rights or reproduction, or translation, application should be made to the ILOPublications Bureau (Rights and Permissions), International Labour Office, CH-1211 Geneva 22,Switzerland. The International Labour Office welcomes such applications.
Libraries, institutions and other users registered in the United Kingdom with the Copyright LicensingAgency, 90 Tottenham Court road, London W1P 9HE (Fax:+44 171 436 3986), in the United States withthe Copyright Clearance Center, 222 Rosewood Drive, Danvers, MA 01923 (Fax:+ 1 508 750 4470), or inother countries with associated Reproduction Rights Organizations, may make photocopies in accordancewith the licences issued to them for this purpose.
The designations employed in ILO publications, which are in conformity with United Nations practice, andthe presentation of material therein do not imply the expression of any opinion whatsoever on the part of theInternational Labour Office concerning the legal status of any country, area or territory or of its authorities,or concerning the delimitation of its frontiers.The responsibility for opinions expressed in signed articles, studies and other contributions rests solely withtheir authors, and publication does not constitute an endorsement by the International Labour Office of theopinions expressed in them. Reference to names of firms and commercial products and processes does not imply their endorsement bythe International Labour Office, and any failure to mention a particular firm, commercial product or processis not a sign of disapproval.
ILO publications can be obtained through major booksellers or ILO local offices in many countries, or directfrom ILO Publications, International Labour Office, CH-1211 Geneva 22, Switzerland. Catalogues or listsof new publications are available free of charge from the above address.