Ecological consequences of fragmentation and deforestation in an urban landscape: a case study
14
1 23 Urban Ecosystems ISSN 1083-8155 Volume 15 Number 3 Urban Ecosyst (2012) 15:533-544 DOI 10.1007/s11252-012-0238-3 Ecological consequences of fragmentation and deforestation in an urban landscape: a case study W. C. Zipperer, T. W. Foresman, S. P. Walker & C. T. Daniel
-
Upload
independent -
Category
Documents
-
view
0 -
download
0
Transcript of Ecological consequences of fragmentation and deforestation in an urban landscape: a case study

1 23
Urban Ecosystems ISSN 1083-8155Volume 15Number 3 Urban Ecosyst (2012) 15:533-544DOI 10.1007/s11252-012-0238-3
Ecological consequences of fragmentationand deforestation in an urban landscape: acase study
W. C. Zipperer, T. W. Foresman,S. P. Walker & C. T. Daniel

1 23
Your article is protected by copyright and
all rights are held exclusively by Springer
Science+Business Media, LLC (outside the
USA). This e-offprint is for personal use only
and shall not be self-archived in electronic
repositories. If you wish to self-archive your
work, please use the accepted author’s
version for posting to your own website or
your institution’s repository. You may further
deposit the accepted author’s version on
a funder’s repository at a funder’s request,
provided it is not made publicly available until
12 months after publication.

Ecological consequences of fragmentation and deforestationin an urban landscape: a case study
W. C. Zipperer & T. W. Foresman & S. P. Walker &
C. T. Daniel
Published online: 19 April 2012# Springer Science+Business Media, LLC (outside the USA) 2012
Abstract Landscape change is an ongoing process even within established urban land-scapes. Yet, analyses of fragmentation and deforestation have focused primarily on theconversion of non-urban to urban landscapes in rural landscapes and ignored urban land-scapes. To determine the ecological effects of continued urbanization in urban landscapes,tree-covered patches were mapped in the Gwynns Falls watershed (17158.6 ha) in Marylandfor 1994 and 1999 to document fragmentation, deforestation, and reforestation. The water-shed was divided into lower (urban core), middle (older suburbs), and upper (recent suburbs)subsections. Over the entire watershed a net of 264.5 of 4855.5 ha of tree-covered patcheswere converted to urban land use—125 new tree-covered patches were added throughfragmentation, 4 were added through reforestation, 43 were lost through deforestation, and7 were combined with an adjacent patch. In addition, 180 patches were reduced in size. Inthe urban core, deforestation continued with conversion to commercial land use. Because ofthe lack of vegetation, commercial land uses are problematic for both species conservationand derived ecosystem benefits. In the lower subsection, shape complexity increased fortree-covered patches less than 10 ha. Changes in shape resulted from canopy expansion,planted materials, and reforestation of vacant sites. In the middle and upper subsections, theshape index value for tree-covered patches decreased, indicating simplification. Density analysesof the subsections showed no change with respect to patch densities but pointed out theimportance of small patches (≤5 ha) as “stepping stone” to link large patches (e.g., >100 ha).
Urban Ecosyst (2012) 15:533–544DOI 10.1007/s11252-012-0238-3
W. C. Zipperer (*)USDA Forest Service, P.O. Box 110806, Gainesville, FL 32611-0806, USAe-mail: [email protected]
T. W. ForesmanInternational Center for Remote Sensing Education, P.O. Box 18285, Baltimore, MD 21227, USA
S. P. WalkerArnold School of Public Health, HESC 311, Department of Environmental Health Science,University of South Carolina, Columbia, SC 29208, USA
C. T. Daniel110N. Washington St., Rockville, MD 20850, USA
Author's personal copy

Using an urban forest effect model, we estimated, for the entire watershed, total carbon loss andpollution removal, from 1994 to 1999, to be 14,235,889.2 kg and 13,011.4 kg, respectively dueto urban land-use conversions.
Keywords Deforestation . Fragmentation . Connectivity . Ecosystem benefits
Introduction
Fragmentation and deforestation of natural habitats by human activities are one of the majorfactors contributing to the decline of biodiversity locally, regionally and globally. Fragmen-tation and deforestation reduce critical habitat, alter existing habitat, increase the dispersaldistances between habitats for species, and increase species isolation (Saunders et al. 1991).In fact, dispersal becomes increasingly problematic as the landscape becomes more inhos-pitable and restricts animal movement.
Regional analyses of fragmentation have reported changes across broad land-use categories(e.g., Anderson Level 1 (Anderson et al. 1976))—urban, agriculture, forest, and transportation(e.g., Sharpe et al. 1986; e.g., Iverson 1988; Turner 1990; Zipperer et al. 1990). These analysesoften do not capture the spatial complexity of land covers/uses within a category. Forexample, in an Anderson Level II classification, urban land use can be divided intoresidential, commercial, institutional, vacant, park, and transportation (Anderson et al.1976). Accounting for this complexity is important for species conservation andmanagement. An analysis of avian diversity by land use revealed shifts in compositionfrom native cover to extensive urban cover (Blair 1996). To effectively manage aviandiversity within an urban landscape, it is important to know how habitats change byland use (Marzluff and Ewing 2001). Unfortunately, we know little about habitatchange and patch dynamics in urban landscapes.
Fragmentation and deforestation also affects the availability and quality of the goods andservices humans derive from the ecosystem. Examples include reduced air and water quality,carbon sequestration, pollution removal, recreational opportunities, noise reduction, humancomfort, and aesthetics. In a series of regional analyses based on tree cover, AmericanForests explored the effect of deforestation on air quality, storm water retention, and carbonsequestration (http://www.americanforests.org/resources/rea/). The broad scale analysesdemonstrated the need to not only slow losses but also to increase tree cover to improvebenefits.
In analyzing carbon sequestration and air pollution removal, Nowak and Crane(2000) observed wide variation by land use. For example, in Baltimore, Maryland,forest-land use had the highest net rate of carbon sequestration (1,497.8 kg/ha/year)and commercial use had the lowest net rate (305.7 kg/ha/year) (David Nowak, USDAForest Service, pers. commun.). Like the spatial distribution of birds in different landuses, these findings point to the need for analyses at least to an Anderson Level II toaccurately assess the ecological effect of deforestation in an urban landscape. Toeffectively manage for biodiversity and ecosystem benefits, natural resource managersneed to consider not only the recent loss of forest cover but also what the site’s futureland use. In this paper, fragmentation and deforestation rates in an urban landscapeare explored by land use to assess ecological effects and loss of ecosystem services.This assessment identifies how fragmentation and deforestation varies within an urbanwatershed, affects patch dynamics and connectivity, and reduces the benefits of twoecological services: carbon sequestration and air pollution removal.
534 Urban Ecosyst (2012) 15:533–544
Author's personal copy
Methods
Study area
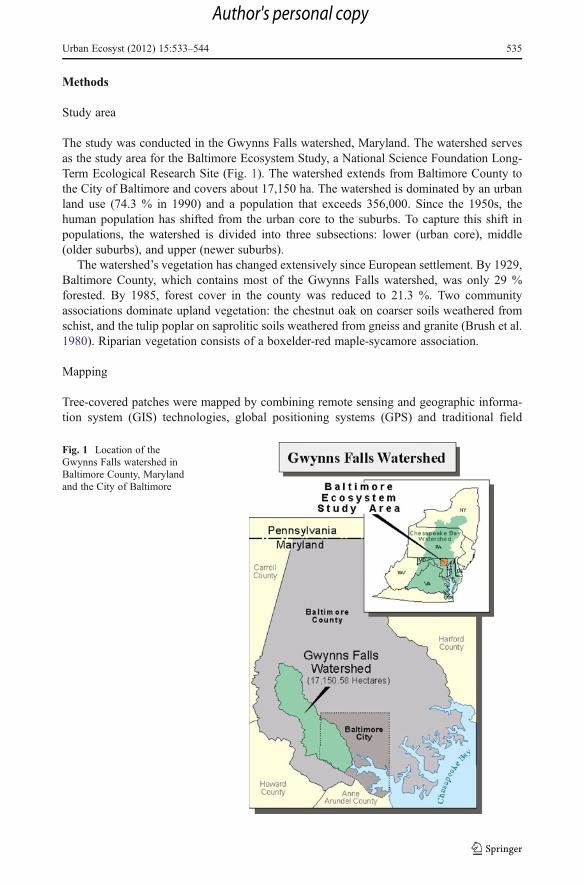
The study was conducted in the Gwynns Falls watershed, Maryland. The watershed servesas the study area for the Baltimore Ecosystem Study, a National Science Foundation Long-Term Ecological Research Site (Fig. 1). The watershed extends from Baltimore County tothe City of Baltimore and covers about 17,150 ha. The watershed is dominated by an urbanland use (74.3 % in 1990) and a population that exceeds 356,000. Since the 1950s, thehuman population has shifted from the urban core to the suburbs. To capture this shift inpopulations, the watershed is divided into three subsections: lower (urban core), middle(older suburbs), and upper (newer suburbs).
The watershed’s vegetation has changed extensively since European settlement. By 1929,Baltimore County, which contains most of the Gwynns Falls watershed, was only 29 %forested. By 1985, forest cover in the county was reduced to 21.3 %. Two communityassociations dominate upland vegetation: the chestnut oak on coarser soils weathered fromschist, and the tulip poplar on saprolitic soils weathered from gneiss and granite (Brush et al.1980). Riparian vegetation consists of a boxelder-red maple-sycamore association.
Mapping
Tree-covered patches were mapped by combining remote sensing and geographic informa-tion system (GIS) technologies, global positioning systems (GPS) and traditional field
Fig. 1 Location of theGwynns Falls watershed inBaltimore County, Marylandand the City of Baltimore
Urban Ecosyst (2012) 15:533–544 535
Author's personal copy

mapping techniques. Color infrared digital ortho-quarter quadrangles (DOQQ’s), taken in1994 (leaf-off) by the State of Maryland’s Department of Natural Resources (MD DNR),were used to create a base map of tree-covered patches within the Gwynns Falls watershed.The DOQQ’s yielded a resolution of 1 m per pixel and were projected in the Maryland StatePlain or Lambert Conformal Conic map projection using the 1927 North American Datum(NAD27). Each tree-covered patch (>120 m2) was digitized on screen by the University ofMaryland Baltimore County Spatial Analysis Lab (UMBC-SAL) using ArcView 3.x GISsoftware, an Environmental Systems Research Institute (ESRI) product. Lab managersconducted quality control procedures regularly to insure data quality by regularly reviewingphoto-interpretations and digital images. Mapped patches included street-side, yard, andpark trees as well as forests that may or may not contain an understory (Hobbs 1988;Zipperer et al. 1997). Field surveys revealed that patches ≥1 ha were often forests with anunderstory. Smaller patches included private and public trees with and without anunderstory.
Once digitized, the tree-covered patches were field checked. Patches were randomlyselected, using a stratified random sampling technique, by size class and sub-watershed. Inaddition, each plot’s map coordinates were generated and downloaded into Trimble Pro XRGlobal Positioning System (GPS) units. The GPS units were used to accurately locate plots(within 1 m) in the field. Eighty-three plots were established to validate mapping accuracy.Accuracy was more than 95 % for patches ≥1 ha and 90 % for patches ≤1 ha.
High-resolution digital ortho-photo aerial photographs (1 m resolution) of the watershedwere obtained in 1999. The photos were leaf-on and used a Universal Transverse Mercator(UTM) projection. To overlay the 1994 tree-covered patch map with the photographs,DOQQ maps were projected to UTM coordinates. By overlaying the patch maps onto thephotos, fragmentation and deforestation were detected and recorded for individual patches.Primary land uses were urban, agriculture, forest and water (Anderson et al. 1976). Urbanwas further divided into residential, commercial, and transportation. Land use conversions toresidential, commercial, institution, transportation, open, agriculture and other were noted,as was the addition of forest cover due to reforestation.
Habitat characteristics
In addition to measuring fragmentation and deforestation, patch shape and density wereevaluated to assess how these attributes changed between 1994 and 1999. Shape was defined
by the Patton shape index, DI ¼ P=2ffiffiffiffiffiffi
pAp
, where P is the perimeter and A is the area of apatch (Wetzel 1983; Forman 1995). Regular shaped objectives (squares, rectangles, andcircles) have values at or near 1. As the shape becomes more complex, the index valueincreases. Although no shape index is perfect, this index was chosen because it is simple tocalculate, suitable for the domain of interest and quantitatively differentiates shapes in anunderstandable manner.
Fragmentation and deforestation increase patch isolation and reduce connectivity (Saunderset al. 1991). In urban landscapes, dispersal can be severely impacted by a high road density,patch isolation, inhospitable habitats and the lack of linear features connecting habitat patches.To examine connectivity, we used the density of patches of different size classes at differentdispersal distances from a reference patch. For example, within 50m of a 10 ha forest patch, thefollowing patch density may be observed: 100–1.0 ha; 10–50 ha; and 1–100 ha. By reportingpatch density, availability of “stepping stones” across a landscape for dispersal can be assessed(see Forman and Collinge 1996). Patch density was measured for any patch ≥10 ha at twodispersal distances, 100 and 500 m. Ten hectares was selected as the minimum patch size
536 Urban Ecosyst (2012) 15:533–544
Author's personal copy

potentially containing interior forest habitat (Levenson 1981). A general linear model was usedto examine differences in mean patch size, shape and density among the watershed subsectionswithin a time period, 1994 or 1999. A simple paired t-test was used to identify significantdifferences of mean patch size, shape and density between time periods, 1994 vs. 1999, within asubsection. Significance was sent at an alpha level of 0.05.
Ecosystem benefits: Carbon sequestration and air pollution removal
To estimate losses in ecosystem benefits from deforestation and fragmentation, we usedresults from the urban forest effect model (UFORE) (Nowak and Crane 2000, 2002) for thecity of Baltimore. Vegetation data was collected by the USDA Forest Service, SyracuseResearch Unit (David Nowak, personal communication) in 1998. To inventory the city, 200vegetation plots were sampled. These plots were stratified land use, and the number of plotsper land use was determined by the relative area of the land use in the city. In other words,larger the land-use area, greater portion of plots were placed in that land use. Data collectioninvolved inventorying by species all trees (diameter at breast height, tree height, canopyheight and width) and shrubs (shrub height, width and basal diameter). Detailed descriptionsof the sampling protocols and model can obtained at http://www.fs.fed.us/ne/syracuse/Tools/tools.htm (Nowak and Crane 2002).
UFORE used the vegetation plot data as well pollution data from local monitoring sites toestimate the amount of carbon sequestered and air pollution removed by trees and shrubs foran entire city or by land use. These estimates were used to determine losses of carbon storageand sequestration, pollution removal, and their monetary value from land-use conversionsbetween 1994 and 1999.
Results
In 1994, the Gwynns Falls watershed had 3,353 tree-covered patches ≥120 m2 representing4855.8 ha of canopy cover or 28.3 % of the total watershed area. As expected, the percentageof total number of tree-covered patches (86.2) was greatest for <1 ha (Table 1). Only sevenpatches were ≥100 ha. Two of these corresponded to a city park (Leakin Park) in the lowersubsection of the watershed and a third was a state park (Soldier’s Delight) in the uppersubsection. Distribution of tree-covered patches in 1994 revealed 1,269 tree-covered patchesin the lower, 1,177 in the middle, and 907 in the upper subsections. The lower and middlesubsections were characterized by a higher percentage (97.3 and 97.6, respectively) of thetotal number of tree-covered patches <5 ha than the upper subsection (92.5). The uppersubsection had a higher percentage (7.5) of the total number of patches ≥5 ha.
In 1994, the lower and middle subsections had similar total mean patch size (0.9 ha),whereas the upper subsections had a mean patch size of 2.9 ha (Table 2). Although notstatistically significant, mean patch sizes by size-class were smaller in the lower subsectionthan the other subsections. Shape analyses indicated that tree-covered patches <10 ha in thelower subsection were more complex than those in the middle or upper subsections (Table 3).The upper subsection had greater shape complexity for patches ≥50 ha when compared tothe lower and middle subsections.
The net number of tree covered patches increased by 78 from 1994 to 1999 (Table 1), butthis increase does not reflect the entire landscape dynamics: 125 new tree-covered patcheswere added through fragmentation, 4 were added through reforestation, 42 were lost throughdeforestation; and 7 were lost through consolidation (combining with an adjacent patch to
Urban Ecosyst (2012) 15:533–544 537
Author's personal copy

form a larger one). The distribution of patches by size class was similar to that observed in1994 (Table 1) as 28 new fragments were added in the lower, 24 in the middle, and 73 in theupper subsection of the watershed. The 1994–99 comparison also revealed that the largestpatches remained relatively intact. Only one patch (#1531) changed significantly in size andshape. Originally 601 ha with a shape index of 10.6, this patch was fragmented into fivepatches ranging in size from 0.05 to 501 ha. The largest patch had a shape index of 9.4,indicating simplification. Patch losses were primarily in the middle classes: 5.0 to 9.9 ha and10 to 49.9 ha (Table 1). For the 5.0–9.9 ha class, three patches were lost in the lower, threefrom the middle, and one from the upper subsection. The upper subsection lost three patchesin the 10 to 49.9 ha class.
Losses were reflected in changes in mean patch size and shape (Tables 2 and 3). Meanpatch size decreased in the middle (from 68.5 to 53.5 ha) and upper (from 73.5 to 70.7 ha)subsections for the 50.0–99.9 ha classes and in the lower subsection for the 10.0–49.9 haclass (from 19.1 to 18.0). By comparison, mean patch shape remained comparativelyunchanged in each subsection from 1994 to 1999. A comparison among subsections,however, showed that the lower subsection was relatively more complex in the smaller sizeclasses and less complex in largest size class than the middle and upper subsections(Table 3).
Table 1 Number of tree-covered patches by size class in lower, middle, and upper subsections of GwynnsFalls watershed, Maryland
Patch size (ha) Lower Middle Upper
1994 1999 1994 1999 1994 1999
< 1.0 1,107 1,121 1,052 1,070 734 774
1.0–4.9 129 131 91 89 105 121
5.0–9.9 18 15 16 13 31 30
10.0–49.9 12 12 16 16 30 27
50.0–99.9 1 1 1 1 3 3
≥100.0 2 2 1 1 4 4
Total 1,269 1,282 1,177 1,190 907 959
Table 2 Mean (S.E.) area (ha) of tree-covered patches by size class in lower, middle and upper subsections ofGwynns Falls watershed, Maryland
Patch size (ha) Lower Middle Upper
1994 1999 1994 1999 1994 1999
<1.0 0.2 (0.01) 0.2 (0.01) 0.2 (0.01) 0.2 (0.01) 0.2 (0.01) 0.2 (0.01)
1.0–4.9 2.1 (0.08) 2.1 (0.08) 2.2 (0.11) 2.2 (0.12) 2.2 (0.10) 2.2 (0.10)
5.0–9.9 6.4 (0.34) 6.5 (0.38) 6.7 (0.31) 6.8 (0.24) 7.0 (0.28) 7.2 (0.28)
10.0–49.9 19.1 (3.04) 18.0 (2.40) 20.8 (2.35) 20.3 (2.2) 23.2 (2.19) 23.4 (2.25)
50–99.9 68.3 68.3 68.5 53.5 73.5 (7.10) 70.7 (8.66)
≥100 118.6 (16.32) 118.6 (16.32) 202.4 196.6 266.4 (113.27) 232.0 (90.44)
Overall mean 0.9 (0.16) 0.9 (0.16) 0.9 (0.20) 0.9 (0.20) 2.9 (0.76) 2.9 (0.76)
538 Urban Ecosyst (2012) 15:533–544
Author's personal copy

From 1994 to 1999, 220 tree-covered patches were reduced in size and 42 patched weredeforested by urban land-use conversions in the watershed overall. Even with these losses, 64tree-covered patches increased in size (Table 4). In all, 264.5 ha of tree cover were lost to urbanland-use conversions, but 35.9 ha were gained through canopy expansion and reforestation. Thelower subsection lost 6.2 ha of tree cover, the middle subsection lost 42.6 ha, and the upper lost179.8 ha to urbanization. Losses in the lower subsection were offset by gains elsewhere in treecover. These were small, incremental additions to existing tree cover.
The type of urban conversion depended on the location within the watershed (Table 4). Inthe lower subsection, more sites were converted to commercial sites; however, residentialuse consumed more area of tree cover than commercial use did (13.2 and 11.7 ha, respec-tively). In both the middle and upper subsections, residential was the dominant land-useconversion and consumed the most land. Because of the need for new roads, transportationconversion also occurred at a higher amount in the upper subsection (8.1 ha) than the middle(0.1 ha) and lower (0.9 ha) subsections. Transportation principally fragmented a patch intosmaller ones and accounted for 14 % of the new patches in the upper subsection.
Table 3 Mean (S.E.) patch shape index by size class for tree-covered patches in lower, middle and uppersubsections of Gwynns Falls watershed, Maryland
Patch size (ha) Lower Middle Upper
1994 1999 1994 1999 1994 1999
<1.0 2.0 (0.02)ab 2.0 (0.02)ab 1.8 (0.02)b 1.8 (0.02) 1.9 (0.02) 1.9 (0.02)
1.0–4.9 3.3 (0.08)ab 3.3 (0.08) 3.0 (0.10) 3.0 (0.10) 2.8 (0.09) 2.8 (0.09)
5.0–9.9 4.1 (0.33)ab 4.2 (0.38) 3.0 (0.23) 2.8 (0.23) 3.5 (0.23) 3.4 (0.21)
10.0–49.9 3.9 (0.34) 3.8 (0.35) 4.1 (0.39) 4.1 (0.38) 4.6 (0.29) 4.5 (0.28)
50–99.9 6.9 6.9 3.3 3.8 6.2 (0.50) 6.0 (0.68)
≥100 5.9 (0.19) 5.9 (0.19) 9.21 8.8 8.4 (1.07) 8.0 (0.94)
Total 2.2 (0.03) 2.2 (0.02) 2.0 (0.02) 2.0 (0.02) 2.2 (0.04) 2.2 (0.03)
a Significantly different from middle subsection within same year, P<0.05b Significantly different from upper subsection within same year, P<0.05
Table 4 Number of tree-covered patches changed or converted to a different land use/cover and resultingchange in amount of forest area (lost) in each subsection of Gwynns Falls watershed, Maryland between 1994and 1999
Land use/cover Lower Middle Upper
Patches (N) Area (ha) Patches (N) Area (ha) Patches (N) Area (ha)
Forest 41 21.3 6 4.1 17 10.5
Residential 5 (13.2) 28 (37.2) 86 (129.9)
Commercial 29 (11.7) 5 (4.3) 29 (44.9)
Transportation 2 (0.9) 1 (0.1) 15 (8.1)
Open 5 (0.4) 22 (5.1) 20 (2.3)
Agriculture 0 0 0 0 4 (1.4)
Miscellaneous 2 (1.3) 1 (>0.0) 8 (3.7)
Total area lost (27.5) (46.7) (190.3)
Urban Ecosyst (2012) 15:533–544 539
Author's personal copy

Connectivity
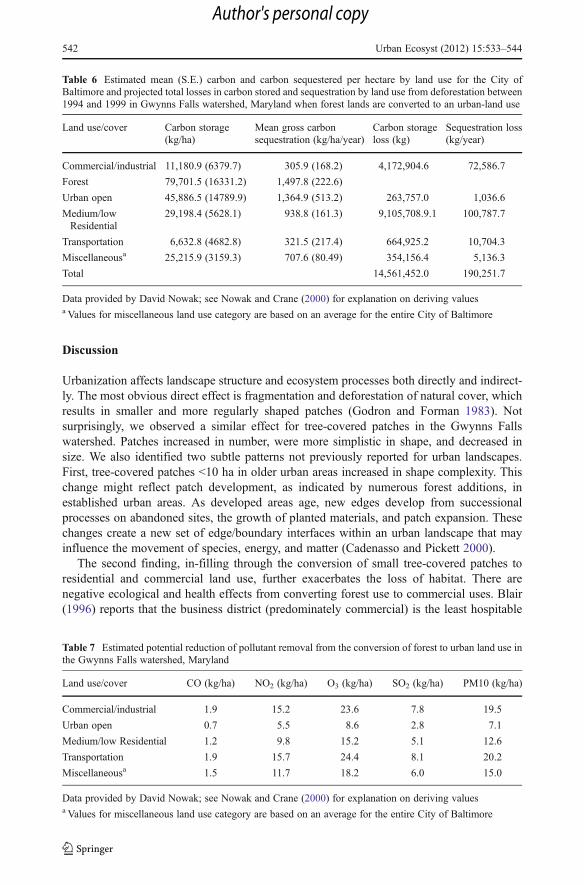
Because of fragmented habitats, urban structure, and road density, some species mayfind an urban landscape rather hostile as they try to maneuver across it. To evaluateconnectivity, we assessed the number of tree-covered patches 100 and 500 m fromeach patch ≥10 ha. Analyses showed that the density of patches surrounding patches≥10 ha did not change significantly within the 100- and 500-m buffers from 1994 to1999 by subsection and among subsections (Table 5). The watershed, however, washighly fragmented and disconnected, and patches ≥50 ha were infrequent and clumped(Fig. 2). The analysis also pointed towards the importance of small tree-coveredpatches (<5 ha) as “stepping-stones” across the urban landscape. In addition, acorridor containing large patches existed only because of the retention of riparianhabitat. The lack of large patches in these urban and urbanizing landscapes present amajor obstacle for managing or conserving interior species.
Loss of ecosystem benefits
The conversion of forest lands to urban-land uses lower stored carbon and sequestration rates(Table 6). For the entire watershed, fragmentation and deforestation changed total carbonstorage from 1994 to 1999 by 14,561,452.0 kg and carbon sequestration of 190,251.7 kg/year, respectively. Losses were partially offset by the addition of forest cover (35.8 ha),which contributed over 2,861,000 kg of carbon stored and over 53,700 kg/year sequestered.Compared to forested land uses, commercial and transportation land uses showed thegreatest loss of carbon storage (68,520.6 and 73,068.1 kg/ha, respectively) and sequestration(1,191.9 and 1176.3 kg/ha/year, respectively). In the lower subsection, the conversion tocommercial land use had the largest losses for storage (801,691.0 kg) and sequestration(13,945.2 kg/year). Conversion to residential had the largest losses for storage (1,878,715.3
Table 5 Mean patch density (S.E.) by patch size (ha) of all patches within 100 m and 500 m of patches≥10.0 ha in the Gwynns Falls watershed, Maryland
Patch size (ha) Lower Middle Upper
1994 (n015) 1999 (n015) 1994 (n018) 1999 (n018) 1994 (n037) 1999 (n034)
100 m buffers
<1.0 10.6 (2.4) 12.2 (2.4) 12.1 (1.6) 10.9 (1.3) 8.0 (1.2) 9.7 (1.4)
1.0–4.9 1.8 (0.3) 1.9 (0.3) 2.8 (0.5) 2.9 (0.6) 2.7 (0.4) 3.1 (0.4)
5.0–9.9 0.8 (0.2) 0.7 (0.2) 0.6 (0.2) 0.6 (0.2) 0.8 (0.2) 0.9 (0.2)
10.0–49.9 0.7 (0.2) 0.6 (0.2) 1.6 (0.3) 1.1 (0.2) 1.4 (0.2) 0.8 (0.2)
50.0–99.9 0.2 (0.1) 0.3 (0.1) 0.0 (0.0) 0.1 (0.2) 0.2 (0.1) 0.2 (0.1)
≥100.0 0.3 (0.2) 0.3 (0.2) 0.2 (0.1) 0.2 (0.1) 0.3 (0.1) 0.3 (0.1)
500 m buffers
<1.0 51.7 (6.9) 50.8 (6.6) 59.7 (5.6) 58.6 (6.0) 33.8 (4.7) 39.3 (6.1)
1.0–4.9 7.4 (0.9) 7.4 (0.9) 7.1 (1.0) 6.8 (1.0) 7.0 (0.6) 8.8 (0.8)
5.0–9.9 1.6 (0.4) 1.3 (0.5) 1.8 (0.2) 1.7 (0.3) 2.2 (0.3) 2.5 (0.3)
10.0–49.9 1.8 (0.4) 1.8 (0.4) 2.6 (0.4) 2.3 (0.3) 3.1 (0.4) 2.0 (0.3)
50.0–99.9 0.4 (0.1) 0.4 (0.1) 0.1 (0.1) 0.2 (0.1) 0.5 (0.1) 0.5 (0.1)
≥100.0 0.6 (0.2) 0.6 (0.2) 0.3 (0.1) 0.4 (0.1) 0.8 (0.1) 0.7 (0.1)
540 Urban Ecosyst (2012) 15:533–544
Author's personal copy

and 6,560,352.7 kg) and sequestration (20,794.8 and 72,614.1 kg/year) in both the middleand upper sections, respectively.
Deforestation also affected the amount nitrogen dioxide, ozone, particulate matter≥10 μ (PM10), and sulfur dioxide removed from the atmosphere in this urban/urbanizing landscape. Estimated total pollutant removal declined by 13,266.3 kg. Ona per hectare basis, commercial and transportation had the lowest estimated pollutionremoval rates of urban land uses (Table 7). Vegetation in commercial and transporta-tion removed an estimated 68.0 and 70.4 kg/ha of air pollutants less than forest landuse. Like the pattern for estimated carbon storage and sequestration, conversion tocommercial land use had the greatest effect on the removal of pollutants in the lowersubsection, whereas conversion to residential land use had the greatest effect on theremoval of pollutants in the middle and upper subsections.
4 0 4 8 Kilometers
Watershed boundaryTree-covered patches >= 10 ha and <50 haTree-covered patches >= 50 ha500 m: >=10 ha100 m: >=10 ha
N
EW
S
BuffersGwynns Falls Watershed
Maryland
Buffer width: Patch size
Fig. 2 Observed connectivity in 1999 for two dispersal distances, 100 and 500 m, in Gwynns Fallswatershed, Maryland
Urban Ecosyst (2012) 15:533–544 541
Author's personal copy
Discussion
Urbanization affects landscape structure and ecosystem processes both directly and indirect-ly. The most obvious direct effect is fragmentation and deforestation of natural cover, whichresults in smaller and more regularly shaped patches (Godron and Forman 1983). Notsurprisingly, we observed a similar effect for tree-covered patches in the Gwynns Fallswatershed. Patches increased in number, were more simplistic in shape, and decreased insize. We also identified two subtle patterns not previously reported for urban landscapes.First, tree-covered patches <10 ha in older urban areas increased in shape complexity. Thischange might reflect patch development, as indicated by numerous forest additions, inestablished urban areas. As developed areas age, new edges develop from successionalprocesses on abandoned sites, the growth of planted materials, and patch expansion. Thesechanges create a new set of edge/boundary interfaces within an urban landscape that mayinfluence the movement of species, energy, and matter (Cadenasso and Pickett 2000).
The second finding, in-filling through the conversion of small tree-covered patches toresidential and commercial land use, further exacerbates the loss of habitat. There arenegative ecological and health effects from converting forest use to commercial uses. Blair(1996) reports that the business district (predominately commercial) is the least hospitable
Table 6 Estimated mean (S.E.) carbon and carbon sequestered per hectare by land use for the City ofBaltimore and projected total losses in carbon stored and sequestration by land use from deforestation between1994 and 1999 in Gwynns Falls watershed, Maryland when forest lands are converted to an urban-land use
Land use/cover Carbon storage(kg/ha)
Mean gross carbonsequestration (kg/ha/year)
Carbon storageloss (kg)
Sequestration loss(kg/year)
Commercial/industrial 11,180.9 (6379.7) 305.9 (168.2) 4,172,904.6 72,586.7
Forest 79,701.5 (16331.2) 1,497.8 (222.6)
Urban open 45,886.5 (14789.9) 1,364.9 (513.2) 263,757.0 1,036.6
Medium/lowResidential
29,198.4 (5628.1) 938.8 (161.3) 9,105,708.9.1 100,787.7
Transportation 6,632.8 (4682.8) 321.5 (217.4) 664,925.2 10,704.3
Miscellaneousa 25,215.9 (3159.3) 707.6 (80.49) 354,156.4 5,136.3
Total 14,561,452.0 190,251.7
Data provided by David Nowak; see Nowak and Crane (2000) for explanation on deriving valuesa Values for miscellaneous land use category are based on an average for the entire City of Baltimore
Table 7 Estimated potential reduction of pollutant removal from the conversion of forest to urban land use inthe Gwynns Falls watershed, Maryland
Land use/cover CO (kg/ha) NO2 (kg/ha) O3 (kg/ha) SO2 (kg/ha) PM10 (kg/ha)
Commercial/industrial 1.9 15.2 23.6 7.8 19.5
Urban open 0.7 5.5 8.6 2.8 7.1
Medium/low Residential 1.2 9.8 15.2 5.1 12.6
Transportation 1.9 15.7 24.4 8.1 20.2
Miscellaneousa 1.5 11.7 18.2 6.0 15.0
Data provided by David Nowak; see Nowak and Crane (2000) for explanation on deriving valuesa Values for miscellaneous land use category are based on an average for the entire City of Baltimore
542 Urban Ecosyst (2012) 15:533–544
Author's personal copy

environment for birds. The conversion of natural habitat to commercial use increases theinhospitable conditions of an urban landscape to avian species and probably other species too.Nowak and Crane (2002) estimated that commercial sites provided the least amount of ecosystembenefits to humans. Even with developed vegetation, commercial sites exhibited the least amountof carbon storage, the lowest carbon sequestration rates, and the lowest pollution removal whencompared to other land uses. Consequently, the continual in-filling of tree-covered sites tocommercial land use in urban landscapes is especially problematic when considering the healthbenefits lost to humans and the potential loss of valuable habitat for native species.
Density analyses point out the importance of maintaining existing patches in an urbanlandscape. Within the Gwynns Falls watershed, connectivity tenuously exists for dispersaldistances of >100 m. Connectivity is principally by the retention of the riparian corridors.Although larger patches often are favored over smaller ones with similar habitat value inconservation strategies, both Forman and Collinge (1996) and Hunter (1990) recommendincluding smaller patches in landscape designs. In agricultural and urban contexts particu-larly, smaller patches may provide ecological benefits by protecting rare habitats and speciesoutside the large patches; enhancing connectivity between large patches via “steppingstones” for species movement; and enhancing heterogeneous conditions throughout thelandscape (Forman and Collinge 1996). In the Gwynns Falls watershed, patches <5 hamay serve as these stepping-stones for species moving across the landscape. The continuedin-filling of tree-covered patches increases patch isolation, which may affect species dis-persal. Although small tree-covered patches may be beneficial for connectivity, additionalresearch is needed to evaluate their ecological costs as population sinks.
Finally, the ecosystem benefit analyses show direct effects of deforestation on humansand not just wildlife species. Because of deforestation, we estimate that more particulatematter and higher concentrations of SO2, NO2 and ozone will occur in the atmosphere;pollutants the otherwise would have possibly been removed by vegetation (Nowak andCrane 2002). Although these values are only estimates, they do provide an insight into howin-filling may affect human at a local or neighborhood level.
Conclusion
Landscapes are dynamic even when dominated by urban land use. Continued deforestationand fragmentation through new conversions to urban land uses create a new landscapemosaic that becomes more inhospitable to species dispersal and reduces ecosystem benefitsto humans. Land-use decisions and conservation efforts need to focus on not only maintainingexisting forest cover in urban landscapes but also maintaining linkages among patchesthrough a patchwork of habitat stepping-stones. Deforestation also reduces the benefitshumans derive from forest ecosystems. To maintain or enhance current tree cover, futuredevelopment needs to occur on sites already developed or in-filled on vacant sites lacking treecover. The loss of tree cover and patchwork integrity only makes our species’ primary habitatless hospitable.
References
Anderson JR, Hardy EE, Roach JT, Witmer RE (1976) Land use and land cover classification system for usewith remote sensing data, Professional Paper 964. US Geological Survey, Washington
Blair RB (1996) Land use and avian species diversity along an urban gradient. Ecol Appl 6:506–519
Urban Ecosyst (2012) 15:533–544 543
Author's personal copy

Brush GS, Lenk C, Smith J (1980) The natural forest of Maryland: an explanation of the vegetation map ofMaryland (with 1:250,000 map). Ecol Monogr 50:77–92
Cadenasso ML, Pickett STA (2000) Linking forest edge structure to edge function: mediation of herbivoredamage. J Ecol 88:31–45
Forman RTT (1995) Land mosaics. Cambridge University Press, New YorkForman RTT, Collinge SK (1996) The ‘spatial solution’ to conserving biodiversity in landscapes and regions.
In: DeGraaf RM, Miller RI (eds) Conservation of faunal diversity in forested landscapes. Chapman &Hall, New York, pp 537–568
Godron M, Forman RTT (1983) Landscape modification and changing ecological characteristics. In: MooneyHA, Godron M (eds) Disturbance and ecosystems: components of response. Springer, New York, pp 12–28
Hobbs ER (1988) Species richness of urban forest patches and implications for urban landscape diversity.Landsc Ecol 1:141–152
Hunter ML Jr (1990) Wildlife, forests, and forestry. Prentice Hall, Englewood CliffsIverson LR (1988) Land-use change in Illinois, USA: the influence of landscape attributes on current and
historic land use. Landsc Ecol 2:45–61Levenson JB (1981) Woodlots as biogeographic islands in Southeastern Wisconsin. In: Burgess RL, Sharpe
DM (eds) Forest island dynamics in man-dominated landscapes. Springer, New York, pp 13–40Marzluff JM, Ewing K (2001) Restoration of fragmented landscapes for conservation of birds: a general
framework and specific recommendations for urbanizing landscapes. Restor Ecol 9:280–292Nowak DJ, Crane DE (2000) The urban forest effect (UFORE) model: quantifying urban forest structure and
functions. In: Hansen M, Burk T (eds) Integrated tools for natural resources inventories in the 21stcentury, Proceedings of the IUFRO Conference Held in Boise, Idaho 16–20 August 1998. USDA ForestService, North Central Research Station, St. Paul, pp 714–720
Nowak DJ, Crane DE (2002) Carbon storage and sequestration by urban trees in the USA. Environ Pollut116:381–389
Saunders DA, Hobbs RJ, Margules CR (1991) Biological consequences of ecosystem fragmentation: a review.Conserv Biol 5:18–32
Sharpe DM, Stearns F, Leitner LA, Dorney JR (1986) Fate of natural vegetation during urban development ofrural landscapes in southeastern Wisconsin. Urban Ecol 9:267–287
Turner MG (1990) Landscape changes in nine rural counties in Georgia. Photogramm Eng Remote Sens56:379–386
Wetzel RG (1983) Limnology. Saunders College Publishing, PhiladelphiaZipperer WC, Burgess RL, Nyland RD (1990) Patterns of deforestation and reforestation in different
landscape types in central New York. For Ecol Manag 36:103–117Zipperer WC, Foresman TW, Sisinni SM, Pouyat RV (1997) Urban tree cover: an ecological perspective.
Urban Ecosyst 1:229–246
544 Urban Ecosyst (2012) 15:533–544
Author's personal copy