Solution Manuals Of For More Solution Manuals Hand Books And Much Much More
Upload
khangminh22Category
view
1download
0
Deforestation and Benthic Indicators: How MuchVegetation Cover Is Needed to Sustain Healthy AndeanStreams?Carlos Iniguez–Armijos1,2*, Adrian Leiva1, Hans–Georg Frede2, Henrietta Hampel3, Lutz Breuer2
1 Departamento de Ciencias Naturales, Universidad Tecnica Particular de Loja (UTPL), Seccion de Ecologıa, Loja, Ecuador, 2 Institute for Landscape Ecology and Resources
Management (ILR), Research Centre for Bio Systems, Land Use and Nutrition (IFZ), Justus–Liebig–University Giessen, Giessen, Germany, 3 Universidad de Cuenca, Quinta
Balzaın, Cuenca, Ecuador
Abstract
Deforestation in the tropical Andes is affecting ecological conditions of streams, and determination of how much forestshould be retained is a pressing task for conservation, restoration and management strategies. We calculated and analyzedeight benthic metrics (structural, compositional and water quality indices) and a physical-chemical composite index withgradients of vegetation cover to assess the effects of deforestation on macroinvertebrate communities and water quality of23 streams in southern Ecuadorian Andes. Using a geographical information system (GIS), we quantified vegetation cover atthree spatial scales: the entire catchment, the riparian buffer of 30 m width extending the entire stream length, and thelocal scale defined for a stream reach of 100 m in length and similar buffer width. Macroinvertebrate and water qualitymetrics had the strongest relationships with vegetation cover at catchment and riparian scales, while vegetation cover didnot show any association with the macroinvertebrate metrics at local scale. At catchment scale, the water quality metricsindicate that ecological condition of Andean streams is good when vegetation cover is over 70%. Further,macroinvertebrate community assemblages were more diverse and related in catchments largely covered by nativevegetation (.70%). Our results suggest that retaining an important quantity of native vegetation cover within thecatchments and a linkage between headwater and riparian forests help to maintain and improve stream biodiversity andwater quality in Andean streams affected by deforestation. This research proposes that a strong regulation focused to themanagement of riparian buffers can be successful when decision making is addressed to conservation/restoration ofAndean catchments.
Citation: Iniguez–Armijos C, Leiva A, Frede H–G, Hampel H, Breuer L (2014) Deforestation and Benthic Indicators: How Much Vegetation Cover Is Needed toSustain Healthy Andean Streams? PLoS ONE 9(8): e105869. doi:10.1371/journal.pone.0105869
Editor: Tomoya Iwata, University of Yamanashi, Japan
Received January 27, 2014; Accepted July 25, 2014; Published August 22, 2014
Copyright: � 2014 Iniguez–Armijos et al. This is an open-access article distributed under the terms of the Creative Commons Attribution License, which permitsunrestricted use, distribution, and reproduction in any medium, provided the original author and source are credited.
Funding: This research was funded through a scholarship of the Secretaria Nacional de Educacion Superior, Ciencia, Tecnologıa e Innovacion of Ecuador(SENACYT), a DFG (Deutsche Forschungsgemeinschaft) grant (FR615/28-1/-2) and by the Universidad Tecnica Partucular de Loja (UTPL). The support fromHenrietta Hampel was thanks to the PROMETEO Program of SENESCYT. The funders had no role in study design, data collection and analysis, decision to publish,or preparation of the manuscript.
Competing Interests: The authors have declared that no competing interests exist.
* Email: [email protected]
Introduction
Tropical deforestation is one of the most important topics
worldwide associated with biodiversity loss and ecosystem
degradation [1–3]. However, the effects of deforestation on
ecological condition of tropical streams have been rarely
investigated despite evidence that forest loss negatively affects
these streams [4–7]. In Ecuador, deforestation for agriculture and/
or urbanization is a critical threat for Andean ecosystems [8],
reaching annual deforestation rates of 2.7% between 1989 and
2008 in the montane forests of southern Andes (Tapia Armijos,
pers. communication). However many of these ecosystems provide
essential environmental services including biodiversity conserva-
tion, carbon storage and water supply [9]. Several studies focused
along the Ecuadorian Andean region have demonstrated that
deforestation affects habitat structure and macroinvertebrate
community assemblages in streams [10], litter breakdown rates
[11] and hydrological processes [12]. Clearly the Ecuadorian
montane streams are influenced by the surrounding landscape and
several research groups have recently deployed considerable efforts
to assess these relationships. Nonetheless, information gaps
concerning the influence of land cover/use and spatial scale on
stream condition remains, despite they affect water quality and
aquatic diversity [13,14]. These data are crucial for management
and conservation of developed catchments to insure long term
sustainability [15].
In other regions, organizations such as the European Environ-
ment Agency (EEA), the United States Environmental Protection
Agency (EPA) and national agencies in New Zealand have
identified, and are currently considering within their monitoring
programs, the impacts of land cover/use changes on stream
ecological conditions based on responses of macroinvertebrate
communities [16–19]. In addition, they have developed catchment
and/or riparian rehabilitation projects in order to enhance stream
condition [20]. In South and Central America such extensive
monitoring or restoration programs by governmental initiatives
are rare, despite their potential to reduce the impact of
deforestation on stream condition [13]. In this regard, a Costa
PLOS ONE | www.plosone.org 1 August 2014 | Volume 9 | Issue 8 | e105869

Rican regulation has showed the effectiveness of protecting
riparian buffers to reduce the impacts of deforestation on
macroinvertebrate communities and sensitive taxa in tropical
streams [4].
Several authors [10,21–23] have applied a variety of macroin-
vertebrate metrics (e.g. Fisher’s index; EPT taxa) to assess the
impact of land cover/use on the ecological condition of streams in
South America focusing on the structure and composition of
benthic communities. These studies have confirmed changes to
aquatic biodiversity and water quality because of deforestation
around the streams. Nevertheless, how does vegetation cover
influences stream ecological condition? In streams running
through forested catchments the macroinvertebrate communities
are more heterogeneous, diversity of intolerant taxa to environ-
mental stress is higher, and abundance and variety of habitats is
greater [10,14,21]. Likewise, streams with forested riparian areas
have low variation in water temperature and less nutrients and
sediment loads along the entire length [4,13]. At the catchment
scale, there is also an influence of vegetation cover on controlling
hydrology and the entire diversity of the streams [12]. In this
regard, estimating the extent of native vegetation cover in a
catchment and the importance of riparian management and
headwater forest protection to maintain and improve biodiversity
and water quality of streams affected by deforestation is a pressing
task for management and conservation [13,14,24].
Geographic Information Systems (GIS) allow researchers to
explore correlations in spatial patterns with ecological features in
the landscape. Allan [13] describes the ability to apply GIS tools
with remote sensing data to assess the influence of land cover/use
on stream ecological condition. Studies in temperate areas have
described the influence of land cover and spatial scale on stream
communities [25,26] and on stream water quality [14] by applying
GIS based evaluation techniques to derive land cover data and to
relate them with physical, chemical and biological data.
In this study, our objective was to investigate the influence of
vegetation cover at three spatial scales (local, riparian buffer and
catchment) on structure and composition of macroinvertebrate
communities and on water quality of headwater streams in the
southern Ecuadorian Andes. These streams are located in two
contrasting regions of varying intensities of anthropogenic pressure
(i.e. deforestation, population growth, and farming). The questions
we addressed were: what spatial scale and how much vegetation
cover are associated with healthy streams based on macroinver-
tebrate metrics? In order to address these questions, we calculated
several diversity and water quality metrics from macroinvertebrate
communities, derived spatial information on land cover from GIS,
and related these metrics statistically to three spatial scales and
stream parameters. Finally, we addressed management and
conservation problems in order to help mitigating impacts of
deforestation on stream ecosystems.
Methodology
For this study, the Ministry of Environment of Ecuador issued
us a general research permit for every sampling site and to collect
water samples and macroinvertebrate specimens. In the case of the
Zamora upstream catchment (Zu), the Municipality of Loja
granted a specific permission to work at sites Zu1–2, 4–5, 8
because these streams are used for the water supply of the city. To
work at the San Francisco catchment (SF), the administration of
the San Francisco Research Station and Nature and Culture
International allowed us to access sites SF1–7. For all other sites
we used the general research permit.
Most of macroinvertebrates collected in this study were
identified at genus level and we do not know if any of these
genera are endangered or protected, because of the lack of
information for Ecuador.
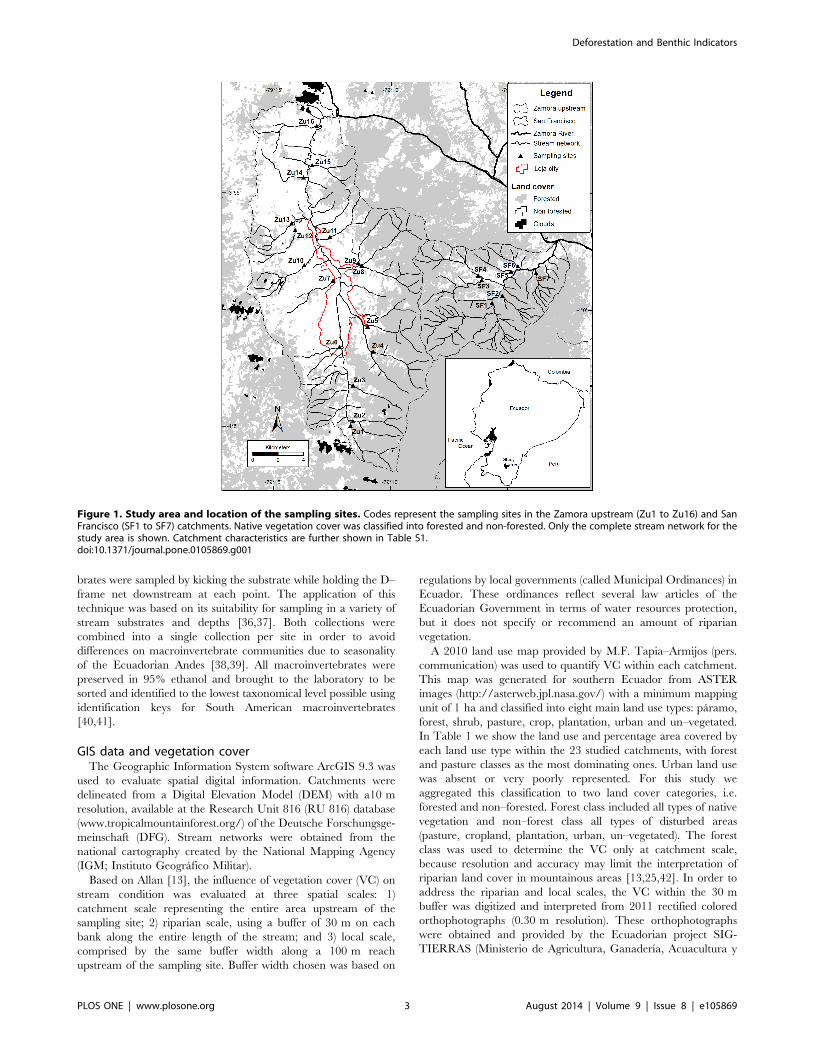
Study areaWe studied 23 streams of two headwater catchments of the
Zamora River basin, located in the mountain forests in
Ecuadorian southern Andes (Figure 1). The Zamora upstream
catchment covers an area of 276.2 km2 and ranges between 2,020
to 3,250 m a.s.l. It is the most populated catchment within the
Zamora River basin with approximately 120, 000 inhabitants in
the city of Loja. The San Francisco catchment is located in a
sparsely populated area of the Zamora River basin with an area of
75.3 km2 and an elevation range from 1,800 to 3,250 m a.s.l. The
natural vegetation in both study catchments is evergreen mountain
rain forests, humid shrub, cloud forest and paramo [27,28].
Anthropic activities in both catchments have substituted the
original vegetation mainly to pasture, and to a lesser extent to
cropland, pine (Pinus) and eucalyptus (Eucalyptus) plantations
[29]. Urban development has only taken place in the Zamora
upstream catchment and has spread along its main river. Both
catchments have similar climatic conditions with a wet season
from May to September and a dry season from October to April.
The average annual precipitation and temperature in the Zamora
upstream and San Francisco catchments are about 2,200 mm and
15.2uC respectively.
Stream measurements and macroinvertebrates samplingWe sampled 16 streams in the Zamora upstream catchment and
7 streams in the San Francisco catchment. Sampling focused on
riffles with an altitudinal variation of 350 m among sites. Every site
consisted of a 30–60 m reach placed at the outlet of each stream in
order to capture the influences of land use upstream on
macroinvertebrate communities. According to the sampling
frequency applied in other studies with benthic macroinvertebrates
both in Ecuador and in other Neotropical regions [4,10,11,30–34],
we collected physical–chemical and macroinvertebrate data
during both dry (November 2010; December 2012) and wet
seasons (May 2011; April 2012) at the same stream reach.
Physical–chemical parameters such as pH, temperature (T),
specific conductance (SC), dissolved oxygen (DO), were assessed
in–stream in each of the sampling periods (Table S1) with a
portable YSI 556 Multi Probe System and were averaged from
several measurements during the sampling campaigns. Grab
samples were taken for measuring further water chemistry at the
laboratory of the Universidad Tecnica Particular de Loja (UTPL)
using standard methods [35]: nitrate (NO32), phosphate (PO4
32),
biochemical oxygen demand during decomposition in a period of
5 days (BOD5), total coliforms (TC) and turbidity (Table S1).
For sampling of macroinvertebrate communities several meth-
ods exist and each one provides different results, nevertheless a
combination of sampling methods is preferable [30]. In this study,
qualitative macroinvertebrates samples were taken along the
stream reach applying two sampling methods: 1) collecting
macroinvertebrates directly in their stream habitats from stones
and leaves, and 2) using a D–frame net (500 mm mesh) for kick
sampling at 3–6 points selected randomly. Collection method 1
was applied during 10 min along the reach to remove all visible
macroinvertebrates from stones and collect leaves respectively.
Selected stones collected were totally submerged and had an
average diameter of 20 cm approximately. Leaves were stored in a
plastic bag and rinsed with tap water to remove macroinverte-
brates in the laboratory. For collection method 2, macroinverte-
Deforestation and Benthic Indicators
PLOS ONE | www.plosone.org 2 August 2014 | Volume 9 | Issue 8 | e105869
brates were sampled by kicking the substrate while holding the D–
frame net downstream at each point. The application of this
technique was based on its suitability for sampling in a variety of
stream substrates and depths [36,37]. Both collections were
combined into a single collection per site in order to avoid
differences on macroinvertebrate communities due to seasonality
of the Ecuadorian Andes [38,39]. All macroinvertebrates were
preserved in 95% ethanol and brought to the laboratory to be
sorted and identified to the lowest taxonomical level possible using
identification keys for South American macroinvertebrates
[40,41].
GIS data and vegetation coverThe Geographic Information System software ArcGIS 9.3 was
used to evaluate spatial digital information. Catchments were
delineated from a Digital Elevation Model (DEM) with a10 m
resolution, available at the Research Unit 816 (RU 816) database
(www.tropicalmountainforest.org/) of the Deutsche Forschungsge-
meinschaft (DFG). Stream networks were obtained from the
national cartography created by the National Mapping Agency
(IGM; Instituto Geografico Militar).
Based on Allan [13], the influence of vegetation cover (VC) on
stream condition was evaluated at three spatial scales: 1)
catchment scale representing the entire area upstream of the
sampling site; 2) riparian scale, using a buffer of 30 m on each
bank along the entire length of the stream; and 3) local scale,
comprised by the same buffer width along a 100 m reach
upstream of the sampling site. Buffer width chosen was based on
regulations by local governments (called Municipal Ordinances) in
Ecuador. These ordinances reflect several law articles of the
Ecuadorian Government in terms of water resources protection,
but it does not specify or recommend an amount of riparian
vegetation.
A 2010 land use map provided by M.F. Tapia–Armijos (pers.
communication) was used to quantify VC within each catchment.
This map was generated for southern Ecuador from ASTER
images (http://asterweb.jpl.nasa.gov/) with a minimum mapping
unit of 1 ha and classified into eight main land use types: paramo,
forest, shrub, pasture, crop, plantation, urban and un–vegetated.
In Table 1 we show the land use and percentage area covered by
each land use type within the 23 studied catchments, with forest
and pasture classes as the most dominating ones. Urban land use
was absent or very poorly represented. For this study we
aggregated this classification to two land cover categories, i.e.
forested and non–forested. Forest class included all types of native
vegetation and non–forest class all types of disturbed areas
(pasture, cropland, plantation, urban, un–vegetated). The forest
class was used to determine the VC only at catchment scale,
because resolution and accuracy may limit the interpretation of
riparian land cover in mountainous areas [13,25,42]. In order to
address the riparian and local scales, the VC within the 30 m
buffer was digitized and interpreted from 2011 rectified colored
orthophotographs (0.30 m resolution). These orthophotographs
were obtained and provided by the Ecuadorian project SIG-
TIERRAS (Ministerio de Agricultura, Ganaderıa, Acuacultura y
Figure 1. Study area and location of the sampling sites. Codes represent the sampling sites in the Zamora upstream (Zu1 to Zu16) and SanFrancisco (SF1 to SF7) catchments. Native vegetation cover was classified into forested and non-forested. Only the complete stream network for thestudy area is shown. Catchment characteristics are further shown in Table S1.doi:10.1371/journal.pone.0105869.g001
Deforestation and Benthic Indicators
PLOS ONE | www.plosone.org 3 August 2014 | Volume 9 | Issue 8 | e105869

Ta
ble
1.
Lan
du
sech
arac
teri
stic
san
dar
ea
(%)
of
eac
hla
nd
use
typ
eo
fth
e2
3st
ud
ied
catc
hm
en
ts.
Ca
tch
me
nt
Pa
ram
oF
ore
stS
hru
bP
ast
ure
Pla
nta
tio
nC
rop
Urb
an
Un
-ve
ge
tate
d
Zu
10
.86
9.4
13
.41
3.6
0.3
2.3
0.0
0.2
Zu
29
.36
1.1
14
.41
2.5
0.5
2.1
0.0
0.0
Zu
31
.45
9.4
10
.72
5.0
0.7
2.6
0.0
0.1
Zu
42
.84
6.9
19
.32
5.2
0.5
5.3
0.0
0.2
Zu
54
.45
4.9
27
.91
0.4
0.9
1.4
0.1
0.1
Zu
60
.38
.81
7.6
66
.02
.22
.91
.50
.7
Zu
70
.04
.61
3.2
71
.10
.89
.00
.01
.2
Zu
82
.73
9.0
25
.63
0.9
0.7
1.0
0.0
0.2
Zu
90
.54
1.0
12
.43
5.9
1.5
8.3
0.2
0.1
Zu
10
0.4
8.0
28
.04
7.1
2.5
13
.40
.00
.6
Zu
11
0.4
33
.79
.14
2.0
2.7
11
.90
.00
.2
Zu
12
0.2
17
.64
.75
7.3
2.9
16
.30
.00
.9
Zu
13
0.4
16
.01
9.2
48
.91
.21
3.5
0.0
0.7
Zu
14
0.0
6.5
0.1
73
.21
.91
5.0
0.0
3.3
Zu
15
0.0
51
.99
.93
2.9
1.1
4.0
0.0
0.2
Zu
16
0.0
15
.60
.27
2.4
2.5
7.0
0.0
2.3
SF1
0.0
82
.35
.35
.60
.00
.00
.06
.8
SF2
2.0
93
.54
.00
.00
.00
.00
.00
.5
SF3
0.0
78
.05
.01
5.8
0.3
0.0
0.0
0.9
SF4
1.9
87
.63
.76
.30
.10
.00
.00
.3
SF5
0.4
81
.83
.01
4.1
0.4
0.0
0.0
0.3
SF6
0.4
76
.32
.81
8.9
1.2
0.0
0.0
0.4
SF7
2.0
92
.03
.92
.00
.00
.00
.00
.1
do
i:10
.13
71
/jo
urn
al.p
on
e.0
10
58
69
.t0
01
Deforestation and Benthic Indicators
PLOS ONE | www.plosone.org 4 August 2014 | Volume 9 | Issue 8 | e105869

Pesca; Proyecto Sistema Nacional de Informacion y Gestion de
Tierras Rurales e Infraestructura Tecnologica).
Data analysisWe calculated nine indices (also referred as metrics) to describe
ecological conditions of the streams. We calculated three
structural, two compositional and four water quality indices
(Table 2) that allowed us assessing stream conditions in response to
increasing VC. The structural indices were richness, Fisher’s
index, and evenness (Pielou’s index). For compositional indices we
classified macroinvertebrates by functional feeding groups (FFG)
according to [43,44], but we only used percentage of scrappers
and shredders because they have an expected decreasing response
to perturbation [36], in our case deforestation.
Water quality was assessed with the Water Quality Index
(WQI), the EPT index, the Biological Monitoring Working Party
index adapted to Colombia (BMWP/Col), and the %5 Dominant
taxa. WQI is a single score composed of several measurements of
various physical, chemical and bacteriological parameters, where
low WQI values show high influence of environmental stress [45].
EPT index shows the taxa richness within the macroinvertebrate
groups which are considered sensitive to stressors, and therefore
should increase with increasing water quality [46]. BMWP/Col
index provides a single value at the family level, representative of
the organism’s tolerance to stressors, where high tolerance to
pollution corresponds to low BMWP scores [40]. %5 Dominant
taxa is a measure of the abundance of the five most dominant taxa
to the total number of organisms in the sample at each site [36].
When a community is dominated by few taxa it will have high
dominance values, thus indicating the community is under the
influence of environmental stress.
Two statistical approaches have been used to evaluate
relationships between vegetation cover/land use and ecological
indices; these are regression [14,42,47] and ordination analyses
[4,10,48]. Prior to analyses, macroinvertebrate abundance data (x)
were transformed by log10 (x) to reduce the effect of large numbers
in single taxa (e.g. Baetodes). Rare taxa, i.e. taxa represented by
three or less individuals in a sampling site, were excluded in order
to avoid the influence of these taxa in the ordination analysis [49].
Because explanatory variables did not have a uniform scale,
stream parameters were log10 (x+1) transformed in order to avoid
the problem with 0 values and reduce the range of data. All of
these variables were analyzed by pairs in scatterplot matrices, and
through an exploratory Redundancy Analysis (RDA) to identify
the least correlated and most informative variables (PO432, DO,
TC and turbidity).
An important issue was to identify whether ecological condition
of the streams was attributable to a land use type and/or a stream
parameter. We used a stepwise multiple linear regression (SMLR)
with calculated macroinvertebrate metrics as dependent variables
against land use and PO432, DO, TC and turbidity to determine
which of those independent variables affect our response variables.
SMLR was applied with the ‘stepAIC’ function of ‘MASS’
package in R [50] using backward elimination of variables and
Akaike Information Criterion for variables or predictors selection.
In addition, we estimated the relative importance of predictors
based on their contribution to R2 using boostrap (‘relaimpo’
package). All p–values were adjusted with a Bonferroni correction
for multiple comparisons during regression analyses. These
analyses indicated that forest class (i.e. VC) was consistently more
informative to explain macroinvertebrate metrics than other land
use types or stream parameter (see Table S2 for SMLR results).
Therefore, to examine the linear dependency of each of our
response variables with increasing VC, macroinvertebrate metrics
(dependent) were regressed against percentages of VC at each
spatial scale (independent) using the method of least mean squares
(‘lm’ function of ‘stats’ package).
We used a RDA (‘rda’ function of ‘vegan’ package) to identify
macroinvertebrate community assemblages associated with per-
centages of VC, PO432, DO, TC and turbidity. RDA evaluates
multivariate response data and is a powerful tool of constrained
ordination in community ecology [51]. RDA works on a matrix Yof response data (e.g. macroinvertebrate data) and a matrix X of
explanatory variables (e.g. water chemistry, VC). It identifies
groups and shows the vector fitting of variables used in the
analysis. While the vector fitting is commonly used for environ-
mental interpretation in ordination diagrams, this implies a linear
relationship between ordination scores and the environment
Table 2. Results of regression analysis between calculated macroinvertebrate metrics and percentage of vegetation cover atmultiple spatial scales.
Spatial scale Catchment Buffer Local
Metric R2 p R2 p R2 p
Structural
Richness 0.30 ,0.01 0.34 ,0.001 0.10 0.13
Fisher’s index 0.50 ,0.001 0.38 ,0.001 0.01 0.30
Evenness 0.24 ,0.01 0.11 0.11 0.00 0.93
Compositional
% Scrappers 0.02 0.57 0.01 0.72 0.02 0.55
% Shredders 0.42 ,0.001 0.46 ,0.001 0.12 0.09
Water Quality
WQI{ 0.56 ,0.001 0.50 ,0.001 0.12 0.11
EPT index 0.53 ,0.001 0.59 ,0.001 0.03 0.39
BMWP/Col 0.44 ,0.001 0.46 ,0.001 0.17 0.05
%5 Dominant taxa 0.85 ,0.001 0.60 ,0.001 0.02 0.50
{WQI is the unique metric derived from water chemistry data showed in Table S1.doi:10.1371/journal.pone.0105869.t002
Deforestation and Benthic Indicators
PLOS ONE | www.plosone.org 5 August 2014 | Volume 9 | Issue 8 | e105869

variables and may not always be appropriate if it is desired to
understand the ordination of studied sites or species in relation to
one or more variables. Thus, we fitted the surface of the best
predictor variable, identified with an ANOVA of the RDA results,
to detect how macroinvertebrate communities are grouped and
spread in relation to this variable. We examined whether
macroinvertebrate communities were different between those
groups using an Analysis of Similarities (ANOSIM; ‘anosim’
function of ‘vegan’ package). ANOSIM is a nonparametric
procedure that provides a test of whether there is a significant
difference between two or more groups of sampling units.
Results
Stream condition and vegetation coverRelationships between VC and all metrics are generally stronger
at catchment and buffer scale than at local scale where associations
are not apparent (Table 2). Significant correlations are found on
catchment and buffer scale in 90% and 80% of all cases. Within
the structural metrics, only evenness does not show significant
relationship with the percentage of VC at buffer scale (R2 = 0.11;
p = 0.11). In general, correlations decrease with smaller spatial
scales, disappearing completely at local scale.
As for compositional metrics, only one FFG shows a strong
relationship with VC at the two larger scales (p,0.001). The
percentage of shredders is more related to VC at catchment and
buffer scales (Table 2). Scrappers show weaker regressions at all
spatial scales (R2,0.02). At local scale no significant correlation
existed at all.
All water quality metrics have stronger relationships at
catchment and buffer scale than at local scale (R2.0.44 and p,
0.001, Table 2). Within water quality metrics, the %5 Dominant
taxa depicts the highest correlation across all scales with 0.85 on
catchment scale. Regression slopes indicate significant differences
in water quality when VC increases at both spatial scales.
However, there are some streams with a large area covered by
forest at catchment and buffer scale which present low values in
water quality indices (Figure 2B–C; F–G). For example, in both
spatial scales the EPT index increase with VC (R2 = 0.53; p,0.001
and R2 = 0.59; p,0.001), but there is one site with approximately
70% of forest cover whose index value is less than 50, indicating
fairly poor water quality. In addition, the strongest relationship is
inversely correlated between the %5 Dominant taxa and the
percentage of VC in the catchment (R2 = 0.85; p = 0.001). As a
general pattern most of the macroinvertebrate metrics indicate
good water quality when the percentage of native VC is higher
than 70% within the catchment and the riparian buffer (see
Figure 2).
Macroinvertebrate communities and vegetation coverAll structural indices are related with VC at catchment scale
rather than at other spatial scales (Table 2). Thus, we decided to
further analyze the community assemblage patterns related to
catchment forest cover. A correlation analysis run for those
variables showed scatterplot matrices and correlation values from
0 to 1.We defined a decision threshold of 0.50 to remove those
variables which are correlated with more than one variable.
Remaining variables include VC, DO, PO432, TC and turbidity.
RDA reveal that 51% of the variation in the data can be explained
by these five selected variables and the ANOVA identified that
catchment VC is the best predictor for macroinvertebrate
composition in the ordination (p,0.001). In Figure 3A, most
variables are spread along negative axis 1 and negative axis 2, with
VC, PO432 and turbidity being the most influential factors for axis
1, while DO and TC are more associated with axis 2. Figure 3B
depicts the fitted surface of the best predictor variable (i.e. VC) to
detect how macroinvertebrate communities are grouped and
spread in relation to VC. Thus the ordination plot illustrates two
visibly distinguishable groups; one group associated to catchments
with a forest cover above 70% which is even more aggregated than
the other group related to lower VC. The ANOSIM indicates that
both groups of macroinvertebrate assemblages were strongly
dissimilar between both ranges of VC (R = 0.55; p = 0.001). Both
RDA plot and Bray–Curtis distance of the ANOSIM suggest that
macroinvertebrate assemblages differ in taxonomical composition
when there is a decline in the percentage of VC within the
catchments.
Overall, macroinvertebrate communities in the 23 study
streams present specific patterns. They are composed of a total
of 13,512 individuals belonging to 11 orders, 33 families and 53
genera (data available at PANGAEA – Data Publisher for Earth &
Environmental Science; doi:10.1594/PANGAEA.831687). Only
two taxa (taxa–1 = Empididae; taxa–2 = Pyralidae) were not
identified to genera level.
Comparing occurrence and abundance patterns between both
groups of catchments (i.e. less than 70% and greater than 70%
VC) we detected several singularities. In catchments with a VC
between 70 to 100% we collected 4,061 individuals of 11 orders.
In contrast 9,451 individuals of nine orders were found in
catchments with less VC (Basommatophora and Lepidoptera were
absent). We found 33 families, all of them present in catchments
highly forested; whilst 10 families were absent in catchments with
less than 70% forest cover (Calamoceratidae, Ceratopogonidae,
Coenagrionidae, Dolichopodidae, Gyrinidae, Odontoceridae,
Physidae, Psephenidae, Ptilodactylidae, and Pyralidae). With
regard to the 53 genera found, only Scirtes (Coleptera) and
Molophilus (Diptera) were absent in catchments above 70% forest
cover, and 25 genera were absent in catchments with lower forest
cover showing the greatest difference between both groups of
catchments at this taxonomic level. Here genera absent at ,70%
catchment VC were: Physa (Basommatophora); Noelmis, Phana-cerus, Dineutus, Anchytarsus, Psephenops, Elodes (Coleoptera);
Probezzia, Aphrosytus, Hexatoma (Diptera); Andesiops, Moribaetis,Haplohyphes, Tricorythodes, Farrodes (Ephemeroptera); taxa–2
(Lepidoptera); Argia (Odonata); Phylloicus, Leptonema, Macro-stemum, Grumichella, Nectopsyche, Triplectes, Marilia, Cernotina(Tricoptera).
A trend can be observed here as well, confirmed by the
ANOSIM, as there are differences in macroinvertebrate compo-
sitions between both groups of catchments (Table 3). We detect an
increase for almost all metrics of the macroinvertebrate commu-
nities with an increase of the percentage of VC in the catchment,
except for evenness where no changes are observed.
Discussion
Stream condition and vegetation coverOur results show a stronger relationship between VC and the
macroinvertebrate metrics at catchment and buffer scales. This
suggests an important linkage between headwater and riparian
forests to conserve diversity and water quality of the streams in
Ecuadorian Andean catchments. We observe that stream condi-
tion begins to improve when native VC within the catchment is
over 70% (see Figure 2). Therefore our suggestion is to retain at
least 70% native VC within the catchment in order to keep
sufficient ecological condition of the streams. Such a percentage of
VC can contribute significantly to riparian management for
protection or restoration of watersheds where forest has been
Deforestation and Benthic Indicators
PLOS ONE | www.plosone.org 6 August 2014 | Volume 9 | Issue 8 | e105869

replaced by grasslands. Further, our findings show that local scale
strategies (e.g. conserving small forest patches in riparian areas) do
not improve water quality and are unlikely to improve the overall
ecological condition of streams. According to [13,47], the
maintenance of ecological conditions may require conservation
of more than only a few native forest patches, and efforts should
Figure 2. Water quality indices plotted against vegetation cover (%) at catchment and buffer scales. Horizontal green dashed linesrepresent thresholds of good water quality defined for each metric in the literature. Only the %5 Dominant index does not have ranges of tolerance,but high percentages indicate stress in the communities. For both spatial scales R2 values are over 0.44 with a p–value ,0.001, see Table 2 for specificvalues of each regression.doi:10.1371/journal.pone.0105869.g002
Figure 3. Redundancy Analysis (RDA) of macroinvertebrate community assemblages from catchments with different vegetationcovers (VC). This ordination analysis detected two groups of macroinvertebrate assemblages: solid circles represent macroinvertebratecommunities in catchments with 70–95% in VC and triangles indicate macroinvertebrate communities in catchments with less than 70% in VC. Eachsymbol represents the community of a single catchment, i.e. macroinvertebrate community at catchment SF3. A Shows the RDA ordination withvector fitting of five variables selected during analysis. DO = dissolved oxygen, TC = total coliforms, PO4 = phosphate. B Displays in green curves thefitted surface only for the percentage of VC, which is the most explicative variable of the ordination (65%). Dashed lines enclose and separate thedetected groups.doi:10.1371/journal.pone.0105869.g003
Deforestation and Benthic Indicators
PLOS ONE | www.plosone.org 7 August 2014 | Volume 9 | Issue 8 | e105869

focus on considering larger spatial patterns that have more
important consequences for stream conservation.
Macroinvertebrates diversity is more related to native VC at
catchment and buffer scale than at a local scale. Many studies have
documented the influence of upstream vegetation on stream
ecological condition downstream, especially on water chemistry
and habitat conditions [13,14,52]. For example, DO increases as
the stream enters the forest [53]. Likewise, the similar relationships
shown between water quality metrics and VC at catchment and
buffer scale is not surprising given the strong longitudinal
connectivity in a riverine landscape [13,54]. Riparian forests can
influence water chemistry and habitat quality, which are directly
linked to the macroinvertebrate metrics and help to minimize the
effects of catchment deforestation on streams [4,42,55].
In this study, there were two particular sampling points in
streams of catchments Zu4 and Zu8 (see Figure 1 and Table S1).
Both had low values in water quality indices but a relatively high
VC (60–68%). We assume that livestock and minor roads which
are located parallel to the streams influence these metrics. For
example, in [4] the authors found a stream affected by inputs of
sediments and nutrients derived from roads and livestock, despite
having a wide riparian buffer. We believe those elements are
affecting the macroinvertebrate composition of very well forested
catchments as discussed below.
Macroinvertebrate communities, indicators andvegetation cover
Analyzing the composition of macroinvertebrate communities
of 23 Andean streams, we are able to identify direct relationships
with the coverage of the catchment’s native forest. The difference
between macroinvertebrate assemblages increases when decreas-
ing the percentage of native VC. We find a group with a more
aggregated distribution when VC is large in the RDA plot. This
pattern was also observed by [14] in a larger sample of streams in
New Zealand. It supports the premise that deforestation is
affecting the macroinvertebrate community assemblages in Ecua-
dorian Andean streams as in other Neotropical streams [4,21,56].
The difference between both groups of macroinvertebrate
communities detected in the RDA is also revealed in the
ANOSIM. Bucker et al. [10] found similar patterns in the San
Francisco catchment having less variation at structural and
compositional level and higher water quality metric values in
forested than in deforested streams. Comparable results were also
found in other Andean streams [11] and Amazon streams [21] of
northern Ecuador. Nonetheless, among all metrics used here and
mostly applied in similar studies, %5 Dominant taxa reveals a
superior fitting to the regression slope despite it has not been used
to reflect deforestation effects on streams before. In [36], authors
denoted that high values of this metric indicate a community
under environmental stress.
In terms of the FFG composition, we observe a direct response
to increasing VC in both groups of macroinvertebrates (Table 3).
In average, the abundance of shredders present in streams with .
70% VC in catchment is always higher than in less forested
catchments. Shredders abundance is typically linked to leaf litter
from riparian vegetation and it is sensitive to riparian zone impacts
[43,57,58]. Shedders could be considered as an indicator of
deforestation in Andean streams, despite proportion of shredders
in macroinvertebrate communities in our catchments are always
small (see Table 3). According to [4,5] this seems to be a general
pattern in tropical streams. On average, scrapers abundance is
slightly higher in more forested catchments in contrast to other
Neotropical streams where their abundance is higher in less
forested streams [4]. Additionally no association between scrap-
pers and VC was detected.
Management and conservationAllan et al. [13,47] have recommended that it is preferable to
retain as much forest cover as possible in a catchment to preserve
natural stream condition. However, in tropical regions like
Ecuadorian Andes, deforestation has been increasing throughout
the years affecting a large part of catchments along the Andes
[29,59,60]. Deforestation has stopped in the upper Andean
catchments because of topography and accessibility, preserving
headwater forests and/or paramo [29]. However, this native
vegetation in the headwaters is not enough to sustain healthy
streams. In Andean countries, human activities are especially
concentrated on midstream sections and valleys of catchments
affecting water/habitat quality downstream and other rivers after
the confluence. For example, within Guayas river basin in
Ecuador there are several cities and in combination with intensive
agricultural land use they are affecting the entire river network and
its water quality [61]. Our results suggest that retaining over 70%
native forest cover in Andean catchments now dominated by
grasslands and keeping the riparian buffers, the water quality and
stream biodiversity could be enhanced or at least preserved.
However, this task is not so easy to achieve if there is not a strong
regulation at national level.
The Ecuadorian constitution defines the right to water and
promotes the protection, restoration and management of basins
and water resources; but it does not mention how much forest
needs to be retained in a catchment or a recommended width for
Table 3. Diversity patterns of macroinvertebrate communities in both groups of catchments identified in RDA ordination plot(Figure 3B). VC = catchment vegetation cover.
Vegetation cover ,70% VC .70% VC Response to increasing VC
Metric Mean SD Mean SD
Structural
Richness 14.3 2.1 20.1 6.2 Increase
Fisher’s index 2.5 0.4 4.9 1.3 Increase
Evenness 0.7 0.1 0.7 0.1 Variable
Compositional
% Scrappers 26.0 16.3 30.6 17.3 Increase
% Shredders 0.3 0.8 3.1 2.6 Increase
doi:10.1371/journal.pone.0105869.t003
Deforestation and Benthic Indicators
PLOS ONE | www.plosone.org 8 August 2014 | Volume 9 | Issue 8 | e105869

riparian buffers. Best conservation actions that intend maintaining
as much forest as possible have been focused on catchments for
drinking water supply from initiatives of local governments
(Municipalities) supported by non–governmental organizations,
through the establishment of trust funds for catchment conserva-
tion. Also, local governments through Municipal Ordinances have
decided to protect riparian strips with different buffer widths (15–
30 m), depending if the stream is running in the city or outside the
urban boundary. Riparian buffers could considerably reduce the
effects of deforestation on benthic communities and water quality,
but there is need for a proper management of riparian areas [4].
Unfortunately, Municipal Ordinances in Ecuador do not include
the management of riparian buffers. Here, we assessed the effect of
a 30 m buffer width on stream condition showing strong
associations with the water quality metrics. Therefore, we also
recommend protection and an effective management of native
riparian forest buffers in Andean streams to assist headwater
forests to sustain ecological condition of the streams.
We did not evaluate any management approaches of riparian
areas, but we would like to recommend some strategies that
governments can include in national regulations. We believe that
the most important problems that managers will face in Andean
streams are livestock density, residential areas and parallel roads
along riparian zones which affect water quality and macroinver-
tebrate communities in forested catchments. Therefore, these
problems must be addressed; for example, livestock exclusion
jointly with a long–term research program to assess its effectiveness
[62]; or an in–depth monitoring to further study road effects on
stream and riparian vegetation [63]. Another important issue to be
considered is the restoration of riparian vegetation, mainly because
it enhances water quality, as our study indicates. Restoration
positively affects habitat and macroinvertebrate community
heterogeneity [48] and can be ecologically successful by using
native plant species and avoiding the use of invasive plant species,
which can affect structure and functionally of streams [64]. Finally,
as mentioned by [4] we would like to emphasize that ‘‘riparian
forest buffers are not a replacement for continuous forest, but can
promote biodiversity and stream ecosystem integrity in tropical
catchments affected by deforestation’’.
Supporting Information
Table S1 List of environmental variables considered inthe 23 studied Andean streams. Data of water parameters
are means obtained from several measurements in two sampling
campaigns. Altitude was determined once at the sampling sites.
Catchment area and percentage of vegetation cover (VC) at three
spatial scales were calculated in ArcGIS 9.3 Geographic
Information System software. T = Temperature, SC = Specific
Conductance, DO = Dissolved Oxygen, NO32 = Nitrate,
PO432 = Phosphate, BOD5 = Biochemical Oxygen Demand in
5 days. Turbidity in Nephelometric Turbidity Units or NTU and
Total Coliforms (TC) as Colony Forming Units or CFU.
(DOCX)
Table S2 Stepwise multiple linear regression analysisbetween macroinvertebrate metrics, land use andstream parameters for 23 Andean streams. Degrees of
freedom for all regressions were 1, 20. AIC = Akaike Information
Criterion used for selection of predictor variables. DO = Dissolved
Oxygen, PO432 = Phosphate, TC = Total Coliforms.
(DOCX)
Acknowledgments
Special thanks are due to the personnel of the San Francisco Research
Station, Nature and Culture International, Municipality of Loja and the
Ministry of Environment for the provision of research facilities. Many
thanks are due to C. Prieto to provide us additional information on stream
parameters and macroinvertebrates of the Zamora catchment; and to L.M.
Cun for his support with field sampling and stream measurements. The
help of C. Romero, S. Aguilar and M. Villa with water analyses is
appreciated. We would like to thank S. Bourret for proof reading, C.
Espinosa for his assistance with R functions and routines, and P.F.
Quintana–Ascencio and two anonymous reviewers for constructive
comments on previous drafts of the manuscript.
Author Contributions
Conceived and designed the experiments: CIA HGF LB. Performed the
experiments: CIA AL. Analyzed the data: CIA LB HH. Contributed
reagents/materials/analysis tools: CIA HGF LB. Wrote the paper: CIA
HH LB.
References
1. Laurance WF (1999) Reflections on the tropical deforestation crisis. Biol
Conserv 91: 109–117.
2. Achard F, Eva HD, Stibig H-J, Mayaux P, Gallego J, et al. (2002) Determination
of deforestation rates of the world’s humid tropical forests. Science (80-) 297:999–1002.
3. Lambin EF, Geist HJ, Lepers E (2003) Dynamics of l and-use and land -cover
change in tropical regions. Annu Rev Environ Resour 28: 205–241.
4. Lorion CM, Kennedy BP (2009) Relationships between deforestation, riparian
forest buffers and benthic macroinvertebrates in neotropical headwater streams.Freshw Biol 54: 165–180.
5. Wantzen KM, Wagner R (2006) Detritus processing by invertebrate shredders: aneotropical – temperate comparison. J North Am Benthol Soc 25: 216–232.
6. Iwata T, Nakano S, Inoue M (2003) Impacts of past riparian deforestation on
stream communities in a tropical rain forest in Borneo. Ecol Appl 13: 461–473.
7. Ordonez MV (2011) Influencia del uso del suelo y la cobertura vegetal natural
en la integridad ecologica de los rıos altoandinos al noreste del EcuadorUniversidad San Francisco de Quito.
8. Sierra R, Campos F, Chamberlin J (2002) Assessing biodiversity conservation
priorities: ecosystem risk and representativeness in continental Ecuador. Landsc
Urban Plan 59: 95–110.
9. Buytaert W, Cuesta-Camacho F, Tobon C (2011) Potential impacts of climatechange on the environmental services of humid tropical alpine regions. Glob
Ecol Biogeogr 20: 19–33.
10. Bucker A, Sondermann M, Frede H-G, Breuer L (2010) The influence of land-
use on macroinvertebrate communities in montane tropical streams – a casestudy from Ecuador. Fundam Appl Limnol 177: 267–282.
11. Encalada AC, Calles J, Ferreira V, Canhoto CM, Graca MAS (2010) Riparian
land use and the relationship between the benthos and litter decomposition in
tropical montane streams. Freshw Biol 55: 1719–1733.
12. Crespo PJ, Feyen J, Buytaert W, Bucker A, Breuer L, et al. (2011) Identifying
controls of the rainfall–runoff response of small catchments in the tropical Andes
(Ecuador). J Hydrol 407: 164–174.
13. Allan JD (2004) Landscapes and riverscapes: the influence of land use on stream
ecosystems. Annu Rev Ecol Evol Syst 35: 257–284.
14. Death RG, Collier KJ (2009) Measuring stream macroinvertebrate responses to
gradients of vegetation cover: when is enough enough? Freshw Biol 55: 1447–
1464.
15. Van Sickle J, Baker J, Herlihy A, Bayley P, Gregory S, et al. (2004) Projecting
the biological condition of streams under alternative scenarios of human land
use. Ecol Appl 14: 368–380.
16. Collier KJ, Hamer M (2012) The ecological condition of Waikato wadeable
streams based on the Regional Ecological Monitoring of Streams (REMS)
Programme. Waikato Regional Council, Technical Report, Waikato.
17. European Environment Agency (2012) European waters - assessment of status
and pressures. EEA Report No 8. Copenhagen.
18. Environmental Protection Agency (2013) National Rivers and Streams
Assessment 2008–2009: A Collaborative Survey. Draft February 28. Washing-
ton.
19. Perrie A, Morar S, Milne JR, Greenfield S (2012) River and stream water quality
and ecology in the Wellington region: State and trends. Greater Wellington
Regional Council, Publication No. GW/EMI-T-12/143, Wellington.
20. Parkyn SM, Davies-Colley RJ, Halliday NJ, Costley KJ, Croker GF (2003)
Planted Riparian Buffer Zones in New Zealand: Do They Live Up to
Expectations? Restor Ecol 11: 436–447.
21. Bojsen BH, Jacobsen D (2003) Effects of deforestation on macroinvertebrate
diversity and assemblage structure in Ecuadorian Amazon streams. Arch fur
Hydrobiol 158: 317–342.
Deforestation and Benthic Indicators
PLOS ONE | www.plosone.org 9 August 2014 | Volume 9 | Issue 8 | e105869

22. Miserendino ML, Casaux R, Archangelsky M, Di Prinzio CY, Brand C, et al.
(2011) Assessing land-use effects on water quality, in-stream habitat, riparianecosystems and biodiversity in Patagonian northwest streams. Sci Total Environ
409: 612–624.
23. Villamarın C, Rieradevall M, Paul MJ, Barbour MT, Prat N (2013) A tool toassess the ecological condition of tropical high Andean streams in Ecuador and
Peru: The IMEERA index. Ecol Indic 29: 79–92.24. Gergel SE, Turner MG, Miller JR, Melack JM, Stanley EH (2002) Landscape
indicators of human impacts to riverine systems. Aquat Sci 64: 118–128.
25. Stewart JS, Wang L, Lyons J, Horwatich JA, Bannerman R (2001) Influences ofwatershed, riparian-cprridor and reach-scale characteristics on aquatic biota in
agricultural watersheds. J Am Water Resour Assoc 37: 1475–1487.26. Sutherland AB, Meyer JL, Gardiner EP (2002) Effects of land cover on sediment
regime and fish assemblage structure in four southern Appalachian streams.Freshw Biol 47: 1791–1805.
27. Gottlicher D, Obregon A, Homeier J, Rollenbeck R, Nauss T, et al. (2009)
Land-cover classification in the Andes of southern Ecuador using LandsatETM+ data as a basis for SVAT modelling. Int J Remote Sens 30: 1867–1886.
28. Thies B, Meyer H, Nauss T, Bendix J (2014) Projecting land-use and land-coverchanges in a tropical mountain forest of Southern Ecuador. J Land Use Sci 9: 1–
33.
29. Torrachi S, Tapia MF, Escudero A, de la Cruz M (2013) Deforestacion en unaregion montanosa megadiversa en los Andes: Dinamica del paisaje en el sur de
Ecuador. In: de la Cruz M, Maestre FT, editors. Avances en el Analisis Espacialde Datos Ecologicos: Aspectos Metodologicos y Aplicados. Mostoles: ECESPA–
Asociacion Espanola de Ecologıa Terrestre. pp. 275–289.30. Stein H, Springer M, Kohlmann B (2008) Comparison of two sampling methods
for biomonitoring using aquatic macroinvertebrates in the Dos Novillos River,
Costa Rica. Ecol Eng 34: 267–275.31. De Caceres M, Legendre P, Moretti M (2010) Improving indicator species
analysis by combining groups of sites. Oikos 119: 1674–1684.32. Sites RW, Willig MR, Linit MJ (2003) Macroecology of Aquatic Insects: A
Quantitative Analysis of Taxonomic Richness and Composition in the Andes
Mountains of Northern Ecuador. Biotropica 35: 226–239.33. Jacobsen D (2004) Contrasting patterns in local and zonal family richness of
stream invertebrates along an Andean altitudinal gradient. Freshw Biol 49:1293–1305.
34. Tarras-Wahlberg N., Flachier A, Lane S., Sangfors O (2001) Environmentalimpacts and metal exposure of aquatic ecosystems in rivers contaminated by
small scale gold mining: the Puyango River basin, southern Ecuador. Sci Total
Environ 278: 239–261.35. American Public Health Association (1995) Standard Methods for the
Examination of Water and Wastewater. 19th ed. American Public HealthAssociation, editor Washington DC.
36. Barbour MT, Gerritsen J, Snyder BD, Stribling JB (1999) Rapid Bioassessment
Protocols for Use in Streams and Wadeable Rivers: Periphyton, BenthicMacroinvertebrates, and Fish. 2nd ed. Environmental Protection Agency.
37. Hauer FR, Resh VH (2007) Macroinvertebrates. In: Hauer FR, Lamberti GA,editors. Methods in Stream Ecology. San Diego CA: Academic Press. pp. 435–
454.38. Rıos-Touma B, Encalada AC, Prat Fornells N (2011) Macroinvertebrate
Assemblages of an Andean High-Altitude Tropical Stream: The Importance of
Season and Flow. Int Rev Hydrobiol 96: 667–685.39. Jacobsen D, Encalada AC (1998) The Macroinvertebrate fauna of Ecuadorian
high–land streams in the wet and dry season. Arch fur Hydrobiol 142: 53–70.40. Roldan Perez G (2003) Bioindicacion de la calidad del agua en Colombia. Uso
del metodo BMWP/Col. 1st ed. Medellın: Editorial Universidad de Antioquia.
41. Fernadez HR, Domınguez E (2001) Guıa para la determinacion de losartropodos bentonicos sudamericanos. 1st ed. Tucuman: Universidad Nacional
de Tucuman.42. Sponseller R, Benfield E, Valett H (2001) Relationships between land use, spatial
scale and stream macroinvertebrate communities. Freshw Biol.
43. Cummins KW, Merritt RW, Andrade PCN (2005) The use of invertebrate
functional groups to characterize ecosystem attributes in selected streams and
rivers in south Brazil. Stud Neotrop Fauna Environ 40: 69–89.
44. Tomanova S, Goitia E, Helesic J (2006) Trophic levels and functional feeding
groups of macroinvertebrates in neotropical streams. Hydrobiologia 556: 251–
264.
45. Brown R (1970) A Water Quality Index – Do We Dare? Water Sew Work 11:
339–343.
46. Lenat DR (1988) Water quality assessment of streams using a qualitative
collection method for benthic macroinvertebrates. J North Am Benthol Soc 7:
222–233.
47. Allan JD, Erickson DL, Fay J (1997) The influence of catchment land use on
stream integrity across multiple spatial scales. Freshw Biol 37: 149–161.
48. Harding JS, Benfield EF, Bolstad P V, Helfman GS, Jones III EBD (1998)
Stream biodiversity: The ghost of land use past. Proc Natl Acad Sci U S A 95:
14843–14847.
49. Legendre P, Gallagher E (2001) Ecologically meaningful transformations for
ordination of species data. Oecologia 129: 271–280.
50. R Development Core Team (2011) R: A language and environment for
statistical computing. R Foundation for Statistical Computing, Vienna. http://
www.r-project.org/.
51. Bocard D, Gillet F, Legendre P (2011) Numerical Ecology with R. 1st ed. New
York: Springer.
52. Harding JS, Claassen K, Evers N (2006) Can forest fragments reset physical and
water quality conditions in agricultural catchments and act as refugia for forest
stream invertebrates? Hydrobiologia 568: 391–402.
53. Suga CM, Tanaka MO (2012) Influence of a forest remnant on macroinver-
tebrate communities in a degraded tropical stream. Hydrobiologia 703: 203–
213.
54. Shandas V, Alberti M (2009) Exploring the role of vegetation fragmentation on
aquatic conditions: Linking upland with riparian areas in Puget Sound lowland
streams. Landsc Urban Plan 90: 66–75.
55. Rios SL, Bailey RC (2006) Relationship between Riparian Vegetation and
Stream Benthic Communities at Three Spatial Scales. Hydrobiologia 553: 153–
160.
56. Couceiro SRM, Hamada N, Luz SLB, Forsberg BR, Pimentel TP (2006)
Deforestation and sewage effects on aquatic macroinvertebrates in urban
streams in Manaus, Amazonas, Brazil. Hydrobiologia 575: 271–284.
57. Lecerf A, Dobson M, Dang CK, Chauvet E (2005) Riparian plant species loss
alters trophic dynamics in detritus-based stream ecosystems. Oecologia 146:
432–442.
58. Lecerf A, Richardson JS (2010) Litter decomposition can detect effects of high
and moderate levels of forest disturbance on stream condition. For Ecol Manage
259: 2433–2443.
59. James LA, Marcus WA, Harden CP (2006) Human impacts on headwater fluvial
systems in the northern and central Andes. Geomorphology 79: 249–263.
60. Molina A, Vanacker V, Balthazar V, Mora D, Govers G (2012) Complex land
cover change, water and sediment yield in a degraded Andean environment.
J Hydrol 472: 25–35.
61. Borbor-Cordova MJ, Boyer EW, McDowell WH, Hall CA (2006) Nitrogen and
phosphorus budgets for a tropical watershed impacted by agricultural land use:
Guayas, Ecuador. Biogeochemistry 79: 135–161.
62. Sarr D (2002) Riparian livestock exclosure research in the Western United
States: A critique and some recommendations. Environ Manage 30: 516–526.
63. Jones JA, Swanson FJ, Wemple BC, Snyder KU (2000) Effects of roads on
hydrology, geomorphology, and disturbance patches in stream networks.
Conserv Biol 14: 76–85.
64. Hladyz S, Kajsa A, Giller PS, Woodward G (2011) Impacts of an aggressive
riparian invader on community structure and ecosystem functioning in stream
food webs. J Appl Ecol 48: 443–452.
Deforestation and Benthic Indicators
PLOS ONE | www.plosone.org 10 August 2014 | Volume 9 | Issue 8 | e105869
Copyright © 2022 FDOKUMEN