Eastern New Mexico University Assessment Report Program
164
Eastern New Mexico University Assessment Report Program: Health and Human Services Department: CDIS Program Academic Year: 2017-2018 Prepared by: Dwayne Wilkerson, CDIS Undergraduate Program Director Dr. Suzanne Swift, CDIS Graduate Coordinator/Department Chair
-
Upload
khangminh22 -
Category
Documents
-
view
3 -
download
0
Transcript of Eastern New Mexico University Assessment Report Program

Eastern New Mexico University
Assessment Report
Program:
Health and Human Services Department: CDIS Program
Academic Year: 2017-2018
Prepared by:
Dwayne Wilkerson, CDIS Undergraduate Program Director
Dr. Suzanne Swift, CDIS Graduate Coordinator/Department Chair

1
TABLE OF CONTENTS
Executive Summary …………….………………………………….……. 3 Undergraduate Learning Objectives and Outcomes
UG Learning Objective #1……………………………….………….... 5 UG Learning Objective #2………………………………...…………... 6 UG Learning Objective #3……………………….……….…………... 7 UG Learning Objective #4………………………….…….…………... 8 UG Learning Objective #5…………………………….…………….... 9 UG Learning Objective #6………………………..…….……………... 10 UG Learning Objective #7……………………….……….…………... 11 UG Learning Objective #8……………………………………………. 12
Undergraduate Learning Outcomes by Course
CDIS 144……………………………………………………...…….…. 15 CDIS 244………………………………………………….……….…... 18 CDIS 300…………………………………………………………….…. 21 CDIS 303………………………………………………….………….… 23 CDIS 310………………………………………………….………….... 26 CDIS 311…………………………………………………………….…. 28 CDIS 320………………………………………………………………. 31 CDIS 323…………………………………………………………….…. 33 CDIS 324…………………………………………………………….…. 35 CDIS 330…………………………………………………………….…. 36 CDIS 332……………………………………………………………….. 38 CDIS 342……………………………………………………………….. 41 CDIS 400……………………………………………………………….. 43 CDIS 421……………………………………………………………….. 45 CDIS 433………………………………………………………………… 48 CDIS 434……………………………………………………………….. 50 CDIS 441……………………………………………………………….. 52 CDIS 441L………………………………………………….…………... 55 CDIS 445………………………………………………….……………. 56 CDIS 446………………………………………………….……………. 57
2
CDIS 454……………………………………………………………….. 58 CDIS 455……………………………………………….………………. 62 UG Courses in Transition…………………………………………..….. 64
Graduate Learning Outcomes and Supplemental Data GR Learning Objective #1………………………………………….….. 65 GR Learning Objective #2………………………………………….….. 65 GR Learning Objective #3………………………………………….….. 66 GR Learning Objective #4……………………………………...……... 66 Praxis Examination Category Analysis…………………………... 67 Praxis Pass Rates (5 year rates)…...………………….……….... 67 Praxis Pass Rates (Residential vs. Distance)…...........………... 68 GR Learning Objective #5………………………………………….…. 69
Program Completion Rates (4 year rates)………………….….... 70 GR Learning Objective #6………………………………….......…….. 71
Employment Rates of Graduates...…………………………….… 71 Employment Rates of Graduates (Residential vs. Distance)…. 72
Graduate Learning Outcomes by Course CDIS 500…………………………………………..……………………. 73 CDIS 504…………………………………………..……………………. 76 CDIS 511…………………………………………..……………………. 79 CDIS 512…………………………………………..……………………. 83 CDIS 516…………………………………………..……………………. 85 CDIS 517…………………………………………..……………………. 88 CDIS 525…………………………………………..……………………. 91 CDIS 526…………………………………………..……………………. 93 CDIS 527…………………………………………..……………………. 95 CDIS 528…………………………………………..……………………. 98 CDIS 529…………………………………………..……………………. 100 CDIS 540…………………………………………..……………………. 104 CDIS 550…………………………………………..……………………. 106 CDIS 554…………………………………………..……………………. 108 CDIS 557…………………………………………..……………………. 111 CDIS 560…………………………………………..……………………. 113

3
CDIS 573…………………………………………..……………………. 115 CDIS 590…………………………………………..……………………. 117
Curricular Map of Student Learning Outcomes Changes to Plan………………………………………………………... 120 Changes to Academic Process…………………………………….…. 121 Changes to Curriculum……………………………….…………….….. 122 Curricular Map……………………………………………………….….. 123
Supplemental Documentation CDIS Mission Statement…………………………………………….… 129 UG KASA Checklist………………………………………………. ….... 132 UG KASA Learning Outcomes by Course …………...….………….….. 134 Graduate KASA Checklist………………………………………….….. 148 Graduate Admissions Rubric…………………………………….……. 150 Portfolio Scoring Rubric…………………………………………….….. 153 Graduate Research Scoring Rubric …….…………………..……...... 160

4
Executive Summary
Summary: This assessment plan serves as a measure of student learning outcomes across the undergraduate and graduate
curriculum in the CDIS program. These outcome measures are used for the purpose of aggregating data that that is routinely collected
at this level for program planning, self-study reports, program review, accreditation, and the effectiveness plan. The assessment data
was analyzed in three ways, application of the learning outcomes across the program, course specific student learning outcomes, and
trend data across assessment cycles.
Results: The eight undergraduate learning objectives used in this assessment consist of foundational knowledge related to basic
human communication and swallowing processes in a specific area (e.g., biological, neurological, linguistic, acoustic, etc.). Each
learning objective was composed of curricular-based student learning outcomes that were measured in specific undergraduate courses.
The assessment results were reported based on aggregate student performance on instructor selected assessments (i.e., skills
performance, student projects, course notebooks, portfolios, scoring rubrics, graded assignments, quizzes and/or exams, etc.). The
performance criteria used to measure the undergraduate outcomes was 70% of the total number of students meeting course specific
student learning outcomes with a recommended cut-off score of 75% or higher. Across 48 core undergraduate learning outcomes, the
average percentage of students who met the 75% or higher performance criteria ranged from 77% to 100%. The mean score was 89%
as compared to 86% from the previous assessment cycle, with a standard deviation of 6.11.
The second analysis measured course specific student learning outcomes across 22 undergraduate and 18 graduate courses taught
in 96 different course sections. In addition to analyzing the data based on the percentage of total students that met course specific
measures, the data was disaggregated by instructor, course type, and length of the course. Descriptive statistics were used to compare
the results, which indicated continued variation in performance when comparing course type (in-class, synchronous/asynchronous
Mediasite, traditional online) and course length (16 weeks and 8 weeks).
A third analysis looked at trend data over the past six years based on the percentage of undergraduate students who met the 75% or
higher performance criteria by course type without regard for course length. A visual analysis of the results indicated that the greatest
percentage of undergraduate and graduate students successfully meeting learning outcomes has shifted from in-class courses to

5
Mediasite courses. This may indicate that this type of course delivery is superior to other methods, or that this finding is an artifact of
the continued increased enrollment in synchronous and asynchronous Mediasite courses. In addition, the data reflects an overall
positive trend in 83.33% of undergraduate courses assessed, based on the percentage of students meeting learning outcomes. By
course type, a positive trend was noted in 56.25% of the online WW course sections, 41.66% of the AW course sections, and 46.66%
of in-class sections.
Closing the Loop: An analysis of the assessment data indicated that the majority of undergraduate and graduate student learning
outcomes were met during this assessment cycle based on the current measures and data collection procedures. The overall results
of the assessment were positive in that the findings indicated a continued level of effectiveness in program design, curriculum
development, instructional methodologies, as well as the assessment process. These findings again confirmed the need to ensure
comparable instructional rigor and data collection methodologies between different sections of the same course. During this
assessment cycle, instructors were given the opportunity to suggest changes, additions, and/or deletions to the student learning
outcomes for their course(s) in order to make the assessment process more effective and meaningful at the instructional level. Plans
for improvement and/or modifications based on the results of the assessment and the instructor’s input include: (1) Continued revision
of student learner outcomes for CDIS 433 to determine which outcomes are essential to the course and best reflect the curricular
content. (2) Add new CDIS electives courses in the next assessment cycle that are currently being developed and/or piloted including
the development of student learning outcomes. (3) Continued review of all undergraduate learning outcomes to determine if changes
are needed or if there is overlap between courses. (4) Provide additional information and faculty training on the assessment process
to ensure that all student learning outcomes are being appropriately assessed and reported. (4) Continue analysis of trend data related
to performance variability using a variety of variables. (5) Continued revision of the online data collection instrument for greater
efficiency and effectiveness in reporting and analyzing the assessment data.

6
Eastern New Mexico University Assessment Report/Plan
Academic Units 2017-2018
Curricular Map of Undergraduate Student Learning Objectives and Outcomes
Measure = Intended student learning outcome Performance Criteria = Standard against which performance is assessed
Outcome = Result Action Taken = Use of results to improve student learning
Undergraduate Learning Objective #1
Knowledge Outcome: CDIS undergraduate students will demonstrate knowledge of basic human communication and swallowing processes including their biological bases
Gen Ed. Competency? ,X ¸No _ Yes Accreditation Objective? X No _ Yes
Measure(s)
100.1) From production through auditory reception, detail all structures and functions required to produce and perceive speech. Students must specifically identify respiratory, phonatory, resonatory, and articulatory components including variations produced in coarticulatory and connected speech contexts with longer linguistic units.
100.2) Develop and implement an oral-motor assessment protocol
100.3) Relate anatomical structure (e.g., dentition, occlusion) and function (e.g.
extension, retraction) to place, manner, and voicing descriptors for normal phoneme development/production
Performance Criteria
70% of total students will meet course specific, entry-level competency for these outcome measures, based on the results of instructor selected assessments (i.e., skills performance, student projects, course notebooks, portfolios, scoring rubrics, graded assignments, quizzes, and/or exams, with a recommended cut-off score of 75% or higher, etc.)
Population/Timeline
100.1) CDIS 300, AY 2017-18
100.2) CDIS 300, AY 2017-18
100.3) CDIS 311, AY 2017-18
Results
Outcome(s)
100.1) An average of 81.00% of total students met this outcome at ≥ 75%
100.2) An average of 88.38% of total students met this outcome at ≥ 75%
100.3) An average of 98.86% of total students met this outcome at ≥ 75%
Action(s) Taken
Continue plan unchanged
Continue plan unchanged
Continue plan unchanged
Timeline for Action(s)
100.1) AY 2018-19 100.2) AY 2018-19
100.3) AY 2018-19
7
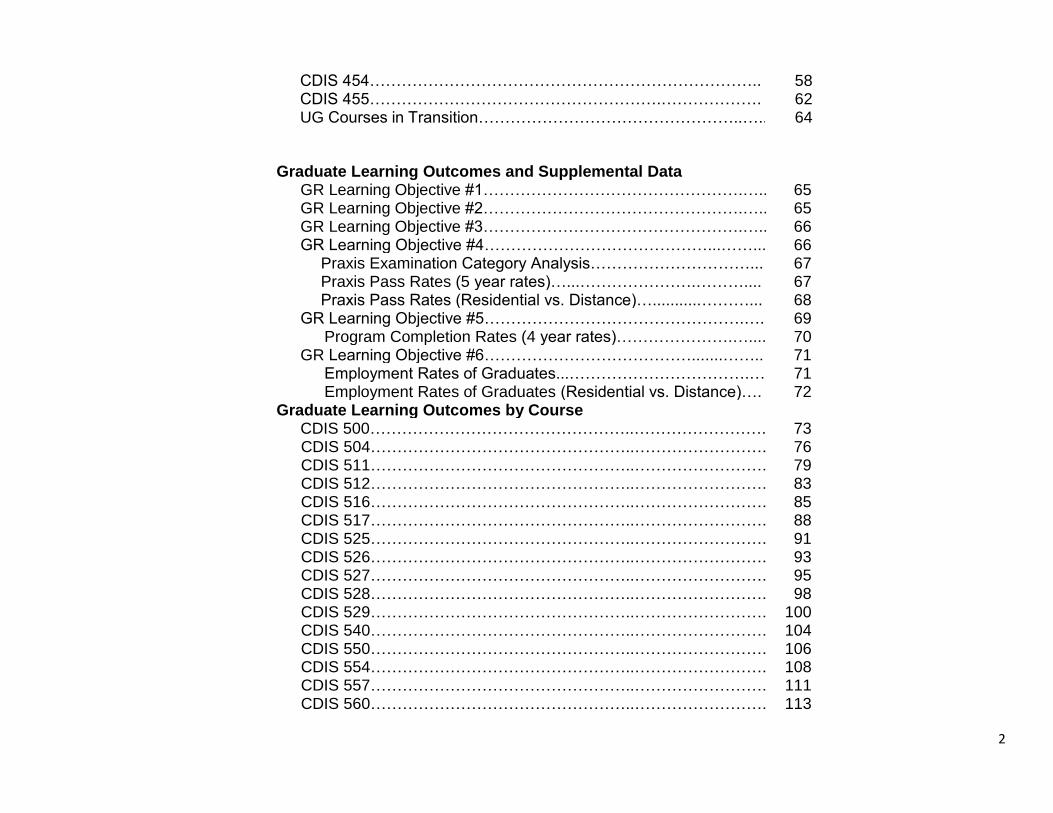
Undergraduate Learning Objective #2
Knowledge Outcome: CDIS undergraduate students will demonstrate knowledge of basic human communication and swallowing processes including their neurological bases
Gen Ed. Competency? X No _ Yes Accreditation Objective? X No _ Yes
Measure(s)
200.1) Identify and explain functions for cranial nerves 200.2) Differentiate structures within and functions of neurological systems
200.3) Identify and list functions for UMN and LMN systems
200.4) Explain the blood supply of the brain and brain stem
200.5) Identify lobes and their functions
200.6) Identify cortical structures of hearing and vision
Performance Criteria
70% of total students will meet course specific, entry-level competency for these outcome measures, based on the results of instructor selected assessments (i.e., skills performance, student projects, course notebooks, portfolios, scoring rubrics, graded assignments, quizzes, and/or exams, with a recommended cut-off score of 75% or higher, etc.)
Population/Timeline
200.1) CDIS 421, AY 2017-18 200.2) CDIS 421, AY 2017-18
200.3) CDIS 421, AY 2017-18
200.4) CDIS 421, AY 2017-18
200.5) CDIS 421, AY 2017-18
200.6) CDIS 421, AY 2017-18
Results
Outcome(s)
200.1) An average of 90.00% of total students met this outcome at ≥ 75%
200.2) An average of 85.00% of total students met this outcome at ≥ 75%
200.3) An average of 79.67% of total students met this outcome at ≥ 75%
200.4) An average of 86.17% of total students met this outcome at ≥ 75%
200.5) An average of 90.83% of total students met this outcome at ≥ 75%
200.6) An average of 86.67% of total students met this outcome at ≥ 75%
Action(s) Taken
Continue plan unchanged
Continue plan unchanged
Continue plan unchanged
Continue plan unchanged
Continue plan unchanged
Continue plan unchanged
Timeline for Action(s)
200.1) AY 2018-19 200.2) AY 2018-19
200.3) AY 2018-19
200.4) AY 2018-19
200.5) AY 2018-19 200.6) AY 2018-19

8
Undergraduate Learning Objective #3
Knowledge Outcome: CDIS undergraduate students will demonstrate knowledge of basic human communication and swallowing processes including their acoustic bases
Gen Ed. Competency? X No _ Yes Accreditation Objective? X No _ Yes
Measure(s)
300.1) Create and analyze waveforms for frequency, amplitude, and periodicity
300.2) Spectrographically analyze and identify selected vowel and consonant
sounds 300.3) Analyze voice samples for jitter, shimmer, mean harmonics-to-noise
ratio, voicing, and pitch spectrographic analysis 300.4) Define formant and describe the manner in which variations in
physiology affect formant frequencies 300.5) Demonstrate competency with basic principles of audiometric evaluation
(to include tympanometry) 300.6) Analyze and interpret audiometric Results
Performance Criteria
70% of total students will meet course specific, entry-level competency for these outcome measures, based on the results of instructor selected assessments (i.e., skills performance, student projects, course notebooks, portfolios, scoring rubrics, graded assignments, quizzes, and/or exams, with a recommended cut-off score of 75% or higher, etc.)
Population/Timeline
300.1) CDIS 400, AY 2017-18
300.2) CDIS 400, AY 2017-18
300.3) CDIS 400, AY 2017-18
300.4) CDIS 400, AY 2017-18
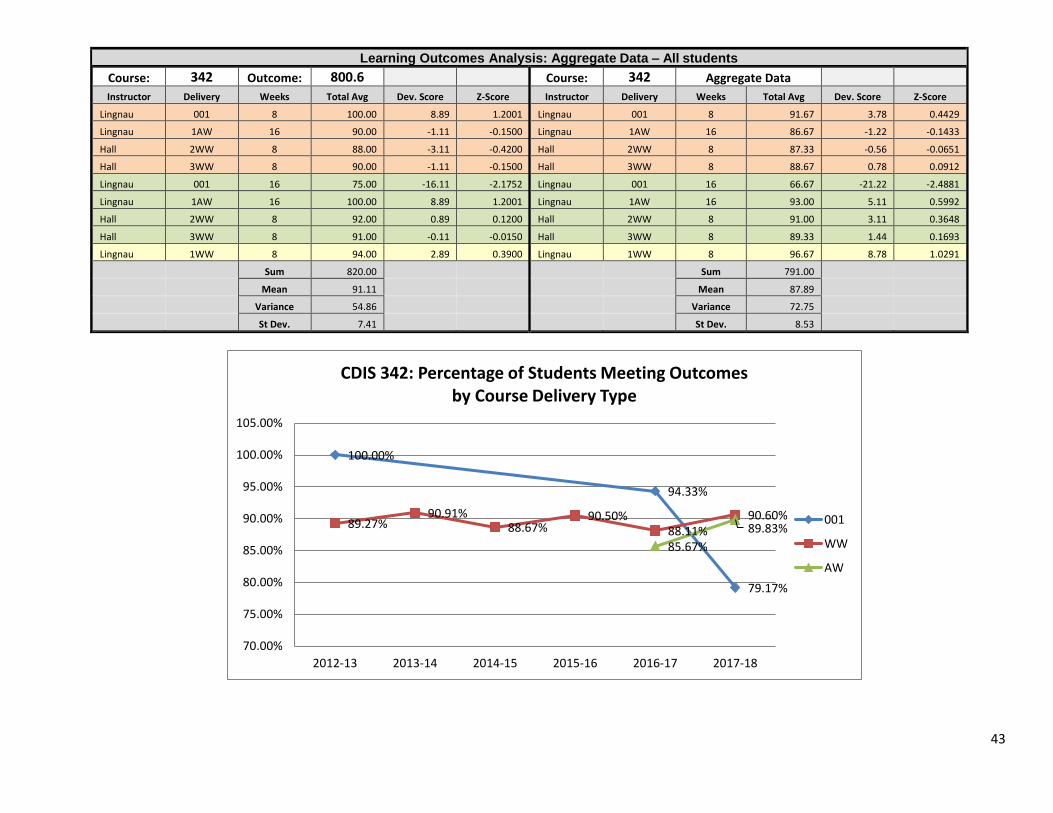
300.5) CDIS 342/446*, AY 2017-18
300.6) CDIS 342, AY 2017-18
Results
Outcome(s)
300.1) An average of 93.50% of total students met this outcome at ≥ 75%
300.2) An average of 93.50% of total students met this outcome at ≥ 75%
300.3) An average of 93.00% of total students met this outcome at ≥ 75%
300.4) An average of 91.25% of total students met this outcome at ≥ 75%
300.5) An average of 82.67%* of total students met this outcome at ≥ 75%
300.6) An average of 89.89% of total students met this outcome at ≥ 75%
*Includes data from 342 only
Action(s) Taken
Continue plan unchanged
Continue plan unchanged
Continue plan unchanged
Continue plan unchanged
Continue plan unchanged
Continue plan unchanged
Timeline for Action(s)
300.1) AY 2018-19 300.2) AY 2018-19
300.3) AY 2018-19
300.4) AY 2018-19
300.5) AY 2018-19
300.6) AY 2018-19

9
Undergraduate Learning Objective #4
Knowledge Outcome: CDIS undergraduate students will demonstrate knowledge of basic human communication and swallowing processes including their psychological bases
Gen Ed. Competency? X No _ Yes Accreditation Objective? X No _ Yes
Measure(s)
400.1) Integrate basic principles of cognitive psychology into intervention contexts
400.2) Integrate basic principles of behavior modification into intervention
contexts 400.3) Address multiple learning styles in therapeutic contexts
Performance Criteria
70% of total students will meet course specific, entry-level competency for these outcome measures, based on the results of instructor selected assessments (i.e., skills performance, student projects, course notebooks, portfolios, scoring rubrics, graded assignments, quizzes, and/or exams, with a recommended cut-off score of 75% or higher, etc.)
Population/Timeline
400.1) CDIS 441, AY 2017-18
400.2) CDIS 441, AY 2017-18
400.3) CDIS 441, AY 2017-18
Results
Outcome(s)
400.1) An average of 76.67% of total students met this outcome at ≥ 75%
400.2) An average of 98.00% of total students met this outcome at ≥ 75%
400.3) An average of 83.00% of total students met this outcome at ≥ 75%
Action(s) Taken
Continue plan unchanged
Continue plan unchanged
Continue plan unchanged
Timeline for Action(s)
400.1) AY 2018-19 400.2) AY 2018-19
400.3) AY 2018-19

10
Undergraduate Learning Objective #5
Knowledge Outcome: CDIS undergraduate students will demonstrate knowledge of basic human communication and swallowing processes including their developmental bases
Gen Ed. Competency? X No _ Yes Accreditation Objective? X No _ Yes
Measure(s)
500.1) Describe how theories of speech and language development explain the emergence of communication
Performance Criteria
70% of total students will meet course specific, entry-level competency for these outcome measures, based on the results of instructor selected assessments (i.e., skills performance, student projects, course notebooks, portfolios, scoring rubrics, graded assignments, quizzes, and/or exams, with a recommended cut-off score of 75% or higher, etc.)
Population/Timeline
500.1) CDIS 330, AY 2017-18
500.2) CDIS 330, AY 2017-18
Results
Outcome(s)
500.1) An average of 84.80% of total students met this outcome at ≥ 75%
Action(s) Taken
Continue plan unchanged
Timeline for Action(s)
500.1) AY 2018-19

11
Undergraduate Learning Objective #6
Knowledge Outcome: CDIS undergraduate students will demonstrate knowledge of basic human communication and swallowing processes including their linguistic bases
Gen Ed. Competency? X No _ Yes Accreditation Objective? X No _ Yes
Measure(s)
600.1) Differentiate the parameters of speech and language according to form, content, and use as well as phonology, morphology, syntax, semantics, and pragmatics
600.2) Transcribe normal speech sample using IPA, diacritics, syllable shapes,
and place/manner/voicing analysis 600.3) Transcribe normal language sample; Compute MLU, MLR, TTR,
semantic analysis, clause density (e.g., coordination/subordination index)
600.4) Using a normal sample, score NRT and analyze results according to
strengths/weaknesses and developmental norms 600.5) Compose Results detailing results of sample
Performance Criteria
70% of total students will meet course specific, entry-level competency for these outcome measures, based on the results of instructor selected assessments (i.e., skills performance, student projects, course notebooks, portfolios, scoring rubrics, graded assignments, quizzes, and/or exams, with a recommended cut-off score of 75% or higher, etc.)
Population/Timeline
600.1) CDIS 330, AY 2017-18
600.2) CDIS 310, AY 2017-18
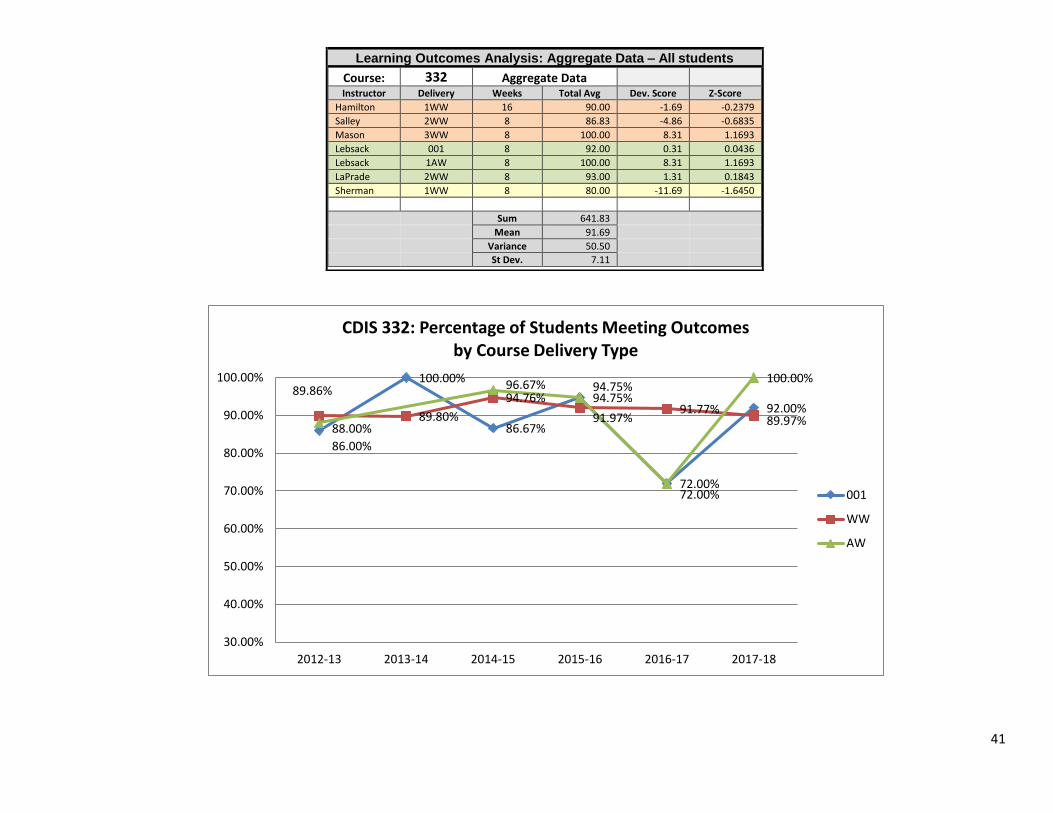
600.3) CDIS 332, AY 2017-18
600.4) CDIS 311/332*, AY 2017-18
600.5) CDIS 332, AY 2017-18
Results
Outcome(s)
600.1) An average of 78.40% of total students met this outcome at ≥ 75%
600.2) An average of 86.25% of total students met this outcome at ≥ 75%
600.3) An average of 89.86% of total students met this outcome at ≥ 75%
600.4) An average of 92.85%* of total students met this outcome at ≥ 75%
600.5) An average of 93.43% of total students met this outcome at ≥ 75%
*Includes data from two courses
Action(s) Taken
Continue plan unchanged
Continue plan unchanged
Continue plan unchanged
Continue plan unchanged
Continue plan unchanged
Timeline for Action(s)
600.1) AY 2018-19 600.2) AY 2018-19
600.3) AY 2018-19
600.4) AY 2018-19
600.5) AY 2018-19

12
Undergraduate Learning Objective #7
Knowledge Outcome: CDIS undergraduate students will demonstrate knowledge of basic human communication and swallowing processes including their cultural bases
Gen Ed. Competency? X No _ Yes Accreditation Objective? X No _ Yes
Measure(s)
700.1) Describe impact of and modifications necessary for successful interactions with diverse multicultural clientele
700.2) Describe impact of and modifications necessary for successful
assessment with diverse multicultural clientele
Performance Criteria
70% of total students will meet course specific, entry-level competency for these outcome measures, based on the results of instructor selected assessments (i.e., skills performance, student projects, course notebooks, portfolios, scoring rubrics, graded assignments, quizzes, and/or exams, with a recommended cut-off score of 75% or higher, etc.)
Population/Timeline
700.1) CDIS 441, AY 2017-18
700.2) CDIS 454, AY 2017-18
Results
Outcome(s)
700.1) An average of 90% of total students met this outcome at ≥ 75%
700.2) An average of 85.50% of total students met this outcome at ≥ 75%
Action(s) Taken
Continue plan unchanged
Continue plan unchanged
Timeline for Action(s)
700.1) AY 2018-19 700.2) AY 2018-19

13
Undergraduate Learning Objective #8
Knowledge Outcome: CDIS undergraduate students will demonstrate knowledge of disordered communication at the pre-professional level
Gen Ed. Competency? X No _ Yes Accreditation Objective? X No _ Yes
Measure(s)
800.1) Transcribe disordered speech sample using IPA, diacritics, syllable shapes, and place/manner/voicing analysis; relate to developmental norms
800.2) Relate anatomical structure (e.g., dentition, occlusion) and function (e.g., hyper/hypo) to pattern of error
800.3) Transcribe disordered language sample; Compute MLU, MLR, TTR,
semantic analysis, clause density (e.g., coordination/subordination index); relate to developmental norms
800.4) Describe common etiologies and characteristics of speech and
language disorders 800.5) Explain basic differences in delay vs. disorder vs. difference in speech
and language profiles 800.6) Relate type of hearing loss to anatomical structure and function
800.7) Discriminate and describe amplification systems
800.8) Discriminate and describe communication methods for deaf and HOH individuals
800.9) Match amplification and communication method to client need based on
type and degree of loss in conjunction with communication profile 800.10) Discriminate and explain various intervention models for addressing
speech and language disorders
800.11) Use elementary principles of EBP to justify decision making process
800.12S) Using a disordered sample, score NRT and analyze results
according to strengths/weaknesses and developmental norms (Speech) 800.12L) Using a disordered sample, score NRT and analyze results according
to strengths/weaknesses and developmental norms (Language)
Performance Criteria
70% of total students will meet course specific, entry-level competency for these outcome measures, based on the results of instructor selected assessments (i.e., skills performance, student projects, course notebooks, portfolios, scoring rubrics, graded assignments, quizzes, and/or exams, with a recommended cut-off score of 75% or higher, etc.)
Population/Timeline
800.1) CDIS 311, AY 2017-18
800.2) CDIS 311, AY 2017-18
800.3) CDIS 332, AY 2017-18
800.4) CDIS 311/332*, AY 2017-18
800.5) CDIS 311/332*, AY 2017-18
800.6) CDIS 342, AY 2017-18
800.7) CDIS 434, AY 2017-18
800.8) CDIS 434, AY 2017-18
800.9) CDIS 434, AY 2017-18
800.10) CDIS 441, AY 2017-18
800.11) CDIS 441, AY 2017-18
800.12S) CDIS 454, AY 2017-18
800.12L) CDIS 454, AY 2017-18

14
Undergraduate Learning Objective #8 (Cont.)
Measure(s)
800.13) Complete syllable shape, positional, and place/manner/voice analysis; identify error types (SODA), pattern of error, intelligibility index, and phonetic inventory
800.14) Integrate and analyze findings from case history (social, educational,
medical, etc.), oral motor structure and function, articulatory and phonological assessments, receptive/expressive language in all parameters (syntax, morphology, semantics, pragmatics, narrative, problem solving, etc.), auditory skills, literacy, dynamic assessment, cultural/linguistic variables
800.15S) Compose Results detailing results of sample; provide preliminary
diagnosis, eligibility, statement of functional need, and prognosis; select and construct goals/objectives in order of target need; recommend treatment approach to include modifications; MUST BE SUPPORTED BY REFERREED EBP (Speech)
800.15L) Compose Results detailing results of sample; provide preliminary
diagnosis, eligibility, statement of functional need, and prognosis; select and construct goals/objectives in order of target need; recommend treatment approach to include modifications; MUST BE SUPPORTED BY REFERREED EBP (Language)
800.16) Apply the ASHA COE to case-based situations
800.17) Explain scope of practice, legal policy, etc.
800.18) Complete clinical observations as assigned
800.19) Complete clinical application assignments
800.20) Prepare an informational session on communicative disorders
Performance Criteria
70% of total students will meet course specific, entry-level competency for these outcome measures, based on the results of instructor selected assessments (i.e., skills performance, student projects, course notebooks, portfolios, scoring rubrics, graded assignments, quizzes, and/or exams, with a recommended cut-off score of 75% or higher, etc.)
Population/Timeline
800.13) CDIS 454, AY 2017-18
800.14) CDIS 454, AY 2017-18
800.15S) CDIS 454, AY 2017-18
800.15L) CDIS 454, AY 2017-18
800.16) CDIS 441, AY 2017-18
800.17) CDIS 441, AY 2017-18
800.18) CDIS 441L, AY 2017-18
800.19) CDIS 441, AY 2017-18
800.20) CDIS 441, AY 2017-18
Results
Outcome(s)
800.1) An average of 96.50% of total students met this outcome at ≥ 75%
800.2) An average of 96.57% of total students met this outcome at ≥ 75%
800.3) An average of 89.29% of total students met this outcome at ≥ 75%
Action(s) Taken
Continue plan unchanged
Continue plan unchanged
Continue plan unchanged
Timeline for Action(s)
800.1) AY 2018-19 800.2) AY 2018-19
800.3) AY 2018-19

15
Results (Cont.)
Outcome(s)
800.4) An average of 95.85%* of total students met this outcome at ≥ 75%
800.5) An average of 96.28%* of total students met this outcome at ≥ 75%
800.6) An average of 91.11% of total students met this outcome at ≥ 75%
800.7) An average of 91.57% of total students met this outcome at ≥ 75%
800.8) An average of 84.00% of total students met this outcome at ≥ 75%
800.9) An average of 91.71% of total students met this outcome at ≥ 75%
800.10) An average of 87.00% of total students met this outcome at ≥ 75%
800.11) An average of 100% of total students met this outcome at ≥ 75%
800.12S) An average of 83.00 of total students met this outcome at ≥ 75%
800.12L) An average of 84.67% of total students met this outcome at ≥ 75%
800.13) An average of 83.83% of total students met this outcome at ≥ 75%
800.14) An average of 80.17% of total students met this outcome at ≥ 75%
800.15S) An average of 80.67% of total students met this outcome at ≥ 75%
800.15L) An average of 82.50% of total students met this outcome at ≥ 75%
800.16) An average of 87.67% of total students met this outcome at ≥ 75%
800.17) An average of 94.33% of total students met this outcome at ≥ 75%
800.18) An average of 93.00% of total students met this outcome at ≥ 75%
800.19) An average of 98.67% of total students met this outcome at ≥ 75%
800.20) An average of 100% of total students met this outcome at ≥ 75%
*Includes data from two courses
Action(s) Taken
Continue plan unchanged
Continue plan unchanged
Continue plan unchanged
Continue plan unchanged
Continue plan unchanged
Continue plan unchanged
Continue plan unchanged
Continue plan unchanged
Continue plan unchanged
Continue plan unchanged
Continue plan unchanged
Continue plan unchanged
Continue plan unchanged
Continue plan unchanged
Continue plan unchanged
Continue plan unchanged
Continue plan unchanged
Continue plan unchanged
Continue plan unchanged
Timeline for Action(s)
800.4) AY 2018-19 800.5) AY 2018-19
800.6) AY 2018-19
800.7) AY 2018-19
800.8) AY 2018-19
800.9) AY 2018-19
800.10) AY 2018-19
800.11) AY 2018-19
800.12S) AY 2018-19
800.12S) AY 2018-19
800.13) AY 2018-19
800.14) AY 2018-19
800.15) AY 2018-19
800.15) AY 2018-19
800.16) AY 2018-19
800.17) AY 2018-19
800.18) AY 2018-19
800.19) AY 2018-19
800.20) AY 2018-19

16
Curricular Map of Undergraduate Student Learning Outcomes
by Individual Course and Course Type
Measure = Intended student learning outcome Performance Criteria = Standard against which performance is assessed
Outcome = Result Data Sources = Methodologies for collecting outcomes data
Color Key: FALL SPRING SUMMER Data Collection Format: Assessment Data Surveys
CDIS 144 Introduction to ASL
Measure(s)
CDIS 144.001) Acquire a working knowledge of foundational ASL signs, fingerspelling, and numbers.
CDIS 144.002) Demonstrate beginning receptive/expressive signing skills and ASL interpreting.
CDIS 144.003) Demonstrate basic knowledge about ASL as a language related to linguistic structure and function.
CDIS 144.004) Demonstrate basic knowledge about Deaf culture related the arts (Deaf literary forms, art, music, theatre, and dance).
CDIS 144.005) Demonstrate basic knowledge about Deaf culture related to Deaf history and cultural oppression.
CDIS 144.006) Demonstrate basic knowledge about Deaf culture related to Deaf history and cultural advancements related to technology.
CDIS 144.007) Demonstrate basic knowledge about Deaf culture including controversies related hearing loss/deafness, Deaf education, and the Deaf community.
Data Sources
Quiz/Exam/Skills performance
Quiz/Exam/Skills performance
Quiz/Exam/Skills performance
Exam/Paper/Essay
Exam/Paper/Essay
Exam/Paper/Essay
Exam/Paper/Essay
Performance Criteria
70% of total students will meet course specific, entry-level competency for these outcome measures, based on the results of instructor selected assessments (i.e., skills performance, student projects, course notebooks, portfolios, scoring rubrics, graded assignments, quizzes, and/or exams, with a recommended cut-off score of 75% or higher, etc.)
Population/Timeline
CDIS 144, AY 2017-18
Gen Ed. Competency? _ No X Yes
17
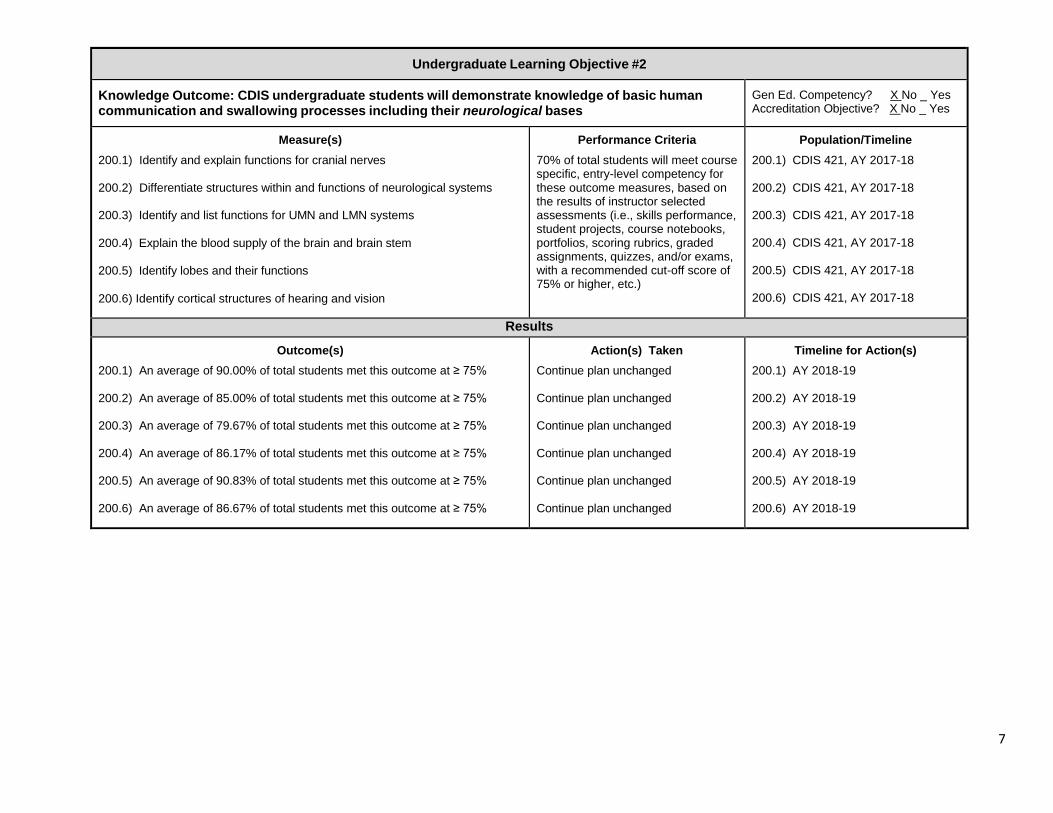
Learning Outcomes Analysis: Aggregate Data – All students
Course: 144 Outcome: 144.001
Instructor Delivery Weeks Total Avg Dev. Score Z-Score
Gray 001 16 90.00 1.00 0.8660
Gray 002 16 88.00 -1.00 -0.8660
Gray 001 16 90.00 1.00 0.8660
Gray 002 16 88.00 -1.00 -0.8660
Sum 356.00
Mean 89.00
Variance 1.33
St Dev. 1.15
Course: 144 Outcome: 144.002 Instructor Delivery Weeks Total Avg Dev. Score Z-Score
Gray 001 16 100.00 2.50 0.5000
Gray 002 16 100.00 2.50 0.5000
Gray 001 16 90.00 -7.50 -1.5000
Gray 002 16 100.00 2.50 0.5000
Sum 390.00
Mean 97.50
Variance 25.00
St Dev. 5.00
Learning Outcomes Analysis: Aggregate Data – All students
Course: 144 Outcome: 144.003
Instructor Delivery Weeks Total Avg Dev. Score Z-Score
Gray 001 16 90.00 2.00 1.2247
Gray 002 16 88.00 0.00 0.0000
Gray 001 16 86.00 -2.00 -1.2247
Gray 002 16 88.00 0.00 0.0000
Sum 352.00
Mean 88.00
Variance 2.67
St Dev. 1.63
Course: 144 Outcome: 144.004
Instructor Delivery Weeks Total Avg Dev. Score Z-Score
Gray 001 16 90.00 0.25 0.1987
Gray 002 16 91.00 1.25 0.9934
Gray 001 16 90.00 0.25 0.1987
Gray 002 16 88.00 -1.75 -1.3908
Sum 359.00
Mean 89.75
Variance 1.58
St Dev. 1.26
Learning Outcomes Analysis: Aggregate Data – All students
Course: 144 Outcome: 144.005
Instructor Delivery Weeks Total Avg Dev. Score Z-Score
Gray 001 16 90.00 0.25 0.0319
Gray 002 16 100.00 10.25 1.3061
Gray 001 16 81.00 -8.75 -1.1150
Gray 002 16 88.00 -1.75 -0.2230
Sum 359.00
Mean 89.75
Variance 61.58
St Dev. 7.85
Course: 144 Outcome: 144.006
Instructor Delivery Weeks Total Avg Dev. Score Z-Score
Gray 001 16 100.00 11.50 1.2236
Gray 002 16 89.00 0.50 0.0532
Gray 001 16 77.00 -11.50 -1.2236
Gray 002 16 88.00 -0.50 -0.0532
Sum 354.00
Mean 88.50
Variance 88.33
St Dev. 9.40

18
88.70%
85.50%
88.36%
75.32%
88.86%
72.71%
88.50%
70.00%
80.00%
90.00%
100.00%
2013-14 2014-15 2015-15 2016-17 2017-18
CDIS 144: Percentage of Students Meeting Outcomesby Course Delivery Type
001
002
Learning Outcomes Analysis: Aggregate Data – All students
Course: 144 Outcome: 144.007
Instructor Delivery Weeks Total Avg Dev. Score Z-Score
Gray 001 16 85.00 6.75 0.4337
Gray 002 16 55.00 -23.25 -1.4938
Gray 001 16 85.00 6.75 0.4337
Gray 002 16 88.00 9.75 0.6264
Sum 313.00
Mean 78.25
Variance 242.25
St Dev. 15.56
Course: 144 Aggregate Data
Instructor Delivery Weeks Total Avg Dev. Score Z-Score
Gray 001 16 92.14 3.46 1.2081
Gray 002 16 87.29 -1.39 -0.4857
Gray 001 16 85.57 -3.11 -1.0836
Gray 002 16 89.71 1.04 0.3612
Sum 354.71
Mean 88.68
Variance 8.22
St Dev. 2.87

19
CDIS 244 ASL I
Measure(s)
CDIS 244.001) Acquire a working knowledge of foundational ASL signs, fingerspelling, and numbers at an intermediate level. CDIS 244.002) Demonstrate intermediate receptive/expressive signing skills and ASL interpreting. CDIS 244.003) Demonstrate intermediate knowledge about ASL as a language related to linguistic structure and function. CDIS 244.004) Demonstrate enhanced knowledge about Deaf culture related the arts (Deaf literary forms, art, music, theatre, and dance) at an intermediate level. CDIS 244.005) Demonstrate enhanced knowledge about Deaf culture related to Deaf history and cultural oppression at an intermediate level. CDIS 244.006) Demonstrate enhanced knowledge about Deaf culture related to Deaf history and cultural advancements related to technology at an intermediate level. CDIS 244.007) Demonstrate enhanced knowledge about Deaf culture including controversies related hearing loss/deafness, Deaf education, and the Deaf community at an intermediate level.
Data Sources
Quiz/Exam/Skills performance
Quiz/Exam/Skills performance
Quiz/Exam/Skills performance
Exam/Paper/Essay
Exam/Paper/Essay
Exam/Paper/Essay
Exam/Paper/Essay
Performance Criteria
70% of total students will meet course specific, entry-level competency for these outcome measures, based on the results of instructor selected assessments (i.e., skills performance, student projects, course notebooks, portfolios, scoring rubrics, graded assignments, quizzes, and/or exams, with a recommended cut-off score of 75% or higher, etc.)
Population/Timeline
CDIS 244, AY 2017-18
Gen Ed. Competency? _ No X Yes
Learning Outcomes Analysis: Aggregate Data – All students
Course: 244 Outcome: 244.001
Instructor Delivery Weeks Total Avg Dev. Score Z-Score
Gray 001 16 88.00 0.00
Sum 88.00
Mean 88.00
Variance
St Dev.
Course: 244 Outcome: 244.002
Instructor Delivery Weeks Total Avg Dev. Score Z-Score
Gray 001 16 100.00 0.00
Sum 100.00
Mean 100.00
Variance
St Dev.

20
Learning Outcomes Analysis: Aggregate Data – All students
Course: 244 Outcome: 244.005
Instructor Delivery Weeks Total Avg Dev. Score Z-Score
Gray 001 16 100.00 0.00
Sum 100.00
Mean 100.00
Variance
St Dev.
Course: 244 Outcome: 244.006
Instructor Delivery Weeks Total Avg Dev. Score Z-Score
Gray 001 16 88.00 0.00
Sum 88.00
Mean 88.00
Variance
St Dev.
Learning Outcomes Analysis: Aggregate Data – All students
Course: 244 Outcome: 244.007
Instructor Delivery Weeks Total Avg Dev. Score Z-Score
Gray 001 16 100.00 0.00
Sum 100.00
Mean 100.00
Variance
St Dev.
Course: 244 Aggregate Data
Instructor Delivery Weeks Total Avg Dev. Score Z-Score
Gray 001 16 93.14 0.00
Sum 93.14
Mean 93.14
Variance
St Dev.
Learning Outcomes Analysis: Aggregate Data – All students
Course: 244 Outcome: 244.003
Instructor Delivery Weeks Total Avg Dev. Score Z-Score
Gray 001 16 88.00 0.00
Sum 88.00
Mean 88.00
Variance
St Dev.
Course: 244 Outcome: 244.004
Instructor Delivery Weeks Total Avg Dev. Score Z-Score
Gray 001 16 88.00 0.00
Sum 88.00
Mean 88.00
Variance
St Dev.

21
90.00%
84.14%82.86%
93.14%
80.00%
85.00%
90.00%
95.00%
100.00%
2014-15 2015-16 2016-17 2017-18
CDIS 244 : Percentage of Students Meeting Outcomesby Course Delivery Type
001

22
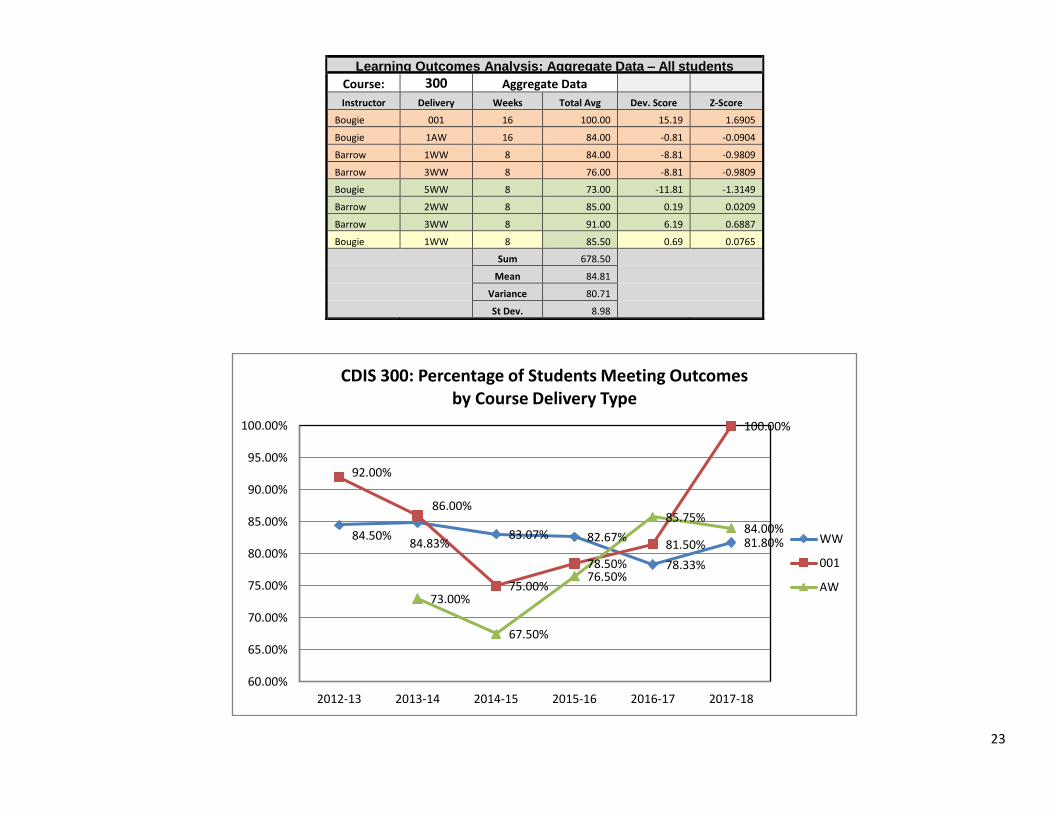
CDIS 300 Speech-Language-Hearing Anatomy and Physiology
Measure(s)
100.1) From production through auditory reception, detail all structures and functions required to produce and perceive speech. Students must specifically identify respiratory, phonatory, resonatory, and articulatory components including variations produced in coarticulatory and connected speech contexts with longer linguistic units.
100.2) Develop and implement an oral-motor assessment protocol
Data Sources
Paper/Essay
Protocol
Performance Criteria
70% of total students will meet course specific, entry-level competency for these outcome measures, based on the results of instructor selected assessments (i.e., skills performance, student projects, course notebooks, portfolios, scoring rubrics, graded assignments, quizzes, and/or exams, with a recommended cut-off score of 75% or higher, etc.)
Population/Timeline
CDIS 300, AY 2017-18
Learning Outcomes Analysis: Aggregate Data – All students
Course: 300 Outcome: 100.1
Instructor Delivery Weeks Total Avg Dev. Score Z-Score
Bougie 001 16 100.00 19.00 1.5740
Bougie 1AW 16 82.00 1.00 0.0828
Barrow 1WW 8 75.00 -6.00 -0.4971
Barrow 3WW 8 60.00 -21.00 -1.7397
Bougie 1WW 16 73.00 -8.00 -0.6627
Barrow 2WW 8 82.00 1.00 0.0828
Barrow 3WW 8 91.00 10.00 0.8284
Bougie 1WW 8 85.00 4.00 0.3314
Sum 648.00
Mean 81.00
Variance 145.71
St Dev. 12.07
Course: 300 Outcome: 100.2
Instructor Delivery Weeks Total Avg Dev. Score Z-Score
Bougie 001 16 100.00 11.63 1.5192
Bougie 1AW 16 86.00 -2.38 -0.3104
Barrow 1WW 8 91.00 2.63 0.3430
Barrow 3WW 8 92.00 3.63 0.4737
Bougie 5WW 8 73.00 -15.38 -2.0093
Barrow 2WW 8 88.00 -0.38 -0.0490
Barrow 3WW 8 91.00 2.63 0.3430
Bougie 1WW 8 86.00 -2.38 -0.3104
Sum 707.00
Mean 88.38
Variance 58.55
St Dev. 7.65
23
Learning Outcomes Analysis: Aggregate Data – All students
Course: 300 Aggregate Data
Instructor Delivery Weeks Total Avg Dev. Score Z-Score
Bougie 001 16 100.00 15.19 1.6905
Bougie 1AW 16 84.00 -0.81 -0.0904
Barrow 1WW 8 84.00 -8.81 -0.9809
Barrow 3WW 8 76.00 -8.81 -0.9809
Bougie 5WW 8 73.00 -11.81 -1.3149
Barrow 2WW 8 85.00 0.19 0.0209
Barrow 3WW 8 91.00 6.19 0.6887
Bougie 1WW 8 85.50 0.69 0.0765
Sum 678.50
Mean 84.81
Variance 80.71
St Dev. 8.98
84.50%84.83%
83.07% 82.67%
78.33%
81.80%
92.00%
86.00%
75.00%
78.50%
81.50%
100.00%
73.00%
67.50%
76.50%
85.75%84.00%
60.00%
65.00%
70.00%
75.00%
80.00%
85.00%
90.00%
95.00%
100.00%
2012-13 2013-14 2014-15 2015-16 2016-17 2017-18
CDIS 300: Percentage of Students Meeting Outcomesby Course Delivery Type
WW
001
AW
24
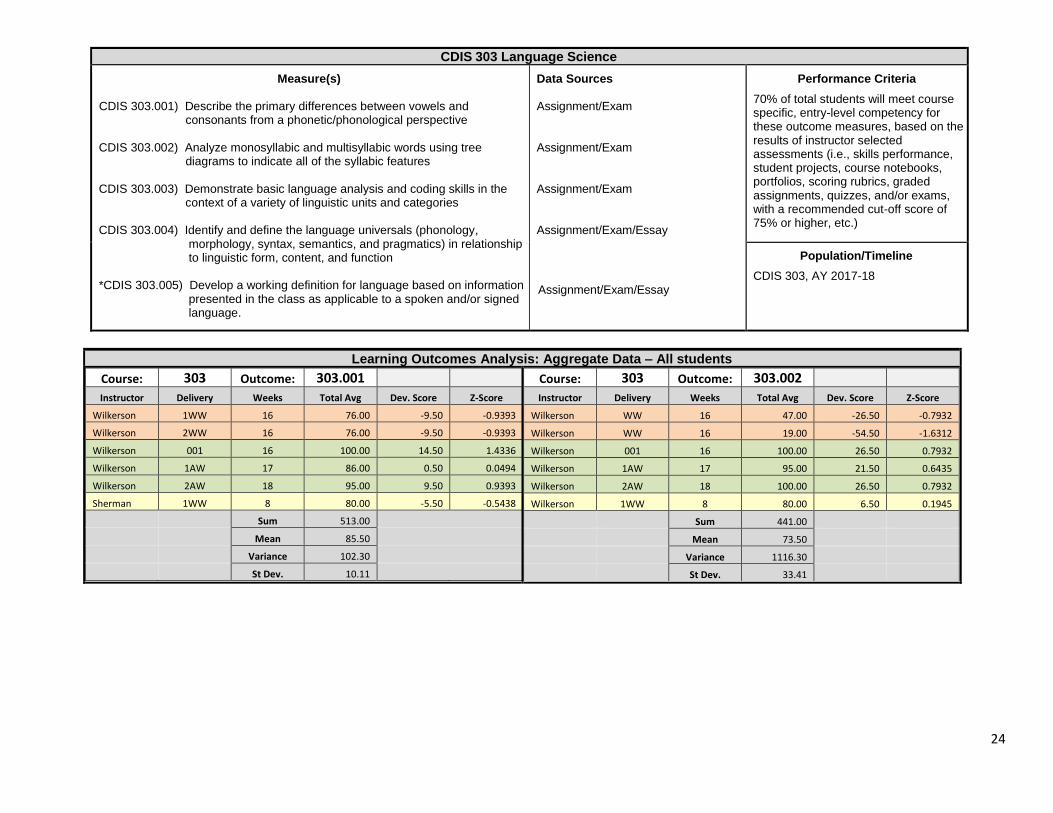
CDIS 303 Language Science
Measure(s)
CDIS 303.001) Describe the primary differences between vowels and consonants from a phonetic/phonological perspective CDIS 303.002) Analyze monosyllabic and multisyllabic words using tree diagrams to indicate all of the syllabic features CDIS 303.003) Demonstrate basic language analysis and coding skills in the context of a variety of linguistic units and categories CDIS 303.004) Identify and define the language universals (phonology, morphology, syntax, semantics, and pragmatics) in relationship to linguistic form, content, and function *CDIS 303.005) Develop a working definition for language based on information presented in the class as applicable to a spoken and/or signed language.
Data Sources Assignment/Exam Assignment/Exam Assignment/Exam Assignment/Exam/Essay
Assignment/Exam/Essay
Performance Criteria
70% of total students will meet course specific, entry-level competency for these outcome measures, based on the results of instructor selected assessments (i.e., skills performance, student projects, course notebooks, portfolios, scoring rubrics, graded assignments, quizzes, and/or exams, with a recommended cut-off score of 75% or higher, etc.)
Population/Timeline
CDIS 303, AY 2017-18
Learning Outcomes Analysis: Aggregate Data – All students
Course: 303 Outcome: 303.001
Instructor Delivery Weeks Total Avg Dev. Score Z-Score
Wilkerson 1WW 16 76.00 -9.50 -0.9393
Wilkerson 2WW 16 76.00 -9.50 -0.9393
Wilkerson 001 16 100.00 14.50 1.4336
Wilkerson 1AW 17 86.00 0.50 0.0494
Wilkerson 2AW 18 95.00 9.50 0.9393
Sherman 1WW 8 80.00 -5.50 -0.5438
Sum 513.00
Mean 85.50
Variance 102.30
St Dev. 10.11
Course: 303 Outcome: 303.002
Instructor Delivery Weeks Total Avg Dev. Score Z-Score
Wilkerson WW 16 47.00 -26.50 -0.7932
Wilkerson WW 16 19.00 -54.50 -1.6312
Wilkerson 001 16 100.00 26.50 0.7932
Wilkerson 1AW 17 95.00 21.50 0.6435
Wilkerson 2AW 18 100.00 26.50 0.7932
Wilkerson 1WW 8 80.00 6.50 0.1945
Sum 441.00
Mean 73.50
Variance 1116.30
St Dev. 33.41

25
Learning Outcomes Analysis: Aggregate Data – All students
Course: 303 Outcome: 303.003
Instructor Delivery Weeks Total Avg Dev. Score Z-Score
Wilkerson WW 16 61.00 -5.50 -0.1157
Wilkerson WW 16 78.00 11.50 0.2418
Wilkerson 001 16 44.00 44.00 0.9253
Wilkerson 1AW 17 68.00 76.00 1.5983
Wilkerson 2AW 18 68.00 57.00 1.1987
Wilkerson 1WW 8 80.00 13.50 0.2839
Sum 399.00
Mean 66.50
Variance 2261.15
St Dev. 47.55
Course: 303 Outcome: 303.004
Instructor Delivery Weeks Total Avg Dev. Score Z-Score
Wilkerson WW 16 94.00 -0.67 -0.0859
Wilkerson WW 16 100.00 5.33 0.6870
Wilkerson 001 16 100.00 5.33 0.6870
Wilkerson 1AW 17 100.00 5.33 0.6870
Wilkerson 2AW 18 94.00 -0.67 -0.0859
Wilkerson 1WW 8 80.00 -14.67 -1.8893
Sum 568.00
Mean 94.67
Variance 60.27
St Dev. 7.76
Learning Outcomes Analysis: Aggregate Data – All students
Course: 303 Outcome: 303.005
Instructor Delivery Weeks Total Avg Dev. Score Z-Score
Wilkerson WW 16 100.00 3.33 0.4082
Wilkerson WW 16 100.00 3.33 0.4082
Wilkerson 001 16 100.00 3.33 0.4082
Wilkerson 1AW 17 100.00 3.33 0.4082
Wilkerson 2AW 18 100.00 3.33 0.4082
Wilkerson 1WW 8 80.00 -16.67 -2.0412
Sum 580.00
Mean 96.67
Variance 66.67
St Dev. 8.16
Course: 303 Aggregate Data
Instructor Delivery Weeks Total Avg Dev. Score Z-Score
Wilkerson WW 16 75.60 -7.77 -1.0306
Wilkerson WW 16 74.60 -8.77 -1.1633
Wilkerson 001 16 88.80 5.43 0.7210
Wilkerson 1AW 17 89.80 6.43 0.8537
Wilkerson 2AW 18 91.40 8.03 1.0660
Wilkerson 1WW 8 80.00 -3.37 -0.4467
Sum 500.20
Mean 83.37
Variance 56.79
St Dev. 7.54

26
91.00%
79.00%
89.43%
81.00%
88.80%
93.33%
82.50%
86.64%
80.30%
90.60%
86.47%
97.68%
89.47%
76.73%75.00%
80.00%
85.00%
90.00%
95.00%
100.00%
2013-14 2014-15 2015-16 2016-17 2017-18
CDIS 303: Percentage of Students Meeting Outcomesby Course Delivery Type
001
AW
WW
27
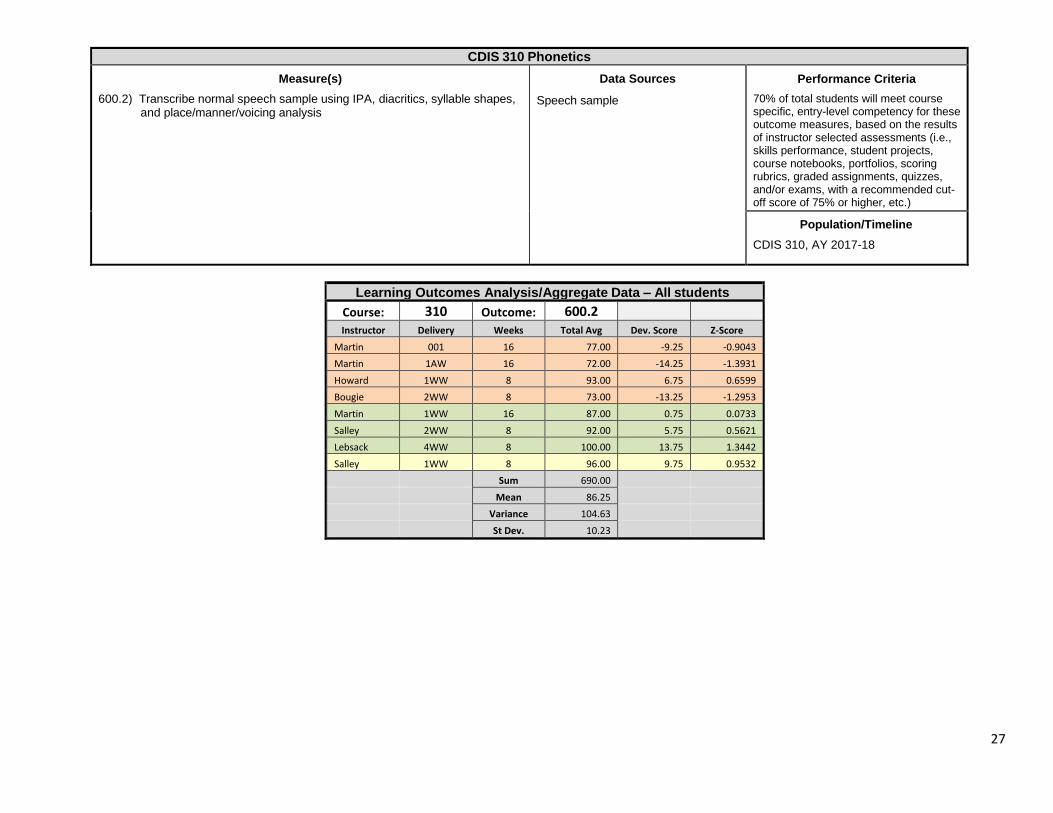
CDIS 310 Phonetics
Measure(s)
600.2) Transcribe normal speech sample using IPA, diacritics, syllable shapes, and place/manner/voicing analysis
Data Sources
Speech sample
Performance Criteria
70% of total students will meet course specific, entry-level competency for these outcome measures, based on the results of instructor selected assessments (i.e., skills performance, student projects, course notebooks, portfolios, scoring rubrics, graded assignments, quizzes, and/or exams, with a recommended cut-off score of 75% or higher, etc.)
Population/Timeline
CDIS 310, AY 2017-18
Learning Outcomes Analysis/Aggregate Data – All students
Course: 310 Outcome: 600.2
Instructor Delivery Weeks Total Avg Dev. Score Z-Score
Martin 001 16 77.00 -9.25 -0.9043
Martin 1AW 16 72.00 -14.25 -1.3931
Howard 1WW 8 93.00 6.75 0.6599
Bougie 2WW 8 73.00 -13.25 -1.2953
Martin 1WW 16 87.00 0.75 0.0733
Salley 2WW 8 92.00 5.75 0.5621
Lebsack 4WW 8 100.00 13.75 1.3442
Salley 1WW 8 96.00 9.75 0.9532
Sum 690.00
Mean 86.25
Variance 104.63
St Dev. 10.23

28
92.00%
80.00%
92.00%
90.00%
80.00%
77.00%
92.16%
90.25% 91.25%
95.20%
98.00%
90.16%
85.00%
90.00%
85.00%
72.00%70.00%
75.00%
80.00%
85.00%
90.00%
95.00%
100.00%
2012-13 2013-14 2014-15 2015-16 2016-17 2017-18
CDIS 310: Percentage of Students Meeting Outcomesby Course Delivery Type
001
WW
AW

29
CDIS 311 Articulation Disorders
Measure(s)
100.3) Relate anatomical structure (e.g., dentition, occlusion and function (e.g. extension, retraction to place, manner, and voicing descriptors for normal phoneme development/production
600.4) Using a normal sample, score NRT and analyze results according to
strengths/weaknesses and developmental norms 600.5) Compose report detailing results of sample
800.1) Transcribe disordered speech sample using IPA, diacritics, syllable
shapes, and place/manner/voicing analysis; relate to developmental norms
800.2) Relate anatomical structure (e.g., dentition, occlusion and function (e.g.,
hyper/hypo to pattern of error 800.4) Describe common etiologies and characteristics of speech and
language disorders 800.5) Explain basic differences in delay vs. disorder vs. difference in speech
and language profiles
Data Sources
Chart/Exam
GFTA/APP Analysis
Articulation Report
Speech sample
Assessment Report
Exam/Paper/Essay
Case based exercises
Performance Criteria
70% of total students will meet course specific, entry-level competency for these outcome measures, based on the results of instructor selected assessments (i.e., skills performance, student projects, course notebooks, portfolios, scoring rubrics, graded assignments, quizzes, and/or exams, with a recommended cut-off score of 75% or higher, etc.)
Population/Timeline
CDIS 311, AY 2017-18
Learning Outcomes Analysis: Aggregate Data – All students
Course: 311 Outcome: 100.3
Instructor Delivery Weeks Total Avg Dev. Score Z-Score
Mason 1WW 8 98.00 -0.86 -0.5447
Lebsack 2WW 16 100.00 1.14 0.7263
LaPrade 3WW 8 96.00 -2.86 -1.8157
Lebsack 001 16 100.00 1.14 0.7263
Lebsack 1AW 16 100.00 1.14 0.7263
Salley 2WW 8 100.00 1.14 0.7263
LaPrade 1WW 8 98.00 -0.86 -0.5447
Sum 692.00
Mean 98.86
Variance 2.48
St Dev. 1.57
Course: 311 Outcome: 600.4
Instructor Delivery Weeks Total Avg Dev. Score Z-Score
Mason 1WW 16 98.00 1.86 0.2884
Lebsack 2WW 8 100.00 3.86 0.5989
LaPrade 3WW 8 96.00 -0.14 -0.0222
Lebsack 001 8 100.00 3.86 0.5989
Lebsack 1AW 16 100.00 3.86 0.5989
Salley 2WW 16 82.00 -14.14 -2.1960
LaPrade 1WW 8 97.00 0.86 0.1331
Sum 673.00
Mean 96.14
Variance 41.48
St Dev. 6.44

30
Learning Outcomes Analysis: Aggregate Data – All students
Course: 311 Outcome: 600.5
Instructor Delivery Weeks Total Avg Dev. Score Z-Score
Mason 1WW 16 98.00 0.83 0.2073
Lebsack 2WW 8 100.00 2.83 0.7047
LaPrade 3WW 8 95.00 -2.17 -0.5389
Lebsack 001 8 100.00 2.83 0.7047
Lebsack 1AW 16 100.00 2.83 0.7047
Salley 2WW 16
LaPrade 1WW 8 90.00 -7.17 -1.7824
Sum 583.00
Mean 97.17
Variance 16.17
St Dev. 4.02
Course: 311 Outcome: 800.1
Instructor Delivery Weeks Total Avg Dev. Score Z-Score
Mason 1WW 16 98.00 1.50 0.2725
Lebsack 2WW 8 100.00 3.50 0.6358
LaPrade 3WW 8 95.00 -1.50 -0.2725
Lebsack 001 8 100.00 3.50 0.6358
Lebsack 1AW 16 100.00 3.50 0.6358
Salley 2WW 16
LaPrade 1WW 8 86.00 -10.50 -1.9075
Sum 579.00
Mean 96.50
Variance 30.30
St Dev. 5.50
Learning Outcomes Analysis: Aggregate Data – All students
Course: 311 Outcome: 800.2
Instructor Delivery Weeks Total Avg Dev. Score Z-Score
Mason 1WW 16 97.00 0.43 0.1096
Lebsack 2WW 8 100.00 3.43 0.8769
LaPrade 3WW 8 93.00 -3.57 -0.9135
Lebsack 001 8 100.00 3.43 0.8769
Lebsack 1AW 16 100.00 3.43 0.8769
Salley 2WW 16 96.00 -0.57 -0.1462
LaPrade 1WW 8 90.00 -6.57 -1.6808
Sum 676.00
Mean 96.57
Variance 15.29
St Dev. 3.91
Course: 311 Outcome: 800.4
Instructor Delivery Weeks Total Avg Dev. Score Z-Score
Mason 1WW 16 96.00 -1.71 -0.5447
Lebsack 2WW 8 100.00 2.29 0.7263
LaPrade 3WW 8 92.00 -5.71 -1.8157
Lebsack 001 8 100.00 2.29 0.7263
Lebsack 1AW 16 100.00 2.29 0.7263
Salley 2WW 16 100.00 2.29 0.7263
LaPrade 1WW 8 96.00 -1.71 -0.5447
684.00
Mean 97.71
Variance 9.90
St Dev. 3.15
31
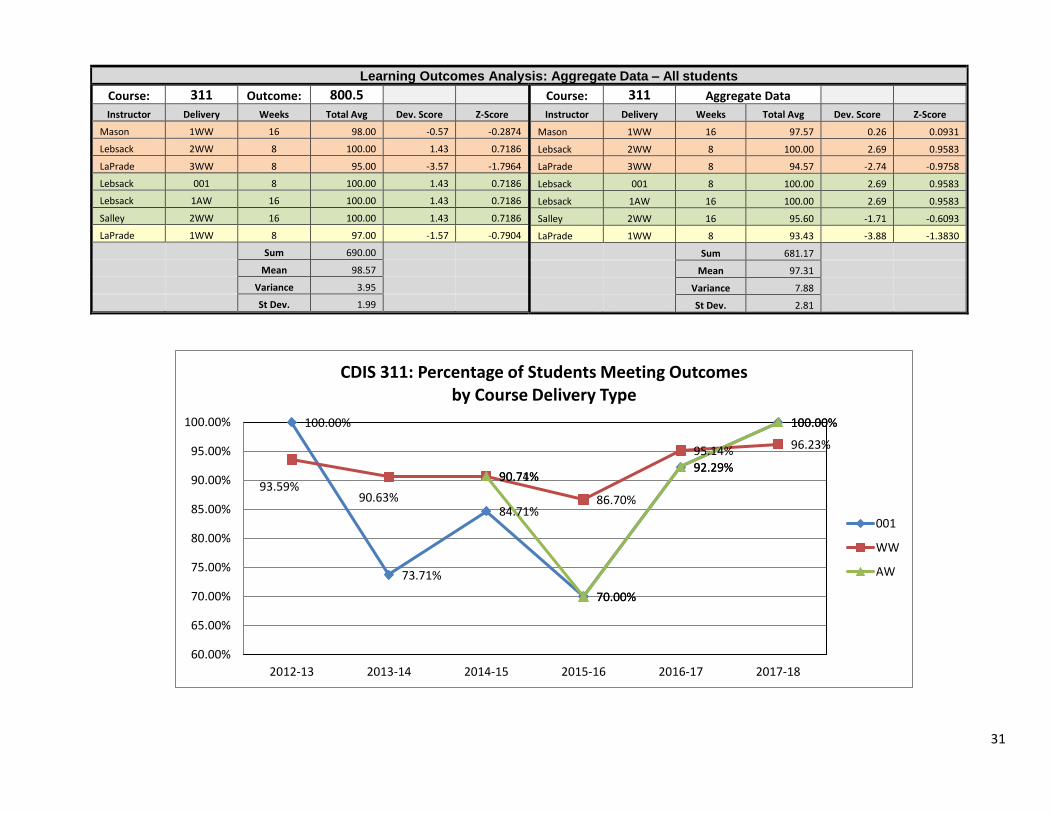
Learning Outcomes Analysis: Aggregate Data – All students
Course: 311 Outcome: 800.5
Instructor Delivery Weeks Total Avg Dev. Score Z-Score
Mason 1WW 16 98.00 -0.57 -0.2874
Lebsack 2WW 8 100.00 1.43 0.7186
LaPrade 3WW 8 95.00 -3.57 -1.7964
Lebsack 001 8 100.00 1.43 0.7186
Lebsack 1AW 16 100.00 1.43 0.7186
Salley 2WW 16 100.00 1.43 0.7186
LaPrade 1WW 8 97.00 -1.57 -0.7904
Sum 690.00
Mean 98.57
Variance 3.95
St Dev. 1.99
Course: 311 Aggregate Data
Instructor Delivery Weeks Total Avg Dev. Score Z-Score
Mason 1WW 16 97.57 0.26 0.0931
Lebsack 2WW 8 100.00 2.69 0.9583
LaPrade 3WW 8 94.57 -2.74 -0.9758
Lebsack 001 8 100.00 2.69 0.9583
Lebsack 1AW 16 100.00 2.69 0.9583
Salley 2WW 16 95.60 -1.71 -0.6093
LaPrade 1WW 8 93.43 -3.88 -1.3830
Sum 681.17
Mean 97.31
Variance 7.88
St Dev. 2.81
100.00%
73.71%
84.71%
70.00%
92.29%
100.00%
93.59%90.63%
90.74%
86.70%
95.14% 96.23%
90.71%
70.00%
92.29%
100.00%
60.00%
65.00%
70.00%
75.00%
80.00%
85.00%
90.00%
95.00%
100.00%
2012-13 2013-14 2014-15 2015-16 2016-17 2017-18
CDIS 311: Percentage of Students Meeting Outcomesby Course Delivery Type
001
WW
AW

32
CDIS 320 Issues in Disabilities
Measure(s)
CDIS 320-001) Students will critically appraise their own beliefs as well as the viewpoints of others. Students will learn to critique/defend and negotiate differences in opinion. CDIS 320-002) Students will recognize and communicate how disabilities have been viewed and treated historically in the U.S. and across the globe. The student will also compare/contrast how different societies presently view individuals with a disability. CDIS 320-003) Students will analyze relationships between culture, religion, SES, gender, and disability. CDIS 320-004) Students will recognize, communicate, and critically appraise barriers for, stigmas about, and discrimination of individuals with a disability.
Data Sources
Exam/Paper/Essay
Exam/Paper/Essay
Exam/Paper/Essay
Exam/Paper/Essay
Performance Criteria
70% of total students will meet course specific, entry-level competency for these outcome measures, based on the results of instructor selected assessments (i.e., skills performance, student projects, course notebooks, portfolios, scoring rubrics, graded assignments, quizzes, and/or exams, with a recommended cut-off score of 75% or higher, etc.)
Population/Timeline
CDIS 244, AY 2017-18
Learning Outcomes Analysis: Aggregate Data – All students
Course: 320 Outcome: 320-001
Instructor Delivery Weeks Total Avg Dev. Score Z-Score
Costa-Guerra 1WW 16 78.00 -6.00 -1.2940
Costa-Guerra 2WW 16 87.00 3.00 0.6470
Costa-Guerra 1WW 16 83.00 -1.00 -0.2157
Costa-Guerra 2WW 16 82.00 -2.00 -0.4313
Costa-Guerra 1WW 8 90.00 6.00 1.2940
Sum 420.00
Mean 84.00
Variance 21.50
St Dev. 4.64
Course: 320 Outcome: 320-002
Instructor Delivery Weeks Total Avg Dev. Score Z-Score
Costa-Guerra 1WW 16 82.00 -3.60 -1.2496
Costa-Guerra 2WW 16 83.00 -2.60 -0.9025
Costa-Guerra 1WW 16 87.00 1.40 0.4859
Costa-Guerra 2WW 16 88.00 2.40 0.8331
Costa-Guerra 1WW 8 88.00 2.40 0.8331
Sum 428.00
Mean 85.60
Variance 8.30
St Dev. 2.88

33
Learning Outcomes Analysis: Aggregate Data – All students
Course: 320 Outcome: 320-003 Instructor Delivery Weeks Total Avg Dev. Score Z-Score
Costa-Guerra 1WW 16 85.00 -3.60 -1.1805
Costa-Guerra 2WW 16 88.00 -0.60 -0.1967
Costa-Guerra 1WW 16 90.00 1.40 0.4591
Costa-Guerra 2WW 16 87.00 -1.60 -0.5247
Costa-Guerra 1WW 8 93.00 4.40 1.4428
Sum 443.00
Mean 88.60
Variance 9.30
St Dev. 3.05
Course: 320 Outcome: 320-004 Instructor Delivery Weeks Total Avg Dev. Score Z-Score
Costa-Guerra 1WW 16 88.00 -3.40 -1.4118
Costa-Guerra 2WW 16 92.00 0.60 0.2491
Costa-Guerra 1WW 16 93.00 1.60 0.6644
Costa-Guerra 2WW 16 90.00 -1.40 -0.5813
Costa-Guerra 1WW 8 94.00 2.60 1.0796
Sum 457.00
Mean 91.40
Variance 5.80
St Dev. 2.41
Learning Outcomes Analysis: Aggregate Data – All students
Course: 320 Aggregate Data Instructor Delivery Weeks Total Avg Dev. Score Z-Score
Costa-Guerra 1WW 16 83.25 -4.15 -1.4405
Costa-Guerra 2WW 16 87.50 0.10 0.0347
Costa-Guerra 1WW 16 88.25 0.85 0.2950
Costa-Guerra 2WW 16 86.75 -0.65 -0.2256
Costa-Guerra 1WW 8 91.25 3.85 1.3364
Sum 437.00
Mean 87.40
Variance 8.30
St Dev. 2.88
85.00%
90.50% 91.00%
96.42%
93.60%
87.40%
75.00%
80.00%
85.00%
90.00%
95.00%
100.00%
2012-13 2013-14 2014-15 2015-16 2016-17 2017-18
CDIS 320: Percentage of Students Meeting Outcomesby Course Delivery Type
WW

34
CDIS 323 Multicultural Issues in Communicative Disorders
Measure(s)
323-001) Contrast communication differences and communication disorders in culturally and linguistically diverse clients 323-002) Complete a self-assessment to become aware of his/her own cultural awareness, examine how personal attitude and belief systems may affect his/her ability to work with culturally different clients 323-003) Identify cultural difference in communication styles, belief systems, socioeconomic circumstances, and linguistic variables that may impact speech-language pathology and other medical services to members of specific culturally and linguistically diverse groups 323-004) Describe potential limitations of standardized tests with culturally and linguistically diverse clients 323-005) Independently design an intervention plan for a chosen culture incorporating dialect and language differences that includes significant cultural practices and holidays
Data Sources
Exam/Paper/Essay
Exam/Paper/Essay
Exam/Paper/Essay
Exam/Paper/Essay
Exam/Paper/Essay
Performance Criteria
70% of total students will meet course specific, entry-level competency for these outcome measures, based on the results of instructor selected assessments (i.e., skills performance, student projects, course notebooks, portfolios, scoring rubrics, graded assignments, quizzes, and/or exams, with a recommended cut-off score of 75% or higher, etc.)
Population/Timeline
CDIS 421, AY 2017-18
Learning Outcomes Analysis: Aggregate Data – All students
Course: 323 Outcome: 323-001 Instructor Delivery Weeks Total Avg Dev. Score Z-Score
Atkinson 1WW 16 97.00 0.00 Sum 97.00
Mean 97.00
Variance
St Dev.
Course: 323 Outcome: 323-002 Instructor Delivery Weeks Total Avg Dev. Score Z-Score
Atkinson 1WW 16 100.00 0.00
Sum 100.00
Mean 100.00
Variance
St Dev.
Learning Outcomes Analysis: Aggregate Data – All students
Course: 323 Outcome: 323-003
Instructor Delivery Weeks Total Avg Dev. Score Z-Score
Atkinson 1WW 16 89.00 0.00
Sum 89.00
Mean 89.00
Variance
St Dev.
Course: 323 Outcome: 323-004
Instructor Delivery Weeks Total Avg Dev. Score Z-Score
Atkinson 1WW 16 n/a
Sum
Mean
Variance
St Dev.

35
Learning Outcomes Analysis: Aggregate Data – All students
Course: 323 Outcome: 323-005
Instructor Delivery Weeks Total Avg Dev. Score Z-Score
Atkinson 1WW 16 n/a
Sum
Mean
Variance
St Dev.
Course: 323 Aggregate Data
Instructor Delivery Weeks Total Avg Dev. Score Z-Score
Atkinson WW 16 95.33
Sum 95.33
Mean 95.33
Variance
St Dev.
88.60%
95.33%
80.00%
85.00%
90.00%
95.00%
100.00%
2016-17 2017-18
CDIS 493: Percentage of Students Meeting Outcomesby Course Delivery Type
1WW

36
CDIS 324 Literacy Development and Disorders
Measure(s)
324-001) Identify elements of illiteracy prevention 324-002) Identify the link between language development and literacy development 324-003) Identify risk factors for written language disorders
Data Sources
Exam/Paper/Essay Exam/Paper/Essay
Exam/Paper/Essay
Performance Criteria
70% of total students will meet course specific, entry-level competency for these outcome measures, based on the results of instructor selected assessments (i.e., skills performance, student projects, course notebooks, portfolios, scoring rubrics, graded assignments, quizzes, and/or exams, with a recommended cut-off score of 75% or higher, etc.)
Population/Timeline
CDIS 421, AY 2017-18
Learning Outcomes Analysis: Aggregate Data – All students
Course: 324 Outcome: 324-001
Instructor Delivery Weeks Total Avg Dev. Score Z-Score
Atkinson 1WW 16 90.00 0.00 Sum 90.00
Mean 90.00
Variance
St Dev.
Course: 324 Outcome: 324-002
Instructor Delivery Weeks Total Avg Dev. Score Z-Score
90.00 0.00
Sum 90.00
Mean 90.00
Variance
St Dev.
Learning Outcomes Analysis: Aggregate Data – All students
Course: 324 Outcome: 324-003
Instructor Delivery Weeks Total Avg Dev. Score Z-Score
90.00 0.00
Sum 90.00
Mean 90.00
Variance
St Dev.
Course: 324-001 Aggregate Data
Instructor Delivery Weeks Total Avg Dev. Score Z-Score
90.00
Sum 90.00
Mean 90.00
Variance
St Dev.
First assessment cycle – no trend data

37
CDIS 330 Speech and Language Development
DIS 330 Speech and Language Development
Measure(s)
500.1) Describe how theories of speech and language development explain the emergence of communication
500.2) Construct a chart of developmental milestones to include auditory skills,
speech development, language development, cognitive development, psycho-social emotional development, gross/fine motor development, and play skills development
600.1) Differentiate the parameters of speech and language according to form,
content, and use as well as phonology, morphology, syntax, semantics, and pragmatics
Data Sources
Paper/Essay
Developmental Chart
Case based exercises
Performance Criteria
70% of total students will meet course specific, entry-level competency for these outcome measures, based on the results of instructor selected assessments (i.e., skills performance, student projects, course notebooks, portfolios, scoring rubrics, graded assignments, quizzes, and/or exams, with a recommended cut-off score of 75% or higher, etc.)
Population/Timeline
CDIS 330, AY 2017-18
Learning Outcomes Analysis: Aggregate Data – All students
Course: 330 Outcome: 500.1
Instructor Delivery Weeks Total Avg Dev. Score Z-Score
Sherman 001 16 70.00 -14.80 -1.0434
Sherman 1AW 16 70.00 -14.80 -1.0434
Salley 1WW 8 96.00 11.20 0.7896
Mason 2WW 8 100.00 15.20 1.0716
Howard 2WW 8 88.00 3.20 0.2256
Sum 424.00
Mean 84.80
Variance 201.20
St Dev. 14.18
Course: 330 Outcome: 600.1
Instructor Delivery Weeks Total Avg Dev. Score Z-Score
Sherman 001 8 70.00 -8.40 -0.5578
Sherman 1AW 16 70.00 -8.40 -0.5578
Salley 1WW 16 64.00 -14.40 -0.9562
Mason 2WW 8 100.00 21.60 1.4343
Howard 2WW 16 88.00 9.60 0.6375
Sum 392.00
Mean 78.40
Variance 226.80
St Dev. 15.06

38
Learning Outcomes Analysis: Aggregate Data – All students
Course: 330 Aggregate Data
Instructor Delivery Weeks Total Avg Dev. Score Z-Score
Sherman 001 8 70.00 -11.60 -0.9091
Sherman 1AW 16 70.00 -11.60 -0.9091
Salley 1WW 16 80.00 -1.60 -0.1254
Mason 2WW 8 100.00 18.40 1.4421
Howard 2WW 16 88.00 6.40 0.5016
Sum 408.00
Mean 81.60
Variance 162.80
St Dev. 12.76
100.00%
80.00%
93.00% 93.33%
41.00%
70.00%
82.05%
90.62%
87.80%92.58% 92.00%
89.33%
95.00%93.33%
41.00%
70.00%
35.00%
45.00%
55.00%
65.00%
75.00%
85.00%
95.00%
2012-13 2013-14 2014-15 2015-16 2016-17 2017-18
CDIS 330: Percentage of Students Meeting Outcomesby Course Delivery Type
001
WW
AW

39
CDIS 332 Language Disorders in Children
Measure(s)
600.3) Transcribe normal language sample; Compute MLU, MLR, TTR, semantic analysis, clause density (e.g., coordination/subordination index
600.4) Using a normal sample, score NRT and analyze results according to
strengths/weaknesses and developmental norms 600.5) Compose report detailing results of sample
800.3) Transcribe disordered language sample; Compute MLU, MLR, TTR,
semantic analysis, clause density (e.g., coordination/subordination index; relate to developmental norms
800.4) Describe common etiologies and characteristics of speech and
language disorders 800.5) Explain basic differences in delay vs. disorder vs. difference in speech
and language profiles
Data Sources
Language sample
PLS/TOLD/CELF Analysis
Language Report
Language Sample
Exam/Paper/Essay
Case based exercises
Performance Criteria
70% of total students will meet course specific, entry-level competency for these outcome measures, based on the results of instructor selected assessments (i.e., skills performance, student projects, course notebooks, portfolios, scoring rubrics, graded assignments, quizzes, and/or exams, with a recommended cut-off score of 75% or higher, etc.)
Population/Timeline
CDIS 332, AY 2017-18
Learning Outcomes Analysis: Aggregate Data – All students
Course: 332 Outcome: 600.3
Instructor Delivery Weeks Total Avg Dev. Score Z-Score
Hamilton 1WW 16 90.00 0.14 0.0152
Salley 2WW 8 75.00 -14.86 -1.5765
Mason 3WW 8 100.00 10.14 1.0763
Lebsack 001 16 92.00 2.14 0.2274
Lebsack 1AW 16 100.00 10.14 1.0763
LaPrade 2WW 8 92.00 2.14 0.2274
Sherman 1WW 8 80.00 -9.86 -1.0460
Sum 629.00
Mean 89.86
Variance 88.81
St Dev. 9.42
Course: 332 Outcome: 600.4
Instructor Delivery Weeks Total Avg Dev. Score Z-Score
Hamilton 1WW 16 90.00 0.43 0.0457
Salley 2WW 8 75.00 -14.57 -1.5537
Mason 3WW 8 100.00 10.43 1.1120
Lebsack 001 8 92.00 2.43 0.2590
Lebsack 1AW 8 100.00 10.43 1.1120
LaPrade 2WW 8 90.00 0.43 0.0457
Sherman 1WW 8 80.00 -9.57 -1.0206
Sum 627.00
Mean 89.57
Variance 87.95
St Dev. 9.38

40
Learning Outcomes Analysis: Aggregate Data – All students
Course: 332 Outcome: 600.5
Instructor Delivery Weeks Total Avg Dev. Score Z-Score
Hamilton 1WW 16 90.00 -3.43 -0.4900
Salley 2WW 8 96.00 2.57 0.3675
Mason 3WW 8 100.00 6.57 0.9392
Lebsack 001 8 92.00 -1.43 -0.2042
Lebsack 1AW 8 100.00 6.57 0.9392
LaPrade 2WW 8 96.00 2.57 0.3675
Sherman 1WW 8 80.00 -13.43 -1.9193
Sum 654.00
Mean 93.43
Variance 48.95
St Dev. 7.00
Course: 332 Outcome: 800.3
Instructor Delivery Weeks Total Avg Dev. Score Z-Score
Hamilton 1WW 16 90.00 0.71 0.0760
Salley 2WW 8 75.00 -14.29 -1.5208
Mason 3WW 8 100.00 10.71 1.1406
Lebsack 001 8 92.00 2.71 0.2890
Lebsack 1AW 8 100.00 10.71 1.1406
LaPrade 2WW 8 88.00 -1.29 -0.1369
Sherman 1WW 8 80.00 -9.29 -0.9885
Sum 625.00
Mean 89.29
Variance 88.24
St Dev. 9.39
Learning Outcomes Analysis: Aggregate Data – All students
Course: 332 Outcome: 800.4
Instructor Delivery Weeks Total Avg Dev. Score Z-Score
Hamilton 1WW 16 90.00 -4.00 -0.5410
Salley 2WW 8 100.00 6.00 0.8115
Mason 3WW 8 100.00 6.00 0.8115
Lebsack 001 8 92.00 -2.00 -0.2705
Lebsack 1AW 8 100.00 6.00 0.8115
LaPrade 2WW 8 96.00 2.00 0.2705
Sherman 1WW 8 80.00 -14.00 -1.8935
Sum 658.00
Mean 94.00
Variance 54.67
St Dev. 7.39
Course: 332 Outcome: 800.5
Instructor Delivery Weeks Total Avg Dev. Score Z-Score
Hamilton 1WW 16 90.00 -4.00 -0.5410
Salley 2WW 8 100.00 6.00 0.8115
Mason 3WW 8 100.00 6.00 0.8115
Lebsack 001 8 92.00 -2.00 -0.2705
Lebsack 1AW 8 100.00 6.00 0.8115
LaPrade 2WW 8 96.00 2.00 0.2705
Sherman 1WW 8 80.00 -14.00 -1.8935
Sum 658.00
Mean 94.00
Variance 54.67
St Dev. 7.39
41
86.00%
100.00%
86.67%
94.75%
72.00%
92.00%
89.86%
89.80%
94.76%
91.97%91.77%
89.97%88.00%
96.67% 94.75%
72.00%
100.00%
30.00%
40.00%
50.00%
60.00%
70.00%
80.00%
90.00%
100.00%
2012-13 2013-14 2014-15 2015-16 2016-17 2017-18
CDIS 332: Percentage of Students Meeting Outcomesby Course Delivery Type
001
WW
AW
Learning Outcomes Analysis: Aggregate Data – All students
Course: 332 Aggregate Data Instructor Delivery Weeks Total Avg Dev. Score Z-Score
Hamilton 1WW 16 90.00 -1.69 -0.2379
Salley 2WW 8 86.83 -4.86 -0.6835
Mason 3WW 8 100.00 8.31 1.1693
Lebsack 001 8 92.00 0.31 0.0436
Lebsack 1AW 8 100.00 8.31 1.1693
LaPrade 2WW 8 93.00 1.31 0.1843
Sherman 1WW 8 80.00 -11.69 -1.6450
Sum 641.83
Mean 91.69
Variance 50.50
St Dev. 7.11

42
CDIS 342 Basic Audiology
Measure(s)
300.5) Demonstrate competency with basic principles of audiometric evaluation (to include tympanometry
300.6) Analyze and interpret audiometric report
800.6) Relate type of hearing loss to anatomical structure and function
Data Sources
Exam/Skills Demonstration
Write audiometric report
Report Summary
Performance Criteria
70% of total students will meet course specific, entry-level competency for these outcome measures, based on the results of instructor selected assessments (i.e., skills performance, student projects, course notebooks, portfolios, scoring rubrics, graded assignments, quizzes, and/or exams, with a recommended cut-off score of 75% or higher, etc.)
Population/Timeline
CDIS 342, AY 2017-18
Learning Outcomes Analysis: Aggregate Data – All students
Course: 342 Outcome: 300.5
Instructor Delivery Weeks Total Avg Dev. Score Z-Score
Lingnau 001 16 75.00 -7.67 -1.0735
Lingnau 1AW 16 80.00 -2.67 -0.3734
Hall 2WW 8 86.00 3.33 0.4668
Hall 3WW 8 80.00 -2.67 -0.3734
Lingnau 001 16 75.00 -7.67 -1.0735
Lingnau 1AW 16 79.00 -3.67 -0.5134
Hall 2WW 8 86.00 3.33 0.4668
Hall 3WW 8 85.00 2.33 0.3267
Lingnau 1WW 8 98.00 15.33 2.1471
Sum 744.00
Mean 82.67
Variance 51.00
St Dev. 7.14
Course: 342 Outcome: 300.6
Instructor Delivery Weeks Total Avg Dev. Score Z-Score
Lingnau 001 8 100.00 10.11 0.6505
Lingnau 1AW 16 90.00 0.11 0.0071
Hall 2WW 8 88.00 -1.89 -0.1215
Hall 3WW 8 96.00 6.11 0.3932
Lingnau 001 16 50.00 -39.89 -2.5662
Lingnau 1AW 16 100.00 10.11 0.6505
Hall 2WW 8 95.00 5.11 0.3288
Hall 3WW 8 92.00 2.11 0.1358
Lingnau 1WW 8 98.00 8.11 0.5218
Sum 809.00
Mean 89.89
Variance 241.61
St Dev. 15.54
43
Learning Outcomes Analysis: Aggregate Data – All students
Course: 342 Outcome: 800.6
Instructor Delivery Weeks Total Avg Dev. Score Z-Score
Lingnau 001 8 100.00 8.89 1.2001
Lingnau 1AW 16 90.00 -1.11 -0.1500
Hall 2WW 8 88.00 -3.11 -0.4200
Hall 3WW 8 90.00 -1.11 -0.1500
Lingnau 001 16 75.00 -16.11 -2.1752
Lingnau 1AW 16 100.00 8.89 1.2001
Hall 2WW 8 92.00 0.89 0.1200
Hall 3WW 8 91.00 -0.11 -0.0150
Lingnau 1WW 8 94.00 2.89 0.3900
Sum 820.00
Mean 91.11
Variance 54.86
St Dev. 7.41
Course: 342 Aggregate Data
Instructor Delivery Weeks Total Avg Dev. Score Z-Score
Lingnau 001 8 91.67 3.78 0.4429
Lingnau 1AW 16 86.67 -1.22 -0.1433
Hall 2WW 8 87.33 -0.56 -0.0651
Hall 3WW 8 88.67 0.78 0.0912
Lingnau 001 16 66.67 -21.22 -2.4881
Lingnau 1AW 16 93.00 5.11 0.5992
Hall 2WW 8 91.00 3.11 0.3648
Hall 3WW 8 89.33 1.44 0.1693
Lingnau 1WW 8 96.67 8.78 1.0291
Sum 791.00
Mean 87.89
Variance 72.75
St Dev. 8.53
100.00%
94.33%
79.17%
89.27%90.91%
88.67%90.50%
88.11%90.60%
85.67%
89.83%
70.00%
75.00%
80.00%
85.00%
90.00%
95.00%
100.00%
105.00%
2012-13 2013-14 2014-15 2015-16 2016-17 2017-18
CDIS 342: Percentage of Students Meeting Outcomesby Course Delivery Type
001
WW
AW

44
CDIS 400 Speech and Hearing Science
Measure(s)
300.1) Create and analyze waveforms for frequency, amplitude, and periodicity 300.2) Spectrographically analyze and identify selected vowel and consonant
sounds 300.3) Analyze voice samples for jitter, shimmer, mean harmonics-to-noise
ratio, voicing, and pitch spectrographic analysis 300.4) Define formant and describe the manner in which variations in
physiology affect formant frequencies
Data Sources
Speech lab assignment
Speech lab assignment
Speech lab assignment
Exam/Paper/Essay
Performance Criteria
70% of total students will meet course specific, entry-level competency for these outcome measures, based on the results of instructor selected assessments (i.e., skills performance, student projects, course notebooks, portfolios, scoring rubrics, graded assignments, quizzes, and/or exams, with a recommended cut-off score of 75% or higher, etc.)
Population/Timeline
CDIS 400, AY 2017-18
Learning Outcomes Analysis: Aggregate Data – All students
Course: 400 Outcome: 300.1
Instructor Delivery Weeks Total Avg Dev. Score Z-Score
Martin 1WW 16 94.00 0.50 0.2611
Martin 001 16 92.00 -1.50 -0.7833
Martin 1AW 16 92.00 -1.50 -0.7833
Martin 1WW 8 96.00 2.50 1.3056
Sum 374.00
Mean 93.50
Variance 3.67
St Dev. 1.91
Course: 400 Outcome: 300.2
Instructor Delivery Weeks Total Avg Dev. Score Z-Score
Martin 1WW 16 94.00 0.50 0.2611
Martin 001 16 92.00 -1.50 -0.7833
Martin 1AW 16 92.00 -1.50 -0.7833
Martin 2AW 16 96.00 2.50 1.3056
Sum 374.00
Mean 93.50
Variance 3.67
St Dev. 1.91

45
90.75%
83.50%
85.50%
92.50%
95.00%
91.50%89.19%
92.50%
95.00%
92.50%
85.00%
90.50% 91.00%
94.37%
95.00%
93.62%
80.00%
85.00%
90.00%
95.00%
100.00%
2012-13 2013-14 2014-15 2015-16 2016-17 2017-18
CDIS 400: Percentage of Students Meeting Outcomesby Course Delivery Type
001
WW
AW
Learning Outcomes Analysis: Aggregate Data – All students
Course: 400 Outcome: 300.3
Instructor Delivery Weeks Total Avg Dev. Score Z-Score
Martin 1WW 16 92.00 -1.00 -0.5000
Martin 001 16 92.00 -1.00 -0.5000
Martin 1AW 16 92.00 -1.00 -0.5000
Martin 2AW 16 96.00 3.00 1.5000
Sum 372.00
Mean 93.00
Variance 4.00
St Dev. 2.00
Course: 400 Outcome: 300.4
Instructor Delivery Weeks Total Avg Dev. Score Z-Score
Martin 1WW 16 90.00 -1.25 -0.5000
Martin 001 16 90.00 -1.25 -0.5000
Martin 1AW 16 90.00 -1.25 -0.5000
Martin 2AW 16 95.00 3.75 1.5000
Sum 365.00
Mean 91.25
Variance 6.25
St Dev. 2.50
Learning Outcomes Analysis: Aggregate Data – All students
Course: 400 Aggregate Data
Instructor Delivery Weeks Total Avg Dev. Score Z-Score
Martin 1WW 16 92.50 -0.31 -0.1551
Martin 001 16 91.50 -1.31 -0.6516
Martin 1AW 16 91.50 -1.31 -0.6516
Martin 2AW 16 95.75 2.94 1.4583
Sum 371.25
Mean 92.81
Variance 4.06
St Dev. 2.01

46
CDIS 421 Neuroscience of Communication
Measure(s)
200.1) Identify and explain functions for cranial nerves 200.2) Differentiate structures within and functions of neurological systems
200.3) Identify and list functions for UMN and LMN systems
200.4) Explain the blood supply of the brain and brain stem
200.5) Identify lobes and their functions
200.6 Identify cortical structures of hearing and vision
Data Sources
Exam/Paper/Essay
Exam/Paper/Essay
Exam/Paper/Essay
Exam/Paper/Essay
Exam/Paper/Essay
Exam/Paper/Essay
Performance Criteria
70% of total students will meet course specific, entry-level competency for these outcome measures, based on the results of instructor selected assessments (i.e., skills performance, student projects, course notebooks, portfolios, scoring rubrics, graded assignments, quizzes, and/or exams, with a recommended cut-off score of 75% or higher, etc.)
Population/Timeline
CDIS 421, AY 2017-18
Learning Outcomes Analysis: Aggregate Data – All students Course: 421 Outcome: 200.1
Instructor Delivery Weeks Total Avg Dev. Score Z-Score
Weems 1WW 16 76.00 -14.00 -1.7392
Weems 001 16 100.00 10.00 1.2423
Weems 1WW 16 93.00 3.00 0.3727
Weems 3WW 16 91.00 1.00 0.1242
Weems 1WW 8 93.00 3.00 0.3727
Weems 2WW 8 87.00 -3.00 -0.3727
Sum 540.00
Mean 90.00
Variance 64.80
St Dev. 8.05
Course: 421 Outcome: 200.2
Instructor Delivery Weeks Total Avg Dev. Score Z-Score
Weems 001 16 79.00 -6.00 -1.0113
Weems 1WW 16 85.00 0.00 0.0000
Weems 2WW 16 93.00 8.00 1.3484
Weems 1WW 8 91.00 6.00 1.0113
Weems 2WW 8 79.00 -6.00 -1.0113
Weems 2WW 8 83.00 -2.00 -0.3371
Sum 510.00
Mean 85.00
Variance 35.20
St Dev. 5.93
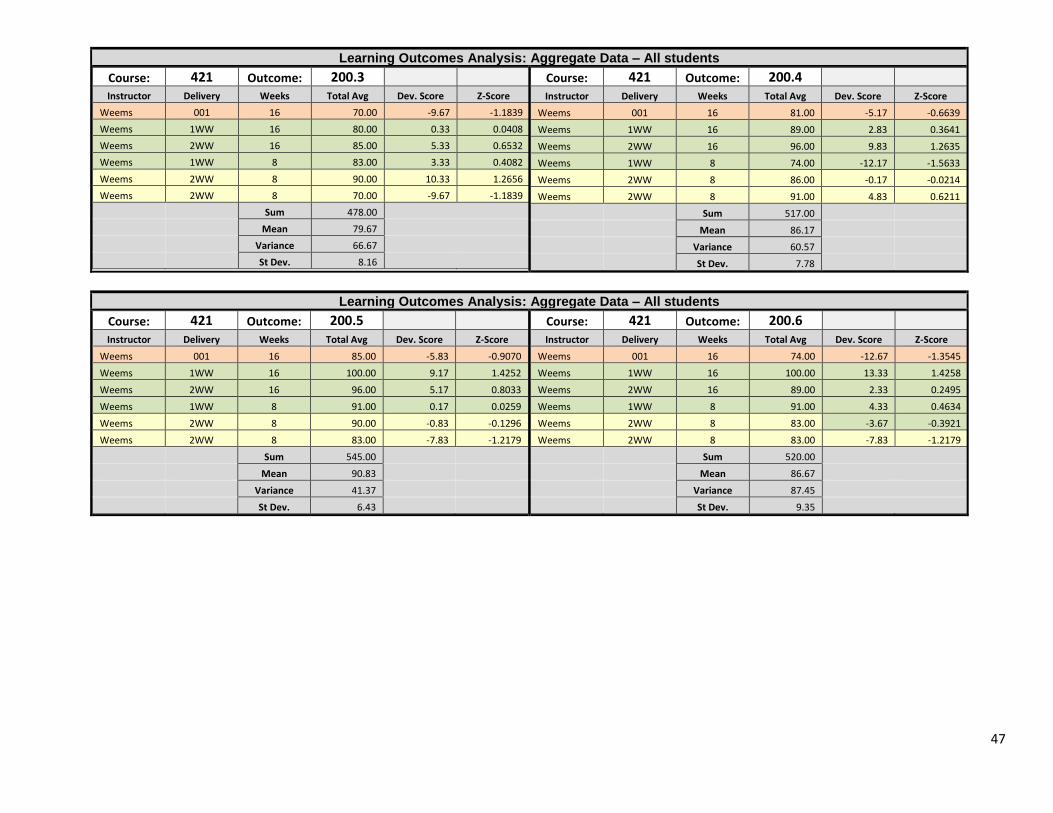
47
Learning Outcomes Analysis: Aggregate Data – All students Course: 421 Outcome: 200.3
Instructor Delivery Weeks Total Avg Dev. Score Z-Score
Weems 001 16 70.00 -9.67 -1.1839
Weems 1WW 16 80.00 0.33 0.0408
Weems 2WW 16 85.00 5.33 0.6532
Weems 1WW 8 83.00 3.33 0.4082
Weems 2WW 8 90.00 10.33 1.2656
Weems 2WW 8 70.00 -9.67 -1.1839
Sum 478.00
Mean 79.67
Variance 66.67
St Dev. 8.16
Course: 421 Outcome: 200.4
Instructor Delivery Weeks Total Avg Dev. Score Z-Score
Weems 001 16 81.00 -5.17 -0.6639
Weems 1WW 16 89.00 2.83 0.3641
Weems 2WW 16 96.00 9.83 1.2635
Weems 1WW 8 74.00 -12.17 -1.5633
Weems 2WW 8 86.00 -0.17 -0.0214
Weems 2WW 8 91.00 4.83 0.6211
Sum 517.00
Mean 86.17
Variance 60.57
St Dev. 7.78
Learning Outcomes Analysis: Aggregate Data – All students Course: 421 Outcome: 200.5
Instructor Delivery Weeks Total Avg Dev. Score Z-Score
Weems 001 16 85.00 -5.83 -0.9070
Weems 1WW 16 100.00 9.17 1.4252
Weems 2WW 16 96.00 5.17 0.8033
Weems 1WW 8 91.00 0.17 0.0259
Weems 2WW 8 90.00 -0.83 -0.1296
Weems 2WW 8 83.00 -7.83 -1.2179
Sum 545.00
Mean 90.83
Variance 41.37
St Dev. 6.43
Course: 421 Outcome: 200.6
Instructor Delivery Weeks Total Avg Dev. Score Z-Score
Weems 001 16 74.00 -12.67 -1.3545
Weems 1WW 16 100.00 13.33 1.4258
Weems 2WW 16 89.00 2.33 0.2495
Weems 1WW 8 91.00 4.33 0.4634
Weems 2WW 8 83.00 -3.67 -0.3921
Weems 2WW 8 83.00 -7.83 -1.2179
Sum 520.00
Mean 86.67
Variance 87.45
St Dev. 9.35

48
Learning Outcomes Analysis: Aggregate Data – All students Course: 421 Aggregate Data
Instructor Delivery Weeks Total Avg Dev. Score Z-Score
Weems 001 16 77.50 -8.89 -1.5769
Weems 1WW 16 92.33 5.94 1.0546
Weems 2WW 16 92.00 5.61 0.9954
Weems 1WW 8 86.83 0.44 0.0788
Weems 2WW 8 86.83 0.44 0.0788
Weems 2WW 8 82.83 -3.56 -0.6308
Sum 518.33
Mean 86.39
Variance 31.77
St Dev. 5.64
78.00%
88.00%
93.50%
85.90%
90.58%
77.50%
86.58%
89.96% 89.50%
86.46%
88.17%
75.00%
80.00%
85.00%
90.00%
95.00%
2012-13 2013-14 2014-15 2015-16 2016-17 2017-18
CDIS 421: Percentage of Students Meeting Outcomesby Course Delivery Type
001
WW

49
CDIS 433 Medical Concepts for Communication Disorders
Measure(s)
433-001) List the professional roles and responsibilities typically encountered by SLPs in medical settings 433-002) Demonstrate use and understanding of medical terminology, abbreviations, and notations as they pertain to Speech-Language Pathologists 433-003) Write SOAP notes using appropriate form, content, and style 433-004) Interpret physician’s history and physical and diagnostic reports 433-005) List vital signs and describe how they are typically obtained
Data Sources
Exam/Paper/Essay
Exam/Paper/Essay
Exam/Paper/Essay Exam/Paper/Essay Exam/Paper/Essay
Performance Criteria
70% of total students will meet course specific, entry-level competency for these outcome measures, based on the results of instructor selected assessments (i.e., skills performance, student projects, course notebooks, portfolios, scoring rubrics, graded assignments, quizzes, and/or exams, with a recommended cut-off score of 75% or higher, etc.)
Population/Timeline
CDIS 421, AY 2017-18
Learning Outcomes Analysis: Aggregate Data – All students
Course: 433 Outcome: 433-001
Instructor Delivery Weeks Total Avg Dev. Score Z-Score
Martin 1WW 8 95.00 0.00 Sum 95.00
Mean 95.00
Variance
St Dev.
Course: 433 Outcome: 433-002
Instructor Delivery Weeks Total Avg Dev. Score Z-Score
Martin 1WW 16 95.00 0.00 Sum 95.00
Mean 95.00
Variance
St Dev.
Learning Outcomes Analysis: Aggregate Data – All students
Course: 433 Outcome: 433-003
Instructor Delivery Weeks Total Avg Dev. Score Z-Score
Martin 1WW 16 95.00 0.00 Sum 95.00
Mean 95.00
Variance
St Dev.
Course: 433 Outcome: 433-004
Instructor Delivery Weeks Total Avg Dev. Score Z-Score
Martin 1WW 16 95.00 0.00 Sum 95.00
Mean 95.00
Variance
St Dev.

50
Learning Outcomes Analysis: Aggregate Data – All students
Course: 433 Outcome: 433-005
Instructor Delivery Weeks Total Avg Dev. Score Z-Score
Martin 1WW 16 90.00 0.00
Sum 90.00
Mean 90.00
Variance
St Dev.
Course: 433 Aggregate Data
Instructor Delivery Weeks Total Avg Dev. Score Z-Score
Martin WW 16 94.00 -1.00
Sum 94.00
Mean 94.00
Variance
St Dev.
First assessment cycle – no trend data

51
CDIS 434 Aural Rehabilitation
Measure(s)
800.7) Discriminate and describe amplification systems 800.8) Discriminate and describe communication methods for deaf and HOH
individuals
800.9) 800.9 Match communication methodologies to client need based on type and degree of loss in conjunction with communication profile
Data Sources
Exam/Paper/Essay
Exam/Paper/Essay
Case based exercises
Performance Criteria
70% of total students will meet course specific, entry-level competency for these outcome measures, based on the results of instructor selected assessments (i.e., skills performance, student projects, course notebooks, portfolios, scoring rubrics, graded assignments, quizzes, and/or exams, with a recommended cut-off score of 75% or higher, etc.)
Population/Timeline
CDIS 434, AY 2017-18
Learning Outcomes Analysis: Aggregate Data – All students
Course: 434 Outcome: 800.7
Instructor Delivery Weeks Total Avg Dev. Score Z-Score
Lingnau 001 16 92.00 0.43 0.0635
Lingnau 1AW 16 100.00 8.43 1.2479
Hall 1WW 8 84.00 -7.57 -1.1210
Lingnau 1WW 16 95.00 3.43 0.5076
Hall 2WW 8 84.00 -7.57 -1.1210
Hall 3WW 8 87.00 -4.57 -0.6768
Lingnau 2WW 8 99.00 7.43 1.0998
Sum 641.00
Mean 91.57
Variance 45.62
St Dev. 6.75
Course: 434 Outcome: 800.8
Instructor Delivery Weeks Total Avg Dev. Score Z-Score
Lingnau 001 16 64.00 -20.00 -1.7912
Lingnau 1AW 16 93.00 9.00 0.8061
Hall 1WW 8 84.00 0.00 0.0000
Lingnau 1WW 16 95.00 11.00 0.9852
Hall 2WW 8 92.00 8.00 0.7165
Hall 3WW 8 75.00 -9.00 -0.8061
Lingnau 2WW 8 85.00 1.00 0.0896
Sum 588.00
Mean 84.00
Variance 124.67
St Dev. 11.17

52
Learning Outcomes Analysis: Aggregate Data – All students
Course: 434 Outcome: 800.9
Instructor Delivery Weeks Total Avg Dev. Score Z-Score
Lingnau 001 16 77.00 -14.71 -1.9738
Lingnau 1AW 16 93.00 1.29 0.1725
Hall 1WW 8 97.00 5.29 0.7091
Lingnau 1WW 16 95.00 3.29 0.4408
Hall 2WW 8 91.00 -0.71 -0.0958
Hall 3WW 8 89.00 -2.71 -0.3641
Lingnau 2WW 8 100.00 8.29 1.1115
Sum 642.00
Mean 91.71
Variance 55.57
St Dev. 7.45
Course: 434 Aggregate Data
Instructor Delivery Weeks Total Avg Dev. Score Z-Score
Lingnau 001 16 77.67 -11.43 -1.7181
Lingnau 1AW 16 95.33 6.24 0.9378
Hall 1WW 8 88.33 -0.76 -0.1145
Lingnau 1WW 16 95.00 5.90 0.8877
Hall 2WW 8 89.00 -0.10 -0.0143
Hall 3WW 8 83.67 -5.43 -0.8161
Lingnau 2WW 8 94.67 5.57 0.8376
Sum 623.67
Mean 89.10
Variance 44.25
St Dev. 6.65
89.00%
100.00%
95.17%
91.59%90.13%
91.11%89.17%
86.47%85.33%
89.17% 88.67%
80.00%
85.00%
90.00%
95.00%
100.00%
105.00%
2012-13 2013-14 2014-15 2015-16 2016-17 2017-18
CDIS 434: Percentage of Students Meeting Outcomesby Course Delivery Type
001
WW
AW

53
CDIS 441 Speech-Language Preclinical
Measure(s)
400.1) Integrate basic principles of cognitive psychology into intervention contexts
400.2) Integrate basic principles of behavior modification into intervention
contexts 400.3) Address multiple learning styles in therapeutic contexts
700.1) Describe impact of and modifications necessary for successful
interactions with diverse multicultural clientele 800.10) Discriminate and explain various intervention models for addressing
speech and language disorders 800.11) Use elementary principles of EBP to justify decision making process
800.16) Apply the ASHA COE to case-based situations
800.17) Explain scope of practice, legal policy, etc.
800.19) Complete clinical application assignments
800.20) Prepare an informational session on communicative disorders
Data Sources
Application assignment/Therapy lesson plan
Exam/Therapy lesson plan
Application assignment/ Therapy lesson plan
Cultural competency exam/ Application assignment
Application assignment/Essay
Application assignment/ Therapy lesson plan
Application assignment/Essay
Application assignment/Essay
Therapy lesson plans/ Language sample-analysis
Application assignment/ Service learning project
Performance Criteria
70% of total students will meet course specific, entry-level competency for these outcome measures, based on the results of instructor selected assessments (i.e., skills performance, student projects, course notebooks, portfolios, scoring rubrics, graded assignments, quizzes, and/or exams, with a recommended cut-off score of 75% or higher, etc.)
Population/Timeline
CDIS 441, AY 2017-18
Learning Outcomes Analysis: Aggregate Data – All students
Course: 441 Outcome: 400.1
Instructor Delivery Weeks Total Avg Dev. Score Z-Score
Wilkerson 1WW 16 78.00 1.33 0.0634
Wilkerson 1WW 16 97.00 20.33 0.9668
Wilkerson 1WW 8 55.00 -21.67 -1.0302
Sum 230.00
Mean 76.67
Variance 442.33
St Dev. 21.03
Course: 441 Outcome: 400.2
Instructor Delivery Weeks Total Avg Dev. Score Z-Score
Wilkerson 1WW 16 94.00 -4.00 -1.1547
Wilkerson 1WW 16 100.00 2.00 0.5774
Wilkerson 1WW 16 100.00 2.00 0.5774
Sum 294.00
Mean 98.00
Variance 12.00
St Dev. 3.46
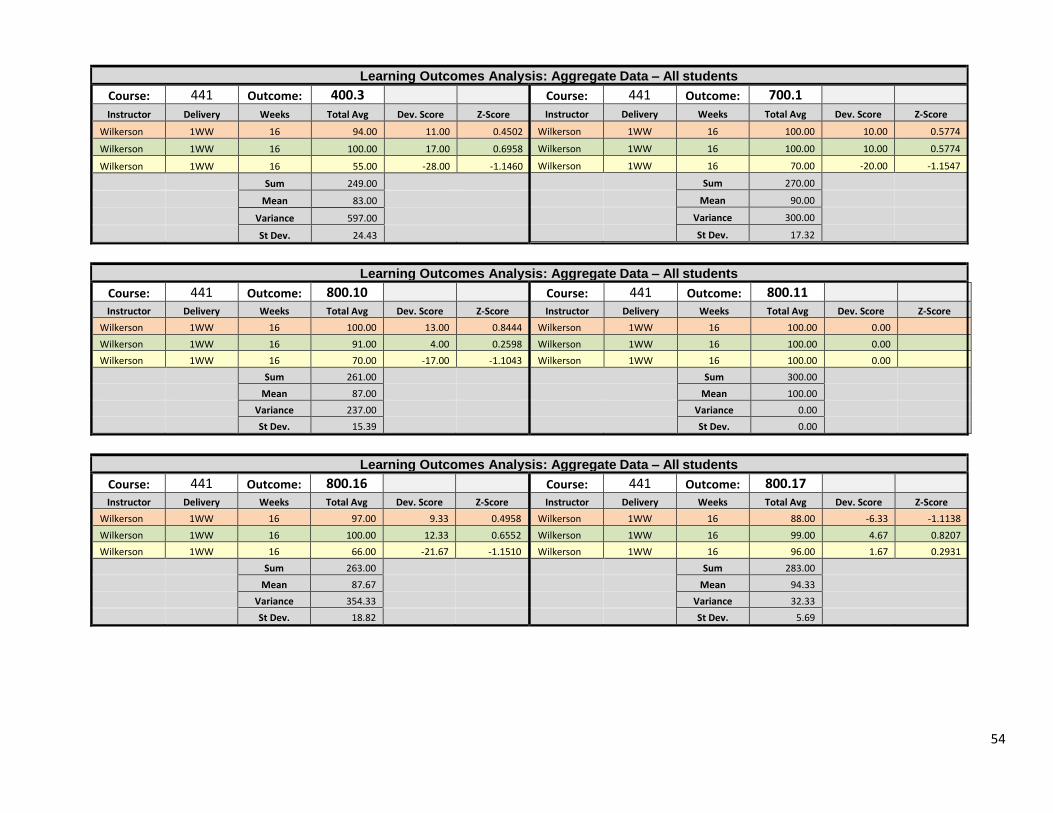
54
Learning Outcomes Analysis: Aggregate Data – All students
Course: 441 Outcome: 400.3
Instructor Delivery Weeks Total Avg Dev. Score Z-Score
Wilkerson 1WW 16 94.00 11.00 0.4502
Wilkerson 1WW 16 100.00 17.00 0.6958
Wilkerson 1WW 16 55.00 -28.00 -1.1460
Sum 249.00
Mean 83.00
Variance 597.00
St Dev. 24.43
Course: 441 Outcome: 700.1
Instructor Delivery Weeks Total Avg Dev. Score Z-Score
Wilkerson 1WW 16 100.00 10.00 0.5774
Wilkerson 1WW 16 100.00 10.00 0.5774
Wilkerson 1WW 16 70.00 -20.00 -1.1547
Sum 270.00
Mean 90.00
Variance 300.00
St Dev. 17.32
Learning Outcomes Analysis: Aggregate Data – All students
Course: 441 Outcome: 800.10
Instructor Delivery Weeks Total Avg Dev. Score Z-Score
Wilkerson 1WW 16 100.00 13.00 0.8444
Wilkerson 1WW 16 91.00 4.00 0.2598
Wilkerson 1WW 16 70.00 -17.00 -1.1043
Sum 261.00
Mean 87.00
Variance 237.00
St Dev. 15.39
Course: 441 Outcome: 800.11
Instructor Delivery Weeks Total Avg Dev. Score Z-Score
Wilkerson 1WW 16 100.00 0.00
Wilkerson 1WW 16 100.00 0.00
Wilkerson 1WW 16 100.00 0.00
Sum 300.00
Mean 100.00
Variance 0.00
St Dev. 0.00
Learning Outcomes Analysis: Aggregate Data – All students
Course: 441 Outcome: 800.16
Instructor Delivery Weeks Total Avg Dev. Score Z-Score
Wilkerson 1WW 16 97.00 9.33 0.4958
Wilkerson 1WW 16 100.00 12.33 0.6552
Wilkerson 1WW 16 66.00 -21.67 -1.1510
Sum 263.00
Mean 87.67
Variance 354.33
St Dev. 18.82
Course: 441 Outcome: 800.17
Instructor Delivery Weeks Total Avg Dev. Score Z-Score
Wilkerson 1WW 16 88.00 -6.33 -1.1138
Wilkerson 1WW 16 99.00 4.67 0.8207
Wilkerson 1WW 16 96.00 1.67 0.2931
Sum 283.00
Mean 94.33
Variance 32.33
St Dev. 5.69

55
Learning Outcomes Analysis: Aggregate Data – All students CDIS 441 Learning Outcomes Analysis: Aggregate Data – All students Course: 441 Outcome: 800.19
Instructor Delivery Weeks Total Avg Dev. Score Z-Score
Wilkerson 1WW 16 100.00 1.33 0.8729
Wilkerson 1WW 16 99.00 0.33 0.2182
Wilkerson 1WW 16 97.00 -1.67 -1.0911
Sum 296.00
Mean 98.67
Variance 2.33
St Dev. 1.53
Course: 441 Outcome: 800.20
Instructor Delivery Weeks Total Avg Dev. Score Z-Score
Wilkerson 1WW 16 100.00 0.00
Wilkerson 1WW 16 100.00 0.00
Wilkerson 1WW 16 100.00 0.00
Sum 300.00
Mean 100.00
Variance 0.00
St Dev. 0.00
81.78%
93.22%
87.10%
90.47%
92.83%91.53%
80.00%
85.00%
90.00%
95.00%
2012-13 2013-14 2014-15 2015-16 2016-17 2017-18
CDIS 441 : Percentage of Students Meeting Outcomesby Course Delivery Type
WW
Learning Outcomes Analysis: Aggregate Data – All students
Course: 441 Aggregate Data
Instructor Delivery Weeks Total Avg Dev. Score Z-Score
Wilkerson 1WW 16 95.10 3.57 0.3805
Wilkerson 1WW 16 98.60 7.07 0.7539
Wilkerson 1WW 16 80.90 -10.63 -1.1344
Sum 274.60
Mean 91.53
Variance 87.86
St Dev. 9.37

56
CDIS 441L Speech-Language Preclinical
Measure(s)
800.18) Complete clinical observations as assigned
Data Sources
Practicum activity
Performance Criteria
70% of total students will meet course specific, entry-level competency for these outcome measures, based on the results of instructor selected assessments (i.e., skills performance, student projects, course notebooks, portfolios, scoring rubrics, graded assignments, quizzes, and/or exams, with a recommended cut-off score of 75% or higher, etc.)
Population/Timeline
CDIS 441L, AY 2017-18
Learning Outcomes Analysis/Aggregate Data – All students
Course: 441L Outcome: 800.18 Instructor Delivery Weeks Total Avg Dev. Score Z-Score
Wilkerson 1WW 16 91.00 -2.00 -0.5774
Wilkerson 1WW 16 91.00 -2.00 -0.5774
Wilkerson 1WW 8 97.00 4.00 1.1547
Sum 279.00
Mean 93.00
Variance 12.00
St Dev. 3.46
77.50%
93.04% 92.67% 93.00%
70.00%
75.00%
80.00%
85.00%
90.00%
95.00%
100.00%
2014-15 2015-16 2016-17 2017-18
CDIS 441L: Percentage of Students Meeting Outcomesby Course Delivery Type
WW

57
CDIS 445 Speech-Language Practicum
Measure(s)
CDIS 445.001) Demonstrate basic clinical competencies in the delivery of therapy services .
Data Sources
Skills performance
Performance Criteria
70% of total students will meet course specific, entry-level competency for these outcome measures, based on the results of instructor selected assessments (i.e., skills performance, student projects, course notebooks, portfolios, scoring rubrics, graded assignments, quizzes, and/or exams, with a recommended cut-off score of 75% or higher, etc.)
Population/Timeline
CDIS 445, AY 2017-18
Learning Outcomes Analysis/Aggregate Data – All students
Course: 445 Outcome: 445.001
Instructor Delivery Weeks Total Avg Dev. Score Z-Score
Wilkerson 001 16 100.00 0.00 Sum 100.00
Mean 100.00
Variance
St Dev.
100.00% 100.00% 100.00% 100.00% 100.00%
80.00%
85.00%
90.00%
95.00%
100.00%
2013-14 2014-15 2015-16 2016-17 2017-18
CDIS 445: Percentage of Students Meeting Outcomes by Course Delivery Type
WW

58
CDIS 446 Speech-Language Practicum
Measure(s)
300.5) Demonstrate competency with basic principles of audiometric evaluation (to include tympanometry) .
Data Sources
Skills performance
Performance Criteria
70% of total students will meet course specific, entry-level competency for these outcome measures, based on the results of instructor selected assessments (i.e., skills performance, student projects, course notebooks, portfolios, scoring rubrics, graded assignments, quizzes, and/or exams, with a recommended cut-off score of 75% or higher, etc.)
Population/Timeline
CDIS 445, AY 2017-18
Learning Outcomes Analysis/Aggregate Data – All students
Course: 446 Outcome: 300.5
Instructor Delivery Weeks Total Avg Dev. Score Z-Score
Lingnau 001 16 100.00 0.00
Lingnau 001 16 100.00 0.00
Sum 200.00
Mean 100.00
Variance 0.00
St Dev. 0.00
First assessment cycle – no trend data

59
CDIS 454 Speech and Language Assessment
Measure(s)
700.2) Describe impact of and modifications necessary for successful assessment with diverse multicultural clientele
800.12S) Using a disordered sample, score NRT and analyze results according to strengths/weaknesses and developmental norms (Speech) 800.12L) Using a disordered sample, score NRT and analyze results according to strengths/weaknesses and developmental norms (Language) 800.13 Complete syllable shape, positional, and place/manner/voice analysis; identify error types (SODA, pattern of error, intelligibility index, and phonetic inventory 800.14 Integrate and analyze findings from case history (social, educational,
medical, etc., oral motor structure and function, articulatory and phonological assessments, receptive/expressive language in all parameters (syntax, morphology, semantics, pragmatics, narrative, problem solving, etc., auditory skills, literacy, dynamic assessment, cultural/linguistic variables
800.15S) Compose report detailing results of sample; provide preliminary
diagnosis, eligibility, statement of functional need, and prognosis; select and construct goals/objectives in order of target need; recommend treatment approach to include modifications; MUST BE SUPPORTED BY REFERREED EBP (Speech)
800.15L) Compose report detailing results of sample; provide preliminary
diagnosis, eligibility, statement of functional need, and prognosis; select and construct goals/objectives in order of target need; recommend treatment approach to include modifications; MUST BE SUPPORTED BY REFERREED EBP (Language)
Data Sources
Assessment Report
GFTA/APP Analysis
PLS/TOLD/CELF Analysis
Diagnostic Report
Diagnostic Report
Diagnostic Report
Diagnostic Report
Performance Criteria
70% of total students will meet course specific, entry-level competency for these outcome measures, based on the results of instructor selected assessments (i.e., skills performance, student projects, course notebooks, portfolios, scoring rubrics, graded assignments, quizzes, and/or exams, with a recommended cut-off score of 75% or higher, etc.)
Population/Timeline
CDIS 454, AY 2017-18

60
Learning Outcomes Analysis: Aggregate Data – All students
Course: 454 Outcome: 700.2
Instructor Delivery Weeks Total Avg Dev. Score Z-Score
Sherman 001 16 75 -10.50 -0.8890
Sherman 1AW 16 75 -10.50 -0.8890
Worthington 1WW 16 78 -7.50 -0.6350
Worthington 1WW 16 100.00 14.50 1.2277
Worthington 2WW 8 100.00 14.50 1.2277
Worthington 1WW 8 85.00 -0.50 -0.0423
Sum 513.00
Mean 85.50
Variance 139.50
St Dev. 11.81
Course: 454 Outcome: 800.12S
Instructor Delivery Weeks Total Avg Dev. Score Z-Score
Sherman 001 16 75 -8.00 -1.1795
Sherman 1AW 16 75 -8.00 -1.1795
Worthington 1WW 16 83 0.00 0.0000
Worthington 1WW 16 90 7.00 1.0321
Worthington 2WW 8 90 7.00 1.0321
Worthington 1WW 8 85.00 2.00 0.2949
Sum 498.00
Mean 83.00
Variance 46.00
St Dev. 6.78
Learning Outcomes Analysis: Aggregate Data – All students
Course: 454 Outcome: 800.12L
Instructor Delivery Weeks Total Avg Dev. Score Z-Score
Sherman 001 16 75 -9.67 -1.2887
Sherman 1AW 16 75 -9.67 -1.2887
Worthington 1WW 16 89 4.33 0.5777
Worthington 1WW 16 90 5.33 0.7110
Worthington 2WW 8 90 5.33 0.7110
Worthington 1WW 8 89.00 4.33 0.5777
Sum 508.00
Mean 84.67
Variance 56.27
St Dev. 7.50
Course: 454 Outcome: 800.13
Instructor Delivery Weeks Total Avg Dev. Score Z-Score
Sherman 001 16 75 -8.83 -1.1622
Sherman 1AW 16 75 -8.83 -1.1622
Worthington 1WW 16 94 10.17 1.3376
Worthington 1WW 16 85 1.17 0.1535
Worthington 2WW 8 85 1.17 0.1535
Worthington 1WW 8 89 5.17 0.6798
Sum 503.00
Mean 83.83
Variance 57.77
St Dev. 7.60

61
Learning Outcomes Analysis: Aggregate Data – All students
Course: 454 Outcome: 800.14
Instructor Delivery Weeks Total Avg Dev. Score Z-Score
Sherman 001 16 75 -5.17 -0.7383
Sherman 1AW 16 75 -5.17 -0.7383
Worthington 1WW 16 72 -8.17 -1.1671
Worthington 1WW 16 85 4.83 0.6907
Worthington 2WW 8 85 4.83 0.6907
Worthington 1WW 8 89.00 8.83 1.2623
Sum 481.00
Mean 80.17
Variance 48.97
St Dev. 7.00
Course: 454 Outcome: 800.15S
Instructor Delivery Weeks Total Avg Dev. Score Z-Score
Sherman 001 16 75 -5.67 -0.8404
Sherman 1AW 16 75 -5.67 -0.8404
Worthington 1WW 16 83 2.33 0.3460
Worthington 1WW 16 79 -1.67 -0.2472
Worthington 2WW 8 79 -1.67 -0.2472
Worthington 1WW 8 93.00 12.33 1.8291
Sum 484.00
Mean 80.67
Variance 45.47
St Dev. 6.74
Learning Outcomes Analysis: Aggregate Data – All students
Course: 454 Outcome: 800.15L
Instructor Delivery Weeks Total Avg Dev. Score Z-Score
Sherman 001 16 75 -7.50 -0.8609
Sherman 1AW 16 75 -7.50 -0.8609
Worthington 1WW 16 94 11.50 1.3200
Worthington 1WW 16 79 -3.50 -0.4017
Worthington 2WW 8 79 -3.50 -0.4017
Worthington 1WW 8 93.00 10.50 1.2052
Sum 495.00
Mean 82.50
Variance 75.90
St Dev. 8.71
Course: 454 Aggregate Data
Instructor Delivery Weeks Total Avg Dev. Score Z-Score
Sherman 001 16 75.00 -7.90 -1.2605
Sherman 1AW 16 75.00 -7.90 -1.2605
Worthington 1WW 16 84.71 1.81 0.2885
Worthington 1WW 16 86.86 3.95 0.6302
Worthington 2WW 8 86.86 3.95 0.6302
Worthington 1WW 8 89.00 6.10 0.9719
Sum 497.43
Mean 82.90
Variance 39.33
St Dev. 6.27

62
77.00%
100.00%
95.29%
73.50%75.00%
93.50% 96.17% 93.38%
90.63%
80.31%
75.00%
96.71%
73.50%
86.85%
70.00%
75.00%
80.00%
85.00%
90.00%
95.00%
100.00%
2012-13 2013-14 2014-15 2015-16 2016-17 2017-18
CDIS 454: Percentage of Students Meeting Outcomesby Course Delivery Type
001
WW
AW

63
CDIS 455 Introduction to Research in CDIS
Measure(s)
CDIS 455.001) Demonstrate understanding of the basic tenets of ethical practices in Communication Sciences research.
CDIS 455.002) Demonstrate a basic knowledge of concepts in Communication Sciences research, including: observation and measurement, hypotheses and research questions, Type I/Type II errors, dependent and independent variables, experimental control, levels of evidence, extraneous or confounding variables, reliability, fidelity, validity, generalization, and social validity.
CDIS 455.003) Demonstrate a knowledge of group and single subject designs and the difference between design and statistics.
CDIS 455.004) Identify and explain research measures and outcomes: levels of measurement, normal distribution, parametric and non-parametric measurement, visual displays, central tendency, variability, correlation, regression, significance, power, alpha levels, independent t-test, and ANOVA/MANOVA.
Data Sources
Quiz/Exam
Quiz/Exam
Quiz/Exam
Quiz/Exam
Performance Criteria
70% of total students will meet course specific, entry-level competency for these outcome measures, based on the results of instructor selected assessments (i.e., skills performance, student projects, course notebooks, portfolios, scoring rubrics, graded assignments, quizzes, and/or exams, with a recommended cut-off score of 75% or higher, etc.)
Population/Timeline
CDIS 143, AY 2017-18
Learning Outcomes Analysis: Aggregate Data – All students
Course: 455 Outcome: 455.001
Instructor Delivery Weeks 455.001 Dev. Score Z-Score
Lingnau 001 16 83 -10.75 -1.3274
Lingnau 1AW 16 100 6.25 0.7718
Copple 1WW 16 100.00 6.25 0.7718
Copple 1WW 16 92.00 -1.75 -0.2161
Sum 375.00
Mean 93.75
Variance 65.58
St Dev. 8.10
Course: 455 Outcome: 455.002
Instructor Delivery Weeks 455.002 Dev. Score Z-Score
Lingnau 001 16 83 -8.25 -1.1796
Lingnau 1AW 16 100 8.75 1.2511
Copple 1WW 16 90.00 -1.25 -0.1787
Copple 1WW 16 92.00 0.75 0.1072
Sum 365.00
Mean 91.25
Variance 48.92
St Dev. 6.99
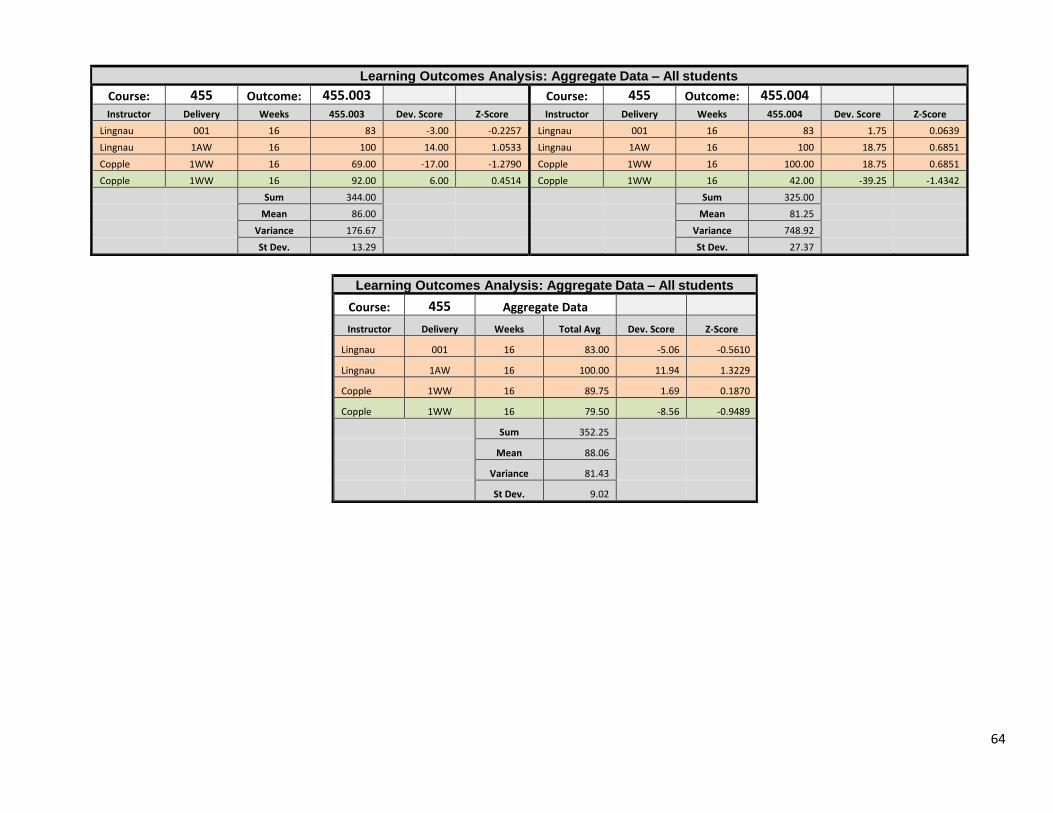
64
Learning Outcomes Analysis: Aggregate Data – All students
Course: 455 Outcome: 455.003
Instructor Delivery Weeks 455.003 Dev. Score Z-Score
Lingnau 001 16 83 -3.00 -0.2257
Lingnau 1AW 16 100 14.00 1.0533
Copple 1WW 16 69.00 -17.00 -1.2790
Copple 1WW 16 92.00 6.00 0.4514
Sum 344.00
Mean 86.00
Variance 176.67
St Dev. 13.29
Course: 455 Outcome: 455.004
Instructor Delivery Weeks 455.004 Dev. Score Z-Score
Lingnau 001 16 83 1.75 0.0639
Lingnau 1AW 16 100 18.75 0.6851
Copple 1WW 16 100.00 18.75 0.6851
Copple 1WW 16 42.00 -39.25 -1.4342
Sum 325.00
Mean 81.25
Variance 748.92
St Dev. 27.37
Learning Outcomes Analysis: Aggregate Data – All students
Course: 455 Aggregate Data
Instructor Delivery Weeks Total Avg Dev. Score Z-Score
Lingnau 001 16 83.00 -5.06 -0.5610
Lingnau 1AW 16 100.00 11.94 1.3229
Copple 1WW 16 89.75 1.69 0.1870
Copple 1WW 16 79.50 -8.56 -0.9489
Sum 352.25
Mean 88.06
Variance 81.43
St Dev. 9.02

65
Courses in the Process of Developing and/or Piloting Updated Student Learning Outcomes
• CDIS 243 Survey of Communicative Disorders o Course is in the process of transitioning to upper division; revising student learning outcomes.
• CDIS 493/593 TPS/Telepractice
• CDIS 493/593 TPS/Case Studies in Speech and Language
• CDIS 493/593 TPS/Professional Writing in Speech-Language Pathology
o To be included in the next assessment cycle
Performance Criteria
70% of total students will meet course specific, entry-level competency for these outcome measures, based on the results of instructor selected assessments (i.e., skills performance, student projects, course notebooks, portfolios, scoring rubrics, graded assignments, quizzes, and/or exams, with a recommended cut-off score of 75% or higher, etc.)
Population/Timeline
CDIS 243 (143), AY 2017-18
90.00%
95.00%
100.00% 100.00%
83.00%
70.00%
89.00%
100.00% 100.00%
84.62%
70.00%
75.00%
80.00%
85.00%
90.00%
95.00%
100.00%
2013-14 2014-15 2015-16 2016-17 2017-18
CDIS 455: Percentage of Students Meeting Outcomes by Course Delivery Type
001
AW
WW

66
Graduate Student Learning Objectives and Outcomes
Measure: Intended student learning outcome Performance Criteria: Standard against which performance is assessed
Outcome: Result Action Taken: Use of results to improve student learning
Graduate Learning Objective #1
CDIS graduate students will acquire entry-level competence with SLP knowledge and skills. Gen Ed. Competency? X No _ Yes Accreditation Objective? _ No X Yes
Measure(s)
1) Classroom based assessment – Students will show proficiency with core curricular knowledge presented in CDIS coursework by meeting all knowledge and skills outcomes (KASA).
Performance Criteria
1) 100% of graduating students will meet 100% of KASA outcomes before graduating.
Timeline/Population
1) Graduating students in 2017-18
Results
Finding(s) or Outcome(s)
1) 100% (50/50) of graduating students during 2017-18 met 100% of
KASA outcomes. Individual results are reported in each student’s
KASA.
Action(s) Taken
1) Continue plan unchanged
Timeline for Action(s)
1) AY 2018-19
Graduate Learning Objective #2
CDIS graduate students will learn to be competent researchers. Gen Ed. Competency? X No _ Yes Accreditation Objective? _ No X Yes
Measure(s)
2) Students will complete research as specified in the ENMU CDIS Graduate Handbook and the final research scoring rubric. This must include:
• Paper
• Poster
• Presentation
Performance Criteria
2) 100% of students will complete the project with a grade of B or better before graduating.
Timeline/Population
2) Graduating students in 2017-18
Results
Finding(s) or Outcome(s)
2) 100% (50/50) of students graduating during 2017-18 successfully completed their research project requirements with a grade of B or better.
Individual results are reported in each student’s KASA.
Action(s) Taken
2) Continue plan unchanged Note: 98% (46/47) of students taking 573 in SP17 earned a B or better (1 must re-take)
Timeline for Action(s)
2) AY 2018-19

67
Graduate Learning Objective #3
CDIS graduate students will demonstrate overall programmatic competence through completion of the capstone portfolio project.
Gen Ed. Competency? X No _ Yes Accreditation Objective? _ No X Yes
Measure(s)
3) Students will complete portfolio projects as specified in the ENMU CDIS Graduate Handbook and in the final portfolio scoring rubric
Performance Criteria
3) 100% of students will pass their portfolio assessment before graduating.
Timeline/Population
3) Graduating students in 2017-18
Results
Finding(s) or Outcome(s)
3) 100% (50/50) of students graduating during the 2017-18 academic year successfully passed their portfolio assessment.
Action(s) Taken
3) Continue plan unchanged
Timeline for Action(s)
3) AY 2018-19
Graduate Learning Objective #4
CDIS graduate students will pass the ETS Praxis National Examination in Speech/Language Pathology & Audiology (NESPA).
Gen Ed. Competency? X No _ Yes Accreditation Objective? _ No X Yes
Measure(s)
4) Students will pass their national exam (NESPA)
Performance Criteria
4) 80% of students will pass the NESPA within 1 year of graduation
Timeline/Population
4) Graduating students in 2017-18
Results
Finding(s) or Outcome(s)
4) 98% (49/50) of CDIS graduate students taking the exam in 2017-18 passed the NESPA within 3 months of graduation (see table below for detail)
Action(s) Taken
4) Continue plan unchanged
Timeline for Action(s)
4) AY 2018-19

68
Curricular Map of Graduate Student Learning Outcomes by Individual Course and Course Type
Measure = Intended student learning outcome Performance Criteria = Standard against which performance is assessed*
Outcome = Result Data Sources = Methodologies for collecting outcomes data
Color Key: FALL SPRING SUMMER Data Collection Format: Assessment Data Surveys
Performance criteria vary by outcome and by instructor – entry level competence differs across objectives. All students must pass all KASA outcomes prior to graduating. The data below is a snapshot of student competency with each KASA outcome at their first assessment attempt. This information is presented as evidence of program planning. The percentage of outcomes passed on the first attempt is influenced by many factors: undergraduate preparation, student information retention, faculty teaching, validity of assessment instruments, etc. The data below is one of many factors the program considers while modifying courses, curricula, resource requests, faculty load, student tutoring, etc.
The program uses student completion data, NESPA scores, and student employment rates post-graduation to assess the effectiveness of the program. We hope to use the data below to increase our overall efficiency and effectiveness.
CDIS 500 Research Methods in Communicative Disorders
Measure(s)
500.1) Understand necessary components of research (e.g., IRB, proposal, annotated bibliographies)
500.2) Differentiate research paradigms (qual/quan) and designs (e.g., descriptive, causal-comparative, correlation)
500.3) Differentiate knowledge of research methodology (i.e., subject, procedures, analysis, variables, etc.)
500.4) Describe validity, reliability, sampling, data collection, observation/recording, and scores/scales used in research
500.5) Discriminate dependent/independent variables and understand hypothesis testing
500.6) Explain basic statistical data (e.g., descriptive/inferential/psychometric stats, alpha, probability, error, power)
500.7) Understand essential components of quality research articles and apply required elements in a literature review (scientific justification, etc.)
500.8) Complete Protection of Human Research Participants Course
Data Sources
Skills performance, student projects, course notebooks, portfolios, scoring rubrics, graded assignments, quizzes, and/or exams.
Population/Timeline
CDIS 500, AY 2017-18

69
Learning Outcomes Analysis: Aggregate Data – All students
Course: 500 Outcome: 500.1
Instructor Delivery Weeks Total Avg Dev. Score Z-Score
Swift 001 16 96.00 1.00 0.7071
Swift 1SW 16 94.00 -1.00 -0.7071
Sum 190.00
Mean 95.00
Variance 2.00
St Dev. 1.41
Course: 500 Outcome: 500.2
Instructor Delivery Weeks Total Avg Dev. Score Z-Score
Swift 001 16 56.00 -3.00 0.6703
Swift 1SW 16 62.00 3.00 0.7421
Sum 118.00
Mean 59.00
Variance 6980.00
St Dev. 83.55
Learning Outcomes Analysis: Aggregate Data – All students
Course: 500 Outcome: 500.3
Instructor Delivery Weeks Total Avg Dev. Score Z-Score
Swift 001 16 64.00 -11.00 0.5970
Swift 1SW 16 86.00 11.00 0.8022
Sum 150.00
Mean 75.00
Variance 11492.00
St Dev. 107.20
Course: 500 Outcome: 500.4
Instructor Delivery Weeks Total Avg Dev. Score Z-Score
Swift 001 16 91.00 1.50 0.7189
Swift 1SW 16 88.00 -1.50 0.6952
Sum 179.00
Mean 89.50
Variance 16025.00
St Dev. 126.59
Learning Outcomes Analysis: Aggregate Data – All students
Course: 500 Outcome: 500.5
Instructor Delivery Weeks Total Avg Dev. Score Z-Score
Swift 001 16 73.00 8.50 0.7934
Swift 1SW 16 56.00 j-8.50 0.6087
Sum 129.00
Mean 64.50
Variance 8465.00
St Dev. 92.01
Course: 500 Outcome: 500.6
Instructor Delivery Weeks Total Avg Dev. Score Z-Score
Swift 001 16 55.00 -7.50 0.6178
Swift 1SW 16 70.00 7.50 0.7863
Sum 125.00
Mean 62.50
Variance 7925.00
St Dev. 89.02

70
Learning Outcomes Analysis: Aggregate Data – All students
Course: 500 Outcome: 500.7
Instructor Delivery Weeks Total Avg Dev. Score Z-Score
Swift 001 16 100.00 2.00 0.7214
Swift 1SW 16 96.00 -2.00 0.6925
Sum 196.00
Mean 98.00
Variance 19216.00
St Dev. 138.62
Course: 500 Outcome: 500.8
Instructor Delivery Weeks Total Avg Dev. Score Z-Score
Swift 001 16 100.00 0.00 0.7071
Swift 1SW 16 100.00 0.00 0.7071
Sum 200.00
Mean 100.00
Variance 20000.00
St Dev. 141.42
Learning Outcomes Analysis: Aggregate Data – All students
Course: 500 Aggregate Data
Instructor Delivery Weeks Total Avg Dev. Score Z-Score
Swift 001 16 79.38 -10.13 -0.0800
Swift 1SW 16 81.50 -8.00 -0.0632
Sum 160.88
Mean 80.44
Variance 166.52
St Dev. 12.90
First assessment cycle – no trend data

71
CDIS 504 Fundamentals of Clinical Practice
Measure(s)
504.1) Explain the rules and principles of the Code of Ethics 504.2) Explain the scope of practice for speech-language pathologists as defined
by ASHA, the CFR, and the state of NM 504.3) Understand current DOE policy (in CFR), NM state standards, and other
legislation which impacts service delivery in educational and health care settings (e.g., HCFA, IDEA, NCLB)
504.4) Show competency with clinical forms/writing (i.e., lesson plan, progress note,
goals/objectives) 504.5) Understand principles of cognitive and behavioral psychology/applied
behavioral analysis, to include task analysis, ecological inventory, and incorporation of ADL domains into the therapeutic process)
504.6) Understand basic intervention techniques (e.g., prompting/assist, modeling,
imitation, rehearsal, signal modification, feedback, prepractice) 504.7) Differentiate basic intervention methods (facilitation, maintenance,
induction), models (speaker-oriented, communication-oriented, child-centered, clinician-directed, hybrid), and approaches to target population profiles (indirect language stimulation, whole language, drill, script therapy, Milieu teaching, focused stimulation, vertical structuring)
504.8) Collect and interpret basic case history information 504.9) Participate in IPE activities, demonstrate team-building skills, and articulate
skills learned during transdisciplinary education 504.11) Complete a prevention activity AND locate and provide information about
educational/resource individuals, groups, and relevant organizations that address communication disorders (including prevention)
Data Sources
Skills performance, student projects, course notebooks, portfolios, scoring rubrics, graded assignments, quizzes, and/or exams.
Population/Timeline
CDIS ____, AY 2017-18

72
Learning Outcomes Analysis: Aggregate Data – All students
Course: 504 Outcome: 504.1
Instructor Delivery Weeks Total Avg Dev. Score Z-Score
Wilkerson 001 16 100.00 0.00
Wilkerson 001 16 100.00 0.00
Sum 200.00
Mean 100.00
Variance 0.00
St Dev. 0.00
Course: 504 Outcome: 504.2
Instructor Delivery Weeks Total Avg Dev. Score Z-Score
Wilkerson 001 16 100.00 0.00
Wilkerson 001 16 100.00 0.00
Sum 200.00
Mean 100.00
Variance 0.00
St Dev. 0.00
Learning Outcomes Analysis: Aggregate Data – All students
Course: 504 Outcome: 504.3
Instructor Delivery Weeks Total Avg Dev. Score Z-Score
Wilkerson 001 16 100.00 1.50 0.7071
Wilkerson 001 16 97.00 -1.50 -0.7071
Sum 197.00
Mean 98.50
Variance 4.50
St Dev. 2.12
Course: 504 Outcome: 504.4
Instructor Delivery Weeks Total Avg Dev. Score Z-Score
Wilkerson 001 16 84.00 0.00
Wilkerson 001 16 84.00 0.00
Sum 168.00
Mean 84.00
Variance 0.00
St Dev. 0.00
Learning Outcomes Analysis: Aggregate Data – All students
Course: 504 Outcome: 504.5
Instructor Delivery Weeks Total Avg Dev. Score Z-Score
Wilkerson 001 16 84.00 -6.50 -0.7071
Wilkerson 001 16 97.00 6.50 0.7071
Sum 181.00
Mean 90.50
Variance 84.50
St Dev. 9.19
Course: 504 Outcome: 504.6
Instructor Delivery Weeks Total Avg Dev. Score Z-Score
Wilkerson 001 16 85.00 -6.00 -0.7071
Wilkerson 001 16 97.00 6.00 0.7071
Sum 182.00
Mean 91.00
Variance 72.00
St Dev. 8.49

73
Learning Outcomes Analysis: Aggregate Data – All students
Course: 504 Outcome: 504.7
Instructor Delivery Weeks Total Avg Dev. Score Z-Score
Wilkerson 001 16 86.00 -4.50 -0.7071
Wilkerson 001 16 95.00 4.50 0.7071
Sum 181.00
Mean 90.50
Variance 40.50
St Dev. 6.36
Course: 504 Outcome: 504.8
Instructor Delivery Weeks Total Avg Dev. Score Z-Score
Wilkerson 001 16 93.00 6.50 0.7071
Wilkerson 001 16 80.00 -6.50 -0.7071
Sum 173.00
Mean 86.50
Variance 84.50
St Dev. 9.19
Learning Outcomes Analysis: Aggregate Data – All students
Course: 504 Outcome: 504.9
Instructor Delivery Weeks Total Avg Dev. Score Z-Score
Wilkerson 001 16 100.00 1.50 0.7071
Wilkerson 001 16 97.00 -1.50 -0.7071
Sum 197.00
Mean 98.50
Variance 4.50
St Dev. 2.12
Course: 504 Outcome: 504.11
Instructor Delivery Weeks Total Avg Dev. Score Z-Score
Wilkerson 001 16 100.00 0.00
Wilkerson 001 16 100.00 0.00
Sum 200.00
Mean 100.00
Variance 0.00
St Dev. 0.00
Learning Outcomes Analysis: Aggregate Data – All students
Course: 504 Aggregate Data
Instructor Delivery Weeks Total Avg Dev. Score Z-Score
Wilkerson 001 16 93.20 9.20 0.6520
Wilkerson 001 16 94.70 10.70 0.7583
Sum 187.90
Mean 93.95
Variance 199.13
St Dev. 14.11
First assessment cycle – no trend data

74
CDIS 511 Articulation/Phonological Disorders
Measure(s)
511.1) Relate anatomical and physiological substrates of speech to normal and disordered articulation
511.2) Relate speech/phonological development theories to normal and disordered articulation 511.3) List/explain developmental milestones of speech/phonological skills
acquisition, to include auditory skills, phonological development, and the impact of culture on accent and dialect development
511.4) Phonetically transcribe disordered articulation (using diacritics
appropriately) 511.5) Describe the psychosocial impact of phonological/articulation disorders 511.6) Apply various classification systems to articulation productions (PMV,
Distinctive Features, Phonological Processes) 511.7) Apply motor learning theory and principles to speech assessment and
articulation interventions 511.8) Differentially select assessment methodologies based on presentation of
articulatory characteristics; describe multiple assessment practices, to include both norm and criterion referenced methods (i.e., standardized assessments and speech samples)
511.9) Classify misarticulations according to developmental/non-developmental,
age-appropriate/age-inappropriate, mislearned/functional (traditional vs. compensatory)/obligatory, and motor-based/phonological categories
511.11) Identify etiologies of and discriminate dysarthria, apraxia, articulation
disorder, phonological processing disorder, structural deviations error, motor-based difficulty, and misarticulation resulting from mislearning; describe probable characteristics of articulation resulting from differential etiologies
511.12) Differentiate articulation/phonological delay vs. disorder vs. difference; discriminate cultural or dialectal differences from articulation disorders 511.13) Design appropriate intervention for various articulatory error profiles, including prevention whenever possible
Data Sources
Skills performance, student projects, course notebooks, portfolios, scoring rubrics, graded assignments, quizzes, and/or exams.
Population/Timeline
CDIS 511, AY 2017-18

75
Learning Outcomes Analysis: Aggregate Data – All students
Course: 511 Outcome: 511.1
Instructor Delivery Weeks Total Avg Dev. Score Z-Score
Swift 001 8 100.00 5.00 0.7071
Swift 1SW 8 90.00 -5.00 -0.7071
Sum 190.00
Mean 95.00
Variance 50.00
St Dev. 7.07
Course: 511 Outcome: 511.2
Instructor Delivery Weeks Total Avg Dev. Score Z-Score
Swift 001 8 67.00 -5.00 -0.7071
Swift 1SW 8 77.00 5.00 0.7071
Sum 144.00
Mean 72.00
Variance 50.00
St Dev. 7.07
Learning Outcomes Analysis: Aggregate Data – All students
Course: 511 Outcome: 511.3
Instructor Delivery Weeks Total Avg Dev. Score Z-Score
Swift 001 8 67.00 -5.00 -0.7071
Swift 1SW 8 77.00 5.00 0.7071
Sum 144.00
Mean 72.00
Variance 50.00
St Dev. 7.07
Course: 511 Outcome: 511.4
Instructor Delivery Weeks Total Avg Dev. Score Z-Score
Swift 001 8 100.00 0.00
Swift 1SW 8 100.00 0.00 Sum 200.00
Mean 100.00
Variance 0.00
St Dev. 0.00
Learning Outcomes Analysis: Aggregate Data – All students
Course: 511 Outcome: 511.5
Instructor Delivery Weeks Total Avg Dev. Score Z-Score
Swift 001 8 67.00 -5.00 9.4752
Swift 1SW 8 77.00 5.00 10.8894
Sum 144.00
Mean 72.00
Variance 50.00
St Dev. 7.07
Course: 511 Outcome: 511.6
Instructor Delivery Weeks Total Avg Dev. Score Z-Score
Swift 001 8 100.00 2.00 0.7071
Swift 1SW 8 96.00 -2.00 -0.7071
Sum 196.00
Mean 98.00
Variance 8.00
St Dev. 2.83

76
Learning Outcomes Analysis: Aggregate Data – All students
Course: 511 Outcome: 511.7
Instructor Delivery Weeks Total Avg Dev. Score Z-Score
Swift 001 8 67.00 -3.00 -0.7071
Swift 1SW 8 73.00 3.00 0.7071
Sum 140.00
Mean 70.00
Variance 18.00
St Dev. 4.24
Course: 511 Outcome: 511.8
Instructor Delivery Weeks Total Avg Dev. Score Z-Score
Swift 001 8 75.00 0.00 Swift 1SW 8 75.00 0.00 Sum 150.00
Mean 75.00
Variance 0.00
St Dev. 0.00
Learning Outcomes Analysis: Aggregate Data – All students
Course: 511 Outcome: 511.9
Instructor Delivery Weeks Total Avg Dev. Score Z-Score
Swift 001 8 67.00 -4.00 -0.7071
Swift 1SW 8 75.00 4.00 0.7071
Sum 142.00
Mean 71.00
Variance 32.00
St Dev. 5.66
Course: 511 Outcome: 511.11
Instructor Delivery Weeks Total Avg Dev. Score Z-Score
Swift 001 8 75.00 0.00 Swift 1SW 8 75.00 0.00 Sum 150.00
Mean 75.00
Variance 0.00
St Dev. 0.00
Learning Outcomes Analysis: Aggregate Data – All students
Course: 511 Outcome: 511.12
Instructor Delivery Weeks Total Avg Dev. Score Z-Score
Swift 001 8 67.00 -4.00 -0.7071
Swift 1SW 8 75.00 4.00 0.7071
Sum 142.00
Mean 71.00
Variance 32.00
St Dev. 5.66
Course: 511 Outcome: 511.13
Instructor Delivery Weeks Total Avg Dev. Score Z-Score
Swift 001 8 67.00 -4.00 -0.8944
Swift 1SW 8 73.00 2.00 0.4472
Sum 140.00
Mean 70.00
Variance 20.00
St Dev. 4.47

77
Learning Outcomes Analysis: Aggregate Data – All students
Course: 511 Aggregate Data
Instructor Delivery Weeks Total Avg Dev. Score Z-Score
Swift 001 8 69.67 -30.33 -0.7717
Swift 1SW 8 75.00 -25.00 -0.6360
Sum 144.67
Mean 72.33
Variance 1545.11
St Dev. 39.31
First assessment cycle – no trend data

78
CDIS 512 Voice Disorders
Measure(s)
512.1) Understand normal respiratory and laryngeal/phonatory anatomy and physiology/neurophysiology, including changes across the lifespan
512.2) Describe the relationship of perceptual voice characteristics to physical
correlates of sound 512.3) Differentiate neurogenic, structural, hyperfunctional, psychogenic, and
systemic etiologies of voice disorders 512.4) Describe characteristics of voice disorders (pitch, loudness, quality) and the
perceptual and laryngoscopic findings associated with each 512.5) Understand prevention, assessment, and treatment methodologies
appropriate to specific conditions resulting in voice disorders; Use EBP to justify actions
Data Sources
Skills performance, student projects, course notebooks, portfolios, scoring rubrics, graded assignments, quizzes, and/or exams.
Population/Timeline
CDIS 512, AY 2017-18
Learning Outcomes Analysis: Aggregate Data – All students
Course: 512 Outcome: 512.1
Instructor Delivery Weeks Total Avg Dev. Score Z-Score
Copple 001 16 100.00 12.50 0.7071
Copple 1SW 16 75.00 -12.50 -0.7071
Sum 175.00
Mean 87.50
Variance 312.50
St Dev. 17.68
Course: 512 Outcome: 512.2
Instructor Delivery Weeks Total Avg Dev. Score Z-Score
Copple 001 16 86.00 12.00 0.7071
Copple 1SW 16 62.00 -12.00 -0.7071
Sum 148.00
Mean 74.00
Variance 288.00
St Dev. 16.97
Learning Outcomes Analysis: Aggregate Data – All students
Course: 512 Outcome: 512.3
Instructor Delivery Weeks Total Avg Dev. Score Z-Score
Copple 001 16 86.00 15.50 0.7071
Copple 1SW 16 55.00 -15.50 -0.7071
Sum 141.00
Mean 70.50
Variance 480.50
St Dev. 21.92
Course: 512 Outcome: 512.4
Instructor Delivery Weeks Total Avg Dev. Score Z-Score
Copple 001 16 86.00 -6.00 -0.7071
Copple 1SW 16 98.00 6.00 0.7071
Sum 184.00
Mean 92.00
Variance 72.00
St Dev. 8.49

79
Learning Outcomes Analysis: Aggregate Data – All students
Course: 512 Outcome: 512.5
Instructor Delivery Weeks Total Avg Dev. Score Z-Score
Copple 001 16 43.00 -6.00 -0.7071
Copple 1SW 16 55.00 6.00 0.7071
Sum 98.00
Mean 49.00
Variance 72.00
St Dev. 8.49
Course: 512 Aggregate Data
Instructor Delivery Weeks Total Avg Dev. Score Z-Score
Copple 001 16 80.20 -11.80 -1.3906
Copple 1SW 16 69.00 -23.00 -2.7106
Sum 149.20
Mean 74.60
Variance 668.24
St Dev. 25.85
First assessment cycle – no trend data

80
CDIS 516 Language Assessment
Measure(s)
516.1) Relate language development theories to normal and disordered language productions
516.2) Describe the development of prelinguistic communication, language,
cognition, and social behaviors; describe milestones to include listening, speaking, reading,and writing
516.3) Explain the reciprocal relationships between language, cognition,
psychological/psychosocial factors, and environment (including culture and poverty) to include listening, speaking, reading,and writing
516.4) Identify preventative measures, causes, characteristics, and contributing
factors for receptive and expressive language delays and disorders in listening, speaking, reading, and writing with consideration for cognitive and psychosocial factors
516.5) Understand basic principles of assessment, including NRT, CRT, SS,
percentile rankings, etc.; understand confounding variables impacting assessment and present strategies for addressing them (e.g., attention, memory, behavior, culture, language/dialect)
516.6) Assess all modalities of developmental language disorders using multiple
instruments and methodologies (listening, speaking, reading, and writing) 516.7) Describe assessment, characteristics of, and interventions for central
auditory processing disorders 516.8) Identify effective modifications and alternative models for traditional
language assessment (e.g., dynamic assessment, extension testing, authentic assessment, portfolio assessment)
516.9) Assess and analyze paralinguistics, semantics, phonology/literacy,
morphology/syntax, pragmatics, problem-solving, narrative, organization, meta-linguistics across the lifespan using NRT, CRT, and language/writing samples
516.11) Interpret language assessment results 516.12) Compose goals/objectives based on assessment and compose preliminary POC for language disordered profiles
Data Sources
Skills performance, student projects, course notebooks, portfolios, scoring rubrics, graded assignments, quizzes, and/or exams.
Population/Timeline
CDIS 516, AY 2017-18

81
Learning Outcomes Analysis: Aggregate Data – All students
Course: 516 Outcome: 516.1
Instructor Delivery Weeks Total Avg Dev. Score Z-Score
Swift 001 16 100.00 4.00 0.7071
Swift 1SW 16 92.00 -4.00 -0.7071
Sum 192.00
Mean 96.00
Variance 32.00
St Dev. 5.66
Course: 516 Outcome: 516.2
Instructor Delivery Weeks Total Avg Dev. Score Z-Score
Swift 001 16 73.00 -6.00 -0.7071
Swift 1SW 16 85.00 6.00 0.7071
Sum 158.00
Mean 79.00
Variance 72.00
St Dev. 8.49
Learning Outcomes Analysis: Aggregate Data – All students
Course: 516 Outcome: 516.3
Instructor Delivery Weeks Total Avg Dev. Score Z-Score
Swift 001 16 100.00 1.00 0.7071
Swift 1SW 16 98.00 -1.00 -0.7071
Sum 198.00
Mean 99.00
Variance 2.00
St Dev. 1.41
Course: 516 Outcome: 516.4
Instructor Delivery Weeks Total Avg Dev. Score Z-Score
Swift 001 16 82.00 0.50 0.7071
Swift 1SW 16 81.00 -0.50 -0.7071
Sum 163.00
Mean 81.50
Variance 0.50
St Dev. 0.71
Learning Outcomes Analysis: Aggregate Data – All students
Course: 516 Outcome: 516.5
Instructor Delivery Weeks Total Avg Dev. Score Z-Score
Swift 001 16 82.00 -7.00 -0.7071
Swift 1SW 16 96.00 7.00 0.7071
Sum 178.00
Mean 89.00
Variance 98.00
St Dev. 9.90
Course: 516 Outcome: 516.6
Instructor Delivery Weeks Total Avg Dev. Score Z-Score
Swift 001 16 73.00 -9.50 -0.7071
Swift 1SW 16 92.00 9.50 0.7071
Sum 165.00
Mean 82.50
Variance 180.50
St Dev. 13.44

82
Learning Outcomes Analysis: Aggregate Data – All students
Course: 516 Outcome: 516.7
Instructor Delivery Weeks Total Avg Dev. Score Z-Score
Swift 001 16
Swift 1SW 16
Sum 0.00
Mean
Variance 0.00
St Dev. 0.00
Course: 516 Outcome: 516.8
Instructor Delivery Weeks Total Avg Dev. Score Z-Score
Swift 001 16 91.00 -3.50 -0.7071
Swift 1SW 16 98.00 3.50 0.7071
Sum 189.00
Mean 94.50
Variance 24.50
St Dev. 4.95
Learning Outcomes Analysis: Aggregate Data – All students
Course: 516 Outcome: 516.9
Instructor Delivery Weeks Total Avg Dev. Score Z-Score
Swift 001 16 73.00 -9.50 -0.7071
Swift 1SW 16 92.00 9.50 0.7071
Sum 165.00
Mean 82.50
Variance 180.50
St Dev. 13.44
Course: 516 Outcome: 516.11
Instructor Delivery Weeks Total Avg Dev. Score Z-Score
Swift 001 16 91.00 -3.50 -0.7071
Swift 1SW 16 98.00 3.50 0.7071
Sum 189.00
Mean 94.50
Variance 24.50
St Dev. 4.95
Learning Outcomes Analysis: Aggregate Data – All students
Course: 516 Outcome: 516.12
Instructor Delivery Weeks Total Avg Dev. Score Z-Score
Swift 001 16 91.00 -3.50 -0.7071
Swift 1SW 16 98.00 3.50 0.7071
Sum 189.00
Mean 94.50
Variance 24.50
St Dev. 4.95
Course: 516 Aggregate Data
Instructor Delivery Weeks Total Avg Dev. Score Z-Score
Swift 001 16 86.00 4.50 6.3640
Swift 1SW 16 94.33 12.83 18.1491
Sum 180.33
Mean 90.17
Variance 184.94
St Dev. 13.60
First assessment cycle – no trend data

83
CDIS 517 Language Intervention
Measure(s)
517.1) Apply specific language theories and principles of language development to intervention planning
517.2) Design intervention with consideration for environmental variables;
incorporate culture, dialect, and difference into language therapy planning 517.3) Describe common characteristics of language intervention programs used
with birth to 3, preschool, early and late elementary, middle school, and older adolescent clients
517.4) Describe communication characteristics of certain disabilities and be familiar
with programs and procedures commonly used for intervention (e.g., LD, MR, CAPD, Autism, deafness)
517.5) Describe specific characteristics of rehabilitation programs for hard of
hearing, deaf, and individuals with hearing aids/cochlear implants to include total communication, oral/aural intervention programs, and strategies for working with interpreters
517.6) Understand best practices in self-contained, inclusionary, consultative, and
collaborative intervention models 517.7) Understand intervention methodologies for developmental language
disorders across listening, speaking, reading, and writing modalities 517.8) Design appropriate intervention for various language delay/disorder profiles,
to include cognitive and psychosocial aspects in the classroom and home programs for generalization and maintenance
Data Sources
Skills performance, student projects, course notebooks, portfolios, scoring rubrics, graded assignments, quizzes, and/or exams.
Population/Timeline
CDIS 517, AY 2017-18
Learning Outcomes Analysis: Aggregate Data – All students
Course: 517 Outcome: 517.1
Instructor Delivery Weeks Total Avg Dev. Score Z-Score
Lebsack 001 16 100.00 0.00 Lebsack 1SW 16 100.00 0.00 Sum 200.00
Mean 100.00
Variance 0.00
St Dev. 0.00
Course: 517 Outcome: 517.2
Instructor Delivery Weeks Total Avg Dev. Score Z-Score
Lebsack 001 16 100.00 0.00 Lebsack 1SW 16 100.00 0.00 Sum 200.00
Mean 100.00
Variance 0.00
St Dev. 0.00

84
Learning Outcomes Analysis: Aggregate Data – All students
Course: 517 Outcome: 517.3
Instructor Delivery Weeks Total Avg Dev. Score Z-Score
Lebsack 001 16 100.00 0.00 Lebsack 1SW 16 100.00 0.00 Sum 200.00
Mean 100.00
Variance 0.00
St Dev. 0.00
Course: 517 Outcome: 517.4
Instructor Delivery Weeks Total Avg Dev. Score Z-Score
Lebsack 001 16 100.00 0.00 Lebsack 1SW 16 100.00 0.00 Sum 200.00
Mean 100.00
Variance 0.00
St Dev. 0.00
Learning Outcomes Analysis: Aggregate Data – All students
Course: 517 Outcome: 517.5
Instructor Delivery Weeks Total Avg Dev. Score Z-Score
Lebsack 001 16 100.00 0.00 Lebsack 1SW 16 100.00 0.00 Sum 200.00
Mean 100.00
Variance 0.00
St Dev. 0.00
Course: 517 Outcome: 517.6
Instructor Delivery Weeks Total Avg Dev. Score Z-Score
Lebsack 001 16 100.00 0.00 Lebsack 1SW 16 100.00 0.00 Sum 200.00
Mean 100.00
Variance 0.00
St Dev. 0.00
Learning Outcomes Analysis: Aggregate Data – All students
Course: 517 Outcome: 517.7
Instructor Delivery Weeks Total Avg Dev. Score Z-Score
Lebsack 001 16 100.00 0.00 Lebsack 1SW 16 100.00 0.00 Sum 200.00
Mean 100.00
Variance 0.00
St Dev. 0.00
Course: 517 Outcome: 517.8
Instructor Delivery Weeks Total Avg Dev. Score Z-Score
Lebsack 001 16 100.00 0.00 Lebsack 1SW 16 100.00 0.00 Sum 200.00
Mean 100.00
Variance 0.00
St Dev. 0.00

85
Learning Outcomes Analysis: Aggregate Data – All students
Course: 517 Aggregate Data
Instructor Delivery Weeks Total Avg Dev. Score Z-Score
Lebsack 001 16 100.00 0.00
Lebsack 1SW 16 100.00 0.00
Sum 200.00
Mean 100.00
Variance 0.00
St Dev. 0.00
First assessment cycle – no trend data
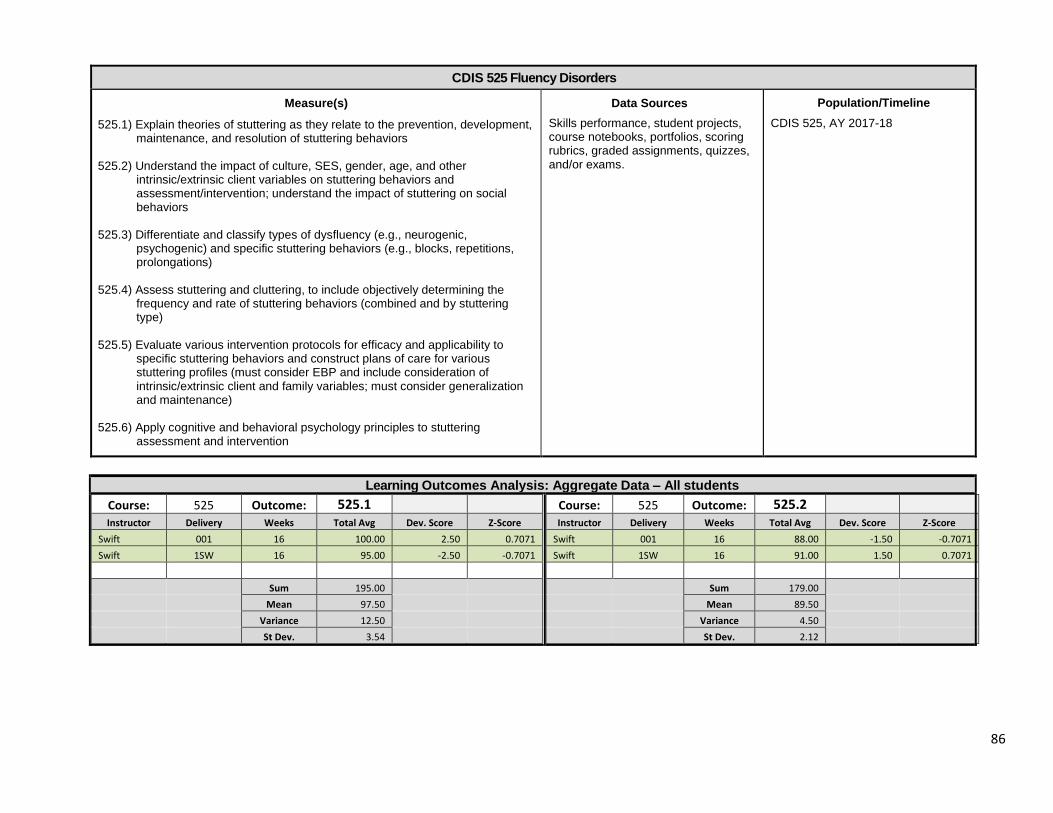
86
CDIS 525 Fluency Disorders
Measure(s)
525.1) Explain theories of stuttering as they relate to the prevention, development, maintenance, and resolution of stuttering behaviors
525.2) Understand the impact of culture, SES, gender, age, and other
intrinsic/extrinsic client variables on stuttering behaviors and assessment/intervention; understand the impact of stuttering on social behaviors
525.3) Differentiate and classify types of dysfluency (e.g., neurogenic,
psychogenic) and specific stuttering behaviors (e.g., blocks, repetitions, prolongations)
525.4) Assess stuttering and cluttering, to include objectively determining the
frequency and rate of stuttering behaviors (combined and by stuttering type)
525.5) Evaluate various intervention protocols for efficacy and applicability to
specific stuttering behaviors and construct plans of care for various stuttering profiles (must consider EBP and include consideration of intrinsic/extrinsic client and family variables; must consider generalization and maintenance)
525.6) Apply cognitive and behavioral psychology principles to stuttering
assessment and intervention
Data Sources
Skills performance, student projects, course notebooks, portfolios, scoring rubrics, graded assignments, quizzes, and/or exams.
Population/Timeline
CDIS 525, AY 2017-18
Learning Outcomes Analysis: Aggregate Data – All students
Course: 525 Outcome: 525.1
Instructor Delivery Weeks Total Avg Dev. Score Z-Score
Swift 001 16 100.00 2.50 0.7071
Swift 1SW 16 95.00 -2.50 -0.7071
Sum 195.00
Mean 97.50
Variance 12.50
St Dev. 3.54
Course: 525 Outcome: 525.2
Instructor Delivery Weeks Total Avg Dev. Score Z-Score
Swift 001 16 88.00 -1.50 -0.7071
Swift 1SW 16 91.00 1.50 0.7071
Sum 179.00
Mean 89.50
Variance 4.50
St Dev. 2.12

87
Learning Outcomes Analysis: Aggregate Data – All students
Course: 525 Outcome: 525.3
Instructor Delivery Weeks Total Avg Dev. Score Z-Score
Swift 001 16 100.00 0.00
Swift 1SW 16 100.00 0.00
Sum 200.00
Mean 100.00
Variance 0.00
St Dev. 0.00
Course: 525 Outcome: 525.4
Instructor Delivery Weeks Total Avg Dev. Score Z-Score
Swift 001 16 100.00 2.50 0.7071
Swift 1SW 16 95.00 -2.50 -0.7071
Sum 195.00
Mean 97.50
Variance 12.50
St Dev. 3.54
Learning Outcomes Analysis: Aggregate Data – All students
Course: 525 Outcome: 525.5
Instructor Delivery Weeks Total Avg Dev. Score Z-Score
Swift 001 16 100.00 1.00 0.7071
Swift 1SW 16 98.00 -1.00 -0.7071
Sum 198.00
Mean 99.00
Variance 2.00
St Dev. 1.41
Course: 525 Outcome: 525.6
Instructor Delivery Weeks Total Avg Dev. Score Z-Score
Swift 001 16 88.00 2.50 0.7071
Swift 1SW 16 83.00 -2.50 -0.7071
Sum 171.00
Mean 85.50
Variance 12.50
St Dev. 3.54
Learning Outcomes Analysis: Aggregate Data – All students
Course: 525 Aggregate Data
Instructor Delivery Weeks Total Avg Dev. Score Z-Score
Swift 001 16 96.00 -1.50 -0.4243
Swift 1SW 16 93.67 -3.83 -1.0842
Sum 189.67
Mean 94.83
Variance 16.94
St Dev. 4.12
First assessment cycle – no trend data

88
CDIS 526 Neurogenic Speech Disorders
Measure(s)
526.1) Understand CNS systems and pathways important for speech production 526.2) Understand etiology and site of lesion for each type of neurogenic motor
speech disorder; Use case history information to support dx 526.3) Discriminate different types of motor speech disorders by characteristics 526.4) Assess underlying neuromotor symptomology for motor speech disorders 526.5) Treat underlying neuromotor symptomology for motor speech disorders 526.6) Understand how different types of motor speech disorders affect each
component of the speech system (i.e., respiratory, phonatory, articulatory, resonatory, prosodic)
Data Sources
Skills performance, student projects, course notebooks, portfolios, scoring rubrics, graded assignments, quizzes, and/or exams.
Population/Timeline
CDIS 526, AY 2017-18
Learning Outcomes Analysis: Aggregate Data – All students
Course: 526 Outcome: 526.1
Instructor Delivery Weeks Total Avg Dev. Score Z-Score
Weems 001 16 66.00 3.00 0.7071
Weems 1SW 16 60.00 -3.00 -0.7071
Sum 126.00
Mean 63.00
Variance 18.00
St Dev. 4.24
Course: 526 Outcome: 526.2
Instructor Delivery Weeks Total Avg Dev. Score Z-Score
Weems 001 16 86.00 -1.50 -0.7071
Weems 1SW 16 89.00 1.50 0.7071
Sum 175.00
Mean 87.50
Variance 4.50
St Dev. 2.12
Learning Outcomes Analysis: Aggregate Data – All students
Course: 526 Outcome: 526.3
Instructor Delivery Weeks Total Avg Dev. Score Z-Score
Weems 001 16 86.00 1.00 0.7071
Weems 1SW 16 84.00 -1.00 -0.7071
Sum 170.00
Mean 85.00
Variance 2.00
St Dev. 1.41
Course: 526 Outcome: 526.4
Instructor Delivery Weeks Total Avg Dev. Score Z-Score
Weems 001 16 79.00 -1.00 -0.7071
Weems 1SW 16 81.00 1.00 0.7071
Sum 160.00
Mean 80.00
Variance 2.00
St Dev. 1.41

89
Learning Outcomes Analysis: Aggregate Data – All students
Course: 526 Outcome: 526.5
Instructor Delivery Weeks Total Avg Dev. Score Z-Score
Weems 001 16 100.00 15.00 0.7071
Weems 1SW 16 70.00 -15.00 -0.7071
Sum 170.00
Mean 85.00
Variance 450.00
St Dev. 21.21
Course: 526 Outcome: 526.6
Instructor Delivery Weeks Total Avg Dev. Score Z-Score
Weems 001 16 52.00 -1.00 -0.7071
Weems 1SW 16 54.00 1.00 0.7071
Sum 106.00
Mean 53.00
Variance 2.00
St Dev. 1.41
Learning Outcomes Analysis: Aggregate Data – All students
Course: 526 Aggregate Data
Instructor Delivery Weeks Total Avg Dev. Score Z-Score
Weems 001 16 78.17 -1.83 -1.2964
Weems 1SW 16 73.00 -7.00 -4.9497
Sum 151.17
Mean 75.58
Variance 52.36
St Dev. 7.24
First assessment cycle – no trend data

90
CDIS 527 Craniofacial Anomalies
Measure(s)
527.1) Understand basic principles of genetics and the embryological development of craniofacial structures
527.2) Understand the relationship between communication disorders,
chromosomal/genetic conditions, and their neurological/anatomical correlates
527.3) Understand etiological, anatomical/physiological, cognitive, and
psychosocial/cultural components of craniofacial management 527.4) Understand mechanisms, etiologies, characteristics, and prevention, for
hearing disorders; understand the impact of types and degrees of hearing loss
527.5) Understand assessment and intervention for hearing disorders, to include
types and severities of loss and aided/unaided interventions; read and interpret audiogram and basic tympanometric data; Justify decisions with EBP support
527.6) Identify characteristics of craniofacial anomalies/cleft palate types (including
classifications) and their associated articulatory/resonatory correlates 527.7) Assess, discriminate, and design intervention for various craniofacial profiles
resulting in multiple communication disorder characteristics, including referral as necessary (e.g., feeding, hearing loss, language, resonance, and articulation to include phonological, functional/compensatory, motoric, and obligatory speech errors); Justify decisions with EBP
527.8) Understand primary and secondary treatment procedures for addressing
craniofacial anomalies and accompanying complications, including communication disorders: justify conclusions using EBP support
527.9) Understand etiologies, characteristics, assessment, and interventions
(including referral) for disorders of resonance: hypernasal, hyponasal, cul-de-sac, and mixed resonances; knowledge of VP Incompetence, VP Insufficiency, VPM, and prosthetic management devices is required
Data Sources
Skills performance, student projects, course notebooks, portfolios, scoring rubrics, graded assignments, quizzes, and/or exams.
Population/Timeline
CDIS 527, AY 2017-18
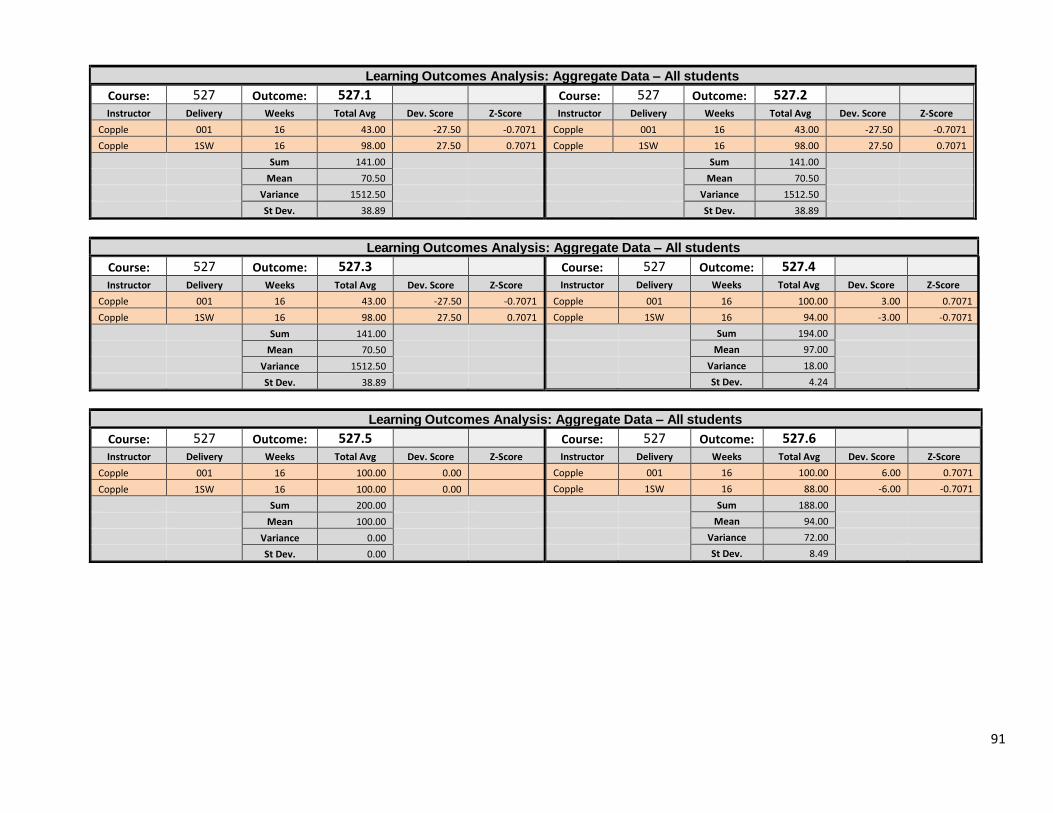
91
Learning Outcomes Analysis: Aggregate Data – All students
Course: 527 Outcome: 527.1
Instructor Delivery Weeks Total Avg Dev. Score Z-Score
Copple 001 16 43.00 -27.50 -0.7071
Copple 1SW 16 98.00 27.50 0.7071
Sum 141.00
Mean 70.50
Variance 1512.50
St Dev. 38.89
Course: 527 Outcome: 527.2
Instructor Delivery Weeks Total Avg Dev. Score Z-Score
Copple 001 16 43.00 -27.50 -0.7071
Copple 1SW 16 98.00 27.50 0.7071
Sum 141.00
Mean 70.50
Variance 1512.50
St Dev. 38.89
Learning Outcomes Analysis: Aggregate Data – All students
Course: 527 Outcome: 527.3
Instructor Delivery Weeks Total Avg Dev. Score Z-Score
Copple 001 16 43.00 -27.50 -0.7071
Copple 1SW 16 98.00 27.50 0.7071
Sum 141.00
Mean 70.50
Variance 1512.50
St Dev. 38.89
Course: 527 Outcome: 527.4
Instructor Delivery Weeks Total Avg Dev. Score Z-Score
Copple 001 16 100.00 3.00 0.7071
Copple 1SW 16 94.00 -3.00 -0.7071
Sum 194.00
Mean 97.00
Variance 18.00
St Dev. 4.24
Learning Outcomes Analysis: Aggregate Data – All students
Course: 527 Outcome: 527.5
Instructor Delivery Weeks Total Avg Dev. Score Z-Score
Copple 001 16 100.00 0.00
Copple 1SW 16 100.00 0.00 Sum 200.00
Mean 100.00
Variance 0.00
St Dev. 0.00
Course: 527 Outcome: 527.6
Instructor Delivery Weeks Total Avg Dev. Score Z-Score
Copple 001 16 100.00 6.00 0.7071
Copple 1SW 16 88.00 -6.00 -0.7071
Sum 188.00
Mean 94.00
Variance 72.00
St Dev. 8.49

92
Learning Outcomes Analysis: Aggregate Data – All students
Course: 527 Outcome: 527.7
Instructor Delivery Weeks Total Avg Dev. Score Z-Score
Copple 001 16 100.00 0.00 Copple 1SW 16 100.00 0.00 Sum 200.00
Mean 100.00
Variance 0.00
St Dev. 0.00
Course: 527 Outcome: 527.8
Instructor Delivery Weeks Total Avg Dev. Score Z-Score
Copple 001 16 100.00 0.00 Copple 1SW 16 100.00 0.00 Sum 200.00
Mean 100.00
Variance 0.00
St Dev. 0.00
Learning Outcomes Analysis: Aggregate Data – All students
Course: 527 Outcome: 527.9
Instructor Delivery Weeks Total Avg Dev. Score Z-Score
Copple 001 16 100.00 0.00
Copple 1SW 16 100.00 0.00
Sum 200.00
Mean 100.00
Variance 0.00
St Dev. 0.00
Course: 527 Aggregate Data
Instructor Delivery Weeks Total Avg Dev. Score Z-Score
Copple 001 16 81.00 -16.00 -3.7712
Copple 1SW 16 97.33 0.33 0.0786
Sum 178.33
Mean 89.17
Variance 256.11
St Dev. 16.00
First assessment cycle – no trend data

93
CDIS 528 Dysphagia
Measure(s)
528.1) Understand normal anatomy/physiology for swallowing, including neurophysiology, oral, pharyngeal, esophageal, and related function. Changes across the lifespan must be considered
528.2) Understand the impact of cultural variations on feeding/swallowing behavior 528.3) Discriminate characteristics and pathophysiology of dysphagia for each
stage of swallowing, including possible reasons for penetration and aspiration
528.4) Identify and apply prevention strategies for swallowing disorders associated
with specific conditions 528.5) Understand assessment methods appropriate to specific disorders resulting
in swallowing disorders 528.6) Understand intervention methods appropriate to specific disorders resulting
in swallowing disorders
Data Sources
Skills performance, student projects, course notebooks, portfolios, scoring rubrics, graded assignments, quizzes, and/or exams.
Population/Timeline
CDIS 528, AY 2017-18
Learning Outcomes Analysis: Aggregate Data – All students
Course: 528 Outcome: 528.1
Instructor Delivery Weeks Total Avg Dev. Score Z-Score
Bratcher 001 16 95.00 -1.50 -0.7071
Bratcher 1SW 16 98.00 1.50 0.7071
Sum 193.00
Mean 96.50
Variance 4.50
St Dev. 2.12
Course: 528 Outcome: 528.2
Instructor Delivery Weeks Total Avg Dev. Score Z-Score
Bratcher 001 16 86.00 -6.00 -0.7071
Bratcher 1SW 16 98.00 6.00 0.7071
Sum 184.00
Mean 92.00
Variance 72.00
St Dev. 8.49

94
Learning Outcomes Analysis: Aggregate Data – All students
Course: 528 Outcome: 528.3
Instructor Delivery Weeks Total Avg Dev. Score Z-Score
Bratcher 001 16 9.00 -14.50 -0.7071
Bratcher 1SW 16 38.00 14.50 0.7071
Sum 47.00
Mean 23.50
Variance 420.50
St Dev. 20.51
Course: 528 Outcome: 528.4
Instructor Delivery Weeks Total Avg Dev. Score Z-Score
Bratcher 001 16 82.00 2.00 0.7071
Bratcher 1SW 16 78.00 -2.00 -0.7071
Sum 160.00
Mean 80.00
Variance 8.00
St Dev. 2.83
Learning Outcomes Analysis: Aggregate Data – All students
Course: 528 Outcome: 528.5
Instructor Delivery Weeks Total Avg Dev. Score Z-Score
Bratcher 001 16 59.00 2.00 0.7071
Bratcher 1SW 16 55.00 -2.00 -0.7071
Sum 114.00
Mean 57.00
Variance 8.00
St Dev. 2.83
Course: 528 Outcome: 528.6
Instructor Delivery Weeks Total Avg Dev. Score Z-Score
Bratcher 001 16 32.00 -11.50 -0.7071
Bratcher 1SW 16 55.00 11.50 0.7071
Sum 87.00
Mean 43.50
Variance 264.50
St Dev. 16.26
Learning Outcomes Analysis: Aggregate Data – All students
Course: 528 Aggregate Data
Instructor Delivery Weeks Total Avg Dev. Score Z-Score
Bratcher 001 16 60.50 -19.50 -6.8943
Bratcher 1SW 16 70.33 -9.67 -3.4177
Sum 130.83
Mean 65.42
Variance 473.69
St Dev. 21.76
First assessment cycle – no trend data

95
CDIS 529 Neurogenic Language Disorders
Measure(s)
529.1) Understand CNS systems and pathways used in language production 529.2) Identify neurogenic language disorders and their psychosocial impact
across the lifespan 529.3) Describe characteristics of disordered language due to neuropathology for
each parameter in listening, speaking, reading, and writing 529.4) Understand etiologies for, identify, and assess cognitive characteristics of
communication disorders (e.g., memory, attention, organization, problem-solving, executive functioning, and sequencing)
529.5) Identify etiologies, assessment, and intervention for social, communication,
and psychological characteristics associated with aphasia (including behavior)
529.6) Identify etiologies, assessment, and intervention for social, communication,
and psychological characteristics associated with right hemisphere (including behavior)
529.7) Identify etiologies, assessment, and intervention for social, communication,
and psychological characteristics associated with TBI (including behavior) 529.8) Identify etiologies, assessment, and intervention for social, communication,
and psychological characteristics associated with dementia (including behavior)
529.9) Understand methods of prevention for neurogenic language disorders
associated with specific conditions 529.11) Understand assessment methodologies appropriate to aphasia, right
hemisphere, TBI, and dementia across listening, speaking, reading, and writing modalities
529.12) Understand intervention methodologies appropriate to aphasia, right
hemisphere, TBI, and dementia across listening, speaking, reading, and writing modalities
529.13) Design intervention for cognitive and social aspects of neurogenic
language disorders
Data Sources
Skills performance, student projects, course notebooks, portfolios, scoring rubrics, graded assignments, quizzes, and/or exams.
Population/Timeline
CDIS 529, AY 2017-18

96
Learning Outcomes Analysis: Aggregate Data – All students
Course: 529 Outcome: 529.1
Instructor Delivery Weeks Total Avg Dev. Score Z-Score
Bratcher 001 16 100.00 2.50 0.7071
Bratcher 1SW 16 95.00 -2.50 -0.7071
Sum 195.00
Mean 97.50
Variance 12.50
St Dev. 3.54
Course: 529 Outcome: 529.2
Instructor Delivery Weeks Total Avg Dev. Score Z-Score
Bratcher 001 16 100.00 2.50 0.7071
Bratcher 1SW 16 95.00 -2.50 -0.7071
Sum 195.00
Mean 97.50
Variance 12.50
St Dev. 3.54
Learning Outcomes Analysis: Aggregate Data – All students
Course: 529 Outcome: 529.3
Instructor Delivery Weeks Total Avg Dev. Score Z-Score
Bratcher 001 16 100.00 2.50 0.7071
Bratcher 1SW 16 95.00 -2.50 -0.7071
Sum 195.00
Mean 97.50
Variance 12.50
St Dev. 3.54
Course: 529 Outcome: 529.4
Instructor Delivery Weeks Total Avg Dev. Score Z-Score
Bratcher 001 16 100.00 2.50 0.7071
Bratcher 1SW 16 95.00 -2.50 -0.7071
Sum 195.00
Mean 97.50
Variance 12.50
St Dev. 3.54
Learning Outcomes Analysis: Aggregate Data – All students
Course: 529 Outcome: 529.5
Instructor Delivery Weeks Total Avg Dev. Score Z-Score
Bratcher 001 16 100.00 2.50 0.7071
Bratcher 1SW 16 95.00 -2.50 -0.7071
Sum 195.00
Mean 97.50
Variance 12.50
St Dev. 3.54
Course: 529 Outcome: 529.6
Instructor Delivery Weeks Total Avg Dev. Score Z-Score
Bratcher 001 16 100.00 2.50 0.7071
Bratcher 1SW 16 95.00 -2.50 -0.7071
Sum 195.00
Mean 97.50
Variance 12.50
St Dev. 3.54
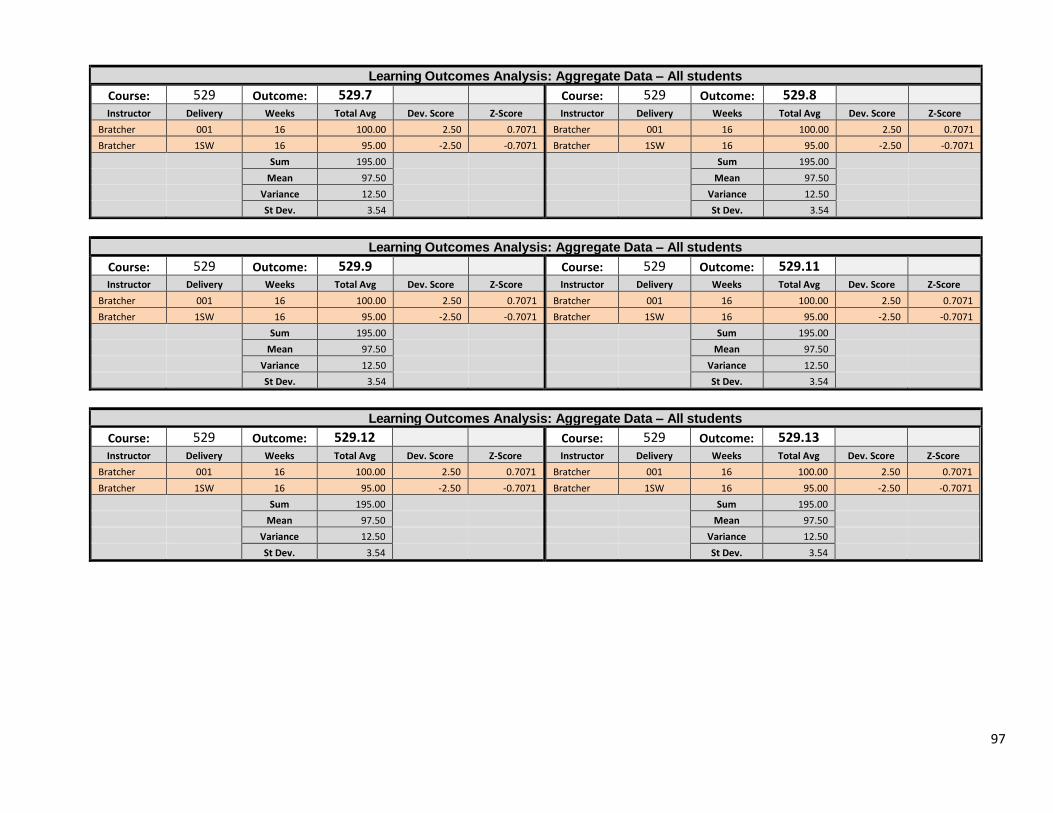
97
Learning Outcomes Analysis: Aggregate Data – All students
Course: 529 Outcome: 529.7
Instructor Delivery Weeks Total Avg Dev. Score Z-Score
Bratcher 001 16 100.00 2.50 0.7071
Bratcher 1SW 16 95.00 -2.50 -0.7071
Sum 195.00
Mean 97.50
Variance 12.50
St Dev. 3.54
Course: 529 Outcome: 529.8
Instructor Delivery Weeks Total Avg Dev. Score Z-Score
Bratcher 001 16 100.00 2.50 0.7071
Bratcher 1SW 16 95.00 -2.50 -0.7071
Sum 195.00
Mean 97.50
Variance 12.50
St Dev. 3.54
Learning Outcomes Analysis: Aggregate Data – All students
Course: 529 Outcome: 529.9
Instructor Delivery Weeks Total Avg Dev. Score Z-Score
Bratcher 001 16 100.00 2.50 0.7071
Bratcher 1SW 16 95.00 -2.50 -0.7071
Sum 195.00
Mean 97.50
Variance 12.50
St Dev. 3.54
Course: 529 Outcome: 529.11
Instructor Delivery Weeks Total Avg Dev. Score Z-Score
Bratcher 001 16 100.00 2.50 0.7071
Bratcher 1SW 16 95.00 -2.50 -0.7071
Sum 195.00
Mean 97.50
Variance 12.50
St Dev. 3.54
Learning Outcomes Analysis: Aggregate Data – All students
Course: 529 Outcome: 529.12
Instructor Delivery Weeks Total Avg Dev. Score Z-Score
Bratcher 001 16 100.00 2.50 0.7071
Bratcher 1SW 16 95.00 -2.50 -0.7071
Sum 195.00
Mean 97.50
Variance 12.50
St Dev. 3.54
Course: 529 Outcome: 529.13
Instructor Delivery Weeks Total Avg Dev. Score Z-Score
Bratcher 001 16 100.00 2.50 0.7071
Bratcher 1SW 16 95.00 -2.50 -0.7071
Sum 195.00
Mean 97.50
Variance 12.50
St Dev. 3.54

98
Learning Outcomes Analysis: Aggregate Data – All students
Course: 529 Aggregate Data
Instructor Delivery Weeks Total Avg Dev. Score Z-Score
Bratcher 001 16 100.00 2.50 0.7071
Bratcher 1SW 16 95.00 -2.50 -0.7071
Sum 195.00
Mean 97.50
Variance 12.50
St Dev. 3.54
First assessment cycle – no trend data

99
CDIS 540 Oral Motor Disorders
Measure(s)
540.1) Understand normal anatomy/physiology and neurophysiology for speaking and feeding, including development across the lifespan
540.2) Understand the psychosocial role of feeding and the impact of oral-
motor/feeding/swallowing disorders on clients and significant others, to include maladaptive behavioral responses
540.3) Describe causes and conditions which result in oral-motor/orofacial myology
disorders which may affect speech or feeding 540.4) Analyze case history information to differentially dx/determine POC for
patient scenarios, including referral 540.5) Describe characteristics of oral-motor/orofacial myology disorders and
identify limiting and maintaining factors which negatively impact oral-motor/orofacial myology disorders as they affect feeding and/or speech performance, (i.e., medical issues, motor development disorders, sensory integration difficulties, etc.); Describe strategies to address these issues
540.6) Understand comprehensive and differential assessment of oral-
motor/orofacial myology disorders as they may affect speech and feeding disorders
540.7) Design EBP-based intervention for various oral-motor/orofacial myology
client profiles (e.g., recommending non-oral supplementation, administering oral stimulation, applying NSOME, OME as a component of motor-based articulation therapy): Compose referral letters as necessary
Data Sources
Skills performance, student projects, course notebooks, portfolios, scoring rubrics, graded assignments, quizzes, and/or exams.
Population/Timeline
CDIS 540, AY 2017-18
Learning Outcomes Analysis: Aggregate Data – All students
Course: 540 Outcome: 540.1
Instructor Delivery Weeks Total Avg Dev. Score Z-Score
Swift 001 8 83.00 -0.50 -0.7071
Swift 1SW 8 84.00 0.50 0.7071
Sum 167.00
Mean 83.50
Variance 0.50
St Dev. 0.71
Course: 540 Outcome: 540.2
Instructor Delivery Weeks Total Avg Dev. Score Z-Score
Swift 001 8 100.00 0.00 Swift 1SW 8 100.00 0.00
Sum 200.00
Mean 100.00
Variance 0.00
St Dev. 0.00

100
Learning Outcomes Analysis: Aggregate Data – All students
Course: 540 Outcome: 540.3
Instructor Delivery Weeks Total Avg Dev. Score Z-Score
Swift 001 8 100.00 0.00 Swift 1SW 8 100.00 0.00 Sum 200.00
Mean 100.00
Variance 0.00
St Dev. 0.00
Course: 540 Outcome: 540.4
Instructor Delivery Weeks Total Avg Dev. Score Z-Score
Swift 001 8
Swift 1SW 8 96.00 0.00 Sum 96.00
Mean 96.00
Variance
St Dev.
Learning Outcomes Analysis: Aggregate Data – All students
Course: 540 Outcome: 540.5
Instructor Delivery Weeks Total Avg Dev. Score Z-Score
Swift 001 8 83.00 -8.50 -0.7071
Swift 1SW 8 100.00 8.50 0.7071
Sum 183.00
Mean 91.50
Variance 144.50
St Dev. 12.02
Course: 540 Outcome: 540.6
Instructor Delivery Weeks Total Avg Dev. Score Z-Score
Swift 001 8 100.00 0.00 Swift 1SW 8 100.00 0.00
Sum 200.00
Mean 100.00
Variance 0.00
St Dev. 0.00
Learning Outcomes Analysis: Aggregate Data – All students
Course: 540 Outcome: 540.7
Instructor Delivery Weeks Total Avg Dev. Score Z-Score
Swift 001 8 67.00 9.00 0.7071
Swift 1SW 8 49.00 -9.00 -0.7071
Sum 116.00
Mean 58.00
Variance 162.00
St Dev. 12.73
Course: 540 Aggregate Data
Instructor Delivery Weeks Total Avg Dev. Score Z-Score
Swift 001 8 88.83 -7.17
Swift 1SW 8 89.86 -6.14 Sum 178.69
Mean 89.35
Variance 89.10
St Dev. 9.44
First assessment cycle – no trend data

101
CDIS 550 Augmentative and Alternative Communication
Measure(s)
550.1) Describe characteristics of AAC systems, both aided and unaided 550.2) Understand and consider physical characteristics of AAC users in
assessment and intervention 550.3) Understand and consider psychological, social, linguistic, and cognitive
variables which impact AAC use, including prelinguistic/paralinguistic communication skills in speaking, listening, reading, and writing
550.4) Describe assessment methods for communication systems (e.g., switch
selection, device features) across various modalities (listening, speaking, reading, writing)
550.5) Describe intervention strategies across various modalities using high and
low-tech AAC devices and systems (e.g., feature matching, cognitive training, selection of sign/symbol systems and devices, integration of AAC user into various environments, partner training)
Data Sources
Skills performance, student projects, course notebooks, portfolios, scoring rubrics, graded assignments, quizzes, and/or exams.
Population/Timeline
CDIS 550, AY 2017-18
Learning Outcomes Analysis: Aggregate Data – All students
Course: 550 Outcome: 550.1
Instructor Delivery Weeks Total Avg Dev. Score Z-Score
Copple 001 16 100.00 1.00 0.7071
Copple 1SW 16 98.00 -1.00 -0.7071
Sum 198.00
Mean 99.00
Variance 2.00
St Dev. 1.41
Course: 550 Outcome: 550.2
Instructor Delivery Weeks Total Avg Dev. Score Z-Score
Copple 001 16 100.00 3.50 0.7071
Copple 1SW 16 93.00 -3.50 -0.7071
Sum 193.00
Mean 96.50
Variance 24.50
St Dev. 4.95

102
Learning Outcomes Analysis: Aggregate Data – All students
Course: 550 Outcome: 550.3
Instructor Delivery Weeks Total Avg Dev. Score Z-Score
Copple 001 16 100.00 0.00
Copple 1SW 16 100.00 0.00
Sum 200.00
Mean 100.00
Variance 0.00
St Dev. 0.00
Course: 550 Outcome: 550.4
Instructor Delivery Weeks Total Avg Dev. Score Z-Score
Copple 001 16 89.00 3.00 0.7071
Copple 1SW 16 83.00 -3.00 -0.7071
Sum 172.00
Mean 86.00
Variance 18.00
St Dev. 4.24
Learning Outcomes Analysis: Aggregate Data – All students
Course: 550 Outcome: 550.5
Instructor Delivery Weeks Total Avg Dev. Score Z-Score
Copple 001 16 100.00 1.50 0.7071
Copple 1SW 16 97.00 -1.50 -0.7071
Sum 197.00
Mean 98.50
Variance 4.50
St Dev. 2.12
Course: 550 Aggregate Data
Instructor Delivery Weeks Total Avg Dev. Score Z-Score
97.80 11.80 2.7813
94.20 8.20 1.9328
Sum 192.00
Mean 96.00
Variance 206.48
St Dev. 14.37
First assessment cycle – no trend data

103
CDIS 554 Current Trends and Professional Issues in Communicative Disorders
Measure(s)
554.1) Explain and apply the rules and principles of the Code of Ethics to clinical, academic, and research hypotheticals
554.2) Analyze new information and current trends in CDIS for validity, reliability,
and applicability; Evaluate and make recommendations about current trends in assessment and intervention practices using EBP (e.g., cleft-palate repair, PE tube placement, NSOME use, feeding plates, Vital/E-stim)
554.3) Demonstrate knowledge of relevant technological developments in the
assessment and treatment of persons with communication disorders 554.4) Demonstrate knowledge of client counseling in CDIS 554.5) Demonstrate knowledge of IEP practices and Medicare/Medicaid
reimbursement billing policies and procedures 554.6) Demonstrate knowledge of current and relevant legal issues and policies,
including abuse reporting, policy changes, ASHA practice policies, ASHA guidelines, and advocacy; Demonstrate knowledge of local, state, and national regulations and policies relevant to professional practice
554.7) Demonstrate knowledge of local, state, and national regulations and policies
relevant to professional practice 554.8) Demonstrate knowledge of professional practices/ethics for business
planning and social media usage 554.9) Describe requirements of continuing education and procedures for obtaining
specialty recognition
Data Sources
Skills performance, student projects, course notebooks, portfolios, scoring rubrics, graded assignments, quizzes, and/or exams.
Population/Timeline
CDIS 554, AY 2017-18

104
Learning Outcomes Analysis: Aggregate Data – All students
Course: 554 Outcome: 554.1
Instructor Delivery Weeks Total Avg Dev. Score Z-Score
Bougie 001 16 100.00 0.00
Bougie 1SW 16 100.00 0.00
Sum 200.00
Mean 100.00
Variance 0.00
St Dev. 0.00
Course: 554 Outcome: 554.2
Instructor Delivery Weeks Total Avg Dev. Score Z-Score
Bougie 001 16 100.00 0.00
Bougie 1SW 16 100.00 0.00
Sum 200.00
Mean 100.00
Variance 0.00
St Dev. 0.00
Learning Outcomes Analysis: Aggregate Data – All students
Course: 554 Outcome: 554.3
Instructor Delivery Weeks Total Avg Dev. Score Z-Score
Bougie 001 16 100.00 0.00
Bougie 1SW 16 100.00 0.00 Sum 200.00
Mean 100.00
Variance 0.00
St Dev. 0.00
Course: 554 Outcome: 554.4
Instructor Delivery Weeks Total Avg Dev. Score Z-Score
Bougie 001 16 100.00 0.00
Bougie 1SW 16 100.00 0.00
Sum 200.00
Mean 100.00
Variance 0.00
St Dev. 0.00
Learning Outcomes Analysis: Aggregate Data – All students
Course: 554 Outcome: 554.5
Instructor Delivery Weeks Total Avg Dev. Score Z-Score
Bougie 001 16 100.00 0.00
Bougie 1SW 16 100.00 0.00
Sum 200.00
Mean 100.00
Variance 0.00
St Dev. 0.00
Course: 554 Outcome: 554.6
Instructor Delivery Weeks Total Avg Dev. Score Z-Score
Bougie 001 16 100.00 0.00
Bougie 1SW 16 100.00 0.00
Sum 200.00
Mean 100.00
Variance 0.00
St Dev. 0.00

105
Learning Outcomes Analysis: Aggregate Data – All students
Course: 554 Outcome: 554.7
Instructor Delivery Weeks Total Avg Dev. Score Z-Score
Bougie 001 16 100.00 0.00
Bougie 1SW 16 100.00 0.00
Sum 200.00
Mean 100.00
Variance 0.00
St Dev. 0.00
Course: 554 Outcome: 554.8
Instructor Delivery Weeks Total Avg Dev. Score Z-Score
Bougie 001 16 100.00 0.00
Bougie 1SW 16 100.00 0.00
Sum 200.00
Mean 100.00
Variance 0.00
St Dev. 0.00
Learning Outcomes Analysis: Aggregate Data – All students
Course: 554 Outcome: 554.9
Instructor Delivery Weeks Total Avg Dev. Score Z-Score
Bougie 001 16 100.00 0.00
Bougie 1SW 16 100.00 0.00
Sum 200.00
Mean 100.00
Variance 0.00
St Dev. 0.00
Course: 554 Aggregate Data
Instructor Delivery Weeks Total Avg Dev. Score Z-Score
Bougie 001 16 100.00 0.00
Bougie 1SW 16 100.00 0.00
Sum 200.00
Mean 100.00
Variance 0.00
St Dev. 0.00
First assessment cycle – no trend data

106
CDIS 557 Clinical Applications of Research Methods
Measure(s)
557.1) Critically review published research (to include all components across multiple designs): Meta-analysis; Quantitative large group design; Quantitative small group design; Quantitative single subject design; Case study; Qualitative design; Other
557.2) Analyze given data and integrate/synthesize relevant findings with literature
to solve problems in clinical case situations: 1 Clinical Problem PICO (What is best practice for….); 1 Clinical Treatment PICOs (Is this tx efficacious?);
1 EBP case evaluation 557.3) Describe the relationship of research, EBP, and RTI 557.4) When presented with clinical problems, construct research designs for
issues in CDIS 557.5) Determine and author appropriate methodology for literature review
completed in CDIS 500 557.6) Submit IRB proposal for personal research
Data Sources
Skills performance, student projects, course notebooks, portfolios, scoring rubrics, graded assignments, quizzes, and/or exams.
Population/Timeline
CDIS 557, AY 2017-18
Learning Outcomes Analysis: Aggregate Data – All students
Course: 557 Outcome: 557.1
Instructor L Weeks Total Avg Dev. Score Z-Score
Lingnau 001 16 100.00 0.00
Lingnau 1SW 16 100.00 0.00
Sum 200.00
Mean 100.00
Variance 0.00
St Dev. 0.00
Course: 557 Outcome: 557.2
Instructor Delivery Weeks Total Avg Dev. Score Z-Score
Lingnau 001 16 100.00 1.50 0.7071
Lingnau 1SW 16 97.00 -1.50 -0.7071
Sum 197.00
Mean 98.50
Variance 4.50
St Dev. 2.12

107
Learning Outcomes Analysis: Aggregate Data – All students
Course: 557 Outcome: 557.3
Instructor Delivery Weeks Total Avg Dev. Score Z-Score
Lingnau 001 16 100.00 1.00 0.7071
Lingnau 1SW 16 98.00 -1.00 -0.7071
Sum 198.00
Mean 99.00
Variance 2.00
St Dev. 1.41
Course: 557 Outcome: 557.4
Instructor Delivery Weeks Total Avg Dev. Score Z-Score
Lingnau 001 16 88.00 -4.50 -0.7071
Lingnau 1SW 16 97.00 4.50 0.7071
Sum 185.00
Mean 92.50
Variance 40.50
St Dev. 6.36
Learning Outcomes Analysis: Aggregate Data – All students
Course: 557 Outcome: 557.5
Instructor Delivery Weeks Total Avg Dev. Score Z-Score
Lingnau 001 16 100.00 1.50 0.7071
Lingnau 1SW 16 97.00 -1.50 -0.7071
Sum 197.00
Mean 98.50
Variance 4.50
St Dev. 2.12
Course: 557 Outcome: 557.6
Instructor Delivery Weeks Total Avg Dev. Score Z-Score
Lingnau 001 16 98.00 0.00
Lingnau 1SW 16 98.00 0.00
Sum 196.00
Mean 98.00
Variance 0.00
St Dev. 0.00
Learning Outcomes Analysis: Aggregate Data – All students
Course: 557 Aggregate Data
Instructor Delivery Weeks Total Avg Dev. Score Z-Score
Lingnau 001 16 97.67 5.17 0.8119
Lingnau 1SW 16 97.83 5.33 0.8381
Sum 195.50
Mean 97.75
Variance 55.14
St Dev. 7.43
First assessment cycle – no trend data

108
CDIS 560 Analytical Approaches to Clinical Research
Measure(s)
560.1) Differentially select appropriate analysis procedures (to include statistical formulas)
560.2) Solve statistical problems 560.3) Analyze and interpret data for qualitative and quantitative designs (e.g.,
coding, thematic analysis, basic to intermediate statistics for non-experimental, quasi-experimental, and experimental designs)
560.4) Make appropriate inferences and generalizations based on data 560.5) Identify limitations of results 560.6) Critique research findings/implications for published articles; Apply relevant
findings to clinical questions 560.7) Report data with preliminary analysis for methodology completed in CDIS
557
Data Sources
Skills performance, student projects, course notebooks, portfolios, scoring rubrics, graded assignments, quizzes, and/or exams.
Population/Timeline
CDIS 560, AY 2017-18
Learning Outcomes Analysis: Aggregate Data – All students
Course: 560 Outcome: 560.1
Instructor Delivery Weeks Total Avg Dev. Score Z-Score
Swift 001 16 100.00 0.00
Swift 1SW 16 100.00 0.00
Sum 200.00
Mean 100.00
Variance 0.00
St Dev. 0.00
Course: 560 Outcome: 560.2
Instructor Delivery Weeks Total Avg Dev. Score Z-Score
Swift 001 16 100.00 0.00
Swift 1SW 16 100.00 0.00
Sum 200.00
Mean 100.00
Variance 0.00
St Dev. 0.00
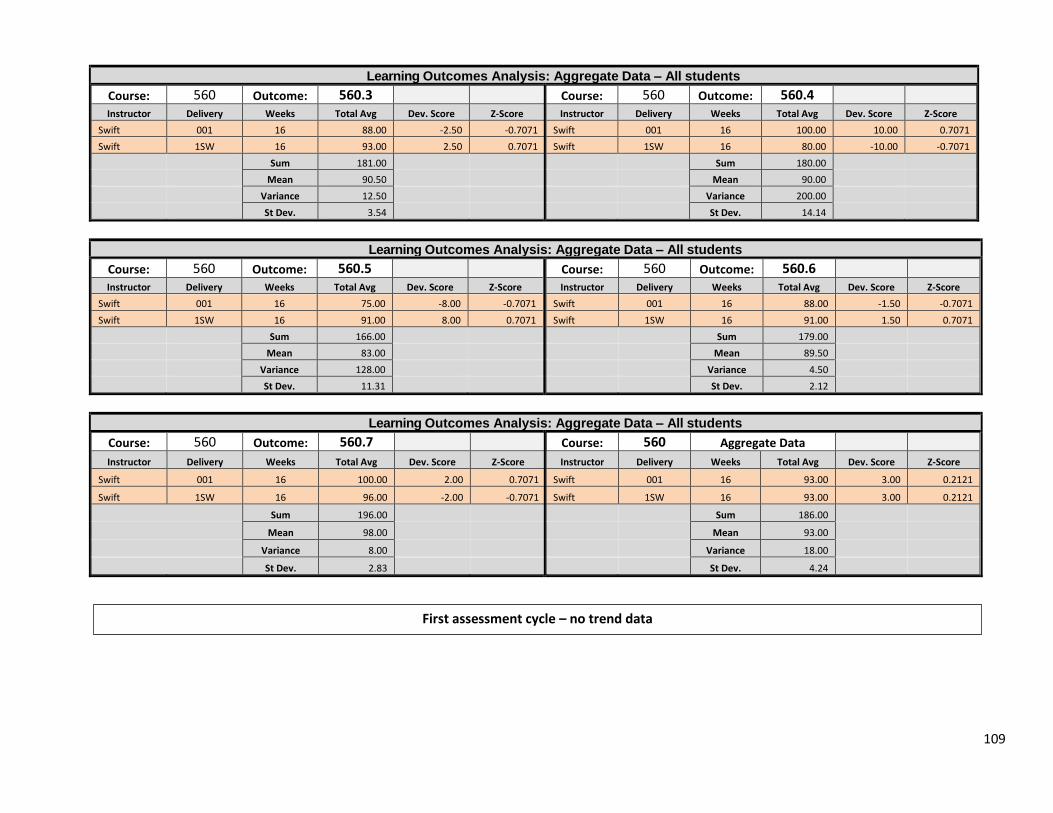
109
Learning Outcomes Analysis: Aggregate Data – All students
Course: 560 Outcome: 560.3
Instructor Delivery Weeks Total Avg Dev. Score Z-Score
Swift 001 16 88.00 -2.50 -0.7071
Swift 1SW 16 93.00 2.50 0.7071
Sum 181.00
Mean 90.50
Variance 12.50
St Dev. 3.54
Course: 560 Outcome: 560.4
Instructor Delivery Weeks Total Avg Dev. Score Z-Score
Swift 001 16 100.00 10.00 0.7071
Swift 1SW 16 80.00 -10.00 -0.7071
Sum 180.00
Mean 90.00
Variance 200.00
St Dev. 14.14
Learning Outcomes Analysis: Aggregate Data – All students
Course: 560 Outcome: 560.5
Instructor Delivery Weeks Total Avg Dev. Score Z-Score
Swift 001 16 75.00 -8.00 -0.7071
Swift 1SW 16 91.00 8.00 0.7071
Sum 166.00
Mean 83.00
Variance 128.00
St Dev. 11.31
Course: 560 Outcome: 560.6
Instructor Delivery Weeks Total Avg Dev. Score Z-Score
Swift 001 16 88.00 -1.50 -0.7071
Swift 1SW 16 91.00 1.50 0.7071
Sum 179.00
Mean 89.50
Variance 4.50
St Dev. 2.12
Learning Outcomes Analysis: Aggregate Data – All students
Course: 560 Outcome: 560.7
Instructor Delivery Weeks Total Avg Dev. Score Z-Score
Swift 001 16 100.00 2.00 0.7071
Swift 1SW 16 96.00 -2.00 -0.7071
Sum 196.00
Mean 98.00
Variance 8.00
St Dev. 2.83
Course: 560 Aggregate Data
Instructor Delivery Weeks Total Avg Dev. Score Z-Score
Swift 001 16 93.00 3.00 0.2121
Swift 1SW 16 93.00 3.00 0.2121
Sum 186.00
Mean 93.00
Variance 18.00
St Dev. 4.24
First assessment cycle – no trend data

110
CDIS 573 Clinical Research Colloquium
Measure(s)
573.1) Summarize, conclude, and make recommendations for data/results obtained in CDIS 560
573.2) Defend research in peer-critique settings 573.3) Construct professional poster describing/explaining research 573.4) Present research findings at professional/research conference, to include
PowerPoint 573.5) Compose and submit professional paper (of completed research) to
program
Data Sources
Skills performance, student projects, course notebooks, portfolios, scoring rubrics, graded assignments, quizzes, and/or exams.
Population/Timeline
CDIS 573, AY 2017-18
Learning Outcomes Analysis: Aggregate Data – All students
Course: 573 Outcome: 573.1
Instructor Delivery Weeks Total Avg Dev. Score Z-Score
Swift 001 16 100.00 0.00
Swift 1SW 16 100.00 0.00
Sum 200.00
Mean 100.00
Variance 0.00
St Dev. 0.00
Course: 573 Outcome: 573.2
Instructor Delivery Weeks Total Avg Dev. Score Z-Score
Swift 001 16 100.00 0.00
Swift 1SW 16 100.00 0.00
Sum 200.00
Mean 100.00
Variance 0.00
St Dev. 0.00

111
Learning Outcomes Analysis: Aggregate Data – All students
Course: 573 Outcome: 573.3
Instructor Delivery Weeks Total Avg Dev. Score Z-Score
Swift 001 16 100.00 0.00
Swift 1SW 16 100.00 0.00
Sum 200.00
Mean 100.00
Variance 0.00
St Dev. 0.00
Course: 573 Outcome: 573.4
Instructor Delivery Weeks Total Avg Dev. Score Z-Score
Swift 001 16 100.00 0.00
Swift 1SW 16 100.00 0.00
Sum 200.00
Mean 100.00
Variance 0.00
St Dev. 0.00
Learning Outcomes Analysis: Aggregate Data – All students
Course: 573 Outcome: 573.5
Instructor Delivery Weeks Total Avg Dev. Score Z-Score
Swift 001 16 100.00 0.00
Swift 1SW 16 100.00 0.00
Sum 200.00
Mean 100.00
Variance 0.00
St Dev. 0.00
Course: 573 Aggregate Data
Instructor Delivery Weeks Total Avg Dev. Score Z-Score
Swift 001 16 100.00 0.00
Swift 1SW 16 100.00 0.00
Sum 200.00
Mean 100.00
Variance 0.00
St Dev. 0.00
First assessment cycle – no trend data

112
CDIS 590 Graduate Seminar
Measure(s)
590.1) Describe the rationale for program accreditation and identify academic program accreditation
590.2) Describe requirements of certification, licensure, continuing education, and
other relevant professional credentialing issues 590.3) Complete (draft) application for certification and licensure 590.4) Formulate a feasible and reasonable business plan for SLP practice 590.5) Identify missing information, relevant questions, and pertinent information in
case study formats 590.6) Demonstrate communication skills sufficient for effective clinical &
professional interaction with clients/patients and relevant others - Comprehend, compose, explain, and discuss diagnostic
590.7) Differentially diagnose and determine POC in case study formats 590.8) Collaborate with a team to discuss case findings, problems, and resolutions
(including additional assessments, treatments, referrals, and overall plan of care); Articulate strategies for continued IPE; Demonstrate skill sets to maximize IPE values
Data Sources
Skills performance, student projects, course notebooks, portfolios, scoring rubrics, graded assignments, quizzes, and/or exams.
Population/Timeline
CDIS 590, AY 2017-18
Learning Outcomes Analysis: Aggregate Data – All students
Course: 590 Outcome: 590.1
Instructor Delivery Weeks Total Avg Dev. Score Z-Score
Bratcher 001 16 100.00 0.00
Bratcher 1SW 16 100.00 0.00
Bratcher 001 16 100.00 0.00
Bratcher 1SW 16 100.00 0.00
Sum 400.00
Mean 100.00
Variance 0.00
St Dev. 0.00
Course: 590 Outcome: 590.2
Instructor Delivery Weeks Total Avg Dev. Score Z-Score
Bratcher 001 16 100.00 0.00
Bratcher 1SW 16 100.00 0.00
Bratcher 001 16 100.00 0.00
Bratcher 1SW 16 100.00 0.00
Sum 400.00
Mean 100.00
Variance 0.00
St Dev. 0.00

113
Learning Outcomes Analysis: Aggregate Data – All students
Course: 590 Outcome: 590.3
Instructor Delivery Weeks Total Avg Dev. Score Z-Score
Bratcher 001 16 100.00 0.00
Bratcher 1SW 16 100.00 0.00
Bratcher 001 16 100.00 0.00
Bratcher 1SW 16 100.00 0.00
Sum 400.00
Mean 100.00
Variance 0.00
St Dev. 0.00
Course: 590 Outcome: 590.4
Instructor Delivery Weeks Total Avg Dev. Score Z-Score
Bratcher 001 16 100.00 0.00
Bratcher 1SW 16 100.00 0.00
Bratcher 001 16 100.00 0.00
Bratcher 1SW 16 100.00 0.00
Sum 400.00
Mean 100.00
Variance 0.00
St Dev. 0.00
Learning Outcomes Analysis: Aggregate Data – All students
Course: 590 Outcome: 590.5
Instructor Delivery Weeks Total Avg Dev. Score Z-Score
Bratcher 001 16 100.00 0.00
Bratcher 1SW 16 100.00 0.00
Bratcher 001 16 100.00 0.00
Bratcher 1SW 16 100.00 0.00
Sum 400.00
Mean 100.00
Variance 0.00
St Dev. 0.00
Course: 590 Outcome: 590.6
Instructor Delivery Weeks Total Avg Dev. Score Z-Score
Bratcher 001 16 100.00 0.00
Bratcher 1SW 16 100.00 0.00
Bratcher 001 16 100.00 0.00
Bratcher 1SW 16 100.00 0.00
Sum 400.00
Mean 100.00
Variance 0.00
St Dev. 0.00
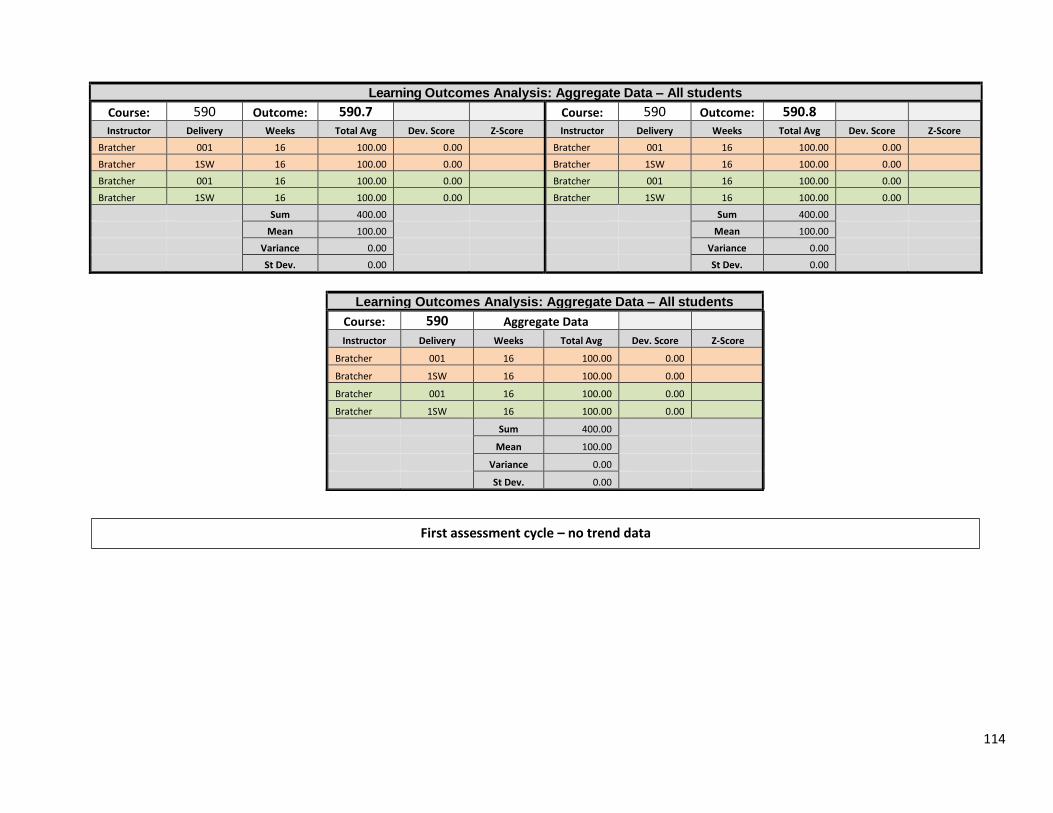
114
Learning Outcomes Analysis: Aggregate Data – All students
Course: 590 Outcome: 590.7
Instructor Delivery Weeks Total Avg Dev. Score Z-Score
Bratcher 001 16 100.00 0.00
Bratcher 1SW 16 100.00 0.00
Bratcher 001 16 100.00 0.00
Bratcher 1SW 16 100.00 0.00
Sum 400.00
Mean 100.00
Variance 0.00
St Dev. 0.00
Course: 590 Outcome: 590.8
Instructor Delivery Weeks Total Avg Dev. Score Z-Score
Bratcher 001 16 100.00 0.00
Bratcher 1SW 16 100.00 0.00
Bratcher 001 16 100.00 0.00
Bratcher 1SW 16 100.00 0.00
Sum 400.00
Mean 100.00
Variance 0.00
St Dev. 0.00
Learning Outcomes Analysis: Aggregate Data – All students
Course: 590 Aggregate Data
Instructor Delivery Weeks Total Avg Dev. Score Z-Score
Bratcher 001 16 100.00 0.00
Bratcher 1SW 16 100.00 0.00
Bratcher 001 16 100.00 0.00
Bratcher 1SW 16 100.00 0.00
Sum 400.00
Mean 100.00
Variance 0.00
St Dev. 0.00
First assessment cycle – no trend data

115
Praxis Examination Category Analysis 2017-18 Graduates
Praxis Examination Pass Rates
5 year rates
Period
# Taking Exam Pass Rate (%)
Taken within 3 months of graduation ENMU's Average Score
600/162 required for certification and NM licensure
FA17-SU18 50 98 177
FA16-SU17 41 98 175
FA15-SU16 37 100 173
FA14-SU15 28 100 660/176
FA13-SU14 22 100 661
Foundations & Professional Practice
Screening, Assessment, Evaluation, &
Diagnosis
Planning, Implementation, &
Evaluation of Treatment Total Score
NESPA Maximum Range 35-36 34-36 34-36 34-36
NESPA Average Range 20-30 20-30 18-29 18-30
ENMU Performance Range 17-34 20-34 16-31 160-193
Average Raw Points Available 35.7 35.14 34.64 35.16
Average ENMU Raw Points Earned 26.2 26.6 24.86 25.89
Average ENMU PCR 73.5 75.7 71.8 73.67
ENMU Pass Rate NSD from 1617 NSD from 1617 NSD from 1617 98%

116
Praxis Examination Pass Rates Residential vs. Distance Students
Period Primary Attendance
(more than 50%) # Taking Exam # Passing Exam
Pass Rate (%) Taken within 3 months of
graduation
ENMU's Average Score
FA17-SU18 Residential 12 12 100 177
Distance 38 37 97 177
Total 50 49 98 177
FA16-SU17 Residential 8 8 100 174
Distance 33 33 100 176
Total 41 41 100 175
FA15-SU16 Residential 21 21 100 173
Distance 16 16 100 173
Total 37 37 100 173
3 yr avg Residential 13.67 (n=41) 13.67 (n=41) 100 175
Distance 29 (n=87) 28.67 (n=86) 99 175
Avg. Total 42.67 (n=128) 42.33 (n=127) 99 175
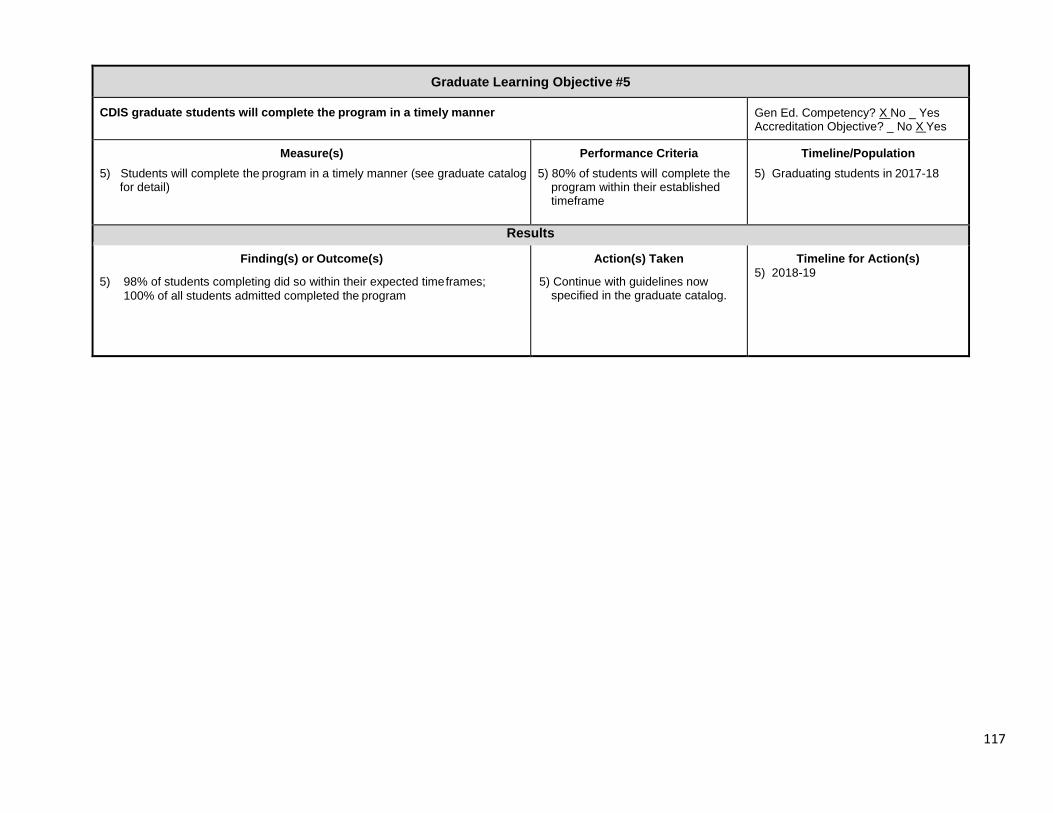
117
Graduate Learning Objective #5
CDIS graduate students will complete the program in a timely manner Gen Ed. Competency? X No _ Yes Accreditation Objective? _ No X Yes
Measure(s)
5) Students will complete the program in a timely manner (see graduate catalog for detail)
Performance Criteria
5) 80% of students will complete the program within their established timeframe
Timeline/Population
5) Graduating students in 2017-18
Results
Finding(s) or Outcome(s)
5) 98% of students completing did so within their expected time frames;
100% of all students admitted completed the program
Action(s) Taken
5) Continue with guidelines now specified in the graduate catalog.
Timeline for Action(s)
5) 2018-19
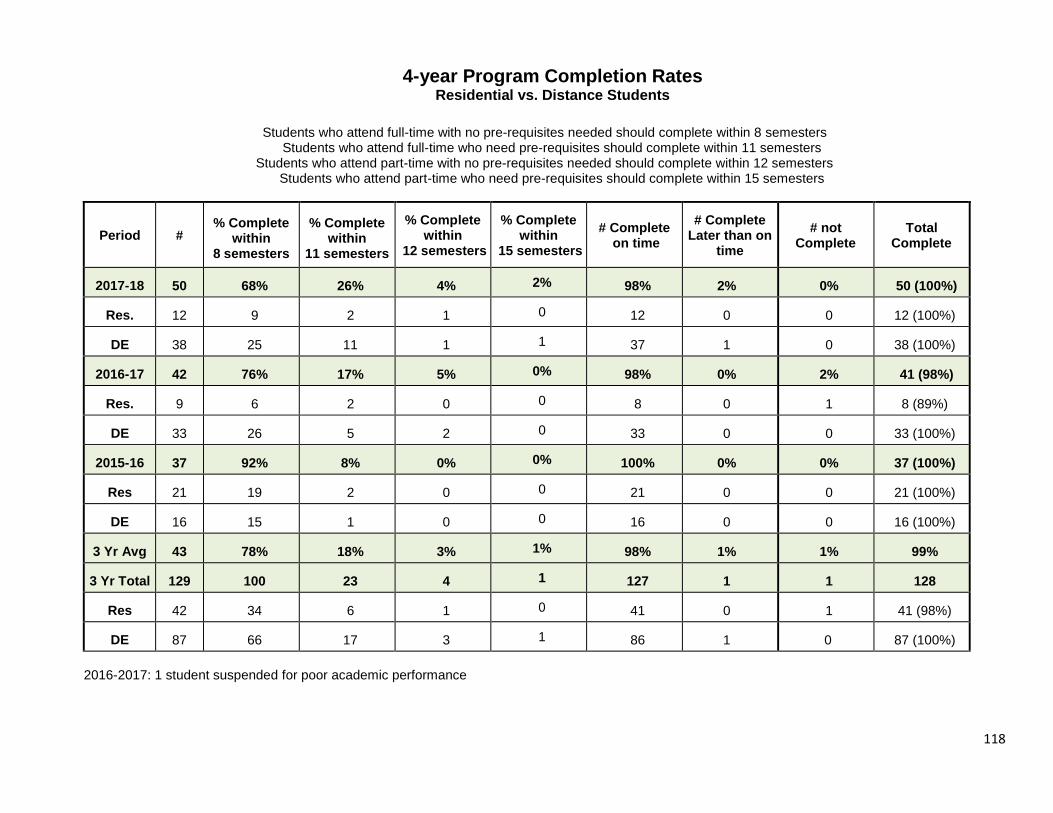
118
4-year Program Completion Rates Residential vs. Distance Students
Students who attend full-time with no pre-requisites needed should complete within 8 semesters Students who attend full-time who need pre-requisites should complete within 11 semesters
Students who attend part-time with no pre-requisites needed should complete within 12 semesters Students who attend part-time who need pre-requisites should complete within 15 semesters
Period # % Complete
within 8 semesters
% Complete within
11 semesters
% Complete within
12 semesters
% Complete within
15 semesters
# Complete on time
# Complete Later than on
time
# not Complete
Total Complete
2017-18 50 68% 26% 4% 2% 98% 2% 0% 50 (100%)
Res. 12 9 2 1 0 12 0 0 12 (100%)
DE 38 25 11 1 1 37 1 0 38 (100%)
2016-17 42 76% 17% 5% 0% 98% 0% 2% 41 (98%)
Res. 9 6 2 0 0 8 0 1 8 (89%)
DE 33 26 5 2 0 33 0 0 33 (100%)
2015-16 37 92% 8% 0% 0% 100% 0% 0% 37 (100%)
Res 21 19 2 0 0 21 0 0 21 (100%)
DE 16 15 1 0 0 16 0 0 16 (100%)
3 Yr Avg 43 78% 18% 3% 1% 98% 1% 1% 99%
3 Yr Total 129 100 23 4 1 127 1 1 128
Res 42 34 6 1 0 41 0 1 41 (98%)
DE 87 66 17 3 1 86 1 0 87 (100%)
2016-2017: 1 student suspended for poor academic performance

119
Graduate Learning Objective #6
ENMU CDIS graduates will be employed as SLPs Gen Ed. Competency? X No _ Yes Accreditation Objective? _ No X Yes
Measure(s)
6) Students will obtain employment as SLPs
Performance Criteria
6) 80% of graduates will be employed as SLPs within 1 year of graduation
Timeline/Population
6) Graduating students in 2016-17
Results
Finding(s) or Outcome(s)
6) 100% of graduates were employed within 1 year of graduation
Action(s) Taken
6) Continue plan
Timeline for Action(s)
6) 2017-18
Employment Rates of Graduates
Period Employment Rate in Profession
# of Graduates % of Graduates Employed within
1 year of graduation Reason for Unemployment
2017-2018 50 In progress
2016-2017 41 100
2015-2016 37 100
2014-2015 28 100
2013-2014 22 100
2012-2013 17 100
2011-2012 13 100
2010-2011 9 100

120
Employment Rates of Graduates Residential vs. Distance Students
Period Employment Rate in Profession
# of Graduates % of Graduates Employed within
1 year of graduation Reason for Unemployment
2017-2018 Residential 12 In progress
Distance 38 In progress
Total 41 100
2016-2017 Residential 8 100
Distance 33 100
Total 41 100
2015-2016 Residential 21 100
Distance 16 100
Total 37 100
2014-2015 Residential 13 100
Distance 15 100
Total 28 100
3 year average Residential 14.33 100
Distance 14.67 100
Total 29 100
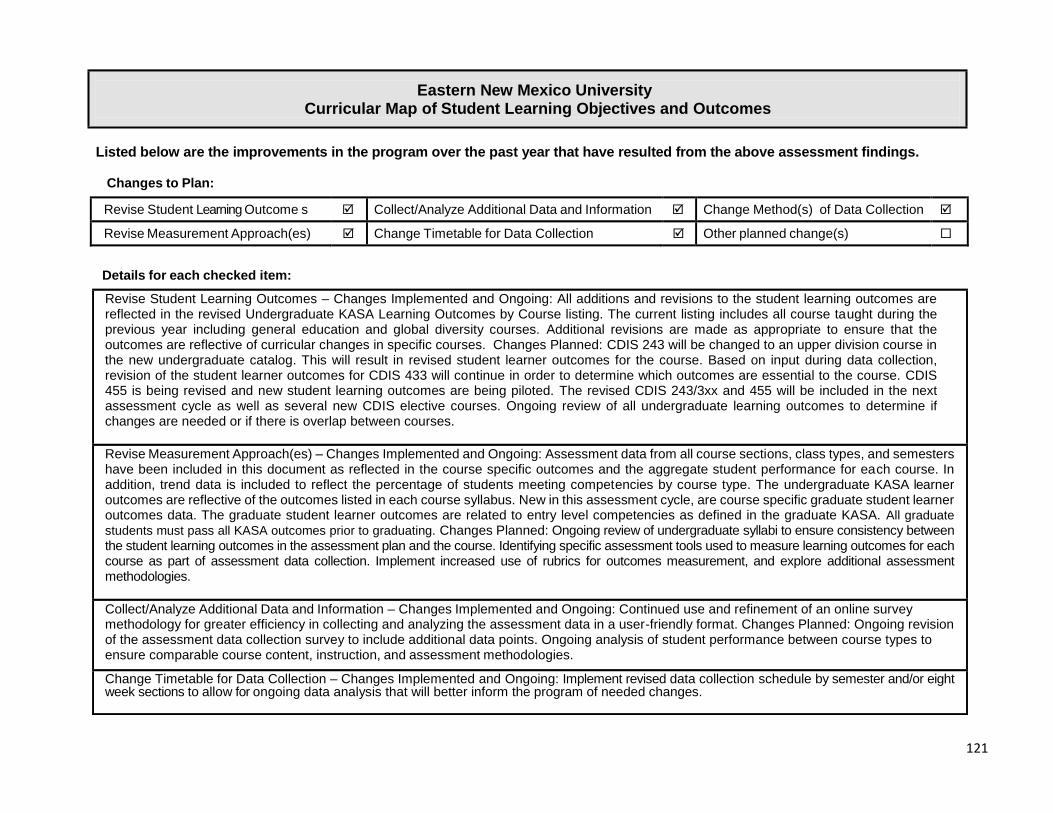
121
Eastern New Mexico University Curricular Map of Student Learning Objectives and Outcomes
Listed below are the improvements in the program over the past year that have resulted from the above assessment findings.
Changes to Plan:
Revise Student Learning Outcome s Collect/Analyze Additional Data and Information Change Method(s) of Data Collection
Revise Measurement Approach(es) Change Timetable for Data Collection Other planned change(s)
Details for each checked item:
Revise Student Learning Outcomes – Changes Implemented and Ongoing: All additions and revisions to the student learning outcomes are reflected in the revised Undergraduate KASA Learning Outcomes by Course listing. The current listing includes all course taught during the previous year including general education and global diversity courses. Additional revisions are made as appropriate to ensure that the outcomes are reflective of curricular changes in specific courses. Changes Planned: CDIS 243 will be changed to an upper division course in the new undergraduate catalog. This will result in revised student learner outcomes for the course. Based on input during data collection, revision of the student learner outcomes for CDIS 433 will continue in order to determine which outcomes are essential to the course. CDIS 455 is being revised and new student learning outcomes are being piloted. The revised CDIS 243/3xx and 455 will be included in the next assessment cycle as well as several new CDIS elective courses. Ongoing review of all undergraduate learning outcomes to determine if changes are needed or if there is overlap between courses.
Revise Measurement Approach(es) – Changes Implemented and Ongoing: Assessment data from all course sections, class types, and semesters have been included in this document as reflected in the course specific outcomes and the aggregate student performance for each course. In addition, trend data is included to reflect the percentage of students meeting competencies by course type. The undergraduate KASA learner outcomes are reflective of the outcomes listed in each course syllabus. New in this assessment cycle, are course specific graduate student learner outcomes data. The graduate student learner outcomes are related to entry level competencies as defined in the graduate KASA. All graduate
students must pass all KASA outcomes prior to graduating. Changes Planned: Ongoing review of undergraduate syllabi to ensure consistency between the student learning outcomes in the assessment plan and the course. Identifying specific assessment tools used to measure learning outcomes for each course as part of assessment data collection. Implement increased use of rubrics for outcomes measurement, and explore additional assessment methodologies.
Collect/Analyze Additional Data and Information – Changes Implemented and Ongoing: Continued use and refinement of an online survey methodology for greater efficiency in collecting and analyzing the assessment data in a user-friendly format. Changes Planned: Ongoing revision of the assessment data collection survey to include additional data points. Ongoing analysis of student performance between course types to ensure comparable course content, instruction, and assessment methodologies.
Change Timetable for Data Collection – Changes Implemented and Ongoing: Implement revised data collection schedule by semester and/or eight week sections to allow for ongoing data analysis that will better inform the program of needed changes.

122
Changes to Academic Processes:
Details for each checked item:
Modify Frequency or Schedule of Class Offerings – Changes Implemented and Ongoing: Continued course scheduling modifications in order to make it possible for students to start their matriculation during any semester.
Make Technology Related Improvements – Changes Implemented and Ongoing: Increased Mediasite lecture capture capabilities, both desktop recorder and ad hoc recordings, to enhance online instruction. Adjunct faculty are encouraged to include recorded presentations throughout their courses. Continued incorporation of asynchronous Mediasite course offerings at the undergraduate level to enhance online course delivery.
Implement Additional Training – Changes Implemented and Ongoing: The CDIS program continues to be interested in having online courses being Quality Matters certified. Exploring additional instructor training as necessary to accomplish this goal including distance adjunct faculty. All faculty including adjuncts have been made aware of the newly implemented Online Course Standards. Revise Advising Standards or Processes – Changes Implemented and Ongoing: Continued shifting of advising loads to new faculty members once they are trained and ready to start advising. Designated faculty handle specialized advising such as second Bachelor’s degrees and CDIS levelers.
Revise Admission Criteria – Changes Implemented and Ongoing: Continued review, refinement, and training in the graduate applications process and admission requirements. Began reviewing the multiple mini interview (MMI) process for piloted implementation in fall 2018.
Changes Planned
Changes Implemented Changes
Planned
Changes Implemented
Modify Frequency or Schedule of Class Offerings
Revise Advising Standards or Processes
Make Technology Related Improvements Revise Admission Criteria
Make Personnel Related Changes Other Implemented/planned change(s)
Implement Additional Training

123
Changes to Curriculum:
Details for each checked item:
Changes Planned
Changes Implemented Changes
Planned
Changes Implemented
Revise and/or Enforce Prerequisites
Add Course(s)
Revise Course Sequence
Delete Course(s)
Revise Course Content
Other implemented / planned change(s)
Add Course(s) – Added CDIS 433 as an elective course. Changes Planned: Changing CDIS 243 to an upper division course. Adding several new CDIS elective courses as part of the revised CDIS Clinical Practice minor. These courses include: Case Studies in Communication Disorders, Professional Writing in Communication Disorders, Survey of Autism and Augmentative and Alternative Communication, Survey of Swallowing, Motor Speech, and Aphasia, Survey of Voice and Fluency, and Telepractice.

124
Eastern New Mexico University Curricular Map of Student Learning Outcomes
Enter course numbers for your department across the top of the matrix. In the column below, indicate where the targeted outcome is “introduced,” “emphasized,” “reinforced,” or “assessed.”
I = Outcome is introduced E = Outcome is emphasized R = Outcome is reinforced A = Outcome is assessed
Undergraduate Program Core Objectives
Course numbers →
144 243 244 300 303 310 311 320 323 324 330 332 342 400 421 433 434 441 441L 445 446 454 455
UG Obj. #1 100.1 I ERA ER ER ER ER
UG Obj. #1 100.2 A ER R ER
UG Obj. #1 100.3 IE ER ERA ER ER
UG Obj. #2 200.1 I ERA
UG Obj. #2 200.2 I ERA
UG Obj. #2 200.3 I ERA
UG Obj. #2 200.4 I ERA
UG Obj. #2 200.5 I ERA
UG Obj. #2 200.6 I ERA
UG Obj. #3 300.1 I ER ER RA
UG Obj. #3 300.2 I E RA
UG Obj. #3 300.3 I E RA
UG Obj. #3 300.4 I E RA
UG Obj. #3 300.5 I ERA ER A
UG Obj. #3 300.6 I ERA ER
UG Obj. #4 400.1 I ER ERA
UG Obj. #4 400.2 I ER ERA
UG Obj. #4 400.3 I ER ERA
UG Obj. #5 500.1 I ER ERA ER ER ER ER
UG Obj. #5 500.2 I ER ERA ER ER ER ER
UG Obj. #6 600.1 I ER ERA ER ER ER ER
UG Obj. #6 600.2 I ERA ER ER ER ER

125
Course numbers →
144 243 244 300 303 310 311 320 323 324 330 332 342 400 421 433 434 441 441L 445 446 454 455
UG Obj. #6 600.3 I ER ERA ER
UG Obj. #6 600.4 ERA ERA ER
UG Obj. #6 600.5 I ER ERA ER ER
UG Obj. #7 700.1 I ER ER ER ER ER ERA ER
UG Obj. #7 700.2 IE ER ER ERA
UG Obj. #8 800.1 I ERA ER ER
UG Obj. #8 800.2 I ERA ER ER
UG Obj. #8 800.3 I ER ERA ER ER
UG Obj. #8 800.4 I E A ER ERA ER ER
UG Obj. #8 800.5 I ERA ER ER ER ER ERA ER ER
UG Obj. #8 800.6 I ERA ER ER
UG Obj. #8 800.7 IER ERA
UG Obj. #8 800.8 I ER ER ER ER ER ER ERA ER
UG Obj. #8 800.9 IER ERA
UG Obj. #8 800.10 IER ERA ER
UG Obj. #8 800.11 I ER ER ER ER ER ER ER ERA ER
UG Obj. #8 800.12S IER ER ERA
UG Obj. #8 800.12L IER ER ERA
UG Obj. #8 800.13 I ER ER ERA
UG Obj. #8 800.14 IER ER ER ERA
UG Obj. #8 800.15S IER ER ERA
UG Obj. #8 800.15L IER ER ERA
UG Obj. #8 800.16 IER ER ERA ER
UG Obj. #8 800.17 IRA
UG Obj. #8 800.18 IRA
UG Obj. #8 800.19 IRA
UG Obj. #8 800.20 IRA

126
Enter course numbers for your department across the top of the matrix. In the column below, indicate where the targeted outcome is “introduced,” “emphasized,” “reinforced,” or “assessed.”
I = Outcome is introduced E = Outcome is emphasized R = Outcome is reinforced A = Outcome is assessed
Undergraduate Program
Course numbers →
144 243 244 300 303 310 311 320 323 324 330 332 342 400 421 433 434 441 441L 445 446 454 455
SLO CDIS 144.001 IRA ER
SLO CDIS 144.002 IRA ER
SLO CDIS 144.003 IRA ER ER
SLO CDIS 144.004 IRA ER
SLO CDIS 144.005 IRA ER
SLO CDIS 144.006 IRA ER
SLO CDIS 144.007 IRA ER
SLO CDIS 244.001 IRA
SLO CDIS 244.002 IRA
SLO CDIS 244.003 IRA ER
SLO CDIS 244.004 IRA
SLO CDIS 244.005 IRA
SLO CDIS 244.006 IRA
SLO CDIS 244.007 IRA
SLO CDIS 303.001 IRA ER ER ER
SLO CDIS 303.002 IRA ER
SLO CDIS 303.003 IRA ER ER ER ER
SLO CDIS 303.004 IRA ER ER ER
SLO CDIS 303.005 IRA ER ER ER
SLO CDIS 320.001 IRA
SLO CDIS 320.002 IRA
SLO CDIS 320.003 IRA
SLO CDIS 320.004 IRA

127
Enter course numbers for your department across the top of the matrix. In the column below, indicate where the targeted outcome is “introduced,” “emphasized,” “reinforced,” or “assessed.”
I = Outcome is introduced E = Outcome is emphasized R = Outcome is reinforced A = Outcome is assessed
Undergraduate Program
Course numbers →
144 243 244 300 303 310 311 320 323 324 330 332 342 400 421 433 434 441 441L 445 446 454 455
SLO CDIS 323.001 IRA
SLO CDIS 323.002 IRA
SLO CDIS 323.003 IRA
SLO CDIS 323.004 IRA
SLO CDIS 323.005 IRA
SLO CDIS 324.001 IRA
SLO CDIS 324.002 IRA
SLO CDIS 324.003 IRA
SLO CDIS 433.001 IRA
SLO CDIS 433.002 IRA
SLO CDIS 433.003 IRA
SLO CDIS 433.004 IRA
SLO CDIS 433.005 IRA
SLO CDIS 445.001 IEA ERA
SLO CDIS 455.001 IRA
SLO CDIS 455.002 IRA
SLO CDIS 455.003 IRA
SLO CDIS 455.004 IRA

128
Enter course numbers for your department across the top of the matrix. In the column below, indicate where the targeted outcome is “introduced,” “emphasized,” “reinforced,” or “assessed.” I = Outcome is introduced E = Outcome is emphasized R = Outcome is reinforced A = Outcome is assessed
Graduate Program
Course numbers 500 501 502 503 506 511 512 516 517 525 526 527 528 530 531 532
Gr Outcome 7A See attached – Knowledge and Skills Acquisition (KASA) Form - Revised: A KASA is completed for each graduate student in
Gr Outcome 7B1 the program, and is updated at the end of each semester. This form specifies which outcomes are measured in the courses
Gr Outcome 7B2 listed in this table.
Gr Outcome 7B3
Gr Outcome 8
Gr Outcome 9
Gr Outcome 10
Gr Outcome 11
Course numbers 540 550 554 565 589
Gr Outcome 7A
Gr Outcome 7B1
Gr Outcome 7B2
Gr Outcome 7B3
Gr Outcome 8
Gr Outcome 9
Gr Outcome 10
Gr Outcome 11

129
Supplemental Documentation
1. CDIS Mission Statement
2. Undergraduate KASA Checklist
3. Undergraduate KASA Learning Outcomes by Course
4. Graduate Knowledge and Skills Acquisition (KASA) Checklist
5. Graduate Admissions Rubrics
6. Portfolio Scoring Rubric
7. Graduate Research Scoring Rubric

130
CDIS Mission Statement

131
Mission
Program Mission: The mission of the Communicative Disorders (CDIS) program is twofold:
1) To meet the needs of the community and to better serve those having communicative impairments by increasing graduation rates of Master’s level speech language pathologists, and…
2) To provide a comprehensive outcome-based education supplemented by active learning experiences, both on and off campus to CDIS students at ENMU.
Students obtaining a baccalaureate degree in CDIS should be academically capable and show proficiency with pre-professional competencies (graduate program pre-requisite skills) in CDIS content areas, basic research, introductory clinical practice, and verbal/written presentation abilities. The comprehensive nature of the undergraduate program, with its emphasis on a broad theoretical foundation in normal and disordered human communication is to prepare students for graduate study in speech/language pathology and/or audiology.
Graduate students in CDIS must demonstrate entry-level competence as defined by the American Speech-Language-Hearing Association (ASHA) accreditation policy and as specified by Knowledge and Skills Acquisition (KASA) learning outcomes. ASHA is the national professional, scientific, and credentialing organization for speech-language pathologists, audiologists, and speech, language, and hearing scientists. The use of KASA learning outcomes as recommended by ASHA’s Council for Clinical Certification (CFCC) demonstrates compliance with accreditation standards related to preparing students to meet ASHA certification requirements. The KASA learning outcomes link knowledge area standards as specified by the CFCC with specific graduate curriculum knowledge and skills that must be acquired by the conclusion of the graduate program. The overall mission of the Graduate program in CDIS is to prepare students for national certification and licensure as practicing speech-language pathologists.
Link to University Mission: Eastern New Mexico University combines a traditional learning environment with twenty-first century technology to provide a rich educational experience. The CDIS program enhances this mission with its diversified learning formats. Each semester we offer face-to-face on campus courses, hybrid courses incorporating Mediasite lecture capture (synchronous/asynchronous), and online/internet courses. All courses are Blackboard enhanced. In addition to this, our courses offer maximum flexibility to meet the needs of both traditional and non-traditional students through course offerings in both 8 and 16 week formats with evening and weekend courses available. Eastern emphasizes liberal learning, freedom of inquiry, cultural diversity and whole student life. The ENMU CDIS Program supports these tenets through advanced critical thinking and application tasks during applied learning and life activities, particularly those which work toward the understanding of communicative and cultural diversity (including the diversity of disability). Active learning takes place during case study, laboratory, and clinical practicum exercises, as does scholarship as students design and complete various data-gathering and research activities to improves services to the clients they serve.
Link to College Mission: The CDIS mission likewise enhances that of the College of Liberal Arts & Sciences in providing courses with content that transcends a wide spectrum of the liberal arts and sciences. Courses address areas such as speech, language(s)/cultural diversity, anatomy/physiology, biology/genetics, acoustics and properties of sound, psychological principles, research, grammar composition/writing, public speaking, and community/client services. As CDIS graduates must provide autonomous services in community based settings, students completing our programs are well prepared for “on your feet” decision making and leadership roles within their occupational placements.

132
Link to Graduate School Mission: The mission of the graduate program in CDIS supports that of the Graduate School in multiple ways. The program seeks to encourage research, independent thought, and intellectual/analytical growth by providing up-to-date instruction in the prevention, identification, evaluation, and remediation of speech, language, swallowing, and hearing disorders. The intensive classroom and clinical educational experiences prepare students for state licensure and certification by the American Speech-Language-Hearing Association, and ultimately, to secure successful careers in the field of speech-language pathology and to provide services to clients with communicative disorders.
URL: www.enmu.edu/cdis

133
Undergraduate Knowledge and Skills Acquisition (KASA) Checklist (Sample Page)

134

135
Undergraduate KASA Learning Outcomes by Course

136
UG KASA LEARNING OUTCOMES BY COURSE
CDIS 144
144.001 Acquire a basic knowledge of foundational ASL signs, fingerspelling, and numbers.
CDIS 144
Demonstration/Quiz/Exam
144.002 Demonstrate beginning receptive/expressive signing skills and ASL interpreting.
CDIS 144
Demonstration/Quiz/Exam
144.003 Demonstrate basic knowledge about ASL as a language related to linguistic structure and function.
CDIS 144
Demonstration/Quiz/Exam
144.004 Demonstrate basic knowledge about Deaf culture related the arts (Deaf literary forms, art, music, theatre, and dance).
CDIS 144
Demonstration/Essay
144.005 Demonstrate basic knowledge about Deaf culture related to Deaf history and cultural oppression.
CDIS 144
Paper/Essay
144.006 Demonstrate basic knowledge about Deaf culture related to Deaf history and cultural advancements related to technology.
CDIS 144
Paper/Essay
144.007 Demonstrate basic knowledge about Deaf culture including controversies related hearing loss/deafness, Deaf education, and the Deaf community.
CDIS 144
Paper/Essay

137
CDIS 243/3xx
TBD CDIS 243
Exam/Paper/Essay
CDIS 243
Exam/Paper/Essay
CDIS 243
Exam/Paper/Essay
CDIS 244
244.001 Acquire knowledge of ASL signs, fingerspelling, and numbers at an intermediate level.
CDIS 244
Demonstration/Quiz/Exam
244.002 Demonstrate intermediate receptive/expressive signing skills and ASL interpreting.
CDIS 244
Demonstration/Quiz/Exam
244.003 Demonstrate knowledge about ASL as a language related to linguistic structure and function at an intermediate level.
CDIS 244
Demonstration/Quiz/Exam
244.004 Demonstrate knowledge about Deaf culture related the arts (Deaf literary forms, art, music, theatre, and dance) at an intermediate level.
CDIS 244
Demonstration/Essay
244.005 Demonstrate knowledge about Deaf culture related to Deaf history and cultural oppression at an intermediate level.
CDIS 244
Paper/Essay

138
244.006 Demonstrate knowledge about Deaf culture related to Deaf history and cultural advancements related to technology at an intermediate level.
CDIS 244
Paper/Essay
244.007 Demonstrate knowledge about Deaf culture including controversies related hearing loss/deafness, Deaf education, and the Deaf community at an intermediate level.
CDIS 244
Paper/Essay
CDIS 300 100.1 From production through auditory reception, detail all structures and functions required to produce and perceive speech. Students must specifically identify respiratory, phonatory, resonatory, and articulatory components including variations produced in coarticulatory and connected speech contexts with longer linguistic units.
CDIS 300
Paper/Essay
100.2 Develop and implement an oral-motor assessment protocol
CDIS 300
Protocol
CDIS 303
CDIS 303.001 Describe the primary differences between vowels and consonants from a phonetic/phonological perspective
CDIS 303
Demonstration/Quiz/Exam
CDIS 303.002 Analyze monosyllabic and multisyllabic words using tree diagrams to indicate all of the syllabic features
CDIS 303
Demonstration/Quiz/Exam
CDIS 303.003 Demonstrate basic language analysis and coding skills in the context of a variety of linguistic units and categories
CDIS 303
Demonstration/Quiz/Exam
CDIS 303.004 Identify and define the language universals (phonology, morphology, syntax, semantics, and pragmatics) in relationship to linguistic form, content, and function
CDIS 303
Demonstration/Essay

139
CDIS 303.005 Develop a working definition for language based on information presented in the class as applicable to a spoken and/or signed language.
CDIS 303
Paper/Essay
CDIS 310
600.2 Transcribe normal speech sample using IPA, diacritics, syllable shapes, and place/manner/voicing analysis
CDIS 252
Speech sample
CDIS 311
100.3 Relate anatomical structure (e.g., dentition, occlusion and function (e.g. extension, retraction to place, manner, and voicing descriptors for normal phoneme development/production
CDIS 311
Chart/Exam
600.4 Using a normal sample, score NRT and analyze results according to strengths/weaknesses and developmental norms
CDIS 311
GFTA/APP Analysis
600.5 Compose report detailing results of sample
CDIS 311
Articulation Report
800.1 Transcribe disordered speech sample using IPA, diacritics, syllable shapes, and place/manner/voicing analysis; relate to developmental norms
CDIS 311
Speech sample
800.2 Relate anatomical structure (e.g., dentition, occlusion and function (e.g., hyper/hypo) to pattern of error
CDIS 311
Assessment Report
800.4 Describe common etiologies and characteristics of speech and language disorders
CDIS 311
Exam/Paper/Essay

140
800.5 Explain basic differences in delay vs. disorder vs. difference in speech and language profiles
CDIS 311
Case based exercises
CDIS 320
320- 001 Students will critically appraise their own beliefs as well as the viewpoints of others. Students will learn to critique/defend and negotiate differences in opinion.
CDIS 320
Exam/Paper/Essay
320-002 Students will recognize and communicate how disabilities have been viewed and treated historically in the U.S. and across the globe. The student will also compare/contrast how different societies presently view individuals with a disability.
CDIS 320
Exam/Paper/Essay
320-003 Students will analyze relationships between culture, religion, SES, gender, and disability.
CDIS 320
Exam/Paper/Essay
320-004 Students will recognize, communicate, and critically appraise barriers for, stigmas about, and discrimination of individuals with a disability.
CDIS 320
Exam/Paper/Essay
CDIS 330
500.1 Describe how theories of speech and language development explain the emergence of communication
CDIS 330
Paper/Essay
500.2 Construct a chart of developmental milestones to include auditory skills, speech development, language development, cognitive development, psycho-social emotional development, gross/fine motor development, and play skills development
CDIS 330
Chart

141
600.1 Differentiate the parameters of speech and language according to form, content, and use as well as phonology, morphology, syntax, semantics, and pragmatics
CDIS 330
Case based exercises
CDIS 332
600.3 Transcribe normal language sample; Compute MLU, MLR, TTR, semantic analysis, clause density (e.g., coordination/subordination index
CDIS 332
Language sample
600.4 Using a normal sample, score NRT and analyze results according to strengths/weaknesses and developmental norms
CDIS 332
PLS/TOLD/CELF Analysis
600.5 Compose report detailing results of sample
CDIS 332
Language Report
800.3 Transcribe disordered language sample; Compute MLU, MLR, TTR, semantic analysis, clause density (e.g., coordination/subordination index; relate to developmental norms
CDIS 332
Language Sample
800.4 Describe common etiologies and characteristics of speech and language disorders
CDIS 332
Exam/Paper/Essay
800.5 Explain basic differences in delay vs. disorder vs. difference in speech and language profiles
CDIS 332
Case based exercises
CDIS 342
300.5 Demonstrate competency with basic principles of audiometric evaluation (to include tympanometry)
CDIS 342
Exam/Skills Demonstration
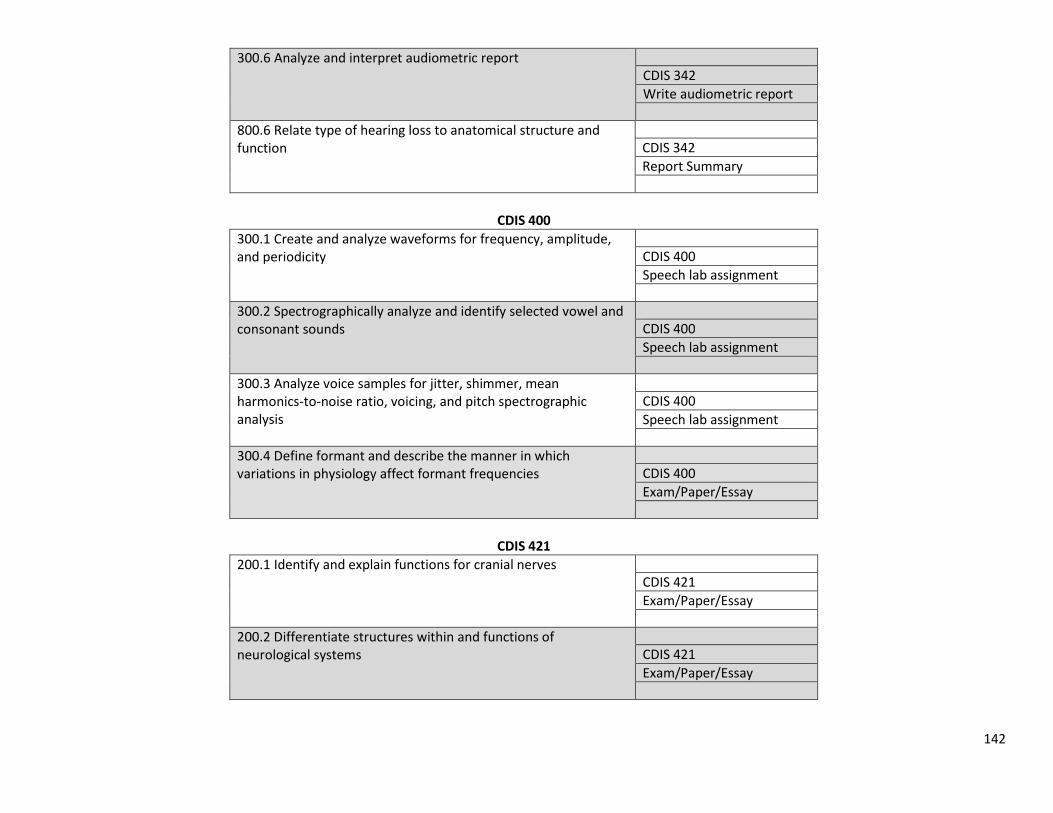
142
300.6 Analyze and interpret audiometric report CDIS 342
Write audiometric report
800.6 Relate type of hearing loss to anatomical structure and function
CDIS 342
Report Summary
CDIS 400
300.1 Create and analyze waveforms for frequency, amplitude, and periodicity
CDIS 400
Speech lab assignment
300.2 Spectrographically analyze and identify selected vowel and consonant sounds
CDIS 400
Speech lab assignment
300.3 Analyze voice samples for jitter, shimmer, mean harmonics-to-noise ratio, voicing, and pitch spectrographic analysis
CDIS 400
Speech lab assignment
300.4 Define formant and describe the manner in which variations in physiology affect formant frequencies
CDIS 400
Exam/Paper/Essay
CDIS 421
200.1 Identify and explain functions for cranial nerves CDIS 421
Exam/Paper/Essay
200.2 Differentiate structures within and functions of neurological systems
CDIS 421
Exam/Paper/Essay

143
200.3 Identify and list functions for UMN and LMN systems CDIS 421
Exam/Paper/Essay
200.4 Explain the blood supply of the brain and brain stem
CDIS 421
Exam/Paper/Essay
200.5 Identify lobes and their functions
CDIS 421
Exam/Paper/Essay
200.6 Identify cortical structures of hearing and vision
CDIS 421
Exam/Paper/Essay
CDIS 433
433-001 List the professional roles and responsibilities typically encountered by SLPs in medical settings
CDIS 433
Exam/Paper/Essay
433-002 Demonstrate use and understanding of medical terminology, abbreviations, and notations as they pertain to Speech-Language Pathologists
CDIS 433
Exam/Paper/Essay
433-003 Write SOAP notes using appropriate form, content, and style
CDIS 433
Exam/Paper/Essay
433-004 Interpret physician’s history and physical and diagnostic reports
CDIS 433
Exam/Paper/Essay

144
433-005 List vital signs and describe how they are typically obtained
CDIS 433
Exam/Paper/Essay
CDIS 434
800.7 Discriminate and describe amplification systems CDIS 434
Exam/Paper/Essay
800.8 Discriminate and describe communication methods for deaf and HOH individuals
CDIS 434
Exam/Paper/Essay
800.9 Match communication methodologies to client need based on type and degree of loss in conjunction with communication profile
CDIS 434
Case based exercises
CDIS 441:
400.1 Integrate basic principles of cognitive psychology into intervention contexts
CDIS 441
Application assignment/
Therapy lesson plan
400.2 Integrate basic principles of behavior modification into intervention contexts
CDIS 441
Exam/Therapy lesson plan
400.3 Address multiple learning styles in therapeutic contexts
CDIS 441
Application assignment/
Therapy lesson plan
700.1 Describe impact of and modifications necessary for successful interactions with diverse multicultural clientele
CDIS 441
Cultural competency exam/
Application assignment

145
800.10 Discriminate and explain various intervention models for addressing speech and language disorders
CDIS 441
Application
assignment/Essay
800.11 Use elementary principles of EBP to justify decision making process
CDIS 441
Application assignment/
Therapy lesson plan
800.16 Apply the ASHA COE to case-based situations CDIS 441
Application
assignment/Essay
800.17 Explain scope of practice, legal policy, etc. CDIS 441
Application
assignment/Essay
800.19 Complete clinical application assignments CDIS 441
Therapy lesson plans/
Language sample-analysis
800.20 Prepare and an informational session on communicative disorders
CDIS 441
Application assignment/
Service learning project
CDIS 441L
800.18 Complete clinical observations as assigned CDIS 441
Skills Demonstration
CDIS 445
CDIS 445.001 Demonstrate basic clinical competencies in the delivery of therapy services
CDIS 445
Skills Demonstration

146
CDIS 446
300.5 Demonstrate competency with basic principles of audiometric evaluation (to include tympanometry
CDIS 342/446
Exam/Skills Demonstration
CDIS 454
700.2 Describe impact of and modifications necessary for successful assessment with diverse multicultural clientele
CDIS 454
Assessment Report
800.12S Using a disordered sample, score NRT and analyze results according to strengths/weaknesses and developmental norms
Speech
CDIS 454
GFTA/APP Analysis
800.12L Using a disordered sample, score NRT and analyze results according to strengths/weaknesses and developmental norms
Language
CDIS 454
PLS/TOLD/CELF Analysis

147
800.13 Complete syllable shape, positional, and place/manner/voice analysis; identify error types (SODA, pattern of error, intelligibility index, and phonetic inventory
CDIS 454
Diagnostic Report
800.14 Integrate and analyze findings from case history (social, educational,
medical, etc., oral motor structure and function, articulatory and phonological assessments, receptive/expressive language in all parameters (syntax, morphology, semantics, pragmatics, narrative, problem solving, etc., auditory skills, literacy, dynamic assessment, cultural/linguistic variables
CDIS 454
Diagnostic Report
800.15S Compose report detailing results of sample; provide preliminary diagnosis, eligibility, statement of functional need, and prognosis; select and construct goals/objectives in order of target need; recommend treatment approach to include modifications; MUST BE SUPPORTED BY REFERREED EBP
Speech
CDIS 454
Diagnostic Report
800.15L Compose report detailing results of sample; provide preliminary diagnosis, eligibility, statement of functional need, and prognosis; select and construct goals/objectives in order of target need; recommend treatment approach to include modifications; MUST BE SUPPORTED BY REFERREED EBP
Language
CDIS 454
Diagnostic Report
CDIS 455
CDIS 455.001 Demonstrate understanding of the basic tenets of ethical practices in Communication Sciences research
CDIS 455
Quiz/Exam
CDIS 455.002 Demonstrate a basic knowledge of concepts in Communication Sciences research, including: observation and measurement, hypotheses and research questions, Type I/Type II errors, dependent and independent variables, experimental control, levels of evidence, extraneous or confounding variables, reliability, fidelity, validity, generalization, and social validity
CDIS 455
Quiz/Exam
CDIS 455.003 Demonstrate a knowledge of group and single subject designs and the difference between design and statistics
CDIS 455
Quiz/Exam

148
CDIS 455.004 Identify and explain research measures and outcomes: levels of measurement, normal distribution, parametric and non-parametric measurement, visual displays, central tendency, variability, correlation, regression, significance, power, alpha levels, independent t-test, and ANOVA/MANOVA
CDIS 455
Quiz/Exam

149
Graduate Knowledge and Skills Acquisition (KASA) Checklist (Sample Page)

150

151
Graduate Admissions Rubrics

152
Graduate Admissions Rubric – Applicant # _____________________ Rater_______________ Total Score ___________
Please note: The purpose of the rubric is to give comparable, relative assessment of admissions materials. All final decisions are reached by the faculty
admissions committee via discussion and consensus in accordance with the Eastern New Mexico University Graduate School guidelines.
CDIS Application – 35% 0 1 2 3 Clinical Observations
No experience Clock Hours: Less than 10 hours Clock Hours: More than 10 hours Clock Hours: More than 10 hours
Clinical Experience
No experience Clock Hours: < 5 hours Clock Hours: 6-10 hours Clock Hours: 11+ hours
Research Experience No experience Assisted with professor’s project Independent or group research project Research presentation (poster or paper)
Second Language Skills Novice level Conversational level Professional level Interpreter level
Personal Characteristics (Weakness and Strategies)
Limited response Negative Neutral Positive
Total
Assessment Scores – 30% Conversion Student Score
0 1 2 3
GRE Verbal (410.5 = 2 yr avg) 147 (36%) <370 or 144 (<26%) 380 – 460; 145 - 151 (27-50%) 470 – 550; 151-156 (51-72%) 560+ or 157+ (73%+)
GRE Quantitative (474.29 = 2 yr avg) 151 (51%) <520 or 144 (<26%) 530 – 620; 145 –149 (27-50%) 630 – 710; 150 -155 (51-73%) 720 + or 156+ (74%+)
GRE Writing (3.71 = 2 yr avg) <3.5 3.5 4.0 4.5+
UG GPA (3.29 = 2 yr avg) <3.0 3.0 - 3.5 3.51 - 3.75 3.76 - 4.0
CDIS GPA (3.32 = 2 yr avg) <3.25 3.26 - 3.5 3.51 - 3.75 3.76 - 4.0
CDIS Related Courses GPA <3.25 3.26 - 3.5 3.51 - 3.75 3.76 - 4.0
Total
Additional Information
Work Experience No experience No applicable experience Possibly helpful Likely helpful
Exceptional Circumstance Not Applicable Mild impact Moderate impact Significant impact
Personal Characteristics – Weaknesses & Strategies Poor Fair Good Excellent
Course Repeats 5+ Repeats 3-5 Repeats 1-2 Repeats No Repeats

153
Essay 0 1 2 3 4
Thesis/Focus Thesis absent Thesis unclear; subject to interpretation
Theme apparent, but tangential prose distracting
Thesis clear with a few non-sequiters
Thesis clear and focus maintained.
Creativity Completely banal Obvious, unimaginative Conventional Somewhat original Original
Plausibility Impossible Improbable Possible Likely effective Should succeed
Development Added impossible resources; Ignored facts/instructions given
Improbable resources, but creative; Missed major supports
Used some resources but left others untouched; Missed several supports
Used most resource but missed minor supports
Recognizes and uses all reasonable resources/supports
Inferencing
Absent or unreasonable assumptions; Missed information not explicitly stated
Marginal; Did not assume what was reasonably implied
Adequate; No glaring omissions Good inferences; Noted subtleties that others missed
Inferences comprehensive and clever.
Deduction Logic
Deductions incorrect and conclusions off-base; Very short-sighted
Deductions untenable and conclusions are flawed; Short-term thinking apparent
Deductions viable, defensible; Conclusions relate to deductions, but some leaps are evident
Deductions pretty accurate; Good conclusions, but neglected some important minor points
Deductions well supported, logical, and comprehensive; Makes perfect sense!
Critical Thinking Reasoning
Tenets cannot be supported by scenario; Does not make connections
Links/rationales are few and weak. Makes faulty judgments; Biased
Makes obvious connections, but neglects confounding variables
Rationales are well explained and only minor issues neglected
Makes excellent conclusions and explained decisions sufficiently
Decision Making Sacrifices “weakest” member; Clear loser; Decisions alarming
Rationalized, but decisions are questionable
Decisions arguable, but some aspects are acceptable
Decisions result in reasonable benefit and try to negate harm to castaways.
Values people equally; Consideration of EVERYONE’S needs.
Problem Solving Problem unsolved Problem lessened, not solved Problem only partially-solved; flaws apparent
Problem mostly solved Problem solved completely
Tone Word Use
Disrespectful; disinterested; flippant; inaccurate word usages
A bit sarcastic or toadying; too harsh or tepid; repetitive vocabulary
Ordinary tone; vocabulary ordinary, but appropriate
Semi-professional tone; Good vocabulary range and accuracy of usage; vernacular terms
Professional tone; Exceptional vocabulary range and polished word selection
Organization Structure
Multiple errors of sentence structure (i.e., fragments, run-ons); simplistic
A bit disorganized or rambling; transitions are poor; Formulaic and tedious sentences; some sentence fragments
Routine transitions and some non-standard syntax; some errors but workable
Competent organization without sophistication; errors are few; effective, but not exciting
Well-developed; smooth transitions; rich, powerful, engaging writing
Mechanics Spelling, punctuation capitalization, length
Frequent errors; far too wordy or cursory
Several errors; a bit too wordy or cursory
Occasional errors Insignificant errors; concise OR comprehensive
No errors; concise but comprehensive
Sub-Totals
Grand Total

154
Portfolio Scoring Rubric

155
PORTFOLIO GUIDELINES AND REQUIREMENTS
All students are required to complete a portfolio of their graduate work to program faculty during their last semester of coursework. The student is
required to turn in 1 portfolio in a digital media format. The portfolio will remain on-file with the CDIS department as evidence of compliance to
ASHA program standards. Students should turn in the digital copy on a slide style jump drive placed inside a clasped small manila envelope placed
inside a plastic presentation folder with the students name showing through on a page in front of the envelope.
PORTFOLIO PREPARATION
Format
Portfolios should be divided into tabbed and labeled, color coded sections that are prefaced by a table of contents. Additionally, each section
should contain an itemized summary/cover page that lists the comprehensive contents of each section in the order in which they are presented
(e.g., Letter of Application, November, 2005; Resume, October, 2005; etc.). Each item within a section should then be divided by a color
coded sheet (e.g., all documents in the writing section are separated by a blue piece of paper) which identifies the document to follow (a
‘title” page of sorts). Hyperlinks should be used to link the table of contents to each section and each section contents page should have
hyperlinks to each of its contents. At the end of each section there should be a hyperlink back to the table of contents. Contents should not be
paginated.
Specific Contents:
1) Synthesis Paper:
This paper should summarize your learning experience, the impact your education has made/will make, your present strengths and
weaknesses, and future goals for employment and/or educational endeavors. It should be typed with 12 font using 1-inch margins, be
double-spaced, and should be 3-5 pages.
2) Letter of Application and Resume:
Write a letter of application for a position in speech-language pathology that is of interest to you. Compose a resume summarizing your
employment goals, credentials, education, experience, presentations, organizations, professional/community activities, and awards/honors.
Your letter should not exceed 1 page and your resume should not exceed 2 pages. These should be typed with 10-12 font in the body
using margins of no less than 1 inch.
3) Professional Credentials:
Compile necessary documentation to support your resume. This should include your completed ASHA application and appropriate state
licensure form and final clock hour logs (one page log showing hours completed in areas) of practicums completed, prefaced by the summary
form. Also include your unofficial copies of academic transcripts. If passing NESPA scores have been obtained, should be included as well.
156
If not obtained, the student should have documentation which details either the date on which he/she will be taking the NESPA, or the date on
which he/she will be taking their comprehensive exams.
4) Clinical Experience:
Write a 2-page double spaced summary which clearly states your clinical strengths, weaknesses, and plans for future development in your
areas of personal need or interest. In addition, this section must provide an index of relevant work completed with an ENMU faculty/staff
supervisor onsite at ENMU or at CCS. This index should state the initials of the client, the date of the report, the site of the report, the area
treated, and the name of the supervisor. The index must address each of the following areas:
§ Child evaluation report
§ Adult evaluation report
§ Child lesson plan/plan of care
§ Adult lesson plan/plan of care
§ Child long term goals and short term objectives
§ Adult long term goals and short term objectives
§ Child SOAP/session note
§ Adult SOAP/session report
§ Child report of 9 weeks/term/semester progress
§ Adult report of 9 weeks/term/semester progress
If any of the above were not completed with an ENMU faculty onsite at ENMU or at CCS, then a demonstration of the work that exhibits the
student’s ability to complete the above should be included in this section.
This section must further contain at least one original example of a clinical work product you created from each of the following work sites
(cannot be a duplicate document used above);
§ University
§ Head Start/preschool
§ Public school (K-12)
§ Medical site
§ Other site (private practice, nursing home, early intervention FIT, adult DD, stuttering camp, etc.).
Documentation should reflect a variety of speech-language impairments and must minimally reflect 3 (e.g., articulation, language, voice,
fluency).
This allows you to do an index for the 10 reports required and simply create a reference to items that you have done with an ENMU
supervisor to include the initials of the client, the date of the report, the site of the report, the area treated, and the name of the supervisor.

157
Students must NOT submit actual practicum documents from real clients. Students who are unable to reference a selected work completed
with an ENMU supervisor must create a “hypothetical” document to demonstrate their mastery of the above - listed skill
5) Major Graduate Research Project/Special Project:
A) This section should begin with a bulleted/listed summary that synthesizes
the following information:
▪ Title of study
▪ Advisor(s)
▪ Purpose of the study
▪ Methodology including research design, subject(s), setting, materials, evaluation procedure(s), and statistical analysis methods
▪ Results of the study (must include chart/table exemplifying results)
▪ Discussion and/or clinical implications
B) Completed “publication-ready” paper including
o Formal abstract (100-120 words unless specified otherwise by publisher)
o Body of paper with introduction, literature review, methodology, results, interpretation/discussion, references, and appendices.
C) Presentation Artifacts
▪ PowerPoint slides
▪ Poster
▪ Brochure and/or webpage
▪ Other handouts
D) Other Project Artifacts
o Human subjects proposal and acceptance letter(s)
o Letter of submission for refereed journal
o Submission guidelines for journal selected
o Evidence of conference presentation
o Evidence of community presentation/distribution
E) A three-page learning experience paper specifying what you have learned
regarding professional research, problems in conducting the study, strengths and weaknesses of your research, what you might have done
differently next time, and additional supports needed.
Students completing a thesis will, of course, substitute their thesis and appropriate artifacts in lieu of the publication-ready paper above.
6) Other Research:
Include evidence of other student research such as participation in faculty sponsored research, study done with practicum supervisors, single
subject designs done as a part of therapy, survey projects, meta-analysis of professional writings, therapeutic and other program reviews,
research papers, article reviews/abstracts, etc. At least 3 items should be submitted.

158
7) Other Professional Projects:
This section should provide other examples of original student work. Items to be considered for this section should NOT include your special
project or more formalized, data-driven research, but rather should include other projects such as student-created checklists, therapy games,
resource guides, staff/parent handouts, topic notebooks, or other clinical/educational tools such as original student created case histories or
progress tracking/reporting forms. Lengthy or bulky projects (e.g., topic notebooks) that do not fit readily into the portfolio should be
summarized rather than directly inserted. Compiled projects should be careful to include references. At least 5 items should be submitted.
8) Professional Writing:
This section should include examples that display your proficiency with writing professional letters to colleagues, clients/parents, supervisors,
administrators, etc. Persuasive letters such as scholarship requests, grant proposals, funding application letters, or submissions for
professional offices (e.g., ASHA delegate, student officers, etc,) are also of interest. At least 5 items should be submitted.
9) Presentation Activities:
Provide evidence of formal presentation activities. Items to be considered include national, state, regional, local, or class presentations
completed by the student. The following criteria must be met for each item submitted:
▪ Title of presentation
▪ Audience
▪ Setting (Date/time/location)
▪ Length of presentation
▪ Number of attendees
▪ Purpose/Learner objectives
▪ Handouts
▪ Convention program/presentation schedule if applicable
At least 5 items should be submitted for this section. 1 item may consist of a web-based presentation venue (e.g., webpage).
10) Continuing Education:
The student must provide evidence of attendance at 6 continuing education events completed during their graduate matriculation period.
Include certificates if given. Attendance at departmentally sponsored relevant classes taken for credit that do not count toward completion of
degree plan requirements (electives) will typically qualify as a single continuing education event; however, approval of the program director
must be secured prior to electives counting as continuing education credit.
11) Additional Sections:
Students should be aware that additional sections may be added on an “as needed” basis as the CDIS Program continues to develop
assessment procedures for the ASHA standards. Additional sections may also be required for students who have not meet KASA
requirements.

159
PORTFOLIO SCORING
Portfolios will be assessed according to the checklist for evaluating portfolios and will be graded with a PASS or FAIL during CDIS 590- Graduate
Seminar.
For the portfolio itself, each student will be rated as pass or fail in each of the following parameters (a full checklist is attached for reference):
▪ Overall portfolio quality
▪ Synthesis paper
▪ Letter of application and resume
▪ Professional credentials
▪ Clinical experience
▪ Special project
▪ Other research
▪ Professional writing
▪ Presentation activities
▪ Continuing education
▪ Program assessment
▪ Additional sections (if applicable)
PORTFOLIO DUE DATES
All portfolios are due by 5:00 pm according to the following schedule:
▪ If graduating in a fall semester, your portfolio is due on the last Friday in October
▪ If graduating in a spring or summer semester, your portfolio is due on the last Monday in March
▪ If any due date falls during an official University recess, your portfolio is due exactly one week prior.
Portfolios should be turned in to the faculty teaching CDIS 590.
***Late portfolios will not be accepted. If your portfolio does not arrive in the Program Office by the date and time required, you will fail to meet
departmental graduation requirements and your graduation will be deferred until such time as you have met all requirements.
PORTFOLIO SUPPORTS
An overview and question/answer session specifically addressing the portfolio process will be provided for students during CDIS 500, 557, 560, 573
and each spring semester during CDIS 590: Graduate Seminar. Students should also feel free to schedule an individual appointment with faculty to
ask additional questions, gain further guidance, view portfolio examples, or to review their portfolio at any time.

160
Requirements Checklist
Format Pass/Fail If deficient, what is missing
Specifics 1. Synthesis Paper
2. Letter of Application
Resume’
3. Professional Credentials
4. Clinical Experiences Summary
10 Total
5 Sites
3 Disorders
5. Major Graduate Project Bulleted Summary
Paper (print ready)
Presentation
Other Artifacts-HS form, etc
Learning Summary
6. Other Research (3 items)
7. Other Professional projects (5 items)
8. Professional Writing (5 items)
9. Presentation Activities (5 items)
10. Continuing Ed (6 items)
** KASA Outcomes 800.1, 800.2, 800.3, 800.4, 800.5, 800.6, 800.7, 800.8, 800.9, 800.11 will all be verified via this checklist.
Swift/Weems/Bratcher – updated 8/22/16

161
Graduate Research Scoring Rubric

162
CDIS 560 Data Grading Rubric
Unacceptable Less than Expected As Expected Better than Expected
Study Execution 0-4 6 8 10
Did not anticipate nor control for confounding variables
Partial control for expected confounding variables, but reacted slowly or did not recognize problems until too late.
Anticipated and controlled for expected confounding variables
Anticipated and controlled for expected variables and reacted quickly to attempt control of unexpected confounding variables
Data Collection 0-4 6 8 10
Data was collected in an inappropriate manner or minimal n was not obtained
Data was collected in appropriate manner with less than required n as specified in IRB and/or approved by supervisor
Data was collected in appropriate manner with required n as specified in IRB & approved by supervisor
Data was collected in exemplary manner with attention to detail and high treatment fidelity; required n was exceeded
Independence 0-4 6 8 10
Relied on supervisor to initiate meetings, structure data, & select statistic; did not solve problems; required supervisor for vast majority of all data analysis
Required significant supervisor support; suggested resolutions which were untenable; relied on supervisor to solve problems; presented raw data to supervisor with no preliminary ideas or analysis.
Requested support as needed; suggested tenable solutions; worked with supervisor to resolve issues; presented partially complete data to supervisor for assistance
Required minimal support; presented solutions to supervisor for approval; submitted largely complete statistical analysis to supervisor for approval
Descriptive: Computation & Calculation Fundamentals
0-6 9 12 15
Could not organize data or compute statistics competently without extensive assistance; Incompetent Excel user
Could only organize data and compute statistics with moderate assistance; Emergent Excel user
Was able to organize data and compute statistics with minimal assistance; Fair Excel user
Was able to organize data and compute statistics without assistance; Good Excel user
Inferential: Computation & Calculation Fundamentals
0-8 12 16 20
Analysis does not match design of research; Could not select or compute statistics competently without extensive assistance (including post-hocs); Incompetent with statistics calculator
Analysis partially matches design of research; Could only select and compute statistics with moderate assistance (including post-hocs); Emergent calculator user
Analysis matches design of research; Was able to select and compute statistics with minimal assistance; (including post-hocs); Fair calculator user
Analysis matches design of research; Was able to select and compute statistics without assistance; (including post-hocs); Good calculator user

163
Interpretation 0-4 6 8 10
Could not interpret statistics competently without extensive assistance
Could only interpret statistics with moderate assistance
Was able to interpret statistics with minimal assistance
Was able to interpret statistics without assistance
Answered Research Question(s)
0-6 9 12 15
Did not answer research question Marginally answered research question
Mostly answered research question; all questions are included in model
Answered research question; Analysis is thorough and exhaustive
Timeliness 0-4 6 8 10
Scheduled late and completed late Scheduled late and completed on time
Scheduled appropriately and completed on time
Scheduled and completed early
Charts and Graphs (Optional) 0-4 6 8 10
None included Charts and graphs included but have mistakes; detract from understanding of date
Charts and data included but distracting and/or hard to read; do not add to understanding of data
Neat and easy to read; enhance the understanding of the data
Total
Grand Total Grade
Student Name: _____________________________________________ Supervisor Signature: ________________________________________ Date: _____________________________________________________