Education in Mexico - MAPEAL
22
Introduction 1 Good education may be the single most powerful tool available to increase economic growth, enhance competi- tiveness and promote inclusion. Countries with higher levels of student learning grow more. Workers with higher levels of skills earn higher wages. Countries with large numbers of top performers, particularly in science and math, tend to compete more successfully in global trade. Countries that boost the human capital of the poor tend to reduce inequal- ity. Well-educated individuals are more likely to partici- pate in community affairs, and to favor democratic over non-democratic governance. Education in Mexico generally fails to play these positive roles. Governments have invested heavily in expanding the public school system and today more children attend school than ever before. But few achieve the levels of learning necessary to promote prosperity, equity and democracy. Children from poor families are particularly unlikely to acquire the skills they need to get ahead. These shortcomings are a major obstacle to economic and social progress. Tapping education’s potential to promote growth and inclusion will require making learning the chief objective of schools, and restructuring the education system to maximize it. Mexico’s standing in the World Economic Forum’s most recent Global Competitiveness Report illustrates the problem. The country’s overall competitiveness ranking has declined from 32nd in 1998 to 66 in 2010. 2 Although some part of this drop may be due to the inclusion of more countries in the annual rankings, Mexico appears to be losing ground. 3 1 The authors would like to thank Robert Myers, Carlos Ornelas, Sylvia Schmelkes, Anil Sood, and Mónica Tapia for their helpful and detailed comments on earlier drafts of this document. The contents of the final version, as well as any errors of fact or interpretation, are the sole responsibility of the authors. 2 Schwab, K. 2010. The Global Competitiveness Report 2010–2011. Centre for Global Competitiveness and Performance. Geneva: World Economic Forum. 3 Based on Bloom, Erik. 2008. Closing the Gap in Mexico’s Upper Secondary Education System. Unpublished Working Paper. A look beyond the composite index suggests that deficien- cies in education are an important part of the country’s failure to improve (Table 3.1). Despite ranking relatively high in measures of enrollment, Mexico ranked low in measures of quality—120th out of 139 in overall quality of the education system, 120th in quality of primary education, and 128th in quality of math and science education. These rankings reflect the perceptions of Mexican business leaders; clearly they are worried about the low quality of education of Mexico’s work force. Current circumstances Enrollments have increased at all levels, and today nearly every child attends primary and lower second- ary school. By most standards, Mexico has made substan- tial progress in getting children into school. It has largely achieved the United Nations Millennium Development Goals in education: universal primary completion, and gender parity in primary education. 4 It has also made significant progress in meeting the six Education For All (EFA) goals established at the 2000 World Education Forum in Dakar. 5 Approximately 7 of 10 children are enrolled in pre-school, 9 of 10 in primary, 9 of 10 in lower secondary and 6 of 10 in upper secondary. During the past 20 years, pre-school enrollment rates have 4 According to the United Nations Statistics Division, indicators for Mexico that measure progress towards reaching the MDGs are: Net enrolment ratio in primary education ( percent both sexes): 99.4 ; Percentage of pupils starting Grade 1 and reach Grade 5 ( percent both sexes): 92.1 ; Gender parity Index in primary level enrolment (ratio of girls to boys): 1.0 ; Literacy rates of 15–24 years old ( percent both sexes): 98.1. 5 The six Dakar goals, also called Education for All (EFA) goals, were set in 2000 in Dakar, Senegal. They were adopted by the international community and are focused on accelerating education progress by 2015. The six goals are: 1) expand and improve com- prehensive early childhood care and education, 2) ensure universal primary education, 3) ensure youth and adult learning needs through equitable access and to appropriate learning and life skills, 4) achieve a 50 percent improvement in levels of adult literacy, 5) eliminate gender disparities in primary and secondary education by 2005, and achieve gender equality in education by 2015, 6) improve all aspects of the quality of education. According to the 2011 Education for All, Global Monitoring Report 2011, Mexico has either reached its goals or at least made substantial progress toward them. I 2 42 Education in Mexico Jeffrey Puryear, Lucrecia Santibañez, and Alexandra Solano
-
Upload
khangminh22 -
Category
Documents
-
view
0 -
download
0
Transcript of Education in Mexico - MAPEAL
Introduction1
Good education may be the single most powerful tool
available to increase economic growth, enhance competi-
tiveness and promote inclusion. Countries with higher levels
of student learning grow more. Workers with higher levels
of skills earn higher wages. Countries with large numbers
of top performers, particularly in science and math, tend to
compete more successfully in global trade. Countries that
boost the human capital of the poor tend to reduce inequal-
ity. Well-educated individuals are more likely to partici-
pate in community affairs, and to favor democratic over
non-democratic governance.
Education in Mexico generally fails to play these positive
roles. Governments have invested heavily in expanding the
public school system and today more children attend school
than ever before. But few achieve the levels of learning
necessary to promote prosperity, equity and democracy.
Children from poor families are particularly unlikely to acquire
the skills they need to get ahead. These shortcomings are
a major obstacle to economic and social progress. Tapping
education’s potential to promote growth and inclusion will
require making learning the chief objective of schools, and
restructuring the education system to maximize it.
Mexico’s standing in the World Economic Forum’s most
recent Global Competitiveness Report illustrates the problem.
The country’s overall competitiveness ranking has declined
from 32nd in 1998 to 66 in 2010.2 Although some part of
this drop may be due to the inclusion of more countries in
the annual rankings, Mexico appears to be losing ground.3
1 The authors would like to thank Robert Myers, Carlos Ornelas, Sylvia Schmelkes, Anil Sood, and Mónica Tapia for their helpful and detailed comments on earlier drafts of this document. The contents of the final version, as well as any errors of fact or interpretation, are the sole responsibility of the authors. 2 Schwab, K. 2010. The Global Competitiveness Report 2010–2011. Centre for Global Competitiveness and Performance. Geneva: World Economic Forum.3 Based on Bloom, Erik. 2008. Closing the Gap in Mexico’s Upper Secondary Education System. Unpublished Working Paper.
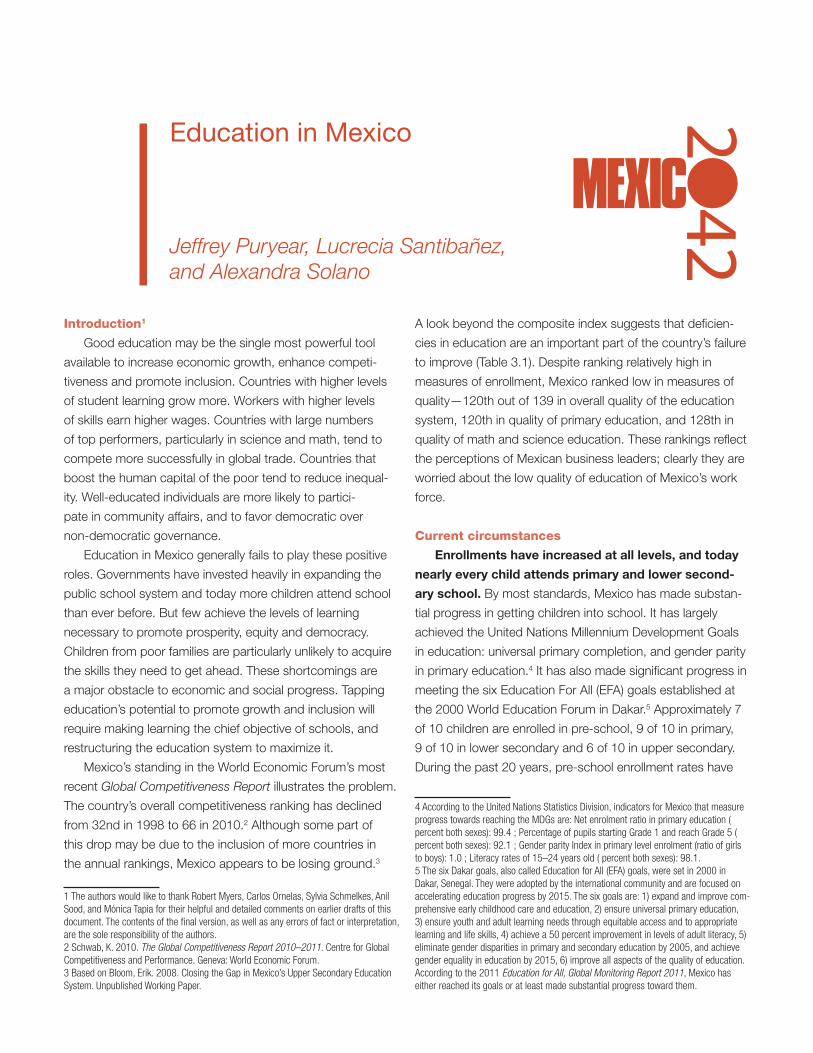
A look beyond the composite index suggests that deficien-
cies in education are an important part of the country’s failure
to improve (Table 3.1). Despite ranking relatively high in
measures of enrollment, Mexico ranked low in measures of
quality—120th out of 139 in overall quality of the education
system, 120th in quality of primary education, and 128th in
quality of math and science education. These rankings reflect
the perceptions of Mexican business leaders; clearly they are
worried about the low quality of education of Mexico’s work
force.
Current circumstances
Enrollments have increased at all levels, and today
nearly every child attends primary and lower second-
ary school. By most standards, Mexico has made substan-
tial progress in getting children into school. It has largely
achieved the United Nations Millennium Development Goals
in education: universal primary completion, and gender parity
in primary education.4 It has also made significant progress in
meeting the six Education For All (EFA) goals established at
the 2000 World Education Forum in Dakar.5 Approximately 7
of 10 children are enrolled in pre-school, 9 of 10 in primary,
9 of 10 in lower secondary and 6 of 10 in upper secondary.
During the past 20 years, pre-school enrollment rates have
4 According to the United Nations Statistics Division, indicators for Mexico that measure progress towards reaching the MDGs are: Net enrolment ratio in primary education ( percent both sexes): 99.4 ; Percentage of pupils starting Grade 1 and reach Grade 5 ( percent both sexes): 92.1 ; Gender parity Index in primary level enrolment (ratio of girls to boys): 1.0 ; Literacy rates of 15–24 years old ( percent both sexes): 98.1.5 The six Dakar goals, also called Education for All (EFA) goals, were set in 2000 in Dakar, Senegal. They were adopted by the international community and are focused on accelerating education progress by 2015. The six goals are: 1) expand and improve com-prehensive early childhood care and education, 2) ensure universal primary education, 3) ensure youth and adult learning needs through equitable access and to appropriate learning and life skills, 4) achieve a 50 percent improvement in levels of adult literacy, 5) eliminate gender disparities in primary and secondary education by 2005, and achieve gender equality in education by 2015, 6) improve all aspects of the quality of education. According to the 2011 Education for All, Global Monitoring Report 2011, Mexico has either reached its goals or at least made substantial progress toward them.
I
242
Education in Mexico
Jeffrey Puryear, Lucrecia Santibañez,and Alexandra Solano
88
A N
EW
VIS
ION
FOR
ME
XIC
O 2042: A
CH
IEV
ING
PR
OS
PE
RIT
Y FO
R A
LL
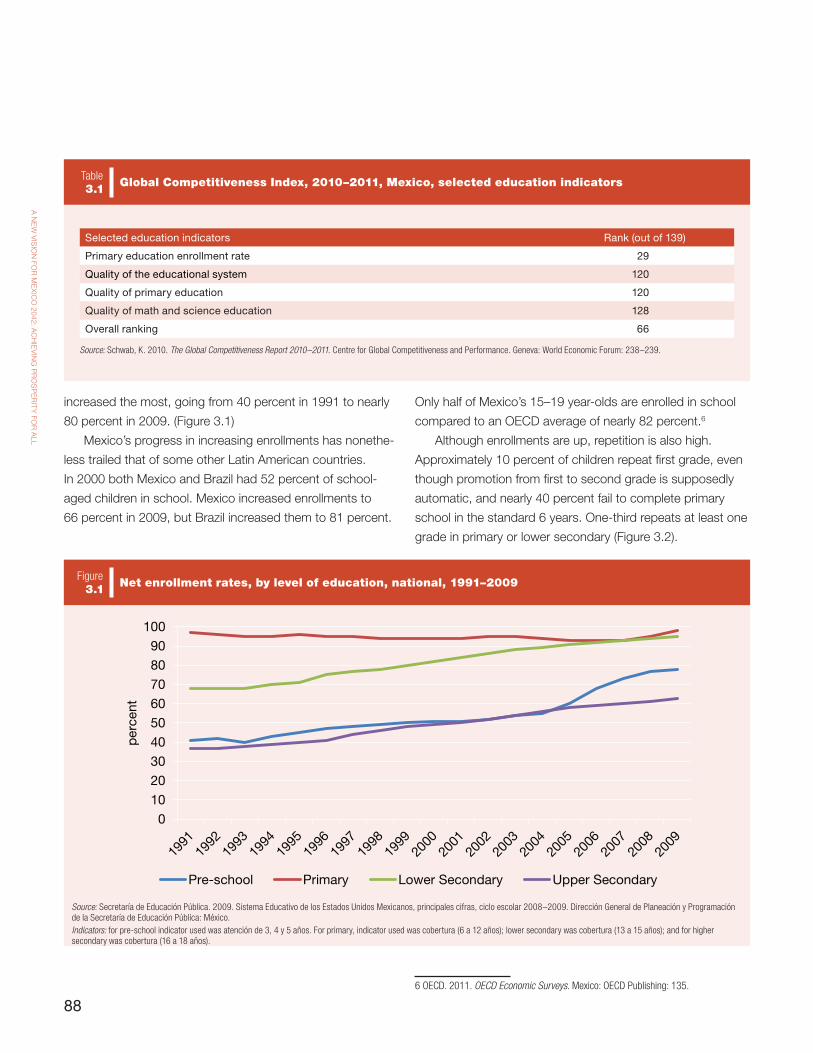
increased the most, going from 40 percent in 1991 to nearly
80 percent in 2009. (Figure 3.1)
Mexico’s progress in increasing enrollments has nonethe-
less trailed that of some other Latin American countries.
In 2000 both Mexico and Brazil had 52 percent of school-
aged children in school. Mexico increased enrollments to
66 percent in 2009, but Brazil increased them to 81 percent.
Only half of Mexico’s 15–19 year-olds are enrolled in school
compared to an OECD average of nearly 82 percent.6
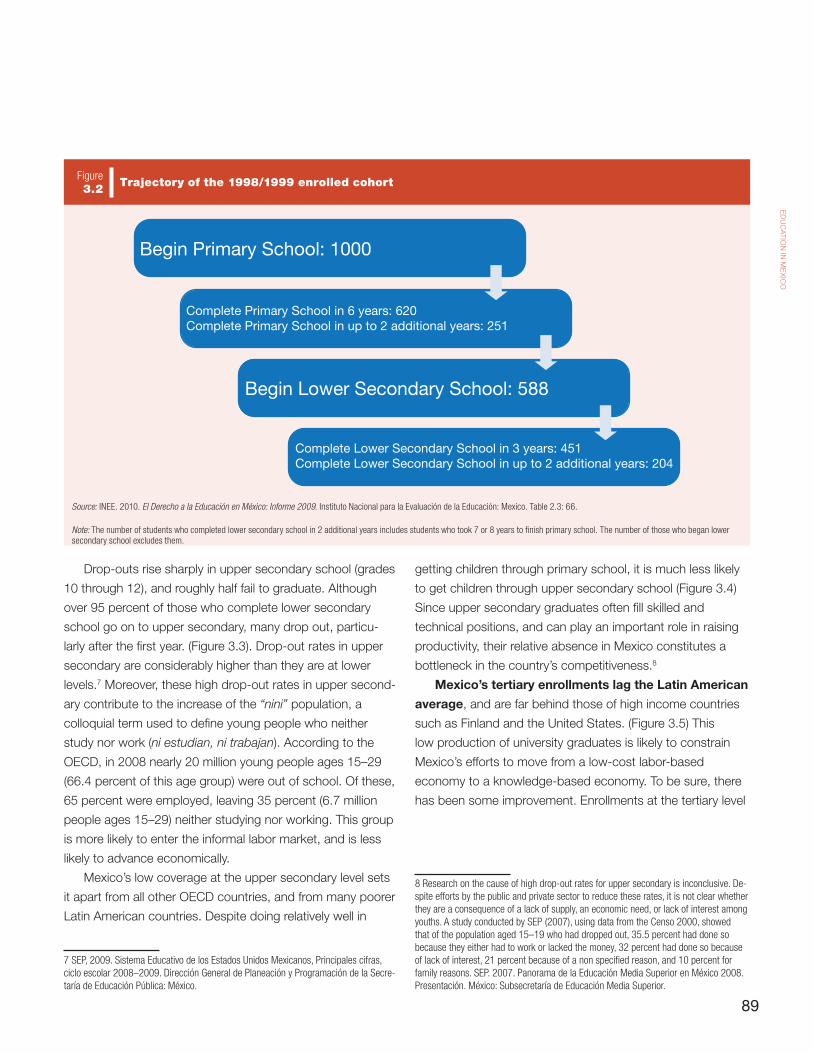
Although enrollments are up, repetition is also high.
Approximately 10 percent of children repeat first grade, even
though promotion from first to second grade is supposedly
automatic, and nearly 40 percent fail to complete primary
school in the standard 6 years. One-third repeats at least one
grade in primary or lower secondary (Figure 3.2).
6 OECD. 2011. OECD Economic Surveys. Mexico: OECD Publishing: 135.
Selected education indicators Rank (out of 139)
Primary education enrollment rate 29
Quality of the educational system 120
Quality of primary education 120
Quality of math and science education 128
Overall ranking 66
Source: Schwab, K. 2010. The Global Competitiveness Report 2010–2011. Centre for Global Competitiveness and Performance. Geneva: World Economic Forum: 238–239.
Global Competitiveness Index, 2010–2011, Mexico, selected education indicatorsTable3.1
Net enrollment rates, by level of education, national, 1991–2009Figure 3.1
Source: Secretaría de Educación Pública. 2009. Sistema Educativo de los Estados Unidos Mexicanos, principales cifras, ciclo escolar 2008–2009. Dirección General de Planeación y Programación de la Secretaría de Educación Pública: México. Indicators: for pre-school indicator used was atención de 3, 4 y 5 años. For primary, indicator used was cobertura (6 a 12 años); lower secondary was cobertura (13 a 15 años); and for higher secondary was cobertura (16 a 18 años).
0102030405060708090
100
per
cent
Pre-school Primary Lower Secondary Upper Secondary
89
ED
UC
ATION
IN M
EX
ICO
Drop-outs rise sharply in upper secondary school (grades
10 through 12), and roughly half fail to graduate. Although
over 95 percent of those who complete lower secondary
school go on to upper secondary, many drop out, particu-
larly after the first year. (Figure 3.3). Drop-out rates in upper
secondary are considerably higher than they are at lower
levels.7 Moreover, these high drop-out rates in upper second-
ary contribute to the increase of the “nini” population, a
colloquial term used to define young people who neither
study nor work (ni estudian, ni trabajan). According to the
OECD, in 2008 nearly 20 million young people ages 15–29
(66.4 percent of this age group) were out of school. Of these,
65 percent were employed, leaving 35 percent (6.7 million
people ages 15–29) neither studying nor working. This group
is more likely to enter the informal labor market, and is less
likely to advance economically.
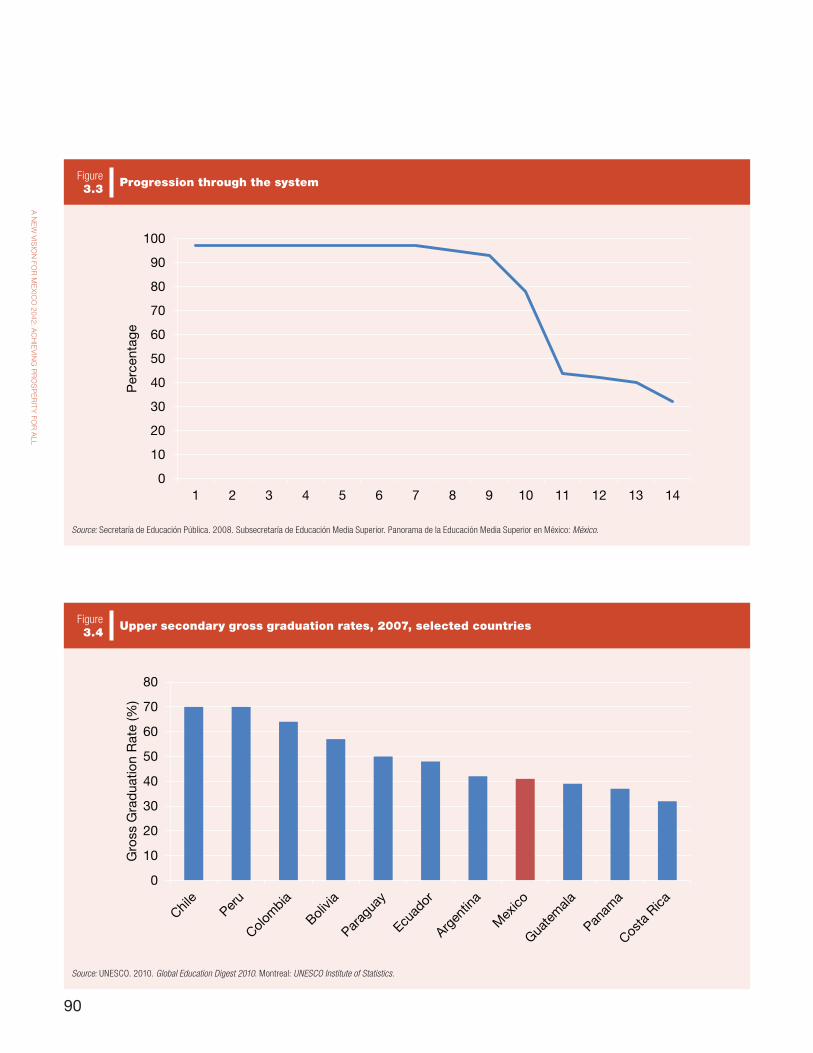
Mexico’s low coverage at the upper secondary level sets
it apart from all other OECD countries, and from many poorer
Latin American countries. Despite doing relatively well in
7 SEP, 2009. Sistema Educativo de los Estados Unidos Mexicanos, Principales cifras, ciclo escolar 2008–2009. Dirección General de Planeación y Programación de la Secre-taría de Educación Pública: México.
getting children through primary school, it is much less likely
to get children through upper secondary school (Figure 3.4)
Since upper secondary graduates often fill skilled and
technical positions, and can play an important role in raising
productivity, their relative absence in Mexico constitutes a
bottleneck in the country’s competitiveness.8
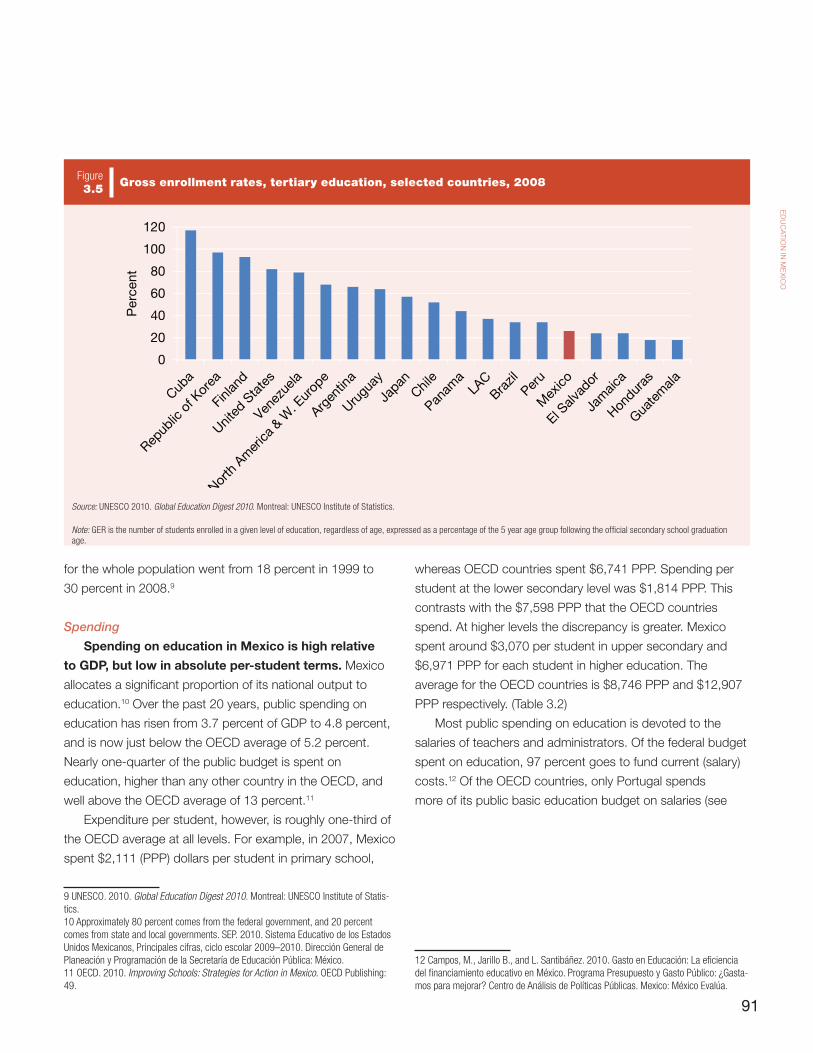
Mexico’s tertiary enrollments lag the Latin American
average, and are far behind those of high income countries
such as Finland and the United States. (Figure 3.5) This
low production of university graduates is likely to constrain
Mexico’s efforts to move from a low-cost labor-based
economy to a knowledge-based economy. To be sure, there
has been some improvement. Enrollments at the tertiary level
8 Research on the cause of high drop-out rates for upper secondary is inconclusive. De-spite efforts by the public and private sector to reduce these rates, it is not clear whether they are a consequence of a lack of supply, an economic need, or lack of interest among youths. A study conducted by SEP (2007), using data from the Censo 2000, showed that of the population aged 15–19 who had dropped out, 35.5 percent had done so because they either had to work or lacked the money, 32 percent had done so because of lack of interest, 21 percent because of a non specified reason, and 10 percent for family reasons. SEP. 2007. Panorama de la Educación Media Superior en México 2008. Presentación. México: Subsecretaría de Educación Media Superior.
Trajectory of the 1998/1999 enrolled cohortFigure 3.2
Source: INEE. 2010. El Derecho a la Educación en México: Informe 2009. Instituto Nacional para la Evaluación de la Educación: Mexico. Table 2.3: 66.
Note: The number of students who completed lower secondary school in 2 additional years includes students who took 7 or 8 years to finish primary school. The number of those who began lower secondary school excludes them.
Begin Primary School: 1000
Complete Primary School in 6 years: 620Complete Primary School in up to 2 additional years: 251
Begin Lower Secondary School: 588
Complete Lower Secondary School in 3 years: 451Complete Lower Secondary School in up to 2 additional years: 204
90
A N
EW
VIS
ION
FOR
ME
XIC
O 2042: A
CH
IEV
ING
PR
OS
PE
RIT
Y FO
R A
LL
Progression through the systemFigure 3.3
Source: Secretaría de Educación Pública. 2008. Subsecretaría de Educación Media Superior. Panorama de la Educación Media Superior en México: México.
0
10
20
30
40
50
60
70
80
90
100
1 2 3 4 5 6 7 8 9 10 11 12 13 14
Per
cent
age
Upper secondary gross graduation rates, 2007, selected countriesFigure 3.4
Source: UNESCO. 2010. Global Education Digest 2010. Montreal: UNESCO Institute of Statistics.
0
10
20
30
40
50
60
70
80
Gro
ss G
rad
uatio
n R
ate
(%)
91
ED
UC
ATION
IN M
EX
ICO
for the whole population went from 18 percent in 1999 to
30 percent in 2008.9
Spending
Spending on education in Mexico is high relative
to GDP, but low in absolute per-student terms. Mexico
allocates a significant proportion of its national output to
education.10 Over the past 20 years, public spending on
education has risen from 3.7 percent of GDP to 4.8 percent,
and is now just below the OECD average of 5.2 percent.
Nearly one-quarter of the public budget is spent on
education, higher than any other country in the OECD, and
well above the OECD average of 13 percent.11
Expenditure per student, however, is roughly one-third of
the OECD average at all levels. For example, in 2007, Mexico
spent $2,111 (PPP) dollars per student in primary school,
9 UNESCO. 2010. Global Education Digest 2010. Montreal: UNESCO Institute of Statis-tics.10 Approximately 80 percent comes from the federal government, and 20 percent comes from state and local governments. SEP. 2010. Sistema Educativo de los Estados Unidos Mexicanos, Principales cifras, ciclo escolar 2009–2010. Dirección General de Planeación y Programación de la Secretaría de Educación Pública: México.11 OECD. 2010. Improving Schools: Strategies for Action in Mexico. OECD Publishing: 49.
whereas OECD countries spent $6,741 PPP. Spending per
student at the lower secondary level was $1,814 PPP. This
contrasts with the $7,598 PPP that the OECD countries
spend. At higher levels the discrepancy is greater. Mexico
spent around $3,070 per student in upper secondary and
$6,971 PPP for each student in higher education. The
average for the OECD countries is $8,746 PPP and $12,907
PPP respectively. (Table 3.2)
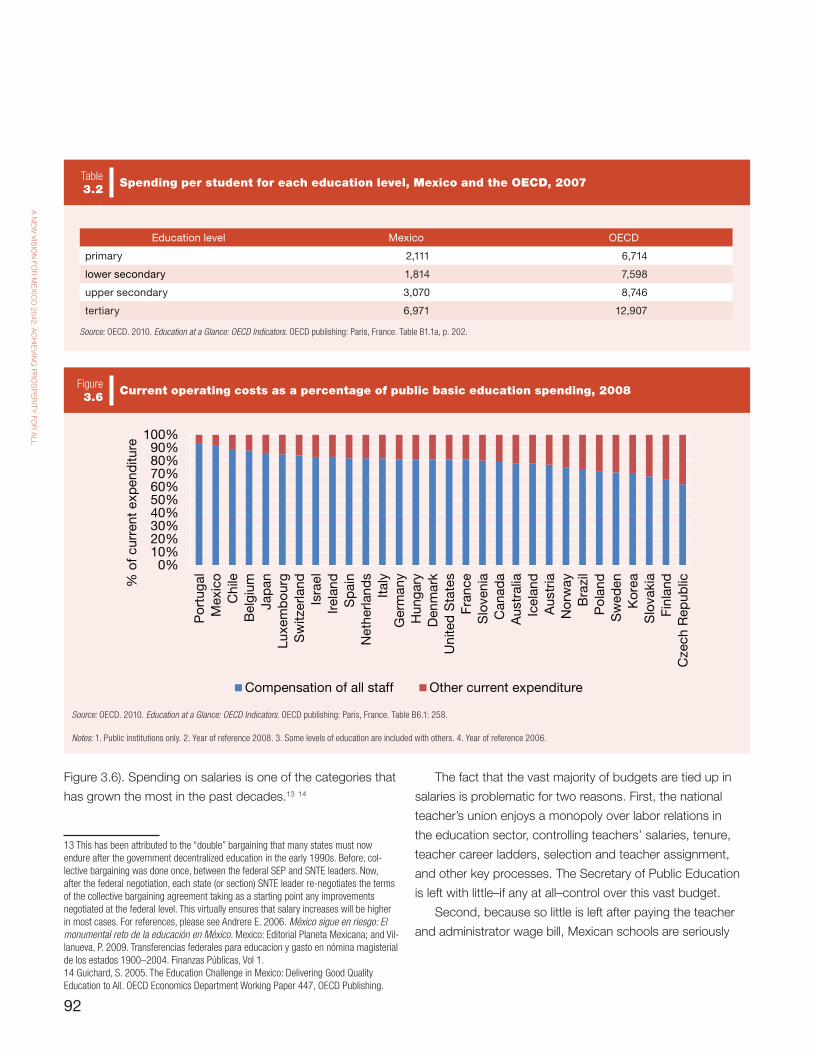
Most public spending on education is devoted to the
salaries of teachers and administrators. Of the federal budget
spent on education, 97 percent goes to fund current (salary)
costs.12 Of the OECD countries, only Portugal spends
more of its public basic education budget on salaries (see
12 Campos, M., Jarillo B., and L. Santibáñez. 2010. Gasto en Educación: La eficiencia del financiamiento educativo en México. Programa Presupuesto y Gasto Público: ¿Gasta-mos para mejorar? Centro de Análisis de Políticas Públicas. Mexico: México Evalúa.
Gross enrollment rates, tertiary education, selected countries, 2008Figure 3.5
Source: UNESCO 2010. Global Education Digest 2010. Montreal: UNESCO Institute of Statistics.
Note: GER is the number of students enrolled in a given level of education, regardless of age, expressed as a percentage of the 5 year age group following the official secondary school graduation age.
0
20
40
60
80
100
120
Per
cent
92
A N
EW
VIS
ION
FOR
ME
XIC
O 2042: A
CH
IEV
ING
PR
OS
PE
RIT
Y FO
R A
LLFigure 3.6). Spending on salaries is one of the categories that
has grown the most in the past decades.13 14
13 This has been attributed to the “double” bargaining that many states must now endure after the government decentralized education in the early 1990s. Before, col-lective bargaining was done once, between the federal SEP and SNTE leaders. Now, after the federal negotiation, each state (or section) SNTE leader re-negotiates the terms of the collective bargaining agreement taking as a starting point any improvements negotiated at the federal level. This virtually ensures that salary increases will be higher in most cases. For references, please see Andrere E. 2006. México sigue en riesgo: El monumental reto de la educación en México. Mexico: Editorial Planeta Mexicana; and Vil-lanueva, P. 2009. Transferencias federales para educacion y gasto en nómina magisterial de los estados 1900–2004. Finanzas Públicas, Vol 1.14 Guichard, S. 2005. The Education Challenge in Mexico: Delivering Good Quality Education to All. OECD Economics Department Working Paper 447, OECD Publishing.
The fact that the vast majority of budgets are tied up in
salaries is problematic for two reasons. First, the national
teacher’s union enjoys a monopoly over labor relations in
the education sector, controlling teachers’ salaries, tenure,
teacher career ladders, selection and teacher assignment,
and other key processes. The Secretary of Public Education
is left with little–if any at all–control over this vast budget.
Second, because so little is left after paying the teacher
and administrator wage bill, Mexican schools are seriously
Current operating costs as a percentage of public basic education spending, 2008Figure 3.6
Source: OECD. 2010. Education at a Glance: OECD Indicators. OECD publishing: Paris, France. Table B6.1: 258.
Notes: 1. Public institutions only. 2. Year of reference 2008. 3. Some levels of education are included with others. 4. Year of reference 2006.
0%10%20%30%40%50%60%70%80%90%
100%
Por
tuga
lM
exic
oC
hile
Bel
gium
Jap
anLu
xem
bou
rgS
witz
erla
ndIs
rael
Irel
and
Sp
ain
Net
herla
nds
Italy
Ger
man
yH
unga
ryD
enm
ark
Uni
ted
Sta
tes
Fran
ceS
love
nia
Can
ada
Aus
tral
iaIc
elan
dA
ustr
iaN
orw
ayB
razi
lP
olan
dS
wed
enK
orea
Slo
vaki
aFi
nlan
dC
zech
Rep
ublic%
of c
urre
nt e
xpen
ditu
re
Compensation of all staff Other current expenditure
Education level Mexico OECD
primary 2,111 6,714
lower secondary 1,814 7,598
upper secondary 3,070 8,746
tertiary 6,971 12,907
Source: OECD. 2010. Education at a Glance: OECD Indicators. OECD publishing: Paris, France. Table B1.1a, p. 202.
Spending per student for each education level, Mexico and the OECD, 2007Table3.2
93
ED
UC
ATION
IN M
EX
ICO
under-resourced. Basic school construction, maintenance
and facility issues plague communities across the country.
According to data from INEE, over one-quarter of public
schools in Mexico have serious maintenance and upkeep
problems. Over 75 percent of public primary schools, and
over 95 percent of indigenous schools, do not have computer
or library facilities. In 15 percent of rural schools, teachers
do not have a chair and/or desk to sit in.15 At the primary
level, only 1.9 percent of Mexico’s budget goes for capital
spending, compared with an OECD average of 7.8 percent;
at the secondary level it is 3.2 percent compared with
7.4 percent for the OECD; at the tertiary level it is 4.8 percent
compared to 9.8 percent.16
Quality
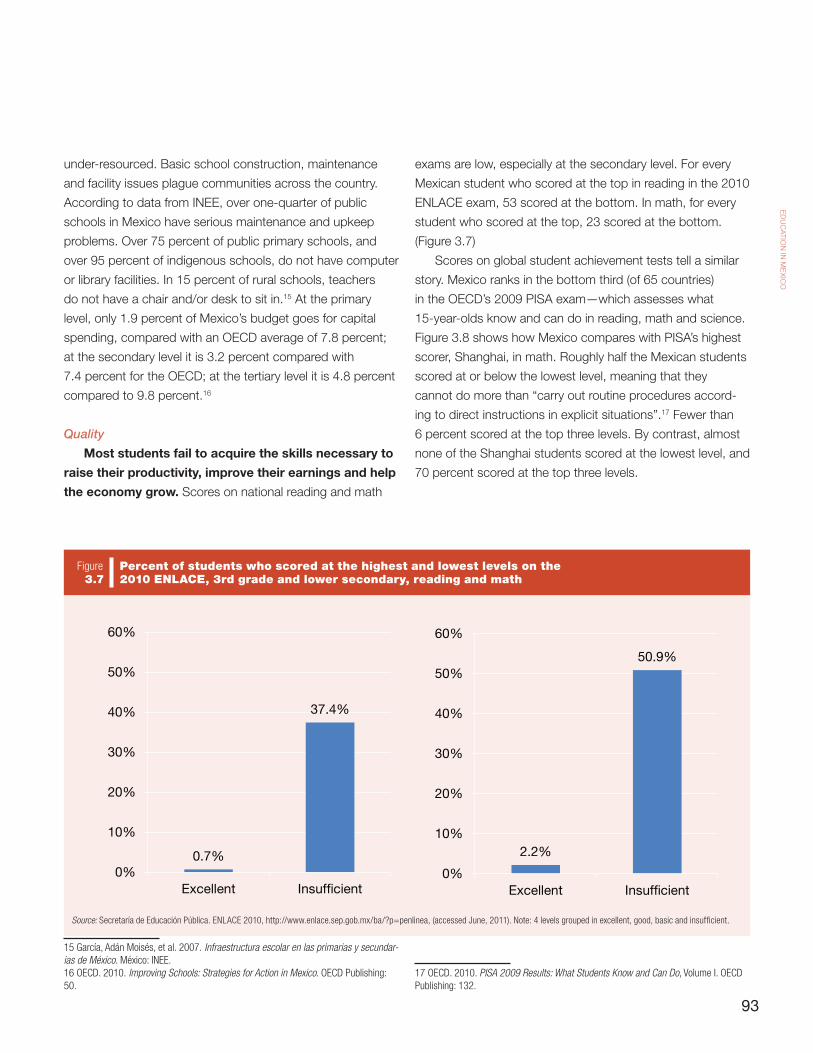
Most students fail to acquire the skills necessary to
raise their productivity, improve their earnings and help
the economy grow. Scores on national reading and math
15 García, Adán Moisés, et al. 2007. Infraestructura escolar en las primarias y secundar-ias de México. México: INEE.16 OECD. 2010. Improving Schools: Strategies for Action in Mexico. OECD Publishing: 50.
exams are low, especially at the secondary level. For every
Mexican student who scored at the top in reading in the 2010
ENLACE exam, 53 scored at the bottom. In math, for every
student who scored at the top, 23 scored at the bottom.
(Figure 3.7)
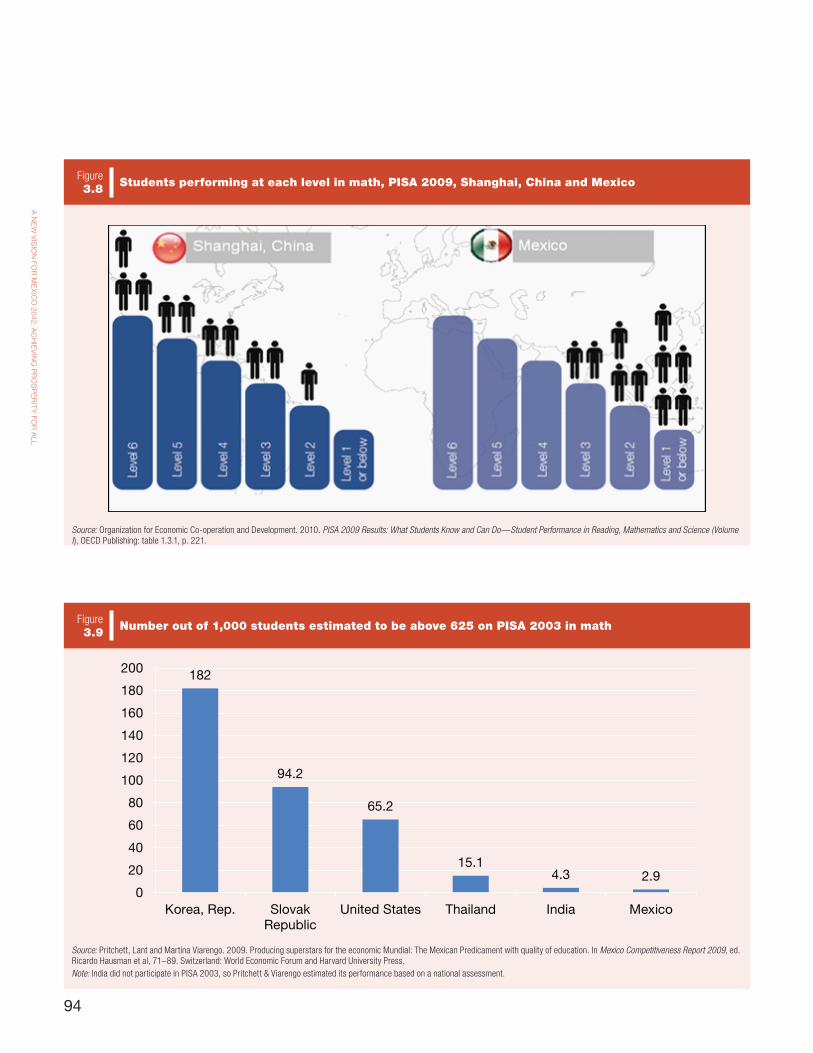
Scores on global student achievement tests tell a similar
story. Mexico ranks in the bottom third (of 65 countries)
in the OECD’s 2009 PISA exam—which assesses what
15-year-olds know and can do in reading, math and science.
Figure 3.8 shows how Mexico compares with PISA’s highest
scorer, Shanghai, in math. Roughly half the Mexican students
scored at or below the lowest level, meaning that they
cannot do more than “carry out routine procedures accord-
ing to direct instructions in explicit situations”.17 Fewer than
6 percent scored at the top three levels. By contrast, almost
none of the Shanghai students scored at the lowest level, and
70 percent scored at the top three levels.
17 OECD. 2010. PISA 2009 Results: What Students Know and Can Do, Volume I. OECD Publishing: 132.
Percent of students who scored at the highest and lowest levels on the 2010 ENLACE, 3rd grade and lower secondary, reading and math
Figure 3.7
Source: Secretaría de Educación Pública. ENLACE 2010, http://www.enlace.sep.gob.mx/ba/?p=penlinea, (accessed June, 2011). Note: 4 levels grouped in excellent, good, basic and insufficient.
0.7%
37.4%
0%
10%
20%
30%
40%
50%
60%
Excellent Insuf�cient
2.2%
50.9%
0%
10%
20%
30%
40%
50%
60%
Excellent Insuf�cient
94
A N
EW
VIS
ION
FOR
ME
XIC
O 2042: A
CH
IEV
ING
PR
OS
PE
RIT
Y FO
R A
LL
Number out of 1,000 students estimated to be above 625 on PISA 2003 in mathFigure 3.9
Source: Pritchett, Lant and Martina Viarengo. 2009. Producing superstars for the economic Mundial: The Mexican Predicament with quality of education. In Mexico Competitiveness Report 2009, ed. Ricardo Hausman et al, 71–89. Switzerland: World Economic Forum and Harvard University Press. Note: India did not participate in PISA 2003, so Pritchett & Viarengo estimated its performance based on a national assessment.
182
94.2
65.2
15.14.3 2.9
0
20
40
60
80
100
120
140
160
180
200
Korea, Rep. SlovakRepublic
United States Thailand India Mexico
Students performing at each level in math, PISA 2009, Shanghai, China and MexicoFigure 3.8
Source: Organization for Economic Co-operation and Development. 2010. PISA 2009 Results: What Students Know and Can Do—Student Performance in Reading, Mathematics and Science (Volume I), OECD Publishing: table 1.3.1, p. 221.
95
ED
UC
ATION
IN M
EX
ICO
The near total absence of Mexican students at the top
levels of learning is a serious constraint on the country’s
global competitiveness. A recent study noted that just
0.29 percent of Mexican students scored at the “advanced”
international benchmark for math established by PISA as
“capable of advanced mathematical thinking and reasoning,
and [able] to interpret complex information about real world
situations.” (Figure 3.9) These are the students who can
compete in the market for ideas by adapting technologies to
local conditions, developing global tradeables like financial
services and product design, and generally putting together
ideas in new ways. They are crucial to economic growth—
particularly in a globalized economy. Mexico compares poorly
with Korea (18.2 percent) and the United States (6.5 percent)
in producing global performers. But its production of top
performers is only half that of India (0.43 percent), even
though the average Mexican student scores well above the
average Indian student.18 19
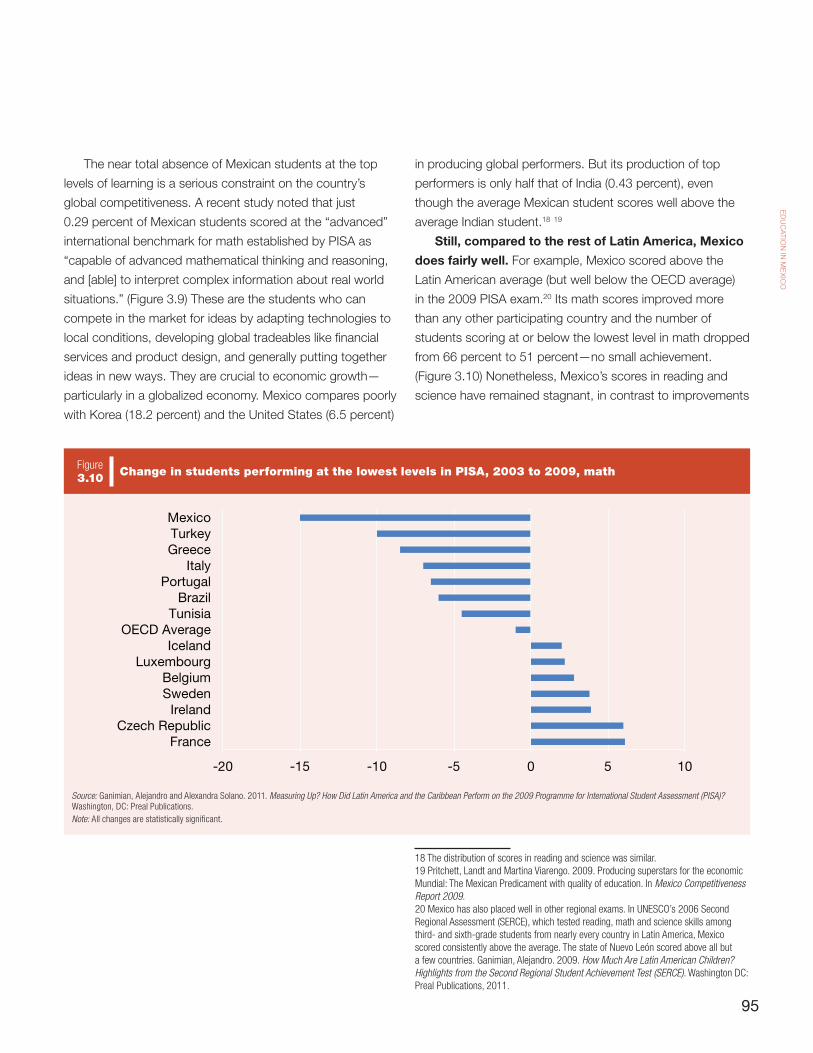
Still, compared to the rest of Latin America, Mexico
does fairly well. For example, Mexico scored above the
Latin American average (but well below the OECD average)
in the 2009 PISA exam.20 Its math scores improved more
than any other participating country and the number of
students scoring at or below the lowest level in math dropped
from 66 percent to 51 percent—no small achievement.
(Figure 3.10) Nonetheless, Mexico’s scores in reading and
science have remained stagnant, in contrast to improvements
18 The distribution of scores in reading and science was similar.19 Pritchett, Landt and Martina Viarengo. 2009. Producing superstars for the economic Mundial: The Mexican Predicament with quality of education. In Mexico Competitiveness Report 2009. 20 Mexico has also placed well in other regional exams. In UNESCO’s 2006 Second Regional Assessment (SERCE), which tested reading, math and science skills among third- and sixth-grade students from nearly every country in Latin America, Mexico scored consistently above the average. The state of Nuevo León scored above all but a few countries. Ganimian, Alejandro. 2009. How Much Are Latin American Children? Highlights from the Second Regional Student Achievement Test (SERCE). Washington DC: Preal Publications, 2011.
Change in students performing at the lowest levels in PISA, 2003 to 2009, mathFigure 3.10
Source: Ganimian, Alejandro and Alexandra Solano. 2011. Measuring Up? How Did Latin America and the Caribbean Perform on the 2009 Programme for International Student Assessment (PISA)? Washington, DC: Preal Publications. Note: All changes are statistically significant.
-20 -15 -10 -5 0 5 10
FranceCzech Republic
IrelandSwedenBelgium
LuxembourgIceland
OECD AverageTunisia
BrazilPortugal
ItalyGreeceTurkeyMexico
96
A N
EW
VIS
ION
FOR
ME
XIC
O 2042: A
CH
IEV
ING
PR
OS
PE
RIT
Y FO
R A
LL
by Chile and Brazil (in reading) and Brazil and Colombia (in
science).
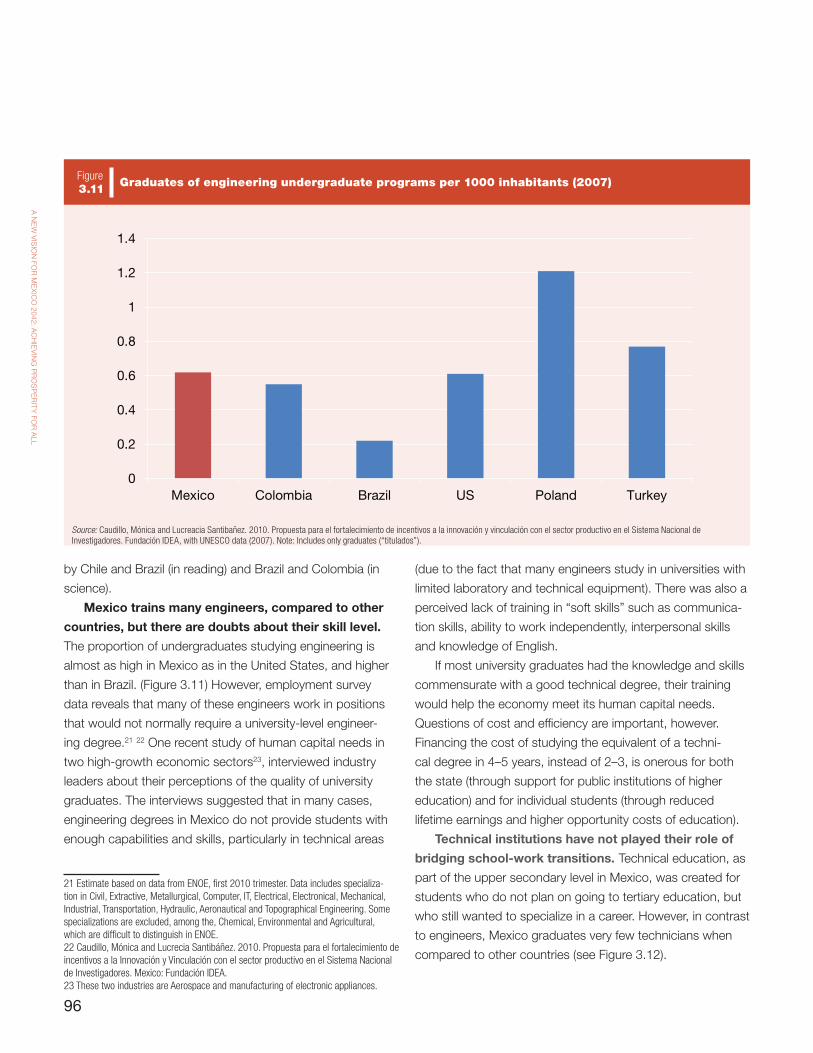
Mexico trains many engineers, compared to other
countries, but there are doubts about their skill level.
The proportion of undergraduates studying engineering is
almost as high in Mexico as in the United States, and higher
than in Brazil. (Figure 3.11) However, employment survey
data reveals that many of these engineers work in positions
that would not normally require a university-level engineer-
ing degree.21 22 One recent study of human capital needs in
two high-growth economic sectors23, interviewed industry
leaders about their perceptions of the quality of university
graduates. The interviews suggested that in many cases,
engineering degrees in Mexico do not provide students with
enough capabilities and skills, particularly in technical areas
21 Estimate based on data from ENOE, first 2010 trimester. Data includes specializa-tion in Civil, Extractive, Metallurgical, Computer, IT, Electrical, Electronical, Mechanical, Industrial, Transportation, Hydraulic, Aeronautical and Topographical Engineering. Some specializations are excluded, among the, Chemical, Environmental and Agricultural, which are difficult to distinguish in ENOE.22 Caudillo, Mónica and Lucrecia Santibáñez. 2010. Propuesta para el fortalecimiento de incentivos a la Innovación y Vinculación con el sector productivo en el Sistema Nacional de Investigadores. Mexico: Fundación IDEA.23 These two industries are Aerospace and manufacturing of electronic appliances.
(due to the fact that many engineers study in universities with
limited laboratory and technical equipment). There was also a
perceived lack of training in “soft skills” such as communica-
tion skills, ability to work independently, interpersonal skills
and knowledge of English.
If most university graduates had the knowledge and skills
commensurate with a good technical degree, their training
would help the economy meet its human capital needs.
Questions of cost and efficiency are important, however.
Financing the cost of studying the equivalent of a techni-
cal degree in 4–5 years, instead of 2–3, is onerous for both
the state (through support for public institutions of higher
education) and for individual students (through reduced
lifetime earnings and higher opportunity costs of education).
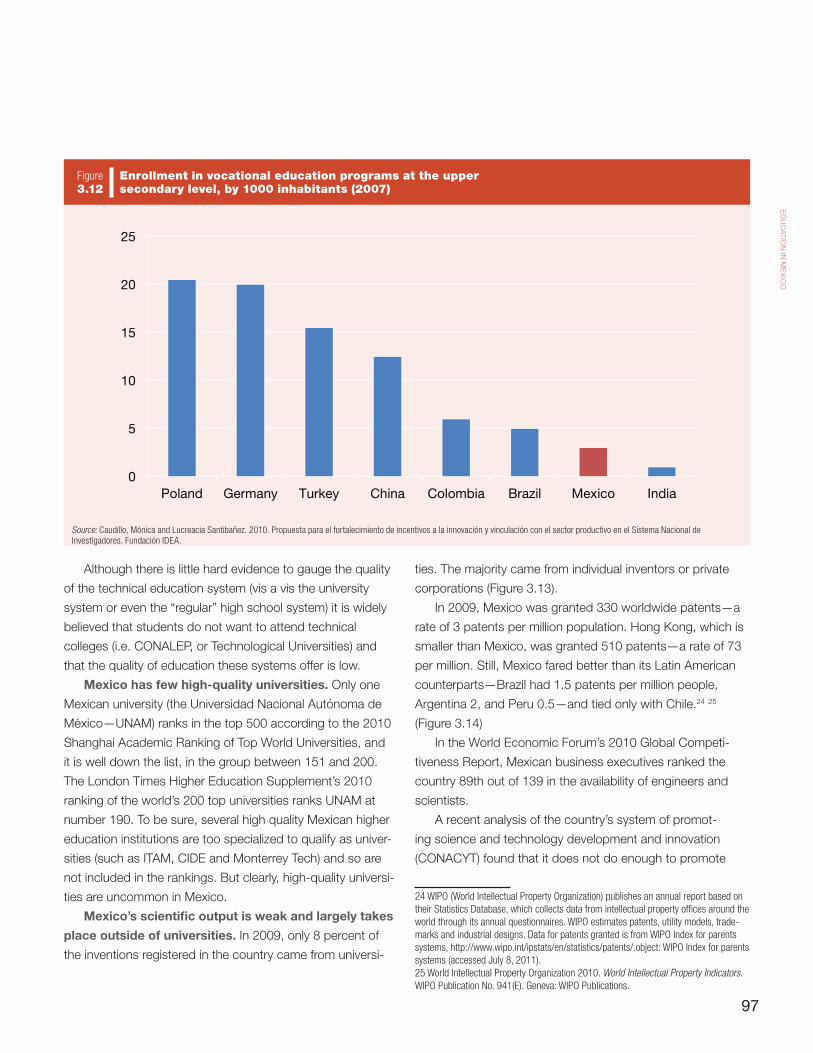
Technical institutions have not played their role of
bridging school-work transitions. Technical education, as
part of the upper secondary level in Mexico, was created for
students who do not plan on going to tertiary education, but
who still wanted to specialize in a career. However, in contrast
to engineers, Mexico graduates very few technicians when
compared to other countries (see Figure 3.12).
Graduates of engineering undergraduate programs per 1000 inhabitants (2007)Figure 3.11
Source: Caudillo, Mónica and Lucreacia Santibañez. 2010. Propuesta para el fortalecimiento de incentivos a la innovación y vinculación con el sector productivo en el Sistema Nacional de Investigadores. Fundación IDEA, with UNESCO data (2007). Note: Includes only graduates (“titulados”).
0
0.2
0.4
0.6
0.8
1
1.2
1.4
Mexico Colombia Brazil US Poland Turkey
97
ED
UC
ATION
IN M
EX
ICO
Although there is little hard evidence to gauge the quality
of the technical education system (vis a vis the university
system or even the “regular” high school system) it is widely
believed that students do not want to attend technical
colleges (i.e. CONALEP, or Technological Universities) and
that the quality of education these systems offer is low.
Mexico has few high-quality universities. Only one
Mexican university (the Universidad Nacional Autónoma de
México—UNAM) ranks in the top 500 according to the 2010
Shanghai Academic Ranking of Top World Universities, and
it is well down the list, in the group between 151 and 200.
The London Times Higher Education Supplement’s 2010
ranking of the world’s 200 top universities ranks UNAM at
number 190. To be sure, several high quality Mexican higher
education institutions are too specialized to qualify as univer-
sities (such as ITAM, CIDE and Monterrey Tech) and so are
not included in the rankings. But clearly, high-quality universi-
ties are uncommon in Mexico.
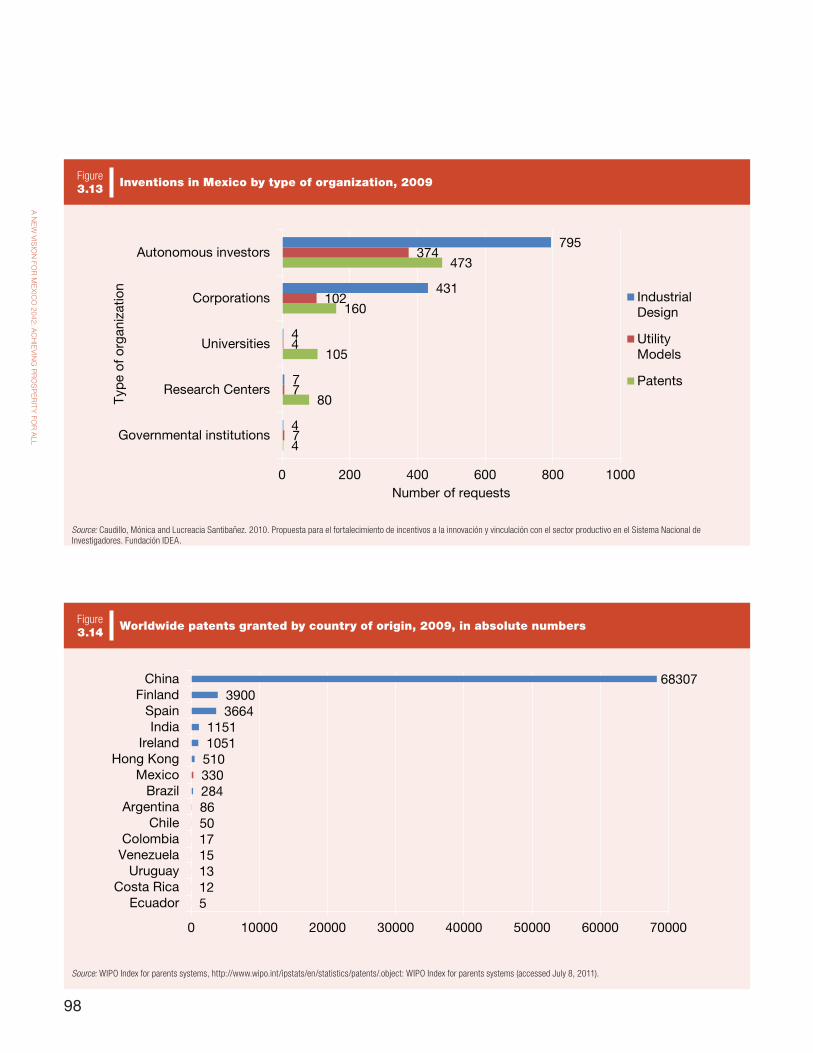
Mexico’s scientific output is weak and largely takes
place outside of universities. In 2009, only 8 percent of
the inventions registered in the country came from universi-
ties. The majority came from individual inventors or private
corporations (Figure 3.13).
In 2009, Mexico was granted 330 worldwide patents—a
rate of 3 patents per million population. Hong Kong, which is
smaller than Mexico, was granted 510 patents—a rate of 73
per million. Still, Mexico fared better than its Latin American
counterparts—Brazil had 1.5 patents per million people,
Argentina 2, and Peru 0.5—and tied only with Chile.24 25
(Figure 3.14)
In the World Economic Forum’s 2010 Global Competi-
tiveness Report, Mexican business executives ranked the
country 89th out of 139 in the availability of engineers and
scientists.
A recent analysis of the country’s system of promot-
ing science and technology development and innovation
(CONACYT) found that it does not do enough to promote
24 WIPO (World Intellectual Property Organization) publishes an annual report based on their Statistics Database, which collects data from intellectual property offices around the world through its annual questionnaires. WIPO estimates patents, utility models, trade-marks and industrial designs. Data for patents granted is from WIPO Index for parents systems, http://www.wipo.int/ipstats/en/statistics/patents/.object: WIPO Index for parents systems (accessed July 8, 2011).25 World Intellectual Property Organization 2010. World Intellectual Property Indicators. WIPO Publication No. 941(E). Geneva: WIPO Publications.
Enrollment in vocational education programs at the upper secondary level, by 1000 inhabitants (2007)
Figure 3.12
Source: Caudillo, Mónica and Lucreacia Santibañez. 2010. Propuesta para el fortalecimiento de incentivos a la innovación y vinculación con el sector productivo en el Sistema Nacional de Investigadores. Fundación IDEA.
0
5
10
15
20
25
Poland Germany Turkey China Colombia Brazil Mexico India
98
A N
EW
VIS
ION
FOR
ME
XIC
O 2042: A
CH
IEV
ING
PR
OS
PE
RIT
Y FO
R A
LL
Inventions in Mexico by type of organization, 2009Figure 3.13
Source: Caudillo, Mónica and Lucreacia Santibañez. 2010. Propuesta para el fortalecimiento de incentivos a la innovación y vinculación con el sector productivo en el Sistema Nacional de Investigadores. Fundación IDEA.
4
80
105
160
473
7
7
4
102
374
4
7
4
431
795
0 200 400 600 800 1000
Governmental institutions
Research Centers
Universities
Corporations
Autonomous investors
Number of requests
Typ
e of
org
aniz
atio
n
IndustrialDesign
UtilityModels
Patents
Worldwide patents granted by country of origin, 2009, in absolute numbersFigure 3.14
Source: WIPO Index for parents systems, http://www.wipo.int/ipstats/en/statistics/patents/.object: WIPO Index for parents systems (accessed July 8, 2011).
512131517508628433051010511151
36643900
68307
0 10000 20000 30000 40000 50000 60000 70000
EcuadorCosta Rica
UruguayVenezuelaColombia
ChileArgentina
BrazilMexico
Hong KongIreland
IndiaSpain
FinlandChina
99
ED
UC
ATION
IN M
EX
ICO
innovation and cutting edge research and development.
It also generates weak linkages between universities and
industries, and fails to give researchers incentives to innovate.
Furthermore, there are few avenues in Mexico for venture
or seed capital that could support this kind of endeavor
and reward researchers and scientists for doing empiri-
cal and applied research.26 Mexico’s approach to science
and technology does not appear to be helping the country
avoid the much-discussed “Middle Income Trap,” in which
countries can neither compete on the basis of low wages, nor
on the basis of knowledge-intensive innovations.
Equity
Mexico’s education system appears to have only a
limited impact on reducing inequality. Children from poor
families are more likely to repeat grades and to drop out than
their rich counterparts, and less likely to enroll in the univer-
26 Caudillo, Mónica and Lucrecia Santibáñez. 2010. Propuesta para el fortalecimiento de incentivos a la Innovación y Vinculación con el sector productivo en el Sistema Nacional de Investigadores. Mexico: Fundación IDEA.
sity. Those poor children who do stay in school tend to learn
less, in part because of the low quality of public schools.
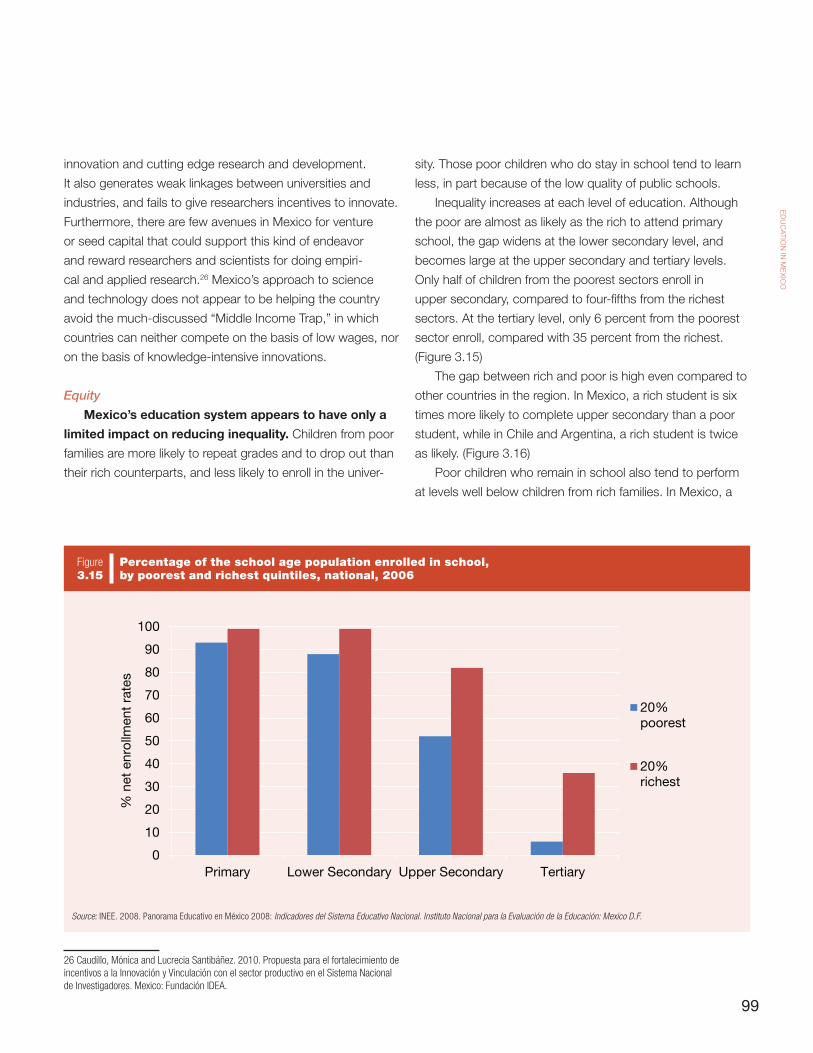
Inequality increases at each level of education. Although
the poor are almost as likely as the rich to attend primary
school, the gap widens at the lower secondary level, and
becomes large at the upper secondary and tertiary levels.
Only half of children from the poorest sectors enroll in
upper secondary, compared to four-fifths from the richest
sectors. At the tertiary level, only 6 percent from the poorest
sector enroll, compared with 35 percent from the richest.
(Figure 3.15)
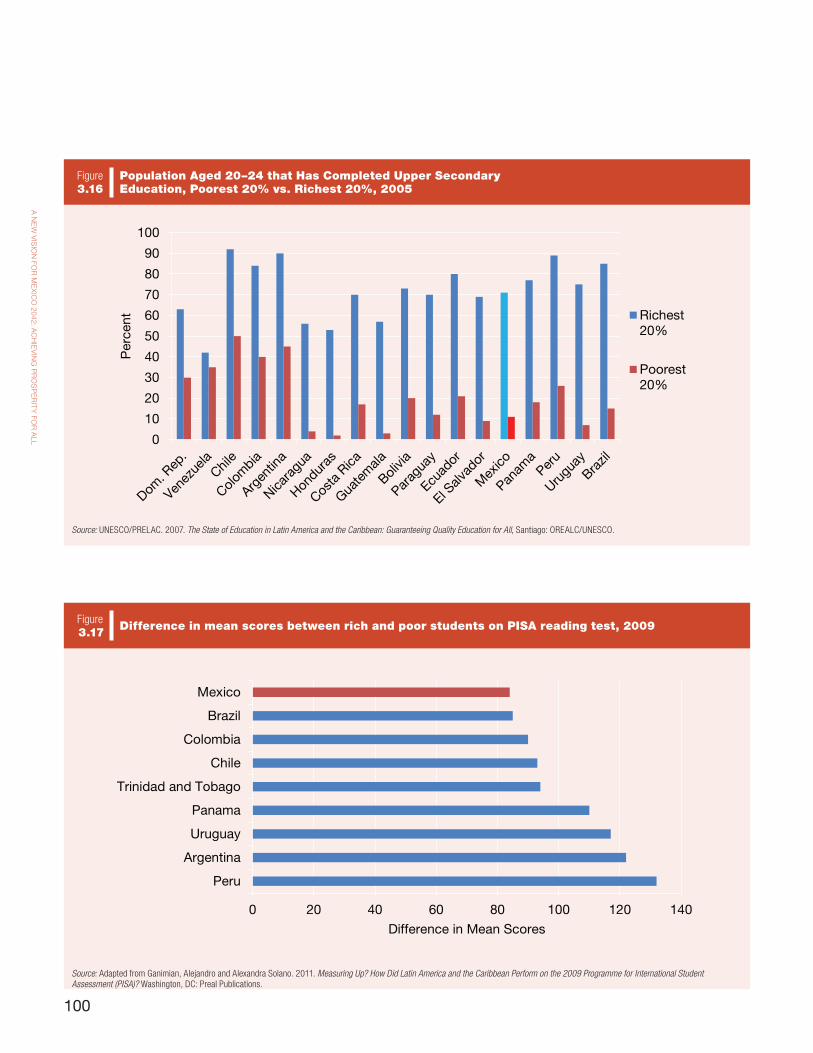
The gap between rich and poor is high even compared to
other countries in the region. In Mexico, a rich student is six
times more likely to complete upper secondary than a poor
student, while in Chile and Argentina, a rich student is twice
as likely. (Figure 3.16)
Poor children who remain in school also tend to perform
at levels well below children from rich families. In Mexico, a
Percentage of the school age population enrolled in school, by poorest and richest quintiles, national, 2006
Figure 3.15
Source: INEE. 2008. Panorama Educativo en México 2008: Indicadores del Sistema Educativo Nacional. Instituto Nacional para la Evaluación de la Educación: Mexico D.F.
0
10
20
30
40
50
60
70
80
90
100
Primary Lower Secondary Upper Secondary Tertiary
% n
et e
nrol
lmen
t ra
tes
20%poorest
20%richest
100
A N
EW
VIS
ION
FOR
ME
XIC
O 2042: A
CH
IEV
ING
PR
OS
PE
RIT
Y FO
R A
LL
Population Aged 20–24 that Has Completed Upper Secondary Education, Poorest 20% vs. Richest 20%, 2005
Figure 3.16
Source: UNESCO/PRELAC. 2007. The State of Education in Latin America and the Caribbean: Guaranteeing Quality Education for All, Santiago: OREALC/UNESCO.
0
10
20
30
40
50
60
70
80
90
100
Per
cent Richest
20%
Poorest20%
Difference in mean scores between rich and poor students on PISA reading test, 2009Figure 3.17
Source: Adapted from Ganimian, Alejandro and Alexandra Solano. 2011. Measuring Up? How Did Latin America and the Caribbean Perform on the 2009 Programme for International Student Assessment (PISA)? Washington, DC: Preal Publications.
0 20 40 60 80 100 120 140
Peru
Argentina
Uruguay
Panama
Trinidad and Tobago
Chile
Colombia
Brazil
Mexico
Difference in Mean Scores
101
ED
UC
ATION
IN M
EX
ICO
Percentage of students who scored at the lowest level for EXCALE, math, 6th grade, primary, 2005 and 2007
Figure 3.18
Source: INEE. 2009. Panorama Educativo de México 2009: Indicadores del Sistema Educativo Nacional. Educación básica. Instituto Nacional para la Evaluación de la Educación: Mexico D.F: 232.
0
5
10
15
20
25
30
35
40
45
50
Urban Public Rural Public IndigenousEducation
Private Education
% o
f stu
den
ts s
corin
g at
the
low
est
leve
l
2005
2007
Percentage of students who scored at the lowest level for EXCALE, math, 3th grade, lower secondary, 2008
Figure 3.19
Source: INEE. 2009. Panorama Educativo de México 2009: Indicadores del Sistema Educativo Nacional. Educación básica. Instituto Nacional para la Evaluación de la Educación: Mexico D.F: 232.
0
10
20
30
40
50
60
70
General Technical Telesecundaria Private
% o
f stu
den
ts s
corin
g at
the
low
est
leve
ls
102
A N
EW
VIS
ION
FOR
ME
XIC
O 2042: A
CH
IEV
ING
PR
OS
PE
RIT
Y FO
R A
LL
15 year-old from a low-income family scores two grade levels
below the wealthiest students in reading. This is a region-
wide problem, however, and Mexico’s performance is similar
to that of Brazil, and better than other LAC countries partici-
pating in the PISA exam. (Figure 3.17)
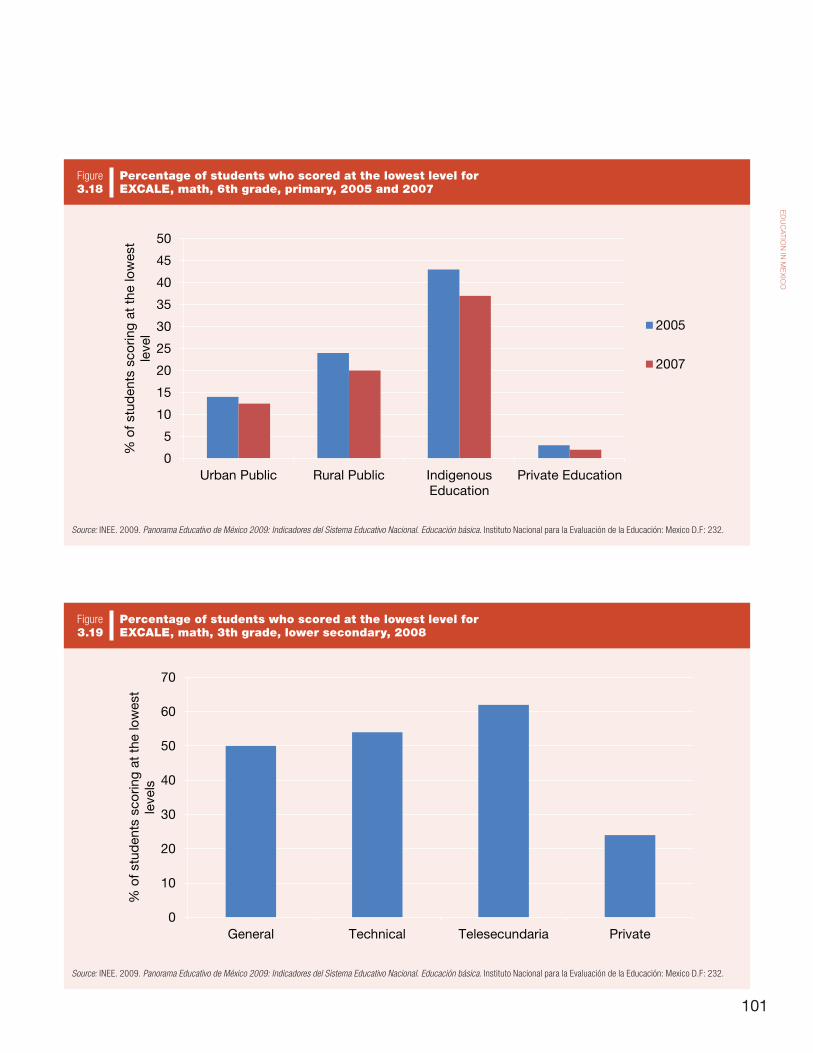
Children who attend indigenous and rural schools also
learn less than their counterparts.
Results from the most recent EXCALE27 assessment
suggest that nearly 45 percent of 6th grade students in
indigenous schools and 24 percent of students in rural
schools scored at the lowest level in Math, compared to just
2.7 percent for students in private schools. (Figure 3.18)
Results for lower secondary are similar, with over half of
students in Telesecundarias (a school type that mostly enrolls
students from rural areas) scoring at the lowest level in math,
compared to roughly one-fourth of students from private
schools. (Figure 3.19)
Indigenous populations are particularly likely to
have less education: 55 percent of indigenous adults either
27 EXCALE is a standardized evaluation applied to students in last grades of primary and lower secondary and measures their performance in reading, math, and social and natural sciences.
did not go to school or did not complete elementary school,
compared to 29 percent of the country’s total population, and
fewer than 3 percent have attended the university, compared
to 15 percent of non-indigenous who have.28 Although a
relatively small proportion (around 7 percent) of Mexico’s
population is indigenous, this group has historically been
marginalized, and education appears to have done little to
decrease the opportunity gap.
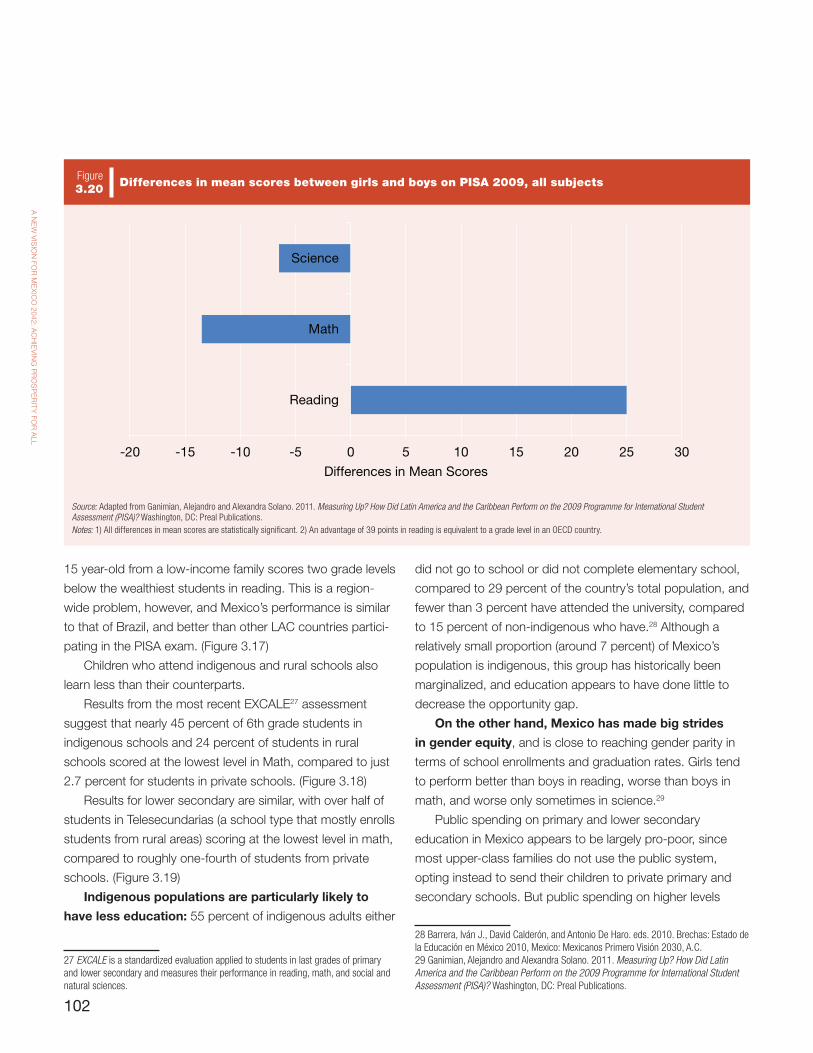
On the other hand, Mexico has made big strides
in gender equity, and is close to reaching gender parity in
terms of school enrollments and graduation rates. Girls tend
to perform better than boys in reading, worse than boys in
math, and worse only sometimes in science.29
Public spending on primary and lower secondary
education in Mexico appears to be largely pro-poor, since
most upper-class families do not use the public system,
opting instead to send their children to private primary and
secondary schools. But public spending on higher levels
28 Barrera, Iván J., David Calderón, and Antonio De Haro. eds. 2010. Brechas: Estado de la Educación en México 2010, Mexico: Mexicanos Primero Visión 2030, A.C. 29 Ganimian, Alejandro and Alexandra Solano. 2011. Measuring Up? How Did Latin America and the Caribbean Perform on the 2009 Programme for International Student Assessment (PISA)? Washington, DC: Preal Publications.
Differences in mean scores between girls and boys on PISA 2009, all subjectsFigure 3.20
Source: Adapted from Ganimian, Alejandro and Alexandra Solano. 2011. Measuring Up? How Did Latin America and the Caribbean Perform on the 2009 Programme for International Student Assessment (PISA)? Washington, DC: Preal Publications. Notes: 1) All differences in mean scores are statistically significant. 2) An advantage of 39 points in reading is equivalent to a grade level in an OECD country.
-20 -15 -10 -5 0 5 10 15 20 25 30
Reading
Math
Science
Differences in Mean Scores
103
ED
UC
ATION
IN M
EX
ICO
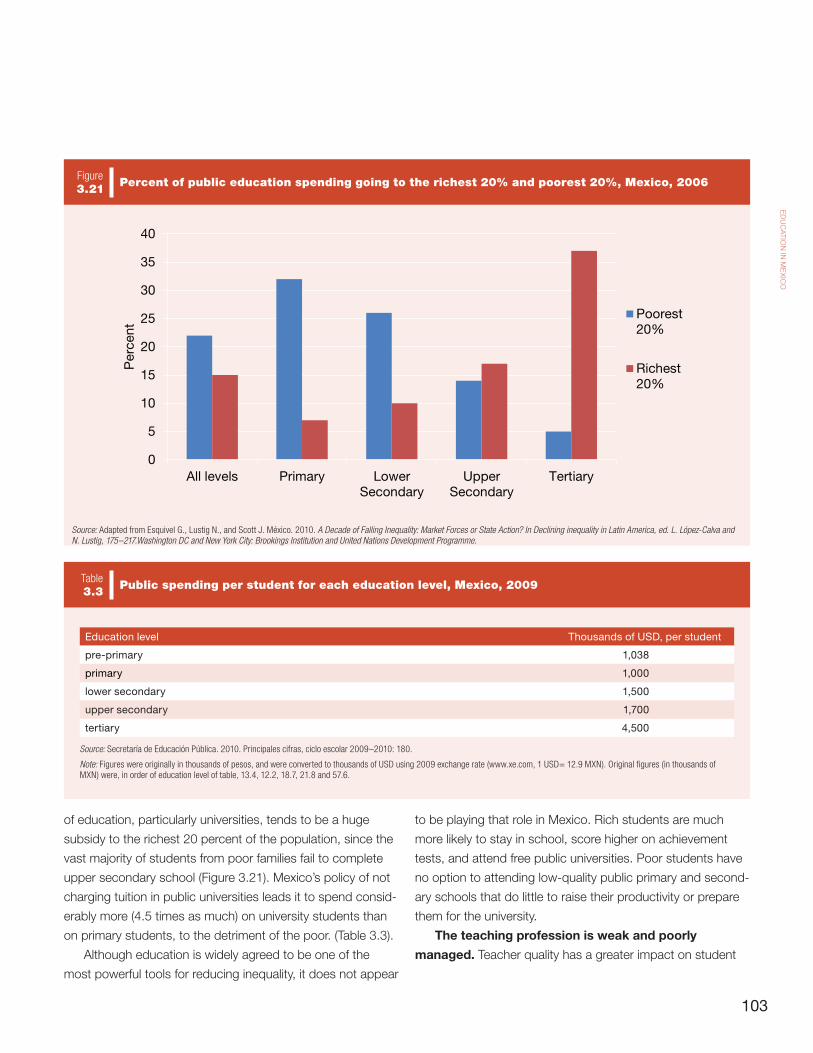
of education, particularly universities, tends to be a huge
subsidy to the richest 20 percent of the population, since the
vast majority of students from poor families fail to complete
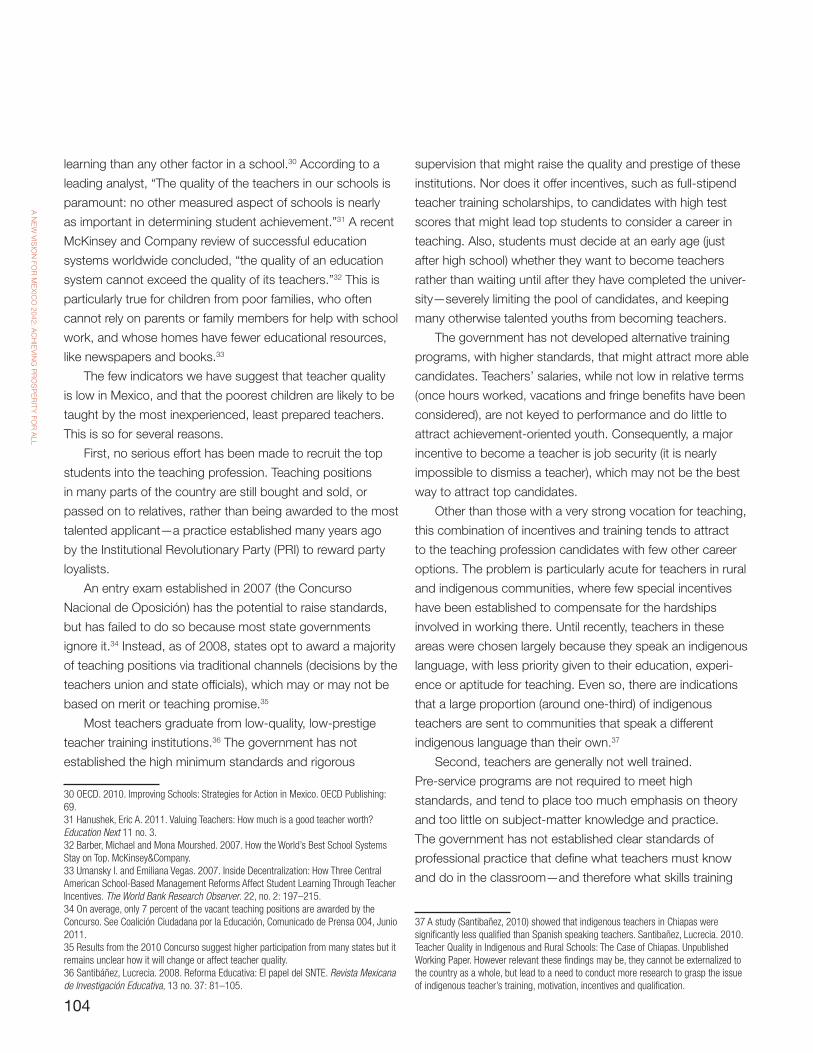
upper secondary school (Figure 3.21). Mexico’s policy of not
charging tuition in public universities leads it to spend consid-
erably more (4.5 times as much) on university students than
on primary students, to the detriment of the poor. (Table 3.3).
Although education is widely agreed to be one of the
most powerful tools for reducing inequality, it does not appear
to be playing that role in Mexico. Rich students are much
more likely to stay in school, score higher on achievement
tests, and attend free public universities. Poor students have
no option to attending low-quality public primary and second-
ary schools that do little to raise their productivity or prepare
them for the university.
The teaching profession is weak and poorly
managed. Teacher quality has a greater impact on student
Percent of public education spending going to the richest 20% and poorest 20%, Mexico, 2006Figure 3.21
Source: Adapted from Esquivel G., Lustig N., and Scott J. México. 2010. A Decade of Falling Inequality: Market Forces or State Action? In Declining inequality in Latin America, ed. L. López-Calva and N. Lustig, 175–217.Washington DC and New York City: Brookings Institution and United Nations Development Programme.
0
5
10
15
20
25
30
35
40
All levels Primary LowerSecondary
UpperSecondary
Tertiary
Per
cent
Poorest20%
Richest20%
Education level Thousands of USD, per student
pre-primary 1,038
primary 1,000
lower secondary 1,500
upper secondary 1,700
tertiary 4,500
Source: Secretaría de Educación Pública. 2010. Principales cifras, ciclo escolar 2009–2010: 180.
Note: Figures were originally in thousands of pesos, and were converted to thousands of USD using 2009 exchange rate (www.xe.com, 1 USD= 12.9 MXN). Original figures (in thousands of MXN) were, in order of education level of table, 13.4, 12.2, 18.7, 21.8 and 57.6.
Public spending per student for each education level, Mexico, 2009Table3.3
104
A N
EW
VIS
ION
FOR
ME
XIC
O 2042: A
CH
IEV
ING
PR
OS
PE
RIT
Y FO
R A
LL
learning than any other factor in a school.30 According to a
leading analyst, “The quality of the teachers in our schools is
paramount: no other measured aspect of schools is nearly
as important in determining student achievement.”31 A recent
McKinsey and Company review of successful education
systems worldwide concluded, “the quality of an education
system cannot exceed the quality of its teachers.”32 This is
particularly true for children from poor families, who often
cannot rely on parents or family members for help with school
work, and whose homes have fewer educational resources,
like newspapers and books.33
The few indicators we have suggest that teacher quality
is low in Mexico, and that the poorest children are likely to be
taught by the most inexperienced, least prepared teachers.
This is so for several reasons.
First, no serious effort has been made to recruit the top
students into the teaching profession. Teaching positions
in many parts of the country are still bought and sold, or
passed on to relatives, rather than being awarded to the most
talented applicant—a practice established many years ago
by the Institutional Revolutionary Party (PRI) to reward party
loyalists.
An entry exam established in 2007 (the Concurso
Nacional de Oposición) has the potential to raise standards,
but has failed to do so because most state governments
ignore it.34 Instead, as of 2008, states opt to award a majority
of teaching positions via traditional channels (decisions by the
teachers union and state officials), which may or may not be
based on merit or teaching promise.35
Most teachers graduate from low-quality, low-prestige
teacher training institutions.36 The government has not
established the high minimum standards and rigorous
30 OECD. 2010. Improving Schools: Strategies for Action in Mexico. OECD Publishing: 69.31 Hanushek, Eric A. 2011. Valuing Teachers: How much is a good teacher worth? Education Next 11 no. 3.32 Barber, Michael and Mona Mourshed. 2007. How the World’s Best School Systems Stay on Top. McKinsey&Company.33 Umansky I. and Emiliana Vegas. 2007. Inside Decentralization: How Three Central American School-Based Management Reforms Affect Student Learning Through Teacher Incentives. The World Bank Research Observer. 22, no. 2: 197–215.34 On average, only 7 percent of the vacant teaching positions are awarded by the Concurso. See Coalición Ciudadana por la Educación, Comunicado de Prensa 004, Junio 2011.35 Results from the 2010 Concurso suggest higher participation from many states but it remains unclear how it will change or affect teacher quality.36 Santibáñez, Lucrecia. 2008. Reforma Educativa: El papel del SNTE. Revista Mexicana de Investigación Educativa, 13 no. 37: 81–105.
supervision that might raise the quality and prestige of these
institutions. Nor does it offer incentives, such as full-stipend
teacher training scholarships, to candidates with high test
scores that might lead top students to consider a career in
teaching. Also, students must decide at an early age (just
after high school) whether they want to become teachers
rather than waiting until after they have completed the univer-
sity—severely limiting the pool of candidates, and keeping
many otherwise talented youths from becoming teachers.
The government has not developed alternative training
programs, with higher standards, that might attract more able
candidates. Teachers’ salaries, while not low in relative terms
(once hours worked, vacations and fringe benefits have been
considered), are not keyed to performance and do little to
attract achievement-oriented youth. Consequently, a major
incentive to become a teacher is job security (it is nearly
impossible to dismiss a teacher), which may not be the best
way to attract top candidates.
Other than those with a very strong vocation for teaching,
this combination of incentives and training tends to attract
to the teaching profession candidates with few other career
options. The problem is particularly acute for teachers in rural
and indigenous communities, where few special incentives
have been established to compensate for the hardships
involved in working there. Until recently, teachers in these
areas were chosen largely because they speak an indigenous
language, with less priority given to their education, experi-
ence or aptitude for teaching. Even so, there are indications
that a large proportion (around one-third) of indigenous
teachers are sent to communities that speak a different
indigenous language than their own.37
Second, teachers are generally not well trained.
Pre-service programs are not required to meet high
standards, and tend to place too much emphasis on theory
and too little on subject-matter knowledge and practice.
The government has not established clear standards of
professional practice that define what teachers must know
and do in the classroom—and therefore what skills training
37 A study (Santibañez, 2010) showed that indigenous teachers in Chiapas were significantly less qualified than Spanish speaking teachers. Santibañez, Lucrecia. 2010. Teacher Quality in Indigenous and Rural Schools: The Case of Chiapas. Unpublished Working Paper. However relevant these findings may be, they cannot be externalized to the country as a whole, but lead to a need to conduct more research to grasp the issue of indigenous teacher’s training, motivation, incentives and qualification.
105
ED
UC
ATION
IN M
EX
ICO
programs should provide. Limited data suggest that a large
proportion of teachers are below par in knowledge and skills.
The share of questions that an average Mexican teacher
could answer correctly in a national teacher knowledge
exam38 in 1996–2000 was just 50 percent.39 40 Once trained
and hired, novice teachers seldom receive much orienta-
tion or mentoring. No systematic program of induction has
been established to provide new teachers with the support,
assessment and feedback necessary to become effective.
In-service training is widely available,41 but appears to
have little impact on student learning. Much of this training
applies a “one-size-fits-all” model and seldom includes school
visits, teacher networks or collaborative projects. Professional
development and other in-service training should be used to
complement and enhance teacher knowledge and skills, and
not to substitute for deficiencies in pre-service training.
Third, teacher performance is not properly evaluated
or rewarded. The existing system has fostered a culture
where excellence and merit do not matter. Teachers are
given lifetime tenure after six months of service with little
concern for the quality of their work. Salaries are almost
entirely unrelated to performance. The main teacher evalua-
tion and incentive program (Carrera Magisterial) suffers from
poor design. Until 2011, majority weight was given to factors
(seniority, academic degrees, in-service training courses and
peer evaluations) that have little impact on student achieve-
ment. Also, until 2011 teachers who passed the exam and
were “incorporated” into the program received a salary bonus
for the rest of their career, even if they never re-took the test.
President Calderón just announced a reform of Carrera
Magisterial that would make teacher performance evaluations
more rigorous. Student achievement would now count for
50 percent of the total score (up from 20 percent), teachers
would be required to re-take the test periodically in order
to continue receiving their bonus, and new factors, such as
a self-appraisal of teacher competence as well as teacher
attendance and punctuality, would be introduced. It remains
38 This refers to the Carrera Magisterial, national teacher incentive exam.39 Very little data is available on teachers’ knowledge and skills, and more is needed.40 Santibañez and others. 2007. Breaking Ground: Analysis of the assessments and impact of the Carrera Magisterial program in Mexico. Technical Report. Santa Monica, CA: RAND/MG-141 (also available in Spanish).41 The OECD Study “TALIS” found that Mexican secondary teachers receive twice as much in-service training as do their counterparts in other countries who participated in the study.
to be seen, however, whether these changes will in fact be
approved and properly implemented. Until then, it is unclear
that the reforms will be enough to make Carrera Magisterial a
meritocratic system for rewarding good teaching.
Regardless, neither Carrera Magisterial nor any other
government programs currently in place do anything to
remove ineffective teachers from the classroom. Princi-
pals do not have the authority to dismiss teachers, or even
to recommend dismissal. More generally, there is little in
Mexican law that allows schools to dismiss ineffective
teachers.42 A high-quality system needs not only to reward
excellent teachers; it also needs to impose consequences,
including dismissal, for those who are ineffective or lazy.
Fourth, the national teacher’s union (Sindicato Nacional
de Trabajadores de la Educación—SNTE) has far too much
power over teacher management and education policy. By
decree (passed more than 60 years ago), only one teachers’
union can exist, and every public school teacher—and most
administrative staff—must belong to it. SNTE was established
as a virtual arm of the Partido Revolucionario Institucional
(PRI) after the Mexican Revolution. It therefore enjoys a
monopoly over the supply of public school teachers, and
has veto power over such key issues as contracts, training,
hiring, incentives, sanctions, and teacher placement.43
Union representatives are often named to key posts in the
SEP (nationally and at the state level), and work against
government efforts to increase accountability, efficiency and
transparency in the system. SNTE also has a substantial
presence in the legislature (Cámara de Diputados) enabling it
to influence legislation. Many union leaders have decades of
experience, while SEP leaders are often politicians with little
background in education, and are replaced frequently. SNTE
also is legally entitled to “commission” teachers to take a paid
leave of absence from teaching to do union work. Although
no official data on commissioned teachers is available,
42 Recent evidence suggests that principals and SEP authorities prefer to deal with inef-fective teachers through informal channels, and transfers to other schools or positions. Even in the most extreme cases, teachers exhibiting criminal behavior or engaged in physical conflict, it is extraordinarily hard to fire a teacher.43 Raphael, Ricardo. 2007. Los Socios de Elba Esther. México: Planeta. See also: Santibáñez, Lucrecia. 2008. Reforma Educativa: El papel del SNTE. Revista Mexicana de Investigación Educativa. 13, 37: 81–105; Ornelas, Carlos. 2008. Política, poder y pupi-tres: Crítica al nuevo federalismo educativo. Mexico: Siglo XXI Editores; Muñoz Armenta, A. 2005. El sindicalismo mexicano frente a la reforma del estado. El impacto de la descentralización educativa y el cambio político en el sindicato nacional de trabajadores de la educación (1992–1998). Mexico: Universidad Iberoamericana.
106
A N
EW
VIS
ION
FOR
ME
XIC
O 2042: A
CH
IEV
ING
PR
OS
PE
RIT
Y FO
R A
LL
some estimate that over 10 percent of teachers are doing
union work at any given time.44 These activities, which often
include electoral campaigns, amount to a public subsidy for
the union’s political agenda. No other union in Latin America
enjoys as much monopoly power as SNTE.
The problem with SNTE’s enormous influence over
education is that, by definition, its mandate is to protect
and promote the labor interests of teachers. Having SNTE
effectively co-govern the education sector, and giving it a
veto over policy, guarantees that the interests of teachers
(or at least, of the teachers’ union) will be placed well ahead
of the interests of students. The result is political support for
politicians who are willing to give SNTE relatively free rein,
ironclad job security for teachers, and third-rate education for
students.
Recommendations
Significantly improving Mexico’s education system will
take much time and effort. Many of the challenges are politi-
cal, and require confronting powerful interest groups that
have “captured” the education system and benefit from the
status quo. These include the teachers union (SNTE) and
politicians who use the education system for patronage. The
demand for quality education, and for fundamental education
reform, is weak. Parents have little information regard-
ing how much their children are learning, and few effective
mechanisms for acting even when they have a complaint.
Employers have been largely silent, preferring to avoid
conflict. Upper- and middle-class elites, who make most
decisions on education policy, send their children to private
schools and so do not directly experience the deficiencies
of the public education system. Political leaders have been
reluctant to challenge SNTE’s power, opting instead either
to offer concessions in return for political support, or to do
nothing.
This may be beginning to change. Public opinion polls
suggest that parental dissatisfaction with the school system,
and with SNTE, is rising.45 A broad network of national policy
experts (the Autonomous Citizen’s Council for Education)
was formed four years ago and agrees generally on the
nature of Mexico’s education problems, and the need for
44 Raphael, Ricardo. 2007. Los Socios de Elba Esther. México: Planeta.45 Juarez Gonzalez, Leticia. 2011. Insatisfacción. Nexos, May.
systemic change. Business leaders are increasingly support-
ing fundamental education reform initiatives. One good
example is Mexicanos Primero, a high-profile organization
that develops and promotes specific reform proposals.
Another is the Citizens’ Coalition for Education, an offshoot
of the Citizens’ Council (above) that was formed in 2010
to document the harmful activities of SNTE and press the
government for change. These initiatives should be seen
as steps toward developing an effective demand for quality
education, and building a constituency that might make it
easier for political leaders to confront SNTE and other special
interests.
Much more needs to be done, however. Although there is
no single recipe for successful education reform, the following
policies will have a substantial, positive impact:
1. Make learning for all a long-term national
objective. The goal is to shift the traditional focus
of education policy away from inputs and toward
outputs and processes. Emphasis should be
on monitoring education outcomes—principally
learning—and taking the steps necessary to raise
learning to acceptable competency levels. An
important part of making learning for all a long-term
national objective is establishing a culture in which
education quality receives top national priority. Major
priority should also be given to raising learning among
the poor. Leaders from the public and private sectors
should to join in high-profile campaigns that draw
attention to education objectives, debate their merits,
and celebrate progress in achieving them. Success
should be measured by how much students learn
rather than by spending or enrollments.
A key component should be to make education a
long-term state policy (política de Estado) at both the
federal and state levels that is insulated from partisan
politics and based on multi-party agreements that
endure relatively unchanged from one administration
to the next. Specifically, the government should:
• Establish a set of demanding core standards
in reading, math and science for each grade,
and key them to existing testing systems. It
should also maintain a robust and profes-
sional student assessment program, and
107
ED
UC
ATION
IN M
EX
ICO
make the results widely available, especially
to parents.46
• Establish clear expectations for what
teachers should know and do in the
classroom. Mexico should define what it
means by effective teaching, outlining out
the kinds of skills, strategies and methods
it expects of its teachers. It should integrate
these expectations into teacher training,
make them core objectives for principal and
supervisory personnel, and incorporate them
into a new teacher evaluation system.47
• Recruit only the most talented graduates
into the teaching profession. Entry into
teacher training programs should be highly
selective, with full-stipend scholarships
for high-scoring applicants. The practice
of inheriting or purchasing teaching posts
should be eliminated. Teachers’ salaries
should be competitive, and be based
strongly on quality of performance and other
relevant indicators rather than on level of
education and years of service. Salaries
should vary with subject taught, geographic
location, and student population. Lifetime
job tenure either be eliminated, or limited
46 According to a 2007 McKinsey report “All the top-performing and rapidly improv-ing systems have curriculum standards which set clear and high expectations for what students can achieve.” Finland and Singapore are among those cited. Regarding student assessments, the McKinsey analysis also observes that “All the top-performing systems recognize that they cannot improve what they do not measure.” (Barber and Mourshed, 2007: 35). By way of example, in 2006 the Brazilian state of Minas Gerais set a recom-mended reading standard for 8-year-olds and managed to increase the percentage reading at that level from 46 to 85 percent by 2010. (Mourshed and others, 2009)47 McKinsey & Company’s review of the world’s best-performing school systems con-cluded that “The first part of the challenge is to define what great instruction looks like.” (Barber and Mourshed, 2007: 26). In less developed countries, these include scripted teaching materials (Minas Gerais in Brazil and Mahdya Pradesh in India); more advanced countries rely on a carefully developed framework that outlines what a teacher should know and do in the classroom. (Mourshed and others, 2009)
to a few highly successful teachers after
substantial time in service.48
• Restructure teacher training by setting high
standards for training institutions, emphasiz-
ing subject matter knowledge over theory,
and adding a strong component of practi-
cal experience. High-prestige alternative
training programs should be established
that allow top performing college graduates
who did not specialize in education to qualify
for teaching positions. Universities should
have the same ability to train teachers for
public schools as do public Normales. Hiring
procedures should not favor graduates of
any particular kind of institution.49
• Transform the role of principal and supervi-
sory personnel from administrator to
pedagogical leader. Principals, supervisors
and technical pedagogic assistants (ATPs)
should become instructional leaders, or
coaches, who regularly assess performance,
demonstrate proper techniques and make
sure their teachers become effective instruc-
tors. This implies a major effort to select
principals and supervisory staff on the basis
of merit, and provide them with proper skills,
and streamlining administrative procedures
so that principals can focus on teacher
mentoring and evaluation. SNTE should be
48 By way of example, South Korea recruits its teachers from the top 5 percent of each graduating cohort; Finland does so from the top 10 percent; and Singapore and Hong Kong do so from the top 30 percent. Singapore, China, Minas Gerais, Chile and Western Cape (South Africa) offer some form of salary bonuses based on improvement of students’ performance; Top-performing systems generally offer a starting salary that is just below GDP per capita. (Barber and Mourshed, 2007). Funding is generally tied to performance in some way: “…system leaders were quick to note that salaries were only increased once the system had made significant progress in achieving the goals of that stage’s intervention cluster.” (Mourshed and others, 2009: 61)49 Very few successful education systems restrict training to Normales. Teachers in virtually all of the world’s high performing school systems have university degrees. Some countries have created alternative training paths—in England, by 2006, there were 32 different ways to enter the teaching profession, and all had the same expectations and knowledge once having completed their training. (Barber and Mourshed, 2007)
108
A N
EW
VIS
ION
FOR
ME
XIC
O 2042: A
CH
IEV
ING
PR
OS
PE
RIT
Y FO
R A
LL
prohibited from participating in any supervi-
sory function.50
• Make accountability a central feature of
public education. A strong teacher evalua-
tion system should be established based in
part on the teacher expectations framework
and in part on student learning over the
school year. Effective teachers should be
rewarded with higher salaries. Non-effective
teachers who fail to improve should be
dismissed. The government should experi-
ment with alternative models of service
delivery that operate under clear expecta-
tions, meaningful consequences for perfor-
mance, and significant competition among
providers. Examples include charter schools,
vouchers, school-based management
reforms, and public-private partnerships.51
2. Reduce the power of the teachers union (SNTE).
The 1946 decree that gave SNTE exclusive rights
to represent teachers should be reviewed, repealed
and replaced. Teachers should be allowed to join the
union of their choice, or not to join at all. Teachers
unions should be restricted to collective bargaining
50 High-performing systems as diverse as Ontario, Canada, Finland and Singapore have made developing strong school leadership a key part of their reform strategies. Systems in Boston and Chicago have seen rapid improvement in student performance by having coaches work one-on-one with teachers in classrooms; Singapore selects master and senior teachers to develop teachers and lead coaching, and has a strict selection process and high starting salaries when hiring principals. (Barber and Mourshed, 2007).51 While accountability mechanisms vary substantially, they are always present in suc-cessful school systems, such as Finland (”Accountability in the Finnish system is built from the bottom up”—OECD 2011: 127). The McKinsey 2007 document concludes “Most top-performing systems recognize that no selection process is perfect, and so implement procedures to ensure that the lowest-performing teachers can, if necessary, be removed from the classroom…based on the evidence of their classroom practice.” (Barber and Mourshed, 2007: 20), Singapore and China award salary bonuses based on teacher performance. Hong Kong’s school system, since 1960, is largely publicly funded and privately operated.
on salaries and other strictly labor issues, not allowed
to participate in decisions on hiring, evaluation,
teacher assignment, or teacher supervision. SNTE’s
veto over education policy should be eliminated. This
recommendation will be difficult to implement and
requires substantial political will. Nonetheless, without
changes to the laws and changes giving SNTE a
co-governing role in education, it will be hard for any
government to make significant progress.
3. Enhance the role of universities as a source of
technical training and research, in cooperation with
the productive/private sector, by:
• Expanding funding for research and
development through venture funds,
business-university funds, basic research
funds, and incentives for R&D companies.52
• Establishing a rigorous higher education
accreditation body with proper funding and
autonomy.
• Shifting public spending on higher education
away from direct support for institutions and
towards scholarships and living stipends for
poor but talented students.
52 The Chinese government has launched a group of specific national initiatives to develop a number of world-class research universities—Chinese Ivy League—such as Shanghai Jiao Tong University (SJTU). Part of the initiative is to provide financial investment from both the central government and the local government. The business community has made important financial contributions to help increase the endowment of top institutions in Singapore and Hong Kong, China (Altbach and Salmi, editors, 2011).