E1782 Vol. 2 - World Bank Documents & Reports
531
ENVIRONMENT IMPACT ASSESSMENT OF JIANGXI SHIHUTANG SHIPPING AND HYDROPOWER PIVOTAL PROJECT AT THE KAN RIVER CLIENT: NAVIGATIONAL AFFAIRS ADMINISTRATION, JIANGXI PROVINCIAL COMMUNICATIONS BUREAU EVALUATOR CCCC SECOND HARBOR CONSULTANTS CO., LTD. JIANGXI PROVINCIAL WATER RESOURCE PLANNING AND DESIGN INSTITUTE October 2007 WB Loan Application Project E1782 Vol. 2 Public Disclosure Authorized Public Disclosure Authorized Public Disclosure Authorized Public Disclosure Authorized Public Disclosure Authorized Public Disclosure Authorized Public Disclosure Authorized Public Disclosure Authorized
-
Upload
khangminh22 -
Category
Documents
-
view
1 -
download
0
Transcript of E1782 Vol. 2 - World Bank Documents & Reports
ENVIRONMENT IMPACT ASSESSMENT
OF
JIANGXI SHIHUTANG SHIPPING AND HYDROPOWER PIVOTAL PROJECT AT THE KAN RIVER
CLIENT: NAVIGATIONAL AFFAIRS ADMINISTRATION, JIANGXI PROVINCIAL COMMUNICATIONS BUREAU
EVALUATOR CCCC SECOND HARBOR CONSULTANTS CO., LTD. JIANGXI PROVINCIAL WATER RESOURCE PLANNING AND DESIGN INSTITUTE
October 2007
WB Loan Application Project
E1782 Vol. 2
Pub
lic D
iscl
osur
e A
utho
rized
Pub
lic D
iscl
osur
e A
utho
rized
Pub
lic D
iscl
osur
e A
utho
rized
Pub
lic D
iscl
osur
e A
utho
rized
Pub
lic D
iscl
osur
e A
utho
rized
Pub
lic D
iscl
osur
e A
utho
rized
Pub
lic D
iscl
osur
e A
utho
rized
Pub
lic D
iscl
osur
e A
utho
rized

EVALUATOR CCCC SECOND HARBOR CONSULTANTS CO., LTD. (EA CERTIFICATE NO.: 2603)
Company Vice President: Zhou Yonghua, Senior Engineer
Company Vice Chief Engineer: Luo Xianqing, Senior Engineer �Reviewed by� (Certificate No.:A26030002)
Director of EA Division: Fang Jianzhang, Senior Engineer (Certificate No.:A26030003)
Project Manager: Chen Yong, Senior Engineer (Certificate No.:A26030008)
Prepared by:
Contents
Prepared by and
their certificate
nos.
Checked by and
his certificate
no.
1.0 General 2.0 Project Overview 3.0 Engineering Analysis 4.0 Plan Harmony Analysis & Environment Alternatives Comparison
Chen Yong A26030008 Zeng Xiang A26030020 Li Haidong A26030009 Wang Ming A26030012
Li Xiangyang A26030004
5.0 Environment Baseline Survey & Assessment 6.0 Environment Impact Assessment 7.0 Special Assessment of Impacts on Old Trees 8.0 Environmental Risk Analysis 9.0 Environment Protection Measures & Techoeconomic Analysis
Chen Yong A26030008 You Lixin
A26030006 Zeng Xiang A26030020 Li Haidong A26030009 Luo Xiong A26030010
Li Xiangyang A26030004
10.0 Environment Management & Monitoring 11.0 Environment Protection Investment Estimate & Environment Impact Gain & Loss Analysis 12.0 Public Consultation 13.0 EIA Conclusions & Suggestions
Chen Yong A26030008 You Lixin
A26030006 Hu Zhiwei A26030011
Li Xiangyang A26030004

Assessment cooperation units:
1. Jiangxi Provincial Water Resource Planning and Design Institute
2. Graduate School of Nanchang University (Jiangxi Provincial Fishes
Association)
3. Ji’an City Environment Monitoring Station
4. Forestry Institute of Jiangxi Agriculture University (Garden and
Park Design and Research Institute Co. Ltd. of Jiangxi Agriculture University�
5. Yangtze Aquatic Products Research Institute of China Aquatic Products
Scientific Research Institute
6. Zhongshui Pearl River Planning, Exploration and Design Co. Ltd.

Table of Contents
TABLE OF CONTENTS
1.0 GENERAL ....................................................................................................................................................... 9
1.1 BACKGROUND OF THE EIA TASK ................................................................................................................... 9
1.2 EIA PURPOSES............................................................................................................................................. 10
1.3 EIA PREPARATION BASIS............................................................................................................................. 10
1.4 EIA STANDARDS.......................................................................................................................................... 16
1.5 EIA CLASS................................................................................................................................................... 19
1.6 SCOPE AND PERIOD OF ASSESSMENT............................................................................................................ 19
1.7 ENVIRONMENT PROTECTION OBJECTIVES.................................................................................................... 20
1.8 IDENTIFICATION OF ENVIRONMENT IMPACTS AND EIA STRESSES................................................................ 30
1.9 EIA METHODS............................................................................................................................................. 32
2.0 PROJECT OVERVIEW ............................................................................................................................... 34
2.1 GEOGRAPHICAL LOCATION OF THE PROJECT................................................................................................ 34
2.2 OVERVIEWS OF THE DRAINAGE AREA AND RELATED PLAN .......................................................................... 34
2.3 FREIGHT FORECASTING AND OPERATING ORGANIZATION PLAN................................................................... 41
2.4 CHARACTERISTICS OF THE PROJECT............................................................................................................. 43
2.5 SETUP OF THE PROJECT................................................................................................................................ 43
2.6 DEVELOPMENT TASK AND PROJECT SCALE .................................................................................................. 44
2.7 PIVOT MANAGEMENT AND OPERATING MODE............................................................................................. 51
2.8 GENERAL ARRANGEMENT............................................................................................................................ 52
2.9 PROTECTION WORK OF THE RESERVOIR AREA............................................................................................. 54
2.10 RESERVOIR INUNDATION AND LAND OCCUPATION OF THE PROJECT........................................................... 61
2.11 CONSTRUCTION ORGANIZATION DESIGN.................................................................................................... 66
2.12 EARTHWORK BALANCE, PLAN OF BORROW SITES AND SPOIL SITES............................................................. 72
2.13 INVESTMENT ESTIMATE AND CAPITAL RAISING ......................................................................................... 78
3.0 ENGINEERING ANALYSIS........................................................................................................................ 79
3.1 ANALYSIS ON ENVIRONMENT IMPACTS DURING CONSTRUCTION................................................................. 79
3.2 INUNDATION, LAND OCCUPATION AND RESETTLEMENT............................................................................... 83
3.3 ANALYSIS ON ENVIRONMENT IMPACT DURING OPERATION.......................................................................... 83
4.0 PLAN HARMONY ANALYSIS & ENVIRONMENT ALTERNATIVES COMPARISON.................... 87
4.1 COORDINATION ANALYSIS OF ENGINEERING CONSTRUCTION & RELEVANT PLANNING ............................... 87
4.2 ENVIRONMENTAL ALTERNATIVE OPTIONS.................................................................................................... 95
5.0 ENVIRONMENT BASELINE SURVEY & ASSESSMENT................................................................... 118
5.1 SURVEY OF NATURAL ENVIRONMENT ........................................................................................................ 118
5.2 SURVEY OF SOCIAL ENVIRONMENT............................................................................................................ 124
5.3 INVESTIGATION OF POLLUTION SOURCES................................................................................................... 135
5.4 STATUS QUO & ASSESSMENT OF WATER ENVIRONMENT............................................................................ 140
5.5 INVESTIGATION & EVALUATION OF EXISTING AMBIENT AIR ...................................................................... 149
5.6 INVESTIGATION & ASSESSMENT OF ACOUSTICAL ENVIRONMENT .............................................................. 151

Table of Contents
5.7 INVESTIGATION OF EXISTING ECO-ENVIRONMENT ..................................................................................... 152
6.0 ENVIRONMENTAL IMPACT ASSESSMENT ..................................................................................... 192
6.1 HYDROLOGIC CONDITIONS ........................................................................................................................ 192
6.2 WATER ENVIRONMENT............................................................................................................................... 225
6.3 ECOLOGICAL ENVIRONMENT ..................................................................................................................... 252
6.4 AMBIENT AIR ............................................................................................................................................. 286
6.5 ACOUSTICAL ENVIRONMENT...................................................................................................................... 291
6.6 RESETTLEMENT OF AFFECTED RESIDENTS................................................................................................. 296
6.7 ANTIQUITIES PRESERVATION...................................................................................................................... 302
6.8 INUNDATION OF MINERAL RESOURCES...................................................................................................... 303
6.9 SOCIAL ENVIRONMENT .............................................................................................................................. 305
6.10 REGIONAL CLIMATE ................................................................................................................................. 309
6.11 GEOLOGICAL ENVIRONMENT ................................................................................................................... 312
6.13 RIVER REGIME & FLOOD DISCHARGE...................................................................................................... 319
6.14 NAVIGATION ............................................................................................................................................. 320
6.15 PUBLIC HEALTH ........................................................................................................................................ 320
6.16 SOLID WASTE........................................................................................................................................... 322
7.0 SPECIAL ASSESSMENT OF IMPACTS ON LARGE AND OLD TREES........................................... 323
7.1 INVESTIGATION OF CURRENT STATUS OF OLD AND LARGE TREES................................................................ 323
7.2 INVESTIGATION ON GROWTH SITUATION OF ROOT SYSTEM OF CINNAMOMUM CAMPHORA IN THE PROJECT
AREA................................................................................................................................................................ 326
7.3 IMPACT APPRAISAL OF OLD AND LARGE TREES........................................................................................... 329
7.4 IMPACTS ON ZHUJIA VILLAGE NATURE RESERVE AND ENVIRONMENT PROTECTION ALTERNATIVE SCHEME
......................................................................................................................................................................... 331
7.5 PROTECTIVE MEASURES FOR OLD TREES AND BIG TREES............................................................................ 335
7.6 TECHNICAL PROPOSAL FOR IN SITU CONSERVATION FOR OLD TREES AND BIG TREES................................... 340
7.7 TECHNICAL PROPOSAL FOR TRANSPLANT CONSERVATION FOR OLD TREES AND BIG TREES...................... 343
7.8 EXPENSES CALCULATION OF PROTECTIVE MEASURES FOR OLD TREES AND BIG TREES................................ 348
8.0 SPECIAL IMPACT ASSESSMENT ON FISHES AND SPAWNING SITES......................................... 351
8.1 INVENTORY SURVEY ON FISH RESOURCES AND SPAWNING SITES............................................................... 351
8.2 ASSESSMENT OF IMPACTS ON FISHES AND SPAWNING SITES....................................................................... 359
8.3 PROTECTION MEASURES OF FISHES AND SPAWNING SITES AND TECHNOECONOMIC APPRAISAL................ 366
8.4 COST ESTIMATE OF PROTECTION MEASURES OF FISHES AND SPAWNING SITES.......................................... 374
9.0 ENVIRONMENTAL RISK ANALYSIS .................................................................................................... 377
9.1 ENVIRONMENTAL RISK IDENTIFICATION AND ASSESSMENT WORKING LEVEL.............................................. 377
9.2 ANALYSIS OF CHANNEL ENVIRONMENT RISK DURING OPERATION............................................................ 381
9.3 RISK ANALYSIS OF AQUATIC ECOLOGICAL ENVIRONMENT.......................................................................... 388
9.4 ENVIRONMENTAL RISK ANALYSIS OF DAM SAFETY..................................................................................... 389
9.5 OTHER ENVIRONMENTAL RISK IMPACT ANALYSIS....................................................................................... 393
9.6 RISK ACCEPTANCE ANALYSIS...................................................................................................................... 393
9.7 RISK PROTECTIVE MEASURES AND EMERGENCY PLAN................................................................................ 394

Table of Contents
10.0 ENVIRONMENTAL PROTECTIVE MEASURES AND ECONOMIC AND TECHNICAL
EVALUATION................................................................................................................................................... 413
10.1 WATER ENVIRONMENTAL PROTECTIVE MEASURES.................................................................................. 413
10.2 ECOLOGICAL ENVIRONMENTAL PROTECTIVE MEASURES......................................................................... 429
10.3 WATER AND SOIL CONSERVATION SCHEME................................................................................................ 433
10.4 PROTECTIVE MEASURES OF ENVIRONMENT ATMOSPHERE......................................................................... 440
10.5 PROTECTIVE MEASURES FOR ACOUSTIC ENVIRONMENT............................................................................ 441
10.6 ENVIRONMENTAL PROTECTION PLAN FOR IMMERGING AND RESETTLEMENT WORKS IN THE RESERVOIR AREA
......................................................................................................................................................................... 442
10.7 REDUCE UNADVANTAGEOUS SOCIAL ENVIRONMENTAL IMPACT MEASURES.............................................. 448
10.8 HANDLING MEASURES FOR SOLID WASTE............................................................................................... 453
10.9 PRECAUTIONS AND EMERGENCY PLAN FOR ENVIRONMENTAL RISK ........................................................ 454
11.0 ENVIRONMENT MONITORING AND ENVIRONMENT MANAGEMENT .................................. 455
11.1 ENVIRONMENT MONITORING PLAN.......................................................................................................... 455
11.2 ENVIRONMENT MANAGEMENT PLAN ....................................................................................................... 467
12.0 ENVIRONMENT PROTECTION INVESTMENT ESTIMATE AND ENVIRONMENTAL GAIN &
LOSS ANALYSIS .............................................................................................................................................. 481
12.1 ENVIRONMENT PROTECTION INVESTMENT ESTIMATE .............................................................................. 481
12.2 ENVIRONMENT ECONOMIC BENEFIT ANALYSIS........................................................................................ 492
12.3 ANALYSIS OF LOSS DUE TO ENVIRONMENTAL IMPACTS............................................................................ 494
13.0 PUBLIC CONSULTATION...................................................................................................................... 496
13.1 OBJECTIVES OF PUBLIC PARTICIPATION.................................................................................................... 496
13.2 PERFORMANCE OF PUBLIC PARTICIPATION AND POLL............................................................................... 496
13.3 PUBLIC POLL RESULTS............................................................................................................................. 501
13.4 ACCEPTANCE OF PUBLIC COMMENTS....................................................................................................... 507
14.0 ACCUMULATED IMPACT ANALYSIS ................................................................................................ 510
14.1 ANALYSIS OF IMPACTS OF RIVER HYDROLOGY AND SEDIMENT ............................................................... 510
14.2 ANALYSIS OF CUMULATIVE IMPACTS ON THE SURFACE WATER ENVIRONMENT ....................................... 513
14.3 ANALYSIS OF CUMULATIVE IMPACTS ON THE ECOLOGICAL ENVIRONMENT............................................. 513
14.4 ANALYSIS OF CUMULATIVE IMPACTS ON THE SOCIAL ENVIRONMENT...................................................... 514
14.5 CUMULATIVE IMPACTS ON AMBIENT AIR ................................................................................................. 514
14.6 ANALYSIS OF IMPACTS ON ACOUSTIC ENVIRONMENT .............................................................................. 514
14.7 ANALYSIS OF IMPACTS ON NATURAL LANDSCAPE.................................................................................... 514
14.8 ANALYSIS OF IMPACTS ON LOCAL CLIMATE ............................................................................................. 514
14.9 ANALYSIS OF IMPACTS ON PUBLIC HEALTH.............................................................................................. 515
14.10 CONCLUSION OF CUMULATIVE EFFECTS................................................................................................ 515
15.0 EIA CONCLUSIONS AND SUGGESTIONS ......................................................................................... 516
15.1 EIA CONCLUSIONS OF ENVIRONMENT ACTUALITY .................................................................................. 516
15.2 EIA CONCLUSIONS.................................................................................................................................. 517
15.3 ASSESSMENT CONCLUSIONS OF IMPACTS ON OLD TREES AND LARGE TREES........................................... 522

Table of Contents
15.4 ASSESSMENT CONCLUSIONS OF IMPACTS ON FISHES AND SPAWNING SITES............................................. 523
15.5 PLAN HARMONY ANALYSIS & ENVIRONMENT ALTERNATIVES COMPARISON........................................... 525
15.6 ENVIRONMENT RISK ASSESSMENT CONCLUSIONS................................................................................... 526
15.7 ENVIRONMENT PROTECTION MEASURES AND COST ESTIMATE ................................................................ 526
15.8 GENERAL CONCLUSIONS.......................................................................................................................... 527
15.9 SUGGESTIONS.......................................................................................................................................... 528
Attached Tables:
Table 01 Summary of construction temporary building quantities;
Table 02�Summary of main construction machinery;
Table 03�Vegetation classification of the evaluated area;
Table 04�Birds directory of the evaluated area;
Table 05�Plankton directory of the evaluated area;
Table 06�Plankton survey record of the evaluated area ( the dam site);
Table 07�Plankton survey record of the evaluated area�Cheng River��
Table 08�Plankton survey record of the evaluated area�Yan Brook��
Table 09�Plankton survey record of the evaluated area�Tong Jiazhuang��
Table 10�Zoobenthos directory of the evaluated area;
Table 11�Old trees distribution and basic situation of the fending groyne;
Table 12 Old trees distribution and basic situation within the fending groyne;
Table 13 Old trees distribution and basic situation of Shihutang;
Table 14 Old trees distribution and basic situation of the flooding area beyond the
fending groyne;
Table 15 Old trees distribution and basic situation of the non-flooding area beyond the
fending groyne;
Table 16�80�100cm diameter camphors distribution and basic situation;
Table 17�Fishes directory of the evaluated area;
Table 18 Environment Protection Approval Registration Table for Construction project;
Table 19 Public poll table (Sample).
APPENDIXES

Table of Contents
APPENDIX 1 Letter of Entrustment of Navigational Affairs Administration of Jiangxi
Provincial Communications Bureau to entrust CCCC Second Harbor Consultants Co., Ltd. To
undertake the environment impact assessment work of the Jiangxi Shihutang Shipping and
Hydropower Pivotal Project at the Kan River;
APPENDIX 2 Jiangxi Provincial Environment Protection Bureau’s Document No.
[2007]213: “Approval for the implementation standards for the environment impact
assessment of the Jiangxi Shihutang Shipping and Hydropower Pivotal Project at the Kan
River”;
APPENDIX 3 Jiangxi Provincial Greening Commission’s Document No.:[2007] 1:
“Response letter about Special Report on Old Trees Protection of the Shihutang Shipping and
Hydropower Pivotal Project by Navigational Affairs Administration of Jiangxi Provincial
Communications Bureau;
APPENDIX 4 Experts’ review comments on Special Report of Impacts on Old and
Famous Trees and Specially Protected Wild Plants of the Shihutang Shipping and
Hydropower Pivotal Project at the Kan River;
APPENDIX 5 Experts’ Approval Report on Old and Famous Trees and Specially
Protected Wild Plants within the Shihutang Shipping and Hydropower Pivotal Project at the
Kan River;
APPENDIX 6 Taihe County People’s Government: “Response letter on adjusting the
core area and buffer area of the county grade nature reserve – Zhujia Village Camphor Woods,
Tangzhou Township, Taihe County” 2007.3.25
APPENDIX 7 Ji’an City People’s Government’s Document No.: [2006] 83: “Notice on
Printing and distributing Ji’an City Emergency Plan to Handle Water Emergencies”;
APPENDIX 8 Exports Review Comments on the Environment Impact Report on
Jiangxi Provincial Inland River Shipping Development Plan;
APPENDIX 9 State Planning Commission’s Document No.:[1990] 1452: “Approval on
Review Comments about the Kan River Basin Planning Report”;
APPENDIX 10 Taihe County Environmental Hygiene Administration’s Letter of
Commitment about Compensated Transport and Disposal of the Domestic Rubbish of
environment protection of the Jiangxi Shihutang Shipping and Hydropower Pivotal Project at

Table of Contents
the Kan River during Construction and Operation
APPENDIX 11 Official Notice No.1 of environment protection of the Jiangxi
Shihutang Shipping and Hydropower Pivotal Project at the Kan River.
ATTACHED DRAWINGS
DRAWING NO. 01 Project Geographical Location Drawing;
DRAWING NO. 02: Environment Situation Survey Points Layout;
DRAWING NO. 03�Environment protection objectives distribution plan;
DRAWING NO. 04 Vegetation classification and biological environment protection
objectives distribution sketch of the evaluated area;
DRAWING NO. 05 County grade nature reserve (Jintan old woods) planning map of
Zhujia Village, Tangzhou Township;
DRAWING NO. 06�Regional water system diagram;
DRAWING NO. 07 Kan River Waterway Planned Grades and Basin Cascade
Development Planning Sketch;
DRAWING NO. 08 Longitudinal Section of Kan River Basin Cascade Development
Planning;
DRAWING NO. 09�General Layout of Recommended Dam Site, Dam Line and Plans
of the Shihutang Project;
DRAWING NO. 10 General Layout of Plans for Comparison and Selection of
Recommended Dam Site & Dam Line of the Shihutang Project;
DRAWING NO. 11 Fending groynes and flood drainage works layout of Taihe County
Seat Protection Area ;
DRAWING NO. 12 Fending groynes and flood drainage works layout of Yongchang
Protection Area ;
DRAWING NO. 13 Fending groynes and flood drainage works layout of Yanxi
Protection Area ;
DRAWING NO. 14 Fending groynes and flood drainage works layout of Wanhe and
Zhangtang Protection Areas ;
Table of Contents
DRAWING NO. 15 Reservoir inundation scope and resettlement places layout and
layout of monitoring points during construction and operation;
DRAWING NO. 16 Stage 1 construction diversion layout;
DRAWING NO. 17 Stage 2 construction diversion layout;
DRAWING NO. 18 General layout for dam site construction;
DRAWING NO. 19 Stock yard distribution sketch;
DRAWING NO. 20 Waste (slag) yard layout of Wanhe Protection Area;
DRAWING NO. 21 Waste (slag) yard layout of Yanxi Protection Area;
DRAWING NO. 22 Waste (slag) yard layout of Yongchang Protection Area;
DRAWING NO. 23 Taihe County Seat Master Plan (19992020);
DRAWING NO. 24 Taihe County Seat Water Supply Plan (19992020);
DRAWING NO. 25�Taihe County Seat Water Drainage Plan (1999�2020);
DRAWING NO. 26�Taihe County Seat Environment Protection Plan;
DRAWING NO. 27 Satellite image and biological environment sampling points
layout;
DRAWING NO. 28 Present landuse map of the evaluated area;
DRAWING NO. 29�Jintan old woods and trees and large trees orientation drawing;
DRAWING NO. 30�Huangkeng Pengxia old trees and large trees orientation drawing;
DRAWING NO. 31�Old trees and large trees orientation drawing of Xiabian Village;
DRAWING NO. 32�Old trees and large trees orientation drawing of Shihutang Village;
DRAWING NO. 33�Old trees and large trees orientation drawing of Shangpeng,
Xinzhou;
DRAWING NO. 34�Old trees and large trees orientation drawing of Xiapeng, Xinzhou;
DRAWING NO. 35�Old trees and large trees orientation drawing of Yanxi Village;
DRAWING NO. 36�Old trees and large trees orientation drawing of Jiangjiazhou;
DRAWING NO. 37�Old trees and large trees orientation drawing of Zhangjia and
Laohukeng;
DRAWING NO. 38�Old trees and large trees orientation drawing of Taipan and
Yinxiajiang;
DRAWING NO. 39�Fishway Layout;

Table of Contents
DRAWING NO. 40�Fishway construction drawing;
DRAWING NO.41: Waste water treatment station layout;
DRAWING NO. 42�General layout of soil and water conservation measures;
DRAWING NO. 43�Soil and water conservation monitoring points layout.

1.0 General
9
1.0 GENERAL
1.1 Background of the EIA Task The Kan River flows through the whole Jiangxi province from south to north and is the largest river in Jiangxi except the Yangtze River, its basin is situated at the south bank of middle and lower reaches of the Yangtze River. The Kan River upstream Ganzhou City is called Gongshui River, after Zhang River affluxes in Ganzhou City, it is called the Kan River. It originates from the Wuyishan Mountain area, a common boundary of Jiangxi and Fujian, its headstream (main tributary) is near Shiliaodong, Shicheng County, flowing through Ganzhou, Ji’an, Zhangshu, Nanchang and Jiujiang from south to north, flowing into the Poyang Lake at Wucheng Township, Yongxiu County of Jiujiang City, then joining into the Yangtze River via the Xingziyu Lake intake. The drainage area of the Kan River upstream the Waizhou Hydrologic Station is 80948km2, the catchment area controlled by the dam site of the Shihutang Shipping and Hydropower Pivotal Project (hereinafter referred to as the Project) is 43770km2. The Kan River from Heyuan to Wucheng is 780km long in total.
In 1982, Jiangxi province established the Kan River Drainage Area Planning Commission, which is responsible for comprehensive planning work of the Kan River, submitting the Jiangxi Kan River Drainage Area Planning Report in June 1986. The Ministry of Water Conservancy organized experts to have reviewed the Jiangxi Kan River Drainage Area Planning Report in December 1989. The former State Planning Commission issued a document No. [1990]1452—“Approval of the Review Comments on the Jiangxi Kan River Drainage Area Planning Report in October 1990, agreed at the review comments of the review commission of the Jiangxi Kan River Drainage Area Planning Report in principle.
The approved Jiangxi Kan River Drainage Area Planning Report recommends two trunk stream cascade development plans I and V through analysis on antiflood, hydropower generation, shipping, water resource application, construction condition, investment, cost and benefit etc. Plan I is an eight-step development plan (Xiashan High Elevation Plan), from upstream to downstream is Xiashan, Maodian, Wanan, Taihe, Shihutang, Xiajiang, Yongtai and Longtoushan. Plan V is a ten-step development plan (Xiashan Low Elevation Plan), from upstream to downstream is Bai’e, Baikoutang, Xiashan, Maodian, Wanan, Taihe, Shihutang, Xiajiang, Yongtai and Longtoushan. The two plans are the same just at the river section downstream Ganzhou, i.e. six steps of Wanan, Taihe, Shihutang, Xiajiang, Yongtai and Longtoushan are arranged. The planned preliminarily selected projects that will be implemented in the near future are the three steps of Taihe, Shihutang and Xiajiang.
The Kan River is the main tributary at the middle reaches of the Yangtze River, flowing through the whole Jiangxi province from south to north, and it is one of the key passages for shipping of Jiangxi province and has been listed into the state high-rank waterway network and is an important part of the state comprehensive transport system with a very important position.
As per the “Approval of Technical Grade of Inland River Waterway” (Document No. [1998]659) issued by the Ministry of Communications, the Ministry of Water Conservancy and the State Trade and Economic Relation Commission in 1998, the 525km long section of the Kan River (Ganzhou to Wucheng) is graded as Grade III inland river waterway.
As per the Jiangxi Inland River Shipping Development Plan, which passed the review of the Jiangxi Provincial People’s Government in February 2006, and through comprehensive cascade development of the Kan River trunk stream water resources and necessary waterway regulating measures, the 450km long waterway of the Kan River trunk stream from Ganzhou to Nanchang will reach Grade III waterway standard and the 156km from Nanchang to Hukou Grade II waterway standard before 2020.

1.0 General
10
The Project is a comprehensive application project mainly featured as shipping one and compromised to generate hydropower and to control flood and it is an important part of the Kan River water transport main passage construction and is also an important part of the comprehensive water resource control and cascade development of the middle and lower reaches of the Kan River. The project geographical location is shown in DRAWING NO.01.
According to the regulations of Environment Impact Assessment Law of PRC and Rules of Environment Protection Management of Construction Projects, to lessen and prevent and treat adverse impacts on environment during construction and operation of construction project, and to practically coordinate the relations among economic growth, social progress and environment protection, the Navigational Affairs Administration of Jiangxi Provincial Communication Bureau (hereinafter referred to as NAA) authorized CCCC Second Harbor Consultants Co., Ltd.(hereinafter referred to as SHCC) to undertake the environment impact assessment (EIA) work of the Project. (For Letter of Entrustment, see APPENDIX 1).
After the EIA of the Project is reviewed and approved, it can be used as the basis of engineering design, construction, environment management and monitoring during construction and operation.
1.2 EIA Purposes The Project will cause impacts on the environment of the dam site and inundated area to a certain extent. The environment impact assessment of the project is to be carried out in order to understand and master the environment situation before construction and to forecast the environment impacts by the construction of the project through project pollution analysis and to put forward feasible measures for pollution prevention and treatment and impact lessening and to give out basis for project decision and to supervise environment protection design and environment management of the project and to achieve economic, social and environment benefits at the same time.
More specifically, the purposes of the EIA are:
(1). To improve the decision-making process by introducing environmental criteria and assessment to design engineers and decision makers and to ensure the Project is environmentally sound and sustainable; (2). To ensure adverse environmental impacts be identified and evaluated in the earlier stage of the Project development so as to develop appropriate measures to avoid, mitigate, reduce or otherwise minimize the adverse impacts to acceptable levels; (3). To develop measures of compensation for the impacts which could not be avoided or mitigated; and; (4). To provide a basis for Project executing agency and relevant government agencies to develop and implement plans for environmental management and monitoring.
1.3 EIA Preparation Basis
1.3.1 Laws, regulations and rules concerning EIA of construction project
�Environmental Protection Law of PRC�1989.12��
�Environment Impact Assessment Law of PRC�2002.10��

1.0 General
11
�Water Pollution Prevention Law of PRC�1996.5��
�Air Pollution Prevention Law of PRC�2000.4��
�Noise Pollution Prevention Law of PRC�1996.10��
�Solid Waste Pollution Prevention Law of PRC�2005.3��
�Land Management Law of PRC�Rev. 1998��
�Wild Animals Protection Law of PRC�1988.11��
�Water and Soil Conservation Law of PRC�1991.6��
�Forestry Law of PRC�Rev.1998��
�Water Law of PRC�Rev. 2002.10��
�Flood Control Law of PRC�
�Cultural Relic Protection Law of PRC�2002.11��
�Law on Safety in Production of PRC�2002.6��
�Fishery Law of PRC�2000.10��
�Infectious Disease Prevention and Curing Law of PRC�1989.2��
�Rules of Environmental Protection Management for Construction Projects ( the State
Council Order No. 253 of PRC);
�Basic Farmland Protection Rules ( the State Council Order No. 257 of PRC in 1998);
�Nature Reserve Ordinance of PRC �the State Council Order No.167, 1994.10.09��
�Decision on Several Issues Concerning Environment Protection �Doc.
No.[1996]31��
(21)National Ecological Environment Protection Outlines�Doc. of the State Council
[2000]38��
(22)Implementation Regulations of Law on the Prevention and Control of Water
Pollution of PRC �the State Council Order No.[2000]284��
(23) Pollution Prevention and Treatment Management Rules of Drinking Water Source
Protection Zone issued by the SEPA, the Ministry of Health, the Ministry of Construction, the
Ministry of Water Conservancy and the Ministry of Geology and Minerals on July 10, 1989;
(24) Directory of Systematic Management of Environment Protection for Construction
Projects Order No.14 of State Environment Protection Administration SEPA
(25) Notice on Enhancing Ecological Protection of Everglade issued by the SEPA, March

1.0 General
12
31, 1994;
(26) Notice about strengthening Ecological Environment Management of Natural
Resource Development ProjectsSEPA,1994.12
(27) Management Regulations on Sanitation at Public Places 1987.4
(28)Implementation Regulation of Infectious Disease Prevention and Curing Law of PRC1991.12
(29) Implementation Regulations of Cultural Relic Protection Law of PRC 1992.5
(30)Water and Soil Conservation Scheme Management Methods of Construction Projects1994.11
(31) Wild Plants Protection Ordinance of PRC1997.1
(32) Implementation Regulations of Aquatic Wild Animals Protection of PRC 1993.10
(33) Terrestrial Wild Animals Protection Implementation Ordinance of PRC (1992.2)
(34) Directory of State Specially Protected Wild Animals ;
(35 Directory of State Specially Protected Wild Plants (1999.9) ;
(36)Safety Management Ordinance of Hazardous Chemicals 2002.3.15
(37) Notice on Orderly Developing Small Hydropower Projects and Practically Protecting Ecological Environment (SEPA,
State Development and Reform Commission SDRC Doc. No. [2006]93��
(38) Letter on Printing and Distributing “Minutes of Water Environment and Aquatic
Ecology Protection Technology and Policy Symposium of Hydropower and Water
Conservancy Construction Project Doc.No.[2006].11�
(39) Letter on Printing and Distributing “Technical Guidelines (trial implementation) of
EIA of Riverway Ecological Water Consumption, Low Temperature Water and Fishway of
Hydropower and Water Conservancy Construction Project Doc.No.[2006].4
(40) Notice on Strengthening EIA Management to Prevent Environment Risks (SEPA Doc. No.
[2005]152)�
(41) Notice on Printing and Distributing “Interim Procedures of EIA Public Poll” by
SEPA�2006.2.14��
(42) Notice of the SEPA and State Development and Reform Commission on Enhancing Environment
Protection Work of Hydropower Construction (Doc. No. [2005]13)
(43) Notice of the Ministry of Realm and Resources on Seriously Implementing “Basic Farmland Protection
Rules and Further Well Doing Basic Farmland Protection Work (Doc. No. [1999]122)

1.0 General
13
(44) Notice to Strengthen the Environmental Impact Assessment Management of Construction
Projects Financed by International Financial Organizations, jointly issued by SEPA, the Ministry of
Health, the Ministry of Construction, the Ministry of Water Conservancy and the People’s Bank
of China;
(45)Interim Management Methods for Imposition and application of Forestry Vegetation
Resumption Fee (Document No.[2003]73 of the Ministry of Finance and State Forestry
Administration, 2003.11)�
(46)�Implementation Regulation of Management Regulations on Sanitation at Public
Places�the Ministry of Health,1991.3��
(47)Environment Management Regulation of Preventing and Treating Inland River
Pollution by Ships;
(48) Measures Concerning Environmental Protection and Management for Transportation
Construction Projects, issued by MOC in 2003;
(49)Notice on Carrying out Environment Supervision Work of Communications Projects (Document No. of the Ministry of
Communication MOC [2004]314);
(50) Yangtze Fishery Resources Management Regulations�2004.7��
(51)Jiangxi Environment Pollution Prevention and Treatment Ordinance2001.3.1
(52)Jiangxi Drinking Water Source Pollution Prevention and Treatment
Method�2006.8.1��
(53)Jiangxi Old and Famous Trees Protection Ordinance�2004.11.26��
(54)Implementation Regulation of Jiangxi Basic Farmland Protection�
(55) Directory of Jiangxi Specially Protected Wild Plants (the first lot)[1995]30;
(56) Proposed Methods of Jiangxi Woodland Protection and Management
(Revision)�1998.2.10��
(57)Directory of Jiangxi Specially Protected Wild Plants (the first lot)�1994.10�
1.3.2 World Bank Requirements
The World Bank requirements include primarily the Bank’s ten safeguard policies, including Operational Policies (OP), Best Procedure (BP), Good Practice (GP) and Operational Directives (OD). These safeguard policies are:

1.0 General
14
Environmental Assessment (OP/BP/GP4.01); Forestry (OP/GP4.36); Natural Habitats (OP/BP4.04); Safety of Dams (OP/BP4.37); Pest Management (OP4.09); Involuntary Resettlement (OP4.12); Indigenous People (OD4.20); Cultural Property (OP4.11); Projects in Disputed Areas (OP/BP/GP7.60); and Projects on International Waterways (OP/BP/GP7.50).
Among these safeguards policies, Environmental Assessment (OP4.01) is the primary requirements and thus will be fully applied in this report and other EA documentation. In addition, other safeguard policies will first be screened during the EA and fully applied if triggered by the screening. Safety of Dams (OP/BP4.37), Natural Habitats (OP/BP4.04), Pest Management (OP4.09) and Forestry (OP/GP4.36) will be applied in this Report too. Involuntary Resettlement (OP4.12) and Cultural Property (OP4.11) will be applied in by two separate teams, but the major findings and subsequent assessment will be included in the EIA process and the EIA reports.
Since there are no project components that involve international waterways (OP/BP/GP7.50), indigenous people (OD4.20) or disputed areas ( OP/BP/GP7.60), policies related to these subjects will not be applied in the EIA.
1.3.3 EIA technical documents
�. Environment Impact Assessment Technical Guide Rules (HJ/T2.1�2.3-93)��. Environment Impact Assessment Technical Guide Rules for Water Conservancy and Hydropower Project�HJ/T88-2003�� �. Environment Impact Assessment Technical Guide Rules for Acoustic Environment (HJ/T2.4-1995)��. Environment Impact Assessment Technical Guide Rules for Non-pollution Ecological Impacts (HJ/T19-1997)��. Environment Impact Assessment Code for Inland River Shipping Construction Project (JTJ227-2001)��. Integrated Treatment Code for Water and Soil Conservation (GB/T16543.1�16543.6-1996)��. Technical Specification for Water and Soil Conservation Plan of Construction Project
(SL204-98);
[8]. Technical Guide Rules for Environment Risks Assessment of Construction Project
(HJ/T169-2004).

1.0 General
15
1.3.4 Related plans, documents and design documents
�Jiangxi Kan River Drainage Area Planning Report (Jiangxi Kan River Drainage Area
Planning Commission)�
�Jiangxi Inland River Shipping Development Plan (Jiangxi Provincial Communications
Bureau);
� EIA of Jiangxi Inland River Shipping Development Plan (Jiangxi Provincial
Communications Bureau);
�Taihe County Seat Master Plan of Jiangxi Province (1999 2020) (Taihe County
People’s Government of Jiangxi Province);
�Statistical Yearbook of Taihe County 2005;
�Feasibility Study Report of the Project (Communications Survey and Design Institute
of Sichuan Provincial Communications Bureau);
� Letter of Entrustment for EIA work for the Jiangxi Shihutang Shipping and
Hydropower Pivotal Project at the Kan River to CCCC Second Harbor Consultants Co., Ltd.
issued by the Navigational Affairs Administration of Jiangxi Provincial Communications
Bureau (See APPENDIX 1);
�Special Report on Impacts of the Project on Old and Famous Trees and Specially
Protected Wild Plants (Forestry Institute of Jiangxi Agriculture University (Garden and Park
Design and Research Institute Co. Ltd. of Jiangxi Agriculture University);
�Cultural Relics Investigation Report of the Project (Jiangxi Cultural Relics
Archaeological Exploitation Institute) ;
�Navigation Demonstration Report of the Project (Jiangxi Harbor Engineering
Investigation and Design Institute;
�Assessment Report of Mineral Resources Buried by the Construction Land of the
Project (Jiangxi Geological and Mineral Exploitation Development Bureau);
�Geological Hazard Risk Assessment Report of the Project (Jiangxi Tianjiu Geological
and Mineral Construction Institute);
�Flood Control Assessment Report of the Project (Jiangxi Provincial Water Resources
Planning and Design Institute);

1.0 General
16
�Water Resources Demonstration Report of the Project (Jiangxi Provincial Water
Resources Planning and Design Institute);
�Resettlement Action Plan (RAP) of the Project (Jiangxi Provincial Water Resources
Planning and Design Institute);
�Water and Soil Conservation Plan of the Project (Jiangxi Provincial Water Resources
Planning and Design Institute);
�Cultural Relics Survey Report of the Project (Jiangxi Provincial Cultural Relics
Archaeological Research Institute;
�Approval of State Development and Reform Commission on the Project Proposal
(SDRC Doc.No. 2007 717;
� Comments about Proposal of the Jiangxi Shihutang Shipping and Hydropower Pivotal
Project at the Kan River (Doc. No.2006 421);
(20) Land Application General Plan Modification Scheme of Taihe County Affected by the Jiangxi Shihutang
Shipping and Hydropower Pivotal Project at the Kan River;
(21) Jiangxi Province Surface Water (Environment) Functional Zoning (Jiangxi Provincial Water Conservancy Bureau and
Jiangxi Provincial Environment Protection Bureau 2006.7.
1.4 EIA Standards
As per Jiangxi Provincial Environment Protection Bureau’s Document No. [2007]213: “Approval for the implementation standards for the environment impact assessment of the Jiangxi Shihutang Shipping and Hydropower Pivotal Project at the Kan River”, the following standards will be applied in the EIA.
1.4.1 Water environment
� Category II of Surface Water Quality Standard (GB3838-2002) will be based for water environment baseline and impact assessment for the water area of Gouzinao Water Intake and its water source reserve and Nanmenzhou Water Intake and its water source reserve. Category III of Surface Water Quality Standard (GB3838-2002) will be based for water environment baseline and impact assessment for the other water areas. (See Table 1.4-1).

1.0 General
17
Table 1.4-1 Surface Water Quality Standard (GB3838-2002) Unit�mg/L(except pH)
No Item Category � Category �
1 PH 6 92 NH3-N �0.5 �1.0 3 DO �6 �5
4Potassium permanganate
index �4 �6
5 BOD5 �3 �4 6 Oils �0.05 �0.05 7 Total P �0.1 lake, reservoir 0.025 �0.2 lake, reservoir 0.058 Total N �0.5 �1.0 9 Volatile phenol �0.002 �0.005 10 Coliform (pcs/L) �2000 �10000 11 Hg �0.00005 �0.0001 12 Cr+6 �0.05 �0.05
� Wastewater discharge will be evaluated by Class I in Integrated Wastewater discharge Standard
(GB8978-1996) (Table 1.4-2). Productive and domestic waste water is strictly prohibited to drain into
drinking water source protected river sections.
Reservoir area water environment function zoning is shown in DRAWING NO.02.
Table 1.4 2 Integrated Wastewater Discharge Standard (GB8978-96) Unit: mg/L
No Pollutant Scope of application Grade 1
1 SS Other drainage firms 70 2 COD Other drainage firms 100
3 BOD5 Other drainage firms 20
4 Oils All drainage firms 5 5 NH3-N Other drainage firms 15 6 Phosphate ( as P) All drainage firms 0.5
1.4.2 Ambient air
� Class II of the Ambient Air Quality Standard (GB3095-1996) will be applied for ambient air baseline and impact assessment (See Table 1.4-3).
� Emissions of air pollutants are evaluated using Class II standard in Integrated Emission
Standard of Air Pollutants (GB6297-1996) (see Table 1.4-4).

1.0 General
18
Table 1.4-3 Ambient Air Quality Standard (GB3095-1996) Unit (mg/m3)Item SO2 NO2 TSP
Daily average 0.15 0.12 0.30 Class II
Hourly average 0.50 0.24 /
Table 1.4-4 Class II of the Integrated Emission Standard of Air Pollutants (GB16297-1996)
Max. Discharge Speed (kg/h) Pollutant
Max. Concentration
allowable (mg/m3)
Height of chimney(m) Class II
Limit for diffused discharge (mg/m3)
15 3.5
20 5.9 TSP 120
30 23
Max. Concentration in ambient air 1.0
1.4.3 Acoustic environment
� With reference to the Standard of Environmental Noise of Urban Area (GB3096-93),
Category IV will be applied for the scope 50m at both sides of the waterway section where towns are
situated, Category II for the scope beyond 50m; Category IV will be applied for the scope 35m at both
sides of the waterway section where villages are situated, Category I for the scope beyond 35m;
Category II will be applied for outside of sensitive buildings as schools, hospitals (sanatorium and homes for the aged) within the evaluated area; Category IV of Noise Standard of Boundary of
Industrial Enterprise (GB12348 90) will be applied for boundary of firms within the EIA scope of
the project: 70dB(A) at day and 55dB(A) at night. Standard of Environmental Noise of Urban Area
are detailed in Table 1.4 5.
Table 1.4 5 Standard of Environmental Noise of Urban AreaGB3096-93 Unit dB(A)
Standard values Category
Daytime Nighttime
Category I 55 45
Category II 60 50
Category III 65 55
Category IV 70 55
� Noise Limits for Construction Site (GB12523-90) will be applied in the assessment for construction phase noise impacts (Table 1.4-6).

1.0 General
19
Table 1.4-6 Noise Limits for Construction Site (GB12523-90) Unit dB(A) Noise limit Construction stage Major source of noise
Daytime
Earth & stone work Bulldozer, excavator, loader, etc. 75 Earth & stone work
Piling Pile driver, etc. 85 Piling
Structuring Concrete mixer, etc. 70 Structuring
Fitment Hoist, elevator etc. 65 Fitment
1.5 EIA Class
Based on the project characteristics and the environment features of the project area, and based on the requirements in the Technical Guidelines for Environmental Impacts Assessment, the classification of EIA for the project is described as follows:
Table 1.5-1 EIA Classification Description Class Basis
Acoustic environmentClass III
Based on HJ/2.4-1995, the noise level is expected to increase by 3-5 dB(A) when the project is completed. This project falls into a large & medium size project. As per the sensitivity grade of the project, the EIA is based on Class I.
Ambient air Class III Based on HJ/12.2-93, emission volume Pi<2.5X10⁹
Ecological environment
Class II Based on HJ/T19-1997, the affected area>50 km2, biomass reduced by<50%, bio-diversity reduced by <50%.
Water environment Class II Based on HJ/T2.3-93, for wastewater discharge <1000 m3/d, the large, medium and small rivers will follow the Class I_IV surface water standard respectively.
1.6 Scope and Period of Assessment
1.6.1 Scope of assessment
Based on the requirements of the Technical Specifications for EIA of Inland River Shipping Construction Project and the actual situation of the site surveys of the project, the scope of assessment is determined to be:
� Social Environment the area directly affected by the project; � Ecological Environment about 38km channel of the inundated area and within 33km downward the dam (Shengkong section of Shengang Mountain, Ji’an City), 3.0km beyond fending groyne line of the protection area, the assessment scope will be properly extended as per the distribution of the borrow sites, spoil sites, nature reserve and species to be protected; � Water environment: about 38km long inundated area and ithin 33km downward the dam (Shengkong section of Shengang Mountain, Ji’an City), altogether 71km Kan River section; � Acoustic environment and ambient air: within 200m beyond fending groyne line of the protection area and 200m at both sides of construction road, 500m beyond the dam site plant

1.0 General
20
area, 500m beyond borrow sites, spoil sites and construction points, the assessment scope will be properly extended as per the distribution of the environment protection objectives ;
1.6.2 Assessment level year
The environment situation assessment level year of this project is 2006, the prediction level year during construction period is construction peak year, and the prediction level year during operation period is 3~5 years and 2020 after operation.
1.7 Environment Protection Objectives
1.7.1 Protection objectives of acoustic environment and ambient air
Protection objectives of acoustic environment and ambient air include the residents’ places of Shihutang Village, Sangyuan Primary School, Jiangjiazhou Village, Lingbei Village, Xiayinxia Village at the left and right banks of the recommended dam site. In addition, odd residents’ places distributed within 200m at both sides of construction road, and within 200m at both sides of fending groyne line and drainage pumping station are listed as environment protection objectives. Details are shown in Table 1.7-1, Table 1.7-2 and DRAWING NO.03.
Table 1.7 1 Main protection objectives of acoustic environment & ambient air
No Objective Location and distance Feature
1Shihutang Village
~400m downstream of right bank of recommended dam site
~100 households�350 people
2Sangyuan Primary School
~500m downstream of right bank of recommended dam site
~200 students,10 teachers
3Jiangjiazhou Village
~450m upstream of right bank of recommended dam site and ~150m away from ship lock
~110 households, 385 people
4Lingbei Village
~500m at left bank of recommended dam site ~50 households,175 people
5Xiayinxia Village
~500m downstream at left bank of recommended dam site
~40 households, 155 people

1.0 General
21
Lingbei Village at the left bank of the recommended dam site
Shihutang Village at the right bank of Sangyuan Primary School at the right the recommended dam site bank of the recommended dam site
1.7.2 Water environment protection objectives
Water environment protection objectives are Gouzinao Water Intake & its water source reserve and Nanmenzhou Water Intake & its water source reserve. In addition, Shangtian Water Intake & its water source reserve planned for long-run construction listed as environment protection objectives. There are existing water intakes and water intakes to be built within 33km downstream of the recommended dam site (river section upstram of Ji’an City area) as Jinggangshan Power Plant Phase I, Jinggangshan Power Plant Phase II, Wuyueguan Water Plant, Ji’an City No.2 Water Plant, Ji’an City No.1 Water Plant, Pharmaceutical Plant water source, Ji’an City Hedong Water Plant etc. Water environment protection objectives are given in Table 1.7-3 and Drawing No.1.7-1 and DRAWING NO.03.

1.0 General
22
Table 1.7 2 Protection objectives of acoustic environment and ambient air
No Objective Location and distance Features
1 Sangyuan Village ~100m to the road to be used for construction
~20 households�80 people
2 Duxia Village ~50m to the road to be used for construction
~15 households�60 people
3 Kou’an Village 60m to the road to be used for construction
~20 households�80 people
4 Xiehouling 100m to the road to be used for construction
~20 households�80 people
5 Xiabian Village ~150m to the fending groyne line & road to be used for construction
~40 households�160 people
6 Yinxiajiang ~150m to the fending groyne line & road to be used for construction
~40 households�160 people
7 Maqian Village ~80m to the fending groyne line & road to be used for construction
~15 households�60 people
8 Pingshang Village ~20m to the fending groyne line & road to be used for construction
~50 households�200 people
9 Gaozhang Village ~50m to the fending groyne line & road to be used for construction
~10 households�40 people
10 Dunshang Village ~70m to the fending groyne line & road to be used for construction
~15 households�60 people
11 Zhang Jia ~150m to the fending groyne line & road to be used for construction
~40 households�160 people
12 Huwei ~100m to the fending groyne line & road to be used for construction
~20 households�80 people
13 Zengjia ~70m to the fending groyne line & road to be used for construction
~25 households�100 people
14 Zhushan ~150m to the fending groyne line & road to be used for construction
~50 households�200 people
15 Mazhou city ~160m to the fending groyne line & road to be used for construction
~60 households�240 people
16 Maozhou ~80m to the fending groyne line & road to be used for construction
~15 households�60 people
17 Jingouwan ~60m to the fending groyne line & road to be used for construction
~20 households�80 people
18 Yaoxi ~40m to the fending groyne line & road to be used for construction
~10 households�40 people
19 Xiamu ~80m to the fending groyne line & road to be used for construction
~25 households�100 people
20 Fenglin Village ~100m to the fending groyne line & road to be used for construction
~15 households�60 people
21 Dengjia ~120m to the fending groyne line & road to be used for construction
~50 households�200 people
22 Shangyinxia ~50m to the fending groyne line & road to be used for construction
~30 households�120 people

1.0 General
23
No Objective Location and distance Features
23 Tongluobei ~40m to the fending groyne line & road to be used for construction
~50 households�200 people
24 Heshupeng ~180m to the fending groyne line & road to be used for construction
~60 households�240 people
25 Heshuxia ~150m to the fending groyne line & road to be used for construction
~40 households�160 people
26 Caoping ~30m to the fending groyne line & road to be used for construction
~80 households�320 people
27 Guibang ~60m to the fending groyne line & road to be used for construction
~20 households�80 people
28 Huangkengpengxia~50m to the fending groyne line & road to be used for construction
~15 households�60 people
29 Xiaojia ~50m to the fending groyne line & road to be used for construction
~20 households�80 people
30 Xinju ~30m to the fending groyne line & road to be used for construction
~40 households�160 people
31 Kangjia Lake ~40m to the fending groyne line & road to be used for construction
~20 households�80 people
32 Jiangqian Village ~80m to the fending groyne line & road to be used for construction
~30 households�120 people
33 Shanjia ~100m to the fending groyne line & road to be used for construction
~15 households�60 people
34 Zengjiapengxia ~60m to the fending groyne line & road to be used for construction
~40 households�160 people
35 Nanmenzhou ~100m to the fending groyne line & road to be used for construction
~30 households�120 people
36 Duwu Village ~100m to the fending groyne line & road to be used for construction
~20 households�80 people
37 Yutai Village ~150m to the fending groyne line & road to be used for construction
~15 households�60 people
38 Zhouwei ~100m to the fending groyne line & road to be used for construction
~40 households�160 people
39 Nanshanxia ~150m to the fending groyne line & road to be used for construction
~50 households�200 people

1.0 General
24
Table 1.7 3 Protection objectives of water environment
No Protection objectives
Water usage
Water intake flow �×104t/d�
Water flow converted�m3/s� Location and distance
1Gouzinao Water Intake
Drinking water
6 0.694 19.04km upstream of the dam, left bank of the Kan River
2Nanmenzhou Water Intake
Drinking water
5 0.579 24.05km upstream of the dam, left bank of the Kan River
3Planned Shangtian Water Intake
Drinking water
4 0.463 29.0km upstream of the dam, left bank of the Kan River
4Jinggangshan Power Plant Phase I
Industrial water
179/129 20.7/14.9 21.4km downstream of the dam, right bank of the Kan River
5Jinggangshan Power Plant Phase II
Industrial water
6.07/5.49 0.702/0.636 21.5km downstream of the dam, right bank of the Kan River
6Wuyueguan Water Plant to be built
Drinking water
5 0.579 27.0km downstream of the dam, left bank of the Kan River
7Ji’an City No.2 Water Plant
Drinking water
10 1.157 28.5km downstream of the dam, left bank of the Kan River
8Ji’an City No.1 Water Plant
Drinking water
4.0 0.463 30.0km downstream of the dam, left bank of the Kan River
9Pharmaceutical Plant water source
Industrial water
2 0.231 32.5km downstream of the dam, left bank of the Kan River
10 Ji’an City Hedong Water Plant
Drinking water
2.0 0.231 33.0km downstream of the dam, right bank of the Kan River
Gouzinao Water Intake Nanmenzhou Water Intake

1.0 General
25
Drawing No1.7 1 Water environment protection objectives at downstream of recommended dam site
Dam site
Hedong Water Plant
Phamaceutical Plant Water Work
No.1 water Plant
No.2 water plant
Wuyueguan water plant
Jinggangshan power plant water
1.0 General
26
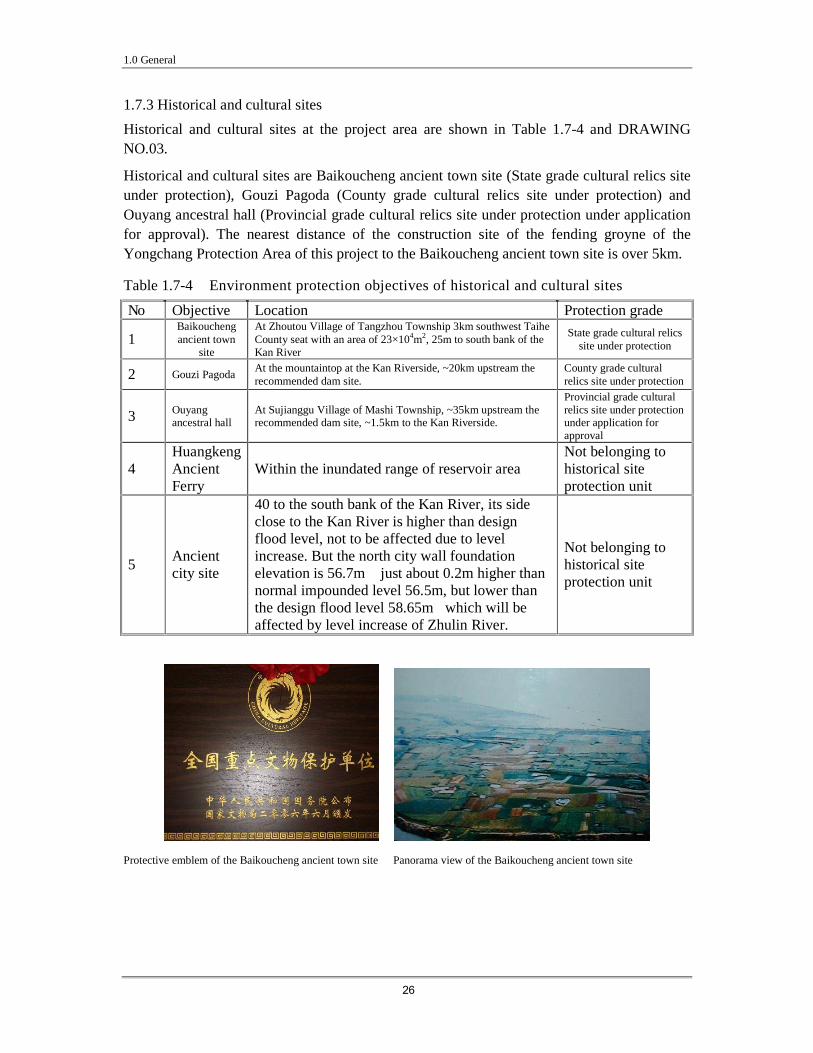
1.7.3 Historical and cultural sites
Historical and cultural sites at the project area are shown in Table 1.7-4 and DRAWING NO.03.
Historical and cultural sites are Baikoucheng ancient town site (State grade cultural relics site under protection), Gouzi Pagoda (County grade cultural relics site under protection) and Ouyang ancestral hall (Provincial grade cultural relics site under protection under application for approval). The nearest distance of the construction site of the fending groyne of the Yongchang Protection Area of this project to the Baikoucheng ancient town site is over 5km.
Table 1.7-4 Environment protection objectives of historical and cultural sites
No Objective Location Protection grade
1Baikoucheng ancient town
site
At Zhoutou Village of Tangzhou Township 3km southwest Taihe County seat with an area of 23×104m2, 25m to south bank of the Kan River
State grade cultural relics site under protection
2 Gouzi Pagoda At the mountaintop at the Kan Riverside, ~20km upstream the recommended dam site.
County grade cultural relics site under protection
3 Ouyang ancestral hall
At Sujianggu Village of Mashi Township, ~35km upstream the recommended dam site, ~1.5km to the Kan Riverside.
Provincial grade cultural relics site under protection under application for approval
4Huangkeng Ancient Ferry
Within the inundated range of reservoir area Not belonging to historical site protection unit
5Ancient city site
40 to the south bank of the Kan River, its side close to the Kan River is higher than design flood level, not to be affected due to level increase. But the north city wall foundation elevation is 56.7m� just about 0.2m higher than normal impounded level 56.5m, but lower than the design flood level 58.65m�which will be affected by level increase of Zhulin River.
Not belonging to historical site protection unit
Protective emblem of the Baikoucheng ancient town site Panorama view of the Baikoucheng ancient town site

1.0 General
27
Gouzinao Pagoda (County grade cultural relics site under protection) Ouyang ancestral hall (Provincial grade cultural relics site under protection
under application for approval)
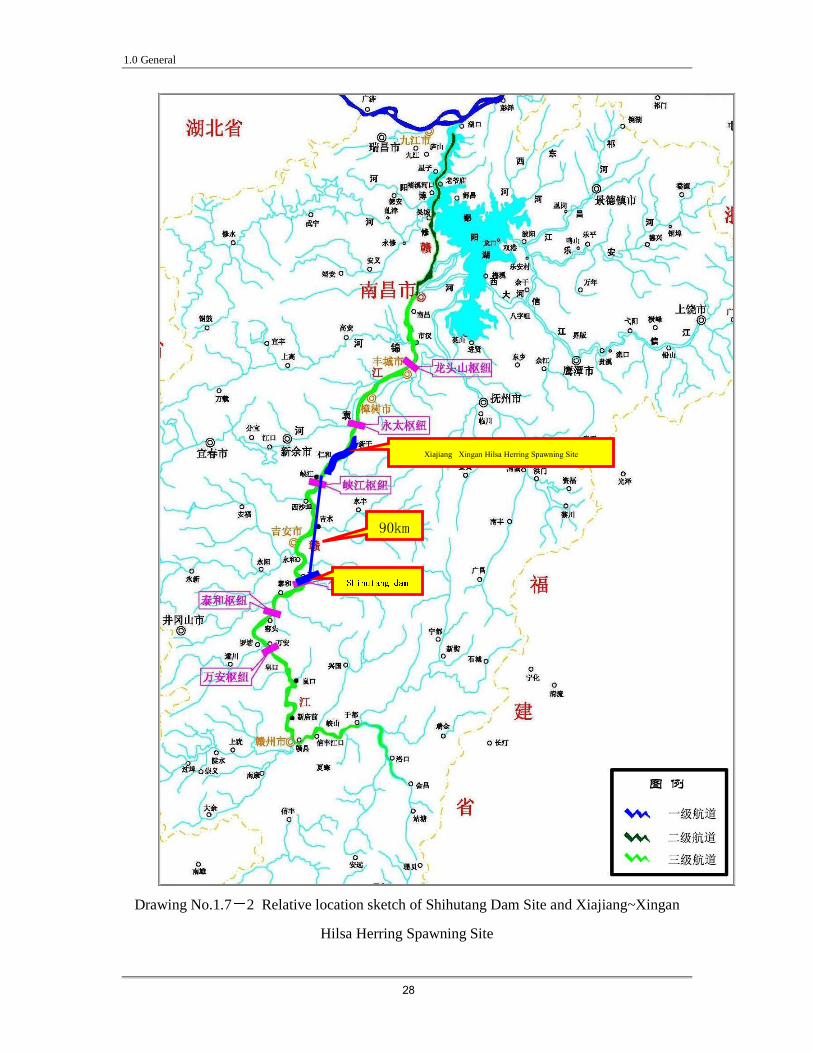
1.7.4 Protection objectives of ecological environment
Protection objectives of ecological environment are given in Table 1.75, Drawing No.1.7 2 and DRAWING NO.04.
Table 1.7 5 Protection objectives of ecological environment
No Objective Briefing Protection grade
1
County grade nature reserve – Zhujia Village Camphor Woods, Tangzhou Township
At the Kan Riverside at Zhujia Village of Tangzhou Township, with an area of 330Mu and an old camphor woods of about 200 camphor trees and over 30 species of wild plants.
County grade nature reserve
2 Old camphor trees etc.
Old trees at the dam site and surrounding of the reservoir area and 200m at both sides of fending groyne line, mainly distributed at the Jintan Old Woods and scattered at Huanghangpengxia, Xinzhou, Shihutang, Jiangjiazhou, Xiabian Village, Yinxiajiang, Taipan, Zhangjia, Laohukeng, Yanxi Village etc.
County grade (all the old trees within the assessment area belong to Grade 3 authenticated on site by experts organized by Greening Commission of Jiangxi Provincial Forestry Bureau).
3 Baijiaxia Spawning Site
At the reservoir area of upper step pivotal project to be built, ~40km to the dam site of this project.
4 Taihe Spawning Site At the reservoir area of this project, 2.1km long, 118hm2, ~21.4km to the dam site, main spawning fishes are grass carp, snail carp, silver xenocypris, bream fish and carp.
5 Yanxidu Spawning Site At the reservoir area of this project, 2.3km long, 126hm2, ~13.9km to the dam site and main spawning fishes are grass carp, snail carp, silver xenocypris, and carp.
6Xiajiang�Xingan Hilsa Herring Spawning Site
~30km long, located at ~90km~120km downstream of the Shihutang dam, the main spawning fish is hilsa herring, its spawning time is between June and July each year.
7 Basic farmland This project needs to permanently occupy 2829.8Mu farmland
(including 701.85Mu paddy field, 2127.9Mu dry land�, among which 198.27Mu is basic farmland.
1.0 General
28
Drawing No.1.7 2 Relative location sketch of Shihutang Dam Site and Xiajiang~Xingan
Hilsa Herring Spawning Site
Xiajiang�Xingan Hilsa Herring Spawning Site
6KLKXWDQJ�GDP�
��NP�

1.0 General
29
� County grade nature reserve of Zhujia Village of Tangzhou Township (Jintan Old Woods)
This county grade nature reserve is at the Kan Riverside at Zhujia Village of Tangzhou Township, with an area of 330Mu including 225Mu core area and 105Mu buffer area, the main protection objectives are the old camphor trees. In July 2002, Taihe County People’s Government issued a document No. [2002]106 “Official Reply on Agreeing to List Camphor Woods of Zhujia Village of Tangzhou Township as Nature Reserve, approved to set a nature reserve. The nature reserve plan is shown in DRAWING NO. 05.
The fending groyne line of the Yongchang Protection Area in the engineering design goes through the core area and buffer area of the nature reserve.
� Old trees (camphor tree, cedar, sabina chinensis, bitter oak etc.)
Besides the county grade nature reserve of Zhujia Village of Tangzhou Township there are old and large trees scattered at the dam site, surrounding of the reservoir area and 200m at both sides of the fending groyne line. The site survey result shows that old and large trees are scattered at Huanghangpengxia, Xinzhou, Shihutang, Jiangjiazhou, Xiabian Village, Yinxiajiang, Taipan, Zhangjia, Laohukeng, and Yanxi Village etc.
All the old trees within the assessment area belong to Grade 3 protected ones authenticated on site by experts organized by Greening Commission of Jiangxi Provincial Forestry Bureau.
�Through site survey, no famous trees or state grade protected wild plants are found within the project area; There are 11 species of provincial grade protected plants within the project area as podocarpus macrophyllus, sweet osmanthus, camellia, coptis, horned holly, iron-colored holly, Chongyang tree, gentian, yellow sandalwood, soupberry and lucid asparagus.
�Through site survey, no state grade protected wild animals are found within the project area; There are 20 species of provincial grade protected animals within the project area, including 4 species of amphibians, 3 species of reptiles, 12 species of birds and 1 species of beast.
�There are three spawning sites at Baijiaxia, Taihe and Yanxidu distributed in the Kan River section of the project, the Taihe and Yanxidu spawning sites are located in the reservoir area of the project, which will be affected to variant degrees during construction period.
The protected species of the project are given in Table 1.7 6.

1.0 General
30
Table 1.7 6 Protected species of the Project
Category Sensitive objectives Protection grade &
remarks Bufo gargarizans Provincial grade Rana limnocharis Provincial grade Rananigromaculata Provincial grade
Amphibians
Microhyla ornata Provincial grade Pelodiscus sinensis Provincial grade Gekko japonica Provincial grade Reptiles Zoacys dhumnades Provincial grade Podiceps ruficollis Provincial grade Egretta alba Provincial grade Ardea cinerea Provincial grade Anas platyrhynchos Provincial grade Ring-necked Pheasant Provincial grade Hydrophasianus chirurgus Provincial grade Vanellus cinereus Provincial grade Alcedo atthis Provincial grade Halcyon smyrnensis Provincial grade Hirundo rustica Provincial grade Lanius cristatus Provincial grade
Birds
Lanius schach Provincial grade
Terrestrial animals
Animals Mustela sibirica Provincial grade
Terrestrial plants
Podocarpus macrophyllus, sweet osmanthus, camellia, coptis, horned holly, iron-colored holly, Chongyang
tree, gentian, Yellow sandalwood, soupberry & Lucid asparagus
Provincial grade�Directory of Provincial grade protected plants issued in the Doc. No. [2005]213 of Jiangxi Provincial Forestry Bureau on August 31, 2005�.
1.8 Identification of Environment Impacts and EIA Stresses
1.8.1 Main environment issues caused by the project
1.8.1.1 Environment impacts during construction
� Impacts on water quality and aquatic ecological environment due to dam site excavation, reservoir area cleanup, earthwork excavation, temporary inundation etc.;
� Impacts on water and soil erosion due to soil borrow and spoil;

1.0 General
31
� Impacts of construction garbage and constructors’ domestic garbage on the surrounding
environment and sanitary conditions;
� Impacts of construction machinery noise on local acoustic environment;
� Impacts of domestic sewage discharge from construction ships and constructors on the
surrounding water environment;
� Impacts of construction of construction temporary road and camp buildings on
surrounding environment;
� Impacts on the existing channel traffic;
� Impacts of land acquisition, relocation and resettlement on living quality of affected
people.

1.0 General
32
1.8.1.2 Environment impacts during operation
�Impacts of the project on hydrological conditions (level, flow rate, flow, silt etc.);
� Impacts of inundation on land resource, farmland and terrestrial organism resource;
� Impacts of reservoir area inundation on surrounding terrestrial ecological environment
and agricultural environment;
� Impacts on aquatic ecological environment, habitat, migration, spawning site, living
habit of fishes;
� Impacts on reservoir water quality and eutrophication;
� Impacts of noise, garbage and waste water from ships on the environment;
� Impacts of reservoir area inundation on water supply and drainage facilities and
fending groyne;
�Impacts of the Project on regional socioeconomy;
�Impacts on cultural landscape.
1.8.2 Environment Impact Identification Results
The impacts of the project on environment are involved in several environment factors as ecological environment, environment geology, local climate, hydrological regime (level, flow velocity, flow and silt etc.), water quality, ambient air, acoustic environment, land resource, land acquisition, relocation, resettlement, public health, cultural landscape, socioeconomy and etc. Matrix identification analysis method is applied to identify these key environment impact issues, the environment impact matrix analysis is shown in Table 1.8-1.
1.8.3 Assessment emphases
The assessment emphases are hydrological regime change, ecological environment, water environment, alternatives comparison and selection, social impact, public consultation and pollution prevention and treatment measures, especially impacts on the hydrological regime, the county grade nature reserve of Zhujia Village of Tangzhou Township (Jintan Old Woods), and impacts on the fish spawning sites distributed at the Kan River section of the Project, and impacts on the water quality and fishes of the reservoir area and water quality at intake of Taihe City and related pollution prevention measures.
1.9 EIA Methods
Mode calculation, analogy method, investigation and analysis are applied for environment impact assessment of the project.

1.0 General
33
Table 1.9 1 Environment impact matrix analysis table Natural environment Social environment Time Impact factor
Local clim
ate
hyd
rolo
gy
Silt
Wate
r quality
Water ten
p.
Land p
lants
Land
anim
als
Aq
uatic lives
Am
bien
t air
Acou
stic environ
men
t
Land
applicatio
n
So
il ero
sion
En
vironm
ent
quality
Pow
er
transm
ission
Living qu
ality
An
ti-flood
irriga
tion
Drinkin
g
water
Na
tura
l lan
dsca
pe
Pub
lic health
Econ
omic
developm
ent
Excavation � � � � � � � � � � Traffic � � � � � � � � � � Preparation
period Reservoir bottom cleaning � � � � �
Site construction � � � � � � � Dam construction � � � � � � � � � � � �
Maintenance � � � � � � Constructor � � � � Waste slag � � �
Construction period
Wastewater � � Inundation � � � � � � � � � � � � � � � � �
Reservoir level lowering � � � � � � � � � � �
Drain � � � � � � � � � � Operation
period Power generation � � � �
land acquisition, relocation & resettlement � � � � � � � � � � �
Inundated area � � � � � � � � � � � � � � � � � � � Construction area � � � � � � � � � Resettlement area � � � � � � � � � � � �
Dam downstream area � � � � � � � � �
Affected areas
Reservoir surrounding area � � � � � � � � � � � �
Notes: Blank——basically no impact, �——less impact, �——Serious impact

2.0 Project Overview
34
2.0 PROJECT OVERVIEW
2.1 Geographical Location of the Project
The Project is between the Ji’an City proper and Taihe County seat at the middle reaches of Kan River, the dam site is situated nearby Shihutang Village, 26km downstream the Taihe County Seat Road Bridge. It is a multipurpose project, which takes shipping as the main, gives consideration to power generation and flood control.
The Kan River is the first largest river of the Poyang Lake Water System of the Yangtze River drainage area, at the south bank of the middle and lower reaches of the Yangtze River, between 113°30 116°40 E, 24°29 29°11 N. The Kan River drainage area is with the Fu River as dividing line, the Wuyi Mountain Chain as dividing line with Fujian Province in the southeast, connecting with Guangdong Province in the south and with Hunan Province in the west, with the tributary of the Xiu River – the Liao River as dividing line in the northwest, connecting with the Poyang Lake to join the Yangtze River at the lake intake in the north. The Kan River drainage area is narrow in east-west direction and long in south-north direction, slightly like an inclined rectangle. The drainage area of the Kan River upstream the Waizhou Hydrologic Station is 80948km2. Regional water system diagram is shown in DRAWING NO. 06.
2.2 Overviews of the Drainage Area and Related Plan
2.2.1 Brief introduction to the Kan River
The Kan River flows through the whole Jiangxi province from south to north and is the largest river in Jiangxi except the Yangtze River, its basin is situated at the south bank of middle and lower reaches of the Yangtze River between 113°30 116°40 E, 24°29 29°11 N. The Kan River upstream Ganzhou City is called Gongshui River, after Zhang River affluxes in Ganzhou City, it is called the Kan River. It originates from the Wuyishan Mountain area, a common boundary of Jiangxi and Fujian, its headstream (main tributary) is near Shiliaodong, Shicheng County, flowing through Ganzhou, Ji’an, Zhangshu, Nanchang and Jiujiang from south to north, flowing into the Poyang Lake at Wucheng Township, Yongxiu County of Jiujiang City, then joining into the Yangtze River via the Xingziyu Lake intake. The catchment area at the lake intake is 162225km2. The Kan River from Heyuan to Wucheng is 780km long in total, the drainage area of the Kan River into the Poyang Lake is 83500km2 accounting for 51.5% of the total area of Jiangxi Province, receiving 13 tributaries of over 1000km2 drainage area successively, within the said drainage area the navigable waterway is 2335km long and the average runoff into the lake is 67.2 billion m3.
Upstream Wanhe is the upstream of the Kan River, 350km long, 200 600m wide, traversing mountainous and hilly area, with higher topography, riverbed of mostly coarse sand and pebble, partly rock, average gradient at low water season 0.32‰ belonging to mountain river. In August 1990, the Wan’an Pivotal Project was completed at 2km upstream Wan’an County Seat, starting to impound water for power generation. The completion of the Wan’an Project has changed silting condition of the middle and lower reaches of the Kan River, obviously affecting 120km upstream

2.0 Project Overview
35
the dam and 110km downstream the dam. The flood peak downstream the dam is apparently cut down, prolonging moderate water season, causing extremely uneven instantaneous release flow at low water season, slight increase of daily average flow and greatly reduced coming silting in low water season.
The middle reaches from Wan’an to Zhangshu is 263km long, crossing the Jitai Basin, tableland and hilly land alternately at both banks, mostly tableland of sandy loam, long-term erosion makes the beach lines collapsed and the riverbed widened, the river is wide and shallow at low water season. The average gradient at low water season is 0.16‰ among which the average gradient from Wan’an to Ji’an is 0.18‰ from Ji’an to Zhangshu 0.15‰; the river is 500 1000m wide, deconcentrating its water flow to form many sandy transition section shallow banks, alternately gravel and pebble transition section shallow banks, secondly branch shallow banks and scattered shallow banks, as per the navigable depth requirement for low water season, the average shallow bank density reaches 2.45 banks/km.
The downstream from Zhangshu to Wucheng is 167km long, flowing through alluvial plain, having lower topography and embankment on the low-lying land at both banks, belonging to plain river, with riverbed of mostly moderate and coarse sand, average gradient at low water season 0.07‰, the river channel is slightly bending, wide and shallow at low water season, with central bars growing. Altogether there are 19 central bars with the total length about 70km among which there are cottages and residents living in two central bars having flood control embankment. The ground elevations at both banks are lower, relying on continuous embankment for flood control. The Kan River enters the Poyang Lake rump after Nanchang, with its trunk firstly divided into two branches of the East River and the West River at YangziZhoutou of Nanchang City, then divided into four branches to join the lake, among which the East River is divided into middle branch and east branch at Jiaojitou, the middle branch flows through Nanxin Lake and Dakou Lake and joins the Poyang Lake at Zhugang with total length of 43km; the east branch is the trunk channel of the East River, flowing through Yelou, Chucha, and flowing into the Poyang Lake at Sanjiangkou after it joins with the Fu River and the Xin River, the river is 56km long; The West River is divided into the north branch and the west branch at Qiaoshe, the north branch trunk flows through Jiangbu and joins the middle branch at Zhugang with a length of 28km, by-passing only at moderate flood season, less flow at low water season; the west branch flows through Qiaoshe, Changyi and into the Poyang Lake at Wucheng, which is the main passage of the Kan River into the Poyang Lake and the Yangtze River. Wucheng to Hukou belongs to the Poyang Lake area, 81km long, average gradient in low water season 0.047‰, Chuxi river mouth 20km downstream Wucheng is the general converging port of water from five rivers of the Poyang Lake area.
2.2.2 Channel situation and shipping development plan
Currently, the navigable conditions of 606km channel section from Ganzhou to Hukou of the Kan River are as follows: Channel from Ganzhou to Wan’an is about 95km long, being the channel of the Wan’an Reservoir Area, when the normal impounding level of the Wan’an Reservoir at initial operation stage is 94.11m (Yellow Sea Elevation), it can reach Grade III

2.0 Project Overview
36
channel standard; According to the current operating and management mode of the Wan’an Reservoir, during flood control period, when the Wan’an Reservoir needs to empty out from the normal impounding level at initial operation stage 94.11m to 85.11m, 69km long channel upstream the Wan’an Project can reach Grade III channel standard, 26km long channel downstream Ganzhou is varying backwater zone. 112km long channel from Wan’an to Ji’an is Grade VI channel, mostly affected channel by the dam hydropower station, because the release flow of the hydropower station is not even, ships can just apply high water for navigation with bigger hidden safety troubles. 151km long channel from Ji’an to Zhangshu started to be regulated since 2003 as per Grade V channel standard and the regulation work was completed in March 2006, now reaching Grade V channel standard already. 92km long channel from Zhangshu to Nanchang has reached Grade V channel standard, in which 500DWT ships can be navigable during moderate flood season, started to be regulated since the end of 2005 as per Grade III channel standard, the regulation work is expected to complete in 2008; 156km long channel of the Kan River from Nanchang to Hukou has reached Grade III channel standard.
The river section of this project is located at downstream of the Wan’an Project, and mostly affected channel by the dam hydropower station, because the release flow of the hydropower station is not even, ships can just apply high water for navigation, the channel is only of Grade IV standard.
In accordance with the Jiangxi Inland River Shipping Development Plan, which passed the review of the Jiangxi Provincial People’s Government in February 2006, the 525km long section of the Kan River (Ganzhou to Wucheng) is graded as Grade III inland river waterway.. According to the comprehensive cascade development of the Kan River trunk stream water resources and necessary waterway regulating measures, the 450km long waterway of the Kan River trunk stream from Ganzhou to Nanchang will reach Grade III waterway standard and the 156km from Nanchang to Hukou Grade II waterway standard before 2020. We try to commence the construction of the Shihutang Project before 2010, through channel regulation to make the channel from Nanchang to Hukou to reach Grade II channel standard, the channel from Zhangshu to Nanchang Grade III channel standard, the channel from Ji’an to Zhangshu Grade V channel standard. After 2010, through channeling and channel regulation, the whole Kan River channel can reach the planned channel standard.
Kan River Waterway Planned Grades is shown in DRAWING NO. 07.
2.2.3 Kan River Drainage Area Cascade Development Plan and Its Situation
2.2.3.1 Kan River Drainage Area Cascade Development Plan
Jiangxi Kan River Drainage Area Planning Commission submitted the Jiangxi Kan River Drainage Area Planning Report in June 1986. The former State Planning Commission issued a document No. [1990]1452—“Approval of the Review Comments on the Jiangxi Kan River Drainage Area Planning Report in October 1990, agreed at the review comments of the review commission of the Jiangxi Kan River Drainage Area Planning Report in principle.
The approved Jiangxi Kan River Drainage Area Planning Report recommends two trunk
2.0 Project Overview
37
stream cascade development plans I and V through analysis on antiflood, hydropower generation, shipping, water resource application, construction condition, investment, cost and benefit etc. Plan I is an eight-step development plan (Xiashan High Elevation Plan), from upstream to downstream is Xiashan, Maodian, Wanan, Taihe, Shihutang, Xiajiang, Yongtai and Longtoushan. Plan V is a ten-step development plan (Xiashan Low Elevation Plan), from upstream to downstream is Bai’e, Baikoutang, Xiashan, Maodian, Wanan, Taihe, Shihutang, Xiajiang, Yongtai and Longtoushan. The two plans are the same just at the river section downstream Ganzhou, i.e. six steps of Wanan, Taihe, Shihutang, Xiajiang, Yongtai and Longtoushan are arranged.
The planned preliminarily selected projects that will be implemented in the near future are the three steps of Taihe, Shihutang and Xiajiang, among which the preliminarily selected normal impounding level of Shihutang Project is 56.11m (Yellow Sea Elevation, the same below), the installed capacity is 120MW and the ship lock dimension is 175×14×2.5m.
2.2.3.2 Kan River Drainage Area Cascade Development Situation
At present, among the planned 6 steps of the Kan River downstream Ganzhou, the Wan’an step was put into operation in 1993, because the two downstream steps of Yongtai and Longtoushan are situated at the flat country of lower reaches of the Kan River, having great impacts of reservoir area inundation, they are difficult to implement in the near future. In addition, among the three steps, the preparation work of the Taihe step between Wan’an and Shihutang Steps has been organized to do by power department; The Xiajiang step downstream the Shihutang step is the flood control project of the Kan River. The project proposal has been prepared by water conservancy department, the project is to commence to build within the Eleventh-Five-Year Plan; The Shihutang Project has been listed into the Eleventh-Five-Year Plan of the Ministry of Communications and into an important project of Eleventh-Five-Year Plan by the Jiangxi Provincial People’s Government; The State Development and Reform Commission will list this project into 2007~2009 alternative projects to use the World Bank loan, and has approved to establish this project in the document No. [2007]717 “Official Reply of the State Development and Reform Commission to the Proposal of the Shihutang Shipping and Hydropower Pivotal Project at the Kan River”, it is planned to commence construction of the project in 2008 and to put into operation in 2012.
� Wan’an Water Conservancy Pivot
The Wan’an Water Conservancy Pivot is located at 2km upstream Wan’an County Seat at middle reaches of the Kan River, its dam site is 83km away from the Shihutang dam site, 116km away from the Ji’an Jinggangshan Bridge, the catchment area controlled is 36900km2, and the annual average flow is 953m3/s. The Project is a comprehensive application project mainly featured as a hydropower one and compromised to control flood, shipping, irrigation, and aquatic breeding and was built in 1993 as per the final design scale, the feature levels are as follows: 88.11m dead water level, 98.11m normal impounding level, 67.66m normal level of tailwater for power generating, 88.11m flood control level, 98.11m upper level for flood control, 98.81m design flood level, 101.71m maximum flood level; The total reservoir capacity is 22.14×10⁸m3 the beneficial reservoir capacity for flood control is 10.19×10⁸m3,

2.0 Project Overview
38
it is an incomplete balancing reservoir; Capacity of hydropower station: 5 water turbine power generating sets, 556m3/s unit flow rate 500MW installed capacity, 15.16×10⁸kW·h annual average generating capacity, 60.4MW firm output, and 22.0m design head. Currently the reservoir is impounded to run as per the operating level of initial operation stage: 83.11m dead water level 94.11m normal water level, 83.11m flood control level 91.71m upper water level for flood control; the beneficial reservoir capacity for flood control is 7.98×10⁸m3 the annual average generating capacity is 11.5×10⁸kW·h and the firm output is 47.0MW.
� Taihe Water Conservancy Pivot Power department is now engaged in the preparation work of the Taihe Water Conservancy Pivotal Project. The dam site is situated near Xilong Village of Taihe County, 42km away from upstream Wan’an dam site, about 15km from the downstream Taihe County Seat Road, with controlled catchment area of 40937km2 annual average flow of 1050m3/s. The Project is a comprehensive application project mainly featured as a hydropower one and compromised to shipping and irrigation. As per the Feasibility Study Report of Jiangxi Taihe Hydropower Station at the Kan River: the reservoir has its normal water level of 68.0m connecting with tailwater of the Wan’an Hydropower Station, with normal level of tail water for power generation 56.9m design flood level 68.0m and maximum flood level 70.35m, total capacity 5.50×10⁸m3 beneficial reservoir capacity 0.12×10⁸m3 only for daily regulation; The Hydropower Station is equipped with 6 water turbine power generating sets with unit flow rate of 402m3/s installed capacity of 180MW annual average power generating capacity of 6.52×10⁸kW·h firm output of 34.4MW design head of 8.7m and base flow released for shipping of 135m3/s.
� Xiajiang Water Conservancy Pivot Xiajiang Water Conservancy Pivot is located at the upstream gorge section of the old county seat (Baqiu Town) of Xiajiang County at the middle reaches of the Kan River, and it is a comprehensive application project mainly featured as a hydropower and flood control one and compromised to shipping and irrigation. At present the water conservancy department is carrying out its preparation work. The dam site is situated at 90km downstream the Shihutang dam site with controlled catchment area of 62710km2 and annual average flow of 1660m3/s. In accordance with the Proposal of the Jiangxi Xiajiang Water Conservancy Pivotal Project: the project has the reservoir normal water level of 46.0m (lowered by 1.9m than the planned normal level because the reservoir area has a larger inundation area), not connecting with tailwater of the Shihutang Hydropower Station, dead level of 44.0m, flood control level of 45.0m upper water level for flood control of 49.1m design flood level of 49.22m maximum flood level of 49.74m, total reservoir capacity of 16.65×10⁸m3, flood control capacity of 9.0×10⁸m3 beneficial reservoir capacity of 2.14×10⁸m3 the reservoir belongs to seasonal regulation reservoir; The Hydropower Station is equipped with 8 water turbine power generating sets with unit flow rate of 587m3/s installed capacity of 360MW annual average power generating capacity of 11.5×10⁸kW·h firm output of 49.8MW design head of 8.57m.
The Kan River Drainage Area Cascade Plan is shown in DRAWING NO. 07 and DRAWING

2.0 Project Overview
39
NO. 08. The main figures of the four step development plan schemes of Wan’an, Taihe, Shihutang and Xiajiang in the Jiangxi Kan River Drainage Area Planning Report are shown in Table 2.2 1.

2.0 Project Overview
40
Table 2.2 1 Main figures of the four step development plan schemes
Reservoir capacity �108m3� Firm output �104kW�
Annual power generationNormal
impounded level�m�
Dead water level �m�
Dam axis length�m�
Maximum dam
height(m� Total capacity
Adjusting capacity
Flood control capacity
Maximum head�m�
Design head�m� Single
running���� Combined
running����
Installed capacity�104kW� Single
running����
100 92 1100 51.0 23.7 8.7 10.2 32.7 6.04 10.8 50 15.16
69 68 1796 33.0 5.6 0.56 11.8 8.7 2.36 4.1 18 6.00
58 57 2079 30.5 0.57 8.9 6.5 2.01 3.2 12 4.19
50 46 492.2 33.8 27.6 6.95 6.0 16.0 11.6 4.32 8.06 35 13.40

2.0 Project Overview
41
2.3 Freight Forecasting and Operating Organization Plan
2.3.1 Planned level year
The planned level year is 2020 (short-run) and 2030 (long-run).
2.3.2 Freight forecasting
The predicted volumes of passenger traffic through the dam in 2020 and in 2030 are respectively 392,000 mantimes and 477,000 mantimes. The predicted freights through the dam in 2020 and in 2030 are respectively 8.43 million t and13.33 million t. The predicted freights through the dam of different level years are shown in Table 2.31.
Table 2.3 1 Predicted freights through the dam of different level years
2020 2030 Item Unit
Total Upbound Downbound Total Upbound Downbound
I. Volume of passenger traffic 39.2 19.6 19.6 47.7 23.95 23.95 II. Volume of freight handled 104t 843 377 466 1333 613 720
1. Coal & its products 104t 150 150 230 230 2. Oil, natural gas and their
products 104t 50 50 70 70
3. Metallic ore 104t 0 0 4. Iron and steel 104t 5 5 10 10
5. Mine construction materials 104t 400 100 300 700 200 500 6. Cement 104t 8 8 14 14 7. Timber 104t 80 80 100 100
8. Non-metallic ore 104t 7 7 10 10 9. Fertilizer and pesticides 104t 31 31 46 46
10. Salt 104t 5 5 8 8 11. Foodstuff 104t 25 15 10 35 20 15
12. Machinery, equipment and electric appliances
104t 0 0
13. Chemical feedstock and products
104t 0 0
14. Non-ferrous metal 104t 1 1 3 3 15. Light industrial and pharmaceutical products
104t 25 10 15 35 15 20
16. Products of agriculture, forestry, husbandry and fishery
104t 48 8 40 60 10 50
17. Others 104t 8 3 5 12 4 8 18. Containers 104t 10 5 5 20 8 12
2.3.3 Operating organization plan
� Ship situation
The main features of Jiangxi transport ships are small capacity, many types, and low standardization degree. Except that 1000DWT or over ships are navigable in the downstream Nanchang at the lower reaches of the Kan River, the Poyang Lake area, and along the Yangtze River and 500DWT motor barges are navigable in the downstream Zhangshu at the

2.0 Project Overview
42
lower reaches of the Kan River, only 300~500DWT motor barges are navigable in upper Zhangshu at the middle and upstream of the Kan River at medium flood season, below 300DWT motor barges are navigable in low water season. In 2004, the average motor ship DWT of the whole Jiangxi province is only 188t.
� Ship type and operating organization plan
The channel section downstream of Ganzhou at the Kan River in 2020 will reach Grade III inland river channel standard with average ship DWT of 500tRecommended ship types and operating organization in 2020 are shown in Table 2.32.
The average ship DWT in 2030 will exceed 500tthe recommended ship types and operating organization are shown in Table 2.33.
Table 2.3 2 Recommended ship types and operating organization in 2020
No Ship type Operating
organization
Total length (m)
Molded breadth
(m)
Draft (m)
Carrying capacity
(t)
1 T97kW+FB2×300t Segmented barge pusher train
18 8.2 1.5 600
2 T147kW+FB2×500t Ditto 21 9.2 1.5 1000
3 T294kW+FB2×1000t Ditto 25 9.2 1.6 2000
4 J147kW×300t+B500t Motor barge pusher train
45 8.6 1.6 840
5 J40kW×100t Single ship 31.5 6.3 1.2 100
6 J88kW×300t Single ship 45 8.6 1.6 300
7 J147kW×500t Single ship 47 10.3 1.9 550
8 J220kW×1000t Single ship 67.5 10.8 2.0 1000
9 500t oil tanker Single ship 55 10.8 1.6 500
10 1000t oil tanker Single ship 67.5 12.8 2.0 1000
11 36TEU container ship Single ship 55 9.8 1.8 36TEU
12 60TEU container ship Single ship 62.5 10.8 2.2 60TEU
Table 2.3 3 Recommended ship types and operating organization in 2030
No Ship type Operating organization Total
length (m) Molded
breadth (m) Draft (m)
Carrying capacity (t)
1 T147kW+FB2×500t Segmented barge pusher train 21 9.2 1.5 1000

2.0 Project Overview
43
2 T294kW+FB2×1000t Segmented barge pusher train 25 9.2 1.6 2000
3 300t motor barge Single ship 38 9.2 1.6
4 500t motor barge Single ship 45 10.8 1.9
5 1000t motor barge Single ship 60 10.8 2.2
6 2000t motor barge Single ship 72.5 10.8 2.8
7 500t oil tanker Single ship 55.0 10.8 1.8
8 1000t oil tanker Single ship 67.5 67.5 12.8 2.0
9 60TEU container ship Single ship 55.0 62.5 10.8 2.2
10 90 TEU container ship Single ship 62.5 67.5 10.8 2.2
2.4 Characteristics of the Project
Project name: Jiangxi Shihutang Shipping and Hydropower Pivotal Project at the Kan River
Project nature: new project
Construction place: Shihutang Village, Taihe County, Ji’an City, Jiangxi Province
Project tasks: Mainly for shipping, minorly for hydropower generation and flood control
Construction scale: belonging to second-class large (2) type hydropower pivotal project, Ship lock, Grade III channel, Installed capacity of hydropower station of 117MW reservoir inundation area of 2544.81hm2 permanently occupied land of 2835.0hm2 total investment of 2.227 billion yuan.
2.5 Setup of the Project
Setup of the Project is shown in Table 2.5 1. Assessment work of power transmission and transformation and electromagnetic radiation involved in this project is not included in this EIA, which will be authorized by the Owner to other qualified assessment unit.
Table 2.5 1 Setup and main technical figures of the Project
I. Setup and main technical figures of the Project Main work Pivotal project
Auxiliary work Reservoir area protection, Reservoir area inundation, Pivot management area Construction
temporary work Pivot construction, Construction firms and their facilities, Construction traffic, Material sites, spoil sites

2.0 Project Overview
44
Pivotal work Dike work Drainage work
Engineering management
area Reservoir inundation Total Permanently
occupied land (hm2) 28.33 115.28 143.24 3.33 2544.81 2835.0
Material sites
Construction road
Spoil sites Resettlemen
t area
Construction area
Farmland elevating Total Temporarily
occupied land (hm2)
159.46 30.73 117.63 5.21 64.20 82.47 459.71 II. Amount of works�×104m3�
Project setup Excavation Fill Application Lend Borrow Spoil Pivotal project 272.19 286.73 160.07 34.15 112.12
Dike work 36.91 202.61 90.61 112 36.91 Drainage work 351.85 109.76 96.16 90.61 13.59 165.07
Total 660.95 599.1 346.84 90.61 159.74 314.10
2.6 Development Task and Project Scale
2.6.1 Development task
The Project is a comprehensive application project mainly featured as shipping one and compromised to generate hydropower and to control flood.
2.6.2 Project scale
The project belongs to second-class large (2) type project, with normal impounding level of 56.50m, total reservoir capacity of about 632 million m3, the reservoir area at normal level of 29.2km2 backwater length of 38km6 water turbine power generating sets, installed capacity of 117MW annual average power generating capacity of 4.8×10⁸kW·h water retaining height of 9.8m belonging to low head building.
The main buildings of the pivot are flood discharge scouring sluice, ship lock, hydropower station, earth rockfill dam at left and right banks and the dam bridge; The main buildings of flood control area are flood dike, regulating sluices, guide drainage canals and electrical drainage pumping stations, with total protection dike line of 38.38km total guide support canal (drainage canal) length of 61.33km. The main buildings of the project are flood discharge scouring sluice, ship lock water retaining part, powerhouse, earth rockfill dam sections at joint of left and right banks, which are designed as per Class 3 building standard, the secondary buildings are designed as per Class 4 building standard, the temporary buildings are designed as per Class 5 building standard.
The navigational standard is 1000t DWT Grade III inland river channel, the ship lock navigational grade is Grade III, the channel dimensions are as follows: design depth 2.2m design width 60m bending radius not smaller than 480m, guaranteed navigational rate of 95%, lock chamber dimension is 180×23×3.5m (length×width×water depth on sill).
The permanent water retaining and release structures of the project are to be designed on a 50-year-flood-reoccurrence period and a 300-year-check-flood-reoccurrence period basis; The design and check flood levels of the powerhouse and ship lock as part of retaining structure are the same with those of retaining structure; The energy dissipation and protection work downstream the release structure are to be designed on a 30-year-flood-reoccurrence period basis.
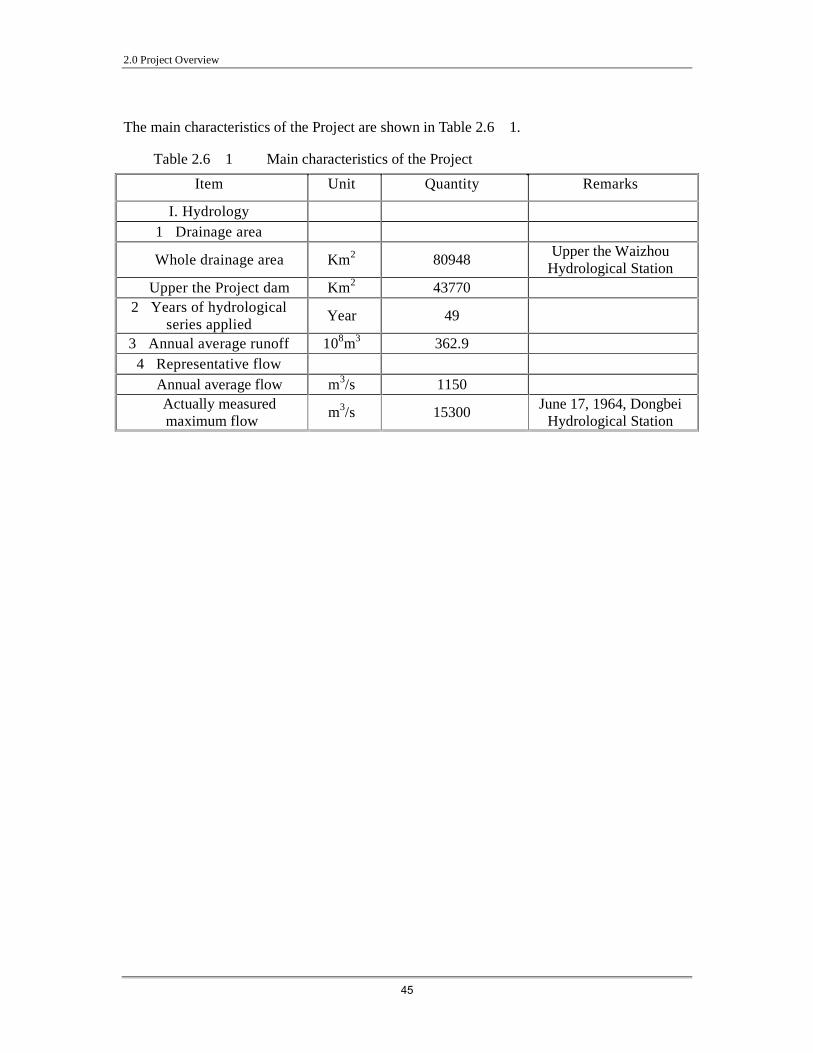
2.0 Project Overview
45
The main characteristics of the Project are shown in Table 2.61.
Table 2.6 1 Main characteristics of the Project
Item Unit Quantity Remarks
I. Hydrology 1�Drainage area
Whole drainage area Km2 80948 Upper the Waizhou Hydrological Station
Upper the Project dam Km2 43770 2�Years of hydrological
series applied Year 49
3�Annual average runoff 108m3 362.9 4�Representative flow
Annual average flow m3/s 1150 Actually measured maximum flow
m3/s 15300 June 17, 1964, Dongbei
Hydrological Station
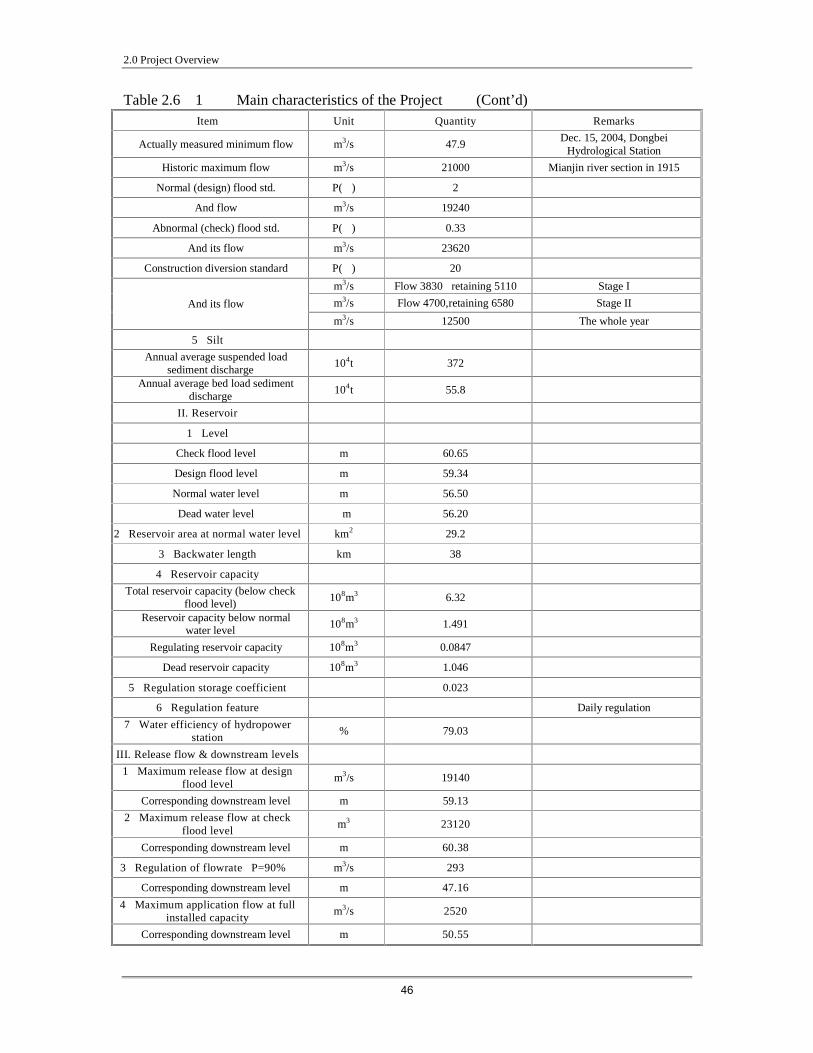
2.0 Project Overview
46
Table 2.6 1 Main characteristics of the Project (Cont’d) Item Unit Quantity Remarks
Actually measured minimum flow m3/s 47.9 Dec. 15, 2004, Dongbei
Hydrological Station
Historic maximum flow m3/s 21000 Mianjin river section in 1915
Normal (design) flood std. P(�) 2
And flow m3/s 19240
Abnormal (check) flood std. P(�) 0.33
And its flow m3/s 23620
Construction diversion standard P(�) 20
m3/s Flow 3830�retaining 5110 Stage I
m3/s Flow 4700,retaining 6580 Stage II And its flow
m3/s 12500 The whole year
5�Silt
Annual average suspended load sediment discharge
104t 372
Annual average bed load sediment discharge
104t 55.8
II. Reservoir
1�Level
Check flood level m 60.65
Design flood level m 59.34
Normal water level m 56.50
Dead water level m 56.20
2�Reservoir area at normal water level km2 29.2
3�Backwater length km 38
4�Reservoir capacity
Total reservoir capacity (below check flood level)
108m3 6.32
Reservoir capacity below normal water level
108m3 1.491
Regulating reservoir capacity 108m3 0.0847
Dead reservoir capacity 108m3 1.046
5�Regulation storage coefficient � 0.023
6�Regulation feature Daily regulation
7�Water efficiency of hydropower station
% 79.03
III. Release flow & downstream levels
1�Maximum release flow at design flood level
m3/s 19140
Corresponding downstream level m 59.13
2�Maximum release flow at check flood level
m3 23120
Corresponding downstream level m 60.38
3�Regulation of flowrate�P=90%� m3/s 293
Corresponding downstream level m 47.16
4�Maximum application flow at full installed capacity
m3/s 2520
Corresponding downstream level m 50.55

2.0 Project Overview
47
Table 2.6 1 Main characteristics of the Project (Cont’d)
Item Unit Quantity Remarks IV. Benefit figures of the
project
1�Shipping benefit Length of channel
improved km 38
Channel dimension m 60×480×2.2 Beeline width×bending
radius×water depth Design fleet t 2×1000
Annual trafficability ×104t/a 827 2�Hydropower benefit
Installed capacity MW 117 Firm output (P=90%) MW 21.61
Annual average generating capacity 108kW·h 4.80 Annual on-stream hours h 4103 V. Inundation loss &
permanently occupied land by the project
1�Occupied farmland(P=50�)
Mu 2977.3
2�Occupied woodland Mu 3468.4 3�Relocated
population(P=10�) Person 711
4�Relocated houses m2 45550 VI. Main buildings &
equipment
1�Type of water retaining structure Open type barrage Foundation feature Mudstone
Basic earthquake intensity/design earthquake intensity
o VI
Crest elevation m 63.5 Maximum dam height m 26.5
Crest length m 584 2�Release structure type Open type barrage
Foundation feature Mudstone Weir (sill) top elevation m 47.00 Discharge per unit width m3/(s·m) 48.2
Energy dissipation mode Energy dissipation by
hydraulic jump
Type, quantity & size of gate
20×10-9.5�24 gates Arc gate
Type, quantity & capacity of headstock gear
QHLY-2×1600-6.2 20 hydraulic headstock
gears Design flood discharge
flow m3/s 19140

2.0 Project Overview
48
Check flood discharge flow
m3/s 23120
3�Navigational building
Type Grade III ship lock
Foundation feature Muddy siltstone, silty mudstone, entrained siltstone
Effective size m 180×23×3.5 Upstream maximum navigable level m 57.64
Table 2.6 1 Main characteristics of the Project (Cont’d)
Item Unit Quantity Remarks
Corresponding flow m3/s 14800 P=10%�flood
frequency� Downstream maximum
navigable level m 57.49
Upstream minimum navigable level
m 52.46 Minimum operating level
of the reservoir Downstream minimum
navigable level m 45.88
Maximum working head m 10.62
Water transmission mode Multiple hole on chamber
wall long coursed way Water transmission valve
type 2.2×2.2-7.3
Submerged hole plane fixed roller gate
Type & size of gate 23×11.9-6.58 23×15.3-6.58
Miter gate
Type, model & power of gate headstock gear
QRWY-500/400-5.6B QRWY-630/500-5.6B
Horizontal hydraulic headstock gear
Type, model & power of valve headstock gear
QPPYII-200-2.5 Vertical hydraulic
headstock gear 4�Powerhouse
Type River channel type
Foundation feature Weakly weathered
mudstone
Powerhouse dimension (L×W×H)
m 145.015×88.89×62.19
Erection elevation of water turbine
m 38.0
5�Stepup substation Foundation feature Manual filling Area (LxW)/storey m2/storey 70×13
GIS switching station m2 40×12 6�Main generating
equipment
Number of water turbines Set 6 Type GZ�SHT1�-WP-730

2.0 Project Overview
49
Rated output MW 20.10 Rated speed r/min 71.4
Draught height m -8.78 Rotary wheel diameter m 7.3
Maximum working head m 9.80 Minimum working head m 3.60
Rated head m 5.35 Rated flow m3/s 420
Number of generators Set 6 Unit capacity kW 19.5
Generator power factor 0.90
Table 2.6 1 Main characteristics of the Project (Cont’d)
Item Unit Quantity Remarks 7�Transmission line
Transmission voltage kV 220 Number of loops Loop 1
Transmission destination Taihe County Transmission distance km 18
VII. Construction of main project
1�Quantities of main project Open soil excavation 104m3 148.83
Open stone excavation 104m3 46.36 Soil and stone fill 104m3 131.66
Pouring of concrete & RC 104m3 92.11 Steel bar t 23617
Installation of metal framework
t 8828
Curtain grouting m 4828 Consolidation grouting m 13167
2�Main construction materials
Timber 104m3 18.7 Cement 104t 32.56 Steel bar 104t 2.46
3�Required labors
Total mandays 104
mandays 277.84
Peak number of constructors
Person 1900
4�Construction temporary houses
� 19200

2.0 Project Overview
50
5�Construction power Power supply load kW 3226
6�Traffic (road) Distance km 4
Volume of freight 104 t 53 7�Construction diversion
method By stages
8�Construction period Preparation work Month 9
Commissioning period Month 29 Total construction period Month 51 VIII. Economic figures
1�Static investment 104 yuan 212756.90 Incl�Pivot buildings 59306.89 Flood control & drainage
works 28070.23
Table 2.6 1 Main characteristics of the Project (Cont’d)
Item Unit Quantity Remarks Land acquisition &
resettlement 20157.80
Other costs 16864.60 Basic contingent cost 12573.92
2�Contingent cost for price difference
0
3. Commitment fee 104 yuan 1183.65 4�Loan interest during
construction period 104 yuan 9899.43
5�Preparatory current capital 104 yuan 33.00 6�Total investment 104 yuan 222689.32
7�Economic indicator Unit investment of
hydropower station Yuan/kw 8762
Unit electrical degree investment
Yuan/kw�h
2.36
Economical IRR � 14.80 Financial IRR � 3.83 Tax included Financial IRR � 3.13 Net of tax
Price of power to grid Yuan/kW
�h 0.291
Loan repayment years Year 12.6

2.0 Project Overview
51
2.7 Pivot Management and Operating Mode
2.7.1 Reservoir Management and Operating Mode
In accordance with the function arrangement of the Jiangxi Kan River Drainage Area Planning Report on the Shihutang Project, the flood management and operation mode of the Project is decided as per the upstream incoming flow (release flow from the existing Wan’an Pivot and the Taihe Pivot to be built).
(1). Under normal condition, the water level in front of the dam is always controlled at normal impounded level (56.5m). When the flow at the Dongbei Hydrological Station at upstream is smaller than critical flow for closing sluice gates (Flow at the Shihutang dam site 4700m3/s), close the sluice gates, incoming flow will be totally used for generating power and keeping normal impounded level operation. At this period, only 187m3/s basic sluice flow is assured to satisfy the navigation requirement. In addition, flows to assure ship lock normal operation are 11.24m3/s in the near future and 15.31m3/s in the long-run.
(2). When Kan River incoming flow is smaller during dry season, Shihutang Hydropower Station is operated simultaneously with Wan’an Hydropower Station, and at the same time, downstream basic sluice flow 187m3/s and flows to assure ship lock normal operation -- 11.24m3/s in the near future and 15.31m3/s in the long-run can be assured. The minimum control level is 56.2m (pivot dead water level, also equivalent to minimum level in front of dam)
(3). When the flow at the Dongbei Hydrological Station at upstream is bigger than or equal to critical flow for closing sluice gates -- 4330 m3/s (Flow at the Shihutang dam site 4700m3/s), open the flood gates, stop generating power, the river will basically resume to natural state until incoming flow smaller than 4700m3/s, then control the gates to assure normal impounded level.
2.7.2 Ship lock Management and Operating Mode
The ship lock is a single line one of navigation grade III. The channel dimensions are design depth of 2.2m, width of 60m, bending radius not smaller than 480m, the navigation guarantee rate is 95%. The lock chamber size is 180×23×3.5m L×W×Sill water depth , once-in-a-50-year- flood is applied for design and once-in-a-300-year-flood for check.
Ship lock upstream design maximum navigational level is 57.64m, the corresponding flow is 14800m3/s the ship lock downstream maximum navigational level is 57.49m.
Ship lock upstream design minimum navigational level is 52.46m minimum reservoir operational level Ship lock downstream design minimum navigational level is 45.88m.
Ship lock design operation parameters:
� Unit ship lock-passing time: 57min
� Daily average shiplock-passing times: 23 times in 22 hours per day
� Annual on-stream days: 347d
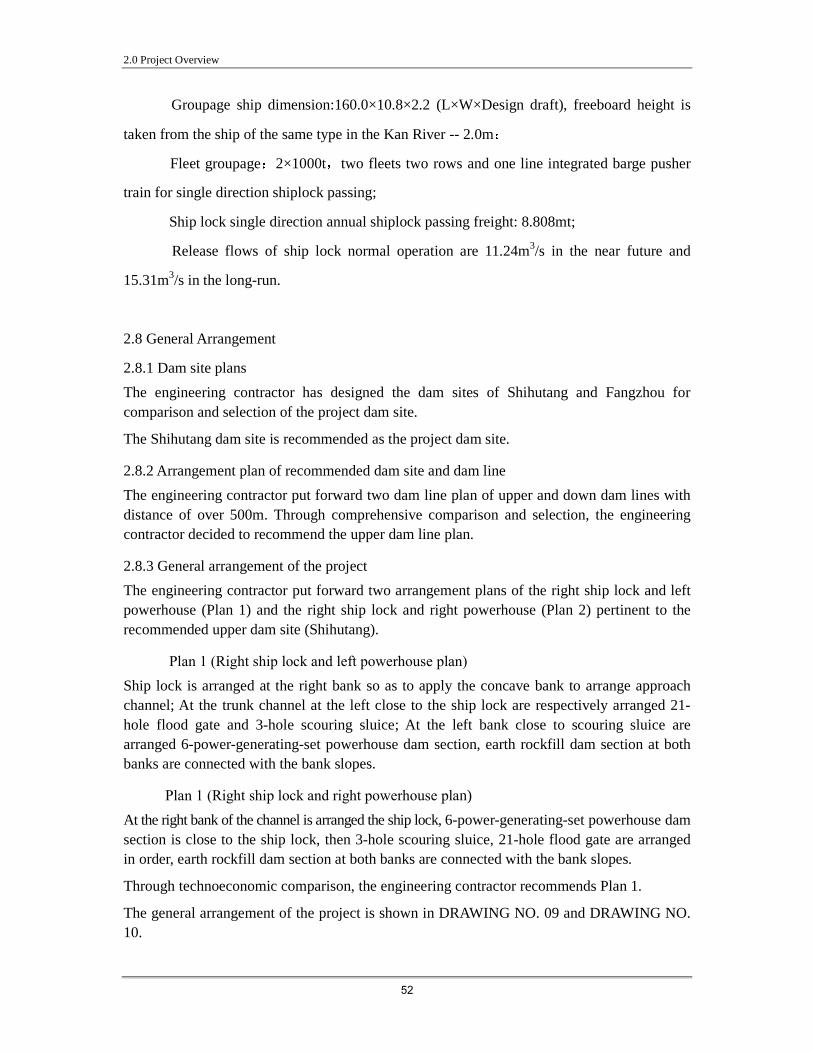
2.0 Project Overview
52
� Groupage ship dimension:160.0×10.8×2.2 (L×W×Design draft), freeboard height is
taken from the ship of the same type in the Kan River -- 2.0m
� Fleet groupage 2×1000t two fleets two rows and one line integrated barge pusher
train for single direction shiplock passing;
� Ship lock single direction annual shiplock passing freight: 8.808mt;
� Release flows of ship lock normal operation are 11.24m3/s in the near future and
15.31m3/s in the long-run.
2.8 General Arrangement
2.8.1 Dam site plans
The engineering contractor has designed the dam sites of Shihutang and Fangzhou for comparison and selection of the project dam site.
The Shihutang dam site is recommended as the project dam site.
2.8.2 Arrangement plan of recommended dam site and dam line
The engineering contractor put forward two dam line plan of upper and down dam lines with distance of over 500m. Through comprehensive comparison and selection, the engineering contractor decided to recommend the upper dam line plan.
2.8.3 General arrangement of the project
The engineering contractor put forward two arrangement plans of the right ship lock and left powerhouse (Plan 1) and the right ship lock and right powerhouse (Plan 2) pertinent to the recommended upper dam site (Shihutang).
� Plan 1 (Right ship lock and left powerhouse plan) Ship lock is arranged at the right bank so as to apply the concave bank to arrange approach channel; At the trunk channel at the left close to the ship lock are respectively arranged 21-hole flood gate and 3-hole scouring sluice; At the left bank close to scouring sluice are arranged 6-power-generating-set powerhouse dam section, earth rockfill dam section at both banks are connected with the bank slopes.
�Plan 1 (Right ship lock and right powerhouse plan)
At the right bank of the channel is arranged the ship lock, 6-power-generating-set powerhouse dam section is close to the ship lock, then 3-hole scouring sluice, 21-hole flood gate are arranged in order, earth rockfill dam section at both banks are connected with the bank slopes.
Through technoeconomic comparison, the engineering contractor recommends Plan 1.
The general arrangement of the project is shown in DRAWING NO. 09 and DRAWING NO. 10.
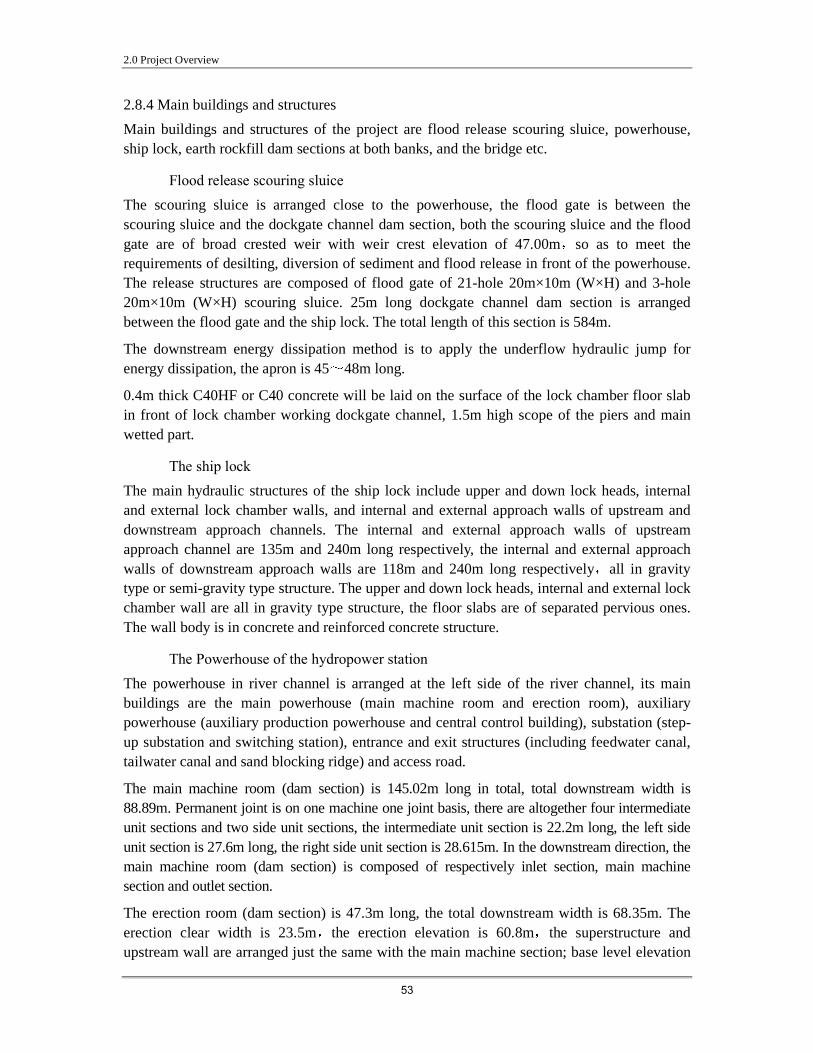
2.0 Project Overview
53
2.8.4 Main buildings and structures
Main buildings and structures of the project are flood release scouring sluice, powerhouse, ship lock, earth rockfill dam sections at both banks, and the bridge etc.
� Flood release scouring sluice
The scouring sluice is arranged close to the powerhouse, the flood gate is between the scouring sluice and the dockgate channel dam section, both the scouring sluice and the flood gate are of broad crested weir with weir crest elevation of 47.00mso as to meet the requirements of desilting, diversion of sediment and flood release in front of the powerhouse. The release structures are composed of flood gate of 21-hole 20m×10m (W×H) and 3-hole 20m×10m (W×H) scouring sluice. 25m long dockgate channel dam section is arranged between the flood gate and the ship lock. The total length of this section is 584m.
The downstream energy dissipation method is to apply the underflow hydraulic jump for energy dissipation, the apron is 45 48m long.
0.4m thick C40HF or C40 concrete will be laid on the surface of the lock chamber floor slab in front of lock chamber working dockgate channel, 1.5m high scope of the piers and main wetted part.
� The ship lock
The main hydraulic structures of the ship lock include upper and down lock heads, internal and external lock chamber walls, and internal and external approach walls of upstream and downstream approach channels. The internal and external approach walls of upstream approach channel are 135m and 240m long respectively, the internal and external approach walls of downstream approach walls are 118m and 240m long respectively all in gravity type or semi-gravity type structure. The upper and down lock heads, internal and external lock chamber wall are all in gravity type structure, the floor slabs are of separated pervious ones. The wall body is in concrete and reinforced concrete structure.
� The Powerhouse of the hydropower station
The powerhouse in river channel is arranged at the left side of the river channel, its main buildings are the main powerhouse (main machine room and erection room), auxiliary powerhouse (auxiliary production powerhouse and central control building), substation (step-up substation and switching station), entrance and exit structures (including feedwater canal, tailwater canal and sand blocking ridge) and access road.
The main machine room (dam section) is 145.02m long in total, total downstream width is 88.89m. Permanent joint is on one machine one joint basis, there are altogether four intermediate unit sections and two side unit sections, the intermediate unit section is 22.2m long, the left side unit section is 27.6m long, the right side unit section is 28.615m. In the downstream direction, the main machine room (dam section) is composed of respectively inlet section, main machine section and outlet section.
The erection room (dam section) is 47.3m long, the total downstream width is 68.35m. The erection clear width is 23.5m the erection elevation is 60.8m the superstructure and upstream wall are arranged just the same with the main machine section; base level elevation
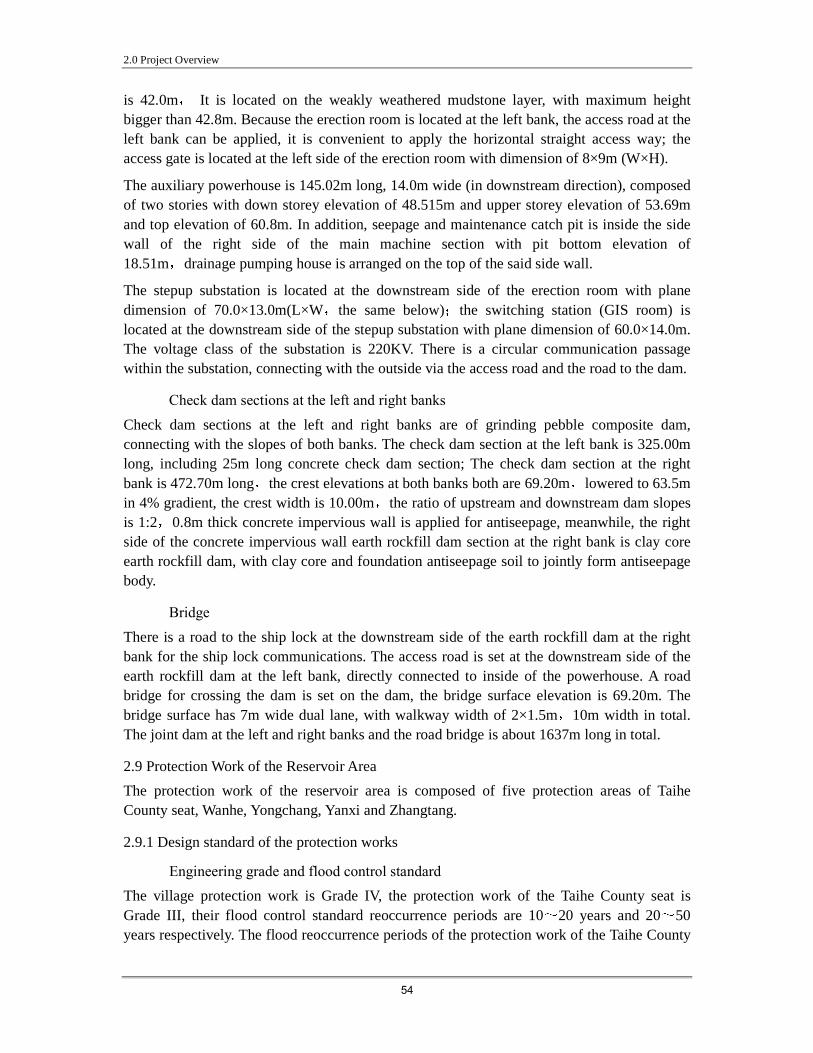
2.0 Project Overview
54
is 42.0m It is located on the weakly weathered mudstone layer, with maximum height bigger than 42.8m. Because the erection room is located at the left bank, the access road at the left bank can be applied, it is convenient to apply the horizontal straight access way; the access gate is located at the left side of the erection room with dimension of 8×9m (W×H).
The auxiliary powerhouse is 145.02m long, 14.0m wide (in downstream direction), composed of two stories with down storey elevation of 48.515m and upper storey elevation of 53.69m and top elevation of 60.8m. In addition, seepage and maintenance catch pit is inside the side wall of the right side of the main machine section with pit bottom elevation of 18.51m drainage pumping house is arranged on the top of the said side wall.
The stepup substation is located at the downstream side of the erection room with plane dimension of 70.0×13.0m(L×W the same below) the switching station (GIS room) is located at the downstream side of the stepup substation with plane dimension of 60.0×14.0m. The voltage class of the substation is 220KV. There is a circular communication passage within the substation, connecting with the outside via the access road and the road to the dam.
� Check dam sections at the left and right banks Check dam sections at the left and right banks are of grinding pebble composite dam, connecting with the slopes of both banks. The check dam section at the left bank is 325.00m long, including 25m long concrete check dam section; The check dam section at the right bank is 472.70m long the crest elevations at both banks both are 69.20m lowered to 63.5m in 4% gradient, the crest width is 10.00m the ratio of upstream and downstream dam slopes is 1:2 0.8m thick concrete impervious wall is applied for antiseepage, meanwhile, the right side of the concrete impervious wall earth rockfill dam section at the right bank is clay core earth rockfill dam, with clay core and foundation antiseepage soil to jointly form antiseepage body.
� Bridge
There is a road to the ship lock at the downstream side of the earth rockfill dam at the right bank for the ship lock communications. The access road is set at the downstream side of the earth rockfill dam at the left bank, directly connected to inside of the powerhouse. A road bridge for crossing the dam is set on the dam, the bridge surface elevation is 69.20m. The bridge surface has 7m wide dual lane, with walkway width of 2×1.5m 10m width in total. The joint dam at the left and right banks and the road bridge is about 1637m long in total.
2.9 Protection Work of the Reservoir Area
The protection work of the reservoir area is composed of five protection areas of Taihe County seat, Wanhe, Yongchang, Yanxi and Zhangtang.
2.9.1 Design standard of the protection works
� Engineering grade and flood control standard
The village protection work is Grade IV, the protection work of the Taihe County seat is Grade III, their flood control standard reoccurrence periods are 10 20 years and 20 50 years respectively. The flood reoccurrence periods of the protection work of the Taihe County

2.0 Project Overview
55
seat and the village protection work are respectively 20 years and 10 years.
The Wanhe Drainage Pumping Station, the Yanxi Drainage Pumping Station, and the Jintan Drainage Pumping Station belong to middle scale pumping stations. The building grade of the said three pumping stations are the same with that of the fending groynes in which they are located, belonging to Grade 4, the design flood standard is once-every-10-year-flood. The building grade of Huangjiaba and Dongmen drainage pumping stations are the same with that of the fending groynes of the Taihe County seat, belonging to Grade 3, the design flood standard is once-every-20-year-flood.
The Zhangtang Regulating Sluice is of middle scale gate, Grade 3 building, with design flood standard of once-every-20-year-flood; The Wanhe Regulating Sluice is of small (1) type gate, Grade 4 building, with design flood standard of once-every-10-year-flood. The crest elevations of typical sections of fending groynes of each protection area are shown in Table 2.9-1.
Table 2.9 1 Crest elevations of typical sections of fending groynes of each protection area
Protection area Pile No.
Design flood
reoccurrence
period
Design flood
level (m)
Crest elevation calculation
value (m)
Wanhe Wanhe 3+144 10 years 58.27 59.27
Yanxi Yanxi 1+927 10 years 58.72 59.72
Zhangtang Zhangtang
0+135 10 years 59.21 60.21
Jintan Jintan 11+233 10 years 62.04 63.04
Taihe Taihe 2+064 20 years 61.74 62.74
� Drainage design standard
For the protection area with villages and towns, the drainage standard is to apply a once-in-a-five-year 3-day rainstorm and drain to the inundation resistant depth within 3 days; the drainage standard of the Taihe County seat is to apply a once-in-a-10-year 1-day storm and drain to the elevation of main buildings non-inundated within 1 day, indicated in the Preliminary Design Report of Flood Control Work of the Taihe County Seat by Ji’an City Water Conservancy and Hydropower Plan and Design Institute; The drainage standard of the guide support canal within the protection area is to apply the corresponding drainage reoccurrence period standard of the protection area, the foreign water guide support canal (river) within the protection area is based on the design flood standard of the fending groyne of the protection area.

2.0 Project Overview
56
2.9.2 Arrangement of protection works
2.9.2.1 Comparison of protection work plans
�Comparison of the axial line arrangement plans of the Wanhe Guide Drainage Canal
The engineering contractor put forward two plans according to the landform, geological condition of the Wanhe Protection Area and the guide drainage canal discharge-- the Kan River level at the same frequency:
Plan 1: The guide drainage canal flows from Zhushan Village to the Zhangtang Protection Area, goes along the old waterway and mountain side to Pile No.14+000, then turns to close proximity of Liutang Village, through Tianduan Village and Jiangbian Village side to the downstream of the down dam site.
Plan 2: The canal axial line is the same before Pile No.14+000 with Plan 1, thereafter, the canal axial line goes further along the old waterway and mountain side to the place 300m downstream of the ship lock discharge of the recommended upper dam site.
Through technoeconomic comparison, the engineering contractor recommends Plan 2.
� Comparison of guide draining operating and control level plans of the Zhangtang
Protection Area
As per the population and house distribution above elevation 54.00 in the Zhangtang Protection Area, guide draining operating and control level plans of the Zhangtang Protection Area are compared under the condition of selected canal axial line, the corresponding levels of Plans 1, 2, 3 and 4 are 52.80m, 53.20m, 53.50m and 53.80m respectively.
Through technoeconomic comparison, the engineering contractor recommends Plan 3.
2.9.2.2 Arrangement of protection works
The engineering contractor has designed and arranged five protection areas of Wanhe, Yanxi, Zhangtang, Yongchang and Taihe County Seat. The total length of fending groyne lines of the protection works is 38.38km, including 3.36km Taihe Fending Groyne8.12km Wanhe Fending Groyne 0.80km Zhangtang Fending Groyne15.79km Yongchang Fending Groyne and 10.32km Yanxi Fending Groynethe total length of guide support canal is 61.33km including 17.18km long county seat guide support canal to be dredged and resumed as per the original section14.45km Yongchang Guide Support Canal to be refit as per the design standard29.70km Yanxi and Wanhe guide support (drainage) canals to be built 11.85km diversion canal to be refit6 new pumping stations with total installed capacity of 5456kW and 2 new regulating sluices.
The arrangement of all the protection works is shown in Table 2.92. Arrangement of fending groynes and drainage works of all the protection areas are shown in DRAWING NO. 11 DRAWING NO. 14.
� Fending groyne design

2.0 Project Overview
57
The designed fending groyne types are as follows:
Wanhe Section: ~1km long fending groyne close to the pivot area is a clay core pebble one, flood wall is locally applied for earth rockfill fending groyne section with restriction, the remained part is earthen groyne.
Zhangtang Section: the whole section is made of homogeneous soil groyne.
Jintan Section: ~5km long homogeneous soil groyne is arranged near the excavated place of the Yunting River rerouting and along the upstream of the Yunting Riverflood wall is locally applied for earth rockfill fending groyne section with restriction, the remained part is clay core pebble groyne.

2.0 Project Overview
58
Table 2.9 2 Protection works arrangement
Fending groyne Guide support canal/Drainage canal Drainage pumping
station/Regulating sluice
No Work name
Name Length (km)
Design level (m)
Top elevation
(m)
Top width (m)
Average raised height (m)
Name
Canal line
length (km)
Canal bottom width (m)
Canal depth (m)
Canal bed longitudinal
gradient i
Design level (m)
Top elevation
(m) Name
Installed capacity
(kW)/ Flow (m3/s)
Remarks
Yanxi Upper Guide
Support Canal
3.0 2.86 4.54
2.04 0.0005 61.65 60.00
62.36 60.71
New canal
Yanxi Down Guide
Support Canal
6.8 1.56 4.55
2.05 0.0005 60.82 58.10
61.53 58.81
New canal 1
Yanxi protection
work
Yanxi Groyne
10.32 58.4 60.06
59.4 61.06
4 4.04
Yanxi Diversion
Canal 2.0 3.94 1.77 0.0005 52.77
51.77 53.41 52.41
Yanxi Drainage Pumping Station
900/12.80
Refit canal
Wanhe Guide
Drainage Canal new
19.60 14.28 3.52 0.000165 50.27 53.50
51.35 54.58
Wanhe Drainage Pumping Station
2000/28.50
Pump & sluice combined, Self
drainage capacity 70m3/s at non-flood
season 2
Wanhe protection
work
Wanhe Groyne
8.12 57.75 59.27
58.75 60.27
4 3.55 Wanhe
Diversion Branch Canal Refit
2.20 3.50 1.85 0.0005 50.59 51.69
51.25 52.35
Wanhe Regulating
Sluice 70 Sluice passing flow
3 Zhangtang protection
work
Zhangtang Groyne
0.8 59.30 59.32
60.30 60.32
4 3.59 Zhangtang Regulating
Sluice 993 Sluice passing flow

2.0 Project Overview
59
Table 2.9 2 Protection works arrangement (Cont’d)
Fending groyne Guide support canal/Drainage canal Drainage pumping station/Regulating
sluice
No Work name
Name Length (km)
Design level (m)
Top elevation
(m)
Top width (m)
Average raised height (m)
Name
Canal line
length (km)
Canal bottom width (m)
Canal depth (m)
Canal bed longitudinal
gradient i
Design level (m)
Top elevation
(m) Name
Installed capacity (kW)/ Flow (m3/s)
Remarks
Yunting River
Rerouting 16.40 60 4.0 0.0004 68.09
61.51 69.09 62.51
2km Yunting River rerouting section
Upper Guide
Support Canal
5.45 2.98 4.44
2.00 0.0005 65.73 63.00
66.43 63.70
Discharge at Yunting River, refit
canal
Down Guide
Support Canal
9.00 0.50 4.80
2.16 0.0005 63.40 58.90
64.14 59.64
Refit canal
4 Yongchang Protection
Work
Yongchang Groyne
15.79 59.98 62.98
60.98 63.98
4 4.29
Jintan Diversion
Canal 3.65 3.51 2.05 0.0005
53.05 54.88
53.76 55.59
Jintan Drainage Pumping Station
1000/ 16.00
Refit canal
Shangtian Guide
Support Canal
6.58 3.44 5.11
2.30 0.0004 67.00 64.37
67.78 65.14
Huangjiaba Drainage Pumping Station
1400/ 27.25
Dredged canal
Donggang Guide
Support Canal
10.60 1.45 6.50
2.93 0.0002 63.22 61.10 64.15 62.03
Dongmen Drainage Pumping Station
111/1.95 Dredged canal 5
Taihe County
Seat Protection
Work
Taihe County
Seat Groyne
3.36 61.40 61.97
62.40 62.97
4 4.02
County Seat
Diversion Canal
4.00 5.24 2.36 0.0005 57.5 55.50 58.29 56.29
Refit canal

2.0 Project Overview
60
Yanxi Section: ~1.6km long homogeneous soil groyne close to Yanxi Town with application of the existing groyne, flood wall and wave protection wall are locally applied for earth rockfill fending groyne section with restriction, the remained part is clay core pebble groyne.
Taihe Section: the whole section is made of clay core pebble groyne.
� Groyne type design
Clay core pebble groyne: the inside and outside slopes are in gradient 1:1.8, the river-facing groyne is face protected with C15 prefabricated slab with protection slope thickness of 0.15m downstream slope is of grassed slope, groyne top has cemented stone road and 0.6m high wave protection wall. The groyne body is built with pebble and with clay core for antiseepage, crest width of 2mgradient of 1:0.25. C15 concrete drain ditch is set at the back of the groyne with depth of 0.5m and bottom width of 0.5m.
Homogeneous soil groyne: the river-facing groyne is face protected with C15 prefabricated slab with protection slope thickness of 0.15m and o.15m thick bedding pebblegradient of 1:2.5, downstream slope is of grassed slope, groyne top has cemented stone road and 0.6m high wave protection wall with gradient of 1:3. The groyne body is built with homogeneous clay for antiseepage. Drain ditch is also set at the back of the groyne.
Flood wall: C20 concrete gravity wall, top width of 1.5m and back slope gradient of 1:0.3.
� Groyne foundation antiseepage
When the ground elevation of the protected object at back of the groyne is higher than the backwater elevation of the reservoir area at 4700m3/s, impervious wall shall be built at the groyne foundation to assure the safety of the protection area.
� Arrangement of drainage pumping stations (regulating sluices) The drainage pumping stations (regulating sluices) of every protection area are set at the discharge of the original canal within the protection area. Considering when standard-exceeding flood happens, the protection area will be filled fully with water, which is required to drain out timely after flood, axial flow pumps will be applied, the pump house shall be of wet house type, composed of pump storey and motor storey, the ground elevation of pumping stations shall be filled up flush with groyne top.
� Arrangement of guide support (diversion) canals Guide support canal line, section guide drainage flow, landform, geology, houses and farmland distribution along the canal line will be decided as per related code, try to minimize house relocation, land occupation, and to make full use of the existing drainage canals. The longitudinal slope of canal normally i0.00015 0.00050, earth canal at side slope of excavated canal m1.5 stone canal m 0.75 fill canal m 1.50 flow in canal meets the condition of no scouring and no silting. The top width of fill section of guide support canal is 2.0m.

2.0 Project Overview
61
2.10 Reservoir Inundation and Land Occupation of the Project
2.10.1 Main inundated substances of the reservoir area
After the fending groynes and farmland elevating measures, the Project is still involved in inundation of five townships, one reclamation farm, forty-four administrative villages of Taihe County. Main inundated substances of the upper dam site plan (the recommended plan) at normal impounded level of the reservoir area 56.5m are as follows:
After the fending groynes and farmland elevating measures, the reservoir inundation and the bury of protection works will need to permanently occupy 2829.8Mu farmland (including 701.85Mu paddy field, 2127.9Mu dry land, among which there are 198.27Mu basic farmland), 104.4Mu garden plot, 3130.9Mu other types of land, 32588.6Mu water area; It is involved in relocation of 711 people, impacts of 8 enterprises and institutions, house relocation of 4.56×10⁴m2 and fence relocation of 6392.59m2 11610m2 cement ground, 48 simple buildings, 8 wells, 161 pressing wells, 1 water tower, 221 tombs, 1576 odd fruit trees; 2.21km Grade 4 road, 10.71km tractor road, 18 ferries and docks, 8.62km aerial fiber cable 5.84km underground cable 2.48km CATV line 5.03km 10kV transmission line 7.55km 0.4kV transmission line 3 transformers, 1 tiny hydropower station (200kW), 15 small electrical pumping stations, 1 water plant, 27 sand picking facilities and some other facilities.
The inunation area is involved in inundation of 1453.5Mu farmland and 28.05Mu garden plot, population resettlement of 524 people, and house relocation of 26,602.74m2.
The protection work is involved in bury and occupation of 1376.25Mu farmland and 76.31Mu garden plot, population resettlement of 187 people, and house relocation of 18,947.46m2.
The scope of the reservoir inundation is given in DRAWING NO. 15.
2.10.2 Land occupation
� The Project will permanently acquire 42525.1Mu, including 2977.3Mu farmland (incl. 198.27Mu basic farmland), 3468.4Mu woodland, and 36079.4Mu of other types.
�The Project will temporarily occupy 6895.65Mu (incl. 1237.05Mu by farmland elevating, 78.15Mu by resettlement area), including 2748.6Mu farmland, 1000.8Mu woodland, and 3146.25Mu of other types. Land occupied by the project is summarized in Table 2.10 1.

2.0 Project Overview
62
Table 2.10�1 Summary of Land occupied by the project Unit: Mu
Nature of land
occupied Item Total Farmland
Paddy field
Dry land
Garden plot
Wood land
Uneven ground
Residents used land
Land not
applied
Water surface
Land for
traffic Bottomland
Pivot area 424.95 147.5 34.5 112.95 0 72.0 202.05 0 0 3.45 Project
management area
49.95 0 0 0 0 0 49.95 0 0 0
Protection works
3877.95 1376.25 402.6 973.65 76.35 1237.15 1017.0 10.2 56.4 104.6
Area of reservoir
inundation 38172.15 1453.5 299.25 1154.25 28.05 2159.25 1500.9 106.2 415.05 32484 25.5
Permanently occupied
land
Total 42525.1 2977.3 736.35 2240.9 104.4 3468.4 2769.9 116.4 471.45 32592.1 25.5 Widened
road 48.0 531.15 48.0
Resettlement area
78.15 192.0 39.0 39.15
Farmland elevating
area 1237.05 283.65 1237.05
Construction production & residence
areas
963.15 0 37.2 493.95 0 227.7 49.95 154.35
Construction road
412.95 465.75 3.75 188.25 0 108.15 97.5 15.3
Soil sites 517.95 1237.05 0 283.65 0 156.9 77.4 0 Gravel sites 1873.95 0 0 0 0 0 0 1873.95 Spoil sites 1764.45 39.0 13.95 451.8 0 508.05 732.6 58.05
Temporarily occupied
land
Total 6895.65 2748.6 1330.95 1417.65 0 1000.8 957.45 39.15 48.0 2101.65

2.0 Project Overview
63

2.0 Project Overview
64
2.10.3 RAP
2.10.3.1 Resettlement and relocation
The population with farmland inundated and houses not inundated by this project can be resettled through farmland adjustment from the same village or other adjacent villages. Under current situation, the project area needs to resettle rural population of 2175 people (including land occupied by reservoir inundation, protection works, and pivot work), the production resettlement population at the design level year 2010 is 2271 people.
The population to be removed and resettled includes the population below the reservoir inundation line, the population with farmland inundated and houses not inundated needing to resettled in other places and the population affected by the protection works needing to be resettled. The resettled population of the project is those who need to be resettled due to the reservoir inundation or bury of the protection works, the current population to be resettled is 711 people and the population to be resettled in 2010 is 744 people.
2.10.3.2 Relocation and construction plan of affected resettlement point
The affected people will be resettled mainly in the same village, same team and same township, assuring all the affected households to have production conditions, house construction conditions, and infrastructure conditions of water and power supply and road which are not lower than before. There are 3 planned concentrated resettlement points, altogether 269 people resettled. Resettlement destinations of affected residents are shown in Table 2.10 2 Resettlement points distribution is shown in DRAWING NO. 15.
Table 2.10 2 Resettlement destinations of affected residents
Township Administrative
village Number of Households
Population Resettlement
Yanxi Caoping 110 368 Partly concentrated resettlement, partly local
resettlement and scattered resettlement
Gaping 2 10 Local resettlement and scattered
resettlement
Yanxi Residents
Committee 1 4
Local resettlement and scattered resettlement
Subtotal 113 382
Wanhe Pingshang 71 264 Partly concentrated resettlement, partly local
resettlement and scattered resettlement
Gaozhang 9 26 Local resettlement and scattered
resettlement
Huwei 6 21 Local resettlement and scattered
resettlement
Subtotal 86 311
Chengjiang Yuye 1 5 Local resettlement and scattered
resettlement
Mashi Shukou 6 46 Concentrated resettlement
Grand total 206 744

2.0 Project Overview
65
2.10.3.3 Relocation and construction plan of affected enterprises and institutions
According to the substance index survey results, there are 8 units involved in total house relocation area of 4373.71m2. The affected enterprises and institutions are mainly involved in warehouse, processing plants and part of the firms, most of them are located at the scope affected by fending groynes or at the edge of the reservoir inundation line, part of the production and residence land and facilities of the enterprises and institutions are affected. Among the affected units, no one is required to wholly remove, all are just partly affected, and their main bodies are not affected. Relocation and construction plan of affected enterprises and institutions are given in Table 2.103.
Table 2.10 3 Relocation and construction plan of affected enterprises and institutions
No Unit Relocated house
area (m2)
Impact
degree Resettlement
1 Taihe Fenghuangtun Industry
Co. Ltd. 351.45 Local Demolition compensation
2 Jiangbian Plastics Factory 149.61 Local Demolition compensation 3 Shiqian Sand Pickup Plant 39.50 Local Demolition compensation
4 Yanxi Channel Administration
Station 382.19 Local Nearby resumption
5 Taihe Shipping Co. Ferry 16.91 Local Demolition compensation
6 Brick Works 2259.96 Local Partly demolition
compensation, partly nearby resumption
7 Sand Works 376.86 Local Demolition compensation
8 Wanhe Grain Supply Center 797.23 Local Partly demolition
compensation, partly nearby resumption
2.10.3.4 City residents’ removal plan
After the fending groynes are built, the project will not be involved in city residents’ removal.
2.10.3.5 Resumption and construction plan of special works
Land acquisition of the project is involved in 2.21km Grade 4 road, 10.71km tractor road 18 ferries and docks, 82.47hm2 land elevating area which will be resumed as per the original scales and functions in the planned compensation modes.

2.0 Project Overview
66
2.11 Construction Organization Design
2.11.1 Construction diversion
� Diversion standard
Diversion structure belongs to Grade 5 one, being earth rockfill cofferdam, the recommended diversion design flood standard is for withstanding a once-in-a-five-year flood.
The cofferdams of Stage 1 and Stage 2 both are earth rockfill overflow ones, in order to meet the inundation control condition of the upstream reservoir area and to reduce the protection load of the cofferdams, the Stage 1 overflow cofferdam is designed as per the standard for withstanding a once-in-a-3-year dry season flood with water retaining height designed for withstanding a once-in-a-5-year dry season flood (height of overflow cofferdam is raised); The hydropower station applies the Stage 2 cofferdam to retain water for generating power and for ship lock navigation. Therefore the Stage 2 overflow cofferdam is designed to meet the minimum navigational level and power generating flow requirement, with its water retaining height designed for withstanding a once-in-a-5-year dry season flood. The powerhouse and the diversion structures of the ship lock are designed for withstanding a once-in-a-5-year flood.
� Diversion period The hydrological features of the Kan River where the Project is situated are flood with high peak and big flow during flood season and big level amplitude at flood and dry seasons. Through construction method and progress analysis, together with hydraulic structure arrangement, landform condition, it possesses diversion condition at dry season. It is recommended to construct at dry season, from August to the next February.
The ship lock and the powerhouse are located at the left and right banks of the Kan River, the riverbed is wider at flood season. According to the principle that the ship lock and the powerhouse generating sets shall be put into operation as early as possible, it must be guaranteed that the powerhouse and the ship lock can be constructed all the year around, therefore, the powerhouse at the left bank and the ship lock at the right bank can be constructed all the year around with capacity of withstanding a once-in-a-5-year flood.
� Diversion method
In accordance with the arrangement of hydraulic structures and landform condition, the project possesses the stage diversion condition at dry season, the diversion principle is as follows: At Stage 1, enclose the left bank and construct powerhouse and 11-hole scouring flood gate first, and at meantime, enclose the dam section of the ship lock, and dockgate channel at the right bank, applying the channel middle to overflow, small foundation pit cofferdam will be completed at the end of the first dry season; The powerhouse and the ship lock can be constructed all the year around under protection of the small foundation pit in the first flood season; In the second dry season, continue to enclose the 11-hole scouring flood gate and the powerhouse at the left bank, the dam section of the ship lock and dockgate channel at the right bank continue to construct under the protection of built cofferdam, using

2.0 Project Overview
67
the middle channel for overflow; In Stage 2, enclose the 13-hole flood gate at the middle, using the completed 11-hole scouring flood gate at the left bank for overflow, the powerhouse can use the retained water by Stage 2 cofferdam for generating power, at the end of the fourth dry season, the civil work of main project will be totally completed.
� Regulating structure
The cofferdams will make full use of the excavated materials of the main project, the type of regulating structure – cofferdams is of earth rockfill and concrete. To lower overflowed upstream level to meet the temporary inundation control requirement of the reservoir area, cofferdams of Stage 1 and Stage 2 both are overflow ones, the upstream and downstream cofferdam crests are equipped with self-breach subcofferdams.
Stage 1 cofferdam: Mixed materials excavated from the main project will be applied for filling cofferdam body, whose upstream is anti-scoured with block stone revetment, and whose downstream is protected with bamboo cylinder filled block stone revetment. High pressure vibrating grouting mortar is applied for antiseepage of the cofferdam body and its foundation cover layer.
Stage 2 upstream and downstream cofferdams: The structure type of the cofferdams is the same with Stage 1. The flood gate piers and the heightened downstream concrete guide wall will be used as Stage 2 longitudinal cofferdam for construction of lock chamber section of flood gate, concrete guide wall will be used as cofferdam body for other part construction.
Ship lock cofferdam: According to the general layout, the upstream section at the left side of upstream and downstream transverse cofferdam connects with the planned spoil site (antiseepage treatment done) at the riverside, its downstream section connects with the original riverside flood dike (strengthening and antiseepage treatment done), its right side connects with the longitudinal cofferdam of the ship lock chamber to form a closed antiseepage ring. The cofferdam of upper and down lock heads and chamber of the ship lock will be of non-overflow one, its upstream wetted face of the whole cofferdam will be protected in block stone revetment, which will be heightened with straw bag earth for retaining water at flood season, high pressure vibrating grouting mortar are applied for antiseepage of cofferdam body and foundation.
Powerhouse cofferdam: Upstream section uses powerhouse silt arrester, downstream section applies powerhouse tailwater canal side wall, upstream cofferdam body is of concrete gravity type structure, directly heightened on hydraulic structure. As for powerhouse small foundation pit longitudinal cofferdam, upstream section applies powerhouse silt arrester, downstream section applies powerhouse tailwater canal side wall, and cofferdam body is of concrete gravity type structure. High pressure vibrating grouting mortar is applied for antiseepage of transverse cofferdam foundation cover layer at upstream and downstream of the powerhouse, its left side connects with the Wanhe flood dike and bank dike, the upstream section at its right side joins the powerhouse silt arrester, the downstream section at its right side joins the powerhouse tailwater canal side wall, forming a closed antiseepage ring.
� River closure The closure time of Stage 2 riverbed is early October of the third year, the closure flow is

2.0 Project Overview
68
944m3/s the closure method is single-shoreup vertical closure method with maximum fall of 0.29m average flow at closure gap of 1.95m/sdischarge per unit width of 3.63m3/s.m at closure gap. Middle stone and stone slag are applied to fill the closure gap, after triangle sections are applied, concrete tetrahedra, large block stones, or reinforced concrete cage to fill the closure gap.
� Navigation during construction period
As per the construction diversion plan, as for Stage 1, enclose the left bank and construct the powerhouse and 11-hole scouring flood gate at the left bank first, at the same time, enclose the dam section of the ship lock, and dockgate channel at the right bank, apply the middle part of the channel for navigation. Because the channel is narrowed and flowrate is increased, it may obstruct the navigation during flood season, while it is good for navigation during dry season after the upstream is deepened. The navigation parameters of the planned channel are as follows: When river section average flow is smaller than 2.0m/s, ships can be self-propelled; When river section average flow is 2.03.0m/s, tug boat must be applied to help aiding navigation; When river section average flow is bigger than 3.0m/s, the river section is closed for navigation.
At Stage 2, the ship lock at the right bank has been completed and navigable. At the same time, 11-hole scouring flood gate at the left bank completed can be applied to control release flow, in order to the requirements of upstream and downstream navigational levels and flow conditions.
The Project will cause a short navigation interrupting time before and after closure of Stage 2 cofferdam, it is estimated that the navigation interrupting time is about 2 months.
The construction diversion plan arrangement is given in DRAWING NO. 16 and DRAWING NO. 17.
2.11.2 Construction of main project
The buildings and structures of the pivot from left to right are mainly composed of the joint dam, powerhouse, release structures (3-hole scouring sluice and 21-hole flood gate), dockgate channel dam section, and the ship lock at the left bank and the joint dam at the right bank, the hydropower station is equipped with 6×1.95MW through-flow type generating sets.
� Construction road
The construction site road at the left bank will be applied for excavation of water part at the left bank, and for forking to foundation pit at upstream and downstream cofferdams, thus to form a circular traffic; The construction site road at the right bank will be applied for excavation of water part at the right bank, and for forking to foundation pit at upstream and downstream cofferdams, thus to form a circular traffic.
� Construction method Hydraulic back shovel digging and loading dump trucks will be applied for pebble excavation to transport spoils out, partly to heighten and thicken the cofferdams, the remained to the spoil sites at the left and right banks.

2.0 Project Overview
69
Foundation pit stones are excavated in two layers of steps, steps will be used for excavation separately at upstream and downstream. 100 type in-the-hole drill will be applied for drilling at a large area of excavation, millisecond electric blasting caps will be applied for split-second squeeze blasting, hand air drills are used to drill sides and corners, plain detonators are used for blasting (without underwater blasting), plane of reference and local part are manually cleaned up; For mudstone exposed place, drain ditch and collector well will be set at the surrounding to lower water table, meantime, concrete will be sprayed on the excavated plane of reference and slope to prevent from being weathered and expanded. Bulldozers are used to collect the excavated wastes which will be transported out by dump trucks, partly for filling Stage1 cofferdam, partly to stack in the spoil site at the left bank for backfill at late stage.
Materials for pebble or stone slags fill will come from the transit spoil site, with loaders for loading, dump trucks for transport, bulldozers for paving, vibratory rollers for compacting, and frog hammers for tamping sides and corners.
Concrete is blended in 3XJ3-1.5 concrete blending building, which will be transported by 6m3 concrete agitating lorry and 10t dump truck to the working plane.
The main powerhouse concrete comes from the concrete blending building at the left bank. At the upstream and downstream of the dam axial line are respectively arranged portal crane rails, 1 MQ600/30 type and 1 MQ1000 type overhead portal crane respectively for concreting of the main powerhouse and part of the auxiliary powerhouse. Concrete is taken from the concrete blending building at the left bank by 15t dump trucks. Trucks go down to the foundation pits along Stage 1 cofferdam at the upstream and downstream sides, dumping the horizontal tanks within the hoisting range of overhead portal crane; As for concrete of other project area, crawler crane is used to hoist horizontal tanks into bin, variable frequency vibrator is used to flatten and compact the bin surface with deburring machine for deburring.
Concrete of scouring sluice and flood gate is blended in 3XJ3-1.5 concrete blending building, which will be transported by 10t dump truck to the working plane. As for concrete of gate foundation and piers, MQ600/30 type portal crane is used to hoist horizontal tanks into bin, portal cranes are arranged at upstream and downstream separately, during flood season, two-way portal crane rail at the dam crest at elevation 53.00m at the upstream side of gate piers can be applied; as for concrete of stilling basin and guide wall, crawler crane is used to hoist horizontal tanks into bin.
As for concrete of part of the left side wall of the ship lock body and flood gate along the ship lock centerline, two MQ600/30 type portal cranes respectively at upstream and downstream are used to hoist tanks into bins; as for concrete of other part and upstream and downstream approach channels, crawler crane is used to hoist horizontal tanks into bin; Steel template and composite template are jointly applied, the bins are manually flattened with mechanical vibrating.
Sectional circulating injection process from up to down will be applied, 150 type exploration drill is used for drilling, BW-250/50 type slurry pump is used for grouting.
Steel bar fabrication and erection: below 10mm disc steel bars will be straightened by windlass, above 10mm steel bars will be straightened and flattened manually, bended and cut mechanically, transported by 5t dump truck to working plane, colligated and welded

2.0 Project Overview
70
manually.
2.11.3 Construction transportation and construction factory facilities
2.11.3.1 Construction transportation
The existing roads at the left and right banks of the pivot will be extended to the construction work areas and construction working faces. The traffic lines within the project site include access road and dam crossing road, and special road to spoil sites with total length of new roads of 6km. Two steel trestles will be built at the lock chamber of the ship lock at the right bank when Stage 2 flood gate is constructed, which is 50m long and 5m wide (crossing upstream and downstream approach channels of the ship lock), construction vehicles can go to upstream and downstream cofferdam of Stage 2 via the ship lock, then to foundation pits.
Summary of construction roads within the main project site is detailed in Table 2.111. Summary of construction roads within the project site is detailed in Table 2.112.
Table 2.11 1 Summary of construction roads within the main project site
No Road Length �m� Road
width�m�
I Left bank
1 External road——1# spoil site——Residence
area at the left bank 1200 8
2 External road——aggregate handling system
——aggregate handling dock 800 8
3 Stage 1 upstream foundation pits—1# spoil site 350 8
4 Stage 1 downstream foundation pits—2# spoil
site 450 8
II Right bank
1 External road —aggregate handling system —
aggregate handling dock 900 8
2 External road —electromechanic equipment
warehouse — spoil site 1000 8
3 Ship lock, Stage 2 upstream foundation pits —
3# spoil site 400 8
4 Ship lock, Stage 2 downstream foundation pits
— 4# spoil site 500 8
III Others 400 8

2.0 Project Overview
71
Table 2.11 2 Summary of construction roads within the project site
Item Total Nature Length Remarks
Expanded 4km Main pivotal project
10km construction road New 6km
8m wide�incl. 4km permanent road
Expanded 22km Fending groyne work
41km construction road New 19km
Expanded 17km Drainage work
32km construction road New 15km
6m wide.
2.11.3.2 Construction factory facilities
� Aggregate processing system
An aggregate processing system will be set at the left bank and the right bank separately.
� Concrete aggregate processing system
Both a 4×0.8 m3 concrete blending station and a 3XJ3-1.5 type concrete blending building will be set at the left bank and the right bank separately.
� Mechanical maintenance system
Two mechanical maintenance stations and two truck garages will be set, each at the left and right banks.
� Integrated processing system
Timber processing plant, steel bar processing plant and concrete prefabricated part plant will be set respectively at the left bank and the right bank.
� Electromechanic equipment installation and metal framework consolidation shed The main purpose of metal framework consolidation shed is for preassembly, consolidation, test and etc. of embedded parts, gates, headstock gears, press steel pipe, water turbine power generating set and their electrical equipment. Metal framework installation yard and electromechanic equipment storage yard will be set at the left bank, a metal framework installation yard at the right bank.
� Construction air supply The main drilling machines for excavation of the main project are hydraulic drilling machine, hand pneumatic drill. As per the project schedule and features, an air supply station will be set at the left and right banks respectively.
Quantities of construction temporary buildings are shown in Table 01.
2.11.4 General construction arrangement
According to the actual situation of the pivotal project, it is classified into two work areas.
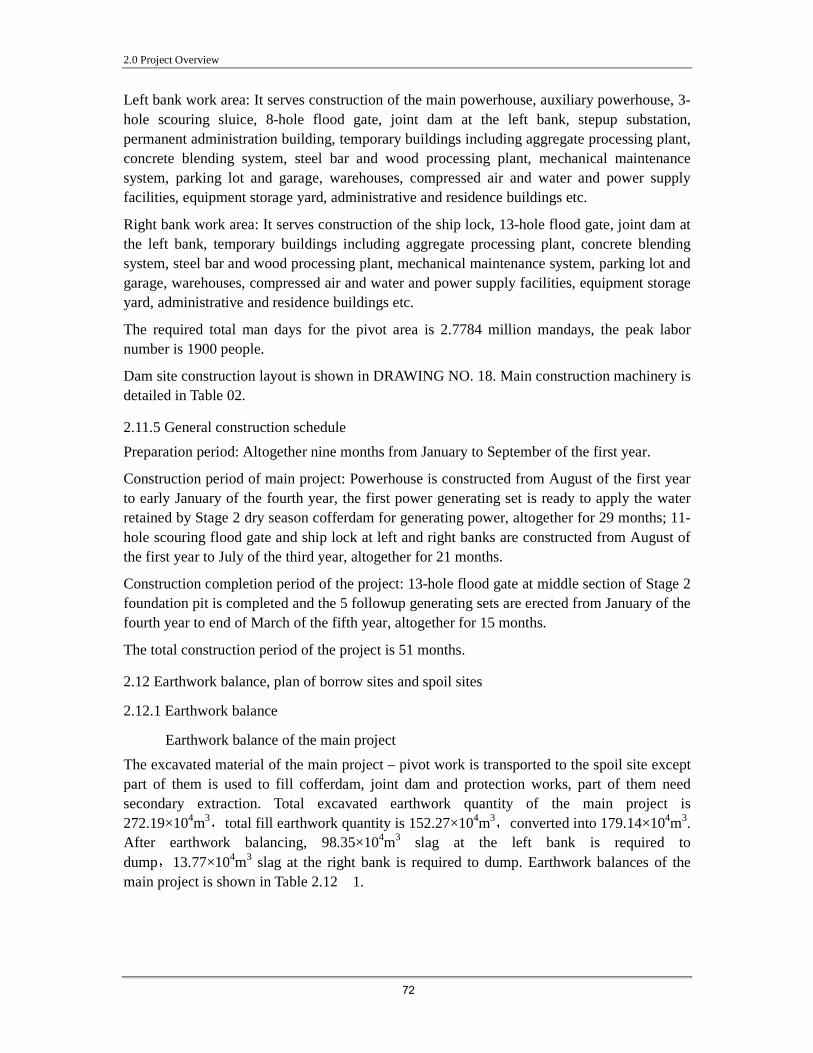
2.0 Project Overview
72
Left bank work area: It serves construction of the main powerhouse, auxiliary powerhouse, 3-hole scouring sluice, 8-hole flood gate, joint dam at the left bank, stepup substation, permanent administration building, temporary buildings including aggregate processing plant, concrete blending system, steel bar and wood processing plant, mechanical maintenance system, parking lot and garage, warehouses, compressed air and water and power supply facilities, equipment storage yard, administrative and residence buildings etc.
Right bank work area: It serves construction of the ship lock, 13-hole flood gate, joint dam at the left bank, temporary buildings including aggregate processing plant, concrete blending system, steel bar and wood processing plant, mechanical maintenance system, parking lot and garage, warehouses, compressed air and water and power supply facilities, equipment storage yard, administrative and residence buildings etc.
The required total man days for the pivot area is 2.7784 million mandays, the peak labor number is 1900 people.
Dam site construction layout is shown in DRAWING NO. 18. Main construction machinery is detailed in Table 02.
2.11.5 General construction schedule
Preparation period: Altogether nine months from January to September of the first year.
Construction period of main project: Powerhouse is constructed from August of the first year to early January of the fourth year, the first power generating set is ready to apply the water retained by Stage 2 dry season cofferdam for generating power, altogether for 29 months; 11-hole scouring flood gate and ship lock at left and right banks are constructed from August of the first year to July of the third year, altogether for 21 months.
Construction completion period of the project: 13-hole flood gate at middle section of Stage 2 foundation pit is completed and the 5 followup generating sets are erected from January of the fourth year to end of March of the fifth year, altogether for 15 months.
The total construction period of the project is 51 months.
2.12 Earthwork balance, plan of borrow sites and spoil sites
2.12.1 Earthwork balance
�Earthwork balance of the main project
The excavated material of the main project – pivot work is transported to the spoil site except part of them is used to fill cofferdam, joint dam and protection works, part of them need secondary extraction. Total excavated earthwork quantity of the main project is 272.19×10⁴m3 total fill earthwork quantity is 152.27×10⁴m3 converted into 179.14×10⁴m3. After earthwork balancing, 98.35×10⁴m3 slag at the left bank is required to dump 13.77×10⁴m3 slag at the right bank is required to dump. Earthwork balances of the main project is shown in Table 2.12 1.
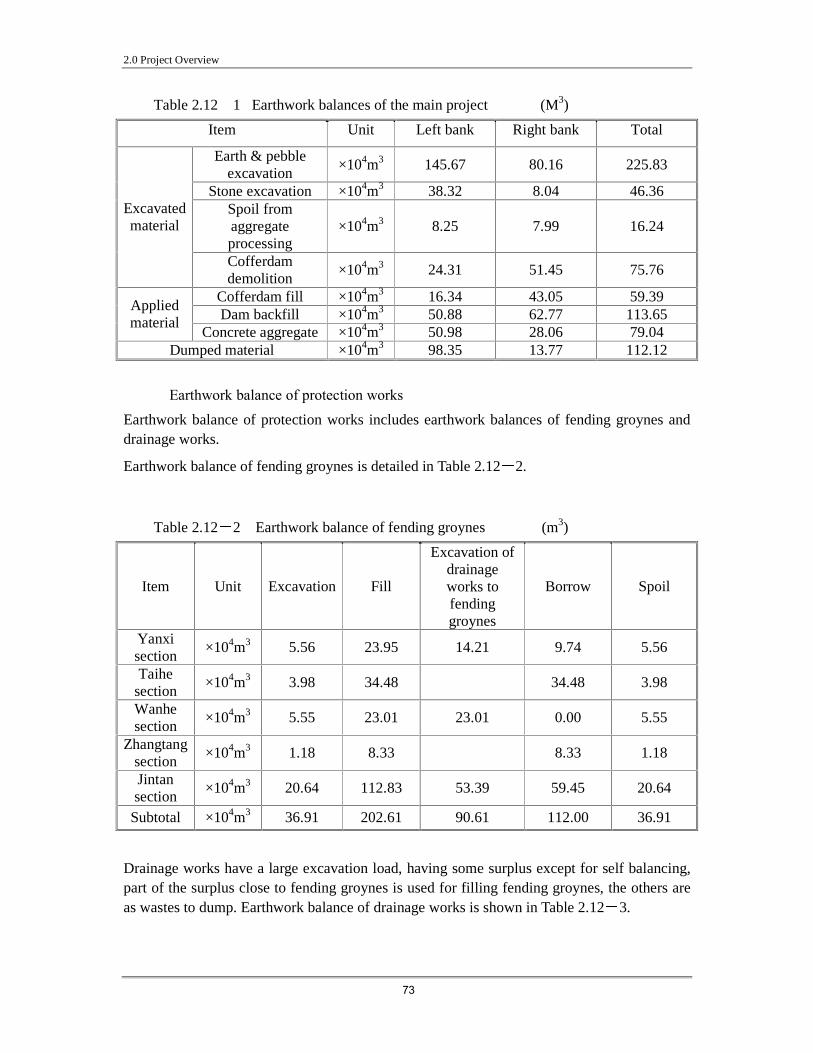
2.0 Project Overview
73
Table 2.12 1 Earthwork balances of the main project (M3)
Item Unit Left bank Right bank Total
Earth & pebble excavation
×104m3 145.67 80.16 225.83
Stone excavation ×104m3 38.32 8.04 46.36 Spoil from aggregate processing
×104m3 8.25 7.99 16.24 Excavated material
Cofferdam demolition
×104m3 24.31 51.45 75.76
Cofferdam fill ×104m3 16.34 43.05 59.39 Dam backfill ×104m3 50.88 62.77 113.65
Applied material
Concrete aggregate ×104m3 50.98 28.06 79.04 Dumped material ×104m3 98.35 13.77 112.12
� Earthwork balance of protection works
Earthwork balance of protection works includes earthwork balances of fending groynes and drainage works.
Earthwork balance of fending groynes is detailed in Table 2.12 2.
Table 2.12 2 Earthwork balance of fending groynes (m3)
Item Unit Excavation Fill
Excavation of drainage works to fending groynes
Borrow Spoil
Yanxi section
×104m3 5.56 23.95 14.21 9.74 5.56
Taihe section
×104m3 3.98 34.48 34.48 3.98
Wanhe section
×104m3 5.55 23.01 23.01 0.00 5.55
Zhangtang section
×104m3 1.18 8.33 8.33 1.18
Jintan section
×104m3 20.64 112.83 53.39 59.45 20.64
Subtotal ×104m3 36.91 202.61 90.61 112.00 36.91
Drainage works have a large excavation load, having some surplus except for self balancing, part of the surplus close to fending groynes is used for filling fending groynes, the others are as wastes to dump. Earthwork balance of drainage works is shown in Table 2.12 3.

2.0 Project Overview
74
Table 2.12 3 Earthwork balance of drainage works Unit: ×104m3
Item Excavation Backfill Lend to fending groynes
Self application
Lend
Application of drainage
canal material
Borrow Spoil
Wanhe 5.20 2.47 2.47 2.73 Yanxi 0.93 0.29 0.29 0.63 Jintan 0.38 10.29 0.38 9.92 0
Yongcheng 0.18 0.29 0.18 0.11 0 Dongmen 0.22 0.29 0.22 0.07 0
Drainage
pumping
stations
Huangjiaba 1.51 7.38 1.51 5.87 0 Yanxi Upper
9.34 1.75 6.54 1.75 1.05
Yanxi Down
11.07 1.59 6.64 1.59 2.84
Jintan Upper
5.32 8.34 5.32 3.02 0
Jintan Down
13.10 18.24 13.1 5.14 0
Shangtian 1.46 10.89 1.46 9.43 0 Donggang 17.31 21.39 17.31 4.08 0
Guide support canal
Wanhe 202.50 7.22 46.8 7.22 148.48 Yanxi 2.65 1.49 1.03 1.49 0.13
Yunting River
Rerouting 44.18 4.12 29.6 4.12 10.03 0.43
Jintan 20.83 5.92 5.92 8.16 6.76 County
Seat 10.33 4.05 4.05 5.94 0.34
Drainage canals
Zhoutou 1.50 0.88 0.88 0.62 Zhangtang
2.44 1.43 1.43 1.02
Wanhe
0.85 0.92 0.85 0.07 0
Regulating sluices
Zhoutou
0.55 0.51 0.51 0.04
Total 351.85 109.75 90.61 72.04 24.13 24.13 13.59 165.07
Draining pumping stations: Wanhe and Yanxi pumping stations will use their own excavated material for backfill, the surplus part is dumped as spoil; Jintan and Yongchang pumping stations will use their own excavated material and the earthwork from Yunting River rerouting; Dongmen and Huangjiaba pumping stations will use their own excavated material and the excavated material of the County Seat Draining Canal.
Guide support canals: Yanxi and Wanhe guide support canals will use their own excavated material for backfill, the surplus part is transported to the dike or dumped as spoil; Jintan Upper, Shangtian and Donggang guide support canals will prefer to use their own excavated material for backfill, the insufficient part is from the borrow site; Jintan Down Guide Support

2.0 Project Overview
75
Canal will prefer to use their own excavated material and the excavated material from drainage canal for backfill, the insufficient part is from the borrow site.
Draining canals: Yanxi Drainage Canal will use its own excavated material for backfill, the surplus part is transported to the dike or dumped as spoil; the other canals will use its own excavated material for backfill, the surplus part is transported to the dike or for other use or dumped as spoil.
Fending groynes: Fending groynes will apply part of the excavated material of drainage works for fill, the other parts will be exploited from other place, the total quantity of materials to be exploited is 111.98×10⁴m3 the total spoil quantity is 36.91×10⁴m3.
Draining works will have some surplus after its own balancing, part of the surplus material is used for filling protection works, part for filling cofferdams of temporary works, part for dumping locally.
2.12.2 Plan of borrow and spoil sites
Altogether 17 borrow sites are planned for the project with land cover area of 159.46hm2 the main types of occupied land are farmland, woodland and wasteland. The basic situations of borrow sites are shown in Table 2.12 4 the distribution of borrow sites is given in DRAWING NO. 19.
Altogether there are 38 spoil sites planned for the project, with spoil quantity of 314.1×10⁴m3 and stacked spoil area of 117.61hm2; 4 spoil sites are set at the left and right banks of the pivot work, the terrace at both banks is flat, spoil sites belong to flat or valley, occupying part of dry land. Spoil sites of the fending groyne work and draining work will be mostly slope toe flat and bottomland. The main occupied land is wasteland, woodland and farmland.
Basic situations of spoil sites are shown in Table 2.12 5 Arrangement of spoil sites is shown in DRAWING NO. 20 DRAWING NO. 22.

2.0 Project Overview
76
Table 2.12 4 Summary of planned borrow sites
No Name Description Reserve (×104m3)
Exploitation area (hm2)
I Borrow site of pivot
area
1 Pebble borrow site High flood land at the right bank
downstream of the dam site, mainly exploited from underwater
200 50
2 Block stone borrow
site Selected and outsourced 2.99×10⁴m3
3 Shihutang
Stage II terrace at the right bank downstream of the dam site, now mainly as woods of pines & China firs, partly as wasteland.
36 2
4
Soil borrow
site
Xiejia Stage II terrace at the left bank of the dam site, now basically as dry land, partly as woods of pines and China firs.
96 3
II Borrow sites of
fending groynes at reservoir area
23.26
1 Xigang Dry land, partly as woods of pines and
China firs 96 5.80
Huangkeng 100 4.20 2
Zoukeng Low-lying hill with higher topography, pine
tree woods
3 Laodongtang Low-lying hill with higher topography, partly planted with pine trees and China
firs. 30 5.13
4 Liufenchang Low-lying hill, partly planted with tee trees
woods & orange woods 140 1.33
5 Futang Low-lying hill with higher topography, partly planted with pine trees and China
firs. 240 1.20
6 Lianhuatang Ditto 80 1.07
7 Wanhedi Belt type site along the dike line, now
basically as dry land 30 3.66
8
Soil borrow
site
Chenjia Pine tree woods 30 0.87 9 Aggregate Flood land 74.93
III Borrow sites of drainage works
6.67
1 Bainigang Low-lying hill, mostly pines, a small
amount of dry land 80 2.00
2 Lijia Ditto 80 2.00 3
Soil borrow
site Tianhong Ditto 30 2.67
4 Aggregate Outsourcing
Total 84.53

2.0 Project Overview
77
Table 2.12 5 Summary of planned spoil sites
Type of occupied land (hm²) Location Name
Area (hm²)
Qty (104m³)
Average stacking
height�m� Landform
Farmland Woodland Wasteland Bottomland
Spoil sites at pivotal area
13.33 112.12 6.40 3.07 3.87
1# 5.00 35.77 7.14 Mild bottomland 2.40 1.15 1.45 Left bank
2# 3.73 28.57 7.65 Mild bottomland 1.79 0.86 1.08
3# 2.47 24.99 10.13 Mild bottomland 1.18 0.57 0.72 Right bank 4# 2.13 22.85 10.71 Mild bottomland 1.02 0.49 0.62
Dike work 8.01 36.91 5.39 1.93 0.69 Wanhe 1# 1.67 7.93 4.75 Bottomland 1.51 0.15 Zhangtang 1# 0.20 0.98 4.90 Mild bottomland 0.21
1# 0.81 4.00 4.94 Mild bottomland 0.16 0.65 2# 0.80 3.00 3.75 Mild bottomland 0.56 0.24 3# 0.80 4.00 5.00 Mild bottomland 0.56 0.24
Jintan
4# 1.06 5.30 5.00 Mild bottomland 0.52 0.54 1# 0.90 4.50 5.00 Mild bottomland 0.63 0.27
Yanxi 2# 1.10 3.80 3.45 Mild bottomland 0.77 0.33
County seat
1# 0.67 3.40 5.07 Slope 0.47 0.20
Drainage work 96.27 165.07 19.25 28.88 48.14 1# 1.00 1.02 Dump into canal 1.00 2# 0.53 1.60 3 Toe of slope 0.53 3# 1.00 3.00 3 Flat 1.00 4# 2.13 6.40 3 Flat 2.13 5# 1.20 3.60 3 Flat 1.20
6# 38.67 28.21 1 Narrow & long wasteland 18.97 19.69
7# 0.47 1.40 3 Ravine 0.14 0.33
8# 3.33 14.00 3 Narrow & long flat at toe of slope 4.01 0.66
9# 2.33 7.00 3 Ditto 2.33 10# 2.33 7.00 3 Flat 2.33
11# 2.00 6.00 3 Narrow & long flat at toe of slope 1.00 1.00
12# 8.67 19.00 3 Ravine 1.73 6.93
13# 3.33 10.00 3 Flat at toe of slope 3.33
14# 2.00 6.00 3 Ravine 1.00 1.00 15# 4.00 12.00 3 Mild slope 4.00 16# 3.33 10.00 3 Ravine 1.67 1.67 17# 13.33 16.00 1.2 Cove 4.36 8.97
Wanhe
Subtotal 91.00 152.23 19.10 28.32 43.59

2.0 Project Overview
78
Table 2.12 5 Summary of planned spoil sites (Cont’d)
Type of occupied land (hm²) Location Name
Area (hm²)
Qty (104m³)
Average stacking
height�m� Landform
Farmland Woodland Wasteland Bottomland
1# 0.80 0.40 0.5 Mild slope
0.80
2# 0.67 1.01 1 Mild slope
0.67
3# 0.67 1.53 1.4 Mild slope
0.20 0.47
4# 1.67 1.83 1.1 Mild slope
1.67
5# 0.13 0.15 1.1 Channel 0.03 0.11 6# 0.60 0.66 1.1 Mild land 0.12 0.48
Yanxi
Subtotal 4.53 4.65 0.00 0.15 0.20 4.19 County
seat 1# 0.4 7.52 2
Flat at toe of slope
0.20 0.20
Zhoutou 1# 0.33 0.67 2 Ditto 0.17 0.17
38 spoil sites 117.61 314.10 31.04 33.87 48.84 3.87
2.13 Investment Estimate and Capital Raising
Total investment of the Project: 2.2268932 billion yuan.
The capital composition of the project is given by the Owner, it is expected that the Ministry of Communications and Jiangxi Province will jointly provide 1.26 billion yuan as statutory capital and 100 million USD loan will be applied from the World Bank, the insufficient part will be applied from load of domestic banks with interest rate of 6.156% all the loans will be input pro rata in several years.
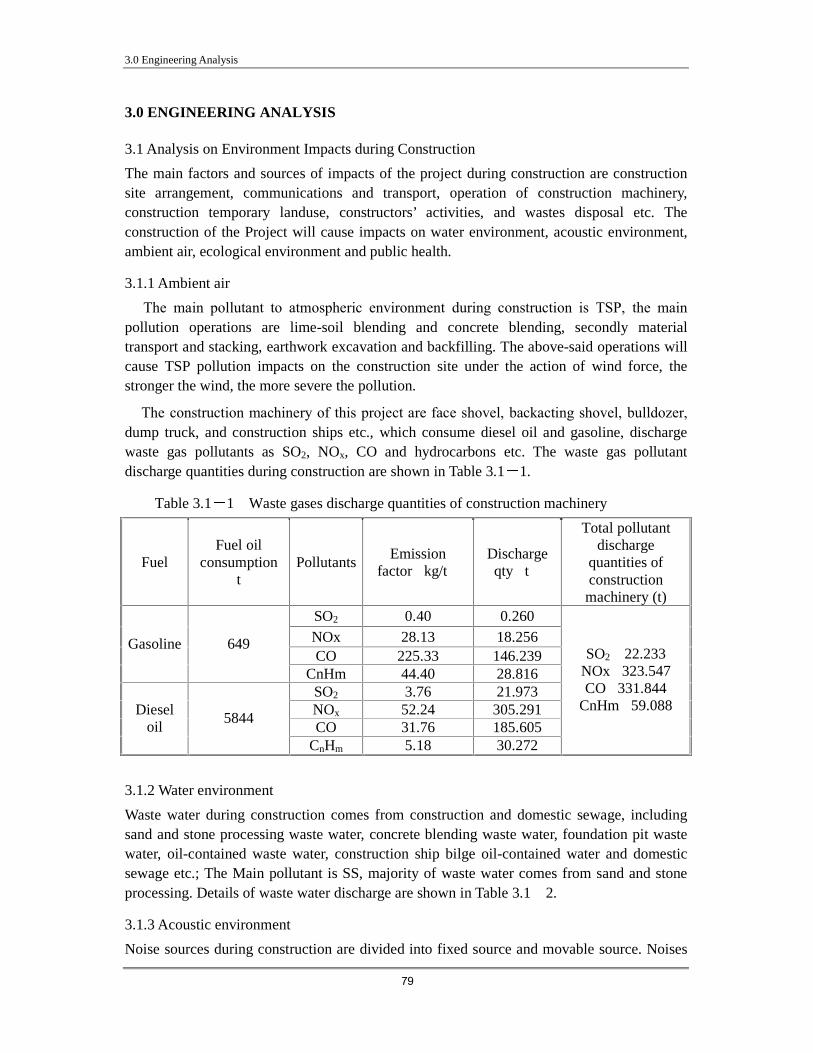
3.0 Engineering Analysis
79
3.0 ENGINEERING ANALYSIS
3.1 Analysis on Environment Impacts during Construction
The main factors and sources of impacts of the project during construction are construction site arrangement, communications and transport, operation of construction machinery, construction temporary landuse, constructors’ activities, and wastes disposal etc. The construction of the Project will cause impacts on water environment, acoustic environment, ambient air, ecological environment and public health.
3.1.1 Ambient air
� The main pollutant to atmospheric environment during construction is TSP, the main pollution operations are lime-soil blending and concrete blending, secondly material transport and stacking, earthwork excavation and backfilling. The above-said operations will cause TSP pollution impacts on the construction site under the action of wind force, the stronger the wind, the more severe the pollution. �
� The construction machinery of this project are face shovel, backacting shovel, bulldozer, dump truck, and construction ships etc., which consume diesel oil and gasoline, discharge waste gas pollutants as SO2, NOx, CO and hydrocarbons etc. The waste gas pollutant discharge quantities during construction are shown in Table 3.11.
Table 3.1 1 Waste gases discharge quantities of construction machinery
Fuel Fuel oil
consumption �t�
Pollutants Emission
factor�kg/t� Discharge qty�t�
Total pollutant discharge
quantities of construction machinery (t)
SO2 0.40 0.260 NOx 28.13 18.256 CO 225.33 146.239
Gasoline 649
CnHm 44.40 28.816 SO2 3.76 21.973 NOx 52.24 305.291 CO 31.76 185.605
Diesel oil
5844
CnHm 5.18 30.272
SO2 �22.233 NOx�323.547 CO�331.844
CnHm�59.088
3.1.2 Water environment
Waste water during construction comes from construction and domestic sewage, including sand and stone processing waste water, concrete blending waste water, foundation pit waste water, oil-contained waste water, construction ship bilge oil-contained water and domestic sewage etc.; The Main pollutant is SS, majority of waste water comes from sand and stone processing. Details of waste water discharge are shown in Table 3.12.
3.1.3 Acoustic environment
Noise sources during construction are divided into fixed source and movable source. Noises
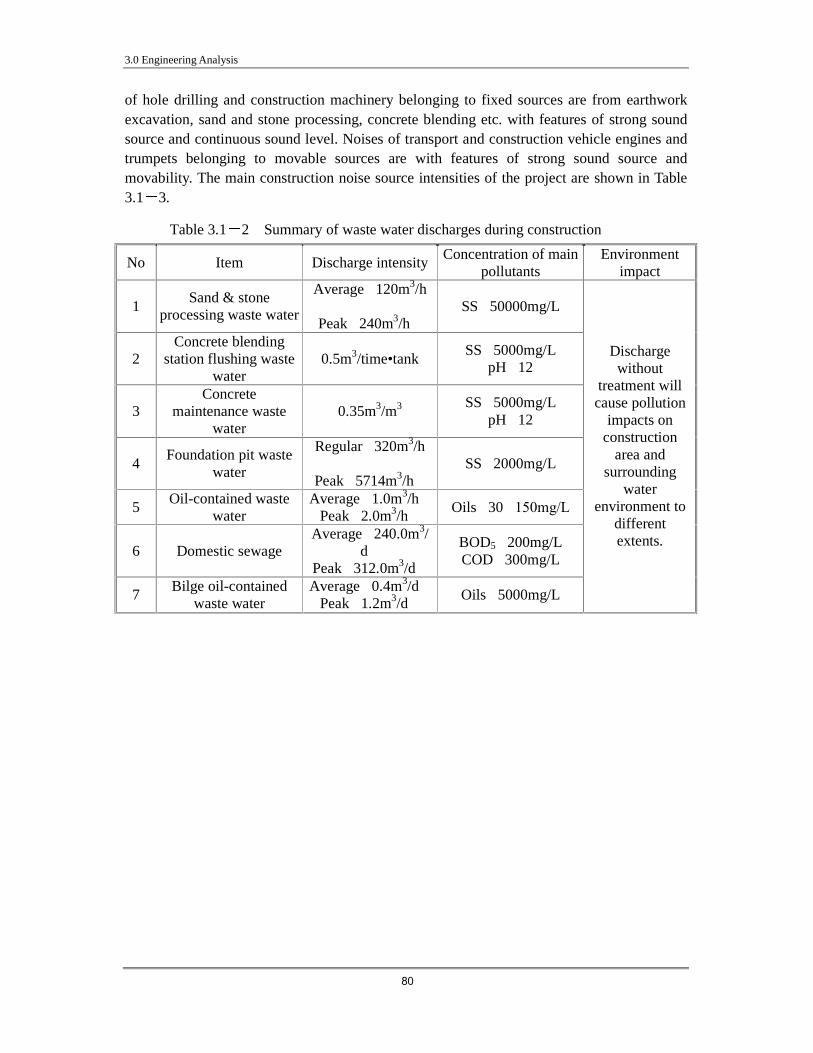
3.0 Engineering Analysis
80
of hole drilling and construction machinery belonging to fixed sources are from earthwork excavation, sand and stone processing, concrete blending etc. with features of strong sound source and continuous sound level. Noises of transport and construction vehicle engines and trumpets belonging to movable sources are with features of strong sound source and movability. The main construction noise source intensities of the project are shown in Table 3.1 3.
Table 3.1 2 Summary of waste water discharges during construction
No Item Discharge intensity Concentration of main
pollutants Environment
impact
1 Sand & stone
processing waste water
Average�120m3/h�
Peak�240m3/h� SS�50000mg/L
2 Concrete blending
station flushing waste water
0.5m3/time•tank SS�5000mg/L
pH�12
3 Concrete
maintenance waste water
0.35m3/m3 SS�5000mg/L
pH�12
4 Foundation pit waste
water
Regular�320m3/h�
Peak�5714m3/h� SS�2000mg/L
5 Oil-contained waste
water Average�1.0m3/h�
Peak�2.0m3/h� Oils�30�150mg/L
6 Domestic sewage Average�240.0m3/
d� Peak�312.0m3/d�
BOD5�200mg/L COD�300mg/L
7 Bilge oil-contained
waste water Average�0.4m3/d�
Peak�1.2m3/d� Oils�5000mg/L
Discharge without
treatment will cause pollution
impacts on construction
area and surrounding
water environment to
different extents.

3.0 Engineering Analysis
81
Table 3.1 1 Main construction noise source intensity
Type Description Noise level A [dB(A)]
Blender, blending station 75-88
Crusher, screener 95-100
Windlass, crane 85�90
Excavator 78
Drilling machine 81
Air compressor 92
Fixed source
Explosive blasting 130
Camion�light-duty� 82�90�76�84�
Camion�medium-duty� 85�91�79�85� Movable source
Camion�heavy-duty� 88�93�84�89�
Note: noises inside and outside brackets are those of uniform speed (50km/h) and acceleration respectively.
3.1.4 Ecological environment
The main work contents of the project include structure construction of the dam site, fending groynes of five protection areas, 6 drainage pumping stations, 2 regulating sluices, and guiding support canal, temporary landuse of construction firms and facilities, temporary construction road landuse, landuse of material stacking site and waste dumping site. The main construction impacts on ecological environment include vegetation damage, farmland occupation, change of landform and topography to affect natural resources, construction waste water, gases and solids to cause change of surrounding environment quality, resulting in affecting habitat quality of animals and plants.
� Water and soil erosion caused by construction Construction activity will disturb the earth’s surface, damage the landform, change the original landform, topography and land application mode, destroy water and soil conservation facilities. The project construction to cause water and soil erosion are foundation excavation of the main work, construction road construction, construction site leveling, construction of auxiliary works, excavation of material sites, waste disposal etc., which will disturb the earth’s surface, damage the vegetation, cause discarded soil and slags due to excavation, it no measures are taken, it will cause water and soil erosion and impacts on the ecological environment at the construction site to different extents.
� Reduction of vegetation and farmland
The Project will permanently acquire 42525.1Mu land, including 2977.3Mu farmland (inc. basic farmland 198.27Mu), 3468.4Mu woodland and 36079.4Mu of other land types.
The Project will temporarily occupy 6895.65Mu (1237.05Mu by farmland elevating,

3.0 Engineering Analysis
82
78.15Mu by resettlement area), including 2748.6Mu farmland, 1000.8Mu woodland and 3146.25Mu of other land types.
Land occupation by the project will directly destroy forest community and vegetation and cause loss of vegetation quantity; Total of permanent and temporary landuse of 5725.9Mu will cause impacts on agricultural production to a certain degree. Farmland elevating and vegetation resumption of temporary landuse can compensate losses of vegetation and farmland to a certain extent.
� Impacts on terrestrial organisms Through site survey, no famous trees or state grade protected wild plants are found within the project area; There are 11 species of provincial grade protected plants within the project area as podocarpus macrophyllus, sweet osmanthus, camellia, coptis, horned holly, iron-colored holly, Chongyang tree, gentian, yellow sandalwood, soupberry and lucid asparagus.
Through site survey, no state grade protected wild animals are found within the project area; There are 20 species of provincial grade protected animals within the project area, including 4 species of amphibians, 3 species of reptiles, 12 species of birds and 1 species of beast.
� Impacts on the nature reserve and famous and old trees It is found through site survey that there are 215 grade 3 old trees within the project area, including 211 camphors, 2 Cupressus funebris, 1 Sabina chinensis, 1 Castanopsis sclerophylla. Old trees have formed a community at the county grade nature reserve of Zhujia Village of Tangzhou Township, and are scattered at Huanghangpengxia, Xinzhou, Shihutang, Jiangjiazhou, Xiabian Village, Yinxiajiang, Taipan, Zhangjia and Laohukeng etc. It is site authenticated by the experts organized by the Greening Commission of Jiangxi Provincial Forestry Bureau that all the old trees distributed within the project area belong to Grade 11 protected ones (Details are given in APPENDIX 5).
The fending groyne line of the Yongchang Protection Area in the engineering design goes through the core area and buffer area of the county grade nature reserve – Zhujia Village Camphor Woods, Tangzhou Township.
During construction, soil borrow for groyne building, construction of bunkhouse and mechanical construction may cause direct mechanical damages to root system, trunk or crown of old trees nearby, especially the old trees at the fending groynes. If the newly filled groynes are over 1.2m thick, this may cause adverse impacts on breathing of root systems of old trees, root crowns and the buried part of trunks of old trees are hard to germinate new root systems, causing severe impacts on growth of old trees.
� Impacts on aquatic organisms and fish spawning sites
Cofferdam formation and foundation pit drainage etc. will cause turbidity and suspended solids of local water area increased and will cause short-run local impacts on habitat of fishes and planktons.
Cofferdam will occupy a very big flow cross section, reducing the area of flow cross section. Structures will disturb water flow form to a certain extent and change local flow field, causing phenomena of back water and level raising at the dam site, affecting the habitat of

3.0 Engineering Analysis
83
fishes and planktons.
There are three spawning sites at Baijiaxia, Taihe and Yanxidu distributed in the Kan River section of the project, the Taihe and Yanxidu spawning sites are located in the reservoir area of the project, which will be affected to variant degrees during construction period.
� Impacts on landscape
Excavation and filling and reservoir area inundation will cause impacts on the natural landscape of the dam area and the reservoir area to a certain degree; Area change of different landforms will cause change of productivity and stability of natural ecological system of the region and cause impacts on the integrity of the ecological environment of the project area to a certain extent.
3.1.5 Solid waste
Main solid wastes during construction include construction garbage and domestic garbage from constructors, as per the quantity of constructors, based on 1kg/manday, the peak solid waste generating quantity is 3900kg/d during construction. The total construction garbage quantity generated during construction is about 200300t.
3.1.6 Public health
The total construction time of the project is over four years, manpower at construction peak is 3900men per day. With increase of population density within the construction area during construction, constructors may carry in infectious disease pathogen, having adverse impacts on environmental sanitation and public health etc. Constructors from outside enter the new environment that are more vulnerable to local epidemic diseases over local people.
3.2 Inundation, Land Occupation and Resettlement
Inundated land by the reservoir area and permanent and temporary landuse of the project will cause a certain impact on agricultural production and fishery and on the normal production of firms and institutions to be relocated, and on normal work and daily life of the affected people to be resettled.
Under current conditions, the total agricultural population to be resettled of the project area (including land inundated by the reservoir, and landuse by protection work and the main project) is 2175 people, the population to be resettled in the design level year 2010 is 2271 people. The population to be resettled by the project is 711 people currently due to direct inundation of the reservoir or land occupation of protection work, the population to be resettled in the planned level year 2010 is 744 people.
New houses construction, infrastructure construction, land cultivation for resettlement will cause impacts on land resource, soil erosion and terrestrial ecology. Resettlement will also cause impacts on living quality, public health and social economy of the resettled people.
3.3 Analysis on Environment Impact during Operation
3.3.1 Hydrological regime
Waterpower is a production process to apply waterpower resource to produce energy,

3.0 Engineering Analysis
84
operation of the project proper will not discharge any pollutants. But impounding for power generation during operation will change the reservoir area scope, level, flow and flow rate and etc. downstream the dam.
3.3.2 Water environment
� Level elevating will change part of the original land at the reservoir area into water area, increase volume of water body at backwater area and strengthen dilution capacity. But due to slowdown of flow rate at the water area, it is not good for pollutant diffusion and self purification, concentration of pollutants at local water area nearby discharge ports of the pivot and back-water area will be increased.
� Ship domestic sewage in the waterway of the reservoir area
The average sizes of navigating ships in the waterway in 2020 and 2030 are considered as 500t and 800t respectively. It is calculated that ship flows in the waterway in 2020 and 2030 are 16860 ship/time/a and 16663 ship/time/a respectively. 300t and 500t ships are manned as 4 persons/ship and 5 persons/ship, sewage is calculated on basis of 20l/person· ship/time, the domestic sewage discharges of ships navigating in the waterway in 2020 and 2030 are respectively 1079.1t/a and 1333.1t/a. Analogical analysis as per related information shows that concentrations of COD and BOD5 reach 300mg/l & 200mg/l respectively. It is forbidden to discharge domestic sewage from ships into the waterway. The ship domestic sewage will be collected by the sewage collecting device equipped in the ship and sent to sewage reception ship or sewage reception unit at bank for treatment, then discharged after meeting Grade 1 of the Comprehensive Waste Water Discharge Standard (GB8978-1996) ( Concentrations of COD & BOD5 reach 100mg/l & 20mg/l). The standard-meeting COD discharges of sewage in 2020 and in 2030 from ships into the waterway are respectively 323.7kg/a and 399.9kg/a The standard-meeting BOD5 discharges of sewage in 2020 and in 2030 from ships into the waterway are respectively 215.8kg/a and 266.6kg/a.
� Ship bilge oil-contained waste water into waterway in the reservoir area
The average oil concentration of bilge oil-contained waste water is 5000mg/l bilge oil-contained waste water quantities of 500t and 800t ships are calculated respectively on 0.14t/d•ship and 0.22t/d•ship. Bilge oil-contained waste water quantities of ships in the waterway in the reservoir area in 2020 and in 2030 are respectively 393.4t/a and 611t/a. It is forbidden to discharge bilge oil-contained waste water into the waterway. Bilge oil-contained waste water will be collected by the oil-contained waste water collecting device equipped in the ship and sent to oil-contained waste water reception ship or oil-contained waste water reception unit at bank for treatment, then discharged after meeting Grade 1 (5mg/l) of the Comprehensive Waste Water Discharge Standard (GB8978-1996). The standard-meeting oils discharges of bilge oil-contained waste water in 2020 and in 2030 from ships into the waterway are respectively 2.0kg/a and 3.1kg/a.
� Domestic sewage of the staff of the Project Management Department
Domestic sewage of the staff is calculated as per the following formula:
Qs=(K·q1·V1)/1000

3.0 Engineering Analysis
85
Where Qs——Domestic sewage discharge, t/d
q1——Water consumption per manday, l/manday
V1——Staff number
K——discharge factor, taking 0.8.
The staff of the Project Management Department is based on 129 persons and water consumption is 150 l/manday, domestic sewage discharge quantity is calculated as per 80% of water consumption, then the total sewage discharge quantity is 7062.75t/a. The main pollution factors COD and BOD5 are based on 300mg/l and 200mg/l, then COD and BOD5 quantities are respectively 2118.83kg/a and 1412.55kg/a, which will be discharged after taking treatment measures and meeting Grade 1 of the Comprehensive Waste Water Discharge Standard. The discharge concentrations of COD and BOD5 are respectively 100mg/l and 20mg/l, then COD and BOD5 quantities are respectively 706.28kg/a and 141.26kg/a.
3.3.3 Ambient air
A small amount of waste gas discharged from ships in the waterway has a certain pollution impact on the ambient air. Ship waste gas discharge is calculated with the recommended calculated method of Lloyd’s Register of Shipping, that is, 1t fuel oil will produce 7.2kg NO2 and 10kg SO2, the fuel consumption of ships in 2020 and in 2030 are based on 4.65g/t•km and 3.72g/t•km respectively. According to the water transport freight volume forecast of this waterway, the fuel consumption of ships in 2020 is 843×104t and the fuel consumption of ships in 2030 is 1333×104t. On these data basis, it is worked out that the waste gas discharge quantities of ships in the waterway in the reservoir area are 11.0t NO2 and 15.29t SO2 in 2020 and 13.92t NO2 and 19.34t SO2 in 2030.
3.3.4 Acoustic environment
The main noise sources during operation are hydropower generating noise at the powerhouse area and noise of communications from navigating ships in the waterway. Noise impact of hydropower generation is only limited within the boundary of the powerhouse; ship average radiated sound levels are shown in Table 3.3 1.
Table 3.3 1 Average exposure sound levels of different types of ships (15m from
ships)
Ship type 300�500t 500�1000t Average exposure sound
level [dB(A)] 71 73
3.3.5 Ecological environment
Impounding at the reservoir will change the hydrological regime and habitat condition of the water area. After the reservoir is impounded, its main impacts on ecological environment are

3.0 Engineering Analysis
86
changes of species and distribution of aquatic organisms and fish resource due to increase of aquatic organisms’ habitat area. The pivotal project will obstruct the migration passage of migratory fish and semi-migratory fish. Increase of reservoir water area will lead to loss of terrestrial vegetation, change of quantity and species of plants; impounding of the reservoir area will slowdown water flow, resulting in corresponding change of quantities and biomasses of plankton, aquatic plants, zoobenthos and resident fishes.
Level elevating may cause serious impacts on the normal living environment of 7 old trees inside inundated area and 181 old trees (including the county grade nature reserve of Zhujia Village of Tangzhou Township) outside inundated area beyond the fending groyne, and 6 old trees on the fending groynes at both banks of the Kan River in the reservoir area, and 14 old trees at the scope of 50m within fending groynes.
3.3.6 Social environment
Class of waterway of the Kan River section where the project is located will be upgraded, promoting shipping development, having power generating benefit and advantageous impacts on development of local social economy.
3.3.7 Solid waste
� Domestic garbage of staff of the Project Management Department The daily and annual domestic garbage produced by the staff of the Project Management Department is respectively about 193.5kg/d and 70.63t/a on 129 persons and 1.5kg/manday basis.
�Annual domestic garbages produced by the ships within the waterway in the reservoir
area in 2020 and in 2030 are respectively about 13.49t and 16.67t.

4.0 Plan Harmony Analysis & Environment Alternatives Comparison
87
4.0 PLAN HARMONY ANALYSIS & ENVIRONMENT ALTERNATIVES COMPARISON
4.1 Coordination Analysis of Engineering Construction & Relevant Planning 4.1.1 Analysis on Consistency with the State Industry Policies The Shihutang Navigation and Hydropower Project is deemed as Class I project (under encouragement) in accordance with Index of Industry Structure Adjustment (2005) (No 40 of State Development & Reform Committee of PRC under the item of Construction of Deep-water Channel & Inland Water Stem Channel and Navigation Structure: Comprehensive Hydraulic Projects. In other words, this Project does not belong to the sunset industry as listed in Class II (under restriction) or Class III (under disposal).
To sum up, this Project is consistent with relevant state industry policy. 4.1.2 Analysis on Consistency with River Basin Planning in Kan River In Oct of 1990, a review was made from the State Planning Committee in the document NO [1990] 1452 in the title of Approval to River Basin Planning Report in Kan River. Up to now, Jiangxi Kan River Drainage Area Planning Report has not yet been modified, therefore, the EIA work on this Plan has not yet commenced.
Jiangxi Kan River Drainage Area Planning Report, after comprehensive analysis in terms of flood control, power generation, navigation, water resources exploitation, execution conditions, investment, cost and benefit, made recommendation for cascade development of Program I and V in the main river channel. Program I is of 8-cascade development, namely, development in such areas as Xiashan, Maodian, Wan’an, Taihe, Shihutang, Xiajiang, Yongtai and Longtoushan. Program V is of 10-cascade development, namely in such areas as Bai’e, Baikoutang, Xiashan, Wan’an, Taihe, Shihutang, Xiajiang, Yongtai and Longtoushan. Of the two programs, the development planning is identical since the reach of Kanzhou District, that is, there will be six cascades in development, namely development in Wan’an, Taihe, Shihutang, Xiajiang, Yongtai and Longtoushan.
In the trunk stream, three cascade development programs are planned for near-sighted construction, that is, Taihe, Shihutang and Xiajiang. Of them, the normal water level in the Shihutang Cascade Development is 56.11m (Huanghai Sea EL), with an installed capacity of 120 MW, and a sluice dimension of 175×14×2.5m. For detail see Attached Drawing 07 and 08.
In accordance with the approved River Basin Planning Report in Kan River, the upper stream Taihe Cascade Development Program has a normal water level of 67.11m and the downstream Xiajiang Cascade Development Program has a normal water level of 48.11m. In line with the planned dam sites and normal water level, reservoir backwater level in the Shihutang Cascade will not be compatible with the tail water out of the Taihe Cascade Program, while tail water out of the Shihutang Project is compatible with the reservoir backwater level of downstream Xiajiang Cascade program. So the Feasibility Report recommended that the normal water level for Shihutang Cascade be at 56.5m, so that its

4.0 Plan Harmony Analysis & Environment Alternatives Comparison
88
reservoir backwater is compatible with the tail water out of the Taihe Cascade.
In line with Project Proposals for Xiajiang Hydraulic Project, to decrease reservoir inundation impact, the recommended normal water level at the Xiajiang Project is 46.0m (or 1.9m lower than originally planned level) and dead water level is 44.0m. If based on original dam site, the reservoir backwater in Xiajiang Cascade matches tail water out of Shihutang Cascade Project. In case of dead water level at 44.0m, there will be 17km of channel unsuitable for navigation. In accordance with the approved River Basin Planning Report in Kan River, planned normal water level reaches 56.11m; in line with Development Planning in Inland Waterway in Jiangxi Province, navigable grade for this Project is Grade III, whose navigable channel is 2.2m deep and 60m wide, with a bending radius no less than 480m. At the normal water level of 56.11m, if the water level facing the dam remains steady at 56.2m, the river channel basically satisfies the requirement for navigation. In case of synchronous peak modulation for the Jiangxi Province Power Network from the Shihutang and Wan’an Project, water level will be lowered by 0.2 to 0.3m, in which case the normal water level (56.2m) can not meet the need for normal navigation. That is to say, only at normal water level of 56.5m can normal navigation be guaranteed.
In accordance with River Basin Planning Report in Kan River, one-lane single life lock will be adopted in Shihutang Project, with a lock of 175×14×2.5m, which is not in line with Grade III as stimulated in state standard Inland River Channel Navigation Standard concerning locks, hence in the Feasibility Report the sluice is recommended at 180×23×3.5m (L×W×D).
To sum up, the Shihutang Project will have a normal water level at 56.5m, with an installed capacity of 117MW, with a sluice of 180×23×3.5m, basically the same as described in the said Planning Report. So construction of this Project satisfies requirement in the Report. 4.1.3 Analysis Corresponding to Development Planning in Inland Navigation in Jiangxi Province & in Kan River In accordance with Development Planning in Inland Navigation in Jiangxi Province [DPINJ] and Navigation Planning in Kan River [NPGR], the 525km-long channel (from Ganzhou to Wucheng) is classified as Grade III inland navigation channel. Due to cascade development and other auxiliary river regulation, by 2020 the channel from Ganzhou to Nanchang in the main stream of Kan River will meet Grade III. By 2010 the Shihutang Project will be under construction. After 2010, by way of canalization and river regulation, the whole Kan River will be made navigable. Navigation grade planning for the River is listed in Attached Drawing 08.
The main purpose of the Shihutang Project is to achieve the goal as set in the Development Planning in Inland Navigation in Jiangxi Province and Navigation Planning in Kan River. In line with this Project the navigation grade is determined at Grade III for 1000-tonnage inland navigation, with a lock of Grade III and a channel of 2.2m (Deep) and 60m (wide) and a bending radius of no less than 480m, at a navigation probability of 95%. The sluice has a size of 180×23×3.5m (L××W××D), in line with stimulation in DPINJ and NPGR.

4.0 Plan Harmony Analysis & Environment Alternatives Comparison
89
Construction of the Shihutang Project satisfies the planning DPINJ and NPGR. 4.1.4 Brief Introduction to Environment Impact Report from DPINJ On July, 2006, 5 experts as invited by the Environment Protection Bureau of Jiangxi Province, together with representatives from provincial Ministry of Communications, Ministry of Land & Resources, Ministry of Water Conservation, and Ministry of Construction, held a conference concerning Environment Impact Report from DPINJ, to outline a review (See Attached Drawing 8). 4.1.4.1 Major Conclusion out of Environment Assessment Development Planning DPINJ meets the need for a well-off society and modernization in Jiangxi Province due to reasonable layout, in line with state communication planning, in coordination with Jiangxi provincial planning, with full consideration to environment protection, therefore to attract widespread support and popularity from the public. Despite some negative impact upon the environment in the course of execution of the project, if effective measures be adopted concerning environment protection, the project will harvest social benefit, environment benefit and economic profits. 4.1.4.2 Buffering Programs & Proposals �Buffering Programs & Proposals concerning Eco-Impact � There will be reasonable construction schedule so that all underwater operation will be completed during the dry season and that there will be no such operation as reef explosion, dredging or rubbish disposal during fish migration and reproduction seasons. �Environment protection will be under study in terms of macro-perspectives, with focus on river basin nature reserve and spawning sites as well as migration passage, to help overcome negative impact from block and achieve biodiversity. � Buffering Programs & Proposals concerning Aquatic Environment �In construction of terminals and docks, all production waste, domestic sewage and rain water shall be under separate drainage, with the former two under collection and treatment before drainage in line with standard to urban drainage system or directly to the water body. There shall be facilities to receive and treat residual oils, waste oils, oily domestic sewage, night soil and rubbish. � It is recommended that by 2010 there will be facilities to receive and treat waste from ships and boats in such ten terminals as Nanchang, Jiujiang and Ganzhou, Ji’an, Zhangshu, and Jindezhen, etc. By 2020 all terminals shall be equipped with necessary facilities to treat wastes.
�Buffering Programs & Proposals concerning Solid Waste

4.0 Plan Harmony Analysis & Environment Alternatives Comparison
90
� All ships and boats shall be equipped with special rubbish reservoir filling and transportation facilities, with rubbish recollection centers in terminals as a part of local rubbish treatment system to prevent rubbish disposal to water body. � There shall be boats especially for clean-up of floating objects in the main channel to enhance treatment of rubbish in the channel.
�Buffering Programs & Proposals concerning Social-Environmental Impact � Coordination shall be enhanced with the fishery department to improve comprehensive exploitation of water resources. There shall be locks in where there is migration of fish, shrimp and crabs. In case there might be severe impact upon fishing resources, there shall be fishing structure or other measures for the sake of speedy recovery of fishing resources. � Resettlement shall be made under reasonable arrangement to promote their economy development in a sustainable manner. � Risk Analysis & Emergency Measures � There shall be strict regulations concerning transportation of such dangerous materials as oil and chemicals. There shall be enhanced regulations and prevention countermeasures concerning emergent pollution in the channels and emergency programs against marine incidents, with necessary training to personnel engaged in relevant operations so that they perform their duty with necessary license, for the sake of standard operation. � Salvage and aid system shall be perfected. With improvement in navigation and increase in numbers of transportation ships, salvage and aid organization shall be enhanced equipped with relevant facilities, for the sake of effective salvage and assistance.
� Standard ships will be promoted to replace old-fashioned ones so as to improve safety on the whole. 4.1.4.3 Suggestions to Environmental Assessment in Lower-level Construction & Planning Under impact from in-depth planning, numerous inland navigation planning fail to deal with detailed problems concerning environmental impact assessment, which shall be conquered in the next stage. � Eco-environment �Environmental impact assessment of Routine Construction Works Local eco-impact assessment without involving sensitive areas shall be made in line with standards concerning environment assessment, with regard to impact upon such factors as agro-ecological environment, land exploitation, soil erosion, and wild animals and plants protection, with to-the-point measures concerning protection of soil, farmland, wild animals and plants, and water and soil conservation.

4.0 Plan Harmony Analysis & Environment Alternatives Comparison
91
Eco-impact assessment for water body shall be made in line with relevant standards concerning environment assessment, with focus on impact produced during construction stages, or on underwater dredging, reef exploitation and disposal of spoil, with emphasis upon impact of such performance upon aquatic ecosystem, aquatic biodiversity and spawning sites. During operation such assessment shall be focused upon impact from risk of oil spill. For expansion and reconstruction project, superimposition impact shall be attended in assessment of impact out of pollutants upon water quality. Measures shall be formulated concerning aquatic eco-environment protection during construction and against oil spill and emergent measures during operation stage. �Environmental Impact Assessment of Nature Reserve For any works involving nature reserves, eco-impact assessment for water body shall be made in line with relevant standards concerning environment assessment, with effective measures for protection of spawning sites and rare fishes, to make sure that during operation there will be pollution control countermeasures concerning the major channel, with relevant approvals from involved departments. � Aquatic Environment � The location between next planning and specific works and drinking water protection areas, intake and aquiculture shall be made clear, with prediction made concerning sensitive water body and relevant buffering measures. � Hydrological characters shall be under analysis concerning the river reach where the works is located, with prediction of impact from works construction upon aquatic environment, including pollutant discharge, impact regions, above-norm range and impact degree, etc, in line with such parameters as dredging, reef exploitation, and earthwork volume. � Assessment shall be made concerning risk of aquatic environment in line with relevant assessment stipulations, to determine the environmental rationality between the terminal layout and berth of hazardous articles, with prediction concerning pollution range, degree and impact upon targeted objects. � Acoustical Environment Assessment concerning acoustical environment is made mainly by prediction in line with relevant standards and regulations, to predict the impact range and degree from noise upon sensitive objects. � Solid Waste Quantitative calculation shall be made concerning various solid wastes to formulate effective measures concerning management, collection and disposal thereof during construction stage. � Soil Conservation

4.0 Plan Harmony Analysis & Environment Alternatives Comparison
92
Water conservation proposals shall be made for works of terminals and navigation channel construction in line with requirement concerning contents and depth of such conservation, to the satisfaction of water conservation laws and technical specifications. � Social Environment � Protection of Land & Bulkhead Line Resources In line with the planning and design in the lower level concerning specific works, acquisition of land, especially of farmland, shall be under analysis to forward specific measures for protection of such resource. Assessment shall be made concerning bulkhead line resources to make proposals concerning optimized programs in terms of environment protection. � Flood Control Compatibility shall be analyzed concerning planning or construction works with flood control objectives, to make proposals concerning site selection of hydraulic structures and structure forms from the eye of flood control.
� Resettlement Detailed analysis shall be made concerning resettlement orientation and manners, with preliminary programs for resettlement. �Preservation of Cultural Relics Preservation of cultural relics shall be proposed upon the basis of detailed investigation concerning works in the next stage. 4.1.4.4 Issues for Attention in Shihutang Project � Site selection shall be carefully made to avoid any impact upon drinking water conservation district. � For any works that might involve nature reserves, all measures shall be adopted to avoid the core and buffering regions of the reserve as well as the experiment zones. In case of impossibility to do so, negative impact shall be reduced to the minimum by performance and construction in proper seasons and proper process. � Construction schedule shall be proper so that underwater operation will be mostly made in dry seasons. � Night whistling shall be under regulation for ships close to urban areas to avoid any noise pollution to nearby residents. � There shall be special ships responsible for collection of floating objects in the main channel to strengthen management of such waste.
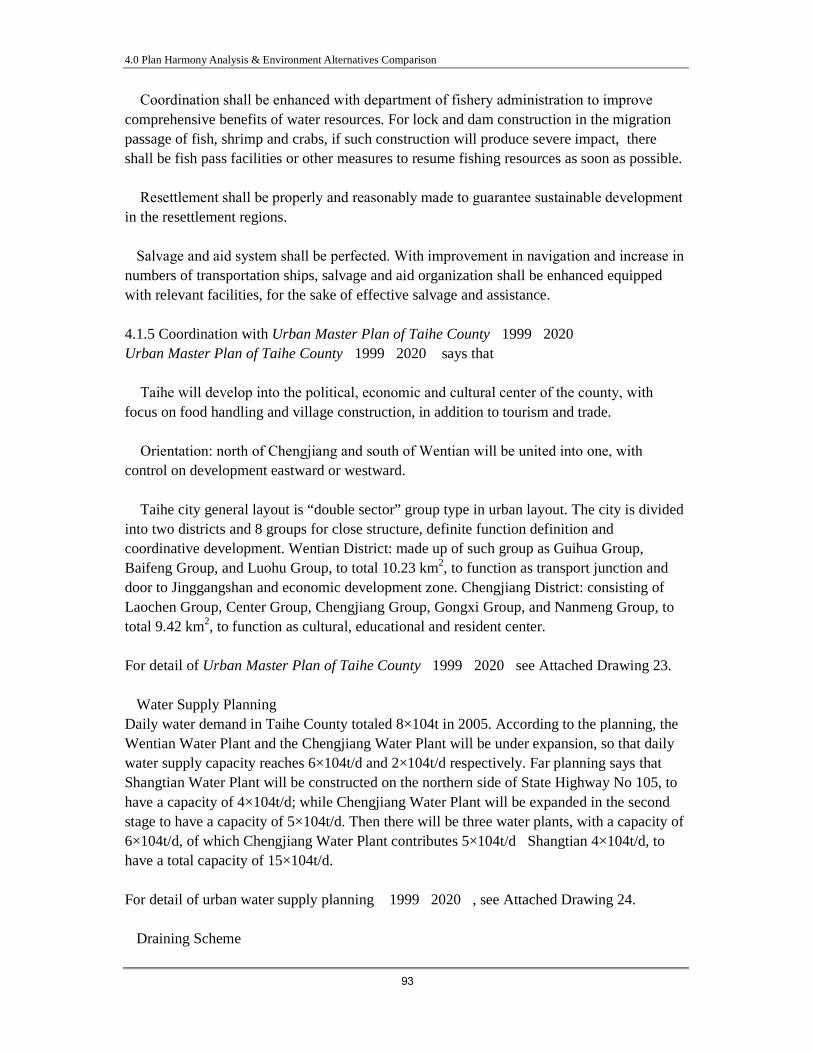
4.0 Plan Harmony Analysis & Environment Alternatives Comparison
93
� Coordination shall be enhanced with department of fishery administration to improve comprehensive benefits of water resources. For lock and dam construction in the migration passage of fish, shrimp and crabs, if such construction will produce severe impact, there shall be fish pass facilities or other measures to resume fishing resources as soon as possible. � Resettlement shall be properly and reasonably made to guarantee sustainable development in the resettlement regions. �Salvage and aid system shall be perfected. With improvement in navigation and increase in numbers of transportation ships, salvage and aid organization shall be enhanced equipped with relevant facilities, for the sake of effective salvage and assistance. 4.1.5 Coordination with Urban Master Plan of Taihe County�1999�2020� Urban Master Plan of Taihe County�1999�2020� says that� � Taihe will develop into the political, economic and cultural center of the county, with focus on food handling and village construction, in addition to tourism and trade. � Orientation: north of Chengjiang and south of Wentian will be united into one, with control on development eastward or westward. � Taihe city general layout is “double sector” group type in urban layout. The city is divided into two districts and 8 groups for close structure, definite function definition and coordinative development. Wentian District: made up of such group as Guihua Group, Baifeng Group, and Luohu Group, to total 10.23 km2, to function as transport junction and door to Jinggangshan and economic development zone. Chengjiang District: consisting of Laochen Group, Center Group, Chengjiang Group, Gongxi Group, and Nanmeng Group, to total 9.42 km2, to function as cultural, educational and resident center. For detail of Urban Master Plan of Taihe County�1999�2020�see Attached Drawing 23. �Water Supply Planning Daily water demand in Taihe County totaled 8×10⁴t in 2005. According to the planning, the Wentian Water Plant and the Chengjiang Water Plant will be under expansion, so that daily water supply capacity reaches 6×10⁴t/d and 2×10⁴t/d respectively. Far planning says that Shangtian Water Plant will be constructed on the northern side of State Highway No 105, to have a capacity of 4×10⁴t/d; while Chengjiang Water Plant will be expanded in the second stage to have a capacity of 5×10⁴t/d. Then there will be three water plants, with a capacity of 6×10⁴t/d, of which Chengjiang Water Plant contributes 5×10⁴t/d�Shangtian 4×10⁴t/d, to have a total capacity of 15×104t/d. For detail of urban water supply planning �1999�2020�, see Attached Drawing 24. �Draining Scheme

4.0 Plan Harmony Analysis & Environment Alternatives Comparison
94
If calculated at 80% of daily water consumption, then urban domestic sewage will total 6.4×10⁴t/d, or 12×104t/d in 2020. Chengjiang Domestic Sewage Treatment Works is planned for construction on the east of Jinggangshan Street and No One Draining Gulch, while Wentian Domestic Sewage Treatment Works will be constructed on the east side of the Beijing-Kowloon Railway. Designed capacity for the two plants reaches 1.5×10⁴t/d and 3×10⁴t/d respectively�to handle 60� and 80� of urban domestic sewage�with a planning capacity of 5×10⁴t/d and 7×10⁴t/d�to handle 100�. Domestic sewage is under second treatment in the two plants, with treated water to be discharged to Kan River. For detail of urban draining in Taihe County�1999�2020�, see Attached Drawing 25. The Shihutang Project is located outside of Taihe County Town, beyond the master plan of Taihe Master Plan. Existing flood control for the dykes along the planed Project is determined at 5-year recurrence, with a large section of the city under no embankment protection. Flood control works in this Project will greatly improve flood control capacity along the reservoir, to improve the 2-3-year recurrence flood to 10-20-year recurrence flood (20-year recurrence flood in Taihe County Town). Execution of this Project will greatly improve local finance, navigation and produce certain benefit in power generation, beneficial to local economy. After completion the Project will offer financial assurance to achievement of Urban Master Plan of Taihe County, of water Supply Planning and Domestic sewage Draining Planning in Taihe County. The dam side is far away from the intake and water conservation district in Taihe County, in line with relevant laws and regulations, with limited impact upon water quality. After reservoir filling the water level will be increased to transform some part of land into water body, but water volume will increase in the reservoir backwater body, thus to improve dilution. But due to slow water movement in this reach, it is unfavorable for pollutants to scatter and self-purification, so that pollutant intensity near the domestic sewage discharge will rise. The Shihutang Project is in line with Master Plan of Taihe County�1999�2020�as a whole. 4.1.6 Analysis of Coordination with Urban Environmental Protection in Taihe County�1999�2020� Urban Environmental Protection in Taihe County�1999�2020� says that: Domestic sewage treatment is determined at Grade II, with 60��80� of domestic sewage under treatment in the near future and 100% in far future. After treatment the water will be discharged directly into Kan River.

4.0 Plan Harmony Analysis & Environment Alternatives Comparison
95
95% of waste will be transported while 70% under non-hazardous treatment in the near future and 90% in far future. Of industrial and medical hazardous waste, 805 will be under treatment in the near and 100% in far future. For detail of environmental function classification see Attached Drawing 26. The project construction will produce some pollution to local environment, but necessary and proper measures will minimize such impact. During operation, there shall be proper environment protection measures and monitor to keep in line with the Urban Environmental Protection in Taihe County�1999�2020�. Construction of this Project is in line with Urban Environmental Protection in Taihe County�1999�2020� and environment function classification in Taihe County.
4.1.7 Analysis of Coordination with Jiangxi Provincial Surface Water (Environment) Function Zoning (1999�2020) Jiangxi Provincial Surface Water (Environment) Function Zoning (1999�2020) says that: The water environment function zone of the Kan River section where the Shihutang Dam Site is situated belongs to reserved zone; The water environment function zone of the Kan River section where the Shihutang reservoir area is situated belongs to reserved zone, industrial water zone, drinking water source protected zone; the Kan River section within 33km downstream of the dam site belongs to reserved zone and drinking water source protected zone. Dam construction will cause a certain water environment pollution to the Kan River section where the dam site is located. After necessary environment protection measures are taken, impacts of the dam construction on water environment can be minimized, basically without causing pollution impacts on drinking water source protected zone upstream and downstream of the dam site. During operation, necessary environment protection measures will be taken and environment management and monitoring plan will be framed and executed, which can minimize the impacts of project operation on the environment. Implementation of this project will not change the water environment function of the Kan River section where the project is located and can meet the requirements of Jiangxi Provincial Surface Water (Environment) Function Zoning (1999�2020) . In a word, Shihutang Project satisfies relevant planning and regulations. 4.2 Environmental Alternative Options 4.2.1 Dam Site Environmental Options 4.2.1.1 Engineering Comparison of Dam Site

4.0 Plan Harmony Analysis & Environment Alternatives Comparison
96
The Project makes a comparison between upper stream site in Shihutang and downstream site in Fangzhou. For detail of engineering design see Table 4.2�1; for detail of engineering volume, see Table 4.2�2. Both the upper site and downstream site enjoy geological conditions for construction of dam and locks of low and medium water head. In comparison, the upper site enjoys better topography and geological conditions, with more advantages in construction conditions of ship lock, sluice gate and powerhouse operation and construction diversion and temporary navigation. The downstream site suffers from worse geological conditions and challenging geological conditions, unfavorable for engineering layout and for increase in construction of 5-km-long flood control dyke, in resettlement and land inundation, thus to increase investment. Comprehensive comparison determines the upper stream site (Shihutang site) as recommended site.

4.0 Plan Harmony Analysis & Environment Alternatives Comparison
97
Table 4.2�1 Comparison of Dam Site
Item Upper Stream Site (Shihutang) Down Stream Site (Fangzhou)
Topography Located at the downstream of S-type stream, with a width of about 1150m.
Located at the downstream of sharp bend stream, with a width of about 600m.
Geological structure
With 4 developed faults, with rather developed joint fissure and intercalated weak seam. No developed carst.
With one fault and developed joint fissure and carst caves and rock holes.
Geological Problems
No developed dissolved caves or carst caves; developed joint fissures.
Developed dissolved caves and carst caves; rather developed joint fissures.
Both dam sites are desirable for water retaining structure construction of medium or low water head. In comparison, the upper stream site enjoys wider valley, thus favorable for layout of sluice structure; there are more challenges in the downstream site.
Layout & Operation Conditions
Though closer to the bend in the upper stream, the upper stream site may achieve smooth connection between the approach channel and the main channel. Some engineering shall be made upon the right bank gulch, to avoid any danger to the approach channel wall; the power house intake and outlet enjoys smooth connection with the upper and downstream channel.
The downstream channel is relatively narrower to satisfy the need for sluice structure, the right bank lock and power house requires larger range of excavation; the dam site is too close to the sharp bend, there is difficulty in layout of upper stream and downstream approach channel. The sluice gate on the left bank suffers impact from a stream, and its foundation will suffer from limestone carst.
Both sites meet the need for layout of pivotal structure, with both sluice gats located at the middle of the channel. In comparison, the upper stream site enjoys better topography and both the lock and the power house enjoys better operation conditions; while the downstream site requires too much excavation with much larger engineering volume in foundation treatment.
Reservoir Inundation
It is about 6km from the upper site to the downstream site, with basically the same catchment area and hydrological properties. Both the downstream site will mean an increased land inundation by 4545 mu and affected population by 923. In terms of reservoir protection works, the Wanhe Draining Gulch and flood control dyke will mean an increase in investment by 47.60 million Yuan. Meanwhile the upper stream site demands less acquisition of land.

4.0 Plan Harmony Analysis & Environment Alternatives Comparison
98
Table 4.2�2 Major Engineering Volume between Upper & Downstream Site
Upper Site�Right ship lock & left power house�
Downstream Site�Right ship lock & right power house�
Dam
power house
Ship lock
Total Dam power house
Ship lock
Total
Earthwork
×104m3
53.75 153.87 64.57 272.19 63.58 108.87 145.02 317.47
Backfill ×104m3
92.09 11.71 27.86 131.66 72.10 11.71 41.97 125.78
4.2.1.2 Environmental Comparison & Selection of Dam Site Schemes The upper dam site scheme (Shihutang) and down dam site scheme designed by the engineering contractor are applied for comparison.. See Table 4.2�3. From the angle of environment protection, both the upper dam site scheme and the down dam site scheme are environmentally feasible. Through integrated environment comparison, this EIA recommends the upper dam site scheme from the angle of environment protection, which is the same as the scheme recommended by the engineering contractor.
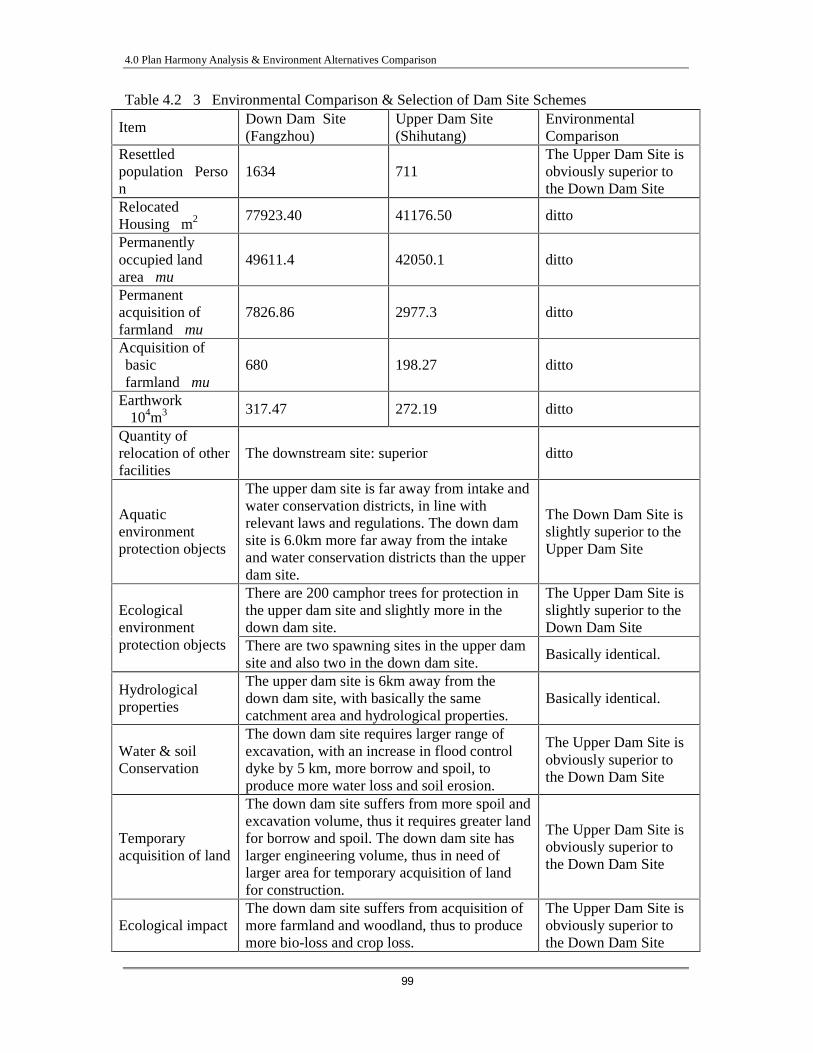
4.0 Plan Harmony Analysis & Environment Alternatives Comparison
99
Table 4.2�3 Environmental Comparison & Selection of Dam Site Schemes
Item Down Dam Site (Fangzhou)
Upper Dam Site (Shihutang)
Environmental Comparison
Resettled population�Person�
1634 711 The Upper Dam Site is obviously superior to the Down Dam Site
Relocated Housing�m2�
77923.40 41176.50 ditto
Permanently occupied land area�mu�
49611.4 42050.1 ditto
Permanent acquisition of farmland�mu�
7826.86 2977.3 ditto
Acquisition of basic farmland�mu�
680 198.27 ditto
Earthwork �104m3�
317.47 272.19 ditto
Quantity of relocation of other facilities
The downstream site: superior ditto
Aquatic environment protection objects
The upper dam site is far away from intake and water conservation districts, in line with relevant laws and regulations. The down dam site is 6.0km more far away from the intake and water conservation districts than the upper dam site.
The Down Dam Site is slightly superior to the Upper Dam Site
There are 200 camphor trees for protection in the upper dam site and slightly more in the down dam site.
The Upper Dam Site is slightly superior to the Down Dam Site
Ecological environment protection objects There are two spawning sites in the upper dam
site and also two in the down dam site. Basically identical.
Hydrological properties
The upper dam site is 6km away from the down dam site, with basically the same catchment area and hydrological properties.
Basically identical.
Water & soil Conservation
The down dam site requires larger range of excavation, with an increase in flood control dyke by 5 km, more borrow and spoil, to produce more water loss and soil erosion.
The Upper Dam Site is obviously superior to the Down Dam Site
Temporary acquisition of land
The down dam site suffers from more spoil and excavation volume, thus it requires greater land for borrow and spoil. The down dam site has larger engineering volume, thus in need of larger area for temporary acquisition of land for construction.
The Upper Dam Site is obviously superior to the Down Dam Site
Ecological impact The down dam site suffers from acquisition of more farmland and woodland, thus to produce more bio-loss and crop loss.
The Upper Dam Site is obviously superior to the Down Dam Site

4.0 Plan Harmony Analysis & Environment Alternatives Comparison
100
Maximum acceptable contamination [MAC]
The down dam site enjoys larger water body and environmental capacity, thus it has larger MAC.
The Down Dam Site is superior to the Upper Dam Site
In terms of environmental protection, both are environmentally feasible, through integrated environmental comparison, the Upper Dam Site is superior to the Down Dam Site. Recommendation No Yes 4.2.2 Environmental Comparison & Selection of Recommended Dam Site 4.2.2.1 Engineering Comparison & Selection Engineering design is made on the basis of the recommended site with proposal of upper and downstream dam. See Table 4.2�4. After comprehensive comparison, the upper dam is selected. 4.2.2.2 Environmental Comparison & Selection The upper dam and the downstream dam site are 500m away, with basically the same environmental factors. But due to difficulty in approach channel for the ships during operation there will be more risks of marine incidents in the downstream site, therefore the upper site is under recommendation. Table 4.2�4 Comparison & Selection of Recommended Dam Site Item Conclusion
Geology
According to geological boring, the upper and the downstream dam site have almost identical geological conditions, with no large range of sandstone. But the lower head of the downstream site is closer to F1 fault, unfavorable for stability of the structure. Meanwhile, the bedrock exposed in the right bank of the downstream dam axis is lower in elevation than in the upper stream, there will be more concrete engineering volume in gate dam and ship lock.
General layout
Both the upper and the downstream dam axis satisfy the need for general layout of the structure, but the downstream dam axis is closer to the rather bending channel, thus unfavorable for approach channel, to create difficulty for ships to approach the lock.
Conclusion
Both the upper and the downstream dam axis satisfy the need for general layout of the structure, but in terms of topography, geology and general layout of the structure, the upper dam axis is superior, thus under recommendation.
4.2.3 Environmental Comparison & Selection of Water Line 4.2.3.1 Engineering Comparison of Water Line Against the normal water level the Project proposed four water levels, namely 56.0m, 56.2m, 56.5m, and 56.8m. Of the four proposals, the Shihutang project enjoys identical design flood

4.0 Plan Harmony Analysis & Environment Alternatives Comparison
101
level and check flood level in the reservoir and other permanent structure. In terms of satisfaction of navigation, power generation, inundation index in kind, and economic evaluation index, in terms of impact upon cascade power plant in Taihe and upon Taihe County Town, a comprehensive comparison is made upon the four normal water levels, to determine the water level at 56.5m as recommended normal water level. Major engineering and economic index in Shihutang Project is listed in Table 4.2—5. Table 4.2�5 Major Engineering & Economic Index in Shihutang Project Item Unit Scheme� Scheme � Scheme � Scheme �
Normal water level Huanghai· m
56.0 56.2 56.5 56.8
Installed capacity MW 105 110.4 117 123 Decrease in power generation in Taihe
104kW·h 0 109 590 1284
Decrease in average Water Head in Taihe
m 0 0.02 0.11 0.20
Resettlement �after completion�
Persons 711 711 711 1004
Inundated farmland�after completion�
Mu 3219.6 3331.2 2977.3 3715.1
4.2.3.2 Environmental Comparison & Selection of Water Line For detail of environmental comparison and selection of water line in Shihutang Project see Table 4.2—6. After comparison at the four water levels, the Report makes recommendation from the eye of environmental protection at 56.5m as normal water level, identical to the level concluded from engineering design. 4.2.4 Environmental Comparison & Selection of General Layout of Structure 4.2.4.1 Engineering Comparison & Selection of Recommended Dam Site & General Layout There are two schemes concerning general layout of the structure, which are: Scheme I: with the ship lock located on the right bank and the powerhouse on the left. In accordance with the features of the topography, the ship lock will be located on the right shore with the approach channel made up of the concave bank; 21 spillway gates and 3 sand sluicing gates will be located in good order in the left main channel adjacent to the ship lock; there will be a power house of 5 sets of generators located on the left bank adjacent to the sand sluicing gates. The right bank and the left bank are under connection from earth and rockfill dam and bank slope.

4.0 Plan Harmony Analysis & Environment Alternatives Comparison
102
Scheme II: with the ship lock and the power house located on the right bank The ship lock will be located on the right shore and a power house of 5 sets of generators adjacent to the ship lock, followed by 21 spillway gates and 3 sand sluicing gates. The right and the left bank are under connection from earth and rockfill dam and bank slope. The right bank and the left bank are under connection from earth and rockfill dam and bank slope. For detail of quantities of main works, see Table 4.2�7. After comprehensive comparison, there seems to be no obvious disadvantages for both schemes. In terms of investment and intervention during construction stage and convenient operation, Scheme I is under recommendation. Table 4.2�7 Quantities of Main Works
Item Unit Scheme I Scheme II Earthwork 104 m3 272.19 309.36
Backfill 131.66 124.15
4.2.4.2 Environmental Comparison & Selection of Layout For detail of such comparison and selection see Table 4.2�8. After environmental comparison and selection of general layout, this report recommends Scheme I, identical to the scheme out of engineering comparison.

4.0 Plan Harmony Analysis & Environment Alternatives Comparison
103
Table 4.2�6 Environmental Comparison & Selection of Normal Water Level in Shihutang Project EL�Yellow Sea Elevation�m� Environ-inf luence factor
56.0 56.2 56.5 56.8 Conclusion
Probability of Marine Incidents & Environmental Risks
Water depth fails to satisfy Grade III channel. Great probability for marine incidents and environmental risks.
In case of no fluctuation of water level in the upper dam, the level basically meets the need for navigation. In case of synchronous peak modulation with Wan’an Hydro-power Station, water level will decrease by 0.2�0.3m, in this case normal water level does meet the need for navigation, so there is great probability for marine incidents and environmental risks.
The water level meets the need for Grade III channel, so there is little probability for marine incidents or environmental risks.
The water level meets the need for Grade III channel, so there is little probability for marine incidents or environmental risks.
When the normal water level is 56.5m and 56.8m, both schemes are ideal; scheme at 56.2mis superior to scheme at 56.0m: while both schemes are undesirable.
Installed capacity�MW�
105 110.4 117 123 56.8m�56.5m�56.2m�56.0m
Permanent land acquisition
41546.1 41818.5 42050.1 42883.6 56.0m�56.2m�56.5m�56.8m�
Permanent farmland acquisition
3119.56 3216.76 2977.3 3486.06 56.0m�56.2m�56.5m�56.8m
Quantities of removal and other facilities
Basically identical for four schemes Basically identical
Resettlement �after completion�
711 711 711 1004 Resettlement is basically the same for schemes at 56.0m, 56.2m, and 56.5m, while scheme at 56.8m requires greater resettlement, to create most impact upon social environment.
Water utilization factor�%�
78.92 79.05 79.03 78.93 56.2m�56.5m�56.8m�56.0m
Impact upon draining in Taihe County Town�m��compared with the scheme at 56.11m�
0 0.02 0.11 0.20 No impact at the scheme of 56.0m or 56.2m; some impact at 56.5m�more impact from 56.8m than 56.5m
Annual average shipping economics �104 Yuan�
6096.9 6096.9 6096.9 6096.9 Identical in economic benefit for the four schemes.
Environmental comparison
The major purpose of this Project is to construct a Grade III channel, while two schemes fail to satisfy the need for navigation due to shallow water depth, to invite great probability for marine incidents and environmental risks. There is no meaning in such works.
56.5m�56.8m
Recommendation? No No Yes No

4.0 Plan Harmony Analysis & Environment Alternatives Comparison
104
Table 4.2�8 Environmental Comparison & Selection of Layout
Items Scheme I Scheme II Conclusion
Earthworks 272.19 309.36 Scheme I: superior
Land for spoil Scheme I will mean acquisition of less land by 100 mu than Scheme II.
Scheme I: superior
Eco-impact Scheme II will create more loss to vegetation than Scheme I.
Scheme I: superior
Impact upon ambient air
Due to greater earthworks in Scheme II, more dust during construction and along the construction roads will be created.
Scheme I: superior
Impact upon acoustics
Due to greater earthworks in Scheme II, more noise during construction and more traffic noise will be created.
Scheme I: superior
water and soil conservation
There will be more water loss and soil erosion in Scheme II.
Scheme I: superior
Conclusion Both Scheme I and Scheme II are feasible from the eye of
environmental protection. Comprehensive comparison concludes that Scheme I is superior to Scheme II.
Recommendation?
Yes No
4.2.5 Environmental Comparison & Selection of Ship Lock Dimensions 4.2.5.1 Engineering Comparison & Selection of Ship Lock Dimensions Three schemes are offered in engineering design concerning the size of ship lock. Scheme I�effective Dimensions at 180×23×3.5m� Scheme II�effective Dimensions at�260×18×3.5m� Scheme III�effective Dimensions at�260×16×3.5m� Comparison of the three schemes are listed in Table 4.2�9. Table 4.2�9 Comparison of Ship Lock Dimension
No Comparison Scheme I Scheme II Scheme III
Near future
5.09 million ton 4.85 million ton
4.78 million ton
1 Trafficability Far future
8.27million ton 7.80 million ton
7.69 million ton
Near future
11.24m3/s 12.04m3/s 11.86m3/s 2 Water
consumption Far future
15.31m3/s 16.16m3/s 15.92m3/s
Comprehensive comparison concluded that the three schemes all satisfy the need for passing dam volume and for shipping programs until 2020 and 2030. While Scheme II and III recommend an effective dimension of 260m for the ship lock, with more investment, only to

4.0 Plan Harmony Analysis & Environment Alternatives Comparison
105
allow one line of ship passing once due to limited width of the lock. Scheme I is superior to other schemes in passing capacity, layout and investment. Ship lock dimension in Scheme I: it consists of a ship lock of three cascades, with an effective dimension of 180×23×3.5m (Effective L×effective W×Depth), with an annual passing capacity of 5.09 million ton in 2020 and 8.27 million ton in 2030. 4.2.5.2 Environmental Comparison & Selection of Ship Lock Dimensions For detail of such comparison see Table 4.2�10. In terms of environmental protection, both Scheme II and III are feasible, while Scheme I is superior to the other two schemes. Therefore Scheme I �180×23×3.5m� is recommended, the same conclusion as out of engineering design. Tale 4.2�10 Environmental Comparison & Selection of Ship Lock Dimensions
Items Contents Conclusion
Earthworks Earthworks in Scheme I is far less than in Scheme II or Scheme III.
Scheme I: obviously superior to Scheme II and III.
Land for spoil Land for spoil in Scheme I is far less than in Scheme II and III.
Scheme I: obviously superior to Scheme II and III.
Eco-impact More vegetation loss due to lock excavation and land for spoil is larger in Scheme II and III than in Scheme I.
Scheme I: obviously superior to Scheme II and III.
Air impact Earthworks in Scheme II and III are far larger than in Scheme I, there will be more dust during construction and along the road.
Scheme I: obviously superior to Scheme II and III.
Acoustic impact
Earthworks in Scheme II and III are far larger than in Scheme I: there will be more noise during construction.
Scheme I: obviously superior to Scheme II and III.
Water conservation
Scheme II and III will produce more water loss and soil erosion.
Scheme I: obviously superior to Scheme II and III.
Passing capacity
Scheme I enjoys more passing capacity than Scheme II and III and shortens the passing duration. In waiting for passing, less waste fume and noise is produced in Scheme I than in Scheme II and III.
Scheme I: obviously superior to Scheme II and III.
Conclusion Both Scheme II and III are feasible from the eye of environmental protection. Comprehensive comparison concludes that Scheme I is superior to Scheme II and III.
Recommendation
Scheme I
4.2.6 Environmental Comparison & Selection of Ship Lock Chamber’s Clear width

4.0 Plan Harmony Analysis & Environment Alternatives Comparison
106
4.2.6.1 Engineering Comparison of Lock Chamber’s Clear width There are three schemes concerning lock Chamber’s clear width, namely 15m, 20m and 22m. For detail of bills of quantities corresponding to the three schemes see Table 4.2-11. Engineering design concludes that with increase in clear width there will be less investment. But if the lock chamber is more than 20m in width, there will be increase in bills of quantities and investment, mainly due to increase in cost out of lock concrete and metal structure and hoisting device. Taking all into consideration, Scheme II is recommended as clear width. 4.2.6.2 Environmental Comparison & Selection of Ship Lock Clear width For detail of comparison of lock chamber clear width, see Table 4.2�12. a comparison is made of the three schemes, namely Scheme I�15m�, Scheme II�20m� and Scheme III�22m�, to recommend Scheme II, identical to conclusion out of engineering design. Table 4.2�11 Comparison of Bill of Quantities & Direct Investment of Chamber Clear Width
Items Unit Scheme I�15m� Scheme II�20m� Scheme III�22m�
Earthworks 104 �3 41.88 38.49 39.45
Backfill 104 �3 2.56 2.41 2.42
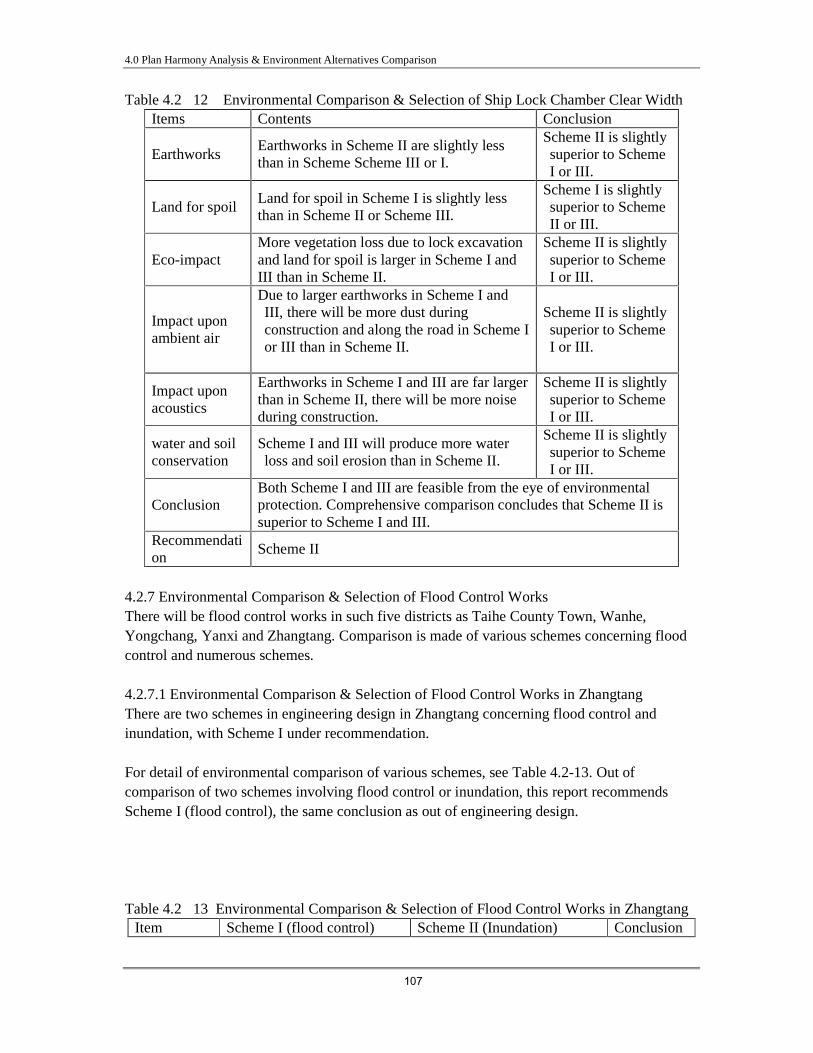
4.0 Plan Harmony Analysis & Environment Alternatives Comparison
107
Table 4.2�12 Environmental Comparison & Selection of Ship Lock Chamber Clear Width Items Contents Conclusion
Earthworks Earthworks in Scheme II are slightly less than in Scheme Scheme III or I.
Scheme II is slightly superior to Scheme I or III.
Land for spoil Land for spoil in Scheme I is slightly less than in Scheme II or Scheme III.
Scheme I is slightly superior to Scheme II or III.
Eco-impact More vegetation loss due to lock excavation and land for spoil is larger in Scheme I and III than in Scheme II.
Scheme II is slightly superior to Scheme I or III.
Impact upon ambient air
Due to larger earthworks in Scheme I and III, there will be more dust during construction and along the road in Scheme I or III than in Scheme II.
Scheme II is slightly superior to Scheme I or III.
Impact upon acoustics
Earthworks in Scheme I and III are far larger than in Scheme II, there will be more noise during construction.
Scheme II is slightly superior to Scheme I or III.
water and soil conservation
Scheme I and III will produce more water loss and soil erosion than in Scheme II.
Scheme II is slightly superior to Scheme I or III.
Conclusion Both Scheme I and III are feasible from the eye of environmental protection. Comprehensive comparison concludes that Scheme II is superior to Scheme I and III.
Recommendation
Scheme II
4.2.7 Environmental Comparison & Selection of Flood Control Works There will be flood control works in such five districts as Taihe County Town, Wanhe, Yongchang, Yanxi and Zhangtang. Comparison is made of various schemes concerning flood control and numerous schemes. 4.2.7.1 Environmental Comparison & Selection of Flood Control Works in Zhangtang There are two schemes in engineering design in Zhangtang concerning flood control and inundation, with Scheme I under recommendation. For detail of environmental comparison of various schemes, see Table 4.2-13. Out of comparison of two schemes involving flood control or inundation, this report recommends Scheme I (flood control), the same conclusion as out of engineering design. Table 4.2�13 Environmental Comparison & Selection of Flood Control Works in Zhangtang
Item Scheme I (flood control) Scheme II (Inundation) Conclusion

4.0 Plan Harmony Analysis & Environment Alternatives Comparison
108
Protection area�km2)
7.48 Inundation area�km2)
8.04
104 persons 0.325 Inundation will affect population(104�
0.33
farmland�104
mu� 0.747
Farmland inundated:�104 mu�
0.81
Protection benefit
Housing�104m2) 14.74 Housing inundated�104 m2)
14.93
Earthworks�104m3)
68.42
Acquisition of land �mu�
168.1
farmland�mu� 70
Bill of quantity
population(104� 0.005 Housing�104m2) 0.19
Investment farmland�104
mu� 0.056
Scheme I is obviously better than Schene II, Scheme II is not feasible.
Engineering comparison Recommended
Environmental comparison
Scheme II will mean too much inundation of arable land with too many people under influence, thus unfeasible; while Scheme I is feasible.
Environmental conclusion Recommended Not recommended
4.2.7.2 Environmental Comparison & Selection of Flood Control Works in Taihe County Town Comparison is made of two schemes concerning flood control and inundation in Taihe County Town, with Scheme I (flood control) for recommendation. For detail of environmental comparison of the two schemes, see Table 4.2-14. Out of comparison of two schemes involving flood control or inundation, this report recommends Scheme I (flood control), the same conclusion as out of engineering design. Table 4.2�14 Environmental Comparison & Selection of Flood Control Works in Taihe
County Town
Item Scheme I (flood control) Scheme II (Inundation) Conclusion
Protection benefit
Protection area�km2) 10.98
Inundation area�km2) 11.16 Scheme I
is

4.0 Plan Harmony Analysis & Environment Alternatives Comparison
109
104 persons 8.21
Inundation will affect population(104
�
8.21
farmland�104
mu� 0.826
Farmland inundated:�104
mu� 0.84
Housing�104
m2) 505.03
Housing inundated�104
m2) 505.03
Earthworks�104m3) 105.37
Acquisition of land �mu� 266
Bill of quantity
farmland�mu� 0.014
is obviously better than Schene II, Scheme II is not feasible.
Engineering conclusion
Recommended
Environmental conclusion
Scheme II will mean too much inundation of arable land with too many people under influence, thus unfeasible; while Scheme I is feasible.
Conclusion Recommended Not recommended 4.2.7.3 Environmental Comparison & Selection of Flood Control Works in Wanhe Comparison is made of two schemes concerning flood control and inundation in Wanhe Flood Control District, with Scheme I (flood control) for recommendation. For detail of environmental comparison of the two schemes, see Table 4.2-15. Out of comparison of two schemes involving flood control or inundation, this report recommends Scheme I (flood control), the same conclusion as out of engineering design. Table 4.2�15 Environmental Comparison & Selection of Flood Control Works in Wanhe
Item Scheme I (flood control) Scheme II (Inundation) Conclusion Protection area�km2)
27.98 Inundation area�km2)
28.43
Protection benefit
104 persons 1.84 Inundation will affect population(104�
1.9
Scheme I is obviously better than Schene II, Scheme II is

4.0 Plan Harmony Analysis & Environment Alternatives Comparison
110
farmland�104
mu� 2.303
Farmland inundated:�104
mu� 2.33
Housing�104m2)
87.06 Housing inundated�104 m2)
91.03
Earthworks�104m3)
70.48 Bill of quantity Acquisition of
land �mu� 663
population(104
� 0.06
Housing (104m2)
3.97
Affected substance
farmland�mu� 0.027
not feasible.
Engineering conclusion
Recommended
Environmental conclusion
Scheme II will mean too much inundation of arable land with too many people under influence, thus unfeasible; while Scheme I is feasible.
Conclusion Recommended Not recommended 4.2.7.4 Environmental Comparison & Selection of Flood Control Works in Yanxi Comparison is made of two schemes concerning flood control and inundation in the Yanxi protection area, with Scheme I (flood control) for recommendation. For detail of environmental comparison of the two schemes, see Table 4.2-16. Out of comparison of two schemes involving flood control or inundation, this report recommends Scheme I (flood control), the same conclusion as out of engineering design. For detail see Table 4.2—17. Table 4.2�16 Environmental Comparison & Selection of Flood Control Works in Yanxi
Item Scheme I (flood control) Scheme II (Inundation) Conclusion Protection area�km2)
9.41 Inundation area�km2)
9.95 Protection benefit
104 persons 0.493 Inundation will affect population(104�
0.56
Scheme I is obviously better than Schene II, Scheme II is

4.0 Plan Harmony Analysis & Environment Alternatives Comparison
111
Farmland�104
mu� 0.91
Farmland inundated:�104
mu� 0.94
Housing�104m2)
22.16 Housing inundated�104 m2)
25.57
Earthworks�104m3)
42.04 Bill of quantity Acquisition of
land �mu� 930
population(104
� 0.067
Housing (104m2)
3.41
Affected substance
farmland�mu� 0.032
not feasible.
Engineering conclusion
Recommended
Environmental conclusion
Scheme II will mean too much inundation of arable land with too many people under influence, thus unfeasible; while Scheme I is feasible.
Conclusion Recommended Not recommended 4.2.7.5 Environmental Comparison & Selection of Flood Control Works in Yongchang Comparison is made of two schemes concerning flood control and inundation in Yongchang Nature Reserve, with Scheme I (flood control) for recommendation. For detail of environmental comparison of the two schemes, see Table 4.2-17. Out of comparison of two schemes involving flood control or inundation, this report recommends Scheme I (flood control), the same conclusion as out of engineering design. For detail see Table 4.2—17. Table 4.2�17 Environmental Comparison & Selection of Flood Control Works in
Yongchang Item
Scheme I (flood control) Scheme II (Inundation) Conclusion
Protection area�km2)
22.583 Inundation area�km2)
23.54
Protection benefit
104 persons 1.84 Inundation will affect population(104�
1.86
Scheme I is obviously better than Schene II, Scheme II is

4.0 Plan Harmony Analysis & Environment Alternatives Comparison
112
farmland�104
mu� 2.096
Farmland inundated:�104
mu� 2.16
Housing�104m2
) 96.10
Housing inundated�104 m2)
96.94
Earthworks�104m3)
125.92
Stone works 12.78 Bill of quantity
Acquisition of land �mu�
1436
population(104
� 0.02
Housing (104m2) 0.88
Affected substance
farmland�mu� 0.038
not feasible.
Engineering conclusion
Recommended
Environmental conclusion
Scheme II will mean too much inundation of arable land with too many people under influence, thus unfeasible; while Scheme I is feasible.
Conclusion Recommended Not recommended 4.2.8 Environmental Comparison & Selection of Draining Gulch Axis in Wanhe In accordance with the engineering topography, geology and drainage outlet in Wanhe Nature Reserve, there are two proposals: Scheme I: the Drainage Gulch passes through Zhushan Township to Zhangtang Nature Reserve, along the original river channel until to benchmark No 14+000 before turning to Liutang Township, by way of Tianduan Township and Jiangbian Township to the downstream of the downstream dam site. Scheme II: with the same axis as Scheme I before benchmark 14+000, after which the gulch axis goes along original river channel until to 300m downstream of the ship lock (upper stream dam site). For detail of the two schemes see Chart 4.2�1. Chart 4.2�1 Layout Scheme of Draining Gulch Axis in Wanhe

4.0 Plan Harmony Analysis & Environment Alternatives Comparison
113
����lower dam site ����upper dam site �����Sangyuan Primary School �����Recommended scheme�����Alternative scheme �����Shihutang Village �����Jiangjiazhou Village Technical and economic comparison recommends Scheme II in design. For detail of environmental comparison in this gulch see Table 4.2�18. Of the two schemes in engineering design, this Report recommends Scheme II in terms of environmental protection, the same conclusion as out of engineering design. Table 4.2�18 Environmental Comparison of Two Schemes of Draining Gulch Axis in Wanhe
No Item Unit Scheme I Scheme II Environmental comparison
1 Rock works 104m3 38.20 0.52
2 Earth works 104m3 199.41 192.85
3 Sand works 104m3 22.50 22.50
4 Backfill m3 10.01 8.71
5 Acquisition of land
mu 945.39 924.16
6 Inundation of land
mu 278.9 278.9
Engineering conclusion Recommended Environmental conclusion
Not recommended
Recommended
4.2.9 Environmental Alternatives of Jintan Section Dyke Axis of Yongchang Protection Area In terms of dyke orientation of Yongchang Protection Area, the engineering design proposes that the axis pass through the core and buffering zone of the county grade nature reserve –

4.0 Plan Harmony Analysis & Environment Alternatives Comparison
114
Jintan Old Woods of Zhujia Village of Tangzhou Town (See Attached Drawing 05). The Report concludes that this proposal is not feasible from the eye of environmental protection. This EIA gives out an environmental alternative for the said dyke from the angle of environment protection (see Attached Drawing 05). Details are shown in Chapter 7.0.
4.2.10 Environment reasonability analysis on construction diversion scheme
Diversion scheme�Stage diversion, two stages and three sections for construction. The diversion procedure is as follows: At Stage 1 (August of the first year ~ Februrary of the third year), enclose the left bank and construct powerhouse and 11-hole scouring flood gate first, and at meantime, enclose the dam section of the ship lock, and dockgate channel at the right bank, applying the channel middle to overflow, small foundation pit cofferdam will be completed at the end of the first dry season; The powerhouse and the ship lock can be constructed all the year around under protection of the small foundation pit in the first flood season; In the second dry season, continue to enclose the 11-hole scouring flood gate and the powerhouse at the left bank, the dam section of the ship lock and dockgate channel at the right bank continue to construct under the protection of built cofferdam, using the middle channel for overflow; In Stage 2 (August of the third year ~ May of the fourth year), enclose the 13-hole flood gate at the middle, using the completed 11-hole scouring flood gate at the left bank for overflow, the powerhouse can use the retained water by Stage 2 cofferdam for generating power, meanwhile, the ship lock is open to traffic, at the end of the fourth dry season, the civil work of main project will be totally completed. Diversion period is from August to the next February. As per the construction diversion plan, as for Stage 1, enclose the left bank and construct the powerhouse and 11-hole scouring flood gate at the left bank first, at the same time, enclose the dam section of the ship lock, and dockgate channel at the right bank, apply the middle part of the channel for navigation. Because the channel is narrowed and flowrate is increased, it may obstruct the navigation during flood season, while it is good for navigation during dry season after the upstream is deepened. Because it is not totally damming off the whole river, thus it will not cause normal water intaking and consumption of water consumers, nor will it cause obvious obstuction impacts on fishes. At Stage 2, the ship lock at the right bank has been completed and navigable, the minimum navigable levels at upstream and downstream of the ship lock are respectively 52.46m and 45.88m. At the same time, 11-hole scouring flood gate at the left bank completed can be applied to control release flow, in order to meet the requirements of upstream and downstream navigational levels. But during construction of the cofferdam in the second stage, with development of the berm, original channel will no longer be too narrow to be available for navigation, while the permanent structure will not function until the water is raised to certain level, thus there will be a period not open to navigation for about two months. To solve the problem, it is recommended that cooperation with the maritime and navigation departments concerned be established to apply for temporary blockage with necessary notice in advance, for the sake of safety during construction. Because 11-hole scouring flood gate of stage 2 can overflow, and powerhouse can apply the retained water by stage 2 cofferdam for generating

4.0 Plan Harmony Analysis & Environment Alternatives Comparison
115
power, and the ship lock is open to navigation, thus it will not cause normal water intaking and consumption of water consumers downstream of the dam, nor will it cause obstuction impacts on fishes (fish pass has been completed). In a word, construction diversion scheme will have smaller impacts on navigation and normal water intaking and consumption of water consumers downstream of the dam and will not cause obvious obstuction impacts on fishes. This construction diversion scheme is environmentally feasible. 4.2.11 Comparison of Environmental Impact between with and without Shihutang Project � Environmental properties of with and without Shihutang Project Prior to construction of the Project, the river flows in a natural way. After completion of the Project, upper stream water will flow in decreased speed, therefore there will be change in original flow. �Comparison of Environmental Impact of with and without Shihutang Project Whether the Project shall be constructed, consideration shall be taken of flow state, water level change, and environmental impact upon aquatic beings and old trees. For detail see Table 4.2—19.

4.0 Plan Harmony Analysis & Environment Alternatives Comparison
116
Table 4.2�19 Comparison of Environmental Impacts between with and without Shihutang Project
Influence factor
Construction of Shihutang Project Not construction
Ecoenvironment
Water level will rise to inundate farmland and woodland along the bank.
Considering construction of a thermal power plant of the same installed capacity, flyash and slag of the thermal power plant there will occupy a great deal of land and farmland.
Inundation Impact
Inundation and embankment protection works will mean permanent acquisition of farmland totaling 2829.8 mu, gardens totaling 104.4 mu, and other types of land totaling 3130.9 mu, resettlement totaling 711 persons and dismantle of 8 enterprises and institutions, removal of housing totaling 4.56×10⁴m2 and dismantle of other facilities.
No impact from inundation
Bank stability
Local bank collapse may happen. Almost no bank collapse
Aquatic organism
Phytoplankton and zooplankton will change in types and quantity. After reservoir impounds water, the flow will decrease so that migratory fishes will decrease due to block from the dam. Water quality in the upper stream will improve during low season. Existing two spawning sites will be affected.
Following the original eco-balance rule
Water quality
After reservoir storage, there will be a water body in the upper stream like a lake, where water flow speed will decrease. But increase in water volume will improve water quality during low water period, if compared with the same period prior to construction of the Project.
Water quality is worse than the water upstream of the dam after the construction of the Project during low water period.
Social environment
In construction of Shihutang Project, construction will commence of approach road to the dam site and road bridge over the dam, which will improve traffic in the region and promote economic development.
Traffic jam
Air & Noise
Dust will be produced during construction in addition to noise (for short duration)
Large discharge of dust, S02 and CO2 from the thermal power plant, to pollute the air; with much noise along the road.
Silting There will be sediment accumulation impact at upstream of the dam
No impact
Flood control
Flood control standard: to improve to 10-year-recurrence so that arable land along the shore and residents and infrastructures are under protection. Annual average flood control benefit is estimated to be 22.831 million Yuan.
Current flood control standard is low, to suffer a lot from flood and waterlogging. Flood loss includes loss to individuals, collectives and the state in agriculture, forestry, engineering facilities and traffic.
Land exploitation
After treatment the land may be proper for grain crops and diversified economy, to create desirable economic and social benefits.
At present there are 12695 mu of farmland under no exploitation (below 10-year recurrence flood), with no harvest.
communications & transport
Completion of the Shihutang Project will transform the 38-km-long upper stream channel into reservoir channel, to create sound condition to turn the main channel in Kan River into Grade III navigable channel. This will optimize traffic networks to promote reasonable adjustment of communications structure in Jiangxi Province. In the near future the Project will save a lot of investment in channel improvement and maintenance and in the far future the Project will result in shipping upsizing and reduce traffic cost.
Due to current low navigation grade and poor channel, the Kan River fails to play her role and advantage in water carriage.

4.0 Plan Harmony Analysis & Environment Alternatives Comparison
117
Table 4.2�19 (Cont’d) Comparison of Environmental Impact between with and without the
Shihutang Project Influence factor
Construction No Construction
Overall evaluation
Completion of the Shihutang Project will create some negative impacts upon eco-environment, inundation, bank stability, aquatic beings, air, noise and sediment accumulation, in addition to positive role in scenery and social benefits. From the eye of power generation, if compared with a thermal power plant of the same installed capacity, the thermal plant will bring much more pressure to highway transport and noise along the highway; meanwhile the plant will mean a lot of acquisition of land and farmland, will discharge a lot of SO2 and CO2, thus to produce a lot of negative impact upon the environment. Judged from environment, the Shihutang Project is not as favorable. But from the point of social benefits, enough attention shall be paid to environment protection during construction to minimize negative impact upon environment, the Project is beneficial and significant.

5.0 Environment Baseline Survey & Assessment
118
5.0 ENVIRONMENT BASELINE SURVEY & ASSESSMENT
5.1 Survey of Natural Environment 5.1.1 Drainage & Channel Characteristics The Kan River rises in Shiliaodong (located between the boundary of Jiangxi Province and Fujian Province), flowing from eastward to westward through Ruijing County and Huichang County (where joined by a tributary Xiang River), to converge into Lian River in Luokou Town. It converges into Mei River about 2km above Yudu County Town, joined by Ping River and Tao River in Gan County. She is not called Kan River until converged by Zhang River in Ganzhou City; flowing out of the city, Kan River runs northward to be joined by Suichuan River in Luotang, by Su River in Taihe County, by Gu River in Ji’an County, by Wu River in Jishui County, by Yuan River in Zhangshui City, by Jin River in Nanchang County, to flow into Poyang Lake in four tributaries, the main in Wucheng Town, Yongxiu County after converge with Xiu River. From the riverhead to Wucheng Town, Kan River lasts 780km. Above Wan’an is the upper stream, 350km long and 200�600m wide. Here Kan River flows through mountainous and hilly areas, the bed mainly of coarse sand and gravel and partially of reef, where the gradient of stream averages 0.32‰�typical of mountain torrent. From Wan'an to Zhangshu City, it is the middle reach, 263km in length and 600�900m in width, flowing through Jitai Basin, featured by mesas(mainly of sandy soils) and hilly areas. Due to long current scour, there is frequent bank failure only to broaden the riverbed. During low water period the river is wide and shallow, with a gradient of stream averaging 0.16‰. Her downstream begins from Zhangshu to Wucheng Town, lasting 167km, flowing through alluvial plain, low in elevation, with polder embankment along the dyke. Here the riverbed, 1000m in width, is mainly of middle ground shoal and coarse sand, with a gradient of stream averaging 0.07‰ in dry season. From Wuchang to Hokou is the Poyang Lake area, 81km long, with a gradient of stream averaging 0.047‰ in dry season. Zexi Estuary, 20km downstream Wucheng, is where the five tributaries of Poyang Lake converge. The Shihutang Project is located in the middle reach of Kan River, with the dam site situated adjacent to Shihutang Township, 26km downstream of Taihe County Town. The river is usually 600�800m wide near the dam site, with a gradient of about 0.2‰. In the upper stream of the reservoir there are three tributaries, Sui River, Guanyuan River and Yunting River. Sui River has a catchment of about 1305km2, flowing into Kan River about 30km and 35km upper stream of the Shihutang dam site to join Kan River. Yunting River has a catchment of 763 km2, to join Kan River from the right bank, 17km upper stream of Shihutang dam site, while Guanyuan river has a catchment area of 558 km2, to join Kan River from the right bank, 10km upper stream of Shihutang dam site. Regional water system is shown in DRAWING NO.06. 5.1.2 Basin Properties

5.0 Environment Baseline Survey & Assessment
119
There are numerous mountains and hills in the upper stream and its major tributaries, including Jiulin Mountain on the north, Dagen Mountain and Jiulian Mt on the south, Guangchang Mt, Le’an Mt and Nanfeng Mt on the east, Luoxiao Mt and Zhuguang Mt on the west; Wuyi Mt on the southeast, with developed basin within the mountainous ranges and valleys. Most of the boundary of the basin and southern basin is made up of hilly areas, generally at 400m in EL, with a peak of over 1000m. The middle of the basin is mixed hilly areas and basin (depression), among which Jitai Basin is the largest. In the northern basin there is the fluvial plain fluvial plain Ganfu Plain. Kan River is the largest tributary of Poyang Lake, whose catchment area makes up almost half of the territory of Jiangxi Province. There are numerous river systems in Kan River, with 14 tributaries whose catchment area totals more than 1000km2. Longitudinal slopes are smooth in Kan River basin, with developed depression, dense population and farmland. Kan River is rich in water resources, with annual precipitation ranging 1300�1800mm, despite uneven distribution in seasons and over years. There is much change in runoff during the flood season and dry season. 5.1.3 Resources in Kan River Basin Potential waterpower resource in Kan River totals 3600MW, or 52% of the power in Jiangxi Province. There may be 313 power stations with an installed capacity over 500 kW for exploitation, to total 3437.5MW in installed capacity�or 67.3% of the capacity in Jiangxi Province. In Kan River there are 8 hydropower stations with an installed capacity of 2267MW, with annual generation of 78.27×10⁸ kW·h. 5.1.4 Weather Kan River basin falls within the moist subtropical belt, with abundant rainfall (average annual rainfall: 1300�1800mm), but rainfall is severely uneven in seasons. In accordance with representative Meteorological Stations, rainfall from April to June makes up 41%�51% of the whole year. There are frequent rainstorms in the basin. In accordance with precipitation stations in the basin storms mainly fall in April to September, while from May to June rainfalls mainly in frontal rain, which makes cloudburst more frequent. From July to September storms are caused mainly by Typhoon. Annual average evaporation reaches 1294�1765mm�annual mean temperature ranges 17.2�19.3�, with extremely highest temperature at 41.6��Yichun Meteorological Station, Aug 16, 1953�� and extremely low temperature at -14.3��Fengchen Meteorological Station, Feb 29, 1991��annual average humidity is 76%�82%� and minimum relative humidity goes to 6%�Xiajiang Meteorological Station, Nov 28, 1978��annual mean wind velocity reaches 1.1�2.9m/s�with maximum speed at 30m/s�Taihe Meteorological Station, Apr 24, 1977��W�. Annual average sunshine totals 1628�1875h�annual average frost-free period lasts 252�288 days. Taihe Meteorological Station, closest to Shihutang Project dam site, records maximum wind velocity at 1.8m/s�and annual maximum wind velocity at 13.4m/s.

5.0 Environment Baseline Survey & Assessment
120
For detail of characteristic parameters in each Meteorological Station in Kan River basin, see Table 5.1�1.

5.0 Environment Baseline Survey & Assessment
121
Table 5.1�1 Statistics of Characteristic Parameters in Meteorological Stations (Representative) Adjacent to Project Site
Name
Annual mean rainfall(mm)
Annual Max rainfall (mm)
In the year of
Annual min rainfall(mm)
In the year of
Annual mean evaporation (mm)
Annual mean temperature (�)
Extreme high(�)
Occurred on �Year/Month Day)
Extreme low (�)
Occurred on �Year/Month Day)
Annual mean relative humidity(%)
Annual mean wind speed (m/S)
Annual mean sunshine(h)
Annual mean frost-free period (days)
Ganzou 1426.8 2183.8 1961 897.6 1986 1616.0 19.4 41.2 1953.8.10 -6.0 1955.1.12 76 1.8 1813.6 282 Wan’an
1401.3 2078.2 2002 741.6 1963 1618.8 18.5 40.7 1992.7.31 -6.5 1967.1.16 80 2.6 1739.6 284
Taihe 1383.0 2371.2 2002 821.5 1986 1407.1 18.7 41.5 2003.8.2 -6.0 1991.12.29 80 1.8 1694.0 288 Ji’an 1495.9 2183.1 1953 982.8 1963 1546.1 18.4 40.3 1991.7.18 -8.0 1972.2.9 78 2.2 1737.3 281 Xiajiang
1629.9 2243.5 1953 919.2 1963 1432.4 17.6 40.6 1971.7.31 -9.1 1991.12.29 82 1.8 1687.9 277
Fencheng
1617.5 2460.5 1973 984.3 1971 1385.6 17.6 39.7 1963.9.1 -14.3 1991.12.29 82 2.4 1787.6 266
Nanchang
1608.9 2628.2 1954 1044.2 1963 1764.6 17.5 40.6 1961.7.23 -9.7 1991.12.29 77 2.9 1841.8 274

5.0 Environment Baseline Survey & Assessment
122
Kan River is of flood storm river, the flood is caused by storms, therefore the flood season coincident with storm season. Usually beginning from April there is flood in the basin, without much peak discharge. From May to June, especially on June, it is the main flood season, when large-scale flood would be caused by heavy storm. From July to Sept, due to influence from typhoon, there may be medium-scaled flood, which might occur occasionally in March and Oct. 5.1.6 Topographical Features Shihutang Reservoir is located in the middle reach of Kan River, expanding outward from Kan River, with topographical features represented by alluvial flat, terrace, hilly areas and mountainous regions, laid out in cascade, in a trend of higher topography in southeast and lower in northwest, typical of low hilly areas. � The dam site is situated 26km downstream of Taihe County Town, in valley of the middle reach of Kan River, which flows from east to west with much bends at a width of 1150m at 46m EL in dry season. The riverbed is covered with pebbles, 6 to 8 m in thickness. The main stream is on the left bank, which is of floodplain 400 to 800m wide, adjacent to second terrace, at about 65 m EL. The right bank is of second bottom, which borders low hilly areas in the rear, at 75 to 83 m El. The dam site is made up of calcilute, mudstone, conglomerate and sand gravel. � At the normal water level of 56.50m, the backwater terminal is adjacent to Guojia Township, Mashi Town. Here the geomorphic unit is mainly of low hilly areas and fluvial erosion of tectonic denudation, and there is no developed unfavorable physical geological structure. Along the river there are multiple terraces, of which the second bottom and the second terrace are fairly developed. Generally the second bottom is at 54 to 60m El and the second terrace at 60 to 70m EL. The third terrace is not developed, with remains of red downy top of Cretaceous System. The second bottom and the second terrace approaches the low hilly areas in the rear, with a peak of 80 to 250 m EL. Bare land in the reservoir is manly of Ganzou group and Guanxi group of Cretaceous System, with limited Tertiary, Permian, Carbonic and Devonian System stratum. The alluvial deposit of Quaternary System scatters in the terraces along Kan River and her tributaries, generally of dualistic structure, no more than ten meter in thickness. The reservoir lies in mid-south of Jitai Basin, mainly of superficial fault of syn-sedimentary faults and delayed fracture of Cretaceous Period, usually small in scale, extending several metes to a few km, in the direction of north to east, north to west, east to west or south to north. Only the blind fault form Pinglin to Wenxi, from Mashi to Bainigang is large in scale, extending more than 20 km. �The embankment protection project is located in the low hilly areas and fluvial erosion of tectonic denudation, along Kan River and her tributaries the second bottom and the second terrace are fairly developed, with fairly low elevation. Generally the project is located in the

5.0 Environment Baseline Survey & Assessment
123
front edge of the second bottom, of cohesive soil at top and sand, gravel at bottom, thus of dualistic structure. In some areas there is small-scaled dyke, low in elevation and poor in quality, failing to make up a complete embankment protection system.
5.1.7 Engineering geology
Geomorphic unit in Shihutang is mainly of hills and hillock plains of tectonic denudation and accumulation plain of fluvial erosion. Kan River runs meanderingly from south to north through Shihutang, where the overall topography is featured by higher surroundings and lower center, sloping gradually toward the center from south to north and from edge to the center. The edge is surrounded by hills, with dissected topography ranging from 10 to hundreds of meters in depth. Kan River valley is smooth and wide, with the bed ranging from one hundred to one thousand meters in width, floodplain scattered everywhere. Unpaired terrace (second bottom and second terrace) is distributed along the banks, while the second bottom is usually 52—61m in height, the second terrace generally 58—70m, to suffer a lot from gulley erosional cutting to develop partial rolling hills.
The stratum is mainly of the Recent Epoch of quaternary system, of vermiform reticulate laterite of Jinxian Group cretaceous Hongningang Group (K2hg), Zhoutian Group (k2z) and Maodian Group (k2m).
The engineering site is located in Ji’an Fault Tectonic Element of South China fold system, of central and south Jiangxi elevation, and of depression in southwest Jiangxi. This area has suffered from such tectogenetic movement as Caledonian, Variscan--Indo-Chinese epoch, Yanshanian and Himalayan. The Sinian Period--Cambrian Period stratum is mainly of gillo arenaceous, siliceous sediments, greywacke and mudstone. After ESN Caledonian compressional movement the NE to NEE fold--arched structure and the NNE faulted structure are developed, to produce minute regional metamorphism to form the foundation base. Late Paleozoic Era--Permian (period) stratum is mainly of clastic rock accumulation, which, due to tectogenetic movement during Variscan--Indo-Chinese epoch, develops folding and uplift so that open fold is formed whose axial and tectonic line runs east-westward, accompanied by a series of NW brittle fracture. During Mesozoic Era the NW fracture further develops under downslide and traction, until into stratum during the Jurassic Period into NW tilt-block basin. Yanshanian tectogenetic movement creates partial plaiting out of stratum developed in Jurassic Period, to develop NE to NEE fault with small-scaled igneous intrusion. During Himalayan tectogenetic movement uplift plays the major role, with NE and NEE and NW revitalized fault network in form of thrusting, marked by basin uplift under erosion and by minute refraction in the faulted basin. Meanwhile along the fault and gulch develops a NE, NNE river, which suffers from frequent stagnated diversion. Here the accumulation is typical of clay stone of swamp facies, Hunagqiao Group, typical of unconsolidated sediment of Quaternary System, to develop into multiple erosion terraces.
Basin-dominant fault mainly develops and scatters at the edge of the basin, in form of discordogenic fault and fault zone, where the tectonic line runs NE, NNE and NW. in the southeast the Suichuan-Dexing Deep-seated Fault lasts about 540km, being a series of NE compression thrust or shearing oblique thrust, about 250—300m in width, about 25km from

5.0 Environment Baseline Survey & Assessment
124
the dam site. On the northwest side Xin’gan—Hukou Deep-seated Fault lasts several hundreds of kilometers, covered with red loam on the marginal basin, about 45km from the dam site. The NE Jishui Deep-seated Fault is made up of a series of NW shear skewing parallel normal faults, to last about90km, dozens to hundreds of meters in width, about 30km from the dam site.
Close to the dam site the major petrographic category is of clastic rock and loose soil. 5.1.8 Earthquake In accordance with Seismic Zoning in China (GB18306-2001)�the seismic peak acceleration at the dam site is less than 0.05g�corresponding to smaller than VI degrees in earthquake intensity, with an Eigen-period of 0.35s in earthquake dynamic response spectrum. 5.1.9 Underground water On the basis of lithological character, the underground water survival condition and hydraulic characteristic of the water-bearing formation, underground water in Shihutang region may be classified into unconsolidated rock pore water and bedrock fracture water.
� Unconsolidated rock pore water
Such water is distributed along the bank of Kan River and her tributaries, with the water-bearing rock made up of alluvial deposit of quaternary system (Holocene and mid- Pleistocene series). Such alluvial deposit is the major water bearing strata, whose top layer is of clayey loam, sandy loam and reticulated laterite fine in structure with a thickness ranging 5 7m; the bottom is made up of sand, sand gravel, and pebble bed about 5 10m in thickness. Submergence is the major hydraulic characteristics, with partial slight load bearing, whose artesian head reaches 0.66 4.79m with a mean bury depth of 2.91 6.20m and individual well water inflow totals 5815.12 3614.55t/d and maximum inflow may reach 6778.01t/d thus abundant in water resources. Water quality is identical to HCO3 Cl Ca(Mg) K+Na whose degree of mineralization ranges 0.03 0.08g/l PH 5.6 6.6 total hardness 0.84 3.352.
� Bedrock fracture water
Based on regional data, the bedrock fracture water is mainly of red clasolite of Cretaceous System where the sand gravel is moderately weathered, rich in water; in comparison, siltite are filled with pelyte in the fracture, thus the zone of weathering bears little water, and the underground water exists mainly in fracture and pore or weathered submergence under tectonization and mechanical weathering. Here individual well water inflow totals 0.1 19.777t/d and fountain flow may amount to 0.011 0.079l/s modulus of runoff averages 0.023 1.55l/s·km2 which means there is rare water bearing stratum. Water quality is identical to HCO3 Ca K+Na & HCO3 SO4 K+Na Ca and the degree of mineralization ranges 0.12 0.08g/L PH 5.4 10.3 total hardness 0.20 34.78.
5.2 Survey of Social Environment 5.2.1 Local Social & Economic Situation

5.0 Environment Baseline Survey & Assessment
125
The channel from Ganzou to Hukou lasts 606km, while the Shihutang Project lies in the upper reach of Kan River in Ji’an City, to produce direct influence upon Ji’an City, Ganzou City and the middle and downstream reach of Kan River. � Ganzou City Ganzou City is located in the upper reach of Kan River, to border Fujian Province in the east, Guanxi Autonomous region in the south and Hunan Province in the west, Ji’an City and Fuzou City on the north. To be exact, it lies at 113°54 to 116°38 E and 24°29 to 27°09 N, to be 219km wide from east to west and 295km long form north to south. It has have jurisdiction over two cities and 16 counties, with an area of 39379km2. National economy sped up in 2004, whose GDP totaled 39.801 billion Yuan, to rise by 12.7%, 0.2% more than last year, the highest speed since 1997. of the GDP, industry contributed 11.40 billion Yuan, to rise by 4.2%; the second industry contributed 13.297 billion Yuan, to rise by 17.6%; the third industry contributed 15.122 billion Yuan, to rise by 14.5%. Fast development was achieved due to harmonious development of all trades and industries, of which the first, second and third industry contributed 1.2%, 6.0% and 5.5% respectively. Industry structure is under further optimization There are 106 types of minerals in Ganzhou, of which 57 proves to be of commercial reserve, composed of 28 large-scale mineral deposit, 60 medium-scale deposit and 712 small-scaled deposit. Such resources are of variety and concentration and high exploitability. There are 52 types of mineral reserve listed on the agenda of commercial exploitation, of which tungsten makes up 61.3% in resource extent�coal 36.4%�tin 73.4%�heavy rare earth 8%�light rare earth 80.8%�led and zinc 15�18%�gold 48.1%�silver 24%�tantalum 16.5%�and niobium 13.8%. The basic objective of economic development is to dramatically improve economy, so that GDP will increase by 12% annually to double the economic aggregate by 2010 when GDP per capita reaches ten thousand Yuan; and financial income will rise by 15% annually, fixed asset investment by 20%. Economic structure will be further optimized, so that the three industries will reach a percentage of 16: 46: 38, of which added value will contribute more than one third in the second industry and high-tech will make up more than 20% in total industry. Capital investment from abroad will rise by 10% annually. The central urban will occupy more than 70km2 with more than 700,000 residents, of whom over 40% will live in urban areas. People’s living standard will greatly improve and eco-environment will turn a new leaf and the whole society will become more harmonious. � Ji’an City Ji’an has a jurisdiction over 2 cities and 11 counties, 218km in length from east to west and about 208km in width from north to south. In 2004 her GDP totaled 24.265 billion Yuan, rising by 14.5%, more than 0.5 % more than last year, the highest speed in last 9 years. The primary industry 7.428 billion Yuan, rising by 8.0%; the second industry 7.868 billion Yuan, rising by

5.0 Environment Baseline Survey & Assessment
126
19.7%; the third industry 8.951 billion Yuan, rising by 14.9%. Here GDP per capita totaled 5220 Yuan, 745 Yuan more than last year, rising by 13.8%. The basic goal for economic development is to develop economy steadily so that national economy will rise by 13% annually to reach 60.7 billion Yuan; actual use of foreign investment will rise by 15% annually, and export by 30%. Economic structure adjustment will be fruitful, so that the three industries percentage will reach 16: 50: 34, of which added value will contribute 37% in the heavy industry and six pillar industries will make up more than 70% in added value in the whole industry. The town system will be perfected. By 2010 urbanization will reach 41.3%, to occupy an area of 190km2. Public service facilities will be improved greatly and so are people’s living standards and eco-environment construction.
� Taihe County
Taihe County is located in the hinterland of Jitai Pendi (Basin) in central Jiangxi Province, with an area of 2665.4km2�with jurisdiction over 16 towns and 6 townships and 290 villages and six communities. According to statistics in 2005, the population totaled 515655, of whom 418412 live in rural areas (agricultural labor force aggregates 249187). Here population density reaches 193 persons per km2. The county has a total cultivated area of 0.661 million mu, averaging 1.8 mu per capita; total forest area amounts to about 2.42 million mu and aquatic area 0.17 million mu. County GDP totaled 3.711 billion Yuan, of which the primary industry contributed 32.15% to total 1.193 billion Yuan, the secondary industry 38.15% to reach 1.416 billion Yuan (of which traditional industry made up 1.061 billion Yuan), and the tertiary industry 29.7% to aggregate 1.102 billion Yuan. Gross product of agriculture, forestry, animal husbandry, fisheries at current prices totaled 2.111 billion Yuan. Of cultivation area, the grain totaled 81952 hectare�oil plants 19950 hectare�and vegetable crop 11079 hectare. 5.2.2 Survey of Local Traffic 5.2.2.1 Local Traffic Ji’an enjoys four traffic means, railway, highway, waterway and airway. During the Tenth Five-Year Plan Period, Ji’an has enjoyed fast development in traffic infrastructure, with highway coverage improved dramatically, railway speeding up, waterway in Kan River under regulation, inland terminals construction hastened, traffic means structure adjustment under acceleration, traffic capacity improved greatly, service quality improved a lot so that traffic bottleneck is greatly relieved. There are 7970 km of roads open to traffic, of which Class 2 roads last for 913 km, Class 3 roads for 698 km, Class 4 roads for 3475km and other roads for 2876km, with a road density of 64.2km/km2. Taihe County enjoys better traffic infrastructure, with State Highway No 105 and No 319 traversing and Beijing-Kowloon Railway and Guangzhou—Nanchang Expressway through the

5.0 Environment Baseline Survey & Assessment
127
county. Advanced program-controlled optical cables communication is available to each rural household. Due to different navigable grade in Kan River, in addition to decreased rainfall in the basin, navigation capacity in the river has been reduced considerably. As a result waterway is severely restricted and carrier improves slowly, whose percentage in the whole traffic capacity drops every year. Meanwhile transport in the waterway is limited to timbre, sand and stones, cement, oil, fertilizer, feed and food. Passenger transport is mainly in form of waterway sightseeing and short-distance travel, while long-distance travel gradually goes outdated.
The main features of Jiangxi transport ships are small capacity, many types, and low standardization degree. Except that 1000DWT or over ships are navigable in the downstream Nanchang at the lower reaches of the Kan River, the Poyang Lake area, and along the Yangtze River and 500DWT motor barges are navigable in the downstream Zhangshu at the lower reaches of the Kan River, only 300~500DWT motor barges are navigable in upper Zhangshu at the middle and upstream of the Kan River at medium flood season, below 300DWT motor barges are navigable in low water season. In 2004, the average motor ship DWT of the whole Jiangxi province is only 188t.
5.2.2.2 Local Traffic Development Planning In terms of highway, Taihe will develop a system made up of “Two longitudinal, two horizontal and two connective highways” as backbone, “three longitudinal, three horizontal and one ring as main highway, county to county highway as branch, to develop a traffic system of optimized structure, perfect function and reasonable layout. By 2020 the roads open to traffic will last 28600km�with classified roads totaling 20000km� of which express highway lasts 1000km� first road 900km�secondary road 3000km�tertiary highway 2000km�quaternary highway 13100km�and other highway 8600km�with a highway density of 72km/100km2, of which grade highway reaches 50km/100km2. In terms of railway, in accordance with the medium- and long-term development plan in Jiangxi Province, a cross-type structure consisting of Beijing--Kowloon Railway, Ganzhou—Long Railway and Ganzhou—Saoshan Railway will come into being, which will connects Beijing—Colon Railway, Beijing—Guangzhou Railway, Zhejiang—Jiangxi Railway, Yingtan—Xiamen Railway, and Hangzhou—Shenzhen Railway. In terms of waterway, in accordance with the state inland navigation development planning, there will be waterway network, which goes to the Yangtze River in the north, Pearl River in the south and the sea in the east. By 2020, a waterway system will develop with Ganzhou as the focus, with all channels up to grade navigation standard. Inland terminals will achieve mechanization, to develop a system of containers and of roll-on and roll-off ships for transport of petroleum and liquid gas, coal and mineral and automobile.

5.0 Environment Baseline Survey & Assessment
128
In terms of airway, by way of expanded project in Gold Airport, traffic connection will be strengthened to develop a 3-dimension traffic system by cooperation with railway, highway and waterway. 5.2.3 Existing Hydraulic Projects Wan’an Hydraulic Project in the main channel of Kan River has been completed, which is located in the middle reach of Kan River, about 2km in the upper reach of Wan’an County Town, with a catchment of 36900km2. This project functions as a comprehensive project capable of flood control, navigation and irrigation. The normal water level reaches 98.11m (preliminary operation level is 94.11m), with a storage capacity of 22.14×10⁸m3. There are 15 large-scaled and 99 medium-scaled reservoirs in the tributaries of Kan River, with a catchment of 54624 km2 and a total storage capacity of 24.63×10⁸m3. Most of the reservoirs play the role mainly of irrigation or power generation complimented by flood control, with an installed capacity of 767.5 MW and an irrigation area of 46.54 million mu. Quangang Flood Diversion, Storage & Reclamation Works is located in the downstream of Kan River, within the boundary of Zhangshu, Fengcheng and Gao’an, made up of intake sluices and Lingzou Dyke. The intake sluice is situated in outlet of the Xiao River, southeast of Quangang Town, completed in 1958, under expansion in 2001 to 2003. After that the flood control standard has improved to one-hundred-year recurrence, with maximum flood diversion at 2000m3/s, with a storage area totaling 131 km2 in the pondage area and an effective storage of 2.0×10⁸m3. This Works is capable of lowering water level in the downstream of Kan River to offer safety to Nanchang and east valley of the river. In the Kan River basin there are two grade polder embankments, namely Fudayo Dyke and Gandong Dyke, for protection of the capital city Nanchang and Ganfu Plain, with seven polder embankments each of which to protect more than 100000 mu of farmland, 10 dykes each of which to protect over 50000 mu of farmland, 47 dykes each of which to protect 100 to 500 thousand mu of farmland.
5.2.3 Brief introduction to regional water resource application 5.2.3.1 Regional water consumption characteristics In order to meet the requirement of regional economic and social development, water resource integrated development and application within the Kan River drainage area includes agricultural irrigation, city residents’ domestic water, industrial water, hydropower, channel navigational condition improvement etc. Water consumption within the region is separated into several categories as city residents’ domestic water consumption, industrial water consumption and agricultural irrigation water consumption. Agricultural irrigation is a major water consumer of Jiangxi Province, approximately accounting for 4/5 of total productive and domestic water consumption of the whole province. With economic development and technical

5.0 Environment Baseline Survey & Assessment
129
improvement, agricultural irrigation water consumption is at down trend, while residents’ domestic water consumption and industrial water consumption are growing. In the Kan River drainage area, water source for irrigation is mainly from water impounding projects, especially centralized irrigation water consumption at dry season; Most of the water intake sources of the residents’ domestic water supply and industrial water supply of Jiangxi Province are surface water, taking water directly from rivers, general industrial water consumption comes from their own water sources, but most of firms come from city water supply pipeline network, own water sources come mostly from surface water too. Underground water as water source for domestic water and general industrial water has a very small proportion, only 5.5 of the total water consumption. Water consumption for cooling of Jiangxi thermal (nuclear) power comes from surface water, taking water directly from rivers, productive wastewater is drained into the original river course at downstream of the water intakes. But there are no existing thermal (nuclear) power plants at the Kan River drainage area at upstream of the Shihutang Project. Water for generating power is instream water use, basically causing no water consumption or new pollution on the river course. Except that runoff type hydropower station has no regulation and impounding capacity on incoming water, other reservoir hydropower stations, through the regulation and impounding function of reservoir, have supplementary function to the instream flow at dry season. It is investigated that there are no projects of water diversion for power generation across Grade III water resource region within the drainage area at upstream of the Shihutang dam site. 5.2.3.2 Water impounding projects within the drainage area at upstream of the Shihutang dam site Water impounding project belongs to an integrated water resource application one, with the general functions as power generation, irrigation, flood control, shipping etc., its reservoir has a certain regulating performance, and may reallocate river runoff in a year and among years. Water impounding projects at upstream of the Shihutang dam site will have a certain impacts on the dam site runoff, therefore, the analysis scope for water impounding project development mode to apply water resource is the drainage area at upstream of the Shihutang dam site. Because the rainfalls and runoffs within the drainage area at upstream of the Shihutang dam site in a year and among years are distributed unevenly, flood and drought often occur, causing life and property losses of the people and grain output reduction. In order to improve the living environment, and to develop and apply water resource, to develop industrial and agricultural production and national economy within the region, a lot of key water control projects have been built within the drainage area since liberation of 1949. In 1993, Wan’an Pivot was completed at the main stream of the Kan River, which is located at upper section of the middle reaches of the Kan River, the dam site is located about 2km at upstream of Wan’an County Seat, with controlled drainage area of 36900km2, it is an integrated water resource application project with power generation as main purpose and also for flood control, shipping and irrigation. From 1950’s to 1970’s, six large reservoirs of Changgang, Youluokou, Tuanjie, Laoyingpan, Shangyoujiang and Longtan with total reservoir capacity of 16.97×10⁸m3,

5.0 Environment Baseline Survey & Assessment
130
regulating (beneficial) reservoir capacity of 9.09×10⁸m3, installed capacity of 122.32MW�And 30 middle-scale water impounding projects have been built within the drainage area after another, with total reservoir capacity of 7.04×10⁸m3�regulating (beneficial) reservoir capacity of 4.01×10⁸m3 and installed capacity of 92.25MW. The total regulating (beneficial) reservoir capacity of 37 large and middle scale reservoirs is 23.29×10⁸m3�the total installed capacity of 37 hydropower stations is 719.57MW. The beneficial reservoir capacity of small reservoir and installed capacity of smaller hydropower station are limited, water resource application amount of other water control projects is not much. The application rate of water resource of the drainage area at upstream of the Shihutang dam site is still low. 5.2.3.3 Water consumers within the area affected by the Shihutang Project Most of the pumping projects within the drainage area at upstream of the Shihutang dam site are to provide water source for irrigation, residents’ domestic water and industrial water, irrigation water is the main water consumer within the region, while its water source is mostly from water impounding projects, pumping projects for irrigation are scattered and small, therefore, water intake amount of pumping projects within the drainage area at upstream of the Shihutang dam site is not big. The possible affected region with pumping projects by the Shihutang Project is the Shihutang reservoir area and the river section from the Shihutang dam site to the Ji’an City Railway Bridge of Beijing~Kowloon Railline at the downstream. As per the survey, pumping stations for farmland anti-drought with the affected area of the Shihutang Project are scattered and very small, most of them are water plants to supply residents’ domestic water and industrial water of Taihe County Seat and Ji’an City. The water intaking flow of the existing water plants at the downstream river section of the Shihutang dam site is 2.28m3/s (because a majority of water of Phase I of the Jinggangshan Power Plant returns to the river course in a short time, therefore, only water loss of 0.2m3/s is considered)�plus some scattered and small irrigation pumping projects, the water intaking flow of pumping projects of the said river section is smaller. 5.2.3.4 Existing main problems of regional water resource development and application
� Low application rate due to uneven space-time distribution of water resource
Though the middle reaches and upstream of the Kan River are of rich waterpower resources and have abundant rainfall, but the rainfalls are asymmetrically distributed in a year and among years, which is very detrimental to development and application of waterpower resources, most of runoff in the water resource is not applied and flows away in vain. Less of the planned cascade pivotal projects are implemented as scheduled, especially the planned five step pivotal projects at the middler and lower reaches of the Kan River trunk stream, because they are situated at the famous Jitai Basin and the downstream plain, the reservoir area has a severe innudation impact, so it is difficult to implement as scheduled, thus causing low application level of the water resources of this region.
5.0 Environment Baseline Survey & Assessment
131
� Low repeating utilization factor and large water consumption of industrial and
agricultural water consumption
Low repeating utilized water of productive water of industrial and mining firms in this region is less, the water consumption per ten thousand yuan output value is bigger, domestic water saving apparatus are of low popularization rate, flooding irrigation is widely applied for agricultural water consumption with a large water resource waste.
� More and more serious water pollution
At present, counties, cities and districts within the drainage area basically have no wastewater treatment plants, a large amount of untreated wastewater and contaminated water are drain at will, plus excessive pesticides application and fertilizers, which has polluted not only water sources but soil. Because the water is polluted, it has affected ecological environment and human physical and mental health.
5.2.4 Regional Population Health Status
In accordance with Statistics of Monitoring of Infectious Diseases in Taihe County in 2005, Taihe County in 2005 reported 15 kinds of infectious diseaseincluding virus hepatitis, measles, hemorrhagic fever, hydrophobia, diarrhea, pulmonary tuberculosis, typhia, paratyphoid, tetanus of newborn, gonorrhoea, syphilis, influenza, mumps, epidemic roseola, acute hemorrhagic conjunctivitis and infectious diarrheato amount to 1408 cases at a disease rate of 264.78/105, 4.22% more than last year. Seventeen died, at a mortality rate of 3.2/105 there are other 5 kinds of infectious diseasegonococcal urethritis, verruca acuminate, herpes genitalis, chicken pox, and tuberculous pleurisy to total 25 cases. The most reported cases are TB (886 cases), contributing to 62.3%followed by virus hepatitis (377 cases) or 26.78% of all.
5.2.5 Antiquities Preservation
Jiangxi Provincial Institute of Cultural Relics and Archaeology, as only one specialized organ of Jiangxi Province, is able to independently carry out archaeological exploitation and unearthing work, entrusted by Navigational Affair Administration of Jiangxi Provincial Communications Bureau to organize specialized personnel for cultural relics exploitation work at the inundation area of the Shihutang reservoir since December 9, 2006 and completed the exploitation work on January 3, 2007 smoothly. On the basis of the site exploitation and unearthing work, Jiangxi Provincial Institute of Cultural Relics and Archaeology completed preparation of Cultural Relics Investigation Report of Jiangxi Shihutang Shipping and Hydropower Pivotal Project at the Kan River at the end of January 2007.
According to the research findings of Cultural Relics Investigation Report of Jiangxi Shihutang Shipping and Hydropower Pivotal Project at the Kan River, in the inundation area of the reservoir, one ancient ferry (Huangkeng Ancient Ferry does not belong to cultural relics protected unit of different grades) was found; at the vicinity of the inundation area, two ancient city sites were found (Baikou Ancient City Site, state grade cultural relics protected unit); In addition, Gouzi Pagoda (county-level cultural relics protected unit) and Ouyang Ancestral Hall

5.0 Environment Baseline Survey & Assessment
132
(under application for province-level cultural relics protected unit) were found in a scope with a certain distance from the inundation area. Distribution of the cultural relics and historic sites of the Project is shown in DRAWING NO.03.
The reservoir area of this Project is involved in seven townships of Taihe County of Ji’an City – Wanhe, Zhangtang, Yanxi, Tangzhou, Chengjiang, Xilong and Mashi and low-lying area of Taihe County Seat. � Wanhe Township: no ancient cultural relics are found at Shengkou, Kuangjia, Duxia and Shihutang at upper and down areas of the dam site and at Jiangjiazhou, Xiabian and Shaxi at the inundation area. � Zhangtang Township: Through survey, the Guabang Mountain at the bank of the Kan River was the battlefield of national hero Wen Tianxiang of late Song Dynasty to fight with Yuan, an ancient ferry was found in the inundation area.
�Huangkeng Ancient Ferry
Huangkeng Ancient Ferry is located at southwest of Huangkeng Village, 2km wouthwest of Zhangtang Polder, its age is about Qing Dynasty. Nearby the ferry, there is a road to the ancient street. This ferry is not very important and does not belong to cultural relics protected unit of different grades.
Huangkeng Ancient Ferry in Literature Status quo of Huangkeng Ancient Ferry
Huangkeng Ancient Ferry Section Ancient polder nearby Huangkeng Ancient Ferry
� Yanxi Township: Through survey, no ancient cultural relics are found at Hetou and Lingbei at upper and down areas of the dam site and at

5.0 Environment Baseline Survey & Assessment
133
Tongluobei, Mopanxing, Zhangjiapeng, Heshupeng, Xinzhou, Guabang, Huangkengpengxia, Gaoping, Gangboyao and Jiangqian Village at the inundation area. There is a Gouzinao Pagoda (picture on the right ) of Qing Dynasty atop the Gouzinao Mountain, 60m away from the inundation area, which belongs to county grade cultural relics protected unit, the pagoda bottom elevation is far higher than design flood level. Project construction and reservoir area inundation will not cause damage or impact on it. � Tangzhou Township: Through survey, two ancient city sites are found in the inundation area.
� Ancient City Site
Ancient City Site is situated at Luojia, Xiamu Village of Hejiang Villagers Committee, 2km north of Tangzhou Township (Yongchang City). The site is basically in square shape, about 397m east-west long and about 387m south-north wide, with total area of about 160,000 square meters. The northeast wall is well protected, adjacent to the Kan River and the Zhulin River; South and west walls are sporadically existing, there is a moat outside the south wall, and city gate outside the west wall. It is analyzed as per the county annals and cultural deposit of the site that the age of this city site is at about Nan Dynasty. This city site is 40m away from the south bank of the Kan River, with elevation of the side close to the Kan River is over 60.68m, higher than design flood level 58.65m, which will not be affected by level rise of the Kan River. But the Foundation elevation of part of the east wall of the city wall close to the Zhulin River is 56.7m, about 0.2m higher than normal impounded level 56.5m, lower than design flood level 58.65m due to rerouting of the Zhulin River, thus about 250m long wall foundation will be affected by level rise of the Zhulin River, this city site does not belong to cultural relics protected unit of different grades.
� Baikou City Site
Baikou City Site is located at the south bank of the Kan River, Zhoutou Village of Tangzhou Township, 3km southwest of Taihe County Seat with an area of 230,000m2, in converse cascade shape, divided into inner and outer cities. The outer city is 1941m long in total, except that part of northwest of the outer city is damaged, most of the outer city is well protected. The inner city is in square shape, at north side of the Baikou City, 861m long in total, with an area of 43,000m2. The outer city now has seven openings, the inner city has three openings, like city gates. Northwest gate of the inner city is of concave structure, like small town outside the city gate. The city wall is built with earth, there is a moat outside the city, flowing into the Kan River from south to north. Archaeological information shows that the Baikou City was built at early West Han Dynasty and was used till East Jin Dynasty. This Site was listed into the sixth lot of state grade key cultural relics protected units by the State Council. Site survey shows that this Site is now 25m away from the south bank of the Kan River, the bank elevation of the side of the Site close to the Kan River is over 59.3m, higher than design flood level 58.65m, which will not be affected by the level rise of the Kan River and be consistent with the regulations of Cultural Relics Protection Law of P.R. China. � Chengjiang Township: no cultural relics are found through survey. � Xilong Township: no cultural relics are found in the inundation area through survey.

5.0 Environment Baseline Survey & Assessment
134
Ancient city site relief map Ancient city site plan sketch
Northwest of the ancient city site South city wall and moat of the ancient city site
Small town at southeast of the ancient city site Small town at northwest of the ancient city site
East wall and the Zhulin River of the ancient city site Wall section of the ancient city site

5.0 Environment Baseline Survey & Assessment
135
Protection sign of the Baikou city site Relief map of the Baikou city site
Panorama of the Baikou city site Plan sketch of the Baikou city site
� Mashi Township: no cultural relics are found in the inundation area through survey. Shujianggu Village of Mashi Township has Ouyang Ancestral Hall of Qing Dynasty, about 1.5km away from the Kan River, under application for provincial grade cultural relics protected unit, because Ouyang Ancestral Hall is far away from the inundation area of the project, the Project construction and the reservoir area inundation will not cause damage or impacts on it.
5.2.6 Mineral resources
The stratum here is simple in structure in the permanent acquisition of land by the Project, mainly composed of cretaceous Maodian Group (k2m), Zhoutian Group (k2z) and Hongningang Group K2hg) of red clasolite; of gravel and vermiform reticulate laterite of Jinxian Group of Pleistocene series of quaternary system; of alluvial gravel, sandy loam and clay soil of Holocene. There is no metallic mineral resource or non-metallic resource, except for such non-vital minerals as building sand, rocks and clay soil, etc.
5.3 Investigation of Pollution Sources 5.3.1 Air Pollution In accordance with the data obtained in Ji’an Environment Detection Station in 2006, industrial fume in 2006 in Ji’an amounted to 37.4115 billion m3, with air pollution mainly rooting from Jiangxi Taihe Yuhua Cement Company LTD, whose industrial fume contributed to 89.9% in local regions. Domestic and other SO2 discharge quantity is 1097t, mainly from Jiangxi Taihe Yuhua Cement Company LTD, Taihe Brick Firm Group and Jiangxi Luqing Nitro-cotton

5.0 Environment Baseline Survey & Assessment
136
Company. Domestic and other NOx discharge quantity is 435t. For details, see Table 5.3-1 and Table 5.3-2. Table 5.3�1 Local Industrial Waste Gas
No Enterprise Name Industrial Waste Gas (104m3)
Percentage (%)
1 Jiangxi Taihe Yuhua Cement Co. LTD
335985 89.8079
2 Jiangxi Luqing Cotton Company 15250 4.0763
3 Jiangxi Jinshui Paper Co. LTD 3255 0.8701
4 Jiangxi Zhetai Industry Com LTD 3255 0.8701
5 Jiangxi Xiangtai Paper Com LTD 3255 0.8701
6 Taihe Rongtai Package Com LTD 3255 0.8701
7 Jiangxi Tianlan Plant Extracts Com LTD
2625 0.7017
8 Taihe Songtai Forestry Com LTD 2625 0.7017
9 Taihe Yonghe Industry Com LTD 1575 0.4210
10 Jiangxi Kang’en Chinese Medicine Health Co. LTD
840 0.2245
11 Jiangxi Hangtian Chemical Co. LTD
630 0.1684
12 Jiangxi Half-sky Medicine Co. LTD
525 0.1403
13 Jiangxi Wangde Chemical Tech Co. LTD
520 0.1390
14 Jiangxi Baishineng Yard-dyed Fabric Co. LTD
268 0.0716
15 Taihe Goose Cotton Spinning Co. LTD
194 0.0519
16 Jiangxi Yuhuan Spice Co. LTD 58 0.0155

5.0 Environment Baseline Survey & Assessment
137
Table 5.3�2 Major Waste Air Quantity
No Enterprise Name SO2 (kg/a)
1 Jiangxi Taihe Yuhuan Cement Co. LTD 1300000
2 Taihe Brick Group Co. 518012
3 Jiangxi Luqing Nitro-cotton Co. LTD 464768
4 Jiangxi Xiangtai Paper Co. LTD 99200
5 Taihe Rongtai Package Co. LTD 99200
5.3.2 Investigation of Water Pollution Source In accordance with the pollution sources data obtained in Ji’an Environment Detection Station in 2006 and with site investigation, from the dam site to the terminal of backup (38.19km), there are three waste drains -- Taihe County Seat drain, industrial garden drain and Yanxi Wastewater Treatment Plant drain, waste water from Taihe County Seat drain is domestic sewage, while waste water from the industrial garden drain and Yanxi Wastewater Treatment Plant drain is industrial wastewater. In 2006 industrial waste water totaled 1520.54×104t/a�of which domestic sewage aggregated 571.15×10⁴t/a and industrial waste water totaled 949.39×10⁴t/a. COD and NH3-N discharge quantities in domestic sewage are 3212.73t/a and 249.88t/a. The major pollution sources come from Jiangxi Jinshui Paper Com LTD, Jiang Zhetai Industry Com LTD, Jiangxi Xiangtai Paper Com LTD and Taihe Rongtai Package Com LTD, the four of which contributed to 92.1 % of the total waste water. For detail see Table 5.3�3, and for major drains of the reservoir area, see Attached Drawing 03.

5.0 Environment Baseline Survey & Assessment
138
Table 5.3�3 Major Industrial Waste Water Discharge
No Pollution Source Quantity (t/a) COD (kg/a) Percentage�%�
1 Jiangxi Jingshui Paper Co. LTD
1800000 735991 23.02
2 Jiangxi Zhetai Industry Co. LTD
1800000 735991 23.02
3 Jiangxi Xiangtai Paper Co. LTD
1800000 735991 23.02
4 Taihe Rongtai Package Co. LTD
1800000 735991 23.02
5 Jiangxi Luqing Nitro-cotton Co. LTD
1538550 130776.8 4.09
6 Taihe Yonghe Industry Com LTD
170000 54400 1.70
7 Jiangxi Taihe Yuhuan Cement Co. LTD
140000 7000 0.22
8 Jiangxi Xiaolong Tunsten Co. LTD
99620 8966 0.28
9 Jiangxi Half-sky Medicine Co. LTD
62500 13750 0.43
10 Jiangxi Hangtian Chemical Co. LTD
42500 2278 0.07
11 Taihe Songtai Forestry Co. LTD
40800 12500 0.39
12 Taihe Guangtai Chemical Co. LTD
30556 7945 0.25
13 Jiangxi kang’an Chinese Medicine & Health Products Co. LTD
12240 2526.9 0.08
14 Jiangxi Tianlan Plant Extracts Co. LTD
10400 8840 0.28
15 Jiangxi Baishineng Yard-dyed Fabric Co. LTD
6800 1768 0.06
16 Jiangxi Yuhuan Spice Co. LTD
4250 1275 0.04
17 Jiangxi Wande chemical Tech Co. LTD
3350 536 0.02
18 Taihe Goose Cotton Spinning Co. LTD
323 17.1 0.001
In addition, non-point source pollution comes from such aspects as follows: � Agricultural pollution source Agriculture is the pillar industry in the assessment region, lack of effective drainage engineering, the seepage is drained to township gulches and canals, so that waste water seepages while the pollutants accumulate in the gulches or canals, with a lot of solid waste
5.0 Environment Baseline Survey & Assessment
139
accumulated in township surface. Such solid waste includes daily waste and crops, which under rainfall flush transfer to the water body. The farm chemicals and fertilizer applied in great amounts are partly absorbed and quite a large percentage of them are transferred to Kan River to produce negative impact upon aquatic environment. � Surface Runoff in Towns Pollutants out of such surface runoff come mainly from rainfall, with surface deposit constituting the majority of pollutant in surface runoff. Such surface deposit is mainly of rubbish, atmosphere dust, rubbish accumulation, animal and plant relics, fallen leaves and traffic derelics. The major factors upon pollutant loading amount come from waterproof area, storm-water drain system, traffic impact, curb height and street sweeping. � N/P Feed into River Such nutrient substance in Kan River comes mainly from domestic sewage and agricultural activities, in three forms, namely domestic sewage, water loss and soil erosion and farm chemicals and fertilizers. Residents are dens in Chengjiang Town, Taihe County Town. In accordance with investigation concerning water resources, N/P fed into the river at County Town Drain Outlet reached 189.4 t and 69.6 t respectively. Agricultural pollution is mainly in the form of farm chemicals and fertilizers. Soil into the reservoir due to water loss and soil erosion aggregates 1,067,400 t annually. Calculated at an average of 1.5� of soil organic matter, then gross organic matter loss reached 16000 t annually; calculated at 0.1� of N and 0.12� of P, then N and P into reservoir aggregate 16.01 ton and 19.21 t respectively. N/P in water migration and reservoir movement will suffer from absorption, assimilation, precipitation, volatilization and retro-gradation. Calculated at a consumption percentage of 70% for N and 95% for P, N/P that flows into reservoir amounts to 4.8t and 0.96t respectively. In accordance with the spastics in 2005 for Taihe County, the major fertilizer applied includes nitrogenous fertilizer, phosphate fertilizer, potash fertilizer and compound fertilizer, of which the N makes up the majority, or 60 % of all, at 34.19kg/mu. Calculated at 44014 mu of farmland around the reservoir, annual application of N totals 1536.53 5, so pure nitrogen applied to the land totals 424.08 t and P 110.63 t annually. N/P loss amount, if estimated according to nutrient substance loss formula, does as follows: EN.P=FN.P·(1-x)·y Of which� EN.P—estimated N/P loss amount� FN.P—N/P content in fertilizer� x—crop’s absorption factor of fertilizer--N: 30%�P:15%� y—fertilizer loss rate after feeding into soil and water body--N:30%; P:5% Calculation indicates that N/P entering water body totals 89.06t/a and 4.70t/a respectively.

5.0 Environment Baseline Survey & Assessment
140
To sum up, N/P from domestic sewage, water loss and soil erosion and fertilizers fed into Kan River aggregates 194.86t/a and 42.76t/a respectively. 5.4 Status Quo & Assessment of Water Environment 5.4.1 Investigation of Existing Water Environment � Detection Period & Section Existing water environment was under observation twice on 13 and 19 March, 2007. There were 6 sections under observation. For detail see table 5.4—1 and Attached Drawing 02. � Sampling Items Observation was made concerning water temperature, pH, suspended substance, permanganate index, BOD5, DO, NH3-N, petroleum, mercury, volatile phenol, total phosphorus, total nitrogen, hexavalent chrome and coli-group. � Analytic Procedure For detail see Table 5.4�2. � Conclusion For detail see Table 5.4�3 and Table 5.4�4. Of the twice observation, there was no detection of petroleum, mercury, volatile phenol or hexavalent chrome. Ji’an
� Perennial routine monitoring results
The main pollutants monitoring results of the drinking water source water quality of Ji’an downtown in 2006 (at 28km�33km downstream of the dam site) provided by Ji’an City Environment Monitoring Station are shown in Table 5.4-5. The main pollutants routine monitoring results of the water quality of Shengangshan Section (Shengkong) (at ~33km downstream of the dam site) of Ji’an City in 2006 and the first half of 2007 provided by Ji’an City Environment Monitoring Station are shown in Table 5.4-6. Table 5.4�1 Detection Sections & Sampling Points of Surface Water Environment
Item
Sections Criteria Sampling Point
1# Backwater edge, 100m upper stream
Surface Water Environmental Quality Standards (SWEQS), Grade III (GB3838-2002)
2# Taihe County Town Drainage Outlet
SWEQS, Grade III (GB3838-2002)
3# Gouzinao Intake, 100m upper stream
SWEQS , Grade II (GB3838-2002)
4# 200m upper stream of dam site
SWEQS , Grade III (GB3838-2002)
In section channel line and on the left/right side of the line there would be a sampling vertical.

5.0 Environment Baseline Survey & Assessment
141
5# 1km downstream of dam site
SWEQS , Grade III (GB3838-2002)
6# 100m downstream of Wanhe Drainage Sluice
SWEQS , Grade III (GB3838-2002)

5.0 Environment Baseline Survey & Assessment
142
Table 5.4�2 Analytical Procedure & Instrumentation of Water Quality Detection
Item Analytical Procedure Instrumentation & Types
pH glass electrode �GB 6920-86� PXS-270 ion(o)meter
Suspended substance
gravimetric method �GB 11901�89�
AB104-N Mettler balance
permanganate index
acid process�GB11892-89� —
BOD5 Dilution & inoculation �GB7488-87�
—
Dissolved oxygen
Electrochemistry probe method �GB11913-89�
OX1315I/SET dissolved oxygen meter
Ammonia n Nessler's reagent photometry�GB7479-87�
VIS-7220 visible spectrophotometer
Petroleum infrared spectrophotometer�GB/T16488-1996�
JDS-100Z infrared ullage meter
Mercury atomic fluorescence spectrometry, in line with Water & Waste Water Analytic Procedure (4th edition)
WCG-200 differential mercury detector
Volatile phenol
4 amino-antipyrine extraction spectrophotometric method �GB7490-87�
VIS-7220 visible spectrophotometer
Total phosphorus
Molybdenum & stibium spectrophotometer�GB 11893-89�
TAS-990 Super atomic absorption spectrophotometer
Total nitrogen
potassium peroxodisulfate ultraviolet spectrophotometric method�GB11894-89�
TV-1800/1800S ultraviolet spectrophotometer
Hexavalent chrome
dinitrodiphenyl carbazide spectrophotometric method�GB 7467-87�
VIS-7220 visible spectrophotometer
Coli --group Multistream zymotechnics in line with Water & Waste Water Analytic Procedure (4th edition)
—

5.0 Environment Baseline Survey & Assessment
143
Table 5.4�3 Conclusion of Water Quality Detection
Unit�mg/L(PH: zero dimension) Observation result�On 13 March, 2007�
Items Backwater : 100m upper stream in 1# reservoir
Taihe County Town rain Outlet 2#
100m upper stream in 3# Gouzinao Intake
200m upper stream in 4# dam site
1km downstream in No 5# dam site
1km downstream in No 6# Wanhe Drain Sluice
Water Quality
Clear Clear Clear Clear Clear Clear
Water (�) temperature
16.0 15.9 16.1 16.2 16.2 16.1
PH 7.12 7.04 7.18 7.16 7.20 7.19 Suspended solid
25.0 29.0 27.0 26.0 28.0 26.0
Permanganate index
2.03 2.85 2.17 2.25 2.46 2.51
BOD5 1.3 1.2 2.7 1.4 1.0 1.6 Dissolved oxygen
7.70 7.67 7.38 7.40 7.41 7.38
Ammonia n 0.168 0.178 0.097 0.127 0.116 0.083 Petroleum 0.001L 0.001L 0.001L 0.001L 0.001L 0.001L
Mercury 0.000005L 0.000005L
0.000005L 0.000005L 0.000005L 0.000005L
Volatile phenol
0.002L 0.002L 0.002L 0.002L 0.002L 0.002L
Total phosphorus
0.02 0.02 0.01 0.01 0.01 0.01
Total nitrogen
1.46 1.57 1.84 2.04 2.00 1.99
Hexavalent chrome
0.004 0.004 0.004L 0.004L 0.004L 0.004L
Coli --group 9400 7900 200 500 200 200 *Note�L means no such substance was detected.
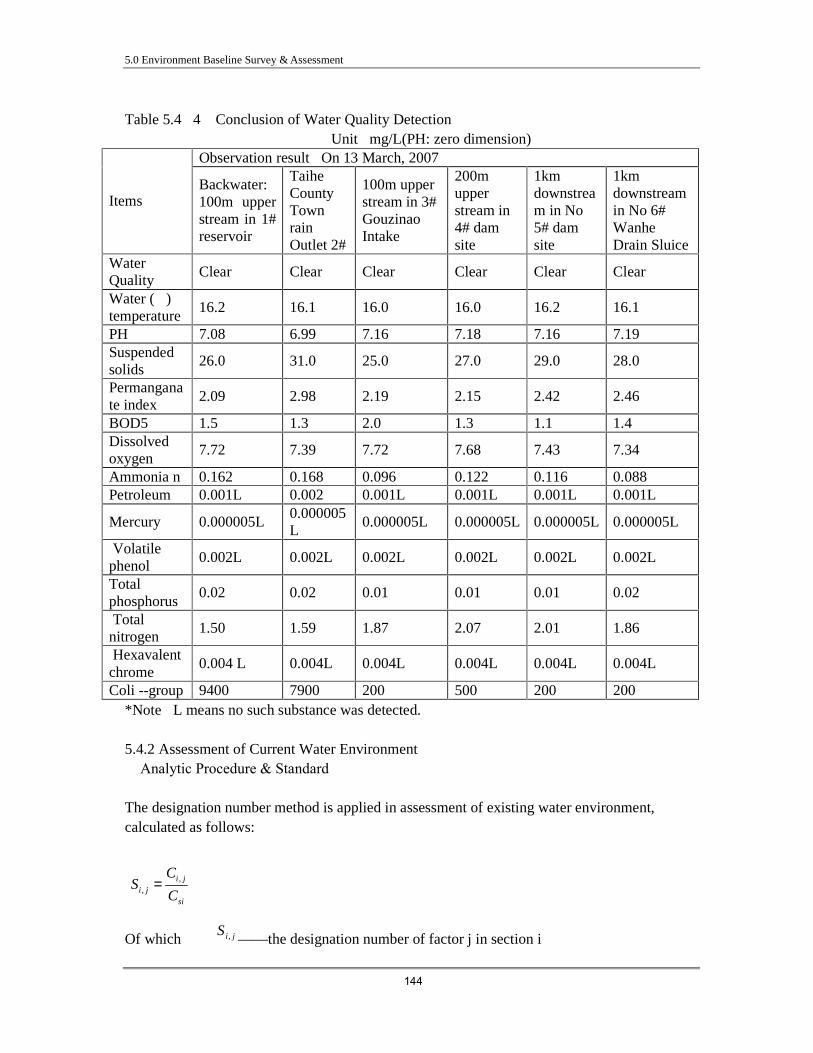
5.0 Environment Baseline Survey & Assessment
144
Table 5.4�4 Conclusion of Water Quality Detection
Unit�mg/L(PH: zero dimension) Observation result�On 13 March, 2007�
Items Backwater: 100m upper stream in 1# reservoir
Taihe County Town rain Outlet 2#
100m upper stream in 3# Gouzinao Intake
200m upper stream in 4# dam site
1km downstream in No 5# dam site
1km downstream in No 6# Wanhe Drain Sluice
Water Quality
Clear Clear Clear Clear Clear Clear
Water (�) temperature
16.2 16.1 16.0 16.0 16.2 16.1
PH 7.08 6.99 7.16 7.18 7.16 7.19 Suspended solids
26.0 31.0 25.0 27.0 29.0 28.0
Permanganate index
2.09 2.98 2.19 2.15 2.42 2.46
BOD5 1.5 1.3 2.0 1.3 1.1 1.4 Dissolved oxygen
7.72 7.39 7.72 7.68 7.43 7.34
Ammonia n 0.162 0.168 0.096 0.122 0.116 0.088 Petroleum 0.001L 0.002 0.001L 0.001L 0.001L 0.001L
Mercury 0.000005L 0.000005L
0.000005L 0.000005L 0.000005L 0.000005L
Volatile phenol
0.002L 0.002L 0.002L 0.002L 0.002L 0.002L
Total phosphorus
0.02 0.02 0.01 0.01 0.01 0.02
Total nitrogen
1.50 1.59 1.87 2.07 2.01 1.86
Hexavalent chrome
0.004 L 0.004L 0.004L 0.004L 0.004L 0.004L
Coli --group 9400 7900 200 500 200 200 *Note�L means no such substance was detected. 5.4.2 Assessment of Current Water Environment � Analytic Procedure & Standard The designation number method is applied in assessment of existing water environment, calculated as follows:
,,
i ji j
si
CS
C=
Of which� jiS , ——the designation number of factor j in section i

5.0 Environment Baseline Survey & Assessment
145
jiC , ——measured concentration of factor j in section i�mg/L
siC ——evaluation criterion of factor j�mg/L
The designation number of pH is calculated as follows�
,
7.0
7.0j
pH jsd
pHS
pH
−=
− 7.0jpH ≤
,
7.0
7.0j
pH jsu
pHS
pH
−=
− 7.0jpH >
Of which�
,pH jS——The designation number of pH
jpH——measured value of pH in section j
supH � sdpH ——upper limit value and lower limit value of pH
For water-dissolved oxygen (DO) it is calculated as follows:
sf
if
DOi DODO
DODOS
−
−=,
DOi�DOs
s
iDOi DO
DOS 910, −=
DOi�DOs
468/(31.6 )fDO T= +
Where,
DOiS , ——The designation number of dissolved oxygen in section i, mg/L
DOi ——dissolved oxygen concentration in section I, mg/L; DOf ——saturated dissolved oxygen concentration in site temperature and salt
content�mg/L� DOs ——evaluation criterion value of dissolved oxygen, mg/L Evaluation criterion adopts Grade II and III in accordance with different sections in line with Surface Water Environmental Quality Standards (SWEQS), Grade III (GB3838-2002) (Section No 3 belongs to Grade II and the rest to Grad III).

5.0 Environment Baseline Survey & Assessment
146
Table 5.4 5 Water quality monitoring result of main drinking water sources of Ji’an City in 2006 Unit: mg/L,
except pH
Item Section
pH Total N Permanganate
index Volatile phenol
Oils Coliform
flora�pcs/L� NH3-N
Average value
7.46 1.07 1.64 0.001 0.001 2521 0.138
Content range 6.80�8.0 0.77�1.92 0.8�2.35 0.001�0.001 0.001�0.004 700�7900 0.03�0.291 Std.
Exceeding rate�%�
0 0 0 0 0 0 0
Yangming Wate
r Work
s Month of peak value
3 8 12 2 7�12 2
Average value
7.45 0.98 1.79 0.001 0.007 2728 0.132
Content range 7.0�8.1 0.61�1.28 1.1�2.44 0.001�0.001 0.001�0.046 490�17000 0.05�0.355 Std.
Exceeding rate�%�
0 8.8 0 0 0 8.8 0
Jifu Wate
r Work
s Month of
peak value 3 4 5 2 7 2
Average value
7.48 1.38 1.63 0.001 0.003 5220 0.140
Content range 7.20�7.9 1.02�2.01 0.90�2.16 0.001�0.001 0.001�0.018 180�35000 0.010�0.29 Std.
Exceeding rate�%�
0 17.0 0 0 0 25.6 0
Hedong Water Works
Month of peak value
3 8 12 1 1 3

5.0 Environment Baseline Survey & Assessment
147
All year around
Annual
average 7.49 1.14 1.69 0.001 0.004 3299 0.14
Table 5.4 6 Water quality monitoring result of Shengangshan Section of the Kan River in 2006 and the first half of 2007
Unit: mg/L, except pH
Year Month Day Water T.�
pH Dissolved
O2 Permanganate
Index COD BOD NH3-N Total P Cr+6
Volatile phenol
Oils Coliform
flora �pcs/L�
2 9 8.9 6.96 10.4 2.08 12.10 2.6 0.278 0.01 0.002 0.001 0.012 1400
4 4 21.0 7.04 8.2 1.93 3.12 2.2 0.298 0.06 0.002 0.001 0.001 790
6 8 22.6 7.27 8.0 2.16 6.96 0.4 0.152 0.06 0.002 0.001 0.001 790
8 9 29.8 7.28 7.2 1.99 6.28 2.5 0.080 0.04 0.002 0.001 0.005 230
10 10 22.9 7.04 7.1 1.46 5.46 1.1 0.101 0.02 0.002 0.001 0.001 2300
2006
12 12 12.2 7.68 10.3 2.31 5.22 1.6 0.137 0.037 0.002 0.001 0.007 4900
2 5 11.0 7.65 10.2 2.35 3.08 0.6 0.065 0.02 0.002 0.001 0.001 1100
4 9 17.7 7.20 7.8 2.40 4.46 0.3 0.127 0.01 0.002 0.001 0.001 1100 2007
6 8 26.6 6.62 5.5 2.35 4.25 0.8 0.155 0.01 0.002 0.001 0.001 1300

5.0 Environment Baseline Survey & Assessment
148
� Assessment Conclusion of Existing Water Quality �The current water quality monitoring results are listed in Table 5.4�7. From the monitoring results it is clear that all the values of pH, permanganate index, BOD5, DO, NH3—N, total phosphorus and coli-group are within the standard values with standard exceeding rate as zero. As a result current water environment of the Kan River satisfies Grade II and III of water quality standard. �The main pollutants monitoring results of the drinking water source water quality of Ji’an downtown in 2006 (at 28km�33km downstream of the dam site) show that the standard exceeding items of the drinking water source water quality of Ji’an downtown are coliform flora and total N at 8.3% and 7.5% respectively, the other item do not exceed the standard values and that Yangming Water Works has no monitoring items exceeding the standard values all the year around, coliform flora and total N of Jifu Water Works exceed the standard values with the same standard exceeding rate of 8.8%, coliform flora and total N of water source of Hedong Water Works exceed the standard values with the standard exceeding rates 7.9� and 17.0� respectively. �The main pollutants routine monitoring results of the water quality of Shengangshan Section (Shengkong) (at ~33km downstream of the dam site) of Ji’an City in 2006 and the first half of 2007 indicate that the water quality of the said river section has no pollutants exceeding the standard (Grade III) with good water quality all the year around. Table 5.4�7 Statistics of Designation Number of Water Quality Assessment Factors
Assessment Conclusion
Items Date Backwater : 100m upper stream in 1# reservoir
Taihe County Town rain Outlet 2#
100m upper stream in 3# Gouzinao Intake
200m upper stream in 4# dam site
1km downstream in No 5# dam site
1km downstream in No 6# Wanhe Drain Sluice
2007.3.13 0.06 0.02 0.09 0.08 0.1 0.095
2007.3.19 0.04 0.01 0.08 0.09 0.08 0.095 2007.3.13 0.34 0.48 0.54 0.38 0.41 0.42 Permanganate
index 2007.3.19 0.35 0.50 0.55 0.36 0.40 0.41 2007.3.13 0.33 0.30 0.90 0.35 0.25 0.40
2007.3.19 0.38 0.33 0.67 0.33 0.28 0.35 2007.3.13 0.44 0.45 0.64 0.50 0.50 0.51 Dissolved
Oxygen 2007.3.19 0.43 0.50 0.55 0.45 0.49 0.51 2007.3.13 0.17 0.18 0.19 0.13 0.12 0.08
Ammonian 2007.3.19 0.16 0.17 0.19 0.12 0.12 0.09 2007.3.13 0.10 0.10 0.10 0.05 0.05 0.05 Total
phosphorus 2007.3.19 0.10 0.10 0.10 0.05 0.05 0.10 2007.3.13 0.94 0.79 0.10 0.05 0.02 0.02
Coli --group 2007.3.19 0.94 0.79 0.10 0.05 0.02 0.02

5.0 Environment Baseline Survey & Assessment
149
5.5 Investigation & Evaluation of Existing Ambient Air 5.5.1 Investigation & Evaluation of Existing Ambient Air � Monitor Factor & Sampling Points There were three monitor points, as indicated in Table 5.1—1 and Attached Drawing 02, to monitor such factors as TSP, NO2 and SO2. � Monitor Period & Frequency The sampling was taken on 14 to 18 March, 2007 continuously for five days, when sampling for TSP lased over 12 hours and for SO2 and NO2 18 hours a day. � Monitor & Analytic Procedure For detail see Table 5.5�2. Table 5.5-1 Sampling Points of Ambient Air Conditions
No Location Criteria
1# Shihutang Township�right bank of dam site�
2# Xiaying Township�left bank of dam site�
3# Roadway in Jiangjia Township (the road for use in construction period�
Grade II as described in Quality Criteria for Ambient Air
Table 5.5�2 Analytic Procedure of Ambient Air
Items Analytic Procedure Instrumentation & Types
KC-6120 Atmospheric Sampling Instrument
Melamine-absorptive rosaniline spectrophotometry VIS-721 visible spectro-photometry
KC-120 Atmospheric Sampling Instrument
Ethylene diamine hydrochloride colorimetry
VIS-7220 visible spectro-photometry
KC-6120 Atmospheric Sampling Instrument Gravimetric method AB104-N Mettler Balance
� Conclusion of Ambient Air Monitoring See Table 5.5�3.

5.0 Environment Baseline Survey & Assessment
150
Table 5.5-3 Conclusion of Ambient Air Monitor Unit�mg/m3
SO2 NO2 Sample Points
Date Hour mean value
Day mean value
Hour mean value
Day mean value
Day mean value
2007.3.14 0.017�0.039 0.027 0.011�0.039 0.026 0.124
2007.3.15 0.020�0.047 0.030 0.003�0.040 0.020 0.115
2007.3.16 0.017�0.037 0.026 0.005�0.036 0.02 0.121
2007.3.17 0.017�0.030 0.024 0.005�0.029 0.019 0.115
��
2007.3.18 0.018�0.029 0.025 0.006�0.036 0.021 0.110
2007.3.14 0.018�0.054 0.038 0.008�0.039 0.024 0.118
2007.3.15 0.016�0.043 0.028 0.013�0.040 0.029 0.119
2007.3.16 0.014�0.032 0.023 0.006�0.043 0.026 0.116
2007.3.17 0.014�0.040 0.024 0.014�0.045 0.031 0.122
��
2007.3.18 0.016�0.029 0.022 0.012�0.045 0.032 0.119
2007.3.14 0.015�0.055 0.035 0.013�0.053 0.034 0.137
2007.3.15 0.013�0.059 0.033 0.011�0.047 0.029 0.127
2007.3.16 0.013�0.062 0.034 0.009�0.049 0.031 0.132
2007.3.17 0.015�0.056 0.033 0.009�0.052 0.031 0.135
��
2007.3.18 0.013�0.057 0.034 0.006�0.048 0.0028 0.133
5.5.2 Assessment of Existing Ambient Air � Evaluation Criteria Ambient air is under evaluation in line with Quality Criteria for Ambient Air (modified) (GB3095-1996) of Grade II. See Table 1.4-3. � Analytic Procedure Ambient air is under evaluation through designation number, in such formula as follows:
/i i oiP C C=
Where, Pi——the designation number of evaluation factor i Ci——measured concentration of factor i�mg/m3� Coi——criteria of factors�mg/m3 � Conclusion See Table 5.5-4.
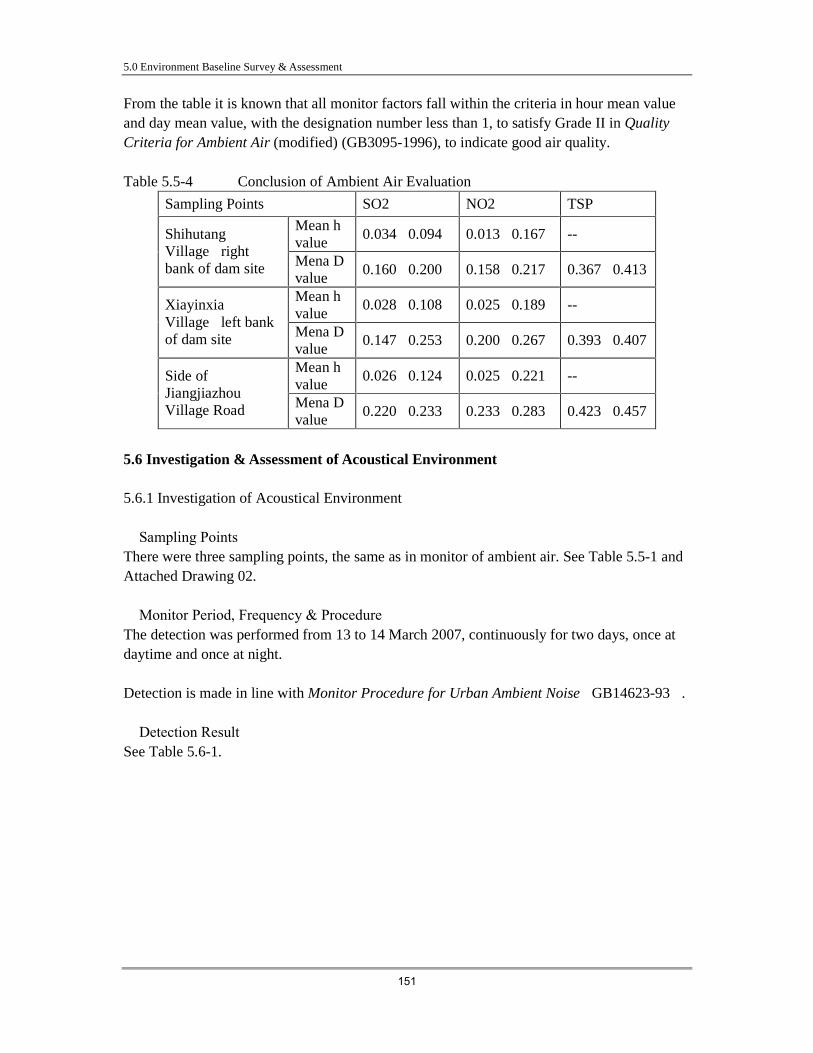
5.0 Environment Baseline Survey & Assessment
151
From the table it is known that all monitor factors fall within the criteria in hour mean value and day mean value, with the designation number less than 1, to satisfy Grade II in Quality Criteria for Ambient Air (modified) (GB3095-1996), to indicate good air quality. Table 5.5-4 Conclusion of Ambient Air Evaluation
Sampling Points SO2 NO2 TSP
Mean h value
0.034�0.094 0.013�0.167 -- Shihutang Village�right bank of dam site� Mena D
value 0.160�0.200 0.158�0.217 0.367�0.413
Mean h value
0.028�0.108 0.025�0.189 -- Xiayinxia Village�left bank of dam site� Mena D
value 0.147�0.253 0.200�0.267 0.393�0.407
Mean h value
0.026�0.124 0.025�0.221 -- Side of Jiangjiazhou Village Road Mena D
value 0.220�0.233 0.233�0.283 0.423�0.457
5.6 Investigation & Assessment of Acoustical Environment 5.6.1 Investigation of Acoustical Environment � Sampling Points There were three sampling points, the same as in monitor of ambient air. See Table 5.5-1 and Attached Drawing 02. � Monitor Period, Frequency & Procedure The detection was performed from 13 to 14 March 2007, continuously for two days, once at daytime and once at night. Detection is made in line with Monitor Procedure for Urban Ambient Noise�GB14623-93�. � Detection Result See Table 5.6-1.
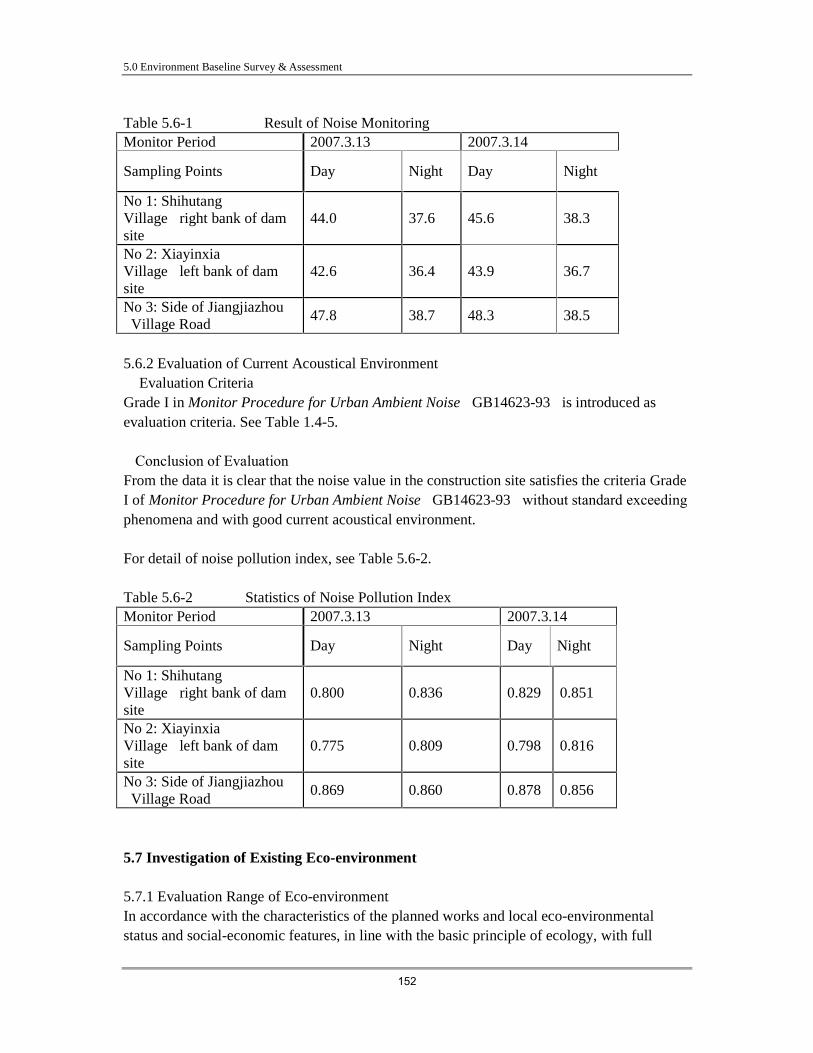
5.0 Environment Baseline Survey & Assessment
152
Table 5.6-1 Result of Noise Monitoring Monitor Period 2007.3.13 2007.3.14
Sampling Points Day Night Day Night
No 1: Shihutang Village�right bank of dam site�
44.0 37.6 45.6 38.3
No 2: Xiayinxia Village�left bank of dam site�
42.6 36.4 43.9 36.7
No 3: Side of Jiangjiazhou Village Road
47.8 38.7 48.3 38.5
5.6.2 Evaluation of Current Acoustical Environment � Evaluation Criteria Grade I in Monitor Procedure for Urban Ambient Noise�GB14623-93�is introduced as evaluation criteria. See Table 1.4-5. �Conclusion of Evaluation From the data it is clear that the noise value in the construction site satisfies the criteria Grade I of Monitor Procedure for Urban Ambient Noise�GB14623-93�without standard exceeding phenomena and with good current acoustical environment. For detail of noise pollution index, see Table 5.6-2. Table 5.6-2 Statistics of Noise Pollution Index Monitor Period 2007.3.13 2007.3.14
Sampling Points Day Night Day Night
No 1: Shihutang Village�right bank of dam site�
0.800 0.836 0.829 0.851
No 2: Xiayinxia Village�left bank of dam site�
0.775 0.809 0.798 0.816
No 3: Side of Jiangjiazhou Village Road
0.869 0.860 0.878 0.856
5.7 Investigation of Existing Eco-environment 5.7.1 Evaluation Range of Eco-environment In accordance with the characteristics of the planned works and local eco-environmental status and social-economic features, in line with the basic principle of ecology, with full

5.0 Environment Baseline Survey & Assessment
153
consideration to interactive relationship and inter-impact among each factor in the ecological system, the range of eco-environmental evaluation for this works goes as follows: �Project Planning Inundation In terms of engineering planning, engineering inundation starts from about 38 km upper stream of Kan River (calculated from Shihutang), at the normal water level of 56.5m, inundation will cover the protection embankment and 3.0km surroundings, or, to be exact, to cover such 6 townships as Yanxi Town, Chengjiang Town, Wanhe Town, Mashi Town, Tangzhou Town and Guanxi Town. � Acquisition of Land for Engineering Construction Such land covers the dam site, including protection embankment, borrow pits, sand pits, gravel deposit, rock block pits, spoil sites, construction sites and passageways, etc. � Downstream of Dam Site It refers mainly to the 33-km-long channel in downstream channel of Kan River down the dam site. � Camphor Protection Zone in Zhujia Township, Tangzhou Town 5.7.2 Analytical Procedure of Eco-environment 5.7.2.1 Collection of Basic Information Available Such information collection covers project feasibility data, engineering drawings, 1:50000 topographic maps, Land Sat7—TM images, background data of bio-diversity, county annals, county statistic yearbooks, and master plan of land utilization, etc. 5.7.2.2 Inventory Survey � Plant & Vegetation � Key places together with their geographical coordinates will be under record in line with design schemes and remote sensing image. � Along the river there will be surveys made to make record of all plants in sight, with focus on typical biotic community. Quadrate for arbor community will cover 20×20m2, for shrub community 5×5m2�for herbaceous 2×2m2. Record shall cover all types of living beings and analysis shall be made of gregariousness, in addition to sampling elevation, with coordinate under record from GPSmap76. � On the basis of remote sensing mapping concerning land utilization within the evaluation region, verification shall be made upon site set point. �Terrestrial Animal Resources

5.0 Environment Baseline Survey & Assessment
154
Abundance of all animals will be measured by estimated rank method. Rank method: usually “+++” means there are numerous animals which are locally dominant species; “++” means there are considerably large population which are locally common species; “+” means the population is very limited (locally rare species). See Table 5.7�1. Table 5.7�1 Estimated Rank Method
Species Status Signal Estimated quantity Locally dominant ��� Numerous Locally common �� Considerably large Locally rare � Rare
� Aquatic Organism Plankton survey: sampling shall be made at different positions and different depths, by No. 25 plankton net to obtain a sample of 1000 ml (1/2 transparent). After filter in the net the sampling shall be moved into the glass, to add formalin for settlement. After 24 hours of deposit, the sampling will be under concentration by siphon to 30 ml. Plankton sampling shall be under identification by types, for quantitative and qualitative analysis. Fish stocks survey: � One motor survey boat and one small wooden boat are equipped for collecting fish spawns, 80cm large spawn net will be equipped on the motor boat for collecting spawns. �fish catch will be purchased directly from the fishing boats or from the market for identification, for routine bio-measurement and under analysis from biological thermatology. 5.7.2.3 Ecosystem Mapping �Satellite image�By LandSat 7-TM with a precision of 30m. See Attached Drawing No. 27. � Mapping of land utilization�by remote sensing image and 1�50000 topographic map�with reference to land utilization planning map by territorial resource department. Classification and statistics shall be made by ArcGIS. �Vegetation type map� Classification shall be made by Erdas Imagine 8.6 concerning remote sensing images, with help from site surveying for accuracy test. � Landscape variation map�In line with engineering scheme, with consideration of land utilization and inundation after storage, such a map can be drawn with help from ArcGIS, with focus upon reflection of change in land utilization. � Scatter diagram of rare animals/plants, animals/plants under protection, fish spawning sites: by way of coordinates these will be marked on remote sensing images.

5.0 Environment Baseline Survey & Assessment
155
5.7.3 Inventory Survey & Evaluation of Plant Resources 5.7.3.1 Flora On the basis of site surveying of flora in Shihutang and of systematic collection of flora data, it is known that vascular plants total 126 families, 296 genera and 392 species, of which ferns total 13 families, 15 genera and 17 species; gymnosperm aggregates 5 families, 8 genera and 9 species, while angiosperms amount to 108 families, 273 genera and 366 species. See Table 5.7�2 for detail. Table 5.7�2 Statistics of Vascular Plants in Shihutang
Ferns Gymnosperm Angiosperms Total Family Genera species Family Genera species Family Genera species Family Genera species
Site 13 15 17 5 8 9 108 273 366 126 296 392 Jiangxi 49 114 432 8 23 30 220 1309 4500 277 1446 5152 State 65 204 2600 11 34 193 291 2946 24357 353 3184 27150 % of Jiangxi
26.5% 11.2% 3.9% 62.5% 34.8% 30% 49.1% 20.9% 8.1% 45.5% 20.5% 7.6%
% of state
20% 3.4% 0.7% 45.5% 23.5% 4.7% 37.1% 9.3% 1.5% 35.7% 9.3% 1.4%
5.7.3.2 Geographic Range of Spermatophyte According to Wu Zhengyi (1991) concerning geographic range of spermatophyte in China, spermatophyte in Shihutang Project district is classified into 14 ranges and 10 derivatives. See Table 5.7�3 for detail.

5.0 Environment Baseline Survey & Assessment
156
Table 5.7�3 Statistics of Geographic Range of Spermatophyte in Shihutang
Range Type Genera
% in all State Genera
% in state
tropical/extra-tropical*
I. World range 51 104 49.04 II. Pan-tropical distribution & derivatives
65 28.26
2. Pan-tropical distribution 61 26.52 316 19.30 2-1 Tropical Asia, Oceania, and South America (Disjunctive)
3 1.30 17 17.65
2-2 Tropical Asia, Africa, and South America (Disjunctive)
1 0.43 29 3.45
III. 3 Tropical Asia and tropical America (Disjunctive)
4 1.74 62 6.45
IV. Old world tropical distribution & derivatives
13 5.65
4. Old world tropical distribution 12 5.22 147 8.16 4-1. Of disjunctive distribution in tropical Asia, Africa & South America
1 0.43 30 3.33
V. 5. Distribution in Asia to tropical Oceania
8 3.48 147 5.44
VI. 6. Distribution in tropical Asia and tropical Africa
6 2.61 149 4.03
VII. Distribution in tropical Asia and derivatives
16 6.97
VII. Distribution in tropical Asia 13 5.65 422 3.08 7-1 Java, Himalayan, South China & Southwest China
2 0.87 30 6.67
7-2. Burma, Thailand to Southwest China
1 0.43 29 3.45
The percentage indicates percentage of the genera of tropical geographical distribution in total genera.

5.0 Environment Baseline Survey & Assessment
157
Table 5.7�3 (Continued) Statistics of Geographic Range of Spermatophyte in Shihutang
Range Type Genera
% in all State Genera
% in state
tropical/extra-tropical*
VIII. North temperate zone distribution & derivatives
54 23.48
8. North temperate zone 43 18.70 213 20.19 8-4. Of disjunctive distribution Of disjunctive distribution in north/south temperate zone
10 4.35 57 17.54
8-5. Of disjunctive distribution in Europe, Asia and South America
1 0.43 5 20.00
IX. 9. Of disjunctive distribution in East Asia & North America
13 5.65 123 10.57
X. Distribution in Old World temperate zone & derivates
14 6.09
10. Distribution in Old World temperate zone
11 4.78 114 9.65
10-1. Of disjunctive distribution in Mediterranean, west Asia & northeast Asia
3 1.30 25 12.00
XI. 1 Distribution in Asia temperate zone
3 1.30 55 5.45
XII. 12. Distribution in Mediterranean, west Asia & central Asia
1 0.43 152 0.66
XIII. 13. Distribution in central Asia
— — 69 —
XIV. Distribution in East Asia & derivatives
29 12.61
14. Distribution in East Asia 18 7.83 73 24.66 14-1. China- Himalaya (SH) 3 1.30 141 2.13 14-2. Sino-Japan (SJ) 8 3.48 85 9.41
The percentage indicates percentage of the genera of moderate geographical distribution in total genera.
XV.15. Peculiar species in China 4 1.74 257 1.56 Total 281 100.00 — ——
*Excluding world distribution genera. � Of dispersed genus there are 51 genera that are distributed almost over the world, mostly of hydrophyte and helophyte, including Potamogeton, Naias, Lemna, Spirodela, Wolffia, Juncus, Carex, Cyperus, Eleocharis, Ammannia, Jussiaea, , Myriophyllum, Callitrche, Polygonum, Ceratophyllum, Lepidium, and Cardamine, etc. There are numerous auxiliary species and surface weeds, including Rorippa Scop, Viola, Polygala, Stellaria, Phytolacca, Chenopodium, Amaranthus, Geranium, Oxalis, Rubus, Erigeron, Gnaphalium, Senecio, Xanthium and Lysimachia, etc. � Of pan-tropical distribution there are 65 genera (including related derivatives)�making up 28.26% of total genera in Shihutang Project district, as the largest genus in the region. To this

5.0 Environment Baseline Survey & Assessment
158
genus belong such genera as Celosia, Buxus, Cuscuta, Verbena, Vitex, Smilax, Dioscorea, Bothriochloa, Cynodon, Paspalum, Setaria and Imperata, etc, most of which are herbaceous plants. There are two derivatives in the region�� three genera are of disjunctive distribution in tropical Asia, Oceania and South America, including Podocarpus, Centipeda and Wahlenbergia�� one genus is of disjunctive distribution in tropical Asia, Oceania and South America, Bambusa. � Four genera (1.74% of local genera) are of disjunctive distribution in tropical Asia and tropical South America, including Mirabilis, Eurya, Sapindus and Soliva. � Of old world tropical distribution there are 13 genera (including related derivatives)�making up 5.65% of total genera in Shihutang Project district, including Stephania, Syzygium, Osbeckia, Grewia, Mallotus, Albizia, Loranthus, Viscum, Cayratia and Melia, etc, mostly of shrub and liane. There is one derivative of disjunctive distribution in tropical Asia, Africa and South America, Rostellularia. � Of distribution in tropical Asia and tropical Oceania there are 8 genera�making up 3.48% of total genera in Shihutang Project district, including Cinnamomum, Trichosanthes, Melastoma, Mazus, Hydrilla, Eremochloa, Lophatherum, and Zoysia. Camphor is the dominant species. � Of distribution in tropical Asia and tropical Africa there are 6 genera�making up 2.61% of total in Shihutang Project district, including Arthraxon, Themeda, Ricinus, Hedera, Cymbopogon and Miscanthus. � Of distribution in tropical Asia there are 16 genera�making up 6.79% of total genera in Shihutang Project district, including Broussonetia, Ixeris, Michelia, Lindera, Cyclea, Diploclisia, Menispermum, Pericampylus, Camellia, Duchesnea, Pueraria, Paederia and Indocalamus. Here there are derivatives��two genera are distributed in Java, Himalayan, south China and West China, including Schima and Bischfia��one genus: Actinostemma is distributed only in Burma, Thailand�and Southwest China. � Of distribution in the north temperate zone there are 54 genera, making up 23.48% of total genera in Shihutang Project district (the second richest genus), including Pinus, Cupressus, Sabina, Capsella, Populus, Salix, Quercus, Ulmus, Morus, Agrimonia, Rhus, Lonicera, Artemisia, Sonchum, Lithospermum, Scrophularia, Prunella, Bromus, Echinochloa and Eragrostis, etc. Here there are relative derivatives��there are ten genera of disjunctive distribution in north and south temperate zone, 4.35% in total, including Sedum, Arenaria, Cerastium,

5.0 Environment Baseline Survey & Assessment
159
Melandrium, Kochia, Vicia, Vaccinium, Rubia, Veronica, and Sagittaria, etc. � There is only one genus of disjunctive distribution in temperate zones in Europe, Asia and South America, that is Alopecurus. � 13 genera are distributed in east Asia and North America, 5.65% in total, including Antenoron, Photinia, Gleditsia, Lespdeza, Wisteria, Liquidambar, Castanopsis, Parthenocissus, Trachelospermum, Aletris, and Brachyelytrum. Such a distribution indicates the genetic relationship between East Asia and North America in geologic history and modern distribution origin. � 14 genera are distributed in old world temperate zones, 6.09% in total, including Cucubalus, Dianthus, Myosoton, Daphne, Pyrus, Oenanthe, Dendranthema, Adenophora, Leonurus, Cleistogenes, and Roegneria. There is only one derivative of three genera of disjunctive distribution in Mediterranean Sea, west Asia and east Asia, including Paliurus, Torilis and Ligustrum. � There are 3 genera of distribution in Asian temperate zones, making up 1.30% of total genera in Shihutang Project district, which are Caragana, Kalimeris and Trigonotis. � There is only one genus of disjunctive distribution in Mediterranean Sea, west Asia and middle Asia--Coriandrum, 0.43% in total. � 29 genera and derivatives are distributed in east Asia, 12.61% in total, including Vernicia, Eriobotrya, Rhaphiolepis, Acanthopanax, Damnacanthus, Patrinia, Hemistepta, Rhynchospermum, Youngia, Caryopteris, Perilla, Ophipogon, Tricyrtis, Lycoris, Phyllostachys, and Pogonatherum. There are two derivatives here. � Three genera of China--Himalayan distribution (1.3% of total)�including Corchoropsis, Firmiana, and Choerospondias� � There are eight genera of Sino-Japan distribution, including Semiaquilegia, Kummerowia, Sageretia, Euscaphis, Serissa, Paulownia, and Phaenosperma. Some of them are relic genus, such as Houttuynia, Loropetalum and Pterocarya. � There are four peculiar species in China, making up 1.74% in total, which are Cunninghamia, Metasequoia, Ginkgo and Poncirus, all of which are culture species. Located in central semitropics, Shihutang Project district, mainly of plain, is rich in hydrothermal condition. Here there are 114 genera of tropical geographical components, the majority of which is not limited to distribution in tropical areas, instead some of the species extend northward to semitropical or even to temperate zones. on the whole, temperate zone geographical components make up the majority, with the tropical geographical components represented mainly in form of shrub, herbal plant, hydrophyte and helophyte. Most of the percentage between tropical geographical components and temperate zone geographical components reaches 0.098. In a word, plants here are mainly of temperate zone geographical

5.0 Environment Baseline Survey & Assessment
160
components, though plants of tropical geographical components make up a considerable percentage. 5.7.3.3 Plant resource Wild plant resources in Shihutang Project district may be classified into 13 types. See Table 5.7�4. Table 5.7�4 Classification of Wild Plants in Shihutang
Types Survey Main Resources
Old Trees Several hundreds of old trees over 100 years old near Yuanjiang Township
camphor, sweet oak, Quercus serrata, spice bush, sweetgum, yellow sandalwood, Schima superba, Xylosma racemosum , Photinia serrulata, privet, gingkgo, cypress tree, Podocarpus macrophyllus
Timbre Plant
Over 60 types of arbor available as timbre along the bank behind Yanjiang Village
Gingkgo, fir, Chinese red pine, slash pine, cypress tree, sweetgum, camphor, Elaeocarpus, eucalyptus, bishopwood, kingwood, sweet oak, Choerospondias axillaris
Officinal
More than 117 types of herbageous plants in the woods, shrub, reclamation land
Japanese fern spore, Drynaria fortunei, gingkgo, Clematis chinensis, Menispermaceae, cordate houttuynia herba, giant knotweed, chemoplodium ambrosioides, Celosia argentea, lilac daphne, St.Johns wort, Ardisia japonica, cat’s foot, cogongrass, Asiatic plantain
Nectariferous Plant
Over 50 types of plants available as nectariferous plant
Canola plant, Eurya japonica, Schima superba, Sapium sebiferum, Castanea mollissima, Chinese milk vetch, honeysuckle, privet, motherwort

5.0 Environment Baseline Survey & Assessment
161
Table 5.7�4 (Continued) Classification of Wild Plants in Shihutang Types Survey Main Resources
Plants for embankment
Flood-control and sand binding plant flora has developed out of all types of arbor, shrub and greenery.
Willow, Sapium sebiferum, wire grass, zoysia, Japanese silvergrass, Chinese ash, fernleaf hedge bamboo
Wild forage feed
Herbaceous plant out of Gramineae and leguminosae has developed into large grove of grass shoal and beach.
Wire grass, Dallis grass, Japanese silvergrass, zoysia, annual bluegrass, vervain, common lespedeza, bush clover, azolla, Malan Straw
Food
There are groves of Quercus glanca, Quercus serrata, Castanea mollissima, jujube and wild persimmon.
Sweet oak, Quercus serrata, chestnut, persimmon, kudzu vine, Chinese date
Coumarin plant
Some plants contain sweet monosodium glutamate, available for extraction of Sweetening agent.
Actinostemma racemosum, perilla, cogongrass
Glechma hederacea
Some plants are rich in aromatic substance, available for extraction of essential oil for industry and daily life.
camphor, sweetgum, matico, pomelo, cypress, wild chrysanthemum, Chinese fevervine, Atractylodes macrocephaia, Cyperus rotundus, Kyllinga brevifolia, citronella�eucalyptus
Resin plant
There are, along the slopes and foothills, groves of redpine, slash pine and sweetgum, available for extraction of resin.
Chinese red pine, slash pine, Sapium sebiferum, sweet gum, bishopwood
Tannin plant There are more than 10 types of plants rich in tan in the slopes and foothills.
Rumex madaio, yellow dock, cherokee rose, sanguisorba, silk tree, sweet gum, Quercus sclerophylla, sweet oak and wild Diospyros kaki
National-level protection species
In line with the China’s Rare Species under Protection by the State Environmental Protection Bureau and by Plant Research Institute of Chinese Academy of Science in 2002.
Metasequoia *(1), gingkgo *(2), kapor *(2)
Provincial -level protection species
In accordance with the lists in Document No [2005] 213 issued from Jiangxi Provincial Ministry of Forestry on Aug 31, 2005.
Podocarpus macrophylla (2), sweet osmanthus (2), camellia (2), Pistacia sinensis (2), horned holly (3), Ilex rotunda(3), Quercus sclerophylla,(3), gentianella (3), yellow sandalwood (3), soap nut tree (3), radix asparagi (3)
*Of culture plant

5.0 Environment Baseline Survey & Assessment
162
� Wild plants in Shihutang are of such features as variety in types, limit in quantity, shortage of resources superiority or exploitability or peculiar species. Of plant resources, only the old trees serve as natural and cultural relic for seed and tourism; pines (Pinus spp) as source of resin, meadow as feed to cattle and as firewood to local residents. � In Shihutang Project district there is no wild plant or famous wood species under state protection. Trees cultivated include yellow cinnamon, metasequoia and gingkgo, in addition to wingceltis (second class protection) and Chinese cress (second class protection) (The latter two are only recorded in files, undiscovered in this investigation) . � There are 11 genera of provincial protective plants, including podocarpus macrophyllus, sweet osmanthus, camellia, rhizoma coptidis, Chinese holly, Ilex rotunda, bishopwood, gentianella, kingwood, soap nut tree, radix asparagi, etc. These species exist mainly in the herb layer of shrub and in broad leaved forest adjacent to villages. � There are numerous old trees scattered along Kan River, including Cinnamomum camphora, Schima superba, Castanopsis sclerophylla, Cupressus funebris, Photinia davidsoniae, Ligustrun lucidum, Xylosma japonicum, and Laurus nobilis. Among them the first two makes up the majority, to form tree mass in some unique areas. 5.7.3.4 Vegetation Distribution Shihutang Project district is mainly of plains and low hillock plain. There are dense villages that have been producing violent activities upon nature so that there is no native vegetation whatsoever. Instead, secondary plant and artificial vegetation makes up the majority. Density of cover from natural vegetation reaches 56%. For detail see Attached Drawing 04. � Cover Type In accordance with the classification in Chinese Vegetation, on the basis of field investigation, the cover type in Shihutang Project district is classified into 9 types and 35 plant formations. See Attached Drawing 03. � Type Properties of Major Plant Community & Distribution �Evergreen broad-leaved forest The evergreen broad-leaved forest is of zonal vegetation in central Asian moderate zone. But due to human activities there are few groves adjacent to villages. These forests, protected in the name of geomantic trees, are small-scaled in areas, discontinuous in distribution, incomplete in plant community, simple in species, poor in replacement. Such communities are mainly of: 1) Form Cinnamomum camphora This species is distributed in dozens of villages along Kan River, with the largest grove discovered in Lingbei, Xiayinxia and Xinzhou of Yanxi Town, in Shihutang, Xiabian and

5.0 Environment Baseline Survey & Assessment
163
Zhangjia of Wanhe Town. For detail see the thematic assessment of impact from old trees in Chapter Seven of this report. 2) Form Schima superba This species is distributed in Tongluo Township of Yanxi Town, or, to be exact, in E115°00´34.01"�N26°53´11.40"�at EL 63m. Here there are also such trees as sawtooth oak, soap pod, and Xylosma, with no undergrowth or herb layer. 3) Form Castanopsis sclerophylla This species is distributed in Shangyinxia Village, or E115°00´27.5"�N26°53´47.6", mainly of Castanopsis sclerophylla, 26 inside the site, in addition to 14 camphor and 8 Photinia serrulata outside the sampling site. There is rare species of undergrowth, except for wild jasmine, capejasmine. Of herb layer there is only limited sedge (sp). � Evergreen Broad-leaved Deciduous Forest This is also under artificial protection, small in area, simple in structure, discovered only in several villages as Caoping and Cangling, in such forms as follows: 4) Form Cinnamomum camphora- Quercus chenii � Broad-leaved Deciduous Forest There are two types of broad-leaved deciduous forests, one is under artificial protection, mainly of Quercus chenii of Fagaceae, another mainly of bank vegetation distributed along the embankment of Kan River. 5�Form Quercus chenii This species is discovered in such villages as Cangling, Zhangjiapeng and Zengjiapeng, small in community, with Quercus chenii as majority, whose diameter is about 50cm at a height of 15m. 6�Form Salix matsudana This species is distributed in alluvial flat and alluvial shoal, with sampling site at Xinluo Shoal, where the soil is of sandy loam, at E114°57´35.3", N26°47´25.8". The community is mainly of hankow willow, where shade density reaches 60%, with the trees averaging 10m in height. The companion species include Chinese tallow tree and bead tree, with rare undergrowth, except for barbas. Coverage of herb layer averages 90%, with wheatgrass as dominant species, whose companion species consist of water buckwheat, Mazus rugosus, Cardamine, lesser swine-cress, and yellow dock. 7�Form Sapium sebiferum This species is distributed in Jintan Township, a part of nature reserve, adjacent to old camphor grove. The community is made up of Chinese tallow trees, where shade density reaches 80%, with the trees averaging 9--11m in height. This community also includes such
5.0 Environment Baseline Survey & Assessment
164
evergreen trees as camphor, Schima superba, and spice bush and such deciduous tree as bead tree, sweet gum and elm. � Coniferous forest Coniferous forest is the generic terms for communities mainly of needle evergreen. The conifers here enjoy warm and moist environment, typical of temperate zone coniferous forest, distributed all over the hillock plains. There are two plant formations: Form Pinus massoniana and artificial Form Pinus elliottii. 8�Form Pinus massoniana Redpine community is orderly in outlook, but spare in distribution and poor in growth, with a diameter of 5—15cm at a height of 5—9 m. The community is almost all of redpine, with rare sweet gum, albizzia kaldora and camphor, in a density cover of 60% to 80 %. The undergrowth varies due to artificial interference, so that the undergrowth is rarer when interference is more serious. Interference originates mainly from residents’ acquisition of firewood. Coverage from undergrowth reaches 20% to 50%, usually at 1m in height, mainly of Glochidion pubetum, Chinese loropetalum, barbas, rhododendron, Japanese eurya, hairy holly root, capejasmine, oriental blueberry, etc. There are limited renewal broadleaf seedlings, including mainly of kapor and needle wood. The coverage of herb layer is considerable, averaging 60-85%, with such dominant species as sedge and loosestrife, etc. Under incomplete canopy there usually are such fern species as Polytrichales, hypnum moss, etc. There is not much extra-zonal vegetation, except for chinaroot greenbrier, rhizoma smilacis glabrae, and Japanese fern spore. Living soil covering consists of Polytrichales and foliaceous lichen; there is limited ground cover, poor in decomposition. Semi-zonality results from frequent artificial activities. 9�Form. Pinus elliottii This community is artificial, out of aerial seeding. Slash pine grows better than redpine, thicker in diameter. In such community usually there is redpine, and occasionally sweet gum. There is limited undergrowth, including barbas, capejasmine and Japanese eurya. The herb layer is adjacent to Form Pinus massoniana. � Bamboo Grove Bamboo is of quality commercial timbre species�and also of ornamental plantation. There are four species of bamboo, of which Phyllostachys edulis and Phyllostachys sulphurea var. viridis make up the majority. They are small-scaled in areas, with the Phyllostachys edulis distributed on village slopes under artificial plantation, and Phyllostachys sulphurea var. viridis in zonal distribution along the second bottom. 10�Form Phyllostachys edulis 11�Form Phyllostachys sulphurea var. viridis � Shrub & Underbrush
5.0 Environment Baseline Survey & Assessment
165
This species is usually located in the hillock plains and the second bottom and second terrace. Development of this species is closely related with frequent artificial interference and timber mining. In the community there is rarely-scattered redpine seedling, therefore the community is unstable in structure, indefinite in layers, uneven in plant species, changeable in dominant species. Companion species usually consist of ferns. Common communities are as follows: 12�Form Paliurus ramosissimus, usually distributed in the alluvial flat or alluvial shoal. 13�Form. Vitex negundo var. cannabifolia 14�Form. Miscanthus floridulus 15�Form. Arundinella setosa 16�Form. Pteridium aquilinum var. latiusculum � Meadow This is usually seen in the low wet alluvial flat in flood season, in zonal distribution, pure in composition, uniform in color, flat and even in physiognomy, dense in coverage (90%). Here the soil is of sand soil, water-rich and sound in air permeability, with little humus accumulation. Meadow is usually for feeding of cattle. Common communities include Cynodon dactylon Ass. and Eremochloa ophiuroides Ass., and there are such communities in water-rich areas as Paspalum distichum Ass., and Beckmannia syzigachne Ass, with a height less than 20cm. Common companion species include needle spikesedge, Kyllinga brevifolia, moneywort, Chinese violet herba violae, water pepper and yellow dockyellow dock. 17�Cynodon dactylon Ass. 18�Eremochloa ophiuroides Ass. 19�Conyza canadensis Ass. 20�Paspalum distichum Ass. 21�Beckmannia syzigachne Ass. � Aquatic Vegetation There is rich aquatic vegetation, usually distributed in the mini-ponds along Kan River, in the shoal where river flows slowly, in the gulches and in some of the alluvial flats and alluvial shoals. No aquatic vascular plant has ever been discovered in this survey. There are varieties of aquatic vegetation, but generally small-scaled in distribution and variable in coverage, mainly including:

5.0 Environment Baseline Survey & Assessment
166
22�Azolla imbricata Ass. 23�Form Jussiaea repens Ass. 24�Form Callitriche stagnalis Ass. 25�Form Scirpus juncoides Ass. 26�Form Polygonum thunbergii Ass. 27�Form Eichhornia crassipes Ass. 28�Form Limnanthemum nymphoides Ass. 29) Form Spirodeia polyrhiza Ass. � Artificial community Owing to large numbers of residential areas, long-time human activities and developed agricultural utilization, artificial communities are large in areas, to play a dominant role. Artificial community is divided into such types as follows, of which Form Populus lasiocarpa is mainly of sapling due to returning of farming land to forestry, located along the terrace of Kan River, with the largest grove in Wanhe Town: 30) Farm field 31) Tea garden 32) Form. Camellia oleifera 33) Orange garden 34) Garden 35) Form Populus lasiocarpa Such vegetation is of special features in horizontal distribution, namely, distributed along Kan River in alluvial flats is meadow; in alluvial shoals are hankow willow and Form Paliurus ramosissimus; in second terrace are garden and Form Populus lasiocarpa due to returning of farming land to forestry; in hillock plains are coniferous forest and underbrush; in villages along Kan River are broad-leaved forest serving as geomantic trees; in the plain is artificial vegetation; in the mini-ponds and gulches is aquatic vegetation. 5.7.3.5 Overall Evaluation of Vegetation in Shihutang There are 9 vegetation forms and 35 plant formations. On the whole, vegetation is simple in structure, monotonous in composition, mostly of secondary succession. Under frequent artificial interference the Form Pinus massoniana and underbrush has transformed into semi-zonal vegetation of disturbance climax. As a result, such vegetation is featured by poor productivity, low bio-diversity and ill renewal. But it is not difficult to trace back the original outlook from the small evergreen broad-leaved forest relict adjacent to villages. Evergreen broad-leaved forest and evergreen broad-leaved deciduous forest had once been the dominant vegetation in this area. Of vegetation in the future, human activities can not be ignored. Under existing economic and social conditions, it is difficult to achieve natural orthodromic succession. Residents’ living manners and resource utilization manners have to be changed until natural succession is possible. Construction of the Shihutang Project is a desirable approach.

5.0 Environment Baseline Survey & Assessment
167
5.7.4 Profile of Agriculture & Forestry & Land Utilization 5.7.4.1 Agricultural land and industrial structure Shihutang Project will involve 6 townships in Taihe County. For detail of agriculture see Table 5.7�5�for percentage of agriculture, forestry, animal husbandry, fisheries see Table 5.7�6�for detail of crop production in 2005 see Table 5.7�7. The townships here depend upon agriculture and husbandry so that agriculture plays the major role in crop farming, which lives upon grain and oil crops. Grain consists mainly of rice, complimented from sweet potatoes and soybean. To cash crops belong canola plant, peanut, Sesamum indicum, potato, sugarcane, watermelon, semen plantaginis, tea, and oranges, etc. Husbandries play the second role, composed mainly of pigs and cattle, with limited poultry, cow and sheep. Fisheries and forestry make up little contribution. Aquatic culture is mainly in form of reservoir and pond fish-farming, complimented from fishing in Kan River. Income from forestry comes mainly from nursery stock. Table 5.7�5 Fundamental State of Agriculture
Agricultural acreage (hm2)
Township
Population
Rural Gross land (Hectare)
Total Paddy fields
Dry land
Total forestry
Acreage per capita (mu/person)
Yanxi 20428 19305 9503.6 2378 1655 723 3398.2 1.848 Chengjiang 90207 25786 12714 2127 1955 172 4189.6 1.124 Wanhe 46577 44072 16720.7 4790 4315 475 5136.9 1.615 Mashi 36245 34062 13670.5 4007 3451 556 3763.2 1.851 Tangzhou
31977 29531 12923.1 3345 2482 863 3494.4 1.61
Guanxi 24638 24794 16880.7 3478 3220 258 9067.9 1.824
Total 250072
177550
82412.6 20125 17078 3047 29050.2
Based upon Taihe County Statistics Yearbook of 2005 Table 5.7�6 Percentage of Agriculture, Forestry, Animal Husbandry & Fisheries Unit�104
Yuan Crop farming Forestry Husbandry Fisheries Others
Year GDP Output
% Output % Output % Output % Yield %
2003 163903
76851 46.89 5677 3.46 64272 39.21
15278 9.32 1825 1.11
2004 200514
101053
50.4 10157 5.07 67201 33.51
19193 9.57 2910 1.45
2005 211098
103317
48.94 10751 5.09 71189 33.72
22534 10.7 3307 1.57
Based upon Taihe County Statistics Yearbook of 2005

5.0 Environment Baseline Survey & Assessment
168
5.7.4.2 Present Land Utilization By interpretation of remote sensing images, based on county statistic yearbook and county-level overall land use planning, in accordance with dam site actual conditions, land use is divided into woodland, underbrush, meadow, paddy fields, dry land, water body, land for urban and rural buildings, and unused land. Such land is under analysis from ArcGIS software. See Table 5.7-8 and Chart 5.7-1 and Attached Drawing 28 for detail. Land use statistics is listed in Table 5.7-9.

5.0 Environment Baseline Survey & Assessment
169
Table 5.7�7 Crop production of Taihe County and Affected Townships in 2005
Population
County/ Township
Agricultural acreage (mu) Gross Rural
Acreage per capita (rural) (mu)
Multiple- cropping index
Percentage of grain crops
Gross grain output
Yield per mu
Yield per capita
% of cash crops
Taihe County
660210 515655 418412 1.58
Wanhe 71850 46577 44072 1.63 2.83 64.9 35748 268 811 35.1 Yanxi 35670 20428 19305 1.85 2.49 59.8 17567 331 910 40.2 Tangzhou 50175 31977 29531 1.70 2.72 65.4 28932 324 980 34.6 Chengjiang 31905 90207 25786 1.24 2.93 58.4 18246 328 708 41.6 Mashi 60105 36245 32413 1.85 2.61 67.9 36396 339 1123 32.1 Sum 249705 225434 151107 1.65 2.72 64.1 136889 312 906 35.9
Table 5.7�8 Present Land Use in Shihutang Unit�hm2 Administrative region
Gross land Farmland Garden Forestry Urban building land
Rural building land
Industrial land
Water body
Taihe County 268068.7 66519.1 14038.1 161837.8 2049.7 11021.5 1970.4 10632.1 Yanxi 9503.6 3908 602.3 2986.2 52.1 957 75.5 922.5 Chengjiang 12714 4235.4 536.8 5086.6 1105.3 476.8 488.7 758.4 Wanhe 16720.7 7941.9 688.5 5535.7 75.8 893.6 58.5 636.2 Mashi 13670.5 5882 909 4457.4 78.8 1189.7 0 1153.6 Tangzhou 12923.1 4567.1 250 5164.2 278 630 100 1933.8 Guanxi 16880.7 4230 2391.5 9067.9 0 723 34 434.3 Sum 82412.6 30764.4 5378.1 32298 1590 4870.1 756.7 5838.8 % 37.33 6.53 39.19 1.93 5.91 0.92 7.08 Based upon the data from Overall Planning of Land Use (1997-2010) from Taihe County Land & Resources Bureau

5.0 Environment Baseline Survey & Assessment
170
Table 5.7�9 Land Use in Shihutang Project Area
Land Type Numbers Average Total �km2�
Forestry 326 0.99 323.88
Shrub & underbush 42 2.60 109.35
Water body 37 1.19 43.93 Land for rural & urban residents
57 0.17 9.83
Paddy fields 87 2.10 182.69
Dry land 118 1.25 146.95
Unused land 27 2.91 78.54
Land use is of such features: each township depends on farmland and forestry, usually the farmland makes up 37.33% and forestry 39.19%�Water body contributes in limited percentage, mainly composed of Kan River basin; there are some hillock plains and alluvial flats along the Kan River, under reclamation for gardens for plantation of vegetables. Forestry totals 323.88 km2, or 36.18% of gross eco-system in Shihutang�as the major type in this region. Water body totals 65.66 km2�or 4.91� of gross area in Shihutang. Farmland (including paddy fields and dry land) aggregate 329.64 km2�36.83� of local gross land. 5.7.5 Inventory Survey & Evaluation of Terrestrial Animals 5.7.5.1 Species, quantity & Status of Amphibians
Dwg. No 5.7 1� Land use situation proportion drawing of the project area
)DUPODQG
*DUGHQ�SORW
:RRGODQG
)DUPODQG
*DUGHQ�
:RRGODQG
/DQG�IRU�FLW\�FRQVW�
/DQG�IRU�YLOODJH�FRQVW�
,QGXVWULDO�ODQG
:DWHU�DUHD

5.0 Environment Baseline Survey & Assessment
171
On the basis of survey and record in reference, analysis is made to conclude that: � Species�there are 9 species of amphibians (See Table 5.7�10)�classified into 4 families, of which Ranidae makes up the majority (Altogether 5 species, 62.5% of gross amphibians). � Eco-behavior & Distribution of Major Species Bufo gargarizana: nicknamed “toad”, mainly inhabit in dark and moist wood underbrush, farmland, gulches and villages. This species is widely distributed in inundated area. Ranani gromaculata: they swallow a lot of insect pest in the wood and therefore serve as prey to flesh-eaters, so directly or indirectly to supply largest quantity of meat to flesh-eaters. Rana limnocharis: in breeding seasons they place spawning in static water; they float in water, large in size, to serve as food or bio-tests and play a significant role in ecological balance. Based upon the investigation it can be concluded that the community of amphibians in Shihutang Project district is very limited. Table 5.7�10 Directory of Amphibians in Shihutang Project district
Name Species Living Environment Flora Protection level
I. Anura
(i) Bufonidae
1. Bufo gargarizana
Riverside and ridge of fields, house surroundings, or under the rock or soil caves
Dispersed species
Province -level
2. Hylaanchiangesis
Widely inhabit in marshy ground, jungle, pond or wetland
Oriental species
3. Rana guentheri
Inhabiting in paddy fields, ponds or water holes; often hiding in aquatic plants or weedery
Oriental species
4. Rana limnocharis
Paddy fields, wetland and vegetable garden
Oriental species
Province -level
5. Rana adenopleura
Pond, water hole, gulch and weedery
Oriental species
Ranidae
6. Ranani gromaculata
Pond, paddy fields, gulch, lakes, streams and wetland
Dispersed species
Province -level
(III) Microhylidae
7. Microhyla ornata
paddy field, water holes, soil caves close to gulches or weedery.
Oriental species
Province --level
(VI) Rhacophoridae
8. Rhacophorus megacephalus
Inhabiting in paddy fields, weedery or muddy holes, or in ridge of field or adjacent to shrub or weedery or surface fallen leaves
Oriental species
5.7.5.2 Species, Quantity & Distribution of Reptiles

5.0 Environment Baseline Survey & Assessment
172
On the basis of survey and record in reference, analysis is made to conclude that there are 3 orders, 5 families and 9 genera of reptiles (See Table 5.7�11)�none of which is under state protection. Ophidia black snake, of colubrid, is widely distributed, as the major cash snakes, which feeds mainly on frogs, in addition to fish and lizard. Most often this species inhabits underneath the shrub or underbrush or in the farmland. 5.7.5.3 Species, Quantity & Distribution of Avifauna On the basis of survey and record in reference, analysis is made to conclude that: � species composition�There are 26 species of birds, divided into 8 orders and 17 families (See Table 04), of which Passeriformes makes up the majority, with 9 species, or 34.62% of all birds. There is no bird under state protection. �Avifauna�of the 26 species, there are 9 classified as oriental species, or 34.62% of all�7 as Palearctic realm, or 26.92% in total; 10 as dispersed species, 38.46% in all. � Non- migratory bird�of the mentioned 26 species of birds, non- migratory birds total 14 species, or 53.85% of all; summer migrant aggregates 7 species , 26.92% of all�winter residents total 5 species, 19.23% of all.
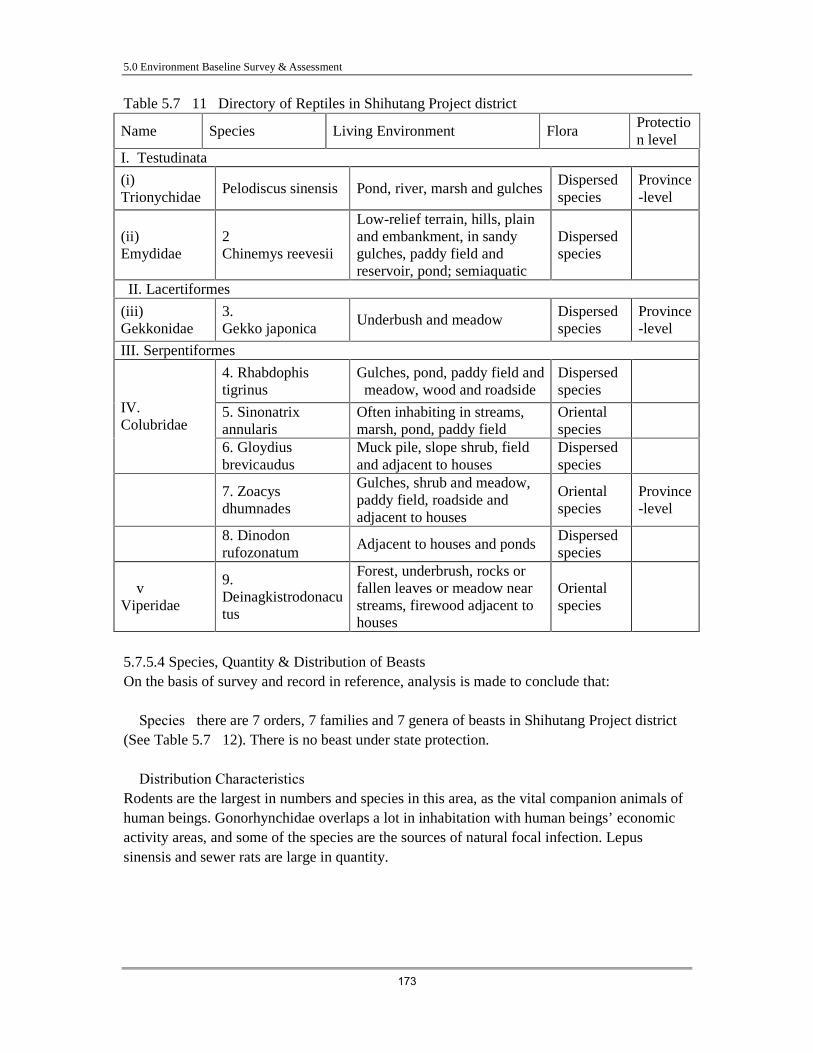
5.0 Environment Baseline Survey & Assessment
173
Table 5.7�11 Directory of Reptiles in Shihutang Project district
Name Species Living Environment Flora Protection level
I. Testudinata
(i) Trionychidae
Pelodiscus sinensis Pond, river, marsh and gulches Dispersed species
Province-level
(ii) Emydidae
2 Chinemys reevesii
Low-relief terrain, hills, plain and embankment, in sandy gulches, paddy field and reservoir, pond; semiaquatic
Dispersed species
II. Lacertiformes
(iii) Gekkonidae
3. Gekko japonica
Underbush and meadow Dispersed species
Province-level
III. Serpentiformes
4. Rhabdophis tigrinus
Gulches, pond, paddy field and meadow, wood and roadside
Dispersed species
5. Sinonatrix annularis
Often inhabiting in streams, marsh, pond, paddy field
Oriental species
IV. Colubridae
6. Gloydius brevicaudus
Muck pile, slope shrub, field and adjacent to houses
Dispersed species
7. Zoacys dhumnades
Gulches, shrub and meadow, paddy field, roadside and adjacent to houses
Oriental species
Province-level
8. Dinodon rufozonatum
Adjacent to houses and ponds Dispersed species
� v� Viperidae
9. Deinagkistrodonacutus
Forest, underbrush, rocks or fallen leaves or meadow near streams, firewood adjacent to houses
Oriental species
5.7.5.4 Species, Quantity & Distribution of Beasts On the basis of survey and record in reference, analysis is made to conclude that: � Species�there are 7 orders, 7 families and 7 genera of beasts in Shihutang Project district (See Table 5.7�12). There is no beast under state protection. � Distribution Characteristics� Rodents are the largest in numbers and species in this area, as the vital companion animals of human beings. Gonorhynchidae overlaps a lot in inhabitation with human beings’ economic activity areas, and some of the species are the sources of natural focal infection. Lepus sinensis and sewer rats are large in quantity.
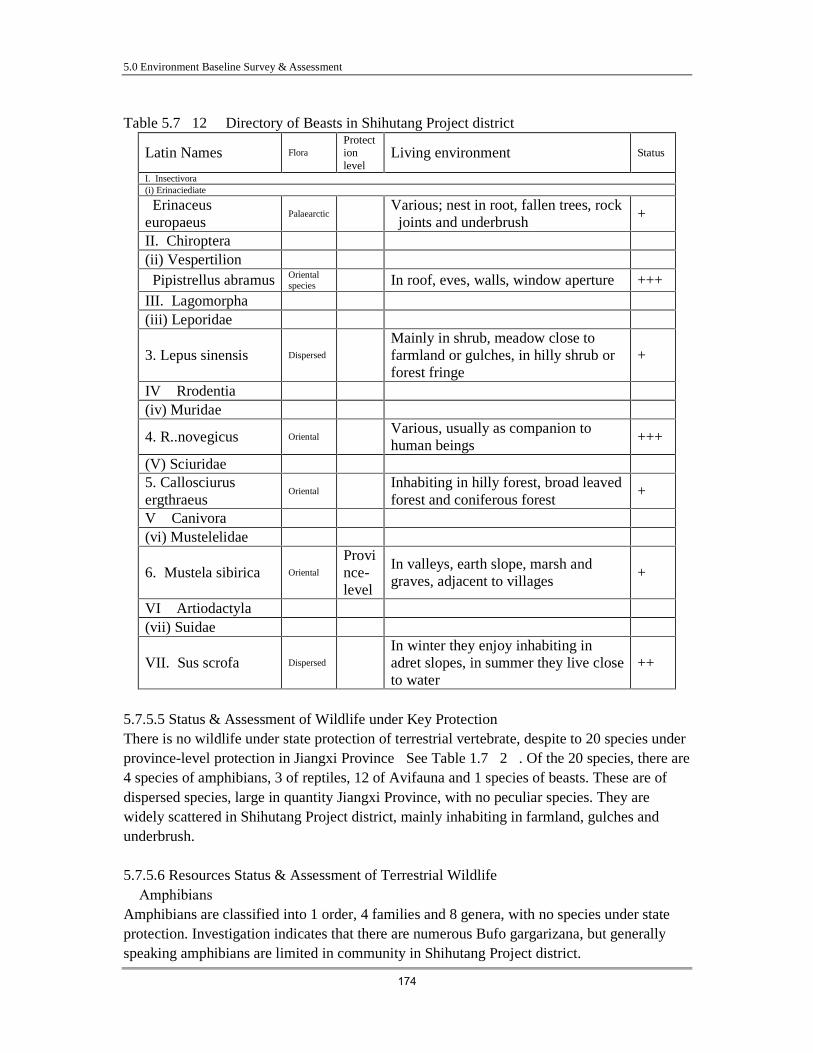
5.0 Environment Baseline Survey & Assessment
174
Table 5.7�12 Directory of Beasts in Shihutang Project district
Latin Names Flora Protection level
Living environment Status
I. Insectivora (i) Erinaciediate
Erinaceus europaeus
Palaearctic Various; nest in root, fallen trees, rock joints and underbrush
+
II. Chiroptera (ii) Vespertilion Pipistrellus abramus Oriental
species In roof, eves, walls, window aperture +++ III. Lagomorpha (iii) Leporidae
3. Lepus sinensis Dispersed Mainly in shrub, meadow close to farmland or gulches, in hilly shrub or forest fringe
+
IV� Rrodentia (iv) Muridae
4. R..novegicus Oriental Various, usually as companion to human beings
+++
(V) Sciuridae 5. Callosciurus ergthraeus
Oriental Inhabiting in hilly forest, broad leaved forest and coniferous forest
+
V� Canivora (vi) Mustelelidae
6. Mustela sibirica Oriental
Province-level
In valleys, earth slope, marsh and graves, adjacent to villages
+
VI� Artiodactyla (vii) Suidae
VII. Sus scrofa Dispersed In winter they enjoy inhabiting in adret slopes, in summer they live close to water
++
5.7.5.5 Status & Assessment of Wildlife under Key Protection There is no wildlife under state protection of terrestrial vertebrate, despite to 20 species under province-level protection in Jiangxi Province�See Table 1.7�2�. Of the 20 species, there are 4 species of amphibians, 3 of reptiles, 12 of Avifauna and 1 species of beasts. These are of dispersed species, large in quantity Jiangxi Province, with no peculiar species. They are widely scattered in Shihutang Project district, mainly inhabiting in farmland, gulches and underbrush. 5.7.5.6 Resources Status & Assessment of Terrestrial Wildlife � Amphibians Amphibians are classified into 1 order, 4 families and 8 genera, with no species under state protection. Investigation indicates that there are numerous Bufo gargarizana, but generally speaking amphibians are limited in community in Shihutang Project district.

5.0 Environment Baseline Survey & Assessment
175
� Reptiles There are 3 orders, 5 families and 9 genera of reptiles, with no species under state protection. Zoacys dhumnades are large in quantity. � Avifauna There are 26 species of birds, classified into 8 families and 17 genera. Passerine are largest in quantity, totaling 9 species, or 34.62% of all. There is no bird under state protection. Of the 26 species of birds, 9 belong to oriental species; or 34.62% in total�7 belong to Palearctic realm, or 26.92% of all�10 species are of dispersed species, 38.46% of all species. non- migratory birds total 14 species, or 53.85% of all; summer migrant aggregates 26.92% of all�Winter residents total 19.23% of all. � Beasts There are 7 orders, 7 families and 7 genera of beasts in Shihutang Project district. There is no beast under state protection. Rodents are the largest in numbers and species in this area, as the vital companion animals of human beings. Gonorhynchidae overlaps a lot in inhabitation with human beings’ economic activities, part of which is the source of natural focal infection. Lepus sinensis and sewer rats are large in quantity. � Wildlife under Key Protection Of all terrestrial vertebrates, there is no species under state protection. There are 20 species under province-level protection in Jiangxi Province, widely scattered in quantity in Shihutang Project district. 5.7.6 Inventory Survey & Assessment of Aquatic Organism 5.7.6.1 Sampling Points There are 5 sampling points. See Table 5.7�13 and Attached Drawing 27.

5.0 Environment Baseline Survey & Assessment
176
Table 5.7�13 Sampling Points of Aquatic Organism Position by GPS
No Sampling Points N E EL�m�
Notes
1 Zhongjia 26°57 37.1 115°00 50.4 50
Downstream reach of recommended dam site
2 Shihutang 26°54 31.9 114°59 52.2 52.4
3 Yanxidu 26°48 46.7 114°58 42.8 57.1 Spawning ground
4 Chengjiang 26°46 48.7 114°54 33.5 58.9 Spawning ground
5 Tongjia 26°42 37.2 114°49 22.1 60.27 Terminal of backup water
5.7.6.2 Plankton Water is sampled in different positions and different depths, by No 25 plankton net to obtain a sample of 1000 ml (1/2 transparent). After filter in the net the sampling shall be moved into the glass, to add formalin for settlement. After 24 hours of deposit, the sampling will be under concentration by siphon to 30 ml. plankton sampling shall be under identification by types, for quantitative and qualitative analysis, to come to the conclusion that: � Species There are 8 phyla and 47 species of plankton, 30 species of Cryophyte�10 species of Chlorophyta�1 species of Euglenophyta and pyrrophyta and xanthophyta, and 1 species of Cryptophyta. For detail see Attached Table 05�09; for detail of quantitative analysis of plankton see Table 5.7�14.

5.0 Environment Baseline Survey & Assessment
177
Table 5.7�14 Quantitative Analysis of Plankton
Species Chengjiang �×104 /L�
Shihutang dam site �×104/L�
Yanxi Town �×104/L�
Asterionella formosa 18 46 34 Cyclotella 2 1 Fragilaria 6 24 21 Melosira granulata 3 8 3 Gomphonema 2 15 9 Cymbella 2 2 3 Stauroneis 3 8 7 Surirella variabilis A.Cl
1 1
Navicula 3 10 10
Pinnularia 1 6 3
Tabellaria fenestriata 6 1 Draparnaldia Ulotrichales 3 6 2 Scenedesmus quadricanda
2
Ankistrodesmus sp. 6 13 4 Cryptomonadales Cryptomonadales 34 17 61
Euglena Phacus 1 chrysophyte Ochromonadaceae 1 Cyanophytes Chroococcaceae 2
� Composition of Species Of plankton in the region the diatom plays the major role, followed by chlorella and Cryptomonadales. In biomass diatom makes up the majority. The dominant species is Fragilaria, Navicula, Synedra, Gomphonema of bacillariophyta; Asterionella Formosa, Navicula of Chrysophytax; and Ulotrichales, Anthithamnion of chlorophyta; Cryptomonadales of Cryptophyta. This indicates the inorganic salt in the reach of Kan River meets the nutrition need for alga, which is desirable food to fishes. The change of alga is not only the basis to assess primary production of certain water, but also determines the productivity of plankton, thus to play a vital role in fishery industry. In addition, cryptophyta in large quantity indicates poor water quality in this reach of Kan River. 5.7.6.3 Zoobenthos In February and July 2007, site investigations were done, investigation points were located in Shihutang site; Zhongjia, Yanxi, Chengjiang and Tongjiazhuang, by way of triangle trail net and Peterson sediment samplers to make qualitative and quantitative sampling of zoobenthos, in addition to picking up at the shore, to make such conclusion as follows;

5.0 Environment Baseline Survey & Assessment
178
� Species All together the investigation collected 24 species of zoobenthos, classified into 2 phyla, 3 classes and 11 families. Of them most are of mollusk�totaling 20 species, making up 83.33% of zoobenthos�only 4 species of arthropod�16.67% of all zoobenthos. For details see Attached Table 10. For detail of record of investigation see Table 5.7�15�5.7�16. Table 5.7�15 Record of Investigation of Zoobenthos
Sampling place Zongjia Dam site Yanxi Chengjiang Tongjiazhuang DATE 2007.2.10 2007.2.10 2007.2.9 2007.2.9 2007.2.11
ALTITUTE�M� 50.0 52.4 57.1 58.9 60.3 TEMP.��� 17 17 15 15 19
EAST LONGITUDE
115°0050.4 114°5952.2 114°5842.8 114°5433.5 114°4922.1 LOCATION
NORTH LATITUDE
26°5737.03 26°5431.9 26°4846.7 26°4648.7 2 6°4237.2
TEMP��� 12 12 12.5 12.5 14 PH 6 6 6 6 6
BED SEDIMENT
SANDSTONE+ MUDDY STONE
FINE SAND + PEBBLE
SANDSTONE + PEBBLE
SANDSTONE SAND
DEPTH�CM� 220 150 120 200 100
WATER BODY
FLOW MODERATE MODERATE MODERATE MODERATE MODERATE
M
AIN
ZO
OB
EN
TH
OS SPC
IES
Rivularia auriculata
Semisulcospira peregrinorum
Corbicula fluminea
Sinopotamon denticulatum
Macrobrachium nipponense
Bellamya aeruginosa Rivularia auriculata
Semisulcospira peregrinorum
Corbicula fluminea
Bellamya aeruginosa Rivularia auriculata
Semisulcospira peregrinorum
Unio douglasiae Acuticosta chinensis Corbicula fluminea
Bellamya aeruginosa
Semisulcospira peregrinorum Sinopotamon denticulatum
Bellamya aeruginosa
Corbicula fluminea Lanceolaria
gladiola Lamprotula caveata
Unio douglasiae
� Species Composition Most of the zoobenthos are Bellamya aeruginosa, Rivularia auriculata, Semisulcospira peregrinorum, Corbicula fluminea and Unio douglasiae, with the former three species usually inhibiting in shallow water (0.7�1.5m)�where most of the bottom is of humus. This is related to their behavior of feeding upon alga or humus while inhabiting on shore rock or pebble. Sandy bottom material is suitable for growth of Corbicula fluminea, available for commercial fishing in fishery off-season, as one of cash farming. Other species of mussel serve as food to birds in low water seasons, thus mollusk plays a vital role in food chain of aquatic ecosystem. Swaying mosquitos larvae are quite sensitive to water pollution, just a few amount of species can withstand pollution to a certain extent. Appearance of swaying mosquitos larvae shows that the water quality and flowability of Taihhe section of the Kan River are good. Table 5.7�16 Record of Investigation of Zoobenthos Sampling place Zongjia Dam site Yanxi Chengjiang Tongjiazhuang
DATE 2007.7.21 2007.7.21 2007.7.20 2007.7.20 2007.7.22

5.0 Environment Baseline Survey & Assessment
179
ALTITUTE�M� 50.0 52.4 54 57 60.3 TEMP.��� 37 37
EAST LONGITUDE 115°0050.4 114°5952.2 114°5842.8 114°5433.5 114°4922.1
LOCATION NORTH
LATITUDE 26°5737.03 26°5431.9 26°4846.7 26°4648.7 2 6°4237.2
TEMP��� 31 31 31 31 30 PH 6 6 6 6 6
BED SEDIMENT
SANDSTONE+ MUDDY STONE
FINE SAND + PEBBLE
SANDSTONE + PEBBLE
SANDSTONE SAND
DEPTH�CM� 2.2 2.1 2.7 2.2 2.5
WATER BODY
FLOW MODERATE MODERATE MODERATE MODERATE MODERATE
MA
IN Z
OO
BE
NT
HO
S SPCIE
S
Rivularia auriculata
Semisulcospira peregrinorum
Unio douglasiae Corbicula fluminea
Sinopotamon denticulatum
Macrobrachium nipponense
Bellamya aeruginosa Rivularia auriculata
Semisulcospira peregrinorum
Corbicula fluminea
Bellamya aeruginosa Rivularia auriculata
Semisulcospira peregrinorum
Unio douglasiae Acuticosta chinensis Corbicula fluminea
Bellamya aeruginosa
Semisulcospira peregrinorum Sinopotamon denticulatum
Bellamya aeruginosa
Corbicula fluminea Lamprotula caveata
Unio douglasiae
� Biomass The density and biomass of zoobenthos at the assessment area vary at different seasons, the density and biomass of zoobenthos in winter is bigger than than in summer. Main species of big density and biomass of zoobenthos are Bellamya aeruginosa averagely with 334/m2 and a biomass of 1080g/m2�Rivularia auriculata 896/m2 and a biomass of 1681g/m2�Corbicula fluminea 160/m2 and a biomass of 126g/m2. � Adaptability of Zoobenthos to environment In Chengjiang: including Southgate Ferry and Eastgate Ferry, where it is resident’s area with dense population, where the bottom material in the mid-current of fine pebblestone is destroyed, to discover no shell. There are huge and small rocks close to Southgate Ferry, in the rock are attached numerous Semisulcospira peregrinorum, while in the north bank only Bellamya aeruginosa was discovered. In Yanxi Town: there is unique environment here, with the mid-current made up of fine sand, suitable for Corbicula fluminea, whose density reaches 160/m2, available for fishing in large quantities in June to July in flood seasons, as an important source of income. Close to the shore the bottom material is of gravel, with large amounts of Bellamya aeruginosa with a biomass of 334/m2�in addition to considerable Semisulcospira peregrinorum and Unio douglasiae, which feed upon alga attached to gravel and serve as good food to carp cyprinoid and herring. In Zhongjia: the mid-current bottom material is of sand mixed with scree, with limited Corbicula fluminea whose density reaches 53/m2. The shore is of mudstone, with unique
5.0 Environment Baseline Survey & Assessment
180
species of Rivularia auriculata with a density of 896/m2 and a biomass of g/m2, in addition to limited Semisulcospira peregrinorum. This reach is rich in crab and shrimp, too. Dam Site: the mid-current bottom material is of fine sand, with Corbicula fluminea making up the majority. The shore is of scree, with large quantity of ivularia auriculata, and Semisulcospira peregrinorum, with a mean biomass of 76.4g/m2. Tongjiazhuang: this point is richest in shell in this investigation, to total 15 species. The sampling occurred in the driest season with average water depth to reach about 1m, to see the bottom everywhere. In the mid-current there is rare shell, except for Corbicula fluminea, which averages 112/m2 in the east bank of sand bottom. The rock contains large quantity of Bellamya aeruginosa, while in the shallow shoal there were numerous species of shell, including Unio douglasiae, Lamprotula caveata, Lanceolaria gladiola, Anodonta globosula, Cuneopsis heudei, Lanceolaria gladiola and Arconaia lanceolata. 5.7.6.4 Profile of Fishery, fish resource, and main fish spawning sites See Chapter 8.0 of this EIA – SPECIAL ASSESSMENT ON FISHES AND SPAWNING SITES. 5.7.6.5 Conclusion of Aquatic Organism Evaluation � Conclusion of Plankton In Shihutang Project district there are 8 phyla and 47 species of plankton, 30 species of Chrysophyt�10 species of Chlorophyta�1 species of Euglenophyta and pyrrophyta and xanthophyta, and 1 species of Cryptophyta. Of plankton in the region the diatom plays the major role, followed bychlorella and Cryptomonadales. In biomass diatom makes up the majority. � Conclusion of Zoobenthos All together the investigation collected 21 species of zoobenthos, of which dominant species consist of Bellamya aeruginosa, Corbicula fluminea, Rivularia auriculata, Semisulcospira peregrinorum and Unio douglasiae. Some of the benthonic organisms are beneficial to human beings, like Bellamya aeruginosa, Corbicula fluminea and Unio douglasiae, which serve as food and feed to poultry and domestic animals, and some are harmful like Semisulcospira peregrinorum and Sinopotamon denticulatum, which is harmful to human as innermost of lung fluke. 5.7.7 Analysis of Primary Productivity of Natural System Vegetation is the most important and most sensitive element in ecological environment, to produce decisive role in eco-system evolution and balance.net vegetation productivity refers to the organic mass accumulated in a period in certain area of green plants, the gross mass created out of photosynthesis after deduction of consumption in phytotrophy respiration. This

5.0 Environment Baseline Survey & Assessment
181
index directly reflects the productivity of vegetation community in natural environment, to serve as vital parameter to evaluate status quo of ecological system. Biomass is the gross carbon in certain area of plants. Vegetation sampling in Shihutang Project district is made by way of field investigation, satellite image interpretation, indoor analysis and collected literature. Satellite image interpretation goes as follows: for chosen TM data, interpretation is under way through remote sensing software ERDAS (geometric accurate correction, image enhancement and amalgamation). On the basis of environmental data and relevant image software interpretation, relevant data and ecological images are obtained concerning ecological study in Shihutang Project district. On the basis of field investigation and satellite image interpretation, the surface vegetation status and vegetation stratus are divided into seven types, whose net productivity is listed in Table 5.7—17. From the table it is clear that based on mean net productivity applicable to terrestrial eco-system, the mean net productivity reaches 505.85gC/(m2.a), less than global average [214.15gC(m2.a)], to indicate that vegetation productivity is lower in Shihutang, where water body makes up considerable area.

5.0 Environment Baseline Survey & Assessment
182
Table 5.7�17 Natural Net Primary Productivity of Vegetation
Types Typical Plants Area�km2�
Percent�%�
NMP [gC/(m2.a)]
Broad-leafed Forestry
Form.Cinnamomum camphora, Form. Schima superba, Form. Castanopsis sclerophylla
27.48 3.07% 936
Conferous forestry
Redpine and slash pine 81.07 9.05% 587
Bush & underbush
Form. Paliurus ramosissimus Form. Vitex negundo var. cannabifolia
287.56 32.09% 426
Bamboo Phyllostachys 11.73 1.31% 626
Meadow Cynodon dactylon Ass., Eremochloa ophiuroides Ass.
13.68 1.53% 236
Farmland Rice, canola plant, tuber crops, legume, vegetables
440.11 49.11% 405
Wetland Aquatic vascular plant, alga 34.47 3.85% 325 Sum 896.1 100% 505.85 Criteria 720 NMP: Net Mean Productivity 5.7.8 Quality Assessment of Landscape Eco-system In classification of natural system, Shihutang belongs to manage landscape eco-system, including artificial landscape (vegetation under improvement) and artificial operation landscape (soil under improvement), field landscape and urban landscape. Artificial landscape consists mainly of river ecosystem, forestry ecosystem, shrub and meadow ecosystem and underbrush ecosystem. Artificial operation landscape is composed of paddy fields, dry land; urban landscape refers to combination of ecosystem in the county, towns, townships and villages. Shihutang Project district is of terrace by the river and hillock plain, under severe interference from human activities, so that the ecosystem is secondary, with focus upon water utilization, complimented from land utilization. Quality of landscape depends upon natural environment within the region and upon the complex relationship between all types of living beings and human society. In terms of landscape ecology and function, the rationality of structure determines superiority or inferiority of the landscape. Of all composition of landscape, matrix is the background to landscape out of wide-scattered, relatively homogeneous, strongest in connectivity, dominant soil overlay type. Such a type to a great degree determines the nature of landscape, to play a leading role in landscape. Matrix in Shihutang adopts landscape ecosystem methods, namely out of the degree of dominance (Do), which is determined by assessment of the superiority of matrix in a special landscape, to be judged by such three parameters as density (Rd), frequency (Rf) and landscape percentage (Lp ). Rd =(number of splits i /gross splits) ×100% Rf =( quadrate number of splits i /gross quadrate number) ×100% Lp =(area of split i/ gross quadrate number) ×100%

5.0 Environment Baseline Survey & Assessment
183
Do=0.5×[o.5×(Rd + Rf)+ Lp ] ×100% For detail of landscape composition see Table 5.7—18. Table 5.7�18 Landscape Composition in Shihutang
Types Area �km2� Percent Splits Woodland 323.88 36.18% 338 Meadow 109.35 12.22% 40 Waters 43.93 4.91% 40 Land for urban, rural and mineral building
9.83 1.10% 57
Paddy fields 261.23 29.18% 97 Dry land 146.95 16.42% 115 Total 895.17 100.00% 687
Based on such parameters the degree of dominance is calculated as follows on Table 5.7�19.

5.0 Environment Baseline Survey & Assessment
184
Table 5.7�19 Degree of Dominance of Each Split
Type Rd��� Rf��� Lp��� Do���
Woodland 46.94 48.81 36.18 42.03
Underbush 5.56 72.31 12.22 25.57
Waters 5.56 7.16 4.91 5.63
Land for urban, rural &mineral building
7.92 35.29 1.10 11.35
Paddy fields 13.47 49.71 20.41 26.00
Dry land 15.97 56.23 16.42 26.26
Unused land 4.58 9.24 8.77 7.84
From Table 5.7�19 it is clear that among the Do in all splits, the woodland enjoys a Do of 42.03%, a (Rd) of 46.94%, Rf of 48.81% and Lp of 36.18%, all of which are higher than in other splits, to serve as the matrix in Shihutang Project district and as the ecosystem to control landscape, followed by dry land Lp of 26.26%, paddy fields Lp of 26.00%, and underbrush Lp of 25.57%. In a word the ecosystem in Shihutang Project district is closely related to human activities, under severe human interference, poor in capacity of resisting disturbance and in adjustability.
5.7.9 Water & Soil Erosion & Water & Soil Conservation
5.7.9.1 Water & Soil Erosion in Affected County
This Project is located in Taihe County of Jiangxi Province, which, based on Soil Corrosion Classification & Gradation StandardsSL190-96 , falls into south China hilly areas of red loam where the soil corrosion is mainly of water erosion. In line with Key Preventive & Rehabilitative Efforts against Soil Erosion in Jiangxi Province from People’s Government, the project is located in this key engineering area, where allowed value for water and soil erosion reaches 500t/Km2.a.
Based on remote sensing of water and soil erosion in 1996 in Jiangxi Province, the whole county has a gross water and soil erosion area of 629.76km2 or 23.6% of total land. Of the land, lightly eroded area totals 155.35km2 and moderately eroded area 174.63km2 and strongly and extremely eroded area reaches 299.78km2 to contribute 24.7%, 27.7% and 47.6% respectively to the gross water and soil erosion areaSee table 5.7 20 . Status quo of water and soil erosion see Chart 5.72. soil corrosion modulus is 1023.07t/km2·a. Water and soil erosion is featured by surface erosion, with partial gulley erosion.

5.0 Environment Baseline Survey & Assessment
185
Table 5.7 20 Status of Water & Soil Erosion in Taihe County Unitkm2
District Acreage Light Medium Deep Severe Violent Total
Percent of water
and soil erosion
area in gross area
(�)
Taihe 2665.4 155.35 174.63 262.32 34.95 2.51 629.76 23.6
5.7.9.2 Status Quo of Water & Soil Erosion in Shihutang Area
Shihutang Project is located at hilly areas of red loam in Southern China, abundant in rainfall, where water and soil erosion is mainly of water erosion. Among the construction area, water and soil erosion area makes up 21% of total land for constructionexcluding reservoir inundation or land for sand and other building materials. Of the land light water and soil erosion area makes up 58% of the total, medium water and soil erosion 40%, strong erosion area 2%. Within the range of construction acquisition of land, mean soil corrosion modulus is 853t/km2.a.
Existing water and soil erosion is listed in Table 5.721 the mean soil corrosion modulus under different topography for different engineering items is listed in Table 5.722.

5.0 Environment Baseline Survey & Assessment
186
Chart 5.7 21 Status of Water & Soil Erosion in Taihe County

6.0 Environment Impact Assessmen t
187
Table 5.7 21 Status of Water & Soil Erosion Unithm2
Item Acreage Light Medium Deep
water & soil erosion area
Percent of water & soil erosion area in gross area�
Nodal region 28.33 4.95 2.10 7.05 25% Embankment protection
258.53 27.99 14.06 0.53 42.58 16%
Project management site
3.33 0.33 0.33 10%
Borrow pits 34.53 4.61 1.51 6.12 18% Spoil sites 117.62 21.60 15.52 37.12 32% Construction & living quarters
64.2 10.61 12.18 2.06 24.86 39%
Roads/highways 30.73 6.34 5.01 11.35 37%
Host area 5.21 2.61 2.61 50%
Lifting the field 82.47 Sum 624.95 76.45 52.99 2.59 132.02 21%

6.0 Environment Impact Assessmen t
188
Table 5.7-22 Background Level of Soil Corrosion Modulus
Engineering site
Use of land (hm2)
Status quo
Soil corrosion modulus �t/km2·a�
Nodal region
28.33 Acquisition of land in the nodal region is mainly of paddy fields, dry land and forestland and unused land; soil corrosion is mainly of medium erosion.
860
Embankment protection
258.53 Acquisition of land is of paddy fields, dry land, forest land and unused land�flat as a pancake, where soil corrosion is of light and slight erosion.
753
Project
management
site
3.33 Mainly of forest land and unused land�and soil
corrosion of medium erosion 600
Borrow pits 34.53 There are 13 borrow pits that all come from the hillside; existing vegetation is of forest, meadow and dry land.
743
Spoil sites 117.62
There are excavation waste dumps�2 of which is located in existing gulch or valley mainly of waste land with deep erosion; 10 located as gentle slope spoil sites, to use farmland as such sites where soil corrosion is medium and light; the rest of the spoil sites use flat paddy fields or dry land as spoil sites, with medium or light soil corrosion
1014
Construction area/living quarters
64.2 Acquisition of land for temporary works is mostly of gentle surface relief�with desirable vegetation out of grass and shrubs, where soil corrosion is deep.
1284
Roads & highways
30.73 Acquisition of land for temporary works is mostly of gentle surface relief�with desirable vegetation out of grass and shrubs, where soil corrosion is light.
1114
Host area 5.21 Acquisition of land is mainly of paddy fields,
forestland, with light soil corrosion. 1752
Lifting the
field 82.47
Acquisition of land is mainly of paddy fields, with
limited dry land. 500
5.7.9.3 Types of Water & Soil Erosion
In the project area the types of water and soil erosion is mainly of surface erosion and gulley erosion, where water and soil erosion makes up over 80% of gross land, with very little gravity erosion from landsliding and bank sloughing. Surface erosion mostly occurs in barren hills and waste slope in arable land and arable land forest land, which is over 5° in gradient, which suffers from partial damage. Gulley erosion comes from surface erosion due to runoff concentration and rill erosion occurs mainly in slope arable land and in loose sheet erosion, usually in downsea slope arable land and barren hills. Shallow gully erosion and gully erosion are common, seen in runoff gathering where gulch and hillside joins. Gravity erosion occurs usually during gullywasher, mostly distributed in inclined or abrupt slopes.

6.0 Environment Impact Assessmen t
189
5.7.9.4 Cause of Water & Soil Erosion
Water and soil erosion is out of combined action of natural elements and artificial activities, closely related to such factors as topography, soil, rainfall, land use patterns, and vegetation. Natural factors are the major causes of water and soil erosion, while human activities aggravate water and soil erosion.
� Rainfall is abundant and concentrated, and storm intensity is very unusual, as the direct force to cause water and soil erosion. Shihutang area is mainly of red loam, followed by purple soil, both of which are undesirable in resistance. The bare soil is open to rain drop erosionthus the soil is ready to be eroded and moved, to result in water and soil erosion.
� There is developed water system, with numerous streams and creeks and brooks densely distributed, with gulch under deep and narrow cutting, with abrupt and long slopes, which is favorable for development of water and soil erosion.
�The density of population in this area is very high and cultivation index is very high, which is one of the causes of water and soil erosion. Density of population amounts to 187 people/km2, mainly of rural population who are engaged in blind deforestation. Such over-use of land and predatory activities will damage vegetation to make some hills into bare ones, only to aggravate water and soil erosion.
� There is severe wanton cutting of forests, which seriously destroys vegetation. Despite some measures to plant trees, but poor management harvests little benefit, so that every year sees planting of trees while to see no formation of grove at all, so that timber can not meet the demand, and forest cover decreases year by year, which of course worsen water and soil erosion.
� Cropping pattern is outdated, which will add to gradient of arable land to create fresh water and soil erosion.
� During infrastructure there is not enough attention to water and soil conservation. In construction and production, the importance of water and soil conservation has been ignored to the extent of wanton damage of surface vegetation and wanton disposal of sand, stones or waste residue so that large amounts of waste residue are directly disposed of to the river to block the channel and thus aggravate water and soil erosion.
By the end of 2002, Taihe County brought an area of 160.2km2 that used to suffer from water and soil erosion under control.
5.7.10 Profile of Regional Soil Within the same bioclimatic zone the soil shows no difference in horizontal distribution, except for vertical distribution. There is such soil as red loam, paddy soil, purple soil, moisture soil and yellow soil. Red loam is typical of regional soil, to rise in elevation from valley terrace in Kan River southeastward, to develop into moisture soil or paddy soil (in valley plain) to red loam, to lateritic soil, to purple soil and gulch paddy soil (in low and middle-elevation hillock plains), until to mountain red soil and corresponding paddy soil (in middle and high-elevation hills and low-relief terrain) or mountain yellow brown soil. � Distribution of Mountain Soil Mountain red soil is distributed in ring along the low-relief terrain and some middle or high hills (0ver 200m), large in areas. Its lower limit borders low EL red soil or partial rocky soil, while its upper limit (over 700m EL) is of mountain yellow brown soil, limited in mountain paddy fields, distributed in narrow valley or some small depression.

6.0 Environment Impact Assessmen t
190
� Distribution of Hilly Soil Hilly soil in Taihe is divided into two types: The first type is distributed in the middle or low-relief terrains out of fuchsia cretaceous waste, in form of purple soil or red loam. Present vegetation is mainly of meadow or shrub, with partial artificial pine, with a cover density of less than 10%, suffering from water loss and earth erosion. The second type is of red loam or lateritic soil, concentrated in Yanxi, Shangtian, Wanhe, Mashi, Tangzhou and other monticles or terrace. There is little coverage and severe water loss and earth erosion. Low gulch of red loam is one of the major rice yield sources, distributed in parallel, mostly lack of water sources. �Distribution of Soil in Valley Plain Valley plain under influence of topographical structure is not large in area, only 2 to 3 km in width, obviously of green sandy clay or green sand of gravel bed. Here the soil changes to paddy soil near the hill edge. Soil nutrition varies corresponding to topography, with brown soil richest in nutrition, followed by red loam, mountain brown soil and purple soil, in a range of 10 times. For detail of soil fertility see Table 5.7—23.

6.0 Environment Impact Assessmen t
191
Table 5.7�27 Evaluation of Soil Fertility
Type Class Major soil Distribution & Utilization
Major Features
Remarks Improvement
Forest
�
Rock waste: mostly of organic medium-thick or thick yellow soil or red loam
Of hilly areas at EL 300m in Zhonglong, Shuiguo, Laoyinpan, and Qiaotou, etc. dominant by arbor and shrub, cash forest and oily and tea forest
Relatively thick soil and fertile
Suitable for various crops
Sasanqua forest; open to improved density by way of forest conservation�planning felling and renewal
Meadow
�
Quartziferous waste: with organic medium-thick or thick yellow soil or red loam; argillaceous slate waste�Full of organic medium-thick or thick red loam
Distributed in hilly areas or hillock plains. Above EL300 m dominated by arbor and shrub, with certain area of Sasanqua forest
The soil is usually thick with little lithosol and humus
Limited in forestry adaptability. Medium-fertile soil
Great attention shall be paid to development of forestry and firewood, and it is suitable to develop cash trees where it adjacent to villages and the slope is slow
Wasteland
�
Fuchsia conglomerate waste: with little organic medium-thick or thick lateritic soil or red loam
Mainly distributed in low and medium-high hilly areas, dominated by meadow or shrub, with sporadic red pines
Thin soil stratum, with the bed rock visible below the surface soil
Low fertility
Shall be under preservation
Wasteland �
Red clay of Quaternary period�With little organic red loam or lateritic soil
Mainly distributed in Yanxi, Shangtian, Tangzhou, Zhangshu and Yuanqian. With little vegetation
Under severe erosion. The bedrock or rix matrices exposed
Little nutrient content. Barren land
Unsuitable for exploitation

6.0 Environment Impact Assessmen t
192
6.0 ENVIRONMENTAL IMPACT ASSESSMENT
6.1 Hydrologic Conditions
6.1.1 Hydrological Regime of the Shihutang Section under Natural Condition
6.1.1.1 Flow at the Shihutang dam site under natural condition
Shihutang Project has a catchment of 43770km2. In accordance with the distribution of upstream and downstream hydrological stations of the dam site and hydrological information, Dongbei Station and Linkeng Station at upstream of the Shihutang dam site are selected as the basis of annual and monthly runoff calculation of the Shihutang dam site. The annual and monthly runoff in Shihutang dam site is computed on the basis of the actual annual and monthly runoff of Dongbei Station and Linkeng Station from 1957 to 2005. After reservoir filling the runoff here is not influenced by Wan’an Reservoir. For many years the average flow is 1150m3/s, the average runoff volume is 362.9×10⁸m3, the average runoff is 828.9 mm deep and the annual runoff modulus is 26.27L/km2/s.
1 Runoff Properties at Shihutang dam site under natural condition
During 49 years from 1957 to 2005, its runoff volume is relatively rich; the annual runoff varies a lot from year by year. The maximum annual average flow is 1940m3/s (in 1975), then 1930m3/s (in 1973), the minimum annual average flow is 405m3/s (in 1963), and the maximum annual average flow is 4.79 times of the minimum annual average flow. The runoff is not evenly distributed during a year, the runoff volume during the 5 successive months of rainy season (from March to July) accounts for 65.6 percent of the total annual runoff volume, of which, the maximum rainfall occurs in June, which accounts for 18.99 percent of the total. Its dry season lasts from October to February of the next year, and the runoff volume of the 5 successive months is only 19.61 percent of the annual runoff volume, of which, the runoff volume in December is the minimum, which only accounts for 3.03 percent of the total annual runoff volume. The maximum monthly average flow 6190m3/s (in June, 1959) is 39.7 times of the minimum monthly average flow 156m3/s (observed in Feb. 1987). The distribution conditions of monthly runoff volume are shown in Table 6.1-1.
Table 6.1�1 Monthly Average Runoff Distribution of Shihutang dam site
Item Jan. Feb. Mar. April May June July Aug Sept Oct. Nov. Dec Whole year
Annual average flow(m3/s)
457 676 1212 1841 2176 2623 1242 1080 931 651 506 418 1150
% of annual runoff
3.31 4.90 8.77 13.33 15.75 18.99 8.99 7.82 6.74 4.71 3.66 3.03 100
Monthly average max. flow
1256 2349 4715 5109 5219 6191 3321 3192 4644 1999 2013 1359 1940

6.0 Environment Impact Assessmen t
193
(m3/s) Year 1998 1998 1983 1973 1975 1959 1997 1997 1961 2002 2002 2002 1975 Monthly average min. flow (m3/s)
160 156 233 379 396 746 392 270 233 167 198 157 405
Year 1957 1987 1977 1971 1963 1963 2003 1963 1965 1963 1967 1958 1963
(2) Design Annual Runoff at Shihutang dam site under natural condition
Average annual runoff for design at Shihutang dam site will be calculated in line with the value from 1992to 1993, from 1982 to1983, from 1990 to 1991, from 1966 to 1967 and from 1986 to 1987 during high flow year, design wet year, design normal year, design low year and dry year. For detail of the characteristics of the values at Shihutang dam site concerning designed mean annual flow, designed mean flow in dry years and in typical years and mean flow during dry periods, see Table 6.1-2; for detail of monthly mean flow see Table 6.1—3 in the five typical years.
Table 6.1�2 Average Flow Comparison between Dam Design Stage & Design Typical
Year Design average flow (m3/s) Stage average flow (m3/s) Frequency
(%) Hydro-year
Oct.-Feb.
Nov.-Jan.
Design typical year Hydro-
year 10�2� 11�1�
10 1660 948 803 1992�1993 1640 374 380
25 1380 675 572 1982�1983 1330 1060 952
50 1110 468 397 1990�1991 1130 559 538
75 877 339 287 1966�1967 877 377 290
90 699 279 236 1986�1987 758 246 267
Mean 1145 542 459 Mean 1147 523 485 Mean value during 49 years from 1957 to 2005 at Shihutang dam
1150 543 464
Table 6.1 3 Runoff Distribution in Typical Design Years in Shihutang dam site under
natural condition
Items Mar Apr May June July Aug Sept Oct Nov Dec Jan Feb Whole year
1992�93 (P=10%)
4211 3335 3041 2743 2682 902 820 439 376 354 409 282 1640
1982�83 (P=25%) 1341 1343 2365 2778 1234 891 706 516 807 859 1190 2029 1330
1990�91 (P=50%) 1019 2658 1378 1866 926 1304 1570 716 659 408 550 457 1130
1966�67 (P=75%) 457 1423 1180 3400 1313 544 349 400 305 312 254 637 877
1986�87 (P=90%)
1027 1623 1178 2034 1126 490 385 264 369 252 183 155 758
Mean flow 1611 2076 1828 2564 1456 826 766 467 503 437 517 712 1147
Max daily flow 13791 10122 5962 9032 11644 4316 6176 1535 2525 2357 3309 6181 13791
Typical years High year
High year
High year
Low year
High year
Normal year
Normal year
Normal year
wet year
Wet year
Wet year
Wet year
high year

6.0 Environment Impact Assessmen t
194
Min daily flow 212 532 360 755 387 280 179 149 226 193 160 124 124
Typical years Low year
Low year
Low year
Low year
normal year
Low year
Low year
Low year
Low year
dry year
dry year
dry year
dry year
Note�the data in the table is under measurement at m3/s.
6.1.1.2 Water level at Shihutang dam site under natural condition Calculated from Table 6.1—2 the water level—runoff curve can be obtained concerning mean annual flow, maximum monthly flow and minimum monthly flow at Shihutang dam site, see Table 6.1—4. On the basis of design mean flow in typical years/months at Shihutang dam site concerning water level—flow curve, mean monthly water level is shown in Table 6.1—5. Table 6.1 4 Water level at Shihutang dam site under natural condition
Item Jan Feb Mar Apr May June July Aug Sept Oct Nov Dec Whole year
Mean annual water level
47.61 48.09 48.99 49.82 50.20 50.66 49.04 48.80 48.55 48.04 47.72 47.51 48.90
Mean monthly high level 49.06 50.38 52.42 52.70 52.77 53.42 51.30 51.19 52.36 50.00 50.02 49.20 49.93
Years 1998 1998 1983 1973 1975 1959 1997 1997 1961 2002 2002 2002 1975
Mean monthly low level 46.67 46.65 46.96 47.41 47.45 48.22 47.44 47.08 46.96 46.70 46.83 46.65 47.48
Years 1957 1987 1977 1971 1963 1963 2003 1963 1965 1963 1967 1958 1963
Table 6.1 5 Summary of Mean Monthly Water Level at Shihutang Dam Site
Item Mar Apr May June July Aug Sept Oct Nov Dec Jan Feb Whole year
1992�93 (P=10%) 52.04 51.32 51.05 50.77 50.72 48.50 48.36 47.56 47.40 47.34 47.49 47.12 49.57
1982�83 (P=25%) 49.18 49.18 50.40 50.81 49.03 48.49 48.15 47.75 48.34 48.43 48.96 50.03 49.16
1990�91 (P=50%)
48.70 50.69 49.23 49.85 48.54 49.13 49.48 48.17 48.05 47.48 47.82 47.61 48.87
1966�67 (P=75%) 47.61 49.29 48.95 51.37 49.14 47.81 47.32 47.46 47.19 47.21 47.03 48.01 48.46
1986�87 (P=90%) 48.71 49.55 48.94 50.04 48.87 47.69 47.42 47.06 47.38 47.02 46.77 46.65 48.25
Average 49.54 50.09 49.80 50.69 49.33 48.37 48.26 47.63 47.72 47.56 47.75 48.16 48.90
Highest daily level
57.19 55.60 53.27 55.06 56.29 52.12 53.41 49.44 50.56 50.39 51.29 53.42 57.19
Years High year
High year
High year
Low year
High year
Normal year
Normal year
Normal year
Wet year
Wet year
Wet year
Wet year
High year
Lowest daily level
46.88 47.78 47.35 48.24 47.43 47.12 46.75 46.62 46.93 46.81 46.67 46.50 46.50
Years Low year
Low year
Low year
Low year
Normal year
Low year
Low year
Low year
Low year
Dry year
Dry year
Dry year
Dry year
Note: the data is based on Yellow Sea base level.
From Table 6.1-4 it is clear that the average annual water level is 48.90m at Shihutang dam site, and the highest monthly water level reaches 50.66 m in June while the lowest level 47.51m occurs in December. The highest monthly water level is 53.42 m (in June 1959) and the minimum 49.06 m occurred in January 1998) and therefore the highest annual mean

6.0 Environment Impact Assessmen t
195
variation amounts to 4.36 m. The lowest monthly water level is 48.22 m maximum (in June 1963), and the lowest level 46.65 m occurred in December 1958, thus mean monthly level varies by 1.57 m. The water level difference between the maximum highest water level and the minimum lowest minimum water level amounts to 6.77 m.
From Table 6.1-5 it can be seen that the average annual water level is 48.90m at Shihutang dam site under natural condition during the typical years, and the highest monthly average water level reaches 52.04 m that occurs in March of the wet years while the lowest monthly average water level 46.65 m occurs in the dry years in February, thus the difference between the highest monthly average water level and the lowest monthly average water level totals 5.39 m. The maximum daily average water level is 57.19 m in wet years in March 28 for the design typical years, while the lowest daily average level 46.50 m occurs on February 21st in the dry season, thus the difference between the highest mean daily water level and the lowest level is 10.69 m.
6.1.2 Load Prediction of Power System in Jiangxi Province On the basis of the feasibility studies concerning the Shihutang Project, the said Project will supply power to the whole Jiangxi Province. Based upon the social and economic data and upon the power demand and supply data, a prediction is made concerning power demand and supply in the Province, that in design year of 2015 Jiangxi Province will demand a power supply totaling 845.9 × 10⁸kW • h, and the largest electricity load totals 16859 MW. Taking into consideration the transmission loss and works load, it is estimated that power demand in Jiangxi Province will total 909 × 108kW • h, and the largest electricity load totals 18123 MW. On the basis of daily load in the said Province in summer and winter in 2005, the representative load curve is described as follows in Table 6.1-6 concerning load curve in 2015.
Table 6.1—6 Representative Daily Load Curve of Power System for 2015 in Jiangxi Province
Time 1 am 2 am 3 am 4 am 5 am 6 am 7 am 8 am 9 am 10 am 11 am 12 am
% 75.9 72.5 69.5 67.0 65.4 64.9 66.7 64.7 70.2 76.2 81.2 86.2 Summer load MW 13755 13139 12595 12142 11852 11762 12088 11726 12722 13810 14716 15622
% 59.2 58.2 57.5 57.2 58.3 60.9 69.8 77.2 77.1 79.0 83.1 79.6 Winter load MW 9120 8966 8858 8812 8981 9382 10753 11893 11877 12170 12802 12262
Time 13 pm 14 pm 15 pm 16 pm 17 pm 18 pm 19 pm 20 pm 21 pm 22 pm 23 pm 24 pm
% 78.7 81.1 80.0 81.2 81.8 83.8 77.9 83.7 100.0 97.2 86.7 82.7 Summer load MW 14263 14698 14498 14716 14825 15187 14118 15169 18123 17616 15713 14988
% 74.8 78.5 81.2 82.5 84.0 87.0 92.0 100.0 96.0 87.0 78.0 66.6 Winter load MW 11523 12093 12509 12709 12940 13402 14173 15405 14789 13402 12016 10260
6.1.3 Brief Introduction to Wan’an Key Water Project & Taihe Key Water Project The Shihutang Project is the third cascade control project in the middle reach of River Kan. The Wan’an Project (completed) and the Taihe Project (to be constructed) are both located in the upper reaches of the Shihutang Project, to produce certain impact upon the Shihutang Project. 6.1.3.1 Operation & Dispatching Model in Wan’an Project (1) Operation & Management Principles

6.0 Environment Impact Assessmen t
196
The Wan’an Project, as the largest hydropower station in Jiangxi Province, has such major functions as power generation, flood control, shipping and irrigation. It plays the role of peak load modulation, frequency modulation and emergency duty. The Project is under operation and management in such principles as: under the premise of safety operation, the Project shall play a full role in power generation, flood control, navigation and irrigation efficiency. To ensure the safe operation of the project, the Project shall give priority to safe flood discharge; in case of conflicts between flood discharge and other benefits, the project hub safety shall be placed at the first place. (2)Authority of Operation & Dispatching When the in-flow or out-flow is less than 4000 m3/s and the water level in the reservoir does not exceeded the operation water level, the project will be run in the mode of power generation and navigation, with the sluice gates under operation by the power plant; in case the in-flow or out-flow is more than 4000 m3/s the Project is under direct dispatching by the provincial flood control department, or if necessary, all the authority concerning operation of the said Project will be completely transferred to the said flood control department. �3) Rule for Dispatching In case the in-flow or out-flow is less than 4000 m3/s, the said Project will be run in the mode of power generation and navigation; in case the said flow exceeds 4000 m3/s, the said Project will be run in the mode of flood control.
Power generation & navigation operation mode The Power generation mode in the Wan’an Project shall be performed in line with the Wan’an Key Project Scheduling Drawing (Figure 6.1.1 is for the final scale operation scheduling diagram and Figure 6.1.2 for the initial operation scheduling). From April to June the reservoir will have the highest water level at 88.11 m (final scale operation), or at 83.11 ~ 86.11 m (initial operation, determined by the provinces’ flood control department), to control the power plant to operate at natural in-coming flow. In case the in-coming flow exceeds the project’s maximum discharge capacity, the excess water will be discharged from the spillway. By the end of June the Project will work at the firm capacity to have full reservoir filling. When the reservoir filing reaches 98.11 m (final scale operation), or 94.11 m (early operation) the project will work under the natural flow. In case the in-coming flow is less than regulated flow, the project works under the firm capacity mode and the inadequate flow is under supply from the reservoir, until the reservoir falls to the dead water level by March. When the water level at the restriction is lower than the restricted water line, the project works under 80% of firm capacity. To meet the shipping requirements in the downstream, the project will arrange two units of 25 MW in the power plant for shipping load so that discharge shipping flow will total 130 m3/s.
Flood control model in early stage In accordance with "Report of Flood Control Dispatching in Wan’an Hydraulic Power Plant in Early Stage" and with "Demonstration of Wan’an Reservoir Operation Mode", during the initial operation of the reservoir flood the control program is recommended as follows: during the flood season from April to June the normal operation water level shall be 86.11 m (to be determined by the provincial flood control department) and the flood control level shall be 91.71m (under cascade control against 50-year-recurrence flood) by way of pre-discharge and despiking. In case of flood over 50-year-recurrence, the project will be run in the mode of dam protection, as follows:

6.0 Environment Impact Assessmen t
197
A. Pre-discharge Mode In case flow in Ji’an is less than 5000 m3/s, the discharge shall be equal to in-flow, so that the project will work under normal water level at 86.11m. In case flow in Ji’an exceeds or is equal to 5000 m3/s, while the flood tends to rise higher, the reservoir undertakes pre-discharge at 1730 m3/s (the added value after deduction of discharge flow from in-flow), to last a day, until the water level falls to 83.11m.
&KDUW������ )ORRG�&RQWURO�6FKHGXOLQJ�LQ�
:DQ’DQ (Normal level: l 98.11m)
88
90
92
94
96
98
100
102
104
0 1 2 3 4 5 6 7 8 9 10 11
12
0RQWKV
Yellow
Sea base level)
Water level
)ORRG�FRQWURO�]RQHV 0RUH��RXWSXW�
0RUH�RXWSXW
Firm capacity
)LUP�FDSDFLW\�
/HVV�RXWSXW
Chart 6.1.2 )ORRG�&RQWURO�6FKHGXOLQJ�LQ�:DQ’DQ
(
�1RUPDO�94.11m)
83
85
87
89
91
93
95
97
99
101
103
105
0 1 2 3 4 5 6 7 8 9 10 11
12
0RQWKV�
)ORRG���
&RQWURO�
]RQHV
More
More output
Firm capacity
Firm capacity
Less output

6.0 Environment Impact Assessmen t
198
B. Impounding & Flood Peak Despiking In case in-flow in Wan’an is more than or equal to 8800 m3/s, the impounding will commence at a discharge of 8800 m3/s. In case in-flow in Wan’an is over 9550 m3/s but less than 12000 m3/s, the discharge will total 750 m3/s. In case in-flow in Wan’an is more than 12000 m3/s, the discharge will reach 4000 m3/s. When the impounding water level reaches 91.71 m in Wan’an, the reservoir shall open all sluice gates for discharge; in case the in-flow is less than 8800 m3/s, discharge shall total 8800 m3/s until the storage water level drops to 86.11 m for normal operation. C. Dam Protection Flood Control Mode In case of over 50-year-recurrence flood (the storage water level reaches higher than design flood level and keeps rising), the reservoir shall be under full discharge for dam protection.
Final Scale Flood Control Mode Up to now the Wan’an Project can not run under final scale, hence there is no study concerning its operation under the final scale. Such an operation shall proceed in line with the designed flood control drawings, which are drafted in accordance with the flood rising rate and the in-flow as basis to determine the storage in Wan’an. According to the flood control scheduling, in case of instantaneous storage, higher level of storage will be undertaken; in case of instantaneous discharge, lower discharge rate will be performed. In case of choice between storage and discharge, storage will be undertaken. When the storage level reaches the designed flood control level, scheduling shall be in line with the principle of dam safety operation (that is, flood control model). The normal operation water level in Wan'an for early stage operation may be modified to 88.11 m, and the designed flood control water level to 98.11 m, so that the final scale control model will be undertaken in line with the despiking scheduling and dam protection scheduling. 6.1.3.2 Operation & Scheduling Mode in Taihe Project (to be constructed) Taihe Project is mainly for power generation, to be complemented by navigation and irrigation, and other functions. The scheduling mode in Taihe Project in the design phase in accordance with the project properties is determined as follows: As a daily regulation hydropower station, in addition to meet the need for shipping base flow, Taihe will be running to its own advantages. As a daily regulation hydropower station, Taihe will be under impact from the upstream cascade hydropower station Wan’an Project (a seasonal regulation hydropower station) in modes of operation. In one day, the aggregate water for Taihe is equal to discharged column from Wan’an Project plus the runoff in the reach. Under this project development tasks, Taihe will function for peak load modulation, frequency modulation and emergency service for Jiangxi Province power system. Taihe Reservoir has neither flood control nor storage capacity, unable to control flood in the downstream. Flood control scheduling in Wan’an will be achieved at 20-year-recurrence flood to prevent flood from submerge of Wan’an, when the reservoir will be under operation of flood discharge capacity. In order to reduce losses from reservoir inundation and from reservoir resettlement, in case of 5-year-recurrence flood, pre-discharge will be undertaken, so that discharge will reach 10000 m3/s before the in-flow flood reaches 10000 m3/s, until the storage level drops to 67.0m. Taihe Project will function as an equalizing reservoir to satisfy the need
6.0 Environment Impact Assessmen t
199
of base flow for navigation in the downstream (at 135 m3/s, and corresponding output reaches 14 MW). 6.1.4 Water Regime in Shihutang In the mainstream of the middle reaches of River Kan there will be four cascade development projects, of which Wan’an was completed in 1993 in line with the final scale and commenced operation in the very year. At present Wan’an is under operation of early stage storage level, while the three projects--Taihe, Shihutang and Xiajiang are currently in the early stage of preparation, to be built in the near future and scheduled to be completed by 2020. Under current conditions water regime for Shihutang Project takes the early stage operation level in Wan’an Project when the other three cascade projects have not yet been completed. 6.1.4.1 Current Flow
(1) Discharge process in normal years for Wan’an Project
In accordance with Wan’an operation and scheduling plan, with power generation and shipping scheduling methods, the mean seasonal discharge in Wan’an in typical years are listed in Table 6.1-7.
(2)Typical daily discharge process in Wan’an Project Wan’an is of seasonal regulation (partial regulation), of limited regulatory capacity. Based on survey and from Table 6.1-7, it is known that Wan'an Project generally has three units for peak load modulation. Now the change in daily discharge in summer and winter in Wan’an is described on the basis of three or four generation sets under full load. The unit discharge capacity in Wan’an reaches 556 m3/s, and hence the maximum discharge capacity for three and four generating units totals 1668 m3/s and 2224 m3/s respectively. Based on the typical daily load curve in 2015 in Jiangxi Power System, at 8-hour peak load modulation in Wan’an, when all the generating units concerned will work under full load at the maximum discharge. In case of no peak load modulation, there will be one unit under operation whose discharge base flow reaches 130 m3/s. For detail of discharge process in Wan’an during summer and winter operation, see Table 6.1.8. From the table it is obvious that the minimum discharge in Wan’an in case of peak load modulation reaches 130 m3/s and the maximum discharge totals 1668 m3/s when the three units are involved in peak load modulation, when the flow variation reaches 1538 m3/s; in case of peak load modulation from four units the maximum discharge totals 2224 m3/s when the flow variation reaches 2094 m3/s.

6.0 Environment Impact Assessmen t
200
Table 6.1.7 Average In-flow & Discharge in Wan’an in Designed Normal Years
March April May June Items
Early Middle Late Early Middle Late Early Middle Late Early Middle late
In-flow (m3/s)
1420 522 603 2492 2433 1772 947 1685 886 1926 1872 892
Discharge (m3/s)
848 848 848 2492 2433 1772 947 1685 886 1926 1872 892
July August Sept. Oct. Items
Early Middle Late Early Middle Late Early Middle Late Early Middle Late
In-flow (m3/s)
1434 521 360 2021 580 721 542 2084 1347 630 485 683
Discharge (m3/s)
772 772 772 1098 922 922 922 1160 1347 630 583 583
Nov. Dec. Jan. Feb. Items
Early Middle Late Early Middle Late Early Middle Late Early Middle Late
In-flow (m3/s)
533 631 470 375 336 325 331 534 524 447 339 367
Discharge (m3/s)
583 583 497 497 497 497 497 497 497 497 497 497
Note�The table shows the calculation results of early stage operation under normal storage at 96m.
Table 6.1 8 Flow during Peak Load Modulation in Wan'an Project
Time 1 am 2 am 3 am 4 am 5 am 6 am 7 am 8 am 9 am 10 am 11 am 12 am 3 units 130 130 130 130 130 130 130 130 130 130 130 1668 Su
mmer
4 units 130 130 130 130 130 130 130 130 130 130 130 2224
3 units 130 130 130 130 130 130 130 130 130 130 1668 130 Winter 4 units 130 130 130 130 130 130 130 130 130 130 2224 130 Time 13 pm 14 pm 15 pm 16 pm 17 pm 18 pm 19 pm 20 pm 21 pm 22 pm 23 pm 24 pm
3 units 130 130 130 130 1668 1668 130 1668 1668 1668 1668 1668 Summer 4 units 130 130 130 130 2224 2224 130 2224 2224 2224 2224 2224
3 units 130 130 130 1668 1668 1668 1668 1668 1668 1668 130 130 winter 4 units 130 130 130 2224 2224 2224 2224 2224 2224 2224 130 130
Note: in the table the unit is m3/s. (3) Runoff in design representative years at Shihutang dam site under current conditions Wan’an Project was completed in 1993, with a certain storage capacity to control 84.3% of the catchment area up to the Shihutang dam site; hence the runoff at Shihutang is subject to storage in Wan'an reservoir. Under the current conditions the representative annual runoff at Shihutang dam site is the runoff subject to impact from early stage operation in Wan’an reservoir. The said runoff in Shihutang dam site will be the result of out-flow in Wan’an reservoir after regulation therein plus the runoff from Wan’an to Shihutang. Runoff regulation is Wan’an is calculated in seasons. For detail see Table 6.1.—9.

6.0 Environment Impact Assessmen t
201
Table 6.1.—9 Annual runoff distribution at Shihutang dam site in design representative years
Items Mar Apr May June July Aug Sept Oct Nov Dec Jan Feb Whole year
1992�93 (P=10%)
4211 3335 3041 2743 2384 902 820 458 435 428 459 397 1640
1982�83 (P=25%) 1341 1343 2365 2778 977 854 787 736 807 868 1203 2029 1330
1990�91 (P=50%) 1019 2658 1378 1866 940 1188 1389 713 668 561 582 569 1130
1966�67 (P=75%) 457 1423 1180 3400 1015 544 420 403 361 368 371 630 877
1986�87 (P=90%) 1027 1623 1178 2034 828 503 392 307 355 304 272 276 758
Mean flow 1611 2076 1828 2564 1229 798 761 523 525 506 577 780 1147
Max daily mean flow
13791 10122 5962 9032 10720 3392 5346 1463 2525 1967 2946 6181 13791
In years High year High year High year Low year High year
Normal year
Normal year
Normal year Wet year Wet year Wet year Wet year High year
Min daily mean flow
212 532 360 755 287 209 216 241 242 267 208 213 208
In years Low year Low year Low year Low year Normal year
Normal year
Normal year Low year Low year Low year Wet year High
year Wet year
Note: in the table the unit is m3/s. From Table 6.1-9 it is clear that under current conditions the annual mean flow at Shihutang dam site in the five representative design years reaches 1150 m3/s, with the maximum monthly mean flow at 4211 m3/s to occur in the wet years in March, identical to flow under the natural state. Minimum monthly average flow totals 272 m3/s, to occur in dry years in January, an increase by 117 m3/s if compared with the minimum monthly flow under natural state (at 155 m3/s). Of the five design representative years, the maximum daily average flow reaches 13,791 m3/s, to occur in wet years on March 28, identical to flow under the natural state. The minimum daily mean flow totals 208 m3/s, to occur in the wet years in January 4, an increase by 84 m3/s if compared with the minimum monthly flow under natural state (at 124 m3/s). Owing to impact from early operation in Wan’an during storage, flow in dry seasons at Shihutang dam site increases a little than under natural state. (4) Typical daily flow at Shihutang dam site under current conditions The catchment area from Wan’an dam site to Shihutang dam site totals 6870 km2. Analysis indicates that the annual mean runoff from Wan’an to Shihutang dam site reaches 198 m3/s, and at the assurance rate of 90% the sectional flow is only 31.5 m3/s, or 53.9 m3/s at the assurance rate of 75%. Under the current conditions the typical daily flow at Shihutang dam site is of the discharge from the Wan’an Project plus the flow between the reach. In summer and winter Wan’an Project is of seasonal peak load modulation power plant. Analysis shows that there is limited flow in Wan’an during peak load modulation, to be exact; the flow reaches 53.9 m3/s in summer at an assurance rate of 75%, and 31.5 m3/s in winter at a assurance rate of 90%. During non-flood season in Wan’an with three or four generating units in operation the representative mean daily flow at Shihutang dam site is listed in Table 6.1—10.

6.0 Environment Impact Assessmen t
202
Table 6.1—10 Representative mean daily flow at Shihutang dam site
Time 1 am 2 am 3 am 4 am 5 am 6 am 7 am 8 am 9 am 10 am 11 am 12 am
3 units for peak load modulation
184 184 184 184 184 184 184 184 184 184 184 1722
summ
er
4 units for peak load modulation
184 184 184 184 184 184 184 184 184 184 184 2278
3 units for peak load modulation
162 162 162 162 162 162 162 162 162 162 1700 162
winter
4 units for peak load modulation
162 162 162 162 162 162 162 162 162 162 2256 162
Time 13 pm 14 pm 15 pm 16 pm 17 pm 18 pm 19 pm 20 pm 21 pm 22 pm 23 pm 24 pm 3 units for peak load modulation
184 184 184 184 1722 1722 184 1722 1722 1722 1722 1722
summ
er
4 units for peak load modulation
184 184 184 184 2278 2278 184 2278 2278 2278 2278 2278
3 units for peak load modulation
162 162 162 1700 1700 1700 1700 1700 1700 1700 162 162
winter
4 units for peak load modulation
162 162 162 2256 2256 2256 2256 2256 2256 2256 162 162
Note: in the table the unit is m3/s.
6.1.4.2 Water level at Shihutang dam site (1) Annual level for design representative years at Shihutang dam site From Table 6.1-9 on the basis of the representative years’ average monthly flow and the maximum and the minimum mean daily flow in the five design years, the water level—flow curve can be obtained, hence the representative years’ average monthly flow, the maximum and the minimum mean daily flow in the five design years are listed in Table 6.1-11.
From Table 6.1-11 it is obvious that annual mean water level at Shihutang dam site reaches 48.90 m, with the highest monthly mean level at 52.04 m in March of the wet years, identical to the condition under natural state. The minimum monthly mean water level is 47.09 m, to occur in January, an increase by 0.44m if compared with the level under natural condition. The water level difference between the highest level and the lowest reaches 4.95m, a drop by 0.44m if compared with the level under natural condition. The highest mean daily water level reaches 57.19 m to occur in wet years on March 28, identical to the condition under natural state. The lowest mean daily level is 46.87 m to occur on August 9 of design normal years and on January 4 of wet years, an increase by 0.37m if compared with the lowest water level (46.50m) under

6.0 Environment Impact Assessmen t
203
natural state. Water level variation between the highest mean daily level and the lowest amounts to 10.69 m, narrowed by 0.37 m.
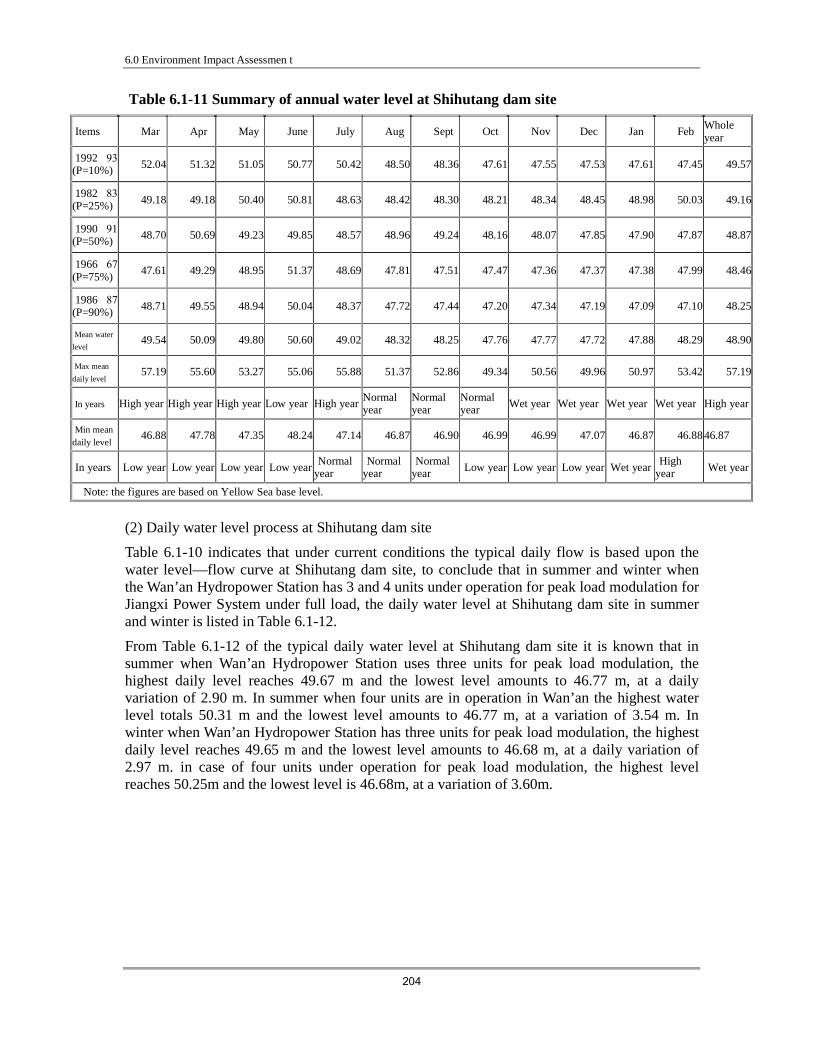
6.0 Environment Impact Assessmen t
204
Table 6.1-11 Summary of annual water level at Shihutang dam site
Items Mar Apr May June July Aug Sept Oct Nov Dec Jan Feb Whole year
1992�93 (P=10%) 52.04 51.32 51.05 50.77 50.42 48.50 48.36 47.61 47.55 47.53 47.61 47.45 49.57
1982�83 (P=25%) 49.18 49.18 50.40 50.81 48.63 48.42 48.30 48.21 48.34 48.45 48.98 50.03 49.16
1990�91 (P=50%) 48.70 50.69 49.23 49.85 48.57 48.96 49.24 48.16 48.07 47.85 47.90 47.87 48.87
1966�67 (P=75%)
47.61 49.29 48.95 51.37 48.69 47.81 47.51 47.47 47.36 47.37 47.38 47.99 48.46
1986�87 (P=90%) 48.71 49.55 48.94 50.04 48.37 47.72 47.44 47.20 47.34 47.19 47.09 47.10 48.25
Mean water
level 49.54 50.09 49.80 50.60 49.02 48.32 48.25 47.76 47.77 47.72 47.88 48.29 48.90
Max mean
daily level 57.19 55.60 53.27 55.06 55.88 51.37 52.86 49.34 50.56 49.96 50.97 53.42 57.19
In years High year High year High year Low year High year Normal year
Normal year
Normal year Wet year Wet year Wet year Wet year High year
Min mean daily level
46.88 47.78 47.35 48.24 47.14 46.87 46.90 46.99 46.99 47.07 46.87 46.88 46.87
In years Low year Low year Low year Low year Normal
year Normal
year Normal
year Low year Low year Low year Wet year High
year Wet year
Note: the figures are based on Yellow Sea base level.
(2) Daily water level process at Shihutang dam site
Table 6.1-10 indicates that under current conditions the typical daily flow is based upon the water level—flow curve at Shihutang dam site, to conclude that in summer and winter when the Wan’an Hydropower Station has 3 and 4 units under operation for peak load modulation for Jiangxi Power System under full load, the daily water level at Shihutang dam site in summer and winter is listed in Table 6.1-12.
From Table 6.1-12 of the typical daily water level at Shihutang dam site it is known that in summer when Wan’an Hydropower Station uses three units for peak load modulation, the highest daily level reaches 49.67 m and the lowest level amounts to 46.77 m, at a daily variation of 2.90 m. In summer when four units are in operation in Wan’an the highest water level totals 50.31 m and the lowest level amounts to 46.77 m, at a variation of 3.54 m. In winter when Wan’an Hydropower Station has three units for peak load modulation, the highest daily level reaches 49.65 m and the lowest level amounts to 46.68 m, at a daily variation of 2.97 m. in case of four units under operation for peak load modulation, the highest level reaches 50.25m and the lowest level is 46.68m, at a variation of 3.60m.

6.0 Environment Impact Assessmen t
205
Table 6.1—12 Typical daily water level at Shihutang dam site under current condition
Time 1 am 2 am 3 am 4 am 5 am 6 am 7 am 8 am 9 am 10 am 11 am 12 am
3 units for peak load modulation
46.77 46.77 46.77 46.77 46.77 46.77 46.77 46.77 46.77 46.77 46.77 49.67
summ
er
4 units for peak load modulation
46.77 46.77 46.77 46.77 46.77 46.77 46.77 46.77 46.77 46.77 46.77 50.31
3 units for peak load modulation
46.68 46.68 46.68 46.68 46.68 46.68 46.68 46.68 46.68 46.68 49.65 46.68
winter
4 units for peak load modulation
46.68 46.68 46.68 46.68 46.68 46.68 46.68 46.68 46.68 46.68 50.28 46.68
Time 13 pm 14 pm 15 pm 16 pm 17 pm 18 pm 19 pm 20 pm 21 pm 22 pm 23 pm 24 pm 3 units for peak load modulation
46.77 46.77 46.77 46.77 49.67 49.67 46.77 49.67 49.67 49.67 49.67 49.67
summ
er
4 units for peak load modulation
46.77 46.77 46.77 46.77 50.31 50.31 46.77 50.31 50.31 50.31 50.31 50.31
3 units for peak load modulation
46.68 46.68 46.68 49.65 49.65 49.65 49.65 49.65 49.65 49.65 46.68 46.68
winter
4 units for peak load modulation
46.68 46.68 46.68 50.28 50.28 50.28 50.28 50.28 50.28 50.28 46.68 46.68
Note: the figures are based on Yellow Sea base level. 6.1.5 Water regime in upper stream & downstream after completion of the Project 6.1.5.1 Project operation & scheduling at Shihutang Project (1) Operation & dispatching principles Shihutang Project is a comprehensive hub mainly for shipping, to be complemented from power generation. After the hub completion, in dry seasons the water level in the upper stream will be elevated due to the dam, thus to deepen the water level in the upper stream and improve navigation conditions. During non-flood seasons the stream fall will be utilized for power generation, to narrow the gap between power supply and power demand in Jiangxi Province. During the flood season greatest attention will be paid toe the dam safety and to reduction of inundation losses, to try to minimize elevation of water level in the upper stream. Hence the principle for Shihutang Project operation is that under the premise of safety for the dam and for flood control in the upper stream and satisfaction to navigation, as much power will be generated as possible, in which case dispatching will ensure that water level remains at a high level to make full use of water resources to obtain the highest benefits.

6.0 Environment Impact Assessmen t
206
(2) Dispatching mode Flood control scheduling in Shihutang will take in-flow as indicator for flood control, namely flood control will be based upon in-flow to decide the open/close state of discharge sluices and irrigation gates. In case the in-flow is over or equal to the critical flow at the sluice gates, flood control mode will commence, otherwise the Project will run in power generation mode. Specific scheduling for the operating mode is that when flow at Dongbei Station is over or equal to the critical flow (4330 m3/s, corresponding to 4700 m3/s at Shihutang dam site) and the floods are still rising while the irrigation water flow at Guanyuan is less than the critical flow (70.0 m3/s), the regulating lock at Guanyuan will be closed (meanwhile the divergence and drainage locks will be opened). Shihutang will open all the sluice gates for full discharge to lower water level in front of the dam. When the flow at Dongbei Station and Guanyuan is greater than or equal to the critical flow and the flood is still rising, or when flow at Dongbei Station is less than the critical flow but the flow at Guanyuan is more than the critical flow and the flood keeps rising, all the discharge gates in Shihutang and in Guanyuan will be opened (meanwhile the divergence and drainage locks in Guanyuan will be closed), to minimize elevation of water level in the upper stream and to reduce inundation losses. In case the flow at Dongbei and Guanyuan is less than the critical flow, the discharge sluice in Guanyuan will be closed (meanwhile the divergence and drainage locks will be opened), and the Shihutang discharge locks will be closed or partially opened, so that water level in front of the dam will maintain between normal storage (56.5m) and dead level (56.2m), to deepen navigation channels in the upper stream and improve navigation conditions. Power will be generated by use of the stream fall to relieve the tense condition of power supply in Jiangxi Province. During the low seasons power generation in River Kan Shihutang will be synchronous with Wan’an Hydropower Station to make full use of water resources. Considering downstream shipping, this hub base flow for navigation will reach 187 m3/s; corresponding output will total 15 MW. In engineering design six turbine generating units will be employed, each with an installed capacity of 19.5 kW and rated flow capacity at 420 m3/s. The said units can work under 30% of rated flow (126 m3/s). 6.1.5.2 Water regime in the upper stream of Shihutang dam site (1) Annual runoff & typical daily flow in the upper reach In the upper stream of Shihutang dam site and downstream of Taihe Project there are three tributaries into the reservoir area, of which River Guanyuan has a catchment area of 3084 km2 with annual mean flow at about 89.4 m3/s; River Yunting has a catchment area of 763 km2 with annual mean flow at about 22.1 m3/s; River Shu has a catchment area totaling 1305 km2 with average annual flow at about 37.8 m3/s. the annual mean in-flow from the three tributaries amounts to 76.1 m3/s. navigation base flow in Wan’an reaches about 130 m3/s, in Taihe about 135 m3/s. Completion of the Shihutang Project will not change the water regime in the upper stream, hence the annual mean runoff and daily mean flow at Shihutang dam site remains the same after operation of the project. See Table 6.1—9 and Table 6.1—10. (2) Annual water level & daily water level at Shihutang dam site In line with operation scheduling in Shihutang Project, during the flood seasons the reservoir will be under natural operation (flow at the dam site exceeds 4700 m3/s), hence in the upstream there is limited elevation of water level. But during non-flood seasons(flow at the dam site is less than 4700 m3/s), the sluice gates shall be closed which will elevate water level in the upper stream and will canalize fairways in the upper stream and thus to improve navigation conditions. Meanwhile the elevated water level will be utilized for power generation, to relieve power shortage in Jiangxi Province. In accordance with the Shihutang scheduling mode, on the

6.0 Environment Impact Assessmen t
207
basis of fiver representative year’s runoff, the typical water level in Shihutang is listed in Table 6.1-13. in summer and winter when the Wan’an Hydropower Station has three or four generating units for peak load modulation and Shihutang Project has four or five units for synchronous peak load modulation, the typical water level in upper stream of Shihutang, on the basis of representative daily runoff, is shown in Table 6.1—14. Table 6.1—13 Summary of design representative years’ water level in upper stream after completion of Shihutang Project
Items Mar Apr May June July Aug Sept Oct Nov Dec Jan Feb Whole year
1992�93 (P=10%)
56.06 56.06 55.85 55.97 55.68 56.35 56.35 56.35 56.35 56.35 56.35 56.35 56.17
1982�83 (P=25%)
56.35 56.35 56.35 55.36 56.35 56.12 56.35 56.35 56.10 56.35 56.35 55.96 56.20
1990�91 (P=50%)
56.14 55.85 56.35 56.13 55.95 55.90 56.03 56.35 56.35 56.35 56.35 56.35 56.17
1966�67 (P=75%)
56.35 56.35 56.35 55.81 56.16 56.35 56.35 56.35 56.35 56.35 56.35 56.35 56.29
1986�87 (P=90%)
56.23 56.23 56.35 55.94 55.34 56.35 56.35 56.35 56.35 56.35 56.35 56.35 56.21
Mean level 56.23 56.17 56.25 55.84 55.90 56.21 56.29 56.35 56.30 56.35 56.35 56.27 56.21
Max daily
level 57.31 56.50 56.50 56.50 56.50 56.50 56.50 56.50 56.50 56.50 56.50 56.50 57.31
In years
high year
Every year
Every year
Every year
Every year
Every year
Every year
Every year
Every year
Every year
Every year
Every year
high year
Min daily
level 49.71 50.67 51.27 49.78 48.39 48.48 50.12 56.20 48.75 56.20 56.20 51.25 48.39
In years Normal year
Normal year
high year
Normal year
Low year
Normal year
Normal year
Every year
Wet year
Every year
Every year
Wet year
Low year
Note: the figures are in meters.
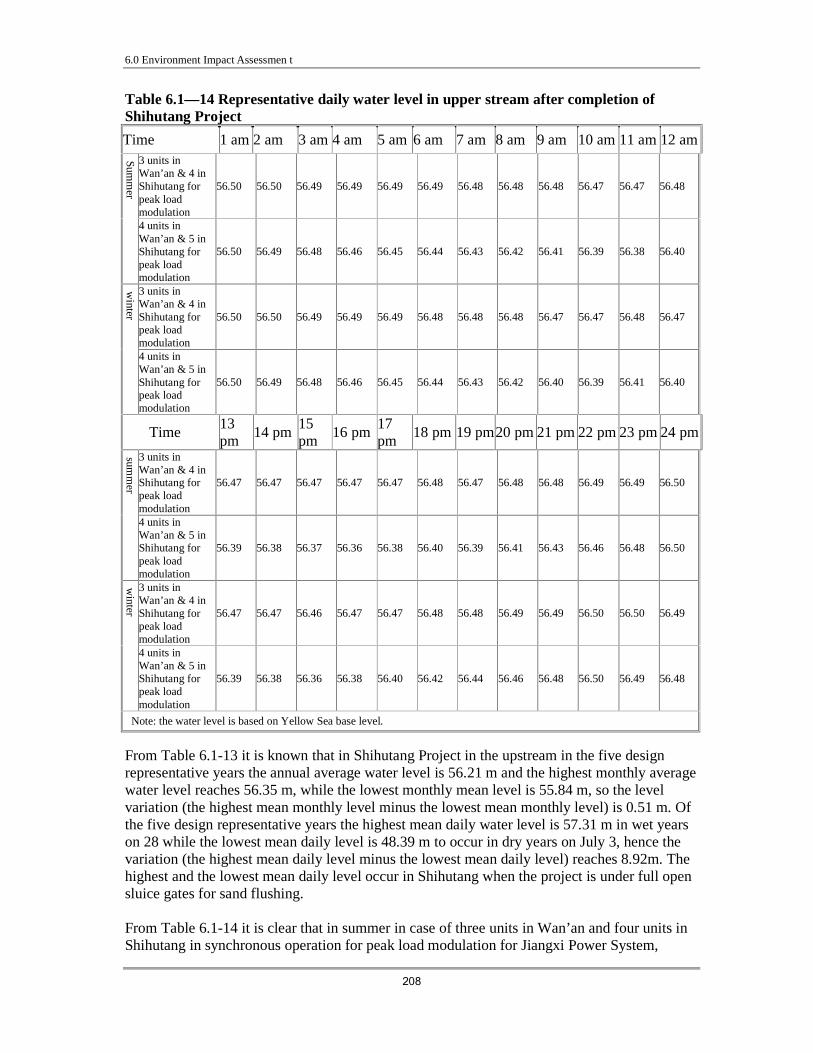
6.0 Environment Impact Assessmen t
208
Table 6.1—14 Representative daily water level in upper stream after completion of Shihutang Project
Time 1 am 2 am 3 am 4 am 5 am 6 am 7 am 8 am 9 am 10 am 11 am 12 am 3 units in Wan’an & 4 in Shihutang for peak load modulation
56.50 56.50 56.49 56.49 56.49 56.49 56.48 56.48 56.48 56.47 56.47 56.48
Summ
er
4 units in Wan’an & 5 in Shihutang for peak load modulation
56.50 56.49 56.48 56.46 56.45 56.44 56.43 56.42 56.41 56.39 56.38 56.40
3 units in Wan’an & 4 in Shihutang for peak load modulation
56.50 56.50 56.49 56.49 56.49 56.48 56.48 56.48 56.47 56.47 56.48 56.47
winter
4 units in Wan’an & 5 in Shihutang for peak load modulation
56.50 56.49 56.48 56.46 56.45 56.44 56.43 56.42 56.40 56.39 56.41 56.40
Time 13 pm
14 pm 15 pm
16 pm 17 pm
18 pm 19 pm 20 pm 21 pm 22 pm 23 pm 24 pm
3 units in Wan’an & 4 in Shihutang for peak load modulation
56.47 56.47 56.47 56.47 56.47 56.48 56.47 56.48 56.48 56.49 56.49 56.50
summ
er
4 units in Wan’an & 5 in Shihutang for peak load modulation
56.39 56.38 56.37 56.36 56.38 56.40 56.39 56.41 56.43 56.46 56.48 56.50
3 units in Wan’an & 4 in Shihutang for peak load modulation
56.47 56.47 56.46 56.47 56.47 56.48 56.48 56.49 56.49 56.50 56.50 56.49
winter
4 units in Wan’an & 5 in Shihutang for peak load modulation
56.39 56.38 56.36 56.38 56.40 56.42 56.44 56.46 56.48 56.50 56.49 56.48
Note: the water level is based on Yellow Sea base level.
From Table 6.1-13 it is known that in Shihutang Project in the upstream in the five design representative years the annual average water level is 56.21 m and the highest monthly average water level reaches 56.35 m, while the lowest monthly mean level is 55.84 m, so the level variation (the highest mean monthly level minus the lowest mean monthly level) is 0.51 m. Of the five design representative years the highest mean daily water level is 57.31 m in wet years on 28 while the lowest mean daily level is 48.39 m to occur in dry years on July 3, hence the variation (the highest mean daily level minus the lowest mean daily level) reaches 8.92m. The highest and the lowest mean daily level occur in Shihutang when the project is under full open sluice gates for sand flushing. From Table 6.1-14 it is clear that in summer in case of three units in Wan’an and four units in Shihutang in synchronous operation for peak load modulation for Jiangxi Power System,

6.0 Environment Impact Assessmen t
209
during the typical non-flood period on the upper stream the highest level goes to 56.50 m and the lowest level is 56.47 m, at a daily variation of only 0.03 m; in summer in case of four units in Wan’an and five units in Shihutang in synchronous operation for peak load modulation for Jiangxi Power System, during the typical non-flood period on the upper stream the highest level reaches 56.50 m, and the lowest water level is 56.36 m, at a daily variation of only 0.14 m. In winter in case of three units in Wan’an and four units in Shihutang in synchronous operation for peak load modulation for Jiangxi Power System, during the typical non-flood period on the upper stream the highest level goes to 56.50 m and the lowest level is 56.46 m, at a daily variation of only 0.04 m; in winter in case of four units in Wan’an and five units in Shihutang in synchronous operation for peak load modulation for Jiangxi Power System, during the typical non-flood period on the upper stream the highest level reaches 56.50 m, and the lowest water level is 56.36 m, at a daily variation of only 0.14 m. 6.1.5.3 Water regime in downstream of Shihutang dam site �1�Design representative years’ runoff & water level at Shihutang dam site Between Shihutang dam site downstream and Ji'an City there are two tributaries flowing into the reservoir area, of which River He has a catchment area 9058 km2, with mean annual flow at about262 m3/s; River Gu has a catchment area of 3084 km2 with mean annual flow at 89.4 m3/s. the two tributaries contribute mean annual flow to River Kan at about 351.4 m3/s. The Shihutang Project has a base navigation flow at 187 m3/s. As this project is runoff development, there is limited effective storage, to produce almost no regulation upon the runoff. Analysis shows that it will take about 2 hours for the discharge from Wan’an to reach Shihutang dam, thus there will be no peak load modulation for Jiangxi Power System unless Wan’an is operated synchronously with Shihutang Project. In other words, Shihutang generates electricity on the basis of the discharged flow from Wan’an plus runoff between the two projects. To ensure that in Shihutang Project the discharged base flow for navigation is equivalent to 187 m3/s, the balance shall be achieved by water from the Shihutang reservoir (76.1 m3/s) when flow from Wan’an (130 m3/s) is not enough to meet the need for base navigation flow. Therefore, at Shihutang downstream the design representative years’ mean annual flow and mean monthly flow and mean annual/monthly water level is identical to the annual runoff and water level under current conditions. See Table 6.1-9 and Table 6.1-11. (2) Typical daily flow & water level at Shihutang dam site downstream Shihutang Project is different from Wan’an in base shipping flow and installed generating units, therefore in case of peak load modulation and guarantee of downstream shipping requirements, Shihutang differs from Wan’an in daily distribution of power generation. Through analysis of operation in summer and winter in case of three units for peak load modulation in Wan’an and four units in Shihutang under full load, or four units in Wan’an and five units in Shihutang concerning typical daily runoff, the results is shown in Table 6.1-15 and Table 6.1-16 concerning daily runoff and water level in downstream Shihutang dam.

6.0 Environment Impact Assessmen t
210
Table 6.1—15 Typical daily flow at downstream Shihutang dam site after completion of the project
Time 1 am 2 am 3 am 4 am 5 am 6 am 7 am 8 am 9 am 10 am 11 am 12 am 3 units in Wan’an & 4 in Shihutang for peak load modulation
206 206 206 206 206 206 206 206 206 206 206 1680
Summ
er
4 units in Wan’an & 5 in Shihutang for peak load modulation
279 279 279 279 279 279 279 279 279 279 279 2100
3 units in Wan’an & 4 in Shihutang for peak load modulation
187 187 187 187 187 187 187 187 187 187 1658 187
winter
4 units in Wan’an & 5 in Shihutang for peak load modulation
257 257 257 257 257 257 257 257 257 257 2100 257
Time 13 pm 14 pm 15
pm 16 pm 17 pm 18 pm 19 pm 20 pm 21 pm 22 pm 23 pm 24 pm
3 units in Wan’an & 4 in Shihutang for peak load modulation
206 206 206 206 1680 1680 206 1680 1680 1680 1680 1680
summ
er
4 units in Wan’an & 5 in Shihutang for peak load modulation
279 279 279 279 2100 2100 279 2100 2100 2100 2100 2100
3 units in Wan’an & 4 in Shihutang for peak load modulation
187 187 187 1658 1658 1658 1658 1658 1658 1658 187 187
Winter
4 units in Wan’an & 5 in Shihutang for peak load modulation
257 257 257 2100 2100 2100 2100 2100 2100 2100 257 257
Note: the unit is m3/s.

6.0 Environment Impact Assessmen t
211
Table 6.1—16 Typical daily water flow at downstream Shihutang dam site after completion of the project
Time 1 am 2 am 3 am 4 am 5 am 6 am 7 am 8 am 9 am 10 am 11 am 12 am 3 units in Wan’an & 4 in Shihutang for peak load modulation
46.86 46.86 46.86 46.86 46.86 46.86 46.86 46.86 46.86 46.86 46.86 49.62
Summ
er
4 units in Wan’an & 5 in Shihutang for peak load modulation
47.11 47.11 47.11 47.11 47.11 47.11 47.11 47.11 47.11 47.11 47.11 50.11
3 units in Wan’an & 4 in Shihutang for peak load modulation
46.78 46.78 46.78 46.78 46.78 46.78 46.78 46.78 46.78 46.78 49.59 46.78
winter
4 units in Wan’an & 5 in Shihutang for peak load modulation
47.04 47.04 47.04 47.04 47.04 47.04 47.04 47.04 47.04 47.04 50.11 47.04
Time 14 pm 15 pm 16 pm 17
pm 18 pm 19 pm 20 pm 21 pm 22 pm 23 pm 24 pm
3 units in Wan’an & 4 in Shihutang for peak load modulation
46.86 46.86 46.86 46.86 49.62 49.62 46.86 49.62 49.62 49.62 49.62 49.62
summ
er
4 units in Wan’an & 5 in Shihutang for peak load modulation
47.11 47.11 47.11 47.11 50.11 50.11 47.11 50.11 50.11 50.11 50.11 50.11
3 units in Wan’an & 4 in Shihutang for peak load modulation
46.78 46.78 46.78 49.59 49.59 49.59 49.59 49.59 49.59 49.59 46.78 46.78
Winter
4 units in Wan’an & 5 in Shihutang for peak load modulation
47.04 47.04 47.04 50.11 50.11 50.11 50.11 50.11 50.11 50.11 47.04 47.04
Note: the water level is based on Yellow Sea base level.
From Table 6.1-15 it is known that in summer in case there are three units in Wan’an for peak load modulation and four units in Wan’an and Shihutang under synchronous operation for peak load modulation, during non-flood seasons the typical maximum daily flow reaches 1680 m3/s, and the minimum flow is 206 m3/s; in summer in case there are four units in Wan’an for peak load modulation and five units in Wan’an and Shihutang under synchronous operation for peak load modulation, during non-flood seasons the typical maximum daily flow downstream reaches 2100 m3/s, and the minimum flow is 279 m3/s. In winter in case there are three units in Wan’an for peak load modulation and four units in Wan’an and Shihutang under synchronous operation for peak load modulation, during non-flood seasons the typical maximum daily flow in downstream reaches 1658 m3/s, and the minimum flow is 187 m3/s; In winter in case there are four units in Wan’an for peak load modulation and five units in Wan’an and Shihutang under synchronous operation for peak load modulation, during non-flood seasons the typical maximum daily flow in downstream reaches 2100 m3/s, and the minimum flow is 257 m3/s.

6.0 Environment Impact Assessmen t
212
From Table 6.1-16 it is known that in summer in case there are three units in Wan’an for peak load modulation and four units in Wan’an and Shihutang under synchronous operation for peak load modulation, during non-flood seasons the typical highest daily water level reaches 49.62m, and the lowest level is 46.86; in summer in case there are four units in Wan’an for peak load modulation and five units in Wan’an and Shihutang under synchronous operation for peak load modulation, during non-flood seasons the typical highest water level reaches 50.11m, and the lowest level is 47.11m. In winter in case there are three units in Wan’an for peak load modulation and four units in Wan’an and Shihutang under synchronous operation for peak load modulation, during non-flood seasons the typical highest daily water level reaches 49.59m, and the lowest level is 46.78; in winter in case there are four units in Wan’an for peak load modulation and five units in Wan’an and Shihutang under synchronous operation for peak load modulation, during non-flood seasons the typical highest water level reaches 50.11m, and the lowest level is 47.04m. 6.1.6 Change in water regime after completion of the project 6.1.6.1 Change in water regime in upper stream after completion of the project (1) Change in upper stream flow after completion of the project Any water-control project can not change the upper stream runoff allocation, so is the Shihutang Project, which, when completed, will have the same upstream runoff as it is at present. In other words, there is no change in the upper stream flow after completion of the project. (2) Change in upper stream water level after completion of the project As the Shihutang Project will construct in the main stream of River Kan a river dam for storage during non-flood seasons for effective storage, thus the water level will be under elevation after completion of the Shihutang project. � Change in upper stream water level during flood seasons During the flood seasons the banked-up water level at Shihutang dam site before completion of the project is listed in Table 6.1-17; T able 6.1—18 shows the change in banked-up water level after completion of the project. Table 6.1—17 Banked-up water level before completion of Shihutang Project during flood seasons

6.0 Environment Impact Assessmen t
213
Items Unit P=0.33% P=0.5% P=1% P=2% P=3.3% P=5% P=10% P=20% P=50%
Design peak discharge
m3/s 23620 22670 20890 19240 18400 16990 14750 11420 8720
Water level downstream
·m 60.54 60.25 59.70 59.16 58.88 58.39 57.56 56.19 54.89
Dam water level
·m 60.65 60.39 59.82 59.34 59.04 58.53 57.64 56.27 54.96
Max. discharge
m3/s 23120 22300 20560 19140 18300 16870 14550 11330 8680
Corresponding downstream level
·m 60.39 60.14 59.59 59.13 58.84 58.34 57.48 56.15 54.87
Water head between upper stream & downstream
m 0.26 0.24 0.23 0.21 0.20 0.19 0.16 0.12 0.09
Banked-up level
m 0.11 0.13 0.12 0.18 0.16 0.14 0.08 0.08 0.07
Gradual consideration of protected zones No consideration of protected zones
Notes The table is based on storage impact from Wan’an Project during its early operation and in line with the
1968 design flood process in Shihutang dam site after flood routing.
Table 6.1—18 Results of water surface line in River Kan during flood seasons in Shihutang Project
Design water level (Yellow Sea base level/·m)
Water surface line now Water surface line after completion
Elevated value after project completion (m) Section
No. Location
Distance from dam site (km) P=5% P=10% P=50% P=5% P=10% P=50% P=5% P=10% P=50%
upper dam
Jiangjiaou 0.00 58.39 57.56 54.89 58.53 57.64 54.96 0.14 0.08 0.07
Shigan CS4
Yinjiajiang 2.04 58.69 57.86 55.22 58.87 57.99 55.32 0.18 0.13 0.10

6.0 Environment Impact Assessmen t
214
Shigan S5
Gaozhang 4.00 59.01 58.16 55.48 59.19 58.31 55.59 0.18 0.15 0.11
Shigan CS+1
Zhangjia 5.00 59.15 58.32 55.67 59.35 58.49 55.79 0.20 0.17 0.12
Shigan CS6
Sunjia 6.13 59.31 58.50 55.88 59.52 58.67 56.02 0.21 0.17 0.14
Shigan CS+2
Xinzhou 7.53 59.52 58.72 56.17 59.73 58.91 56.33 0.21 0.19 0.16
Shigan CS7
Zhushan 9.16 59.74 58.98 56.52 59.96 59.18 56.68 0.22 0.20 0.16
Shigan CS8
Huangken 11.11 60.03 59.33 56.96 60.24 59.52 57.10 0.21 0.19 0.14
Shigan CS9
Xinju 13.87 60.47 59.79 57.51 60.66 59.98 57.67 0.19 0.19 0.16
Shigan CS+3
Yanxidu 15.32 60.72 60.03 57.80 60.90 60.23 57.94 0.18 0.20 0.14
Shigan CS10
Kangjiahu 16.32 60.88 60.20 57.99 61.07 60.40 58.13 0.19 0.20 0.14
Shigan CS11
Pengxia 18.86 61.28 60.65 58.31 61.48 60.85 58.47 0.20 0.20 0.16
Shigan CS12
Xiazou 21.56 61.79 61.20 59.00 61.99 61.40 59.17 0.20 0.20 0.17
Shigan CS13
Yunchang
24.24 62.24 61.65 59.50 62.44 61.85 59.66 0.20 0.20 0.16
Shigan CS14
Gaochen 27.54 82 62.20 60.00 63.05 62.44 60.17 0.23 0.24 0.17
Shigan CS15
Zoutou 30.44 63.50 62.87 60.51 63.67 63.06 60.67 0.17 0.19 0.16
In accordance with Shihutang operation and scheduling rules, in the flood period (the upstream in-flow is greater than or equivalent to critical flow), Shihutang will have all the flood gates opened for flushing and discharge, to try to avoid banked-up water level in the upper stream, thus there is limited elevation of water level during flood seasons. Flood routing shows that during flood seasons after completion of Shihutang Project in case of P = 50% or P = 0.33%, banked-up water level before the Shihutang dam is only 0.07m to 0.18 m, very limited. After comparison of the water surface line before the Shihutang Project and after completion of the Project, there is not much change in elevation of water level. From Table 6.1-18 it is known that in case of flood P = 50% to P = 5% the elevated water level ranges from 0.05m to 0.24 m. � Change in water level in upper stream in Shihutang dam site during non-flood seasons For detail of elevated water level in the upper stream after completion of the project see Table 6.1—19. Table 6.1—19 Elevated water level in upper stream after completion of the Shihutang Project compared with the level at present
Item Mar Apr May June July Aug Sept Oct Nov Dec Jan Feb Whole year
1992�93 (P=10%) 4.02 4.74 4.80 5.20 5.26 7.85 7.99 8.74 8.80 8.82 8.74 8.90 6.60
1982�83 (P=25%) 7.17 7.17 5.95 4.55 7.72 7.70 8.05 8.14 7.76 7.90 7.37 5.93 7.04

6.0 Environment Impact Assessmen t
215
1990�91 (P=50%) 7.44 5.16 7.12 6.28 7.38 6.94 6.79 8.19 8.28 8.50 8.45 8.48 7.30
1966�67 (P=75%) 8.74 7.06 7.40 4.44 7.47 8.54 8.84 8.88 8.99 8.98 8.97 8.36 7.83
1986�87 (P=90%)
7.52 6.68 7.41 5.90 6.97 8.63 8.91 9.15 9.01 9.16 9.26 9.25 7.96
Mean level
6.69 6.08 6.45 5.24 6.88 7.89 8.04 8.59 8.53 8.63 8.47 7.98 7.31
Highest mean daily
0.12 0.90 3.23 1.44 0.62 5.13 3.64 7.16 5.94 6.54 5.53 3.08 0.12
Lowest mean daily
2.83 2.89 3.92 1.54 1.25 1.61 3.22 9.21 1.76 9.13 9.33 4.37 1.52
Note: the figures show the elevated level at meters.
From Table 6.1—13 Summary of design representative years’ water level in upper stream after completion of Shihutang Project and from Table 6.1—11 Summary of annual water level at Shihutang dam site it is known that of the five representative years the mean monthly water level is raised from 48.90m to 56.21m, by 7.31m; the highest monthly water level is elevated from 52.04m to 56.35m, by 4.31m; the lowest mean monthly level is raised from 47.09m to 55.34m, by 8.25m. Of the fiver representative years the highest daily water level rises from 57.19m to 57.31m, by only 0.12m; the lowest mean daily level is raised from 46.87m to 48.39m, by 1.52m. The monthly variation in water level between the highest and the lowest monthly mean water level under current conditions reaches 4.95m, while after completion of Shihutang Project the monthly level variation will be reduced to 1.01m, by 3.94m. The daily water level variation between the highest and the lowest daily mean water level under current conditions reaches 10.32m, while after completion of Shihutang Project the daily mean level variation will be reduced to 8.92m, by 1.40m. For detail of variation in water level at different time of a day before and after construction of Shihutang Project see Table 6.1—20.
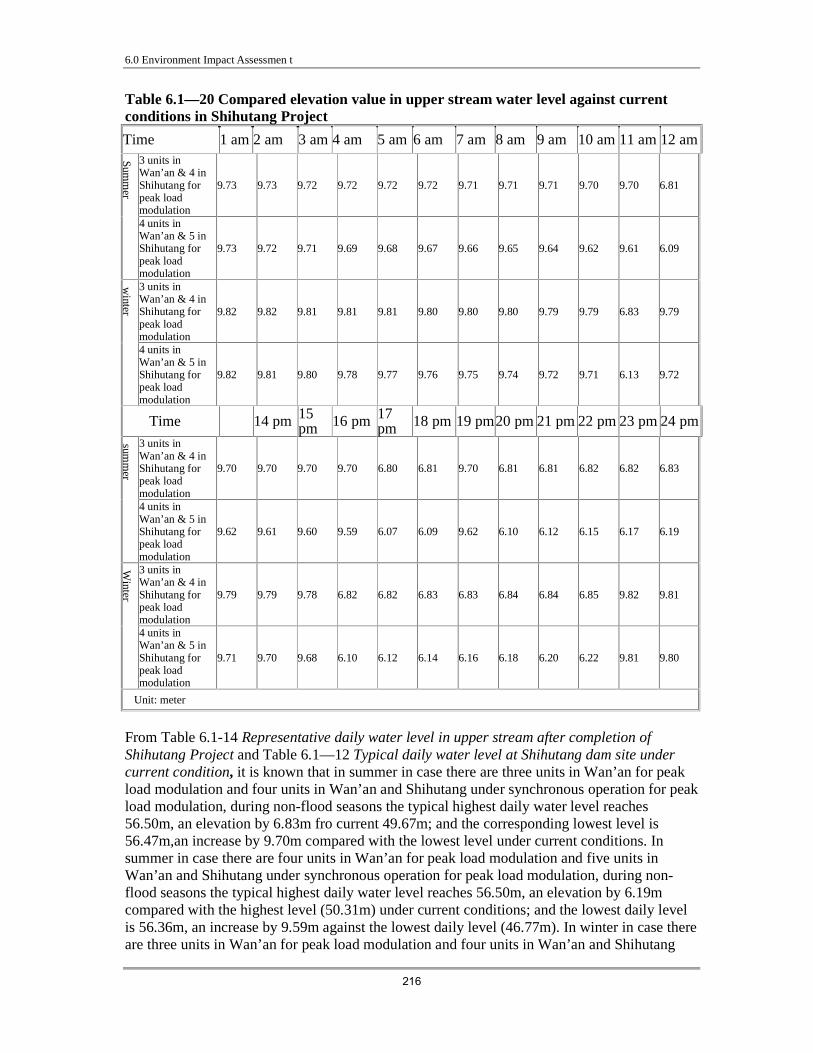
6.0 Environment Impact Assessmen t
216
Table 6.1—20 Compared elevation value in upper stream water level against current conditions in Shihutang Project
Time 1 am 2 am 3 am 4 am 5 am 6 am 7 am 8 am 9 am 10 am 11 am 12 am 3 units in Wan’an & 4 in Shihutang for peak load modulation
9.73 9.73 9.72 9.72 9.72 9.72 9.71 9.71 9.71 9.70 9.70 6.81
Summ
er
4 units in Wan’an & 5 in Shihutang for peak load modulation
9.73 9.72 9.71 9.69 9.68 9.67 9.66 9.65 9.64 9.62 9.61 6.09
3 units in Wan’an & 4 in Shihutang for peak load modulation
9.82 9.82 9.81 9.81 9.81 9.80 9.80 9.80 9.79 9.79 6.83 9.79
winter
4 units in Wan’an & 5 in Shihutang for peak load modulation
9.82 9.81 9.80 9.78 9.77 9.76 9.75 9.74 9.72 9.71 6.13 9.72
Time 14 pm 15 pm 16 pm 17
pm 18 pm 19 pm 20 pm 21 pm 22 pm 23 pm 24 pm
3 units in Wan’an & 4 in Shihutang for peak load modulation
9.70 9.70 9.70 9.70 6.80 6.81 9.70 6.81 6.81 6.82 6.82 6.83
summ
er
4 units in Wan’an & 5 in Shihutang for peak load modulation
9.62 9.61 9.60 9.59 6.07 6.09 9.62 6.10 6.12 6.15 6.17 6.19
3 units in Wan’an & 4 in Shihutang for peak load modulation
9.79 9.79 9.78 6.82 6.82 6.83 6.83 6.84 6.84 6.85 9.82 9.81
Winter
4 units in Wan’an & 5 in Shihutang for peak load modulation
9.71 9.70 9.68 6.10 6.12 6.14 6.16 6.18 6.20 6.22 9.81 9.80
Unit: meter
From Table 6.1-14 Representative daily water level in upper stream after completion of Shihutang Project and Table 6.1—12 Typical daily water level at Shihutang dam site under current condition, it is known that in summer in case there are three units in Wan’an for peak load modulation and four units in Wan’an and Shihutang under synchronous operation for peak load modulation, during non-flood seasons the typical highest daily water level reaches 56.50m, an elevation by 6.83m fro current 49.67m; and the corresponding lowest level is 56.47m,an increase by 9.70m compared with the lowest level under current conditions. In summer in case there are four units in Wan’an for peak load modulation and five units in Wan’an and Shihutang under synchronous operation for peak load modulation, during non-flood seasons the typical highest daily water level reaches 56.50m, an elevation by 6.19m compared with the highest level (50.31m) under current conditions; and the lowest daily level is 56.36m, an increase by 9.59m against the lowest daily level (46.77m). In winter in case there are three units in Wan’an for peak load modulation and four units in Wan’an and Shihutang

6.0 Environment Impact Assessmen t
217
under synchronous operation for peak load modulation, during non-flood seasons the typical highest daily water level reaches 56.50mm, rising by 6.85m against the current highest level at 49.65m; and the lowest level is 56.46m, an elevation by 9.78m against the current lowest level at 46.68m. In winter in case there are four units in Wan’an for peak load modulation and five units in Wan’an and Shihutang under synchronous operation for peak load modulation, during non-flood seasons the typical highest daily water level reaches 56.50m, an elevation by 6.22m against the current highest level at 50.28m; and the lowest daily level reaches 56.36m, a rise by 9.58m against current lowest level at 46.78m. Under current conditions the level variation between the highest and the lowest level ranges from 2.9m to 3.6m, which will change to 0.0m to 0.14m after completion of the Shihutang Project. During non-flood seasons when there are three or four units in Wan’an for peak load modulation and four or five units in Wan’an and Shihutang under synchronous operation for peak load modulation, analysis based on current water curve line indicates that due to banked-up water level for sand flushing and irrigation, there will be considerable increase in water level elevation. For detail see Table 6.1—21 and Figure 6.1—3.
)LJXUH������ Water line change in upper stream in Shihutang before/after the project
44
46
48
50
52
54
56
58
60
62
0 2 4 6 8 10 12 14 16 18 20 22 24 26 28 30 32 34 36 38 40 42
'LVWDQFH�IURP�GDP�VLWH� km
Water level /E
l
·
���P��V�ZDWHU�OLQH ����P��V�ZDWHU�OLQH�DW�JDWH�ORFNLQJ�����P��V�ZDWHU�OLQH �����P��V�ZDWHU�OLQH�DW�JDWH�
ORFNLQJ �����P��V�ZDWHU�OLQH������P��V�ZDWHU�OLQH�DW�JDWH�ORFNLQJ Bottom line

6.0 Environment Impact Assessmen t
218
Table 6.1 21 Design water line in main stream in River Kan during non-flood period in
Shihutang Project
Design water level (Yellow Sea base level·/m) Water line after
project
Elevated water line after project completion(m) Section No Location
Distance from the dam site (km)
Present Water line Sluice
closed Sluice
opened Sluice
opened Sluice
closed Upper dam site Jiangjiazhou 0.00 52.40 52.46 56.50 0.06 4.10
ShiganCS4 Yinxiajiang 2.04 52.75 52.80 56.56 0.05 3.81
ShiganCS5 Gaozhang 4.00 53.04 53.08 56.63 0.04 3.59
ShiganCS+1 Zhangjia 5.00 53.23 53.27 56.67 0.04 3.44
ShiganCS6 Sunjia 6.13 53.43 53.46 56.72 0.03 3.29
ShiganCS+2 Xinzou 7.53 53.72 53.75 56.86 0.03 3.14
ShiganCS7 Zushan 9.16 54.05 54.07 57.02 0.02 2.97
ShiganCS8 Huangken 11.11 54.46 54.48 57.19 0.02 2.73
ShiganCS9 Xinju 13.87 55.13 55.15 57.36 0.02 2.23
ShiganCS+3 Yanxidu 15.32 55.44 55.45 57.45 0.01 2.01
ShiganCS10 Kangjiahu 16.32 55.66 55.67 57.52 0.01 1.86
ShiganCS11 Pengxia 18.86 56.00 56.01 57.68 0.01 1.68
ShiganCS12 Xiazou 21.56 56.63 56.64 58.04 0.01 1.41
ShiganCS13 Yongchang 24.24 57.28 57.29 58.37 0.01 1.09
ShiganCS14 Gaocheng 27.54 57.88 57.88 58.72 0.00 0.84
ShiganCS15 Zhoutou 30.44 58.31 58.31 59.00 0.00 0.69
ShiganCS16 Sukouzou 33.34 58.91 58.91 59.40 0.00 0.49
ShiganCS17 Pengzili 35.84 59.63 59.63 59.96 0.00 0.33
ShiganCS18 Guojia 38.19 60.27 60.27 60.51 0.00 0.24
ShiganCS19 Chengzou 40.84 60.95 60.95 61.08 0.00 0.13
Note: the water level in the table refers to the level in each location in the upper stream at the critical flow of 4700m3/s for sluice lock.
(3) Change in flow rate in the upper stream after completion of the Shihutang Project Such four sections as follows will serve as representative sections for calculation of flow rate in Shihutang Projects, as shown in Table 6.1—22 and 6.1—23:
(a) Shigan CS4 (located in the main stream of River Ken, about 2.04km in upstream, closest to the dam site). This section will suffer from the highest elevated level after completion of Shihutang Project;

6.0 Environment Impact Assessmen t
219
(b) Shigan CS8: located in the main stream of River Kan, about 11.11km in the upstream, the section to suffer from the largest change in discharge section before and after the completion of the Shihutang project;
(c) Shigan CS11: located in the main stream of River Kan, about 18.86km in upper
stream from the dam site. This section will suffer from the largest change in elevated water level before and after completion of Shihutang project;
(d) Shigan CS14: located in the main stream of River Kan, about 27.54km in the
upstream. This section suffers from almost no change in elevated water level after completion of Shihutang project.

6.0 Environment Impact Assessmen t
220
Table 6.1 22 Change in flow rate before/after construction of Shihutang Project in
representative sections in upper stream
Design level (m)
Discharge area (m2)
Mean flow rate in section (m/s)
Section Names
Section Location
Design frequency
(%)
Design flow
(m
3/s)
Com
pletion of flood bank
Com
pletion of dam
Com
pletion of flood bank
After
completion
Additional cross section
by percentage
Com
pletion of flood bank
Com
pletion of dam
Increase in flow rate by
percentage
3.3 18400 59.25 59.40 6427 6517 1.40 2.86 2.82 -1.38 5 16990 58.75 58.87 6129 6200 1.16 2.77 2.74 -1.15 10 14750 57.92 57.99 5645 5685 0.71 2.61 2.59 -0.70 20 11420 56.57 56.63 4892 4925 0.67 2.33 2.32 -0.67 50 8720 55.27 55.32 4199 4225 0.62 2.08 2.06 -0.62 critical value for sluice lock
4700 52.75 56.56 2951 4887 65.60 1.59 0.96 -39.62
Shigan CS4
Shihutang Upper stream from dam site 2.04km
Annual mean value
1150 49.12 56.50 1300 4854 273.38 0.88 0.24 -73.22
3.3 18400 60.61 60.68 6629 6673 0.66 2.78 2.76 -0.66 5 16990 60.18 60.24 6357 6395 0.60 2.67 2.66 -0.59 10 14750 59.49 59.52 5924 5942 0.30 2.49 2.48 -0.30 20 11420 58.32 58.35 5204 5222 0.35 2.19 2.19 -0.34 50 8720 57.08 57.10 4478 4490 0.27 1.95 1.94 -0.27 critical value for sluice lock
4700 54.46 57.19 2978 4542 52.52 1.58 1.03 -34.43
ShiganCS8
Shihutang Upper stream from dam site 11.11km
Annual mean value
1150 51.21 56.53 1188 4160 250.17 0.97 0.28 -71.44
3.3 18400 61.83 61.86 6153 6173 0.33 2.99 2.98 -0.32 5 16990 61.45 61.48 5912 5931 0.32 2.87 2.86 -0.32 10 14750 60.84 60.85 5530 5536 0.11 2.67 2.66 -0.11 20 11420 59.70 59.72 4836 4848 0.25 2.36 2.36 -0.25 50 8720 58.46 58.47 4111 4116 0.12 2.12 2.12 -0.12 critical value for sluice lock
4700 56.00 57.68 2834 3670 29.50 1.66 1.28 -22.78
ShiganCS11
Shihutang Upper stream from dam site 18.86km
Annual mean value
1150 52.52 56.56 1368 3089 125.80 0.84 0.37 -55.71
3.3 18400 63.39 63.41 7827 7844 0.22 2.35 2.35 -0.22 5 16990 63.04 63.05 7525 7534 0.12 2.26 2.26 -0.12 10 14750 62.43 62.44 7001 7009 0.11 2.11 2.10 -0.11 20 11420 61.35 61.36 6076 6085 0.15 1.88 1.88 -0.15 50 8720 60.17 60.17 5111 5111 0.00 1.71 1.71 0.00 critical value for sluice lock
4700 57.88 58.72 3530 4097 16.06 1.33 1.15 -13.84
ShiganCS14
Shihutang Upper stream from dam site 27.54km
Annual mean value
1150 54.38 56.67 1227 2728 122.33 0.94 0.42 -55.02
Remarks: Shigan CS4 is closet to the dam site. This cross section in elevated water level will be closest to water level before construction of Shihutang and after completion of the project.
Shigan CS8: this cross section will see greatest change in discharge section after completion of Shihutang Project.
Shigan CS11: this cross section will witness highest elevated water level after completion of Shihutang Project. Shigan CS14: there will be almost no change in elevated water level after completion of Shihutang Project and
completion of flood bank.

6.0 Environment Impact Assessmen t
221
Table 6.1 23 Comparison of mean flow rate in Upper stream representative cross
sections
Design level (m)
Discharge area (m2)
Mean flow rate in section (m/s)
Section Names
Section Location
Design frequency
(%)
Design flow
(m
3/s)
Current
condition
Com
pletion of dam
/sluices
Current
condition
Com
pletion of dam
/sluices
Additional cross
section by percentage
Current
condition
Com
pletion of dam
/sluices
Increase in flow rate by
percentage
3.3 18400 59.21 59.40 6403 6517 1.78 2.87 2.82 -1.75 5 16990 58.69 58.87 6093 6200 1.76 2.79 2.74 -1.73 10 14750 57.86 57.99 5611 5685 1.32 2.63 2.59 -1.30 20 11420 56.52 56.63 4866 4925 1.21 2.35 2.32 -1.20 50 8720 55.22 55.32 4173 4225 1.25 2.09 2.06 -1.23 critical value for sluice lock 4700 52.75 56.56 2951 4887 65.60 1.59 0.96 -39.62
ShiganCS4
Shihutang Upper stream from dam site 2.04km
Annual mean value 1150 49.12 56.50 1300 4854 273.38 0.88 0.24 -73.22
3.3 18400 60.47 60.68 8117 6673 -17.79 2.27 2.76 21.64 5 16990 60.03 60.24 7677 6395 -16.70 2.21 2.66 20.05 10 14750 59.33 59.52 6984 5942 -14.92 2.11 2.48 17.54 20 11420 58.13 58.35 5831 5222 -10.44 1.96 2.19 11.66 50 8720 56.96 57.10 4877 4490 -7.94 1.79 1.94 8.62
critical value for sluice lock 4700 54.46 57.19 3165 4542 43.51 1.48 1.03 -30.32
ShiganCS8
Shihutang Upper stream from dam site 11.11km
Annual mean value 1150 51.21 56.53 1188 4160 250.17 0.97 0.28 -71.44
3.3 18400 61.66 61.86 6371 6173 -3.11 2.89 2.98 3.21 5 16990 61.28 61.48 6054 5931 -2.03 2.81 2.86 2.07 10 14750 60.65 60.85 5543 5536 -0.13 2.66 2.66 0.13 20 11420 59.43 59.72 4712 4848 2.89 2.42 2.36 -2.81 50 8720 58.31 58.47 4030 4116 2.13 2.16 2.12 -2.09 critical value for sluice lock 4700 56.00 57.68 2834 3670 29.50 1.66 1.28 -22.78
ShiganCS11
Shihutang Upper stream from dam site 18.86km
Annual mean value 1150 52.52 56.56 1368 3089 125.80 0.84 0.37 -55.71
3.3 18400 63.23 63.41 7689 7844 2.02 2.39 2.35 -1.98 5 16990 62.82 63.05 7336 7534 2.70 2.32 2.26 -2.63 10 14750 62.20 62.44 6803 7009 3.03 2.17 2.10 -2.94 20 11420 61.09 61.36 5854 6085 3.95 1.95 1.88 -3.80 50 8720 60.00 60.17 4988 5111 2.47 1.75 1.71 -2.41 critical value for sluice lock 4700 57.88 58.72 3530 4097 16.06 1.33 1.15 -13.84
ShiganCS14
Shihutang Upper
stream from
dam site
27.54km
Annual mean value 1150 54.38 56.67 1227 2728 122.33 0.94 0.42 -55.02
Remarks: Shigan CS4 is closet to the dam site. This cross section in elevated water level will be closest to water level
before construction of Shihutang and after completion of the project.
Shigan CS8: this cross section will see greatest change in discharge section after completion of Shihutang
Project.
Shigan CS11: this cross section will witness highest elevated water level after completion of Shihutang
Project.
Shigan CS14: there will be almost no change in elevated water level after completion of Shihutang Project and
completion of flood bank.
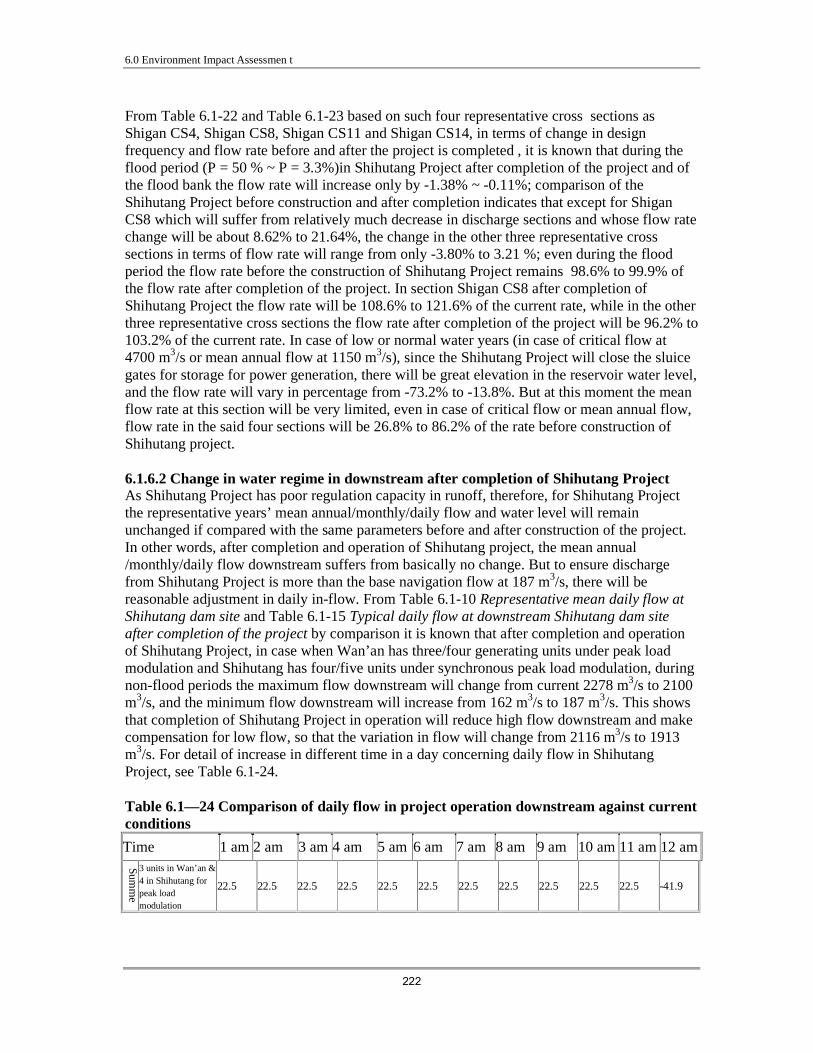
6.0 Environment Impact Assessmen t
222
From Table 6.1-22 and Table 6.1-23 based on such four representative cross sections as Shigan CS4, Shigan CS8, Shigan CS11 and Shigan CS14, in terms of change in design frequency and flow rate before and after the project is completed , it is known that during the flood period (P = 50 % ~ P = 3.3%)in Shihutang Project after completion of the project and of the flood bank the flow rate will increase only by -1.38% ~ -0.11%; comparison of the Shihutang Project before construction and after completion indicates that except for Shigan CS8 which will suffer from relatively much decrease in discharge sections and whose flow rate change will be about 8.62% to 21.64%, the change in the other three representative cross sections in terms of flow rate will range from only -3.80% to 3.21 %; even during the flood period the flow rate before the construction of Shihutang Project remains 98.6% to 99.9% of the flow rate after completion of the project. In section Shigan CS8 after completion of Shihutang Project the flow rate will be 108.6% to 121.6% of the current rate, while in the other three representative cross sections the flow rate after completion of the project will be 96.2% to 103.2% of the current rate. In case of low or normal water years (in case of critical flow at 4700 m3/s or mean annual flow at 1150 m3/s), since the Shihutang Project will close the sluice gates for storage for power generation, there will be great elevation in the reservoir water level, and the flow rate will vary in percentage from -73.2% to -13.8%. But at this moment the mean flow rate at this section will be very limited, even in case of critical flow or mean annual flow, flow rate in the said four sections will be 26.8% to 86.2% of the rate before construction of Shihutang project. 6.1.6.2 Change in water regime in downstream after completion of Shihutang Project As Shihutang Project has poor regulation capacity in runoff, therefore, for Shihutang Project the representative years’ mean annual/monthly/daily flow and water level will remain unchanged if compared with the same parameters before and after construction of the project. In other words, after completion and operation of Shihutang project, the mean annual /monthly/daily flow downstream suffers from basically no change. But to ensure discharge from Shihutang Project is more than the base navigation flow at 187 m3/s, there will be reasonable adjustment in daily in-flow. From Table 6.1-10 Representative mean daily flow at Shihutang dam site and Table 6.1-15 Typical daily flow at downstream Shihutang dam site after completion of the project by comparison it is known that after completion and operation of Shihutang Project, in case when Wan’an has three/four generating units under peak load modulation and Shihutang has four/five units under synchronous peak load modulation, during non-flood periods the maximum flow downstream will change from current 2278 m3/s to 2100 m3/s, and the minimum flow downstream will increase from 162 m3/s to 187 m3/s. This shows that completion of Shihutang Project in operation will reduce high flow downstream and make compensation for low flow, so that the variation in flow will change from 2116 m3/s to 1913 m3/s. For detail of increase in different time in a day concerning daily flow in Shihutang Project, see Table 6.1-24. Table 6.1—24 Comparison of daily flow in project operation downstream against current conditions
Time 1 am 2 am 3 am 4 am 5 am 6 am 7 am 8 am 9 am 10 am 11 am 12 am
Summ
er 3 units in Wan’an &
4 in Shihutang for peak load modulation
22.5 22.5 22.5 22.5 22.5 22.5 22.5 22.5 22.5 22.5 22.5 -41.9

6.0 Environment Impact Assessmen t
223
4 units in Wan’an & 5 in Shihutang for peak load modulation
94.9 94.9 94.9 94.9 94.9 94.9 94.9 94.9 94.9 94.9 94.9 -178
3 units in Wan’an & 4 in Shihutang for peak load modulation
25.5 25.5 25.5 25.5 25.5 25.5 25.5 25.5 25.5 25.5 -41.2 25.5
winter
4 units in Wan’an & 5 in Shihutang for peak load modulation
95.7 95.7 95.7 95.7 95.7 95.7 95.7 95.7 95.7 95.7 -156 95.7
Time 13 pm
14 pm 15 pm 16 pm 17
pm 18 pm 19 pm 20 pm 21 pm 22 pm 23 pm 24 pm
3 units in Wan’an & 4 in Shihutang peak load modulation
22.5 22.5 22.5 22.5 -41.9 -41.9 22.5 -41.9 -41.9 -41.9 -41.9 -41.9
summ
er
4 units in Wan’an & 5 in Shihutang peak load modulation
94.9 94.9 94.9 94.9 -178 -178 94.9 -178 -178 -178 -178 -178
3 units in Wan’an & 4 in Shihutang for peak load modulation
25.5 25.5 25.5 -41.2 -41.2 -41.2 -41.2 -41.2 -41.2 -41.2 25.5 25.5
Winter
4 units in Wan’an & 5 in Shihutang for peak load modulation
95.7 95.7 95.7 -156 -156 -156 -156 -156 -156 -156 95.7 95.7
Unit: m3/s
(2) Change in water level downstream after completion & operation of Shihutang Project From Table 6.1-12 Typical daily water level at Shihutang dam site under current condition and Table 6.1-16 Typical daily water flow at downstream Shihutang dam site after completion of the project by comparison it is known that after completion and operation of Shihutang Project, in case when Wan’an has three/four generating units under peak load modulation and Shihutang has four/five units under synchronous peak load modulation, during non-flood period the maximum water level downstream will drop from current 50.31m to 50.11m, and the lowest water level will increase from 46.68m to 46.78m. This shows that completion of Shihutang Project in operation will elevate the lowest water level during non-flood period and reduce the heist level downstream, so that the variation in water level changes from 3.63m to 3.33m. For detail of compared elevation in water level downstream after completion of the project, see Table 6.1-25.
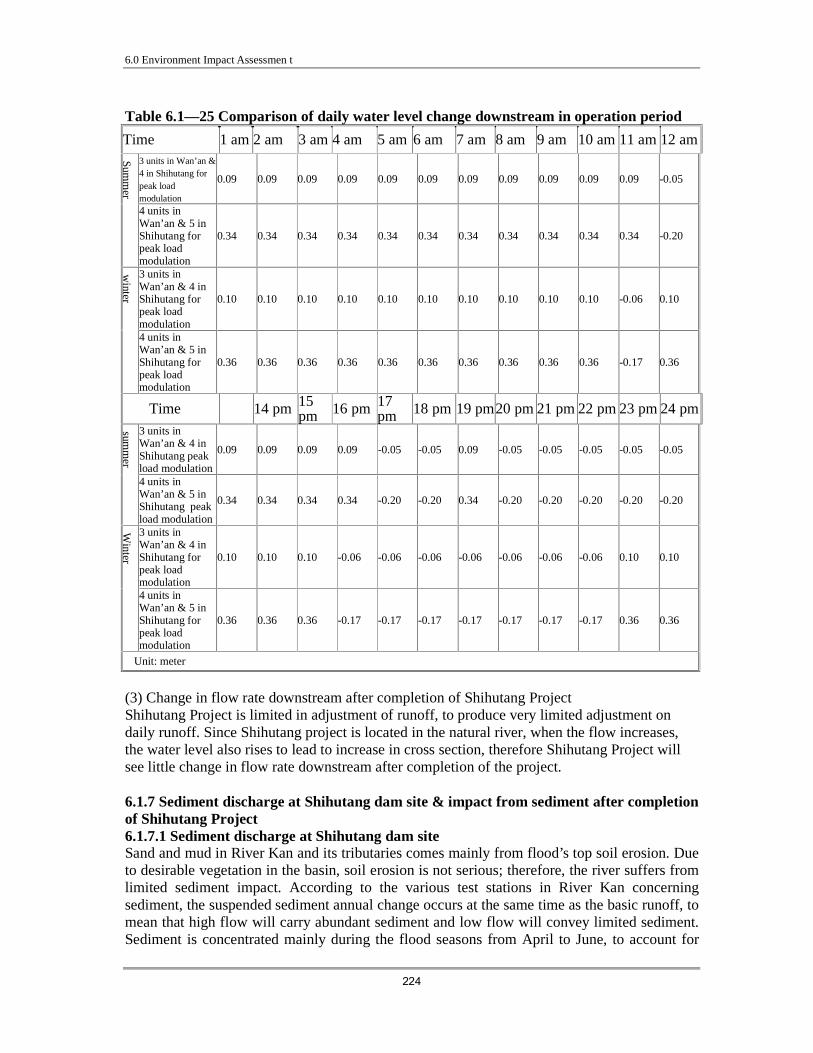
6.0 Environment Impact Assessmen t
224
Table 6.1—25 Comparison of daily water level change downstream in operation period
Time 1 am 2 am 3 am 4 am 5 am 6 am 7 am 8 am 9 am 10 am 11 am 12 am 3 units in Wan’an & 4 in Shihutang for peak load modulation
0.09 0.09 0.09 0.09 0.09 0.09 0.09 0.09 0.09 0.09 0.09 -0.05
Summ
er
4 units in Wan’an & 5 in Shihutang for peak load modulation
0.34 0.34 0.34 0.34 0.34 0.34 0.34 0.34 0.34 0.34 0.34 -0.20
3 units in Wan’an & 4 in Shihutang for peak load modulation
0.10 0.10 0.10 0.10 0.10 0.10 0.10 0.10 0.10 0.10 -0.06 0.10
winter
4 units in Wan’an & 5 in Shihutang for peak load modulation
0.36 0.36 0.36 0.36 0.36 0.36 0.36 0.36 0.36 0.36 -0.17 0.36
Time 14 pm 15 pm 16 pm 17
pm 18 pm 19 pm 20 pm 21 pm 22 pm 23 pm 24 pm
3 units in Wan’an & 4 in Shihutang peak load modulation
0.09 0.09 0.09 0.09 -0.05 -0.05 0.09 -0.05 -0.05 -0.05 -0.05 -0.05
summ
er
4 units in Wan’an & 5 in Shihutang peak load modulation
0.34 0.34 0.34 0.34 -0.20 -0.20 0.34 -0.20 -0.20 -0.20 -0.20 -0.20
3 units in Wan’an & 4 in Shihutang for peak load modulation
0.10 0.10 0.10 -0.06 -0.06 -0.06 -0.06 -0.06 -0.06 -0.06 0.10 0.10
Winter
4 units in Wan’an & 5 in Shihutang for peak load modulation
0.36 0.36 0.36 -0.17 -0.17 -0.17 -0.17 -0.17 -0.17 -0.17 0.36 0.36
Unit: meter
(3) Change in flow rate downstream after completion of Shihutang Project Shihutang Project is limited in adjustment of runoff, to produce very limited adjustment on daily runoff. Since Shihutang project is located in the natural river, when the flow increases, the water level also rises to lead to increase in cross section, therefore Shihutang Project will see little change in flow rate downstream after completion of the project. 6.1.7 Sediment discharge at Shihutang dam site & impact from sediment after completion of Shihutang Project 6.1.7.1 Sediment discharge at Shihutang dam site Sand and mud in River Kan and its tributaries comes mainly from flood’s top soil erosion. Due to desirable vegetation in the basin, soil erosion is not serious; therefore, the river suffers from limited sediment impact. According to the various test stations in River Kan concerning sediment, the suspended sediment annual change occurs at the same time as the basic runoff, to mean that high flow will carry abundant sediment and low flow will convey limited sediment. Sediment is concentrated mainly during the flood seasons from April to June, to account for

6.0 Environment Impact Assessmen t
225
63.8% ~ 67.2% of total in a year. Shihutang dam site is located between the Wan’an reservoir dam site and Ji'an Hydrometric Station, in the upstream about 83km from Wan’an and downstream about 30km from the Ji'an Hydrometric Station. Based on 50 years’ sediment data as collected in Ji'an Station, it is estimated that annual sediment in suspension at Shihutang dam site totals 372 × 104t, and tractional load totals 55.8 × 10⁴t, and annual total sediment discharge amounts to 428 × 104t.
6.1.7.2 Analysis of impact from sediment accumulation after completion of Shihutang Project The discharge sluice bottom elevation in Shihutang Project is 47.0m, almost the same in height as the river bed, thus advantageous for sand flushing. Moreover, the project will be operated with the in-flow as indicator for openness of the sluice gates: when at the dam site the in-flow is over 4700 m3/s, all the flood gates will be opened for sand flushing; when at the dam site the in-flow ranges from 2520 to 4700 m3/s, the spillway gates will be partially opened for sand flushing. Only when the in-flow is less than 2,520 m3/s, all the flood gates will be closed for storage to meet the need for shipping and power generation in this case there will be limited sediment concentration and sediment grains are very small. In terms of general layout and project dispatching mode, there is limited change in Shihutang project in flow if compared with that under natural state, especially during flood periods in case of high water. Since the sluice gates are sufficient for sand flushing and when all are opened the sluice gates will produce no change in flow and hydraulic elements and the sand grains are too small to create silting in the reservoir and majority of sediment from the upper stream will be removed in flood discharge. But due to long reaches of backup water, the suspension sediment is difficult to carry to the dam site, and the sediment before the dam site will be easily flushed downstream due to low elevation at the bottom sluice. It is estimated that sediment in Shihutang project will develop into small-scaled delta in the reservoir and there will be very limited sediment at the terminal of the reservoir and in front of the dam. In a word, there will be limited impact from sediment against the water line and project operation. 6.2 Water Environment
6.2.1 Water Impact Analysis during the construction period (1) During the construction period, the waste water includes the waste water from washing the gravel, the waste water from mixing the concrete and the pit’s waste water, etc. The pollutants are mainly of SS, the wastewater mainly comes from gravel washing. The drained gravel-washing water is 5760m3/d, the drained suspension concentration is 50000mg/L; the average wastewater from concrete pouring is 593.83m3/d, the suspension concentration is 5000mg/L, the PH value is 11.9.
The wastewater for flushing the gravel contains relatively high concentration of SS, the water’s SS concentration within 1000m in the low reaches will be raised during normal water level period or in dry season if it is not treated and drained. Thus, the wastewater should be treated (SS should reach 70mg/L after treatment); the treated wastewater for flushing the gravel has less impact on the water environment.
(2)During the construction peak of Shihutang Project, there are 2900 men/day, water consumption is 150L/man per day, and sewage discharge is computed at 80 percent of water consumption. The maximum domestic sewage drainage is 348 m3/day. In the sewage, the main

6.0 Environment Impact Assessmen t
226
pollutant factors are COD and BOD5, whose concentrations are respectively 300mg/L and 200mg/L, the production of COD and BOD5 is respectively 104.4kg/day and 69.6kg/day.
The domestic sewage in Shihutang area will be under treatment to reach the standard before disposal, it will have relatively little effect on the recipient.
(3)The oil sewage at the tank bottom of the construction ship
The average oil concentration of the oil sewage at the tank bottom is 5000mg/L. If the oil sewage is directly drained without treatment, it will do great harm to the water environment; the drained concentration after treatment will not be over 15mg/L.
According to some related regulations, the oil sewage from the ship tank should be treated by the oil-water separator and shall not be disposed until reaching the standard (the drain concentration is 15mg/L). As for the small ships or boats without oil-water separator, the oil sewage from the ship tank should be stored in its own container, and then is sent to the oil sewage accepting boat or the oil sewage accepting unit to be treated. If the oil sewage from construction ships (mainly slurry-digging ships and material haul ships) is drained according to the standards, it will have limited impact on the water environment.
(4) During the construction period the production sewage and domestic sewage will be under discharge somewhat far from the drinking intake and water source protection zones (over 500m). After adoption of effective measures in construction against pollution there will be no impact upon water intake and water source protection zones downstream.
6.2.2 Prediction of impact upon water environment during the construction period
The reservoir itself will produce no pollutants, but the reservoir performance will create impact the water regime in the reservoir and downstream reaches, upon pollutant dilution, degradation and spread process. Impact from the reservoir upon the river quality in the reservoir area occurs mainly due to elevated water level, increase in the cross section and in the water depth, sedimentation, decrease in flow rate, etc. impact upon downstream reaches occurs mainly due to the difference in discharged flow and water quality if compared with the parameters under the natural conditions. Prediction is made after consideration of such factors as the water temperature, pollution sources, the overall water quality in the reservoir area, the water quality in the inshore, eutrophication, water environmental capacity and discharged water quality and wastewater quality during construction period, so that water quality will be guaranteed to minimize impact from the project construction upon the water environment. The major protection objectives under this project consist of Chengjiang Intake and its water source protection zone; Nanmenzou Intake and its water source protection zone. Meanwhile, in the planning Shangtian Intake and its source protection zone is also under consideration. 33km down the dam site (upper stream of Ji’an City) under protection will be such intakes as intake for the first and second stage of the Jinggangshan Power Plant, intake for Wuyue Water Plant proposed for construction in near future and its water source protection areas; intake for Ji’an City No 2 Water Plant and its water source protection areas; intake for Ji’an City No 1 Water Plant and its water source protection zones; intake for the Pharmaceutical Factory and its water source protection areas; intake for Ji’an City Dongchang Water Plant and its water source protection areas.
6.2.2.1 Water Temperature
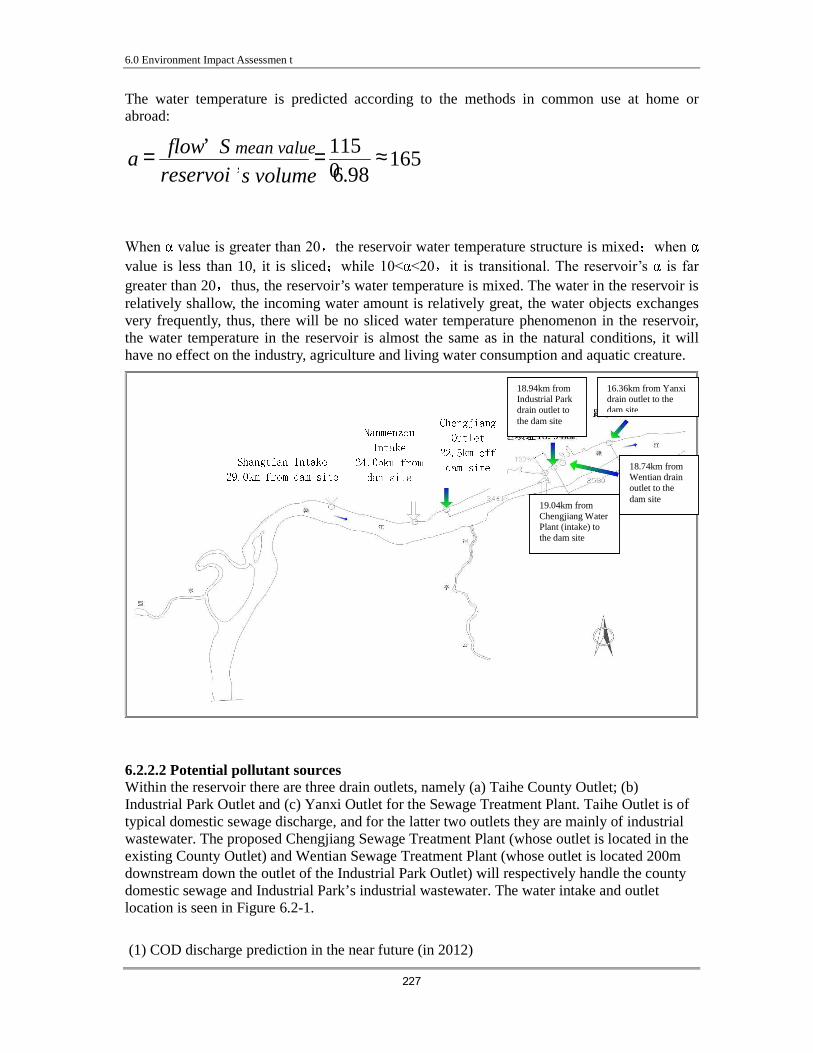
6.0 Environment Impact Assessmen t
227
The water temperature is predicted according to the methods in common use at home or abroad:
When value is greater than 20 the reservoir water temperature structure is mixedwhen value is less than 10, it is slicedwhile 10< <20 it is transitional. The reservoir’s is far greater than 20 thus, the reservoir’s water temperature is mixed. The water in the reservoir is relatively shallow, the incoming water amount is relatively great, the water objects exchanges very frequently, thus, there will be no sliced water temperature phenomenon in the reservoir, the water temperature in the reservoir is almost the same as in the natural conditions, it will have no effect on the industry, agriculture and living water consumption and aquatic creature.
6.2.2.2 Potential pollutant sources Within the reservoir there are three drain outlets, namely (a) Taihe County Outlet; (b) Industrial Park Outlet and (c) Yanxi Outlet for the Sewage Treatment Plant. Taihe Outlet is of typical domestic sewage discharge, and for the latter two outlets they are mainly of industrial wastewater. The proposed Chengjiang Sewage Treatment Plant (whose outlet is located in the existing County Outlet) and Wentian Sewage Treatment Plant (whose outlet is located 200m downstream down the outlet of the Industrial Park Outlet) will respectively handle the county domestic sewage and Industrial Park’s industrial wastewater. The water intake and outlet location is seen in Figure 6.2-1.
(1) COD discharge prediction in the near future (in 2012)
16598. 6
1150 ’
’ ≈==s volume reservoi
S mean valueflowa
6KDQJWLDQ�,QWDNH��
����NP�IURP�GDP�VLWH�
1DQPHQ]RX�
,QWDNH��
�����NP�IURP�
GDP�VLWH�
&KHQJMLDQJ�
2XWOHW��
����NP�RII�
GDP�VLWH�
19.04km from Chengjiang Water Plant (intake) to the dam site
18.74km from Wentian drain outlet to the dam site
16.36km from Yanxi drain outlet to the dam site
18.94km from Industrial Park drain outlet to the dam site

6.0 Environment Impact Assessmen t
228
On the basis of General Layout Planning Report in Taihe County, the urban sewage discharge in 2012 will be 2718.07×104t/a of which the domestic sewage contributes 762.52×10⁴t/a and the industrial sewage 1955.5×104t/a . It is planned to set up Chengjiang sewage plant in the east side of Jinggangshan Avenue and in the south side of the first line ditches. The purpose is to treat the domestic sewage in Chengjiang area. Wentian sewage plant is set up in the east side of Beijing-Kowloon railway to treat the living and industrial sewage in Wentian area. The design treatment capacity of Chengjiang and Wentian sewage plant is respectively 1.5×10⁴t, 3×10⁴t, the treatment ratio is respectively 46.5% and 60.0%. In 2012 Yanxi Sewage Plant will dispose sewage totaling 965.5×10⁴t of industrial waste. Yanxi Sewage Plant has a capacity of 2.1 ×10⁴t/d at a treatment ratio of 100 . The rank of the two sewage plants is secondary treatment, and after treatment the sewage is discharged into Kan River.
On the basis of Pollutant Discharge Standards for Urban Sewage Plant (GB18918-2002), the COD drainage concentration in Chengjiang sewage plant of Taihe County is not greater than 60mg/L, the COD drainage concentration in Wentian sewage plant isn’t greater than 100mg/L. Thus, we can know the pollutant drainage conditions in the reservoir area in 2012. If the domestic sewage isn’t treated, its COD drainage concentration is 300mg/L, 341.4mg/L for industrial sewage. According to the above forecast, the drained wastewater through the secondary treatment is 1642.5t/a, the drained wastewater without treatment is 1489.5t/a. For details, see Tab. 6.2-1 and Tab. 6.2-2.
Table 6.2-1 Waste Water Discharge Unit �×104t/a
Item Chengjiang Sewage Outlet Industrial Park Outlet Yanxi Outlet
Satisfaction of criteria Yes No Yes No Yes No
Waste water amount 547.5 215.0 1095.0 860.5 965.5
Total 762.52 1955.5 965.5
Table 6.2 2 Pollutant discharge Unit t/a
Item Chengjiang Sewage Outlet Industrial Park Outlet Yanxi Outlet
Satisfaction of criteria Yes No Yes No Yes No
NH3-N 43.8 94.07
BOD5 109.5 322.53
COD 328.5 645.1 1095.0 2937.9 579.3
Such prediction shows that waste water flowing into Kan River under secondary treatment will total 2608.0t/a�while waste water under no treatment will aggregate 1075.6t/a. Amount of NH3-N, BOD5 and COD under disposal from Chengjiang Sewage Outlet will total137.87t/a�432.03t/a and 5585.7t/a respectively. (2) Long-term COD discharge forecast (in 2020)
On the basis of General Layout Planning Report in Taihe County, the Chengjiang and Wentian Sewage Plant will undertake 100% interception of urban sewage; Yanxi Sewage Plant will intercept all sewage from the Industrial Park, for secondary treatment to the sewage plant. Completion of the project will reduce discharge of sewage to relieve pressure in Kan River. By 2020 discharge in the county city will amount to 4380×104t; the long-term design treatment

6.0 Environment Impact Assessmen t
229
capacity for Chengjiang and Wentian Sewage Plant is respectively 5×10⁴t/d and 7×10⁴t/d, at a treatment ratio of 100%. The rank of the sewage plant is secondary treatment and after treatment the sewage is drained into Kan River.
In line with Discharge Standards of Sewage Treatment in Cities & Towns (GB18918—2002), in Taihe county the Chengjiang Sewage Treatment Plant has NH3-N emissions concentrations � 8 mg/L, BOD5 emission concentrations � 20 mg /L, COD emission concentrations � 60 mg/L, text fields sewage treatment plant emissions COD concentrations � 100 mg/L, respectively. Yanxi Sewage Treatment Plant has emissions COD concentrations � 60 mg/L.
The pollutant discharge conditions in the reservoir area in 2020 can be worked out. In 2020, the urban sewage discharge amounts to 5730×104t, of which, 1825×104t comes from Chengjiang Sewage Outlet, and 2555×104t from Wentian Sewage Outlet. After treatment the total NH3-N discharged will be 146.0t/a and BOD5 165.0t/a. COD discharge totals 4460t drained into Kan River.
(3) Forecast of the phosphorus into the reservoir
The NH3-N and phosphorus in the reservoir area mainly come from domestic sewage of the residents and livestock along the two banks of the river. According to the actual conditions in the reservoir area, the analyzed objects mainly include three parts: domestic sewage, soil erosion, pesticide and chemical fertilizer.
The concentrated residential area in the reservoir area is mainly Chengjiang Town in Taihe County. In 2012, 49.8t is drained into the river; in 2020 69.6t is drained into the river. The phosphorus with soil erosion into the water is 0.96t/a, the phosphorus with farm chemical into the water is 4.70t/a.
The phosphorus into the reservoir area thanks to the residential area, soil erosion and chemical fertilizer is 55.41t in 2012 and 75.23t in 2020.
6.2.2.3 Water Quality in the Reservoir
(1) Forecast conditions
Forecast level year: regard 2012 in the near future and 2020 in the long term as the forecast level year.
Forecast factor: use the permanganate index fro prediction.
Pollution sources:
The current wastewater in the urban sewage outlet is treated by Chengjiang Plant, its discharge Q=0.173m3/s, of which NH3-N concentration reaches p 8mg/L BOD5 concentration
p 20mg/L COD concentration p 60 mg/L and the untreated waste water discharge p=0.200068 m3/s COD discharge concentration p 300mg/L. In Yanxi Outlet NH3-N concentration reaches p 43.75 mg/L BOD5 discharge concentration p 150mg/L COD discharge concentration p 300mg/L. In Wentian Plant, its discharge Q=0.347 m3/s, COD discharge concentration C=60mg/L; the untreated wastewater discharge rate reaches Q=0.273 m3/s, when COD discharge concentration C=341.4mg/L. In Yanxi Sewage Plant after secondary treatment the waste discharge quantity totals p=0.23 m3/s and COD discharge concentration p 60 mg/L.
The long term waste water from Chengjiang Sewage Outlet is treated in Chengjiang Plant, its

6.0 Environment Impact Assessmen t
230
discharge Q=0.579 m3/s, where NH3-N concentration reaches p 8mg/L BOD5 concentration p 20mg/L and COD discharge concentration C=60mg/L;the long term waste water from Wentian Sewage Outlet is treated in Chengjiang Plant, its discharge Q=0.8105/s, COD discharge concentration C=100mg/L. In Yanxi Sewage Plant after secondary treatment the waste discharge quantity totals p=0.23 m3/s and COD discharge concentration p 60 mg/L.
Design flow: design flow is based on 90% or 95% assurance rate of monthly average flow in the driest season in the river section of Shihutang pivot.
Forecast plan: adopt Shihutang pivot on Kan River to forecast the water quality in the reservoir area.
Position of waste outlet: the urban sewage outlet and the sewage outlet in planned Chengjiang Sewage Plant are 22.3km away from the dam site. Wentian Sewage Outlet is 18.74km and Yanxi Sewage Outlet is 16.36km away from the dam site.
The hydrological parameters near the waste outlet at 90% or 95% assurance rate of monthly average driest flow are shown in Table 6.2-3 and Table 6.2-4. Table 6.2�3 Hydrological Parameters near waste outlets at 90% of Assurance Rate at Monthly Average Driest Flow
Parameter section
flow (m3�s)
Mean flow rate (m�s)
Mean water depth (m)
Hydraulic slope (‰)
Mean river width (m)
Urban waste outlet
163 0.217 2.5 0.26‰ 300
Yanxi Waste Outlet
163 0.217 2.5 0.26‰ 300
Chengjiang Plant
163 0.217 2.5 0.26‰ 300
Wentian Plant 163 0.217 2.5 0.26‰ 300
Table 6.2�4 Hydrological Parameters near waste outlets at 95% of Assurance Rate at Monthly Average Driest Flow
Parameter Section
flow (m3�s)
Mean flow rate (m�s)
Mean water depth (m)
Hydraulic slope (‰)
Mean river width (m)
Chengjiang Sewage Treatment Plant �90��
163 0.0385 6 0.0037‰ 705
Wentian Sewage Treatment Plant�90��
163 0.0385 6 0.0037‰ 705
Yanxi Sewage 163 0.0385 6 0.0037‰ 705

6.0 Environment Impact Assessmen t
231
Treatment Plant�90�� Chengjiang Sewage Treatment Plant�95��
157.5 0.0372 6 0.0037‰ 705
(2) Forecast model
Shihutang Reservoir belongs to a stream way reservoir. Its water is detained for a short period of time, the water depth is relatively shallow, its water temperate has no obvious slices, and the water quality in the reservoir area is forecast by means of one-dimensional water quality model.
−=
u
XKCCx exp0
In this formula: �x—pollutant’s concentration after flowing X distance, mg/L� �o—pollutant’s concentration at the starting section(X=0),mg/L� U —river’s mean flow rate, m/s� X —longitudinal distance�m� �—pollutant’s overall disintegration coefficient, s-1. Determination of K value: the pollutant’s overall disintegration coefficient shows that the degradation rate of organic pollutant is related with the river’s hydrological conditions, such as: flow, flow rate, river width, water depth and silt content. Before building the dam, K value is 0.2(1/d). After building the dam, considering about the hydrological change, K value is 0.06(1/d). Determination of �o value� �o�(�p�p+�h�)/(�p+�) In the formula��p��p—sewage’s discharge flow(m3/s) and concentration(mg/L)� � —flow, m3/s� �h—average COD concentration from upper reaches��h=5.16mg/L In the near future: �p=0.99386 m3/s��p�79.8200.0 mg/L�in long-term �p=1.38962 m3/s��p�33.3380.04 mg/L Q is 90% assurance rate of monthly average driest flow Q=163m3/s
The pollutant’s forecast results are permanganate index, the conversion factor of COD and permanganate index is 2.5.
(3) Forecast results The forecast results show that under the hydrological conditions of 90% assurance rate of monthly average driest flow, before construction of the dam, the current permanganate index COD concentration is 5.12 mg/L, or 4.88 mg/L in the long term; after building the dam, the current permanganate index concentration will be 4.49 mg/L, or 4.28 mg/L in the long term. Thus, after building the dam, there is not much change in total water quality yin the reservoir. See Tab. 6.2-5.
Table 6.2�5 COD Concentration Forecast Results for Reservoir Water Quality
Unit�mg/l

6.0 Environment Impact Assessmen t
232
Longitudinal distance(m) 50 100 150 200 250 300 3461 17860
Current before construction of the dam 6.186 6.183 6.179 6.176 6.173 6.169 5.965 5.117
Current after construction of the dam 6.184 6.178 6.172 6.167 6.161 6.156 5.815 4.486
Long-term before construction of the dam 5.896 5.893 5.890 5.887 5.884 5.881 5.686 4.877
Long-term after construction of the dam 5.894 5.889 5.883 5.878 5.873 5.868 5.543 4.276
6.2.2.4 Water Quality in Nearshore Towns & Cities
Shangtian Intake and its water source protection areas and Nanmen Intake and its water outfall protected areas are located in the upper reaches; Chengjiang Intake and her water source protection areas are 3461m from the upstream County Sewage Outlet (i.e. proposed Chengjiang Sewage Outlet) 3461 m. In terms of the relationship between the intake and outlet location, in order to guarantee the safety of drinking water sources, impact upon the Chengjiang Intake and its water source protection zones will be analyzed from various prediction factors. Prediction factors: for Chengjiang Outlet NH3-N, BOD5 and COD will be taken as prediction factors; for Wentian and Yanxi Outlet Cod as prediction factor. Prediction Program: under 95% and 90% of assurance rate in Shihutang project during low months, under near future and far future and emergency emissions, prediction will be made concerning Chengjiang Outlet - Chengjiang Intake in terms of reservoir water quality. Prediction will also be made under 90% of assurance rate during low months, under near future and far future and emergency emissions concerning total water quality in the reservoir.
� Prediction model Water quality variation is under prediction on the basis of two-dimensional convection and diffusion model, with no consideration to tenuation since it is short-term prediction. The model may be simplified as follows:
( ) )4
e x p (4
2,
2
xE
u z
x uEH
QCCzxC
zz
Pp
h
−+=π
Of which�C(x,z)�(x,z) mean concentration of point pollutants�mg/L�
Ch�concentration of pollutants in the upper reach�mg/L�
H�mean depth calculated from the section of pollution zone�m�
U—longitudinal flow velocity�m/s�
Cp�pollutant discharge concentration�mg/L�
Qp�discharge of waste water�m3/s�
Ez�Lateral diffusion coefficient�m2/s�
x�longitudinal distance from the computed point to the drain outlet�m�
z�Lateral distance from the computed point to the drain outlet�m

6.0 Environment Impact Assessmen t
233
Lateral diffusion coefficient ZE may be computed by such empirical formula� *UHaE zz ⋅⋅=
gHIU =*
Of which� za —zero dimension diffusion coefficient�regular reach:0.15��
H —mean depth in a section�m��
*U ——fiction flow velocity�m/s��
g —acceleration of gravity�9.8m/s2��
I —hydraulic gradient�‰�
ZE �0.01327 m2/s
� Prediction Result No consideration is given to tenuation.
� Short-term Prediction
At 95% of assurance rate in the driest season, prediction is made concerning nearshore waters close to county town drain outlets (discharged to Kan River) concerning NH3-N, see Table 6.2 6 for detail; for prediction of BOD5, see Table 6.2—7; for COD, see table 6.2—8.
The Table shows that under the hydrological condition of monthly average flow of the driest month at 95% of assurance rate, after completion of the dam, in scope of the nearshore waters lasting 2050m long and 23m wide close to Chengjiang Sewage Outlet in the near future, the pollutant concentration goes beyond Grade II of water quality standard; at 2461m downstream the outlet (1000m in the upstream, 5m to the bank) NH3-N concentration �0.5 mg/L, BOD�3 mg/L and COD�15 mg/L. Still, water meets the requirement of water intaking of the Chengjiang Water Plant, 3461m downstream.
Table 6.2 6 Short-term NH3-N Prediction in Chengjiang Outlet in Downstream
Nearshore Waters Unit mg/l
Longitudinal Horizontal (m) 100 200 300 400 500 1000 3461
5 1.648 1.294 1.103 0.981 0.895 0.671 0.467 10 1.014 1.017 0.942 0.872 0.815 0.642 0.459 20 0.208 0.418 0.516 0.555 0.568 0.538 0.429 30 0.100 0.152 0.227 0.287 0.331 0.408 0.385 40 0.097 0.101 0.122 0.152 0.184 0.287 0.333 50 0.097 0.097 0.100 0.108 0.121 0.198 0.279 60 0.097 0.097 0.097 0.098 0.102 0.143 0.230 70 0.097 0.097 0.097 0.097 0.097 0.115 0.189 80 0.097 0.097 0.097 0.097 0.097 0.103 0.157 90 0.097 0.097 0.097 0.097 0.097 0.098 0.134
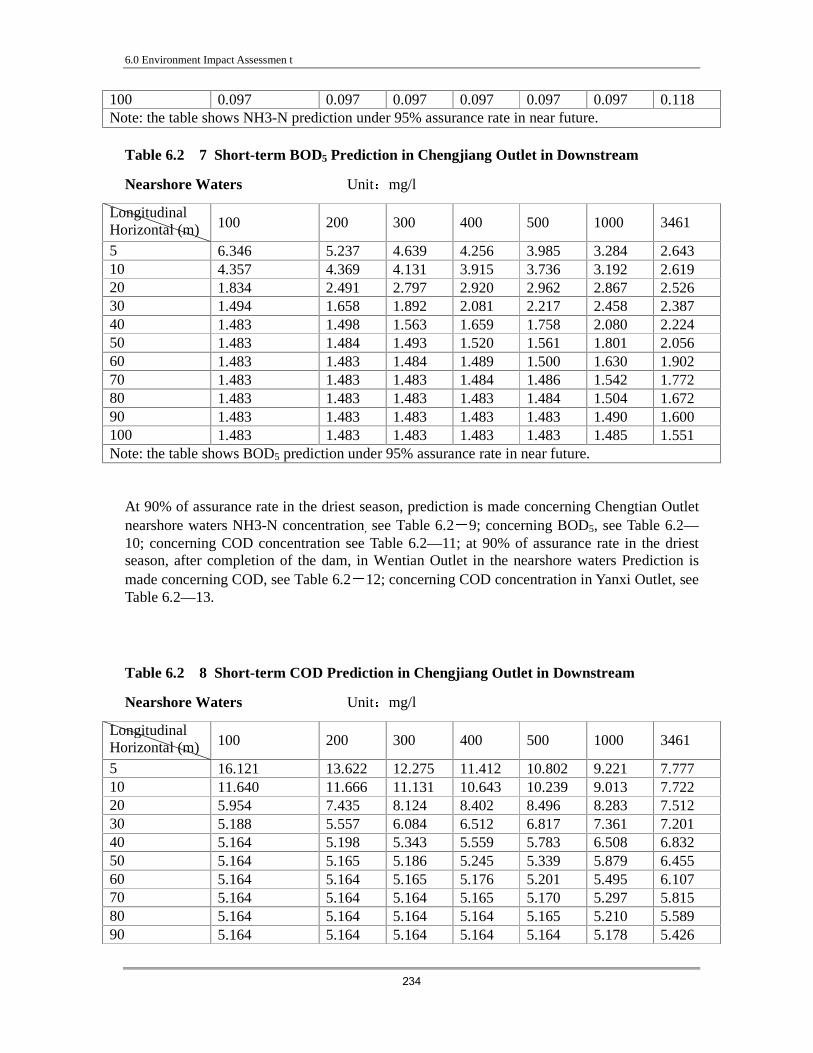
6.0 Environment Impact Assessmen t
234
100 0.097 0.097 0.097 0.097 0.097 0.097 0.118 Note: the table shows NH3-N prediction under 95% assurance rate in near future.
Table 6.2 7 Short-term BOD5 Prediction in Chengjiang Outlet in Downstream
Nearshore Waters Unit mg/l
Longitudinal Horizontal (m) 100 200 300 400 500 1000 3461
5 6.346 5.237 4.639 4.256 3.985 3.284 2.643 10 4.357 4.369 4.131 3.915 3.736 3.192 2.619 20 1.834 2.491 2.797 2.920 2.962 2.867 2.526 30 1.494 1.658 1.892 2.081 2.217 2.458 2.387 40 1.483 1.498 1.563 1.659 1.758 2.080 2.224 50 1.483 1.484 1.493 1.520 1.561 1.801 2.056 60 1.483 1.483 1.484 1.489 1.500 1.630 1.902 70 1.483 1.483 1.483 1.484 1.486 1.542 1.772 80 1.483 1.483 1.483 1.483 1.484 1.504 1.672 90 1.483 1.483 1.483 1.483 1.483 1.490 1.600 100 1.483 1.483 1.483 1.483 1.483 1.485 1.551 Note: the table shows BOD5 prediction under 95% assurance rate in near future.
At 90% of assurance rate in the driest season, prediction is made concerning Chengtian Outlet nearshore waters NH3-N concentration, see Table 6.2 9; concerning BOD5, see Table 6.2—10; concerning COD concentration see Table 6.2—11; at 90% of assurance rate in the driest season, after completion of the dam, in Wentian Outlet in the nearshore waters Prediction is made concerning COD, see Table 6.2 12; concerning COD concentration in Yanxi Outlet, see Table 6.2—13.
Table 6.2 8 Short-term COD Prediction in Chengjiang Outlet in Downstream
Nearshore Waters Unit mg/l
Longitudinal Horizontal (m) 100 200 300 400 500 1000 3461
5 16.121 13.622 12.275 11.412 10.802 9.221 7.777 10 11.640 11.666 11.131 10.643 10.239 9.013 7.722 20 5.954 7.435 8.124 8.402 8.496 8.283 7.512 30 5.188 5.557 6.084 6.512 6.817 7.361 7.201 40 5.164 5.198 5.343 5.559 5.783 6.508 6.832 50 5.164 5.165 5.186 5.245 5.339 5.879 6.455 60 5.164 5.164 5.165 5.176 5.201 5.495 6.107 70 5.164 5.164 5.164 5.165 5.170 5.297 5.815 80 5.164 5.164 5.164 5.164 5.165 5.210 5.589 90 5.164 5.164 5.164 5.164 5.164 5.178 5.426

6.0 Environment Impact Assessmen t
235
100 5.164 5.164 5.164 5.164 5.164 5.168 5.316 Note: the table shows COD prediction under 95% assurance rate in Chengjiang Outlet in near future.
Table 6.2 9 Short-term NH3-N Prediction in Chengjiang Outlet in Downstream
Nearshore Waters Unit mg/l
Longitudinal Horizontal (m) 100 200 300 400 500 1000 3461
5 1.613 1.270 1.084 0.965 0.880 0.661 0.460 10 0.976 0.991 0.920 0.855 0.800 0.631 0.452 20 0.196 0.398 0.495 0.536 0.551 0.526 0.422
30 0.099 0.146 0.215 0.274 0.317 0.396 0.377 40 0.097 0.100 0.118 0.146 0.176 0.276 0.325 50 0.097 0.097 0.099 0.106 0.118 0.190 0.272 60 0.097 0.097 0.097 0.098 0.101 0.139 0.223 70 0.097 0.097 0.097 0.097 0.097 0.113 0.183 80 0.097 0.097 0.097 0.097 0.097 0.102 0.152 90 0.097 0.097 0.097 0.097 0.097 0.098 0.130 100 0.097 0.097 0.097 0.097 0.097 0.097 0.116 Note: the table shows NH3-N prediction under 90% assurance rate in Chengjiang Outlet in near future.
Table 6.2 10 Short-term BOD5 Prediction in Chengjiang Outlet in Downstream
Nearshore Waters Unit mg/l
Longitudinal Horizontal (m) 100 200 300 400 500 1000 3461
5 6.234 5.162 4.579 4.205 3.940 3.252 2.623 10 4.240 4.285 4.065 3.859 3.686 3.158 2.598 20 1.796 2.427 2.733 2.862 2.909 2.831 2.504
30 1.492 1.637 1.856 2.040 2.173 2.421 2.364 40 1.483 1.495 1.552 1.640 1.733 2.047 2.200 50 1.483 1.484 1.491 1.514 1.551 1.777 2.033 60 1.483 1.483 1.484 1.487 1.497 1.615 1.880 70 1.483 1.483 1.483 1.484 1.485 1.535 1.754 80 1.483 1.483 1.483 1.483 1.484 1.501 1.657 90 1.483 1.483 1.483 1.483 1.483 1.488 1.589 100 1.483 1.483 1.483 1.483 1.483 1.485 1.543 Note: the table shows BOD5 prediction under 90% assurance rate in Chengjiang Outlet in near future.

6.0 Environment Impact Assessmen t
236
Table 6.2 11 Short-term COD Prediction in Chengjiang Outlet in Downstream
Nearshore Waters Unit mg/l
Longitudinal Horizontal (m) 100 200 300 400 500 1000 3461
5 15.869 13.453 12.139 11.297 10.699 9.150 7.732 10 11.376 11.478 10.982 10.517 10.128 8.938 7.676 20 5.868 7.290 7.980 8.270 8.376 8.200 7.463
30 5.183 5.510 6.004 6.418 6.718 7.276 7.148 40 5.164 5.191 5.318 5.516 5.727 6.435 6.778 50 5.164 5.165 5.181 5.233 5.316 5.825 6.402 60 5.164 5.164 5.165 5.173 5.195 5.462 6.059 70 5.164 5.164 5.164 5.165 5.168 5.280 5.774 80 5.164 5.164 5.164 5.164 5.164 5.203 5.556 90 5.164 5.164 5.164 5.164 5.164 5.175 5.401 100 5.164 5.164 5.164 5.164 5.164 5.167 5.299 Note: the table shows COD prediction under 90% assurance rate in Chengjiang Outlet in near future.
Table 6.2 12 Short-term COD Prediction in Wentian Outlet in Downstream Nearshore
Waters Unit mg/l
Longitudinal Horizontal (m) 100 200 300 400 500 1000 2480
5 51.558 41.528 36.066 31.996 30.057 23.534 17.387 10 32.929 33.325 31.248 29.298 27.668 22.639 17.143 20 10.016 15.879 18.714 19.895 20.314 19.497 16.216
30 7.000 8.342 10.370 12.068 13.299 15.541 14.834 40 6.701 6.806 7.325 8.135 8.999 11.890 13.199 50 6.456 6.459 6.526 6.737 7.081 9.175 11.516 60 6.209 6.214 6.223 6.261 6.354 7.469 9.954 70 5.977 5.986 5.995 6.007 6.030 6.520 8.625 80 5.773 5.784 5.795 5.806 5.818 6.019 7.572 90 5.602 5.614 5.626 5.637 5.648 5.744 6.790 100 5.468 5.479 5.490 5.501 5.512 5.572 6.238 Note: the table shows COD prediction under 90% assurance rate in Wentian Outlet in near future.
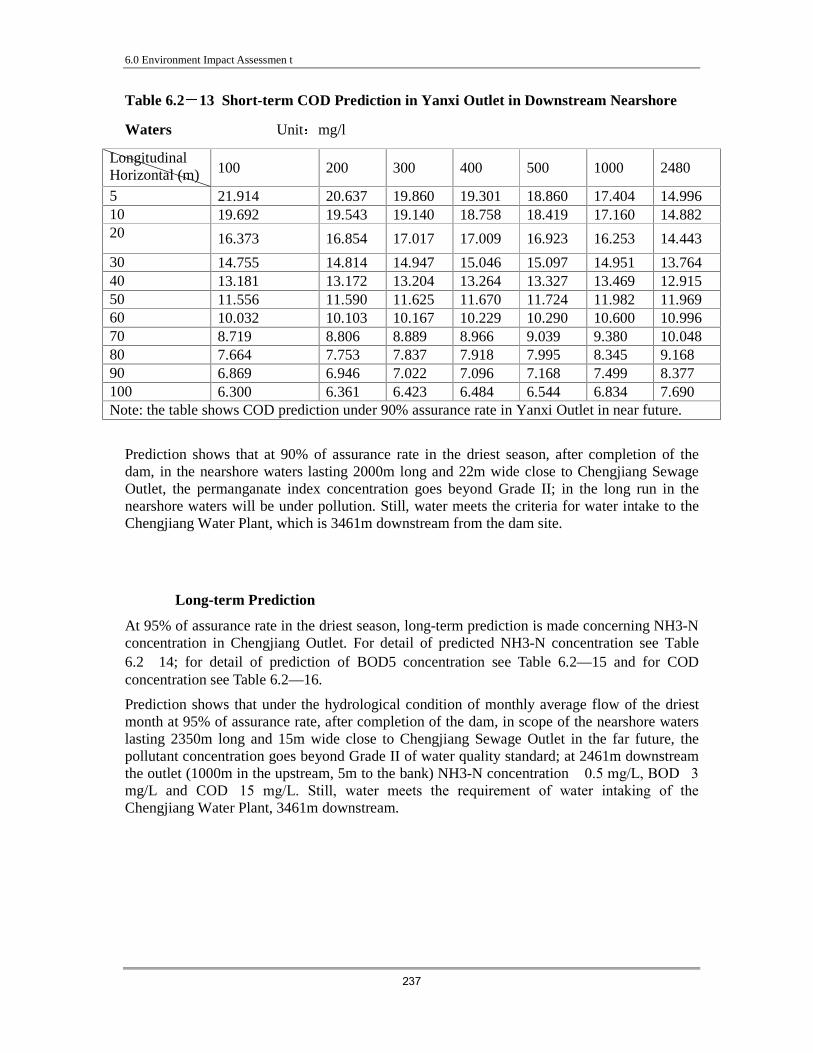
6.0 Environment Impact Assessmen t
237
Table 6.2 13 Short-term COD Prediction in Yanxi Outlet in Downstream Nearshore
Waters Unit mg/l
Longitudinal Horizontal (m) 100 200 300 400 500 1000 2480
5 21.914 20.637 19.860 19.301 18.860 17.404 14.996 10 19.692 19.543 19.140 18.758 18.419 17.160 14.882 20 16.373 16.854 17.017 17.009 16.923 16.253 14.443
30 14.755 14.814 14.947 15.046 15.097 14.951 13.764 40 13.181 13.172 13.204 13.264 13.327 13.469 12.915 50 11.556 11.590 11.625 11.670 11.724 11.982 11.969 60 10.032 10.103 10.167 10.229 10.290 10.600 10.996 70 8.719 8.806 8.889 8.966 9.039 9.380 10.048 80 7.664 7.753 7.837 7.918 7.995 8.345 9.168 90 6.869 6.946 7.022 7.096 7.168 7.499 8.377 100 6.300 6.361 6.423 6.484 6.544 6.834 7.690 Note: the table shows COD prediction under 90% assurance rate in Yanxi Outlet in near future.
Prediction shows that at 90% of assurance rate in the driest season, after completion of the dam, in the nearshore waters lasting 2000m long and 22m wide close to Chengjiang Sewage Outlet, the permanganate index concentration goes beyond Grade II; in the long run in the nearshore waters will be under pollution. Still, water meets the criteria for water intake to the Chengjiang Water Plant, which is 3461m downstream from the dam site.
� Long-term Prediction
At 95% of assurance rate in the driest season, long-term prediction is made concerning NH3-N concentration in Chengjiang Outlet. For detail of predicted NH3-N concentration see Table 6.2 14; for detail of prediction of BOD5 concentration see Table 6.2—15 and for COD concentration see Table 6.2—16.
Prediction shows that under the hydrological condition of monthly average flow of the driest month at 95% of assurance rate, after completion of the dam, in scope of the nearshore waters lasting 2350m long and 15m wide close to Chengjiang Sewage Outlet in the far future, the pollutant concentration goes beyond Grade II of water quality standard; at 2461m downstream the outlet (1000m in the upstream, 5m to the bank) NH3-N concentration �0.5 mg/L, BOD�3 mg/L and COD�15 mg/L. Still, water meets the requirement of water intaking of the Chengjiang Water Plant, 3461m downstream.

6.0 Environment Impact Assessmen t
238
Table 6.2 14 Long-term NH3-N Prediction in Chengjiang Outlet in Downstream
Nearshore Waters Unit mg/l
Longitudinal Horizontal (m) 100 200 300 400 500 1000 3461
5 1.740 1.365 1.163 1.034 0.942 0.705 0.488 10 1.068 1.072 0.991 0.918 0.858 0.674 0.480 20 0.215 0.437 0.540 0.582 0.596 0.564 0.449
30 0.100 0.156 0.234 0.299 0.344 0.426 0.402 40 0.097 0.102 0.123 0.156 0.189 0.298 0.347 50 0.097 0.097 0.100 0.109 0.123 0.204 0.290 60 0.097 0.097 0.097 0.098 0.102 0.146 0.238 70 0.097 0.097 0.097 0.097 0.097 0.116 0.194 80 0.097 0.097 0.097 0.097 0.097 0.103 0.160 90 0.097 0.097 0.097 0.097 0.097 0.099 0.136 100 0.097 0.097 0.097 0.097 0.097 0.097 0.119 Note: the table shows NH3-N prediction under 95% assurance rate in Chengjiang Outlet in near future.
Table 6.2 15 Long-term BOD5 Prediction in Chengjiang Outlet in Downstream
Nearshore Waters Unit mg/l
Longitudinal Horizontal (m) 100 200 300 400 500 1000 3461
5 5.591 4.654 4.149 3.826 3.424 3.004 2.463 10 3.911 3.921 3.721 3.537 3.261 2.927 2.442 20 1.780 2.335 2.593 2.697 2.736 2.653 2.364
30 1.492 1.631 1.828 1.989 2.181 2.307 2.247 40 1.483 1.496 1.550 1.631 1.791 1.987 2.109 50 1.483 1.484 1.491 1.514 1.591 1.751 1.967 60 1.483 1.483 1.484 1.488 1.513 1.607 1.837 70 1.483 1.483 1.483 1.484 1.490 1.533 1.728 80 1.483 1.483 1.483 1.483 1.484 1.501 1.643 90 1.483 1.483 1.483 1.483 1.483 1.489 1.581 100 1.483 1.483 1.483 1.483 1.483 1.485 1.540 Note: the table shows BOD5 prediction under 95% assurance rate in Chengjiang Outlet in near future.
At 90% of assurance rate in the driest season, long-term prediction is made concerning NH3-N concentration in the nearshore waters close to Chengjiang Sewage Outlet, see Table 6.217; for prediction of BOD5, see Table 6.2—18 and for COD see Table 6.2—19. At 90% of assurance rate in the driest season, the same long-term prediction is made concerning COD concentration near Wentian Outlet, see Table 6.2—20; for prediction of COD concentration
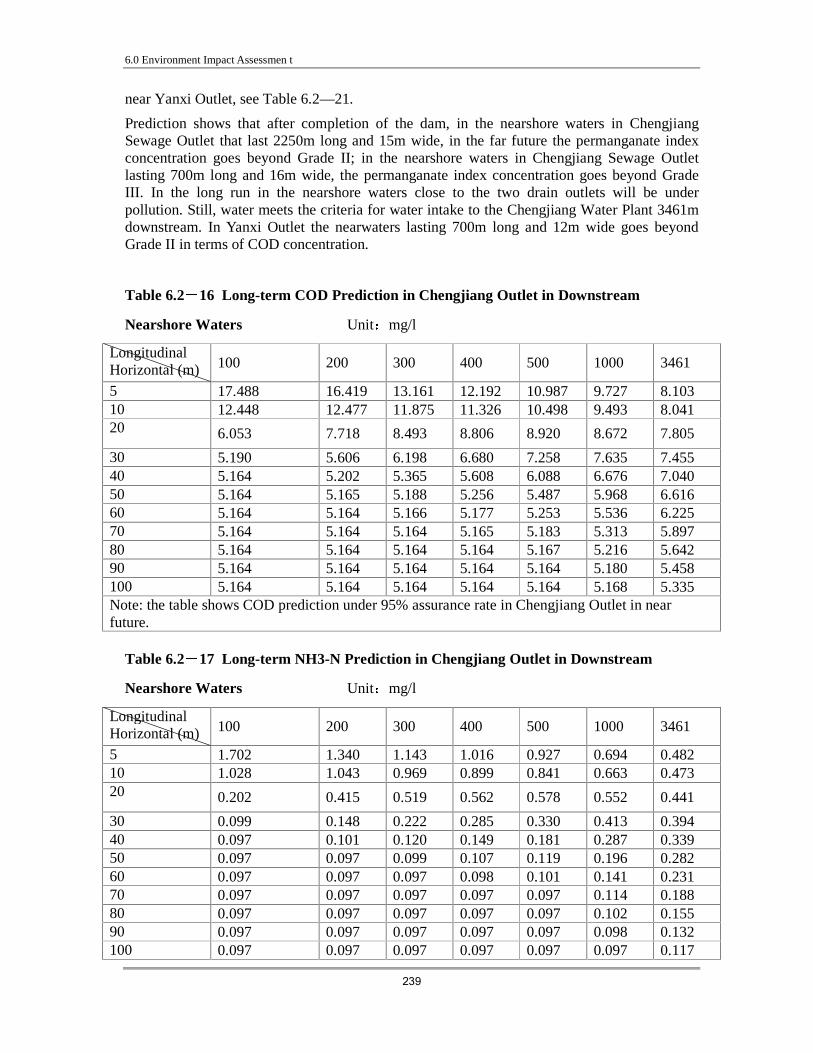
6.0 Environment Impact Assessmen t
239
near Yanxi Outlet, see Table 6.2—21.
Prediction shows that after completion of the dam, in the nearshore waters in Chengjiang Sewage Outlet that last 2250m long and 15m wide, in the far future the permanganate index concentration goes beyond Grade II; in the nearshore waters in Chengjiang Sewage Outlet lasting 700m long and 16m wide, the permanganate index concentration goes beyond Grade III. In the long run in the nearshore waters close to the two drain outlets will be under pollution. Still, water meets the criteria for water intake to the Chengjiang Water Plant 3461m downstream. In Yanxi Outlet the nearwaters lasting 700m long and 12m wide goes beyond Grade II in terms of COD concentration.
Table 6.2 16 Long-term COD Prediction in Chengjiang Outlet in Downstream
Nearshore Waters Unit mg/l
Longitudinal Horizontal (m) 100 200 300 400 500 1000 3461
5 17.488 16.419 13.161 12.192 10.987 9.727 8.103 10 12.448 12.477 11.875 11.326 10.498 9.493 8.041 20 6.053 7.718 8.493 8.806 8.920 8.672 7.805
30 5.190 5.606 6.198 6.680 7.258 7.635 7.455 40 5.164 5.202 5.365 5.608 6.088 6.676 7.040 50 5.164 5.165 5.188 5.256 5.487 5.968 6.616 60 5.164 5.164 5.166 5.177 5.253 5.536 6.225 70 5.164 5.164 5.164 5.165 5.183 5.313 5.897 80 5.164 5.164 5.164 5.164 5.167 5.216 5.642 90 5.164 5.164 5.164 5.164 5.164 5.180 5.458 100 5.164 5.164 5.164 5.164 5.164 5.168 5.335 Note: the table shows COD prediction under 95% assurance rate in Chengjiang Outlet in near future.
Table 6.2 17 Long-term NH3-N Prediction in Chengjiang Outlet in Downstream
Nearshore Waters Unit mg/l
Longitudinal Horizontal (m) 100 200 300 400 500 1000 3461
5 1.702 1.340 1.143 1.016 0.927 0.694 0.482 10 1.028 1.043 0.969 0.899 0.841 0.663 0.473 20 0.202 0.415 0.519 0.562 0.578 0.552 0.441
30 0.099 0.148 0.222 0.285 0.330 0.413 0.394 40 0.097 0.101 0.120 0.149 0.181 0.287 0.339 50 0.097 0.097 0.099 0.107 0.119 0.196 0.282 60 0.097 0.097 0.097 0.098 0.101 0.141 0.231 70 0.097 0.097 0.097 0.097 0.097 0.114 0.188 80 0.097 0.097 0.097 0.097 0.097 0.102 0.155 90 0.097 0.097 0.097 0.097 0.097 0.098 0.132 100 0.097 0.097 0.097 0.097 0.097 0.097 0.117

6.0 Environment Impact Assessmen t
240
Note: the table shows NH3-N prediction under 90% assurance rate in Chengjiang Outlet in near future.
Table 6.2 18 Long-term BOD5 Prediction in Chengjiang Outlet in Downstream
Nearshore Waters Unit mg/l
Longitudinal Horizontal (m) 100 200 300 400 500 1000 3461
5 5.497 4.591 4.098 3.783 3.389 2.978 2.446 10 3.812 3.850 3.665 3.490 3.224 2.898 2.425 20 1.747 2.280 2.539 2.648 2.694 2.622 2.345
30 1.490 1.613 1.798 1.953 2.145 2.275 2.227 40 1.483 1.494 1.541 1.615 1.767 1.960 2.088 50 1.483 1.484 1.490 1.509 1.579 1.731 1.947 60 1.483 1.483 1.484 1.487 1.509 1.595 1.819 70 1.483 1.483 1.483 1.484 1.489 1.527 1.712 80 1.483 1.483 1.483 1.483 1.484 1.498 1.630 90 1.483 1.483 1.483 1.483 1.483 1.488 1.572 100 1.483 1.483 1.483 1.483 1.483 1.484 1.534 Note: the table shows BOD5 prediction under 90% assurance rate in Chengjiang Outlet in near future.
Table 6.2 19 Long-term COD Prediction in Chengjiang Outlet in Downstream
Nearshore Waters Unit mg/l
Longitudinal Horizontal (m) 100 200 300 400 500 1000 3461
5 17.205 14.486 13.009 12.062 10.882 9.647 8.052 10 12.151 12.265 11.708 11.184 10.386 9.409 7.989 20 5.956 7.555 8.331 8.657 8.797 8.579 7.750
30 5.185 5.553 6.109 6.574 7.148 7.540 7.396 40 5.164 5.195 5.338 5.560 6.015 6.593 6.979 50 5.164 5.165 5.184 5.241 5.450 5.908 6.556 60 5.164 5.164 5.165 5.174 5.240 5.499 6.170 70 5.164 5.164 5.164 5.165 5.180 5.294 5.850 80 5.164 5.164 5.164 5.164 5.166 5.208 5.605 90 5.164 5.164 5.164 5.164 5.164 5.177 5.431 100 5.164 5.164 5.164 5.164 5.164 5.167 5.316 Note: the table shows COD prediction under 90% assurance rate in Chengjiang Outlet in near future.

6.0 Environment Impact Assessmen t
241
Table 6.2 20 Long-term COD Prediction in Wentian Outlet in Downstream Nearshore
Waters Unit mg/l
Longitudinal Horizontal (m) 100 200 300 400 500 1000 2000
5 35.602 29.229 25.753 23.514 21.919 17.730 14.540 10 23.775 24.014 22.685 21.437 20.392 17.152 14.322 20 9.191 12.898 14.685 15.424 15.681 15.119 13.501
30 7.192 8.035 9.314 10.383 11.156 12.545 12.307 40 6.893 6.955 7.280 7.790 8.334 10.148 10.941 50 6.617 6.619 6.661 6.794 7.011 8.332 9.597 60 6.339 6.345 6.353 6.379 6.439 7.152 8.413 70 6.078 6.089 6.099 6.110 6.128 6.454 7.460 80 5.848 5.862 5.874 5.886 5.898 6.047 6.747 90 5.657 5.671 5.684 5.697 5.709 5.793 6.242 100 5.506 5.518 5.531 5.543 5.555 5.617 5.896 Note: the table shows COD prediction under 90% assurance rate in Wentian Outlet in near future.
Table 6.2 21 Long-term COD Prediction in Yanxi Outlet in Downstream Nearshore
Waters Unit mg/l
Longitudinal Horizontal (m) 100 200 300 400 500 1000 3461
5 18.315 17.107 16.396 15.899 15.516 14.314 13.033 10 16.170 16.087 15.745 15.422 15.138 14.120 12.928 20 13.146 13.676 13.886 13.923 13.881 13.403 12.525
30 11.966 12.052 12.212 12.338 12.414 12.392 11.908 40 10.909 10.904 10.942 11.009 11.080 11.269 11.146 50 9.813 9.832 9.855 9.890 9.936 10.172 10.314 60 8.775 8.819 8.860 8.899 8.941 9.176 9.478 70 7.869 7.925 7.977 8.027 8.074 8.309 8.688 80 7.128 7.185 7.240 7.293 7.343 7.576 7.978 90 6.556 6.607 6.657 6.706 6.753 6.973 7.363 100 6.133 6.175 6.216 6.258 6.298 6.493 6.850 Note: the table shows COD prediction under 90% assurance rate in Yanxi Outlet in near future.
6.2.2.5 Prediction of Water Pollution from Sewage Treatment Works in Emergency
discharge
At 95% of assurance rate in the driest season, prediction is made concerning NH3-N concentration in downstream nearshore waters during emergency discharge in Chengjiang Outlet, see Table 6.2—22; concerning BOD5 see Table 6.2 23; concerning COD see Table 6.2—24. At 95% of assurance rate in the driest season, prediction is made concerning NH3-N concentration in nearshore waters close to emergency discharge in Chengjiang Omelet in far

6.0 Environment Impact Assessmen t
242
future, see Table 6.225; concerning BOD5 concentration see Table 6.2—26; concerning COD concentration see Table 6.2—27.
Table 6.2 22 Estimate of Emergency Discharge from Chengjiang Outlet (Near future) (mg/l)
Longitudinal(m)
Lateral(m) 100 200 300 400 500 1000 3461
5 5.890 4.568 3.856 3.400 2.834 2.241 1.478
10 3.520 3.534 3.251 2.993 2.604 2.132 1.449
20 0.514 1.297 1.661 1.808 1.862 1.746 1.338
30 0.109 0.305 0.583 0.809 1.081 1.258 1.173
40 0.097 0.114 0.191 0.305 0.531 0.807 0.979
50 0.097 0.097 0.108 0.140 0.248 0.475 0.779
60 0.097 0.097 0.097 0.103 0.138 0.271 0.595
70 0.097 0.097 0.097 0.097 0.106 0.167 0.441
80 0.097 0.097 0.097 0.097 0.098 0.121 0.321
90 0.097 0.097 0.097 0.097 0.097 0.104 0.235
100 0.097 0.097 0.097 0.097 0.097 0.098 0.177 Note: the table shows NH3-N prediction under 95% assurance rate in Chengjiang Outlet in near future in case of emergency discharge.
Table 6.2 23 Estimate of Accident BOD5 Discharge from Chengjiang Outlet (Near future) (mg/l)
Longitudinal(m)
Lateral(m) 100 200 300 400 500 1000 3461
5 11.514 9.226 7.993 7.204 6.223 5.197 3.876
10 7.412 7.436 6.946 6.499 5.825 5.007 3.825
20 2.207 3.563 4.193 4.448 4.541 4.339 3.633
30 1.505 1.844 2.325 2.717 3.188 3.494 3.348
40 1.485 1.514 1.647 1.845 2.235 2.714 3.011
50 1.483 1.485 1.503 1.558 1.746 2.138 2.665
60 1.483 1.483 1.485 1.494 1.556 1.786 2.347
70 1.483 1.483 1.483 1.484 1.499 1.605 2.080
80 1.483 1.483 1.483 1.483 1.486 1.526 1.872
90 1.483 1.483 1.483 1.483 1.484 1.496 1.723
100 1.483 1.483 1.483 1.483 1.483 1.487 1.623 Note: the table shows BOD5 prediction under 95% assurance rate in Chengjiang Outlet in near future in case of emergency discharge.
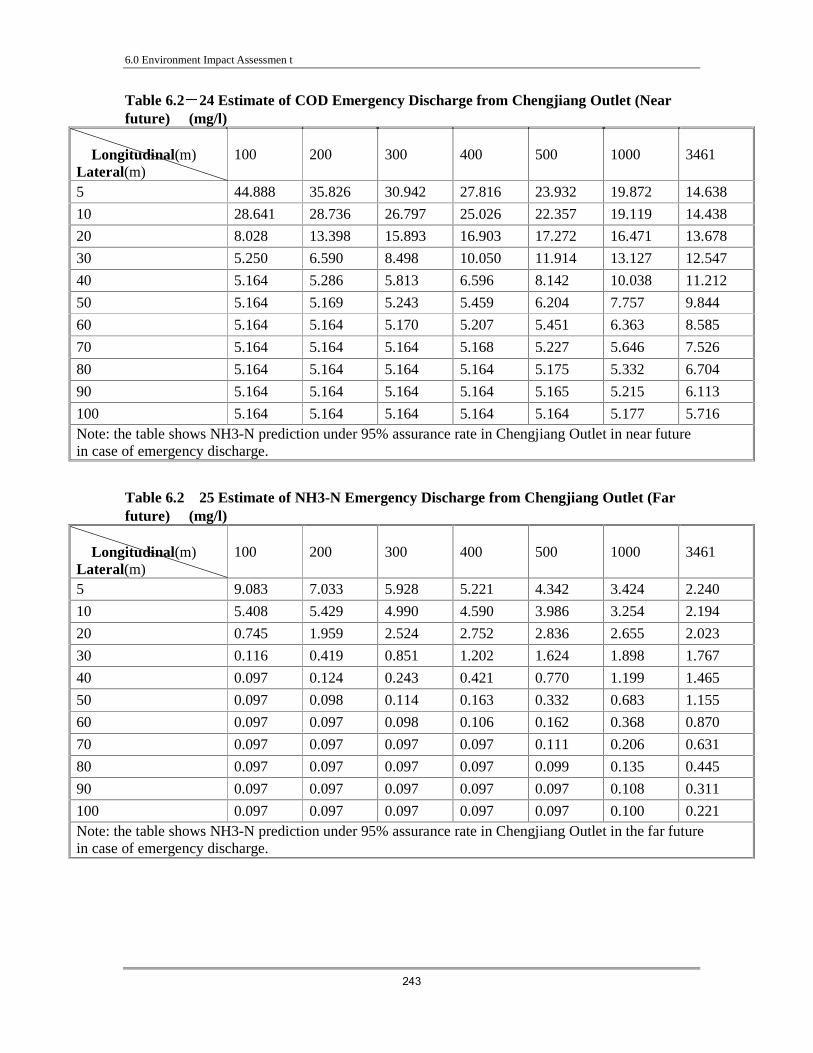
6.0 Environment Impact Assessmen t
243
Table 6.2 24 Estimate of COD Emergency Discharge from Chengjiang Outlet (Near future) (mg/l)
Longitudinal(m)
Lateral(m) 100 200 300 400 500 1000 3461
5 44.888 35.826 30.942 27.816 23.932 19.872 14.638
10 28.641 28.736 26.797 25.026 22.357 19.119 14.438
20 8.028 13.398 15.893 16.903 17.272 16.471 13.678
30 5.250 6.590 8.498 10.050 11.914 13.127 12.547
40 5.164 5.286 5.813 6.596 8.142 10.038 11.212
50 5.164 5.169 5.243 5.459 6.204 7.757 9.844
60 5.164 5.164 5.170 5.207 5.451 6.363 8.585
70 5.164 5.164 5.164 5.168 5.227 5.646 7.526
80 5.164 5.164 5.164 5.164 5.175 5.332 6.704
90 5.164 5.164 5.164 5.164 5.165 5.215 6.113
100 5.164 5.164 5.164 5.164 5.164 5.177 5.716 Note: the table shows NH3-N prediction under 95% assurance rate in Chengjiang Outlet in near future in case of emergency discharge.
Table 6.2 25 Estimate of NH3-N Emergency Discharge from Chengjiang Outlet (Far future) (mg/l)
Longitudinal(m)
Lateral(m) 100 200 300 400 500 1000 3461
5 9.083 7.033 5.928 5.221 4.342 3.424 2.240
10 5.408 5.429 4.990 4.590 3.986 3.254 2.194
20 0.745 1.959 2.524 2.752 2.836 2.655 2.023
30 0.116 0.419 0.851 1.202 1.624 1.898 1.767
40 0.097 0.124 0.243 0.421 0.770 1.199 1.465
50 0.097 0.098 0.114 0.163 0.332 0.683 1.155
60 0.097 0.097 0.098 0.106 0.162 0.368 0.870
70 0.097 0.097 0.097 0.097 0.111 0.206 0.631
80 0.097 0.097 0.097 0.097 0.099 0.135 0.445
90 0.097 0.097 0.097 0.097 0.097 0.108 0.311
100 0.097 0.097 0.097 0.097 0.097 0.100 0.221 Note: the table shows NH3-N prediction under 95% assurance rate in Chengjiang Outlet in the far future in case of emergency discharge.

6.0 Environment Impact Assessmen t
244
Table 6.2 26 Estimate of BOD5 Emergency Discharge from Chengjiang Outlet (Far future) (mg/l)
Longitudinal(m)
Lateral(m) 100 200 300 400 500 1000 3461
5 100 200 300 400 500 1000 3461
10 32.295 25.266 21.477 19.054 17.337 12.892 8.832
20 19.693 19.767 18.262 16.889 15.754 12.307 8.676
30 3.705 7.870 9.806 10.588 10.853 10.254 8.087
40 1.550 2.590 4.070 5.273 6.131 7.660 7.210
50 1.484 1.578 1.987 2.594 3.225 5.264 6.175
60 1.483 1.487 1.545 1.713 1.976 3.495 5.114
70 1.483 1.483 1.488 1.517 1.589 2.413 4.137
80 1.483 1.483 1.484 1.487 1.500 1.857 3.315
90 1.483 1.483 1.483 1.484 1.485 1.614 2.678
100 1.483 1.483 1.483 1.483 1.484 1.523 2.219 Note: the table shows BOD5 prediction under 95% assurance rate in Chengjiang Outlet in near future in case of emergency discharge.
Table 6.2 27 Estimate of COD Emergency Discharge from Chengjiang Outlet (Far future) (mg/l)
Longitudinal(m)
Lateral(m) 100 200 300 400 500 1000 3461
5 66.786 52.729 45.152 40.304 34.278 27.981 19.861
10 41.584 41.731 38.722 35.975 31.835 26.812 19.550
20 9.608 17.937 21.808 23.374 23.947 22.705 18.371
30 5.297 7.377 10.336 12.743 15.635 17.517 16.618
40 5.165 5.354 6.171 7.386 9.785 12.726 14.546
50 5.164 5.172 5.287 5.622 6.778 9.187 12.424
60 5.164 5.164 5.173 5.230 5.610 7.024 10.471
70 5.164 5.164 5.164 5.171 5.261 5.911 8.828
80 5.164 5.164 5.164 5.164 5.181 5.425 7.554
90 5.164 5.164 5.164 5.164 5.166 5.243 6.636
100 5.164 5.164 5.164 5.164 5.164 5.185 6.021 Note: the table shows COD prediction under 95% assurance rate in Chengjiang Outlet in near future in case of emergency discharge.
The prediction shows that in the near future 3461m downstream in Chengjiang Outlet (1000m in the upper stream of the intake) emission of NH3-N, BOD5 and COD averages 0.5mg/L,
3mg/L and 15 mg/L respectively; in the long run the same index will average 0.5mg/L, 3mg/L and 15 mg/L respectively, all beyond the water quality standard.

6.0 Environment Impact Assessmen t
245
6.2.2.6 Estimate of Eutrophication in Reservoir
(1) Model Prediction
Phosphorous concentration in the reservoir is under estimate from Vollenweidwer Model and Dylon Model.
� Annual mean concentration of NH3-N and phosphor is estimated according to
Vollenweidwer Model:
C=sqH
Ci/1+
qS=Qinflow/A
of which C —Annual mean concentration of NH3-N and phosphor mg/L;
Ci—Annual mean concentration of NH3-N and phosphor by flow weighted
mean mg/L;
H —reservoir mean water depth m;
qS —Annual mean load in unit area m3/(m2·a);
Q —inflow m3;
A—Water area m2
Ci in Vollenweidwer Model is determined in line with the mean concentration of NH3-N
and phosphor coming from the upper stream.
� Dylon Model
( )H
RLC
⋅−=
ρ1
Of which L—annual NH3-N or phosphor accumulated in certain area of a
reservoir g/(m2·a);
R—NH3-N or phosphor retardance coefficient 1/a;
R=0.426exp(-0.271qS)+0.547exp(-0.00949qS)
qS=Qinflow/A
ρ —hydraulic erosion coefficient 1/a and V
Q=ρ ;
Qinflow—inflow m3/a
V—volume of reservoir m3
According to Vollenweidwer Model and Dylon Model it is estimated that in 2012 NH3-Nous and phosphorous concentration will reach 0.0145mg/L and 0.0132mg/L respectively; while in 2020 they will average 0.0150mg/L and 0.0137mg/L respectively. For detail of the major
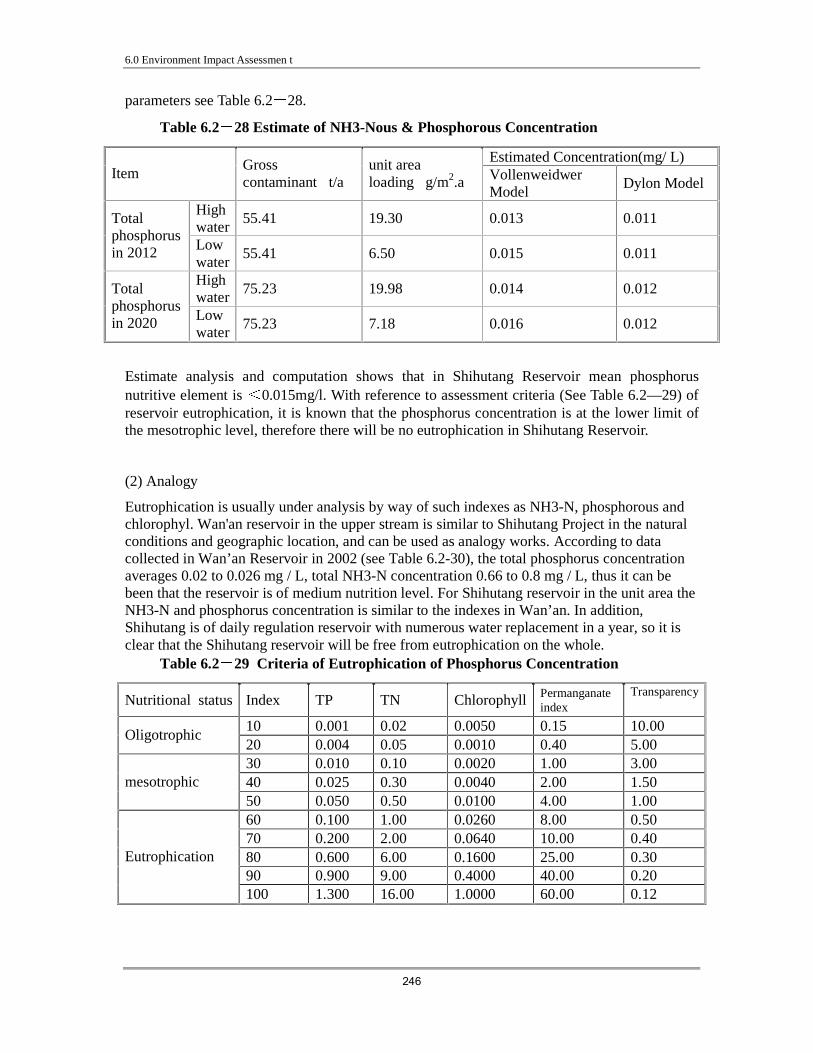
6.0 Environment Impact Assessmen t
246
parameters see Table 6.228.
Table 6.2 28 Estimate of NH3-Nous & Phosphorous Concentration
Estimated Concentration(mg/ L) Item
Gross contaminant�t/a�
unit area loading�g/m2.a� Vollenweidwer
Model Dylon Model
High water
55.41 19.30 0.013 0.011 Total phosphorus in 2012 Low
water 55.41 6.50 0.015 0.011
High water
75.23 19.98 0.014 0.012 Total phosphorus in 2020 Low
water 75.23 7.18 0.016 0.012
Estimate analysis and computation shows that in Shihutang Reservoir mean phosphorus nutritive element is 0.015mg/l. With reference to assessment criteria (See Table 6.2—29) of reservoir eutrophication, it is known that the phosphorus concentration is at the lower limit of the mesotrophic level, therefore there will be no eutrophication in Shihutang Reservoir.
(2) Analogy
Eutrophication is usually under analysis by way of such indexes as NH3-N, phosphorous and chlorophyl. Wan'an reservoir in the upper stream is similar to Shihutang Project in the natural conditions and geographic location, and can be used as analogy works. According to data collected in Wan’an Reservoir in 2002 (see Table 6.2-30), the total phosphorus concentration averages 0.02 to 0.026 mg / L, total NH3-N concentration 0.66 to 0.8 mg / L, thus it can be been that the reservoir is of medium nutrition level. For Shihutang reservoir in the unit area the NH3-N and phosphorus concentration is similar to the indexes in Wan’an. In addition, Shihutang is of daily regulation reservoir with numerous water replacement in a year, so it is clear that the Shihutang reservoir will be free from eutrophication on the whole.
Table 6.2 29 Criteria of Eutrophication of Phosphorus Concentration
Nutritional status Index TP TN Chlorophyll Permanganate index
Transparency
10 0.001 0.02 0.0050 0.15 10.00 Oligotrophic
20 0.004 0.05 0.0010 0.40 5.00 30 0.010 0.10 0.0020 1.00 3.00 40 0.025 0.30 0.0040 2.00 1.50 mesotrophic 50 0.050 0.50 0.0100 4.00 1.00 60 0.100 1.00 0.0260 8.00 0.50 70 0.200 2.00 0.0640 10.00 0.40 80 0.600 6.00 0.1600 25.00 0.30 90 0.900 9.00 0.4000 40.00 0.20
Eutrophication
100 1.300 16.00 1.0000 60.00 0.12
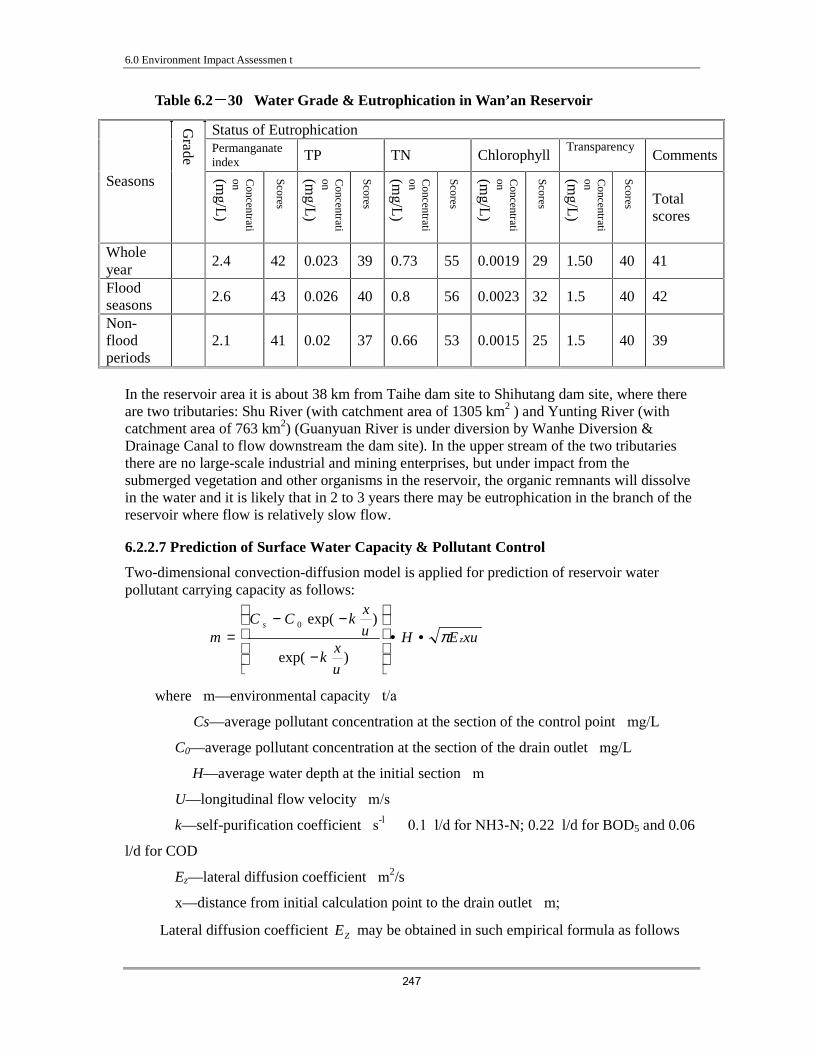
6.0 Environment Impact Assessmen t
247
Table 6.2 30 Water Grade & Eutrophication in Wan’an Reservoir
Status of Eutrophication Permanganate index TP TN Chlorophyll
Transparency Comments
Seasons
Grade
Concentrati
on
(mg/L
)
Scores
Concentrati
on
(mg/L
)
Scores
Concentrati
on
(mg/L
)
Scores
Concentrati
on
(mg/L
)
Scores
Concentrati
on
(mg/L
)
Scores Total scores
Whole year
� 2.4 42 0.023 39 0.73 55 0.0019 29 1.50 40 41
Flood seasons
� 2.6 43 0.026 40 0.8 56 0.0023 32 1.5 40 42
Non-flood periods
� 2.1 41 0.02 37 0.66 53 0.0015 25 1.5 40 39
In the reservoir area it is about 38 km from Taihe dam site to Shihutang dam site, where there are two tributaries: Shu River (with catchment area of 1305 km2 ) and Yunting River (with catchment area of 763 km2) (Guanyuan River is under diversion by Wanhe Diversion & Drainage Canal to flow downstream the dam site). In the upper stream of the two tributaries there are no large-scale industrial and mining enterprises, but under impact from the submerged vegetation and other organisms in the reservoir, the organic remnants will dissolve in the water and it is likely that in 2 to 3 years there may be eutrophication in the branch of the reservoir where flow is relatively slow flow. 6.2.2.7 Prediction of Surface Water Capacity & Pollutant Control
Two-dimensional convection-diffusion model is applied for prediction of reservoir water pollutant carrying capacity as follows:
xuEH
u
xk
u
xkCC
m z
s
π••
−
−−=
)exp(
)exp(0
where�m—environmental capacity�t/a�
Cs—average pollutant concentration at the section of the control point�mg/L�
C0—average pollutant concentration at the section of the drain outlet�mg/L�
H—average water depth at the initial section�m�
U—longitudinal flow velocity�m/s�
k—self-purification coefficient�s-l��0.1 l/d for NH3-N; 0.22 l/d for BOD5 and 0.06
l/d for COD�
Ez—lateral diffusion coefficient�m2/s� x—distance from initial calculation point to the drain outlet�m;
Lateral diffusion coefficient ZE may be obtained in such empirical formula as follows�

6.0 Environment Impact Assessmen t
248
gHIU =*
Where� za —zero dimensional diffusion coefficient �at 0.15��
H —average water depth at the section�m��
*U ——friction flow velocity�m/s��
g —gravitational acceleration�9.8m/s2��
I —hydraulic slope�‰�
After completion of the dam, ZE �0.01327m2/s�
Prediction shows that in case of the design flow at 157.5 m3/s for the Shihutang Project at 90% assurance rate in the dry season, water environmental capacity for NH3-N at Chengjiang Outlet reaches 155.9 t/a, for BOD5 695.2 t/a and for COD 3506.6 t/a.
Annual emission in the near future Chengjiang Outlet of NH3-N is estimated to total 137.87 t/a, of BOD5 432.03 t/a, and of COD 973.6 t/ a. In the far future annual emission of NH3-N therein is expected to amount to 146.0 t/a, of BOD5 to 365.0 t/a, and of COD to 1095.0 t/a, all of which is less than local evaluated environmental capacity. See Table 6.2-31.
Table 6.2 31 Environmental capacity from Chengjiang Sewage Outlet to 100m up in the
Upper Stream from Intake of Chengjiang Water Plant
Time Items Environmental capacity�t/a� Pollutant discharge�t/a�
NH3-N 155.9 137.87
BOD5 695.2 432.03 Near future
COD 3506.6 973.6
NH3-N 155.9 146.00
BOD5 695.2 365.00 Long run
COD 3506.6 1095.00
6.2.2.8 Estimate of Discharged Water Quality
In case of the hydropower station under normal operation, in the near future in front of the dam, COD in the reservoir is estimated to reach 4.49 mg/l, and in the far future COD will total 4.28 mg/l. Discharge of such water will accelerate flow velocity and improve reoxygenation capacity so that water quality will change for the better. As a result, there is not much change in water quality downstream if compared with the quality before construction of the project. 6.2.2.9 Analysis of Sewage from Ships in the Reservoir
Vessel sewage discharge in the reservoir will total 1079.1t/a in 2020 and 1333.1t/a in 2030 respectively. Comparison and analysis on the basis of acquired data shows that corresponding concentration of COD and BOD5 will total 300mg/l and 200mg/l respectively. Without direct
*UHaE zz ⋅⋅=

6.0 Environment Impact Assessmen t
249
treatment the vessel sewage will be discharged into the channel, only to produce pollution to water environment in the reservoir. Hence arises the necessity to forbid discharge of vessel sewage. Vessel sewage shall be under collection from gathering units in the vessel to transfer to sewage receiving vessels or to shore receiving units for treatment until to meet the Grade I criteria as described in Standard for Sewage Discharge (GB8978-1996) concentration of COD and BOD5 will reach 100mg/l and 20mg/l respectively. To be exact, discharge of COD in 2020 and 2030 shall be less than 323.7kg/a and 399.9kg/ and OD5 shall be less than 215.8kg/a and 266.6kg/a respectively.
6.2.2.10 Bilge Water
Mean oil concentration in bilge water averages 5000mg/lso that in 2020 and 2030 bilge water will total 393.4t/a and 611t/a respectively. If without treatment, direct discharge of bilge water would create desirable pollution to water body. So there will be no direct discharge of bilge water, which shall be under collection from gathering units in the vessel to transfer to sewage receiving vessels or to shore receiving units for treatment until to meet the Grade I criteria as described in Standard for Sewage Discharge (GB8978-1996) 5mg/l . To be exact, discharge of bilge water in 2020 and 2030 shall be less than 2.0kg/a and 3.1kg/a.
6.2.2.11 Domestic Sewage out of Personnel from Shihutang Management Bureau
There will be about 129 staff in Shihutang Project Management Bureau, who will discharge 7062.75t/a of domestic sewage. Such sewage contains mainly COD and BOD5 whose concentration may reach 300mg/L and 200mg/L respectively, so annual discharge will total 2118.83kg and 1412.55kg respectively. Such sewage shall be under treatment to meet the Grade I standard so that discharge concentration of COD and BOD5 will average 100mg/L and 20mg/L respectively or to total 706.28kg/a and 141.26kg/a. After treatment such domestic sewage will produce little impact upon water quality in Kan River.
6.2.3 Comprehensive Evaluation of Environmental Impact upon Surface Water
� Water body in the reservoir is of mixed pattern, thus there is little difference in water temperature in the discharged water and natural water, to produce no impact upon downstream eco-environment.
�Under the hydrological condition of monthly average flow of the driest month at 95% of assurance rate, after completion of the dam, in scope of the nearshore waters lasting 2050m long and 23m wide close to Chengjiang Sewage Outlet in the near future, the pollutant concentration goes beyond Grade II of water quality standard; at 2461m downstream the outlet (1000m in the upstream, 5m to the bank) NH3-N concentration �0.5 mg/L, BOD�3 mg/L and COD�15 mg/L. Still, water meets the requirement of water intaking of the Chengjiang Water Plant, 3461m downstream.
Under the hydrological condition of monthly average flow of the driest month at 95% of assurance rate, after completion of the dam, in scope of the nearshore waters lasting 2350m long and 15m wide close to Chengjiang Sewage Outlet in the far future, the pollutant concentration goes beyond Grade II of water quality standard; at 2461m downstream the outlet (1000m in the upstream, 5m to the bank) NH3-N concentration �0.5 mg/L, BOD�3 mg/L and COD�15 mg/L. Still, water meets the requirement of water intaking of the Chengjiang Water

6.0 Environment Impact Assessmen t
250
Plant, 3461m downstream.
In case of the sewage treatment plants under normal discharge, under the conditions with and without the Shihutang Project and of short-term and long-term impacts, the quality of water at 1000m upstream of the water intake can satisfy Grade II of water quality standard; if under emergency discharge, the quality of water can not satisfy Grade II. Under the hydrological condition of monthly average flow of the driest month at 90% of assurance rate, after completion of the dam, within the scope of 2000m long and 22m wide nearshore waters downstream of Chengjiang Wastewater Outlet, the quality of water will exceed Grade II in the near future; within the scope of 4480m long and 31m wide nearshore waters from Wentian Wastewater Outlet to Yanxi Wastewater Outlet, the pollutant concentration will exceed the Grade II of the water quality standard.
Under the hydrological condition of monthly average flow of the driest month at 90% of assurance rate, after completion of the dam, within the scope of 2250m long and 15m wide nearshore waters downstream of Chengjiang Wastewater Outlet, the pollutant concentration will exceed Grade II in the far future; within the scope of 1800m long and 31m wide nearshore waters downstream of Wentian Wastewater Outlet, the COD concentration will exceed the Grade II of the water quality standard in the far future; within the scope of 700m long and 12m wide nearshore waters downstream of Yanxi Wastewater Outlet, the COD concentration will exceed the Grade II of the water quality standard in the far future.
�Annual mean phosphorus nutritive element in Shihutang reservoir will be�0.015mg/l, to mean that phosphorus concentration is at the lower limit of mesotrophic level, therefore there will be no eutrophication in the reservoir.
�Water environmental capacity of NH3-N at Chengjiang Wastewater Outlet is 155.9t/a; BOD5 695.2t/a and COD 3506.6t/a.
In the near future annual NH3-N discharge at Chengjiang Wastewater Outlet is expected to be 137.87 t/a, BOD5 432.03 t/a, and COD 973.6 t/a; in the long run annual NH3-N discharge at Chengjiang Wastewater Outlet will reach 146.0 t/a, BOD5 365.0 t/a and COD 1095.0 t/a, all are below the environmental capacity of the river section. �Under normal operation, in the reservoir area upstream of the dam in the near future, COD concentration is expected to be 4.49 mg/l, and in the long run 4.28 mg/l; After water is discharged, the water flow rate will increase so that reoxygenation capacity will be improved and water quality will get better, thus the quality of water downstream of the dam site will not have a big change compared with that before construction of the dam. [6] During the operation period, collection and disposal of vessel sewage, bilge water and domestic sewage from Shihutang Project Management Dept. will meet the Grade I criteria as described in Standard of Waste DischargeGB8978-1996 . As a result there will be limited impact upon water body to produce no change in surface water function.
6.2.4 Analysis of Impact upon Underground Water
6.2.4.1 Geohydrologic Characteristics of Underground Water

6.0 Environment Impact Assessmen t
251
Unconsolidated rock pore water is distributed along the bank of Kan River and her tributaries, with the water-bearing rock made up of alluvial deposit. Such alluvial deposit is the major water bearing strata. Water supply is mainly in form of rainfall by way of gravel and sand seepage and river lateral seepage. During the flood periods the nearshores are under feeding from the river flow, while during normal seasons and low water periods the shores supply water to the river. The first bottom and the second terrace are of inter-slanted, of identical underground level, to discharge toward the river. the other part of the terrace is of base terrace, where underground will discharge into the river by way of wells in the front of the terrace or in where there are deep-cut low-lying areas.
Bedrock fracture water is mainly of red clasolite of Cretaceous Systemwhere the sand gravel is moderately weathered, rich in water; in comparison, siltite are filled with pelyte in the fracture, thus the zone of weathering bears little water, and the underground water exists mainly in fracture and pore or weathered submergence under tectonization and mechanical weathering. The fracture is under feeding from rainfall, to discharge into the fracture underground layers, not so abundant in water reserve.
6.2.4.2 Relationship between Underground Water & Kan River
Kan River is related to underground water that exists surrounding the second bottom and the second terrace close to Kan River. When water level in Kan River is higher than that of underground water underground water receives feeding from Kan Riverotherwise underground water will discharge into Kan River. Kan River produces long-term impact upon the underground water in that there is more impact upon underground water if Kan River is closer to underground water location, and vice versa.
6.2.4.3 Underground Water Reserve & Utilization Status
Underground water is classified into unconsolidated rock pore water and bedrock fracture water, with pore water richest in reserve. Generally individual well water inflow amounts to 5815.12 3614.55t/d or maximum to 6778.01t/d. Pore water is mainly distributed in the overflow land and second bottom, while fracture water mainly in hilly land.
Underground water is under exploitation for drinking or irrigation.
6.2.4.4 Analysis of Environmental Impact upon Underground Water
After reservoir filling to normal water level at 56.5mwater will be raised to different degree in different sections of the river. The normal water level is higher than natural water level by 9.43m Minimum flow as observed on Feb. to Oct. 2006 reached 274m3/s with corresponding water level in the upper reach of the dam averaged 47.07mand water level for 10-year and 20-year recurrence flood was raised by 0.08m and 0.14m respectively. Now water feeding to the underground water in the second bottom and second terrace will be resumed in this case until dynamic equality of underground water is established. Lowering of the underground water will be under effective control, so that underground water reserve will remain stable and steady, to provide sufficient water sources for development of daily water and industrial consumption in Taihe County Town.
Meanwhile, due to gradual rising of underground water, drought in the second bottom will be relieved effectively, so that some of the deserted farmland may become suitable for

6.0 Environment Impact Assessmen t
252
reclamation. The lakes and wet land at the edge of the second bottom and the second terrace will be enlarged with the gradual rising of the underground water, to perfect its eco-function.
After reservoir filling to normal water level at 56.5mwater filling will be undertaken only in non-flood season, so there will little impact upon the downstream reach of Kan River or upon development of underground water.
But with reservoir filling and operation of Shihutang Project, a huge narrow artificial lake will develop in the reach of Taihe County, when Kan River will transform from a natural river into relatively static lake and natural purification will be greatly weakened. If more wastewater were discharged into Kan River and such wastewater failed to be under proper treatment, Kan River would be polluted with worse water quality. Since the underground water in the second bottom and second terrace is closely related to Kan River in terms of hydraulic connection and complementary actionunderground water in the second bottom and the second terrace will be contaminated to result in worse water quality and negative impact upon daily life and production. In a word, during construction and the operation period of the project there must be as limited pollutants as possible to be discharged to Kan River so as to protect surface and underground water resources.
To sum up, by way of decease in discharge into Kan River of pollutants and sewage, the Shihutang Project meets the environmental need concerning underground water, only to create positive impact upon eco-benefit and economic benefit in areas close to Kan River.
6.3 Ecological Environment
6.3.1 Evaluation Methodology
Based on analysis and evaluation of the status quo, 3S technology will be fully utilized to collect as much information as possible. Then on the basis of ecological system, such methodology as ecological mechanism analysis and landscape ecology will be adopted to make prediction concerning direct or indirect impact from construction and operation of the Shihutang Project.
6.3.2 Analysis of Ecological Environment during the Construction Period
This project has a construction period of 51 months, to cover such works as main works, protection embankment and diversion canal, etc. Such construction works as housing for construction, embankment construction, and highway development will produce change to original land layout. Such main works as cofferdam, bank regulation, and sand and gravel acquisition will greatly increase suspended solid in the reach of Kan River, which is the major cause of impact out of the Project upon ecological environment.
6.3.2.1 Impact upon Terrestrial Plants
� Impact upon vegetation Direct impact from the Project upon vegetation is mainly in form of (a) permanent acquisition of land for pivotal projects (b) permanent acquisition of land for protection embankment(c) damage to vegetation during bank regulation(d) acquisition of stones and sand, and excavation waste dumpand (e) acquisition of land for temporary roads, etc. The major species of vegetation include Form Pinus massoniana, Form Pinus elliottii, shrub and meadow and artificial gardens (For detail see Table 6.31). There is no broad-leaved forest or native

6.0 Environment Impact Assessmen t
253
vegetation. Except for permanent acquisition of land, there is no re-vegetation for other kinds of land use. Except for limited historical trees, there is no rare plant community, all of which is local dispersed species.

6.0 Environment Impact Assessmen t
254
Table 6.3 1 Directory of Land for the Project Unit mu
Works Sum Paddy fields
Dry land
Garden Forest Uneven ground
Resident land
Unexploited Waters Land for communications
alluvial land
Duration
For pivotal works
424.95 34.5 112.95 0 72.0 202.05 0 0 3.45
For Project management
49.95 0 0 0 0 49.95 0 0 0
For embankment
3877.95 402.6 973.65 76.35 1237.15 1017.0 10.2 56.4 104.6
For inundation
38172.15 299.25 1154.25 28.05 2159.25 1500.9 106.2 415.05 32484 25.5
Sum 42525.1 736.35 2240.9 104.4 3468.4 2769.9 116.4 471.45 32592.1 25.5
Permanent
Broadening roads
48.0 48.0
Resettlement 78.15 39.0 39.15 Lifting field 1237.05 1237.05 Construction site & living quarters
963.15 37.2 493.95 0 227.7 49.95 154.35
construction detour
412.95 3.75 188.25 0 108.15 97.5 15.3
Borrow earth pits
517.95 0 283.65 0 156.9 77.4 0
Sand gravel yard
1873.95 0 0 0 0 0 1873.95
Excavation waste dump
1764.45 13.95 451.8 0 508.05 732.6 58.05
Total 6895.65 1330.95 1417.65 0 1000.8 957.45 39.15 48.0 2101.65
Temporary
6.0 Environment Impact Assessmen t
255
� Impact upon biodiversity & plant resources Impact upon plant resources during the construction period includes destruction of some red pines, slash pines and sapling of Form Populus lasiocarpa which have been planted in the course of returning farming land to forestry; impact also includes reduction of hay crop resources in the alluvial flat. In addition, acquisition will create some impact upon farmland and gardens. All the impact is partial and local, with nonnegative influence upon species reproduction and preservation. Construction of the Project will produce no destructive impact upon biodiversity or to the overall agriculture or forestry. There is no rare species of trees under impact, except for some historical trees.
� Impact upon historical trees During the construction period, impact upon historical trees is a sensitive point in such aspects as (a)direct influence to historical trees; (b)construction of the project will create negative impact upon growth of the historical trees (especially out of embankment protection works) (c) after reservoir filling the surrounding underground water will be raised to bring negative impact upon historical trees of low elevation (upon their root respiration)(d) damage of the construction to historical trees, upon their leaves, root, and stems. For detail see Chapter Seven concerning evaluation of impact upon historical trees.
� Impact upon province-level protection trees
There are 11 species of plants under province-level protection, including podocarpus macrophyllus, Osmanthus fragrans, camellia, mastic tree, Chinese holly, Ilex rotunda, Bischofia tyifliata, Gentiana scabra Bunge, Planchonella spp. , Sapindus mukorossi Gaerth and Asnaragus cochinchinensic. These species are mainly distributed in the herbages of shrub and underwood and in the broad-leaved forest close to villages. There is no such mentioned species in the project site, except for Gentiana scabra Bunge, Planchonella spp., Chinese holly, Asnaragus cochinchinensic occasionally in borrow earth pits. Anyway they are limited in number, with no large trees or historical treesall of which are dispersed species. The project will in no way threaten their survival or reproduction, and its impacts are slight.
6.3.2.2 Impact upon Terrestrial Animals
With broadening of the access roads, with construction machinery and constructors moving to the site, noise from the stockyard and from construction operation will change the habitat environment of the wild animals, to produce negative impact upon the habitat, life habit and residence thereof. Such influence is decided by various causes.
Construction will produce little impact upon terrestrial animals. Due to limited quantities of wild animals, which are mostly distributed in artificial forests and shrubs somewhat distant from the dam site in Yanxi, Chengjiang and Tongjianzhuang. They may be frightened from their original habitat, but they will return once the project is completed, thus such impact is temporary and will be finished with the completion of the project.
Amphibians undertake reproduction and ingestion in the underwood and the scrub forest. After reservoir filling, these places in the Shihutang Reservoir will be under inundation, to force these amphibians to move to shallow river bend or forks in the upper reach. Rhacophoridae is terricolous. The dam once completed will reduce its habitat and reduce its community. But to Bufo B.gargarizans Cantor that lives on farmland, gulch or villages, reservoir filling will enlarge its habitat, favorable for its development.
Bufo B.gargarizans Cantor and Zaocys dhumnades mainly inhabit close to moist and dark

6.0 Environment Impact Assessmen t
256
shrub, farmland, gulch or villages, by feeding on insects. Serpentry mostly live on low-relief terrain and hills in broad-leaved deciduous forest, mixed broadleaf-conifer forest or dark and moist brushwood, or farmland, to feed upon insects, Batrachia, birds or rats. During construction the construction materials and waste slag will change the river turbidness and other physicochemical propertiesto bring damage to the life habitat to these amphibians and reptiles. But they will move to non-construction areas or to non-inundation regions, thus there will be no threat to their survival. Numerous constructors working in the site may kill some wild animals, to damage these amphibians and reptiles resources. There shall be countermeasures to prevent such occurrence.
Ardeidae is the dominant bird in this area, which mainly inhibits in water surface and forests to feed upon fishes. Of beasts the dominant is Lepuscapensis. These dominant species will be under influence from construction to be forced to desert their original habitat. Adjacent beasts and birds will also be frightened to move away. But such impact is limited and will not last long. Re-vegetation of temporary acquisition of land will make them return to initial habitat.
Muridae (like Rattus norvegicus Berkenhout) overlaps a lot with human activities, which may inhibit at human houses or in outdoors and change with the seasons. In winter then food is rare outdoors, they will move to human houses. While in spring when it gets warm and there is plenty of food outdoors they will move outside. They are the source of natural focal infection. During construction their density will increase, therefore close observation shall be made to prevent any occurrence of natural focal infection.
6.3.2.3 Impact upon Aquatic Organism
� Impact upon benthonic organism
During the construction period, sand machinery will stir the bed silt and fine sand into moving upward to create a pinniform cloudy belt, to create negative impact upon aquatic organism, especially upon benthonic organism. Secondary settlement of sand from sand stirring will bury the benthonic organism nearbyto deteriorate their life habitat and make it impossible to survive, except for some species of strong adaptability, like mussel.
The construction will have benthonic organism in the reach suffer from complete destruction. Based on investigation in Shihutang concerning benthonic organism status, mean bio-mass of benthonic organism amounts to 76.4g/m2 if calculated at affected area of 104mu, estimated loss of benthonic organism totals about 5.24t.
� Impact upon fish stocks
For detail see Chapter Eigt concerning fishes and spawning grounds.
6.3.3 Impact upon Ecological Environment
6.3.3.1 Impact upon Terrestrial Plants
� Impact upon vegetation Direct impact from the Project upon vegetation is mainly in form of (a) permanent acquisition of land for pivotal projects (b) permanent acquisition of land for protection embankment (c) damage to vegetation during bank regulation(d) acquisition of stones and sand, and excavation waste dumpand (e) acquisition of land for temporary roads, etc. The major species of vegetation include Form Pinus massoniana, Form Pinus elliottii, shrub and
6.0 Environment Impact Assessmen t
257
meadow and artificial gardens (For detail see Table 6.21). There is no broad-leaved forest or native vegetation. Except for permanent acquisition of land, there is no re-vegetation for other kinds of land use. Except for limited historical trees, there is no rare plant community, all of which is local dispersed species.
� Impact upon biodiversity & plant resources Impact upon plant resources during the construction period includes destruction of some red pines, slash pines and sapling of Form Populus lasiocarpa which have been planted in the course of returning farming land to forestry; impact also includes reduction of hay crop resources in the alluvial flat. In addition, acquisition will create some impact upon farmland and gardens. All the impact is partial and local, with nonnegative influence upon species reproduction and preservation. Construction of the Project will produce no destructive impact upon biodiversity or to the overall agriculture or forestry. There is no rare species of trees under impact, except for some historical trees.
� Impact upon historical trees During the construction period, impact upon historical trees is a sensitive point in such aspects as (a)direct influence to historical trees; (b)construction of the project will create negative impact upon growth of the historical trees (especially out of embankment protection works) (c) after reservoir filling the surrounding underground water will be raised to bring negative impact upon historical trees of low elevation (upon their root respiration)(d) damage of the construction to historical trees, upon their leaves, root, and stems. For detail see Chapter Seven concerning evaluation of impact upon historical trees.
6.3.3.2 Impact of habitat upon animals
� Loss of Habitat After reservoir filling, the existing habitat for wild animals will be under flood inundation, which will reduce their habitat. For animals located in lower altitudes, such as reptiles and small beasts and serpentry, damage of initial habitat will force them to resettle upward. For birds and beasts initially inhabiting in lower altitudes shrub, meadows, their habitat will be partially damaged. But they are of resettlement capacity, with multiple sources of food, thus the project will not produce much influence upon them. After reservoir filling their prowl will decrease, but they will not be threatened.
� Impact of changed riverside landscape upon wetland animals Completion of the project will lift the water surface and enlarge waters, to create ideal habitat for static hydrocole amphibians like bufo gargarizans. Prowl and habitat for the waterfowl will vanish, thus original eco-function will be destroyed.
After reservoir filling, forest cover will create desirable conditions for such water birds as aigrette and grey heron, good for their reproduction.
6.3.3.3 Impact upon Plankton
Completion of the project will transform the river into lacustrine faciesso that nutritive materials will keep releasing during flood inundation and more nutritive materials will flow into the reservoir with the runoff, favorable for development of phytoplankton. After reservoir

6.0 Environment Impact Assessmen t
258
filling there will be numerous embayment where water is relatively static with limited concentration of nutritive salts, to create necessary conditions for survival and reproduction of plankton. Diatom, which was dominant, will be gradually replaced by chlorella. Moreover, in spring and autumn due to water convection, nutritive materials rich in subjacent waters will move to the surface water, desirable for phytoplankton, which lives and reproduces in sunshine layers. In spring, green algae will quickly multiply in species and quantity, followed by other species of algae. It may be safely estimated that on the reservoir the quantity and biomass of phytoplankton will reach peak in spring. In autumn when the air and water temperature is low, there will be no peak of phytoplankton.
In the river there is limited species and quantity of Cladocera and copepoda, which will increase in quantity and species, so will rotifer and protozoans. In spring there will be peak of plankton in quantity and biomass.
6.3.3.4 Impact upon Benthonic Organism
Completion of Shihutang Project will broaden the river, which will have no more torrents, not to create much impact upon benthonic organism. Numerous freshwater snails originally attached to nearshore rocks or stones will disappear due to increased water level, but formation of broader river channels will create better condition for freshwater snails. Where there is no torrent and water depth is over 10m, the freshwater snails will vanish, but waters of various hydraulic properties will create habitat for migratory fishes and non-migratory fishes, favorable for parasitic larva. In a word, completion of Shihutang Project produces little impact upon benthonic organism in species and quantity.
6.3.3.5 Impact upon Fish Stocks
Completion of Shihutang Project will produce change in some of the natural reach of Gan River close to Taihe Countyto create some impact to aquatic organism, so that original eco-balance is broken to establish fresh balance by way of fish regulation. For detail see Chapter Eight.
6.3.4 Impact upon Arable Land & Agricultural Activities during Operation Period
� Acquisition of arable land
Permanent and temporary acquisition of land will total 5725.9 mu of which permanent acquisition of land reaches 2977.3 mu including 198.27 mu of basic farmland temporary acquisition of land totals 2748.6 mu which will create some influence to agricultural activities. Permanent acquisition of land will involve only 1.18 of gross arable land (251295 mu), thus very limited in impact. By way of lifting the field and re-vegetation of temporary acquisition of land, crop loss may be compensated to some degree. Of the permanent acquisition of land, 198.27 mu is of basic farmland which shall be under acquisition in line with Laws of Protection of Basic Farmland. For such acquisition see Table6.3 2.

6.0 Environment Impact Assessmen t
259
Table 6.3 2 Percentage of Permanent Acquisition of Land in Gross Arable Land
Towns Gross affected arable land mu
Permanent acquisition mu
Percentage
Wanhe 71850 873.88 1.22% Yanxi 35670 1007.78 2.83% Tangzhou 50175 818.10 1.63% Chengjiang 31905 180.10 0.56% Mashi 60105 42.13 0.07% Wuxi 1590 55.31 3.48% Sum 251295 2977.3 1.18%
The permanent acquisition of land for Shihutang Project will total 198.27 mu. In line with Regulations of Protection of Primary Farmland and relevant laws and rules, the owner shall obtain permits from state land planning department for approval of the said acquisition of primary farmland. The owner shall make compensation for the occupied farmland in the principle of reclamation of the same amount of primary farmland. In case of impossibility to reclaim the same amount of farmland of identical quality, the owner shall pay fees to the province in line with relevant regulations concerning reclamation of farmland. The owner in this case shall recover the surface soil of the occupied arable land for improvement of the newly reclaimed land or poor arable land. at present the owner has entrusted the departments concerned with compilation of Amended Overall Planning of Land Utilization in Taihe County for Construction of Shihutang Project, and are undergoing relevant procedures and permits from the state land management department. The permanent acquisition of land (especially of arable land totaling 2977.3 mu and of primary land totaling 198.27 mu) has been listed in the said Amended Overall Planning, so that the project will achieve balance between acquisition of land and reclamation of farmland.
� Impact upon Grain Output Impact upon Grain Output in paddy fields: in accordance with statistics of 2005 yearbook the average early rice output in Taihe County was 301kg/mulate rice 306kg/mu so annual rice output totals 607kg/mu.
Annual loss in paddy fields from permanent acquisition of land: 607×775.4 470.7(t)
Annual loss in paddy fields from temporary acquisition of land in the first three years: 607×58.65×3=106.8(t)
Annual loss in paddy fields prior to lifting the field 607×1237.1=751(t)
Grain output will be reduced after restoration of farming even after termination of the temporary acquisition of land and after lifting the field.
Impact upon grain output in dry fields: investigation shows that in the project area there are mainly such dry crops as legume, tuber crops, oil-bearing crops and vegetable. Basic loss is calculated as follows:
Legume�68kg/mu×3673.2mu�249.8(t/a)
Tuber crops�264.9kg/mu×3673.2mu�973.0(t/a)
Oil-bearing crops �62.9kg/mu×3673.2mu�231.1(t/a)

6.0 Environment Impact Assessmen t
260
Vegetable:1849kg/mu×3673.2mu�6791.8(t/a)
At present, some of the existing farmland is frequently subject to impact from inundation, thus with lower yields. Shihutang Project will develop five protection zones in Taihe county city, Wanhe, Yongchang, Yanxi and Zhangtang, in order to improve the current flood standard from 2 to 5 year-recurrence to 10 to 20-year-recurrence. As result, the Project will have a total area of74.8 km2 and 650 million mu of cultivated land and 53000 residents under protection. By way of elevated fields on the left bank the tributary Yunting River and in Mawei city at the tail of the reservoir, a total area of 0.12 million mu of cultivated land will be brought under protection. This is very favorable for agricultural activities. Such temporary measures as elevation of farmland will compensate to some degree for agricultural losses. 6.3.5 Impact upon Productivity of Land
6.3.5.1 Biological Productivity
Biological productivity refers to the gross organic yield in unit area and unit time (t/hm2·a). this index reflects the productivity of green plants.
GLBP
RPP
qn
nq
++=
+=
Of which�Pq——gross mass growth�
Pn—— net mass growth�
R——quantity of consumption in respiration�
Bq——mass growth�
L——loss of dead branches and fallen leaves�
G——loss from animals ingestion
Coefficient of growth�
moqa BBP /=
Of which�Bmo——rated biomass
6.3.5.2 Biomass
Biomass refers to the weight of living organisms in unit area that exist during unit time, calculated at t/hm2.
Relative biomass�
momb BBP /=
Of which�Bm——rated biomass
6.3.5.3 Species Quantity
Species quantity refers to the amount of certain species in unit area in a community.
Relative species quantity�
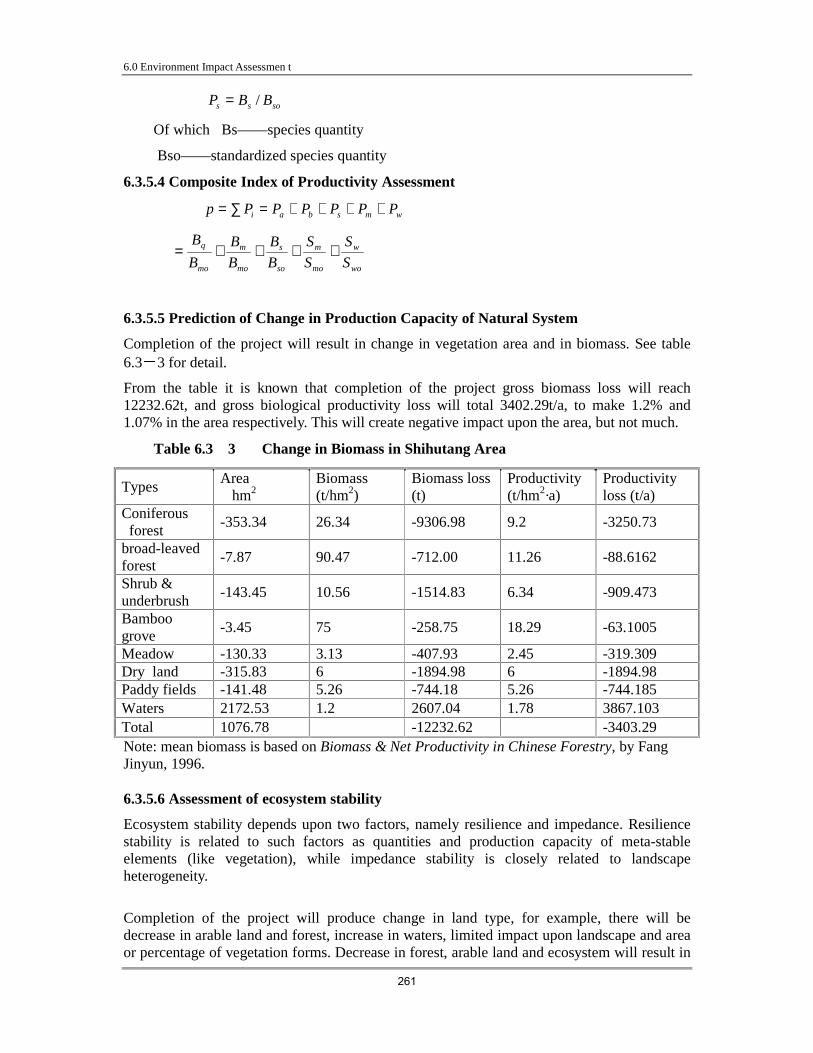
6.0 Environment Impact Assessmen t
261
soss BBP /=
Of which�Bs——species quantity�
Bso——standardized species quantity
6.3.5.4 Composite Index of Productivity Assessment
wmsbai PPPPPPp ++++=∑=
wo
w
mo
m
so
s
mo
m
mo
q
S
S
S
S
B
B
B
B
B
B++++=
6.3.5.5 Prediction of Change in Production Capacity of Natural System
Completion of the project will result in change in vegetation area and in biomass. See table 6.3 3 for detail.
From the table it is known that completion of the project gross biomass loss will reach 12232.62t, and gross biological productivity loss will total 3402.29t/a, to make 1.2% and 1.07% in the area respectively. This will create negative impact upon the area, but not much.
Table 6.3 3 Change in Biomass in Shihutang Area
Types Area �hm2�
Biomass (t/hm2)
Biomass loss (t)
Productivity (t/hm2·a)
Productivity loss (t/a)
Coniferous forest
-353.34 26.34 -9306.98 9.2 -3250.73
broad-leaved forest
-7.87 90.47 -712.00 11.26 -88.6162
Shrub & underbrush
-143.45 10.56 -1514.83 6.34 -909.473
Bamboo grove
-3.45 75 -258.75 18.29 -63.1005
Meadow -130.33 3.13 -407.93 2.45 -319.309 Dry land -315.83 6 -1894.98 6 -1894.98 Paddy fields -141.48 5.26 -744.18 5.26 -744.185 Waters 2172.53 1.2 2607.04 1.78 3867.103 Total 1076.78 -12232.62 -3403.29 Note: mean biomass is based on Biomass & Net Productivity in Chinese Forestry, by Fang Jinyun, 1996. 6.3.5.6 Assessment of ecosystem stability
Ecosystem stability depends upon two factors, namely resilience and impedance. Resilience stability is related to such factors as quantities and production capacity of meta-stable elements (like vegetation), while impedance stability is closely related to landscape heterogeneity.
Completion of the project will produce change in land type, for example, there will be decrease in arable land and forest, increase in waters, limited impact upon landscape and area or percentage of vegetation forms. Decrease in forest, arable land and ecosystem will result in

6.0 Environment Impact Assessmen t
262
decrease of biomass by 12232.62t and loss of productivity by 3402.29t/a. the project on the whole will cause limited interference, to produce not much change in ecosystem stability.
In Shihutang area the dominant vegetation is of artificial or semi-artificial coniferous forest Form Pinus massoniana and Slash Pine. Such community is monotonous in composition, unable to develop into bio-diversity, poor in timbre thus open to attack from insects, poor in self-adjustability, and imperfect in function. Study shows that artificial forest is inferior to natural forest in saturated soil water content and soil fertility, while suffers more from soil erosion, to play limited role in relief of ecological environment. Completion of the project will enlarge the waters to increase from 18.81km2 to 43.47km2(to account for 53.99 of local area). In a word, the project will produce much impact upon landscape heterogeneity and impedance.
6.3.5.7 Assessment of Comprehensive Prediction of Landscape Eco-system
A comparison is made of the amounts and area of the patch type. See Table 6.34. Superiority of the patch type after completion of the project is listed in Table 6.35.
From the two tables it is known that after completion of the project there is change in land use patterns, of which the waters patch will play a bigger role due to construction of navigation and hydropower generation works, to improve its dominance index from 16.94(before the completion of the project) to 37.04, and the degree of dominance of land for building improves too, while there is decrease in dominance index of other patches. The dominance index of waters increases by 20.10, very high above normal. In a word, the project will create much impact upon landscape.
Table 6.3 4 Comparison of Amounts & Area of Patch Types before & after
Completion of Shihutang Project
Before completion After completion Patch type Patches Area �km2� Patches Area �km2�
Forest land 338 323.88 326 320.23 Shrub grassland 40 109.35 42 107.92 waters 40 43.93 37 65.66 Land for urban/rural construction and mining
57 9.83 57 9.79
Paddy fields 97 182.69 87 181.28 Dry land 115 146.95 118 160.45
Unused land 33 78.54 27 76.82

6.0 Environment Impact Assessmen t
263
Table 6.3 5 Dominance Index of Major Patch Types before & after Completion of
Shihutang Project
Rd��� Rf��� Lp��� Do��� Patch types
Before After Before After Before After Before After
Forest land 46.94 46.97 48.81 48.81 36.18 34.73 42.03 41.31
Shrub grassland 5.56 6.05 72.31 72.31 12.22 11.70 25.57 25.44
Waters 5.56 5.33 7.16 7.16 4.91 7.12 5.63 6.68 Land for residents/ enterprises /mines
7.92 8.21 35.29 35.29 1.10 1.06 11.35 11.41
Paddy fields 13.47 12.54 49.71 49.71 20.41 19.66 26.00 25.39
Dry land 15.97 17.00 56.23 56.23 16.42 17.40 26.26 27.01
Unused land 4.58 3.89 9.24 9.24 8.77 8.33 7.84 7.45
As above-mentioned, completion of the Project will change existing land use patterns to produce impact upon natural system. The project will involve self-adjustability of the ecosystem, landscape engineering and resilience of vegetation, the character and function of natural system will be restored. Moreover, attention shall be paid to preservation of the ecosystem so that the affected natural productiveness of the ecosystem will be restored as soon as possible. Anyway, the project produces limited impact upon ecosystem stability or upon landscape heterogeneity. Such impact is acceptable to regional natural system.
Cascade development of Kan River will artificially cut the river into 9 or 11 reaches, of which 8 or 10 will be of river-type reservoir, which will totally change the natural landscape, to produce damage to some degree in terms of integrity and continuity of natural landscape.
6.3.6 Ecological Water Consumption Downstream
There are numerous methods to calculate base ecological flow within the basin, each focusing upon different aspects. According to the characteristics in this basin, base ecological flow is udder calculation by "the average monthly base" and "Tennant", in addition to comparative analysis.
(1) Mean monthly flow in the driest season
On the basis of data in terms of monthly runoff collected in Dong back Hydrometric Station and Linken Hydrometric Station from 1957 to 2005, the mean monthly flow can be obtained from section year the flow; the smallest sampling method shows that the mean monthly flow at Shihutang dam site is 163m3/s in the driest month at 90% of assurance rate.
(2) Tenant Method
On the basis of the average monthly flow at Shihutang dam site, it is known that annual mean flow therein is 1150 m3/s; by Tenant method, namely at 10% of annual mean flow, the ecological base flow for this basis is 115 m3/s.

6.0 Environment Impact Assessmen t
264
Shihutang Project is mainly for shipping, to be complemented from power generation, flood control and other comprehensive utilization purposes. To meet the need for navigable channel is the most important objective during construction period, when the discharge shall be kept at187 m3/s. furthermore, in the near future the flow at the ship lock will be 11.24m3/s�and 15.31m3/s in the long run. The minimum guaranteed flow is 198.24 m3/s in the near future and 202.31 in the long run m3/s. This shows that during the period of operation of the project the discharge flow meets the base flow for downstream ecological water consumption, to produce no significant impact upon downstream ecological environment. In initial storage the base flow shall remain at 187 m3/s to satisfy the need for water consumption for downstream ecology and water consumption units. Base flow from Wan’an Power Plant is about 130 m3/s (135 m3/s after the completion of Taihe Hydropower Station). Between the 38km-long reach from Shihutang to Taihe there are three tributaries, of which Yunting River has a catchment area of 763 km2 with annual mean flow at about 22.1 m3/s; Shu River has a catchment area of 1305 km2 with mean annual flow at about 37.8 m3/s; mean annual flow form the two tributaries amount to about 59.9 m3/s (Guanyuan River has a catchment area of 558 km2 with annual mean flow at about 16.2 m3/s; its inflow is under diversion by Wanhe Diversion & Drainage Canal to downstream). Evidently, at Shihutang dam site the base flow (187 m3/s) is guaranteed. Base flow at 187m3/s is equivalent to base output of 15 MW. Shihutang will have 6 turbine generating units, each having an installed capacity of 19.5 kW at rated flow of 420 m3/. The said unit can generate power at 30% of the lowest rated flow 30% (126 m3/s).
6.3 .7 Water & Soil Conservation
6.3.7.1 Prediction of Water & Soil Erosion during Constructing Period
� Area of perturbed topography and damaged land and vegetation Permanent acquisition of land includes acquisition of land for the pivotal project, for embankment protection, for projects for stagnant water drainage, for reservoir inundation and for resettlement of affected residents, etc. Permanent acquisition of land totals 2843.41hm2, of which paddy fields amount to 51.69hm2 dry land 150.39hm2, gardens 6.96hm2, forest land 231.22hm2, uneven ground 184.66hm2, building lot for residents 7.76hm2, unused land 36.24hm2 and waters total 2172.8hm2. Temporary acquisition of land consists of land for living quarters, for auxiliary enterprises, for construction road, for borrow pit, for sand stocking yard and spoil areas, to amount to 451.26hm2 in all, including paddy fields of 86.13hm2 dry land of 94.49hm2, forest land of 66.72hm2, uneven ground of 63.83hm2, and alluvial land of 140.11hm2.
Perturbed topography aggregates 3294.67hm2 damaged acreage 624.93hm2 and damaged vegetation 302.44hm2.
� Area of damaged water and soil conservation facilities
Damage to facilities concerning water and soil conservation lies in damage and acquisition of water and soil conservation facilities so that their function is deprived of. But such acquisition of water and soil conservation facilities does not destroy the facilities concerned. Damage to water and soil conservation facilities amounts to 302.44hm2 in area (excluding forest or meadow area of flood inundation . For detail see Table 6.3 6.

6.0 Environment Impact Assessmen t
265
Table 6.3 6 Index In Kind of Damaged or Appropriated Water & Soil Conservation
Facilities Unit hm2
Item Sum Forest land Uneven ground Nature
Nodal region 18.27 4.80 13.47 Permanent Embankment protection
3.33 3.33 Permanent
Construction site 150.29 82.49 67.80 Permanent Construction detour
18.51 15.18 3.33 Temporary
Borrow earth pits 13.71 7.21 6.50 Temporary Excavation waste dump
15.62 10.46 5.16 Temporary
Total 82.71 33.87 48.84 Temporary � Prediction of construction spoil �Construction spoil out of excavation
During the construction period, excavation spoil will total 314.10×10⁴m3.
�Construction spoil out of stockyard mining
In the trunk channel of the project all together 13 borrow earth pits will be developed to total 34.53hm2 in area out of arable land, forest land and wasteland. Mined soil will aggregate 48.47×10⁴m3 to this end surface soil about 0.2 0.3m will be stripped (such top soil will total 10.36×10⁴m3. such stripped top soil is of temporary spoil to be piled together for backfilling after completed mining of the stockyards.
�Construction spoil in host area
Resettlement of affected residents is in form of rural resettlement, all in form of local integration. There will be 744 immigrants for resettlement for acquisition of land totaling 5.21hm2. Immigrants amount to 197 households in need of building new houses, if calculated at 17m3of construction spoil, total construction spoil in housing will amount to 3349 m3. Such spoil will be disposed of to the low-lying areas around the villages.
Construction spoil will total 324.8 ×10⁴m3.
6.3.7.2 Prediction of new coming water and soil erosion area
� Prediction method parameters
Water and soil erosion produced during the construction period comes mainly from two parts: (a) perturbed and damaged topography, damaged and appropriated land and vegetation, which will disfunction water and soil conservation and aggravate soil corrosion; (b) construction spoil in construction of the project will add to water and soil erosion due to unreasonable placing.
Soil loss amount is calculated as follows:

6.0 Environment Impact Assessmen t
266
� Gross amount of water and soil erosionWgross=� Fi×Mri×Ti
� Added amount of water and soil erosion Wfresh=� Fi× Mri—M0 ×Ti
Of which Wgross—gross amount of water and soil erosion t
Wfresh—added amount of water and soil erosion t
Fi—perturbed area in each district hm2
Mri—soil corrosion modulus after perturbation t/km2.a
M0—soil corrosion modulus before perturbation t/km2.a
Ti—perdition duration a
� Prediction of soil corrosion modulus
Predicted value of soil corrosion modulus is listed in Table 6.3 7.
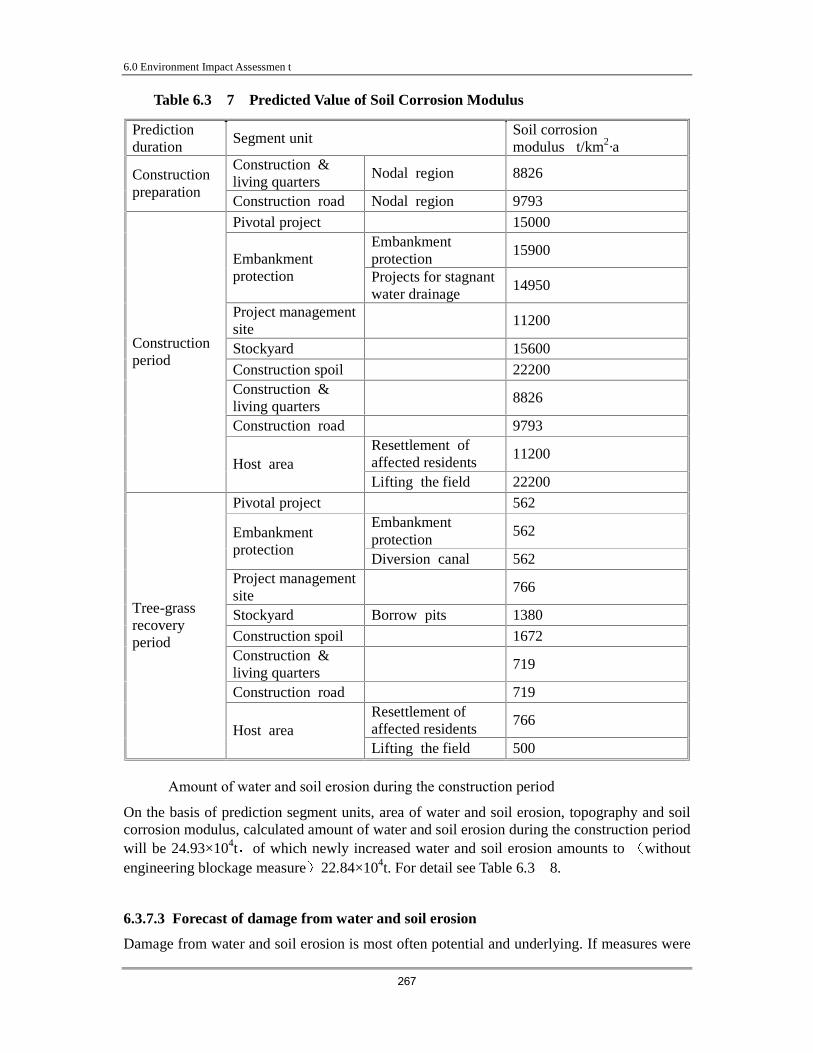
6.0 Environment Impact Assessmen t
267
Table 6.3 7 Predicted Value of Soil Corrosion Modulus
Prediction duration
Segment unit Soil corrosion modulus�t/km2·a�
Construction & living quarters
Nodal region 8826 Construction preparation
Construction road Nodal region 9793
Pivotal project 15000 Embankment protection
15900 Embankment protection Projects for stagnant
water drainage 14950
Project management site
11200
Stockyard 15600
Construction spoil 22200 Construction & living quarters
8826
Construction road 9793 Resettlement of affected residents
11200
Construction period
Host area Lifting the field 22200
Pivotal project 562 Embankment protection
562 Embankment protection
Diversion canal 562 Project management site
766
Stockyard Borrow pits 1380
Construction spoil 1672 Construction & living quarters
719
Construction road 719 Resettlement of affected residents
766
Tree-grass recovery period
Host area Lifting the field 500
� Amount of water and soil erosion during the construction period
On the basis of prediction segment units, area of water and soil erosion, topography and soil corrosion modulus, calculated amount of water and soil erosion during the construction period will be 24.93×10⁴t of which newly increased water and soil erosion amounts to without engineering blockage measure 22.84×10⁴t. For detail see Table 6.3 8.
6.3.7.3 Forecast of damage from water and soil erosion
Damage from water and soil erosion is most often potential and underlying. If measures were

6.0 Environment Impact Assessmen t
268
adopted to control water and soil erosion after such damage occurred, land resources would be damaged and productivity of land would be lowered and there would be more channel sedimentation. And such control works would be costly, challenging and unfruitful. If without full consideration to control of water and soil erosion in engineering design and construction, there would be such damage as follows:
� Damage to the works itself
Earth excavation and earth-rock fill will severely threaten the stability of soil stratum, only to aggravate water and soil erosion. Especially in areas potential to such damage as landsliding and bank sloughing and debris flow, works construction may result in flourishing of such geologic hazards. If without timely control measures, occurrence of such mentioned hazards will create severe impact upon the smooth progress of the project.
� Damage to ecological environment
During the construction periodoriginal topography will be under severe perturbation, with topsoil and vegetation under serious damage, which will greatly reduces soil resistance to corrosion. The project will involve such areas as residents’ settlement, land for farming and rivers and streams. Any neglect of temporary control of water and soil erosion will result in desirable increase in runoff sedimentation in rainy seasons, which will deposit to block the dam or channel to produce negative impact upon flooding or water transmission. In dry season such neglect will produce a lot of dust to be unfavorable to people’s production or living, unfavorable to vegetation growth only to worsen ecological environment.
� Damage to downstream and surrounding areas
In such measures as concerning construction management and construction spoil control failed to be undertaken, there would be a lot of construction spoil under discharge to produce damage to downstream production and living.
� Such discharge of construction spoil will lower productivity of land and crop output.
Perturbed topography will aggravate water and soil erosion, lessen soil thickness, reduce soil fertility and therefore lower the productivity of land part of the water and soil erosion flows along the gulch and slopes into arable land to create sedimentation there or even to cover the crops to affect crop output.
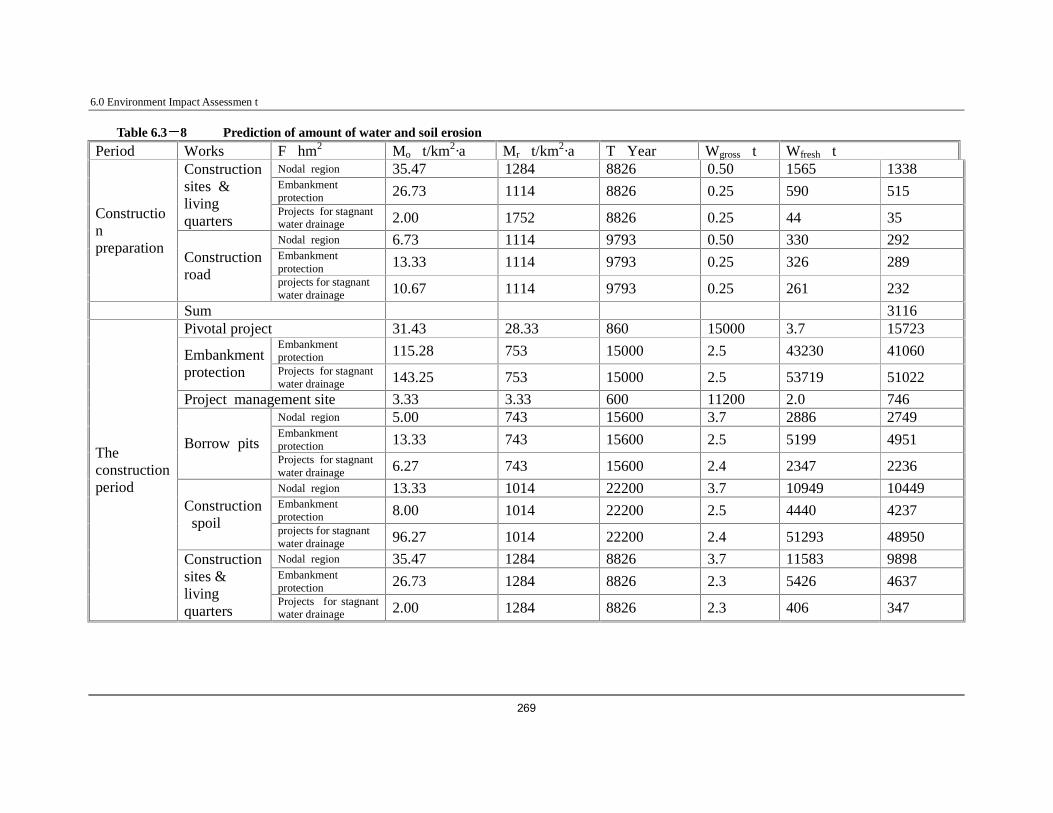
6.0 Environment Impact Assessmen t
269
Table 6.3 8 Prediction of amount of water and soil erosion Period Works F�hm2� Mo�t/km2·a� Mr�t/km2·a� T�Year� Wgross�t� Wfresh�t�
Nodal region 35.47 1284 8826 0.50 1565 1338 Embankment protection 26.73 1114 8826 0.25 590 515
Construction sites & living quarters
Projects for stagnant water drainage 2.00 1752 8826 0.25 44 35 Nodal region 6.73 1114 9793 0.50 330 292 Embankment protection 13.33 1114 9793 0.25 326 289
Construction preparation
Construction road
projects for stagnant water drainage 10.67 1114 9793 0.25 261 232
Sum 3116 Pivotal project 31.43 28.33 860 15000 3.7 15723
Embankment protection 115.28 753 15000 2.5 43230 41060 Embankment
protection Projects for stagnant water drainage 143.25 753 15000 2.5 53719 51022
Project management site 3.33 3.33 600 11200 2.0 746 Nodal region 5.00 743 15600 3.7 2886 2749 Embankment protection 13.33 743 15600 2.5 5199 4951 Borrow pits Projects for stagnant water drainage 6.27 743 15600 2.4 2347 2236
Nodal region 13.33 1014 22200 3.7 10949 10449 Embankment protection 8.00 1014 22200 2.5 4440 4237 Construction
spoil projects for stagnant water drainage 96.27 1014 22200 2.4 51293 48950 Nodal region 35.47 1284 8826 3.7 11583 9898 Embankment protection 26.73 1284 8826 2.3 5426 4637
The construction period
Construction sites & living quarters
Projects for stagnant water drainage 2.00 1284 8826 2.3 406 347
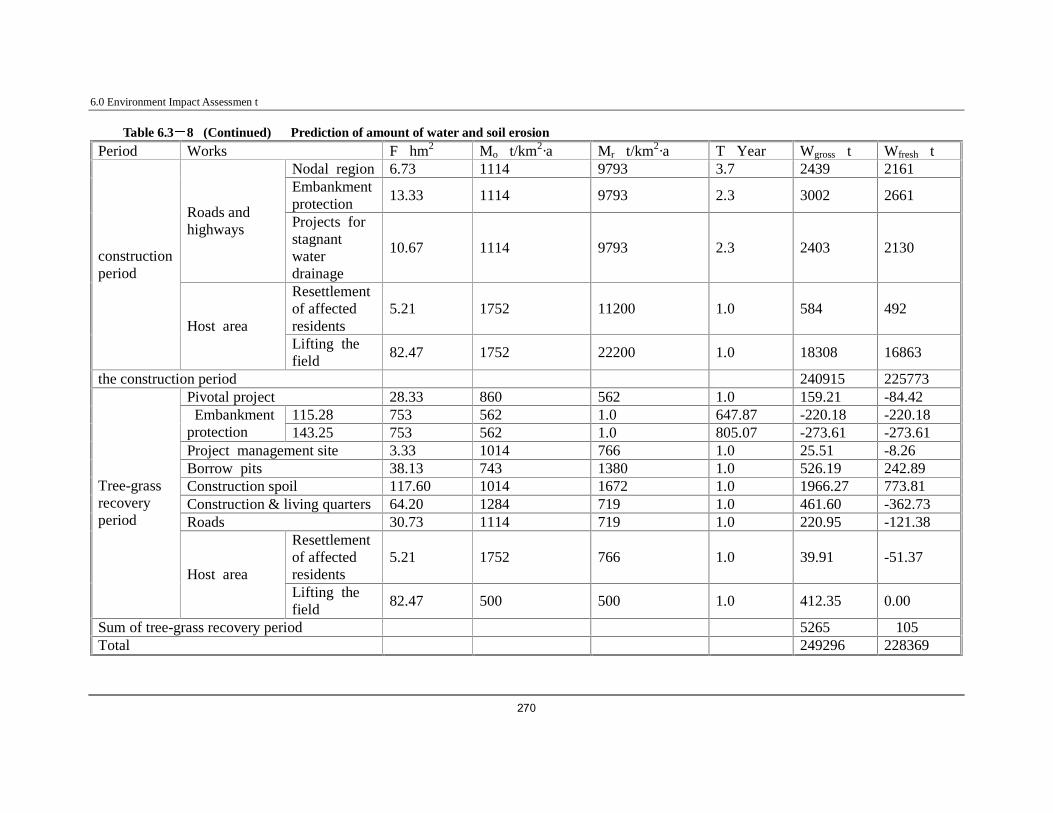
6.0 Environment Impact Assessmen t
270
Table 6.3 8 (Continued) Prediction of amount of water and soil erosion Period Works F�hm2� Mo�t/km2·a� Mr�t/km2·a� T�Year� Wgross�t� Wfresh�t�
Nodal region 6.73 1114 9793 3.7 2439 2161 Embankment protection
13.33 1114 9793 2.3 3002 2661 Roads and highways Projects for
stagnant water drainage
10.67 1114 9793 2.3 2403 2130
Resettlement of affected residents
5.21 1752 11200 1.0 584 492
construction period
Host area Lifting the field
82.47 1752 22200 1.0 18308 16863
the construction period 240915 225773 Pivotal project 28.33 860 562 1.0 159.21 -84.42
115.28 753 562 1.0 647.87 -220.18 -220.18 Embankment protection 143.25 753 562 1.0 805.07 -273.61 -273.61 Project management site 3.33 1014 766 1.0 25.51 -8.26 Borrow pits 38.13 743 1380 1.0 526.19 242.89 Construction spoil 117.60 1014 1672 1.0 1966.27 773.81 Construction & living quarters 64.20 1284 719 1.0 461.60 -362.73 Roads 30.73 1114 719 1.0 220.95 -121.38
Resettlement of affected residents
5.21 1752 766 1.0 39.91 -51.37
Tree-grass recovery period
Host area Lifting the field
82.47 500 500 1.0 412.35 0.00
Sum of tree-grass recovery period 5265 �105 Total 249296 228369

6.0 Environment Impact Assessmen t
271
6.3.8 Analysis of Environmental Reasonableness of Permanent Acquisition of Land
Permanent acquisition of land totals 42525.15muof which the pivotal project will cover an area of 424.95mu, the inundation an area of 38172.15muembankment protection 3877.95 mu and project management an area of 49.95mu. Such acquisition of land consists of (a) dry land, floodland meadow, unused landpartial paddy fields and forest land for the pivotal project (b) dry land, forest land, unused land, shrub grassland and meadow for embankment protection floodland meadow, sand spit, nearshore shrub grassland, limited arable land and forest land for flood inundation, etc. Engineering works will cover such land as for gardens (mainly of tea and orange), to plan for building lot for residents. On the whole, permanent acquisition of land does not produce much negative impact upon local social or economic development. Use of land is convenient to restore eco-system, thus reasonable from the eye of environment.
6.3.9 Analysis of environmental reasonableness of temporary acquisition of land &
construction sites
6.3.9.1 Suitability of workyard with environmental sensitive objects
Field investigation shows that located on the right bank of the dam are such environmental sensitive objects as Shihutang Villageabout 400m downstream of the recommended dam site , Sangfu Primary Schoolabout 500m downstream of the recommended dam siteand Jiangjia Village 450m upstream of the recommended dam siteabout 150m from the ship lock . There are rural houses between the Sangfu Primary School and workyard, long in distance between, to suffer limited impact from works construction. In concrete layout of the works, such noisy and dusty structure as spoils, concrete batching plants, compressed air stations, sand and stone processing plants and oil tankage have been under layout near the shore, far away from the mentioned objects, to minimize the negative impact upon them. In a word, there is reasonableness in layout of the construction plane on the right bank.
Located on the left bank of the dam are such environmental sensitive objects as Lingbei Village, Xiayinxia Village about 500m on the upper stream of the dam site, on the left bank . In concrete layout of the works, such noisy and dusty structure as spoils, concrete batching plants, compressed air stations, sand and stone processing plants and oil tankage have been under layout near the shore, far away from the mentioned objects, to minimize the negative impact upon them. In a word, there is reasonableness in layout of the construction plane on the right bank.
In a word, the layout of workyard is reasonable from the point of environmental protection.
6.3.9.2 Analysis of Environmental Reasonableness of Temporary Acquisition of Land
In line with the topography of the site, the workyard is under layout on the left and right bank. To be exact, on the left bank workyard are located such temporary facilities as sand and stone processing plants, concrete mixing plants, steel and timbre processing plants, mechanical repair and replacement system, parking lots and carshops, warehouses of various facilities and equipment, houses for management and welfare, etc. While in contrast, on the right bank workyard are located such temporary facilities as sand and stone processing plants, concrete mixing plants, steel and timbre processing plants, mechanical repair and replacement system,

6.0 Environment Impact Assessmen t
272
parking lots and carshops, warehouses of various facilities and equipment, houses for management and welfare, etc. Temporary acquisition of land for construction encampment and auxiliary enterprises amounts to 963.15muincluding 37.2mu of paddy fields 493.95mu of dry land and 227.7mu of forest land. Temporary acquisition of land in pivotal works for construction encampment and auxiliary enterprises totals 532.05mu consisting of paddy fields (37.2mu)dry land (218.1mu) and forest land (122.4 mu). See Table 6.39.
Table 6.3 9 Temporary Acquisition of Land for Construction Encampment &
Auxiliary Enterprises
Items Unit Area Paddy fields
Dry land
Garden Forest land
Uneven ground
Alluvial land
Pivotal project mu 532.05 37.2 218.1 0 122.4 0 154.35
Embankment protection
mu 400.95 0 269.85 0 96.3 34.95
Projects for stagnant water drainage
mu 30.0 0 6 0 9 15
Total mu 963.15 37.2 493.95 0 227.7 49.95 154.35
In terms of layout of the nodal region workyard, a temporary acquisition of 532.05 mu for construction encampment and auxiliary enterprises is reasonable. For the sake of protection arable land, especially of paddy fields, there shall be proper adjustment of workyard on the left bank, to try to avoid temporary acquisition of 37.2 mu of paddy fields.
In terms of layout of the embankment protection workyard, a temporary acquisition of 400.95 mu for construction encampment and auxiliary enterprises is reasonable. For the sake of protection arable land, there shall be proper adjustment of workyard to try to avoid temporary acquisition of dry field.
In a word, after undertaking of all necessary measures concerning water and soil conservation, there is reasonableness for temporary acquisition of land for construction encampment and auxiliary enterprises.
6.3.10 Analysis of Environmental Reasonableness of Temporary Acquisition of Land for
Stockyards
The project plans to have 17 stockyards, to cover an area of 2391.9 mu, of which dry land totals 283.65mu forest land 156.9mu uneven ground 77.4muand alluvial land 1873.95mu. For detail of the stockyards see Table 6.310.
In terms of road distribution, transport distance, stockyard and surrounding environment and acquisition of farmland, layout of stockyards take into consideration both the convenience of transport and impact upon surrounding environment. Stockyards shall be located in the alluvial land, is possible, to minimize acquisition of farmland. In line with the principle of concentrated location of stockyards, it is recommended that the Huangken Stockyard and Zouken will be combined into one, to cancel the Zouken Stockyard; that Futang Stockyard be cancelled to include in Lianhuatang Stockyard; that Wanheti Stockyard be cancelled to

6.0 Environment Impact Assessmen t
273
include in Chenjia Stockyard; that Bailiangang Stockyard and Lijia Stockyard and Tianhong Stockyard be cancelled to include in Shiihutang Stockyard. After such adjustment there will be only 11 stockyards, to decrease acquisition of land by 77.4 mu (5.16 hm2).
In a word, selection of borrow pits in this project follows the principles of minimum impact upon environment and principles of best solution of conflicts of borrow and acquisition of land. Meanwhile there are measures of reclamation or vegetation restoration concerning the stockyard in line with land utilization planning and concrete situations, so that temporary acquisition of land will be basically under reclamation or vegetation restoration. Adoption of proposals in this Statement and undertaking of various engineering measures concerning water and soil conservation, layout of stockyards is reasonable in terms of environmental protection.
Chenjia Borrow Pits
Sand gravel stockyard Shihutang Borrow Pits

6.0 Environment Impact Assessmen t
274
Huangkeng Borrow Pits Zoukeng Borrow Pits
Xigang Borrow Pits Lianghuatang Borrow Pits
Futang Borrow Pits Sixth farm Borrow Pits
Xiejia Borrow Pits Lianxi Stockyard

6.0 Environment Impact Assessmen t
275

6.0 Environment Impact Assessmen t
276
Table 6.3—10 Summary of Environmental Reasonableness of Stockyards Layout No Names Environmental introduction Reserve
(104m2) Area (hm2)
Analysis & Suggestion
I Hub Stockyard 55.0 1 gravel stones On the alluvial land on the right bank,
mainly under submarine mining 200 50 Reasonable in terms of road distribution,
transport distance and spoil ground environment status quo
2 Gravel Procurement will total 2.99 * 104 m3 3 Shihutang On the second bottom on the right bank,
mainly of pine wood, with partial waste land
36 2 Reasonable in terms of road distribution, transport distance and spoil ground environment status quo
4
Stockyard
Xiejia On the left bank second bottom, mainly of dry land, with partial pine wood
96 3 Reasonable in terms of road distribution, transport distance and spoil ground environment status quo
II Drainage works stockyard 6.67 1 Bainigang Of low hills, mainly of pine wood with
partial dry land 80 2.00 Cancelled to include in Shihutang
Stockyard 2 Lijia Of low hills, mainly of pine wood with
partial dry land 80 2.00 Cancelled to include in Shihutang
Stockyard 3
Earth S
tockyard Tianhong Of low hills, mainly of pine wood with partial dry land
30 2.67 Cancelled to include in Shihutang Stockyard
4 Sand and gravel stockyard For procurement III Embankment stockyard 23.26 1 Xigang Of dry land for pine 96 5.80 Reasonable in terms of road distribution,
transport distance and spoil ground environment status quo
2
Ea
rth stockyard
Hunagken Of low hills, high in EL, mainly of pine wood
100 4.20 Reasonable in terms of road distribution, transport distance and spoil ground environment status quo

6.0 Environment Impact Assessmen t
277
No Names Environmental introduction Reserve (104m2)
Area (hm2)
Analysis & Suggestion
Zouken 0 Cancelled to include in Shihutang Stockyard
3 Laodongtang Of low hills, high in EL, mainly of pine wood
30 5.13 Reasonable in terms of road distribution, transport distance and spoil ground environment status quo
4 No 6 Farmland Of low hills, now serving as earth stockyard
140 1.33 Reasonable in terms of road distribution, transport distance and spoil ground environment status quo
5 Futang Of low hills, high in EL, with partial pine wood
240 1.20 Cancelled to include in Lianhuatang Stockyard
6 Lianhuatang Of low hills, now serving as earth stockyard
80 1.07 Reasonable in terms of road distribution, transport distance and spoil ground environment status quo
7 Wanheti In belt form along the embankment line, basically of dry land
30 3.66 Cancelled to include in Chenjia Stockyard
8 Chenjia Of low hills, high in EL, mainly of pine wood
30 74.93 Reasonable in terms of road distribution, transport distance and spoil ground environment status quo
9
Sand and gravel Alluvial land 159.46 Reasonable in terms of road distribution, transport distance and spoil ground environment status quo

6.0 Environment Impact Assessmen t
278
6.3.11 Analysis of Environmental Reasonableness of Excavation Waste Dump
There will be 38 construction spoil grounds in this Project, with the spoil to total 314.1×10⁴m3 to cover an area of 117.61hm2. There will be 4 such spoil grounds on the left and right bank, which is flat as a pancake so that the spoil grounds are located in the bowl-shaped depression, to appropriate a part of dry land. Due to the lengthy works of embankment protection and projects for stagnant water drainage, spoil will be under local placing in flat areas, depression, slight grade, and valley or gully (mostly in flat foot of slope and depression). Most of such acquisition is of waste land, forest land and arable land. For detail of construction spoil, see Table 6.3 11; fro layout of construction spoil grounds, see Attached Drawing No 20 22; for detail of construction spoil grounds in quantity and types, see Table 6.3 12.
Wanhe Construction Spoil Ground Yanxi Construction Spoil Ground
Table 6.3 11 Amount/Types of Temporary Acquisition of Land for Construction Spoil
Grounds
Items Unit Area Paddy fields
Dry land
Garden Forest land
Uneven ground
Alluvial land
Pivotal project
mu 199.95 13.95 82.05 � 46.05 � 58.05
Embankment protection
mu 120.3 � 81 � 28.8 10.5 �
Projects for stagnant water drainage
mu 1444.05 � 288.75 � 433.2 722.1 �
Total mu 1764.3 13.95 451.8 � 508.05 732.6 58.05
Analysis indicates there is reasonableness for layout of construction spoil grounds in the nodal region (Temporary acquisition of land amounts to 199.95 mu). For protection of arable land, especially of paddy fields, there shall be adjustment of No 1 spoil ground on the left bank of the nodal region, to try to avoid the paddy fields of 13.95mu.
There is reasonableness for temporary acquisition of 1564.35mu of land for construction spoil grounds in embankment protection works and Projects for stagnant water drainage.

6.0 Environment Impact Assessmen t
279
Construction spoil grounds to this end will occupy an area of 369.75mu of dry land, which is capable of restoration to dry land or paddy fields after completion of the project.
In terms of environmental protection, layout of construction spoil grounds shall take into consideration both traffic convenience and avoidance of impact upon environment. Such construction spoil grounds shall make full use of flat depression, gully or valley, and unused alluvial land. Water and soil conservation programs shall involve construction of slag trap walls and drain ditch. For any spoil grounds capable of reclamation, stripped top soil shall be returned, otherwise there shall be engineering protection measures or vegetation cover measures. In a word, layout and acquisition of land for this Project is reasonable from the point of environmental protection.

6.0 Environment Impact Assessmen t
280
Table 6.3—12 Reasonableness Analysis of Construction Spoil Grounds
Type of land(hm²) Location
Spoil ground
Area (hm²)
Qty (104m³)
Mean height�m�
Topography Land Wood
Wasteland
alluvial
Suitability analysis & comment
In hub 13.33 112.12 6.40 3.07 � 3.87
1# 5.00 35.77 7.14 Flat low land
2.40 1.15 1.45 For adjustment to avoid acquisition of paddy fields (13.95 mu) Left
bank 2# 3.73 28.57 7.65
Flat low land
1.79 0.86 1.08 This stockyard is suitable considering existing roads, transport distance and ecological condition
3# 2.47 24.99 10.13 Flat low land
1.18 0.57 0.72 This stockyard is suitable considering existing roads, transport distance and ecological condition Right
bank 4# 2.13 22.85 10.71
Flat low land
1.02 0.49 0.62 This stockyard is suitable considering existing roads, transport distance and ecological condition
Embankment works
8.01 36.91 5.39 1.93 0.69
Wanhe 1# 1.67 7.93 4.75 Low land 1.51 0.15 Recommendation: cancel to be incorporated into No1 Wanhe drainage
works spoil ground.
Zha
ngtan
1# 0.20 0.98 4.90 Flat low land
0.21 Recommendation: cancel to be incorporated into No 8 Wanhe drainage works spoil ground.
1# 0.81 4.00 4.94 Flat low land
0.16 0.65 This stockyard is suitable considering existing roads, transport distance and ecological condition
2# 0.80 3.00 3.75 Flat low land
0.56 0.24 Recommendation: cancel to be incorporated into No 1 Jintan spoil ground.
3# 0.80 4.00 5.00 Flat low land
0.56 0.24 Recommendation: cancel to be incorporated into No 4 Jintan spoil ground.
Jintan
4# 1.06 5.30 5.00 Flat low land
0.52 0.54 This stockyard is suitable considering existing roads, transport distance and ecological condition
Ya
nxi 1# 0.90 4.50 5.00 Flat low land
0.63 0.27 Recommendation: cancel to be incorporated into No1 Yanxi drainage works spoil ground.

6.0 Environment Impact Assessmen t
281
Type of land(hm²) Location
Spoil ground
Area (hm²)
Qty (104m³)
Mean height�m�
Topography Land Wood
Wasteland
alluvial
Suitability analysis & comment
2# 1.10 3.80 3.45
Flat low land
0.77 0.33 Recommendation: cancel to be incorporated into No 3 Yanxi drainage works spoil ground.
County
town 1# 0.67 3.40 5.07
Sloping field
0.47 0.20 Recommendation: cancel to be incorporated into No 1 County spoil ground.
Drainage works
96.27 165.07 19.25 28.88 48.14
1# 1.00 1.02 Abandoned to the canal
1.00 This stockyard is suitable considering existing roads, transport distance and ecological condition
2# 0.53 1.60 3 Slope toe 0.53 Recommendation: cancel to be incorporated into No 6 Wanhe spoil ground.
3# 1.00 3.00 3 Flat land 1.00 Recommendation: cancel to be incorporated into No 6 Wanhe spoil ground.
4# 2.13 6.40 3 Flat land 2.13 Recommendation: cancel to be incorporated into No 6 Wanhe spoil ground.
5# 1.20 3.60 3 Flat land 1.20 Recommendation: cancel to be incorporated into No 6 Wanhe spoil ground.
6# 38.67 28.21 1 Strake wasteland
18.97 19.69 This stockyard is suitable considering existing roads, transport distance and ecological condition
7# 0.47 1.40 3 Valley 0.14 0.33 Recommendation: cancel to be incorporated into No 8 Wanhe spoil ground.
8# 3.33 14.00 3 Strake wasteland
4.01 0.66 This stockyard is suitable considering existing roads, transport distance and ecological condition
9# 2.33 7.00 3 Strake wasteland
2.33 Recommendation: cancel to be incorporated into No 8 Wanhe spoil ground.
10# 2.33 7.00 3 Flat land 2.33 Recommendation: cancel to be incorporated into No 8 Wanhe spoil ground.
11# 2.00 6.00 3 Strake wasteland
1.00 1.00 This stockyard is suitable considering existing roads, transport distance and ecological condition
12# 8.67 19.00 3 Valley 1.73 6.93 Recommendation: cancel to be incorporated into No 11 Wanhe spoil ground.
13# 3.33 10.00 3 Slope toe flat land
3.33 This stockyard is suitable considering existing roads, transport distance and ecological condition
Wanhe
14# 2.00 6.00 3 valley 1.00 1.00 This stockyard is suitable considering existing roads, transport distance and ecological condition

6.0 Environment Impact Assessmen t
282
Type of land(hm²) Location
Spoil ground
Area (hm²)
Qty (104m³)
Mean height�m�
Topography Land Wood
Wasteland
alluvial
Suitability analysis & comment
15# 4.00 12.00 3 Flat slope 4.00 Recommendation: cancel to be incorporated into No 13 Wanhe spoil ground.
Location
Spoil ground
Area (hm²)
Qty (104m³)
Mean height�m�
Topography
Type of land(hm²)
Type of land(hm²)
Type of land(hm²)
Type of land(hm²)
Suitability analysis & comment
16# 3.33 10.00 3 Valley 1.67 1.67 Recommendation: cancel to be incorporated into No 13 Wanhe spoil ground.
17# 13.33 16.00 1.2 Cove 4.36 8.97 Recommendation: cancel to be incorporated into No 14 Wanhe spoil ground.
Wa
nhe
Sum 91.00 152.23 19.10 28.32 43.59
1# 0.80 0.40 0.5 Flat land 0.80 This stockyard is suitable considering existing roads, transport distance and ecological condition
2# 0.67 1.01 1 Flat land 0.67 Recommendation: cancel to be incorporated into No 1 Yanxi spoil ground.
3# 0.67 1.53 1.4 Flat land 0.20 0.47 This stockyard is suitable considering existing roads, transport distance and ecological condition
4# 1.67 1.83 1.1 Flat land 1.67 Recommendation: cancel to be incorporated into No 1 Yanxi spoil ground.
5# 0.13 0.15 1.1 Ditch 0.03 0.11 Recommendation: cancel to be incorporated into No 3 Yanxi spoil ground.
6# 0.60 0.66 1.1 Flat land 0.12 0.48 Recommendation: cancel to be incorporated into No 3 Yanxi spoil ground.
Ya
nxi
Subtotal 4.53 4.65 0.00 0.15 0.20 4.19

6.0 Environment Impact Assessmen t
283
County
town 1# 0.4 7.52 2
Toe flat land
0.20 0.20 This stockyard is suitable considering existing roads, transport distance and ecological condition
Zouto
u 1# 0.33 0.67 2 Toe flat land
0.17 0.17 This stockyard is suitable considering existing roads, transport distance and ecological condition
38 Spoil grounds
117.61 314.10 31.04 33.87 48.84 3.87

6.0 Environment Impact Assessmen t
284
6.3.12 Analysis of environmental reasonableness of acquisition of land for construction
road
Shihutang Project is located in the trunk channel of Kan River, in Taihe County of Ji’an City. It is 26km from the Ganjiang Bridge in Taihe County, which is an important city in Jiangxi Province, to connect Nanchang by railway and highways, to connect with the Yangtze River by waterways. Highways and roads close to the project radiate in all directions very convenient to connect with the outside world.
Existing roads and highways on the right and left bank will be connected to each construction area and working face. In the dam site there is internal road network consisting of approach road and special road to the spoil grounds.
Newly constructed roads for this Project lasts 40km and extended roads 46km (including 6km-long newly constructed and 4km-long extended road in the nodal region). For detail of internal traffic, see Table 2.11 1. fro detail of internal and outside traffic, see Table 2.11 2.
Most of traffic for the Project will be of existing roads and highways, to avoid acquisition of land. Newly constructed and extended roads will match traffic construction programs in local villages, with grass along the roadside to alleviate water and soil erosion. In a word, layout and acquisition of land for this Project is reasonable from the point of environmental protection.
6.3.13 Analysis of Environmental Reasonableness & Fruitfulness of Water & Soil
Conservation
� Completeness of water and soil conservation programmed Water and soil conservation programme covers the pivotal project, the embankment protection, the project management site, the construction area and living quarters, the stockyards, the construction spoil grounds, roads and highways and the host area. Such a coverage is complete for completion of the Project.
� Effect analysis of water and soil conservation programme
Based on the requirement of “three simultaneity”, the measures for water and soil conservation must be practically positioned before the trial operation of the project. Therefore, during the period of Complex operation, the surface earth of the permanent land occupation of the project have been hardened and afforestated; slopes have been cut for protection; temporary land has been leveled and afforestated; drainage system for roads have been perfected; ecologic environment of the project area has been recovered and improved. In this case, if soil erosion occurs, the volume would be limited. By that time, the measures for conservation of water and soil in the migrant resettlement area have exerted their protective functions, and the soil erosion can be ignored.
Through the implementation of the measures for conservation of water and soil where engineering measures and planting measures are adequately integrated, the project has formed
6.0 Environment Impact Assessmen t
285
a complete system for protection and treatment of soil erosion. Such has not only prevented great quantity of earth from entering the reservoir that results in reduction of reservoir storing capacity, but also ensured the safety of the building structures and the smooth progress of the project construction. It will also beautify the environment, improve the ecologic environment of the reservoir area, increase the comprehensive benefits and prolong the life of the reservoir.
Above all, through a series of measures for conservation of water and soil, construction of the project will fully make use of the natural water resources, improve regional environment of the reservoir area and promote the working of water conservation.
� Environmental feasibility of water and soil conservation programme
Water and soil conservation programme is made out of combined engineering measures and biological control measures, thus to avoid any conflict between construction of the project with the nature.
Water and soil conservation programme will effectively reduce rain drop erosion and thus greatly relieve water and soil erosion during the construction period, to play a positive role in water and soil conservation. During embankment protection works at the same time or earlier there will be construction of soil trap wall. There will be considerable increase in water and soil erosion during the early period of construction. At the late period most of the embankment protection works will be finished and the vegetation will be under restoration, so water and soil erosion will be under control.
Based on comprehensive analysis of engineering re—vegetation, if measures concerning embankment protection and re—vegetation are undertaken, then water and soil erosion will be under effective control during the construction period, and all facilities concerning water and soil conservation will be restored to original level, or even be better.
In terms of construction spoil grounds layout, most of the grounds are located in such areas as mild low-lying ground, gulch or valley, unused alluvial land, to meet the need for environmental protection. There might be environmental challenges from partial water and soil erosion and vegetation damage and acquisition of limited arable land. In engineering reclamation measures consideration is given to reclamation, re—vegetation, masonry dam and drainage facility, all to alleviate impact from water and soil erosion.
In a word, engineering measures and biological control measures in the course of water and soil conservation programme is feasible from the point of environmental protection.
6.0 Environment Impact Assessmen t
286
6.4 Ambient Air
6.4.1 Impact upon Ambient Air during Construction Period
6.4.1.1 Atmospheric Pollution during Construction Period
The characteristics of the project will mean that the major discharge of air contaminant includes bug dust, followed by limited fuel exhaust from the construction machinery and haulage vehicles, mainly out of such works as follows:
�machining operation like bulldozer, excavating machine, shoveling machine, lift trucks and mixing plant or stirring mill�
� dust from the sand stocking yards due to aerodynamic�
� dusting and secondary dusting in the course of earthrocks haulage and of construction
of sand stocking yards due to vibration or natural wind�
� bug dust pollution from automatic unloading and from unpacking of cement.
� there will be limited discharge of fuel exhaust from the main engines of the
workboats, the haulage vehicle and other kinds of construction machinery, mainly in form of
SO2, NOX and hydrocarbon.
The above-mentioned pollution occurs mostly on the left and right bank of pivotal project area, on the newly constructed pumping stations for the sake of embankment protection; on the spoil grounds and borrow pits; on the area of lifting the field; on resettlement host areas; and on existing roads for temporary approaches and construction purpose.
6.4.1.2 Impact upon ambient air during the construction period
Atmospheric pollution during the construction period all comes from disorderly discharge, scattered in spatial-temporal location, thus analysis is made as follows based on analogy investigation
� on the basis of site survey data of similar works, TSP concentration 50m leeward from the concrete mixing plant reaches 8.90mg/m3 100m leeward 1.65mg/m3 150m leeward TSP concentration satisfies Grade III as described in Quality Standard of Ambient Air (GB3095-1996)(daily mean value is 0.30mg/m3).
� based on data out of analogy investigation, for soil haulage vehicles, TSP concentration 50m leeward averages 11.62mg/m3, 100m leeward 9.69mg/m3; 150m leeward 5.09mg/m3 and 160m leeward such concentration meets the lower limit value in Comprehensive Discharge Standard of Air Contaminant (GB16297-1996).
� In other works such as site grading, matter transport and placing there may be dusting pollution which is capable of being brought under control within a range of 50100m, which is in line with Grade II in Quality Standard of Ambient Air (GB3095-1996).
� Impact upon ambient air in this Project is under analysis on the basis of site observed data in Baise Pivotal Project in Guangxi Autonomous Region. Observation was made in the mentioned Baise Project in summer, autumn and winter during the construction period, with the result listed in Table 6.4-1.
Table 6.4-1 Observed Results in Baise Project during Construction Period

6.0 Environment Impact Assessmen t
287
Monitoring Period Note Item Points
Summer Autumn Winter
1 0.022 0.011 0.007 NO2
2 0.027 0.021 0.011
1 0.23 0.09 0.07 TSP
2 0.23 0.06 0.05
No 1 sampling point is about 100m from the construction site; No 2 sampling point is about 150m from the construction site
From Table 6.4-1 it s known that about 100m from the construction site, such index as TSP and NO2 concentration in three seasons all goes beyond Grace II if judged by Quality Standard of Ambient Air. Therefore it is estimated that 100m from the construction site the ambient air basically meets the criteria.
� Air contaminant produced out of construction machinery (such as crowd shovel, pullshovel, bulldozer, autodumper, workboats) for consumption of diesel and petrol is mainly in form of SO2 NOx, CO and hydrocarbon. During the construction period gross contaminant from the construction machinery amounts to 22.233t (SO2 ), 323.547t (NOx), 331.844t (CO) and 59.088t (CnHm). For detail see Table 3.11.
Since all the major operation occurs in the shore or on the surface of water, and such operation is of mobility and intermittence, noxious gas discharged from the construction machinery, workboats and the haulage vehicle will swiftly spread to the surroundings t produce little impact upon environment.
6.4.1.3 Impact upon Protected Objects during Construction Period
For detail of impact from contraction operation upon protection objectives adjacent, see Table 6.4—1. For detail of impact from construction concerning operation of protection embankment, drainage canal and temporary roads, see Table 6.4—3.
Bug dust created during the construction period will produce pollution to the protection embankment, diversion canal, temporary approaches and existing roads and roadside residents who live within a range of 150m. Bug dust created during the construction period will produce pollution to the borrow pits, the spoil grounds, the lifting the field, the host area and the roadside residents who live within a range of 150m. Impact upon ambient air will not last long. Completion of the Project will mean an end to such pollution. Still, during the construction period, necessary measures shall be adopted.
6.4.2 Impact upon Ambient Air during Operation Period
Hydropower is a process to make use of hydraulic resources, to produce almost no pollution to the ambient air during the operation period.
Ships in the channel will produce limited exhaust to the ambient air. Such exhaust consists of NO2 ( to total 11.0t in 2020 and 13.92t in 2030), SO2 (15.29t in 2020 and 19.34t in 2030). Such exhaust is mainly of unsystematic emission source of short-distance pollution, thus to produce pollution to surrounding the ambient air. But such impact is limited to 50m of the emission source, not to produce much pollution to protected objects in terms of ambient air.

6.0 Environment Impact Assessmen t
288
Table 6.4—2 Impact upon Ambient Air during Operation Period
No. Protection objectives
Location/distance Scale/features Impact analysis
1 Shihutang Village
About 400m downstream on the right bank of the recommended dam site
About 100 households and 350 residents
The construction site is about 50m from the nearest point in the village, and there may be construction dust pollution.
2 Sangyuan Primary School
About 500m downstream on the right bank of the recommended dam site
About 200 pupils and 1 teachers
The construction site is about 50m from the nearest point in the village, and there may be limited impact from construction dust.
3 Jiangjiazhou Village
About 450m in the upper stream on the right bank of the recommended dam site; about 150m from the ship lock
About 110 households and 385 residents
The construction site is about 50m from the nearest point in the village, and there may be construction dust pollution.
4 Lingbei Village
About 500m on the left bank from the recommended dam site
About 50 households and 175 residents
The construction site is about 50m from the nearest point in the village, and there may be construction dust pollution.
5 Xiayinxia Village
About 500m downstream on the left bank of the recommended dam site
About 40 households and 155 residents
The construction site is about 50m from the nearest point in the village, and there may be construction dust pollution.

6.0 Environment Impact Assessmen t
289
Table 6.4—3 Impact upon Ambient Air against Protection Objectives during Operation Period from Construction of protection Embankment, Drainage Canals & Temporary Roads No Objective Location and distance Features Impact analysis 1 Sangyuan Village ~100m to the road to be used for construction ~20 households�80 people Limited impact from construction dust 2 Duxia Village ~50m to the road to be used for construction ~15 households�60 people Certain pollution from construction dust 3 Kou’an Village 60m to the road to be used for construction ~20 households�80 people Certain pollution from construction dust 4 Xiehouling 100m to the road to be used for construction ~20 households�80 people Limited impact from construction dust
5 Xiabian Village ~150m to the fending groyne line & road to be used for construction
~40 households�160 people Limited impact from construction dust
6 Yinxiajiang ~150m to the fending groyne line & road to be used for construction
~40 households�160 people Limited impact from construction dust
7 Maqian Village ~80m to the fending groyne line & road to be used for construction
~15 households�60 people Certain pollution from construction dust
8 Pingshang Village ~20m to the fending groyne line & road to be used for construction
~50 households�200 people Certain pollution from construction dust
9 Gaozhang Village ~50m to the fending groyne line & road to be used for construction
~10 households�40 people Certain pollution from construction dust
10 Dunshang Village ~70m to the fending groyne line & road to be used for construction
~15 households�60 people Certain pollution from construction dust
11 Zhang Jia ~150m to the fending groyne line & road to be used for construction
~40 households�160 people Limited impact from construction dust
12 Huwei ~100m to the fending groyne line & road to be used for construction
~20 households�80 people Limited impact from construction dust
13 Zengjia ~70m to the fending groyne line & road to be used for construction
~25 households�100 people Certain pollution from construction dust
14 Zhushan ~150m to the fending groyne line & road to be used for construction
~50 households�200 people Limited impact from construction dust
15 Mazhou city ~160m to the fending groyne line & road to be used for construction
~60 households�240 people Limited impact from construction dust
16 Maozhou ~80m to the fending groyne line & road to be used for construction
~15 households�60 people Certain pollution from construction dust
17 Jingouwan ~60m to the fending groyne line & road to be used for construction
~20 households�80 people Certain pollution from construction dust
18 Yaoxi ~40m to the fending groyne line & road to be used for construction
~10 households�40 people Certain pollution from construction dust
19 Xiamu ~80m to the fending groyne line & road to be used for construction
~25 households�100 people Certain pollution from construction dust
20 Fenglin Village ~100m to the fending groyne line & road to be used for construction
~15 households�60 people Limited impact from construction dust
21 Dengjia ~120m to the fending groyne line & road to be used for construction
~50 households�200 people Limited impact from construction dust

6.0 Environment Impact Assessmen t
290
No Objective Location and distance Features Impact analysis
22 Shangyinxia ~50m to the fending groyne line & road to be used for construction
~30 households�120 people Certain pollution from construction dust
23 Tongluobei ~40m to the fending groyne line & road to be used for construction
~50 households�200 people Certain pollution from construction dust
24 Heshupeng ~180m to the fending groyne line & road to be used for construction
~60 households�240 people Limited impact from construction dust
25 Heshuxia ~150m to the fending groyne line & road to be used for construction
~40 households�160 people Limited impact from construction dust
26 Caoping ~30m to the fending groyne line & road to be used for construction
~80 households�320 people Certain pollution from construction dust
27 Guibang ~60m to the fending groyne line & road to be used for construction
~20 households�80 people Certain pollution from construction dust
28 Huangkengpengxia ~50m to the fending groyne line & road to be used for construction
~15 households�60 people Certain pollution from construction dust
29 Xiaojia ~50m to the fending groyne line & road to be used for construction
~20 households�80 people Certain pollution from construction dust
30 Xinju ~30m to the fending groyne line & road to be used for construction
~40 households�160 people Certain pollution from construction dust
31 Kangjia Lake ~40m to the fending groyne line & road to be used for construction
~20 households�80 people Certain pollution from construction dust
32 Jiangqian Village ~80m to the fending groyne line & road to be used for construction
~30 households�120 people Certain pollution from construction dust
33 Shanjia ~100m to the fending groyne line & road to be used for construction
~15 households�60 people Limited impact from construction dust
34 Zengjiapengxia ~60m to the fending groyne line & road to be used for construction
~40 households�160 people Limited impact from construction dust
35 Nanmenzhou ~100m to the fending groyne line & road to be used for construction
~30 households�120 people Limited impact from construction dust
36 Duwu Village ~100m to the fending groyne line & road to be used for construction
~20 households�80 people Limited impact from construction dust
37 Yutai Village ~150m to the fending groyne line & road to be used for construction
~15 households�60 people Limited impact from construction dust
38 Zhouwei ~100m to the fending groyne line & road to be used for construction
~40 households�160 people Limited impact from construction dust
39 Nanshanxia ~150m to the fending groyne line & road to be used for construction
~50 households�200 people Limited impact from construction dust

6.0 Environment Impact Assessmen t
291
6.5 Acoustical Environment
6.5.1 Noise Effect during Construction Period
Noise during the construction period comes mainly from construction machinery and traffic, with limited noise from blasting.
6.5.1.1 Noise effect from construction machinery
Prediction is made on such simplified formula as follows:
Li�L0-20lg(ri/r0)-�L
Of which�Li ——sound level at a distance from sound source ri�dB(A)�
L0 ——sound level at a distance from sound source r0�dB(A)�
�L ——noise attenuation caused by other factors�dB(A)�
Taken into consideration the maximum value of sound level r0 from various construction machineries, then predicted value of noise from the construction machinery at different period of construction is listed in Table 6.5-1.
Table 6.5-1 Predicted Value of Noise at Stationary Noise Sources Unit dB(A)
Types 15m 50m 100m 200m 300m 400m 500m 600m
Stirring mill, concrete mixing station
70.5 60.0 54.0 48.0 44.5 42.0 40.0 38.5
Crushing machine, sieving machine
82.5 72.0 66.0 60.0 56.5 54.0 52.0 50.5
Winding engine, crane
72.5 62.0 56.0 50.0 46.5 44.0 42.0 40.5
Excavating machine
60.5 50.0 44.0 38.0 34.5 32.0 30.0 28.5
Drilling machine 63.5 53.0 47.0 41.0 37.5 35.0 33.0 31.5
Air compressor 74.5 64.0 58.0 52.0 48.5 46.0 44.0 42.5
The result shows that within 15m of noise source, noise rating number (NRN) for such machinery as crushing machine and sieving machine are both over 75dB(A) beyond 50m NRN for all machinery is below 75dB(A); beyond 200m machinery noise (except for crushing machine and sieving machine) will all reduce below 55dB(A). this indicates that beyond 50m of construction site, the daytime noise meets the criteria as described in Noise Limits in Construction Site[75dB(A)]; and beyond 200m from the construction machinery, the noise basically satisfies the night noise meets the criteria as described in Noise Limits in Construction Site[55dB(A)].
Impact from construction upon the protection objectives surrounding the construction sites is listed in Table 6.5—2.
The results show that at daytime there is no noise impact beyond the standard upon

6.0 Environment Impact Assessmen t
292
surrounding protection embankment, diversion and drainage canals, borrow pits and spoil grounds, and elevated fields and residents (15m adjacent), nor impact to 100m surrounding the construction sites at night. Such construction noise is temporary, to end with the completion of the project. Still, there shall be necessary measures against noise pollution.

6.0 Environment Impact Assessmen t
293
Table 6.5 2 Impact of Dam Construction upon Surrounding Protection
Objectives
No Objectives Location/Distance Scales/features Impact analysis
1 Shihutang Village About 400m downstream on the left bank of the recommended dam site
About 100 households�350 persons
The construction site is about 50m from the nearest point in the village. At daytime there is basically no noise pollution beyond the required standard, despite certain adverse impact at night.
2 Sangyuan Primary School
About 500m downstream on the left bank of the recommended dam site
200 pupils and 10 teachers
The construction site is about 150m from the nearest point in the village. At daytime and night there is basically no noise pollution beyond the required standard (There is no class at night)t.
3 Jiangjiazhou Village
About 450m downstream on the left bank of the recommended dam site; 150m from the ship lock
About 110 households�385 persons
The construction site is about 50m from the nearest point in the village. At daytime there is basically no noise pollution beyond the required standard, despite certain adverse impact at night.
4 Lingbei Village About 500m on the left bank of the recommended dam site
About 50 households�175 persons
The construction site is about 50m from the nearest point in the village. At daytime there is basically no noise pollution beyond the required standard, despite certain adverse impact at night.
5 Xiayingxia Village About 500m downstream on the left bank of the recommended dam site
About 40 households�155 persons
The construction site is about 50m from the nearest point in the village. At daytime there is basically no noise pollution beyond the required standard, despite certain adverse impact at night.

6.0 Environment Impact Assessmen t
294
Noise created at daytime during the construction period will produce no noise pollution to protection embankment, to diversion channel, to borrow pits, to the spoil grounds, to the lifting the field and to host area (within 15m), and nor noise to a range of 100m at night. Such mentioned sporadic residential areas will suffer from limited noise at daytime, and from noise pollution to different degree at night.
6.5.1.2 Effects of traffic noise
� Prediction model of traffic noise
On the basis of Guide Rules to Environmental Impact Assessment—Acoustical Environment (HJ/T2.4—1995) which recommends the prediction model by Federal Highway Administration concerning highway noise FHWA , traffic noise is under prediction during the construction period in the construction roads. Since the construction vehicles are mainly of oversize vehicle, the construction roads may be deemed to be boundless in length, so the prediction model is simplified as follows
30)lg(10)lg(10)( 100 −∆+++= + SLLAeq aD
D
VT
DNw
π
Of which (LAeq)——equivalent noise level dB(A)
Lw——mean radiation sound level of oversize vehicle in reference
energy dB(A)
N ——the ith type of traffic flow at designated time T(1h) ;
D0 ——reference range from measurement of vehicle radiated noise level,
D0=15m
D ——vertical distance from center lane to the predicted position, m
V ——mean velocity of oversize vehicle, km/h
T ——computing time of equivalent sound level, 1h
a ——surface coverage coefficient, depending on site conditions, a=0 or
a=0.5
Since the construction vehicles are mainly of oversize vehicles, therefore the mean radiated noise level is calculated in such formula as follows:
oversize vehicle Lw=24.6log(V)+38.5
Of which V refers to the mean running speed, estimated to 40km/h at daytime and 20km/h at night.
The predicted value of traffic noise level during the construction period is listed in Table 6.5-3.

6.0 Environment Impact Assessmen t
295
Table 6.5-3 Predicted Value of Traffic Noise At Different Distances Unit dB(A)
Distance 20m 40m 60m 80m 100m 120m 160m 200m
Day 61.3 57.2 55.2 54.0 53.2 52.6 51.9 51.4 Self--
dischargin
g truck Night 56.4 51.9 49.5 47.9 46.7 45.8 44.5 43.6
Noises within 10m of the temporary roads and existing roads basically has no standard-exceeding impacts and fall within Grade IV at daytime, with no standard-exceeding impact upon objects 30m away from the roadside at night. In a word, during the construction period noise standard-exceeding pollution impacts on scattered residential areas by roadside of the temporary roads and existing roads is limited.
This Project will produce temporary noise effect upon local regions in acoustical environment. With completion of the Project, such impact will be terminated. Still, during the construction period there shall be necessary countermeasures.
6.5.1.3 Noise of Blasting
This project involves no submarine blasting, though blasting occurs mainly in the foundation bedrock leveling. Noise impact is under analysis on the basis of analogy of similar works, where observed results are listed in Table 6.5-4.
Table 6.5-4 Predicted Value of Noise of Blasting
Distance (m) 5 20 50 100 200 400
Noise rating
number: dB(A) 100�110 86�96 87�97 72�82 65�75 57�67
Noise of blasting is of temporary noise, whose maximum value, in line with relevant standard, shall be 15dB(A) less than designated value. Table 6.3-3 shows that 100m from the shotpoint the noise level satisfies the criteria15dB(A) less than designated value; 400m from the shotpoint the noise level satisfies the criteria too. All the environmental protective objects involved in this Project are 400m away, thus impact from blasting is very limited and minor.
6.5.2 Noise Effect during Operation Period
Noise pollution sources during the operation period come mainly from generating sets and from traffic (ships and boats passing by).
� Noise from the generating sets is limited to the nodal region, which is over 400m away from the nearest settlement, who thus will not suffer from such noise effect.
� ship tonnage is estimated to be 500t and 800t for the year of 2020 and 2030, and observed water traffic flow totals 16860 ships/times/aor 47 ships/times/d and 16663 ships/times

6.0 Environment Impact Assessmen t
296
/a or 46 ships/times /d by the year of 2020 and 2030 respectively.
Exposed sound level for 500t-ship at 15m is about 71dB(A), which takes about 15m to attenuate to 70dB(A) and about 95m to attenuate to 55dB(A). The noise level for 800t-ship at 15m is about 73dB(A), which takes about 21m to attenuate to 70dB(A) and about 119m to attenuate to 55dB(A).
All the settlement involved in this Project is at least 150m away from the pivotal project area ship lock and more than 150m from the thalweg. In fact most of the settlement is 400m off the ship lock and the thalweg, therefore during the operation period noise from the ships basically creates no noise effect upon residents.
6.6 Resettlement of Affected Residents
6.6.1.1 Plan of Land Acquisition & Relocation
�Plan of Relocation & Resettlement Persons affected in arable land but not in housing will be under resettlement in the very affected village or in ant village adjacent. At present there will be 2175 persons in need of resettlement and it is estimated that 2271 persons will be in need of production resettlement in 2010.
Such resettlement will involve people who live below the reservoir flooded line; people affected in arable land but not in housing; people who can not be satisfied by relocation backward in terms of arable land thus need to be resettled in other areas; people involved in acquisition of land for the embankment protection works. Such resettlement will involve 711 persons at present or 744 by 2010.
� Plan of Settlement Most of the resettlement is in form of backward relocation in the same village, the same township or town, to make sure that every household is satisfied with production conditions, housing conditions and fundamental facilities in supply of water, electricity and roads. There will be 3 centralized settlements according to the plan, to meet the need for 269 immigrants.
Centralized Settlement in Pingshang Village Centralized Settlement in Caoping Village
� Resettlement of Enterprises or Institutions
The Project will involve 8 enterprises or institutions concerning relocated housing to total 4373.71m2, most of which consists of warehouses, processing factories and some enterprises, which are located within the protection embankment works or within the reservoir flooded line, thus the living area and facilities are affected. There is no unit in need of complete

6.0 Environment Impact Assessmen t
297
relocation, all of the enterprises or institutions are just partially affected.
� Relocation of Urban Residents There will be no urban residents in resettlement after completion of the embankment protection works.
� Reconstruction Plan of Special Items The resettlement involves 2.21km of 4th-grade highway and 10.71km of tractor road, 18 ferries and docks, 82.47hm2 of lifting the field. All such affected land will be under compensation to restore original function in scale and standard.
6.6.2 Analysis of Environmental Capacity & Suitability in Host Area
� Impact upon Arable Land Resources
In accordance with statistics in Taihe County, involved in the resettlement there will be 77674 persons, 110538 mu of arable land (1.42 mu per capita) and net income per capita is 4842 Yuan.
In Wanhe Township the inundation will involve 43215mu of arable land, 29213 persons, (1.48 mu per capita), to involve resettlement of 756 persons and 873.88 mu of land). In Tangzhou Town the inundation will involve 27887mu of arable land, and 17188 persons (1.62 mu per capita), to concern resettlement of 631 persons and 818.1 mu of arable land). In Yanxi Town the inundation will involve 22513 mu of arable land, 13030 persons, (1.73 mu per capita), to involve resettlement of 575 persons and 1007.78 mu of land). In Chengjiang Town the inundation will involve 12766 mu of arable land and 15057 persons, (0.85 mu per capita), to involve resettlement of 255 persons and 180.1 mu of land). In Mashi Town the inundation will involve 2567 mu of arable land and 3186 persons, (0.81 mu per capita), to involve resettlement of 54 persons and 42.13 mu of land). There is a high percentage of inundated arable land (4.5% of gross land) in Yanxi Town, so that after the inundation arable land per capita is reduced by 0.08 mu. For detail of environmental capacity, see Table 6.61.
After completion of the embankment protection works and works concerning lifting the field, there will be land acquisition in form of belt, so that arable land per capita will reduce by 2.7 , from 1.42mu per capita to 1.38mu. There is little impact from such land acquisition to local residents. Meanwhile resettlement is distributed in 44 villages, so they will benefit from low-yield land improvement.
� Impact upon resettlement living standards Permanent acquisition of land for reservoir inundation and embankment protection will amount to 2829.8 mu, which accounts for only 2.7% of gross resources in affected villages, so that rural residents will reduce arable land by 0.04mu per capita. Social and economic survey shows that at present net income per capita reaches about 4842Yuan per capita. Based on the statistics in Taihe County, rural residents’ income from the primary industry rises by about 8.8% annually, by 19.2% from other industries. This means that in the plan period their income from the primary industry will total Yuan per capita and 6132 Yuan per capita from other industries. For this plan period the income target is set at 9623 Yuan per capita.
After relocation, despite decrease in arable land, improvement in embankment and newly constructed dykes will improve flood control standard. In addition, in the plan period,

6.0 Environment Impact Assessmen t
298
agricultural hydraulic engineering has been improved and plant production optimized and such industries as horticulture, livestock breeding, township-run enterprises, catering industry and trade have been in small-scaled commercial activities, therefore rural residents’ income is steady in rise. In a word, if proper measures are adopted to solve any problems concerning production or living for the resettlement, their living standards will be better. This shows that plan for resettlement of affected residents is basically reasonable.
� Impact upon resettlement habits and customs
In order to minimize the impact upon immigrants in habits and customs, to minimize any damage to their social network, to avoid enlarging their farming radius, resettlement will be mainly in form of local relocation, with focus on development of plant production and livestock breeding. By way of perfection of rural infrastructure, regulation of industrial structure and improved varieties will sustainable development be guaranteed. Moreover, more immigrants will be encouraged to participate in project construction to earn more money.
Since the immigrants are under local relocation, their customs and habits will suffer little from cultural shock, thus plan for the resettlement of affected residents is basically reasonable.
� Impact upon immigrants’ infrastructure
� Impact upon traffic
Construction of this Project is of limited impact upon local traffic facilities and during the construction all affected traffic facilities are expected to restore their function Prior to reservoir filling. Moreover, completion of the Project will greatly improve local waterways to accelerate logistics in the reservoir surroundings and in south of Jiangxi Province, thus to promote local economic development. Meanwhile, with implementation of the resettlement of affected residents, immigrants will enjoy improved living and traffic conditions.

6.0 Environment Impact Assessmen t
299
Table 6.6 1 Environmental Capacity
Rural Arable land
Arable land per capita
Arable land under inundation & acquisition
Residual arable land
Arable land per capita after completion of project
Reduced arable land per capita
Increase in capacity
Production relocation
Planned production relocation Affected townships /towns
Village
(men) (mu) (mu) (mu)
% of arable land
(mu) (mu) (mu) (person)
Wanhe Town 16 29213 43215 1.48 873.88 2 42341 1.45 0.03 2431 (men) (men)
Tangzhou Town 10 17188 27887 1.62 818.1 2.9 27069 1.57 0.05 1253 724 756
Yanxi Town 8 13030 22513 1.73 1007.78 4.5 21505 1.65 0.08 962 604 631
Chengjiang Town 9 15057 12766 0.85 180.1 1.4 12586 0.84 0.01 1399 551 575
Mashi Town 1 3186 2567 0.81 42.13 1.6 2524 0.79 0.01 295 244 255
Washman Reclamation Farm 1 1590 55.31 3.5 1535 160 52 54
Total 77674 110538 1.42 2977.3 2.7 107560 1.38 0.04 6500
6.0 Environment Impact Assessmen t
300
� Water The project will affect areas located in the valley, which is abundant in surface water and underground water (which is high in water level, thus convenient for welling or construction of tap water). In a word the project will constitute no impact upon drinking water to local residents. On the contrary, rise in reservoir water level is more convenient for irrigation to local production and daily water consumption. To sum up, local residents’ water consumption will not reduce in terms of convenience and comfort.
� Electricity Power transmission and sub-transformation facilities will be restored, thus affected residents will fell no impact. Instead, completion of the Project will transmit 4.8×10⁸kW.h of power to Ji’an Power Network, to improve power assurance rate.
� Medical, Cultural & Educational Conditions The Project will not create direct impact upon medical, educational facilities, thus there will be no negative effect upon local medical service or schooling.
� Fuel Supply
Affected residents depend upon such fuel as liquidized gas, coal and firewood, while acquisition of land produces minute impact upon local residents.
6.6.3 Environmental Impact upon Host Area
Resettlement of affected residents is on the basis of making full use of existing resources and tapping potential of land resources. Such resettlement is active in relocation to gradually improve their living standards to former level, with much room for development so that the resettlement enjoys long-term development.
Land in Shihutang area is under high use, thus there is limited room for development of arable land in waste hills or unused land. As a result, the Project will adopt measures for protection of arable land below the flooded line. Due to scattered relocation of immigrants, each host area will not suffer from pressure due to limited resettlement. According to the plan, resettlement will be achieved in the very same village or in villages nearby. In a word, limited resettlement creates not much negative impact upon environments, as analyzed as follows:
� Advantage of water resources will be fully utilized to promote industry adjustment At present economy does not major in plant production, which accounts for about 38% of local GDP. Within Wanhe and Yanxi Embankment Protection Zone, some arable land frequently suffers from flood to produce low output. Developmental resettlement will mean decrease in arable land per capita, but by way of newly constructed or improved embankment to improve flood control standard, by perfection of agricultural hydraulic engineering to improve medium-or-low output farmland to high output land, by optimization of plant production and commercial development of such industry as horticulture, livestock breeding, village-run enterprises , catering industry and supermarkets, immigrants will earn more money due to improved output per unit.
� To promote the capacity to resist natural calamities in the resettlement areas.

6.0 Environment Impact Assessmen t
301
Large input of funds, materials, information and technologies during the migrant resettlement will improve the electric supply, transportation and telecommunication facilities in the resettlement areas. Irrigative conditions for farmland will be radically improved, thus strengthen the capacity of the migrants to resist the natural calamities. � To improve the living standards of migrants The objects of migrant resettlement of the project are some rural households. The resettlement has provided new opportunities for the improvement of the living conditions of the migrants. Newly constructed houses have taken good consideration of the infrastructure. The quality of the houses will be also improved. � To increase the land productivity through reasonable development of land resources. The normal water storage level of the project is 56.5m. A certain amount of surplus labors for re-employment. These people will loss the productive foundation that they live on. According to the RAP, improvement of low-yield farmland and dry land and greenhouse vegetable planting and aquiculture in the reservoir area will be used for re-employment. Such land development projects help to comprehensively utilize the land resources in the resettlement areas, hence increase the land productivity. � The impacts of resettlement on the land resources The reserved farmland in the reservoir area is limited. There are very few farmlands that are suitable for agricultural purposes in the reservoir area. Due to the inundation and migrating resettlement that will occupy some quantity of land, the contradiction between farmland resources and population tend to be more intensive. Productive resettlement of migrants will end with local adjustment of the remained farmland after inundation of the reservoir, which shall be done by local people’s government according to the overall planning. After adjustment, the average farmland per capita will be less than that before reservoir construction. This has affected agricultural activities to some extent. However, through the economic income from the project construction and economic compensation for the migrants that will be used to improve the land productivity, the population-land contradiction will be mitigated effectively. � The analysis of the impacts of resettlement on the environment The productive resettlement of the project mainly includes improvement of low-yield farmland and dry land and greenhouse vegetable planting and aquiculture in the reservoir area. This means that resettlement will not occupy new land. The impacts of productive resettlement on the environment are in the following aspects: The impacts on water quality: Productive resettlement will cause water erosion, mainly of SS. It is because that there are many places being scattered in a vast area. So the impacts are on big range but of little degree. On the other hand, the impacts of mesh-cage fishery cultivation on the environment are mainly of organic pollution caused by the feeds thrown into the water. However, most feeds will be consumed by the aquatic life and the impacts of the remains on the environment will be very limited. Water erosion caused by productive resettlement will come into being in construction. The

6.0 Environment Impact Assessmen t
302
main impacts of water erosion are on the quality of the water in the ditches nearby the agricultural development areas, causing mud accumulation. The cultivatable layer in the agricultural production areas will become thinner due to water erosion, thus affecting agricultural production. Therefore, it is required to enhance the works of conservation of water and soil during the process of development. � The impacts of migrating resettlement on social environment The issues of migrating resettlement of project construction are somewhat sensitive. For the sake of project construction, some people have to give up the existing quiet life and reestablish their livelihood; some people have to newly engage in land development for agricultural production. The issues of migrating resettlement will cause some negative impacts on the social environment if not properly resolved. Therefore, it is required to thoroughly carry out the plans for migrating resettlement and do well the works, such as settle the problems of water supply in the migrating areas and the accommodation for the migrants during the transition period. Such will help to accelerate the project construction. 6.6.4 Environmental Reasonableness of Plan for Resettlement of Affected Residents
Environmental capacity is under full consideration in planning of resettlement of affected residents. By way of embankment protection and lifting the field, arable land per capita in the area reduces only by 2.7, from 1.42mu to 1.38mu. Acquisition of land for the Project produces limited impact upon local residents. Meanwhile, the immigrants will be under relocation in 44 villages. By way of improvement of low-yield farmland in nearby villages, resettlement of affected residents will be under proper solution so that their living standard will even be better than at present.
Resettlement plan covers plan of relocation, plan of settlement, plan of relocation of enterprises or institutions, plan of reconstruction of special items, plan of environmental protection and plan of water and soil conservation. Amount them environmental protection plan consists of plan to handle such issues as rural domestic sewage treatment, solid waste disposal, environmental protection measures concerning immigrants infrastructure, feasible measures for promotion of people’s health. Water and soil conservation measures in the plan will cover such measures as concerning water and soil conservation works in the host area and measures for lifting the field. Implementation of these measures will effectively prevent water and soil erosion in the host area, will alleviate environmental loads to avoid any potential negative impact, thus favorable for regional environmental balance.
To sum up, the plan concerning resettlement of affected residents is somewhat reasonable from the point of environmental protection.
6.7 Antiquities Preservation
In accordance with Cultural Relics Investigation Report of Jiangxi Shihutang Shipping and Hydropower Pivotal Project at the Kan River as compiled from Jiangxi Provincial Institute of Cultural Relics and Archaeology, also based upon site investigation, in the inundation and surrounding area of Shihutang there are such 5 relics as (a) site of ancient Baikou City (State-level unit of cultural relics protection ), (b) Gouzi Tower (county-level unit of cultural relics protection), (c) Ouyang Ancestral Hall (under application for province-level cultural relics protection), (d) Huangkeng Ancient Ferry, and (e) site of ancient city.
For detail of location of the five relics’ protection see Attached Drawing 03. For detail of a

6.0 Environment Impact Assessmen t
303
profile of the 5 relics and impact thereupon from the planned Shihutang Project, see Table 6.7—1.
From Table 6.7 1 it is clear that of the 5 relics only 2 are under protection one under state-level protection and one under county-level , with one under application for province-level protection. The project and inundation will produce no impact upon the two relics, which are under protection, and the one under application for province-level protection. The project will create impact upon the 2 relics, which are under no protection.
Huangkeng Ancient Ferry is located within the project inundation. Prior to the construction of the project, if there are no measures for protection of the said ferry, cultural relics there will be under adverse impact. In accordance with Cultural Relics Investigation Report of Jiangxi Shihutang Shipping and Hydropower Pivotal Project at the Kan River as compiled by Jiangxi Provincial Institute of Cultural Relics and Archaeology, there is a pledge therein to the extent that the Jiangxi Provincial Institute of Cultural Relics and Archaeology will adopt measures, before the construction of the Shihutang Project, for protection of the ferry to obtain relevant historical information so that after the cultural relics protection work is completed, there will be no impact from the Project upon the ferry.
The ancient city site is located 40m from the south bank of the Kan River, where generally it is over 60.80m in EL, higher than the design flood level (58.65m), to suffer from no impact of water level rise in the Kan River. But the north wall of the ancient city, due to channel rerouting of the Zhulin River, has an EL of only 56.7m, about 0.20m higher than the normal storage level (56.5m), but lower than the design flood level (58.65m). If there are no protection measures before the project is implemented, the ancient city will suffer from adverse impact. In accordance with Cultural Relics Investigation Report of Jiangxi Shihutang Shipping and Hydropower Pivotal Project at the Kan River as compiled from Jiangxi Provincial Institute of Cultural Relics and Archaeology, there is a pledge therein to the extent that the Jiangxi Provincial Institute of Cultural Relics and Archaeology will adopt measures, before the construction of the Shihutang Project, for protection of the ancient city to obtain relevant historical information so that after this measure there will be no impact from the Project upon the ancient city.
6.8 Inundation of Mineral Resources
In accordance with Evaluation Report of Mineral Resources under Inundation from Jiangxi Shihutang Shipping and Hydropower Pivotal Project at the Kan River, the stratum here is simple in structure in the permanent acquisition of land by the Project, mainly composed of cretaceous Maodian Group (k2m), Zhoutian Group (k2z) and Hongningang Group K2hg) of red clasolite; of gravel and vermiform reticulate laterite of Jinxian Group of Pleistocene series of quaternary system; of alluvial gravel, sandy loam and clay soil of Holocene. There is no metallic mineral resource or non-metallic resource, except for such non-vital minerals as building sand, rocks and clay soil, etc.
In the permanent acquisition of land from Shihutang Hydropower & Navigation Project in the inundation area, there are no mineral resources under inundation; there is therefore no need for avoidance.

6.0 Environment Impact Assessmen t
Table 6.7 1 Analysis of Impact from Engineering Construction & Inundation
upon Cultural Relics
No Names Site Era Level Impact from project construction and inundation
1 Baikou ancient city
Zhoutou Village of Tangzhou Town, 3 km southeast of Taihe County Town, south bank of Kan River.
West Han to Sui Dynasty
state-level key protection
The site is located 25 km south of Kan River bank, where EL is usually over 59.3m, higher than design flood level (58.65m). Yongchang Embankment Protection will be constructed at least 5 km from the site. There will be no impact upon the site from Shihutang Hydropower & Navigation Project construction and inundation.
2 Gouzi Tower
About 20km upper reach of recommended dam site, at the top of shore hill
Qing Dynasty
County -level protection
The tower is about 60m to the shore of Kan River, whose foundation is higher than design flood level, to suffer from no impact from Shihutang Hydropower & Navigation Project construction and inundation.
3 Ouyang Ancestral Hall
About 35km upper reach of recommended dam site, at Shujiang Village of Mashi Town; 1.5 km to the shore of Kan River
Qing Dynasty
Under application for province -level protection
Far away from the inundation area, to suffer from no impact from Shihutang Hydropower & Navigation Project construction and inundation.
4
Huangkeng Ancient Ferry
west of Huangken Village, 2 km southwest of Zhangtang, Zhangtang Township, Taihe County
Qing Dynasty
Under no protection
Within the inundation area. Jiangxi Provincial Institute of Cultural Relics and Archaeology will undertake protection to obtain relevant historical data. There will be no impact upon the site from Shihutang Hydropower & Navigation Project construction and inundation.
5 Site of Ancient City
At Xiamu Village, Hejiang Village Committee, 2km to the north of Yongchang City, Taihe County
South Dynasty
Under no protection
The site is located 40m south of Kan River bank, where EL is usually over 60.68m, higher than design flood level (58.65m), to suffer from no impact out of water rise in Kan River. But due to river diversion from Zhujiang, the north

6.0 Environment Impact Assessmen t
wall with an EL of 56.7m, lower than normal water level, will suffer from water rise in Zhujiang River. Jiangxi Provincial Institute of Cultural Relics and Archaeology will undertake protection to obtain relevant historical data. There will be no impact upon the site from Shihutang Hydropower & Navigation Project construction and inundation.
6.9 Social Environment
6.9.1 Impact upon Social Environment during The construction period
� The project will need newly constructed roads lasting 40km long and expanded roads 4 km long. During the construction period, the engineering vehicles and material carrier vehicles will use existing roads and village roads. Partial jamming may occur to produce negative impact upon local traffic.
�The construction will adversely affect navigation. In line with the construction diversion program, on the first stage, operation will commence first on the cofferdam and the 11-hole flushing locks on the left bank and also on the ship lock and grooves on the right bank, ith only the central channel for navigation. After narrowing of the river the flow velocity will increase, which is unfavorable for navigation during the flood period, while during the dry season the deepened upstream is favorable for navigation. River navigation parameters are: When at the river section the average velocity is less than 2.0 m/s, ships will sail at will; when the average flow ranges from 2.0 to 3.0 m/s, they shall move from the help of tugboats. During the second stage, the right bank ship lock will have been completed for shipping. At the same time, the left bank will have 11-hole flushing sluices available for flow control to meet the need for upper stream and downstream navigation. In the second phase during cofferdam construction there will be about two months for suspension of navigation. In order to resolve this challenge, if necessary, there shall be public notice for such suspension in cooperation with local marine and navigation departments for shipping security.
[3] About 500m downstream on the right bank of the recommended dam site stands Sangyuan Primary School whose 200 students go to and from by a road in front of the school. During the construction period this road will be used for transport of materials, thus there will be high peak in traffic. As a result, good management of this road will be vital to students’ study and safety.
[4] The project will have about 4 years as the construction period, to have about 3900 personnel per day in peak, which will create desirable demand of meat and vegetables from

6.0 Environment Impact Assessmen t
306
local markets. If at 200 Yuan per day per capita, in peak time the local benefit will increase by 78000 Yuan per month. Construction units in operation will promote development of local catering industry, service industry and entertainment, in addition to supply of jobs to local residents. All of these factors will promote local economy, improve people’s living standards and promote development of local social environment.
6.9.2 Impact upon Social Environment during the operation period
� Kan River one of the major channels in China listed by the Ministry of Communications.. In accordance with Planning of Inland Channel and Terminals Layout in PR China, Grade III channel available for 1000-t ships is considered as “major channel”, channel for 500-t as “complementary channel” (Grade IV). Such major channels and Yangtze River channel network together with Pearl River channel network will make up 2 horizontal--one vertical--two networks--16 major channel layout called “2-1-2-16” , of which Kan River is part from Ganzhou to Hukou (606km). After completion of Shihutang Project, Grade III channelized waterway in Kan River will be extended in the upper stream by 38 km to finally realize the planned goal.
� Water transport is the traditional traffic in Jiangxi Province, at steady development at present. But in terms of overall transport system, water transport is far backward from railway or highway transport. Completion of Shihutang Project will promote development of the major channel in Kan River, development of modernization of harbor installation and of auxiliary support and safeguards system, and development of containers and special ship transport. Meanwhile the Project will accelerate modernization, upsizing and standardization of bulk carriers, to help water transport in Kan River develop in virtuous cycle.
� Upsizing and standardization of inland craft is the sole way to improve efficiency and adapt to market competition. Faced with market propeller and competition, water transport in Jiangxi Province is under self-adjustment. With gradual recovery of water transport market, especially due to flourishing as never before in transport of building materials and of mineral resources, water craft is harvesting better and better reward. Owing to the exemplary role of 1000-t and above carriers’ investment from individuals, more and more individuals realize that construction of heavy-tonnage vessels proves more efficient than light-tonnage ones. Jiangxi Province is rich in mineral resources and building materials, while the Yangtze River, Kan River and Xing River connects the middle and lower reaches of the Yangtze River and the Yangtze delta, where there is a huge demand for such materials and resources. Completion of Shihutang Project will greatly improve channel conditions so that bulk vessels may reach any places directly to reduce cost and improve economic benefits.
� With the fast economic development in Jiangxi Province, there will be greater demand for power. Shihutang Hydropower Station, a medium-scaled one, is close to the load center of Jiangxi Province, will become the backbone hydropower station. After completion the station

6.0 Environment Impact Assessmen t
307
together with Wan’an Hydropower Station is capable of peak modulation, to play a vital role in relief of power shortage in Jiangxi Province.
� Jiangxi Province as a power-shortage province has limited coal reserve, except for some hydropower. At present she depends upon thermal power and hydropower for energy. She has very limited coal reserve, after exploitation for some time, the resource will soon be exhausted. Her energy structure is far from rational, with coal to play too big a role. In 2004 all the power generated amounted to 327.77×10⁸kW·h of which thermal power contributed 297.64×10⁸kW·h or 90.8% of the total while hydropower generated only 30.13×10⁸kW·h or 9.2% less than one tenth. Shihutang Hydropower Station is one of the medium-scaled stations under planning. Once it is put into operation, it will raise the percentage of hydropower over the whole Jiangxi power grid and help to improve energy structure of Jiangxi Province .
� In terms of the history of urban development in Jiangxi Province, most of the towns and cities thrive close to rivers or lakes, therefore water transport plays a decisive role in formation and development of towns and cities. Development of water transport promotes fast development of towns and cities along the shores of such rivers as Kan River, Fu River, Xing River, Rao River and Xiu River. Depending upon water transport of Kan River, such big cities as Nanchang, such medium-sized cities as Ganzhou and Ji’an, such small cities and towns as Zhangshu, Fengcheng and Taihe came into being. In accordance with Urban System Plan in Jiangxi Province, by 2020, there will be such three super-metropolitan cities as Nanchang, Jiujiang and Ganzhou, one large city –Ji’an, and such four medium-sized cities as Fengcheng, Zhangshu, Ruijing and Taihe. Modernization of cities demands development of swift, efficient, safe and comfortable traffic, thus water transport will offer quality service for economic connection between all cities and towns, large or small.
� Jingang Mountain is one of the most famous revolutionary regions where people once made greatest contribution to foundation of PR China. Due to various reasons economy is still far behind the times, thus there is need for more investment to promote local economic development by exploitation of regional resources. Shihutang Project is located in the hinterland of Jingang Mountain, close to Jingang Mountain Scenic Spot, with numerous counties nearby, therefore the completion of the project will greatly promote regional economic development.
� Once into operation, Shihutang Project will not only create direct financial benefit to Taihe County but also necessary conditions for development of tourism by contribution to traffic and energy, thus to provide fresh chance for sustainable development of economy in Taihe County.

6.0 Environment Impact Assessmen t
308
� At present in Wan’he and Yanxi some farmlands often suffer from flood inundation in Kan River, with poor annual yield. Completion of Shihutang Project will bring such five areas under protection as Taihe County Town, Wan’he, Yongchang, Yanxi, and Zhangshu, so as to improve the current flood prevention standard from 2-to- 5- year-recurrence to 10-to-20-year recurrence. As a result, there will be 74.8km2 of area under protection, among which farmland totals 65000 mu and population 53000 persons. By improvement of embankment in left-bank inundation area of Kan River’s tributary Yunting River and of dyke in Mashi Town (tail of reservoir), there will be 1200 mu of farmland under protection. All of these will be beneficial for perfection of municipal infrastructure in Taihe, for protection of people’s lives and wealth and for improvement of farmland yield.
� Within Taihe County there are only highway bridges to connect the Kan River. Wanhe Town on the left bank and Yanxi Town on the right bank is somewhat far away from Taihe County Town, while there are about 43000 people in Wanhe, about 19000 in Yanxi. Both towns are backward in economy, where people depend upon boats or ships for traffic, to suffer from threat during flood seasons. Shihutang Project will build a highway bridge over the dam (10m in width and 1637m in length, with a pavement of 2×1.5m). Such a bridge will greatly relieve traffic bottleneck and remove any threat from flood to people or to water traffic, thus to play a great role in promotion of regional economic development.
� Completion of Shihutang Project will bring a lot of convenience to Taihe Water Plant and to intake of scattered pumping irrigation stations.
6.9.3 Impact upon Downstream Water Supply during Operation Period
In the 33km-long reach from Shihutang dam site downstream to Ji'an City there are such major water consumption units as Jinggangshan Power Plant Water Works, Hedong Water Plant of Ji'an City, No 1 and No 2 Water Plant, Water Works of the Pharmaceutical Plant, Wuyueguan Waterworks, to have a total designed daily supply capacity of 208.7 × 10⁴t/d, equivalent to the flow of 24.1 m3/s. See Table 1.7-3. The base navigation flow at Shihutang dam site is 187m3/s the ship lock has a flow of 11.24m3/s in the near future and 15.31m3/s in the long run. The project minimum assurance flow averages 198.24m3/s I the near future and 202.31m3/s in the far future.
At Shihutang dam site in the upper stream there is one tributary Guanyuan River with a catchment area of 558km2and mean annual flow at about 16.2m3/s whose inflow is under diversion by the Wanhe Diversion and Drainage Canal downstream.
Downstream from the Shihutang dam site to Ji’an there are two tributaries, of which Heshui River has a catchment area of 9058km2 with mean annual flow at about 262m3/s Gu river has a catchment area of 3084km2 with annual mean flow at about 89.4m3/s mean annual flow from the two tributaries total about 351.4m3/s.

6.0 Environment Impact Assessmen t
309
Since Shihutang Project is of runoff development, there is limited effective storage, ith almost no regulation control over the runoff. It serves as peak load modulation with Wan’an Hydropower Station for Jiangxi Power Network. To satisfy the base navigation flow at least equivalent to 187m3/s the discharged base navigation flow from Wan’an 130m3/s shall be under compensation from Shihutang reservoir (inflow at Shihutang reservoir totals 76.1m3/s . Therefore the mean annual, monthly and daily flow and water level downstream at Shihutang dam site is the same as the index at present See Table 6.1 9 and Table 6.1 11 .
To sum up, the water consumption from Shihutang dam site to Ji’an is equivalent to a water flow of 24.1m3/s while the aggregate inflow between the two regions reaches 565.84m3/s; meanwhile the mean annual, monthly and daily flow and water level downstream at Shihutang dam site is the same as the index at present, to show that operation of Shihutang project will create no impact upon normal water consumption downstream.
6.10 Regional Climate
6.10.1 Profile of Regional Climate
Kan River basin falls within sub-tropical wet climate, of east-Asian monsoon region abundant in rainfall. Annual mean rainfall totals 1300 1800mm in the basin, severely uneven in distribution between months. In accordance with record in meteorological stations in Kan River, most rainfall, about 41% 51% of rain in a year, drops from April to June. Annual mean evaporation amounts to 1294 1765mm annual mean temperature ranges from 17.2 to 19.3� while extreme temperature reached 41.6� observed in Yichun Meteorological Station on 16 Aug, 1953 and extreme low -14.3� observed in Fengcheng Meteorological Station on Feb, 29, 1991 annual mean humidity is 76% 82% with relative minimum humidity at 6% observed in Xiajiang Meteorological Station on Nov, 28,1978 annual mean wind velocity ranges from 1.1 to 2.9m/s while most severe wind reached 30m/s observed in Taihe Meteorological Station on Apr. 24, 1977 of west wind W . Annual mean sunshine averages 1628 1875h and annual frost-free period lasts 252 288days. Taihe Meteorological Station, closest to the Project, records annual mean wind velocity at 1.8m/s while maximum mean wind speed reaches13.4m/s.
6.10.2 Analysis of Impacts on Local Climate
River water impounding has changed the quality of the original underlying surface in that the energy budget has changed, which will affect the local climate. The impacts of water on the climate are classified into two types. The first one is direct influence, i.e. the air denaturalization above water body, where air will expand in all directions to land through stratospheric action. Such will change the air quality above the neighboring land but being of little impacts mainly on the air layer by the underlying surface. The other one is indirect impact. Due to the change of meteorological elements above the water body, the function of thermodynamic circulation is formed, which enables rising or descending of the air in large

6.0 Environment Impact Assessmen t
310
scale. In the air rising area, rainfall is easily formed. Increase of clouds in the daytime will reduce the sunshine hours, which will consequently lower the temperature, and vice versa in the nighttime.
6.10.2.1 Impacts on atmospheric temperature The impacts of the reservoir water body on temperature are divided into direct and indirect impacts. As for direct impact, due to the different thermodynamic features of land surface and water surface, when the air parcel moves on land surface and water surface, under the vertical exchange and horizontal exchange, different denaturalization will occur. In the daytime, the land is hotter than the water surface, while in the nighttime; such will be on the contrary. When the air parcel moves from land to water surface, cold denaturalization will occur, which is closely related to the moving time on the new underlying surface and the strength of turbulent exchanges. After completion of the reservoir, the water surface will be enlarged. The time for air parcel moving above water surface becomes longer, so such degree will be stronger than the previous one. As for indirect impacts, due to lower surface temperature of water than the land, in the daytime, there exists relatively strong down draft above the water body, while at the same time there exists rising current on the land nearby the banks of water body. After completion of the reservoir, the volume of clouds above water body in the daytime will reduce, while the volume of clouds above the lands by the banks will increase. According to monitoring data, every additional one hour of sunshine will enable additional rise of temperature of 0.43�; each additional of 10% of cloud volume, the daily average temperature will varieties 0.8-1.0�. The range impacted by water body on temperature is related to the areas of water surface. According to the survey of Hongshuihe River conducted by concerned departments, the maximum temperature difference between water surface temperature and land surface temperature is 2.0�. Such impacts shall cover the range of about 2km or less when the landforms are undulating. The water surface will be 250-550 m broader than the one before construction. The water surface after reservoir construction still shapes river type at 250-550m widths, showing little difference between before and after reservoir construction. Based on the temperature analysis of similar river-type reservoir project, the impact caused by change of water body on the temperatures in different seasons shall be about 0.1� covering the range of about 2km. It can be seen that the impacts after construction of the Project on temperatures of both banks are very limited.
6.10.2.2 Impacts on rainfall
The elements that affect the rainfall in reservoir district are relatively complicated, which are mainly due to the variations of water vapor content in the atmosphere above the reservoir and the changes of wind-fields caused by the changes of heating power. In daytime, due to the down current above water body, rainfall reduces; in nighttime, due to rising current above water body, rainfall increases. As for the land on neighboring area, such shall be on the contrary. The bigger water surface, the more obvious of such case is. After construction of the reservoir, it still belongs to river-channel type reservoir. The widened area of water surface will not be much, which will not bring much impact on the rainfall. The spatiotemporal distribution will remain the same, and the variation of rainfall will not be obvious. The

6.0 Environment Impact Assessmen t
311
gravitational field caused by the changes of heat power is relatively complicate. The prediction herewith only aims at the variation of rainfall caused by the changes of water vapor contents. The prediction formula is:
)
11(
1 ’’
KE
E
KR
R −+=
In the formula:
R—— rainfall after heading up, mm�
R—— rainfall before heading up, mm�
E �E—— evaporation quantity after and before heading-up, mm�
K—— moisture circulation coefficient;
K=1.002659+0.00005084L
L—— featured length of backwater area. m.
Analogical analysis of similar project, E /E =1.0029 computation results R /R =1.002. The annual average rainfall of the Project area is 1300~1800mm. The rainfall after heading up only increases 2.6~3.6mm than that before the heading up. It can be seen that the water impounding will basically have no impacts on rainfall.
6.10.2.3 Impacts on wind
When air current enters from the underlying surface of one property to another, wind speed will change due to the different degrees of roughness. When wind blows from land surface to water surface, due less roughness of water surface, the wind speed will increase. Variation of wind speed is related to the length of wind zone. The longer the wind zone, the bigger variation of the wind speed is. The addition of wind speed will be rapid at the beginning and gradually slow down till stable after passing certain distance. According to the monitoring data for similar projects, when the additional width is at 200-500m range, the wind speed will be 1.07~1.16 times of the previous speeds. The width of water surface after reservoir impounding will not change much, only 50~250m wider than the previous width. Therefore, the wind speed after reservoir impounding will not have obvious changes.
6.10.2.4 Impacts on foggy days
Variation of foggy days is related to the changes of local humidity and temperature. It can be seen from the paragraph of temperature impacts, the variation of temperature is little after water retaining. In addition, due to the little changes of the wideness of water surface after water retaining, plus humid location of the project, the impacts of water body on air humidity will be little, from which, it can be inferred that the dammed water will not have serious

6.0 Environment Impact Assessmen t
312
impacts on foggy days.
6.10.2.5 Impacts on frost days
The number of frost days is closely related to the average lowest temperature. According to the similar project survey, the reservoir after being completed will reduce 2-3 days of the frost period for the land nearby the water body than that of the land far away from the water body, i.e. prolonging the frost-free period for 2-3 days. According to the prediction of temperature variation, after the completion of the reservoir, the lowest temperature on the banks in winter will be 1.0� higher. The analogy analysis shows that the frost period in winter will be about 3 days less.
6.10.2.6 Impacts on humidity
According to the survey, the absolute humidity in summer above the water body shall be lower than that above the land, while in winter, it will be higher than that of land. The district for assessment belongs to low latitude humid area; the impacts of water body on air humidity will be less than that in dry areas. Based on the survey results of like projects before and after project construction, the absolute humidity in wet season after reservoir construction will be 1hpa lower than that before reservoir construction, while in dry season, the figure will be about 1hpa higher. Therefore, it can be inferred that the absolute humidity will not undergo obvious variation after water impounding of the reservoir.
6.11 Geological Environment
6.11.1 Analysis of Impact upon Embankment Stability
The reservoir created out of Shihutang Project is of river channel, with the embankment mainly of second bottom and second terrace. There is no discovery of such unfavorable geological conditions as collapse or landslide or bank failure, except for small-scaled embankment collapse or bank failure in the front of the terrace, therefore the embankment of the reservoir is basically stable and steady. Preliminary analysis indicates that after reservoir filling the soil embankment under long-term influence of wave impact will suffer from embankment collapse to some extent, despite not much negative impact upon the works’ construction.
In accordance with engineering surveying, the embankment out of second bottom suffering from torrential impact is poor in stability, mainly including the reach (a)from Jiangjiezhou to Huwei within Wanhe Embankment Protection Zone, from Jiangbei to Huangken within Zhangtang Embankment Protection Zone, from Yanxi Town to Xiajia Village within Yanxi Embankment Protection Zone, from Tangxuan to Shangtian Terminal within Taihe Embankment Protection Zone, and the reach (b)on the left bank of Shui River and the reach (c) covering most of the cave bank of Yunting River, to last about 29 km in length. Here the slope is of dualistic structure, the upper made of clay soil, loam, sand soil or fine sand to serve as the major soil of the slope; the bottom usually of gravel. The slope is most often 5 7m above normal water level at a grading angle of 60 75º, upright at partial reach. Estimate by

6.0 Environment Impact Assessmen t
313
descriptive geometry solution shows that after reservoir filling the above-mentioned embankment will suffer from bank failure by 15 to 21 m in width.
Although most of the rest of reservoir banks is made up of unconsolidated sediment of quaternary system, they are located on accretion beach with slow slope, under weak fluvial erosion, thus the embankment is desirably steady and stable. There will be little bank failure after reservoir filling. The embankment on the left bank of Dahe Tower and the reach on the right bank of Jiangbei and the reach close to Taihe Highway Bridge is made up of low hills of cretaceous red stratus, usually 30 to 40 m in height at an angle of 15º, almost horizontal. Here the embankment, about 2km in length, is basically stable, to suffer from no collapse or bank failure after reservoir filling.
6.11.2 Analysis of Potential Surface Collapse
The bed rock in Shihutang Project is all of dark purple thick stratified mudstone, of pelitic siltstone, of poststone and of packsand, etc, over 582.0m in thickness, of non-dissoluble rock. Without artificial underground caves, therefore there is no possibility of surface collapse from karst or from goaf.
The stratum is simple in structure in the permanent acquisition of land by the Project, mainly composed of Maodian Group (k2m), (k2z) and Hongningang Group K2hg) of red clasolite; of gravel and vermiform reticulate laterite of Jinxian Group of; of alluvial gravel, sandy loam and clay soil of Holocene. There is no metallic mineral resource or non-metallic resource, except for such non-vital minerals as building sand, rocks and clay soil, etc.
6.11.3 Analysis of Dam Deformation & Stability against Sliding
In the dam site the bare stratum is of red clasolite of cretaceous Zhoutian Group , and of alluvium of Pleistocene series and holocene of quaternary system weathered or lightly weathered red clasolite classified into C�—B�1, with four developed faults (F1, F2, F3 and F4), of which F1 runs 40—45° at a slope angle of 60—75°S--E of extensional fault and of medium permeable stratum; F3 is of unidentified structure, of medium permeable stratum; F2 and F4 are estimated to be of compression fault, of weak permeable stratum. There are four groups of crevice, of which the N—E joints and plane fracture are relatively developed, with clay gouged intercalation. The two sides of the dam are of earth and rockfill dam, with silty clay and loam as supporting course to the dam foundation. There shall be anti-seepage treatment to the bottom of sand and gravel layer. On the left bank on the second terrace the surface has an elevation of 60 to 66m, while the right bank is usually 56 to 66 m high in EL. In the bedrock the concrete dam has a foundation of weak weathered rock formation, there will be necessity of deep excavation in case of encounter with fault or dense joints.
The overburden soil at the dam site is of medium—compressibility, allowable bearing pressure and shearing resistance at the dam foundation generally meets the need for load of the earth and rockfill dam, which will suffer from no stability against sliding. At the concrete dam the bedrock is of silty mudstone, muddy siltite and interbedding of the two, out of

6.0 Environment Impact Assessmen t
314
cretaceous Zhoutian Group. Here the allowable bearing pressure and deformation behavior of the bedrock satisfies the need for concrete dam design. Here clay gouged intercalation of podiform is buried 10 to 20m below the bedrock, to create not much impact upon stability against sliding.
6.11.4 Analysis of Seepage Impact
6.11.4.1 Reservoir Seepage
The reservoir bank is of second bottom and second terrace, with partial low topography, lower than normal water level, and partial low hills of slow slopes, which are higher than normal water level, free from low pass or structure fracture zone, thus desirable in seal. Investigation indicates the well and reservoirs constructed along the low hills enjoy an elevation higher than normal water level. There is challenge from seepage just on the right bank of the dam site where there is underground sand and sandy gravel, for vertical anti-seepage engineering. After reservoir filling there is little chance of seepage.
6.11.4.2 Seepage through Dam Foundation
� Earth & Rockfill Dam The second bottom and the second terrace are covered with clay soil or loam, with a permeability coefficient of 1.29×10⁻⁷—9.26×10⁻⁵cm/s thus of weak permeability. On the bottom of the and the terrace are sand and gravel, with a permeability coefficient of 3.0×10-
3—1.0×10⁻¹cm/s of medium permeability, in need of anti-seepage engineering. Of the earth and rockfill dam if the permeability coefficient is less than 10Lu, it is considered relative water insulation. Boring packer permeability test indicates that the bed rock permeability coefficient is less than 10Lu, t satisfy the need for bed rock anti-seepage. But there are F1 and F3 fault of medium permeability in need of anti-seepage engineering.
� Concrete Dam
The bed rock at the dam site is of low permeability, desirable in permeability, except for dam foundation near boring ZK203 and ZK206, where permeability coefficient ranges from 10 to 100Lu of medium permeability in need of anti-seepage engineering.
6.11.4.3 Seepage through Dam Abutment
The earth and rockfill dam connects with the second terrace on the left bank and with massif on the right bank. Boring (ZK1) on the left bank and (ZK10) on the right bank indicates the stable underground water table reaches 57.56m and 58.77m respectively both of which are higher than normal water level (56.50m). There will be no seepage through dam abutment if the cut-off wall extends until the two sites.

6.0 Environment Impact Assessmen t
315
6.11.5 Analysis of Impact from Reservoir Silting
Sand and mud in Kan River comes mainly from flood’s top soil erosion, which is not so severe in the basin. It is not a silt-laden river. At the dam site the total annual discharge of sediment reaches 428×104t, mostly of fine silt 0.054mm . Due to low elevation of the sluice flour slab, which is favorable for discharge of sediment, all the discharge sluices are open to discharge of sediment in flood seasons, so that most of sediment from the upper reach will be discharged out of the reservoir. Sediment accumulation in the reservoir is estimated to develop into a small-scaled delta, with little sediment accumulation in the reservoir head and in front of the dam, which will produce little impact upon works operation.
6.11.6 Analysis of Reservoir-induced Earthquake In the reservoir the earthquake peak acceleration is less than 0.05g, corresponding to VI in earthquake intensity. In recent years there has been no active fault, with no background to induce strong earthquake, falling into relatively stable area. The reservoir is located in the central-to-south part of Jitai Basin, whose stratum is mainly of cretaceous redbed, weak in permeability. Fracture tectonics is mainly of cretaceous syn-sedimentary fault and small-scaled fault. There is no passage for the reservoir to seepage deeper. After operation the reservoir will not raise water head by much, which will produces little change in terrestrial stress, therefore there is little possibility to induce earthquake.
6.12 Analysis of Impact from Reservoir Inundation
6.12.1 Inundation Survey Within the reservoir some hydrologic(al) geology impregnation sections are arranged to determine the standard of reservoir inundation in accordance with groundwater mound, to make prediction concerning possible inundated areas.
� Taihe County Embankment Protection Zone The Protection Zone is located on the second bottom of the left bank, where the elevation ranges from 58.3m to 60.2m (upper reach to downstream), where the top clay is usually 5 6m in thickness. Except for the southern side of the protection zone, all the rest are for paddy fields. After reservoir filling, the crest elevation of the cohesive soil water-bearing zone reaches 56.5 58.9m and bury of underground reaches 0 0.9m.inundation will produce negative impact upon the areas south of Xinning, north of Gaoyin, east of Guanxi and west of Hunagjiaba, because there areas have an EL of 59.5m. the surface elevation on the south of the county town usually goes to 59.5 61m and after reservoir filling the crest elevation of the cohesive soil water-bearing zone reaches 57 58.6m where bury of underground is 0.90 3.3m therefore negative impact from reservoir inundation will be produced upon buildings of two to four floors whose foundation depth ranges 1.5 2.2m.
� Wanhe Embankment Protection Zone
Wanhe Embankment Protection Zone is located on the second bottom and second terrace of

6.0 Environment Impact Assessmen t
316
the right bank of Kan River, to feed on paddy fields. The second bottom is usually 5456m in EL and part of depression and bayou is only 5254m El. In the Protection Zone there is sparse terrace whose EL reaches 5658m, for cash cropping at present. The top clay on the second terrace goes to 3.66m in thickness. Most of the Protection Zone is lower than normal water level (56.50m)falling into inundation area. After reservoir filling due to ground water mound the groundwater table will reach 56.4058.62m all these areas lower than 56.5m will be under waterlogging, and these areas higher than 56.5m will be marsh under waterlogging, except for sporadic islands which will be free from impact out of inundation.
� Jintan Embankment Protection Zone
This Protection Zone is located on the second bottom of the right bank of Kan River, to feed on paddy fields, with limited second terrace on parts of Laodongtang —Maowubei. The second bottom elevation takes 1 1’ inundation section as boundary: east of Laojintan has an EL of 56 58m and west of Laojintan 58 60m with parts of terrace reaching 61 63m EL. After reservoir filling to 56.5m the backwater surface will reach about 56.8 57.2m EL.
The top clay on terrace from Laojintan to Xinzhou is generally 4.5 10m in thickness with part of marginal terrace lost. After reservoir filling the underground water has an elevation of 54.95 56.83m with a bury depth of 0 3.06m and these areas located at 57.4m EL(Mazhou, Jinhu and Jujia Village) will be under waterlogging or become marsh under waterlogging
The top clay on terrace from Laojintan to west of Xinzhou is generally 4 7.2m in thickness with part of marginal terrace lost in Kan River and Yunting River. After reservoir filling the underground water has an elevation of 57.11 57.95m with a bury depth of 1.22 2.75m. there will be no impact upon most areas with EL over 58 60m. But after reservoir filling the normal level of Yunting River remains at 57.2m almost the same as that in Kan River, thus the terrace located between Yunting River and Kan River and the coast along Yunting River which is lower than 58.0m will suffer from inundation.
� Yanxi Embankment Protection Zone
This Protection Zone is located on the second bottom of the left bank of Kan River, to feed on paddy fields, with limited second terrace (dry land) for cash crops.
The second bottom is usually at 54.5 56.5m with only part of Caoping in the upper reach reaches 56.5 57.3m EL basically under inundation. The top clay on terrace is generally 2 5m in thickness with part of marginal terrace lost. After reservoir filling the underground water has an elevation of 55.86 57.15m a bury depth of 0 0.75m basically to be under waterlogging or to become marsh under waterlogging.
The second terrace has an elevation of 60 62m, whose margin borders the second bottom where develops a NE gulch. From Xiaojia Village to Zhangjiapeng to Kan River, the margin due to erosion reaches 58 60m EL. The top clay is usually 4 7m in thickness with the bottom made up of gravel. After reservoir filling underground table in the terrace reaches 56.37 60.25m with a bury depth of 0.85 2.75m. Since the dry land and the villages are

6.0 Environment Impact Assessmen t
317
located in high places, there is no impact from inundation after reservoir filling.
� Zhangtang Embankment Protection Zone
This Protection Zone is located on the right bank of Kan River, to feed on paddy fields. This Zone is mainly situated on the second bottom of Guanshui River and its tributaries, with an elevation of 58 54m. The second bottom on the right bank of Kan River goes usually to 56 57m EL. Embankment protection will be constructed along Kan River, with the dyke foundation under vertical anti-seepage treatment. Wanhe Canal head will extend to Guanyuan River, and at the converge of Guanyuan River to Kan River there will be a large sluice (Zhangtang Regulating Sluice) and a smaller one (Wanhe Regulating Sluice). By way of pivotal sluice and the two regulating sluices, Guanyuan River will remain what it naturally was. After vertical anti-seepage treatment the underground water will mainly connect with Guanyuan River. Since the works will not change the natural state of Guanyuan River, there is little chance of impact from inundation.
� Reservoir Head Zhoutou & Mashi In case of normal water level (56.5m) and under full-load flow (2400m3/s) for Taihe Hydropower Station, the backwater elevation will reach 57.557.9m, about 0.8 1.1m higher than water surface curve of the same flow in natural state. Investigation shows that Zhoutou and Mashi has an elevation of 6162m, while top clay of the terrace usually reaches 4 6m in thickness. When the reservoir filling reaches 56.5m, the ground water mound will reach 58 59m with a bury depth of 3m or sotherefore basically there is no impact from inundation.
Based on uplifted bury depth due to ground water mound (except for Mashi inundation area which will be under treatment), all areas under potential inundation are under protection from embankment.
In protection design for each embankment protection zone, the embankment has been raised, consolidated or newly constructed, to develop into sealed protection ring. Vertical anti-seepage treatment has been undertaken; drain system has been completed in regulation and dredging, with drain pumping stations completed in outlet of inland inundation and waterlogging control; hillsides within the area have been under diversion. As a result, all problems facing inundation have been solved.
6.12.2 Inundation Analysis
Field survey and data provided by local agriculture department and urban construction department indicate that in the reservoir area the major crops are composed of rice, rapeseed, tea, cotton, sugar cane and Penny’s potato, etc. Buildings in the area are divided into three categories: Category No 1 includes the one to three story rural housing, mostly of strip foundation with embedded depth of foundation ranging from 0.5m to 0.6 m; The second category includes 2-4 story urban buildings, mostly of strip foundation with embedded depth of foundation ranging from 1 .5m to 2.2 m; Category No 3 consists of 3 to 5 story or high

6.0 Environment Impact Assessmen t
318
urban buildings, mainly of pile foundation with the supporting course located in the gravel or bedrock below the underground water. Due to dual structure in terrace stratigraphy in the reservoir area, the underground water is mainly of confined underground water. Calculation of elevated underground water level is based on hydrodynamic theory to obtain the creast slab depth of water-bearing zone in the clay. Capillary rise height for clay in the reservoir is calculated at 1.0m to 1.50 m. According to the "Farmland Drainage Engineering Technical Norms" (SL/T4-1999) and distribution features of local crops and buildings, immersion standards are recommended. On the basis of underground water level due to elevation from reservoir filling and the corresponding immersion standards, except for the inundated area, it is known that all areas likely to inundation impact are all located within the protection zones. To prevent possible impact from inundation, the project will develop such five protection zones Wanhe, Yanxi, Zhangtang, Yongchang and Taihe County City. The protective embankment line lasts 38.38 km long, of which the embankment in Taihe lasts 3.36 km long, in Wanhe 8.12 km, in Zhangtang 0.80 km, in Yongchang15.79 km, in Yanxi 10.32 km. The Daotuo Canal lasts 61.33 km, of which restored canal of the original section after dredge lasts 17.18 km long; Yongchang canal lasts 14.45 km (improved in line with original standard); newly constructed canal from Wanhe to Yanxi lasts 29.70 km long; improved diversion channels last 11.85 km long; there will be 6 newly constructed pumping stations with a total installed capacity of 5456 kW; there will two new regulation locks. The Works will lift fields by 1237.05 acres. Works grading and flood control standards: Grave IV for rural protective zones, III for Taihe County City; design of flood recurrence year ranges from 10 to 20 and 20 to 50 years respectively for rural and urban areas. The drainage design criteria is as follows: for the protection zones with villages and towns, the flood prevention standard will be five-year-recurrence of a rainstorm for 3 days until drainage is achieved to the depth of submerge-resistance; for Taihe County City the drainage standards shall be "Preliminary Design Report of Taihe County Flood Control" (as compiled by Ji’an City Water Conservancy and Hydropower Planning and Design Institute) concerning the 10-year-recurrence rainstorm for one day without inundation to the main buildings; for the drainage canals within thee protective zones corresponding drainage standards will be practical.
From the said information it is known that in the reservoir area to prevent possible immersion, in the protective zones the protection engineering design shall take such measures as reinforced heightening of the protective embankment to basically form a closed protection ring; vertical impermeable treatment shall be adopted against the dual foundation of the protective embankment; the gutter shall be under renovation and dredge and there shall be drainage pumping stations where there is frequent waterlogging; the hillside runoff shall be

6.0 Environment Impact Assessmen t
319
under diversion and drainage; some regions have adopted elevated fields measures. Engineering design shall fully take into account the immersion problems. The inundation has now been basically resolved.
This evaluation recommends that in the next design phase of the project, according to the elevated water levels and inundation standards in protection zones there will be detailed survey concerning inundation with corresponding counter-measures.
6.13 River Regime & Flood Discharge
On the basis of Flood Prevention Report of Shihutang Project, in Kan River of Jiangxi Province, analysis is made concerning impact from the project upon the river regime and flood discharge.
� Shihutang Project dam will narrow the original discharge flow cross section, to raise water level in the upper reach of Kan River and enlarge the flow cross section for flood discharge in the upper reach, thus to slow down the flow rate. But the Project after completion will achieve limited rising of water and very limited flow speed-down. In case of flood P=50%P=3.3%, flow is accelerated by 3.80%3.21%. After completion the Shihutang Project during non-flood seasons will achieve reservoir filling to raise water level in the upper reach, to deepen the water and reduce flow rate, there will be little change in sediment accumulation because at this period there is little sediment concentration in the river, and there is little impact from flushing downstream. Sediment accumulation produces little impact upon water surface curve and works operation. In engineering design there will be works concerning protection of downstream embankment open to erosion or collapse. In a word after completion the Shihutang Project will not change basic stability of the existing plane form of the Kan River within the affected area or the situation of slow riverbed silting. The Shihutang Project produces little negative impact upon the stability of the river regime.
� Shihutang Project will construct a barrage in the major channel in the middle reach of Kan River, with little change in clear width in terms of sand sluicing gates, and its bottom slab is almost of the same elevation as that of the original river bed, thus favorable for flood discharge and sediment discharge. In construction and operation the Shihutang Project will raise the water level in the upper reach, but not much. Although the Project narrows the flow cross section, but the raised water head will accelerate flow rate so that the flood still flows smoothly. In a word, the Project produces little impact upon flood discharge.
� After completion the Shihutang Project raises the water level in the upper reach, but not by much. Thus the Project will create little impact upon existing embankment projects or bridges.
� During construction all sand and gravel for the works will be obtained from nearby river channels, with block stones from nearby quarries. Despite the sporadic distribution of embankment projects, all stones for the works will be locally obtained. Despite heavy traffic during the construction period, during flood season there will no use of flood control vehicles and after completion of the project there will be no damage to highways or traffic conditions. In a word, the Project produces no negative impact upon emergency flood fighting.
� In engineering design, the permanent water retaining structure, outlet structure and energy
6.0 Environment Impact Assessmen t
320
dissipation works in Shihutang Project are all proper and desirable for proper flood control, in line with the flood control standard in each of the embankment protection zone.
� after completion the Shihutang Project creates more convenience for Taihe Water Plant and pumping irrigation stations.
� Shihutang Project will raise water level in non-flood seasons to meet the need for irrigation and enlarge the scope of inundation in the upper reach, which will create much impact upon drain for the farmland. In addition, during operation Shihutang Project will create flushing downstream, to produce possible collapse or bank failure. All these have been under proper engineering treatment in design in line with technical descriptions, standards or criteria.
6.14 Navigation
Impact upon navigation is under analysis in line with Verification Report of Navigation in Kan River in Jiangxi Province concerning Shihutang Project.
� The major purpose of Shihutang Project is to improve the channels, complimented from power generation and flood control. The Project will achieve canalized waterway totaling 38km (Grade III), to play a desirable role in improvement of existing channel, which is difficult for navigation.
� After completion the Project produces little change in runoff or flood in the main channel. Discharge at 187m3/swill create no impact upon all kinds of function of downstream pivotal hydraulic works. Instead, the Project will play some role in navigation during low water periods. Meanwhile such a discharge will create prerequisite for the downstream channel to meet Grade III.
� The balancing storage of this Project is not large, but it still is capable of daily adjustment to guarantee basic navigation to some degree.
� During construction of the cofferdam in the second stage, with development of the berm, original channel will no longer be too narrow to be available for navigation, while the permanent structure will not function until the water is raised to certain level, thus there will be a period not open to navigation. To solve the problem, it is recommended that cooperation with the maritime and navigation departments concerned be established to apply for temporary blockage with necessary notice in advance, for the sake of safety.
� construction of the Project will make the original leading light fail to function, which will create negative impact upon navigation. Therefore there shall be cooperation with the maritime and navigation departments concerned to establish temporary light for the sake of safe navigation.
6.15 Public health
The analysis of the impacts of hydropower projects aims to predict the possible occurrence, spreading and development of some diseases caused by the environmental changes due to project construction and operation. The predictive analysis herewith covers the diseases of

6.0 Environment Impact Assessmen t
321
natural focal diseaseendemic diseasewater-borne infection and insect-borne infectious disease etc. The methods for assessment mainly is analogical predictive analysis.
6.15.1 Analysis of impacts of the Project on public health during construction
The project construction lasts four years to involve 3900 employees per day during construction peak. During the construction period, frequent floating working staff will increase the chances for spreading of various diseases, which will bring some epidemic diseases that the construction sites do not previously have, or extend some diseases of the areas to outside places. Sanitary garbage, ordure and wastewater, if not properly treated, will cause pollution to river and water sources. Local people and the workers who drink the water may suffer from intestinal epidemic disease such as hepatitis and bacillary dysentery, which, if not properly controlled, will lead to mass epidemic diseases. On the other hand, earthwork and stonework after excavation will easily form plashes where may become the places for breeding of mosquitoes, thus may lead to the occurrence and spreading of insect-borne infectious diseases including malaria. Dust, NO2, SO2 produced by construction will have adverse impacts on the air of the construction site, which will add to the patients who suffer from respiratory diseases. Noise pollution may harm the auditory system and public health. Meanwhile, strong labor intensity of the workers may worsen the physique and weaken the resistance against disease, and labors may easily suffer from disease. It can be seen that project construction will bring adverse influences on the working personnel and neighboring residents. According to the statistical dada of 1987 of Yantang Hydropower Station of Hongshuihe River, in the construction site, there were over 200 people suffering from diarrhea, more than 300 people from malaria. The incidences of these two diseases in local countryside are relatively higher during construction period than that before construction, indicating obvious rising.
6.15.2.2 Analysis of impacts of the Project on public health during operation
People’s health is closely related to the natural conditions, living habits, living idea, living standard and sanitary conditions. However the impacts on the health by these factors are complicate which shall be difficult to present quantitative description. Therefore, the prediction herewith adopts analogical method. The similar project is Dahua Hydropower Station that has the same natural river channel. From the collected materials, it can be seen that:
1 No epidemic diseases are found due to environmental changes after 10 years of water retaining in Dahua Hydropower Station;
2 No schistosomiasis patients or oncomelania are found before and after reservoir construction.
3 The incidences of diarrhea and viral hepatitis of water-borne infection are high during construction period and reduced after one year.
4 The incidence of malaria is high during construction period, and tends to reduce after water retaining. No fulminate epidemic is found.

6.0 Environment Impact Assessmen t
322
5 The encephalitis B does not have obvious changes. From the analogical data, it can be predicted that, after water retaining of the reservoir, the project will not have adverse impacts on the people’s health. On the other hand, operation of the project will promote the local economy and living standard. The cultural information exchanges will be also enhanced. People’s living ideas will also undergo changes, which will make them attach to the good living habits. Therefore, the bad factors that affect people’s health will disappear gradually and the occurrence of various epidemic diseases will be controlled.
6.16 Solid Waste
Solid waste produced during construction consists mainly of builders’ rubbish and domestic garbage. Peak yield of solid waste will total 3900Kg/d during the construction period, and the gross solid waste from the project will reach 200 to 300 tons. If there were no effective measures to treat the waste, constructors' health would be under threat, and surroundings and landscape will be polluted.

7.0 Special Assessment of Impacts on Large & Old Trees
323
7.0 SPECIAL ASSESSMENT OF IMPACTS ON LARGE AND OLD TREES
According to Special Appraisal on Impact to Old and Famous Trees and Key Wild Plants of the Shihutang Project of Jiangxi Province compiled by Forestry Institute of Jiangxi Agricultural University, as well as impact of project construction period and operating period of field investigation result appraisal of this appraisal to the old and famous trees and key wild plants, nature protection area distributed within the appraisal range, and put forward corresponding protective measures.
According to the field evaluation of experts of Forestation Commission of Jiangxi Province Forestry Department, all old trees within the appraisal range of the project belong to Class III old trees See Appendix V for details Forestation Commission of Jiangxi Province made an official reply of Special Appraisal on Impact to Old and Famous Trees and Key Wild Plants of Navigation and Power Junction of Kan River Shihutang of Jiangxi Province with the title of Reply of Special Protection of Old Trees of Navigation and Power Junction of Kan River Shihutang of Jiangxi Province GanLuBanHan [2007] No.1See Appendix III for details .
7.1 Investigation of current status of old and large trees 7.1.1 Determination of old trees, big trees
Consult with the file information of old trees of Taihe County, we found that most old trees in the project area have not established files, which should be confirmed during the field investigation. Most old trees in the project area are Cinnamomum camphora, according to natural growth rhythm of Cinnamomum camphora in Taihe County and evaluation method of Taihe County Forestation Commission on old Cinnamomum camphora, for Cinnamomum camphora that has no exact age record, determine diameter at the breast height �100cm belong to old tree. Considering that other places usually take diameter at the breast height 80cm as old Cinnamomum camphora, hence, big Cinnamomum camphora ——“potential old trees ” big tree with a breast diameter 80 100cm should also be as object of detailed investigation.
Tree species that have no exact age record should be determined according to local habitat conditions with analogy method.
7.1.2 Field of investigation
Field of investigation is the entire project area of Shihutang navigation and power junction project, including inundation area, junction area, protection area, construction area, resettlement area and etc.
7.1.3 Investigation contents
� Investigation of old and famous trees

7.0 Special Assessment of Impacts on Large & Old Trees
324
Carry out investigation and inspection on species of old and famous trees, diameter at the breast height, tree height, crown diameter, age, growth status, site condition, as well as accurate measurement and positioning of azimuth and elevation of old trees and big trees.
� Investigation of key protected wild plants Carry out investigation and inspection on species of key protected wild plants within investigation area, diameter at the breast height, tree height, crown diameter, growth status, site condition, as well as accurate measurement and positioning of azimuth and elevation of them.
� Investigation of old and famous trees and key protected wild plants habitat Carry out investigation on habitat condition of old and famous trees and key protected wild plants, especially detailed investigation on composition of habitat and tree species of old tree groups.
�investigation of root system of affected tree species According to the investigation and data processing of the aforesaid contents, find out tree species affected by the project. And further carry out investigation on the root system situation, distribution features and growth soil of these tree species in the investigation area, and provide scientific basis for the impact assessment of these tree species and protective measures.
� Investigation of water tolerant situation of affected tree species investigate tree species distribution and growth status affected by the project of habitat similar with the project area after retaining water on the bank of reservoir, pond, river close to the water level, so as to make analogy analysis evaluation on the impact of these tree species.
7.1.4 Investigation method
� Investigation of old and famous trees and protected plants: carry out detailed investigation and every-tree inspection on various investigation contents, hang tag and numbering, photo, and control measurement with total station, and carry out level and elevation positioning on each investigating object.
� Habitat investigation: investigate the composition of tree species of old and famous trees and protected plants community, especially old trees community, and select typical sector, excavate soil profile combining with root system investigationto carry out soil investigation.
� Root system investigation: excavate a soil profile on the investigated trees in south-north direction, carry out investigation on growth situation of the entire root system, mainly investigate the morphological characteristics and level and vertical distribution situation of main root and Grade I, II and III of lateral roots.
7.1.5 Current investigation result
Taihe County is situated in the central subtropical zone, belong to east moist forest region in the China vegetated area with characters of subtropical zone evergreen broad-leaved forest

7.0 Special Assessment of Impacts on Large & Old Trees
325
belt, advantageous natural environment and abundant hydrothermal condition; however, the original vegetation is destroyed seriously due to the requirements of local production and life, less native and semi-native vegetation, evergreen broad-leaved forest is reserved better only under special habitat condition of tiny minority mountainous area and crick area, the rest mostly are secondary forests, artificial forest and scrub and grass clump or fell grass clump.
According to this investigation, vegetations in the project inundation area and around the reservoir are mainly secondary forest and artificial forest, such as protective forest of protection embankment, village amenity forest and poplar young growth of returning land for farming to forestry and etc. plants in inundation area are mostly common species distributed at low elevation.
Famous trees and wild national key protected wild plants have not been discovered in the project area.
7.1.5.1 Distribution status of old trees
After field investigation, there are altogether 215 old trees in the project areaaccording to the filed appraisal of experts of Forestation Commission of Jiangxi Province Forestry Department, all old trees belong to Class III protective old trees, including 211 Cinnamomum camphora, 2 Cupressus funebris, 1 Sabina chinensis and 1 Castanopsis sclerophylla. The old trees are mainly distributed in old forest of Jintan, Huanghangpengxia, Xinzhou, Shihutang, Jiangjiazhou, Xiabian Village, Yinxiajiang, Taipan, Zhangjia, Laohukeng and etc. Old trees form an old trees community in nature protection area of Jintan, and others are irregular stocking in the village or beside the village sporadically. Moreover, there are some sporadic distributions of old trees in Tongluobei, Lingbei Village and Xiayinxia Village. Since the terrain is higher with farther distance, according to the arrangement of the project scheme, the project construction has basically no impact to them; hence, it is not involved in this investigation. See Figure 04 for detailed distribution of old trees in the project area, and see Figure 29Figure 38 for detailed positioning of each old tree See figure collection for photo of each old tree.
� Old trees distributed on the protection embankment There are 6 old trees on the planned construction protection embankment of the project, see Table 11 for details.
� Old trees distributed in the protection embankment Considering the construction of protection embankment may have some impact to old trees, so investigation has been made on old trees within the range about 50m in the internal side of the embankment. There are 14 old trees in this area after the investigation, see Table 12 for details.
� Old trees distributed in other project land
There are 7 old trees beside the highway of Shihutang Village on the edge of junction project area after the investigation, see Table 13 for details.
� Old trees outside the protection embankment

7.0 Special Assessment of Impacts on Large & Old Trees
326
The protection embankment is designed on both banks of the reservoir area, which is located outside the protection embankment and 7 old trees are distributed in the inundation areathe range of inundation area will be determined on the basis of corresponding water level elevation of switch off critic flow 4700m3/s, see Table 14 for details181 old trees are distributed in the non-inundation area, and see Table 15 for details, altogether 188 old trees. Most of these old trees are in Jintan.
7.1.5.2 Distribution status of big trees
Key national protected wild plants have not been discovered in the project area through the investigation. Although Cinnamomum camphora in the project area not belongs to wild plants, however, as a protective species, it has important economic use and ornamental value. Furthermore, diameters at the breast height of many Cinnamomum camphora are between 80 100cm, which belong to “potential old trees”, hence, project impact to these old trees should be controlled to the minimum as well. Therefore, detailed investigation has also made on Cinnamomum camphora with diameter at the breast height 80 100cm. after investigation, there are 74 Cinnamomum camphora with diameter at the breast height 80 100cm in the project area, including 9 trees in the inundation area, 4 on the embankment, 60 outside the embankment and 1 inside the embankment. See Table 16 for details.
In summary, there are 215 old trees distributed in the project area after the field investigation, including 6 old trees in the planned protection embankment, 14 old trees within protection embankment, 7 beside the road of Shihutang Village on the edge of the junction project area, 7 old trees in the inundation area outside the protection embankment, 181 old trees in the non-inundation area outside the protection embankment most of them is located in the Jintan Nature Protection Area at County Level . Moreover, there are 74 Cinnamomum camphora potential old trees with breast diameter of 80 100cm in the project area, including 9 in the inundation area, 4 on the embankment, 60 outside the embankment and 1 inside the embankment.
7.2 Investigation on growth situation of root system of Cinnamomum camphora in the project area In order to know impact to the growth of old trees and big trees of Cinnamomum camphora reserved in the project area for Shihutang Hydropower Project after it fills water according to the design water level, investigators have made deep field investigation into Huangkengpengxia, Zhoushanzhou and Jintan of the project area where distribution of old Cinnamomum camphora and big Cinnamomum camphora are concentrated, and then select representative sectors to carry out investigation and analysis on growth situation both on the ground and underground of old trees and big trees of Cinnamomum camphora.
Investigation content include: � distribution rules and growth characteristics of innamomum camphora Class � lateral roots main root system of fixed Cinnamomum camphora
� Root system distribution of Cinnamomum camphora and correlativity of crown
diameter�

7.0 Special Assessment of Impacts on Large & Old Trees
327
� Distribution status of main absorption root system and growth correlativity of
Cinnamomum camphora.
We investigate 3 old trees of Cinnamomum camphora this timeJintan No.47, No.35, No.20 5 big trees 2 in Huangkengpengxia, 3 in Zhoushanzhou. Among them, we investigate root system distribution and growth situation of 4 old trees by digging soil along the basal of trunk since outside soil of old Cinnamomum camphora at Kan River side of Jintan collapse, we investigate root system distribution and growth situation of 2 old trees Main root system of old trees were exposed due to erosion by large water for many years in Zhoushanzhou, in cooperation with manual oil excavation this time, we investigate root system distribution and growth situation of 2 old trees. For the purpose of not affect the normal growth of the trees, excavate usually at most 2 direction during the investigation, after the investigation, the soil will be returned back to the original location. Through careful investigation and analysis, master basically the old trees and big trees root system distribution and growth situation of Cinnamomum camphora. The detailed investigation result is as follows:
� 8 old trees and big trees of Cinnamomum camphora in this investigation, Class� lateral roots usually is prominent at basal of trunk, judge accurately on the basis of prominent situation the number of Class� lateral roots growing from the basal of trunk. Class� lateral roots of 8 Cinnamomum camphora in this investigation are 3-4, Class� lateral roots enter into the soil 40-60cm depth in slant or vertical direction from crown of root, and then extend outwards in the soil layer of 40-60cm depth, during the slant or horizontal extension process of Class� lateral roots, branches grow every interval 20-50cm, Class � lateral roots will grow gradually during the growth process of Class � lateral roots. Usually Class� lateral roots grew from the basal of trunk are bulky board shape or round shape big root, most diameter of Class� lateral roots is equivalent to 2/3 ground diameter at the connection point with the trunk. For example, the trunk ground diameter of No.3 big Cinnamomum camphora in Zhoushanzhou is 40cm, while diameters of 4 Class� lateral roots reaches to 28cm. since each old tree of Cinnamomum camphora has 3-4 large Class� lateral roots extending into the soil and generate a lot of Class �—Class � lateral roots, which form a Class �—Class � lateral roots network, enable the tree roots firmly in the soil and not afraid wind blow and snow pressure.

7.0 Special Assessment of Impacts on Large & Old Trees
328
Huangkengpengxia
Jintan
Zhoushanzhou

7.0 Special Assessment of Impacts on Large & Old Trees
329
Cinnamomum camphora growing at the waterside of Jintan Village
� The root system of cross growth distribution zone of 4 old trees and big trees investigated in this soil excavation all exceed the projection of tree crown. Tree crown east-west direction of No. 62 large Cinnamomum camphora in Huangkengpengxia is 13.1m; root system east-west direction excavation reaches 14.5m, which exceeds projection of tree crown 1.4m. Tree crown north-south direction of No. 47 old Cinnamomum camphora in Jintan is 12m, root system north-south direction excavation reaches 13.3m, which exceeds projection of tree crown 1.3m. most root system distributed around tree crown is Class � lateral roots or rootlets and fibrous root. Most of them is distributed in the 5-30cm soil layer, root system both inside and outside the tree crown forms an immense absorption water and nutrient network, which provide continuously water and nutrition to the tree and promote the fast growth of the tree.
� Investigation result shows that depth of Class� lateral roots of Cinnamomum camphora distributed in the soil mostly is 40-70cm, most Class � lateral roots grew from Class� lateral roots and Class � lateral roots grew from Class � lateral roots is distributed in 30-40cm soil layer. Rootlet diameter is less than 0.5cmand fibrous root are distributed mostly in 5-30cm soil layer, rootlet and fibrous root are main root system to absorb water and nutrition it is called absorption root system for Cinnamomum camphora. It must have fine water and air permeability in the distribution scope of the absorption root system, thus, it can promote the metabolism of root system and sprout new roots, and the root system keeps strong vigor. According to biological characteristics and growth characters of Cinnamomum camphora, Cinnamomum camphora has certain water resistance, however, its absorption root system cannot be submerged in the water for a long time, Otherwise, the root system will rot due to poor ventilation condition, and finally cause poor growth of the trees or even death. The investigation result shows that water level in distribution area of Cinnamomum camphora lower than 1.0m will not have apparent impact to the growth of trees.
7.3 Impact appraisal of old and large trees According to requirements of Regulations for the Protection of Old and Famous Trees of Jiangxi Province 2004.11.26 : old tree refers to tree with ages more than 100 years Famous tree refers to rare, precious trees or trees that have important historical, culture, scientific research value and memorial meaning. Old trees implement grading protection method. Old trees with age above 500 years will be the first grade protection; old

7.0 Special Assessment of Impacts on Large & Old Trees
330
trees with age above 300 year and less than 500 years the second grade protection, and age above 100 years and less than 300 years the third grade protection. Famous trees implement the first grade protection. Old and famous trees that should be transplanted due to the construction of important engineering project must apply to the forestry, city greening competent administrative department according to the following regulations: transplant first, second grade protection old trees and famous trees, apply to the forestry, city greening competent administrative department of district governmentTransplant third grade protection old trees; apply to the forestry, city greening competent administrative department of county level government.
After evaluation of expert of Forestation Commission of Jiangxi Province Forestry Department, all old trees distributed within the appraisal range belong to the third protection old trees See Appendix V for details.
The representatives of the Owner, engineering designer, environment assessment personnel, ecological and old trees protective researcher form a joint working group, taking design recommendation embankment line scheme of engineering design as the basis, carry out field investigation on impact of the engineering design scheme to old trees, in case design recommendation embankment line scheme has impact on the old trees, consider firstly to adjust the embankment line directionWhen the designers confirm that the embankment line direction cannot be adjusted after considering various factors comprehensively, then the environment assessment personnel, ecological and old trees protective researchers should consider protective scheme and measures.
According to the design recommendationembankment line scheme based on full protection of old trees confirmed jointly by the engineering design contractor and environment assessment personnel, ecological and old trees protective researchers, after field investigation and actual measurement, old trees distribute within the range of project area: 14 old trees are inside the protection embankment, 6 on the protection embankment, 188 outside protection embankment and 7 in the vicinity of junction area construction area. According to azimuth and elevation of old trees, during the project construction and after junction project storing water, it will generates different impact to old trees, through biological characteristics and ecology characteristics analysis on old Cinnamomum camphora, as well as root system investigation of typical old trees, old Cinnamomum camphora in the project area has certain adaptability of water resistant due to discontinuous immersion for a long time, in addition, Cinnamomum camphora itself has stronger water resistant characteristics. The project will generate the following impact to old trees on the basis of positioning analysis on old trees one by one:
7.3.1 Old trees inside the protection embankment
When the water level doesn’t exceed the protection embankment, it will not be affected by the river in principle. Its impact factors are: old trees near the dyke during the construction of the project, take soil to build the dyke, build bunkhouse, root system of old trees, and trunk or tree crown may be damaged directly by machine during the implementation of mechanical operation.
7.3.2 Old trees on the protection embankment

7.0 Special Assessment of Impacts on Large & Old Trees
331
When dyke construction and earth filling at upper part of root crown of old trees and lower than 1.2m, it will not generate serious impact to the growth of old treesif new dyke earth filling exceeding above 1.2m, it may generate bad impact to the respiration of root system of old trees and new root system will not be easy to generate in the root crown of old trees and trunk earth filling section.
7.3.3 Old trees outside the protection embankment
Elevation of root crown of 183 old trees is larger than 1.0m above elevation of design level, it will not generate bad impact in common hydrological yearselevation of root crown of 5 old trees is larger than that of design level 0.51.0m, the river water will generate certain impact to the respiration of root system, and cause week growth and even deathDesign level of old tree at root crown and below will be affected seriously, and finally lose the plant.
Xinzhou has 9 old trees. Since Xinzhou will not build protection embankment, and elevation of old trees has smaller elevation difference with design level0.27 0.66m , these old trees will be affected seriously.
There are 161 old trees in Jintan old forest, since Jintan old forest has been eroded seriously along the bank, after the junction project is completed, the water level will be advanced, the soil of slope of river bank below the design level is immersed in the water for a long time, which may cause collapse, some root system of old trees far from the bank may be eroded to be exposed, and affect seriously the normal growth of old trees.
7.4 Impacts on Zhujia Village Nature Reserve and Environment Protection Alternative
Scheme
7.4.1 Zhujia Village County Level Small Natural Reserve (Jintan Old Woods) of Tangzhou Township
Zhujia Village County Level Small Natural Reserve (Jintan Old Woods) of Tangzhou Township is located at Jintan Village of Tangzhou Township with an area of 330mu, including core area 225mu, buffer zone 105mu. In July 2002, Reply on Agreeing to List Cinnamomum Camphora Forest of Zhujia Village of Tangzhou Township as Small Natural Reserve (TaiFuBanZi[2002]No.106) issued by Taihe County Government to set up the small natural reserve. See DRAWING NO. 05 for details of the natural reserve plan.

7.0 Special Assessment of Impacts on Large & Old Trees
332
Jintan Old Woods County Level Small Natural Reserve
Jintan Old Woods County Level Small Natural Reserve
The Jintan Old Woods has beautiful outlook with fine vegetation and abundant tree species. Old trees community in the upper layer of arbor layer are mainly Cinnamomum camphora, Liquidambar formosana Hance, Ilex rotunda Thunb, Sapindus mukorossi, Dalbergia balansae, Celtis sinensis, Ulmus parvifolia, Diospyros oleifera and etc, composition of tree species of secondary layer are mainly Lindera communis, Ligustrum sinense, Photinia davidsoniae, Elaeocarpus sylvestris, Symplocos sumuntia, Osmanthus fragrans, Citrus grandis, Xylosma racemosum, Ligustrum lucidum and etc., tree species at the edge of the forest and riverside are mainly Sapium sebiferum, Pterocarya stenoptera, Morus alba, Salix glandulosa, Celtis sinensis, Ulmus parvifolia and etc.plants species below the forest and herb layer are less, which are mainly Symplocos sumuntia, Clerodendrum cyrtophyllum, Phyllanthus glaucus, Vitex negundo var. cannabifolia, Wikstroemia indica, Ardisia japonica, Lycoris radiata, Viola verecunda, Cynodon dactylon, Eleusine indica, Centella asiatica, Liriope spicata and so on.
According to Special Report on Impact of Jiangxi Shihutang Shipping and Hydropower Pivotal Project at the Kan River on Old and Famous Trees and Key Wild Plants prepared by Forestry Institute of Jiangxi Agricultural University, 161 old trees are more than 100 years old among Jintan Old Woods (identified as Grade 3 old trees by experts organized by Greening Commission of Jiangxi Provincial Forestry Bureau), the breast diameter of the largest Cinnamomum camphora�Jin 46�reaches 230cm with a tree height 34m. In addition, there are 39 Cinnamomum camphora with breast diameter 80�100cm, these old trees or big trees are located in the non-inundation area outside the embankment. Embankment line direction of

7.0 Special Assessment of Impacts on Large & Old Trees
333
Yongchang Protection Area of the project in the engineering design will pass through the core area and buffer zone of this reserve. 7.4.2 Analysis of impacts of the Project on county-grade small nature reserve of Zhujia Village, Tangzhou Township -- Jintan Old Woods
� Camphor root system growth survey results of the project area show that the distribution area of camphor trees with water table below 1.0m has no obvious impacts on the growth of camphor trees. It is calculated as per corresponding maximum design level at gate-opening critical flow 4700m3/s that water tables of distribution points of all the old trees and follow-up old trees of Jintan Old Woods are all below 1.0m, which indicates that growth of all the old trees and follow-up old trees in the Jintan Old Woods will not be distinctly affected under the condition of corresponding maximum design level at gate-opening critical flow 4700m3/s after the Project is impounded.
� Currently Jintan Old Woods has been eroded seriously along the bank of the Kan River, after the Project is impounded, the water level will be raised, the soil of slope of river bank below the design level is immersed in water for a long time, which may cause collapse, some root systems of old trees at the bank may be eroded to be exposed, which will affect seriously the normal growth of old trees.
�Embankment line direction of Protection Embankment Subproject of Yongchang Protection Area will pass through the core area and buffer zone of this reserve, the arrangement plan of embankment line put forward by the engineering design contractor doesn’t comply with relative laws, rules and regulations of Regulation on Nature Reserves of the People’s Republic of China Decree No.167 of the State Council, October 9, 1994 .
� There are many old trees distributed in core area and buffer zone of protection embankment line, new earth filling will exceed 1.2m, it may generate bad impact on the respiration of root system of old trees and new root system is not easy to grow in earthing filling section of the root crown of old trees and trunks.
7.4.3 Environment protection alternative scheme of the designed fending groyne line direction of Jintan fending groyne of Yongchang Protection Area
� Designed fending groyne line direction
The designed fending groyne line direction of Jintan fending groyne of Yongchang Protection Area will pass through the core area and buffer zone see DRAWING NO.03 for details of county-grade small nature reserve of Zhujia Village, Tangzhou Township -- Jintan Old Woods, this EIA deems this scheme infeasible from the angle of environment protection. To meet the regulations of Regulation on Nature Reserves of the People’s Republic of China Decree No.167 of the State Council, October 9, 1994 , this EIA puts forward two environment protection alternative schemes for comparison and selection from the angle of environment protection (See DRAWING NO.05 for details).
� Environment protection alternative schemes
Environment protection alternative scheme I Inner line scheme Recommended

7.0 Special Assessment of Impacts on Large & Old Trees
334
scheme Whereas growth of all the old trees and follow-up old trees in the Jintan Old Woods will not be distinctly affected under the condition of corresponding maximum design level at gate-opening critical flow 4700m3/s after the Project is impounded, the fending groyne line will pass through the inner side (facing the Kan River is outer side) beyond the boundary of county-grade small nature reserve of Zhujia Village, Tangzhou Township -- Jintan Old Woods, (the fending groyne line is about 20~50m away from the boundary of the reserve); In addition, the bank of the Kan River which the core area of the reserve is facing will be protected with 1040m long cement laid stone revetment (the revetment is at the boundary of the reserve), to prevent from bank collapse to be caused by river water scouring after the Project is impounded.
Environment protection alternative scheme IIOuter line scheme Alternative scheme the fending groyne line will pass through the outer side (the side facing the Kan River) beyond the boundary of county-grade small nature reserve of Zhujia Village, Tangzhou Township -- Jintan Old Woods, (the fending groyne line is at the boundary of the reserve); In addition, drainage canal will be arranged within the reserve to prevent the reserve from waterclogging.
Comprehensive comparison and selection of the two environment protection alternative schemes are given in Table 7.41. Fending groyne line directions of the two environment protection alternative schemes are shown in DRAWING NO.05.
Table 7.4 1 Comprehensive comparison and selection of the two environment protection alternative schemes
Item Scheme I Inner line scheme Scheme II�Outer line scheme� Comparison result
Volume of works
12.5m wide concrete diaphragm wall 1860m 1040m long cement laid stone revetment.
12.5m wide concrete diaphragm wall 1520m 1730m long drainage canal.
Cost
Concrete diaphragm wall8.37 million yuan (incl. in project investment Cement laid stone revetment2.9068 million yuan (incl. in EA investment . Total 11.2768 million yuan.
concrete diaphragm wall6.84 million yuan (incl. in project investment Drainage canal 519,000 yuan incl. in EA investment . Total 7.359 million yuan.
Scheme II is better
than Scheme I.
Ambient air
Construction activities within the reserve are distinctly less than Scheme II. Impact on the ambient air within the reserve is lighter than Scheme II.
Construction activities within the reserve are distinctly more than Scheme I. Impact on the ambient air within the reserve is bigger than Scheme I.
Scheme I is better than Scheme II.
Ecological environment
Construction activities are mainly at outside of the reserve. The main construction activities within the reserve are transport of a small amount of materials (mainly by water) and trimming and cement laid stone of dome facing the Kan River, the existing earth road within the reserve can be applied for transport of construction materials. Basically the vegetation within the reserve will not be damaged. Because there are less construction activities within the
Concrete diaphragm wall (dyke) requires to permanently occupy 19000m2 land within the reserve and will cause greater vegetation loss to the reserve. In addition, drainage canal will also damage a certain amount of vegetation. Construction activities are mainly at inside of the reserve. It is required to build construction access road within the reserve which will cause a certain loss of vegetation. Because there are more construction activities within the reserve, the
Scheme I is obviously better than Scheme II.

7.0 Special Assessment of Impacts on Large & Old Trees
335
reserve, the environment management during construction within the reserve is easier. Probability of constructors’ artificial damage to old trees is smaller than Scheme II.
environment management during construction within the reserve is difficult.
Protection effect
After impounded, water table of the reserve will rise. Growth of old trees and follow-up old trees will not be obviously affected.
After impounded, water table of the reserve will be obviously lower than Scheme I. The protection effect is better than Scheme I.
Scheme II is better
than Scheme I.
Both Scheme I and Scheme II are feasible. Through comprehensive comparison and selection, Scheme I is better than Scheme II.
Comment Recommended Not recommended
Through comprehensive comparison and selection, Scheme I (Inner line scheme) is recommended.
After communicated with the Owner and the engineering design contractor, they have agreed at Scheme I in principle. Because the river bank revetment work is at the boundary of the reserve (within the scope of the reserve), Taihe County People’s Government agreed to implement the river bank revetment work at the boundary of the reserve put forward in this EIA in a document titled Reply on Adjustment of Core Area and Buffer Zone of Zhujia Village Cinnamomum Camphora Forest County Level Nature Reserve, Tangzhou Township, Taihe County.
7.5 Protective measures for old trees and big trees
7.5.1 Old trees and big trees to be protected
After the project storing water, it will generate certain impact to trees in the project area. According to analysis, old trees that are affected and should be protected are: old trees located in embankment line of protection embankment with dyke construction and earth filling over 1.2m old trees located in design ship lock old trees with differences between elevation and design level of root crown the corresponding maximum design level of switch off critic flow 4700m3/s less than 1m outside protection embankment.
According to the investigation, 21 old trees should be protected, including 20 Cinnamomum camphora trees, 1 Cupressus funebris. The distribution are: 2 inside the ship lock, 1 on the dyke, 18 outside the dyke, see table 7.5 1 and 7.5 2 for details.
27 big trees should be protected with diameter at the breast height 80cm 100m, including 26 Cinnamomum camphora trees, 1 Castanopsis sclerophylla, see table 7.5 3 for details.

7.0 Special Assessment of Impacts on Large & Old Trees
336
Table 7.5 1 Protective measures for protected old trees
Serial No.
No. Tree
species
Diameter at the breast
height (cm)
Location Elevation
(m)
Design Water level (m)
Elevation differenc
e (m)
Location protective measures
1 Huang 8 Cinnamomum
camphora 105.0
Huangkeng pengxia
57.30 56.69 0.61 Outside
dyke Masonry breast
wall
2 Huang 9 Cinnamomum
camphora 106.5
Huangkeng pengxia
57.30 56.69 0.61 Outside
dyke Masonry breast
wall
3 Jiang 2 Cinnamomum
camphora 128.0 Jiangjiazhou 54.46 56.50 -2.04 In ship lock Transplant
4 Jiang 3 Cupressus funebris
85.6 Jiangjiazhou 54.51 56.50 -1.99 In ship lock Transplant
5 Tai 8 Cinnamomum
camphora 110.8 Taipan 55.83 56.52 -0.69
Outside dyke
Concrete diaphragm wall
6 Xia 6 Cinnamomum
camphora 122.5 Xiabian Village 55.03 56.52 -1.49
Outside dyke
Transplant
7 Yin 1 Cinnamomum
camphora 229.8 Yinxiajiang 57.46 56.52 0.94
Outside dyke
Masonry breast wall
8 Yin 2 Cinnamomum
camphora 145.8 Yinxiajiang 55.94 56.52 -0.58
Outside dyke
Concrete diaphragm wall
9 Yin4 Cupressus funebris
156.6 Yinxiajiang 56.23 56.52 -0.29 Outside
dyke Concrete
diaphragm wall
10 Xin 2 Cupressus funebris
145.0 Xinzhou
shangpeng 57.28 56.21 0.67
Outside dyke
Masonry breast wall
11 Xia5 Cupressus funebris
139.4 Xiabian Village 55.04 56.52 -1.48 on the dyke Adjust
embankment line outward 16m
12 Xin2 Cupressus funebris
145 Xinzhou
shangpeng 57.28 56.61 0.67
Outside dyke
Masonry breast wall
13 Xin3 Cupressus funebris
162 Xinzhou
shangpeng 56.85 56.61 0.24
Outside dyke
Concrete diaphragm wall
14 Xin5 Cupressus funebris
101 Xinzhou
shangpeng 56.96 56.61 0.35
Outside dyke
Concrete diaphragm wall
15 Xin8 Cupressus funebris
103 Xinzhou
shangpeng 57.17 56.61 0.56
Outside dyke
Masonry breast wall
16 Xin9 Cupressus funebris
106 Xinzhou
shangpeng 56.85 56.61 0.24
Outside dyke
Concrete diaphragm wall
17 Xin15 Cupressus funebris
105 Xinzhou
shangpeng 56.93 56.61 0.32
Outside dyke
Concrete diaphragm wall
18 Xin19 Cupressus funebris
114 Xinzhou xiapeng
56.87 56.61 0.26 Outside
dyke Concrete
diaphragm wall
19 Xin21 Cupressus funebris
130.5 Xinzhou xiapeng
56.24 56.61 -0.37 Outside
dyke Concrete
diaphragm wall
20 Huang 7 Castanopsis sclerophylla
91.8 Huangkeng
pengxia 57.60 56.69 0.91
Outside dyke
Masonry breast wall

7.0 Special Assessment of Impacts on Large & Old Trees
337
Table 7.5 2 Protective measures for old trees located in new dyke with dyke construction and
earth filling over 1.2m
Serial
No. No. Tree species Location
Tree
elevation
(m)
Design dyke
height (m)
Height of dyke
construction and
earth filling (m)
Protective measures
1 Xia 5 Cinnamomum
camphora
Xiabian
Village 55.04 58.75�60.27 3.71�5.23
Adjust embankment
line outward 16m

7.0 Special Assessment of Impacts on Large & Old Trees
338
Table 7.5 3 Protective measures for protected big trees
Serial No.
No. Tree
species
Diameter at the breast
height (cm)
Location Elevation
(m)
Design Water level (m)
Elevation difference
(m) Location Disposal
1 Huang1 Cinnamomum camphora 84.0 Huangkeng
pengxia 57.60 56.69 0.91
Outside dyke
Masonry breast wall
2 Huang2 Cinnamomum camphora 92.5 Huangkeng
pengxia 57.60 56.69 0.91
Outside dyke
Masonry breast wall
3 Huang4 Cinnamomum camphora 97.3 Huangkeng
pengxia 57.45 56.69 0.76
Outside dyke
Masonry breast wall
4 Huang7 Castanopsis sclerophylla 91.8 Huangkeng
pengxia 57.60 56.69 0.91
Outside dyke
Masonry breast wall
5 Jiang 1 Cinnamomum camphora 92.3 Jiangjiazhou 54.05 56.50 -2.45 Inside
the ship lock
Transplantation
6 Tai 4 Cinnamomum camphora 98.7 Taipan 56.49 56.52 -0.03 Outside
dyke Concrete
diaphragm wall
7 Tai 9 Cinnamomum camphora 84.0 Taipan 56.01 56.52 -0.51 Outside
dyke Concrete
diaphragm wall
8 Xia7 Cinnamomum camphora 88.5 Xiabian Village 55.04 56.52 -1.48 Outside
dyke Transplantation
9 Xia8 Cinnamomum camphora 95.5 Xiabian Village 55.31 56.52 -1.21 Outside
dyke Transplantation
10 Xia9 Cinnamomum camphora 92.3 Xiabian Village 56.63 56.52 0.11 Outside
dyke Concrete
diaphragm wall
11 Xin 10 Cinnamomum camphora 85.0 Xinzhou shangpeng 57.07 56.61 0.46 Outside
dyke Ditto
12 Zhang 5 Cinnamomum camphora 86.9 Zhangjia 56.93 56.56 0.37 Ditto Ditto
13 Zhang 11 Cinnamomum camphora 91.0 Zhangjia 57.44 56.56 0.88 Outside
dyke Masonry breast
wall
14 Zhang 13 Cinnamomum camphora 88.5 Zhangjia 56.44 56.56 -0.12 Outside
dyke Concrete
diaphragm wall
15 Xin 1 Cinnamomum camphora 83 Xinzhou shangpeng 57.41 56.61 0.80 Outside
dyke Masonry breast
wall
16 Xin 4 Cinnamomum camphora 98.5 Xinzhou shangpeng 56.88 56.61 0.27 Outside
dyke Concrete
diaphragm wall
17 Xin 6 Cinnamomum camphora 81.5 Xinzhou shangpeng 57.07 56.61 0.46 Outside
dyke Masonry breast
wall
18 Xin 10 Cinnamomum camphora 85 Xinzhou shangpeng 57.07 56.61 0.46 Ditto Ditto
19 Xin 11 Cinnamomum camphora 80.5 Xinzhou shangpeng 56.95 56.61 0.34 Ditto Concrete
diaphragm wall
20 Xin 12 Cinnamomum camphora 97 Xinzhou shangpeng 57.30 56.61 0.69 Ditto Masonry breast
wall
21 Xin 13 Cinnamomum camphora 80.3 Xinzhou shangpeng 56.92 56.61 0.31 Ditto Concrete
diaphragm wall
22 Xin 14 Cinnamomum camphora 84.5 Xinzhou shangpeng 57.08 56.61 0.47 Ditto Masonry breast wall
23 Xin 16 Cinnamomum camphora 84.2 Xinzhou shangpeng 57.06 56.61 0.45 Ditto Ditto
24 Xin 17 Cinnamomum camphora 82.5 Xinzhou xiapeng 56.50 56.61 -0.11 Ditto Concrete diaphragm wall
25 Xin 18 Cinnamomum camphora 90 Xinzhou xiapeng 56.41 56.61 -0.20 O Ditto Ditto
26 Xin 20 Cinnamomum camphora 80.5 Xinzhou xiapeng 56.67 56.61 0.06 Ditto Ditto
27 Xin 22 Cinnamomum camphora 88.3 Xinzhou xiapeng 56.07 56.61 -0.54 Ditto Ditto
7.0 Special Assessment of Impacts on Large & Old Trees
339
7.5.2 Protective measures for old trees and big trees
Aiming at elevation, location, growth status of old trees in the project area, according to relative results of Special Report on Impact of Jiangxi Shihutang Shipping and Hydropower Pivotal Project at the Kan River on Old and Famous Trees and Key Wild Plants, this assessment puts forward the following protective countermeasures and measures.
� If any old trees in the new planned construction or adjusted levee, and the elevation of root crown less than 58.8mnamely dyke construction and earth filling over 1.2m, adopt avoiding protective measures in principle, move the embankment line inward or outward, so as to let the central line of the dyke keep more than 12m from old trees.
� Raise the height of protection embankment of the planned construction project on the original dyke basis, old trees on the top of the dyke or slope under conditions of earth building not over 0.8m will not adopt special treatment in principle, while protective measures of trees binding should be adopted during the constructions in order to prevent direct damage to the trees for instance, increase height to 11.2m, protective measures should be adopted, as well as suggest to construct by 2 times layer by layer with an interval of 12 years between the 2 times, and arrange vertical aeration pope.
� old trees in the vicinity of protection embankment, river and underground water has smaller impact to the trees due to the protection embankment functions, special protective measures will not be considered in principle, mainly to prevent direct or indirect impact to the trees during the constructions dyke body, such as borrow soil from the tree side, stack material, soil rolling, damage by construction machines and transport vehicles and etc., original soil environment should be kept usually 5m from tree crown.
� Old trees outside dyke should be treated combining with the design level, growth trend and root system exposure situation and etc. usually old trees with elevation difference higher than 1m or above will not be transplanted, however, rejuvenation measures may be adopted for old trees according its growth status, decide whether to adopt earth backing and earth-retaining works breast wall according to root system exposure status and terrain and soil collapse situation 6m around trunkold trees with elevation difference 0.51m should all adopt in situ conservation measures, such as slurry masonry breast wall for protection, and cooperate with technologies of excised roots, prune, earth backing, fertilization and etc.Technical proposal for in situ conservation scheme � old trees with elevation difference -0.7 0.5m, cast-in-place concrete diaphragm wall 6m or so from the trunk, and at the same time cooperate with technologies of excised roots, prune, earth backing, fertilization and etc. Technical proposal for in situ conservation scheme � old trees with elevation difference less than -0.7m, implement transplanting and adopt rational comprehensive supporting transplant technology to advance the transplant survival ratetechnical proposal for transplant conservation.
� 7 old trees distributed in Shihutang are located around the construction area of the dam, tree body binding measures should be adopted during the construction, and set protective measures, such as enclosure and etc.

7.0 Special Assessment of Impacts on Large & Old Trees
340
�The project will adopt protective measures for 21 old trees and 27 big trees, including transplanting protective measures for 3 old trees and 3 big treesadopting concrete diaphragm wall protective measures for 9 old trees and 13 big treesmasonry breast wall protective measures for 7 old trees and 11 big treesEmbankment line avoiding protective measures for 2 old trees and no big trees
� The recommended transplanting place of the three old trees and three big trees is Jintan Old Woods for centralized management.
� Old trees and three big trees that will be in situ conservation, especially key protective trees on the dyke or outside the dyke should be strengthened for caring and management work during the project construction and operating period.
� Cement laid stone masonry slope protection will be adopted for river bank of Xinzhou 30m long in order to prevent river erosion.
� It is recommended that environment protection protection department under the owner appoint special persons for protection work of old and large trees. During implementation of the project, the owner shall handle related formalities of old and large trees transplanting and local conservation from the forestry authority. College of Forestry of Jiangxi Agricultural University and qualified unit shall be entrusted as technical consultation organ of old and large trees protection during construction and operation (5 years); qualified nursery stock company or specialized maintenance team shall be entrusted to carefully do the protection work of old and large trees as per the SPECIAL REPORT ON IMPACTS OF THE SHIHUTANG PROJECT ON OLD AND FAMOUS TREES AND KEY WILD PLANTS, this EIA, the engineering design of next stage and the specific protection schemes to be put forward by the technical consultation organ of large and old trees protection and the regulations and requirements of forestry authority.
7.6 Technical proposal for in situ conservation for old trees and big trees
7.6.1 Class I Technical proposal for in situ conservation for old trees and big trees
� Applicable object
� Old trees and big trees outside protection embankment with difference between elevation of root crown and design level larger than 1m
� Old trees and big trees diameter at the breast height above 80cmon levee with dyke construction and earth filling not over 1.2m.
� Protective measures
� Normal water storage line should be over 6m from trees with flat ground, tree crown with wild lawn grass under the tree may not adopt any protective measures, for those that have conditions may fertilize in low water season or winter time in every 2 years in order to promote or keep the growth trend of the tree, and take it as the forest against wave wash of river way.

7.0 Special Assessment of Impacts on Large & Old Trees
341
� Normal water storage line should be over 6m from the trees, however, the terrain under tree crown is steep and even soil collapse or soil drawn out, side of some root system is collapsed, make a masonry breast wall in collapse azimuth or 36m around from the treesaccording to size of trees and collapse distance. If upper part of root system of the tree is exposed, adopt earth backing 3050cm and fertilize properly. The height of breast wall should be higher than 20cm after the earth backing.
For trees community with smaller spacing and row spacing, and certain quantity and area, soil retaining wall of single tree can be changed to larger planting bed wall.
For trees with poor growth situation, check the cause and adopt relative rejuvenation technology.
� When normal water storage line is less than 6m from the trunk, ground should be finished in order to smooth the landform and plant centipede grass, or make masonry breast wall.
� Old trees or big trees on the levee with dyke construction and earth filling not higher than 1.2m can adopt healthcare measures, such as scarification, fertilization, moth proof and etc., half or one year before the construction in order to promote the normal growth of the trees, and once earth filling not over 80cm. protective measures, such as trunk binding, ramification higher and bough shortcut and etc., should be adopted in order to prevent damage of the tree body during the construction.
7.6.2 Class II old trees and big trees technical proposal for in situ conservation
� Applicable object
Old trees and big trees outside protection embankment with difference between elevation of root crown and elevation of design level is -0.71m.
� Protective measures
� Old trees with elevation difference 0.5 1m, adopt protective Scheme �.
� Old trees with elevation difference -0.7 0.5m, adopt protective Scheme �.
7.6.2.1 Technical proposal for in situ conservation Scheme�for old trees and big trees
� Purpose: through implementing protective project, make the trees to grow healthy, surface root system retracting and raise distribution position of main root system, coordinate upper ground part and underground part of trees and adapt to the rising of certain degree underground water level.
� Main construction procedure and requirements:
� First year, promote the tree’s growth or rejuvenation of big trees: main contents include:
A Fertilization: combining methods of surface application, furrow application, foliage application
B Trunk injection with active materials of “tree impetus” or “plants mineral elements” and etc., so as to promote the growth of trees
C Prevent diseases and insect pests

7.0 Special Assessment of Impacts on Large & Old Trees
342
� Second year, excised roots treatment: make 2 times circular arc furrow excised roots by section in spring, autumn seasons at 5m or so from the trunk, furrow depth 80cm with smooth cut, big root over 5cm should not be sawed down but make round skin at the inner section of the furrow, and irrigate ABT root promoting powder after earth back fill.
� Third year, make masonry breast wall and prune: take trunk as the center; make a round masonry breast wall 1m outward from inner section of excised roots furrow. Breast wall should be 0.6 0.8m higher than the original groundraise the height accordingly if the root system of tree exposes seriously, PVC drainage pipes should be distributed at different height around the breast wall, and then fill in 0.40.6m planting soil in the breast wall, and arrange evenly 4 5 vertical aeration pipes. The length of aeration pipe is 6080cm with 10cm exposure out of soil on the top.
Carry out pruning on tree crown in AprilMay the same year, in addition to thinning and removing deadwood, sick branch and overcrowded branches, cutting back the reserved main branches, so as to make the tree crown decease 1/31/2, and implement disinfection treatment on the cut.
� Every year, professional technicians will inspect periodically the growth situation of trees, and solve problems in time. In every 2—3 years, carry out fertilization, excised roots treatments and etc.
7.6.2.2 Technical proposal for in situ conservation Scheme � for old trees and big trees
� Purpose: same as conservation Scheme �
� Main construction procedures and requirements:
� First year, promote growth of tree or big trees rejuvenation: same as conservation technical proposal �.
� Second year, excised roots treatment: Same as conservation technical proposal �
� Third year, make concrete diaphragm wall and pruning. Carry out pruning on the tree crown in March the same year, in addition to thinning and removing deadwood, sick branch and overcrowded branches, cutting back the reserved main branches 1/3 1/2, and handle the cut. Then, take trunk as the center, 12m as side length, make a square cast in place concrete diaphragm wall, bottom of impervious wall into soil to batholith, 0.7 1.9m higher than ground level, that is about 1.2m higher than the design level. Secondly, select in the impervious wall any two opposite wall as the outer wall, make square shape absorbing well with inner diameter 70cm, the well top is 50cm higher than the original ground, well bottom 1.3m lower than the original ground, namely the depth of well is 1.8m. wall of the absorbing well will be made with bricks, base is fixed with cement mortar, no cement joint in the middle, apply cement around the well mouth, cover with iron cover with holes on it, fix the well wall with square iron. Finally, fill in nutrition soil to impervious wall, and keep the same height with absorbing well mouth.
During the rainy season, water in the soil penetrates into absorbing well, which should be pumped out by special person, so as to ensure no water accumulation in main distribution

7.0 Special Assessment of Impacts on Large & Old Trees
343
layer of the root systems. Furthermore, absorbing well can be used as soil watering pipe in the dry season, at the same time; it is the exchanging passage of root system of trees with outside air, which has functions of drainage, watering and aeration.
� If the original ground is lower than the design level, fill in nutrition soil 50cm to the impervious wall in every 2 years and raise the height of absorbing well accordingly, till the soil is 1m higher than the design level, that is 20cm lower than the impervious wall. Then plant 3 4 young Cinnamomum camphora with diameter about 2cm around the trunk, connect 4 5 young Cinnamomum camphora with the base of old trees in the second year. Drill holes uniformly according to different height on the impervious wall above the design level in the third year after the connection, so as to let the root system in the wall to exchange with outside that has the function of aeration and drainage.
In order to reach the purpose of grafting in advance and form high level root mass earlier, excised roots treatment can be carried out at the same time in the second year, utilize engineering method to fix 34 large vessels with seedling trees close to the trunk 11.3m higher than the design level, and then carry out grafting. Moreover, few years later, decide whether to fill absorbing well with soil in order to level it with the ground according to the growth situation of high level root system.
� Check periodically the growth situation of trees every year, and solve the problem in time. Carry out fertilization, excised roots treatment and etc for trees in every 2—3 years.
7.7 Technical Proposal for Transplant Conservation for Old Trees and Big Trees
7.7.1 Applicable object
� Old trees and big trees outside protection embankment with difference between elevation of root crown and design level less than 1m diameter at the breast height 80cm below
� Old trees and big trees outside protection embankment with difference between elevation of root crown and design level less than -0.7m
� Transplanting required by the project
� Big trees and old trees that protection embankment body will be heighten more than 1.2m.
7.7.2 Technical classification of transplantation
Tree transplantation can adopt different transplanting scheme in accordance with its size, growth status and etc:
� For Cinnamomum camphora with diameter at the breast height 20cm and below, bare root or transplant with soil, the transplanting technology will select Scheme �.
� For Cinnamomum camphora with diameter at the breast height 21 40cm, in order to improve the transplant survival rate, it should select transplanting Scheme �.
� For Cinnamomum camphora with diameter at the breast height 41 80cm, it should select

7.0 Special Assessment of Impacts on Large & Old Trees
344
comprehensive transplanting technology due to its large size, deep main root and soft soil, select transplanting Scheme �.
� For Cinnamomum camphora with diameter at the breast height 81-100cm and above 100cm, adopt as possible on the spot protective measures in principle, for individuals required to be transplantedsuch as in the ship lock, adopt transplanting Scheme �.
7.7.3 Technical proposal for transplantation
7.7.3.1 Technical proposal�for transplantation
� Applicable object: Cinnamomum camphora with diameter at the breast height less than 10 20cm.
� Soil texture and tree growth status: most soil texture is fine silt, sandy loam or silty clay. The trees are in natural growth status, usually no caring measures is adopted. Since the soil texture is suitable, as well as warm weather of Taihe County with abundant rainwater, most trees grow normally and well.
� Tree species characteristics: trunk of Cinnamomum camphora usually is not clear but with strong power of sprouting from stools and strong branch formingRich main roots, less side and fibrous roots, but strong new power of sprouting from stools, which is an easy transplanting tree species
� Technical measures
� Transplanting time: arrange at the end of February to middle of March as possible
� Tools and machines: spade and sharp shovel, handsaw, hay band, grass bag, transport vehicle and etc.
� Transplanting method: bare root transplant
� Personnel requirements: assign experienced technicians to guide the transplanting, which must be operated by skilled gardener.
� Construction operating method and key points:
A. Pruning and cut treatment: repruning tree crown before the transplantation. Determine height of stem is usually 2.53.5m, trunk and branch higher than this level shall be cut, reserve 3 4 main branches in the main trunk with length 0.51.0m. If the branch height of tree is high, trunk cutting pruning method can be adopted. Avoid pull apart when sawing the large branches and flattening the cut, and then apply “wound coating agent” or “wound maintenance film” to protect the cut.
B. Excavation and root protection: usually 40 70cm from trunk is radius round furrow excavation. The depth should be below the distribution layer of main root system, usually 50 70cm. Brush out ball clay surface layer rootless floating earth before the excavation according to actual situation. During the excavation, saw up large root with handsaw, no rude shovel is allowed in order to avoid pull crack. All root system cut should be smooth.

7.0 Special Assessment of Impacts on Large & Old Trees
345
The falling tree should bring with soilheart protection soil as possible, and bind with damp grass bag, and then tie with hay band.
C. Transport and trunk protection: excavated Cinnamomum camphora should bind with hay band on main trunk and reserved main branches, and spray wet the hay band in order to keep water of tree body, at the same time prevent damage during the transport and planting. Load after binding, stack in order and cover with awning.
D. Plant: plant hole should be over 2030cm larger than root breadth of soil ball and height, and the hole bottom should apply thoroughly decomposed base fertilizer. Carry out spray application on the hole bottom contact with roots and around with “Root Power” or “Plants Mineral Elements” and “Root Rot Medicine” water with aqueous solution .
Put the tree into hole, the root system flat and stretch, fill planting soil into the tree hole. Fill solid the space of root system. When filling to half height, pull upward gently or shake, connect closely planting soil with root system, water it after tamping. Add soil after water seeping downward fully, and then water cofferdam after add to 10 15cm above the ground.
E. Curing: transplanting land should select land with higher terrain without water accumulation but convenient for irrigation. The trees should present row line with drainage ditch around.
Water sufficiently after planting, water the second time 2 3 days later, and then water the third time after one week, water according to the soil situation, and be “dry totally and then water enough at one time”.
Water often the tree body with hay band and around with in high temperature of summer time, 4 5 times a day, water to a degree of wet but not drop water so as to prevent water accumulation at root.
Since temperature is high in summer time, the tree has strong transpiration, in order to reduce water disperse of tree body. Shed should be set up. The shed should keep more than 50cm distance from the tree body so as to ensure air flow in the shed.
7.7.3.2 Tree transplanting Scheme �
� Applicable object: Cinnamomum camphora with diameter at the breast height
21�40cm.
� Soil texture and tree growth status: �same as Scheme ��
� Tree species characteristic: �same as Scheme ��
� Technical measures
� Transplanting time: arrange as possible at the end of February to middle of March
every year�

7.0 Special Assessment of Impacts on Large & Old Trees
346
� Tools and machines: spade and sharp shovel, handsaw, hay band, lifting rope, grass
bag, truck guard plate, crane, transport vehicle and etc.�
� Transplanting method: excised roots transplant method�
� Personnel requirements: �same as Scheme ��.
� Construction operating method and key points � Excised roots: carry out excised roots treatment 1 2 years before the transplanting. In spring time the first 1 year, draw a circle 23 times as radius 50 90cm or so around the trunk of trees with diameter at the breast height, and then divide the circle into 4 parts, select 2 opposite circular arcs to excavate furrow outward with depth 6070cm, cut lateral roots in the inner section of furrow, the cut mouth should be flat. Not cut up large lateral rootsabove 5cm but skin in the inner section, and then apply 0.1% naphthylacetic acid solution on the wound of root pruning and ring skin place, and refill solid. Pruning the roots and refill on the other two circular arcs with the same method at autumn of that year or spring the next year.
� Pruning and wound treatment: transplant in the spring of the third year after the first excised roots. Prune before the transplanting, Determine height of stem usually is 3.55.5m, reserve 3 5 main branches stretching in different directions with length about 0.71.3m. Prevent pull crack when saw up large branches and smooth the wound, and then apply “wound coating agent”, or “wound maintenance film”.
� Excavation and root protection: method is basically the same as Scheme �, but excavate furrow outward at 15 20cm in the inner section of original excised roots. The excavation depth should be 10 15cm deep than that of excised roots.
� Transport and trunk protection: basically the same as Scheme, pay attention to the following points:
A Spray apply transpiration controlling preparation on the tree body before the loading in order to reduce water loss
B Bind with hay band and gunny bag piece at hoisting place of listing rope, and nail with guard plate, center of gravity of tree is at lower part of soil ball
C Fix both sides of soil ball with sandbag after loading on the truck, pad the trunk with soft materials at contacting surface with the carriage in order to avoid wear the tree skin and fix the trunk on the carriage
D Shorten the transport time as possible.
� Plant: basically same method as Scheme �, but the planting depth can be shallower, hole depth should be 3/4 of the soil ball height.
� Curing: method basically the same as Scheme �, use continuously “tree power”, “plants mineral elements” or “core energy element” after planting for trunk transfusion, and directly supplement the nutrition and water the tree body.
7.7.3.3 Tree transplanting scheme �

7.0 Special Assessment of Impacts on Large & Old Trees
347
� Applicable object: Cinnamomum camphora with diameter at the breast height 41 100cm. Cinnamomum camphora with diameter at the breast height 81100cm and over 100cm shall be locally protected in principle, individual trees requiring to transplant (such as the trees within ship lock) shall be transplanted as per Scheme III.
� Soil texture and tree growth status: most soil texture is sandy loam, fine silt or silty clay, which is suitable for the growth of Cinnamomum camphora. The tree growth trend is different due to different trees, among them, most Cinnamomum camphora with diameter at the breast height 40 80cm grow normal or fine, while some trees with diameter at the breast height over 80cm have the problem of local rot in main trunk, root system exposure and lose plant phenomenon at the tip, some become apparently weak and even already weak.
� Tree species characteristics: same as Scheme �
� Technical measures
� Transplanting time: arrange as possible at the end of February to middle of March, in cloudy sky or sunshine day without wind.
� Tools and machines: spade, shovel, handsaw, hay band, grass bag, guard plate, harness, crane, transport vehicle and etc.
� Personnel requirements: same as Scheme �
� Transplanting method: excised roots transplanting.
� Construction operating method
� Big trees rejuvenation:
A. Early spring of that year at the end of January and beginning of February, dig furrow in circular shape for fertilization at drip moulding of tree crown, furrow width and depth 30 40cm, apply bean cake fertilizer 1015 jin for each tree, compound fertilizer 35 jin, mix with soil and back fill and cover with soil.
B. Carry out leaf fertilization on the tree crown with high pressure air atomizer in April June, concentration is carbamide 0.1%, potassium dihydrogen phosphate 0.2%, once half a month, apply alternatively.
C. Tree hole cleaning and fill. When cleaning tree hole, remove the dust first, scraping deadwood in the hole, and clean with wire brush or hair brush, and then spray 0.3% copper sulphate aqueous solution to the hole wall 2 times with an interval 30min, apply bitumastic solution (wood tar) antifungin in the inner wall of hole after being dried or repair tree body with polyurethane and polysulfide sealant, or fill directly with bricks and stone and cement mortar.
D. Pest control. For some trunk borer pest, such as bark beetle or longhorn beetle species, control with atgard or 4O% dimethoate with water l000 times liquid.
� Excised roots treatment : excised roots same method as Scheme �, section from the trunk radius is 100 220cm, the depth reaches 70120cm.
� Pruning and wound treatment: same method as Scheme �, topping height: for big trees

7.0 Special Assessment of Impacts on Large & Old Trees
348
with diameter at the breast height 5060cm is 6 8.5m, reserve 3 5 main branches and small amount of secondary branches, main branches 11.5m long and secondary branches 0.5 1m long for big trees with diameter at the breast height 7080cm, determine height of stem is 7 10m, reserve 1.2 1.8m long main branches, and secondary branches 0.8 1.3m.
� Excavation and root protection: same method as Scheme �.
� Transport and trunk protection: same method as Scheme �.
� Plant: Same method as Scheme �
� curing: basically same method as Scheme �, install mini nozzle on the wire drawing of canopy net or branch, spray many times everyday in summer time, so as to advance air humidity in the shed and reduce the temperature in the shed.
7.8 Expenses calculation of protective measures for old trees and big trees � See Table 7.8 1 for budgetary estimate for transplantation of single old trees, big trees.
� Implement transplantation and in situ conservation for old trees and big trees in project area, observation and maintenance expenses for riverbank slope protection and project operating period 5 years will be 9.5506 million yuan. See Table 7.82 for details.
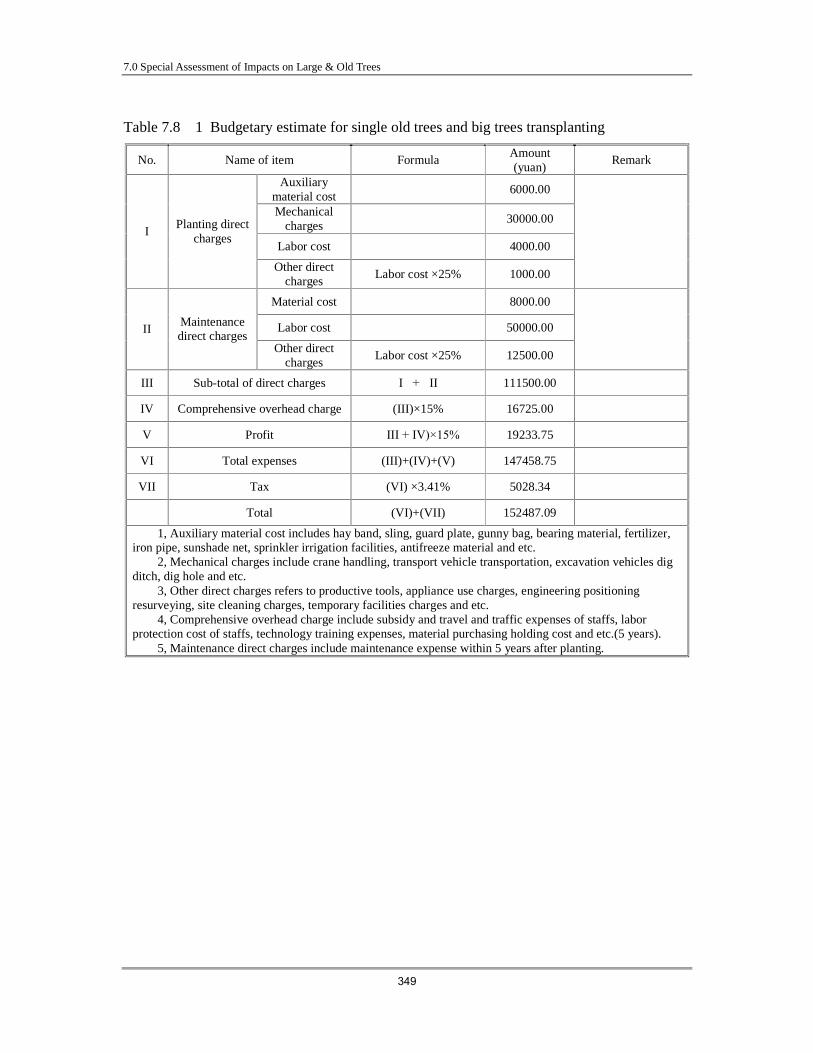
7.0 Special Assessment of Impacts on Large & Old Trees
349
Table 7.8 1 Budgetary estimate for single old trees and big trees transplanting
No. Name of item Formula Amount (yuan)
Remark
Auxiliary material cost
6000.00
Mechanical charges
30000.00
Labor cost 4000.00 I
Planting direct charges
Other direct charges
Labor cost ×25% 1000.00
Material cost 8000.00
Labor cost 50000.00 II Maintenance direct charges
Other direct charges
Labor cost ×25% 12500.00
III Sub-total of direct charges �I�+�II� 111500.00
IV Comprehensive overhead charge (III)×15% 16725.00
V Profit �III + IV)×15% 19233.75
VI Total expenses (III)+(IV)+(V) 147458.75
VII Tax (VI) ×3.41% 5028.34
Total (VI)+(VII) 152487.09
1, Auxiliary material cost includes hay band, sling, guard plate, gunny bag, bearing material, fertilizer, iron pipe, sunshade net, sprinkler irrigation facilities, antifreeze material and etc.
2, Mechanical charges include crane handling, transport vehicle transportation, excavation vehicles dig ditch, dig hole and etc.
3, Other direct charges refers to productive tools, appliance use charges, engineering positioning resurveying, site cleaning charges, temporary facilities charges and etc.
4, Comprehensive overhead charge include subsidy and travel and traffic expenses of staffs, labor protection cost of staffs, technology training expenses, material purchasing holding cost and etc.(5 years).
5, Maintenance direct charges include maintenance expense within 5 years after planting.

7.0 Special Assessment of Impacts on Large & Old Trees
350
Table 7.8 2 Expense calculation of old and big trees in project area and environmental protection of nature protection area
NO. Name of item Quantity Unit price �10000 yuan�
Sub total �10000 yuan�
Total �10000 yuan�
Remark
Pier perdue 1070m 0.2681 286.87 1
riverbank slope
protection Slope protection
wall body 1070m 0.0114 12.99
299.86 Xinzhou 30m, Jintan 1040m
Breast wall body 18 items 1.13 20.34 Earth work 18 items 0.22 3.96 2
Breast wall protection Planting
measures 18 items 1.2 21.60
45.90 7 old trees, 11 big trees
Impervious wall body
22 items 7.1 156.20 3
Impervious wall protection Plant and other
measures 22 items 2.8 61.6
217.80 9 old trees, 13 big trees
4 Transplantation 6 trees 15.25 91.5 91.5
5 Comprehensive maintenance
management expenses 5 years 30.00 150.00 150.00
6 Special charges of emergency
protection for old trees 150.00
Total 955.06 Note: Comprehensive maintenance management expenses refer mainly to observation, maintenance management expenses of in situ conservation trees on the dyke and outside the dyke for 5 years during the project operating period.
Special charges of emergency protection for old trees refer to reserved protection expenses for necessary measures adopted due to larger change of water level at the earlier stage of operation period during the construction period and operating period of prevention and control project, as well as unexpected technical problem or old and big trees involved but not discovered�no data�due to various causes during the protection period of old and big trees.

8.0 Special Impact Assessment on Fishes and Spawning Sites
351
8.0 SPECIAL IMPACT ASSESSMENT ON FISHES AND SPAWNING SITES
8.1 Inventory Survey on Fish Resources and Spawning Sites
8.1.1 Brief introduction to regional fishery
The Kan River is located at the south bank of the midder and lower reaches of the Yangtze River, as the second largest tributary thereof. The Kan River lasts 788km, with a catchment of 83525km2�making up half of Dongting Lake water system. According to the site interview result of the resettlement report of the project, there are 7 professional fishing boats in the river section between the Shihutang dam site and upstream Taihe Pivot (listed in the compensation scope of this project), in addition there are a small amount of non-professional fishing boats. The professional fishing boats in the upper reach catch about 3 tons of fish a year, and the non-professional boats about 1 ton (gross annual catch totals 83 ton). There are 273 fishing boats from the Shihutang dam site to the downstream Xiajiang, to catch about 408 t a year.
8.1.2 Survey on fish spawning sites
8.1.2.1 Brief of fish spawning sites within the reservoir area
In history the Kan River is a major source of fish fry with many fish spawning sites distributed. Literature shows that there are the following spawning sites as Ganzhou, Wangqian Shoal and Liangkou Shoal at upper Wan’an, and Baijiaxia, Taihe, Yanxidu, Jishui, Xiaogang, Xiajiang, Xingan and Sanhu at down Wan’an, among which Yanxidu, Jishui, Xiaogang and Xiajiang are the major spawning sites. In accordance with literature and data from fishery departments, there are three spawning sites in this reach of Kan River involved in Shihutang Project, namely Taihe(Chengjiang), Yanxidu and Baijiaxia, of which the spawning sites in Baijiaxia is located in the upper reach at the tail of inundation area, within the range of Taihe Pivotal Project under planning for construction, thus beyond assessment this time. Historic literature shows that the Taihe Spawning Site is located at the reservoir area of this Project, 2.1km long, 118hm2, main spawning fishes are grass carp, snail carp, silver xenocypris, bream fish and carp and that the Yanxidu Spawning Site is located also at the reservoir area of this Project, 2.3km long, 126hm2, main spawning fishes are snail carp, cyprinoid, silver xenocypris and grass carp etc. For details of these two spawning sites, see Table 8.1�1, Table 8.1-2 and Table 8.1-3.

8.0 Special Impact Assessment on Fishes and Spawning Sites
352
Table 8.1 1 Profile of Spawning Sites
Spawning grounds
Location Length �m�
Area �hm2
�
Major spawning fishes
Gross fecundity (108)
Taihe E�114°50 35.03 N�26°46 59.06
2100 118
Grass carp, herring, silver xenocypris, Hemibarbus maculates, fresh-water bream, carp cyprinoid
0.98
Yanxidu E�114°57 53.60 N�26°48 27.98
2300 126
Herring, carp cyprinoid, silver xenocypris, grass carp
1.01
Table 8.1 2 Major Spawning Fishes & Gross Fecundity of Taihe Spawning Site
Fish Spawning Period Estimated resources (t)
Estimated Fecundity (104)
Grass carp Late Apr.—end of June 0.89 2283.84
herring Late Apr.—end of June 0.58 2050.42
Carp cyprinoid
April to June 0.84 1032.08
Fresh-water bream
May to June 0.71 862.11
Silver xenocypris
March to May 1.34 2720.21
Hemibarbus maculates
Middle & Late April 0.82 851.34
Total 5.18 9800
Table 8.1 3 Major Spawning Fishes & Gross Fecundity of Yanxidu Spawning Site
Fish Spawning Period Estimated resources (t)
Estimated Fecundity (104)
Carp cyprinoid
April to June 1.18 2124.29
Silver xenocypris
March to May 1.56 3130.42
Grass carp Late Apr.—end of June 0.97 2568.27
Herring Late Apr.—end of June 0.86 2277.02
Total 4.57 10100
8.1.2.2 Inventory survey on fish spawning sites

8.0 Special Impact Assessment on Fishes and Spawning Sites
353
During the spawning period of 2007 (April to June), the project team has executed site survey on the two spawning sites. We set one spawn collecting point at the Taihe (Chengjiang) Spawning Site and the Yanxidu Spawning Site respectively, each point is equipped with a motor boat and a small wooden boat for collecting spawns, 80cm large spawn net will be equipped on the motor boat for collecting spawns. Altogether there are 478 times of laying nets in the two spawning sites, including 236 times in Taihe and 242 times in Yanxidu. The total collected spawns are 2.3569 million grains, only accounting for 1.18% of historic spawning quantity. Meanwhile, fishes accumulating phenomenum is not found in the said two sites, and the river section is severely sand dredged and flows moderately and has sparse aquatic plants. It is told by the local fisherfolks that no large fishes spawning in these two sites have been found, which indicates that these two spawning sites have been severely degraded.
8.1.3 Survey on fishes resource at the project river section
8.1.3.1 Inventory survey on fishes resource and fishing harvest analysis
Site fishes resource surveys were made at Zhongjia, Shihutang dam site, Yanxidu, Wanhe, Tongjiazhuang and Chengjiang of the assessed river section at dry season (Frebruary), rich season (July) and spawning season (April~June), (see DRAWING NO.27). Most of fish samples are collected through drift net, silk net, and fixed net etc. a small portion of fish samples are bought from the markets and fishing boats. Fishing harvests were classified and determined and routine biological surveys were made. Main fishing harvest statistics is shown in Table 8.1�4, total fishing harvest statistics is shown in Table 8.1�5.

8.0 Special Impact Assessment on Fishes and Spawning Sites
354
Table 8.1 4 Main fishing harvest statistics
Quantity�pcs� Weight �g� Length�cm� Fishes
Frebruary April � June July Frebruary April � June July Frebruary April � June July Silver xenocypris 618 203 156 18.3�108.5 7.8�67.8 5.0�98.3 10.4�17.3 9.3�16.8 6.9�18.3
Hemibarbus
maculates 27 94 96 3.58�183.9 52.2�72.4 52.2�72.4 12.5�21.2 15.1�16.4 15.1�16.4
Pelteobagrus
fulvidraco 70 89 56 7.4�22.9 6.0�47.8 6.0�47.8 8.8�12.7 7.9�13.7 7.9�13.7
Shining
pelteobagrus
fulvidraco
57 98 48 13.15�13.8 11.8�20.4 0.4�20.2 10.8�10.9 10.2�12.9 3.3�11.9
Silver gudgeon 43 65 60 2.1�24.5 20.16�26.4 2.4�19.1 5.2�11.3 9.8�11.2 5.4�10.2 Pseudolaubuca
sinensis 29 43 36 8.58�20.5 3.42�50.32 2.1�55.8 10.4�13.7 7.5�18.6 6.3�17.1
Bream fish 23 72 87 140.5�260.2 24.6�386.7 22.8�421.0 21.2�29.5 12.7�24.8 10.4�27.0 Bullhead 22 10 21 85.8�155.0 72.3�107.5 18.0�27.4 22.4�28.3 23.8�26.9 13.0�14.6 Red-fin
anabarilius
grahami
19 16 15 42.4�111.0 34.2�109.6 53.8�112.6 14.8�19.6 13.8�19.4 15.6�20.9
cyprinoid 18 24 17 750�4000 1260�2500 580�3056 20.5�43.6 31.6�46.2 18.6�44.8 grass carp 11 36 17 400�1800 608�2268 306�2071 35.6�48.9 42.7�53.2 32.8�50.8 Snail carp 9 43 26 750�1000 638�2607 314�1780 38.6�42.9 37.2�61.8 30.4�48.5
Red-eye trout 16 79 42 176.6�379.0 170.6�382.4 93.1�368.2 22.9�28.1 22.6�28.9 18.1�30.2 Crucion carp 12 64 21 75.8�265.0 18.3�22.9 65.8�306.8 14.8�19.6 10.2�12.6 13.9�20.7
Big-eye
mandarin fish 11 56 89 13.26�39.4 13.26�39.4 10.8�25.9 8.4�12.6 8.4�12.6 7.9�10.3
Sarcocheilichthys 7 8 10 23.8�46.2 24.9�56.8 34.2�57.5 21.6�42.8 21.9�49.8 27.6�48.7

8.0 Special Impact Assessment on Fishes and Spawning Sites
355
Quantity�pcs� Weight �g� Length�cm� Fishes
Frebruary April � June July Frebruary April � June July Frebruary April � June July sinensis
Sarcocheilichthys
nigripinnis
nigripinnis
2 28 16 27.8�50.6 36.04�44.2 28.4�41.9 11.1�12.8 11.9�12.2 11.5�12.3
Mystus
macropterus 9 41 18 10.6�18.9 5.8�20.4 4.9�12.1 10.4�11.8 9.5�12.4 8.4�10.8
Erythroculter
ilishaeformis 6 36 18 68.9�159.7 110.5�215.0 96.2�238.7 16.9�23.4 21.25�25.3 18.3�27.8
Silver carp 6 28 11 421�1881 590�2128 364�1071 37.8�47.2 39.8�52.2 34.8�45.2 Bighead 4 18 10 550�1200 538�2016 304�1480 37.6�43.9 40.2�58.8 28.7�46.5
Rhinogobio
typus 6 17 28 13.5�22.3 13.5�22.3 13.5�22.3 11.2�13.2 11.2�13.2 11.2�13.2
Erythroculter
mongolicus 5 16 12 67.8�162.3 98.3�125.6 68.9�189.7 15.6�22.4 18.9�20.8 16.5�26.9
Cobitis sinensis 5 18 37 3.6�18.9 4.8�24.5 2.3�27.5 6.7�9.8 7.1�10.5 5.3�11.1 Long body
mandarin fish 5 13 6 10.96�49.11 9.6�30.6 11.5�40.8 8.4�14.3 7.9�13.5 9.2�13.2

8.0 Special Impact Assessment on Fishes and Spawning Sites
356
Table 8.1 5 Total fishing harvest statistics
Species % of total harvest
Habitat & habit Type Distribution
silver xenocypris 39.69
Middle & lower layer of water body with plankton as food
Key economic fish
Distributed at
assessment river
section
hemibarbus maculates 5.56
Middle & lower layer of running or static water with aquatic insects, fishworm, snail & clam as food
Key economic fish
ditto
Pelteobagrus fulvidraco 8.65
Bottom of static water or slack stream with aquatic insects, small
fish & shrimp as food
Have a certain economic
value ditto
Shining pelteobagrus fulvidraco
6.41 Middle & lower layer of river &
lake withaquatic insects, small fish & shrimp as food
ditto ditto
Silver gudgeon 4.08 Slack stream open water area with
mosquito larva as food ditto ditto
Pseudolaubuca sinensis 2.75
Upper layer of slack stream or static water with algae aquatic plants and
small fish and shrimp as food ditto ditto
Bream fish 3.18 Middle & lower layer of water body with fishworm, shrimp etc. as food
Key economic fish
ditto
Bullhead 2.09 Bottom of water body with
fishworm, frog, small fish etc. as food
Economic fish ditto
Red-fin anabarilius grahami
1.80 Middle and upper layer of slack stream or static water with small
fish, shrimp & aquatic insect as food
Key economic fish
ditto
cyprinoid 1.71 Lower layer of running water or
static water, omnivory Key economic
fish ditto
grass carp 1.57
Middle & lower layer of river and lake and alongshore aquatic plants
rich area with aquatic higher plant as food
Key economic fish
ditto
Snail carp 1.28
Middle and lower layer of large water area with many snails at
bottom with snail, mussel, clam as food
Key economic fish
ditto
Red-eye trout 3.52 Middle layer of slack stream with
algae & aquatic higher plant as food Key economic
fish ditto
Crucion carp 1.14 Lower layer of running or static
water, omnivory Key economic
fish ditto
Big-eye mandarin fish 1.04
Middle & lower layer of running water body with fish & shrimp as
food
Key economic fish
ditto
Sarcocheilichthys sinensis 0.66
Middle and lower layer of slack stream with benthic invertebrate,
Small economic
ditto

8.0 Special Impact Assessment on Fishes and Spawning Sites
357
consoliolative algae & plant chip as food
value
sarcocheilichthys nigripinnis
davidi 0.19
Middle and lower layer of running or static water with benthic
invertebrate, aquatic insect as food ditto ditto
Mystus macropterus 0.85
Lower layer of running water with zoobenthos as food
Have a certain economic
value ditto
E·ilishdeformis 0.57 Lower layer of running or static
water with small fish and shrimp as food
Key economic fish
ditto
Silver carp 1.19 Middle and upper layer of water body, filter feeder, mainly eating
zooplankton
Key economic fish
ditto
Table 8.1 5 Cont’d Total fishing harvest statistics
Species % of total
harvest Habitat & habit Type Distribution
Bighead 1.09 Middle layer of water body, filter
feeder, mainly eating zooplankton as rotifer, and also phytoplankton.
Key economic fish
Distributed at the assessment river section
Rhinogobio typus 1.57 Bottom of river and lake, with benthic invertebrate as food
Small economic
value ditto
Erythroculter mongolicus 0.47
Upper and middle layer of slack bay and lake, with small fish and shrimp
as food
Key economic fish
ditto
Cobitis sinensis 1.47 Bottom of running water, with small
benthic invertebrate and algae as food
Have a certain economic
value ditto
Long body mandarin fish 0.47
Clear running water with stone bed sediment, with small fish, shrimp,
aquatic insect as food
Key economic fish
ditto
Acheilognathus hypselonotus 0.28
Fresh water bottom, with algae as food
Small economic
value ditto
Saurogobio dabryi 2.38 Middle and lower layer of river and lake, with aquatic insect and aquatic
plant or algae as food
Small economic
value ditto
A kind of fish 0.38 Upper layer of slack open water area
or static water with aquatic insect and algae as food
Have a certain economic
value Ditto
Pseudobagrus tenuis 0.28 Bottom of static water or slack
stream, with aquatic insect, small fish and shrimp as food
Have a certain economic
value
Distributed at the river section of Taihe County
Seat
Elopichthys bambusa richardson 0.28
Middle and upper layer of water body with other fishes as food
Key economic fish
Distributed at the assessment river section

8.0 Special Impact Assessment on Fishes and Spawning Sites
358
Abbottina rivularis 0.28 Bottom of slack stream, with small
benthic invertebrate as food
Small economic
value
Distributed at the river section of Taihe County
Seat
Erythroculter dabryi 0.28 Lay bay with depth 1m around, with
small fish and shrimp as food Key economic
fish ditto
Pseudorasbora parva 0.19 Shoal water area of river, lake and pond , with zooplankton as food
Small economic
value ditto
Pseudobrama simoni 0.19
Middle and upper layer of slack bay and lake with consoliolative algae, higher plant chip and crustacea as
food
Key economic fish
ditto
Opsariichthys uncirostris amurensis 0.09
Gully rivulet, especially rapid stream shoal, rivulet or tributary
with sandstone bed, with small fish and aquatic insect as food
Have a certain economic
value ditto
Distoechodon tumirostris 0.09
Middle and lower layer of river and lake, with consoliolative algae and
plant chip as food Economic fish ditto
Plagiognathops microlepis 0.09
Middle and lower layer of water body, with plankton as food
Economic fish ditto
Paracheilognathus imberbis 0.09
Low elevation slack water area or gully with aquatic plant, with
consoliolative algae, zooplankton and aquatic insect as food
Small economic
value ditto
8.1.3.2 Species composition of fish resources
In accordance with the literature, fishes in the Kan River total 118 species, classified into 11 orders, 22 families and 74 genera, of which the Cyprinidae makes up the majority�about 58.5% in total, followed by Bagridae, 9.3%; by Cobitidae, 5.9%; by Serranidae, 5.1%�while such fishes as Setipinna taty, Salangidae, Catfishes, Eleotridae, Aeoliscus scuttatus, Osphronemidae and Eleotridae each contributing to 1.7%�with the remained 11 families making up 9.3%. Of Cyprinidae, Gobioninae and Anabarilius grahami each averages 23.2%�followed by ugui minnow and Acheilognathinae, each making up 14.4%� while barb 8.7%�silver xenocypris 7.3%�carp cyprinoid and Gobiobotinae and Hypophthalmichthys moritrix each contributing 2.9%. There are altogether 41 species of recorded fishes through investigation of the assessed river section, classified into 3 orders and 7 families, of which the Cyprinidae makes up the majority�about 73.17% in total. These species are all common fresh water fishes without special species, among which there are key economic fishes as silver xenocypris, hemibarbus maculates, bream, red-eye trout, mandarin fish, pelteobagrus fulvidraco, shining pelteobagrus fulvidraco, etc. and migration fishes as “four major Chinese carps” . This investigation has not recorded some valuable and rare migration fishes recorded in literature (as Acipenser dabrganus Dumeril,Psephurus gladius(Martens), Myxocyprinus

8.0 Special Impact Assessment on Fishes and Spawning Sites
359
asiaticus (Bleeker),Anquilama japonica J.et.s,Coilia ectenes J.et.s and hilsa herring etc.). According to fisherfolks’ feedback and monitoring result of fishery department, these valuable and rare migration fishes are out of sight in recent years. Fishes directory of the assessed area (recorded in literature and this investigation) is shown in Table 17.
8.1.4 Assessment conclusions
In accordance with the literature, fishes in the Kan River total 118 species, classified into 11 orders, 22 families and 74 genera, of which the Cyprinidae makes up the majority�about 58.5% in total, followed by Bagridae, 9.3%; by Cobitidae, 5.9%; by Serranidae, 5.1%�while such fishes as Setipinna taty, Salangidae, Catfishes, Eleotridae, Aeoliscus scuttatus, Osphronemidae and Eleotridae each contributing to 1.7%�with the remained 11 families making up 9.3%. Of Cyprinidae, Gobioninae and Anabarilius grahami each averages 23.2%�followed by ugui minnow and Acheilognathinae, each making up 14.4%� while barb 8.7%�silver xenocypris 7.3%�carp cyprinoid and Gobiobotinae and Hypophthalmichthys moritrix each contributing 2.9%. There are altogether 41 species of recorded fishes through investigation of the assessed river section, classified into 3 orders and 7 families, of which the Cyprinidae makes up the majority�about 73.17% in total. These species are all common fresh water fishes without special species, among which there are key economic fishes as silver xenocypris, hemibarbus maculates, bream, red-eye trout, mandarin fish, pelteobagrus fulvidraco, shining pelteobagrus fulvidraco, etc. and migration fishes as “four major Chinese carps” . This investigation has not recorded some valuable and rare migration fishes (as Acipenser dabrganus Dumeril,Psephurus gladius(Martens), Myxocyprinus asiaticus (Bleeker),Anquilama japonica J.et.s,Coilia ectenes J.et.s and hilsa herring etc.). Historic literature shows that the Project is involved in two spawning sites as Taihe (Chengjiang) Spawning Site and the Yanxidu Spawning Site. The document provided by fishery department shows that the main spawning fishes of these two sites are mandarin fish, grass carp, snail carp, silver xenocypris, bream fish and etc. During the spawning period of 2007 (April to June), the project team has executed site survey on the two spawning sites. The total collected spawns are 2.3569 million grains, only accounting for 1.18% of historic spawning quantity. Meanwhile, fishes accumulating phenomenum is not found in the said two sites, and the river section is severely sand dredged and flows moderately and has sparse aquatic plants. It is told by the local fisherfolks that no large fishes spawning in these two sites have been found, which indicates that these two spawning sites have been severely degraded.
8.2 Assessment of Impacts on Fishes and Spawning Sites
8.2.1 Impacts on fishes during construction
� Suspended solid (SS) increase by construction will reduce light transmittance of water. Too high suspended solid content in water will cause fine sediment to deposit onto fish parotid gland, severely harmful to filter and breathing function of parotid, even resulting in death by

8.0 Special Impact Assessment on Fishes and Spawning Sites
360
suffocation. Different fishes have different SS endurable ranges. Test data show that fishes can survive for only one day at longest when SS is 8×10⁴mg/L; and that fishes can survive for only one week at longest when SS is 6000mg/L; if the water is agitated for a short time every day to well up deposited sludge, keep SS content at 2300mg/L, fishes can survive for 3~4 weeks. It is generally agreed that aquatic organisms of fishes etc. in water body with SS content of 200mg/L will not directly die, while SS bigger than 125mg/L will have a certain impacts on aquatic larva. Nanhai Aquatic Products Institute of China once cleaned up domestic and foreign documents about fatal SS content and obviously affected SS content of fishes and shrimps. Details are shown in Table 8.2�1.
Table 8.2 1 Fatal SS content and obviously affected SS content of organisms
Unit: mg/L
Adult Larva
Fatal SS content
Obviously affected SS
content Fatal SS content
Obviously affected SS
content Fishes 52000 500 250 125
Shrimps 8000 500 400 125 Crabs 9200 4300 700 125 Shells 700 500 250 125
� Impact upon fish resources
Adult fish has stronger moving ability, construction impact on fish mostly appears as “dissipation effect”, protection of fish species resource will not be affected. Due to change in water quality in the construction site, and reduction of plankton and benthonic organism, the original habitat, survival and reproduction has changed for the fishes, which will be forced to move to other places and thus the density of fishes will decrease during construction period. There will be impacts by the project construction on the site only, no impact upon fish resource protection will be caused due to fishes moving to other places.
During construction diversion period, the Kan River will not be totally closed, and the Kan River will basically assure navigational for the whole construction period (except Phase II cofferdam for about two months non-navigation), when Phase II cofferdam is constructed, navigation is not allowed for two months, but the river will not be dammed off, only because the narrow navigational river channel, flow velocity and river width can not meet navigation requirements. Therefore construction diversion will not affect obvious obstruction impacts on fishes.
� Impact upon spawning sites
Over-water construction of this Project will be concentrated on the pivotal region. There are two spawning sites in the upper reach of the dam site with long distances (Taihe Spawning Site is about 21.4km away from the dam site, the Yanxidu Spawning Site is about 13.9km). Despite negative impact upon water quality, plankton and benthonic organism from such underwater construction as cofferdam, foundation pit excavation and cofferdam removal�the

8.0 Special Impact Assessment on Fishes and Spawning Sites
361
construction site is far away from the spawning sites�and there will be no water flow interception, thus there is no severe impact upon spawning sites during construction period.
8.2.2 Impacts on fishes during operation
Completion of Shihutang Project will produce change in some of the natural reach of the Kan River close to Taihe Countythus to create some impacts on aquatic organisms, the original eco-balance is broken to establish a new balance by way of regulation of fishes and foodstuff organism.
�After the Project is completed, the reservoir will gradually impound water under the premise of assuring the release flow of 187m3/s to meet the shipping requirement of the dam downstream at initial impounding stage. That release flow can also meet the productive, domestic and ecological water consumption requirement of the dam downstream.
�After the project is put into operation, the river section from the dam site to the tail of the reservoir will become the reservoir area, the levels of different sections of the river will be raised to different extents than before. When the reservoir is under operation, at the same flow, the flow of the reservoir area river section will be slowed down than before when the reservoir area is impounding, the water depth will be increased, so that sunshine will not reach the bottom, which makes it difficult to grow for algae and aquatic organism, and benthic invertebrate will decrease accordingly. On the contrary, plankton will multiply to create desirable ground for fishes that feed on plankton. Meantime, rising of water level will bring some water grass under inundation, to produce negative impacts upon fishes whose eggs are attached to the grass. This will cause great impacts on fishes laying adhesive spawns. The completion of the dam will reduce flow velocity and water level of the dam downstream river section to severely threaten the spawning and breeding of such fishes as enjoy flowing water.
�After the reservoir is impounded�a great deal of suspended sediment will deposit to greatly improve transparency. With increase of incident sunshine, aquatic plants will grow better to increase the quantity of herbivore. In the shallow nearshore waters there will be emergent aquatic plants and filamentous algae, which are desirable for grass carp, fresh water bream and red-eye trout. After rot of residual plants they provide nutritive materials to the water body. In the downstream reach due to decrease in sediment, benthonic organism will multiply. Most of the river bed of the Shihutang Project is of sandstone�it is estimated that such species as algae and filamentous algae will multiply with abundant benthonic organism. Limited sediment bottom will be desirable for pondweed, for mussel and Corbiculidae. There will be obvious increase of fishes eating benthonic organism in the downstream reach. � The Kan River is one of the major habitats of the four major Chinese carps, whose spawning ground is of certain special topographical and hydrographic characters. Every year from April to July when water temperature reaches over 18�, the four carps will go to their spawning grounds for bleeding, whose scale is related to swelling flow and flood duration. When an unprecedented flood arrives there will be more oviferous laying, while a small-scaled flood there will be limited egglaying or no reproduction at all. Such behavior is a way

8.0 Special Impact Assessment on Fishes and Spawning Sites
362
to adapt to runoff of the Kan River, as the genetic property of the four carps. There are two spawning grounds at the Taihe river section of the Kan River, namely Taihe and Yanxidu. In natural state, one flooding process will last several days or longer, when the flow will increase with the time going on and abrupt flood peak will develop and then decrease step by step until the river flows relatively smoothly. The four major Chinese carps start to spawn on the first or second day of swelling and will stop spawning if the river does not rise much or stops rising. In the project section of the Kan River in May and June the spawning will make up 70�80% of the whole spawning season. After operation of the Project, flow of the incoming water from upstream of the dam will be the same with the current flow, that is, no change of upstream flow of the dam will happen. Compared the flow after operation of the Project with the flow after completion of planned flood control dike, the flow will be increased by only -1.38%�-0.11%. According to the operation management rule of the Shihutang Project, during the period from March to June (upstream incoming water flow is bigger than and equal to gate opening critical flow), all the scouring sluices of Shihutang Project will be opened for flood discharge, in order to avoid raising upstream flood level of the dam, to basically keep natural condition, the upstream level increase of Shihutang Dam will be smaller during flood season. According to the flood regulation calculation, after the Shihutang Project is finished, the backwater height of pre-dam water level is 0.07~0.18m while the design flood frequency is P=50%~P=0.33%. Through calculation and analysis and comparison of the design water level under current condition and the design water level after completion of the Project, the backwater level increase at upstream of the dam after completion of the Project during flood season will not be big either, the backwater height of pre-dam water level is 0.05�0.24m while the design flood frequency is P=50%~P=5%. In a word, in the fish spawning season (flood season), all the scouring sluices of Shihutang Project will be opened for flood discharge, in order to avoid raising upstream flood level of the dam and to basically keep the upstream at natural condition. After completion of the Project, in the fish spawning season (flood season), the change of flood flow and duration is smaller, impacts on fish spawning within the reservoir area spawning sites is relatively smaller. � After completion of the Project, the dam will block the migration passage of migration fishes. Some migration and semi-migration fishes can not swim back to the upstream for raising up seeds. Because the upstream spawning site nearer to the reservoir area is of short flow stream, floating and semi-floating spawns flow into static water of the reservoir area too early during drifting incubation, with growth affected. Some spawns or fries flow down with the water flow, and can not bear impact of enormous energy and can not survive, even if they can survive, they can not swim back to upstream for making up group resource. According to site survey and information of fishery department, though some valuble and rare migration fishes (as eels, Chinese sturgeon and hilsa herring) of this river section have disappeared, and the population quantity of some common migration fishes (as four major Chinese carps) is less, on the viewpoint of fish resource protection of the whole Kan River, it is necessary to build fishpass to lessen impacts of the Project on fish resources.

8.0 Special Impact Assessment on Fishes and Spawning Sites
363
�After completion of Shihutang Project, there will be change in such hydrologic factors as water level, water temperature and flow velocity, only to change original spawning grounds in Taihe (Chengjiang) and Yanxito result in considerable bio-mass loss of such cash fishes stocks. Such negative impact upon spawning, breeding and growth will be unfavorable for fish stocks. Estimated at the most unfavorable condition (disappearance of the mentioned two spawning grounds), based on site collection of spawns and experience from fish men, larval fish loss=total breeding×hatchability 10% ×survival rate 10% the maximum losses of spawns and larval fish during the operation period are 199 million grains and 1.9898 million pcs, see Table 8.2 2.

8.0 Special Impact Assessment on Fishes and Spawning Sites
364
Table 8.2 2 Maximum losses of spawns and larval fish during operation period
Spawning
ground Fishes
Maximum loss of
spawns (104)
Maximum loss of larval
fish (104)
Herring 2050.42 20.5
Grass carp 2283.84 22.84 Parabramis pekinensis
862.11 8.62
Hemibarbus maculates Bleeker
851.34 8.51
Common carp 1032.08 10.32
Xenocypris argentea
2720.21 27.2
Taihe
Sum 9800 97.99
herring 2277.02 22.77
grass carp 2568.27 25.68
common carp 2124.29 21.24
Xenocypris argentea
3130.42 31.3
Yanxi
Sum 10100 100.99
8.2.3 Impact of the Project on the downstream XiajiangXingan hilsa herring spawing site China has three large hilsa herring formations: Yangtze hilsa herring, Pearl River hilsa herring and Qiantangjiang River hilsa herring. Some information shows that Yangtze hilsa herring is the important fishing object of the Yangtze River before 1970’s, with its output fluctuated at 309�584t in 1960’s and 74�157t in 1970’s. From late 1970’s, its output is reduced year by year, the output of 1980’s is about 12�192t, only 12t in 1986, which could not form fishing season. From 1987 up to now, according to the monitoring result of Changjiang Aquatic Product Institute, only one 1.5kg hilsa herring was caught in Jiangsu Province in 1998. From 1980’s, Pearl River hilsa herring output began to descend, fluctuated at 78�175t during 1980�1988�averaged 144t�equivalent to 1/6 of output in 1960, the output in 1996 was 0.6t only. Qiantangjiang River hilsa herring basically disappeared in 1970. Pearl River hilsa herring mostly enter the Xijiang River, parent hilsa herring going to upstream could reach at Guiping in 1970’s, concentrated and distributed at Cangwu, Teng County, Pingnan and Guiping. A small portion enters the Dongjiang River to reach Huizhou. Since 1980’s, hilsa herring upstream of Wuzhou of Guangxi has been on the brink of extinction. Hilsa herring to Qiantangjiang River could reach Tonglu and Fuyang at farthest before construction of Xin’anjiang dam and has now perished already. Hilsa herring breeding groups to the Yangtze River in 1970’s mostly entered the Poyang Lake, and then to Kan River spawning sites. A small part of groups went further along the

8.0 Special Impact Assessment on Fishes and Spawning Sites
365
Yangtze River trunk stream via Jiujiang to Chenglingji, then divided into two routes, one continued to go west along the Yangtze trunk stream to reach Yichange at furthest, the other entered the Dongting Lake via Yueyang, then to Xiangjiang River to Changsha and Xiangtan section for spawning. In 1980, only a small amount of hilsa herring entered the Kan River, hilsa herring of other routes have disappeared. As per literature, the Kan River hilsa herring spawing sites (Xiajiang~Xingan) are located at more than 90km long river section upstream of Xinganshikou and downstream of Ji’an, among which the main spawning sites are located at 30km long river section of upstream and downstream of Xiajiang County seat. Xiajiang~Xingan hilsa herring spawning sites are located at about 90km~120km downstream of this dam. (see Drawing No.1.7�3). Xiajiang hilsa herring is a rare edible fish. In fishes taxology, Xiajiang hilsa herring belongs to herring family, large mouth, toothless, a jag at center of upper jaw, without lateral line, big and thin scale with hair crack, narrow in abdomen, sawing device type large and sharp keeled scale. It is of fat meat and delicous taste, high fat content and famous at all times. At end of spring and early summer, fish group of well upgrown sex gland is anadromously migrating for breeding, from offshore to river fresh water area for breeding. The breeding group is composed mainly of four-year-old hilsa herring, with small amout of three-year-old and five-year-old hilsa herrings. The spawning period is June to July. Spawned parent fish then swims back to the sea. Fertilized eggs hatch out fries after 20 hours, which will enter lakes or shallow bay for food after having swimming ability, thereafter, migrated into the sea for getting fat, after the sex is mature, they will go upbound to river for spawning and bleeding. They eat zooplankton as main food, in addition, dayfly larva, rotifer, diatom, and organic chip are also their foods. Sexually mature hilsa herring enters the river from the sea April to May each year, going countercurrently upward to arrive at Xiajiang Spawning Site at end of May and early June, after spawning, returns to the sea. Prosperous flood season normally happens from June 15 to July 15 each year. Since 1970’s, the breeding characteristics of the Yangtze hilsa herring has changed apparently: group quantity has been reduced, mature individual fish has become small, its sexual maturity ahead of time, young-aged fish increased, old-aged fish decreased, group average age descended. In 1980’s, group quantity of hilsa herring entering Xiajiang Spawning Site has been reduced year by year, from 119 fish in 1980 to 17 fish in 1989. In 1990’s, ilsa herring entering Xiajiang Spawning Site has basically disappeared. During June 14 to July 8, 1996, fisherfolks were organized for trial catching in the Xiajiang Spawning Site for 21 days, 414.5 hours, 93 ship times, except that fishing stopped on June 19 and 23 due to strong wind, even one hilsa herring was not caught. This site survey has not recorded hilsa herring. At the same time, the fisherfolks feedback that no hilsa herring has been caught in recent more than ten years. And in the investigation of fishes at lake intake in recent years, no adult hilsa herring has been found to enter the lake or fries found to go out of the lake.

8.0 Special Impact Assessment on Fishes and Spawning Sites
366
After operation of Shihutang Project, the annual average, monthly average and daily average flows and levels at downstream of the dam will hardlly change. In order to assure the release shipping basic flow of the hydropower station bigger than or equal to 187m3/s and to meet the downstream shipping requirement of the dam, incoming water flow of one day will be properly adjusted. Maximum flow at the downstream of the dam on a typical day during non-flood period will be reduced from current 2278m3/s to 2100m3/s, Minimum flow at the downstream of the dam on a typical day during non-flood period will be increased from current 162m3/s to 187m3/s. That is, after operation of Shihutang Project, the large flow at the downstream of the dam on a typical day during non-flood period will be cut down, the small flow will be supplemented properly, the flow change range at the downstream of the dam on a typical day will be reduced from current 2116m3/s to 1913m3/s. Because the Shihutang reservoir has extremely poor runoff control ability, i.e. control of daily runoff, its control ability is limited too, because Shihutang is a natural riverway, when flow increases, its level will rise accordingly, wetted area of the same section will increase accordingly, therefore, the change of flow at downstream of Shihutang dam after operation will be smaller compared with the flow under current situation. Xiajiang hilsa herring (Xiajiang~Xingan) spawning site is over 90km away from Shihutang dam, such a long distance can basically resume the physical properties of water as water temperature etc. to be changed by the dam. And Shihutang Pivot belongs to low head dam, runoff type development mode, and hardly runoff control performance. The operation mode of the Shihutang hydropower station will utilize the power generating drain flow of the Wan’an hydropower station plus sectional flow as its power generating flow. The annual average, monthly average and daily average flows and levels of downstream of the Shihutang dam in the design representative year all will be the same with the runoff and level of the Shihutang dam under current condition in the design representative year. Overall, Shihutang Project will cause very limited impacts on the Xiajiang hilsa herring spawning site, the main negative impacts on the Xiajiang hilsa herring spawning site by the Kan River hydropower development will not come from the Shihutang Project.
8.3 Protection Measures of Fishes and Spawning Sites and Technoeconomic Appraisal
Considering the hydropower development actuality of the drainage area and the special features of this project, the size, habit and operation management conditions of fishes at the Taihe section of the Kan River, this EIA applies measures �to build fishpass, �to construct fish proliferation and fry releasing station, � to construct substitute fish habitat, � to execute monitoring and study, � to strengthen fishery aministration etc. to mitigate adverse impacts of the project construction on fishes and spawning sites.
8.3.1 Fish pass
8.3.1.1 Fish passing objects and necessity of fish pass construction
After the completion of this project, it will change the original hydrological conditions of reservoir area and certain section of downstream river, and basically obstruct the upstream-

8.0 Special Impact Assessment on Fishes and Spawning Sites
367
bound passage of migration fishes and semi-migration fishes, which causes fishes habitat broken, and decrease or even vanish of fishes exchange organism.
According to the situation of the investigated migration fishes and semi-migration fishes in the Kan River, combining the characters of the project, selected fish passing objects are: female or male parents and adults of semi-migration fishes, such as grass carp, snail carp, silver carp, bighead carp and etc. The water retaining height of the project is 9.8m, which belongs to low head structure, spawning ground of fish passing objects exists on the dam parent fish after spawning and young fish may enter the river from drainage openings; it has the basic conditions for construction of fish pass structure, which is suitable for building the fish pass structure. Main fishes passing protective objects are migration fishes and semi-migration fishes in the Kan River, among which semi-migration fishes are mainly economic fishes of “four major Chinese carps”. Setting fish pass structure can create basic conditions for valuable and rare fishes to return back to middle and lower reaches of the Kan River and can also provide upstream-bound passage of migration fishes(grass carp, snail carp, silver carp, bighead carp), which is favorable for the recovery of fishes composition and varieties in the Kan River and for raising the fishery economic output value of the Kan River.
The main fish passing objects of the fish pass are the main information for designing fish pass, on this basis, type and size of fish passge suitable for those fishes can be correctly selected and designed, which shall be decided as per the specific situation of different rivers of China. In accordance with the inventory survey result and the literature, fishes in the Kan River total 118 species, classified into 11 orders, 22 families and 74 genera, of which the Cyprinidae (grass carp, snail carp, silver carp, bighead carp etc.) makes up the majority�about 58.5% in total. In addition, historic record shows that there are ocean and inland river migration fishes as hilsa herring and eel etc. According to this feature, the river migration fishes, mainly economic fishes of “four major Chinese carps” are selected as fish passing objects. Setting fish pass structure can create basic conditions for valuable and rare fishes (as hilsa herring) to return back to middle and lower reaches of the Kan River.
8.3.1.2 Comparison and selection of fish pass structure schemes
Fish pass structure of the dam consists of fish pass, fish lock, fish elevator, fish boat for collection and transportation and etc, according to overseas experiences, fish elevator, fish boat for collection and transportation are usually suitable for high dam, which is used mainly for fishes of strong migration and large sized fishes. The water retaining height of the project is 9.8m, which belongs to low head structures, hence, it is unnecessary to build large sized fish pass structure, such as fish elevator or fish boat for collection and transportation.
As per the characteristics of the practical situation of comprehensive drainage area hydroelectric development and the project, and fishes size, habit and operating management conditions in the Taihe County section of the Kan River, we recommend to build fish pass and fishes proliferation and releasing station, to execute monitoring and research, to build fishes alternative habitat, and to strengthen fishery administration management, so as to

8.0 Special Impact Assessment on Fishes and Spawning Sites
368
reduce unfavorable impact on fishes.
8.3.1.3 Fish pass design scheme
�Comparison and selection of fish pass types
As per structure type, fish pass can be divided into pond type fish pass, trough type fish pass and diaphragm type fish pass (cascade fish pass). Pond type fish pond is very close to condition of natural waterway, fish rest condition in pond is good, but its applicable head is very small, and it occupies a larger plan location, and requires a suitable landform, therefore, its practicability is somewhat restricted. Trough type fish pass is divided into simpe trough type and Daniel type, simple trough type fish pass is of a water trough to connect upstream with downstream, without any energy dissipation device, only relying on elongating water flow path and trough circuference coefficient of roughness for energy dissipation. This type fish pass is of moderate slope, a very long length, a very small applicable head, therefore it is rarely applied. Daniel type fish pass is to set dense baffle walls and ridges at the trough wall and bottom, which is normally applicable to strong fishes and place without big level difference. Diaphragm type fish pass is to apply diaphgram to separate the total level difference of upstream and downstream of fish pass into many cascades, and to apply water cushion and course friction and current impact and diffusion for energy dissipation, to achieve flow regime improvement and fish pass flow reduction requirement, its water flow condition is easy to control, it can be applied in the place with bigger water level difference, ponds of different cascades are good rest places for fishes, and the type, position and size of fish pass hole can be adjusted to suit the passing requirement of fishes of different habits, it is of simple structure and convenient maintenance, therefore most of neoteric fish passes apply this type. On the ground of the landform and level of the river section where this project is situated, diaphragm type fish pass is recommended.
� Parameter selection of fish pass
� Main fish passing objects
The main fish passing objects of the fish pass are the migration fishes of the Kan trunk and river migration fishes, mainly economic fishes of “four major Chinese carps”. Setting fish pass can create basic conditions for valuable and rare fishes (as hilsa herring) to return back to middle and lower reaches of the Kan River.
� Main passing season of fish pass
Passing season refers to time interval for main fish passing objects of fish pass to pass through the fishpass. Hilsa herring spawning time is at 12:00~18:00 pm of June to July; Snail carp swins to the place with high flow velocity at the middle and lower reaches of the Yangtze River in May ~July for spawning; Grass carp begins to spawn at late April; Silver carp begins to spawn in mid-April; Bigheat spawning time is from April to June each year.

8.0 Special Impact Assessment on Fishes and Spawning Sites
369
According to the above information, it is decided that the main fish passing season of the fishpass is from April to July each year.
� Upstream and downstream levels of main fish passing season of fish pass
Upstream and downstream service levels of fish pass are directly related with whether the fish pass possesses proper fish passing condition or not during fish passing season; Upstream and downstream level change range of fish pass will also affect water surface connection of inlet and outlet of fishpass and pond water flow condition, resulting in that fishes arriving at outlet can not enter the reservoir, and fishes arriving at vicinity of inlet downstream can not enter the fishpass. Upstream and downstream levels of the dam are shown in Table 8.3�1. Upstream level during fish passing season is to select the normal impounded level of reservoir 56.50m, downstream level is to select average low level of April � August 47.16m, maximum design level difference is 9.34m.
Table 8.3 1 Upstream and downstream levels
Reservoir level Release flow & downstream level Maximum release flow at design flood
level 19140m3/s
Corresponding downstream level 59.13m Design flood
level 59.34m
Maximum release flow at max. flood level
23120m3/s
Corresponding downstream level 60.38m Maximum flood level
60.65m Regulation of rate of flow�P=90%� 293m3/s
Corresponding downstream level 47.16m Normal
impouded level 56.50 Maximum application flow at full load of
installed capacity 2520m3/s
Dead water level
56.20 Corresponding downstream level 50.55m
� Design flow velocity of fish passing hole of fish pass diaphragm
Design flow velocity of fish pass refers to the maximum flow velocity of fish passing hole of fish pass diaphragm under condition of design level difference. Factors to affect design flow velocity are fish passing object, geographical location, pond water flow condition etc. Design flow velocity is better to decide through test. It is stated that ability of fishes to overcome flow velocity is increased with length increase of its body, therefore, at the stage of fish pass design, body length of main fish passing object can be based to determine design flow velocity of fish pass. In accordance with some outdoor and indoor tests and observation information of China, for cyprinoid with body length bigger than 30cm, design flow velocity of fish pass is 1.0�1.2m/s; hilsa herring fond flow velocity is 0.7�1.0m/s, so design flow velocity of fish passing hole of fish pass diaphragm is decided as 0.7�1.2m/s.
� Fish pass conceptual design
� Fish pass dimension

8.0 Special Impact Assessment on Fishes and Spawning Sites
370
Fish pass water depth: 2m
Pond width: 3m
Pond length: 3.6m
� Fish pass length
The total head of Shihutang fish pass is 9.34m, head difference of each diaphragm is 0.06m,
diaphragm quantity 7.15506.0
34.9 ==n , take 156 pieces.
Fish pass has altogether 156 diaphragms to form 155 water ponds, each pond is 3.6m, so grade section length of fish pass with diaphragms is L1=155×3.6=558m Corner section, sight chamber section, rest room section, upstream outlet gate section and downstream inlet gate section of designed fish pass all are of flat bottom, its total length L2 is to be decided as per the length of final line location, specific requirements are as follows:
� Rest pond: a rest pond is set for every 10 diaphragms, altogether 15 rest ponds, each
rest pond is 7m long and 3m wide at bottom.
� Corner section: Each corner section is of axial line length 10m and bottom width 3m,
corner quantity is to be decided as per the final line location, corner section can also be used
as rest pond.
� Upstream outlet gate section: 10m long, 3m wide at bottom.
� Downstream intlet gate section: 10m long, 3m wide at bottom.
Total length of fish pass L= L1+ L2=683m�excluding corner sections�
� Inlet and outlet elevations of fish pass
As per upstream and downstream design levels and depths of fish pass, the downstream inlet elevation of fish pass is 44.16m, the upstream outlet elevation is 53.50m, via moderate slope to connect with downstream and upstream river beds respectively.
� Section type of fish pass trough
This Project is situated between Ji’an city urban area and Taihe county seat at middle reaches of the Kan River in which there are rich fish resources and many cash fish species. Through integrated comparison among the habits of main fish passing objects (snail carp, grass carp, silver carp, bighead and hilsa herring), level difference and level change range etc. the design fish pass trough section is 3m wide at bottom, height of side walls of both sides 1.8m, height of 1:2 slope to connect upward 0.7m, altogether 2.5m high. Recommended diaphragm fish pass layout is shown in DRAWING NO.39.

8.0 Special Impact Assessment on Fishes and Spawning Sites
371
� Type of diaphragm fish passing hole
Composite type diaphragm is recommended for use, with one side “vertical holes – graded holes”, the other side overflow holes. Fish pass structure type is shown in DRAWING NO.40.
8.3.1.4 Fish pass work
As per the above-defined fish pass parameters, layout of hydraulic structures, hydrological conditions, topographical condition and geological conditions of hydropower station, the following fish pass scheme is drawn up: Fish pass is located at the left bank, going through the dam and along the bank with total length of 713m. Fish pass is of open canal with inlet section length of 10m, bottom plate as flat section, bottom plate elevation of 44.16m, longitudinal bottom slope 1:60, and clear width 3m. Key factors for success of fish pass not only include the selected type and design parameters of fish pass which shall meet the requirement of the site and task, but also include its location and water consumption. As per the domestic and foreign design experiences of fish pass inlet, all the fish pass inlets are located at upper of draft tubes of hydropower stations, applying the released water of hydropower stations to seduce fishes or located at sides of spill ways. The fish pass inlet of the aforesaid fish pass scheme is atat upper of draft tube of hydropower station, tailwater of hydropower station is the downstream routine water flow, under attraction of tailwater, fishes are concentrated at front and both sides of powerhouse tailwater, therefore here is the best inlet of hydropower station type fish pass. Functions of fish pass auxiliary facilities are to seduce fishes to enter fish pass and block water surface floats. The main auxiliary facilities are approach, regulating gate and trash rack etc. Whereas the level of design detail at this stage is limited, auxiliary facilities are temporarily not considered, it is recommended to jointly consider auxiliary facilities when model test for optimizing fish pass design is carried out. The specific location of fish pass in the general layout of the Project is given in DRAWING NO.09. This scheme is technically consulted by Changjiang Aquatic Product Institute employed by the Owner and designed in accordance with the literatures, test results and analog of typical fish passes of different fish passing objects at home and abroad. Fish pass design shall make full consideration of river water conservancy condition, fish biological features of passing objects, environment adaptability etc., the design parameters of fish pass will be adjusted and modified to meet the fish passing requirement of fish pass in the engineering design of the next stage as per the test result through physical model test.

8.0 Special Impact Assessment on Fishes and Spawning Sites
372
Currently, the Owner is authorizing a contractor for physical model test of fish pass of this Project. (see Appendix 13).
8.3.2 Manual proliferation and fry releasing
Manual proliferation and fry releasing is the popular proliferation method of aquatic resources both at home and abroad. The former Soviet Union, USA and Japan and other countries have obtained apparent benefits in fish resources recovery by utilizing artificial proliferation and fry releasing method, manual proliferation and fry releasing activities have got some ecological benefits in areas of the Yangtze River, the Heilongjiang River, the Pearl River, and the Yellow Sea in recent years, such as Gezhouba Dam junction adopts artificial proliferation and fry releasing method for Chinese sturgeon, and obtained some effects. Manual proliferation and fry releasing is an important method to recover natural fishery resources, through planned manual releasing germchit, it can increase quantity of middle and low aged and young fishes in the fish population structure, enlarge group scale, store sufficient quantity of proliferation reserved population, which can solve fundamentally insufficient quantity of natural fish resources.
To build fish proliferation and fry releasing station is the basic measure for fish proliferation and fry releasing. The target and main task of fish proliferation and fry releasing station is to carry out wild parent fishing, transport, domestication of fishesimplement artificial propagation and seedlings incubationprovide seedlings for releasing, and reach the purpose to control decline of fish resources in the Kan River by manual fish proliferation and fry releasing method.
�Selection of proliferation and releasing objects
Proliferation and releasing objects are mainly protective fishes and endemic fishes, and secondarily main economic fishes. Considering from technical angle, proliferation and releasing should be carried out according to the principle of from easy to difficult, at the same time, according to the monitoring result of fish resources and fish resources situation in the reservoir, adjust gradually the proliferation and releasing object.
At present, fishes in inundation area of the Shihutang Project mainly are cyprinoid fish, golden carp, Culter alburnus, grass carp, snail carp, bream, silver carp, Pelteobagrus fulvidraco and etc., among which, fishes that need running water stimulation for spawning are affected greatly due to the project, including grass carp, snail carp, silver carp, bighead carp and etc., hence proliferation and releasing objects are the four major Chinese carps.
�Standard, quantity and size of proliferation and releasing seedlings
�Standard of proliferation and releasing seedlings
Releasing young fish must be first filial generation of wild parent artificial propagation. The releasing seedlings must be free of wound,disability, disease and be healthy. It is suggested to refer to Regulations on Aquatic Breeding Seedlings.

8.0 Special Impact Assessment on Fishes and Spawning Sites
373
�Quantity and size of proliferation and releasing seedlings
The releasing quantity is considered mainly from the aspects of species protection and ecological compensation on the basis of economical rationality in order to increase and compensate the quantity of fish species and stop the decline of fish resources. After comprehensive consideration of maximum spawn and fry losses, benthos loss, caused during operation, as well as factors of aquatic site, seedlings cost, lowest demand of survival rate and releasing and so on, releasing quantity at the early stage of the operation period is decided as 2.2 million fishes per year, the fry releaseing will continue for a long period during operation. The size of seedlings should be controlled about 1 year with a total length 10-20cmthe releasing ratio of four major Chinese carps grass carp , snail carp, silver carp, bighead carp will be temporarily 1:1:1:1, the releasing time will be April - July every year, and the releasing place should be 2 spawning grounds convenient for releasing. Releasing species and quantities will be adjusted gradually during the operating period in accordance of investigation analysis on proliferation and releasing result and monitoring investigation analysis basis on fish eggs and fry quantity, fish species, quantity, population dynamics, habitat condition changes of 2 spawning grounds.
�Construction of proliferation and fry releasing station
The planned land occupation of proliferation and releasing station is about 60mu, which is planned to be arranged in Wanhe Township, see DRAWING NO. 15 for detailed location.
Fish proliferation and releasing station consists of 18mu parent fish & breeding protection pond, 6mu circulating warm current aquatic breeding pond, 24mu seedling pond, 3mu productive and living houses and auxiliary facilities of energy supply facilities, feed processing equipment, fences and roads and so on. The construction period is 1 year. See DRAWING NO. 8.3-1 for plan layout of proliferation and releasing station.
Water inlet 18mu parent fish & breeding protection pond 6mu circulating warm current 3mu productive and living aquatic breeding pond houses
Closed canal for drainage, road, 24mu seedling pond

8.0 Special Impact Assessment on Fishes and Spawning Sites
374
Drawing No.8.3 1 Plan layout of proliferation and releasing station
Apparatus & equipment required for proliferation and releasing station are: 4 desk top computers, 1 camera, 2 digital cameras, 1 microscope, 1 anatomical lens, 1 water quality monitoring equipment, 1 transport vehicle, 5 air conditioners, 2 refrigerators and communication equipments and etc.
8.3.3 Setting of artificial fish nest
After water storage in the reservoir area, since a large amount of terrestrial plants will be immerged, fishes that lay viscid eggs lose adhesive materials, which will affect the population quantity. Therefore, artificial fish nest can be set to provide spawning conditions during the fishes spawning season, plant a large quantity of aquatic plants, such as reeds with a planting area 140hm2, in order to provide spawning conditions for fishes that lay viscid eggs cyprinoid fish, golden carp, bream, white fish and etc.at shoal waters of inundation area in Huangkengpengxia Xinzhou, Mazhou City, Tianmazhousee Table 8.3 2 and DRAWING NO. 15 for details , so as to make up the loss of fish eggs and fish resources resulted due to the project. At the same time, reeds have active functions in control soil erosion, prevent mud and sand from silting in the reservoir, and prolong the service life of the reservoir.
Table 8.3 2 Artifical fish nest planting area No Location Planting area�hm2� Remarks
1 Huangkengpengxia
�Xinzhou 21.0
2 Mazhou City 64.0 3 Tianmazho 55.0
Total 140.0
As for reeds planting, reed roots shall be collected before the water storage of reservoir, and 800pcs/mu reeds shall be planted, in addition, other emerging plants may be planted as well, such as: cattail, cane shoot, reed and etc.
8.3.4 Fishery administration strengthening
Local fishery department shall strengthen fishery administration during construction and during operation, to avoid artificial event occurrence of fish stealing, fishing and fish explosion etc. in the fish pass and nearby waters and artifical fish nest waters and to instruct and monitor the artificial proliferation and fry release work of the owner.
8.4 Cost Estimate of Protection Measures of Fishes and Spawning Sites
The total investment of fish pass is 7.1614 million yuan. Details are shown in Table 8.4�1. The estimated cost of protection measures of fishes and spawning sites is 25.5406 million yuan, including cost of fishes monitoring and proliferation and fry releasing during operation. Details are given in Table 8.4�1.

8.0 Special Impact Assessment on Fishes and Spawning Sites
375
Table 8.4 1 Cost estimate of fish pass
No Item Unit Qty. Unit price
(yuan)
Total price (104 yuan�
I Civil works 700.2373
2 3 m3 hydraulic excavator for excavation and loading, 15t dump truck for transport
m3 63168.46
13.55 85.6099
2 3 m3 hydraulic excavator for excavation and loading, 15t dump truck for transport
m3 4082.69 13.55 5.5331
4 Apron wheel compacted earthwork, dry
density�1.7t/ m3 m3 3459.91 3.82 1.3202
1 Cast-in-situ concrete fish pass beam
slab,C25 m3 383.79 386.29 14.8255
2 Cast-in-situ concrete fish pass side
wall,C20 m3 6672.68 301.74
201.3386
1 Cast-in-situ concrete fish pass beam
slab,C25 m3 572.00 386.29 22.0961
2 Cast-in-situ concrete guide wall body,
gravity type,C20 m3 5632.00 301.74
169.9375
22
Reinforcement processing, lock head superstructure, longitudinal & transverse
grid beam, energy dissipation room, flume, wall body, beam, slab, column etc.
t 369.65 5399.01 199.576
5
II Erection work of metal framework and equipment 15.9011
�i� Water gate equipment and erection work 9.6564
1 Fishpass gate t 6 11376.0
9 6.8257
2 Fishpass gate embedded parts t 2.4 11794.9
6 2.8308
�ii� Water gate headstock gear and erection
work 6.2447
1 Fishpass electrical hoist 2.2t/set set 1 62446.6
6 6.2447
Total 716.14
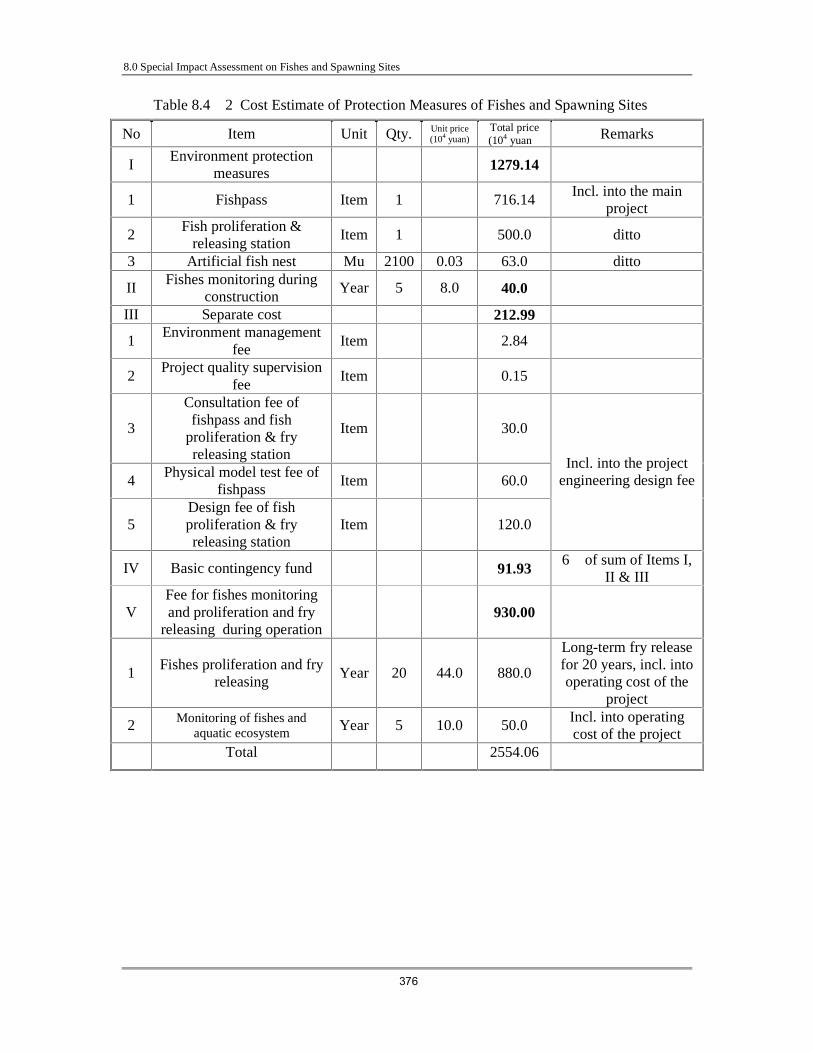
8.0 Special Impact Assessment on Fishes and Spawning Sites
376
Table 8.4 2 Cost Estimate of Protection Measures of Fishes and Spawning Sites
No Item Unit Qty. Unit price (104 yuan)
Total price (104 yuan� Remarks
I Environment protection
measures 1279.14
1 Fishpass Item 1 716.14 Incl. into the main
project
2 Fish proliferation &
releasing station Item 1 500.0 ditto
3 Artificial fish nest Mu 2100 0.03 63.0 ditto
II Fishes monitoring during
construction Year 5 8.0 40.0
III Separate cost 212.99
1 Environment management
fee Item 2.84
2 Project quality supervision
fee Item 0.15
3
Consultation fee of fishpass and fish
proliferation & fry releasing station
Item 30.0
4 Physical model test fee of
fishpass Item 60.0
5 Design fee of fish proliferation & fry releasing station
Item 120.0
Incl. into the project engineering design fee
IV Basic contingency fund 91.93 6� of sum of Items I,
II & III
V Fee for fishes monitoring and proliferation and fry
releasing during operation 930.00
1 Fishes proliferation and fry
releasing Year 20 44.0 880.0
Long-term fry release for 20 years, incl. into operating cost of the
project
2 Monitoring of fishes and aquatic ecosystem Year 5 10.0 50.0
Incl. into operating cost of the project
Total 2554.06

9.0 Environmental Risk Analysis
377
9.0 ENVIRONMENTAL RISK ANALYSIS
According to the requirements of State Environmental Protection Administration of China (90) HG Zi No. 057 Notice on Risk Evaluation of Significant Environment Pollution Accident Hidden Danger and State Environmental Protection Administration of China HF No. [2005]152 Notice on Strengthening Management on Environmental Impact Assessment to Prevent Environmental Risk, in compliance with the requirements of Technical Guidelines for Environmental Risk Assessment on Projects (HJ/T169-2004), to carry out environmental risk assessment by risk identification, risk analysis and risk consequence calculation, so as to provide information and basis for project design and environment management, thus to achieve the goal of reducing danger and harm.
9.1 Environmental risk identification and assessment working level
9.1.1 Environmental risk identification
The environmental risks of shipping junction mainly are dam safety environmental risk and water way operation environmental risk, moreover; during the construction period, there are some other environmental risks, such as construction blasting risk and population health risk and etc.
9.1.1.1 Water way operation environmental risk identification
The accident types in the water way operation include collision accident, hull piling up, boat fire and shipwreck accident and etc.
� Substance of danger potentiality identification
According to the forecasting analysis of project design, the transportation goods types of ships sailing in the reservoir area water way are coal, metallic substance, steel, petroleum, natural gas, mine and building materials, cement, wood, non-metallic ore, chemical fertilizer and agricultural chemicals, grain, machine, equipment, electrical appliance, chemical raw material and products, light industry and medical products, agricultural, forestry, animal husbandry and fishery products, and container etc. In the year 2020, the transportation quantity crossing the dam will be 8.43 million tons, of which, coal, mine and building materials, agricultural, forestry, animal husbandry and fishery products take up 80.4%, and oil product transportation is about 5.9%; in 2030, the transportation quantity crossing the dam is 13.33 million tons, of which coal, mine and building materials, agricultural, forestry, animal husbandry and fishery products take up 81.8%, and oil product transportation is about 5.3%.
According to relevant regulations in Substance Potentiality of Danger Standard, Important Dangerous Source Distinguish (GBl8218—2000), and Classification of Health Hazard Levels for Occupational Exposure to Toxic Substances (GB50844-85), the dangerous substances

9.0 Environmental Risk Analysis
378
involved in the project operation period are diesel oil (water insoluble) and methanol (water soluble).
� Dangerous substance toxicological property
� Diesel oil
Diesel oil is a dangerous oil product, the dangerous characteristics mainly are:
� Inflammable and explosive
According to the Code for Fire Prevention Design of Petrochemical Enterprises (GB50160-92 1999 version) and Design Specifications of Oil Depot (GB50074-2002), diesel oil belongs to high flash point inflammable liquid with a fire dangerous class of Third A.
� Easy flow
Diesel oil is liquid with a low viscosity and good flowability. During the process of storage and transportation, if leakage occurs, it could not only cause economic loss and environment pollution, but also may cause fire and blasting accident.
� Highly volatile
Diesel oil has a low boiling point, and could evaporate in normal temperature. In the normal work and storage process, volatilization of the materiel is unavoidable. If the steam of finish oil product leakage or normal volatilization mixing with the air reach the explosion limit range, it is easy to explosion. So measures should be adopted to reduce volatilization, or reduce oil gas concentration by measures of ventilation etc. so as to prevent the formation of explosive mixed gas.
� Easy to accumulate static electricity
The product oil has a weak conductivity, during the process of flow, filter, mixing, ejecting, washing, charging and shaking, it could produce and accumulate electric charge. In the process of storage and transportation, the crush and friction between flammable liquid and flammable liquid, flammable liquid and pipeline, container, filtration medium, water, impurity and air etc. might cause static electricity accumulation. Static electricity discharge is an important cause of fire and explosion accident.
� Heat expansibility
When oil product is heated, temperature rises and volume expands, if the container is over charging, and exceeds the safe capability, this may cause the damage of container or pipeline, and bring about oil product overflow and leakage, and increase the fire and explosion danger.
� Toxicity
There are two poisonous expressions of petroleum products, first is special irritant gas, and second is poisonous liquid or steam.
Steam of petroleum products can cause irrigative symptom of eyes and upper respiratory tract, if the concentration is too high, it might only take several minutes to cause anoxia such as dyspnea, and bring harm to human body through alimentary tract, respiratory tract and skin.

9.0 Environmental Risk Analysis
379
See Table 9.1 1 for details of physical and chemical and toxicological property of diesel oil.
To carry out potentiality of danger identification on the poisonous, harmful, inflammable and explosive substances which are concerned in the project according to Technical Guidelines for Environmental Risk Assessment on Projects (HJT169-2004), see Table 9.12 for the risk identification standard.
� Methanol
Methanol is toxic, interblendable with water, alcohol and ether. Absorption and inhalation of methanol will cause poisoning, even blindness and death, it is very flammable, easy to oxidizing, or dehydrogenation to form formaldehyde, formic acid. Risk analysis of methanol is given in Table 9.1-3.
9.1.1.2 Dam environmental risk identification
The main risk is collapse of dam, which could be caused by flood overtopping the dam, construction quality and geologic hazard accidents such as earthquake etc. The causes of formation of flood overtopping the dam are flood exceeding criterion, mud and sand sedimentation invading the flood control reservoir capacity etc.
9.1.2 Assessment working level
According to the regulations of environmental risk assessment working level division in Technical Guidelines for Environmental Risk Assessment on Projects, the project itself has no substance potentiality of danger and functionality danger sources; the risk probability is resulted in indirect behaviors. Therefore the environmental risk assessment working level of the project is Level 2.

9.0 Environmental Risk Analysis
380
Table 9.1 1 Physical, chemical and toxicological property of diesel oil
Category Item Diesel oil
Appearance and characteristics
Brown liquid with little viscosity
Melting point�boiling point (�) -18�282-338
Relative density To water 0�87-0�9, to air >1
Physical and
chemical property
Solubility Water insoluble, freely dissolve in benzene, carbon bisulfide and
alcohol, can dissolve in fat Flash point/ ignition
temperature (�) 50�227-257
Explosion limit (vol�) 1�4—4�5 Stability Stable
Building regulation fire hazard leveling
Third A type
Explosion hazard group and type
T3��A high flash point inflammable liquid
Dangerous characteristics Naked fire, high temperature and oxidizer have the hazard to cause burning and explosion, and high temperature can increase container internal pressure, which has the danger of dehiscing and explosion.
Combustion and
explosion danger
potentiality
Fire fighting measures Fire extinguishing agent types: carbon dioxide, foam, dry chemical
and sandy soil
Table 9.2 2 Diesel oil substance of danger potentiality standard
Category Level LD50(Big mouse from
mouth) �mg/kg�
LD50(Big mouse from skin) �mg/kg�
LC50(Small mouse breath in 4 hours)
�mg�L� 1 <5 <1 <0�01 2 5<LD50<25 10<LD50<50 0�1<LC50<0�5
Poisonous substance
3 25<LD50<200 50<LD50<400 0.5<LC50<2
1 Flammable gas—— substance that gaseous state and mixing with air to form flammable mixture under normal pressure: and its boiling point (under normal pressure) is 20� or lower than 20�
2 Inflammable liquid—— Substance with a flash point lower than 21�, and a boiling point
of above 20� Inflammable
substance
3 Flammable liquid—— substance that has a flash point lower than 55�, remaining in liquid state under pressure, and can cause major accident under practical operation condition (such as high temperature and high pressure)
Explosive substance Substance that could explode influenced by flame, or more sensitive to strike and
friction than nitrobenzene
Table 9.1-3 Methanol risk analysis
Item Physico-chemical property Combustion and explosion features and harms on
human body
Methanol
Colorless, transparent, volatile, highly polar liquid, having weak alcohol smell, interblendable with water, alcohol and ether.
Methanol is toxic. Absorption and inhalation of methanol will cause poisoning, even blindness and death, it is very flammable, easy to oxidizing, or dehydrogenation to form formaldehyde, formic acid, finally form CO2. Methanol vapor can form explosive admixture with air.

9.0 Environmental Risk Analysis
381
9.2 Analysis of Channel Environment Risk during Operation
9.2.1 Analysis of channel environment accident frequency during operation
According to the statistics of greater accidents both domestic and abroad, sudden accident oil spillage has a certain risk probability. Since there is no mature calculating method, risk probability analysis of a project is usually carried out by adopting statistics data due to the effect of objective conditions and uncertainty.
According to the statistics of Ji’An City maritime affairs bureau, only one marine safety accident occurred in recent 3 years 2004 2006 in Kan River of Taihe County section, and there was no cargo falling into the river and oil material leakage. Analogy method is adopted to determine the risk probability of ship oil spillage accident of the project. The analogy project is the statistics of ship oil spillage accident of Hanjiang River waterway in Hubei. Hanjiang River and Kan River are branch rivers of Yangtze River, hydrological and waterway conditions are similar.
Risk probability of ship oil spillage accident in Xinglong of Hubei Hanchuan section of Hanjiang River is 0.03 0.08times/year. Hence, maximum risk probability of oil spillage accident this project is once every 33 years 12.5 years.
9.2.2 Impact forecast analysis of oil spillage accident during waterway operation period
9.2.2.1 Accident source item
� The appraisal is considered according to ship collision in the waterway of reservoir area, which causes fuel tank broken and diesel oil leakage into the river, diesel oil leakage amount will be considered on the basis of 5t. oil spillage form is sudden instant point source discharge..
� The appraisal is considered according to ship collision in the waterway of reservoir area, which causes methanol leakage into the river, methanol leakage amount is considered on the basis of 5t. Methanol spillage form is sudden instant point source discharge.
9.2.2.2 Impact forecasting of diesel oil accidental spillage
(1) Physicochemical change process of oil spillage
� Convection and diffusion principles
Movement of oil spillage on the water is carried out mainly through convection and diffusion. The convection is mainly limited by upper wind of oil film and water current under oil film. Diffusion is a phenomenon caused by kinetic balance among gravity, inertia force, friction force, glutinous and surface tension. Impact of wind to oil film reflects as drift generated by wind. Oil film diffusion (or widen) is also very complex process. Comparing detailed researches of Bonit 1992 and Fay 1969, 1971 . These researches are limited mainly in

9.0 Environmental Risk Analysis
382
oil film on dead water, while natural rivers are more complicated due to impact of factors, such as bank reflection and unidirectional flow. Oil film diffusion is divided into three stages: inertial stage, glutinous stage and surface tension stage.
� Evaporation 1/2 2/3 oil spillage will be evaporated within a few hours and one day. Physical and chemical property of oil film will generate important changes due to evaporation. Since evaporation depends on multiple factors and these factors changes at any time, it is difficult to calculate the evaporation rate accurately.
� Dissolution
Hydrocarbon dissolved in the water has potential toxicity for the water biological system, however, oil spillage dissolution will not reach the degree of a few percentage, it does not matter from the point view of oil spillage amount. This means that dissolution rate may not be considered when analyzing movement of oil film.
� Vertical diffusion or vertical transportation
Duration of oil film on the water is usually limited by vertical transportation of oil point to the water body or emulsification of oil in the water.
� Formation of emulsified emulsion
Heavy crud oil has higher glutinous, it usually form more stable emulsion shape oil, while existence of asphaltene and high molecular weight cere has close relations with the formation of emulsion.
� Sedimentation
Various oils may be adsorbed by sediments granule to sink into the water or stick to the bank. Oil penetration in the silt sediments is the smallest; only a few centimeters on the upper layers will be affected.
In a word, convection and diffusion are the most important process to affect the oil spillage, through the numerical model of convection and diffusion of oil spillage, the appraisal gives out the approximate distribution outline of oil film of oil spillage, from these outlines, we can forecast where the most dangerous oil spillage may appear, as well as its impact range.
(2) Calculation mode of oil spillage diffusion
Oil film diffusion plays a leading function at the initial stage, while diffusion plays a leading function at the final stage. Although there are a lot of formulas of diffusion range calculation, many formulas are simplified due to complicated influential factor, and the calculating results are different as well. Fay formula is thought high widely to be one of the formulas for the expansion function of oil film in numerous results.
Fay divides the expansion process into three stages:
(1) Inertial expansion stage

9.0 Environmental Risk Analysis
383
2/14/11 t)gv(KD β
(2) Glutinous enlarging stage
4/16/122 tuw/gvKD β
(3) Surface tension expansion stage
4/32/13 tuw/w/ ρδKD
(4) Before the completion of expansion, oil film diameter keeps the same
D 356.8V3/8
Formula: D—oil film diameter m
g— acceleration of gravity (m/s2)
V— total volume of oil spillage m3
t— time experienced from oil spillage s
— 1 0/ w
0 — oil density t/m3
w — water density t/m3
aw — surface tension coefficient between air and water ( /m)
oa — surface tension coefficient between oil and air ( /m)
ow — surface tension coefficient between oil and air ( /m)
K1— experience coefficient of inertial expansion stage
K2— experience coefficient of glutinous expansion stage
K3— experience coefficient of surface tension expansion stage
Oil film expansion increases the area of oil film and reduces the thickness. When oil film thickness is larger than critical thickness (that is after expansion, oil film diameter keeps the same thickness ), oil film keeps integrityWhen oil film thickness equals or less than critical thickness, oil film starts to split into fragment, and continue to diffuse.
(3) Calculation method of oil film drifting analysis
Oil spillage diffuses oil film after entering the water, and then drift under the function of water current and wind-drift current, at the same time, equivalent oil film of oil spillage self diffusion is diffusing and increasing continuously. Hence, oil spillage pollution range is the water area passed by this continual diffusing and increasing drifting equivalent oil film. Drifting is different from expansion, it has no relations with oil quantity, drifting size is usually judged in accordance with center shift of oil film equivalent. If oil film takes initial

9.0 Environmental Risk Analysis
384
position as S0, after �t time, its position S is calculated in the following formula:
∫∆
+tt
t
00
0
0
dtVSS
Center drifting speed V0 of oil film in the formula is obtained from the following
formula:
V0 V V
V =u10×K
Formula: u10—10m height wind velocity
K— wind factor coefficient, K=3.5%
V —flow velocity.
(4) Forecasting result analysis
Forecasting according to calculation of diesel oil into the river 5t, see Table 9.2-1 for details of oil film diffusion result in case of oil spillage accident, and see Table 9.2-2 for detailed pollutants diffusion eigenvalue.
According to accident spillover forecasting result, it shows: oil spillage of oil product from the beginning to 645 is the film shape inertial expansion stage, from 645 1732 is film shape glutinous expansion stage, from 1732 3h4714 is film shape tension expansion stage, after 3h4714 , continuous film shape does not existed, the critical thickness of film now is 0.01mm. Continual film drifting distance is 12.17km.
Gouzinao water intake and its water-source reserve and Nanmenzhou water intake and its water-source reserve are distributed in the project reservoir area. In addition, water intake of Shangtian Water Works and its water-source reserve that will be constructed according to the remote planning. If the place of accident is located in water intake of upper reaches with a distance larger than 12.17km, pollution effect to the water quality of water intake is relatively light if the place of accident is located in water intake of upper reaches with a distance less than 12.17km, it will generate serious pollution effect to water quality of water intakeIf the place of accident is located in water intake of lower reaches within the range of water source reserve, pollution effect to the water quality of water intake is comparatively limited. If the accident place is at approach channel at downstream of the dam, because the nearest water intake at the downstream of the dam is about 21.4km to the dam site, once oil spillage accident happens, it will cause very limited pollution impacts on the water quality of the water intake.
Once spillover accident occurs in the waterway of reservoir area, oil spillage will diffuse into oil film soon after entering the water, and drift under the function of water current wind current, at the same time, diffusion equivalent oil film of oil spillage itself will diffuse and increase gradually, pollution range of oil spillage is the expanding and drifting equivalent oil
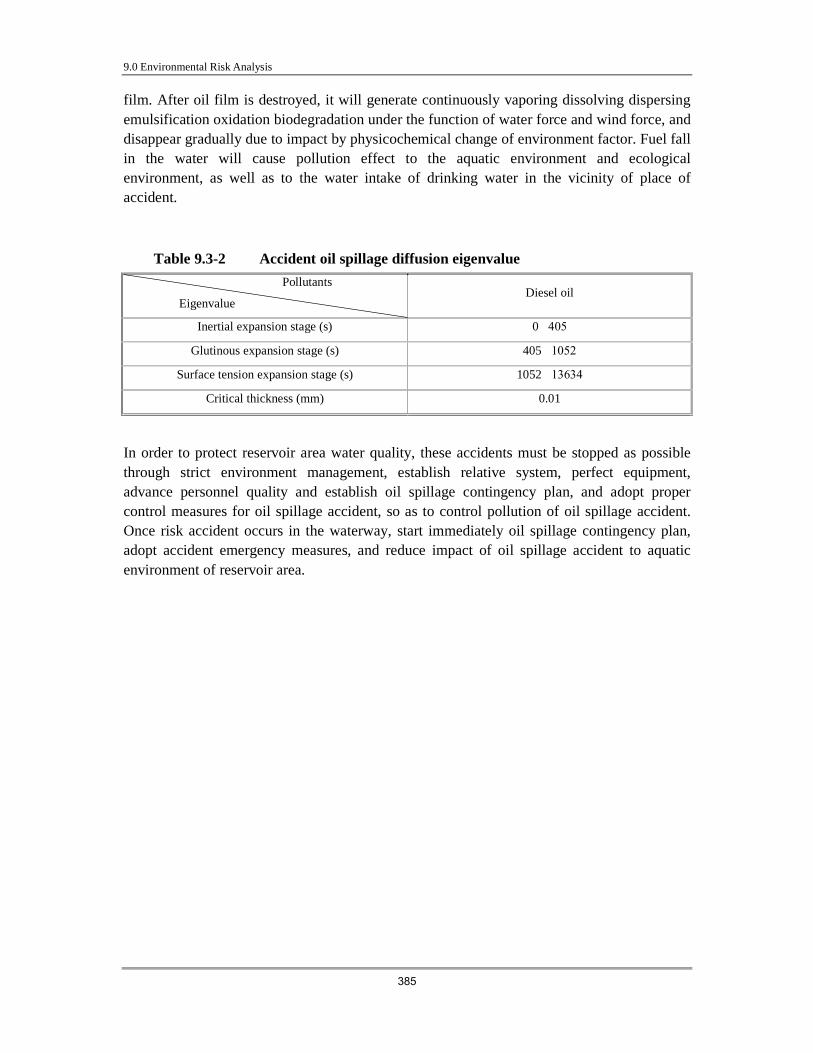
9.0 Environmental Risk Analysis
385
film. After oil film is destroyed, it will generate continuously vaporing dissolving dispersing emulsification oxidation biodegradation under the function of water force and wind force, and disappear gradually due to impact by physicochemical change of environment factor. Fuel fall in the water will cause pollution effect to the aquatic environment and ecological environment, as well as to the water intake of drinking water in the vicinity of place of accident.
Table 9.3-2 Accident oil spillage diffusion eigenvalue
Pollutants
Eigenvalue Diesel oil
Inertial expansion stage (s) 0�405
Glutinous expansion stage (s) 405�1052
Surface tension expansion stage (s) 1052�13634
Critical thickness (mm) 0.01
In order to protect reservoir area water quality, these accidents must be stopped as possible through strict environment management, establish relative system, perfect equipment, advance personnel quality and establish oil spillage contingency plan, and adopt proper control measures for oil spillage accident, so as to control pollution of oil spillage accident. Once risk accident occurs in the waterway, start immediately oil spillage contingency plan, adopt accident emergency measures, and reduce impact of oil spillage accident to aquatic environment of reservoir area.

9.0 Environmental Risk Analysis
386
Table 9.3-1 Oil film diffusion forecast result
No. Time (s) Diameter (m) Area (m2) Thickness (mm) Distance (m)
1 60 30.78 743.84 7.91 169
2 180 53.32 2231.51 2.64 501
3 300 68.83 3719.18 1.58 834
4 480 83.46 5467.55 1.08 1334
5 600 88.24 6112.91 0.96 1668
6 720 92.36 6696.36 0.88 2002
7 840 95.99 7232.89 0.81 2335
8 900 97.66 7486.75 0.79 2502
9 1140 107.90 9140.13 0.64 3169
10 3000 222.95 39019.07 0.15 8340
11 4200 286.95 64635.18 0.09 11676
12 5400 346.46 94229.24 0.06 15012
13 6600 402.74 127324.19 0.05 18348
14 7800 456.49 163582.54 0.04 21684
15 9000 508.21 202749.04 0.03 25020
16 10800 582.68 266520.53 0.02 30024
17 13200 677.32 360127.21 0.02 36696
18 14400 693.44 377470.19 0.01 40032
19 15600 693.44 377470.19 0.01 43368
9.2.2.3 Methanol emergency overflow impact prediction
� Transport and diffusion mode of methanol emergency overflow at instantaneous point source:
−−−=Dt
yutx
HDt
MC
4
)(exp
4
22
π
Where, M——Pollution source intensity (g);
H—— Water depth�m��
D——Horizontal diffusion coefficient�m2/s�� huD *8.0= �
X——Longitudinal distance�m��
T——Time�S�.
� Predicted result analysis
Based on 5t methanol overflowed into the river, corresponding flow of 95% design condition

9.0 Environmental Risk Analysis
387
is selected for calculated. The predicted results are shown in Table 9.2-3.
Table 9.2 3 Predicted axial maximum concentration of methanol emergency overflow pollution impact
14.695km 21.4km 21.5km 27km
Time (s) Concentration (mg/l) Time (s) Concentration
(mg/l) Time (s) Concentration (mg/l) Time (s) Concentration
(mg/l) 29378 3.00 42788 2.07 42988 2.05 53988 1.64
29919 2.00 43659 1.00 43859 1.00 54793 1.00
30272 1.00 44012 0.50 44212 0.50 55242 0.50
30524 0.50 44587 0.10 44790 0.10 55924 0.10
28.5km 30km 32.5km 33.0km
Time (s) Concentration (mg/l) Time (s) Concentration
(mg/l) Time (s) Concentration (mg/l) Time (s) Concentration
(mg/l) 56988 1.55 59988 1.47 64988 1.36 65988 1.34
57768 1.00 60739 1.00 65684 1.00 66672 1.00
58245 0.50 61248 0.50 66249 0.50 67249 0.50
58957 0.10 61988 0.10 67037 0.10 68046 0.10
The predicted results indicate that the maximum methanol concentration at 14.695km satisfies the standard requirement (maximum allowed harmful substance concentration at water body of USSR is 3.0mg/L . The reservoir area of the Project has Gouzinao water intake and its water source protection area, Nanmenzhou water intake and its water source protection area, and the water intake and water source protection area of the Shangtian Water Plant to be built in the long range plan. When overflow emergency happens in the channel of the reservoir area, if the accident place is over 14.695km away from upstream of water intake, its pollution impact on water quality of the water intake will be relatively lighter;if the accident place is less than 14.695km away from upstream of water intake, its pollution impact on water quality of the water intake will be serious; if the accident place is at downstream of water intake and beyond the scope of the water source protection area, its pollution impact on water quality of the water intake will be limited.
Once emergency overflow happens in the reservoir area, gates shall be immediately opened for water release, so as to mitigate pollution impacts on the water intake, and Accident Emergency Plan shall be started up swiftly, and the water quality monitoring of the water intake shall be strengthened to assure water quality safety of the water intake.
If emergency overflow happens at the downstream approach channel of the dam, the neareast water intake at downstream of the dam is about 21.4km to the dam site, once emergency overflow happens, maximum methanol concentration at 21.4km is 2.07mg/Lwhich can meet maximum allowed harmful substance concentration at water body of USSR -- 3.0mg/L and will have limited polluted impacts on water quality of the water intake.
Because overflow quantity and time are uncertain, once emergency overflow happens at the

9.0 Environmental Risk Analysis
388
dam site, immediately inform the downstream water intakes to stop intaking, and swiftly start up Accident Emergency Plan, strengthen water quality monitoring of water intakes to assure water quality safety of the water intakes.
In order to protect reservoir area water quality, these accidents must be stopped as possible through strict environment management, establish relative system, perfect equipment, advance personnel quality and establish oil spillage contingency plan, and adopt proper control measures for oil spillage accident, so as to control pollution of oil spillage accident. Once risk accident occurs in the waterway, start immediately oil spillage contingency plan, adopt accident emergency measures, and reduce pollution impact of oil spillage accident to aquatic environment of reservoir area and the river section downstream of the dam site.
9.3 Risk analysis of aquatic ecological environment
9.3.1 Acute poisoning effect
Once there is an oil spillage pollution accident, it will pollute water area in a certain range, it may also pollute water intake of living water along the line, which has greater impact to boogies, fishes and residents that take Kan River as the water resources of farming irrigation. Take petroleum pollution as example, its danger mainly comes from the chemical composition, properties and the existing form in the waterway of petroleum. In the different components of petroleum, low boiling point aromatic hydrocarbon is toxic to all biology, while high boiling point aromatic hydrocarbon belongs to long acting toxicity, which will be a threat, damage and even death to life of aquatic biology.
9.3.2 Impact to fishes
� Acute toxicity test of fishes According to the toxicity test result of kinds of different fish fry in recent years, cyprinoid fish fry 96hLC50 value of petroleum is 0.53.0mg/L, so, instantaneous high concentration discharge (that is accident discharge) in pollution belt may cause acute poisoning fish death accident, hence, petroleum transportation ship in the waterway must be managed and controlled strictly.
� Analysis of accumulation residue of petroleum in fish body
Accumulation and residue of petroleum in fish body may cause fishes slow poisoning and result in long acting pollution effect, which can cause not only changes of fish resources, but also fish idioplasmatic degeneration. Once fishes contact with the oil molecule, it will generate oil stinking in a short time, and affect its edibility. Taking No.20 fuel oil as example, when petroleum concentration is 0.01mg/L, most fishes and shrimps will have oil taste within 7 days, and most fishes will have peculiar smell within 30 days.
9.3.3 Impact to phytoplankton

9.0 Environmental Risk Analysis
389
According to experiment, petroleum will destroy phytoplankton cell, damage the exchange of chlorophyl and Interfering gas, by this way hamper their photosynthesis. The damage degree is determined by the type of petroleum, concentration and phytoplankton species. According to toxic experiment results both domestic and abroad, as the basis of feedstuff, phytoplankton has very low withstanding capacity to various oils. Acute poisoning fatal concentration of petroleum for general phytoplankton is 0.110.0mg/L, usually is 1.0 3.6mg/L; For sensitive species, when oil concentration is lower than 0.1mg/L, it will hamper the speed and growth of cell split.
9.3.4 Impact to zooplankton
Acute poisoning fatal concentration range of petroleum for zooplankton is usually 0.1 15mg/L, through tests of copepod larva in different petroleum concentration environment, it shows that sensitivity of permanent (lifetime) zooplankton larva is larger than stage (temporary) benthos larva, and their sensitivity of larva is larger than adult .
In summary, once oil spillage accident occurs in the waterway of reservoir area, pollution factors petroleum and methanol will generate acute poisoning to fishes in the waterway, the accumulation and residue in the fish body will generate greater negative effect to the fish mutagenicity, as well as certain effect to phytoplankton and animals; hence, risks protective measure and accident emergency response plan must be strictly implemented.
9.4 Environmental risk analysis of dam safety
9.4.1 Flood dam overtopping
According to statistical records, about 1/3 of the dam accidents in China and of the world are caused by dam flood overflowing that is closely related to the design standard for flood control of the dam. According to the existing flood design standard, the analysis of the dam safety shows that, from the hydrological point of view, the theoretical rate of dam flood overflowing is by far higher than the actual rate of accidents. This indicates that the dam normally has certain potential capacity for flood control that results mainly from the following two aspects. The first one is the impacts of the uncertainties of the random hydrological and hydraulic features, which makes the designer leave some safety margins when making decision of the flood control computation, designing scales of flood discharging structure and elevation of dam top etc. The second one is due to impacts of the vague uncertainties of project construction and management that lead to the fuzzification of the critical limit values for dam failure of flood overflowing. Normally, when the flood water level is slightly above the dam top, accidents will not occur.
Shihutang navigation and power junction project belongs to Grade II largeII type hydropower project. The normal water storage level of the project is 56.50m with a total reservoir capacity about 632,000,000m3, permanent water retaining and water release

9.0 Environmental Risk Analysis
390
structures of the junction project is designed in accordance with return period of flood once every 50 years, examination of return period of flood adopts 300 yearsas a part of water retaining structures, the design and examination of flood standard of workshop and ship lock should be the same with water retaining structuresEnergy dissipation and protective works of water release structures in the downstream will be designed according to return period of flood of once every 30 years. Main structures of the project, such as flood discharge flushing sluice, water retaining section of ship lock, workshop and earth rockfill dam of joint of left and right banks, will be designed according to Class III structures, secondary structures will be designed according to Class IV structures and temporary structures Class V, so as to satisfy the requirements of the design specifications, which can guarantee the safety of dam once every 300 years with relative maximum overflow discharge 4700m3/s, without risks of overtopping and collapse of dam. Since Wan’An power station in the upper reaches has peaking capability, no dam overtopping and collapse risks will happen even if flood once every 300 years through the peaking regulation of Wan’An power station.
Flood regulation operating method of Shihutang navigation and power junction project will adopt upstream incoming water flow rate to indicate flood regulation operating method. The detailed flood regulation operating method is: when flow rate of upstream Dongbei station is larger than switch off critical flow rate 4330m3/s, corresponding flow rate of Shihutang dam site 4700m3/s and outlet flow rate of Guanyuanshui is larger than switch off critical flow rate 70.0m3/s and flood still has rising tendency, or flow rate of Dongbei station is less than switch off critical flow rate but outlet flow rate of Guanyuanshui is larger than switch off critical flow rate and flood still has rising tendency, Shihutang junction flood gate and flood control regulating sluice of outlet flow rate of Guanyuanshui will all be open at this time, flood control regulating sluice of guide discharge channel of Guanyuanshui will be closed to release flood, and the river way keeps basically natural state. The water retaining height of the project is 9.6m, maximum height of concrete dam is only 26.5m, which belongs to low head structures. The water level difference of upper reaches and lower reaches is less than 0.5m under the flood water regime, which is near natural; in case of project accident, the loss caused to the lower reaches will be smaller.
The project design has established water regime automatic forecasting system, and arranged 19 water and rain regime report station and point, which can ensure the safety and economic operation of Shihutang navigation and power junction project. Protection area works will be used safely under the design flood standard condition, thus, dam collapse due to flood can be controlled effectively.
9.4.2 Sediment accumulation invades flood control reservoir capacity
The second risk of flood overtopping comes from sediment accumulation invading into the flood control reservoir capacity. Bottom elevation of flood gate of Shihutang navigation and power junction project is 47.0m, which is very low, almost the same level with the original river bed, the project flood gate is favorable for sand discharge. In addition, the regulation operating method of junction project adopts upstream coming water volume to indicate the open degree of flood gate; when the dam coming water volume exceeding after flood once

9.0 Environmental Risk Analysis
391
every 2 years, all flood gates should be opened for flood releasing and sediment-flushing. Sand content of Gan River is small with fine granule, Mean annual sediment load of Shihutang dam site is 428×104t. Considering from the project general layout and operating regulation method, as well as the reservoir type, water current form is smaller than natural situation, especially in flood season with larger incoming sediment. Since the discharge capacity of flood gate is large and all are opened for flood releasing that doesn’t change the water current formation and hydraulic element; moreover, the sand granule of the river is smaller, mud and sand are difficult to deposit at the end of reservoir, and most coming sand from the upstream dam site can be discharged from the reservoir with water current. However, Shihutang reservoir backwater is comparatively long, transported sediment is difficult to move to in front of dam, mud and sand that move to the dam front will be brought to the dam below due to low bottom elevation of flood gate of junction project that is favorable for sediment releasing. Hence, sediment accumulation in Shihutang reservoir is expected to become a small scale delta mud accumulation, sediment accumulation of reservoir end and dam front is less. Mud accumulation in Shihutang reservoir has smaller operating impact to water surface line of reservoir area and the project, which will not affect apparently the flood control reservoir capacity.
9.4.3 Stability of reservoir bank affects flood control capacity
Reservoir area banks of Gan River Shihutang Navigation and Power Junction Project are mainly river alluvial plain landform, hill landform is distributed as well. Total length of bank slope of reservoir bank is about 109.55km including branch river Shushui River bank , according to geological disaster development degree, the bank slope of reservoir bank can be divided into three levels, namely better stability, middle stability and instability. Total length of nature bank slope with better stability is about 46km. Total length of nature bank slope with middle stability is about 40km. Total length of nature reservoir bank with instability is about 24km, the bank slope is mainly distributed in dam site of east bank of Jiangjiazhou of Gan River—Huwei, Weijia in east bank of reservoir end of Gan River and Shushui River enters into two banks of Gan River section. Bank slope is formed by Quaternary System unyoke alluvial layer, lithology has obvious dualistic structure, the upper part of which is formed by clay, clayey soil, clayey loam, usually thickness 1—4m, terrace structure is loose, the lower part of which is formed by conglomeratic sand soil, ovum gravel, usually thickness 2—3m, natural rocky ledge may generate collapse in flood season every year due to no management, now most landslide debris are flushed away by water current, there is small amount of residual, which has small impact to the project and no apparent flood control reservoir capacity. Anterior border around the reservoir exist small scale bank failure phenomenon; design of protective works of reservoir area in the project design has adopted corresponding protection measures, which can effectively control unfavorable geological phenomenon, such as collapse, landslide.
According to buried depth of ground water level and relative immersion standard of backwater height of water storage provided by geological specialty, in addition to inundation area field lift treatment in Mashi immersion area , sections that may be affected by immersion in the reservoir area are all in protection areas of reservoir area. In the protective
9.0 Environmental Risk Analysis
392
works design of protection areas, heighten, fasten and build new protection embankment has formed basically closed protection circlevertical anti seepage treatment has been carried out for permeable layer of binary embankment foundation of protection embankmentdrainage ditch system in the flat ground of the area has been renovated and dredged, drainage pumping station and drainage culvert and sluice are established in the inland inundation and subsurface drainage outlets It guides the slope coming water in the area. Hence, immersion problem in protection areas have been solved basically.
Through summarizing the examples of reservoir accidents caused by flood, it is known that: (1)Flood may cause danger to the dam; (2)In existing reservoirs, the probability of dam accidents caused by flood will be several in a ten thousand; (3)There are two kinds of accidents of dam: dam overflowing and dam breaking. The former has less risky strength while the latter has extremely strong risk strength. (4)Dam type is closely related to the probability of flood risk. When the dam encounters over-limit flood,
the concrete gravity dam will only have overflowing.
9.4.4 Construction quality
Construction quality cannot be ignored among the factors that may cause dam breaking. In recent years, accidents that were caused by construction quality can be found frequently. Such risk can be avoided through enhancement of construction management.
9.4.5 Analysis of reservoir induced earthquake
The seismic peak ground acceleration of reservoir area is lower than 0.05g, and relative earthquake basic intensity is lower than Grade � degree. In the recent years there is no active geological fault, and no geological structure background to form violent earthquake, the area is structure relative stable area. The reservoir area is located in the south central Ji-Tai basin, and the basin stratum is mainly made up with cretaceous redbed with usually weak perviousness. The faulted structure is mainly the consortium break and small scale basin back break lying concealed in cretaceous stratum, there is no permeating channels to deeper part for reservoir water. After building up and operation of reservoir, the uplift water head is not high, and the earth stress changes moderately, and the possibility of reservoir induced earthquake is minor. It is observed that the dam collapse risk of reservoir caused by earthquake is minor.
In summary of the examples of dam failure caused by earthquake, it is known that: (1). As for the dam failure caused by earthquake, whatever in the total numbers of dams or in the number of failures, the probability tends to be lower that is by far lower than that caused by flood.

9.0 Environmental Risk Analysis
393
(2). In addition to the structural earthquake that may cause dam failure, the earthquake caused by reservoir may also cause dangers to the dam. The probability of the dam failure caused by reservoir-induced earthquake accounts for about one third of the total dam failures. (3). The consequences of dam failure are cracks and damage to facilities that will affect the normal dam operation. Up to now, there is not any report in this regard, of which, the losses will be much less than dam overflowing and dam breaking. (4). Concrete gravity dam is better than other type of dam. Its anti seismic capacity is better than that of other kinds of dams.
9.5 Other environmental risk impact analysis
� Construction blasting risks During the project construction process, blasting will be carried out for bedrock in the foundation pit after the formation of coffer wall. Impact of construction blasting to the environment of land area is limited, which will not generate impact to aquatic biology.
� Storage and transportation risk of dangerous articles during the construction period
Certain environmental risk during the transportation and storage process exists due to combustible and explosion hazard in the construction period
� Population health risks During construction period, due to inferior sanitary conditions, outside people frequently come and go. Construction team people are relatively concentrated showing high population density. Such will bring and spread some diseases.
9.6 Risk acceptance analysis Shihutang navigation and power junction project is comprehensive utilization shipping and water conservancy junction project that takes shipping as main and generates electricity and flood control at the same time. It belongs to a traffic transport project, hence, its risk evaluation is different from environmental risk assessment for production, utilization, storage and transportation projects of poisonous and harmful and combustible and explosive substances.
The project environmental risk is divided mainly environmental risk of dam safety and environmental risk of waterway operation.
Main structures of the project junction follows the design standard that can guarantee dam safety of no risks of dam overtopping and dam breach even if flood once every 300 years however, it has flood dam breach risks only when hydrological risks of coming water from upper reaches exceeding once every 300 years, since Wan’An power station in the upper reaches has peak regulation capacity, in case of flood once every 300 years, no risks of dam overtopping and dam breach will happen through peak regulation and joint peak regulation of Wan’An power station. The project water retaining height 9.6m, which belongs to low head structures, it has small loss impact to the lower reaches in case of project accident. The project design has set up water regime automatic forecasting system, which can ensure the safety and

9.0 Environmental Risk Analysis
394
economic operation of Shihutang navigation and power junction project, protection area works will be used safely under designed flood standard conditions, and dam breach risks due to flood can be controlled effectively. Sediment accumulation in the reservoir has small impact to the water surface profile of reservoir area and project operation, which will not apparently affect flood control storage capacity. Possibility of earthquake induced by reservoir is small; it is observed that reservoir dam breach risk caused by earthquake is small.
According to project design forecast, dam-cross transportation quantity in 2020 will be 8.43 million tons, among which, 80.4% of them are coal, mine construction materials, farming, forestry, animal husbandry and fishery products; oil product transportation ratio is about 5.9% Dam-cross transportation quantity in 2030 will be 13.33 million tons, 81.8% of them are coal, mine construction materials, farming, forestry, animal husbandry and fishery products, and oil product transportation ratio is about 5.3%. at present, there is almost no real wharf in the reservoir area, according to Jiangxi Province Inland Navigation Development Plan, Jiangxi Province inland ports are planned in accordance with their scales: main port, regional key port, common port is divided into three layers, Taihe County is positioned as common port without large scale port and wharf development plan. Maximum risk probability of ship oil spillage accident in the waterway of reservoir area during the operation period is once every 33 years 12.5 years.
According to analogy analysis of similar project, value at risk of maximum confident accident Rmax of the project is less than maximum acceptable level Rl in the same industry, hence, the construction risk level of the project is acceptable.
9.7 Risk protective measures and emergency plan
9.7.1 Protective measures of shipping risks and emergency response plan
9.7.1.1 Emergency response plan for regional accident risk
For sudden waterway environment pollution accident, emergency response plan for regional marine accident risk should be set and set up permanent regional accident risk emergency reaction center. Once a sudden marine accident occurs, it can carry out timely, fast, accurate and effective treatment, and reduce to the maximum extent damage of life, property and environment caused by pollution accident.
A perfect regional accident risk control management system has been set up by the Ji’An City government and relevant functional departments, as well as a permanent accident risk emergency reaction center. Once risk accident occurs, accident emergency measures can be adopted. Following is the main contents of Ji’An City Emergency Response Plan for Handling Marine Sudden Event JiFuBanZi [2006] No.83 April 12, 2006 issued by Ji’An City government:
� Emergency response system and main responsibilities Ji’An City Handling Marine Sudden Event Emergency Response Headquarters is the
9.0 Environmental Risk Analysis
395
command organ to handle marine sudden event emergency response work and guide marine sudden event emergency treatment work of the city.
� Main responsibilities of city emergency response headquarters: � Implement the decision and instruction of City Emergency Response Command Office.
� Organize uniformly and command serious, major and greater marine sudden event emergency treatment, decide to set up on-the-spot command, out forward suggestion to the City Emergency Response Command Office to terminate the emergency status.
� Research and decide major decision and work opinion on marine sudden event emergency work of the city.
� Guide the rescue work of the city marine sudden event emergency.
� Member of City Emergency Response Headquarters:
Commander in chief: deputy mayor of the city government in charge of marine traffic safety
Deputy commander in chief: director of bureau of communications, director of local marine department, deputy secretary general of city government, public safety department, and principal of city administration of work safety.
Member: city government office, city communications bureau, city public safety department, city work safety supervision management bureau, city agriculture bureau, city health bureau, city tourist bureau, city bureau of civil affairs, city finance bureau, city bureau of water resource, city bureau of state land and resources, city environmental protection bureau, city meteorological bureau, city fire control branch, relative principal of city local marine department.
� Standing body
City emergency response headquarters has set up office and established Ji’An City marine search and rescue center under the city local marine department, as the working organ of city emergency response headquarters, which is responsible for the daily work of city emergency response headquarters, and undertakes marine search and rescue operating management.
Director of city marine search and rescue center: deputy director in charge of city communications bureau Deputy Director of city marine search and rescue center: section chief of city local marine department, section chief of city port navigation department.
Main responsibility of Ji’An City marine search and rescue center:
� Implement the decision and instruction of city emergency response headquarters�.
� Establish relative regulations of city level marine rescue work, compile the budget of
city level marine search and rescue.
� Be responsible for the draft, operation and management of city level marine sudden
event emergency response plan.

9.0 Environmental Risk Analysis
396
� Decide the responsible region of city marine search and rescue organ, and carry out
business guidance.
�Sign interlocal marine search and rescue agreement with neighboring cities, establish
emergency cooperation and linkage organism.
�Undertake the emergency on duty of city marine search and rescue, be responsible for
the comprehensive coordination and relative organization management work of city marine
search and rescue work.
�Undertake the city marine oil pollution emergency and reception and liaison work of
marine security alarm.
�Organize the city marine search and rescue emergency drill and emergency exercise.
�Organize the training and marine safety knowledge propaganda of safety, specialty
knowledge, new technology application of the city marine search and rescue personnel.
� On-the-spot command
After serious, major and greater marine sudden event happen, city emergency response headquarters will establish on-the-spot command in the accident place if necessary. Main leader of the local county (city, district) government will be the commander in chief, or designate by provincial or city emergency response headquartersAccording to sudden event situation, members of on-the-spot command will be organized by leaders of relative departments, units and local town government of county (city, district). On-the-spot command will set some special groups in accordance with necessity, see figure 9.71 for details.
� Emergency response organization organ
See figure 9.7 2 for detailed organization structure of emergency response system, see figure 9.7 3 for detailed work flow of emergency response system.
Figure 9.7 1 On-the-spot emergency command organ

9.0 Environmental Risk Analysis
397
On-the-spot command
Marine search and rescue group
Marine traffic alert safeguard
Comprehensive coordination group
Medical assistance group
Logistics support group
Aftermath handling group
A
Serious or major, greater sudden public incident alarm
Further examination
No detailed information
Other information sources
City marine search and rescue center make analysis on distress message
False alarm
Dangerous situation elimination

9.0 Environmental Risk Analysis
398
Dangerous situation confirmation
Whether in the responsible district
Yes
No
Report the accident and report dynamic marine sudden event emergency according to regulations
Notice emergency command organ in the corresponding responsible district
Advanced treatment (local government and relative units)

9.0 Environmental Risk Analysis
399
A
Figure 9.7 3 Work flow of emergency response system
Start emergency response

9.0 Environmental Risk Analysis
400
plan approved by city emergency response committee
Commanders reach the designated position
Establish emergency communication
Startup expert system
Designate on the spot command
Emergency response (mainly local county, city, district government)
Emergency team guarantee
Emergency equipment guarantee
Emergency technology guarantee
Rescue people
Dangerous situation control
Medical assistance
On the spot monitoring
Emergency rescue assistance activity
Start pollution emergency response plan in case of pollution accident
Adjust emergency rescue assistance plan
Appraisal on emergency rescue assistance result
People has been rescored or no survival

9.0 Environmental Risk Analysis
401
survival possibility
Emergency terminated (approved by emergency response committee)
Spot cleaning
White alert
Aftermath handling (local county, city, district governments and relative units of city government)
Search and rescue result and emergency experience summary (city emergency response committee or relative departments of city government together with local county, city and district governments)
Resume reconstruction (local county, city, district governments and relative units of city government)
Establish file

9.0 Environmental Risk Analysis
402
� �
� �
Figure 9.7 2 Organization structure of emergency response system

9.0 Environmental Risk Analysis
403
City Emergency Response Committee
City Emergency Response Headquarters
Members of City Emergency Response Headquarters
On -the-spot command
Expert group
County (City, District) Emergency Response Headquarters
City marine search and rescue center
Township Emergency Response Headquarters
County (City, District) Emergency Response Command Office
Township Emergency Response Command Office
Marine emergency rescue assistance force
Marine professional force
Fire control professional force
Military professional force
Government public affairs force
Other social force

9.0 Environmental Risk Analysis
404
� Emergency response procedure Members of city emergency response headquarters should establish perfect monitoring organs, analyze comprehensively possible early warning information of serious, major and greater marine sudden event and report relative information to city emergency linkage center and city marine search and rescue center.
Relative units, ships and personnel engaged in marine activities should pay attention to receive early warning signal, adopt corresponding protective measures according to different early warning grade, so as to prevent damage of marine sudden event to life, property and environment.
City emergency response headquarters and member units should do well relative preparation work in accordance with early warning information and their responsibilities. Marine professional emergency teams at all levels should enter into armed state and preparation for emergency rescue assistances.
After marine sudden event occurs, person in danger or eyewitness near the site should report immediately to the local marine management department or public security, fire control departments, ship in danger should simultaneously report to the aforesaid units. The public security, fire control and ship departments should inform in time the local marine sudden event emergency command organ or marine management organ as soon as receiving the report. After marine sudden event emergency command organ or marine management organ receiving the report, through examination, should immediately ask for instructions of standing deputy commander in chief and inform local marine officeteam and ship management pointing in the local accident section both upper reaches and lower reaches to implement traffic control for the upstream and downstream ships for ships with dangerous articles that have combustion, explosion, leakage, pollution accident that may endanger the normal shipping of other ships, endanger units and residents safety. Start emergency response plan to implement traffic control in the entire navigation district in necessary.
� Emergency treatment for pollution accident
� Carry out rescue assistance for accident wounded�
� Judge the accident nature, the professional personnel should guide the ship to start self
help according to the ship oil spillage contingency plan, and evacuate the persons on the spot
in case of combustion or explosion dangers�
� According to the site situation, organize people to evacuate from the accident water
area or other ships entering into safety water area�
� Pollution oil fence control recovery team should use existing emergency materials,
and carry out fence control and recover the leakage oil product�

9.0 Environmental Risk Analysis
405
� Escort the leakage ship in time to designated wharf, unload hazardous goods�and
organize relative ships to carry out overside transport for ships that cannot sail by itself or
dangerous articles ship with heavy load�
� Organize personnel and equipment to eliminate pollution
� Alarm method See Table 9.7 1 for detailed common alarm, report and notice telephone
The following contents should be included when reporting marine dangerous message:
Accident time, place, dangerous situation, ship in danger; name, category, contact method and etc of aircraft or person in distress
Person that gave alarm should provide as possible the following information:
� Main size, owner, agent, operator and carrier of ship or aircraft
� Quantity and casualty situation of person in danger
� Freight situation, especially hazardous goods, name, category and quantity of cargo
� Direct accident cause, adopted measures, rescue assistant requirements
� Weather, hydrological information of accident site�Including wind power, wind
direction, velocity of wave, wave height and etc
Table 9.7 1 Common alarm, report and notice telephone
Unit Telephone on duty Fax
Special telephone for marine search and
rescue District number +12395
China maritime search and rescue center
010-65292218 010-65292245
China Maritime Search and Rescue Centre of
Ministry of Communications
010-65292218 010-65292245
City marine search and rescue center
0796�8223140�working date�
City marine search and rescue center
8224639 8238458(city local marine department )�holidays, evening�
Public security 110
Fire control 119
Ji’An city environment protection bureau 0796-8230629
9.7.1.2 Protective measures for project shipping accident
The construction period of the project junction will generate impact to the shipping in river

9.0 Environmental Risk Analysis
406
section of the project, in order to prevent shipping accident risk, necessary protective measures should be adopted.
Shipping flow of approach channel of ship lock during the project operation period is larger, in order to prevent shipping accident risk when ships passing through the ship lock and approach channel, necessary protective measures should be adopted.
See Table 9.7 2 for detailed protective measures for ship accident risk during the project construction period and operation period.
At present, Ji’An City marine emergency equipments mare mainly 26 ships of Ji’An City local marine department, including 2 maritime affairs ships of Taihe County, 4 beacon vessels. Considering ship flow in reservoir area during the project operation period will increase greatly, we suggest relevant department to increase marine emergency equipments of relative department in the project site, so as to reduce the loss of probability of sudden accident and accident pollution. In addition, we suggest perfecting the regional salvage rescue assistance mechanism. Along with the improvement of shipping conditions and growth of transportation ships, salvage rescue assistance organ and supporting equipments should be perfected, so as to provide effective rescue assistance treatment in case of accident.

9.0 Environmental Risk Analysis
407
Table 9.7 2 Protective measures adopted for ship accident risk of the project
Time interval Protective measures Construction
period Port navigation safety supervision will be implemented during the construction period of the
project junction in order to prevent ship accident risk. 6 beacon lights will be set to prevent ship accident risk
12 sign boards will be set for 3 water intakes of drinking water and water-source reserves, prompt passing ships to protect water sources�remind passing ships to strengthen safety consciousness�prohibit ships to anchor in these areas�prohibit ships overside transport in this water area�prohibit ships to discharge all pollutants in this water area.
Operation period
Set 10 travel assistance mark plates, warm passing ships to pay attention to strengthen safety consciousness, dial immediately emergency call to inform accident emergency organization in case of accident
� Spillover intercepting equipment: accessory equipments, such as oil fence�800m�, buoy, anchor, anchor rope and etc.
� Spillover recovery equipment: oil absorption felt�2t�, blotter�1 set�. � Working ship: can carry out oil fence laying, recover spillover operation
marine working ship�1 ship�
9.7.2 Protective measure of dam risks and emergency response plan
To assure the safety of the dam, the Project Office has set Dam Safety Team that is responsible for framing work outlines of Dam Safety Team, preparing the dam safety report (including construction supervision and quality assurance plan, observation apparatus plan, operation and maintenance plan and emergency preparation plan).
9.7.2.1 Protective measure of dam risks
� According to possible hydrological risks, flood observation and prediction work should be strengthened. Considering risks of sediment accumulation breaking into reservoir storage capacity, since expectable risk mainly comes from soil erosion; hence, strengthen soil erosion monitoring in the reservoir rain collection range in order to regulate existing soil erosion area and stop generating new soil erosion. In order to master water (rain) regime in the upper reaches above Shihutang dam site and reach timely and accurately flood control command center at all levels, especially to pay attention to flood exceeding the safety design standard, provide scientific basis for the safety operation of dam, and get more time to resist flood exceeding the standard, the project design has set up water (rain) regime automatic forecasting system.
The project has arranged 19 water and rain regime report station and point, including Shihutang dam below, Dongbei and Kinkeng are hydrological stations, namely survey water level, rainfall amount, flow rate and mud and sand. Shihutang dam set a water level report station, the rest 15 stations and points are rainfall stations. See Table 9.73 and 9.7 4 for details. Adopt ultrashort wave report communication network. Adopt public data network for the communication between Shihutang to Wan’An Hydraulic Power Plant and Shihutang to Ji’An.

9.0 Environmental Risk Analysis
408
� Carry out reservoir bank stability monitoring during the project operation period
� Carry out soil erosion monitoring during the project construction period and operation
period.
(4)Aiming to the risk of construction quality, it is necessary to undertake legal effective
control over the construction, renew the consciousness of quality of the contractor and
construction team workers, so as to avoid possible dam breaking caused by construction
quality.
Table 9.7 3 Composition of water regime automatic forecasting system
No. Water regime report ultrashort
wave network Unit Quantity
1 Central station 1
2 Sub-center station 1
3 Rainfall station 15
4 Water level station 1
5 Hydrological station 3
6 Relay station 2

9.0 Environmental Risk Analysis
409
Table 9.7 4 Project water regime automatic forecasting system station
arrangement
No. Station name Station nature
Observation point location Observation item
1 Shihutang dam
below Hydrological
Cangyuan Village of Wanhe Town of Taihe County
Water level, flow rate, mud and sand, rainfall
2 Shihutang dam
upper Water level Shihutang dam upper Water level
3 Dongbei Hydrological Dongbei Village of Baijia Town
of Wan’an County Water level, flow rate, mud
and sand, rainfall
4 Linkeng Hydrological Linkeng Village of Gaopo Town
of Wan’an County Water level, flow rate, mud
and sand, rainfall
5 Yangmeikou Rainfall Yangmeikou Village of Jiantou
Town of Wan’an County Rainfall
6 Xingzhou Rainfall Lizhou Village of Huang’ao
Town of Jinggangshan Rainfall
7 Wudoujiang Rainfall Baishi village of Wudoujiang
town of Suichuan county Rainfall
8 Che’ao Rainfall Che’ao Village of Wudoujiang
Town of Suichuan County Rainfall
9 Xinjiang Rainfall Xinjiang Village of Xinjiang Town of Suichuan County
Rainfall
10 Wanzhou Rainfall Wanzhou Village of Shuangqiao
Town of Suichuan County Rainfall
11 Baitujie Rainfall Qishan Village of Suxi Town of
Taihe County Rainfall
12 Taihe Rainfall Shangtian Village of Shangtian
Town of Taihe County Rainfall
13 Longtankou Rainfall Longtankou Village of
Chongxian Town of Xingguo County
Rainfall
14 Laoyingpan Rainfall Shangpi Village of Shangpi Town
of Taihe County Rainfall
15 Guanchao Rainfall Guanchao Village of Guanchao
Town of Taihe County Rainfall
16 Longxia Rainfall Longxia Village of Zhonglong
Town of Taihe County Rainfall
17 Wanxi Rainfall Wanxi Village of Wanxi Town of
Taihe County Rainfall
18 Shangjiang Rainfall Shangjiang Village of Guanxi
Town of Taihe County Rainfall
19 Yuanqian Rainfall Meishan Village of Yuanqian
Town of Taihe County Rainfall
(5) According the conclusion of geological assessment, even though the possibility of
earthquake in this district is very less, due to the consequences of dam breaking, it is required
to enhance communication with local earthquake station and the earthquake monitoring.
� Organize dam safety monitoring group
Dam safety group is the important guarantee to implement protective measure of dam
risks.

9.0 Environmental Risk Analysis
410
� Responsibility of dam safety group
To supervise and inspect relevant issues in connection with the project construction, including the overall arrangement of the main structures of the Shihutang dam, hydro-power station, water gate and reservoir area protection, accuracy of the engineering geological prospecting results, correctness of the analysis of the hydraulic model test, dam foundation design, stability of the natural and cutting slopes, engineering technology and methods for foundation construction, rationality of investment budget and geological issues etc. The group will inspect the degree of influence on the project by the key fracture layer and geological fault within the range of the dam site. It also inspects the influence of weak ground on the dam body as well as the reliability and rationality of the treatment measures.
2 The group will inspect concerned design basis, use of parameters and result of
computation for the structures of the dam in different stages (including the body structures). It will also inspect the rationality of the designed water level, hydraulic design and check water level, thus to ensure the safety requirement for water blocking. The group will independently compute and inspect the reliability of the relative materials in connection with sudden rainfall and flow volume caused by different frequencies, as well as the treatment schemes for dam water blocking and leakage prevention.
3 The group will inspect concerned issues in connection with the analysis of silt
sediment, correctness of computed results of incoming silt sediment and the reservoir operating methods. It will inspect the influences on the lower navigating channels and water works by the short-term sediment and long-term reservoir systematic scouring.
4 The group will inspect concerned technical documents in connection with the bidding
for the main works of the project, as well as inspect the equipment selection of the project.
5 The group will inspect the construction management plan, time schedule, progress plan, establishment of project construction management and the personnel scheduling etc.
6 The group will inspect the applicable standards and structural types for diversion of the
reservoir, as well as inspect the feasibility and effectiveness of the flood control schemes in construction period, protective measures and emergency measures.
7 The group will inspect the feasibility and effectiveness of the supervisor’s management
plans, enforcement regulations, quality control ensuring system, supervising means and measures etc. for the facilities and main works of the reservoir. It will also assist and oversee the supervisor to fulfill its obligations as well as control quality, progress and project investment costs etc.
8 The group will provide with improving suggestions for the special works of the project,
such as land requisition and environmental protection, so as to minimize the negative impacts

9.0 Environmental Risk Analysis
411
and gain greater achievement.
9 The group will inspect the results of hydraulic computation under various flows, including the operational schemes in the dam’s initial stage, the schemes of flood control and the schemes of flood discharge, so as to ensure the safety of the dam.
10 Others: the group will inspect other issues that are in connection with the safety of the
Pivot.
� The Dam Safety Group is the important factor to assure the implementation of the risk preventive measures for the dam. As for this project, the Project Office shall establish the Dam Safety Group according to the requirement of the World Bank, whose main tasks are to provide with safety evaluation and technical consultation for the whole process of construction of the project from design, bidding, construction to the dam’s initial operation. During the period of project construction, the group, according to the requirement of the project, will mobilize more experts, including experts in geology, seismology, reservoir sedimentology, concrete construction technology, environmental protection and reservoir land requisition and removal, to provide with technical consultation and temporary assistance to the project construction.
9.7.2.2 Dam risks emergency plan
The risk of dam breaking is little which would also be easily ignored. In order to avoid being in horror during dam breaking, there should be a set of emergency plans for dam breaking. As for the places in lower reaches, dam breaking of reservoir means the breakout of over-limit flood. However, the situation of dam breaking is quite different from the normal over-limit flood. As for dam breaking, due to high dam and large storage, the draining volume is extraordinary big but lasts for short time. Therefore, the emergency plans for dam breaking have included into the existing regional flood control plans.
9.7.3 Protective measures for other environmental risks
9.7.3.1 Protective measure for aquatic ecology risks in the construction blasting
� Blasting operation in construction should avoid fishes mating season in April – July of the river section as possible.
� Blasting will adopts millisecond electric detonator elementary error squeeze blasting, and shorten the blasting impact range as possible.
9.7.3.2 Protective measure for dangerous articles storage and transportation risk during the construction period
� Regulations of hazardous goods transportation should be followed strictly during the transportation process, mixed loading of dynamite and detonator in transportation is not allowed.

9.0 Environmental Risk Analysis
412
� Arrangement of explosive store and oil depot should satisfy the requirements of relative safety production specifications, and keep necessary safety distance from the residential point and construction camp.
� Management system for explosive store and oil depot must be strict, no smoking or naked flame, set lightning protection facilities, so as to avoid accident as possible.
9.7.3.3 Protective measures for population health risks
� Population health epidemic situation monitoring will be carried out during the project construction period and operation period
� During the construction period, pay attention to improvement of hygiene conditions, avoid pollution to drinking water, implement strict disinfection on drinking water, strengthen living area hygiene, epidemic prevention management, and implement domestic wastewater, rubbish and manure treatment, so as to reduce or eliminate site of disease mosquito-borne breeding site as possible.

10.0 Environment Protection Measures & Techoeconomic Analysis
413
10.0 ENVIRONMENTAL PROTECTIVE MEASURES AND ECONOMIC AND TECHNICAL EVALUATION
10.1 Water Environmental Protective Measures
10.1.1 Construction period
10.1.1.1 Sandstone aggregate preparation system flushing wastewater treatment measures and economic and technical evaluation
� General situation of wastewater A sandstone aggregate preparation system will be set at the right and left banks of the project junction area respectively. Average discharge amount of sandstone flushing wastewater is 120m3/h peak value 240m3/hSS discharge concentration 50000mg/L. main pollutants of sandstone flushing wastewater is SS, which has characteristics of large wastewater amount, high SS concentration, if it discharges directly without treatment, it will cause greater impact to the downstream water quality of project river reach during the flat and dry season.
� Treatment target Suspended matter concentration of sandstone wastewater after treatment should be less than 70mg/L, so as to realize wastewater recycle utilization.
� Selection of treatment scheme
� Selection of wastewater treatment scheme According to wastewater characteristics of sandstone material processing system, we plan 2 schemes in order to carry out technical economy comparison.
Scheme I: adopt natural sedimentation method; see Figure 10.1-1 for treatment flow. Wastewater with high suspended matter flows from the screening building, enter into the sedimentation basin without using polycoagulant, carry out natural sedimentation in the sedimentation basin, and supernatant will be used circularly. The feature of this scheme is simple treatment flow, low requirement for technical capital construction technology, easy running operation and less operating expenses; however, in order to realize better treatment effect, which has a large sedimentation basin scale requirements, and it is difficult to meet the requirements of reclaimed water quality.

10.0 Environment Protection Measures & Techoeconomic Analysis
414
Figure 10.1 1 Process flow of natural sedimentation method
Makeup water
Reclamation system
Screening building
Sedimentation
Desilting
Supernatant
Scheme II: adopt coagulant sedimentation, see Figure 10.12 for treatment flow. Wastewater flows from screening building to remove coarse sand after primary sedimentation through desilting treatment unit, and then enter into the flocculating settling unit. Because of the adding of flocculant, suspended matter less than 0.035mm can be removed fast and effectively. The shortcoming is the increasing of equipment and operating expenses Comparing with Scheme I, this scheme has a smaller land occupation with fine treatment technology effect, which can reclaim a large amount of fine sand.
Figure 10.2 2 Process flow of coagulant sedimentation
Makeup water
Reclamation system
Screening building

10.0 Environment Protection Measures & Techoeconomic Analysis
415
Desilting basin
Add flocculant
Flocculating settling basin
Sedimentation
Desilting
Slurry
Supernatant
Considering from the maintenance management and operating expenses, Scheme I has greater advantages As for treatment effect and land occupation, Scheme I has greater advantages. Most suspended matter in the sandstone aggregate processing wastewater of the project is inorganic grain, which has better sinking performance, but with very strict requirement for treatment target, under the situation of short of construction land use, Scheme I cannot satisfy apparently the requirements, hence we recommend Scheme II .
� Selection of treatment unit
� Desilting treatment unit
Scheme I: adopt combining method of sand settling basin and spiral sand-water separator. Flushing wastewater from screening building flow automatically into the sand settling basin, treatment water enters into the follow-up treatment unit, sand slime in the bottom of sand settling basin will be sent to spiral sand-water separator by pump to carry out mechanical dewatering, and water content after fine sand dewatering will be controlled around 30%, which can be reutilized. This method is the traditional coarse sand removing treatment method, while it has some problems during the practical operation, mainly spiral sand-water separator has poor grain sand-water separating effect less than 0.1mm, which increases the load of follow-up treatment unit, and increase slurry treatment amount and work volume.
Scheme II: adopt fine sand recovery processor. Pump provides high suspended matter wastewater to hydrocyclone, fine sand less than 0.035mm overfall through cyclone, water content of cyclone desilting through high power and efficiency dewater unit is about 20%, part of which can be recycled according to sandstone grading requirements. The device has been utilized widely in fine sand reclamation of sandstone processing plant both domestic and abroad, which has high economic benefit and environmental protection benefit.
Analysis from treatment effect, operation management, operating maintenance and project investment, as well as comprehensive analysis of environmental protection benefit, Scheme II has greater advantages than Scheme I. Scheme I can only guarantee the fine sand removal larger than 0.1mm; however, recovery of fine sand recovery processor for fine sand larger than 0.035mm can reach to 80%, which reduces to the maximum extent the follow-up sedimentation cleaning volume of work, and decrease greatly cleaning costsand settling basin of Scheme I is concrete placed in situ structure, which will be abandoned after the completion of the project complete equipment of Scheme II is convenient for arrangement, which will not need to pour concrete base and can be reused in other project, it can save

10.0 Environment Protection Measures & Techoeconomic Analysis
416
investing cost of the Ownerin addition, Scheme II has higher automation degree, no special person is required for the operation management during the using process, and very convenient for operating maintenance.
� Flocculating settling unit Flocculating settling unit of sandstone processing wastewater treatment is planned primarily the following two alternative schemes:
Scheme I: it is planned to design two groups of rectangle filter tank for use in turn, in order to ensure the effluent water quality, add in flocculant before entering into the filter tank, water seepage from filter tank will be recycled, slurry on the filtering material will be dehydrated naturally through evaporation, filtering, insulation and etc by utilizing time interval, excavate with excavator and transport to the nearby slag yard. This scheme has less civil works volume, no mechanical equipment with low construction cost and better effluent water quality, however, since the slurry adopts natural dehydrating method with higher water content, large cleaning working volume and high expenses, as well as troublesome management.
Scheme II: water out from the desilting unit into advection flocculating sedimentation basin after reactive precipitation, slurry in the basin bottom will be sent to sludge dewatering machine house with traveling pump suction type mud sucker and transport outward to the nearby slag yard. This method has higher mechanization degree, which is simple for operating management and better effluent water quality, water content of slurry after pressure filtration dehydration is about 30%, slurry moulding, slurry amount decrease, which is convenient for transport and reduce greatly transport expenses. However, it has machine maintenance problem with comparatively larger floor area.
On the basis of better effluent water quality, looking from investing expense, primary investment of Scheme I is less, while the filtering material and cleaning expenses during the operation process are higher, considering comprehensibly the two schemes are basically the same as for maintenance and management in the operation, soil discharging of Scheme I is not mechanical automation operation, which has large management volume of work, and management and maintenance for filtering material cleaning and desilting are complex. Considering reliability and practical management level of construction of hydraulic power plant, practical Scheme II is recommended, and especially to strengthen clear and transport of sludge and mechanical overhaul.
� Recommended scheme design
� Technological design See Figure 10.1 3 for wastewater treatment process of sandstone aggregate preparation system. Wastewater of sandstone processing plant flows from screening building into wastewater regulating reservoir, the pump provides wastewater with high suspended matter to fine sand recovery processor, reclaim fine sand larger than 0.035mmabout 80%, screening filtering water flows back into regulating reservoir, spill water flows automatically advection sedimentation basin, and then supernatant flows into reclamation system through flocculating settling, which will be used together with make up water for productive water of screening

10.0 Environment Protection Measures & Techoeconomic Analysis
417
building. Two groups of sedimentation basins will be used in turn, draw bottom mud out through mud sucker and pressure filtering with pressure filter, dehydration, pressure filtration water will flow automatically into regulating reservoir, transport mud cake to the nearby slag yard or backfill yard to excavate the base.
� Desilting treatment unit Fine sand recovery processor of the treatment unit is suggested to adopt complete equipment with mature technology, the equipment investment will be borne by the Owner, and indicate clearly in the bidding documents.

10.0 Environment Protection Measures & Techoeconomic Analysis
418
Figure 10.1 3 Process flow of wastewater and argillaceous silt treatment of sandstone material processing system
Makeup water
Reclamation system
Screening building
Regulating reservoir
Add flocculant
Fine sand recovery processor
Fine recovery processing
Flocculating settling basin
Slurry dewatering
Supernatant
Mud transport to slag yard
� Flocculating settling unit According to characteristics of high concentration of construction wastewater raw water, and simple construction management condition, the flocculating settling adopts advection sedimentation basin. After analysis of comparison and selection, flocculating settling unit of this stage adopts two grilles single basin advection sedimentation basin, which is planned for alternative use in case of overhaul and cleaning mud. Considering larger suspended matter concentration in the coming water, the silting is easy to become harden, we plan to adopt mud sucker for mud drainage.
Design flow speed of sedimentation basin is 8.3mm/s, residence time is 1.1h, surface load 2.26m/h, length of single grille sedimentation basin is 33m, effective depth 2.5m, net width of single grille 6.0m, total width of two grilles 13.2m(thickness of partition wall and side wall
10.0 Environment Protection Measures & Techoeconomic Analysis
419
are 0.4m), single grille operation, use alternatively. Since adopting mud sucker to remove mud, sedimentation basin can work continuously, which will be used in turn only in overhaul and stage mud cleaning.
Flocculant will select polyacrylamide (PAM), flocculation reaction basin may not be set. After flocculating settling, suspended fine particle less than 0.035mm in the wastewater will be removed further; SS after treatment can be kept below 70mg/L, which can be used circularly.
� Reclamation unit The reclamation system consists of high and low level basin and reclaimed water pump. Dimensions of high and low level basin are 7.0m (long) ×7.0m (wide) ×5.0m (high) and 8.5m (long) ×8.5m (wide) ×5.0m (high) respectively.
� Main equipments and monitoring instruments See Table 10.1 1 for main productive wastewater treatment equipments and monitoring instruments of a set of sandstone aggregate processing plant.
� Flushing wastewater treatment measures for sandstone aggregate preparation system
during the construction period
A set of productive wastewater treatment unit will be set respectively in right and left banks of the construction area of this project to collect and treat the flushing wastewater from sandstone aggregate precessing system, together 2 sets.

10.0 Environment Protection Measures & Techoeconomic Analysis
420
Table 10.1 1 Main equipments and monitoring instruments
Location Name of main equipments Quantity of main
equipments Main monitoring instruments
Raw water Open channel meter
Regulating reservoir Sand pump 2 sets(1 for operation
and 1 for standby)
Sand pump 2 sets(1 for operation
and 1 for standby) Sand-water separation
Fine sand recovery processor
1 set
Flocculating sedimentation basin
Traveling pump sucking type mud sucker
1 set Ultrasonic sludge level
Belt type pressure filter 2
Dosing pump 1
Liquor mixing tank 2
Sludge pump 2
Air compressor 1
Dehydrator machine room
Centralized control cabinet
1
Supernatant effluent reclamation system
Pump 2 sets(1 for operation
and 1 for standby) Flow meter, solid suspended
matter calcimeter
10.1.1.2 Flushing wastewater treatment measures for concrete mixing system
� General situation of wastewater
A set of 4×0.8m3 concrete mixing station and a set of 3XJ3-1.5 concrete mixing building will be set on both left and right banks of the project junction area. flushing wastewater of concrete mixing system is calculated on the basis of 0.5m3/times•tank, wastewater presents alkalinity pH value: 12 , SS discharging concentration is 50000mg/L.
� Treatment target Suspended matter concentration of sandstone wastewater after treatment is less than 70mg/L, pH value is controlled in 6 9.
� Treatment measures
According to characteristics of small quantity of concrete flushing wastewater and short flushing time, wastewater collection basins should be set on both left and right banks in the vicinity of mixing station with volume not less than one times of flushing wastewater volume, discharge flushing wastewater into the basin by utilizing shift changing time, and discharge till the next shift changing, and manual sand removal. See Table 10.1 2 for detailed dimensions of wastewater collection basin, and see Figure 10.1 4 for plan layout.
The flushing wastewater of mixing building will be discharged into a sedimentation basin (the other for standby) in every shift changing, add in flocculant and deposit for a shift and then discharge. Outlet of the basin should be flexible for the purpose of convenient for cleaning

10.0 Environment Protection Measures & Techoeconomic Analysis
421
and transport and adjusting water level. Change to use the standby basin after sludge of the sedimentation basin depositing for a certain degree. The original basin should be dried automatically, transport sludge for the treatment in slag yard after anhydration.
Table 10.1 2 Specification of wastewater collection basin
Item Specifications Remark
Sand settling
basin 5m�long�×1.5m�wide�×2m�high�
Built two grilles, one is for standby, advection
basin
Neutralized
sedimentation
basin
3m�long�×3m�wide�×2m�high� Build two partition walls in the basin, install pH
value calcimeter at outlet
�
�
�
Figure 10.1 4 Plan layout of wastewater treatment of concrete mixing system
Water in
Water out
Sand sedimentation basin
Neutralized sedimentation basin
Dosing
10.1.1.3 Foundation pit drainage treatment measures
� Design target Drainage and discharging standard of the project foundation pit will follow Integrated Wastewater Discharge StandardGB8978-1996 Grade one discharging standard, SS discharging concentration should be controlled under 70mg/L.
� Design scheme Drainage of the project foundation pit consists of mainly precipitation, water seepage, concrete pouring and maintenance water, excavation drainage of underground workshop, SS and pH are main pollutants. Additional treatment facilities will not be adopted for foundation

10.0 Environment Protection Measures & Techoeconomic Analysis
422
pit drainage, add in flocculant in the water catchment of foundation pit, draw out to discharge after drainage still deposit for 2h, regular manual cleaning for rest sludge, this method has better effect.
According to characteristics of small volume of foundation pit wastewater, high suspended matter concentration and water body presents alkalinity, as well as treatment experiences of foundation pit wastewater of other hydroelectric power projects, no additional treatment facilities will be adopted for foundation pit wastewater, add only flocculant into the foundation pit, draw out to discharge after drainage still deposit for 2h, regular manual cleaning for rest sludge. The discharging technical measures of foundation pit wastewater is rational and effective, economized, which can solve foundation pit water problem in the practical. See Figure 10.15 for scheme flow for wastewater treatment design flow of foundation pit.
Figure 10.1 5 Scheme flow for wastewater treatment design flow of foundation pit
Flocculant
Foundation pit
Clear liquid discharge
cleaning Cleaning sludge transport to slag yard
10.1.1.4 Oil wastewater treatment measures for overhaul system
� Design target Oil wastewater treatment of the project construction area will follow Integrated Wastewater Discharge StandardGB8978 96 Class II pollutants maximum discharge concentration grade one standard, petroleum treatment target is below 5mg/L.
� Treatment scheme Drainage ditch will be set respectively in the construction machinery parking area on both left and right banks of the project junction area construction area, under the inspection rack, collecting channel will be arranged around the maintenance station to collect mechanical cleaning wastewater in the drainage ditch. Steel plate will be set to separate the oil in the front end of collecting channel; thin plate weir overfall will be set at the outlet of collecting channel. Clean periodically waste oil gathered in front of steel plate, and clean sludge in the bottom.
See Figure 10.1 6 for wastewater collection and treatment flow of mechanical equipment curing. See Table 10.13 for specifications of collecting basin. Wastewater with oil will be discharged to the peripheral drainage system after deoiling and sedimentation.

10.0 Environment Protection Measures & Techoeconomic Analysis
423
Table 10.1 3 Specifications of collecting basin
Place Area (m2) Wastewater
amount (m3/d)
Residence
time (d)
Design
volume (m3) Specifications of collecting basin (m)
Parking
area 300 6 1 12 4m�long�×1.5m�wide�×2m�high�
Figure 10.1 6 Wastewater treatment flow of mechanical maintenance
Thin plate weir
Water out
Wastewater with oil
Thin plate weir
10.1.1.5 Domestic sewage treatment measures and economic and technical evaluation
� General situation of sewage Domestic sewage source of the project comes from domestic water and feces drainage during the construction period. Construction personnel in the construction peak will be 1900person/d, if the water consumption is 150L/(person ·d), calculate according to sewage discharge amount on the basis of 80% of water consumption, maximum discharge amount of domestic sewage will be 228m3/d. main pollution factors in sewage are COD and BOD5 if calculate the concentration on the basis of 300mg/L and 200mg/L respectively, discharge amount of COD, BOD5 will be 68.4Kg/d and 45.6Kg/d respectively.
� Treatment target
Domestic sewage in construction area after treatment should reach Integrated Wastewater Discharge Standard (GB8978-1996) Grade one standard BOD5, CODcr discharging concentration should be controlled under 20mg/L, 100mg/L respectively , drainage or used for irrigation locally.
� Scheme comparison and selection Scheme I: adopt septic tank. domestic sewage during the construction period will be drained through septic tank after primary treatment, this scheme has advantages of low construction
��� �
���

10.0 Environment Protection Measures & Techoeconomic Analysis
424
cost and low operating expenses, however, removal rate of pollutants is low, which is only suitable for project with smaller sewage volume and low requirements of discharging standard.
Scheme II: adopt complete domestic sewage treatment equipment. Since complete equipment has some advantages in technical index and economic index, it is more attractive in small sized domestic sewage treatment field.
As for this project, it has large volume of domestic wastewater, in order to reach the anticipated treatment effect and reduce domestic sewage of construction workers to the water quality of the project river segment, Scheme II is recommended.
Considering components and concentration of main pollutants in the sewage, we plan to adopt XHS corresponding domestic sewage complete treatment equipment. For selected XHS type sewage treatment complete equipment, under conditions of water in quality as BOD5�250mg/L CODcr�450mg/L SS�300mg/L, effluent water quality can be BOD5�20mg/L CODcr�60mg/L SS �50mg/L; and that can reach completely target value of domestic sewage treatment of the project.
� Process flow and explanation
See Figure 10.1 7 for process flow of XHS type sewage treatment complete equipment.
Figure 10.1 7 Process flow for XHS sewage treatment complete equipment
Sewage
Grate
Regulating basin
Sedimentation basin
Primary contact oxidation pond
Secondary contact oxidation pond
Return -sludge flow
Secondary sedimentation tank

10.0 Environment Protection Measures & Techoeconomic Analysis
425
Blower
Sedimentation basin
Disinfecting tank
Transport
Discharge
Primary sedimentation: used to deposit infusible suspended matter, adopt vertical slant pipe sedimentation basin, surface load 1.53.0m3/(m2.h), residence time 11.5h, and the deposited sludge will enter into the sludge sump with air stripping device.
Contact oxidation pond: sewage after primary sedimentation will flow automatically into the pond for biochemical treatment, the pond is divided into two stages, total residence time not less than 6h, hang clean filling or fill in multi-surface hollow ball, aerating apparatus is micro-pore aerator with gas water ratio as (1016): 1.
Secondary sedimentation tank: sewage will flow automatically into the secondary sedimentation tank after biochemical treatment, adopt vertical sedimentation basin, surface load is 0.9 1.2 m3/(m2·h), residence time is 1.5 2.0h, the part deposited sludge will be sent to sludge sump by air stripping device, and part return back to contact oxidation pond.
Sludge sump: primary sedimentation sludge and part sludge of the secondary sedimentation tank will be concentrated primarily here, water contents of sludge after concentration is less, which may be drawn out and transport the manure freely to the residents in the vicinity with dung-cart.
Blower house: 2 3 blowers (2 for standby), silencing equipment should be equipped at inlet and outlet on the ground or underground.
Power control cabinet: Power control cabinet is set in ground control room, which is equipped with PLC control system, and carries out control automatically on blower, pump and air stripping device, or controlled manually. Blower and pump standby equipment will switch automatically every 8 hours.
A set of complete treatment facility with be equipped each for living areas of left and right banks of the project junction construction area, altogether 2 sets.
10.1.1.6 Sewage treatment facilities of other construction points
Different wastewater of other construction points beyond the pivot area is strictly prohibited to directly drain into water body. Presently, most of local residents go out to work, there are many vacant houses there. We suggest that local residents’ houses be hired as construction camps with sewage to be treated by the existing facilities. For construction site with small wastewater amount and far away from the existing residence areas, septic tank or dry toilet shall be set for collection, after treated, it can be used as farmyard manure. It is strictly forbidden to directly drain into water body.
10.1.1.7 Oil sewage management measures for construction ship bottom
Average oil concentration of ship bottom oil sewage is 5000mg/l, if ship bottom oil sewage is

10.0 Environment Protection Measures & Techoeconomic Analysis
426
discharged directly without treatment, it will generate great impact to the water environment, and oil concentration after treatment should not be larger than 15mg/l.
According to relative regulations, ship bottom oil sewage must be discharged after reaching the standard through the treatment of oily water separator of the ship, discharge standard for petroleum products should not be larger than 15mg/l.
10.1.2 Operation period
10.1.2.1 Domestic sewage treatment measures for Management Department of Shihu Navigation And Power Junction Project
Calculate according to the staffs of project management department 129 persons, total domestic sewage discharge volume is 7062.75t/a. main pollution factors in the sewage are COD and BOD5, concentrations are 300mg/L, 200mg/L respectively, generating capacity of COD, BOD5 are 2118.83kg/a and 1412.55kg/a respectively. Discharge after reaching first grade discharge standard after adopting sewage treatment measures, COD, BOD5 discharge concentration are 100mg/L, 20mg/L respectively, and generating capacity are 706.28kg/a and 141.26kg/a respectively.
Adopt same complete domestic sewage treatment equipment with domestic sewage treatment measures during the construction period. One set of XHS corresponding model domestic sewage complete treatment equipment treatment capacity over 9007t/a, treating the sewage of the
project management department and ship sewage within the reservoir area and oil-contained bilge water
preheated by oil/water separatorwill be adopted. See Para.10.1.1.5 domestic sewage treatment measures and economic and technical evaluation for detailed proofs.
10.1.2.2 Ship sewage treatment measures for waterway of reservoir area
� Ship domestic sewage of waterway of reservoir area Ship domestic sewage discharge amount of reservoir area waterway in 2020, 2030 will be 1079.1t/a, 1333.1t/a respectively. Ship domestic sewage to discharge directly in to the waterway without treatment will generate pollution effect to the aquatic environment of reservoir area aquatic environment. Ship domestic sewage discharge in the waterway should be prohibited. Ship domestic sewage should be collected with domestic sewage collection device on the ship and sent to sewage receiving ship at upstream and downstream of the ship lock for paid reception, then sent to ashore sewage treatment unit equipped at the project management department for treatment by sewage receiving ship, and discharged after reaching Grade One standardCOD, BOD5 concentration reach 100mg/l, 20mg/l respectively stipulated in Integrated Wastewater Discharge Standard (GB8978-1996).
One workboat to be equipped for the project management department will be applied as sewage receiving ship.
� Ship bottom oil sewage of waterway of reservoir area Average oil concentration of ship bottom oil sewage is 5000mg/l, generating capacity of ship bottom oil sewage in reservoir area waterway in 2020, 2030 will be 393.4t/a, 611t/a

10.0 Environment Protection Measures & Techoeconomic Analysis
427
respectively. If ship bottom oil sewage discharges directly without treatment, it will generate great impact to the aquatic environment. Ship oil sewage discharge into the waterway should be prohibited. ship bottom oil sewage should be collected with oil sewage collection device on the ship and and sent to oil sewage sewage receiving ship at upstream and downstream of the ship lock for paid reception. One workboat to be equipped for the project management department will be applied as oil-contained wastewater receiving ship.
� Collection and treatment process and description of sewage and bilge oil-contained
wastewater of ships passing through the ship lock
Project Management Department will be equipped with a wastewater treatment station with land occupation area of 300m2 and a work boat (ship wastewater reception boat) jetty. The work boat (ship wastewater reception boat) jetty will be equipped with a ship sewage reception pipeline (DN80) and a bilge oil-contained wastewater collection pipeline (DN80). The wastewater treatment station will be equipped with a complete set of XHS type sewage treatment equipment (treatment capacity is over 9007t/a, it can receive and treat the sewage from the Project Management Department, ships within the reservoir area and pretreated bilge oil-contained wastewater by oil/water separator and with one 0.5t/h oil/water separator and a complete set of treatment unit as separation tank etc. The plan layout of the wastewater treatment station and oil-contained wastewater treatment process are shown in DRAWING NO.41. The treatment process of sewage and bilge oil-contained wastewater of ships passing through the ship lock is given in Drawing No.10-8.
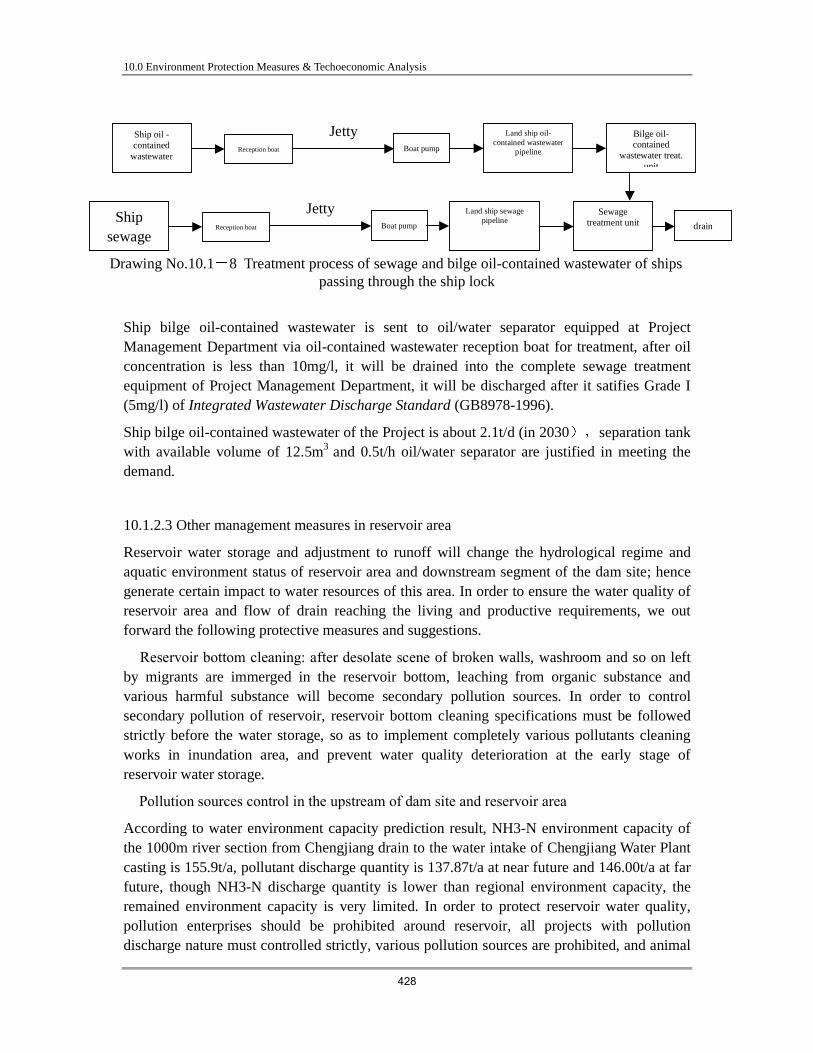
10.0 Environment Protection Measures & Techoeconomic Analysis
428
Drawing No.10.1 8 Treatment process of sewage and bilge oil-contained wastewater of ships passing through the ship lock
Ship bilge oil-contained wastewater is sent to oil/water separator equipped at Project Management Department via oil-contained wastewater reception boat for treatment, after oil concentration is less than 10mg/l, it will be drained into the complete sewage treatment equipment of Project Management Department, it will be discharged after it satifies Grade I (5mg/l) of Integrated Wastewater Discharge Standard (GB8978-1996).
Ship bilge oil-contained wastewater of the Project is about 2.1t/d (in 2030separation tank with available volume of 12.5m3 and 0.5t/h oil/water separator are justified in meeting the demand.
10.1.2.3 Other management measures in reservoir area
Reservoir water storage and adjustment to runoff will change the hydrological regime and aquatic environment status of reservoir area and downstream segment of the dam site; hence generate certain impact to water resources of this area. In order to ensure the water quality of reservoir area and flow of drain reaching the living and productive requirements, we out forward the following protective measures and suggestions.
� Reservoir bottom cleaning: after desolate scene of broken walls, washroom and so on left by migrants are immerged in the reservoir bottom, leaching from organic substance and various harmful substance will become secondary pollution sources. In order to control secondary pollution of reservoir, reservoir bottom cleaning specifications must be followed strictly before the water storage, so as to implement completely various pollutants cleaning works in inundation area, and prevent water quality deterioration at the early stage of reservoir water storage.
� Pollution sources control in the upstream of dam site and reservoir area
According to water environment capacity prediction result, NH3-N environment capacity of the 1000m river section from Chengjiang drain to the water intake of Chengjiang Water Plant casting is 155.9t/a, pollutant discharge quantity is 137.87t/a at near future and 146.00t/a at far future, though NH3-N discharge quantity is lower than regional environment capacity, the remained environment capacity is very limited. In order to protect reservoir water quality, pollution enterprises should be prohibited around reservoir, all projects with pollution discharge nature must controlled strictly, various pollution sources are prohibited, and animal
Ship oil - contained
wastewater Reception boat Boat pump
Land ship oil-contained wastewater
pipeline
Bilge oil-contained
wastewater treat. unit
Jetty
drain Ship
sewage Reception boat
Land ship sewage pipeline
Sewage treatment unit
Jetty Boat pump

10.0 Environment Protection Measures & Techoeconomic Analysis
429
and human excreta and rubbish are not allowed to discharge directly into the river. We suggest to perfect as soon as possible the sewage collection system and treatment facilities, as well as domestic waste handling facilities in the area, so as to reduce pollution due to discharge of sewage and rubbish on the water quality of reservoir area and avoid pollution effect to the water quality of reservoir area.
�. According to pollution characteristics of water quality at the early stage of water storage of similar built water conservancy project, at the first 5 days of water storage, suspended matter, organic substance, mineral substance and bacteria and malignant bacteria in the reservoir increased greatly. In order to guarantee the safety of water quality of water works in the reservoir area, monitoring frequency and monitoring density should be strengthened in water intake of water works and monitor in time the dynamic water quality of dinking water sources. In case of water quality deterioration, notice water works of Taihe County to strengthen the sterilization and purification treatment of tap water, so as to ensure the safety of drinking water for residents.
� 12 sign boards will be set for 3 water intakes of drinking water and water-source reserves, prompt passing ships to protect water sourcesremind passing ships to strengthen safety consciousnessprohibit ships to anchor in these areasprohibit ships overside transport in this water area prohibit ships to discharge all pollutants in this water area.
� Project Management Department will be equipped with auxiliary equipment, such as oil fence 800m , buoy, anchor, anchor rope and etc.; 2t oil absorption felt, one oil absorber and one work boat for oil fence laying and recovering spillover.
In order to protect the water quality of the reservoir area, especially water source protection areas, ship accidents must be avoided as possible through strict environment management, establishing relative system, perfecting equipment, improving personnel quality and establishing oil spillage emergency plan. Once risk accident occurs in the waterway, start immediately oil spillage emergency plan, adopt accident emergency measures, and mitigate and eliminate pollution impact of oil spillage accident on water quality of the water source protection areas.
Local government and local environment protection department shall strictly execute environment management, establish related systems and strengthen supervision and avoid emergency discharge from drains. Once risk accident occurs in the waterway, start immediately regional emergency plan, adopt accident emergency measures, and mitigate and eliminate pollution impact of oil spillage accident on water quality of the water source protection areas.
10.2 Ecological Environmental Protective Measures
10.2.1 Precautions
� In order to protect the vegetation and old trees of Tangzhou Town Zhujia Village County Level Small Natural ReserveJintan old trees community, set caution boards in project construction area, construction personnel is not allowed to stay in the non-construction area.

10.0 Environment Protection Measures & Techoeconomic Analysis
430
� Strengthen education on the construction personnel the ecology protection of construction area with bulletin, leaflets and brochures, and prohibit the construction personnel to prey on frogs, snakes, birds, animals, fishes in the Kan River through systems, advocate greatly not to prey on wildlife so as to refuse impact of the construction to the local terraneous animals and plants, and adopt effective measures to restrict the harm of rodent.
� Construction contractor during construction period should designate special person to be responsible for the patrol, monitoring on old trees, big trees and provincial level protected plants in the vicinity of the construction point, so as to prevent harm to old trees, big trees and protected plants due to construction activities or stealthily cut down trees. Adopt protective measures in time for valuable and rare animals and plants discovered in the construction.
� Combining with water storage plan and ecological habit of wildlife, set up corresponding protection plan, and avoid as possible the dormancy period of amphibian and reptile at the primary water storage stage of the power station.
�According to the investigation, the mating season of main fishes in Kan River is in April - July, hence, the underwater excavation works will be carried out as possible to avoid April - July.
�Prohibit the construction personnel to throw any wastes directly into the water body, especially poisonous harmful substances.
�Earth material yard will be excavated horizontally, surface soil will be stacked, cover the excavated surface with waterproof cloth in case of rain, after the borrow soil, cover soil for ecological recovery, recover to farmland if possible.
�Clear plants in all reservoir area before the water storage and transplant trees if possible. Cut trees that cannot transplant, and utilize all that can be utilized, burn that cannot be utilized and wood ash should be used as manure.
�Resume vegetation on the river shoal, stop reclaiming wasteland on river shoal in order to prevent bank landslide and collapse.
� After water retaining of the dam, most of the animals that previously reside around the river banks will migrate to other places quickly, while there will be some animals staying behind looking during the primary period of water impounding to see whether they can adapt to the new environment. In this period, it is necessary to organize people to patrol for protection so as to avoid any animal hunting in the chaos of the animals or excessive disturbing. This will help to retain more animals to live in the reservoir area.
10.2.2 Protective measures for old trees and big trees
There are 21 old trees should be protected in the project, including 20 Cinnamomum camphoras and 1 Cupressus funebris27 big trees should be protected, including 26 Cinnamomum camphoras and 1 Castanopsis sclerophylla. Protective measures for old trees and big trees include on the spot protective measures and transplanting protective measures. See 7.0 Special appraisal on impact to old trees for details.

10.0 Environment Protection Measures & Techoeconomic Analysis
431
10.2.3 Old trees protection measures and economic and technical evaluation
Old and large trees protection scheme is shown in Chapter 7.0.
10.2.4 Protective measures for Zhujia Village County Level Small Natural Reserve
Protective measures for Tangzhou Town Zhujia Village County Level Small Natural Reserve Jintan old trees include: Change embankment line direction and implement cement laid stone masonry slope protection on the riverbank and etc. See 7.0 Special appraisal on impact to old trees for details.
10.2.5 Protection Measures of Fishes and Spawning Sites and Technoeconomic Appraisal
Protection measures include �to build fishpass, �to construct fish proliferation and fry releasing station, � to construct substitute fish habitat, � to execute monitoring and study, � to strengthen fishery aministration etc. Details are shown in Chapter 8.0.
10.2.6 Reduction of project land occupation and basic farmland protection scheme
� To reduce inundation area of the reservoir area, the Project is to build five protection areas of Taihe County Seat, Wanhe, Yongchang, Yanxi and Zhangtang, altogether 2.687km2 land inundated area is reduced, and 1980Mu farmland inundated ares is reduced. Farmland elevating measure is taken to protect 1237Mu farmland of the shallow inundated area at the left bank of the tributary Yunting River and Mashi Township.
� Permanent and temporary acquisition of land will total 5725.9 mu of which permanent acquisition of land reaches 2977.3 mu including 198.27 mu of basic farmland temporary acquisition of land totals 2748.6 mu which will create some influence to agricultural activities. Permanent acquisition of land will involve only 1.18 of gross arable land (251295 mu), thus very limited in impact. By way of lifting the field and re-vegetation of temporary acquisition of land, crop loss may be compensated to some degree. Of the permanent acquisition of land, 198.27 mu is of basic farmland which shall be under acquisition in line with Laws of Protection of Basic Farmland.
� Temporary acquisition of land for construction encampment and auxiliary enterprises totals 532.05mu consisting of paddy fields (37.2mu)dry land (218.1mu) and woodland (122.4 mu). For the sake of protection arable land, especially of paddy fields, there shall be proper adjustment of workyard on the left bank, to try to avoid temporary acquisition of 37.2 mu of paddy fields.
� Land is an irregenerative resource, agricultural utilization value of land can not be replacedby other land use. Therefore, attentions shall be paid on earthwork longitudinal balance during design and construction to minimize quantities of borrow or spoil and to minimize land occupation. Borrow pit or spoil site are not allowed to be located at basical farmland protection area; Borrow pit or spoil site are prohibited to be located at Jintan Old Woods; Spoils are prohibited to dump at inner side of earth bank along the river way or below

10.0 Environment Protection Measures & Techoeconomic Analysis
432
maximum level. Borrow pits shall be located at open forest land and brush land as many as possible to avoid farmland, and borrow pits shall be located at higher land, the borrow depth shall be decided as per the landform condition, the borrowed pit shall be kept basically flush with the surrounding land surface, without pit formed and resume its original ecological condition; Hummock wasteland shall be reasonably applied as spoil sites to minimize farmland occupation. For spoil site which can resume second plowing, peel and return surface soil and resume second plowing; For spoil site which can not resume second plowing, engineering protection and vegetation protection measures shall be considered to resume the vegetation of woodland and brush land occupied by spoil.
The project plans to have 17 borrow pits, to cover an area of 2391.9 mu (159.46hm2), of which dry land totals 283.65mu. To minimize farmland to be occupied by borrow pits, as per the concentrated borrow principle, this EIA suggests that Huangkeng Borrow Pit and Zoukeng Borrow Pit be combined, Zoukeng Borrow Pit be cancelled; Futang Borrow Pit be cancelled to be merged into Lianhuatang Borrow Pit; Wanhe Borrow Pit be cancelled to be merged into Chenjia Borrow Pit; Bainigang Borrow Pit, Lijia Borrow Pit and Tianhong Borrow Pit be cancelled to be merged into Shihutang Borrow Pit. After the above adjustment, altogether 11 borrow pits are set with occupied dry land of about 77.4Mu (5.16hm2) reduced.
There will be 38 construction spoil sites in this Project, to cover an area of 117.61hm2. There will be 4 such spoil sites on the left and right banks of the Project, whose terraces are flat. The spoil sites belong to flat land and valley, occupying some dry land. In order to protect farmland, especially paddy field, it is suggested that spoil site 1# at the left bank of the pivot area be properly adjusted to keep away from 13.95Mu paddy field to be temporarily occupied. Temporary occupied land area of the embankment work and drainage work is 1564.35Mu, including 369.75Mu farmland (dry land), with a bigger farmland (dry land) area occupation.To minimize farmland occupation by spoil sites, as per the concentrated dumping principle, this EIA suggests that 22 spoil sites be cancelled, their spoil quantity be merged into the nearby spoil sites. After the above adjustment, altogether 16 spoil sites are set with occupied dry land of about 359.25Mu (23.95hm2) reduced.
� At engineering design stage, land to be occupied by temporary work as construction camp, construction access road, stockyard and blending station etc. shall be minimized, especially farmland. The existing houses and yards at both sides of the embankment line shall be utilized as possible.
� Soil plow layer protection design
Before entering the sites for levee construction, borrow pits and spoil sites and temporary construction sites etc., the plow layer soil with fertility of the surface layer of the above-mentioned sites shall be protected to facilitate the greening and vegetation resumption of the sites at later stage of construction. At excavation and site cleanup, mellow soil at surface layer shall be peeled off and temporarily stacked when vegetation at land surface is cleared.
Peeling, stacking and protection work shall be put forward or detailed in the design documentas per the aforesaid principle, and corresponding environment protection requirements shall be put forward for construction.

10.0 Environment Protection Measures & Techoeconomic Analysis
433
� Measures to resume and save farmland
In the principle of being convenient for construction, construction camps shall be arranged for different subprojects, local residents’ houses nearby will be hired as construction camps to minimize area of temporarily occupied land.
10.3 Water and soil conservation scheme
10.3.1 Control target of soil erosion
� Rational arrangement of control measures for water and soil conservation can not only bring the original soil erosion of the project construction under control, but also bring the newly increased soil erosion under effective control, and control the soil erosion intensity within the targeted value. The control target should reach the following six comprehensive target value, that will be the control index of the scheme, as well as the standard value of final acceptance of water and soil conservation, see Table 10.3 1 for detailed quantization control target.
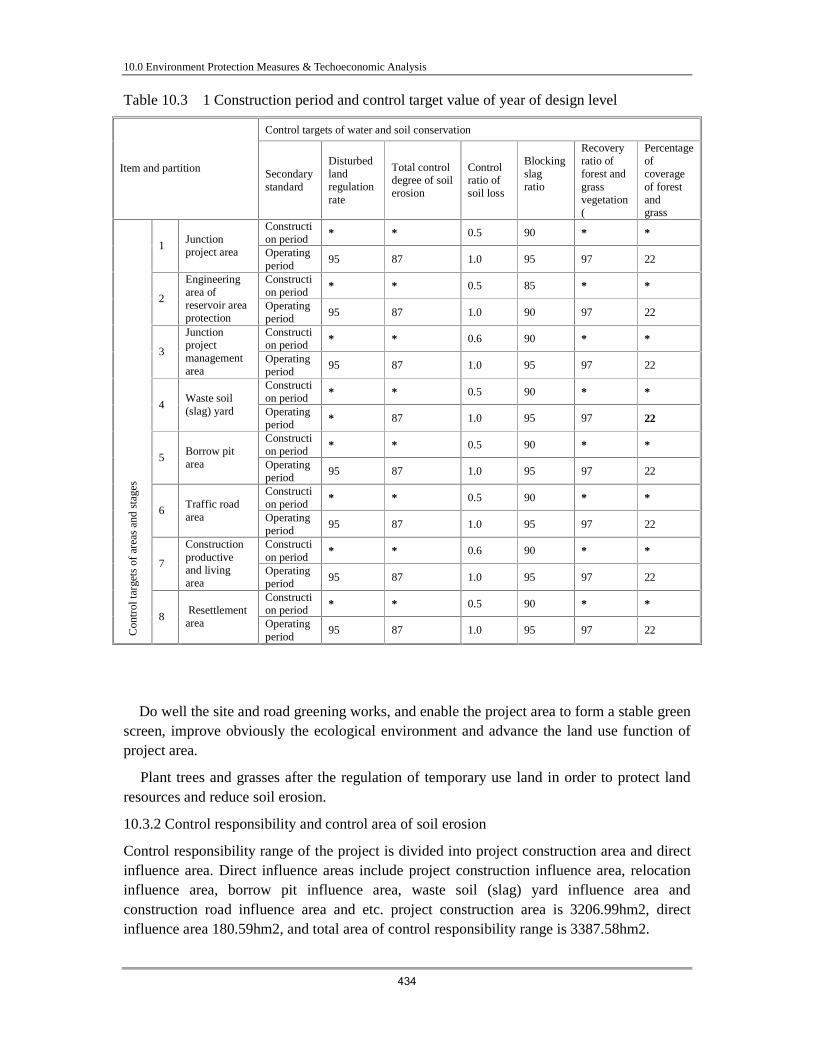
10.0 Environment Protection Measures & Techoeconomic Analysis
434
Table 10.3 1 Construction period and control target value of year of design level
Control targets of water and soil conservation
Item and partition Secondary standard
Disturbed land regulation rate���
Total control degree of soil erosion���
Control ratio of soil loss
Blocking slag ratio���
Recovery ratio of forest and grass vegetation (��
Percentage of coverage of forest and grass���
Construction period * * 0.5 90 * *
1 Junction project area Operating
period 95 87 1.0 95 97 22
Construction period * * 0.5 85 * *
2
Engineering area of reservoir area protection
Operating period
95 87 1.0 90 97 22
Construction period * * 0.6 90 * *
3
Junction project management area
Operating period
95 87 1.0 95 97 22
Construction period * * 0.5 90 * *
4 Waste soil (slag) yard Operating
period * 87 1.0 95 97 22
Construction period * * 0.5 90 * *
5 Borrow pit area Operating
period 95 87 1.0 95 97 22
Construction period * * 0.5 90 * *
6 Traffic road area Operating
period 95 87 1.0 95 97 22
Construction period
* * 0.6 90 * * 7
Construction productive and living area
Operating period
95 87 1.0 95 97 22
Construction period * * 0.5 90 * *
Con
trol
targ
ets
of a
reas
and
sta
ges
8 Resettlement area Operating
period 95 87 1.0 95 97 22
� Do well the site and road greening works, and enable the project area to form a stable green screen, improve obviously the ecological environment and advance the land use function of project area.
� Plant trees and grasses after the regulation of temporary use land in order to protect land resources and reduce soil erosion.
10.3.2 Control responsibility and control area of soil erosion
Control responsibility range of the project is divided into project construction area and direct influence area. Direct influence areas include project construction influence area, relocation influence area, borrow pit influence area, waste soil (slag) yard influence area and construction road influence area and etc. project construction area is 3206.99hm2, direct influence area 180.59hm2, and total area of control responsibility range is 3387.58hm2.

10.0 Environment Protection Measures & Techoeconomic Analysis
435
According to the characters of construction and land occupation, the control area is divided into junction project control area, protection works control area of reservoir, junction project management area, construction productive and living control area, soil and rocks yard control area, waste soil (slag) yard control area, traffic road control area and resettlement area and etc. see Table 10.3 2 for details.
Table 10.3 2 Soil erosion control area and responsibil i ty range
Partition Sub-item Area (hm2) Boundary condition
Junction project area 28.33 Project management range
Protection works control area of reservoir
258.53 Project management range
Project management area 3.33 Project management range
Traffic road area 30.53 Actual land occupation
Construction productive and living area
64.20 Actual land occupation
Soil and rocks yard area 159.46 Actual land occupation
Waste soil (slag) yard area 117.60 Actual land occupation
Reservoir inundation area 2544.81 Actual land occupation
Project construction area
Sub-total 3206.99
Resettlement area 87.68 Actual land occupation
Borrow pit influence area 0.56 Possible influence range
Waste soil�slag�yard influence area
28.50 Possible influence range
Construction road influence area
12.45 Possible influence range
Influence area around reservoir 51.10 Possible influence range
Flood diversion and drain influence area in bank and slope of lower reaches
0.30 Possible influence range
Direct influence area
Subtotal 180.59
Control responsibility range 3387.58
10.3.3 Control measures for soil erosion
� Junction project control area The slope protection measures and plants protection measures of the control area have been involved in the main part of the project design, which forms a temporary retaining wall close to the side of the reservoir, so as to prevent excavated and stacked earthwork entering into the water body. Temporary drainage ditch should be set in the construction area, and set up simple retaining wall or baffle around and cover with waterproof cloth when the excavated cover layer and stones stacking temporarily.
� Protection works control area of reservoir The slope protection measures and plants protection measures of the control area have been

10.0 Environment Protection Measures & Techoeconomic Analysis
436
involved in the main part of the project design, the soil slope temporary coverage during the construction period has not been considered in the current design stage, which will be considered in the soil and water conservation scheme, stackwaste soil in the construction area should be temporarily protected and covered.
� Project management area
Greening and beautifying area provide a fine office and living environment.
�Soil and rocks yard control area
During the construction period, do well the water damming and drainage work in the material yard, strip off temporary protection of surface soil, and reduce soil erosion during the construction period. After the completion of the construction, implement site regulation and covering soil greening. Most sand and pebble materials are located in the river shoal, which mainly explore underwater, waste sand treatment is required to back fill the pit the leveling. Drainage measures of borrow pit, plant protection measures and temporary protection measures will be increased in the soil and water conservation scheme.
� Waste soil (slag) yard control area
Since storage and waste soil (slag) yard is a loose congeries, it has uneven sedimentation phenomenon; rainwater is easy to be infiltrated, which may become the source of landslide or debris flow with serious water erosion. However, combining with project measures and plant measures for this area, pay attention to the stability of slag yard. measures design has not be involved in the main body design for the waste soil (slag) yard, drainage facilities and waste slag obstructing design, plant protection measures, temporary protection measures and construction management measures have been increased in the soil and water conservation scheme.
� Construction road control area
Construction roads include main trunk road in the site, secondary trunk road and branch roads. Plant roadside trees for greening along trunk road and secondary trunk permanent roads, for construction temporary branch roads, adopt planting measures after the completion of the construction. Protection of construction temporary road, drainage measures and vegetation recovery will be involved in the soil and water conservation scheme.
� Construction productive and living control area It includes mainly sandstone material processing and concrete mixing system, construction living base camp and land occupied by construction auxiliary enterprises. The main task is to pay attention to the drainage problem of peripheral area of the construction site, site stripping surface soil protection measures, after the completion of the construction and removal of temporary facilities, improve the occupied and pressed and damaged earth’s surface to resume the land use function.
� Resettlement area
The local government will be responsible for the resettlement work. The water and soil conservation expenses of resettlement area are involved in the resettlement expenses, which

10.0 Environment Protection Measures & Techoeconomic Analysis
437
will be implemented by relevant personnel or unit of the local government. The water and soil conservation scheme is mainly greening the resettlement area (point), elevate the farmland and strip off protection of farming soil, raise the slope protection and etc.
See Table 10.3 3 for newly increased work volume of water and soil conservation scheme of the project. See Figure 42 for general layout of soil erosion control measures.
10.3.4 Schedule arrangement of soil erosion control measures
The working schedule of water and soil conservation is based on the construction progress of main part of the project. The water and soil conservation project will start in January 2008 and complete in June 2012 with a construction period of 54 months.
Protection of construction road and construction productive living area, as well as drainage works should be completed during the main part of the project “Three connections and one leveling”, drainage works should be completed before the borrow soil of borrow pit control area, and other protection works vegetation protection should be completed after the borrow soil as soon as possible. Waste soil (slag) yard control area should be completed before the completion of obstruction and drainage measures of waste slag, and carry out vegetation recovery and second ploughing after the completion of waste soil. Land regulation will be implemented first, plant measures can be arranged later. The corresponding water and soil conservation works should be completed basically at the completion of each bidding section of main part of the project The rest work volume of water and soil conservation measures should be completed at the completion of the project.
10.3.5 Guarantee measures of scheme implementation
� Organization leading and management measures
The project management department will set up the implementation management organ for water and soil conservation scheme. Special personnel will be in charge of the organization, management and implementation of water and soil conservation work, and contact with the local water and soil conservation department, receive consciousness the supervision inspection of local water administration department. Coordinate the relations between water and soil conservation scheme and main part of the project, lead uniformly and regulate the construction. Establish scheme implementing target responsibility system, establish scheme implementation, check, acceptance method and requirements, establish scheme implementation self-inspection group, and organize the construction strictly according to the design requirements and standard. During the project tendering and bidding process, bring the water and soil conservation requirements into the tendering and bidding documents, indicate clearly the soil erosion control responsibility of the contractor and ensure various water and soil conservation facilities to satisfy the design standard and quality.

10.0 Environment Protection Measures & Techoeconomic Analysis
438
Table 10.3 3 Newly increased work volume of Shihutang water and soil conservation scheme
No. Unit works Unit Junction project area
Protection project area
Junction management area
Construction productive living area
Traffic road area
Soil and rocks material yard area
Waste soil �slag�yard
Total
I Project measures
1 Strip off surface soil ×104m3 32.54 32.54
2 Earthwork�surface soil�backfill
×104m3 7.95 12.41 32.54 52.95
3 Land leveling hm2 1.17 18.51 13.71 15.62 86.58 135.59
4 Earthwork of drainage ditch
×104m3 0.17 1.5 0.18 0.68 2.53
5 Drainage�catch�drain of M7.5 cement laid stone masonry
×104m3 0.38 0.38
6 Earthwork of settling basin
×104m3 0.17 0.01 0.18
7 Cement laid stone masonry of settling basin
×104m3 231.2 231.2
10 Retaining wall of M7.5cement laid stone masonry
10000m3
0.075 0.85 0.93
II Plant measures
1 Area of landscaping hm2 1.17 1.17
Total landscaping tree planting
Tree 23000 23000
Arbor Tree 600 600
Bushes Tree 22400 22400
Lay and plant turf hm2 1.12 0.06 1.18

10.0 Environment Protection Measures & Techoeconomic Analysis
439
To be continued Table 10.3 1 Newly increased work volume of Shihutang water and soil conservation scheme
No. Unit works Unit Junction project area
Protection project area
Junction management area
Construction productive living area
Traffic road area
Soil and rocks material yard area
Waste soil �slag�yard
Total
2 Forest and grass area of water and soil conservation
hm2 61.38 18.51 13.71 15.62 86.58 195.80
Total tree planting Tree 61700 70692 52078 288595 473065
Needle leaf arbor Tree 0
Broadleaf arbor Tree 30850 2000 26039 72149 131038
Gardenia yellow Tree 26039 26039
Amorpha Tree 30850 68550 216446 315846
Grass planting hm2 61.38 18.51 15.37 15.62 86.58 197.46
III Temporary protection measures
1 Retaining wall of earth bag
m3 500 11200 936 1075.00 3346.68 5993 24051
2 Waterproof cloth coverage
m2 4000 3000 16000 23000
3 Temporary grass planting
hm2 1.97 2.65 4.08 10.85 19.55

10.0 Environment Protection Measures & Techoeconomic Analysis
440
� Technical guarantee measures As for water and soil conservation scheme, the design work of relative stage should be carried out. After the inspection of water and soil conservation scheme is passed, the Owner should implement seriously the design contents of water and soil conservation scheme approved by department of water administration in accordance with the current project design progress, entrust the engineering design contractor with qualification should start the construction drawing design work of water and soil conservation of the project as soon as possible. Ask the opinion of water administration department during the design examination, the approved water and soil conservation scheme report should be sent to the competent authorities for file. During the implementation of water and soil conservation scheme, if any larger changes in project position and project quantity, report for approval according to the regulations, and report to department of water administration for file.
10.4 Protective Measures of Ambient Air The project impact to ambient air mainly occurs in construction periodWater power generation utilizes production process engineering of water power resources to generate energy sources, environment atmosphere pollutants discharged by the project operation itself is limited.
Control measures of environment atmosphere pollution during the construction period are:
� One water sprinkler will be used at the left and right bank of the dam site construction area and at the farmland elevating area respectively to regularly spray water to reduce dust every non-rainy day to reduce dust impact time and scope.
� At pump station and protection embankment, along the line of guide drainage canal borrow pits, spoil sites project field elevating areaconcentrated resettlement point construction temporary road and the existing roads to be used, regularly spray water to reduce dust every non-rainy day to reduce dust impact time and scope.
� In order to reduce the dust impact on the health of working personnel and construction personnel of construction site, transport of construction materials should adopt as possible the coverage and closed form.
� Implement individual protection to the construction personnel. The main objects affected by project atmosphere pollution are the construction personnel, individual protection should be adopted for the construction personnel, such as wearing anti-dust respirator and etc.
� Sandstone aggregate processing should adopt low dust technology, dedusting devices should be equipped in primary crushing, pre-screening, main screening, medium and fine crushing workshop in order to control dust pollution.
� Concrete will be produced within closed mixing building with dust collector to control concrete mixing dust.
� Follow strictly Discard Standard for Vehicles In-Use, execute compulsory update and discard system, update timely old vehicles that have more fuel consumption of engine with low efficiency and serious tail gas discharge.

10.0 Environment Protection Measures & Techoeconomic Analysis
441
� Construction road repair, maintenance and cleanup team shall be established to timely cleanup road surface droppings and to keep road clean and in good condition.
10.5 Protective measures for acoustic environment
10.5.1 Protective measures for acoustic environment during the construction period
� Select low noise equipment and technology in order to reduce source intensity
� Strengthen maintenance of equipment, keep the machine lubricated in order to reduce operating noise.
� Mechanical equipment with large vibration should adopt vibration reduction machine base to reduce noise
� Workshops, such as crusher, sand maker, screening building, mixing building, air compressor, refrigerating compressor and etc should adopt as many as possible porous sound absorbing material to set up noise barrier, acoustic enclosure and acoustic booth.
� Main affected object of the project construction noise is construction personnel in the site, individual protection measures should be adopted, such as earplug, ear protector, noise proof helmet and etc.
� Strictly organize and control construction time, avoid night construction of machines with high noise. The project construction time should be controlled as possible during 8: 0012: 00 in the morning and 14: 0020: 00 in the afternoon.
�Transport vehicle may cause noise standard-exceeding impact to residential area along two sides of transport line, restrict strictly vehicle speed and vehicle flow rate within unit time during the transport process, reduce the vehicle speed when vehicle passing through towns and cities and concentrated residential, in order to reduce disturbance to the residents in the city and no horn is allowed.
� Sign boards should be set on the road of villages near the dam site, such as Shihutang Village, Sangyuan Elementary School, Jiangjiazhou Village, Lingbei Village and Xiayinxia Village, indicate: speed per hour less than 20km/h, no horn. There are altogether 8 sign boards.
� Protection embankment, construction point of guide drain ditch should be within 100m from the concentrated residential point along the line, no night22: 00 6: 00 construction is allowed.
� If there is concentrated residential point 30m along the construction road sides, avoid night 22: 00 6: 00 transport.
10.5.2 Protective measures for acoustic environment during the operating period
� According to Standard of Environmental Noise of Urban Area (GB3096-93), maximum value of night sudden noise should not exceed standard value 15dB, while the ship horn

10.0 Environment Protection Measures & Techoeconomic Analysis
442
instantaneous noise usually is over 100dB. “No horning” sign board should be set in the middle and lower reaches of the section of Taihe County Seat, approach channel upstream and downstream of ship lock at the dam separately, and altogether 4 sign boards.
� Noise of slurry carrier is usually the serious noise pollution sources in the waterway. Relevant management department should strengthen management on the ships, ships with their noises that can not satisfy the requirements shall be prohibited to enter the waterway to carry out transport activities, so as to reduce as possible impacts from the ship traffic noise on the normal production and living of residents along the waterway.
10.6 Environmental protection plan for resettlement works in the reservoir area
10.6.1 Environmental protection plan for resettlement
According to existing main environment problems in the resettlement area, we put forward relative and practical environmental protective measures, so as to reduce unfavorable impacts to ecology and environment due to resettlement, and integrate organically resettlement and protection and regulation of ecology and environment, bring comprehensive benefit of the project into full plat in order to create favorable environment for migration resettlement, and enable the migration to reach the target of living and working in peace and contentment.
� Domestic sewage treatment measures for rural resettler New site for resettling area should be selected for immerged area of reservoir, there are many residents in these area and spread sporadically, domestic sewage generated must be treated to the standard on the basis of households, domestic sewage discharge of residents will adopt anaerobic pool for the treatment, and combining to develop methane, we decide primarily to set 1 about 4m3 anaerobic methane pool per household. For those inconvenient to develop methane, encourage them to build a septic tank for every household. And subsidy 1000 yuan will be paid per pool.
Human-animal sewage discharged by residential household will enter the anaerobic pool to carry out anaerobic ferment, methane generated can be taken as residential living fuel, waste slag and wastewater after ferment treatment will be clearer, waste slag generated can be as agricultural manure, while small amount of wastewater also can be discharged into farmland for irrigation. By this way, it avoids effectively the impact of domestic sewage in rural resettlement areas to the aquatic environment, and increased precious energy and manure for the rural resellers.
� Treatment measures for solid waste Every household must select well the rubbish stacking position to avoid pollution, at the same time, according to the rural rubbish components, rubbish should be burnt and waterlogged compost as possible.
� Environmental protection of resettling public infrastructure
Migrants in the immerged area of reservoir will adopt moving arrangement at the back of
10.0 Environment Protection Measures & Techoeconomic Analysis
443
former address, or moving to another place, the construction of public infrastructure for migration residential area must combine with environmental protection, and adopt some measures to protect the environment.
� Migration residential area should be far from the industrial and mining enterprises, select areas that locate in the upper drift and upper reaches of the industrial and mining enterprises, so as to avoid impact by waste gas and wastewater.
� When arranging the migrants, utilize fully waste mountain and barren slope, and reduce as possible forest land or farmland for building of houses in principle, which should be arranged in hillside area with better geological conditions, do well the water and soil conservation, set drainage ditch on the upper part of excavation surface in order to reduce flushing and protect the safety of residentsExcavation waste soil should be backfilled as soon as possible and plant trees and grass in order to prevent soil erosion.
� Migration residential area shall be matched with new roads, drainage facilities and etc., reduce as possible damages to landforms and vegetation. After the completion of the project, excavation surface and bared land should plant trees and grass to restore the landscape.
� Pay special attention to animal houses in residential area, such as hogcate, bullpen and etc., wastewater and domestic sewage discharged should be concentrated in the pool for treatment, which should not flow at random in order to prevent environment pollution.
� House arrangement of residential point should be planned, which is favorable to reduce land use and natural lighting. Living and drinking water should adopt tap water method as possible for the convenience of migrants.
� Since some migrants in the reservoir area will move to another places, the resettlers will generate impact to the local residents. In order to do well the coordinating measures, reduce as possible impact of reconstruction of residential point to the local natural environment and social environment. To provide benefit from the reconstruction for the local residential point in the design should be considered, as well as improve their living environment and enable the resettling area to develop healthy and last stability and durable peace.
� Residential area should have greening plan, and increase the forest and grass coverage gradually to over 30 , plant trees around the house and village, promote ecological courtyard. Selection of tree species should be decided by the villagers; it should beautify the environment and increase income as the same time.
� Protective measures for public health
� During the resettlement of migration, strengthen the supervision on migration capitals, master the living situation of migration, and do well the water quality monitoring work on the living water of migrants.
� Hygiene and disease control measures
Strengthen patriotic health education, mobilize people to participate large scale of killing mouse and mosquito, level the ditches water accumulation belt, and eliminate disease infectious vector from the beginning.
Before the water storage of reservoir, clean thoroughly pollution sources of reservoir bottom,

10.0 Environment Protection Measures & Techoeconomic Analysis
444
pollutants, clear other sundries, prevent new disease sources due to water body spreading strictly in accordance with the requirements of Method on Reservoir Bottom Cleaning.
Do well the health care work in resettlement area. For migrants adopting moving arrangement at the back of former address, the residential houses must be planned uniformly, select places with fine ventilation and natural conditions, human and animal live apart, construct supporting public facilities, and carry out regular disinfection, do well the planned disinfection for drinking water sources and stop drinking unclear water sources. Make thorough physical examination for resettlers, as well as corresponding examination on people in the resettlement place, so as to prevent strictly infection of migrants by infectious disease sources.
� Epidemic situation monitoring and management
Since the immersion involves a large scale, hygiene and disease control monitoring organization must be established, after the completion of reservoir, establish epidemic prevention division, which is subordinate to the project monitoring center, carry out sampling investigation on the health of people in the reservoir area, pay close attention to the dynamic health of people, cooperate closely with relative professional department, and prevent strictly the occurrence and spreading of communicable disease.
� Fisherfolk compensation measures According to the site interview result of this resettlement report of the project, there are 7 professional fishing boats in the river section between the Shihutang dam site and upstream Taihe Pivot (listed in the compensation scope of this project), in addition there are a small amount of non-professional fishing boats. Those affected fisherfolks will be compensated for resettlement as per the state latest compensation standard.
10.6.2 Water and soil conservation plan for resettlement
Soil erosion resulted in migrant relocation mainly includes two aspects, namely productive development and foundation implementing construction in the resettlement area.
10.6.2.1 Soil erosion impact analysis
The project migrant resettlement adopts moving arrangement at the back of former address and part concentrated arrangement, production arrangement mainly adopting farmland adjustment, and avoid large excavations, which is favorable for the water and soil conservation however, the construction of residential building and construction of special facilities, such as field lift and so on, have changed the original land utilization method during the construction process, which has caused damage to the local vegetation, generate soil erosion, like surface erosion, gully erosion, gravity erosion and etc., corresponding protection measures and regulating measures must be adopted; otherwise, the generated soil erosion affects not only the ecological environment in the resettlement area, but also the peripheral agricultural production.
Soil Table 10.6 1 for detailed erosion impact analysis.

10.0 Environment Protection Measures & Techoeconomic Analysis
445
Table 10.6 1 Soil erosion impact analysis of resettlement area
Single works Soil erosion impact analysis
Soil loss in the village, no drainage facilities both in and out of the village, surface runoff with mud and sand flows to the low area in the village in the rain, slope excavation in the arrangement area, it is easy to be flushed and form gulley erosion.
Drainage water way out of village. residential point set on the upper part of the slope, since there is no way out drainage channel, rainwater and mud and sand in the village flush to the farmland outside the village, which causes damage to agricultural crop, or flush to the nearby village, and cause unnecessary contradictions.
Rainwater flows into the courtyard, landform of some residential points are low; there is no drainage facilities in the village, rainwater in the heavy rain will flow into the courtyard.
Resettlement area point
Affected by drain from the upper reaches, residential point that constructed in the lower part of large area slope, rainwater from the upper part will flush into the in rainstorm, which will cause impact to the production and living conditions of the people.
Field elevating Slope of excavation and fill exposed, excavated slope espoused, surface farmland is stripped off to stack, that is easy to be flushed and cause serious soil erosion.
10.6.2.2 Soil erosion control responsibility
The project soil erosion control responsibility includes requisition, permanent, temporary occupation and area. Soil erosion control responsibility in resettlement area includes rural resettlement areapoint 5.21hm2 and field lift 82.47hm2, altogether 87.68hm2.
10.6.2.3 Water and soil conservation measures
� Water and soil conservation measures of rural resettlement area (point)
Relative measures of main part of the project has controlled basically soil erosion, considering plant measures of new rural residential site, the measures will adopt plant measures for bare slope in front and back of the house and site, the area adopted control measures is 5.21hm2.
soil erosion is most serious in the “Three connections and one leveling” stage of construction period of migration new village, the leveling of new site in the stage will damage the original surface, the surface is bare, rainfall may cause soil erosion.
When there is larger catchments area in resettlement area in the upper reaches, build flood control drainage ditch in resettlement area in the upper reaches in order to prevent flood flushing the bare surface during the construction period and safety of the resettlement area. Resettlement area will be arranged in the slope of upper reaches, build catch basin at the slope foot, so as to prevent mud and sand silting in the farmland furrows of lower reaches. Drainage direction inside and outside of the resettlement area will not affect the farmland furrows of lower reaches and flushing to the villages in lower reaches.
Utilize fully the land, according to the principle of “the most suitable tree for the most proper site”, combining with the local conditions, and considering the local economic benefit and ecological efficiency, we suggest to plant economic tree species: mandarin orange, broadcast

10.0 Environment Protection Measures & Techoeconomic Analysis
446
sowing pasture with better economic benefit.
Adopt slope protection measures of stone masonry and grass planting for excavation surface of the site slope in resettlement area (point). The slope protection area is 0.74hm2. Slope protection work volume: work volume of cement laid stone masonry is 330m3, grass planting area in the gridiron is 0.37hm2.
� Field lift protection measures Field lift is 82.47hm2, field lift by sections, and strip off agricultural soil, pay attention to strengthen the protection of agricultural soil.
Temporary protection measures for agricultural soil stacking: in order to protect and utilize fully the reproducible land resources, before the field lift, strip off the cultivated layer and stack at other site, so as to backfill and second ploughing after the completion of construction. Set corresponding surface soil temporary stacking area in every site with a height about 3m, stacking slope ratio will be controlled in about 1: 1.5, in order to avoid soil erosion during the surface soil stacking period, temporary breast wall built with polywoven bag with soil will be constructed around the slope foot of soil stack, soil texture drainage ditch will be set around, drainage ditch dimension: 0.3upper bottom ×0.3 lower bottom ×0.6m depth Cover waterproof cloth or grass on the stacked surface soil for temporary protection. After the completion of field lift, adopt stone masonry and lay turf for newly formed slope to control soil erosion.
Lay turf about 0.8hm2, stone masonry 500m3, temporary breast wall about 346m3, waterproof cloth 6000m2. Excavation of temporary drainage ditch earthwork 156m3.
10.6.3 Reservoir bottom cleaning
10.6.3.1 Reservoir bottom cleaning scope
Reservoir bottom cleaning consists of general cleaning and special cleaning. Scope and contents of general cleaning includes removal and cleaning of various buildings and structures under residential migration level forest cut-down below reservoir normal water storage level, site cleaning and hygiene and disease control cleaning residues (such as pile, stone tablet, pole) of large buildings and structures under 2m from normal water storage level to dead water level (including dead water level) and forest land cleaning and etc. scope of special cleaning is within the area of each department and special facilities of each unit, which will be cleaned according to the requirements of the departments.
10.6.3.2 Structures cleaning
� Houses and accessory structures within the cleaning scope should be removed, fences, walls and chimneys should be push down and levelled, wastes that cannot be utilized and easy to float will be transported outside the reservoir or burnt on the spot.
�Ground structures and its auxiliary facilities of road, power supply, telecom, industrial and

10.0 Environment Protection Measures & Techoeconomic Analysis
447
mining enterprises,water conservancy and power projects in inundation area, hampering reservoir operation and utilization, must be removed, equipment and old materials should be transported outside the reservoirlarger obstruction, such as pier, gate and dam must be blown down, and the residual height usually should not be 0.5m over the ground.
� Underground structures in reservoir drawdown area should adopt blocking, plugging or other treatment measures according to the geological situation and beneficial use requirements of the reservoir area.
10.6.3.3 Hygiene cleaning
�Pollution sources in reservoir area should be hygiene cleaned. For washroom, cesspit, pens for livestock, rubbish and etc, pollutants should be transported to outside the reservoir as possible, if it is difficult to transport to outside, adopt insolation disinfection treatmentand adopt disinfection treatment for pit with 0.51kg/m2 quicklime The sewage pit should be blocked with clean soil.
�Toxicant sites as industrial and mining enterprises, hospitals, veterinarian stations of severe pollution sources, and the places to bury dead persons and livestocks of communicable disease should be cleaned or treated under the guidance of environmental and hygiene departments.
� For tombs buried for over 15 years, decide whether to move outside the reservoir according to the local custom, however, tombs buried less than 15 years must be moved outside the reservoir or treated on the spot, and adopt disinfection treatment for every pit with 0.51kg bleaching powder.
10.6.3.4 Forest land cleaning
� Tree species with special and high value within the cleaning range, as well as young trees that can be transplanted should be transplanted outside the reservoir.
�Forest and sporadic trees that cannot be transplanted may be cut down at the level of ground and cleared outside the reservoir, residual stubs should not be over 0.3m on the ground.
�Drifters, such as tree folk cut down in the forest, dead wood, bushes and straw stalk, peat coal and etc., should be transported outside the reservoir or burnt on the spot before the water storage.
10.6.3.5 Reservoir bottom cleaning substance quantity
According to the reservoir bottom cleaning scope, cleaning requirements, structures that may hamper the shipping in trunk stream of reservoir area or grade one branch, house waste that cannot be utilized and burnt, junction that may affect the power station, drifters and pollutants in the water quality of reservoir area had been investigated one by one. According to the statistics, cleaning structures in reservoir area of Shihutang navigation and power junction project, removed frame, bricks and concrete, bricks and wood, mud and wood, and other

10.0 Environment Protection Measures & Techoeconomic Analysis
448
structures houses are 45500m2forest land cleaning is 2159mu calculating in accordance with immerged area Hygiene cleaning is 744 persons calculating in accordance with designed annual relocation persons, and tomb treatment 221.
10.7 Measures to Reduce Unadvantageous Social Environmental Impact
10.7.1 Cultural relic impact reduction measures
Some culture relics are distributed in inundation area and reservoir area of Shihutang navigation and power junction project, such as Baikoucheng site of ancient citysite protected for historical and cultural value at state level, Gouzi Pagoda site protected for historical and cultural value at county level, Ouyang ancestral hallit applies now for provincial site protected for historical and cultural value, Huangkeng ancient ferryit is not included in any site protected for historical and cultural value, site of ancient city it is not included in any site protected for historical and cultural value, altogether 5 cultural relic points. The project construction and reservoir area immersion have no impact on 2 cultural relic points that have protective grade and 1 cultural relic point that applies now for provincial site protected for historical and cultural valueThey have impact on 2 cultural relic points (Huangkeng Ancient Ferry and site of ancient city ) that have no protective grade.
According to the Investigation Report of Cultural Relics in Jiangxi Province Kan River Shihutang Navigation and Power Junction Project and the Cultural Relics Protection Law of P. R. China, Jiangxi Provincial Institute of Cultural Relics and Archaeology will implement rescuing archaeological excavation on the Huangkeng Ancient Ferry (work area 600m2) and site of ancient city (work area 5000m2) so as to obtain related historic information. The cultural relics and relative historical information of 2 cultural relic points will be transferred to the site protected for historical and cultural value or museum. After the archaeological excavation work is completed, the two cultural relics points can be submerged, which will not affect the implementation of the project and be consistent with the regulations and requirements of the Cultural Relics Protection Law of P. R. China. The cost of archaeological excavation work has been listed in the project budget.
Except that the culture relics protection work of the above-mentioned 2 cultural relic points that may be affected by the project construction will be completed to obtain related historic information before the commencement of the project, it can be certain that the whole project innundation area is beyond the protection scope and construction control zone of county grade cultural relics protection units, and will not threathen the safety of cultural relics and be consistent with with the regulations and requirements of the Cultural Relics Protection Law of P. R. China.
Because of concealment and unpredictability of buried cultural relics, plus limited investigation and survey technical means of cultural relics department, possibility of futher finding cultural relics points during construction can not be ruled out. Once a cultural relics point is found during construction, the Owner and construction company shall timely report to Jiangxi Provincial Institute of Cultural Relics and Archaeology according to related cultural relics regulations, the construction work can be continued only after rescuing archaeological

10.0 Environment Protection Measures & Techoeconomic Analysis
449
excavation work is completed. After all the cultural relics protection work is finished, Jiangxi Provincial Institute of Cultural Relics and Archaeology will issue the final certifcate of “Cultural Relics Protection Work Done”.
The Owner should communicate as soon as possible with Jiangxi Provincial Institute of Cultural Relics and Archaeology, so as to start the cultural relic protection work of 2 cultural relic points for Jiangxi Provincial Institute of Cultural Relics and Archaeology, guarantee the cultural relic protection work before the project construction and reservoir water storage, and avoid damage to cultural relic due to project construction and water storage or affect the construction period due to cultural relic protection.
10.7.2 Prevent impact to the normal study and living measures of residents due to construction transport
Located at 500m in the lower reaches from right bank of recommended dam site, Sangyuan Elementary School has 200 students, students must pass the highway from the school gate to go to the school and go back. During the project construction period, construction vehicles and construction material transport vehicles will utilize this highway as the construction roads, and vehicle flow rate of this highway will be great during the construction peak. In order not to affect the normal study of the students and the safety of the students, a sign board will be set at the road side of Sangyuan Elementary School during the construction period, indicate: speed per hour less than 20km/h, no horn, students in and out Establish special construction road management team to command, manage and supervise the construction vehicles passing the school gate.
10.7.3 Protective measures for public health
In order to protect public health of residents and construction personnel, ensure various diseases, especially communicable disease and level will not have any abnormal changes due to the project construction, protective measures for people’s health should be implemented.
� Environment hygiene cleaning Harmful animals, such as mouse, mosquitoes, fly, cockroach and etc. should be killed regularly in construction living area every year. Mouse trap method and poison bait method should be adopted to kill mouse, and spray “kill them fast” to kill mosquito, fly and cockroach.
� Environment hygiene and food hygiene management Strengthen environment hygiene management of the drinking water sources of living area and office area of construction personnel and owner living area during the construction period, and public food and beverage site, rubbish stacking point, public washroom, carry out hygiene examination regularly, except daily cleaning, at least 2 concentrative cleanings should be carried out every month.
Persons engaged in food and beverage must obtain hygiene license, and carry out regular

10.0 Environment Protection Measures & Techoeconomic Analysis
450
physical examination, communicable disease carrier must leave his post.
Drinking water sources must be monitored regularly on all camps in order to ensure the water quality of drinking water.
Establish special cleaning team in charge of the cleaning work of construction area, office area, living community, set garbage can, garbage truck.
Public hygiene facilities should satisfy the state hygiene standard and requirements.
� Control measures for hygiene and disease
� File establishment and general investigation of epidemic situation
In order to control communicable disease epidemic in construction area, the construction contractors should carry out comprehensive health investigation for construction personnel and establish epidemic situation file before construction personnel entering the site, and only healthy personnel can enter the construction area.
Investigation and file contents mainly include age, sex, health situation, communicable disease history, native places and etc. the general investigation items are: tuberculosis, epidemic hepatitis, diarrhea and so on, outsourcing construction personnel should also check the origin of communicable disease.
Investigation and number of establishing file will be calculated according to 3900 person/day during the construction peak period.
� Selective examination of epidemic situation and control plan During the construction period, carry out regular epidemic situation sampling quarantine on epidemic situation. Selective examination contents of epidemic situation are mainly alimentary canal communicable diseases of local susceptible hepatitis, diarrhea, respiratory diseases of tuberculosis and other common communicable diseases in the general investigation of epidemic situation, find patients condition and carry out therapy in time.
Quarantine will be carried out in autumn every year during the construction period, quarantine persons will be calculated according to 10% of 3900 persons during the construction peak period, namely 390 persons.
In order to control effectively epidemic disease in the site and improve the disease resistance ability of construction personnel, adopt some preventive measures for construction personnel regularly, such as take preventative medicine, vaccination and etc.
� Epidemic situation monitoring and emergency measures All Owners should determine clearly person in charge of hygiene and disease control, and manage epidemic situation management system and report system regulated by the local hygiene department, and receive the supervision of the local hygiene department.
Epidemic situation monitoring station should be set during the construction period, prepare medicines and facilities for common communicable diseases at any time, such as diarrhea, hepatitis, tuberculosis and etc. in case of epidemic situation, adopt measures for infection source, like therapy, isolation, observation and etc, adopt preventive measures for susceptible

10.0 Environment Protection Measures & Techoeconomic Analysis
451
population, and report timely hygiene and disease control competent authorities .
10.7.4 Protective measures for area public facilities
The project land occupation and reservoir area immersion will occupy 8 wells, pressure pumped well 161, water tower 1 set, Class IV Highway 2.21km, tractor road 10.71km, ferry and wharf 18, aerial optical cable 8.62km, underground optical cable 5.84km, cable TV line 2.48km, 10kV transmission line 5.03km, 0.4kV transmission line 7.55km, transformer 3 sets, small hydraulic power plant 1 (200kW), small scale electric lift irrigation facilities 15 points, water works for industrial use 1. since this will generate certain impact to normal production, life, work and travel of the local residents, protective measures should be adopted accordingly.
� Migrant residential point relocation plan established in the main part of the project will guarantee all migrants productive conditions, house building conditions, infrastructure of water, power and road conditions not lower than the before the building of reservoir. These measures can guarantee the living level of migrants is not lower than before the requisition and relocation, and even higher than before the implementation of the project.
� Special item rebuilding plan established in the main part of the project will rebuild all public facilities affected by the construction on the principle of resuming its function in accordance with original scale, original standard. These measures can guarantee the effective resume of area public facilities.
� Aforesaid measures should be implemented according to the principles of make-before-break, and those facilities shall be put into operation before the requisition and relocation and the water storage of reservoir area.
10.7.5 Protective measures for geological environment
10.7.5.1 Protective measures for geological environment during the construction period
Reservoir bank with poor stability is mainly distributed in Jiangjiazhou —Huwei on the east bank of Kan River in the dam site area, Weijia on the east bank of Kan River at the end of reservoir and both banksides section of Shushui River entering into Kan River with a total length about 24km. the project design has adopted proper works design measures for treatment according to the requirements of the regulations, specifications and relative documents.
Both banks of earth-rock dam section meet with F1, F3 fault with medium water penetration, in order to control the dam foundation penetration, the project design has adopted proper works design measures for anti-penetration treatment according to the requirements of the regulations, specifications and relative documents.
Absorption rate of rock body of ZK203, ZK206 holes of dam foundation at concrete dam section is between 10—100Lu, which has medium water penetration; in order to control the

10.0 Environment Protection Measures & Techoeconomic Analysis
452
dam foundation penetration, the project design has adopted proper works design measures for anti-penetration treatment according to the requirements of the regulations, specifications and relative documents.
Furthermore, adopt necessary project measures for reservoir protection that may occur leakage, such as grouting, bedspread, block, build retaining wall, membrane barrier wall and drain and pressure reduction measuresfor bank slope that may occur serious bank slope damage(collapse, landslide), adopt measures for protection, such as slope protection, unloading load, regulation, reconstruction and necessary plant protection.
10.7.5.2 Protective measures for geological environment during the operation period
Carry out regular monitoring and maintenance on the stability of reservoir banks of the project protection area, and adopt emergency treatment for section in dangerous conditions.
10.7.6 Submergence impact prevention measures
To prevent and treat submergence impact of the reservoir area, the engineering contractor has designed and arranged five protection areas of Wanhe, Yanxi, Zhangtang, Yongchang and Taihe County Seat. The total length of fending groyne lines of the protection works is 38.38km, including 3.36km Taihe Fending Groyne8.12km Wanhe Fending Groyne 0.80km Zhangtang Fending Groyne15.79km Yongchang Fending Groyne and 10.32km Yanxi Fending Groynethe total length of guide support canal is 61.33km including 17.18km long county seat guide support canal to be dredged and resumed as per the original section14.45km Yongchang Guide Support Canal to be refit as per the design standard29.70km Yanxi and Wanhe guide support (drainage) canals to be built 11.85km diversion canal to be refit6 new pumping stations with total installed capacity of 5456kW and 2 new regulating sluices. The total farmland elevating area is 1237.05Mu.
Drainage design standard: There are village and town protection areas within the protection area, the drainage standard is to apply a once-in-a-five-year 3-day rainstorm and drain to the inundation resistant depth within 3 days; the drainage standard of the Taihe County seat is to apply a once-in-a-10-year 1-day storm and drain to the elevation of main buildings non-inundated within 1 day, indicated in the Preliminary Design Report of Flood Control Work of the Taihe County Seat by Ji’an City Water Conservancy and Hydropower Plan and Design Institute; The drainage standard of the guide support canal within the protection area is to apply the corresponding drainage reoccurrence period standard of the protection area, the foreign water guide support canal (river) within the protection area is based on the design flood standard of the fending groyne of the protection area.
In the engineering design of protection work of protection area, the embankment will be raised, consolidated or newly constructed, to develop into sealed protection ring. Vertical anti-seepage treatment will be done for permeable layer of embankment foundation; drain system at flat land of the region will be refit and dredged, with drain pumping stations and culverts and gates at outlet of inland inundation and waterlogging control; water from hillsides within
10.0 Environment Protection Measures & Techoeconomic Analysis
453
the area will be diversed. Farmland elevating measure will be taken for local area. It is suggested that in the engineering design of the next stage, as per raised water table depth after water impounding of protection areas and corresponding inundation standard, detailed inundation impact survey should be made at the protection areas, specific protection and treatment measures should be taken for the area possibly affected by inundation as per the survey results.
10.7.7 Other environmental protective measures
�Project construction will cause the original navigation mark facilities arranged on the river section of dam site losing navigation function. This will cause some impact to the navigation during the construction period. The Owner should communicate closely with the navigation competent authorities during the construction period, and set necessary temporary navigation mark facilities in order to guarantee the safety of navigation.
� Project operating period will generate certain amount of flush to the dam below, both banks of the dam below may cause collapse. The project design has implemented project protection measures for bank line of dam below that may generate collapse according to the requirements of the regulations, specifications and relative documents.
� During construction of Phase II cofferdam, along with the gradual advance of berm, the original navigation river channel will be narrowed, which will loss the navigation function, while the permanent structures will usually start to use only after the water level reaches a certain degree, there is a gap between them, there is a shipping interruption time for a short or longer while.
In order to solve or relieve this contradiction, we suggest keeping close contact with maritime affair and navigation department, apply short term navigation blockage if necessary, and issue notice to mariners in advance in order to guarantee the navigation safety.
10.8 Handling Measures for Solid Waste
10.8.1 Handling measures for solid waste during the construction
Solid waste during the construction period mainly includes construction rubbish and domestic waste of construction personnel. Generating capacity of solid waste in construction period (domestic waste ) peak is 3900Kg/dtotal construction rubbish quantity during the whole construction period is about 200300t. Since the project has a longer construction cycle, various solid wastes generated in the construction camp during the project construction process should be treated properly, abandon at will is forbidden. Productive rubbish, such as abandoned concrete block, equipment packing and so on should be concentrated to stack, and then sent to the nearby refuse disposal plant of the town for landfill treatment. Set garbage can in construction living area and main office area, and transport periodically to the refuse disposal plant for landfill treatment.
10.0 Environment Protection Measures & Techoeconomic Analysis
454
10.8.2 Handling measures for solid waste during the operating period
Generating capacity of domestic waste generated by personnel of project management department of Shihu navigation and power junction is 193.5kg/d. Project management department will be equipped with 30 garbage cans to collect domestic waste of staffs, and transport periodically to the refuse disposal plant for landfill treatment.
Generating capacity of domestic waste of ships in waterway of reservoir area in 2020 is about 13.49t, and about 16.67t in 2030. Ship domestic waste should not be thrown into the river at will, ship lock shall be equipped with 20 garbage cans in order to collect domestic waste of the ship, and transport periodically to the refuse disposal plant for landfill treatment.
Taihe County Environment and Hygiene Management Office has the transport and treatment ability of domestic garbage during construction and operation of the project. Presently Taihe County Environment and Hygiene Management Office has committed to undertake paid transport and treatment of domestic garbage during construction and operation of the project (see Appendix 11).
10.9 Precautions and Emergency Plan for Environmental Risk See Chapter 9.0 ENVIRONMENTAL RISK ANALYSIS for details of precautions and emergency plan for environmental risk.

11.0 Environment Monitoring & Environment Management
455
11.0 ENVIRONMENT MONITORING AND ENVIRONMENT MANAGEMENT
11.1 Environment Monitoring Plan
11.1.1 Objective of environmental monitoring
Environmental monitoring plans include the Environmental Monitoring Plan during Construction and the Environmental Monitoring Plan during Operation, the purposes of monitoring are to investigate and understand the range and degree of influence on the environmental quality from the construction of the project during construction and during operation so as to provide authoritative prompt information and scientific basis for environmental management.
11.1.2 Environment Monitoring Plan during the Period of Construction
In order to monitoring the performance of various measures for environmental protection in construction period and understand the environmental influences from the project in operation period as well as to better understand the environmental quality in construction area and the discharging of the pollutants in different construction stages, it is necessary to carry out environmental monitoring in construction period. The monitoring period shall include the whole construction period and the contents include water quality, air, noise, biological environment, public health, hydrological forecasting, soil erosion, resettlement and so on.
11.1.2.1 Water quality monitoring
� Monitoring of sewage port
Monitoring item: pH value, suspended matters, oily matters, COD, BOD5, ammonia and nitrogen. Monitoring point: including the discharging port of domestic sewage, discharging port of sewage of foundation pit, discharging port of the sewage from concrete blending system. Monitoring frequency: twice per year, once respectively in level period and dry season. The monitoring time shall be increased in the peak period of construction.
� Monitoring of water quality of Kan River at this section
Monitoring item: pH value, water temperature, suspended solids, oils, index of permanganate, BOD5 , ammonian and total phosphorus. Monitoring section: one section shall be arranged respectively at the upper and lower reaches of Hanjiang River at construction area to collect the water sample of the surface layer.

11.0 Environment Monitoring & Environment Management
456
Monitoring frequency: twice per year, once respectively in level period and dry season. The monitoring methods of water quality shall be carried out according to Monitoring and Analysis Method of Water and Waste Water (the second edition) issued by State Bureau of Environmental Protection.
11.1.2.2 Air monitoring
Monitoring item: TSP, SO2 and NO2.
Monitoring frequency: twice per year, once respectively in summer and winter, 5 days continuously for each time. Monitoring point: one monitoring point will be set respectively at the Shihutang Village, Jiangjiazhou Village, Lingbei Village, Xiayinxia Village, access road sides at the construction areas of the right and left banks of the site. The monitoring and analysis methods will be based on the specifications in Monitoring and Analysis Method of Air and Waste Water (1990) issued by State Bureau of Environmental Protection.
11.1.2.3 Noise monitoring Monitoring item: continuous equivalent sound level A. Monitoring frequency: once per season, monitoring frequency will be properly increased at construction peak. Monitoring point: one monitoring point will be set respectively at the Shihutang Village, Jiangjiazhou Village, Lingbei Village, Xiayinxia Village, access road sides at the construction areas of the right and left banks of the site. Monitoring points during construction period are shown in DRAWING NO. 15.
11.1.2.4 Hydrologic regime monitoring and forecasting
Hydrologic information about water from upstream and rainfall will be collected during construction period, and hydrologic regime forecast plan of construction period will be prepared.
11.1.2.5 Water and Soil Erosion Monitoring
Water and soil conservation plan is to set 39 fixed monitoring points: one point at the borrow site, spoil site and construction site of the pivot work area separately; five points at the borrow site, spoil site, construction site and filled side slope of the fending groyne work area

11.0 Environment Monitoring & Environment Management
457
separately; four points at the borrow site, spoil site, construction site and filled (excavated) side slope of the fending groyne work area separately. Patrol inspection will be implemented in other construction sites. Water and soil erosion monitoring plan is shown in Table 11.1�1�Water and soil erosion monitoring points of construction site are shown in DRAWING NO. 43.
11.1.2.6 Old trees monitoring
Construction supervisors shall supervise the construction site carefully, assuring the old trees protection measures implemented. The management personnel of the project environment protection dept. and construction contractors will carry out daily patrol inspection on the construction site, directviewingly understanding the impacts on old trees by construction activities, and preventing construction activities from damaging old trees or contrived damages of old trees.
11.1.2.7 Aquatic ecology monitoring
It is to survey the situation, species and quantity of fishes passing through the river section of the dam site during construction period, and to analyze their reasons so as to take related countermeasures. 11.1.2.8 Monitoring of other construction sites As for the construction situation of the reservoir, lower reaches, construction road, solid wastes, material stacking sites, borrow sites and waste dumping sites, cultural relic protection, resettlement area, reservoir area cleanup, Kan River navigational safety, construction site overviews, the supervising and the managerial staff of the environmental protection department of the project must make daily inspection of the sites, so as to have direct views of the general environmental quality, promptly discover environmental problems and analyze their developing tendency and to take countermeasures accordingly.
The environmental monitoring plan of the project in construction period is shown in Table
11.1-2.
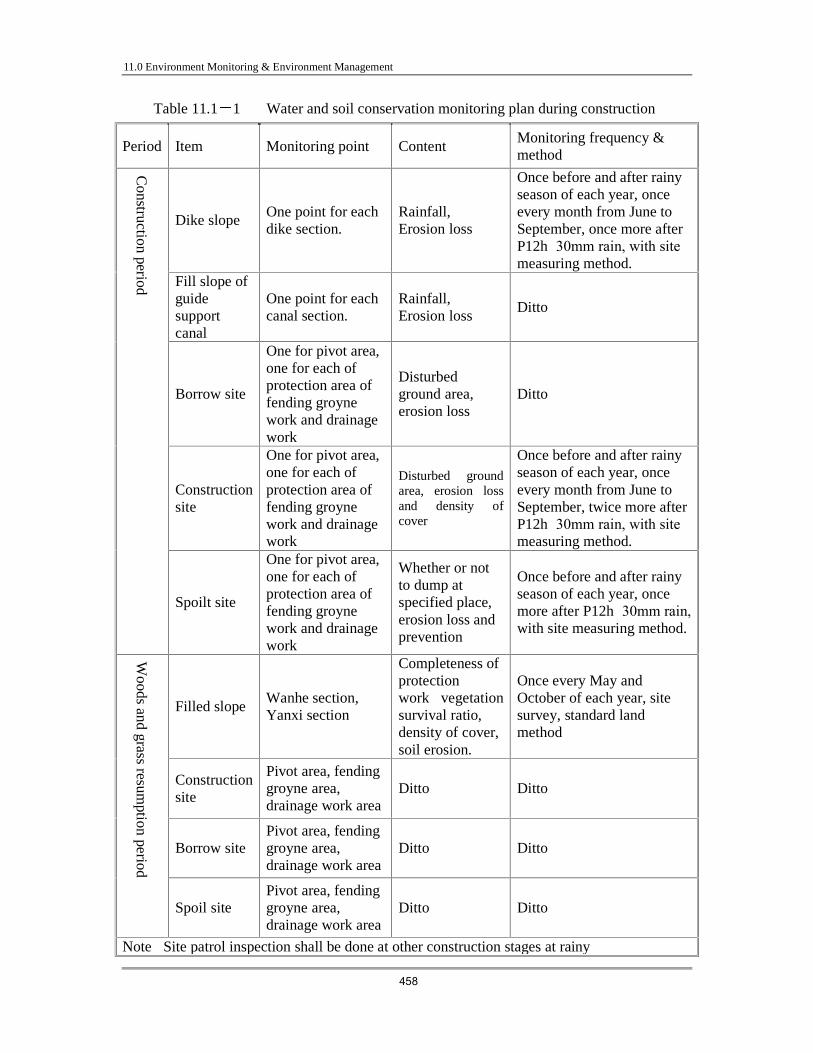
11.0 Environment Monitoring & Environment Management
458
Table 11.1 1 Water and soil conservation monitoring plan during construction
Period Item Monitoring point Content Monitoring frequency & method
Dike slope One point for each dike section.
Rainfall, Erosion loss
Once before and after rainy season of each year, once every month from June to September, once more after P12h�30mm rain, with site measuring method.
Fill slope of guide support canal
One point for each canal section.
Rainfall, Erosion loss
Ditto
Borrow site
One for pivot area, one for each of protection area of fending groyne work and drainage work
Disturbed ground area, erosion loss
Ditto
Construction site
One for pivot area, one for each of protection area of fending groyne work and drainage work
Disturbed ground area, erosion loss and density of cover
Once before and after rainy season of each year, once every month from June to September, twice more after P12h�30mm rain, with site measuring method.
Construction period
Spoilt site
One for pivot area, one for each of protection area of fending groyne work and drainage work
Whether or not to dump at specified place, erosion loss and prevention
Once before and after rainy season of each year, once more after P12h�30mm rain, with site measuring method.
Filled slope Wanhe section, Yanxi section
Completeness of protection work�vegetation survival ratio, density of cover, soil erosion.
Once every May and October of each year, site survey, standard land method
Construction site
Pivot area, fending groyne area, drainage work area
Ditto Ditto
Borrow site Pivot area, fending groyne area, drainage work area
Ditto Ditto
Woods and grass resum
ption period
Spoil site Pivot area, fending groyne area, drainage work area
Ditto Ditto
Note�Site patrol inspection shall be done at other construction stages at rainy

11.0 Environment Monitoring & Environment Management
459
season�problems found shall be timely feedbacked to the Owner.

11.0 Environment Monitoring & Environment Management
460
Table 11.1 2 Environment monitoring plan during construction
Monitoring factor
Monitoring point (section) Content Monitoring frequency
Monitoring organs
1# domestic sewage discharge at right bank, taking mixed water sample. 2# domestic sewage discharge at left bank, taking mixed water sample.
pH, COD, BOD5, NH3-N.
3� foundation pit waste water discharge, taking mixed water sample. 4# waste water discharge of concrete blending system at left bank, taking mixed water sample. 5# waste water discharge of concrete blending system at right bank, taking mixed water sample.
pH, SS, oils.
Twice per year, once per dry and level season. Monitoring times shall be properly increased at construction peak.
6 1km upstream of the dam site, taking mixed water sample of left, middle and right.
Water quality
7 1km downstream of the dam site, taking mixed water sample of left, middle and right.
pH, water temperature, SS, oils, CODMn, BOD5, NH3-
N & total P.
Twice per year, once per dry and level season.
Ji’an City Environment Monitoring
Station
1# Shihutang Village 2# Jiangjiazhou Village
3� Beiling Village 4# Xiayinxia Village
5# side of access road of pivot construction area at the right bank
Air
6 side of access road of pivot construction area at the left bank
TSP, SO2, NO2.
Twice per year, continuous 5 days per time
Ditto
1# Shihutang Village 2# Jiangjiazhou Village
3� Beiling Village 4# Xiayinxia Village
5# side of access road of pivot construction area at the right bank
Noise
6 side of access road of pivot construction area at the left bank
Equivalent continuous A sound level
Once per season,
once at day and at night
per time
Ditto
Regime forecasting
Hydrologic information about water from upstream and rainfall will be collected during construction period, and hydrologic regime forecast plan of construction period will be prepared.
Real time monitoring
The Owner & construction contractor
Old trees Project area
Assuring the old trees protection measures implemented, understanding the impacts on old trees by construction activities, and preventing construction activities from damaging old trees or contrived damages of old trees.
Daily
The Owner & construction contractor & supervision contractor
Aquatic ecology
River section in which the dam site is situated
Understanding activities of fishes.
Fishery dept.
Reservoir & its downstream Construction road
Material storage yard Solid wastes
Borrow sites and spoil sites
Others
Resettlement area
Observing environment quality during construction
Daily Project Environment Protection Dept. & construction supervision contractor

11.0 Environment Monitoring & Environment Management
461
Reservoir area cleanup Navigational safety of the Kan River
11.1.3 Environment Monitoring Plan during the Operating Period
11.1.3.1 Monitoring of Water Quality The change of the water quality at the inlet of the reservoir, in the reservoir and at the outlet of the reservoir after the reservoir is built must be monitored. If the result shows that pollution is aggravated or over the limit, timely report to the environment protection administration must be made in order to adopt the relevant measures for controlling the pollution sources and to guarantee the water quality to reach the function standard as regulated. Layout of the Sections for Monitoring: the principle of the layout is to control the quality of the water source from the upper reach of the river, and that of the water in the reservoir and that at the outlet of the reservoir. Seven sections are to be laid out for monitoring. Monitoring Frequency: continuously monitoring for five years, once during low flow period, level period and high-water period respectively; two successive days each time for sampling at sections of the right, middle and the left. Monitoring items: totally 15 items, including water temperature, pH, SS, DO, CODmn, BOD5, oils, NH3-N, Hg, phenols, total P, total N, Cr+6, coliform bacteria and chlorophyll a.
11.1.3.2 Monitoring of Water Temperature After the Project is completed, the water temperature will show its firm layered structure. At that time monitoring of the vertical layered structure of the water temperature must be performed and the temperature of the flow or drain must be validated in order to adopt measures to reduce the influence on water for industrial and agricultural uses at the lower reaches of the river. Monitoring of the water temperature structure is to be done within the five vertical observation lines distributing in the left, middle, right zones of the dam and in the reservoir and at the tail of the reservoir. Monitoring frequency: the observation period is 5 years and the time for the same term observation is the fifth day, 15th day and 25th day of each month at 8:00. Monitoring items: the water temperature and the runoff at the outlet of the power station, the vertical water temperature of the reservoir, the water temperature and runoff at the inlet, the air temperature in front of the dam, water level, etc. 11.1.3.3 Monitoring of noise

11.0 Environment Monitoring & Environment Management
462
Monitoring point: one monitoring point will be set respectively at the Shihutang Village, Jiangjiazhou Village, Lingbei Village and Xiayinxia Village. Monitoring Frequency: continuously monitoring for three years, once per season. Time and Method for Monitoring: as per the relevant requirements in Methods for Measuring of Environmental Noises in Urban Area (GB/T14623-93).
11.1.3.4 Hydrologic regime monitoring and forecasting
After the reservoir impounds water, the hydrologic regime will be observed for 20 years, Hydrologic information about coming water and rainfall of the area will be collected, and hydrologic regime forecast plan will be prepared.
11.1.3.5 Monitoring of reservoir bank stability
After the reservoir impounds water, the reservoir bank stability will be monitored for 5 years.
11.1.3.6 Soil submersion monitoring
After the reservoir impounds water, the submerged soil will be monitored for 5 years.
11.1.3.7 Monitoring of water and soil erosion
Monitoring period of water and soil erosion is ten years, the first monitoring of water and soil erosion will be done in the first year of operation period, thereafter, it will be monitored once every two years.
11.1.3.8 Monitoring of old trees
After the reservoir impounds water, the old trees will continuously be observed and maintained for 5 years.
11.1.3.9 Monitoring of terrestrial ecosystem and land resource
Monitoring of terrestrial ecosystem and land resource is to understand the impacts on terrestrial ecosystem and land resource application due to the reservoir inundation and resettlement development work after operation of the reservoir.
Irregular survey will be made on density of cover, terrestrial organism species change, and diversity change, especially the backwater section of the reservoir will be observed; irregular observation and survey shall be made on change of the land application method and benefit of the reservoir area and resettlement area, water and soil erosion and soil fertility; irregular

11.0 Environment Monitoring & Environment Management
463
observation shall be made on soil gleying and secondary salinization at the surrounding of reservoir and its downstream.
11.1.3.10 Monitoring of aquatic ecosystem
� Monitoring and survey on population type, quantity, biomass, fish flora, population, dominant species, distribution and change of aquatic higher plants, plankton and zoobenthos;
� One aquatic ecosystem monitoring point will be set respectively at the Taihe Spawning Site, the Yanxidu Spawning Site, and at 2km downstream the dam (Specific locations are shown in DRAWING NO. 42), monitoring and surveying the spawns, fry quantity, fish species, quantity, population dynamics, and habitat condition;
� Survey on the effect of fish proliferation and fry laying;
� Survey on situation, species and quantity of fishes passing through the fish pass, analysis on their tendency so as to take relevant countermeasures;
� Since the first year after the reservoir impounds water, three aquatic ecological environment monitoring will be made respectively in April, July and December of each year, for continuous five years. Fish passing situation of the fish pass will be surveyed once a season, survey frequency will be properly increased during spawning and migration peak period.
11.1.3.11 Other monitoring during operation As for the construction situation of the reservoir, lower reaches, resumption overviews of material stacking sites, borrow sites and waste dumping sites, resettlement area, increase and reduction of discharge ports, the supervising and the managerial staff of the environmental protection department of the project must make inspection of the sites, so as to have direct views of the general environmental quality, promptly discover possible environmental problems and analyze their developing tendency and to take countermeasures accordingly.
Environment monitoring plan during operation is shown in Table 11.13. Environment monitoring points during operation of the project are shown in DRAWING NO. 15.

11.0 Environment Monitoring & Environment Management
464
Table 11.1 3 Environment monitoring plan during operation
Factor Monitoring point (section) Content Monitoring frequency
Monitoring organs
1� at 100m upstream at backwater end of the reservoir, taking mixed water samples of left, middle and right side. 2� Taihe County Seat discharge, taking mixed water samples. 3# 100m upstream of Gouzinao Water Intake�taking mixed water samples of left, middle and right side. 4� Yanxi discharge, taking mixed water samples. 5# 200m upstream of the dam site�taking mixed water samples of left, middle and right side. 6# 1km downstream of the dam site�taking mixed water samples of left, middle and right side.
Water quality
7# 100m downstream of Wanhe Drainage Gate�taking mixed water samples of left, middle and right side.
Water temperature, pH, SS, DO, CODMn, BOD5, oils, NH3-N, Hg, volatile phenol, total P, total N, Cr+6, coliform and chlorophyll a etc. Flowrate, flow and ecological base flow added for 6# section.
Once per dry, level and rich season of each year, two days each time.
Ji’an City Environment Monitoring
Station
1 Vertical survey line at the left side of the dam site
2 Vertical survey line at the middle of the dam site
3 Vertical survey line at the right side of the dam site
4 Reservoir middle vertical survey line
Water temp.
5 Reservoir tail vertical survey line
Water temperature, flow, atmospheric
temperature, water level
Survey period is five years, survey time is 8:00 a.m. of the 5th , 15th and 25th of each month
Ji’an City Environment Hydrological
Station
1# Shihutang Village 2# Jiangjiazhou Village
3�Lingbei Village Noise
4# Xiayinxia Village
Equivalent continuous A sound level
Once a season, once at day and at night each
time.
Ji’an City Environment Monitoring
Station
Regime forecast
Collection of hydrological information and preparation of regime forecasting plan
For continuous 20 years.
The Owner
Reservoir bank
stability All the protection areas For continuous 5
years once a year. Geological
Dept.
Soil submersio
n All the protection areas Ditto Ditto
Reservoir area Water & soil
erosion Resettlement point
Intensity and loss of water and soil erosion
Monitoring period is 10 years (once every two years)
Water conservancy
dept.
Old trees Within the project area
Survey on the growth and habitat conditions of old trees within the project area, especially the affected old trees.
For continuous 5 years after operation of the reservoir
Forestry dept.

11.0 Environment Monitoring & Environment Management
465
Terrestrial ecosystem
Within the project area
Irregular observation on density of cover, terrestrial organism species change, diversity change, change of the land application method and benefit of the reservoir area and resettlement area.
For continuous 5 years once a year.
Forestry dept. & land administrati
on dept.
Table 11.1 3 Environment monitoring plan during operation
(Cont’d)
Factor Monitoring point
(section) Content
Monitoring frequency
Monitoring organs
1# Taihe Spawning Site
2# Yanxidu Spawning Site
Aquatic ecosystem
3� Place 2km downstream of the
dam
Monitoring and survey on population type, biomass, fish flora, population, dominant species, distribution and change of aquatic higher plants, plankton and zoobenthos;
Monitoring and surveying the spawns, fry quantity, fish species, quantity, population dynamics, and habitat condition;
Survey on the effect of fish proliferation and fry laying;
Survey on situation, species and
quantity of fishes passing through the
fish pass
Since the first year after the reservoir impounds water, three aquatic ecological environment monitoring will be made respectively in April, July and December of each year, for continuous five years. Fish passing situation of the fish pass will be surveyed once a season, survey frequency will be properly increased during spawning and migration peak period.
Fishery and
aquatic product
dept.
Reservoir and its downstream
Construction road Material storage
yard Increase and decrease of
discharge quantity Borrow site and spoil
site
Others
Resettlement area
Understand the general environmental quality change, promptly discover environmental problems and analyze their developing tendency and to take countermeasures accordingly.
Once a season
Project environme
nt protection
dept.
11.1.4 Environment monitoring institutions
Environmental monitoring and management during the construction period is to be done by the joint monitoring group consisting of local qualified environmental monitoring unit entrusted by the project, local quarantine service and local environmental geological department.

11.0 Environment Monitoring & Environment Management
466
After the completion of the reservoir, it is suggested that the environmental monitoring during the operation period is to be performed by the local environmental monitoring unit entrusted. The local quarantine service can be entrusted for the monitoring of public health within the reservoir area. The monitoring of stability of reservoir bank is to be undertaken by local environmental geological department entrusted. Monitoring of terrestrial ecological system shall be done by local forestry department, while the monitoring of aquatic ecological system shall be done by local fishery and aquatic products department. All methods for monitoring and analyzing will adopt the existing national or industrial standards and codes.
11.1.5 Submission of Environmental Monitoring Report
After completion of each phase of monitoring during construction period, the monitoring institution is required to submit in duplicate Environmental Monitoring Report during Construction Period of the Project to the Environment Protection Department of the Project Construction Office of Shihutang Shipping and Hydropower Pivotal Project of NAA (hereafter referred as to the Project Office). From the first year of construction commencement, the Project Office is required to submit semi-annual report respectively to NAA of Jiangxi Communications Bureau, Jiangxi Environment Protection Bureau and Ji’an Environmental Protection Bureau till completion of the project.
11.1.6 Estimated Cost of Environmental Monitoring
(1) Cost of Environmental Monitoring during the Construction Period Construction period: 5 years; environmental monitoring cost: RMB1.076 million yuan/a; monitoring cost of water and soil erosion: RMB 620,000 yuan/a. (2) Cost of Environmental Monitoring during the Operation Period and other environment protection cost: Environment monitoring cost: RMB 1.528 million yuan/a; monitoring cost of water and soil erosion: RMB 120,000 yuan/a
The estimated environmental monitoring charges are shown in Table 11.1�4.

11.0 Environment Monitoring & Environment Management
467
Table 11.1 4 Estimated environmental monitoring charges
Phase Monitoring items Monitoring period(year)
Estimated cost (RMB10,000/a.)
Total (RMB10,000)
Water quality 5 3.0 15.0
Air 5 0.4 2.0
Noise 5 0.12 0.6
Aquatic ecology 5 8.0 40.0
Regime forecasting 5 4.0 20.0
Construction
Old trees 5 6.0 30.0
Total 107.6
Water quality 5 2.0 10.0
Water temperature 5 2.0 10.0
Noise 3 0.8 1.8
Public health 10 1.0 6.0
Regime forecasting 20 2.0 40.0
Bank stability 5 1.0 5.0
Soil immersion 5 3.0 15.0 Terrestrial ecosystem
5 3.0 15.0
Operation
Aquatic ecosystem 5 10.0 50.0
Tota l 152.8
Grand total 260.4
11.2 Environment Management Plan
11.2.1 Emvironment Management Organs and Responsibilities
Environment management is also an important guarantee that can control the negative impacts of the project and exert the long-run benefits. Environmental management must be available throughout the construction and operational periods whereby there will emerge many factors that will have impacts on the environment. Therefore, the project shall establish professional administrative institutions that have good professional basis and administrative competence. It should be equipped with necessary environmental protection personnel, being merged into the established integrative and professional environmental protection system to be responsible for, carrying out and supervising the work of environmental protection of the project. Environment management procedure during construction of the Project is given in Drawing No.11.2�1�Environment management procedure during operation of the Project is given in Drawing No.11.2�2.

11.0 Environment Monitoring & Environment Management
468
Drawing No.11.2 1 Environment management procedure during construction
Drawing No.11.2 2 Environment management procedure during operation
�The environmental management for the project shall be conducted by the Project Office, under which, the Environmental Protection Section (EPS) of the Project shall be established and charged by specially-assigned persons.
�During construction, the EPS has 1~2 full-time personnel with the following
responsibilities: �The EPS is administerially under the leadership of the Project Office and
professionally under the supervision and guidance of the provincial and prefectural (municipal) environmental protection bureaus, forestry bureaus, water conservancy bureaus and fishery bureaus, being responsible for submitting the monthly report on environmental management and for compiling the reports of environmental monitoring during construction.
� Entrust qualified environment monitoring company to execute environment monitoring during construction, assist to well do environment monitoring work during construction.
� Assure to include the environment management plan into tender document or contracting contract. Supervise construction contractor to implement pollution prevention and treatment measures, immediately issue an unconformity notice to the construction team and report to the Project Office if the contractors are found to violate environmental protection regulations or fail to effectively implement the pollution preventive measures. Assist to deal
(QYLURQPHQW�3URWHFWLRQ�6HFWLRQ�RI�3URMHFW�2IILFH�
Envi. Supervisor EA consultant institution Envi. Monitor. Organ
&RQWUDFWRU�
EA bureau
Fishery bureau
Forestry bureau
Water bureau
)LVKSDVV�
2SHUDWLRQ�
6HFWLRQ�
3UROLIHUDWLRQ�
�UHOHDVH�
VWDWLRQ�
'\NH�
0DLQWHQDQFH�
6HFWLRQ�
'DP�6DIHW\�
6HFWLRQ�
Environment Monitoring
Organ
(QYLURQPHQW�3URWHFWLRQ�6HFWLRQ�RI�3URMHFW�0DQDJHPHQW�'HSW��EA bureau
Fishery bureau
Forestry bureau
Water bureau
EA consultant institution

11.0 Environment Monitoring & Environment Management
469
with the environment pollution accidents in case a pollution accident occurs. �Assure to include the environment management plan into tender document or
supervision contracting contract. Supervise and participate in environment supervision of the Project. Assist to deal with the environment pollution accidents in case a pollution accident occurs.
� Employ an environment protection consultation organ to provide technical support for environment protection work of the Project during construction and to provide contractor with technical supervision of environment protection work and to assist to well carry out on-the-job environment protection training of project management personnel, supervision personnel and contractors.
�During operation, the EPS has 1~2 full-time personnel with the following
responsibilities: �The EPS is administerially under the leadership of the Shihutang Pivot Management
Department and professionally under the supervision and guidance of the provincial and prefectural (municipal) environmental protection bureaus, forestry bureaus, water conservancy bureaus and fishery bureaus, being responsible for submitting the annual report on environmental management and for compiling the reports of environmental monitoring during operation.
�Entrust qualified environment monitoring company to execute environment monitoring during operation, assist to well do environment monitoring work during operation.
�Supervise and assure normal operation of all the environment protection facilities. Assist to deal with the environment pollution accidents in case a pollution accident occurs.
� Employ an environment protection consultation organ to provide follow-up study and technical support for environment protection work of the Project during operation and to assist to well carry out on-the-job environment protection training of management personnel and operators.
�Main responsibilities of environment monitoring organ:
Main responsibilities of environment monitoring organ are to complete environment monitoring work during construction and during operation as per the entrustment of the EPS of the Project Office (Shihutang Pivot Management Department) and the environment monitoring plan given in this EIA.
�Main responsibilities of environment protection consultation organ:
Main responsibilities of environment protection consultation organ are to provide technical support for the environment protection work of the Project and to provide technical supervision for contractors during construction as per the entrustment of the EPS of the Project Office (Shihutang Pivot Management Department), this EIA and the environment protection design document and to well carry out environment protection training work during construction; and to provide technical support for the environment protection work of the Project during operation and to well carry out environment protection training work during operation as per the entrustment of the EPS of the Project Office (Shihutang Pivot Management Department) and this EIA
� Main responsibilities of contractor

11.0 Environment Monitoring & Environment Management
470
Main responsibilities of contractor are to perform environment protection work during construction according to the tender document, contract, this EIA and environment protection design document etc. under instruction and supervision of the environment management personnel and environment supervision engineers of the EPS of the Project Office and governmental relative functional departments and under technical support of environment protection consultation organ.
� Responsibilities of environment supervisor
The responsibilities of the environmental supervisor are, based on routine site observation, to coordinate the environmental protection section of the Project Office to deal with the identified environmental problems.
11.2.2 Environment supervision
The environmental protection supervisor can be assumed by construction supervision engineer who can learn to supervise environmental works after being trained.
11.2.2.1 Determination of environment supervision plan of the project
Environment supervision includes two parts of environment quality supervision and environment engineering supervision. Before environment supervision, supervisor shall prepare the supervision plan of the project according to the environment protection codes and standards related with the project, the engineering design document, design specification and other design documents, project construction contract, tendering and bidding documents, environment supervision contract and tendering and bidding document etc. The supervision plan shall include the followings:
� Scope, stage and duration of environment supervision
Environment supervision scope: the area where the project is located and the affected area.
Scope of work: construction site, camp building, auxiliary facilities and etc. and the area in which construction may cause environment pollution and ecological damage of the said scope.
Stage of work: environment supervision at construction preparation stage, construction stage, and guarantee stage.
Term of supervision service: from construction preparation stage till expiration of guarantee period of the project term of service during guarantee period is one year after completion of construction. The environment supervision of the project is divided into three stages of construction preparation, construction and defects liability period.
� Work objectives Environment supervision work objectives: In accordance with the national and industrial laws, rules, policies, the rules, codes and technical standards of the World Bank, and the approved design documents, bidding documents, supervision contract and construction contract signed lawfully, as per the scope and content of environment supervision service,

11.0 Environment Monitoring & Environment Management
471
perform the environment supervision obligations, independently, justly, scientifically and effectively serve the project, implement an overall environment supervision, make the project to reach the environment protection requirements in the aspects of engineering design, construction and operation, implement the environment supervision as per the measures in the environment management plan of this report.
� Supervise the water and soil erosion caused by the main project and temporary works, check whether or not all the water and soil conservation facilities reach the design requirements, borrowing and spoiling are in accordance with specified procedures and locations; especially supervise construction spoils not to dump to mountain slopes to avoid damaging landscape; build temporary settling tank during construction; use straw cushion or plastic film to cover the ground breaking points or other places vulnerable to soil erosion before rainstorms for protectionkeep the rivers, canals and drainage system unblocked with good conditions.
� Environment supervision on productive wastewater and residence sewage treatment measures: Supervise the sources, discharge quantities and water quality of productive wastewater and residence sewage, and construction process and treatment effect of treatment facilities of productive and domestic wastewater, check and monitor whether or not they reach the approved discharge requirements.
� Environment supervision of air pollution prevention measures: air pollution at the construction area comes mainly from waste gases and dust produced during construction and production. Pollution sources are required to discharge after meeting the discharge standard, construction area and it affected area shall reach the specified environment quality standard.
�Environment supervision of noise control measures: To avoid noise harm, strong noise or vibrating pollution sources shall be prevented as per the design requirement, especially blasting operation, it is required to assure the noise environment quality of construction area and its affected area to reach the related standard.
�Environment supervision of solid wastes treatment measures: Solid wastes treatment includes treatment of productive and domestic garbage and productive waste slags, reaching the requirement of cleanness and tidiness of the construction site.
�Environment supervision of wildlife and aquatic ecological measures: To avoid impacts of water and soil erosion, manage the construction contractors, especially fulfill the measures of protection, relocation and isolated protection of old trees as per vegetation protection requirements.
�Environment supervision of public health measures: to guarantee domestic water and drinking water safe and reliable, prevent infective diseases, provide necessary welfare and sanitary conditions etc.
�Environment monitoring supervision: Supervise performance of the environment monitoring work as per the monitoring content of this report.
� Construction and installation supervision of environment protection facilities: supervise construction of wastewater treatment facility, noise barriers, environment greening etc.

11.0 Environment Monitoring & Environment Management
472
� Work system
Including work record system, training system, report system, correspondence system, regular environment meeting system: An environment protection supervision meeting will be held each month. During the regular environment meeting, contractor shall make a review summarization on the environment protection work of the recent stage, environment supervision engineer will make an overall assessment on the environment protection work of that month, affirming the achievement of the environment protection work and lodging existing problems and improvement requirements. A MOM will be formed at each meeting.
� Plan and preparation of personnel and equipment in and out of the site
Preparing environment supervision work plan, submitting the composition of environment supervision organ and name list of environment supervision engineers to the Owner before entering the construction site; defining the duty responsibilities, posts and work time of environment supervision engineers; establishing complete and stringent supervision rules and regulations and organizing all the environment supervision engineers to be familiar with contract terms and related technical codes; carrying out site surveys, mastering the site landform, geographical objects, hydrogeology and environment overview.
On the basis of environment supervision plan, according to detailed engineering design, providing environment supervision work plan and preparing environment supervision work detailed rules for implementation before environment supervision engineers enter the site.
Environment supervision work plan and environment supervision work detailed rules for implementation will be prepared by environment supervision engineer, reported to the Owner for approval.
� Quality control
� Quality control principle
Implementing an overall-process and omnibearing check, supervision and management on construction. Stressing on precontrol, timely preventing and curbing varied disadvantageous factors which may cause environment impacts, stifling in the cradlestringently implementing midcontrol, eliminating all the hidden troubles which may cause environment impacts at any time; completing post-control, making the project to be handed over by the contractor consistent with all the environment protection requirements specified in design documents, technical codes and contract.
� Main methods and measures of quality control Establishing a complete quality control system with chief supervisory engineer in charge of environment supervision work, executing an omnibearing supervision and check on the construction methods and processes of contractor.
� Organization and coordination, information summarization, transmission and
management
Coordination and management work will be well done mainly in the form of environment

11.0 Environment Monitoring & Environment Management
473
supervision meeting.
As for information summarization, filing and management, according to the Owner’s requirements, with reference to related national, local and WB regulations and the project features, information will be sorted, classified, tabulated and filed, and special meeting will often be held, checking and supervising and urging contractor to timely sort contract document and technical documents, assuring engineering document and file classification clear & complete, technical files and drawings simultaneous with physical goods.
11.2.2.2 Content of environment supervision work
� Environment supervision at the early stage of construction
Review of pollution prevention plan: As per the process design of specific project, review wastes discharge links of construction process, main discharge pollutants, and review whether or not treatment measures applied in the design advanced or feasible. Plan for final pollutant disposal method and destination shall be made at the early stage of the project as per related rules and treatment requirements, and fulfilled after being reported to environment protection authority.
Review of special environment protection terms in construction contract: Construction contract must follow the environment protection requirements and embody in construction contract in the form of special terms, hereby strengthen supervision and management, check, monitoring during construction, reducing environment impacts during construction, meantime, civilized construction quality and construction environment management level of construction contractor will also be reviewed.
� Environment supervision during construction period
� Supervise and check whether water and soil conservation measures are consistent with
requirements of environment protection countermeasures, measure fulfillment and effects;
�Supervise and check whether different machinery and equipment are consistent with
noise pollution control requirement during construction or not;
�Supervise and check whether the domestic sewage and garbage at construction site are
properly disposed as specified;
�Supervise and check the daily collection, classified storage and disposal of
construction and domestic garbage;
� Productive wastewater must be discharged after treating and meeting the discharge
standard;
�Supervise and check whether the construction roads are unblocked or drainage system
in good application condition, the construction site has retained water;

11.0 Environment Monitoring & Environment Management
474
� Well train constructors in the aspect of environment protection, train them to have
consciousness of cherishing environment and preventing pollution;
� Well do the environment monitoring, check and inspection work for pollutants
discharge during construction;
� Participate in investigating and handling environment pollution accidents and
environment disputes during construction period.
� Environment resumption supervision after completion of the project
Supervise and manage the fulfillment of environment resumption monitoring and plan
and the operation of the environment protection facilities.
� Supervise preparation of as-built documents;
� Organize initial acceptance;
� Assist the Owner in organizing as-built acceptance;
� Prepare the environment supervision sum-up report of the project;
� Sort out environment supervision as-built documents.
� Site supervision
Environment supervision engineers shall wholly patrol the environment protection construction and links possibly causing pollution, be present at the main pollution construction process to supervise and check all the links. The main work contents are:
� Coordinate environment supervision work of site construction, stress on patrolling construction site, master site pollution dynamics, supervise and urge both contractor and supervisor to jointly implement environment supervision detailed rules well, timely find and handle important pollution problems;
� Supervision engineers shall be present at construction site for supervision of the whole construction process and for site monitoring and checking contractor’s construction records.
Content of site monitoring and check: Check whether construction is in accordance with environment protection terms, or any changes without authorization; Check through monitoring whether the construction process is consistent with the environment protection requirements; check whether construction is consistent with the environment protection codes, or the environment protection design requirements; Check whether all the environment protection measures to assure the environment protection requirements have been implemented or not during construction.
Supervision personnel shall record daily site monitoring and check results and report to environment supervision engineer, the environment supervision engineer shall supervise and check the work of supervision personnel and timely find and treat the existing problems.

11.0 Environment Monitoring & Environment Management
475
11.2.3 Environmental Protection Training
All personnel of the Project Office Environment Protection Section and construction workers have to receive environmental protection training at least one time before commencement of construction. Key environmental administrative and monitoring personnel must go through the technical training for a period of 1~3 months.
11.2.3.1 Environmental protection technology and technical training
�1�On-duty training for environmental monitoring managerial personnel The targets to provide with on-duty training for the environmental monitoring and management personnel are to enhance the work of environmental monitoring and management during construction and operational periods, thus to ensure the quality of environmental monitoring and effective environmental management and to wholly improve the quality of the project. Through the training, the trainees will know how to distinguish the key environmental problems during construction period and acquire more about the existing problems and deficiencies so that they can make prompt reports to the environmental protection department to take necessary preventive measures as soon as possible. During the process of construction, the Project Office Environment Protection Section will invite experts of environmental protection or experienced administrative staff to lecture on the possible environmental problems and correspondent solutions. �2�Training for persons in-charge and construction workers Before commencement of the project, the persons in-charge and construction workers of the contractor must receive systematic training of environmental protection knowledge, so that they can avoid the damages to the environment due to mal-operation during the process of construction. The target of training person in-charge of contractor is to clarify the responsibilities of environmental protection for the contractor. The aim of training construction workers is to emphasize the correct operating methods for construction works during construction period, so that mal-operation can be avoided. The training of person in-charge and construction workers shall be charged by the assigned persons of the environmental protection department of the Project Office, of which, the main tasks are to make clear the possible damages to the environment by project construction, necessary environmental protection measures and the handling methods for any problems. Through training, the person in-charge may know the obligations that he should shoulder and the possible consequences if the environment is damaged. At the same time, construction workers may be more directly knowing about the degrees and methods of environmental protection for the sensitive points. According to the actuality of the project, the training period for the person in-charge and construction workers shall last for one week. �3�During operation period, Project Owner shall regularly provide environmental protection training for the staff, hence to make them clear about possible environmental problems and take necessary measures. Each personnel shall have the awareness to protect the environment.

11.0 Environment Monitoring & Environment Management
476
11.2.3.2 Training method and training charges
Training method includes: (1) Experts, or leaders from environmental protection competent department give lectures. Training budget is RMB 30000. (2) Visit of environmental protection site of similar projects. This is to organize visits to the environmental administrative departments of representative inland river waterway development projects under construction or operation to learn experienced environmental administrative method through site demonstration. Training budget: RMB60000. (3) Non-scheduled long-term (1 to 2 years) or short-term (1 to 3 months) training sponsored by domestic universities and scientific research units. Estimated cost for training is RMB 100,000. (4) Abroad study and training. Twelve persons divided into two groups will be sent abroad to the places, which have similar experiences (especially the World Bank loaned projects) to learn foreign advanced management. It is to formulate provisions for environmental administration according to the actuality of the project. The training period shall be one month. Training budget: RMB600000. The total budget of the above training will be RMB790000.
11.2.4 Implementation of Environmental Protection Measures
The Implementation plan of project environmental protection measures is shown in Table
11.2-1.
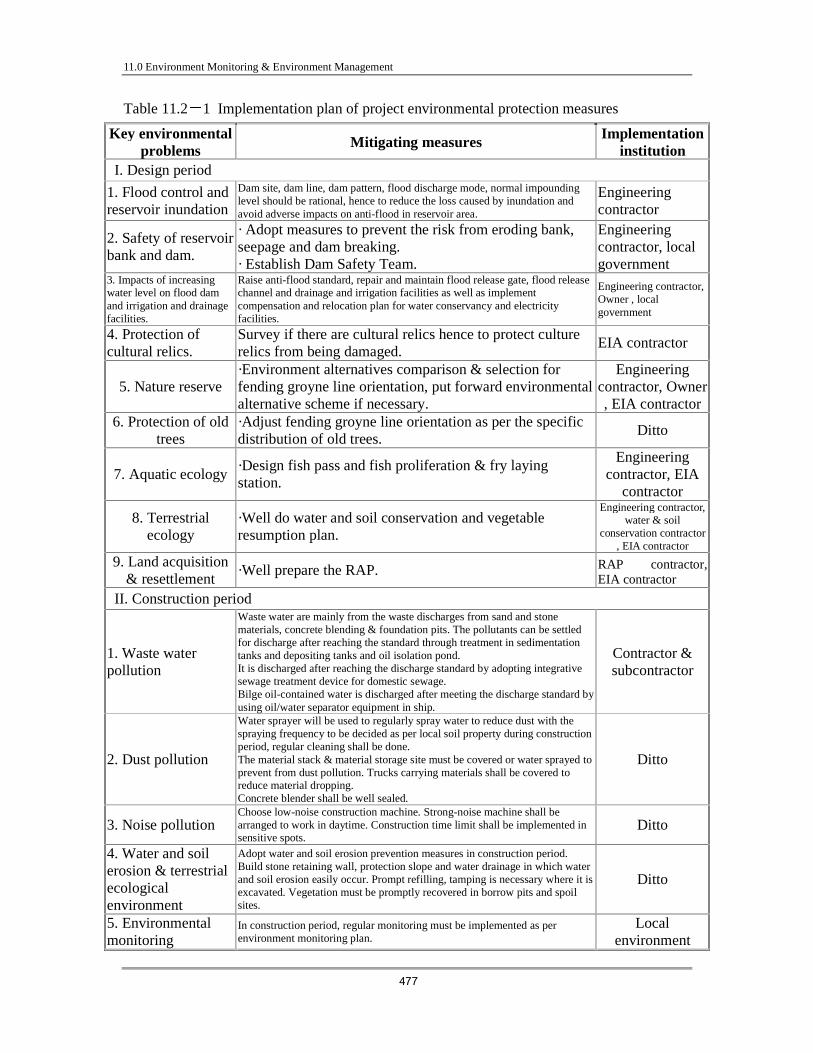
11.0 Environment Monitoring & Environment Management
477
Table 11.2 1 Implementation plan of project environmental protection measures
Key environmental problems Mitigating measures Implementation
institution I. Design period
1. Flood control and reservoir inundation
Dam site, dam line, dam pattern, flood discharge mode, normal impounding level should be rational, hence to reduce the loss caused by inundation and avoid adverse impacts on anti-flood in reservoir area.
Engineering contractor
2. Safety of reservoir bank and dam.
· Adopt measures to prevent the risk from eroding bank, seepage and dam breaking. · Establish Dam Safety Team.
Engineering contractor, local government
3. Impacts of increasing water level on flood dam and irrigation and drainage facilities.
Raise anti-flood standard, repair and maintain flood release gate, flood release channel and drainage and irrigation facilities as well as implement compensation and relocation plan for water conservancy and electricity facilities.
Engineering contractor, Owner , local government
4. Protection of cultural relics.
Survey if there are cultural relics hence to protect culture relics from being damaged.
EIA contractor
5. Nature reserve ·Environment alternatives comparison & selection for fending groyne line orientation, put forward environmental alternative scheme if necessary.
Engineering contractor, Owner , EIA contractor
6. Protection of old trees
·Adjust fending groyne line orientation as per the specific distribution of old trees.
Ditto
7. Aquatic ecology ·Design fish pass and fish proliferation & fry laying station.
Engineering contractor, EIA
contractor
8. Terrestrial ecology
·Well do water and soil conservation and vegetable resumption plan.
Engineering contractor, water & soil
conservation contractor , EIA contractor
9. Land acquisition & resettlement
·Well prepare the RAP. RAP contractor, EIA contractor
II. Construction period
1. Waste water pollution
Waste water are mainly from the waste discharges from sand and stone materials, concrete blending & foundation pits. The pollutants can be settled for discharge after reaching the standard through treatment in sedimentation tanks and depositing tanks and oil isolation pond. It is discharged after reaching the discharge standard by adopting integrative sewage treatment device for domestic sewage. Bilge oil-contained water is discharged after meeting the discharge standard by using oil/water separator equipment in ship.
Contractor & subcontractor
2. Dust pollution
Water sprayer will be used to regularly spray water to reduce dust with the spraying frequency to be decided as per local soil property during construction period, regular cleaning shall be done. The material stack & material storage site must be covered or water sprayed to prevent from dust pollution. Trucks carrying materials shall be covered to reduce material dropping. Concrete blender shall be well sealed.
Ditto
3. Noise pollution Choose low-noise construction machine. Strong-noise machine shall be arranged to work in daytime. Construction time limit shall be implemented in sensitive spots.
Ditto
4. Water and soil erosion & terrestrial ecological environment
Adopt water and soil erosion prevention measures in construction period. Build stone retaining wall, protection slope and water drainage in which water and soil erosion easily occur. Prompt refilling, tamping is necessary where it is excavated. Vegetation must be promptly recovered in borrow pits and spoil sites.
Ditto
5. Environmental monitoring
In construction period, regular monitoring must be implemented as per environment monitoring plan.
Local environment

11.0 Environment Monitoring & Environment Management
478
monitoring station
6. Protection of cultural relics
Relocation protection Cultural relics
dept.

11.0 Environment Monitoring & Environment Management
479
Table 11.2 1 Implementation plan of project environmental protection measures
(Cont’d)
Key environmental problems Mitigating measures Implementation
institution
7. Nature reserve & old trees
·To implement the old trees protection plan; ·To Build cement laid stone slope protection at the river bank of Xinzhou�30m long�. ·To Build a 1040m long cement laid stone slope protection at the river bank of the nature reserve.
Contractor & subcontractor, forestry dept.
8. Aquatic ecology
·To build fish pass; ·To construct fish proliferation and fry laying station; ·To plant reeds etc. to form artificial fish nest; ·To observe and understand fishes activity.
Contractor & subcontractor,
fishery dept., the owner
III. Operation period
1. Industrial & domestic waste water
No waste water shall be discharged by the Pivot proper. It is discharged after reaching the discharge standard by adopting integrative
sewage treatment device for domestic sewage. Enterprises within reservoir area can discharge waste water into the Kan River after reaching the standard through treated by the city wastewater treatment plant. Projects of discharge nature surrounding the reservoir area shall be strictly controlled to avoid new pollution sources. Ship bilge oil-contained waste water, sewage and garbage shall not be discharged into water body but into acceptance facilities in the port.
Local government, Navigation administration
2. Noise of vessels Strengthen the management of passing ships and vessels. Those which noise is beyond the limited standard are not allowed to run.
Navigation supervising administration
3. Accident risk
Regional flood control plan and the Ji’an City Emergency Plan to Handle Water Emergencies shall be implemented.
Local government, Transportation administrative department, navigation supervising administration
4. Environmental monitoring
Environmental monitoring must be implemented according to monitoring plan.
Ji’an environment monitoring station
5. Nature reserve and protection of old trees ·Old trees protection plan shall be executed.
Forestry dept. Contractor & subcontractor
6. Aquatic ecology · Vegetation coverage percentage, terrestrial animal and plant population change, reservoir area and resettlement area shall be irregularly observed.
The owner
7. Terrestrial ecology
·To survey aquatic higher plants, planktons, zoobenthos population type, biomass, and artificial fish nest etc. ·To observe spawn, fry quantity, fishes species, quantity, population dynamics, habitat condition and etc.
The owner

11.0 Environment Monitoring & Environment Management
480
·To execute fish proliferation and fry laying and to survey its effect. ·To survey the fish passing situation, passed fish species and quantity through fish pass.
12.0 Environment Protection Investment Estimate and Environmental Gain & Loss Analysis
481
12.0 ENVIRONMENT PROTECTION INVESTMENT ESTIMATE AND
ENVIRONMENTAL GAIN & LOSS ANALYSIS
12.1 Environment Protection Investment Estimate
12.1.1 Preparation principles and basis
� The principle of “one shall treat the pollution which he causes, one shall protect the environment in which he develops” shall be followed. The investment required by measures of environment protection, monitoring and management taken for lessening or eliminating disadvantageous impacts on the environment by construction project, not only protecting the environment but also serving the main project, shall be included in the environment protection investment of the project, among which the investment of environmental protection nature of the project investment and resettlement investment and water and soil conservation investment will be listed separately, the others are the environment protection investment.
� “Giving prominence to the key point” principle shall be abided by. The environment factors having great impact by the project, causing public attentions and having higher protection grades shall be specially protected with environment protection investment priority.
� “Function resumption” principle. The compensation measures taken for disadvantageous impacts on the environment by the project shall be based on the principle of resuming the original functions. The investment increased due to standard raising or scale increase of relocation and revamping project shall be borne by local government or competent authorities or equity ownership.
�“Compensation just in one time” principle. Substitute compensation or reasonable compensation in one time as per specified standard shall be paid for the environment losses by the project which can not be resumed.
� Environment protection is one of the important items of the project whose cost composition, investment estimate basis and price level are consistent with those of the main project.
� “Design Estimate Preparation Method and Calculation Standard for Hydropower Project” (Edition 2002), (Public Notice No. 2002 (78) of State Trade and Economic Relation Commission).
12.1.2 Investment item classification
Article 62 of “Environment Protection Design Specification of Construction Project” specifies that units, equipment and monitoring means and engineering facilities required by pollution treatment and environment protection all belong to environment protection facilities and that construction project with environment protection facilities shall list out the investment estimate of environment protection facilities.
As per the regulations of “Environment Protection Design Estimate Preparation Specification for Water Resources and Hydropower Project”, together with environment protection work content of water resources and hydropower project, investment items are classified into five

12.0 Environment Protection Investment Estimate and Environmental Gain & Loss Analysis
482
parts: environment protection measures (including environment protection measures and environment monitoring measures), water and soil conservation measures, environment protection measures for resettlement, water and soil conservation measures for resettlement and reservoir area cleanup etc.
12.1.3 Environment protection investment estimate
The static environment protection investment of this project is estimated as per the price level of the first season of 2007.
12.1.3.1 Investment estimate of the environment protection measures of the project
� Investment estimate of water environment protection measures Investment of water environment protection measures is estimated as 7.19 million yuan. Details are shown in Table 12.11.
Table 12.1-1 Investment estimate summary of water environment protection measures
Stage Item
Civil construction
cost (104 yuan)
Equipment cost
(104 yuan)
Operating cost
(104 yuan)
Environment protection investment
�104 yuan� Sand & stone aggregate flushing waste water
treatment system at the pivotal left bank 20.0 60.0 50 130.0 Sand & stone aggregate flushing waste water
treatment system at the pivotal right bank 20.0 60.0 50 130.0 Concrete blending flushing waste water treatment system at the pivotal left bank 0.5 1.5 2.5 4.5 Concrete blending flushing waste water
treatment system at the pivotal right bank 0.5 1.5 2.5 4.5
Foundation pit drainage treatment measure 0.5 Maintenance system oil-contained waste water
treatment system at pivotal left bank 1.0 3.0 1.0 5.0 Maintenance system oil-contained waste water
treatment system at pivotal right bank 1.0 3.0 1.0 5.0 Domestic sewage treatment system at pivotal
left bank 5.0 25.0 35.0 65.0
Construction period
Domestic sewage treatment system at pivotal right bank 5.0 25.0 35.0 65.0
Total 409.5
Domestic sewage collection & treatment system 6.0 33.6 39.6
Oil contained wastewater collection & treatment system
3.5 12.0 15.5
Workboat jetty 20.0 20.0
Workboat 150.0 150.0
Caution board 4.4 4.4
800m oil boom, float, anchor, & anchor rope etc.
50.0
Operation period
2t Oil absorption felt and 1 oil absorber
30.0
Total 309.5
Environment protection investment estimate 719.0
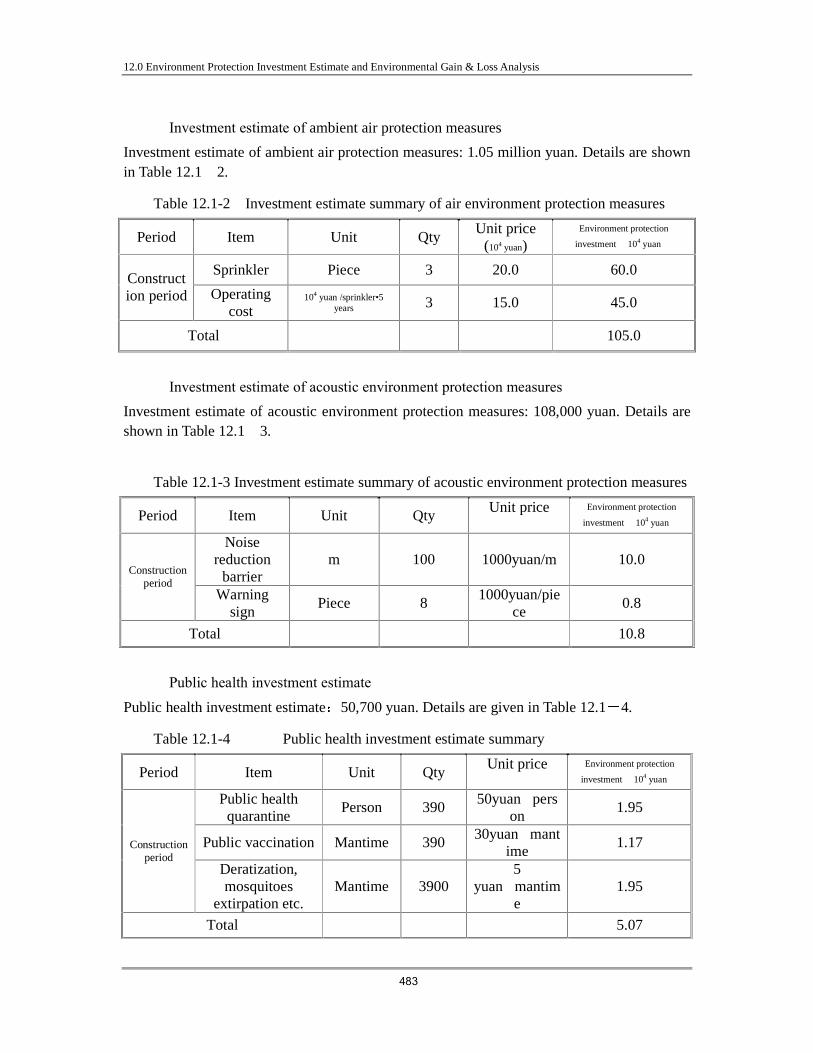
12.0 Environment Protection Investment Estimate and Environmental Gain & Loss Analysis
483
� Investment estimate of ambient air protection measures
Investment estimate of ambient air protection measures: 1.05 million yuan. Details are shown in Table 12.1 2.
Table 12.1-2 Investment estimate summary of air environment protection measures
Period Item Unit Qty Unit price
(104 yuan) Environment protection
investment�104 yuan�
Sprinkler Piece 3 20.0 60.0 Construction period Operating
cost 104 yuan /sprinkler•5
years 3 15.0 45.0
Total 105.0
� Investment estimate of acoustic environment protection measures Investment estimate of acoustic environment protection measures: 108,000 yuan. Details are shown in Table 12.1 3.
Table 12.1-3 Investment estimate summary of acoustic environment protection measures
Period Item Unit Qty Unit price
Environment protection
investment�104 yuan�
Noise reduction barrier
m 100 1000yuan/m 10.0 Construction
period Warning
sign Piece 8
1000yuan/piece
0.8
Total 10.8
� Public health investment estimate
Public health investment estimate50,700 yuan. Details are given in Table 12.14.
Table 12.1-4 Public health investment estimate summary
Period Item Unit Qty Unit price
Environment protection
investment�104 yuan�
Public health quarantine
Person 390 50yuan�pers
on 1.95
Public vaccination Mantime 390 30yuan�mant
ime 1.17 Construction
period Deratization, mosquitoes
extirpation etc. Mantime 3900
5 yuan�mantim
e 1.95
Total 5.07

12.0 Environment Protection Investment Estimate and Environmental Gain & Loss Analysis
484
� Solid waste treatment investment estimate
Solid waste treatment investment estimate: 112,000 yuan. Details are shown in Table 12.15.
Table 12.1-5 Solid waste treatment investment estimate summary
Period Item Unit Qty Unit price
Environment protection
investment�104
yuan� Construction period
Solid waste collection & disposal
Month
51 2000 yuan�m 10.2
Operation period
Solid waste collection & disposal (garbage bins)
Piece 50 200
yuan�piece 1.0
Total 11.1
�Investment estimate of ecological environment protection measures Investment estimate of ecological environment protection measures19.362 million yuan. Details are shown in Table 12.16.
Table 12.1-6 Investment estimate summary of ecological environment protection
measures
No Item Unit Qty Unit price
Environment protection
investment�104 yuan�
1 Old tree protection cost Item 1 655.06
2 Fish passing device
(Fish pass) Item 1 716.14
3 Fish proliferation and
fry laying station Item 1 500.00
4 Artificial fish nest Mu 2100 0.03 63.0
5 Ecological environment protection propaganda
during construction 2.0
Total 1936.2
12.1.3.2 Investment estimate of water and soil erosion prevention and treatment measures of
the project
Investment estimate of water and soil erosion work of the project is 14.8113 million yuan, including 5.5933 million yuan for engineering measures, 1.5921 million yuan for plant measures, 1.8928 million yuan for temporary work of construction, 2.0415 million yuan for separate cost, 667,200 yuan as basic contingency fee and 3.0244 million yuan as compensation fee of water and soil conservation devices.
12.1.3.3 Investment estimate of resettlement environment protection measures
Investment estimate of resettlement environment protection measures: 411,600 yuan. Details are shown in Table 12.17.

12.0 Environment Protection Investment Estimate and Environmental Gain & Loss Analysis
485
Table 12.1 7 Investment estimate of resettlement environment protection measures
No Item Description Unit Qty Unit price Total (104
yuan)
I. Environment protection measures
27.62
1 Domestic sewage
treatment Biogas generating pit
septic tank Piece 196 0.10 19.60
2 Public health Once quarantine, 80
yuan /mantime Mantime 356 0.01 3.56
3 Sanitary treatment Disinfection, garbage
disposal etc. hm2 4.46 1.00 4.46
II. Separate cost 11.21
1 Environment management fee 3.00
2 Environment supervision fee 3.00
3 Investigation and design fee 8% of total of Parts I ~ II. 2.21
4 Public health monitoring fee of reservoir area 3.00
III. Basic contingency fee 6% of total of Parts I ~ III. 2.33
Total 41.16
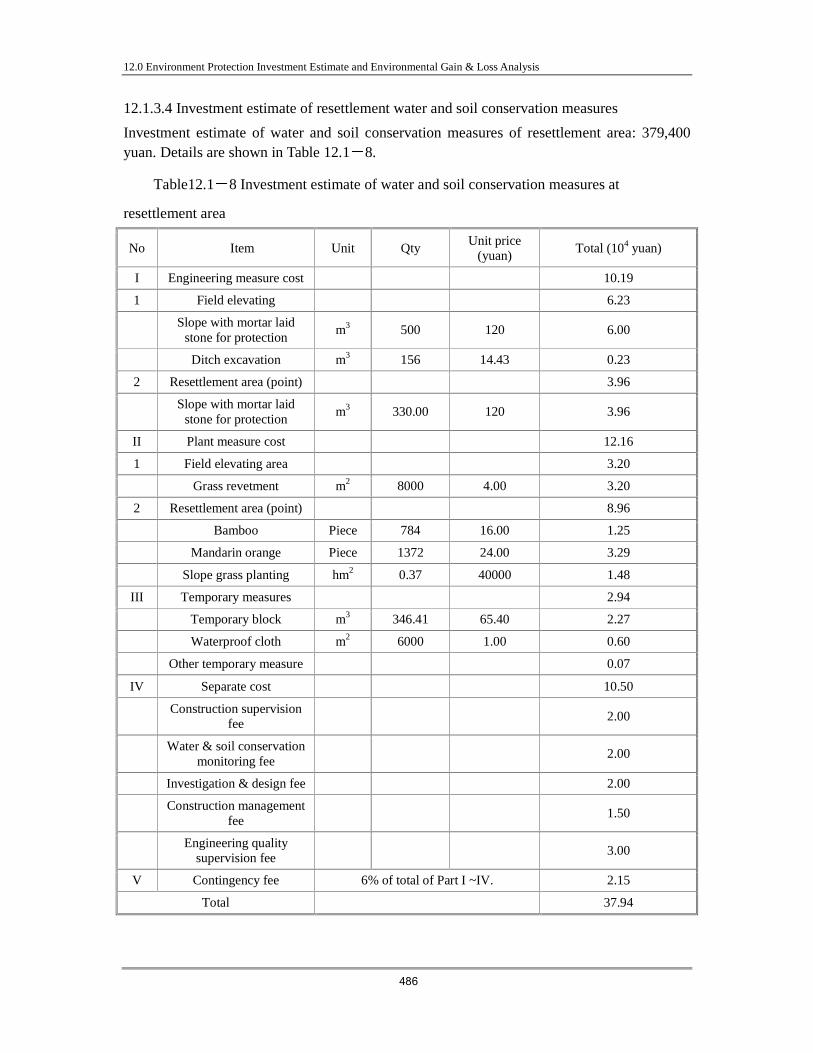
12.0 Environment Protection Investment Estimate and Environmental Gain & Loss Analysis
486
12.1.3.4 Investment estimate of resettlement water and soil conservation measures
Investment estimate of water and soil conservation measures of resettlement area: 379,400 yuan. Details are shown in Table 12.18.
Table12.1 8 Investment estimate of water and soil conservation measures at
resettlement area
No Item Unit Qty Unit price
(yuan) Total (104 yuan)
I Engineering measure cost 10.19
1 Field elevating 6.23
Slope with mortar laid
stone for protection m3 500 120 6.00
Ditch excavation m3 156 14.43 0.23
2 Resettlement area (point) 3.96
Slope with mortar laid
stone for protection m3 330.00 120 3.96
II Plant measure cost 12.16
1 Field elevating area 3.20
Grass revetment m2 8000 4.00 3.20
2 Resettlement area (point) 8.96
Bamboo Piece 784 16.00 1.25
Mandarin orange Piece 1372 24.00 3.29
Slope grass planting hm2 0.37 40000 1.48
III Temporary measures 2.94
Temporary block m3 346.41 65.40 2.27
Waterproof cloth m2 6000 1.00 0.60
Other temporary measure 0.07
IV Separate cost 10.50
Construction supervision
fee 2.00
Water & soil conservation
monitoring fee 2.00
Investigation & design fee 2.00
Construction management
fee 1.50
Engineering quality
supervision fee 3.00
V Contingency fee 6% of total of Part I ~IV. 2.15
Total 37.94

12.0 Environment Protection Investment Estimate and Environmental Gain & Loss Analysis
487
12.1.3.5 Investment estimate of reservoir bed cleanup
Investment estimate of reservoir bed cleanup is 170,600 yuan in total.
12.1.3.6 Total environment protection investment
The total investment of the project is 2.2268932 billion yuan, static environment protection investment is 71.1983 million yuan in total, including environment protection investment of 55.4254 million yuan, investment of water and soil erosion work of 14.8113 million yuan, resettlement environment protection investment of 411,600 yuan, investment for water and soil conservation measures at resettlement area of 379,400 yuan, and reservoir bed cleanup investment of 170,600 yuan. Environment protection investment accounts for 3.20% of the total investment of the project.
Total environment protection investment estimate of the project is shown in Table 12.19.

12.0 Environment Protection Investment Estimate and Environmental Gain & Loss Analysis
488
Table 12.1-9 Investment estimate summary of environment protection measures
No Item Unit Qty
Unit price (104
yuan)
Total (104 yuan) Remarks
Part�: Environment protection measure of the project
3204.77 Inc. special cost of environment protection of 6.8737 million yuan.
i Water environment protection cost 719
Inc. special cost of environment protection of 2.895 million yuan.
1 Water environment protection cost during construction period
409.5
Aggregate processing system flushing waste water system
Item 2 130.0 260.0 Included in the cost of
main project.
Flushing waste water treatment
system of concrete blending system
Item 2 4.5 9.0
Foundation pit drainage
treatment measures Item 1 0.5
Maintenance system oil-
contained waste water treatment system
Item 2 5.0 10
Domestic sewage treatment
system Item 2 65.0 130.0
Ditto
2 Water environment protection
fee during operation period 309.5
Domestic sewage collection &
treatment system Item 1 39.6 39.6
Special cost for environment protection
Oil contained wastewater
collection & treatment system Item 1 15.5 15.5 Ditto
Workboat jetty Item 1 20.0 20.0 Included in the cost of
main project.
Workboat Set 1 150.0 150.0 Special cost for
environment protection Caution board Item 22 0.2 4.4 Ditto
800m oil boom, float, anchor, &
anchor rope etc. Item 1 50.0 Ditto
2t Oil absorption felt and 1 oil
absorber Pcs 1 30.0 Ditto
ii Air environment protection cost 105.00
Incl. special cost for environment protection 144,000 yuan.
Sprinkler Piece 3 20.0 60.0 Included in the cost of main project.
Operating cost 45.0 Incl. special cost for environment protection 144,000 yuan.
iii Acoustic environment 10.80 Incl. special cost for

12.0 Environment Protection Investment Estimate and Environmental Gain & Loss Analysis
489
No Item Unit Qty
Unit price (104
yuan)
Total (104 yuan) Remarks
protection cost environment protection 100,000 yuan.
Noise reduction barrier m 100 0.1 10.0 Special cost for
environment protection
Warning sign Piece 8 0.1 0.8 Included in the cost of main project.
iv Cultural relic protection cost Item 1 50.00 Preliminarily considered cost
v Public health cost Item 1 5.07 Construction period: Special environment
protection item
vi Solid waste collection & disposal cost 11.2
Special cost for environment protection
Solid waste collection & disposal
during construction Item 10.2
Solid waste collection & disposal during operation (garbage bins)
Piece 50 0.02 1.0
vii Ecological environment protection cost 1936.2
Incl. special cost for environment protection 3.572 million yuan.
Old tree protection fee Item 1 655.06 Incl. special cost for environment protection 3.552 million yuan.
Fish passing devices (Fish pass) Item 1 716.14 Included in the cost of
main project.
Fish proliferation and fry laying
station Item 1 500.00
Artificial fish nest Mu 2100
0.03 63.0
Included in the basic contingency of main
project
Ecological environment
protection propaganda during construction
Item 1 2.0 Special cost for
environment protection
viii Risk prevention cost 367.50 Included in the cost of
main project.
Automatic regime monitoring and reporting system during
operation Item 1 367.5
Included in the cost of main project.
Part II: Environment monitoring cost during construction period
107.6 Incl. special cost for environment protection 576,000 yuan.
Water quality Year 5 3.0 15.0 Special cost for
environment protection Air Year 5 0.4 2 Ditto Noise Year 5 0.12 0.6 Ditto Aquatic ecology (fishes) Year 5 8.0 40.0 Ditto
Regime forecasting Year 5 4.0 20.0 Included in the cost of
main project.

12.0 Environment Protection Investment Estimate and Environmental Gain & Loss Analysis
490
No Item Unit Qty
Unit price (104
yuan)
Total (104 yuan) Remarks
Old trees Year 5 6.0 30.0 Ditto
Total of Part� � 3312.37 Incl. special cost for environment protection 7.4497 million yuan.

12.0 Environment Protection Investment Estimate and Environmental Gain & Loss Analysis
491
Table 12.1-9 Investment estimate summary of environment protection measures (Cont’d)
No Item Unit Qty
Unit price (104
yuan)
Total (104 yuan) Remarks
Part � Separate cost 659.08 Incl. special cost for environment protection 1.5498 million yuan.
i Environment management cost 52.9
7.1� of sum of Part I~II; Calculated as special cost for environment protection.
ii Environment protection
consultation fee 328.0
Incl. special cost for environment protection 754,000 yuan.
1 EIA cost 88.0 2 EIA review feet 30.0
Incl. in cost of preparation stage of the project
3 Consultation fee of fish pass and
fish proliferation station Item 30.0
4 Fish pass physical model test fee Item 60.0
5 Design fee of fish pass and fish
proliferation station Item 120.0
Incl. in total engineering design fee of the project
iii Environment protection training
fee 79.0
Incl. in total training cost of the project.
iv Environment supervision fee Manyear 24 6.0 196.5 Incl. special cost for
environment protection 240,000 yuan.
v Engineering quality supervision
fee 2.68
0.36% of sum of Part��� as special environment protection cost.
Total of Part� � 3971.45 Incl. special cost for environment protection 8.9995 million yuan.
Part � Basic contingency fee 238.29
6% of sum of Part�~�; including special cost for environment protection 540,000 yuan.
Part �: Environment monitoring & protection cost during operation
period 1332.8
1 Water quality Year 5 2.0 10.0 Special cost for
environment protection 2 Water temperature Year 5 2.0 10.0 Ditto 3 Noise Year 3 0.8 1.8 Ditto 4 Public health Year 10 1.0 6.0 Ditto
5 Regime forecasting Year 20 2.0 40.0 Included in the project
operating cost 6 Reservoir bank stabilization Year 5 1.0 5.0 Ditto

12.0 Environment Protection Investment Estimate and Environmental Gain & Loss Analysis
492
No Item Unit Qty
Unit price (104
yuan)
Total (104 yuan) Remarks
7 Soil submersion Year 5 3.0 15.0 Ditto 8 Old tree maintenance Year 5 30.0 150.0 Ditto
9 Contingency fee for old tree
emergent protection 150.0
Incl. in the basic contingency fee of the main project during construction; Included in the project operating cost during operation.
10 Terrestrial ecological system Year 5 3.0 15.0 Special cost for
environment protection
11 Fish proliferation and fry
pouring station Year 20 44.0 880.0
Executing long-term fry pouring for 20 years; Included in the project operating cost during operation.
12 Aquatic ecological system Year 5 10.0 50.0 Included in the project
operating cost 1. Environment protection investment
of the project 5542.54 Sum of Part� �
2. Investment of water & soil erosion prevention and treatment measure
1481.13
3. Resettlement environment protection investment
41.16
4. Water and soil conservation measure investment for resettlement
area 37.94
5. Reservoir bed cleanup investment 17.06 Static environment protection
investment in total 7119.83
12.2 Environment Economic Benefit Analysis
The Project is a comprehensive application project mainly featured as shipping one and compromised to generate hydropower and to control flood, having total installed capacity of 117MW and annual average generating capacity of 4.8×10⁸kW·h.
According to the with and without principle analysis, the national economic benefit of the project embodies mainly in shipping benefit, hydropower benefit, flood control benefit, replanting benefit of unapplied land etc.
� Shipping benefit Shipping benefit embodies mainly in saving of freight due to change of transport methods and reduction of transport cost due to application of large ships.
After completion of the project, with the improvement of channel conditions, part of goods is transferred to water transport from road transport, the transfer volume of freight is calculated on 20% of forecasted volume of freight, average road transport distance is considered as

12.0 Environment Protection Investment Estimate and Environmental Gain & Loss Analysis
493
30km, road transport unit price is based on the current Jiangxi road transport unit price of 0.5 yuan /tkm; water transport distance is considered as 38km, water transport unit price is based on the current Jiangxi water transport unit price of 0.15 yuan /tkm.
Benefit of national economy due to application of large ships after operation of the project is divided into near-future benefit and far-future benefit, the near future benefit is the saved channel regulation cost and maintenance fee, the far-future benefit is the benefit of national economy due to reduction of transport cost after application of large ships.
After the project is implemented, it can channelize 38km Kan River channel upstream the dam site (backwater to Taihe Pivot), by 2020 the upstream and downstream planned steps will have been completed, the channel of the Kan River from Ganzhou to Nanchang will reach Grade III channel standard, navigable to 1000 DWT ships all the year around. If this project is not implemented, with reference to similar channel regulation projects of the Kan River, the channel regulation cost is considered as 2.60 million yuan/km, meantime, since then, channel need to maintain each year, on the basis of maintenance fee of 50000 yuan/km, the channel regulation cost and channel maintenance fee are the near-future benefit of national economy of the project.
In the far-future to 2020, the channel of the Kan River from Ganzhou to Nanchang will reach Grade III channel standard, the Kan River shipping must be developing to application of large ships. Application of large ships is a gradual process, therefore, in the calculation with the project, average ship DWT is based on 500DWT, average ship DWT without the project is based on 80DWT. Because minerals and building materials among freight volume mostly belong to regional short-distance transport, therefore, the average transport distance with the project is considered as 35km. Through calculation of ship.day cost, the transport costs of 500DWT ship and 80DWT ship are respectively 0.03893 yuan/t·km and 0.09109 yuan/t·km saved unit transport cost is about 0.05215yuan/t·km.
� Hydropower benefit The project has a total installed capacity of 117MW and annual average generating capacity of 4.8×10⁸kW·h the annual hydropower benefit is 136.417 million yuan as per the annual cost of substituting thermal power station.
� Flood control benefit Flood control benefit is divided into direct benefit and indirect benefit. Both banks at the Kan River of the reservoir area is flat with rich land. Terrace at both banks of the Kan River trunk is normally 600 1400m wide, with ground elevation between 48 60m, population and farmland concentrated. The existing fending groynes along the Kan River are of low flood control standard with serious flood & waterlogging disaster. To minimize impacts of the reservoir inundation on local national economy and ecological environment, and to minimize land inundation, protection work measures are taken by the project in temporary inundation area or shallow inundation area or partly deep inundation area with protection work condition and with concentrated population and concentrated land. After implementation of the project, the flood control standard will be totally raised up to control a once-in-a-10-year flood and to protect farmland and population at both banks. Flood losses include losses of agriculture,

12.0 Environment Protection Investment Estimate and Environmental Gain & Loss Analysis
494
forestry, engineering facilities, communication and transport, individual, collective and national properties etc. Because flood losses of forestry and engineering facilities are hard to quantitatively calculate, so only flood losses of agriculture and population due to inundation are calculated and included. Annual average flood control benefit is the annual average loss before implementation of flood control works, i.e. direct benefit is 19.025 million yuan. The indirect benefit is the loss caused by flood loss, which can not be quantized, such as disease spreading, rising prices, loss of work time etc. Indirect benefit is calculated on basis of 20% of direct benefit.
After the project is implemented, the annual average flood control benefit is 22.831 million yuan.
� Replanting benefit of unapplied land
At present, there are altogether 12695 Mu unapplied land below a once-in-a-10-year flood without benefit. After implementation of the project, these lands can be used for planting grain crops and for developing mixed farming, which will bring considerable economic benefit and social benefit.
12.3 Analysis of Loss due to Environmental Impacts
The construction of the project without adopting relevant protection measures may cause environmental loss, which includes mainly the discharge of pollutants during the construction period, the uprise of incidence of diseases among the construction workers, the interference of the growing environment of animals and plants, the obstruction of the dam, the serious damage to the growing environment of fishes and flooding historical cultural sites due to the water flow from the dam and the malaria spreading etc. Disadvantageous impacts on environment can be avoided or lessened through adopting measures. The environmental loss is about equal to the total sum of the cost of protection measures for disadvantageous influence and the relevant cost of environmental protection management and control. The total investment of the project is 2.2268932 billion yuan, the static investment on environmental protection is 71.1983 million yuan, which amounts to 3.20% of the total project investment.
12.3.1 Analysis of Environmental Economic Loss Environmental economic loss includes the necessary investment for avoiding or reducing the environmental loss, totaling 71.1983 million yuan. The average annual value of loss is 3.5599 million yuan during 20 years’ operation.
12.3.2 Analysis of Environmental Economic Benefit

12.0 Environment Protection Investment Estimate and Environmental Gain & Loss Analysis
495
� Water power is to be used as the clean energy source, which can greatly reduce the discharges of the wastes, and its environmental benefits can be calculated based on the equivalent environmental investment of thermal power plant on the coequal scale, which can be saved if water power is used. The total investment of thermal power plant of coequal scale is about 600 million yuan, to satisfy the national environment protection requirement, its environment protection investment normally accounts for 12% of the total investment, i.e. 72 million yuan; As per the requirement of SEPA, thermal power plant is allowed to discharge 0.9g SO2/kWh, 512.2t SO2/a, it is roughly calculated that SO2 discharge fee to be levied each year is 308,000 yuan on the basis of 0.6 yuan/kg SO2. Therefore, the annual investment for E.P. will be RMB4.8 million if the E.P. establishments can be used for 15 years. The operating cost of environmental protection facilities is RMB 200 thousand each year. So it can be calculated that annual average environment loss by thermal power plant RMB 5.3008 million can be saved each year after operation of the project. 12.3.3 Analysis of Loss and Benefit of Environmental Economy Ratio of Loss and Benefit = value of annual environmental loss / value of annual environmental benefit The annual average environmental loss is RMB 3.5599 million and the annual average environmental benefit is RMB 5.3008 million, so the ratio being 1:1.49. Therefore, the economic benefits brought by the environmental investment is larger than the environmental loss. This project can bring remarkable social benefits, economic and environmental benefits as well.

13.0 Public Consultation
496
13.0 PUBLIC CONSULTATION
Public participation and consultation is an important part of the work of estimating the environmental influences of the project construction as well as a kind of bi-directional exchange between the owner, EIA unit and the public. Through public participation and consultation, the environmental problems cared by the public can be really understood so as to assist the related authorities with preparing practical and reliable environmental protection measures so that the environmental estimation of the project to be constructed can be more open to the public and the conclusion is more practical just to ensure the project can realize its expected social and economic benefit. The Project construction is to indirectly and directly influence the economic and cultural lives of the residents around the project site in many aspects, especially, for example the problems such as relocation and resettlement and land acquisition and so on that are involved in the immediate interests of the public. Therefore, it is very necessary to carry out public participation and consultation.
13.1 Objectives of Public Participation
� To make the public understand the objective and scale of the construction of the project and construction place as well as the influences on the areas around the project in related aspects after it is built and the countermeasures and measures to be adopted, and to let the public express their opinions so as to get understanding, support and cooperation of the public; � Through the local residents’ consultation results about the personal experience in the inhabited and living environment, it can help analyze the characteristics of the polluted environment in this area and the existing quality level of the environmental factors so as to reflect the objective degree of the environmental estimation and protect the immediate interest of the affected people; � The public are similar with the resources such as natural ecology, economic development, values of consumer goods involved in EIA, through public participation, they are invited to participate in confirming the measures of protecting resources and environment; in this way, their requirements can be understood; as a result, various environmental protection measures put forward in this project will be more practical and effective; � To make the public have chance to participate in discussing the construction feasibility of the project.
13.2 Performance of Public Participation and Poll
13.2.1 Scope of public poll
Public poll covers the area of Taihe County where the project is situated (Both banks of the Kan River), the surrounding area of the reservoir area, all the affected villages with land acquired etc. basically all the possibly affected areas.

13.0 Public Consultation
497
13.2.2 Respondents
To assure the public poll results abroad representative, the respondents can be classified as follows: (1). Affected residents, enterprises and institutions, and relocated households; (2). NGO: township government, village committee, civil organizations and social groups. (3). Government departments: local environment protection bureau, water conservancy departments, forestry departments, communications departments, cultural bureaus, etc.
13.2.3 Investigation method
The following forms for public participation and poll are applied:
z�Public symposia, to be held in the township government, village committee and affected
villagers’ homes which may be attended even by the illiterate people;
z�Public opinion survey, using a pre-prepared questionnaire;
z�Official notice (Open to the public): � Information open to the public via the Internet. �Put the EIA of the Shihutang Shipping and Hydropower Pivotal Project at the Shihutang Project Office at the second floor of Taihe County Government Building for public reference. Put the Concise EIA of the Shihutang Shipping and Hydropower Pivotal Project at the governments of Wanhe Township, Tangzhou Township, Yanxi Township, Chengjiang Township and Mashi Township, and Wushan Reclamation Farm Office for public reference.
13.2.4 Investigation content
Investigation content: Explain to the affected people the scope and content of the Project, investigate the understanding of the respondents on the Project, their attitudes on environment pollution impacts and the most concerned issue on the Project.
13.2.5 Investigation process
� Public symposium of the first round After accepting the EIA work entrustment of the Project by the Owner, the EIA contractor – SHCC consulted and held symposiums with 132 people in October 2006, including the affected households, affected people, affected village committees, township governments, and related functional departments of the environment protection, water conservancy, forestry and communications of Taihe County.

13.0 Public Consultation
498
Symposium with the villagers at Shihutang Village
Environment impact placard Environment impact symposium at Caoping Village
at Wanhe Township Government
� Public participation and investigation of the first round
After accepting the EIA work entrustment of the Project by the Owner, the EIA contractor – SHCC organized public poll in the form of distributing questionnaires in October 2006. Detailed are presented in Table 19. After the questionnaires were distributed to the respondents, those questionnaires were signed by the respondents proper, filled with the work unit, sex, age, nationality, education, professional title, post, address, and contact method etc., finally SHCC sorted out, summarized and analyzed the collected questionnaires.
� Official placard in the Internet of the first round After accepting the EIA work entrustment of the Project by the Owner and having prepared the EIA Outlines, on April 10, 2007 SHCC posted the following contents on the Jiangxi Navigational Affair Information Website (www.jxhw.gov.cn): Brief introduction to the Project; main environment problems which may be caused during and after implementation of the Project; the Owner and their contact methods; EIA contractor and their contact methods; public comments feedback methods etc., provided the public inquiry, consultation and disambiguation services.

13.0 Public Consultation
499
Official placard in the Internet of the first round
�Public symposium of the second round
After having prepared the draft of the EIA of the Project, the EIA contractor – SHCC consulted and held symposiums with 156 people in May 2005, including the affected households, affected people, affected village committees, township governments, and related functional departments of the environment protection, water conservancy, forestry and communications of Taihe County.
� Public participation and investigation of the second round
After having prepared the draft of the EIA of the Project, the EIA contractor – SHCC organized public poll in the form of distributing questionnaires in May 2007. After the questionnaires were distributed to the respondents, those questionnaires were signed by the respondents proper, filled with the work unit, sex, age, nationality, education, professional title, post, address, and contact method etc., finally SHCC sorted out, summarized and analyzed the collected questionnaires.
� Official placard in the Internet of the second round After having prepared the draft of the EIA of the Project, on April 10, 2007 SHCC posted the following contents on the Jiangxi Navigational Affair Information Website (www.jxhw.gov.cn): Simplified EIA of the Project, the Owner and their contact methods; EIA contractor and their contact methods; public comments feedback methods etc., provided the public inquiry, consultation and disambiguation services.

13.0 Public Consultation
500
Environment impact placard at Shihutang Village Environment impact symposium at Shihutang Village
Environment impact placard at Caoping Village Environment impact symposium at Pingshang Village
Official placard in the Internet of the second round

13.0 Public Consultation
501
13.3 Public Poll Results
13.3.1 Public poll results of the first round
104 questionnaires are released for public participation in this survey, of which 102 are returned effectively and the rate of return is 98.1%. The sex proportion, age structure, education background, and profession distribution of the persons participating in the survey are described as below:
� Sex proportion: 83.3% male, 16.7% female;
� Age structure: 15.7% younger than 30�51.0% between 30�50, 32.3% older than 50�
� Education background: 36.3% junior college and higher, 27.59% high school, 29.4%
junior high school and 6.8% primary school.
� Profession distribution: 29.4% cadres, 36.3% farmers, 30.3% workers and 4% others.
The following collected public opinions and suggestions are summarized in Table 13.3-1.
According to the survey results, the following collected opinions and suggestions are obtained:
�The degree of understanding this project Among the persons surveyed, as to the question that do you know the construction of the project related to yourself? The ones who understand the information account for 92.6%, the ones who do not understand the information about the project so much account for 6.9%, in addition, the ones accounting for 0.5% are not clear about the project; Through public symposia, 100% of the public express to support construction of the project. � The opinions to the land acquisition, relocation and resettlement Among the surveyed persons, as to the question that do you know the policy of compensation for relocation, the ones who know this policy account for 40.2%, the ones who does not know the policy accounts for 59.8%; when asked the question whether they obey relocation, 7 households disobey the relocation, the other households affected express to obey relocation. Those seven households all are the villagers of Caoping Village of Xinzhou, the main reason they are not willing to relocate is that they can earn higher incomes from crops planted in Xinzhou and they are worrying about future incomes of crops planted in the newly allocated land not as high as present ones. � The influences on the environment from the construction of the project and the countermeasures

13.0 Public Consultation
502
After the workers answer some questions, most of the public (accounting for 81.4%) think the influence on the water environment from the construction of the project is the largest, 29.4% of them think the construction of the project will have great influences on the agricultural production, 23.5% think the construction of the project will have influences on ecological environment. As to the measures that shall be taken to slow down the influences on the environment, 79.4% think the measure of improving it in limited period is a very good measure; 6.8% require to strengthen management or to take other measures.
13.3.2 Suggestions of the respondents of public symposium and questionnaire survey of the
first round
The main suggestions of the respondents are as follows: to employ local labors as many as possible during construction; to build a new bridge and fending groyne at Xinzhou; To minimize to occupy farmland and woodland; to build the project simultaneously with ecological work; to assure relocation and resettlement fund paid to the affected people; to commence the project construction as soon as possible and to benefit local people; to simultaneously well build water conservancy and flood control facilities; to completely solve the waterlogging problem; to earnestly protect the ecological environment at the surrounding of the reservoir area and to well resettle the relocated people; to protect farmland from being occupied, and improve farming condition at the surrounding of the reservoir area; to recommend to the dam open to traffic etc.

13.0 Public Consultation
503
Table 13.3-1 Summary of questionnaire survey with the participation of the public
No Question Comments Proportion(%) Remarks Yes 100
1 Do you support the construction of the
project? No /
Clear 92.6 Not too clear 6.9 2
Do you know the construction of the project related to yourself?
No clear 0.5
Satisfactory 92.2 So-so 7.8 3
Degree of satisfaction on the current environment of the area in which the project is
involved. Dissatisfactory /
Atmosphere 2.9 Water 72.5 Noise 9.8
Ecology 23.5 Others /
4 What are the main environment problems of the area where the project is involved?
Non 11.8
Majority select
answers of 2 or more.
Atmosphere 3.9 Ecology 23.5 Noise 6.9 Water 81.4
Drink water source
11.8
Agricultural production
29.4
Town landscape 12.7 Others /
5 What are the environment issues which shall
draw emphatical attention?
Non 1.9
Majority select
answers of 2 or more.
Increased 90.2 Decreased 3.9 6
Impacts of the project construction on the living quality of surrounding residents?
Not apparent 5.9
Advantageous 98.0 Not apparent 1.0 7
Whether the project is advantageous or not to regional economic development and water
transport development? Disadvantageous 1.0
EP measures by the project
79.4
To build the project in
another place 1
To strengthen management
2.9
8 What measures shall be taken to mitigate
pollution?
Others 3.9
Yes 40.2 9
Do you know the policy of compensation for relocation? No 59.8
Same village & town
97.1 10 The place you want to be resettled?
Other village 2.9
Yes 39.2
11 Do you obey the decision of relocation
and resettlement? No 6.8
54.0% are not involved
in relocation.
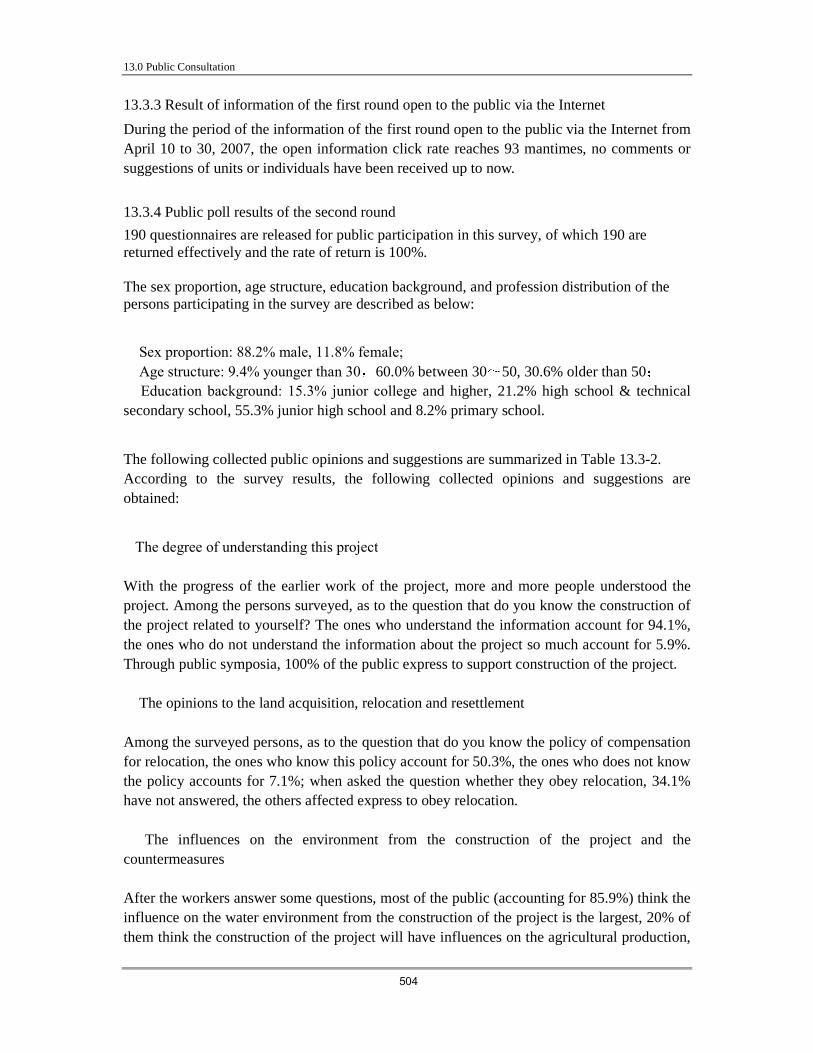
13.0 Public Consultation
504
13.3.3 Result of information of the first round open to the public via the Internet
During the period of the information of the first round open to the public via the Internet from April 10 to 30, 2007, the open information click rate reaches 93 mantimes, no comments or suggestions of units or individuals have been received up to now.
13.3.4 Public poll results of the second round
190 questionnaires are released for public participation in this survey, of which 190 are returned effectively and the rate of return is 100%. The sex proportion, age structure, education background, and profession distribution of the persons participating in the survey are described as below:
� Sex proportion: 88.2% male, 11.8% female; � Age structure: 9.4% younger than 30 60.0% between 3050, 30.6% older than 50 � Education background: 15.3% junior college and higher, 21.2% high school & technical secondary school, 55.3% junior high school and 8.2% primary school.
The following collected public opinions and suggestions are summarized in Table 13.3-2. According to the survey results, the following collected opinions and suggestions are obtained:
�The degree of understanding this project With the progress of the earlier work of the project, more and more people understood the project. Among the persons surveyed, as to the question that do you know the construction of the project related to yourself? The ones who understand the information account for 94.1%, the ones who do not understand the information about the project so much account for 5.9%. Through public symposia, 100% of the public express to support construction of the project. � The opinions to the land acquisition, relocation and resettlement Among the surveyed persons, as to the question that do you know the policy of compensation for relocation, the ones who know this policy account for 50.3%, the ones who does not know the policy accounts for 7.1%; when asked the question whether they obey relocation, 34.1% have not answered, the others affected express to obey relocation. � The influences on the environment from the construction of the project and the countermeasures After the workers answer some questions, most of the public (accounting for 85.9%) think the influence on the water environment from the construction of the project is the largest, 20% of them think the construction of the project will have influences on the agricultural production,

13.0 Public Consultation
505
10.6% think the construction of the project will have influences on ecological environment. As to the measures that shall be taken to slow down the influences on the environment, 82.4% think the measure of improving it in limited period is a very good measure; 60% require to strengthen management.
13.3.5 Suggestions of the respondents of public symposium and questionnaire survey of the
second round
The main suggestions of the respondents are as follows: to employ local labors as many as possible during construction; to well protect the ancestral temple of the village during relocation of Pingshang Village; to assure the project quality during construction; to assure relocation and resettlement fund paid to the affected people; to commence the project construction as soon as possible and to benefit local people; to simultaneously well build water conservancy and flood control facilities; to earnestly protect the ecological environment at the surrounding of the reservoir area and to well resettle the relocated people; to protect farmland from being occupied, and improve farming condition at the surrounding of the reservoir area; to recommend to the dam open to traffic etc.

13.0 Public Consultation
506
Table 13.3-2 Summary of questionnaire survey with the participation of the public No Question Comments Proportion(%) Remarks
Yes 100 1
Do you support the construction of the project? No /
Clear 94.1 Not too clear 5.9 2
Do you know the construction of the project related to yourself?
No clear /
Satisfactory 96.5 So-so 3.5 3
Degree of satisfaction on the current environment of the area in which the project is
involved. Dissatisfactory /
Atmosphere 5.9 Water 87.1 Noise 7.1
Ecology 15.3 Others /
4 What are the main environment problems of the area where the project is involved?
Non /
Majority select answers of 2 or more.
Atmosphere 4.7 Ecology 10.6 Noise 3.5 Water 85.9
Drink water source
2.4
Agricultural production
20
Town landscape 8.2 Others /
5 What are the environment issues which shall
draw emphatical attention?
Non /
Majority select answers of 2 or more.
Increased 95.3 Decreased 4.7 6
Impacts of the project construction on the living quality of surrounding residents?
Not apparent /
Advantageous 100.0 Not apparent / 7
Whether the project is advantageous or not to regional economic development and water
transport development? Disadvantageous /
EP measures by the project
82.4
To build the project in
another place /
To strengthen management
60.0
8 What measures shall be taken to mitigate
pollution?
Others /
Majority select answers of 2 or more.
Yes 50.3 9
Do you know the policy of compensation for relocation? No 7.1
42.6% have not answered
Same village & town
64.7 10 The place you want to be resettled?
Other village /
35.6% have not answered
Yes 65.9 11
Do you obey the decision of relocation and resettlement? No /
34.1% have not
answered

13.0 Public Consultation
507
13.3.6 Result of information of the second round open to the public via the Internet
During the period of the information of the second round open to the public via the Internet from June, 2007, the open information click rate reaches 128 mantimes, no comments or suggestions of units or individuals have been received up to now.
13.3.7 Official notice on newspaper
After the EIA is prepared, it will be placed at the third floor of Taihe County Government Building for public reference. Put the Concise EIA of the Shihutang Shipping and Hydropower Pivotal Project at the governments of Wanhe Township, Tangzhou Township, Yanxi Township, Chengjiang Township and Mashi Township, and Wushan Reclamation Farm Office for public reference. In October 2007, official notice was posted on the Jinggangshan Newspaper (No.1 newspaper at the location of the Project) for public reference. Up to now no comments or suggestions of individuals or units have been received.
13.4 Acceptance of Public Comments
�Seven households are worrying about future incomes of crops planted in the newly allocated land not as high as present ones. SHCC has feedbacked this information to the Owner. The Owner answers that the latest national and local compensation standards will be implemented by the Project (the compensation sum will be greatly raised than before) and the compensation standards have been included into the Feasibility Study Report and RAP of the

13.0 Public Consultation
508
Project, which will be under supervision of the World Bank during implementation. Item 6.6 Resettlement of Chapter 6.0 – Environment Impact Assessment and Chapter 10.0 Environment Protection Measures of this Report analyzes their concern. � As for the suggestion that local labors should be employed as many as possible during construction of the project, SHCC has feedbacked this information to the Owner. The Owner answers that local labors are surely to be employed during construction of the project; During construction bidding of the project, construction contractor is required to employ local labors as many as possible under the premise of guaranteeing quality, schedule of the project and same labor cost. � As for the suggestion that a new bridge and fending groyne be built at Xinzhou Islet, SHCC has feedbacked this information to the Owner and Taihe County People’s Government. According to the introduction of the Owner and Taihe County People’s Government, this suggestion will not be considered through integrated consideration of the project investment, overall county development plan, flood control safety and convenient traffic of the residents on Xinzhou Islet, future tourism development plan, aquatic ecological environment protection and convenient environment management. � As for the suggestion that farmland be minimized to occupy by the project, SHCC has feedbacked this information to the Owner. The Owner answers that, in order to meet the requirements of realm and resource department and environment protection department and in order to reduce the project investment, occupation of farmland by the Project will be minimized, the quantity of farmland to be occupied by the Project has been reduced from more than 6000Mu at Prefeasibility Study Stage to the current 2977.3Mu. Item 6.2 Ecological Environment and Item 6.3 Water and Soil Conservation of Chapter 6.0 – Environment Impact Assessment and Chapter 10.0 Environment Protection Measures of this Report analyzes their concern. � As for the suggestion that the project should be constructed simultaneously with ecological work, SHCC has feedbacked this information to the Owner. The Owner answers that the environment protection work and water and soil conservancy work shall be implemented simultanesouly with the main Project. Item 6.2 Ecological Environment and Item 6.3 Water and Soil Conservation of Chapter 6.0 – Environment Impact Assessment and Chapter 10.0 Environment Protection Measures of this Report analyzes their concern. �As for the request to assure relocation and resettlement fund paid to the affected people, SHCC has feedbacked this information to the Owner, the Owner promised to assure relocation and resettlement fund paid to the affected people in time as per the specified sum. Item 6.6 Resettlement of Chapter 6.0 – Environment Impact Assessment and Chapter 10.0 Environment Protection Measures of this Report analyze and answers their concern. �As for the suggestion to commence the project construction as soon as possible and to benefit local people SHCC has feedbacked this information to the Owner, the Owner
13.0 Public Consultation
509
expressed to stringently execute national approval procedure of construction project and to seize the time to try to commence the project construction as soon as possible. �As for the suggestion to simultaneously well build water conservancy and flood control facilities and to completely solve the waterlogging problem, the project is to construct five protection areas (including fending groynes and drainage pumping stations) of Taihe County seat, Wanhe, Yongchang, Yanxi and Zhangtang. The present flood control standard for once-every-2~5-year flood of both banks of the Kan River will be upgraded into flood control standard for once-every-20-year flood. Chapter 2.0 Project Overview, Item 6.6 Resettlement of Chapter 6.0 – Environment Impact Assessment and Chapter 10.0 Environment Protection Measures of this Report analyze and answers their concern. �As for the suggestion to protect farmland from being occupied, and improve farming condition at the surrounding of the reservoir area, the plans of farmland elevating and five protection areas are raised in the engineering design, which are advantageous to protecting farmland and to improving farming conditions at the surrounding of the reservoir area. �The suggestion that the dam should be open to traffic, which has been accepted in the engineering design. �As for the suggestion that the ancestral temple of the village should be well protected during relocation of Pingshang Village, SHCC has feedbacked this information to the Owner, the Owner expressed to keep it in the fending groyne line arrangement of the next stage.

14.0 Accumulated Impact Analysis
510
14.0 ACCUMULATED IMPACT ANALYSIS
The approved Jiangxi Kan River Drainage Area Planning Report recommends two trunk stream cascade development plans I and V through analysis on antiflood, hydropower generation, shipping, water resource application, construction condition, investment, cost and benefit etc. Plan I is an eight-step development plan, from upstream to downstream is Xiashan, Maodian, Wanan, Taihe, Shihutang, Xiajiang, Yongtai and Longtoushan. Plan V is a ten-step development plan, from upstream to downstream is Bai’e, Baikoutang, Xiashan, Maodian, Wanan, Taihe, Shihutang, Xiajiang, Yongtai and Longtoushan. The two plans are the same just at the river section downstream Ganzhou, i.e. six steps of Wanan, Taihe, Shihutang, Xiajiang, Yongtai and Longtoushan are arranged. At present, among the planned 6 steps of the Kan River downstream Ganzhou, the Wan’an step was put into operation in 1993, because the two downstream steps of Yongtai and Longtoushan are situated at the flat country of lower reaches of the Kan River, having great impacts of reservoir area inundation, higher investments, poor step economic figures, they are difficult to implement in the near future. In addition, among the three steps, the preparation work of the Taihe step between Wan’an and Shihutang Steps has been organized to do by power department; The Xiajiang step downstream the Shihutang step is the flood control project of the Kan River. The project proposal has been prepared by water conservancy department, the project is to commence to build within the Eleventh-Five-Year Plan; The Shihutang Project has been listed into the Eleventh-Five-Year Plan of the Ministry of Communications and into an important project of Eleventh-Five-Year Plan by the Jiangxi Provincial People’s Government; The State Development and Reform Commission will list this project into 2007~2009 alternative projects to use the World Bank loan, and has approved to establish this project in the document No. [2007]717 “Official Reply of the State Development and Reform Commission to the Proposal of the Shihutang Shipping and Hydropower Pivotal Project at the Kan River”, it is planned to commence construction of the project in 2008 and to put into operation in 2012. Step construction is short-term behavior, in views of individual construction, the impacts would be small. However, with the time passes, some impacts will turn serious due to the cumulative effects. Because these projects are similar, the impacts on the environment are also similar. Such impacts will have cumulative effects. The cumulative effects of the proposed project and the step construction of the Kan River drainage area are shown in Table 14.0-1.
14.1 Analysis of Impacts of River Hydrology and Sediment
With the gradual construction of the planned steps, the existing river will be divided into different sections, each of which will become a river-type reservoir. The water flow is slowered, water amplitude becomes less and the flow also undergoes obvious changes. Especially in low water period, the river can keep at a designed flow that will be higher than that in the natural river channel. In view of the prediction of each individual junction, it can be seen that, even water is released in flood period and most sand are carried away by flood,

14.0 Accumulated Impact Analysis
511
there are still some quantity of sand sediment in the reservoir. After completion of the multiple steps, even with flood releasing, due to the blocking gate in the floodway, flood releasing will be somewhat hampered and so some sand sediment shall be intercepted and silted in the reservoir.
Because the Shihutang Project is of runoff type development mode, and the beneficial reservoir capacity of the reservoir is very small, hardly having control performance on runoff, it can realize daily regulation of the Jiangxi power consumption peak only after it runs synchronously with the Wan’an Hydropower Station, i.e. the beneficial operating mode of the Shihutang Hydropower Station is basically to apply the release flow of the Wan’an Hydropower Station plus sectional flow as power generating flow of the Shihutang Hydropower Station. The annual, monthly and daily average flows and levels at the downstream of the Shihutang dam at design representative year are the same with the current runoffs and levels at the downstream of the Shihutang dam at design representative year. Therefore, construction of the Shihutang Project will cause very tiny impacts on the annual, monthly and daily average flows and levels at the downstream of the Shihutang dam at design representative year. Because upstream two steps have stronger regulating performance on runoff, so majority of cumulative impacts on the downstream of the Shihutang dam are impacts caused by the upstream two steps.

14.0 Accumulated Impact Analysis
512
Table 14.0-1 Matrix Table for Cumulative effects of the Project
Cumulative effects
Project Factors of impacts Characteristics of Impacts
Degree of Impacts
Ecological environment
Terrestrial & aquatic organisms & local ecological system
Serious
Social environment Promotion of regional economic development
Medium
Surface water environment
Water quality Light
Ambient air Fuel waste gas of ships Light
Acoustic environment
Noise Light
River hydrology Change of river flow pattern and sand sediment
Medium
Natural landscape Natural landscape Light
Local climate Climate factors of temperature, humidity
Very Light
Shihutang Project
Public health Health Light
Ecological environment
Terrestrial & aquatic organisms & local ecological system
Serious
Social environment Promotion of regional economic development
Medium
Surface water environment
Water quality Medium
Ambient air Fuel waste gas of ships Light
Acoustic environment
Noise Light
River hydrology Change of river flow pattern and sand sediment
Medium
Natural landscape Natural landscape Light
Local climate Climate factors of temperature, humidity
Light
Kan River Drainage
Area Development
Public health Health Light

14.0 Accumulated Impact Analysis
513
14.2 Analysis of Cumulative Impacts on the Surface Water Environment
Construction of the Kan River steps will lower the water velocity in each reaches of the channel, degrade the degradation capacity of the river water and further deteriorate the water quality. Prediction of the single pivot also reflects the same point. Discharge equal quantities of pollutants into two kinds of river water, one is water before construction of the pivot and the other after. As a result, water quality of the former is better than the latter. After completion of multiple steps, quality of water from the upper step is already contaminated, and water quality of steps in the lower reaches will be accumulated to be worse and worse, so construction of Kan River steps will cause obvious cumulative impacts on water quality in the lower reaches, especially in case of short reaches of the channel.
14.3 Analysis of Cumulative Impacts on the Ecological Environment
� Terrestrial organism Cascade development of the Kan River will inundate an abroad area, greatly damage the existent habitat of terrestrial organism, force the existent space of terrestrial organism to migrate to high level or zone far away from the reservoir area, result in reduction of the existent space of terrestrial animals and disappearance of terrestrial plans of a large area due to abrupt change of water and land environment. From the angle of organism species, no animals and plants in severe danger are found within the scope of the reservoir area, population quantities of terrestrial animals and plants will not be reduced.
� Aquatic organism Generally speaking, cascade development of the Kan River will cause a certain impacts on aquatic animals. As for migratory fishes, steps will obstruct their migrating passage, cause them impossible to migrate. When a single dam is built, these fishes can find the environment downstream which suit to live for them, while construction of several steps is involved in longer channel, the upmost step and downmost step have a too far distance, their environment difference will be great, many fishes may be hard to exist because of great difference, causing their quantity gradually reduced. Obstruction of the dam will cause impacts only on two fishes, one is migratory fish, the other is the fish with a large activity space. For algae fonding of deep water and slow flow, after cascade construction, it will slow down the flows of different river sections, increase the water depths and width, it will promote growth of the algae of that species. Meantime, due to decline of degradation capacity of the reservoir area on organic matters, plankton will have more sufficient foods and thus increase their reproductive force, quantity and species of plankton will be in the tendency of increase.

14.0 Accumulated Impact Analysis
514
14.4 Analysis of Cumulative Impacts on the Social Environment
With gradual construction of the planned multiple steps in the Kan River, the navigating capacity of the Kan River will be improved, which will promote the exploitation of rich mineral resources in Jiangxi province, and drive the economic construction and development in the middle and lower reaches of Kan River, especially Ji’an City and Taihe County, thus drive the regional economic development, increase more job opportunities, and improve the regional economic situation.
14.5 Cumulative Impacts on Ambient Air
Construction of the Kan River steps will not produce air pollutants itself. However, step construction will increase the navigating capacities of the Kan River. This means that there will be more ships waiting for passing the cascade ship lock, which will discharge more waste gas. Therefore, the nearby air environmental quality will be affected by the waste gas discharged by the passing ships. After completion of the whole steps in the planning of the Kan River, the transporting capacity and volume of freight will be bigger and there will be more and more ships. So the neighboring ambient air quality will gradually deteriorate along with the completion of the steps. However, according to the estimated number of ships, even by 2020, waste gas of ships will not make the air quality nearby the ship lock lower than the corresponding standard.
14.6 Analysis of Impacts on Acoustic Environment
With gradual construction of the planned multiple steps in the Kan River, the navigating capacity of the Kan River will be improved. The passing ships will increase and the waiting ships for passing the ship lock will also increase. Therefore, the mechanical noises produced by ships will also worsen some impacts on the neighboring environment in the scope and degree of impact.
14.7 Analysis of Impacts on Natural Landscape
With the gradual construction of the planned steps, the natural channel of the Kan River will be divided into 9 (or 11) sections, 8 (or 10) of which are river-type reservoirs, and this will wholly change the landscape along Kan River. Although it imposes little impact on the value of sight enjoyment, it destroys to a certain extent the continuity and completeness of natural landscape along Kan River.
14.8 Analysis of Impacts on Local Climate
The Project belongs to a river-type reservoir that will have a very small scope of impacts on the climate, which shall be limited to the range of 2km from riversides in a limited degree. After completion of the multiple steps, the river sections shall remain the previous river

14.0 Accumulated Impact Analysis
515
channels, and the impacts on climate are only limited to the neighboring areas of the river sections. The superpositional impacts shall be very much limited. Therefore, the construction of multiple steps will not have cumulative effects on the climate.
14.9 Analysis of Impacts on Public Health
According to the prediction of the Project, completion of the project will not have obvious impacts on the health of the neighboring residents. Due to the construction of the multiple steps, the water in the Kan River will be deeper than that in the previous natural river channel. All reservoirs belong to river-type reservoirs. In flood time, the flood will be released to the lower reservoirs. Even though with different water quality and the upper reservoirs will somewhat affect the lower reservoirs, due to the limited influence from upper reservoirs, the degree of cumulative effects will be limited. From the above analysis, it can be seen that, construction of multiple steps will have cumulative effects on the social environment, especially on the aquatic organism followed by on the social environment and surface water environment. Therefore, during the process of construction, it is required to enhance the protective measures for negative impacts, thoroughly exert the positive effects, thus to make it serve the human being while minimize the impacts on the environment.
14.10 Conclusion of Cumulative Effects
From the analysis of cumulative effects of the Project and multiple-step construction, it can be seen that the cumulative effects of individual step construction will be limited while the construction of multiple steps will have obvious cumulative effects due to accumulation of time and identical impacts. The negative impacts are mainly on aquatic life, especially on the migratory fishes, semi-migratory fishes and spawning sites. Multiple-step construction will make floating and semi-floating spawns to flow into static waters too early during drifting and hatching process, thus affecting their growth. The positive impacts of the construction of the project are to promote the economic development of the Kan River drainage area, especially the revolutionary old regions of Ji’an and Jinggang Mountains. Therefore, during construction of individual project, it is required to take into consideration of the integrative influences of multiple projects so that the advantages can be exerted and the disadvantages may be avoided, thus to minimize the negative impacts on the environment.

15.0 EIA Conclusions and Suggestions
516
15.0 EIA CONCLUSIONS AND SUGGESTIONS
15.1 EIA Conclusions of Environment Actuality
� The Project is located between Ji’an urban area and Taihe County seat at the middle reaches of the Kan River, the dam site is situated nearby Shihutang Village, 26km downstream the Taihe County Seat Road Bridge.
�It is a multipurpose project, which takes shipping as the main, gives consideration to power generation and flood control. The project belongs to second-class large (2) type project, with normal impounding level of 56.50m, total reservoir capacity of about 632 million m3, the reservoir area at normal level of 29.2km2 backwater length of 38km6 water turbine power generating sets, installed capacity of 117MWannual average power generating capacity of 4.8×10⁸kW·h water retaining height of 9.8m belonging to low head building, the total investment is 2.223 billion yuan.
� According to the survey result of 6 water quality monitoring sections, the present quality of water environment of the Kan River section where the project is located meets the requirements of Category I to III water quality standard, and it is good in general.
�According to the survey result of 3 air monitoring points, the present quality of ambient air of the area the project is located meet Grade II of Ambient Air Quality Standard (Revision) (GB3095-1996), the regional ambient air quality is good.
�According to the survey result of 3 noise monitoring points, the noise values of the project area can Category 1 of City Area Ambient Noise Standard (GB3096 93) without standard-exceeding phenomena, the present regional acoustic environment is good.
� There are no national grade protected wild plants and famous trees within the EIA area. There are 11 species of provincial grade protected plants within the EIA area. More old trees are distributed along both banks within the EIA area, mostly cinnamomum camphora and schima superba, which have formed old tree population in some unique areas. Shihutang Project district is mainly of plains and low hillock plain distributed in six administrative townships, there is no native vegetation whatsoever. Instead, secondary plant and artificial vegetation makes up the majority. Density of cover from natural vegetation reaches 56%.
�Amphibians are classified into 1 order, 4 families and 8 genera, with no species under state protection. Investigation indicates that there are numerous Bufo gargarizana. There are 3 orders, 5 families and 9 genera of reptiles, with no species under state protection. Zoacys dhumnades are large in quantity. There are 26 species of birds, classified into 8 families and 17 genera. Passerine are the largest in quantity, totaling 9 species, or 34.62% of all. There is no bird under state protection. There are 7 orders, 7 families and 7 genera of beasts in Shihutang Project district. There is no beast under state protection. Rodents are the largest in numbers and species in this area. Of all terrestrial vertebrates, there is no species under state protection. There are 20 species under province-level protection in Jiangxi Province, widely scattered in quantity in Shihutang Project district. Of plankton in the region the diatom plays the major role, followed by chlorella and Cryptomonadales. In biomass diatom makes up the majority. All together the investigation collected 21 species of zoobenthos, classified into 2

15.0 EIA Conclusions and Suggestions
517
phyla, 3 classes and 9 families. Of them most are of mollusktotaling 19 species, making up 90.48% of zoobenthos.
15.2 EIA Conclusions
15.2.1 Water environment
� During the construction period, water pollution source mainly comes from productive wastewater and domestic sewage, in general, smaller in discharge but higher in pollution concentration, after corresponding treatment measures are taken to make the discharge satisfy Grade 1 of the Standard for Integrated Sewage Discharge (GB8978-1996), it will cause smaller impacts upon water quality of treated wastewater reception water body during construction.
� The catchment area controlled by the Project is 43770km2. The maximum annual average flow is 1940m3/s (in 1975), the minimum annual average flow is 405m3/s (in 1963), annual average flow is 1150m3/s, annual average runoff is 362.9×10⁸m3, annual average depth of runoff is 828.9mm, annual average runoff modulus is 26.27L/km2/s, the annual average total sediment runoff of the Shihutang dam site is 428×104t.
The flood management and operation mode of the Project is decided as per the upstream incoming flow. When the incoming flow at upstream is smaller than critical flow for opening gates, it will switch into beneficial flood management and operation mode of shipping and hydropower generation. The design critical flow at the Shihutang dam site is 4700m3/s, and the critical flow at the Guanyuan River discharge section is 70m3/s.
To meet the shipping requirement of the dam downstream, the release flow of the reservoir shall not be smaller than 187m3/s, accounting for 16.3% of annual average flow. That release flow can also meet the navigational requirement of the downstream channel, and productive, domestic and ecological water consumption requirement of the dam downstream.
The silting sand in Shihutang reservoir is expected to become a small silting delta, the silting sand at the end of the reservoir and before the dam is relatively little.
� Water body in the reservoir is of mixed pattern, thus there is no big difference in water temperature in the discharged water and natural water, to produce no impact upon downstream eco-environment.
�Under the hydrological condition of monthly average flow of the driest month at 95% of assurance rate, after completion of the dam, in scope of the nearshore waters lasting 2050m long and 23m wide close to Chengjiang Sewage Outlet in the near future, the pollutant concentration goes beyond Grade II of water quality standard; at 2461m downstream the outlet (1000m in the upstream, 5m to the bank) NH3-N concentration �0.5 mg/L, BOD�3 mg/L and COD�15 mg/L. Still, water meets the requirement of water intaking of the Chengjiang Water Plant, 3461m downstream.
Under the hydrological condition of monthly average flow of the driest month at 95% of assurance rate, after completion of the dam, in scope of the nearshore waters lasting 2350m long and 15m wide close to Chengjiang Sewage Outlet in the far future, the pollutant

15.0 EIA Conclusions and Suggestions
518
concentration goes beyond Grade II of water quality standard; at 2461m downstream the outlet (1000m in the upstream, 5m to the bank) NH3-N concentration �0.5 mg/L, BOD�3 mg/L and COD�15 mg/L. Still, water meets the requirement of water intaking of the Chengjiang Water Plant, 3461m downstream.
In case of the sewage treatment plants under normal discharge, under the conditions with and without the Shihutang Project and of short-term and long-term impacts, the quality of water at 1000m upstream of the water intake can satisfy Grade II of water quality standard; if under emergency discharge, the quality of water can not satisfy Grade II. Under the hydrological condition of monthly average flow of the driest month at 90% of assurance rate, after completion of the dam, within the scope of 2000m long and 22m wide nearshore waters downstream of Chengjiang Wastewater Outlet, the quality of water will exceed Grade II in the near future; within the scope of 4480m long and 31m wide nearshore waters from Wentian Wastewater Outlet to Yanxi Wastewater Outlet, the pollutant concentration will exceed the Grade II of the water quality standard.
Under the hydrological condition of monthly average flow of the driest month at 90% of assurance rate, after completion of the dam, within the scope of 2250m long and 15m wide nearshore waters downstream of Chengjiang Wastewater Outlet, the pollutant concentration will exceed Grade II in the far future; within the scope of 1800m long and 31m wide nearshore waters downstream of Wentian Wastewater Outlet, the COD concentration will exceed the Grade II of the water quality standard in the far future; within the scope of 700m long and 12m wide nearshore waters downstream of Yanxi Wastewater Outlet, the COD concentration will exceed the Grade II of the water quality standard in the far future.
�Annual mean phosphorus nutritive element in Shihutang reservoir will be0.016mg/l, phosphorus concentration is at the lower limit of mesotrophic level, therefore there will be no eutrophication in the reservoir in general.
� Water environmental capacity of NH3-N at Chengjiang Wastewater Outlet is 155.9t/a; BOD5 695.2t/a and COD 3506.6t/a.
In the near future annual NH3-N discharge at Chengjiang Wastewater Outlet is expected to be 137.87 t/a, BOD5 432.03 t/a, and COD 973.6 t/a; in the long run annual NH3-N discharge at Chengjiang Wastewater Outlet will reach 146.0 t/a, BOD5 365.0 t/a and COD 1095.0 t/a, all are below the environmental capacity of the river section. �Under normal operation, in the reservoir area upstream of the dam in the near future, COD concentration is expected to be 4.49 mg/l, and in the long run 4.28 mg/l; After water is discharged, the water flow rate will increase so that reoxygenation capacity will be improved and water quality will get better, thus the quality of water downstream of the dam site will not have a big change compared with that before construction of the dam.
� After the reservoir is impoundedwater levels of different river sections will be raised than before to different extents. The normal water level is higher than natural water level by 9.43m Minimum flow as observed on Feb. to Oct. 2006 reached 274m3/s with

15.0 EIA Conclusions and Suggestions
519
corresponding water level in the upper reach of the dam averaged 47.07mand water levels for 10-year and 20-year recurrence floods were raised by 0.08m and 0.14m respectively. Now water feeding balance to the underground water at the front edge of the first terrace and second terrace will be resumed in this case until new dynamic balance more beneficial to underground water is established. Lowering of the underground water level will be under effective control, so that underground water reserve will remain stable and steady, to provide sufficient water sources for domestic and industrial water consumption in Taihe County Town.
15.2.2 Ecological environment
�The Project will permanently acquire 42525.1Mu, including 2977.3Mu farmland (incl. 198.27Mu basic farmland). The Project will temporarily occupy 6895.65Mu (incl. 1237.05Mu by farmland elevating, 78.15Mu by resettlement area), including 2748.6Mu farmland. After completion of the Project, arable land per capita will reduce by 2.7, from 1.42mu per capita to 1.38mu. There is little impact from such land acquisition to local residents. The major species of vegetation include Form Pinus massoniana, Form Pinus elliottii, shrub and meadow and artificial gardens. Except for permanent acquisition of land, the other land all can be resumed with their vegetation.
�There are 11 species of plants under province-level protection, including podocarpus macrophyllus, Osmanthus fragrans, camellia, mastic tree, Chinese holly, Ilex rotunda, Bischofia tyifliata, Gentiana scabra Bunge, Planchonella spp. , Sapindus mukorossi Gaerth and Asnaragus cochinchinensic. These species are mainly distributed in the herbages of shrub and underwood and in the broad-leaved forest close to villages. There is no such mentioned species in the project site, except for Gentiana scabra Bunge, Planchonella spp., Chinese holly, Asnaragus cochinchinensic occasionally in borrow earth pits. Anyway they are limited in number, with no large trees or historical treesall of which are dispersed species. The project will in no way threaten their survival or reproduction, and its impacts are slight.
� Impacts during construction on terrestrial animals are smaller. Benthos loss will be about 63.57t during construction.
� During operation there will be at lease 187m3/s of basic discharge flow to satisfy the need for navigation. The ship lock will maintain a discharge flow of 11.24m3/s in the near future and 15.31m3/s in the long run. The guaranteed minimum flow will reach 198.24m3/s in the near future and 202.31m3/s in the long run. During operation of the Project, the basic ecological water consumption requirement of the downstream river section and normal water intaking requirement of water consumers downstream of the dam can be satisfied.
15.2.3 Water and soil erosion
�Earth excavation and earth-rock fill will severely threaten the stability of soil stratum, to aggravate water and soil erosion.
� During the construction periodoriginal topography will be under severe perturbation, with topsoil and vegetation under serious damage, which will greatly reduces soil resistance to corrosion. The project will involve such areas as residents’ settlement, land for farming and rivers and streams. Any neglect of temporary control of water and soil erosion will result in

15.0 EIA Conclusions and Suggestions
520
desirable increase in runoff sedimentation in rainy seasons, which will deposit to block the dam or channel to produce negative impact upon flooding or water transmission. In dry season such neglect will produce a lot of dust to be unfavorable to people’s production or living, unfavorable to vegetation growth only to worsen ecological environment.
15.2.4 Ambient air
Impact of the Project on ambient air happens mainly during construction period. Dust caused by construction will cause a certain pollution impact on the surrounding residential areas. Impact upon ambient air will not last long. Completion of the Project will mean an end to such pollution.
15.2.5 Acoustic environment
Construction noise at daytime basically has no standard-exceeding impacts on the surrounding residential areas, but construction noise at nighttime will cause a certain impacts on the nearer surrounding residential areas.
Noises within 10m of the temporary roads and existing roads basically has no standard-exceeding impacts and fall within Grade IV at daytime, with no standard-exceeding impact upon objects over 30m away from the roadside at night. In a word, during the construction period noise standard-exceeding pollution impacts on scattered residential areas by roadside of the temporary roads and existing roads is limited.
The hydropower generation of the Project will produce noise effect only within the battery limits of the pivot area, which is over 400m away from the concentrated residential areas at both banks. Operation of the hydropower station basically will not cause noise pollution impacts on them.
During the operation period noise from the ships basically creates no noise standard-exceeding effect upon the residents along the channel.
15.2.6 Resettlement
After the fending groynes and farmland elevating measures, the reservoir inundation and the bury of protection works will need to permanently occupy 2829.8Mu farmland (including 701.85Mu paddy field, 2127.9Mu dry land, among which there are 198.27Mu basic farmland), 104.4Mu garden plot, 3130.9Mu other types of land, 32588.6Mu water area; It is involved in relocation of 711 people, impacts of 8 enterprises and institutions, house relocation of 4.56×10⁴m2 and some other facilities.
After completion of the embankment protection works and works concerning lifting the field, there will be land acquisition in form of belt, so that arable land per capita will reduce by 2.7 , from 1.42mu per capita to 1.38mu. There is little impact from such land acquisition to local residents. Meanwhile resettlement is distributed in 44 villages, so they will benefit from low-yield land improvement. Therefore complete fulfillment of RAP can minimize the negative impacts on social environment due to resettlement.

15.0 EIA Conclusions and Suggestions
521
15.2.7 Cultural relics protection
Five spots of culture relics are distributed in inundation area and reservoir area of Shihutang navigation and power junction project. The project construction and reservoir area immersion have no impact on 2 cultural relic points that have protective grade and 1 cultural relic point that applies now for provincial site protected for historical and cultural valueThey have impact on 2 cultural relic points that have no protective grade. Jiangxi Provincial Institute of Cultural Relics and Archaeology will carry out the culture relics protection work for 2 cultural relic points that may be affected by the project construction before the commencement of the project, in order to obtain historical information, after the cultural relic protection work is finished, the project construction and reservoir area impounding will not cause damage and impact to cultural relics.h
15.2.8 Bury and coverage of mineral resources
Within the reservoir inundation area and the project area, no important mineral resources will be directly buried and covered, without need to let by.
15.2.9 Social environment
�During the construction period, the engineering vehicles and material carrier vehicles will use the existing roads and village roads, which will cause a certain negative impact upon local traffic and normal living and traffic of local people too.
�At present in Wanhe and Yanxi some farmlands often suffer from flood inundation in Kan River, with poor annual yield. Completion of Shihutang Project will bring such five protection areas as Taihe County Town, Wanhe, Yongchang, Yanxi, and Zhangtang, so as to improve the current flood prevention standard from 2-to- 5- year-recurrence to 10-to-20-year recurrence. As a result, there will be 74.8km2 area under protection, among which farmland totals 65000 Mu and population 53000 persons. By improvement of embankment in left-bank shallow inundation area of Kan River’s tributary Yunting River and by farmland elevating measure for basic farmland of Mashi Township (tail of reservoir), there will be 1200 Mu of farmland under protection. All of these will be beneficial for perfection of municipal infrastructure in Taihe, for protection of people’s lives and wealth and for improvement of farmland yield.
15.2.10 Geological environment
The landform unit within the project area is mainly of low hilly areas of tectonic denudation and plain of accumulation by fluvial erosion. Without artificial underground caves or goaf of mines to be exploited, therefore there is no possibility of surface collapse from karst or from goaf. The reservoir bank is composed of primary and secondary terraces, with partial low topography, lower than normal water level, and partial low hills of slow slopes. After the reservoir is impounded there is little chance of permanent seepage.
At the dam site the total annual discharge of sediment reaches 428×104t, with fine silt (0.054mm). Due to low elevation of the sluice gate bottom, most of sediment from the upper reach will be discharged out of the reservoir. Sediment accumulation in the reservoir is

15.0 EIA Conclusions and Suggestions
522
estimated to develop into a small-scaled delta, with little sediment accumulation in the reservoir head and in front of the dam, which will produce little impact upon works operation.
The basic earthquake intensity of the reservoir area is smaller than 7 degrees. After operation the reservoir will not raise water head by much, which will produces little change in terrestrial stress, therefore there is little possibility to induce earthquake.
15.3 Assessment Conclusions of Impacts on Old Trees and Large Trees
�According to this investigation, vegetations in the project inundation area and around the reservoir are mainly secondary forest and artificial forest, such as protective forest of protection embankment, village amenity forest and poplar young growth of returning land for farming to forestry and etc. plants in inundation area are mostly common species distributed at low elevation.
Famous trees and wild national key protected wild plants have not been discovered in the project area.
After field investigation, there are altogether 215 old trees in the project areaaccording to the filed appraisal of experts of Forestation Commission of Jiangxi Province Forestry Department, all old trees belong to Class III protective old trees, including 211 Cinnamomum camphora, 2 Cupressus funebris, 1 Sabina chinensis and 1 Castanopsis sclerophylla. The old trees are mainly distributed in old forest of Jintan, Huanghangpengxia, Xinzhou, Shihutang, Jiangjiazhou, Xiabian Village, Yinxiajiang, Taipan, Zhangjia, Laohukeng and etc. Old trees form an old trees community in nature protection area of Jintan, and others are irregularly growing in the village or beside the village sporadically.
There are 215 old trees distributed in the project area, including 6 old trees in the planned protection embankment, 14 old trees within protection embankment, 7 beside the road of Shihutang Village on the edge of the junction project area, 7 old trees in the inundation area outside the protection embankment, 181 old trees in the non-inundation area outside the protection embankmentmost of them is located in the Jintan Nature Protection Area at County Level . Moreover, there are 74 Cinnamomum camphorapotential old trees with breast diameter of 80100cm in the project area, including 9 in the inundation area, 4 on the embankment, 60 outside the embankment and 1 inside the embankment.
After the project impounds water, it will cause a certain impacts on the trees within the project area. The project will adopt protective measures for 21 old trees and 27 big trees, including transplanting protective measures for 3 old trees and 3 big treesadopting concrete diaphragm wall protective measures for 9 old trees and 13 big treesmasonry breast wall protective measures for 7 old trees and 11 big treesEmbankment line avoiding protective measures for 2 old trees and no big trees. Cement laid stone masonry slope protection will be adopted for river bank of Xinzhou30m long in order to prevent river erosion.
�This country grade nature reserve is at the Kan Riverside at Zhujia Village of Tangzhou Township, with an area of 330Mu including 225Mu core area and 105Mu buffer area. There are 161 old trees more than 100 years old among Jintan old trees. In addition, there are 39 Cinnamomum camphora with breast diameter 80100cm, these old trees or big trees are located in the non-inundation area outside the embankment.

15.0 EIA Conclusions and Suggestions
523
Embankment line direction of engineering design of Yongchang Protection area Protection Embankment of the project will pass the core area and buffer zone of this reserve. The arrangement plan of embankment line put forward by the engineering design contractor doesn’t comply with relative laws, rules and regulations of Regulation on Nature Reserves of the People’s Republic of China. The EIA contractor has put forward alternative scheme (recommended scheme) of environmental protection from environmental protection angle aiming at design of embankment line arrangement scheme of this section, embankment line of alternative scheme of environmental protection of this assessment is located outside the core area and buffer zone of the reserve zone. After communication with the Owner and engineering design contractor, they have agreed in principle to adopt the alternative scheme of environmental protection.
In order to reduce the environment impact of project construction to Tangzhou Town Zhujia Village County Level Small Natural Reserve (Jintan old trees) to an acceptable degree, implement cement laid stone masonry slope protection with a length 1040m for riverbank of core area of reserve zone in order to prevent river bank collapse due to river erosion. The riverbank slope protection work is located in the border of the reserve zone within the reserve zone . Taihe County government agrees to implement the riverbank slope protection work at the border of the reserve zone put forward by this assessment and issued a document titled Reply on Adjustment of Core Area and Buffer Zone of Zhujia Village Cinnamomum Camphora Forest County Level Nature Reserve, Tangzhou Township, Taihe CountyMarch 25, 2007 .
15.4 Assessment Conclusions of Impacts on Fishes and Spawning Sites
�According to the site interview result of the resettlement report of the project, there are 7 professional fishing boats in the river section between the Shihutang dam site and upstream Taihe Pivot, in addition there are a small amount of non-professional fishing boats. The gross annual catch totals 83 tons.
�Historic literature and the document provided by fishery department show that the Project is involved in two spawning sites as Taihe (Chengjiang) Spawning Site and the Yanxidu Spawning Site. The main spawning fishes of these two sites are mandarin fish, grass carp, snail carp, silver xenocypris, Elopichthys bambusa, bream fish, Xenocypris argentea, H.maculatus
Bleeker and etc. During the spawning period of 2007 (April to June), the project team has executed site survey on the two spawning sites. The total collected spawns are 2.3569 million grains, only accounting for 1.18% of historic spawning quantity. Meanwhile, fishes accumulating phenomenum is not found in the said two sites, and the river section is severely sand dredged and flows moderately and has sparse aquatic plants. It is told by the local fisherfolks that no large fishes spawning in these two sites have been found, which indicates that these two spawning sites have been severely degraded. �In accordance with the literature, fishes in the Kan River total 118 species, classified into 11 orders, 22 families and 74 genera, of which the Cyprinidae makes up the majority�about 58.5% in total, followed by Bagridae, 9.3%; Of Cyprinidae in the Kan River, Gobioninae and

15.0 EIA Conclusions and Suggestions
524
Anabarilius grahami each averages 23.2%. There are altogether 41 species of recorded fishes through investigation of the assessed river section, classified into 3 orders and 7 families, of which the Cyprinidae makes up the majority�about 73.17% in total. These species are all common fresh water fishes without special species, among which there are key economic fishes as silver xenocypris, hemibarbus maculates, bream, red-eye trout, mandarin fish, pelteobagrus fulvidraco, shining pelteobagrus fulvidraco, etc. and migration fishes as “four major Chinese carps” . This investigation has not recorded some valuable and rare migration fishes (as Acipenser dabrganus Dumeril,Psephurus gladius(Martens), Myxocyprinus asiaticus (Bleeker),Anquilama japonica J.et.s,Coilia ectenes J.et.s and hilsa herring etc.). � Construction impact on fish mostly appears as “dissipation effect”, impact on protection of fish species resource will be limited. Construction diversion will not affect obvious obstruction impacts on fishes. Over-water construction of this Project will be concentrated on the pivotal region. There are two spawning sites in the upper reach of the dam site with long distances (Taihe Spawning Site is about 21.4km away from the dam site, the Yanxidu Spawning Site is about 13.9km). Despite negative impact upon water quality, plankton and benthonic organism from such underwater construction as cofferdam, foundation pit excavation and cofferdam removal�the construction site is far away from the spawning sites�and there will be no water flow interception, thus there is no severe impact upon spawning sites during construction period. �After the project is put into operation, the levels of different sections of the river will be raised to different extents than before. Meantime, rising of water level will bring some water grass under inundation, to produce negative impacts upon fishes whose eggs are attached to the grass. This will cause great impacts on fishes laying adhesive spawns. The completion of the dam will reduce flow velocity and water level of the dam downstream river section to severely threaten the spawning and breeding of such fishes as enjoy flowing water.
After completion of the Project, the dam will block the migration passage of migration fishes. Some migration and semi-migration fishes can not swim back to the upstream for raising up seeds. Because the upstream spawning site nearer to the reservoir area is of short flow stream, floating and semi-floating spawns flow into static water of the reservoir area too early during drifting incubation, with growth affected. Some spawns or fries flow down with the water flow, and can not bear impact of enormous energy and can not survive, even if they can survive, they can not swim back to upstream for making up group resource. After completion of Shihutang Project, there will be changes of original spawning grounds in Taihe (Chengjiang) and Yanxi�to result in considerable bio-mass loss of such cash fishes stocks. Estimated at the most unfavorable condition of the mentioned two spawning grounds, the maximum losses of spawns and larval fish during the operation period are 199 million grains and 1.9898 million pcs. �As per literature, the Kan River hilsa herring spawing sites (Xiajiang~Xingan) are located at more than 90km long river section upstream of Xinganshikou and downstream of Ji’an, among which the main spawning sites are located at 30km long river section of upstream and

15.0 EIA Conclusions and Suggestions
525
downstream of Xiajiang County seat. Xiajiang~Xingan hilsa herring spawning sites are located at about 90km~120km downstream of this dam. The main spawning time of hilsa herring is concentrated in June and July each year. This site survey has not recorded hilsa herring. At the same time, the fisherfolks feedback that no hilsa herring has been caught in recent more than ten years. And in the investigation of fishes at lake intake in recent years, no adult hilsa herring has been found to enter the lake or fries found to go out of the lake. Xiajiang hilsa herring (Xiajiang~Xingan) spawning site is over 90km away from Shihutang dam, such a long distance can basically resume the physical properties of water as water temperature etc. to be changed by the dam. And Shihutang Pivot belongs to low head dam, runoff type development mode, and hardly runoff control performance. The operation mode of the Shihutang hydropower station will utilize the power generating drain flow of the Wan’an hydropower station plus sectional flow as its power generating flow. The annual average, monthly average and daily average flows and levels of downstream of the Shihutang dam in the design representative year all will be the same with the runoff and level of the Shihutang dam under current condition in the design representative year. Therefore, the main negative impacts on the Xiajiang hilsa herring spawning site by the Kan River hydropower development will not come from the Shihutang Project. �Considering the hydropower development actuality of the drainage area and the special features of this project, the size, habit and operation management conditions of fishes at the Taihe section of the Kan River, this EIA applies protection measures of fishes and spawning sites for this project �to build fishpass, �to construct fish proliferation and fry releasing station, � to construct substitute fish habitat, � to execute monitoring and study, � to strengthen fishery aministration etc.
15.5 Plan Harmony Analysis & Environment Alternatives Comparison
15.5.1 Assessment conclusions of plan harmony
Construction of the Project is consistent with the national industrial policies, and with the Kan River Drainage Area Plan of Jiangxi Province in general, and with the Taihe County Seat Master Plan (1999 2020) and meets the requirements of the Taihe County Seat Environment Protection Plan (1999 2020) and the Taihe County Environment Function Delimitation.
15.5.2 Environment comparison conclusions of engineering alternatives
� Environment comparison on the Fangzhou Dam Site Plan and the Shihutang Dam Site Plan lodged by the engineering design contractor is done, the Shihutang Dam Site Plan is recommended from the angle of environment protection in the EIA, which is just the same with the recommended plan by the engineering design contractor.
� Two plans of Upper Dam Line Plan and Down Dam Line Plan are addressed by the engineering design contractor, the Upper Dam Line Plan is recommended from the angle of environment protection in the EIA, which is just the same with the recommended plan by the

15.0 EIA Conclusions and Suggestions
526
engineering design contractor.
�Environment comparison on the normal impounded level plans of the Shihutang Project lodged by the engineering design contractor is done, the 56.5m normal impounded level plan is recommended from the angle of environment protection in the EIA, which is just the same with the recommended plan by the engineering design contractor.
�Environment comparison on the Layout Plan 1 (right ship lock and left powerhouse plan) and Layout Plan 2 (right ship lock and right powerhouse plan) of the Shihutang Project lodged by the engineering design contractor is done, Layout Plan 1 (right ship lock and left powerhouse plan) is recommended from the angle of environment protection in the EIA, which is just the same with the recommended plan by the engineering design contractor.
�In terms of environmental protection, three ship lock dimension schemes are compared, Scheme I 180×23×3.5m is recommended, the same conclusion as out of engineering design.
� A comparison is made of the three schemes, namely Scheme I 15m , Scheme II 20m and Scheme III 22m concerning gate hole clear width, on the viewpoint of environment protection, Scheme II is recommended, identical to conclusion out of engineering design.
�Out of comparison of two schemes involving flood control or inundation of five protection areas, this report recommends Scheme I (flood control plan), the same conclusion as out of engineering design.
�Of the two schemes of Wanhe guide drainage canal axial line in engineering design, this Report recommends Scheme II in terms of environmental protection after comparison, the same conclusion as out of engineering design.
15.6 Environment Risk Assessment Conclusions
The main environment risks of the shipping pivot are dam breach and earthquake etc. The accident types in the water way operation include collision accident, hull stranding, boat fire and shipwreck accident and ship pollutant emergency discharge etc.
The maximum risk possibility of ship oil overflow accident in channel is 0.03 0.08 time/a. A perfect regional accident risk control management system has been set up by the Ji’An City government and relevant functional departments, as well as a permanent accident risk emergency reaction center. Once a risk accident occurs, accident emergency measures can be adopted promptly.3
15.7 Environment Protection Measures and Cost Estimate
To control pollution impacts during construction and operation of the project on the environment within an endurable extent, corresponding environment protection measures have been framed according to the pollution impact characteristics of the project.
The total investment of the project is 2.2268932 billion yuan, static environment protection

15.0 EIA Conclusions and Suggestions
527
investment is 71.1983 million yuan in total, including environment protection investment of 55.4254 million yuan, investment of water and soil erosion work of 14.8113 million yuan, resettlement environment protection investment of 411,600 yuan, investment for water and soil conservation measures at resettlement area of 379,400 yuan, and reservoir bed cleanup investment of 170,600 yuan. Environment protection investment accounts for 3.20% of the total investment of the project.
15.8 General Conclusions
The Shihutang Project is a multipurpose project, which takes shipping as the main, gives consideration to power generation and flood control. Construction of this project will promote construction of the Kan River backbone channel network and will raise hydropower proportion in the whole Jiangxi power grid, and will be beneficial to perfecting the municipal infrastructure of Taihe County and to protecting the safety of lives and properties of Taihe County’s people and to raising agricultural unit output within the protection area.
Completion of the project will tinily change flood and runoff of the Kan River trunk, release base flow 187m3/s will not affect all the existing water consumption functions of the dam downstream, and meantime it can also meet the ecological water consumption requirement of the downstream river section of the dam; It will have a certain function to control shipping at dry season, beneficial to navigation.
Measures of old trees protection, fish pass, fish proliferation and fry laying, and artificial fish nest lodged in this report will greatly lessen impacts on the ecological environment due to construction of the dam.
The Owner shall reinforce the work of environmental management during construction period, intensify environmental protection education of the construction team, make close supervision, and advocate civilized construction. The contractor shall make specific provisions in the contract and promise the above pollution control measures during construction period, as well as draw up rigorous punishment for breach of the contract. According to the relevant environmental protection specification and standards, design drawings, design specifications and other design documents, construction contract and bid document and tender document, contract for construction environment supervision and bidding document, the construction supervision contractor shall draw up the environment supervision plan, and strictly abide by it. Strengthen the work of environmental monitoring during construction period, and carry out regular or irregular environmental monitoring plans.
Before impounding of the project, Taihe County Government shall construct city sewage collector network and sewage treatment plant strictly according to the Taihe County City Overall Plan, collecting all the city sewage and industrial wastewater, discharge the treated water after satisfying the discharge standard; Taihe County Government shall prohibit to develop pollutive enterprises at the surrounding of the reservoir, and stringently control the new, revamping and expansion projects with discharge nature at the surrounding of the
15.0 EIA Conclusions and Suggestions
528
reservoir, strictly forbid to set different pollution sources or night soil of human and domestic animals and garbage directly discharged into the river. This is the premise of the project feasible in the aspect of environment.
After fulfilling the environment protection plans decided in the engineering design and all the environment protection countermeasures and suggestions given in this report, the Project will be feasible in the angle of environment protection.
15.9 Suggestions
� It is suggested to construct and complete the regional sewage collector system and treatment facilities and domestic garbage disposal facility as soon as possible, reducing and avoiding pollution impacts of wastewater and garbage discharge on water quality of the reservoir area.
� Whereas the flow of ships in the reservoir area channel will greatly increase during operation period, it is suggested that the related governmental authority properly increase overwater emergency facilities of local departments according to the development situation of water transport industry of the reservoir area channel, so as to reduce accident probability and loss caused by accidental pollution.
� With improvement of navigational conditions and increase of transport ships, it is suggested that governmental authority complete regional salvage and rescue organ and equip related equipment and facilities, so as to effectively aid the accidents.
� After the dam is completed, the supervision and management work load of fishery department on fish passing device, fish resources, aquatic ecological environment, fish proliferation and fry pouring work will be greatly increased. It is suggested that related government authority increase financial input on local fishery department so that the daily supervision and management work of fishery department can be effectively fulfilled.