
E2498 Vol. 6 - World Bank Documents & Reports
395
1 Environment Impact Assessment Report For Bayannaoer Water Reclamation and Environment Improvement Project Chinese Research Academy of Environmental Sciences Oct. 2010 E2498 Vol. 6 Public Disclosure Authorized Public Disclosure Authorized Public Disclosure Authorized Public Disclosure Authorized Public Disclosure Authorized Public Disclosure Authorized Public Disclosure Authorized Public Disclosure Authorized
-
Upload
khangminh22 -
Category
Documents
-
view
1 -
download
0
Transcript of E2498 Vol. 6 - World Bank Documents & Reports
1
Environment Impact Assessment Report
For
Bayannaoer Water Reclamation and Environment
Improvement Project
Chinese Research Academy of Environmental Sciences Oct. 2010
E2498 Vol. 6 P
ublic
Dis
clos
ure
Aut
horiz
edP
ublic
Dis
clos
ure
Aut
horiz
edP
ublic
Dis
clos
ure
Aut
horiz
edP
ublic
Dis
clos
ure
Aut
horiz
edP
ublic
Dis
clos
ure
Aut
horiz
edP
ublic
Dis
clos
ure
Aut
horiz
edP
ublic
Dis
clos
ure
Aut
horiz
edP
ublic
Dis
clos
ure
Aut
horiz
ed
2
Table of Contents
1 General Introduction ......................................................................................................... 1
1.1 Project Background ................................................................................................................................ 1 1.1.1 Need of the Project...................................................................................................................... 1 1.1.2 Project Objectives ....................................................................................................................... 1 1.1.3 Relevant Policies and Regulations............................................................................................. 1 1.1.4 Relevant Planning of Environmental Protection Strategies.................................................... 2
1.2 Assessment Purposes ............................................................................................................................ 5 1.3 Assessment Grade and Key Points............................................................................................................ 5
1.3.1 Assessment Grade ....................................................................................................................... 5 1.3.2 Assessment Key Points ............................................................................................................... 6
1.4 Scope and Timing of Assessment and Environmental Protection Objects ............................................... 6 1.4.1 Scope of Evaluation .................................................................................................................... 6 1.4.2 Time Interval of Environmental Assessment ........................................................................... 8 1.4.3 Environmental Protection Objects............................................................................................ 8
1.5 Applicable Standards............................................................................................................................ 11 1.5.1 Environmental Quality Standards .......................................................................................... 11 1.5.2 Standards for the Discharge of Pollutants.............................................................................. 13
1.6 Environmental Impact Factors............................................................................................................ 15 1.6.1 Identification of Environmental impact Factors.................................................................... 15 1.6.2 Selection of Environmental Impact and Assessment Factors ............................................... 16
1.7 Assessment Principles and Methods....................................................................................................... 28 1.8 Technical route for environmental impact assessment ........................................................................... 28
2. Framework for Policy, Law and Administration .......................................................... 30
2.1 Documents on Environment Policy and Law ..................................................................................... 30 2.1.1 Outline ....................................................................................................................................... 30 2.1.2 Laws and Rules on Environmental Protection....................................................................... 30 2.1.3 Technical Policies for Pollution Control ................................................................................. 31 2.1.4 Plans and layout of social and economic development and environmental protection....... 31 2.1.5 Urban Master Plans and Related Plans .................................................................................. 31 2.1.6 Technical Guidelines................................................................................................................. 31 2.1.7 Environmental Quality Standard............................................................................................ 32 2.1.8 Standards for pollution discharge ........................................................................................... 32 2.1.9 World Bank safeguard policies................................................................................................ 32 2.1.10 Documents related to the Project .......................................................................................... 32
2.2 Environmental Management Institutions and Their Responsibilities.............................................. 32
3. Description and Analysis of the Project ......................................................................... 36
3.1 Outline of the Project............................................................................................................................ 36 3.1.1 Investment of the Project ......................................................................................................... 36 3.1.2 Composition, construction content and size of the project.................................................... 36 3.1.3 Proposed Locale of the Project ................................................................................................ 36 3.1.5 Floor Area of the Project and Plane Layout of Factory Area............................................... 41 3.1.6 Construction Progress Schedule.............................................................................................. 46
3.2 Construction Schedule of the Project.................................................................................................. 47 3.2.1 Subproject of Reclaimed Water Supply.................................................................................. 47 3.2.2 Processing park wastewater treatment and reclamation sub-projects ............................... 60 3.2.3 Wuliangsuhai Lake Area Treatment Sub-project ................................................................. 62
4. Environmental Baseline.................................................................................................. 78
4.1 Profile of Regional Environment ......................................................................................................... 78 4.1.1 Environmental Profile of Bayannaoer City............................................................................ 78 4.1.2 Environmental Profile of Subitem Location........................................................................... 82
4.2 Evaluation on the situation of regional environment quality............................................................ 93 4.2.1 Evaluation on the situation of air environment quality......................................................... 93
3
4.2.2 Current surface water environmental quality assessment .................................................. 102 4.2.3 Assessment of current groundwater environmental quality............................................... 120 4.2.4 Evaluation of current acoustic environmental quality ........................................................ 125 4.2.5 Sediment Monitoring.............................................................................................................. 127 4.2.6 Current status of ecological environment............................................................................. 129
4.3 Balance analysis on the project water resource................................................................................ 148 4.3.1 Balance analysis on the regional water resources ................................................................ 148 4.3.2 Water capacity balance in Ulansuhai.................................................................................... 150
4.4 The pollution source in the project area and its treatment overview............................................. 153 4.4.1The water supply and consumption in the project area and the wastewater pollution source 153 4.4.2 Survey on industrial enterprises and their water pollution source in Processing Parks.. 153 4.4.3 Municipal wastewater treatment works ............................................................................... 169 4.4.4 Solid waste ............................................................................................................................... 171
5 Comprehensive Environment Impact Assessment ....................................................... 173
5.1 Analysis on Environment Impact during Construction .................................................................. 173 5.1.1 Ambient Air Impact Analysis ................................................................................................ 173 5.1.2 Water Environment Impact Analysis and Assessment........................................................ 176 5.1.3 Analysis of Acoustic Environmental Impact ........................................................................ 179 5.1.4 Analysis of Solid Waste Environmental Impact................................................................... 180 5.1.5 Analysis of Ecological Impact ................................................................................................ 182 5.1.6 Social Environmental Impact Analysis................................................................................. 185
5.2 Environmental Impact Analysis of Operation Period ..................................................................... 187 5.2.1 Reclaimed Water Supply Works ........................................................................................... 187 5.2.2 Wastewater treatment and recycling engineering in Processing Park............................... 198 5.2.3 Wuliangsuhai Lake Lake Administration Project............................................................... 206 5.2.4 Analysis on the impacts after implementation of Project.................................................... 218
5.3 Mitigation Measures ........................................................................................................................... 233 5.3.1 Mitigation Measures in Construction Period ....................................................................... 233 5.3.2 Mitigation Measures in Operation Stage.............................................................................. 239
6. Environmental Risk Analysis and Relief Measures..................................................... 249
6.1 Environmental Risk Analysis and Relief Measures of Reclaimed Water Supply Works............. 249 6.1.1 Environmental Risk Analysis of Reclaimed Water Supply Works .................................... 249 6.1.2 Environmental Risk Relief Measures of Reclaimed Water Supply Works ....................... 249
6.2 Environmental Risk Analysis and Relief Measures of Wastewater Treatment and Recycling Works......................................................................................................................................................... 250
6.2.1 Potential Environmental Risk and Accident ........................................................................ 250 6.2.2 Prevention Countermeasure and Measures of Risk and Accident..................................... 251
6.3 Artificial Wetland Works of Wuliangsuhai Lake ............................................................................ 256 6.3.1 Analysis of Wetland Operation in Winter ............................................................................ 256 6.3.2 Inlet Water Quantity of Wetland in Winter and Water Quality Analysis......................... 258 6.3.3 Accident analysis on Abnormal Operation........................................................................... 260
7 Comparison, selection and analysis of alternatives ...................................................... 263
7.1 Content and principle of comparison, selection and analysis ......................................................... 263 7.2 Comparison, selection and analysis on zero plan............................................................................. 263 7.3 Comparison, selection and analysis on alternatives of reclaimed water supply project............... 264
7.3.1Comparison, selection and analysis on restoration process of reclaimed water supply project 264 7.3.2 Comparison, selection and analysis on process plans of reclaimed water supply project 267 7.3.3 Selection of sterilization mode ............................................................................................... 268 7.3.4 Comparison and selection on sludge treatment plans of reclaimed water supply works. 269 7.3.5 Comparison and selection of pipe material .......................................................................... 272 7.3.6 Comparison, selection and analysis on plant site plan of reclaimed water supply plant.. 274
7.4 Comparison, selection and analysis on alternatives of wastewater treatment and reuse item..... 277 7.4.1Comparison and selection on wastewater treatment process plan...................................... 277
4
7.4.2 Comparison and selection on sludge treatment processes................................................... 283 7.5 Comparison, selection and analysis on alternatives of treatment works of Wuliansu Lake........ 284
7.5.1 Comparison, selection and analysis on constructed wetland .............................................. 284 7.5.2 Comparison and selection on execution plans of grid water channel................................. 297
8. Analysis on Environmental and Economic Loss and Profit........................................ 307
8.1 Project Development Target and Impact Analysis .......................................................................... 307 8.2 Economic Benefits............................................................................................................................... 307 8.3 Social Benefits...................................................................................................................................... 308 8.4 Environmental Benefits ...................................................................................................................... 309
8.4.1 Improving Hydraulic Conditions of Sea Area...................................................................... 309 8.4.2 Reduction of Pollutants .......................................................................................................... 309 8.4.3 Improving Water Quality of Sea Area of Wuliangsuhai Lake ........................................... 310
9. Public Consultation and Information Disclosure ........................................................ 310
9.1 Public Consultation............................................................................................................................. 310 9.1.1 Goal of Public Consultation ................................................................................................... 310 9.1.2 Mode of Public consultation................................................................................................... 310 9.1.3 The First Public consultation................................................................................................. 311 9.1.4 The Second Public consultation............................................................................................. 318 9.1.5 Public consultation Summary and Public Opinion Adoption............................................. 319
9.2 Disclosure of information ..................................................................................................................... 322 9.2.1 Time and Details of the First Media Annoucement ............................................................. 322 9.2.2 Time and Details of the Second Round of Information Disclosure .................................... 323 9.2.3 Summany ................................................................................................................................. 323
10. Social Impact and Migrant Resettlement................................................................... 325
10.1 Social Impact Analysis...................................................................................................................... 325 10.1.1 Project Impact and Service Scope ....................................................................................... 325 10.1.2 Project Impact Analysis ....................................................................................................... 325 10.1.3Determination of project affected area 330 10.1.4Impact indicator of Project 331 10.1.5Analysis on impact by land expropriation 336
10.2 Migration and resettlement plans.................................................................................................... 338 10.2.1Policy basis 338 10.2.2Resettlement policies applicable to this Project 338 10.2.3Compensation standard 339 10.2.4Resettlement and compensation plans 341 10.2.5Estimate of compensations for land expropriation and house removal 345 10.2.6Implementation plans of resettlement works 345 10.2.7Organization and structure 348
11 Abstracts of Environmental Management Plan.......................................................... 351
11.1 Environmental Management System .............................................................................................. 351 11.1.1 Organization of Environmental Protection in Construction Period ................................ 358 11.1.2 Environmental Management Organ in Operation Period ................................................ 360 11.1.3 Schedule of Environmental Management Institutions for Sub-projects.......................... 360
5
11.2 Implementation of Environmental Management Plan .................................................................. 362 11.2.1 Detailed Tasks of Environmental Management Plan ........................................................ 362 11.2.2 Contractual Requirement on Environmental Management ............................................. 364 11.2.3 Information Exchange and Solution to Non-conformity Case.......................................... 364 11.2.4 Training—Necessary Capability Development and Means Development ....................... 365
11.3 Environment Monitoring Plan......................................................................................................... 368 11.3.1 Monitoring Purpose.............................................................................................................. 368 11.3.2 Environment Monitoring Organ ......................................................................................... 368 11.3.3 Environment Monitoring Plan............................................................................................. 370
11.4 Estimates on Environmental Management Expenses and Source of Capital.............................. 376 11.4.1 Budget Distribution .............................................................................................................. 376 11.4.2 Capital Source and EMP Budget......................................................................................... 376
11.5 Information Management of Environmental Management Plan ................................................. 379 11.5.1 Information Exchange.......................................................................................................... 379 11.5.2 Recording Mechanism .......................................................................................................... 379 11.5.3 Report Mechanism................................................................................................................ 379
12 Conclusion of Environmental Appraisal..................................................................... 381
12.1 Relevant Policies and Conformity with the Planning .................................................................... 381 12.2 Analysis on Water Resources Balance ............................................................................................ 381 12.3 Appraisal Result of Present Environment Quality ........................................................................ 382
12.3.1 Present Situation of Air Environment Quality................................................................... 382 12.3.2 Present Situation of Quality of Surface Water Environment ........................................... 382 12.3.3 Present Situation of Quality of Ground Water Environment........................................... 382 12.3.4 Present Situation of Quality of Acoustic Environment...................................................... 382 12.3.5 Monitoring results for sediment .......................................................................................... 383 12.3.6 Present Situation of Ecological Environment..................................................................... 383
12.4 Appraisal Result of Environmental Impact.................................................................................... 383 12.4.1 Environmental Impact in Construction Period.................................................................. 383 12.4.2 Environmental Impact in Operation Period....................................................................... 385
12.5 Relief Measures of Environmental Impact ..................................................................................... 386 12.6 Conclusion of Analysis on Environmental Benefits ....................................................................... 386 12.7 Conclusion of Public consultation ................................................................................................... 387 12.8 General Conclusion........................................................................................................................... 387
Attachment 1 Advertisement for EIA Report Disclosure ............................................... 388
Attachment 2Certificate Letter from Bayannaoer Library on EIA Report Disclosure. 389
1
1 General Introduction 1.1 Project Background 1.1.1 Need of the Project Bayannaoer City is located in the west of North China’s frontier province, Inner Mongolia Autonomous Region�within the range between 105°12 ~109°53 E and 40°13 ~42°28 N. It is bordered by Baotou City and Ulanqab City to the east, by Alashan League to the west and by the Ikchor with the Yellow River and by the People's Republic of Mongolia with a national boundary of 368.89km long. The Bayannaoer city, 378km long from east to west and 238km wide from north to south, covers an area of 65,788km2. Its administrative divisions include 4 banners, 2 counties and 1 district such as Wulate Front Banner, Wulate Middle Banner, Wulate Back Banner, Hangjinhouqi County, Wuyuan County and Dengkou County. Its core area is the Hetao Irrigation District. Approved by the State Council at the end of 2000, the city was raised to a prefecture-level city. According to the strategies for economic development of the Inner Mongolia Autonomous Region and Bayannaoer City, the economic development will be based on the establishment of industrial parks to make the best use of the abundant mineral resources in the city and Mongolia. Such projects have been planned to establish Qingshan Industrial Park, Jinquan Industrial Park, Shahai Industrial Park, Linhe Chemical Industrial Park and Wulate Industrial Base. Thus Bayannaoer will be a key heavy chemical industry base in Inner Mongolia Autonomous Region. The total industrial water demand for its perspective long-term plan will reach about 520,000,000m3/a. The water demand for long-term plan of such industrial parks in the area along the mountains where water shortage is very acute is about 410,000,000 m3. According to the estimates of Water Resource Comprehensive Planning Report of Bayannaoer of Inner Mongolia Autonomous Region, the gross amount of water resources at the southern foot of Yishan Moutain in Yellow River Basin within Bayannaoer city is 587,000,000m3, where ground water resource, totaling 380,000,000m3, mainly serve as domestic water for urban and rural residents. In line with the state’s relevant industrial policies, industrial water is mainly subject to reclaimedwater. With 293km2 water surface and about 330,000,000m3 total storage capacity, Wuliangsuhai Lake is the largest riverside freshwater lake on the middle - upper stream of the Yellow River. With the development of industrial production and increase in town populations in the irrigation district, industrial wastewater and municipal domestic wastewater are increasing year by year, the pollution of main drainage canal is getting worse. Eutrophication in Wuliangsuhai Lake in particular is getting worse. Accordingly, total phosphorus and nitrogen and COD in the lake exceed 3~5 times the national category-3 standard for surface water quality. The water quality is worse than Grade V. The biological sedimentation speed in the lake is accelerating, leading to the degradation of its ecological functions. Moreover, before the flood period each year, to reserve enough flood storage capacity, it is necessary to take off the check gate at the exit section of main drain to discharge the water to the Yellow River. As such, the large amounts of wastewater storaed in the lake may offer threat of serious pollution to the Yellow River.
To further promote comprehensive improvement of water environment in Bayannaoer city, exert more efforts to strengthen infrastructure service, reduce pollution load into Wuliangsuhai Lake, slow down environmental degradation, improve the quality of urban water environment and further advance urbanization process and economic growth, Bayannaoer municipal Party Committee and municipal government decided to cooperate with the Word Bank so as to make use of World Bank loans to implement the Bayannaoer Water Reclamation and Environemnt Improvement Project (hereafter refer to “the Project”).. With extensive preliminary investigation and elaborate preparations, Bayannaoer submitted a formal application to the State Development and Reform Commission in August 2006 for World Bank load of 150,000,000 dollars (totaling about 2.125 billion RMB with counterpart funds) to implement the Bayannaoer Water Reclamation and Environemnt Improvement Project (hereinafter called The Project). This application was approved in July, 2009 and was listed in the China Alternative Project Planning in 2010-2012 Fiscal Year by Use of World Bank Loan. 1.1.2 Project Objectives The Project is intended to improve the quality of water environment in Bayannaoer city, make reasonable regulation and storage of water resources and promote the sustainable development of eco-environment and economy through the Project. 1.1.3 Relevant Policies and Regulations y Chinese Relevant Policies and Regulations
The reclaimed water supply and wastewater treatment and reuse works are classified into the comprehensive utilization and treatment works for “brackish water, poor quality water and sea water exploitation and utilization works” and “three wastes” that are encouraged by guidance of national industrial restructuring (2005 edition)..
2
Wuliangsuhai lake is an important natural reserve of Inner Mongolia Autonomous Region. According to the Regulations on the Nature Protection Regions of the People’s Republic of China, core area is prohibited from entrance and any types of development, the buffer zone of the natural reserve is not allowed for development of production works. However, This project is of water environment treatment works aiming at improving the water environment quality and ecological conditions of Wuliangsuhai lake, protecting and restoring its wetland functions. The project will avoid constructing in core area but in buffer zone and experimental area. According to the Circular of the of the General Office of the State Council on Intensifying Wetland Protection and Management (GBF [2004] No.50), importance shall be attached to the strengthening of wetland protection and restoring of function. Therefore, the Wuliangsuhai lake treatment Works is in accordance with the national relevant laws and regulations. To sum up, this project meets the requirements of national relevant industrial policies, laws and regulations.
y World Bank Safeguard Policies
The implementation of wastewater treatment and reuse and reclaimed water supply works, especially the Wuliangsuhai lake works will reduce the pollutantion loads into the Wuliangsuhai lake, so as to improve its water environment quality, improve and protect its aquatic environment and restore its nature reserve function. According to the World Bank Safeguard Policies (OP 4.01, 4.04), the World Bank encourages the restoration and protection of natural habitat and its functions. The World Bank has been supporting and expecting the borrower to adopt defensive measures on natural resource management to ensure the sustainable development of environment. It has also initiated and supported the protection and land-improvement activities for natural habitat and provided funds for the natural habitat and ecological function protection programs which are favorable to the national and local development. The World Bank has also further initiated the restoring and reconstruction works on the deteriorative natural habitat. Therefore, this project meets the environmental assessment policies of World Bank for loaning program.
1.1.4 Relevant Planning of Environmental Protection Strategies 1) National Economic Development Program During the “11th Five-Year” period, the overall requirements of Bayannaoer for economic and social development are to take Deng Xiaoping Theory and the important thought of “Three Represents" as guidance, lead economic and social development by scientific concept of development. make further reform and deepen opening-up policies, make further implementation of rejuvenating and prospering the market by science, technology and talents, accelerate economical transition, adjust economic structure, change economic growth methods, speed up industrialization and urbanization process, promote the construction of socialism new rural and pastoral areas, increase infrastructure and ecological environment construction, establish Chinese western green agricultural and animal products and non-ferrous metals industry production and opening-up to the North bases, establish important hinges linking North China and North west, insist on people-oriented, make overall development of social undertakings, improve community services, better social security and assistance mechanism, make all efforts to maintain social stability, accelerate the overall construction of affluent society and try hard to build a prosperous, civilized, ecological and harmonious Bayannaoer. The macroeconomic development strategy of Bayannaoer is to achieve the ecological environment protection and sustainable development. The strategy is centered on the green agriculture and animal husbandry that will be enhanced by deep processing of agricultural and animal products. The new type industrialization of mining and smelting industries will be established. During the “11th Five-Year” period, one of the main objective of economic and social development of Bayannaoer is to make achievements in environmental protection and construction, including the further improved ecological environment, above 15% forest coverage rate, Class � country level of atmospheric environment, qualified water environment, 90% qualified discharge standard of “Three Waste” and 40% comprehensive utilization rate. The Plan has put forward an objective to build a resource-saving and environmental-friendly society by integrating water resources, making unified planning of Yellow River, surface water, underground water and rain water and trying hard to realize the cyclic utilization of water resources. It has also request the whole city to center on water resources optimal allocation, insist on broadening sources of incoming and reducing expenditure on reasonable utilization of water resources, deepen water right displacement, positively explore the water consumption modes of along-mountain industrial enterprise from Wuliangsuhai lake and main Drainage Canal, promote water saving in cities, make full use of the treated water and Yellow River ice flood and flood diversion water, make reasonable use of lake, sea, reservoir and running off water under the premise of un-destroying wetland ecological environment and attach importance to protect industrial water. On the other hand, the city is request to intensity water environment protection and treatment, plan drinking water protection area, strictly implement the water quality control standard for drinking-water source Carry out industrial discharge license system, achieve more than 90% pass rate of industrial waste water, attach importance to treat papermaking, brewing and smelting pollution, consolidating achievements, improve urban wastewater treatment
3
ratio, intensity comprehensive treatment of agricultural area source pollution, reduce application of fertilizer and pesticide, strengthen the construction of urban wastewater treatment facilities and supporting pipelines, gradually reach the industrial and domestic wastewater discharge standard, cut off pollution source of Yellow River and underground water, plan Wuliangsuhai lake treatment Works, implement urban roads, pipelines, water supply and discharge, refuse treatment and wastewater treatment programs taking all these as the important programs during the “11th Five-Year Plan” period. To sum up, the construction of this project is an important part of Bayannaoer Municipal National Economic and Social Development Program, which is of great importance to the realization of planned environmental protection objectives and in accordance with the requirements for development. 2) Urban Master Planning The general objective and strategy of the Bayannaoer master planning are: to speed up the process of urbanization, to enhance the core competitiveness of the city, to actively support by coordinated action the development strategy fit to the regional situation of Inner Mongolia Autonomous Region, and to build Bayannaoer City into a medium-sized city with increasingly integrated services, making it a Hetao garden city with continually developing economy, evolving society, and excellent maintaining environment. The Bayannaoer master planning puts the protection of ecological environment at the first place, basically realizing ecologization and garden style. The green coverage of the city shall get up to more than 35%, and the urban per capita public green space 19m 2. These are the objectives and strategy of the environmental development of Bayannaoer City. Development and construction activities aiming to non-agricultural nature under city regional planning of the outside of city proper in the Bayannaoer master plan divide the Bayannaoer space into three land use types, namely rigid control developing area, limited control developing area, and developing construction area. Rigid control developing area can be proximately regarded as non-allowable construction area, including: �First-grade basic farmland protection areas and first-grade basic pasture designated in Overall Plan of Land Utilization; � existing and planning natural reserves designated in Conservation Development Plan; � Water protection area specified in Over City Plan; � cultural heritages and historical and cultural sites under government protection, etc. designated by Cultural Relics Protection Department; � Other non-allowable construction control areas and important green areas for environmental protection, etc. along both sides of the nation highway or provincial highway; Developing construction area is mainly city(town) planning construction land scope confirmed by the general planning of various levels of city(or town), and the scope of use of land in construction like independent industrial and mining sites and major regional infrastructure, public social service facilities approved of the development and construction by the planning, land and other related administrative departments, non-agricultural development and construction activities approved by the law are allowed and encouraged in development construction areas; strictly control areas outside the development areas and the development construction areas as limited control development area, can do moderate village and town constructions and non-agricultural constructions under the control of strict policy and planning. Any non-agricultural development construction activities in limited control development areas are subject to careful legal procedures. The site selections of both resurgent water supply project and wastewater treatment and recycling project of this project are not in strict control development area, and The Wuliangsuhai lake area treatment project is an environment treatment project aiming at improving the sea area water environment, not belongs to production construction development activity. The water resources planning of Bayannaoer master planning regard adjusting water structure, developing water-saving agriculture, reducing agricultural water use to replenish industrial water use, actively developing wastewater treatment and reclaimed water recycling, relieving and avoiding the vicious cycle of scarcity of clean water as the planning principles. It also levies charge for water resources on agricultural exploitation of groundwater in irrigation areas, and maintains the balance of groundwater resources by the use of price leverage. The layout of industry should consider the actual situation of water resources. Meanwhile, large high-water-consumption industries are not encouraged to develop. Efforts shall be made to increase the recycling rate of industrial water use, so as to realize the harmony and sustainable development of industry and water resource. It puts forward active wastewater treatment and recycles wastewater, aiming to establish wastewater treatment factories in each county and each town and realizing wastewater reuse to replenish industrial water use and landscape water use, so as to release the increasingly tense water use conflict. The environmental protection objectives of Bayannaoer master planning is to bring the environment pollution and ecological deterioration fully under control, completely realize the discharge standards of pollutants, and enter a virtuous cycles of ecological systems. Thereinto, the atmosphere quality should stay at the national secondary standard. Among the quality of surface water environment, the water quality of the Yellow River and its irrigation channels should reach the National Surface Water Standard Class III, Wuliangsuhai lake, the main drain and arterial drainage should reach National Standard Grade IV, realizing the sustainable development of social economy and ecological environment. Such areas as Yellow River, Wuliangsuhai lake, Ural Mountains National Forest Park, Nudengsuosuolin Natural Reserve, water and soil erosion area, prairie desertification and degradation area, Ulan Buh desertification area
4
and Hetao secondary salinization area, the urban area and all counties shall be regarded as key areas of environment protection. Efforts shall be focused on the pollution prevention and ecological environment protection of the Yellow River and Wuliangsuhai lake. Efforts shall be also made to speed up the construction of waste water treatment factories in each county, controlling industrial pollution sources along the banks and achieving standard discharge of domestic and industrial wastewater. Pollution shall be controlled in terms of sources. Comprehensive renovation shall be imposed on Wuliangsuhai lake. Great efforts shall be made to plant trees and grass, make a good job in water and soil conservation and restore natural ecology. The regional pollution emission shall be subject to strict control. Long-term effective management measures among industrial enterprises shall be carried out. Water quality of irrigation channels from Yellow River and wastewater discharged into Wuliangsuhai lake shall be under strict control so as to make wastewater treatment rate to reach 100%, ensuring the water quality of Yellow River to reach National Surface Water Standard Class III. In sum, the sites selection of all works of the comprehensive control project of the Bayannaoer water environment by World Bank loans is in accordance with the requirements of the urban master planning and city regional planning, and it is also an important measure to accomplish city goals, water resource allocation and environment protection goals of Bayannaoer master planning and city regional planning. Therefore, the project accords with the Bayannaoer master planning and the city regional plan. 3) Land Use Planning The land use type of this project’s reclaimed water supply works and wastewater treatment plant site is waste land, unused land and processing park construction land respectively, none of which is in the strictly controlled development area. Therefore, the works construction of this project meets the land use planning of Bayannaoer. 4) Environmental Protection Planning Water environment protection objectives of Bayannaoer include: urban drinking water quality shall meet the sanitary standard for drinking water; water quality of the Yellow River Bayannaoer League section: water at the boundary section shall meet the class � standard of the national Environmental Quality Standard for Surface Water; water quality of Wuliangsuhai Lake shall meet the class � standard of the national Environmental Quality Standard for Surface Water; water quality of the main drain and other Drainage Canals shall meet the class � standard of the national Environmental Quality Standard for Surface Water;
The “11th Five-Year” planning objectives of environmental protection are determined as follows: by 2010, the development trend of environmental pollution and ecological damage shall reduce, urban lake water pollution and atmospheric environment pollution shall be reduced, urban environmental infrastructural construction shall be greatly improved; realize the total amount control objective of pollutants. The total amount control objective of water pollutants shall be as follows: COD shall be controlled within 40,000 t/a and the ammonia nitrogen within 2,000 t/a. Water pollution control measures to be adopted during the period of “11th Five-Year Plan” are mainly as follows: y Establish and implement the water pollution control planning on each Drainage Canal, main drain and
Wuliangsuhai Lake with the focus on improving the water environmental quality of river reaches in key cities and towns. Slow down lake sedimentation and effectively control pollution and eutrophication trend. Build wastewater treatment plant in 4 cities and towns to improve sewerage treatment rate and attainment rate, gradually realize the reclamation of wastewater and reduce the discharge amount of pollutants and the pollution load of each Drainage Canal and lake.
y Complete pollution monitoring network, pay attention to preventing the pollution damage of accidental toxic and hazardous chemicals. Implement pollutant discharging license and Max. amount control system, increase the monitoring efforts and accelerate the pollution source control. The control attainment rate of enterprises in the city with the daily discharge of wastewater more than 100t shall reach 90%; the city's two major paper mills shall build alkali recovery system and achieve discharge up to standard.
y Establish the groundwater pollution control measures of Linhe District, unified planning, unified management and rational exploitation. Strictly control the pollution of industrial wastewater, toxic and hazardous substances and solid waste on groundwater.
y Combining with industrial enterprise management and technological transformation, develop clean production technology in paper making, brewing, energy, metallurgy, chemical industry and other key industries and gradually realize circular economy. Meanwhile, in the introduction of new projects and new technologies, the energy saving, comprehensive utilization and pollutant discharge reduction shall be brought into business management and technological transformation. Actively carry out the certification of ISO14000 environmental management series standards and environmental labeling products, and improve the environmental management level of enterprises.
5
In addition, aiming at the water environmental pollution status of Wuliangsuhai Lake, based on the overall control and planning, it is planned to strengthen the control work form the following two aspects: y Control on farmland diffused source. According to the characteristics of agricultural area pollution in Hetao
irrigated areas, propose agricultural area pollution prevention project planning; through the adjusting of agricultural structure, popularize the long-acting and sustained-release compound fertilizers and high-efficiency, low-toxic and less persistent pesticides, promote agricultural water-saving irrigation technology, introduce advanced and scientific technique of fertilization, control agricultural area pollution, effectively control and reduce the eutrophication of Wuliangsuhai Lake.
y Physical works measures: adopt various measures such as the setup of pre-setting reservoir in the front of lake, partial deepening at lake bottom, aquatic plant harvesting, diversion of water from the Yellow River to lake and resources development and utilization, etc. Promote the control of Wuliangsuhai Lake, restore its own beneficial cycle and maintain the sustainable development.
This project is an integral part of the environmental protection planning of Bayannaoer, which can effectively promote the comprehensive control of Bayannaoer water environment, especially the quality improvement of Wuliangsuhai Lake water environment. 1.2 Assessment Purposes According to the regulations of China Environmental Influence Assessment Law, Regulations on the Administration of Construction Project Environmental Protection and Notice on the Strengthening of Administration on the Environmental Impact Assessment of Construction Projects Using Loans from International Financial Organizations and the requirements of World Bank’s Safeguard Policies, as well as domestic and World Bank’s environmental impact assessment procedure, the environmental impact assessment on this project will reach the following main purposes: y Through data analysis, field survey and monitoring, and necessary modeling and analogy analysis, to make a
comprehensive assessment on the background situation of environment in the assessment areas, to determine the main existing environmental problems, provide background information for the prediction and assessment of the degree and range of the environmental impact as well as the future final acceptance of projects.
y Through field survey and analogy analysis, to identify the environmental impact factors during the construction and the operation of projects, to determine the parameters of primary pollution sources.
y Through the adopting of model simulation, analogy survey and other technical means, to predict and assess the impact degree and range of the projects on the ambient air water environment, soil, ecological environment, noise and social environment in the assessment areas.
y In accordance with the requirements of relevant laws, regulations and technical specifications, combining with the characteristics of local natural and social environment, propose and stipulate the protective measures which shall be adopted to reduce environmental impact.
y Through the assessment of this project, to propose specific and effective mitigation measures and environmental management plan, so as to provide basis for the supervision by independent institutions, also to provide scientific basis for the construction, operation, environmental management and environmental pollution prevention of water environment comprehensive control project, minimize the adverse impacts of project construction on surrounding environment, maximize the social environmental benefit, achieve the coordination and unification of economic, social and environmental benefits.
y This environmental impact assessment not only focuses on the analysis of water environment improvement of Wuliangsuhai Lake, but also considers the feasibility analysis on water resources allotment of the project; not only considers the impact of this project, but will consider the combined influence of the projects having been built, under construction and planned to be implemented in the next few years.
1.3 Assessment Grade and Key Points 1.3.1 Assessment Grade According to the regulations of the Notice on the Strengthening of Administration on the Environmental Impact Assessment of Construction Projects Using Loans from International Financial Organizations (HJ[1993] No. 324) of State Environmental Protection Administration of China and other ministries and commissions as well as the World Bank’s Safeguard Policies OP4.01 Environmental Assessment, , the environmental assessment category of this project is determined as Category A. The assessment grade is determined according to the Technical Guidelines for Environmental Impact Assessment (HJ/T2.1-93, HJ2.2-2008, HJ/T 2.3-93, HJ/T2.4-1995 and HJ/T19-1997). (Expressed in the form of table) (1) Surface Water Environment
6
According to the surface water environmental impact assessment classification of HJ/T2.3-93 Technical Guidelines for Environmental Impact Assessment—Surface Water Environment, the assessment grade is determined by the following four factors: wastewater discharge of the construction project, complexity of wastewater quality, scale of surface water area and surface water quality requirements. The surface water environment assessment grades of this project are as follows: because there is no wastewater discharged in the processing park wastewater treatment and reuse works of this project, only a brief analysis will be made on the water environmental impact of such works; the tail water discharge amount of reclaimed water supply works is small, the water quality is simple and the tail water is discharged into the class �water body of surface water, the assessment grade is determined as Grade � and qualitative assessment will be made on the water environmental impact of such works; the assessment grade of Wuliangsuhai Lake sea area control works is difficult to be directly judged according to the four factors alone. The pollutant source is mainly the pollutants discharge during the construction period. In view of the special properties of Wuliangsuhai Lake, the project scale is large and the involvement aspect is broad. Therefore, the assessment grade is determined as Grade � of surface water environmental impact assessment. (2) Ecology The reclaimed water supply works and the processing park wastewater treatment and reuse works of this project have very small range of influence, also very small impact on the ecological environment, therefore, only a brief analysis will be made on the ecological environment impact of these two types of works; the sea area control works of Wuliangsuhai Lake is environmental treatment works itself and its environmental impact is mainly the environmental impact during the construction period, which is temporary, short-term and will gradually disappear as the construction is completed. Therefore, the ecological environment assessment grade of this project is determined as Grade �.
(3) Ambient Air The impacts of this project on atmospheric environment mainly include the dust emission during the construction period and the offensive odor during the operation period of the processing park wastewater treatment and reuse works as well as the reclaimed water supply works. This project will adopt biological deodorization after the collection of the offensive odor caused during the operation period, which has small discharge amount; in addition, there are very few environmental objects around each works. Therefore, the atmospheric environment assessment grade of all works of this project is determined as Grade � and only qualitative assessment will be made.
(4) Acoustic Environment The impacts of this project on acoustic environment mainly include the construction machinery and traffic noises during the construction period of each works and the power equipment operating noise during the operation period of the processing park wastewater treatment and reuse works as well as the reclaimed water supply works. Consider that the noise impact during the construction period is short-term behavior, and during the operation period, the site selection of the wastewater treatment and reuse works as well as the reclaimed water supply works avoids the densely populated residential areas, hospitals, schools and other sensitive points. Therefore, the acoustic environment assessment grade of all works of this project is determined as Grade � and only qualitative assessment will be made.
1.3.2 Assessment Key Points The assessment of this project includes the construction period and operation period. The assessment key points of the construction period are as follows: (1) Wuliangsuhai Lake sediment and ecological environment impact; (2) Environmental impact and mitigation measures of pollution during the construction period. The assessment key points of the operation period are as follows: (1) The quality improvement of Wuliangsuhai Lake water environment after the project is put into operation and the accumulative impacts of effluent discharge into Wuliangsuhai Lake. This part includes 3 main aspects:
y Accumulative impacts on Wuliangsuhai Lake water quality after completion of the project; y Impacts on the growing and reproduction condition changes of terrestrial life and aquatic life and the impacts
on aquatic resources, breeding and fishery production before and after completion of the project; y Impacts of single subproject on Wuliangsuhai Lake water quality during the operation.
(2) Environmental impact mitigation measures and environmental management plan during the operation period of the project. (3) The impacts and mitigation measures of sludge in the processing park wastewater treatment and reuse works, reclaimed water supply works and the dredged sediment in grid waterway.
1.4 Scope and Timing of Assessment and Environmental Protection Objects 1.4.1 Scope of Evaluation
7
The scope of overall environmental Assessment of this project is: y Under the requirements of Technical Guidelines for Environmental Impact Assessment, and on the basis of
formulated evaluation grades, the scope of Assessment of each subproject shall be regarded as the basic scope of assessment of the overall environmental assessment of this project;
y If there are environmental protection objectes, they should be included in the scope of assessment; y Elements and issues having direct relevance with or potential influence on this project should be included in the
scope of assessment as well; y Other associated similar projects (relating works) over the same period or regions possibly having an impact
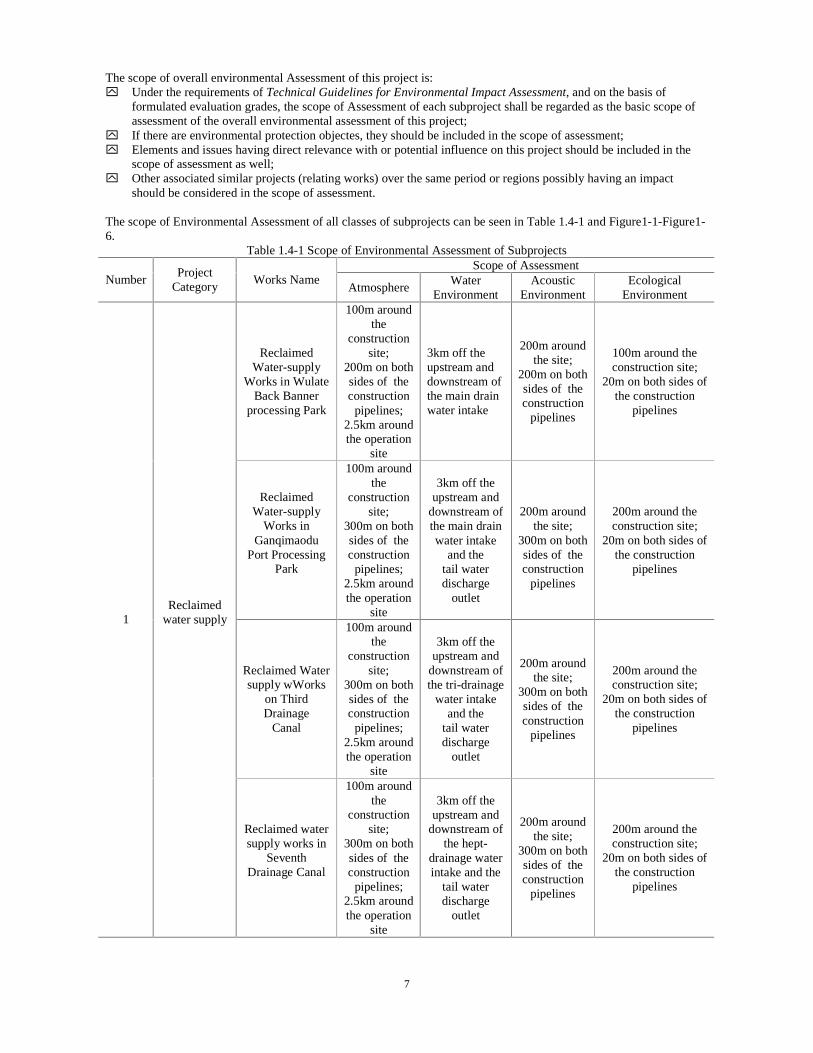
should be considered in the scope of assessment. The scope of Environmental Assessment of all classes of subprojects can be seen in Table 1.4-1 and Figure1-1-Figure1-6.
Table 1.4-1 Scope of Environmental Assessment of Subprojects Scope of Assessment
Number Project
Category Works Name
Atmosphere Water
Environment Acoustic
Environment Ecological
Environment
Reclaimed Water-supply
Works in Wulate Back Banner
processing Park
100m around the
construction site;
200m on both sides of the construction pipelines;
2.5km around the operation
site
3km off the upstream and downstream of the main drain water intake
200m around the site;
200m on both sides of the construction
pipelines
100m around the construction site;
20m on both sides of the construction
pipelines
Reclaimed Water-supply
Works in Ganqimaodu
Port Processing Park
100m around the
construction site;
300m on both sides of the construction pipelines;
2.5km around the operation
site
3km off the upstream and
downstream of the main drain water intake
and the tail water discharge
outlet
200m around
the site; 300m on both sides of the construction
pipelines
200m around the construction site;
20m on both sides of the construction
pipelines
Reclaimed Water supply wWorks
on Third Drainage
Canal
100m around the
construction site;
300m on both sides of the construction pipelines;
2.5km around the operation
site
3km off the upstream and
downstream of the tri-drainage
water intake and the
tail water discharge
outlet
200m around the site;
300m on both sides of the construction
pipelines
200m around the construction site;
20m on both sides of the construction
pipelines
1Reclaimed
water supply
Reclaimed water supply works in
Seventh Drainage Canal
100m around the
construction site;
300m on both sides of the construction pipelines;
2.5km around the operation
site
3km off the upstream and
downstream of the hept-
drainage water intake and the
tail water discharge
outlet
200m around the site;
300m on both sides of the construction
pipelines
200m around the construction site;
20m on both sides of the construction
pipelines
8
Wastewater treatment and reuse works in Wulate Back
Banner Processing Park (Huhe Town)
100m around the
construction site;
2.5km around the operation
site.
-200m
200m around the site
100m around the site
Wastewater treatment and reuse works in Ganqimaodu
Port Processing Park (Deling Mount
Town)
100m around the
construction site;
2.5km around the operation
site.
-200m around
the site 100m around the site 2
Processing Park
wastewater treatment and reuse works
Wastewater treatment and reuse works in Wulate Front
Banner Processing Park
(Xianfeng Town)
100m around the
construction site;
2.5km around the operation
site
-200m around
the site 100m around the site
Grid waterway Works in
Wuliangsuhai Lake
200m around the
construction site;
Sediment pile site 500m
Wuliangsuhai Lake
Sea area
200m around the
construction site
Wuliangsuhai Lake
area and 1km around the sea area
3
Wuliangsuhai Lake
sea area treatment
works artificial
wetlands works in
Wuliangsuhai Lake
200m around the
construction site
Wuliangsuhai Lake
area; ground water
evaluation scope is 500m
around the artificial wetlands
200m around the
construction site
Wuliangsuhai Lake area and 1km around
the sea area
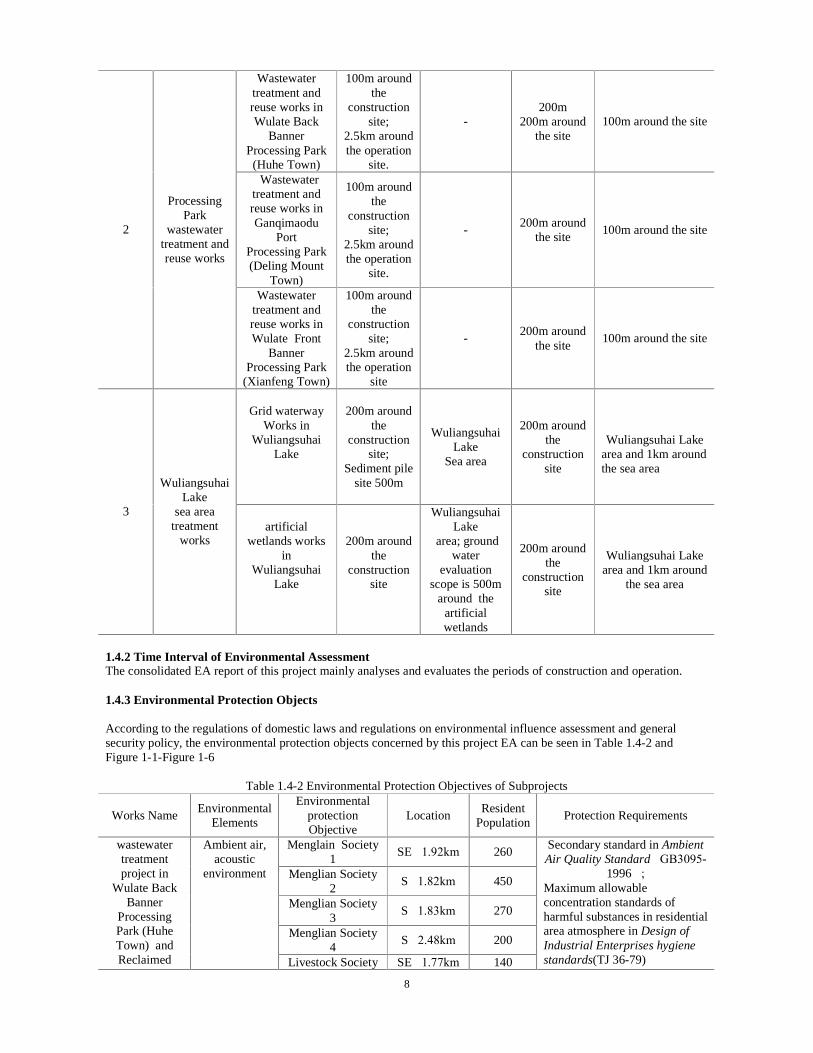
1.4.2 Time Interval of Environmental Assessment The consolidated EA report of this project mainly analyses and evaluates the periods of construction and operation. 1.4.3 Environmental Protection Objects According to the regulations of domestic laws and regulations on environmental influence assessment and general security policy, the environmental protection objects concerned by this project EA can be seen in Table 1.4-2 and Figure 1-1-Figure 1-6
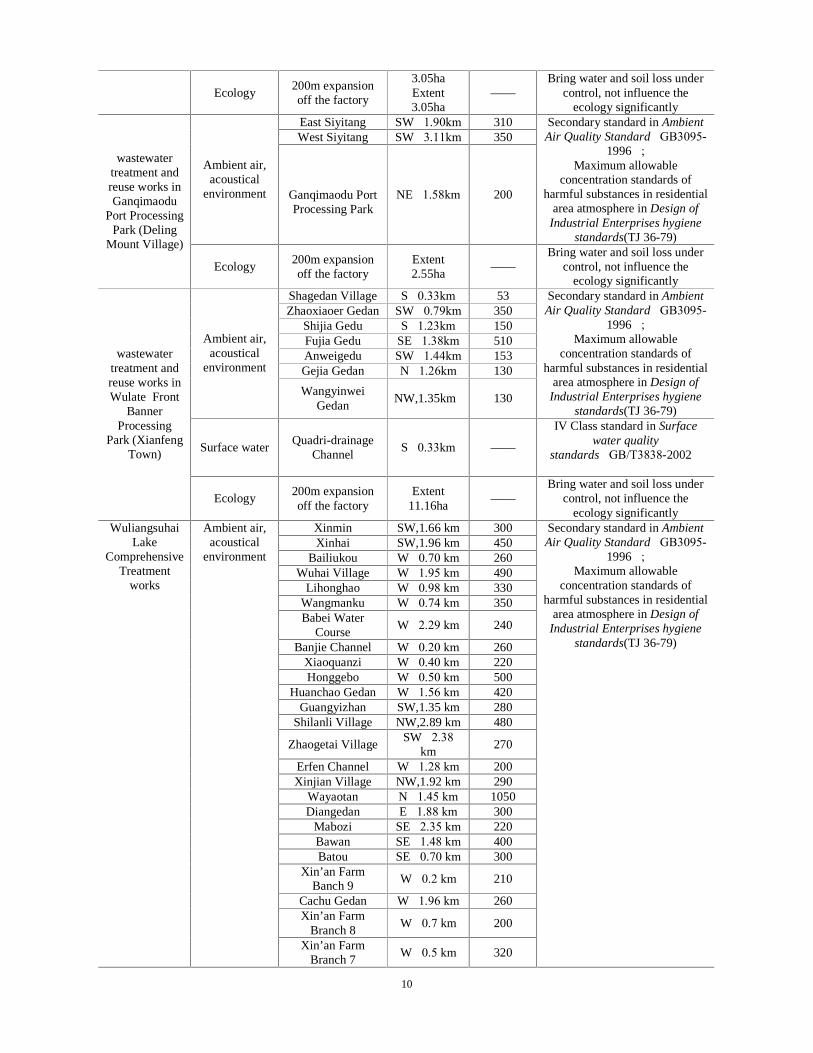
Table 1.4-2 Environmental Protection Objectives of Subprojects
Works Name Environmental
Elements
Environmental protection Objective
Location Resident
Population Protection Requirements
Menglain Society 1
SE�1.92km 260
Menglian Society 2
S�1.82km 450
Menglian Society 3
S�1.83km 270
Menglian Society 4
S�2.48km 200
wastewater treatment project in
Wulate Back Banner
Processing Park (Huhe Town) and Reclaimed
Ambient air, acoustic
environment
Livestock Society SE�1.77km 140
Secondary standard in Ambient Air Quality Standard�GB3095-
1996�; Maximum allowable concentration standards of harmful substances in residential area atmosphere in Design of Industrial Enterprises hygiene standards(TJ 36-79)

9
Menglian Village S�2.81km 300 Zhangdagebo NE�1.60km 400
Xinhong Village 1 NE�3.75km 210
Surface water Main drain S�2.9km —— IV Class standard in Surface
water quality standards�GB/T3838-2002�
water supply works in
Wulate Back Banner
Processing Park
Ecology 200m Expansion
off the factory Extent 5.47ha
—— Bring water and soil loss under
control, not influence the ecology significantly
Dashuncheng Group 4
E�0.71km 210
Shawan Village Cultivation
Society SW�0.5km 50 Ambient air,
acoustical environment
Zhangtiancaigedan NW�0.69km 260
Secondary standard in Ambient Air Quality Standard�GB3095-
1996�; Maximum allowable
concentration standards of harmful substances in residential
area atmosphere in Design of Industrial Enterprises hygiene
standards(TJ 36-79)
Surface water
Tri-drainage channel
E�0.1km ——
IV Class standard in Surface water quality
standards�GB/T3838-2002�
Reclaimed water supply
works in Third Drainage Canal
Ecology 200m expansion off the factory
Extent 3.52ha
—— Bring water and soil loss under
control, not influence the ecology significantly
Five Star Team 1 N�2.33km 1400 Old City Society 1 E�1.66km 500 Querhong Gedan WN�1.68km 520
Weijia Gedan W�1.79km 490 Liuwen Gedan SE�1.24km 500
Wuyuan County brick yard
W�0.15km 60
Hept-drainage Wastewater
Treatment Factory S�0.1km 50
Ambient air, acoustic
environment
Hongzhu Environmental
Protection Thermoelectricity
CO., Ltd.
SW�0.5km 1000
Secondary standard in Ambient Air Quality Standard�GB3095-
1996�; Maximum allowable
concentration standards of harmful substances in residential
area atmosphere in Design of Industrial Enterprises hygiene
standards(TJ 36-79)
Surface water Hept-drainage
channel
E�0.1km —— IV Class standard in Surface
water quality standards�GB/T3838-2002�
Reclaimed water supply
works in Seventh
Drainage Canal
Ecology 200m expansion off the factory
Extent 3.52ha
—— Bring water and soil loss under
control, not influence the ecology significantly
Muyanghai Farm Company 6
SE�0.79km 270
Fodder Team NE�0.81 km 315 Tractor Plowing
Team NE�1.39 km 280
Ambient air, acoustical
environment Eryang Gedan
SW�2.35
km 340
Secondary standard in Ambient Air Quality Standard�GB3095-
1996�; Maximum allowable
concentration standards of harmful substances in residential
area atmosphere in Design of Industrial Enterprises hygiene
standards(TJ 36-79)
Wangbahaizi N�2.44km —— III Class standard in Surface
water quality standards�GB/T3838-2002�
Reclaimed water supply
works in Ganqimaodu
Port Processing Park
Surface water
Main drain S�1.68km —— IV Class standard in Surface
water quality standards�GB/T3838-2002�
10
Ecology 200m expansion off the factory
3.05ha Extent 3.05ha
—— Bring water and soil loss under
control, not influence the ecology significantly
East Siyitang SW�1.90km 310 West Siyitang SW�3.11km 350
Ambient air, acoustical
environment Ganqimaodu Port Processing Park
NE�1.58km 200
Secondary standard in Ambient Air Quality Standard�GB3095-
1996�; Maximum allowable
concentration standards of harmful substances in residential
area atmosphere in Design of Industrial Enterprises hygiene
standards(TJ 36-79)
wastewater treatment and reuse works in Ganqimaodu
Port Processing Park (Deling
Mount Village)
Ecology 200m expansion off the factory
Extent 2.55ha
—— Bring water and soil loss under
control, not influence the ecology significantly
Shagedan Village S�0.33km 53 Zhaoxiaoer Gedan SW�0.79km 350
Shijia Gedu S�1.23km 150 Fujia Gedu SE�1.38km 510 Anweigedu SW�1.44km 153 Gejia Gedan N�1.26km 130
Ambient air, acoustical
environment
Wangyinwei Gedan
NW,1.35km 130
Secondary standard in Ambient Air Quality Standard�GB3095-
1996�; Maximum allowable
concentration standards of harmful substances in residential
area atmosphere in Design of Industrial Enterprises hygiene
standards(TJ 36-79)
Surface water Quadri-drainage
Channel S�0.33km ——
IV Class standard in Surface water quality
standards�GB/T3838-2002�
wastewater treatment and reuse works in Wulate Front
Banner Processing
Park (Xianfeng Town)
Ecology 200m expansion off the factory
Extent 11.16ha
—— Bring water and soil loss under
control, not influence the ecology significantly
Xinmin SW,1.66 km 300 Xinhai SW,1.96 km 450
Bailiukou W�0.70 km 260 Wuhai Village W�1.95 km 490
Lihonghao W�0.98 km 330 Wangmanku W�0.74 km 350 Babei Water
Course W�2.29 km 240
Banjie Channel W�0.20 km 260 Xiaoquanzi W�0.40 km 220 Honggebo W�0.50 km 500
Huanchao Gedan W�1.56 km 420 Guangyizhan SW,1.35 km 280
Shilanli Village NW,2.89 km 480
Zhaogetai Village SW�2.38
km 270
Erfen Channel W�1.28 km 200 Xinjian Village NW,1.92 km 290
Wayaotan N�1.45 km 1050 Diangedan E�1.88 km 300
Mabozi SE�2.35 km 220 Bawan SE�1.48 km 400 Batou SE�0.70 km 300
Xin’an Farm Banch 9
W�0.2 km 210
Cachu Gedan W�1.96 km 260 Xin’an Farm
Branch 8 W�0.7 km 200
Wuliangsuhai Lake
Comprehensive Treatment
works
Ambient air, acoustical
environment
Xin’an Farm Branch 7
W�0.5 km 320
Secondary standard in Ambient Air Quality Standard�GB3095-
1996�; Maximum allowable
concentration standards of harmful substances in residential
area atmosphere in Design of Industrial Enterprises hygiene
standards(TJ 36-79)
11
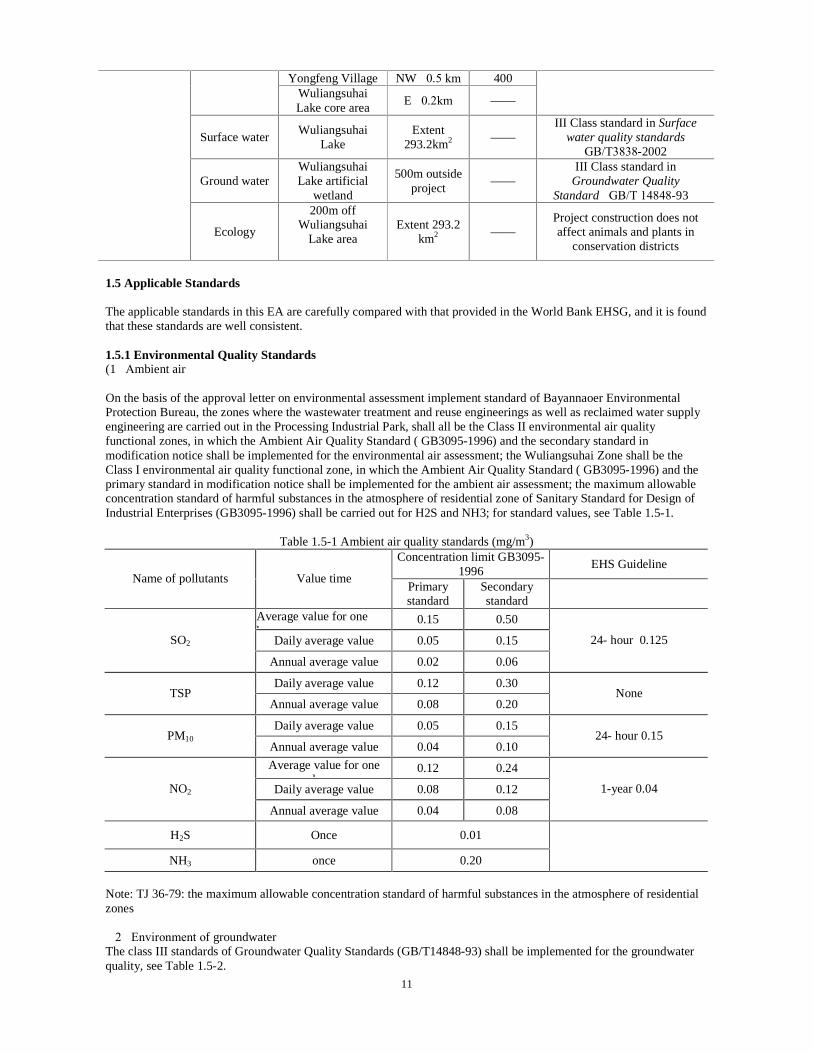
Yongfeng Village NW�0.5 km 400 Wuliangsuhai Lake core area
E�0.2km ——
Surface water Wuliangsuhai
Lake Extent
293.2km2 —— III Class standard in Surface
water quality standards �GB/T3838-2002�
Ground water Wuliangsuhai Lake artificial
wetland
500m outside project
—— III Class standard in
Groundwater Quality Standard�GB/T 14848-93�
Ecology
200m off Wuliangsuhai
Lake area
Extent 293.2 km2 ——
Project construction does not affect animals and plants in
conservation districts
1.5 Applicable Standards
The applicable standards in this EA are carefully compared with that provided in the World Bank EHSG, and it is found that these standards are well consistent. 1.5.1 Environmental Quality Standards (1�Ambient air On the basis of the approval letter on environmental assessment implement standard of Bayannaoer Environmental Protection Bureau, the zones where the wastewater treatment and reuse engineerings as well as reclaimed water supply engineering are carried out in the Processing Industrial Park, shall all be the Class II environmental air quality functional zones, in which the Ambient Air Quality Standard ( GB3095-1996) and the secondary standard in modification notice shall be implemented for the environmental air assessment; the Wuliangsuhai Zone shall be the Class I environmental air quality functional zone, in which the Ambient Air Quality Standard ( GB3095-1996) and the primary standard in modification notice shall be implemented for the ambient air assessment; the maximum allowable concentration standard of harmful substances in the atmosphere of residential zone of Sanitary Standard for Design of Industrial Enterprises (GB3095-1996) shall be carried out for H2S and NH3; for standard values, see Table 1.5-1.
Table 1.5-1 Ambient air quality standards (mg/m3)
Concentration limit GB3095-1996
EHS Guideline Name of pollutants Value time
Primary standard
Secondary standard
Average value for one h
0.15 0.50
Daily average value 0.05 0.15 SO2
Annual average value 0.02 0.06
24- hour 0.125
Daily average value 0.12 0.30 TSP
Annual average value 0.08 0.20 None
Daily average value 0.05 0.15 PM10
Annual average value 0.04 0.10 24- hour 0.15
Average value for one h
0.12 0.24
Daily average value 0.08 0.12 NO2
Annual average value 0.04 0.08
1-year 0.04
H2S Once 0.01
NH3 once 0.20
Note: TJ 36-79: the maximum allowable concentration standard of harmful substances in the atmosphere of residential zones �2�Environment of groundwater The class III standards of Groundwater Quality Standards (GB/T14848-93) shall be implemented for the groundwater quality, see Table 1.5-2.
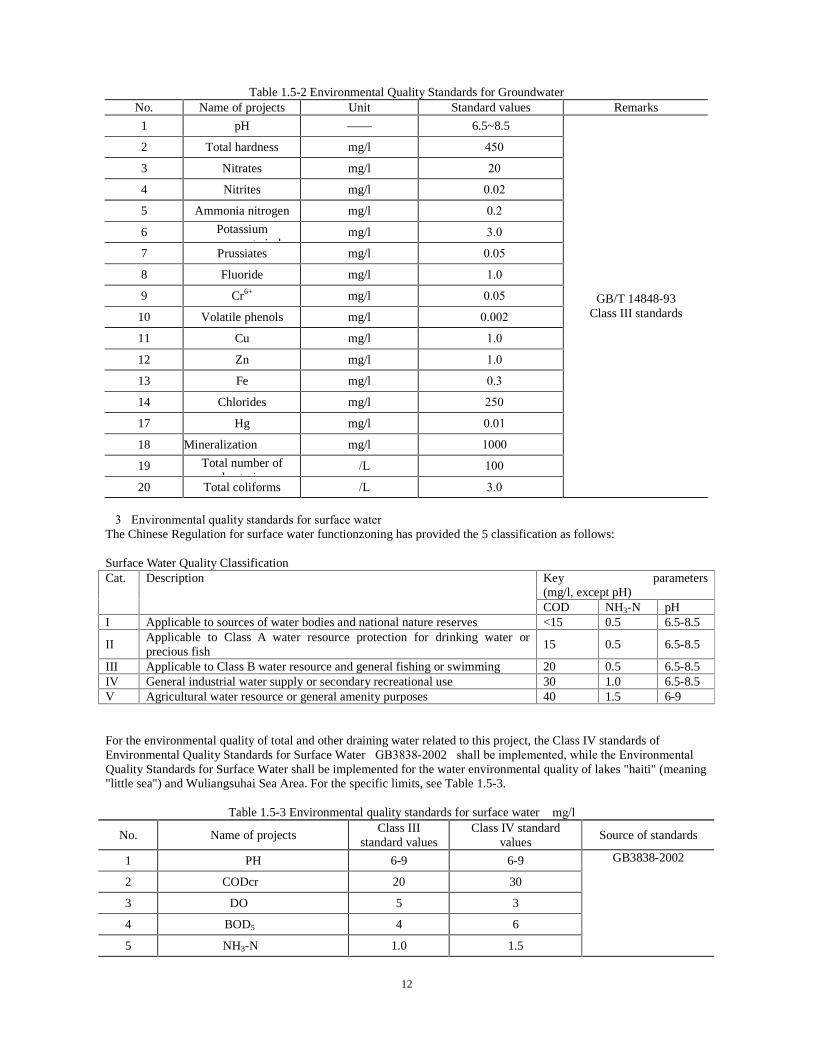
12
Table 1.5-2 Environmental Quality Standards for Groundwater No. Name of projects Unit Standard values Remarks
1 pH —— 6.5~8.5
2 Total hardness mg/l �450
3 Nitrates mg/l �20
4 Nitrites mg/l �0.02
5 Ammonia nitrogen mg/l �0.2
6 Potassium t i d
mg/l �3.0
7 Prussiates mg/l �0.05
8 Fluoride mg/l �1.0
9 Cr6+ mg/l �0.05
10 Volatile phenols mg/l �0.002
11 Cu mg/l �1.0
12 Zn mg/l �1.0
13 Fe mg/l �0.3
14 Chlorides mg/l �250
17 Hg mg/l �0.01
18 Mineralization mg/l �1000
19 Total number of b t i
�/L �100
20 Total coliforms �/L �3.0
GB/T 14848-93 Class III standards
�3�Environmental quality standards for surface water The Chinese Regulation for surface water functionzoning has provided the 5 classification as follows: Surface Water Quality Classification
Key parameters(mg/l, except pH)
Cat. Description
COD NH3-N pH I Applicable to sources of water bodies and national nature reserves <15 0.5 6.5-8.5
II Applicable to Class A water resource protection for drinking water or precious fish
15 0.5 6.5-8.5
III Applicable to Class B water resource and general fishing or swimming 20 0.5 6.5-8.5 IV General industrial water supply or secondary recreational use 30 1.0 6.5-8.5 V Agricultural water resource or general amenity purposes 40 1.5 6-9
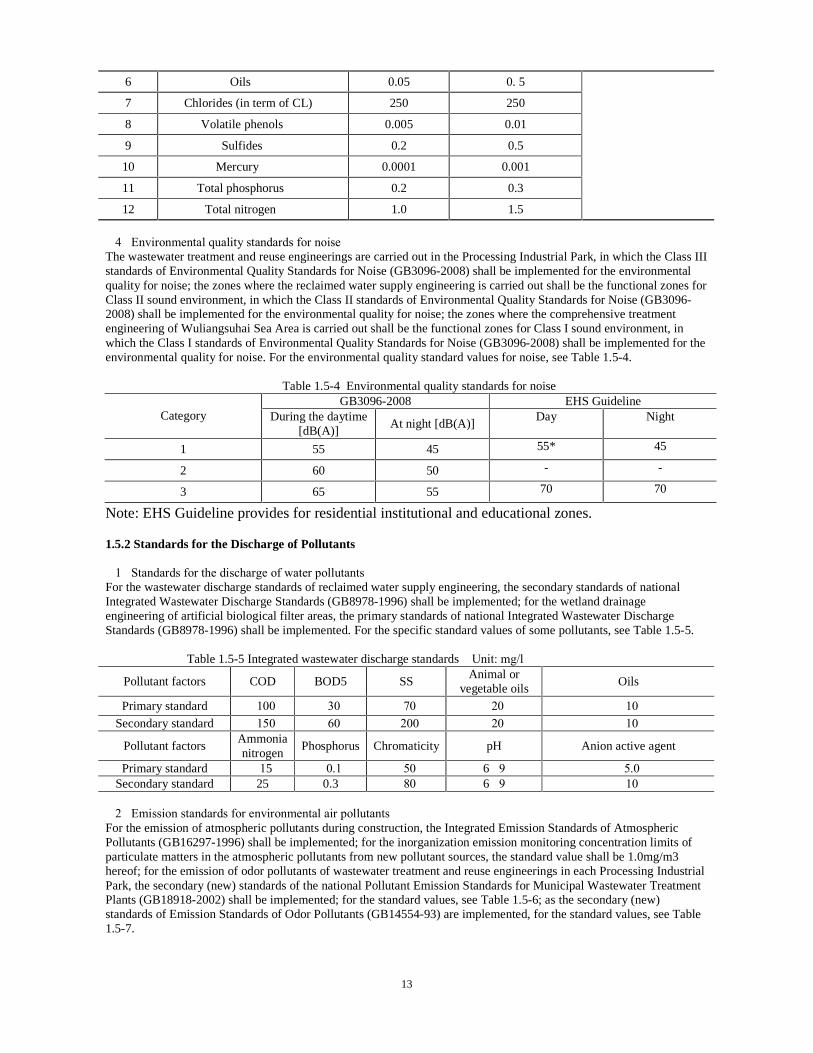
For the environmental quality of total and other draining water related to this project, the Class IV standards of Environmental Quality Standards for Surface Water�GB3838-2002�shall be implemented, while the Environmental Quality Standards for Surface Water shall be implemented for the water environmental quality of lakes "haiti" (meaning "little sea") and Wuliangsuhai Sea Area. For the specific limits, see Table 1.5-3.
Table 1.5-3 Environmental quality standards for surface water �mg/l�
No. Name of projects Class III
standard values Class IV standard
values Source of standards
1 PH 6-9 6-9
2 CODcr � 20 30
3 DO � 5 3
4 BOD5 � 4 6
5 NH3-N � 1.0 1.5
GB3838-2002
13
6 Oils � 0.05 0. 5
7 Chlorides (in term of CL) � 250 250
8 Volatile phenols � 0.005 0.01
9 Sulfides � 0.2 0.5
10 Mercury � 0.0001 0.001
11 Total phosphorus � 0.2 0.3
12 Total nitrogen � 1.0 1.5
�4�Environmental quality standards for noise The wastewater treatment and reuse engineerings are carried out in the Processing Industrial Park, in which the Class III standards of Environmental Quality Standards for Noise (GB3096-2008) shall be implemented for the environmental quality for noise; the zones where the reclaimed water supply engineering is carried out shall be the functional zones for Class II sound environment, in which the Class II standards of Environmental Quality Standards for Noise (GB3096-2008) shall be implemented for the environmental quality for noise; the zones where the comprehensive treatment engineering of Wuliangsuhai Sea Area is carried out shall be the functional zones for Class I sound environment, in which the Class I standards of Environmental Quality Standards for Noise (GB3096-2008) shall be implemented for the environmental quality for noise. For the environmental quality standard values for noise, see Table 1.5-4.
Table 1.5-4 Environmental quality standards for noise
GB3096-2008 EHS Guideline Category During the daytime
[dB(A)] At night [dB(A)]
Day Night
1 55 45 55* 45
2 60 50 - -
3 65 55 70 70
Note: EHS Guideline provides for residential institutional and educational zones. 1.5.2 Standards for the Discharge of Pollutants �1�Standards for the discharge of water pollutants For the wastewater discharge standards of reclaimed water supply engineering, the secondary standards of national Integrated Wastewater Discharge Standards (GB8978-1996) shall be implemented; for the wetland drainage engineering of artificial biological filter areas, the primary standards of national Integrated Wastewater Discharge Standards (GB8978-1996) shall be implemented. For the specific standard values of some pollutants, see Table 1.5-5.
Table 1.5-5 Integrated wastewater discharge standards �Unit: mg/l�
Pollutant factors COD BOD5 SS Animal or
vegetable oils Oils
Primary standard �100 �30 �70 �20 �10
Secondary standard �150 �60 �200 �20 �10
Pollutant factors Ammonia nitrogen
Phosphorus Chromaticity pH Anion active agent
Primary standard �15 �0.1 �50 6�9 �5.0 Secondary standard 25 0.3 �80 6�9 �10
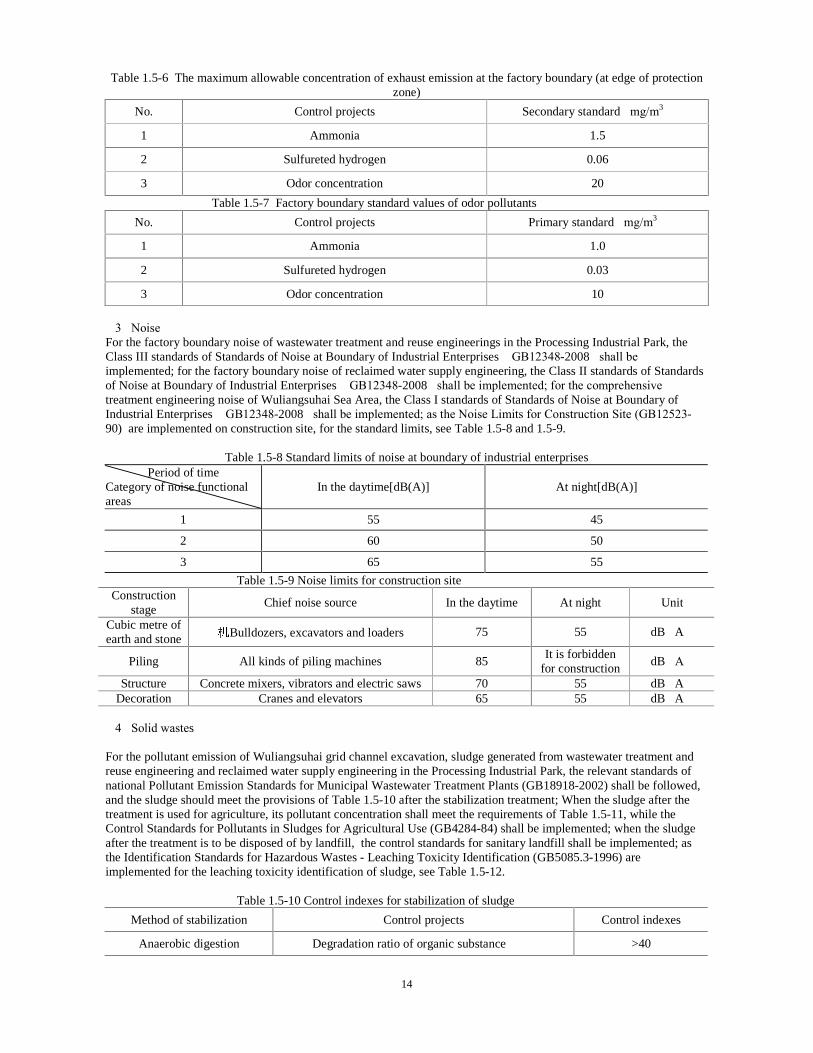
�2�Emission standards for environmental air pollutants For the emission of atmospheric pollutants during construction, the Integrated Emission Standards of Atmospheric Pollutants (GB16297-1996) shall be implemented; for the inorganization emission monitoring concentration limits of particulate matters in the atmospheric pollutants from new pollutant sources, the standard value shall be 1.0mg/m3 hereof; for the emission of odor pollutants of wastewater treatment and reuse engineerings in each Processing Industrial Park, the secondary (new) standards of the national Pollutant Emission Standards for Municipal Wastewater Treatment Plants (GB18918-2002) shall be implemented; for the standard values, see Table 1.5-6; as the secondary (new) standards of Emission Standards of Odor Pollutants (GB14554-93) are implemented, for the standard values, see Table 1.5-7.
14
Table 1.5-6 The maximum allowable concentration of exhaust emission at the factory boundary (at edge of protection zone)
No. Control projects Secondary standard�mg/m3�
1 Ammonia 1.5
2 Sulfureted hydrogen 0.06
3 Odor concentration 20
Table 1.5-7 Factory boundary standard values of odor pollutants
No. Control projects Primary standard�mg/m3�
1 Ammonia 1.0
2 Sulfureted hydrogen 0.03
3 Odor concentration 10
�3�Noise For the factory boundary noise of wastewater treatment and reuse engineerings in the Processing Industrial Park, the Class III standards of Standards of Noise at Boundary of Industrial Enterprises �GB12348-2008�shall be implemented; for the factory boundary noise of reclaimed water supply engineering, the Class II standards of Standards of Noise at Boundary of Industrial Enterprises �GB12348-2008�shall be implemented; for the comprehensive treatment engineering noise of Wuliangsuhai Sea Area, the Class I standards of Standards of Noise at Boundary of Industrial Enterprises �GB12348-2008�shall be implemented; as the Noise Limits for Construction Site (GB12523-90) are implemented on construction site, for the standard limits, see Table 1.5-8 and 1.5-9.
Table 1.5-8 Standard limits of noise at boundary of industrial enterprises Period of time
Category of noise functional areas
In the daytime[dB(A)] At night[dB(A)]
1 55 45
2 60 50
3 65 55
Table 1.5-9 Noise limits for construction site Construction
stage Chief noise source In the daytime At night Unit
Cubic metre of earth and stone Bulldozers, excavators and loaders 75 55 dB�A�
Piling All kinds of piling machines 85 It is forbidden
for construction dB�A�
Structure Concrete mixers, vibrators and electric saws 70 55 dB�A�Decoration Cranes and elevators 65 55 dB�A�
�4�Solid wastes
For the pollutant emission of Wuliangsuhai grid channel excavation, sludge generated from wastewater treatment and reuse engineering and reclaimed water supply engineering in the Processing Industrial Park, the relevant standards of national Pollutant Emission Standards for Municipal Wastewater Treatment Plants (GB18918-2002) shall be followed, and the sludge should meet the provisions of Table 1.5-10 after the stabilization treatment; When the sludge after the treatment is used for agriculture, its pollutant concentration shall meet the requirements of Table 1.5-11, while the Control Standards for Pollutants in Sludges for Agricultural Use (GB4284-84) shall be implemented; when the sludge after the treatment is to be disposed of by landfill, the control standards for sanitary landfill shall be implemented; as the Identification Standards for Hazardous Wastes - Leaching Toxicity Identification (GB5085.3-1996) are implemented for the leaching toxicity identification of sludge, see Table 1.5-12.
Table 1.5-10 Control indexes for stabilization of sludge
Method of stabilization Control projects Control indexes
Anaerobic digestion Degradation ratio of organic substance��� >40
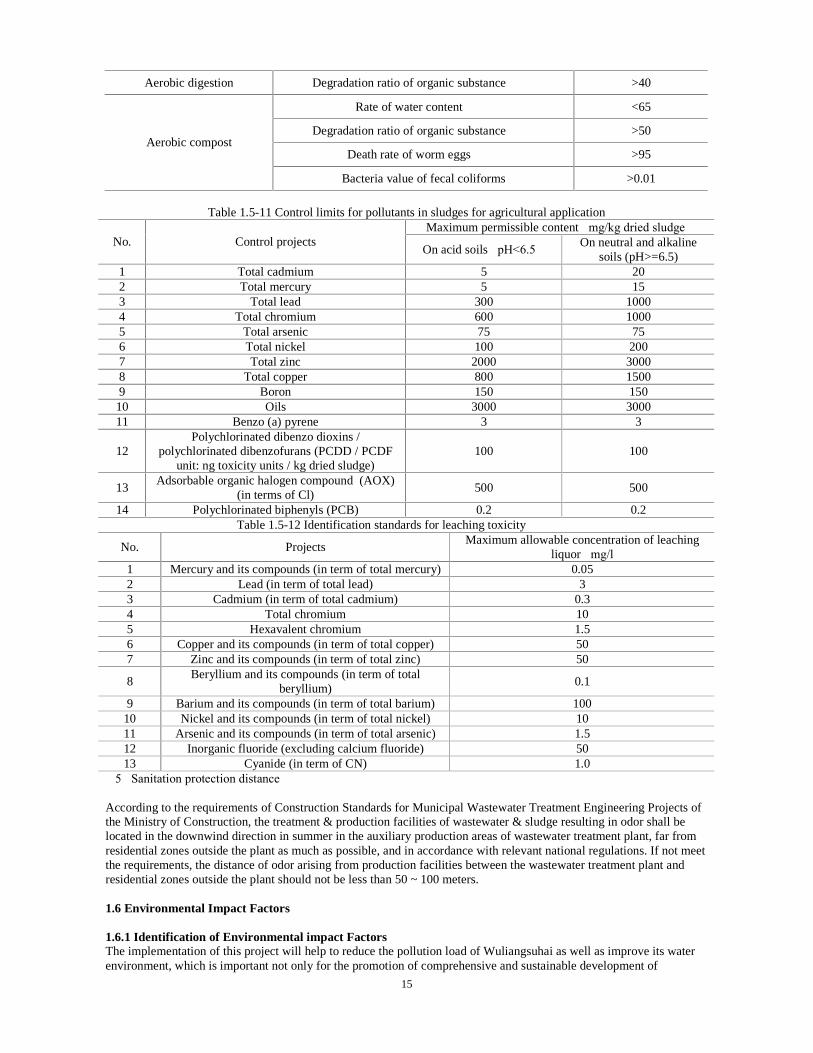
15
Aerobic digestion Degradation ratio of organic substance��� >40
Rate of water content��� <65
Degradation ratio of organic substance��� >50
Death rate of worm eggs��� >95 Aerobic compost
Bacteria value of fecal coliforms >0.01
Table 1.5-11 Control limits for pollutants in sludges for agricultural application Maximum permissible content�mg/kg dried sludge�
No. Control projects On acid soils�pH<6.5�
On neutral and alkaline soils (pH>=6.5)
1 Total cadmium 5 20 2 Total mercury 5 15 3 Total lead 300 1000 4 Total chromium 600 1000 5 Total arsenic 75 75 6 Total nickel 100 200 7 Total zinc 2000 3000 8 Total copper 800 1500 9 Boron 150 150 10 Oils 3000 3000 11 Benzo (a) pyrene 3 3
12 Polychlorinated dibenzo dioxins /
polychlorinated dibenzofurans (PCDD / PCDF unit: ng toxicity units / kg dried sludge)
100 100
13 Adsorbable organic halogen compound (AOX)
(in terms of Cl) 500 500
14 Polychlorinated biphenyls (PCB) 0.2 0.2 Table 1.5-12 Identification standards for leaching toxicity
No. Projects Maximum allowable concentration of leaching
liquor�mg/l 1 Mercury and its compounds (in term of total mercury) 0.05 2 Lead (in term of total lead) 3 3 Cadmium (in term of total cadmium) 0.3 4 Total chromium 10 5 Hexavalent chromium 1.5 6 Copper and its compounds (in term of total copper) 50 7 Zinc and its compounds (in term of total zinc) 50
8Beryllium and its compounds (in term of total
beryllium) 0.1
9 Barium and its compounds (in term of total barium) 100 10 Nickel and its compounds (in term of total nickel) 10 11 Arsenic and its compounds (in term of total arsenic) 1.5 12 Inorganic fluoride (excluding calcium fluoride) 50 13 Cyanide (in term of CN) 1.0
�5�Sanitation protection distance
According to the requirements of Construction Standards for Municipal Wastewater Treatment Engineering Projects of the Ministry of Construction, the treatment & production facilities of wastewater & sludge resulting in odor shall be located in the downwind direction in summer in the auxiliary production areas of wastewater treatment plant, far from residential zones outside the plant as much as possible, and in accordance with relevant national regulations. If not meet the requirements, the distance of odor arising from production facilities between the wastewater treatment plant and residential zones outside the plant should not be less than 50 ~ 100 meters. 1.6 Environmental Impact Factors 1.6.1 Identification of Environmental impact Factors The implementation of this project will help to reduce the pollution load of Wuliangsuhai as well as improve its water environment, which is important not only for the promotion of comprehensive and sustainable development of
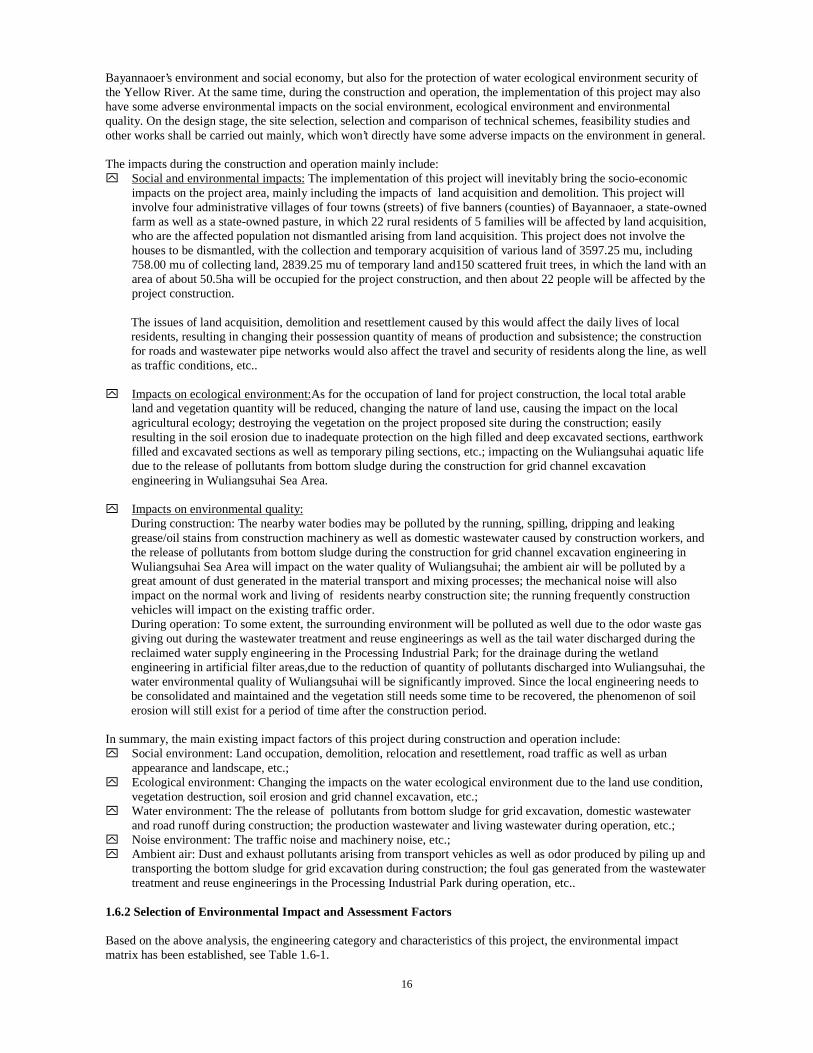
16
Bayannaoer’s environment and social economy, but also for the protection of water ecological environment security of the Yellow River. At the same time, during the construction and operation, the implementation of this project may also have some adverse environmental impacts on the social environment, ecological environment and environmental quality. On the design stage, the site selection, selection and comparison of technical schemes, feasibility studies and other works shall be carried out mainly, which won’t directly have some adverse impacts on the environment in general. The impacts during the construction and operation mainly include: y Social and environmental impacts:The implementation of this project will inevitably bring the socio-economic
impacts on the project area, mainly including the impacts of land acquisition and demolition. This project will involve four administrative villages of four towns (streets) of five banners (counties) of Bayannaoer, a state-owned farm as well as a state-owned pasture, in which 22 rural residents of 5 families will be affected by land acquisition, who are the affected population not dismantled arising from land acquisition. This project does not involve the houses to be dismantled, with the collection and temporary acquisition of various land of 3597.25 mu, including 758.00 mu of collecting land, 2839.25 mu of temporary land and150 scattered fruit trees, in which the land with an area of about 50.5ha will be occupied for the project construction, and then about 22 people will be affected by the project construction.
The issues of land acquisition, demolition and resettlement caused by this would affect the daily lives of local residents, resulting in changing their possession quantity of means of production and subsistence; the construction for roads and wastewater pipe networks would also affect the travel and security of residents along the line, as well as traffic conditions, etc..
y Impacts on ecological environment:As for the occupation of land for project construction, the local total arable land and vegetation quantity will be reduced, changing the nature of land use, causing the impact on the local agricultural ecology; destroying the vegetation on the project proposed site during the construction; easily resulting in the soil erosion due to inadequate protection on the high filled and deep excavated sections, earthwork filled and excavated sections as well as temporary piling sections, etc.; impacting on the Wuliangsuhai aquatic life due to the release of pollutants from bottom sludge during the construction for grid channel excavation engineering in Wuliangsuhai Sea Area.
y Impacts on environmental quality:
During construction: The nearby water bodies may be polluted by the running, spilling, dripping and leaking grease/oil stains from construction machinery as well as domestic wastewater caused by construction workers, and the release of pollutants from bottom sludge during the construction for grid channel excavation engineering in Wuliangsuhai Sea Area will impact on the water quality of Wuliangsuhai; the ambient air will be polluted by a great amount of dust generated in the material transport and mixing processes; the mechanical noise will also impact on the normal work and living of residents nearby construction site; the running frequently construction vehicles will impact on the existing traffic order. During operation: To some extent, the surrounding environment will be polluted as well due to the odor waste gas giving out during the wastewater treatment and reuse engineerings as well as the tail water discharged during the reclaimed water supply engineering in the Processing Industrial Park; for the drainage during the wetland engineering in artificial filter areas,due to the reduction of quantity of pollutants discharged into Wuliangsuhai, the water environmental quality of Wuliangsuhai will be significantly improved. Since the local engineering needs to be consolidated and maintained and the vegetation still needs some time to be recovered, the phenomenon of soil erosion will still exist for a period of time after the construction period.
In summary, the main existing impact factors of this project during construction and operation include: y Social environment: Land occupation, demolition, relocation and resettlement, road traffic as well as urban
appearance and landscape, etc.; y Ecological environment: Changing the impacts on the water ecological environment due to the land use condition,
vegetation destruction, soil erosion and grid channel excavation, etc.; y Water environment: The the release of pollutants from bottom sludge for grid excavation, domestic wastewater
and road runoff during construction; the production wastewater and living wastewater during operation, etc.; y Noise environment: The traffic noise and machinery noise, etc.; y Ambient air: Dust and exhaust pollutants arising from transport vehicles as well as odor produced by piling up and
transporting the bottom sludge for grid excavation during construction; the foul gas generated from the wastewater treatment and reuse engineerings in the Processing Industrial Park during operation, etc..
1.6.2 Selection of Environmental Impact and Assessment Factors Based on the above analysis, the engineering category and characteristics of this project, the environmental impact matrix has been established, see Table 1.6-1.
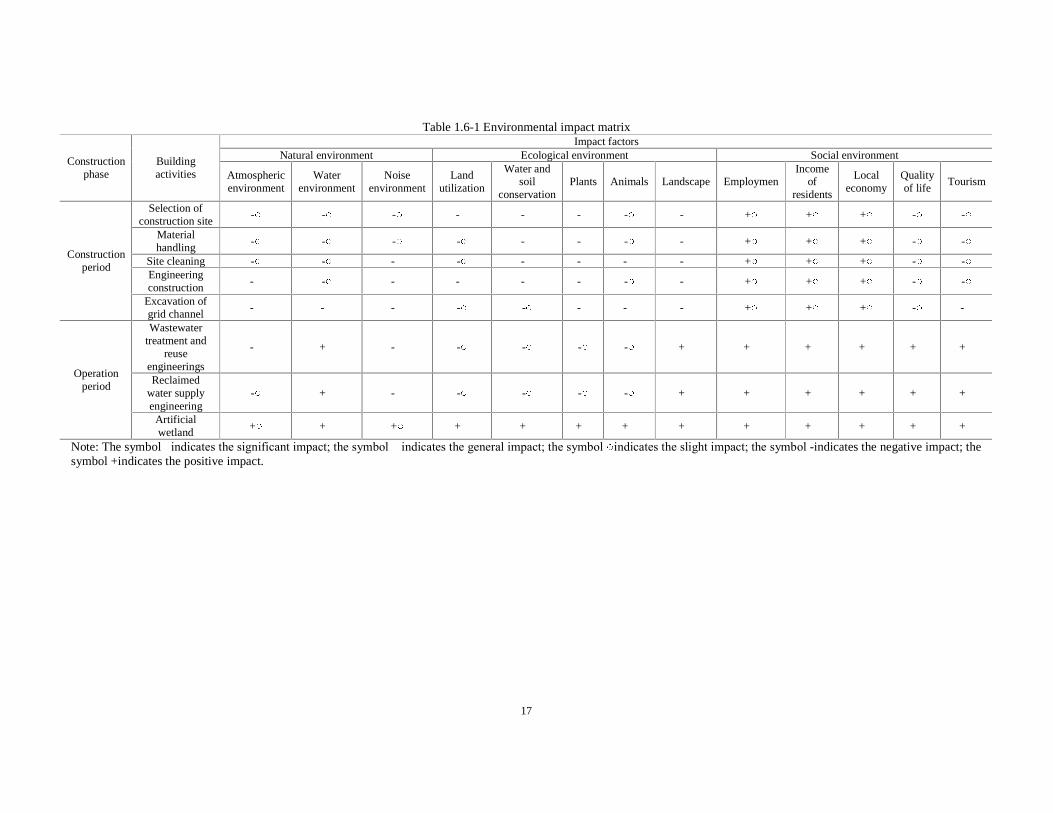
17
Table 1.6-1 Environmental impact matrixImpact factors
Natural environment Ecological environment Social environmentConstructionphase
Buildingactivities Atmospheric
environmentWater
environmentNoise
environmentLand
utilization
Water andsoil
conservationPlants Animals Landscape Employmen
Incomeof
residents
Localeconomy
Qualityof life
Tourism
Selection ofconstruction site
- - - -� -� -� - -� + + + - -
Materialhandling
- - - - -� -� - -� + + + - -
Sitecleaning - - -� - -� -� -� -� + + + - -Engineeringconstruction
-� - -� -� -� -� - -� + + + - -
Constructionperiod
Excavation ofgrid channel
-� -� -� - - -� -� -� + + + - -�
Wastewatertreatment and
reuseengineerings
-� +� -� - - - - +� +� +� +� +� +�
Reclaimedwater supplyengineering
- +� -� - - - - +� +� +� +� +� +�
Operationperiod
Artif icialwetland
+ +� + +� +� +� +� +� +� +� +� +� +�
Note: The symbol�indicates the significant impact; the symbol �indicates the general impact; the symbol indicates the slight impact; the symbol -indicates the negative impact; thesymbol +indicates the positive impact.
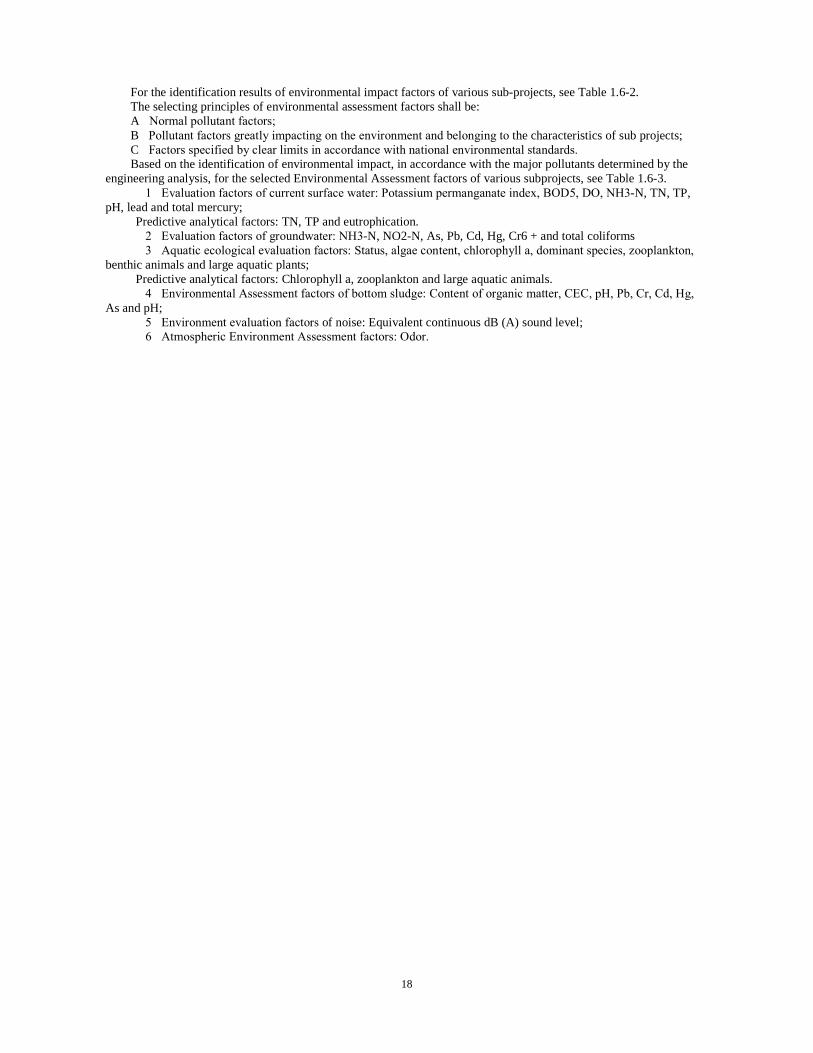
18
For the identification results of environmental impact factors of various sub-projects, see Table 1.6-2. The selecting principles of environmental assessment factors shall be: A�Normal pollutant factors; B�Pollutant factors greatly impacting on the environment and belonging to the characteristics of sub projects; C�Factors specified by clear limits in accordance with national environmental standards. Based on the identification of environmental impact, in accordance with the major pollutants determined by the
engineering analysis, for the selected Environmental Assessment factors of various subprojects, see Table 1.6-3. �1�Evaluation factors of current surface water: Potassium permanganate index, BOD5, DO, NH3-N, TN, TP,
pH, lead and total mercury; Predictive analytical factors: TN, TP and eutrophication. �2�Evaluation factors of groundwater: NH3-N, NO2-N, As, Pb, Cd, Hg, Cr6 + and total coliforms��3�Aquatic ecological evaluation factors: Status, algae content, chlorophyll a, dominant species, zooplankton,
benthic animals and large aquatic plants; Predictive analytical factors: Chlorophyll a, zooplankton and large aquatic animals. �4�Environmental Assessment factors of bottom sludge: Content of organic matter, CEC, pH, Pb, Cr, Cd, Hg,
As and pH; �5�Environment evaluation factors of noise: Equivalent continuous dB (A) sound level; �6�Atmospheric Environment Assessment factors: Odor.
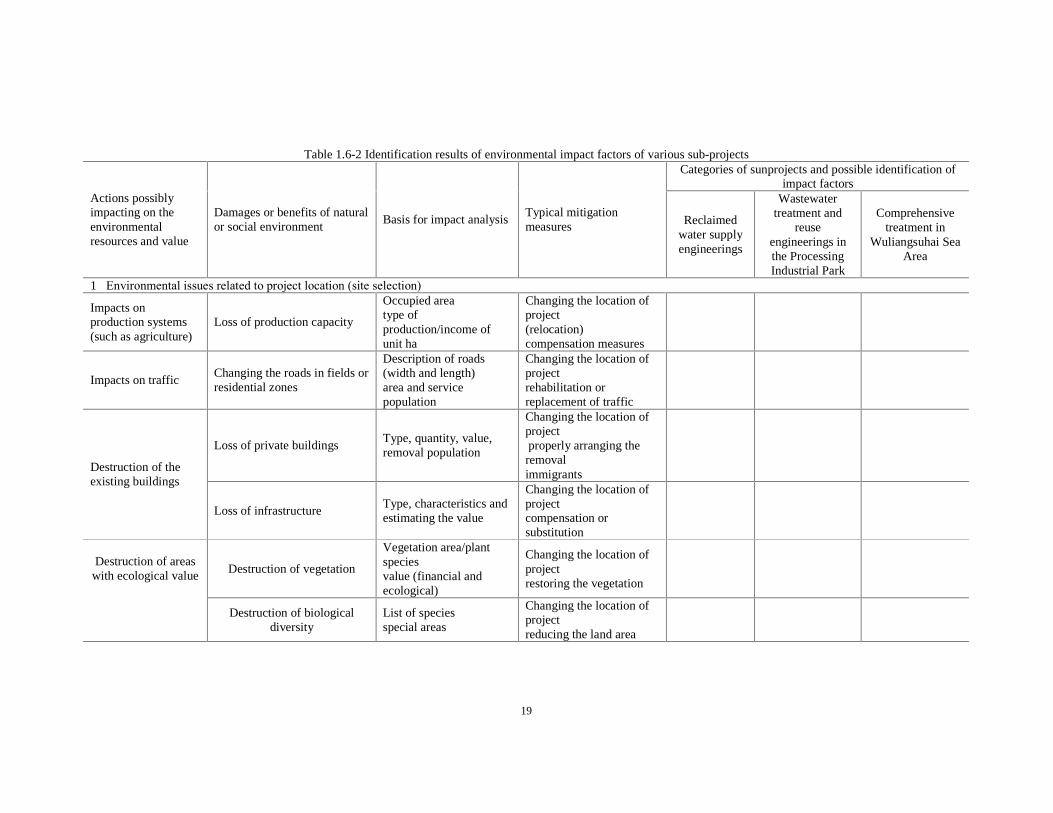
19
Table1.6-2 Identification results of environmental impact factors of various sub-projectsCategories of sunprojects and possible identification of
impact factorsActions possiblyimpacting on theenvironmentalresourcesand value
Damages or benefits of naturalor social environment
Basis for impact analysisTypical mitigationmeasures Reclaimed
water supplyengineerings
Wastewatertreatment and
reuseengineerings inthe ProcessingIndustrial Park
Comprehensivetreatment in
Wuliangsuhai SeaArea
1�Environmental issues related to project location (site selection)
Impacts onproduction systems(such as agriculture)
Loss of production capacity
Occupied areatype ofproduction/income ofunit ha
Changing the location ofproject(relocation)compensation measures
�
Impacts on trafficChanging the roads in fields orresidential zones
Description of roads(width and length)area and servicepopulation
Changing the location ofprojectrehabilitation orreplacement of traffic
� �
Loss of private buildingsType, quantity, value,removal population
Changing the location ofprojectproperly arranging theremovalimmigrants
Destruction of theexisting buildings
Loss of infrastructureType, characteristics andestimating the value
Changing the location ofprojectcompensation orsubstitution
� �
Destruction of vegetation
Vegetation area/plantspeciesvalue (financial andecological)
Changing the location ofprojectrestoring the vegetation
� �Destruction of areaswith ecological value
Destruction of biologicaldiversity
List of speciesspecial areas
Changing the location ofprojectreducing the land area
�
20
Impacts on protected areas:National parks and natural
reserves
Type and purpose ofprotectiontotal area, area to beaffected
Changing the location ofprojectreducing the land area
�
Impacts on the surfacewaterenvironment and flood risk
Hydrological parameters,monitoring values of
water quality
Changing the location ofprojectchanging the location ofoutfall
� � �
Destruction ofdrainage channels
and ditchesFloods, soil acidification
Main drainagepatterns orline of channels andditches (pipeline)
Changing the location ofprojectpaying attention to theprotection of drainagechannels and ditchesduring construction
�
Artificialinfrastructure to be
built in outdoorscenic areas
Destruction of landscapeandtourism value
Destructiveness and areaof landscape value
Changing the location ofprojectcarrying out theappropriate design toprotect thescenic areas
�
2�Environmental issues possibly existing during construction of project
Temporary occupiedland for work sheds
and storageareas, etc.
Impacts on land use andproduction
Occupied area, use,location
Reducing the area ofoccupied land, requiringthecontractor’s obligationmonitoring andsupervising theconstruction activities
� � �
Clearing ofvegetation
Destruction of woodland,orchard and farmland
Type / area andeconomic value ofvegetation to be damaged
Clearing ways, monitoringtheclearing activitiesdivision of area
� � �
Moreaccessible toarrive in natural areas
Thereare risks, such as therisk of poaching, etc.
Location of sensitiveareas
threatened areas orspecies
Contractor’s obligationsmonitoring and managingtheconstruction personnel
�
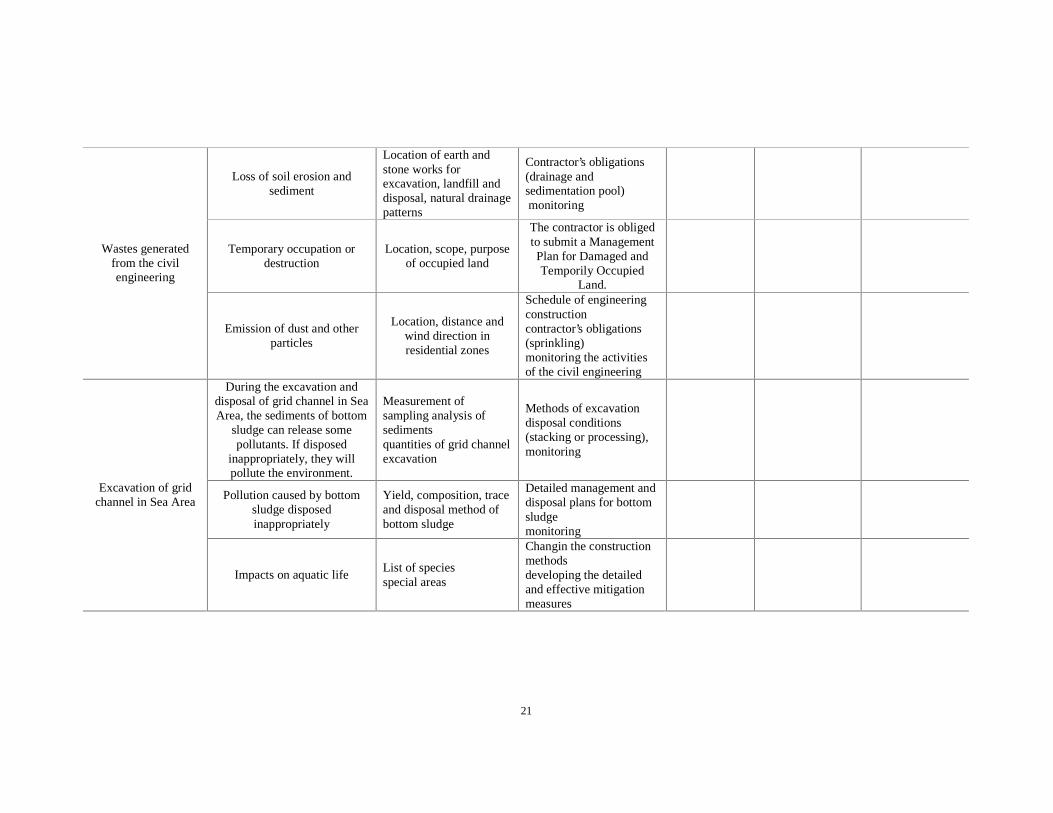
21
Loss of soil erosion andsediment
Location of earth andstone works forexcavation, landfill anddisposal, natural drainagepatterns
Contractor’s obligations(drainageandsedimentation pool)monitoring
� � �
Temporary occupation ordestruction
Location, scope, purposeof occupied land
The contractor is obligedto submit a ManagementPlan for Damaged andTemporily Occupied
Land.
� � �Wastes generatedfrom the civilengineering
Emission of dust and otherparticles
Location, distanceandwind direction inresidential zones
Schedule of engineeringconstructioncontractor’s obligations(sprinkling)monitoring the activitiesof the civil engineering
� � �
During the excavation anddisposal of grid channel in SeaArea, the sediments of bottom
sludge can releasesomepollutants. If disposed
inappropriately, they willpollute the environment.
Measurement ofsampling analysis ofsedimentsquantities of grid channelexcavation
Methods of excavationdisposal conditions(stacking or processing),monitoring
�
Pollution caused by bottomsludge disposedinappropriately
Yield, composition, traceand disposal method ofbottom sludge
Detailed management anddisposal plans for bottomsludgemonitoring
�
Excavation of gridchannel in SeaArea
Impacts on aquatic lifeList of speciesspecial areas
Changin theconstructionmethodsdeveloping the detailedand effectivemitigationmeasures
�
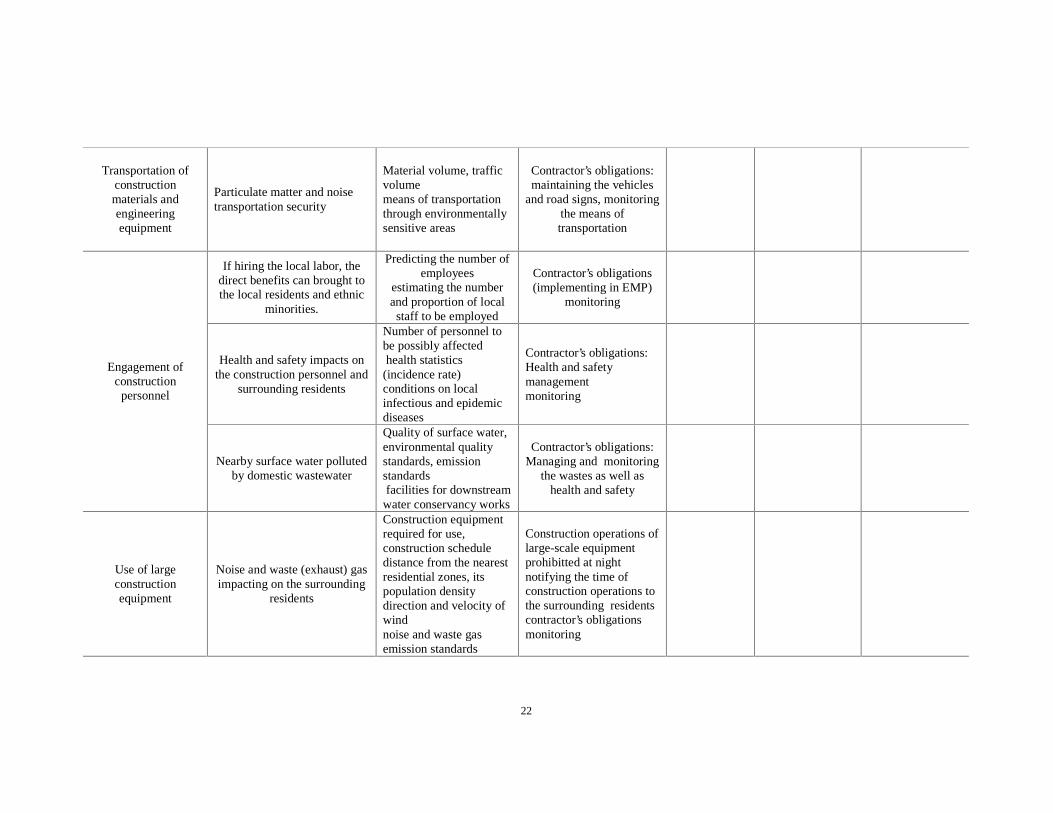
22
Transportation ofconstructionmaterialsandengineeringequipment
Particulatematter and noisetransportation security
Material volume, trafficvolumemeans of transportationthrough environmentallysensitive areas
Contractor’s obligations:maintaining the vehicles
and road signs, monitoringthemeans oftransportation
� � �
If hiring the local labor, thedirect benefits can brought tothe local residents and ethnic
minorities.
Predicting the number ofemployees
estimating the numberand proportion of localstaff to be employed
Contractor’s obligations(implementing in EMP)
monitoring� � �
Health and safety impacts ontheconstruction personnel and
surrounding residents
Number of personnel tobe possibly affectedhealth statistics(incidence rate)conditions on localinfectious and epidemicdiseases
Contractor’s obligations:Health and safetymanagementmonitoring
� � �Engagement ofconstructionpersonnel
Nearby surface water pollutedby domestic wastewater
Quality of surfacewater,environmental qualitystandards, emissionstandardsfacilities for downstreamwater conservancy works
Contractor’s obligations:Managing and monitoring
thewastesas well ashealth and safety
� � �
Use of largeconstructionequipment
Noiseand waste (exhaust) gasimpacting on the surrounding
residents
Construction equipmentrequired for use,construction scheduledistance from the nearestresidential zones, itspopulation densitydirection and velocity ofwindnoise and waste gasemission standards
Construction operations oflarge-scale equipmentprohibitted at nightnotifying the time ofconstruction operations tothesurrounding residentscontractor’s obligationsmonitoring
� � �
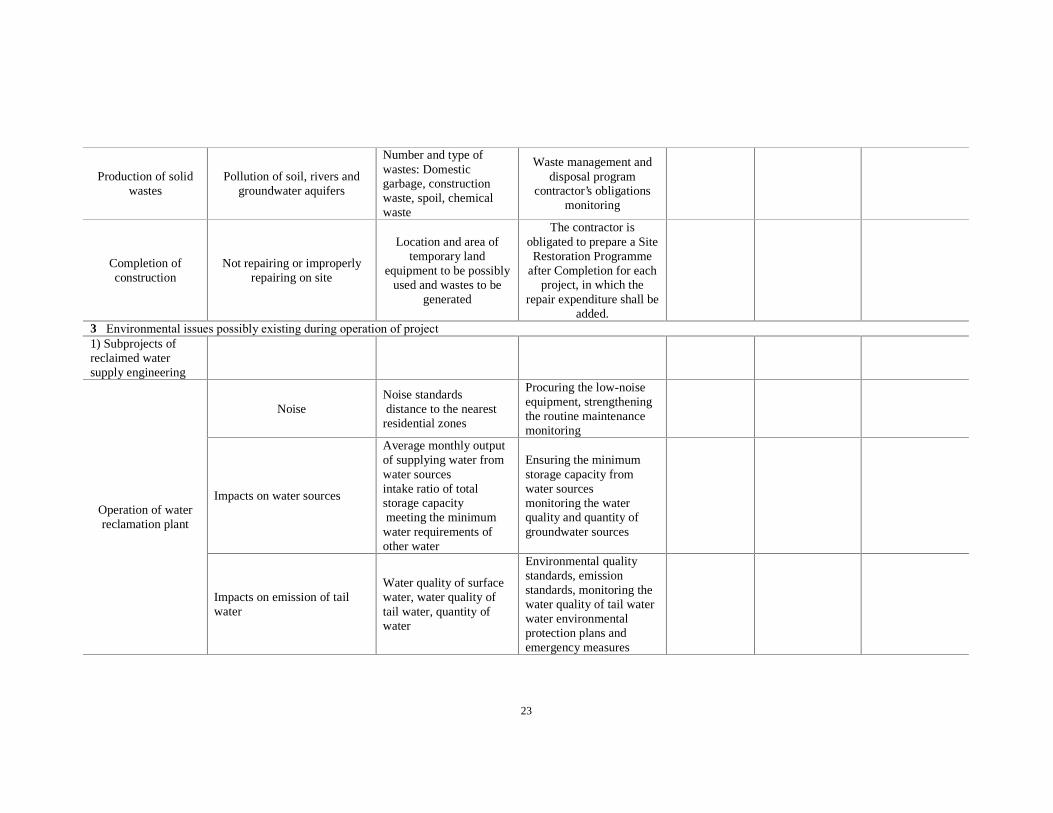
23
Production of solidwastes
Pollution of soil, rivers andgroundwater aquifers
Number and type ofwastes: Domesticgarbage, constructionwaste, spoil, chemicalwaste
Waste management anddisposal program
contractor’s obligationsmonitoring
� � �
Completion ofconstruction
Not repairing or improperlyrepairing on site
Location and area oftemporary land
equipment to bepossiblyused and wastes to be
generated
The contractor isobligated to prepare aSiteRestoration Programme
after Completion for eachproject, in which the
repair expenditureshall beadded.
� �
3�Environmental issues possibly existing during operation of project1) Subprojects ofreclaimed watersupply engineering
NoiseNoise standardsdistance to the nearestresidential zones
Procuring the low-noiseequipment, strengtheningthe routine maintenancemonitoring
�
Impacts on water sources
Average monthly outputof supplying water fromwater sourcesintake ratio of totalstorage capacitymeeting the minimumwater requirements ofother water
Ensuring the minimumstorage capacity fromwater sourcesmonitoring the waterquality and quantity ofgroundwater sources
�Operation of waterreclamation plant
Impacts on emission of tailwater
Water quality of surfacewater, water quality oftail water, quantity ofwater
Environmental qualitystandards, emissionstandards, monitoring thewater quality of tail waterwater environmentalprotection plans andemergency measures
�
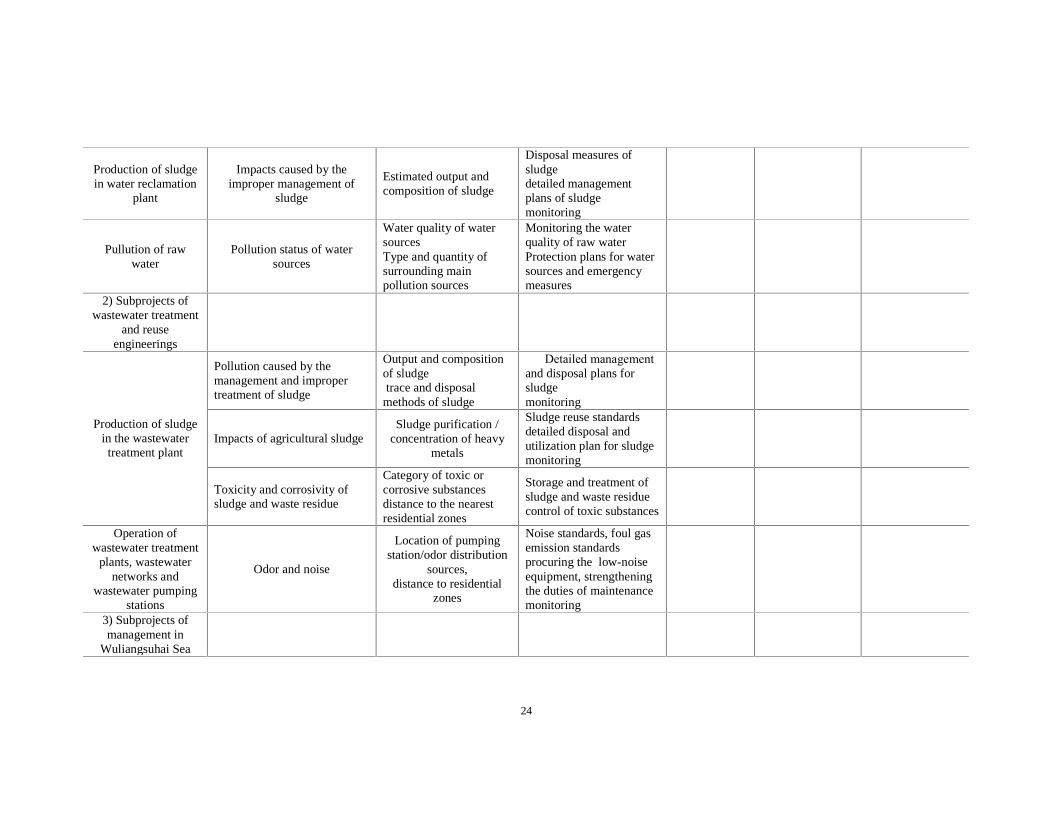
24
Production of sludgein water reclamation
plant
Impacts caused by theimproper management of
sludge
Estimated output andcomposition of sludge
Disposal measures ofsludgedetailed managementplans of sludgemonitoring
�
Pullution of rawwater
Pollution status of watersources
Water quality of watersourcesType and quantity ofsurrounding mainpollution sources
Monitoring thewaterquality of raw waterProtection plans for watersourcesand emergencymeasures
�
2) Subprojects ofwastewater treatment
and reuseengineerings
Pollution caused by themanagement and impropertreatment of sludge
Output and compositionof sludgetraceand disposalmethods of sludge
��Detailed managementand disposal plans forsludgemonitoring
�
Impacts of agricultural sludgeSludgepurification /
concentration of heavymetals
Sludge reuse standardsdetailed disposal andutilization plan for sludgemonitoring
�Production of sludge
in the wastewatertreatment plant
Toxicity and corrosivity ofsludge and waste residue
Category of toxic orcorrosive substancesdistance to the nearestresidential zones
Storageand treatment ofsludgeand waste residuecontrol of toxic substances
�
Operation ofwastewater treatment
plants, wastewaternetworksand
wastewater pumpingstations
Odor and noise
Location of pumpingstation/odor distribution
sources,distance to residential
zones
Noise standards, foul gasemission standardsprocuring the low-noiseequipment, strengtheningtheduties of maintenancemonitoring
�
3) Subprojects ofmanagement in
Wuliangsuhai Sea
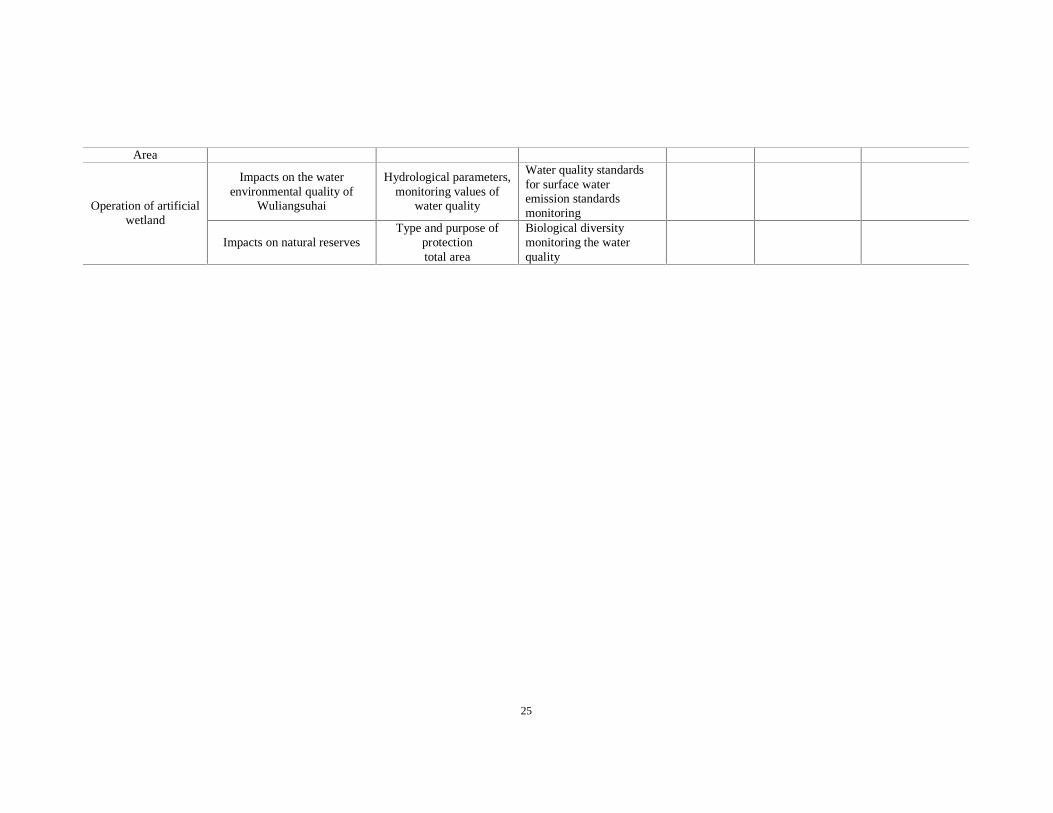
25
Area
Impacts on thewaterenvironmental quality of
Wuliangsuhai
Hydrological parameters,monitoring values of
water quality
Water quality standardsfor surface wateremission standardsmonitoring
�Operation of artificial
wetland
Impacts on natural reservesType and purpose of
protectiontotal area
Biological diversitymonitoring the waterquality
�
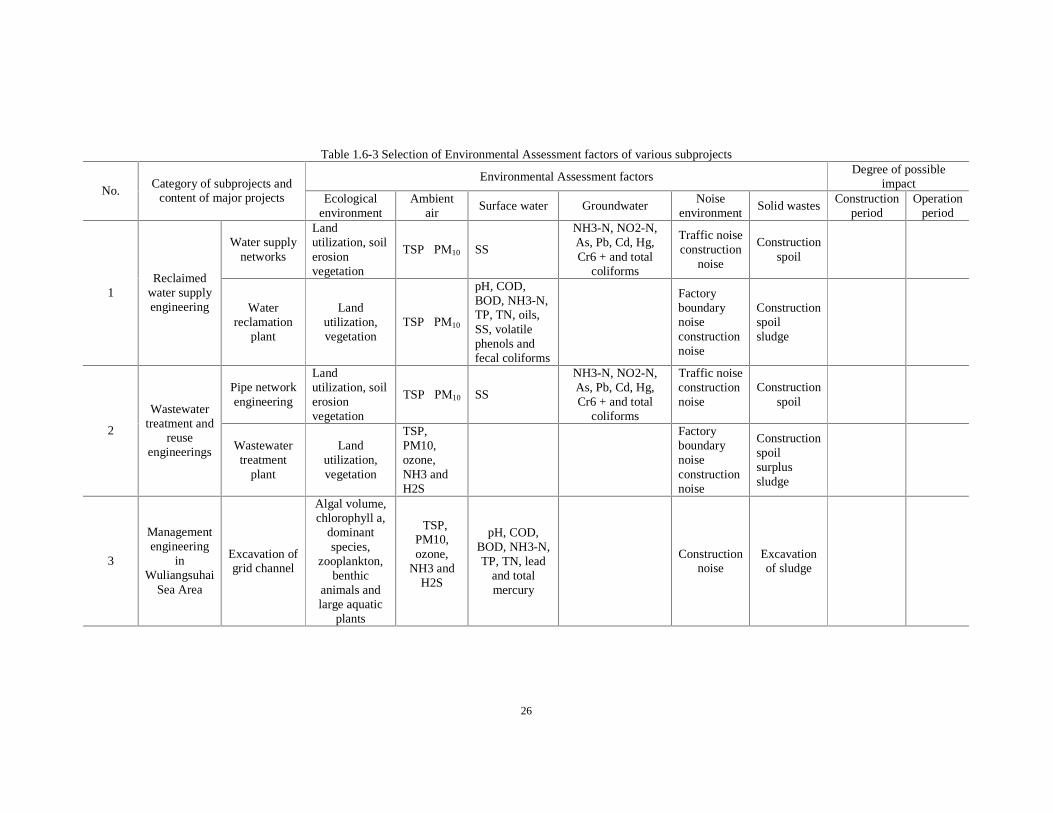
26
Table 1.6-3 Selection of Environmental Assessment factors of various subprojects
Environmental Assessment factorsDegree of possible
impactNo.
Category of subprojects andcontent of major projects Ecological
environmentAmbient
airSurface water Groundwater
Noiseenvironment
Solid wastesConstruction
periodOperation
period
Water supplynetworks
Landutilization, soilerosionvegetation
TSP�PM10 SS
NH3-N, NO2-N,As, Pb, Cd, Hg,Cr6 + and total
coliforms
Traffic noiseconstruction
noise
Constructionspoil
�� �
1Reclaimed
water supplyengineering Water
reclamationplant
Landutilization,vegetation
TSP�PM10
pH, COD,BOD, NH3-N,TP, TN, oils,SS, volatilephenols andfecal coliforms
�
Factoryboundarynoiseconstructionnoise
Constructionspoilsludge
�� ��
Pipenetworkengineering
Landutilization, soilerosionvegetation
TSP�PM10 SS
NH3-N, NO2-N,As, Pb, Cd, Hg,Cr6 + and total
coliforms
Traffic noiseconstructionnoise
Constructionspoil
�� �
2
Wastewatertreatment and
reuseengineerings Wastewater
treatmentplant
Landutilization,vegetation
TSP,PM10,ozone,NH3 andH2S
� �
Factoryboundarynoiseconstructionnoise
Constructionspoilsurplussludge
�� ��
3
Managementengineering
inWuliangsuhai
SeaArea
Excavation ofgrid channel
Algal volume,chlorophyll a,
dominantspecies,
zooplankton,benthic
animals andlarge aquatic
plants
TSP,PM10,ozone,
NH3 andH2S
pH, COD,BOD, NH3-N,TP, TN, lead
and totalmercury
� Constructionnoise
Excavationof sludge
�� ��
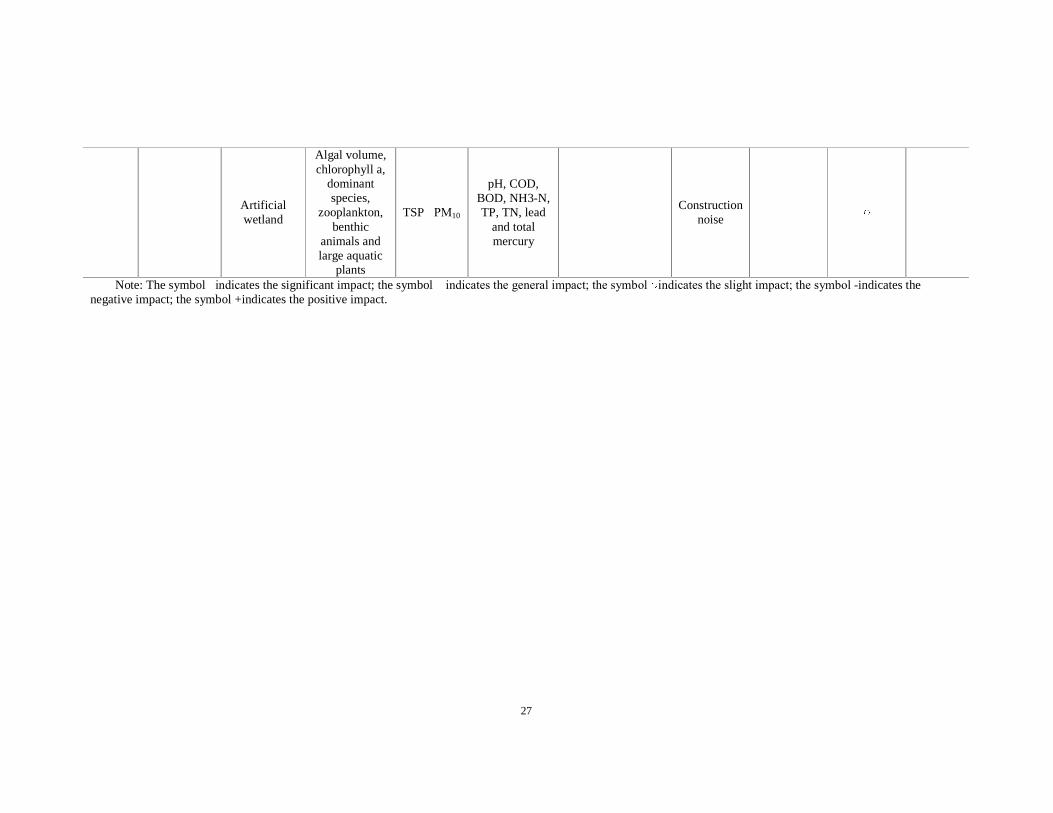
27
Artificialwetland
Algal volume,chlorophyll a,
dominantspecies,
zooplankton,benthic
animals andlarge aquatic
plants
TSP�PM10
pH, COD,BOD, NH3-N,TP, TN, lead
and totalmercury
� Constructionnoise
� ��
Note: Thesymbol�indicates thesignificant impact; thesymbol �indicates the general impact; the symbol indicates the slight impact; the symbol -indicates thenegative impact; the symbol +indicates the positive impact.
28
1.7 Assessment Principles and Methods y Meet the requirements of construction project environmental management of national and local
environmental protection departments and industry competent authorities as well as the requirements of environmental impact evaluation of World Bank and Notice on Strengthening the Environmental Management of Loan Construction Project of International Financial Organization;
y In accordance with the characteristics of construction environmental impact assessment, take the key environmental factors and pollution factors as the evaluation objects, highlight the evaluation of key protection objectives, and pay attention to the rational analysis of discharge after reaching standards, cleaning production, gross control and site selection;
y Use the methods of combining with the analogy investigation, model simulations, data collection and analysis, etc., fully use the existing data, predict the environmental benefits and possible environmental impacts of project construction, and use the method of providing the Public Opinion Questionnaire and other methods for public consultation;
y For the management services, prepare the environmental management plans (EMP), provide the administration sections and construction units with the opinions and suggestions for decision and reference, through the development of a series of measures for mitigation, monitoring and institution building during the implementation and operation of projects, so as to eliminate or compensate the adverse effects on society and envirenment during project construction;
y From the point of environmental protection, demonstrate the feasibility of project construction, strive to make the scientific and feasible conclusion of environmental impact assessment, and provide the scientific basis for the environmental protection management during the approval, design and construction of projects.
1.8 Technical route for environmental impact assessment This technical route for environmental impact assessment shall be shown in Fig.1.8-1.
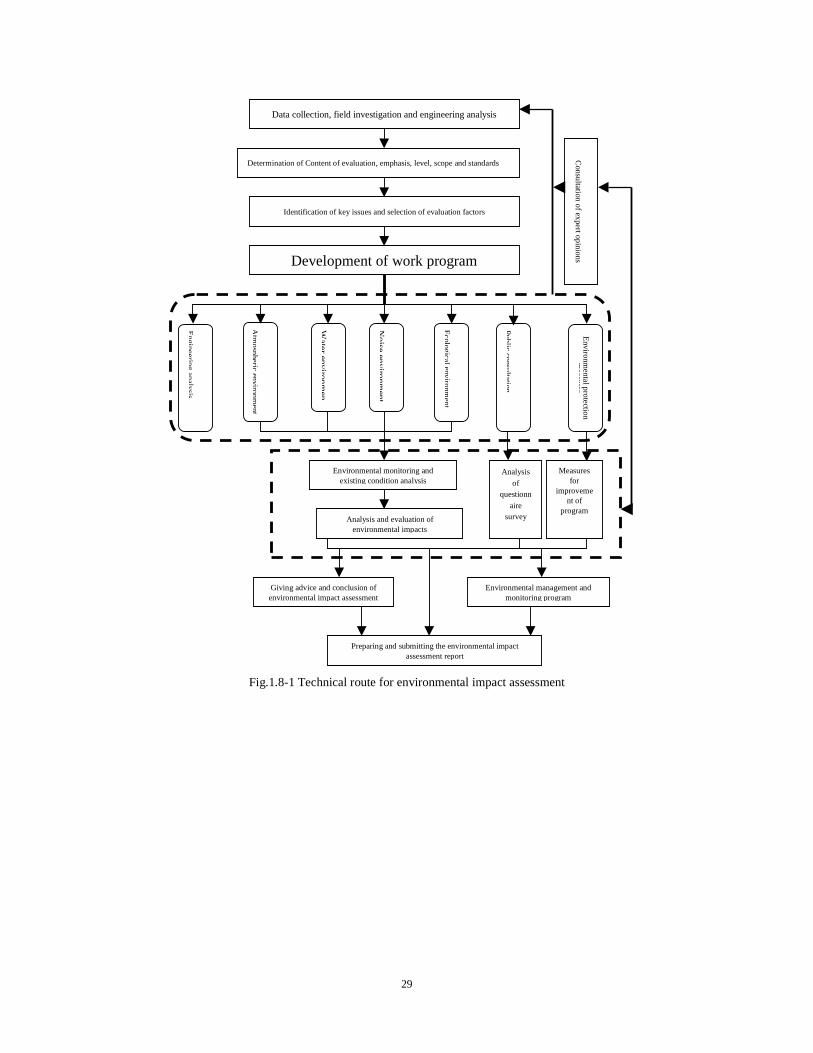
29
Fig.1.8-1 Technical route for environmental impact assessment
Data collection, field investigation and engineering analysis
Determination of Content of evaluation, emphasis, level, scope and standards
Identification of key issues and selection of evaluation factors
Development of work program
Engineering
analysis
Atm
osphericenvironm
ent
Water
environmen
Noise
environment
Ecologicalenvironm
ent
Publicconsultation
Environmental monitoring and existing condition analysis
Analysis and evaluation of environmental impacts
Analysis
ofquestionn
aire survey
Environm
entalprotectionm
easures
Measures for
improvement of
program
Consultation
ofexpertopinions
Giving advice and conclusion of environmental impact assessment
Environmental management and monitoring program
Preparing and submitting the environmental impact assessment report
30
2. Framework for Policy, Law and Administration 2.1 Documents on Environment Policy and Law 2.1.1 Outline On the basis of the comprehensive analysis on the type, scale, location and environmental sensibility of the project and the character and size of the potential environmental impact, the main policy, law and standards governing or involved with the environmental assessment of this Project include:
(1) Laws and rules on environmental protection; (2) Technology policy for pollution prevention; (3) Plans and layout of social and economic development and environmental protection; (4) Urban master planning; (5)Technology guideline for environmental impact assessment; (6) Environmental quality standard; (7) Control standards for pollution discharge; and (8) World Bank safeguard policies.
The above policies, laws and standards constitute the framework for the preparation of the environmental assessment of this Project. Each sub-project is covered by different policy, law and standards because of the different types and characters. Beside the above laws and policies, one of the basis for the environmental assessment of this Project includes the outline of environmental impact assessment (TOR), the feasibility study report, the administrative examination and approval documents of the government authorities and other related documents in which the policy, law and standards are embodied and applied concretely. 2.1.2 Laws and Rules on Environmental Protection
1) The Environmental Protection Law of the People’s Republic of China, 1989.12.26; 2) The Environmental Impact Assessment Law of the People’s Republic of China, 2002.10.28; 3) The Water Pollution Prevention and Control Law of the People’s Republic of China,
2008.06.01; 4) The Air Pollution Prevention and Control Law of the People’s Republic of China,
2000.04.29; 5) The Environmental Noise Pollution Prevention and Control Law of the People’s Republic of
China, 1996.10.29; 6) The Law of the People’s Republic of China on the Prevention and Control of Environmental
Pollution by Solid Waste, 2004.12.29; 7) The Water Law of the People’s Republic of China, 1988.01.21; 8) The Law of the People’s Republic of China on Water and Soil Conservation, 1991.06.29; 9) The Law of the People’s Republic of China on the Protection of Cultural Relics, 2002.10.28; 10) The Regulations on the Administration of Construction Project Environmental Protection,
1992.08.17; 11) The Regulations on the Protection of Basic Farmland, 1998.12.27; 12) The Rules for the Implementation of the Water Pollution Prevention and Control Law of the
People’s Republic of China, 2000.3.20; 13) The Regulations of the People’s Republic of China on Nature Reserves, 1994.12.01; 14) The Circular of the General Office of the State Council on Strengthening the Administration
of the Wetland Protection, 2004.06.05; 15) The Circular of the State Council on Strengthening Urban Water Supply and Saving and
Water Pollution Prevention, 2000.11.7; 16) The Opinions on Strengthening Industrial Water Saving, 2000.10.25; 17) Assessment of the Construction Projects with Loans from International Financial
Organizations, 1993.6.21; 18) The Provisions on Hierarchical Examination and Approval of the Environmental Impact
Assessment of Construction Projects, 2008.12.11; 19) The Guiding Catalog of Industrial Structure Adjustment, 2007; 20) The Categorized List of the Environmental Impact Assessment of Construction Projects,
2008.10.01; 21) The Interim Measures on Public consultation in Environmental Impact Assessment,
2006.02.22;
31
22) The Measures for the Disclosure of Environmental Information (Trial Implementation), 2007.04.21;
23) The Regulations on Water Resources Justification for Construction Projects, 2002.05; 24) The Interim Provisions on the Punishment of Activities Violating the Law and Discipline on
Environmental Protection, 2006.02.20; 25) The Opinions on Strengthening the Environmental Protection of Construction Projects in the
Development of the West Regions, 2001.01.08; 26) The Regulations on Water Pollution Prevention of Yellow River Basin within the Territory
of Inner Mongolia Autonomous Region, 1996.09.28; 27) The Implementation Opinions of the People’s Government of Inner Mongolia Autonomous
Region on Strengthening Energy Saving and Emission Reduction in the 11th Five Years, 2007.04.29;
28) The Regulations of Inner Mongolia Autonomous Region on the Environmental Protection (revised in 2002), 2002.03.21;
29) The Implementation Measures of Inner Mongolia Autonomous Region on the Law of the People’s Republic of China on Water and Soil Conservation, 1997.09.24; and
30) The Announcement of the People’s Government of Inner Mongolia Autonomous Region on the Division of the Main Prevention Areas of Water and Soil Loss, 1999.05.20.
2.1.3 Technical Policies for Pollution Control
y The disposal and the technical policy for pollution prevention of urban domestic solid wastes y The disposal and the technical policy for pollution prevention of urban domestic wastewater y Technical policy for the prevention and control of lake and reservoir eutrophication. y Technical policy for the sludge treatment and disposal and the pollution prevention and
control in municipal wastewater treatment plant (trial implementation) y Technical policy for the prevention and control of hazardous wastes pollution y Opinions on strengthening the water environmental protection of important lakes.
2.1.4 Plans and layout of social and economic development and environmental protection
y Outline of the Eleventh Five-Year Plan for National Economic and Social Development in Inner Mongolia Autonomous Region
y Outline of the Eleventh Five-Year Plan for National Economic and Social Development in Bayannaoer City
y The Eleventh Five-year Plan of Water Pollution Prevention and Control in Key River Basins y The Comprehensive Planning for the Water Resources in Yellow River Basin y The Function Division of the Inland Rivers in Northwestern and Yellow River Basin y The Environmental Protection Planning of Bayannaoer City (2005-2010)
2.1.5 Urban Master Plans and Related Plans
y The Compilation of the Urban Master Planning of Bayannaoer City (2004-2020) y The Industrial Water Supply Planning in Bayannaoer City, Inner Mongolia Autonomous
Region (2007) y The Water Resources Comprehensive Planning in Bayannaoer City y The Urban Water System Planning in Bayannaoer City, Inner Mongolia Autonomous Region
(F208G-A1) 2.1.6 Technical Guidelines
y HJ/T2.1-93 Technical Guideline for Environmental Impact Assessment General Provisions
y HJ2.2-2008 Technical Guideline for Environmental Impact Assessment Atmospheric Environment
y HJ/T2.3-93 Technical Guideline for Environmental Impact Assessment Surface Water Environment
y HJ/T2.4-1995 Technical Guideline for Environmental Impact Assessment Sound Environment
y HJ/T19-1997 Technical Guideline for Environmental Impact Assessment Non-Pollution Ecological Impact
y HJ/T169-2004 Technical Guidelines for Environmental Risk Assessment on Projects y HJ/T192-2006 Technical Criterion for Eco-environmental Status Evaluation (Trial
Implementation)
32
y GB/T16453.1�6-1996 Technical specification for comprehensive control of soil and water conservation
y SL204-98 Technical Regulation on Water and Soil Conservation Plan of Development and Construction Projects
2.1.7 Environmental Quality Standard
(1) GB3095-1996 Ambient Air Quality Standard (2) GB3838-2002 Environmental quality Standards for Surface Water (3) GB/T14848-93 Quality Standard for ground Water (4) CJ/T206-2005 Quality Standard for Urban Water Supply (5) GB5749-2006 Sanitary Standard for Drinking Water (6) CJ 3020-93 Water Quality Standard for Drinking Water Sources (7) GB5084-92 Standards for Irrigation Water Quality (8) GB15618-1995 Environmental Quality Standard for Soils (9) GB3096-2008 Environmental Quality Standards for Noise (10) TJ36-79 Sanitary Standard for the Design of Industrial Enterprise (the Maximum
Allowable Concentration of Hazardous Substances in Atmosphere of Residential Area)
(11) GB/T18883-2002 Indoor Air Quality Standard 2.1.8 Standards for pollution discharge
(1) GB16297-1996 Integrated Emission Standard of Air Pollutants (2) GB14554-93 Emission Standard for Odor Pollutants (3) GB8978-1996 Integrated Wastewater Discharge Standard (4) GB18918-2002 Discharge Standard of Pollutants for Municipal Wastewater Treatment
Plant (5) GB12523-90 Noise Limits for Construction Site (6) GB12348-2008 Standard of Noise at Boundary of Industrial Enterprises
(7) GB18599-2001 Standards for Pollution Control on the Storage and Disposal Site for General Industrial Solid Wastes
(8) GB5085-1996 Identification Standard for Hazardous Wastes (9) GB8172-87 Control Standards for Urban Wastes for Agricultural Use (10) GB4284-84 Control Standards for Pollutants in Sludges from Agricultural Use
2.1.9 World Bank safeguard policies
�1�OP/BP 4.01 Environmental Assessment �2�OP/BP 4.04 Natural Habitats �6�OP/BP 4.12 Involuntary Resettlement
2.1.10 Documents related to the Project y The proposals for the project of the comprehensive treatment of the water environment in
Bayannaoer City, Inner Mongolia Autonomous Region (SC2006-101-(H)-49); y The proposals for the project of the comprehensive treatment of Wuliangsuhai Lake, the
project of environmental treatment in Yellow River basin in Inner Mongolia; y The feasibility study report for the ecological treatment project of Wuliangsuhai Lake in
Bayannaoer�Inner Mongolia� y The implementation plan of the ice jam flood detention project from Sanshenggong to
Sanhehukou of Yellow River in Inner Mongolia (BSSDY·SJ-039-2005); y The outline of the water ecosystem recovery plan of Wuliangsuhai Lake (2008-2033); y The report of water resources in Bayannaoer (2002-2006); y The report on the investigation of the reasonable disposition of the water resources in
Bayannaoer City; and y The reply on the standard of environmental assessment of the water environment
comprehensive treatment in Bayannaoer City with the loan from World Bank (Ba Huan Han Fa [2009] No.79).
2.2 Environmental Management Institutions and Their Responsibilities PRC Central People's Government and the People's Governments in all provinces(municipalities directly under the central government and autonomous regions ), cities(municipalities) and
33
counties(prefectures) all have their own environmental management institutions which perform their environmental management duties according to law. The environmental management institutions in relation with this Project mainly include: State Environment Protection Administration (SEPA), the Department of Environmental Protection of Inner Mongolia Autonomous Region and the environmental protection bureaus in all cities, municipalities and banners(counties and districts). (1) State Environment Protection Administration (SEPA) In March 1998, the former State Environment Protection Administration became the organization directly under the State Council. It is in charge of the administrative management and enforcement of the environmental protection all over the country and its main tasks and responsibilities include: to draw up the environmental protection guideline, policy, laws and rules, planning and administrative regulations; to supervise the exploitation and utilization of natural resources, the main ecological environment construction and the ecological damage restoration that have an influence on the ecological environment; to check and supervise the biodiversity protection, the wildlife protection, wetland environment protection and the desert prevention; to supervise and manage the national nature reserves; to direct and harmonize the significant environmental matters among all localities and departments and the multi-locations and multi-basins; to establish and organize to implement all environmental management systems; to examine and approve the environmental impact reports of development and construction activities according to laws and rules; to direct the comprehensive environmental regulation in cities and towns; in charge of rural eco-environmental protection; to manage the international cooperation and communication on environmental protection; to involve the harmonization of the important international activities on environmental protection; to mange, organize and harmonize the domestic implementation of the international treaties in relation with the environmental protection; to unify contacts with other countries and territories; to manage the foreign economic cooperations of the environmental protection system; to harmonize and implement the related foreign-funded projects; to deal with foreign-related environmental protection matters authorized by the State Council; and in charge of contacting with the environmental protection international organizations. State Environment Protection Administration establishes an Environmental Impact Assessment Department in special charge of the administrative management of environmental impact assessment and its main tasks and responsibilities include: to draw up and organize to implement environmental impact assessment, "three simultaneousness" and other environment management policy, laws and rules; to undertake the environmental impact assessment of significant economic and technology policy, development plans and important economic development plans; to draw up the categorized list of environmental impact assessment; and to examine and approve the environmental impact reports of the significant development and construction activities. (2) Department of Environmental Protection of Inner Mongolia Autonomous Region The Department of Environmental Protection of Inner Mongolia Autonomous Region is in charge of the administrative management and enforcement of the environmental protection in all the region and its main tasks and responsibilities include: to implement the State environmental protection guideline, policy, laws and rules, administrative regulations and standards; to draw up and supervise the implementation of the environmental protection rules and administrative regulations in all the region; to undertake, upon the authorization by the People’s Government of Inner Mongolia Autonomous Region, the environmental impact assessment of significant economic and technology policy, development plans and important economic development plans in all the region; to draw up the environmental protection plans, to organize the compilation of the environmental function division, the regional and basinal pollution prevention plans and the ecological protection plans, and to supervise the implementation thereof; to involve the establishment of the environmental protection industrial policy and development plans; to manage and supervise the environmental protection of the natural ecology and construction projects; to organize to draw up and supervise the implementation of the prescribed-time treatment plan of pollution resources; to make the control plan of the total amount of pollution discharge in all the region, in charge of the registration of the pollution discharge and the management of the pollution discharge license, and to organize and supervise the collection of pollution discharge fees; in charge of the environmental supervision and the environmental protection administrative check; to organize the implementation of the international treaties in relation with the environmental protection in all the region; in charge of the international economic and technology cooperation and communication related to the environmental protection; and to deal with foreign-related environmental protection matters authorized by the People’s Government of Inner Mongolia Autonomous Region.
34
The Department of Environmental Protection of Inner Mongolia Autonomous Region establishes an environmental impact assessment administrative office in special charge of the administrative management of environmental impact assessment and its main tasks and responsibilities include: to supervise and manage the implementation of the environmental impact assessment and the "three simultaneousness" system in all the region; to implement the State laws, rules, regulations and policy in relation with environmental impact assessment and the "three simultaneousness" system; to draw up, implement and supervise the local regulations, rules and policy in relation with the environmental impact assessment and the "three simultaneousness" system; in charge of the examination of environmental impact assessment documents of the plans examined and approved by the People’s Government and its departments in the region; to guide and supervise the examination and approval of environmental impact assessment of construction projects in all the region; in charge of the administrative license of environmental impact assessment documents of construction projects within the authorization of the Department of Environmental Protection of the region; in charge of the administrative license of the trial production (operation) and the environmental protection check and acceptance of construction projects within the authorization of the Department of Environmental Protection of the region; and to guide the business of the environment examination centers of construction project in the region. The Department of Environmental Protection of Inner Mongolia Autonomous Region establishes an foreign cooperation and communication office in charge of the international cooperation and communication related to environmental protection in all the region and its main tasks and responsibilities include: to organize, in cooperation with related offices and branches, the filtration, recommendation and application of foreign cooperation and investment projects on environmental protection in all the region; in charge of the negotiation on environmental protection between Inner Mongolia Autonomous Region and international organizations, foreign governments and organizations and on-governmental organizations and the management of the organization and implementation of the cooperation projects; and to undertake the business of foreign-funded projects in relation with environmental protection. (3) Environmental Protection Bureau in Bayannaoer City The Environmental Protection Bureau in Bayannaoer City is in charge of the administrative management and enforcement of the environmental protection in the city and its main tasks and responsibilities include: to implement the State environmental protection guideline, policy, laws and rules, administrative regulations and standards; to draw up and supervise the implementation of the environmental protection rules and administrative regulations in the city; to undertake, upon the authorization by the People’s Government of the city, the environmental impact assessment of significant economic and technology policy, development plans and important economic development plans in the city; to draw up the environmental protection plans, to organize the compilation of basinal pollution prevention plans and ecological protection plans, and to supervise the implementation thereof; to manage and supervise the environmental protection of the natural ecology and construction projects; to organize to draw up and supervise the implementation of the prescribed-time treatment plan of pollution resources; to make the control plan of the total amount of pollution discharge in the city, in charge of the registration of the pollution discharge and the management of the pollution discharge license, and to organize and supervise the collection of pollution discharge fees; in charge of the environmental supervision and the environmental protection administrative check; in charge of the international economic and technology cooperation and communication related to the environmental protection; and to deal with foreign-related environmental protection matters authorized by the People’s Government of Bayannaoer City. The Environmental Protection Bureau in Bayannaoer City establishes an environmental impact assessment administrative office (or pollution control office, supervision and management office) in special charge of the administrative management of environmental impact assessment and its main tasks and responsibilities include: to supervise and manage the implementation of the environmental impact assessment and the "three simultaneousness" system in the city; to implement the laws, rules, regulations and policy, stipulated by the State or Inner Mongolia Autonomous Region, in relation with environmental impact assessment and the "three simultaneousness" system; to draw up, implement and supervise the local regulations, rules and policy in relation with the environmental impact assessment and the "three simultaneousness" system; to guide and supervise the examination and approval of environmental impact assessment of construction projects in the city; in charge of the administrative
35
license guideline of environmental impact assessment documents of construction projects within the authorization of the Environmental Protection Bureau in the city; and in charge of the administrative license of the trial production (operation) and the environmental protection check and acceptance of construction projects within the authorization of Environmental Protection Bureau in the city. (4) Environmental Protection Bureaus in all counties (districts) The Environmental Protection Bureaus in all banners (counties, districts) where the sub-projects of this Project located are in charge of the administrative management and enforcement of the environmental protection in the banner (county, district) and their main tasks and responsibilities include: to implement the State environmental protection guideline, policy, laws and rules, administrative regulations and standards; to draw up and supervise the implementation of the environmental protection plan in the banner (county, district); to manage and supervise the environmental protection of the natural ecology and construction projects; to organize to draw up and supervise the implementation of the prescribed-time treatment plan of pollution resources; to make the control plan of the total amount of pollution discharge in the banner (county, district), in charge of the registration of the pollution discharge and the management of the pollution discharge license within the authorization thereof, and to organize and supervise the collection of pollution discharge fees; and in charge of the environmental supervision and the environmental protection administrative check. In order to generally organize, harmonize and manage the filtration, recommendation, application, business negotiation and check and acceptance of the environment projects with the loan from World Bank in Bayannaoer City, the government of Bayannaoer City establishes the project cooperation and lead group (PCLG) the leader of which is the deputy mayor in main charge of environmental protection. PCLG have a project management office (YNPMO), administratively established in Hetao Water Affairs Group Limited, which is the representative of the municipal project cooperation and lead group to undertake the related business.
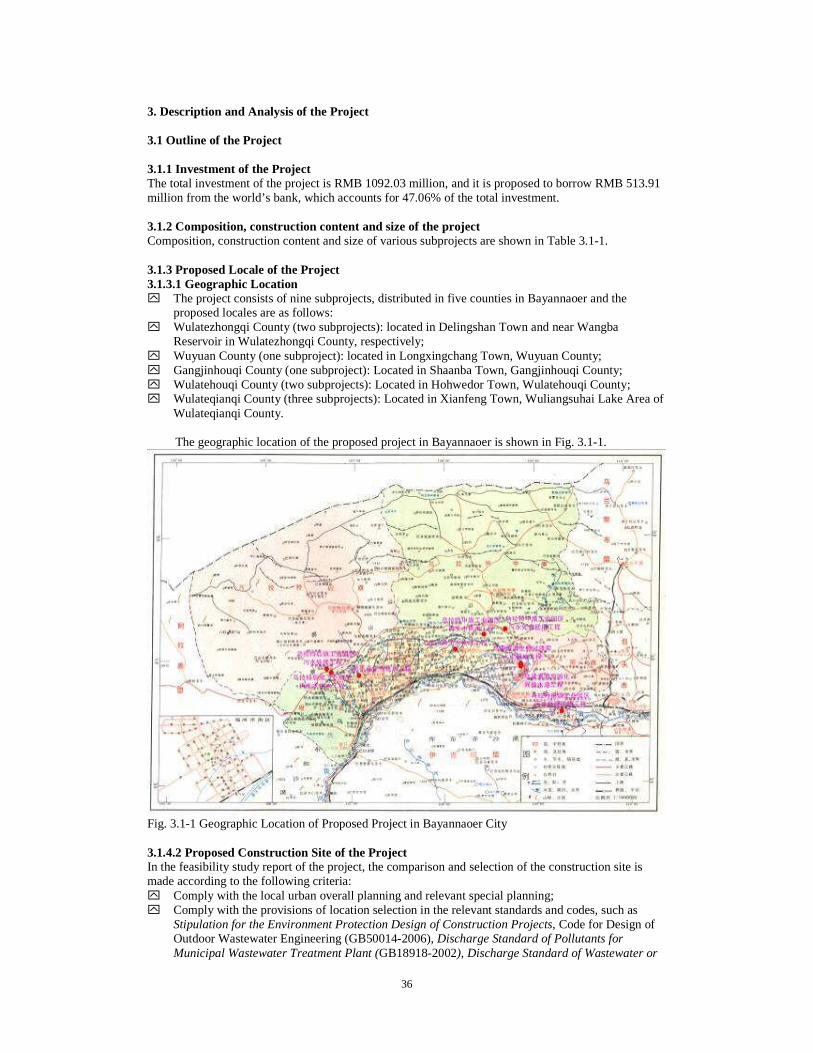
36
3. Description and Analysis of the Project 3.1 Outline of the Project 3.1.1 Investment of the Project The total investment of the project is RMB 1092.03 million, and it is proposed to borrow RMB 513.91 million from the world’s bank, which accounts for 47.06% of the total investment. 3.1.2 Composition, construction content and size of the project Composition, construction content and size of various subprojects are shown in Table 3.1-1. 3.1.3 Proposed Locale of the Project 3.1.3.1 Geographic Location y The project consists of nine subprojects, distributed in five counties in Bayannaoer and the
proposed locales are as follows: y Wulatezhongqi County (two subprojects): located in Delingshan Town and near Wangba
Reservoir in Wulatezhongqi County, respectively; y Wuyuan County (one subproject): located in Longxingchang Town, Wuyuan County; y Gangjinhouqi County (one subproject): Located in Shaanba Town, Gangjinhouqi County; y Wulatehouqi County (two subprojects): Located in Hohwedor Town, Wulatehouqi County; y Wulateqianqi County (three subprojects): Located in Xianfeng Town, Wuliangsuhai Lake Area of
Wulateqianqi County. The geographic location of the proposed project in Bayannaoer is shown in Fig. 3.1-1.
Fig. 3.1-1 Geographic Location of Proposed Project in Bayannaoer City 3.1.4.2 Proposed Construction Site of the Project In the feasibility study report of the project, the comparison and selection of the construction site is made according to the following criteria: y Comply with the local urban overall planning and relevant special planning; y Comply with the provisions of location selection in the relevant standards and codes, such as
Stipulation for the Environment Protection Design of Construction Projects, Code for Design of Outdoor Wastewater Engineering (GB50014-2006), Discharge Standard of Pollutants for Municipal Wastewater Treatment Plant (GB18918-2002), Discharge Standard of Wastewater or

37
Wastewater for Municipal Wastewater Treatment Plant (CJ3025-93), Construction Standard for Urban Wastewater Treatment Project, and so on;
y Comply with the principle of less investment and lower operation cost; The recommended construction site is shown in Table 3.1-2 upon the site investigation and the comprehensive comparison and analysis of technical economy and environment condition. The rational analysis of the site selection is detailed in Chapter 10 Comparison and Analysis of Alternatives.
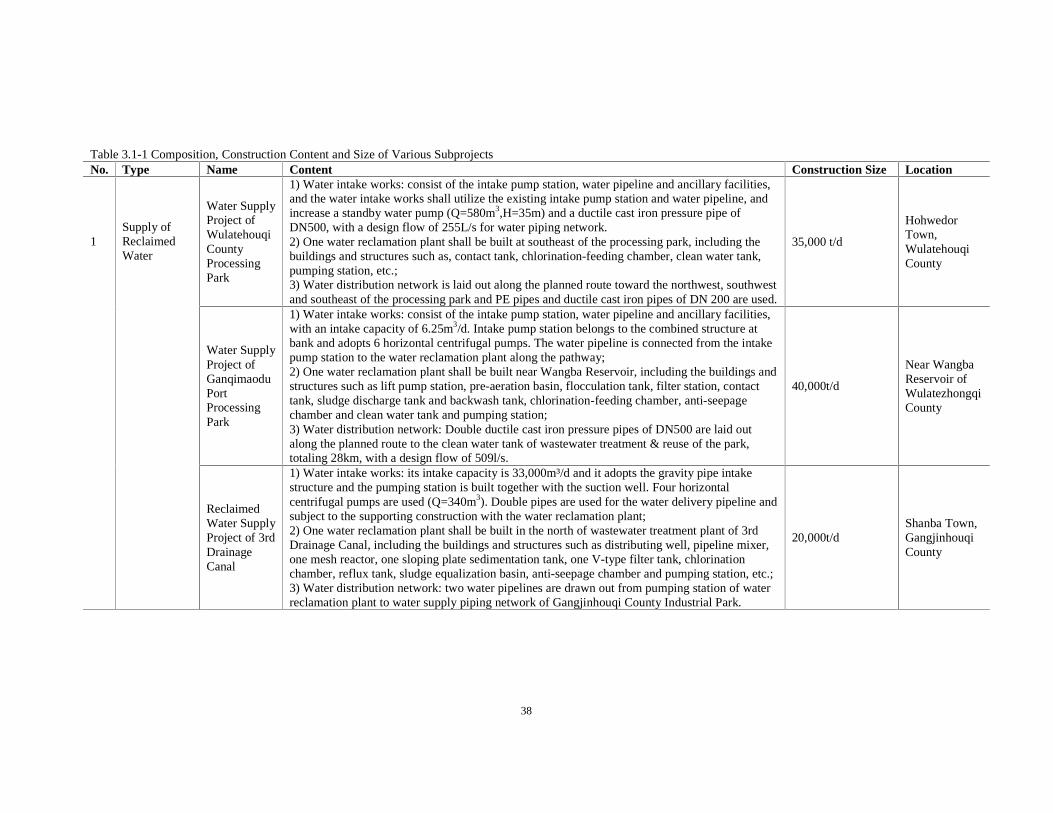
38
Table 3.1-1 Composition, Construction Content and Size of Various SubprojectsNo. Type Name Content Construction Size Location
Water SupplyProject ofWulatehouqiCountyProcessingPark
1) Water intake works: consist of the intake pump station, water pipelineand ancillary facilities,and thewater intakeworks shall utilize the existing intake pump station and water pipeline, andincreasea standby water pump (Q=580m3,H=35m) and a ductile cast iron pressurepipe ofDN500, with a design flow of 255L/s for water piping network.2) One water reclamation plant shall be built at southeast of the processing park, including thebuildings and structures such as, contact tank, chlorination-feeding chamber, clean water tank,pumping station, etc.;3) Water distribution network is laid out along the planned route toward the northwest, southwestand southeast of the processing park and PE pipes and ductilecast iron pipes of DN 200 areused.
35,000 t/d
HohwedorTown,WulatehouqiCounty
Water SupplyProject ofGanqimaoduPortProcessingPark
1) Water intake works: consist of the intake pump station, water pipelineand ancillary facilities,with an intakecapacity of 6.25m3/d. Intake pump station belongs to thecombined structureatbank and adopts 6 horizontal centrifugal pumps. Thewater pipeline is connected from the intakepump station to thewater reclamation plant along the pathway;2) One water reclamation plant shall be built near Wangba Reservoir, including thebuildings andstructures such as lift pump station, pre-aeration basin, flocculation tank, filter station, contacttank, sludgedischarge tank and backwash tank, chlorination-feeding chamber, anti-seepagechamber and clean water tank and pumping station;3) Water distribution network: Double ductile cast iron pressure pipes of DN500 are laid outalong theplanned route to the clean water tank of wastewater treatment & reuse of thepark,totaling 28km, with a design flow of 509l/s.
40,000t/d
Near WangbaReservoir ofWulatezhongqiCounty
1Supply ofReclaimedWater
ReclaimedWater SupplyProject of 3rdDrainageCanal
1) Water intake works: its intakecapacity is 33,000m³/d and it adopts the gravity pipe intakestructure and the pumping station is built together with the suction well. Four horizontalcentrifugal pumps are used (Q=340m3). Double pipes are used for the water delivery pipeline andsubject to the supporting construction with the water reclamation plant;2) One water reclamation plant shall be built in the north of wastewater treatment plant of 3rdDrainage Canal, including the buildings and structures such as distributing well, pipeline mixer,one mesh reactor, one sloping plate sedimentation tank, one V-type filter tank, chlorinationchamber, reflux tank, sludge equalization basin, anti-seepage chamber and pumping station, etc.;3) Water distribution network: two water pipelines are drawn out from pumping station of waterreclamation plant to water supply piping network of Gangjinhouqi County Industrial Park.
20,000t/dShanba Town,GangjinhouqiCounty
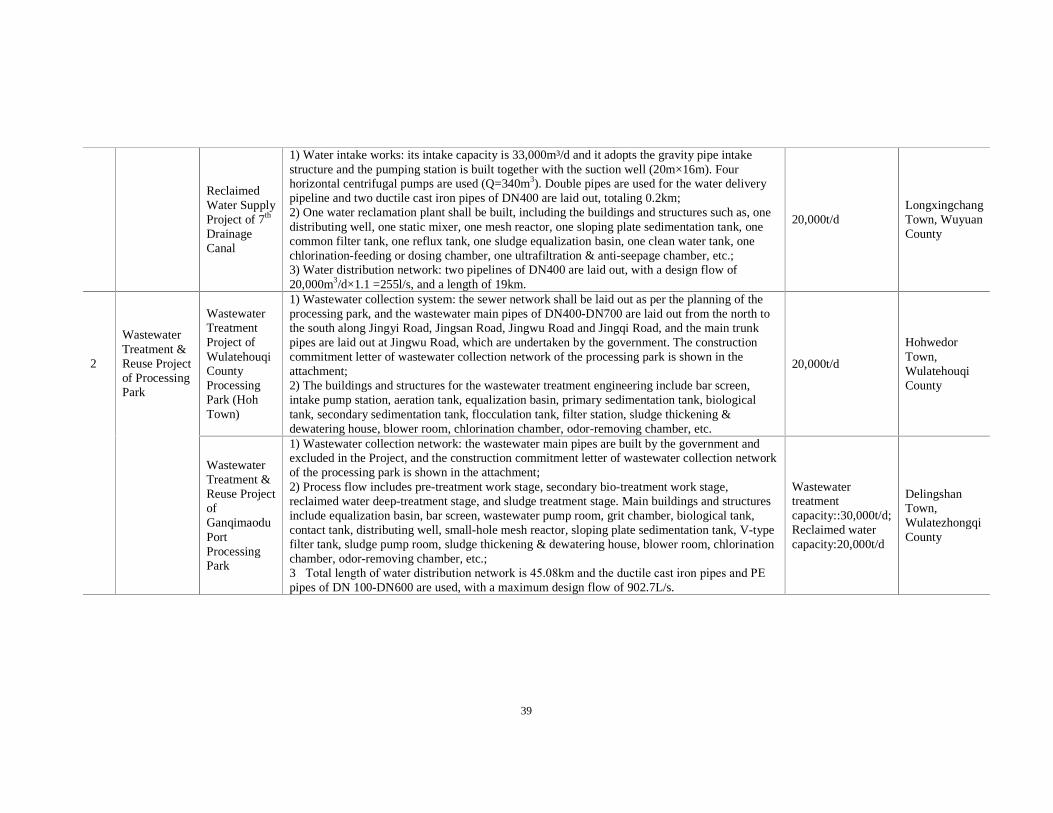
39
ReclaimedWater SupplyProject of 7th
DrainageCanal
1) Water intake works: its intakecapacity is 33,000m³/d and it adopts the gravity pipe intakestructure and the pumping station is built together with the suction well (20m×16m). Fourhorizontal centrifugal pumps are used (Q=340m3). Double pipes are used for the water deliverypipeline and two ductile cast iron pipes of DN400 are laid out, totaling 0.2km;2) One water reclamation plant shall be built, including the buildings and structures such as, onedistributing well, one static mixer, one mesh reactor, one sloping plate sedimentation tank, onecommon filter tank, one reflux tank, one sludge equalization basin, one clean water tank, onechlorination-feeding or dosing chamber, one ultrafiltration & anti-seepage chamber, etc.;3) Water distribution network: two pipelines of DN400 are laid out, with a design flow of20,000m3/d×1.1 =255l/s, and a length of 19km.
20,000t/dLongxingchangTown, WuyuanCounty
WastewaterTreatmentProject ofWulatehouqiCountyProcessingPark (HohTown)
1) Wastewater collection system: the sewer network shall be laid out as per the planning of theprocessing park, and the wastewater main pipes of DN400-DN700 are laid out from the north tothe south along Jingyi Road, Jingsan Road, Jingwu Road and Jingqi Road, and the main trunkpipes are laid out at Jingwu Road, which are undertaken by the government. The constructioncommitment letter of wastewater collection network of the processing park is shown in theattachment;2) The buildings and structures for the wastewater treatment engineering include bar screen,intake pump station, aeration tank, equalization basin, primary sedimentation tank, biologicaltank, secondary sedimentation tank, flocculation tank, filter station, sludge thickening &dewatering house, blower room, chlorination chamber, odor-removing chamber, etc.
20,000t/d
HohwedorTown,WulatehouqiCounty
2
WastewaterTreatment &Reuse Projectof ProcessingPark
WastewaterTreatment &Reuse ProjectofGanqimaoduPortProcessingPark
1) Wastewater collection network: the wastewater main pipes are built by the government andexcluded in the Project, and the construction commitment letter of wastewater collection networkof the processing park is shown in the attachment;2) Process flow includes pre-treatment work stage, secondary bio-treatment work stage,reclaimed water deep-treatment stage, and sludge treatment stage. Main buildings and structuresinclude equalization basin, bar screen, wastewater pump room, grit chamber, biological tank,contact tank, distributing well, small-hole mesh reactor, sloping plate sedimentation tank, V-typefilter tank, sludge pump room, sludge thickening & dewatering house, blower room, chlorinationchamber, odor-removing chamber, etc.;3�Total length of water distribution network is 45.08km and the ductile cast iron pipes and PEpipes of DN 100-DN600 are used, with a maximum design flow of 902.7L/s.
Wastewatertreatmentcapacity::30,000t/d;Reclaimed watercapacity:20,000t/d
DelingshanTown,WulatezhongqiCounty
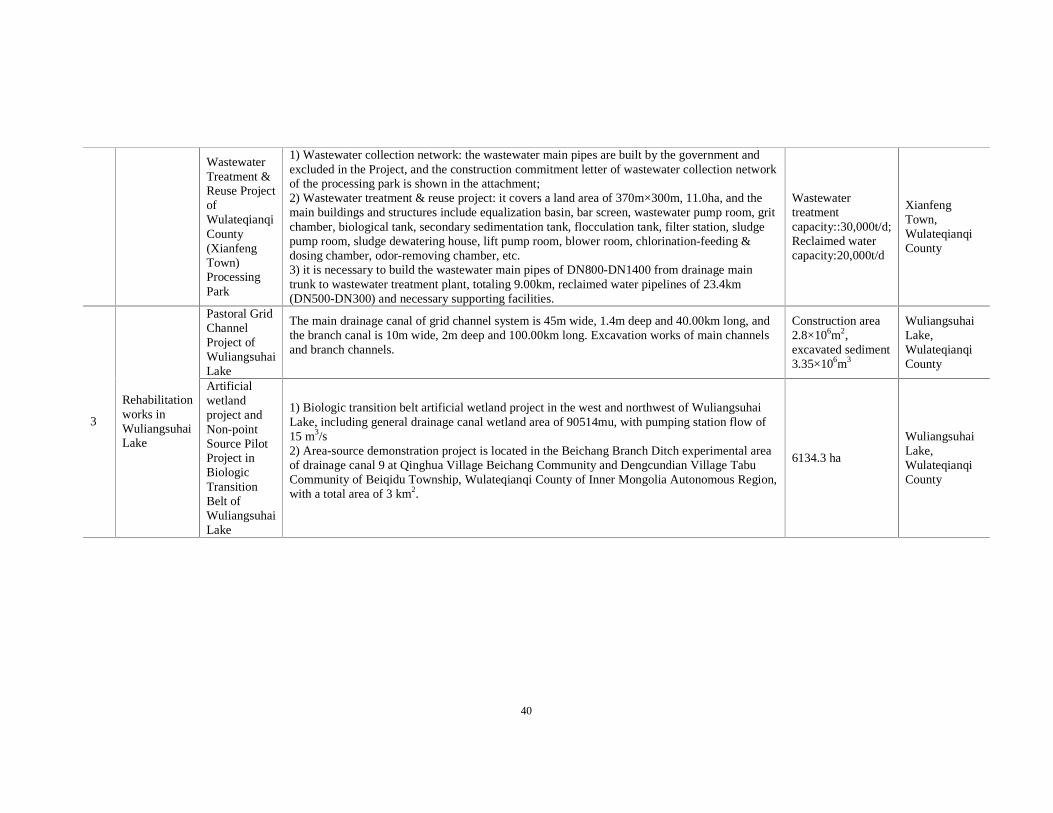
40
WastewaterTreatment &Reuse ProjectofWulateqianqiCounty(XianfengTown)ProcessingPark
1) Wastewater collection network: thewastewater main pipesarebuilt by the government andexcluded in theProject, and the construction commitment letter of wastewater collection networkof the processing park is shown in the attachment;2) Wastewater treatment & reuse project: it covers a land area of 370m×300m, 11.0ha, and themain buildings and structures include equalization basin, bar screen, wastewater pump room, gritchamber, biological tank, secondary sedimentation tank, flocculation tank, filter station, sludgepump room, sludge dewatering house, lift pump room, blower room, chlorination-feeding &dosing chamber, odor-removing chamber, etc.3) it is necessary to build the wastewater main pipes of DN800-DN1400 from drainage maintrunk to wastewater treatment plant, totaling 9.00km, reclaimed water pipelines of 23.4km(DN500-DN300) and necessary supporting facilities.
Wastewatertreatmentcapacity::30,000t/d;Reclaimed watercapacity:20,000t/d
XianfengTown,WulateqianqiCounty
Pastoral GridChannelProject ofWuliangsuhaiLake
The main drainage canal of grid channel system is 45m wide, 1.4m deep and 40.00km long, andthe branch canal is 10m wide, 2m deep and 100.00km long. Excavation works of main channelsand branch channels.
Construction area2.8×106m2,excavated sediment3.35×106m3
WuliangsuhaiLake,WulateqianqiCounty
3
Rehabilitationworks inWuliangsuhaiLake
Artificialwetlandproject andNon-pointSource PilotProject inBiologicTransitionBelt ofWuliangsuhaiLake
1) Biologic transition belt artificial wetland project in the west and northwest of WuliangsuhaiLake, including general drainage canal wetland area of 90514mu, with pumping station flow of15 m3/s�2) Area-source demonstration project is located in the Beichang Branch Ditch experimental areaof drainage canal 9 at Qinghua Village Beichang Community and Dengcundian Village TabuCommunity of Beiqidu Township, Wulateqianqi County of Inner Mongolia Autonomous Region,with a total area of 3 km2.
6134.3 ha
WuliangsuhaiLake,WulateqianqiCounty
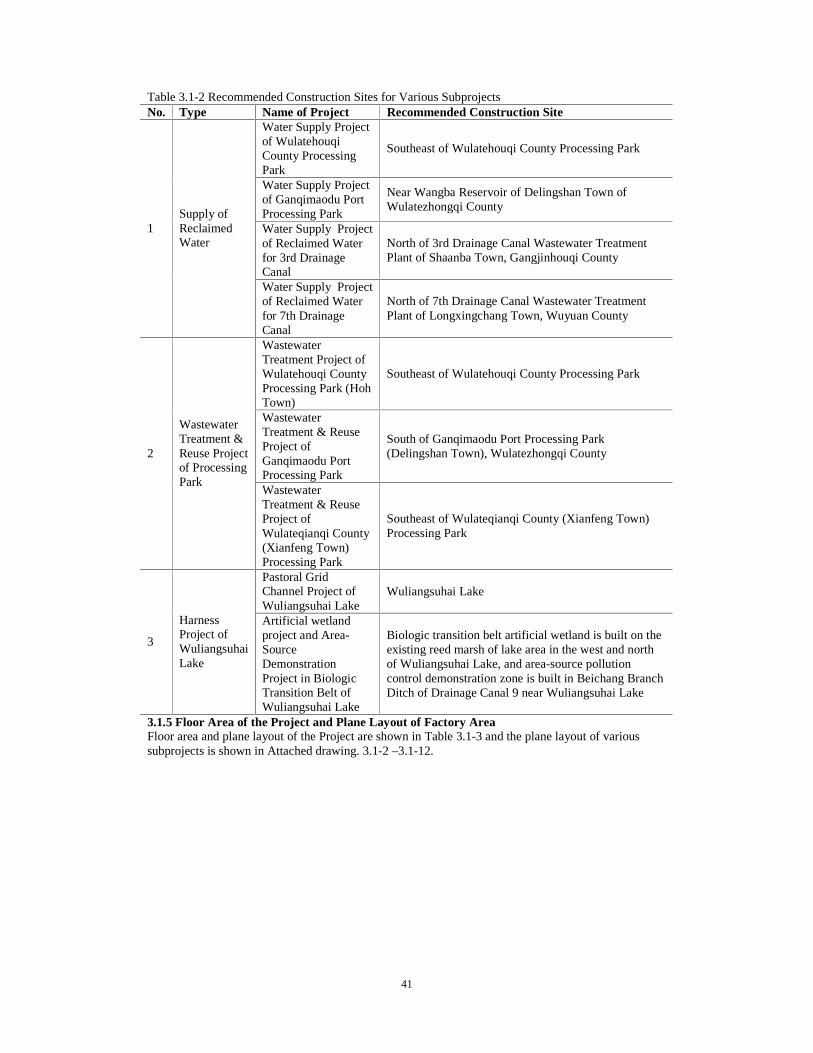
41
Table 3.1-2 Recommended Construction Sites for Various Subprojects No. Type Name of Project Recommended Construction Site
Water Supply Project of Wulatehouqi County Processing Park
Southeast of Wulatehouqi County Processing Park
Water Supply Project of Ganqimaodu Port Processing Park
Near Wangba Reservoir of Delingshan Town of Wulatezhongqi County
Water Supply Project of Reclaimed Water for 3rd Drainage Canal
North of 3rd Drainage Canal Wastewater Treatment Plant of Shaanba Town, Gangjinhouqi County
1Supply of Reclaimed Water
Water Supply Project of Reclaimed Water for 7th Drainage Canal
North of 7th Drainage Canal Wastewater Treatment Plant of Longxingchang Town, Wuyuan County
Wastewater Treatment Project of Wulatehouqi County Processing Park (Hoh Town)
Southeast of Wulatehouqi County Processing Park
Wastewater Treatment & Reuse Project of Ganqimaodu Port Processing Park
South of Ganqimaodu Port Processing Park (Delingshan Town), Wulatezhongqi County 2
Wastewater Treatment & Reuse Project of Processing Park
Wastewater Treatment & Reuse Project of Wulateqianqi County (Xianfeng Town) Processing Park
Southeast of Wulateqianqi County (Xianfeng Town) Processing Park
Pastoral Grid Channel Project of Wuliangsuhai Lake
Wuliangsuhai Lake
3
Harness Project of Wuliangsuhai Lake
Artificial wetland project and Area-Source Demonstration Project in Biologic Transition Belt of Wuliangsuhai Lake
Biologic transition belt artificial wetland is built on the existing reed marsh of lake area in the west and north of Wuliangsuhai Lake, and area-source pollution control demonstration zone is built in Beichang Branch Ditch of Drainage Canal 9 near Wuliangsuhai Lake
3.1.5 Floor Area of the Project and Plane Layout of Factory Area Floor area and plane layout of the Project are shown in Table 3.1-3 and the plane layout of various subprojects is shown in Attached drawing. 3.1-2 –3.1-12.
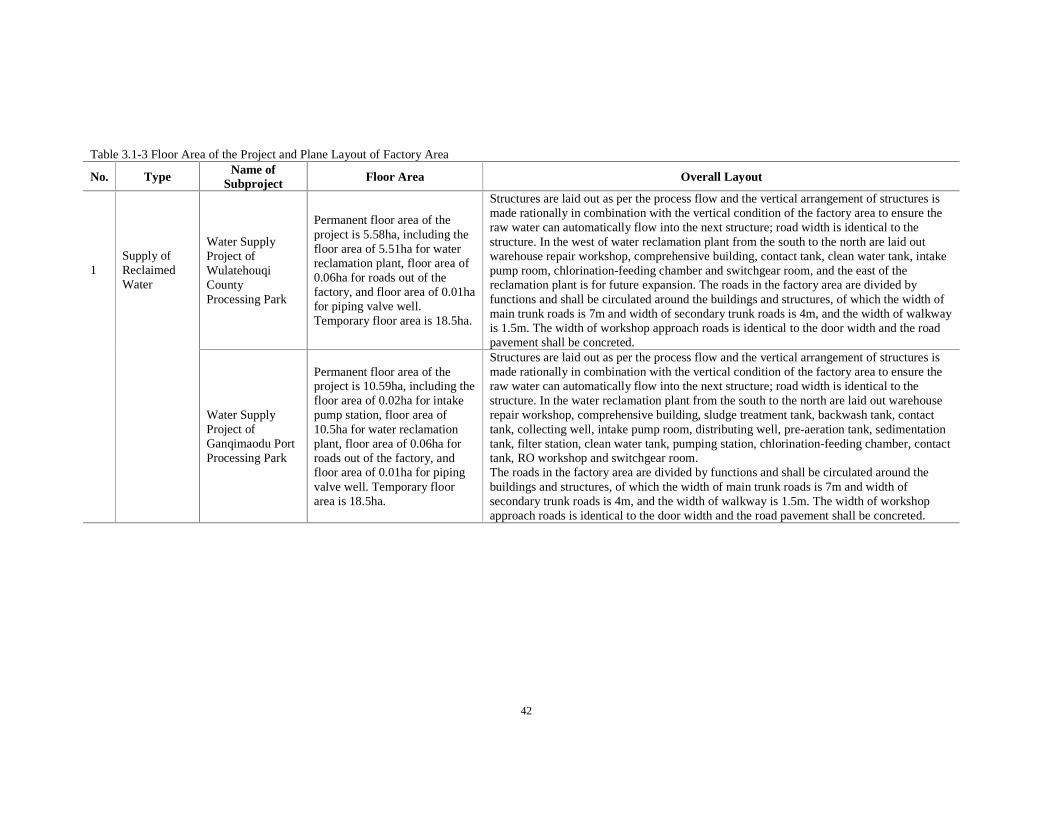
42
Table 3.1-3 Floor Area of the Project and Plane Layout of Factory Area
No. TypeName of
Subproject Floor Area Overall Layout
Water SupplyProject ofWulatehouqiCountyProcessing Park
Permanent floor area of theproject is5.58ha, including thefloor area of 5.51ha for waterreclamation plant, floor area of0.06ha for roads out of thefactory, and floor area of 0.01hafor piping valve well.Temporary floor area is 18.5ha.
Structures are laid out as per theprocess flow and the vertical arrangement of structures ismade rationally in combination with the vertical condition of the factory area to ensure theraw water can automatically flow into thenext structure; road width is identical to thestructure. In the west of water reclamation plant from the south to the north are laid outwarehouse repair workshop, comprehensive building, contact tank, clean water tank, intakepump room, chlorination-feeding chamber and switchgear room, and theeast of thereclamation plant is for future expansion. The roads in the factory areaaredivided byfunctions and shall be circulated around thebuildingsand structures, of which the width ofmain trunk roads is 7m and width of secondary trunk roads is 4m, and thewidth of walkwayis 1.5m. Thewidth of workshop approach roads is identical to the door width and the roadpavement shall beconcreted.
1Supply ofReclaimedWater
Water SupplyProject ofGanqimaodu PortProcessing Park
Permanent floor area of theproject is10.59ha, including thefloor area of 0.02ha for intakepump station, floor area of10.5ha for water reclamationplant, floor area of 0.06ha forroads out of the factory, andfloor area of 0.01ha for pipingvalvewell. Temporary floorarea is 18.5ha.
Structures are laid out as per theprocess flow and the vertical arrangement of structures ismade rationally in combination with the vertical condition of the factory area to ensure theraw water can automatically flow into thenext structure; road width is identical to thestructure. In the water reclamation plant from thesouth to the north are laid out warehouserepair workshop, comprehensivebuilding, sludge treatment tank, backwash tank, contacttank, collecting well, intake pump room, distributing well, pre-aeration tank, sedimentationtank, filter station, clean water tank, pumping station, chlorination-feeding chamber, contacttank, RO workshop and switchgear room.The roads in the factory areaare divided by functionsand shall becirculated around thebuildings and structures, of which thewidth of main trunk roads is 7m and width ofsecondary trunk roads is 4m, and thewidth of walkway is 1.5m. Thewidth of workshopapproach roads is identical to the door width and the road pavement shall beconcreted.
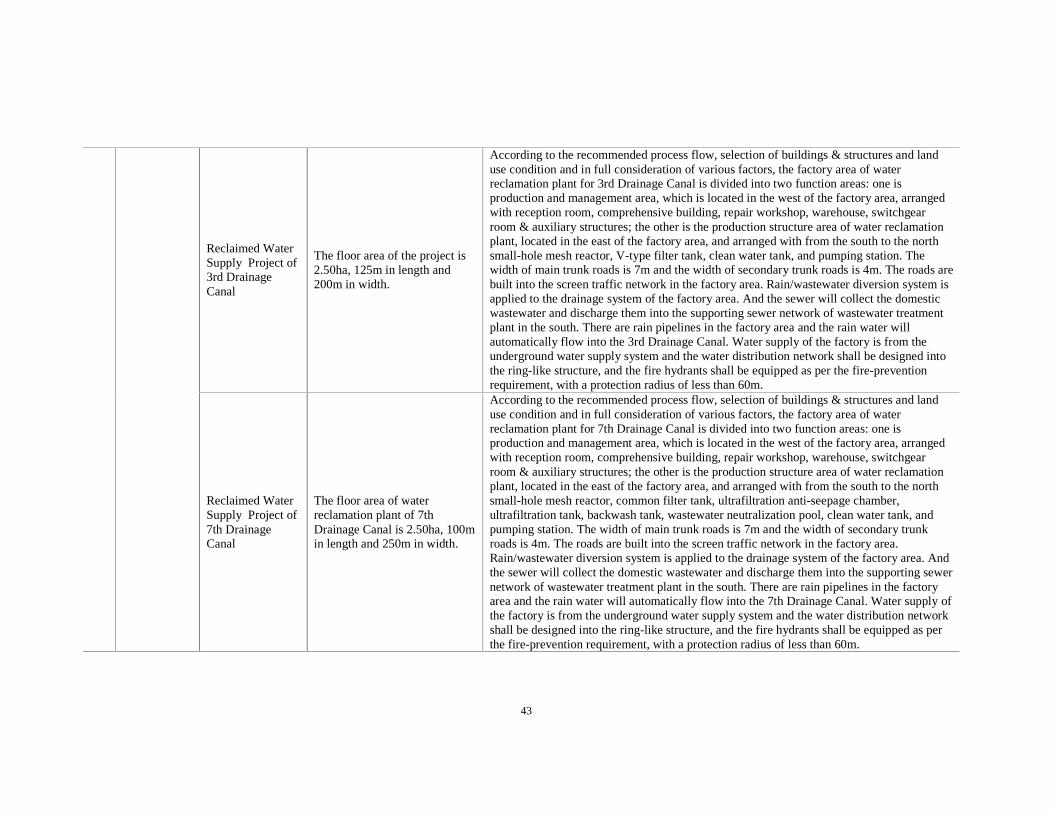
43
Reclaimed WaterSupply Project of3rd DrainageCanal
The floor area of the project is2.50ha, 125m in length and200m in width.
According to the recommended process flow, selection of buildings & structuresand landuse condition and in full consideration of various factors, the factory area of waterreclamation plant for 3rd Drainage Canal is divided into two function areas: one isproduction and management area, which is located in the west of the factory area, arrangedwith reception room, comprehensivebuilding, repair workshop, warehouse, switchgearroom & auxiliary structures; the other is the production structurearea of water reclamationplant, located in theeast of the factory area, and arranged with from thesouth to the northsmall-holemesh reactor, V-type filter tank, clean water tank, and pumping station. Thewidth of main trunk roads is 7m and thewidth of secondary trunk roads is4m. The roadsarebuilt into the screen traffic network in the factory area. Rain/wastewater diversion system isapplied to thedrainage system of the factory area. And thesewer will collect the domesticwastewater and discharge them into the supporting sewer network of wastewater treatmentplant in the south. There are rain pipelines in the factory area and the rain water willautomatically flow into the 3rd Drainage Canal. Water supply of the factory is from theunderground water supply system and thewater distribution network shall bedesigned intothe ring-like structure, and the fire hydrants shall be equipped as per the fire-preventionrequirement, with a protection radius of less than 60m.
Reclaimed WaterSupply Project of7th DrainageCanal
The floor area of waterreclamation plant of 7thDrainage Canal is 2.50ha, 100min length and 250m in width.
According to the recommended process flow, selection of buildings & structuresand landuse condition and in full consideration of various factors, the factory area of waterreclamation plant for 7th Drainage Canal is divided into two function areas: one isproduction and management area, which is located in the west of the factory area, arrangedwith reception room, comprehensivebuilding, repair workshop, warehouse, switchgearroom & auxiliary structures; the other is the production structurearea of water reclamationplant, located in theeast of the factory area, and arranged with from thesouth to the northsmall-holemesh reactor, common filter tank, ultrafiltration anti-seepagechamber,ultrafiltration tank, backwash tank, wastewater neutralization pool, clean water tank, andpumping station. The width of main trunk roads is 7m and the width of secondary trunkroads is 4m. The roads are built into the screen traffic network in the factory area.Rain/wastewater diversion system is applied to thedrainage system of the factory area. Andthesewer will collect the domestic wastewater and discharge them into the supporting sewernetwork of wastewater treatment plant in thesouth. There are rain pipelines in the factoryareaand the rain water will automatically flow into the 7th Drainage Canal. Water supply ofthe factory is from theunderground water supply system and thewater distribution networkshall bedesigned into the ring-likestructure, and the firehydrants shall beequipped as perthe fire-prevention requirement, with a protection radius of less than 60m.
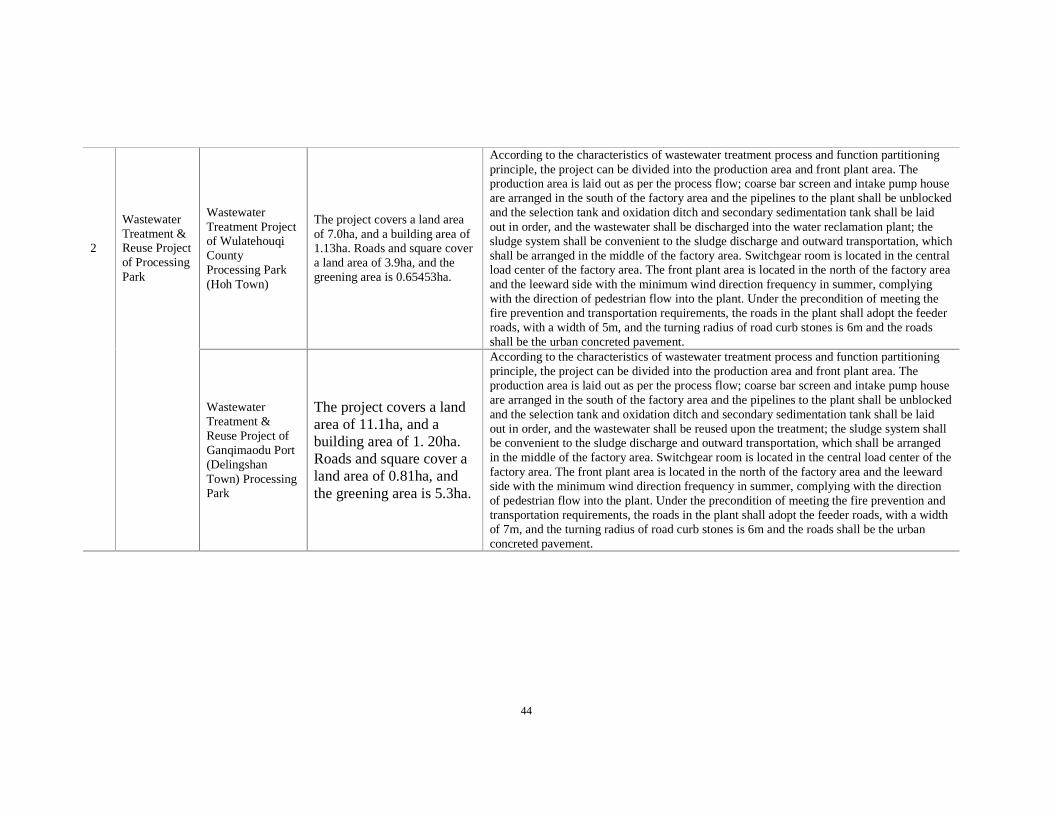
44
WastewaterTreatment Projectof WulatehouqiCountyProcessing Park(Hoh Town)
Theproject covers a land areaof 7.0ha, and abuilding area of1.13ha. Roadsand square covera land area of 3.9ha, and thegreening area is 0.65453ha.
According to the characteristics of wastewater treatment process and function partitioningprinciple, theproject can be divided into the production area and front plant area. Theproduction area is laid out as per the process flow; coarse bar screen and intake pump housearearranged in the south of the factory areaand the pipelines to the plant shall be unblockedand the selection tank and oxidation ditch and secondary sedimentation tank shall be laidout in order, and thewastewater shall be discharged into the water reclamation plant; thesludgesystem shall be convenient to the sludge dischargeand outward transportation, whichshall bearranged in the middle of the factory area. Switchgear room is located in thecentralload center of the factory area. The front plant area is located in the north of the factory areaand the leeward side with the minimum wind direction frequency in summer, complyingwith thedirection of pedestrian flow into the plant. Under the precondition of meeting thefireprevention and transportation requirements, the roads in the plant shall adopt the feederroads, with a width of 5m, and the turning radius of road curb stones is 6m and the roadsshall be the urban concreted pavement.
2
WastewaterTreatment &ReuseProjectof ProcessingPark
WastewaterTreatment &Reuse Project ofGanqimaodu Port(DelingshanTown) ProcessingPark
The project coversa landarea of 11.1ha, and abuilding area of 1. 20ha.Roadsand square cover aland area of 0.81ha, andthe greening area is5.3ha.
According to the characteristics of wastewater treatment process and function partitioningprinciple, theproject can be divided into the production area and front plant area. Theproduction area is laid out as per the process flow; coarse bar screen and intake pump housearearranged in the south of the factory areaand the pipelines to the plant shall be unblockedand the selection tank and oxidation ditch and secondary sedimentation tank shall be laidout in order, and thewastewater shall be reused upon the treatment; the sludge system shallbe convenient to the sludge dischargeand outward transportation, which shall be arrangedin the middle of the factory area. Switchgear room is located in the central load center of thefactory area. The front plant area is located in the north of the factory areaand the leewardsidewith the minimum wind direction frequency in summer, complying with the directionof pedestrian flow into the plant. Under the precondition of meeting the fireprevention andtransportation requirements, the roads in the plant shall adopt the feeder roads, with a widthof 7m, and the turning radius of road curb stones is6m and the roads shall be the urbanconcreted pavement.
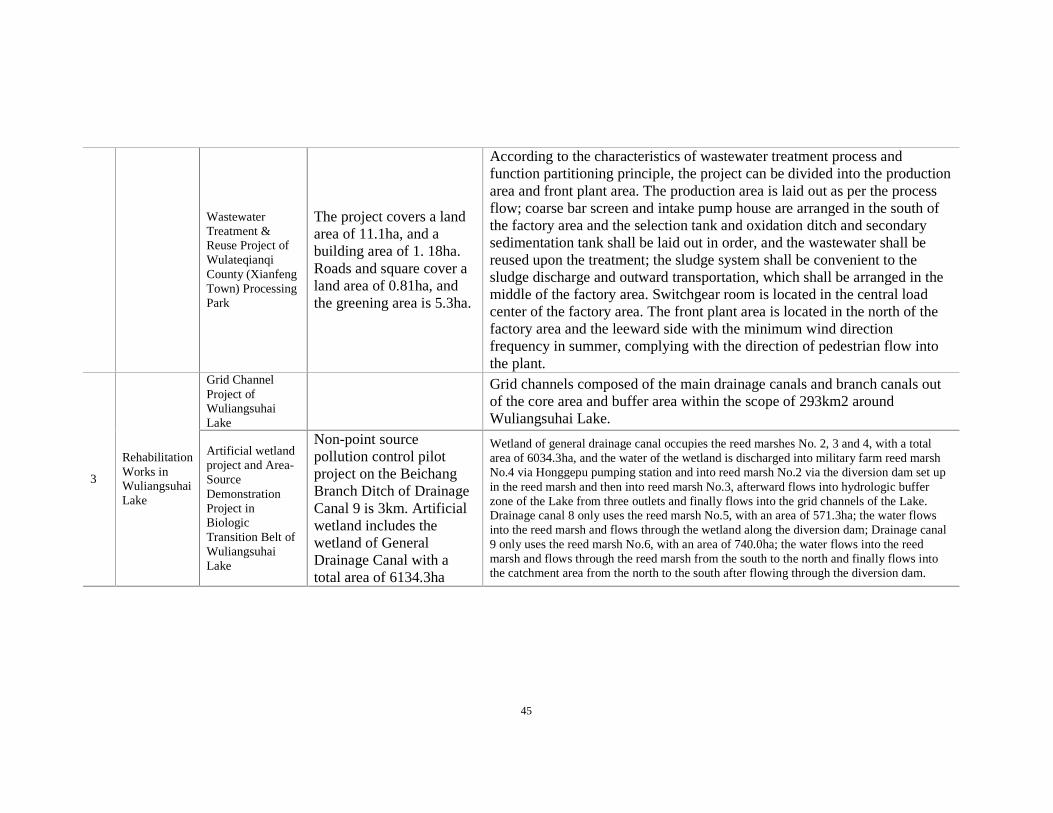
45
WastewaterTreatment &Reuse Project ofWulateqianqiCounty (XianfengTown) ProcessingPark
The project coversa landarea of 11.1ha, and abuilding area of 1. 18ha.Roadsand square cover aland area of 0.81ha, andthe greening area is5.3ha.
According to thecharacteristicsof wastewater treatment processandfunction partitioning principle, theproject can bedivided into the productionarea and front plant area. The production area is laid out asper the processflow; coarse bar screen and intakepump house are arranged in thesouth ofthe factory areaand the selection tank and oxidation ditch and secondarysedimentation tank shall be laid out in order, and the wastewater shall bereused upon the treatment; thesludge system shall be convenient to thesludge discharge and outward transportation, which shall bearranged in themiddleof the factory area. Switchgear room is located in thecentral loadcenter of the factory area. The front plant area is located in thenorth of thefactory areaand the leeward side with the minimum wind directionfrequency in summer, complying with the direction of pedestrian flow intothe plant.
Grid ChannelProject ofWuliangsuhaiLake
Grid channelscomposed of the main drainage canalsand branch canalsoutof thecoreareaand buffer area within the scopeof 293km2 aroundWuliangsuhai Lake.
3
RehabilitationWorks inWuliangsuhaiLake
Artificial wetlandproject and Area-SourceDemonstrationProject inBiologicTransition Belt ofWuliangsuhaiLake
Non-point sourcepollution control pilotproject on theBeichangBranch Ditch of DrainageCanal 9 is 3km. Artificialwetland includes thewetland of GeneralDrainage Canal with atotal areaof 6134.3ha
Wetland of general drainage canal occupies the reed marshes No. 2, 3 and 4, with a totalareaof 6034.3ha, and the water of the wetland is discharged into military farm reed marshNo.4 viaHonggepu pumping station and into reed marsh No.2 via the diversion dam set upin the reed marsh and then into reed marsh No.3, afterward flows into hydrologic bufferzone of the Lake from three outlets and finally flows into the grid channels of the Lake.Drainagecanal 8 only uses the reed marsh No.5, with an area of 571.3ha; thewater flowsinto the reed marsh and flows through thewetland along the diversion dam; Drainage canal9 only uses the reed marsh No.6, with an area of 740.0ha; the water flows into the reedmarsh and flows through the reed marsh from the south to thenorth and finally flows intothecatchment area from the north to thesouth after flowing through the diversion dam.
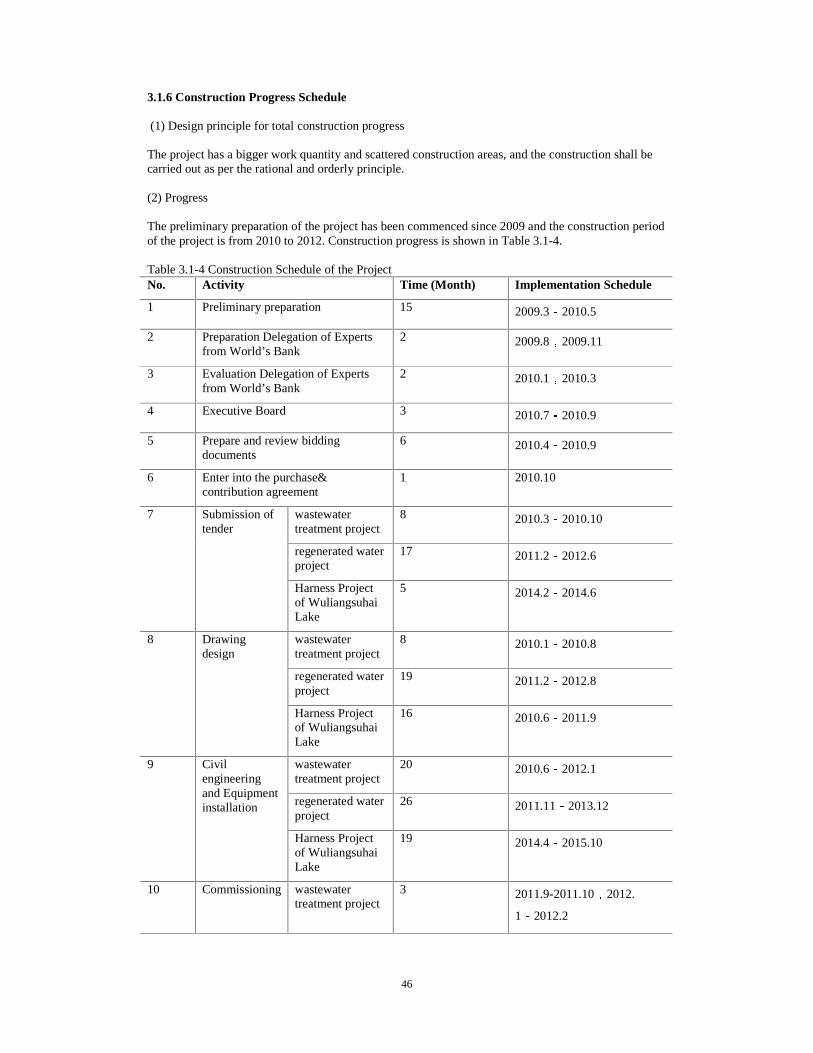
46
3.1.6 Construction Progress Schedule (1) Design principle for total construction progress The project has a bigger work quantity and scattered construction areas, and the construction shall be carried out as per the rational and orderly principle. (2) Progress The preliminary preparation of the project has been commenced since 2009 and the construction period of the project is from 2010 to 2012. Construction progress is shown in Table 3.1-4. Table 3.1-4 Construction Schedule of the Project No. Activity Time (Month) Implementation Schedule
1 Preliminary preparation 15 2009.3 2010.5
2 Preparation Delegation of Experts from World’s Bank
2 2009.8 2009.11
3 Evaluation Delegation of Experts from World’s Bank
2 2010.1 2010.3
4 Executive Board 3 2010.7 2010.9
5 Prepare and review bidding documents
6 2010.4 2010.9
6 Enter into the purchase& contribution agreement
1 2010.10
wastewater treatment project
8 2010.3 2010.10
regenerated water project
17 2011.2 2012.6
7 Submission of tender
Harness Project of Wuliangsuhai Lake
5 2014.2 2014.6
wastewater treatment project
8 2010.1 2010.8
regenerated water project
19 2011.2 2012.8
8 Drawing design
Harness Project of Wuliangsuhai Lake
16 2010.6 2011.9
wastewater treatment project
20 2010.6 2012.1
regenerated water project
26 2011.11 2013.12
9 Civil engineering and Equipment installation
Harness Project of Wuliangsuhai Lake
19 2014.4 2015.10
10 Commissioning wastewater treatment project
3 2011.9-2011.10 2012.
1 2012.2
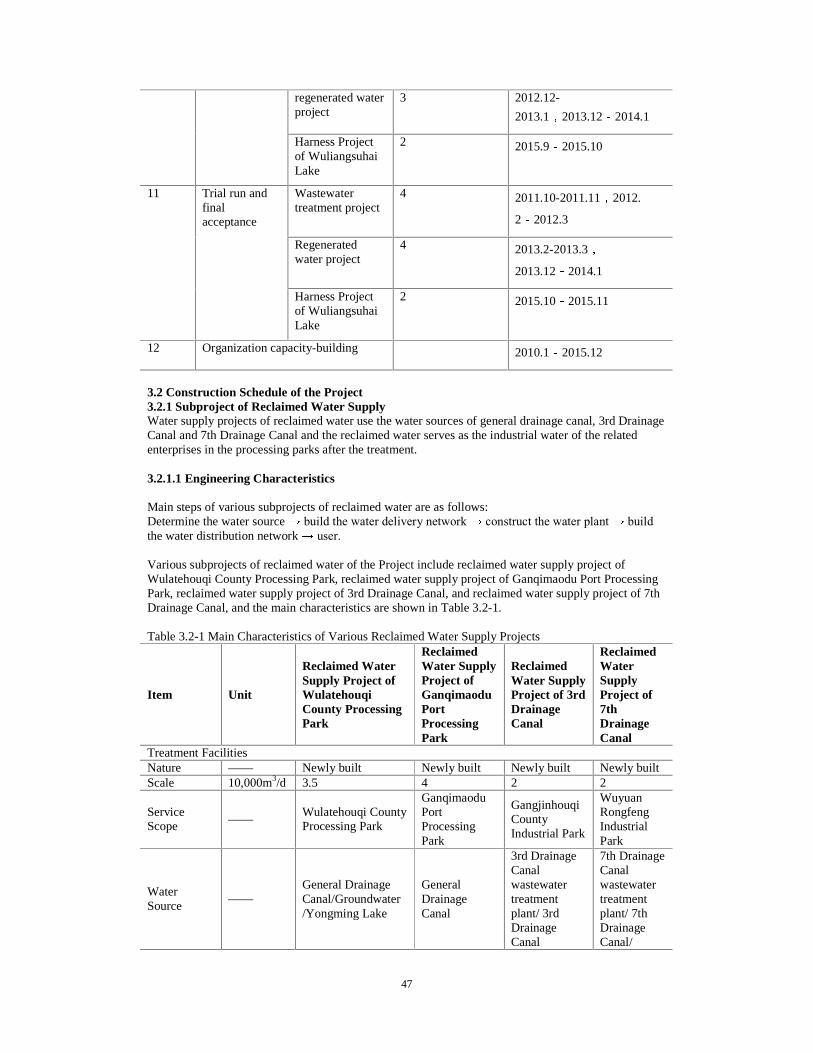
47
regenerated water project
3 2012.12-
2013.1 2013.12 2014.1
Harness Project of Wuliangsuhai Lake
2 2015.9 2015.10
Wastewater treatment project
4 2011.10-2011.11 2012.
2 2012.3
Regenerated water project
4 2013.2-2013.3
2013.12 2014.1
11
Trial run and final acceptance
Harness Project of Wuliangsuhai Lake
2 2015.10 2015.11
12 Organization capacity-building 2010.1 2015.12
3.2 Construction Schedule of the Project 3.2.1 Subproject of Reclaimed Water Supply Water supply projects of reclaimed water use the water sources of general drainage canal, 3rd Drainage Canal and 7th Drainage Canal and the reclaimed water serves as the industrial water of the related enterprises in the processing parks after the treatment. 3.2.1.1 Engineering Characteristics Main steps of various subprojects of reclaimed water are as follows: Determine the water source build the water delivery network construct the water plant build the water distribution network user.
Various subprojects of reclaimed water of the Project include reclaimed water supply project of Wulatehouqi County Processing Park, reclaimed water supply project of Ganqimaodu Port Processing Park, reclaimed water supply project of 3rd Drainage Canal, and reclaimed water supply project of 7th Drainage Canal, and the main characteristics are shown in Table 3.2-1. Table 3.2-1 Main Characteristics of Various Reclaimed Water Supply Projects
Item Unit
Reclaimed Water Supply Project of Wulatehouqi County Processing Park
Reclaimed Water Supply Project of Ganqimaodu Port Processing Park
Reclaimed Water Supply Project of 3rd Drainage Canal
Reclaimed Water Supply Project of 7th Drainage Canal
Treatment Facilities Nature —— Newly built Newly built Newly built Newly built Scale 10,000m3/d 3.5 4 2 2
Service Scope
—— Wulatehouqi County Processing Park
Ganqimaodu Port Processing Park
Gangjinhouqi County Industrial Park
Wuyuan Rongfeng Industrial Park
Water Source
—— General Drainage Canal/Groundwater /Yongming Lake
General Drainage Canal
3rd Drainage Canal wastewater treatment plant/ 3rd Drainage Canal
7th Drainage Canal wastewater treatment plant/ 7th Drainage Canal/
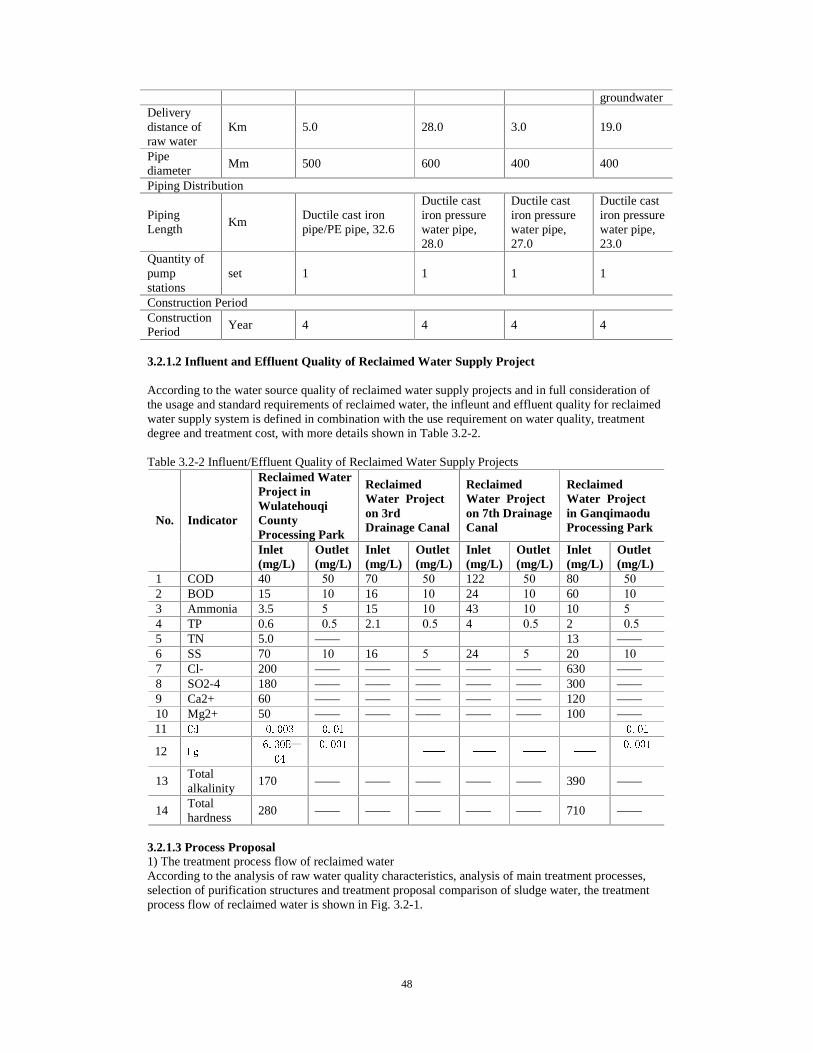
48
groundwater Delivery distance of raw water
Km 5.0 28.0 3.0 19.0
Pipe diameter
Mm 500 600 400 400
Piping Distribution
Piping Length
Km Ductile cast iron pipe/PE pipe, 32.6
Ductile cast iron pressure water pipe, 28.0
Ductile cast iron pressure water pipe, 27.0
Ductile cast iron pressure water pipe, 23.0
Quantity of pump stations
set 1 1 1 1
Construction Period Construction Period
Year 4 4 4 4
3.2.1.2 Influent and Effluent Quality of Reclaimed Water Supply Project According to the water source quality of reclaimed water supply projects and in full consideration of the usage and standard requirements of reclaimed water, the infleunt and effluent quality for reclaimed water supply system is defined in combination with the use requirement on water quality, treatment degree and treatment cost, with more details shown in Table 3.2-2. Table 3.2-2 Influent/Effluent Quality of Reclaimed Water Supply Projects
Reclaimed Water Project in Wulatehouqi County Processing Park
Reclaimed Water Project on 3rd Drainage Canal
Reclaimed Water Project on 7th Drainage Canal
Reclaimed Water Project in Ganqimaodu Processing Park
No. Indicator
Inlet (mg/L)
Outlet (mg/L)
Inlet (mg/L)
Outlet (mg/L)
Inlet (mg/L)
Outlet (mg/L)
Inlet (mg/L)
Outlet (mg/L)
1 COD 40 �50 70 �50 122 �50 80 �50 2 BOD 15 �10 16 �10 24 �10 60 �10 3 Ammonia 3.5 �5 15 �10 43 �10 10 �5 4 TP 0.6 �0.5 2.1 �0.5 4 �0.5 2 �0.5 5 TN 5.0 —— 13 —— 6 SS 70 �10 16 �5 24 �5 20 �10 7 Cl- 200 —— —— —— —— —— 630 —— 8 SO2-4 180 —— —— —— —— —— 300 —— 9 Ca2+ 60 —— —— —— —— —— 120 —— 10 Mg2+ 50 —— —— —— —— —— 100 —— 11 &G� ������ ����� üü� üü� üü� üü� üü� �����
12 +J�����(�
���
������ üü�üü� üü� üü� üü�
������
13 Total alkalinity
170 —— —— —— —— —— 390 ——
14 Total hardness
280 —— —— —— —— —— 710 ——
3.2.1.3 Process Proposal 1) The treatment process flow of reclaimed water According to the analysis of raw water quality characteristics, analysis of main treatment processes, selection of purification structures and treatment proposal comparison of sludge water, the treatment process flow of reclaimed water is shown in Fig. 3.2-1.
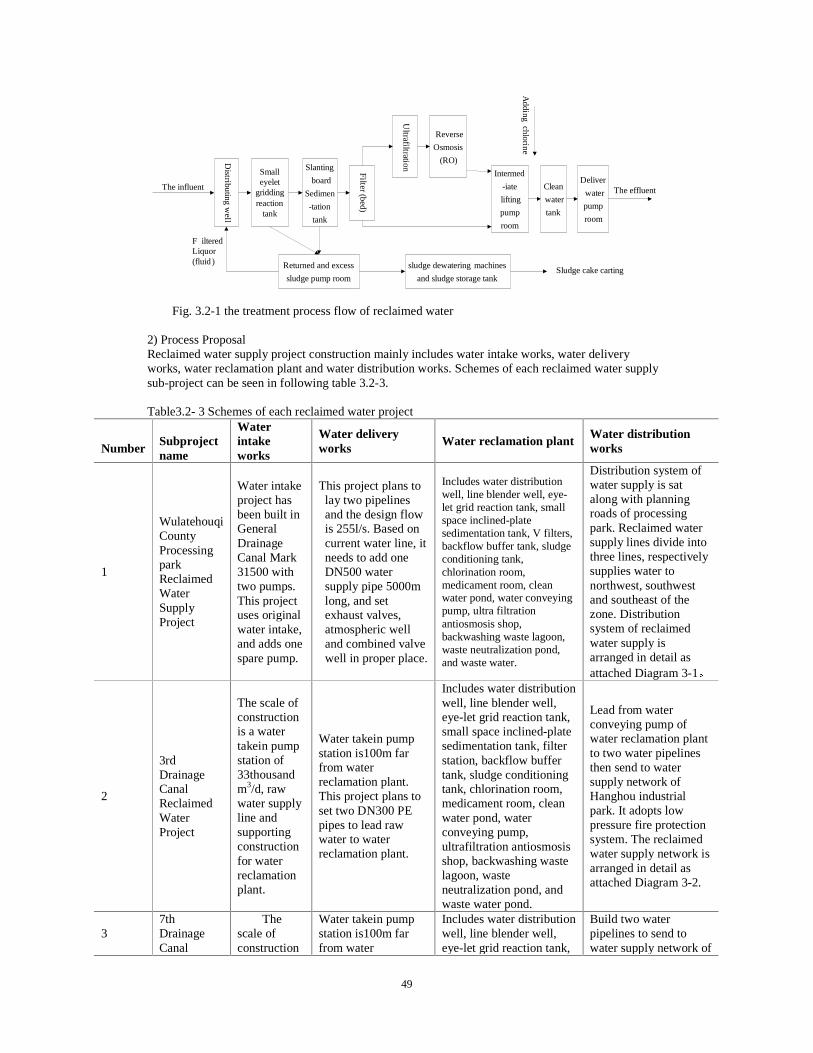
49
Distributing w
ell
Small eyelet
gridding reaction
tank
The influent
Slanting
board
Sedimen
-tation
tank
Filter (bed)
Ultrafiltration
Reverse
Osmosis
(RO)
Intermed
-iate
lifting
pump
room
Clean
water
tank
Deliver
water
pump
room
sludge dewatering machines
and sludge storage tank
Returned and excess
sludge pump roomA
dding chlorine
F iltered Liquor (fluid )
The effluent
Sludge cake carting
Fig. 3.2-1 the treatment process flow of reclaimed water
2) Process Proposal Reclaimed water supply project construction mainly includes water intake works, water delivery works, water reclamation plant and water distribution works. Schemes of each reclaimed water supply sub-project can be seen in following table 3.2-3.
Table3.2- 3 Schemes of each reclaimed water project
Number
Subproject name
Water intake works
Water delivery works
Water reclamation plant Water distribution works
1
Wulatehouqi County Processing park Reclaimed Water Supply Project
Water intake project has been built in General Drainage Canal Mark 31500 with two pumps. This project uses original water intake, and adds one spare pump.
This project plans to lay two pipelines and the design flow is 255l/s. Based on current water line, it needs to add one DN500 water supply pipe 5000m long, and set exhaust valves, atmospheric well and combined valve well in proper place.
Includes water distribution well, line blender well, eye-let grid reaction tank, small space inclined-plate sedimentation tank, V filters, backflow buffer tank, sludge conditioning tank, chlorination room, medicament room, clean water pond, water conveying pump, ultra filtration antiosmosis shop, backwashing waste lagoon, waste neutralization pond, and waste water.
Distribution system of water supply is sat along with planning roads of processing park. Reclaimed water supply lines divide into three lines, respectively supplies water to northwest, southwest and southeast of the zone. Distribution system of reclaimed water supply is arranged in detail as attached Diagram 3-1
2
3rd Drainage Canal Reclaimed Water Project
The scale of construction is a water takein pump station of 33thousand m3/d, raw water supply line and supporting construction for water reclamation plant.
Water takein pump station is100m far from water reclamation plant. This project plans to set two DN300 PE pipes to lead raw water to water reclamation plant.
Includes water distribution well, line blender well, eye-let grid reaction tank, small space inclined-plate sedimentation tank, filter station, backflow buffer tank, sludge conditioning tank, chlorination room, medicament room, clean water pond, water conveying pump, ultrafiltration antiosmosis shop, backwashing waste lagoon, waste neutralization pond, and waste water pond.
Lead from water conveying pump of water reclamation plant to two water pipelines then send to water supply network of Hanghou industrial park. It adopts low pressure fire protection system. The reclaimed water supply network is arranged in detail as attached Diagram 3-2.
3 7th Drainage Canal
The scale of construction
Water takein pump station is100m far from water
Includes water distribution well, line blender well, eye-let grid reaction tank,
Build two water pipelines to send to water supply network of
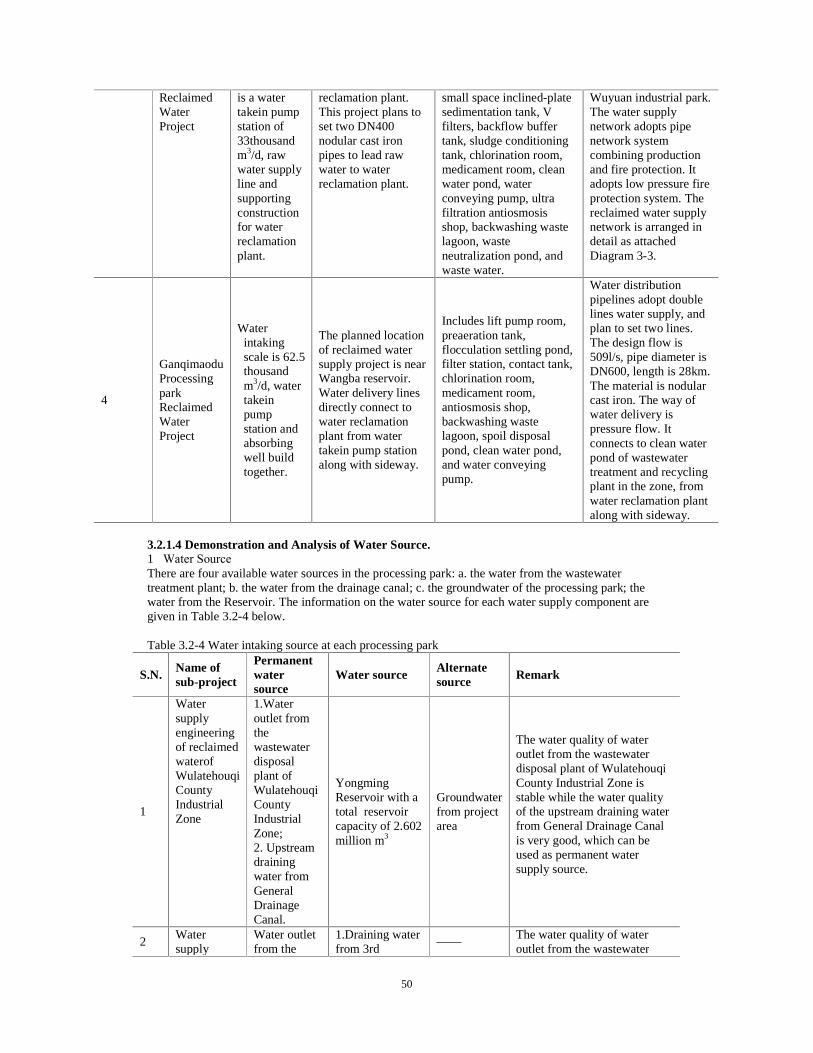
50
Reclaimed Water Project
is a water takein pump station of 33thousand m3/d, raw water supply line and supporting construction for water reclamation plant.
reclamation plant. This project plans to set two DN400 nodular cast iron pipes to lead raw water to water reclamation plant.
small space inclined-plate sedimentation tank, V filters, backflow buffer tank, sludge conditioning tank, chlorination room, medicament room, clean water pond, water conveying pump, ultra filtration antiosmosis shop, backwashing waste lagoon, waste neutralization pond, and waste water.
Wuyuan industrial park. The water supply network adopts pipe network system combining production and fire protection. It adopts low pressure fire protection system. The reclaimed water supply network is arranged in detail as attached Diagram 3-3.
4
Ganqimaodu Processing park Reclaimed Water Project
Water intaking scale is 62.5 thousand m3/d, water takein pump station and absorbing well build together.
The planned location of reclaimed water supply project is near Wangba reservoir. Water delivery lines directly connect to water reclamation plant from water takein pump station along with sideway.
Includes lift pump room, preaeration tank, flocculation settling pond, filter station, contact tank, chlorination room, medicament room, antiosmosis shop, backwashing waste lagoon, spoil disposal pond, clean water pond, and water conveying pump.
Water distribution pipelines adopt double lines water supply, and plan to set two lines. The design flow is 509l/s, pipe diameter is DN600, length is 28km. The material is nodular cast iron. The way of water delivery is pressure flow. It connects to clean water pond of wastewater treatment and recycling plant in the zone, from water reclamation plant along with sideway.
3.2.1.4 Demonstration and Analysis of Water Source. 1�Water Source There are four available water sources in the processing park: a. the water from the wastewater treatment plant; b. the water from the drainage canal; c. the groundwater of the processing park; the water from the Reservoir. The information on the water source for each water supply component are given in Table 3.2-4 below. Table 3.2-4 Water intaking source at each processing park
S.N. Name of sub-project
Permanent water source
Water source Alternate source
Remark
1
Water supply engineering of reclaimed waterof Wulatehouqi County Industrial Zone
1.Water outlet from the wastewater disposal plant of Wulatehouqi County Industrial Zone; 2. Upstream draining water from General Drainage Canal.
Yongming Reservoir with a total reservoir capacity of 2.602 million m3
Groundwater from project area
The water quality of water outlet from the wastewater disposal plant of Wulatehouqi County Industrial Zone is stable while the water quality of the upstream draining water from General Drainage Canal is very good, which can be used as permanent water supply source.
2 Water supply
Water outlet from the
1.Draining water from 3rd
—— The water quality of water outlet from the wastewater
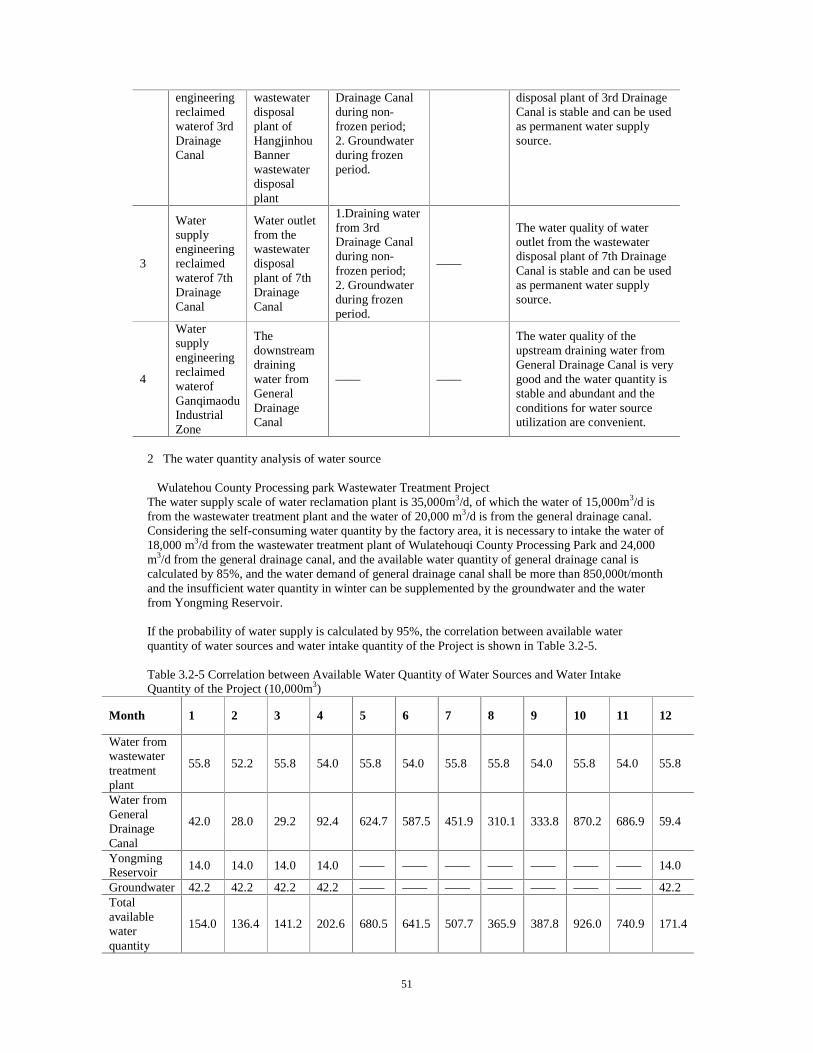
51
engineering reclaimed waterof 3rd Drainage Canal
wastewater disposal plant of Hangjinhou Banner wastewater disposal plant
Drainage Canal during non-frozen period; 2. Groundwater during frozen period.
disposal plant of 3rd Drainage Canal is stable and can be used as permanent water supply source.
3
Water supply engineering reclaimed waterof 7th Drainage Canal
Water outlet from the wastewater disposal plant of 7th Drainage Canal
1.Draining water from 3rd Drainage Canal during non-frozen period; 2. Groundwater during frozen period.
——
The water quality of water outlet from the wastewater disposal plant of 7th Drainage Canal is stable and can be used as permanent water supply source.
4
Water supply engineering reclaimed waterof Ganqimaodu Industrial Zone
The downstream draining water from General Drainage Canal
—— ——
The water quality of the upstream draining water from General Drainage Canal is very good and the water quantity is stable and abundant and the conditions for water source utilization are convenient.
2�The water quantity analysis of water source �Wulatehou County Processing park Wastewater Treatment Project The water supply scale of water reclamation plant is 35,000m3/d, of which the water of 15,000m3/d is from the wastewater treatment plant and the water of 20,000 m3/d is from the general drainage canal. Considering the self-consuming water quantity by the factory area, it is necessary to intake the water of 18,000 m3/d from the wastewater treatment plant of Wulatehouqi County Processing Park and 24,000 m3/d from the general drainage canal, and the available water quantity of general drainage canal is calculated by 85%, and the water demand of general drainage canal shall be more than 850,000t/month and the insufficient water quantity in winter can be supplemented by the groundwater and the water from Yongming Reservoir. If the probability of water supply is calculated by 95%, the correlation between available water quantity of water sources and water intake quantity of the Project is shown in Table 3.2-5. Table 3.2-5 Correlation between Available Water Quantity of Water Sources and Water Intake Quantity of the Project (10,000m3)
Month 1 2 3 4 5 6 7 8 9 10 11 12
Water from wastewater treatment plant
55.8 52.2 55.8 54.0 55.8 54.0 55.8 55.8 54.0 55.8 54.0 55.8
Water from General Drainage Canal
42.0 28.0 29.2 92.4 624.7 587.5 451.9 310.1 333.8 870.2 686.9 59.4
Yongming Reservoir
14.0 14.0 14.0 14.0 —— —— —— —— —— —— —— 14.0
Groundwater 42.2 42.2 42.2 42.2 —— —— —— —— —— —— —— 42.2 Total available water quantity
154.0 136.4 141.2 202.6 680.5 641.5 507.7 365.9 387.8 926.0 740.9 171.4
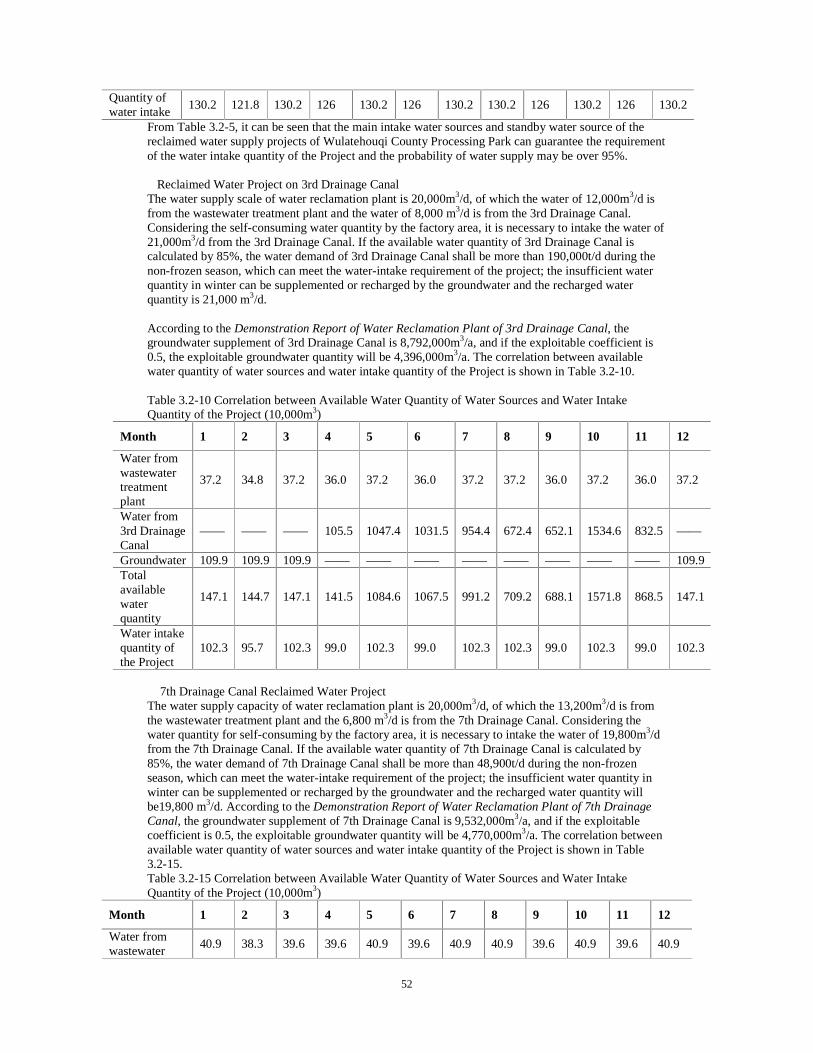
52
Quantity of water intake
130.2 121.8 130.2 126 130.2 126 130.2 130.2 126 130.2 126 130.2
From Table 3.2-5, it can be seen that the main intake water sources and standby water source of the reclaimed water supply projects of Wulatehouqi County Processing Park can guarantee the requirement of the water intake quantity of the Project and the probability of water supply may be over 95%. �Reclaimed Water Project on 3rd Drainage Canal The water supply scale of water reclamation plant is 20,000m3/d, of which the water of 12,000m3/d is from the wastewater treatment plant and the water of 8,000 m3/d is from the 3rd Drainage Canal. Considering the self-consuming water quantity by the factory area, it is necessary to intake the water of 21,000m3/d from the 3rd Drainage Canal. If the available water quantity of 3rd Drainage Canal is calculated by 85%, the water demand of 3rd Drainage Canal shall be more than 190,000t/d during the non-frozen season, which can meet the water-intake requirement of the project; the insufficient water quantity in winter can be supplemented or recharged by the groundwater and the recharged water quantity is 21,000 m3/d. According to the Demonstration Report of Water Reclamation Plant of 3rd Drainage Canal, the groundwater supplement of 3rd Drainage Canal is 8,792,000m3/a, and if the exploitable coefficient is 0.5, the exploitable groundwater quantity will be 4,396,000m3/a. The correlation between available water quantity of water sources and water intake quantity of the Project is shown in Table 3.2-10. Table 3.2-10 Correlation between Available Water Quantity of Water Sources and Water Intake Quantity of the Project (10,000m3)
Month 1 2 3 4 5 6 7 8 9 10 11 12
Water from wastewater treatment plant
37.2 34.8 37.2 36.0 37.2 36.0 37.2 37.2 36.0 37.2 36.0 37.2
Water from 3rd Drainage Canal
—— —— —— 105.5 1047.4 1031.5 954.4 672.4 652.1 1534.6 832.5 ——
Groundwater 109.9 109.9 109.9 —— —— —— —— —— —— —— —— 109.9 Total available water quantity
147.1 144.7 147.1 141.5 1084.6 1067.5 991.2 709.2 688.1 1571.8 868.5 147.1
Water intake quantity of the Project
102.3 95.7 102.3 99.0 102.3 99.0 102.3 102.3 99.0 102.3 99.0 102.3
� 7th Drainage Canal Reclaimed Water Project The water supply capacity of water reclamation plant is 20,000m3/d, of which the 13,200m3/d is from the wastewater treatment plant and the 6,800 m3/d is from the 7th Drainage Canal. Considering the water quantity for self-consuming by the factory area, it is necessary to intake the water of 19,800m3/d from the 7th Drainage Canal. If the available water quantity of 7th Drainage Canal is calculated by 85%, the water demand of 7th Drainage Canal shall be more than 48,900t/d during the non-frozen season, which can meet the water-intake requirement of the project; the insufficient water quantity in winter can be supplemented or recharged by the groundwater and the recharged water quantity will be19,800 m3/d. According to the Demonstration Report of Water Reclamation Plant of 7th Drainage Canal, the groundwater supplement of 7th Drainage Canal is 9,532,000m3/a, and if the exploitable coefficient is 0.5, the exploitable groundwater quantity will be 4,770,000m3/a. The correlation between available water quantity of water sources and water intake quantity of the Project is shown in Table 3.2-15. Table 3.2-15 Correlation between Available Water Quantity of Water Sources and Water Intake Quantity of the Project (10,000m3)
Month 1 2 3 4 5 6 7 8 9 10 11 12
Water from wastewater
40.9 38.3 39.6 39.6 40.9 39.6 40.9 40.9 39.6 40.9 39.6 40.9
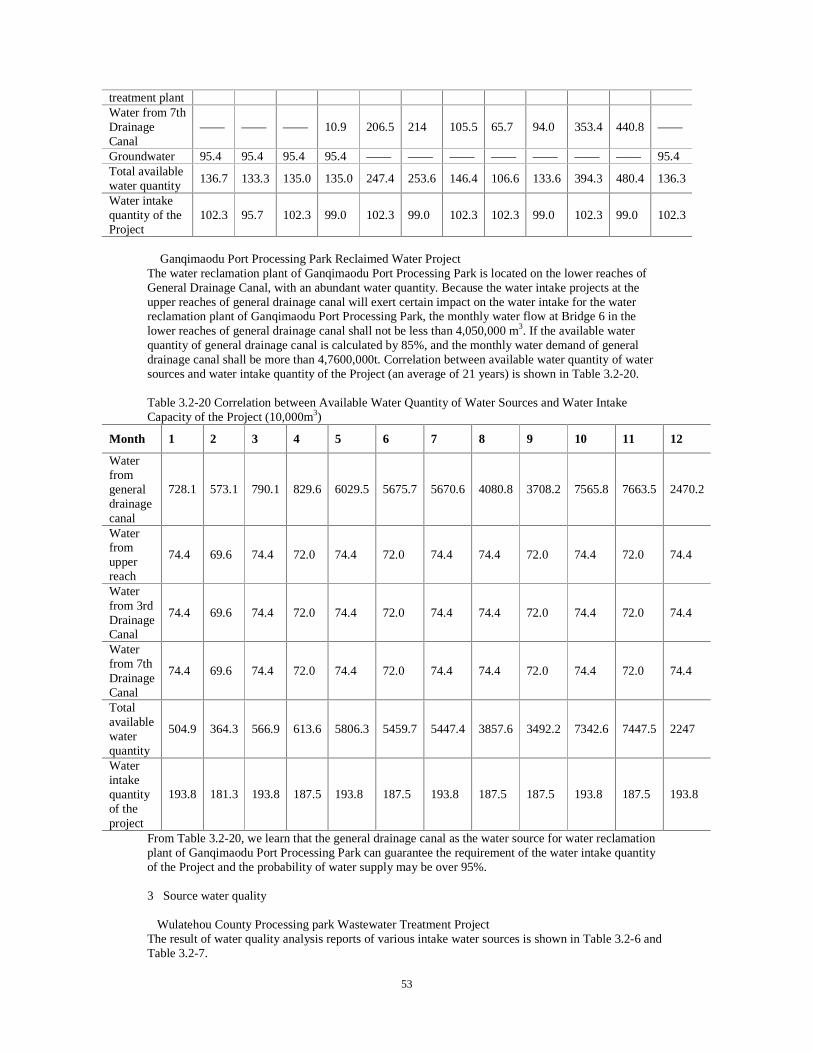
53
treatment plant Water from 7th Drainage Canal
—— —— —— 10.9 206.5 214 105.5 65.7 94.0 353.4 440.8 ——
Groundwater 95.4 95.4 95.4 95.4 —— —— —— —— —— —— —— 95.4 Total available water quantity
136.7 133.3 135.0 135.0 247.4 253.6 146.4 106.6 133.6 394.3 480.4 136.3
Water intake quantity of the Project
102.3 95.7 102.3 99.0 102.3 99.0 102.3 102.3 99.0 102.3 99.0 102.3
� Ganqimaodu Port Processing Park Reclaimed Water Project The water reclamation plant of Ganqimaodu Port Processing Park is located on the lower reaches of General Drainage Canal, with an abundant water quantity. Because the water intake projects at the upper reaches of general drainage canal will exert certain impact on the water intake for the water reclamation plant of Ganqimaodu Port Processing Park, the monthly water flow at Bridge 6 in the lower reaches of general drainage canal shall not be less than 4,050,000 m3. If the available water quantity of general drainage canal is calculated by 85%, and the monthly water demand of general drainage canal shall be more than 4,7600,000t. Correlation between available water quantity of water sources and water intake quantity of the Project (an average of 21 years) is shown in Table 3.2-20. Table 3.2-20 Correlation between Available Water Quantity of Water Sources and Water Intake Capacity of the Project (10,000m3)
Month 1 2 3 4 5 6 7 8 9 10 11 12
Water from general drainage canal
728.1 573.1 790.1 829.6 6029.5 5675.7 5670.6 4080.8 3708.2 7565.8 7663.5 2470.2
Water from upper reach
74.4 69.6 74.4 72.0 74.4 72.0 74.4 74.4 72.0 74.4 72.0 74.4
Water from 3rd Drainage Canal
74.4 69.6 74.4 72.0 74.4 72.0 74.4 74.4 72.0 74.4 72.0 74.4
Water from 7th Drainage Canal
74.4 69.6 74.4 72.0 74.4 72.0 74.4 74.4 72.0 74.4 72.0 74.4
Total available water quantity
504.9 364.3 566.9 613.6 5806.3 5459.7 5447.4 3857.6 3492.2 7342.6 7447.5 2247
Water intake quantity of the project
193.8 181.3 193.8 187.5 193.8 187.5 193.8 187.5 187.5 193.8 187.5 193.8
From Table 3.2-20, we learn that the general drainage canal as the water source for water reclamation plant of Ganqimaodu Port Processing Park can guarantee the requirement of the water intake quantity of the Project and the probability of water supply may be over 95%. 3�Source water quality �Wulatehou County Processing park Wastewater Treatment Project The result of water quality analysis reports of various intake water sources is shown in Table 3.2-6 and Table 3.2-7.

54
Table 3.2-6 Outlet Water of Wastewater Treatment Plant of Wulatehouqi County Processing Park
No. Water Quality Index Designed Outlet Water Quality
1 CODcr 60 mg/l 2 BOD5 20 mg/l 3 SS 20 mg/l 4 Ammonia (metered by N) 8 mg/l 5 TP (metered by P) 1 mg/l
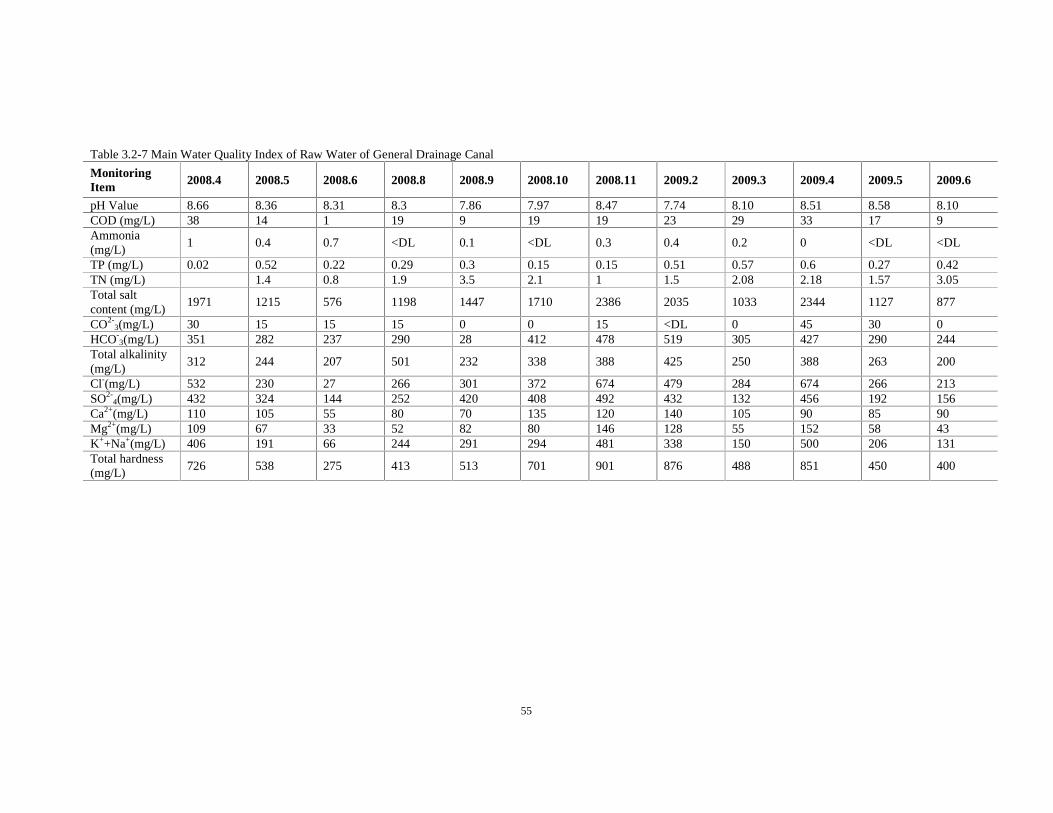
55
Table 3.2-7 Main Water Quality Index of Raw Water of General Drainage Canal
Monitoring Item 2008.4 2008.5 2008.6 2008.8 2008.9 2008.10 2008.11 2009.2 2009.3 2009.4 2009.5 2009.6
pH Value 8.66 8.36 8.31 8.3 7.86 7.97 8.47 7.74 8.10 8.51 8.58 8.10 COD (mg/L) 38 14 1 19 9 19 19 23 29 33 17 9 Ammonia (mg/L)
1 0.4 0.7 <DL 0.1 <DL 0.3 0.4 0.2 0 <DL <DL
TP (mg/L) 0.02 0.52 0.22 0.29 0.3 0.15 0.15 0.51 0.57 0.6 0.27 0.42 TN (mg/L) 1.4 0.8 1.9 3.5 2.1 1 1.5 2.08 2.18 1.57 3.05 Total salt content (mg/L)
1971 1215 576 1198 1447 1710 2386 2035 1033 2344 1127 877
CO2-3(mg/L) 30 15 15 15 0 0 15 <DL 0 45 30 0
HCO-3(mg/L) 351 282 237 290 28 412 478 519 305 427 290 244
Total alkalinity (mg/L)
312 244 207 501 232 338 388 425 250 388 263 200
Cl-(mg/L) 532 230 27 266 301 372 674 479 284 674 266 213 SO2-
4(mg/L) 432 324 144 252 420 408 492 432 132 456 192 156 Ca2+(mg/L) 110 105 55 80 70 135 120 140 105 90 85 90 Mg2+(mg/L) 109 67 33 52 82 80 146 128 55 152 58 43 K++Na+(mg/L) 406 191 66 244 291 294 481 338 150 500 206 131 Total hardness (mg/L)
726 538 275 413 513 701 901 876 488 851 450 400
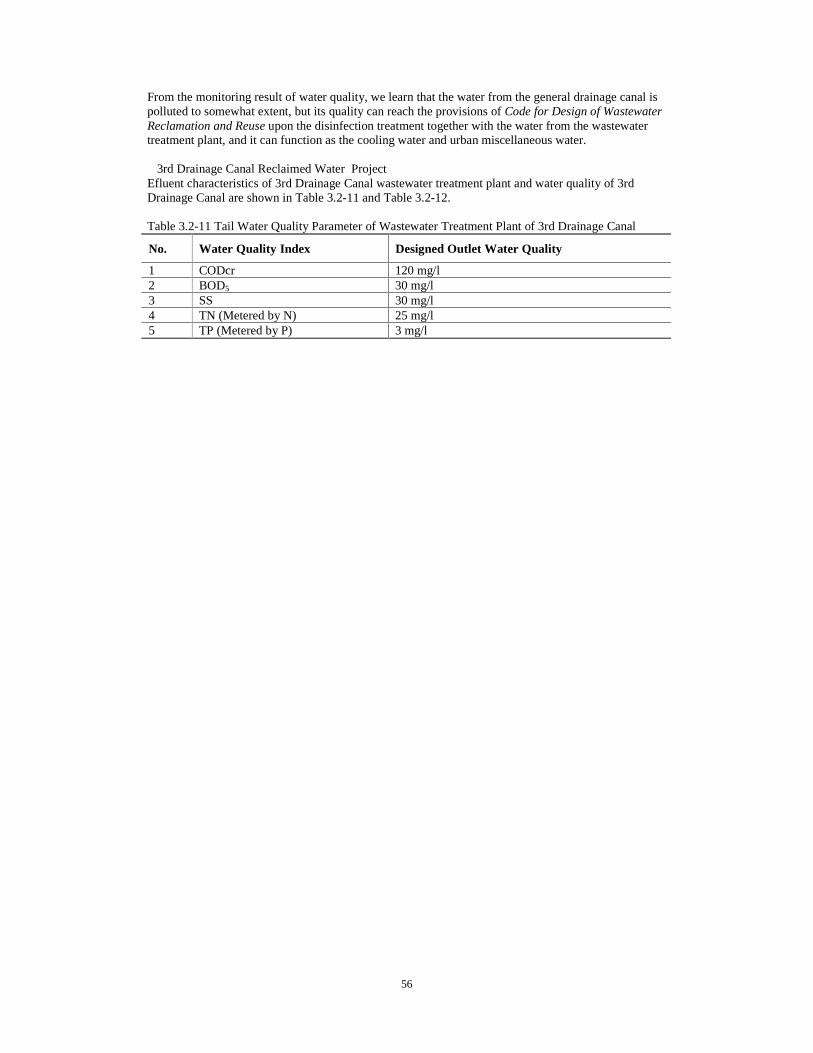
56
From the monitoring result of water quality, we learn that the water from the general drainage canal is polluted to somewhat extent, but its quality can reach the provisions of Code for Design of Wastewater Reclamation and Reuse upon the disinfection treatment together with the water from the wastewater treatment plant, and it can function as the cooling water and urban miscellaneous water. �3rd Drainage Canal Reclaimed Water Project Efluent characteristics of 3rd Drainage Canal wastewater treatment plant and water quality of 3rd Drainage Canal are shown in Table 3.2-11 and Table 3.2-12. Table 3.2-11 Tail Water Quality Parameter of Wastewater Treatment Plant of 3rd Drainage Canal
No. Water Quality Index Designed Outlet Water Quality
1 CODcr 120 mg/l 2 BOD5 30 mg/l 3 SS 30 mg/l 4 TN (Metered by N) 25 mg/l 5 TP (Metered by P) 3 mg/l
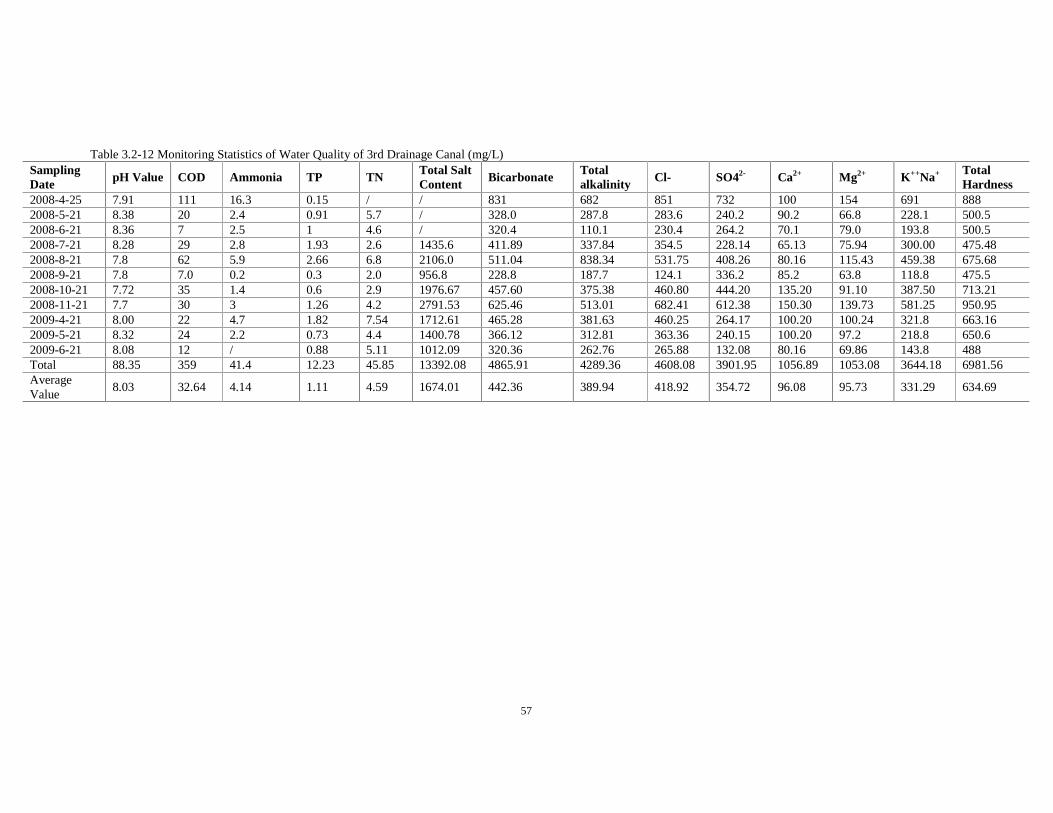
57
Table 3.2-12 Monitoring Statistics of Water Quality of 3rd Drainage Canal (mg/L) Sampling Date
pH Value COD Ammonia TP TN Total Salt Content
Bicarbonate Total alkalinity
Cl- SO42- Ca2+ Mg2+ K++Na+ Total Hardness
2008-4-25 7.91 111 16.3 0.15 / / 831 682 851 732 100 154 691 888 2008-5-21 8.38 20 2.4 0.91 5.7 / 328.0 287.8 283.6 240.2 90.2 66.8 228.1 500.5 2008-6-21 8.36 7 2.5 1 4.6 / 320.4 110.1 230.4 264.2 70.1 79.0 193.8 500.5 2008-7-21 8.28 29 2.8 1.93 2.6 1435.6 411.89 337.84 354.5 228.14 65.13 75.94 300.00 475.48 2008-8-21 7.8 62 5.9 2.66 6.8 2106.0 511.04 838.34 531.75 408.26 80.16 115.43 459.38 675.68 2008-9-21 7.8 7.0 0.2 0.3 2.0 956.8 228.8 187.7 124.1 336.2 85.2 63.8 118.8 475.5 2008-10-21 7.72 35 1.4 0.6 2.9 1976.67 457.60 375.38 460.80 444.20 135.20 91.10 387.50 713.21 2008-11-21 7.7 30 3 1.26 4.2 2791.53 625.46 513.01 682.41 612.38 150.30 139.73 581.25 950.95 2009-4-21 8.00 22 4.7 1.82 7.54 1712.61 465.28 381.63 460.25 264.17 100.20 100.24 321.8 663.16 2009-5-21 8.32 24 2.2 0.73 4.4 1400.78 366.12 312.81 363.36 240.15 100.20 97.2 218.8 650.6 2009-6-21 8.08 12 / 0.88 5.11 1012.09 320.36 262.76 265.88 132.08 80.16 69.86 143.8 488 Total 88.35 359 41.4 12.23 45.85 13392.08 4865.91 4289.36 4608.08 3901.95 1056.89 1053.08 3644.18 6981.56 Average Value
8.03 32.64 4.14 1.11 4.59 1674.01 442.36 389.94 418.92 354.72 96.08 95.73 331.29 634.69
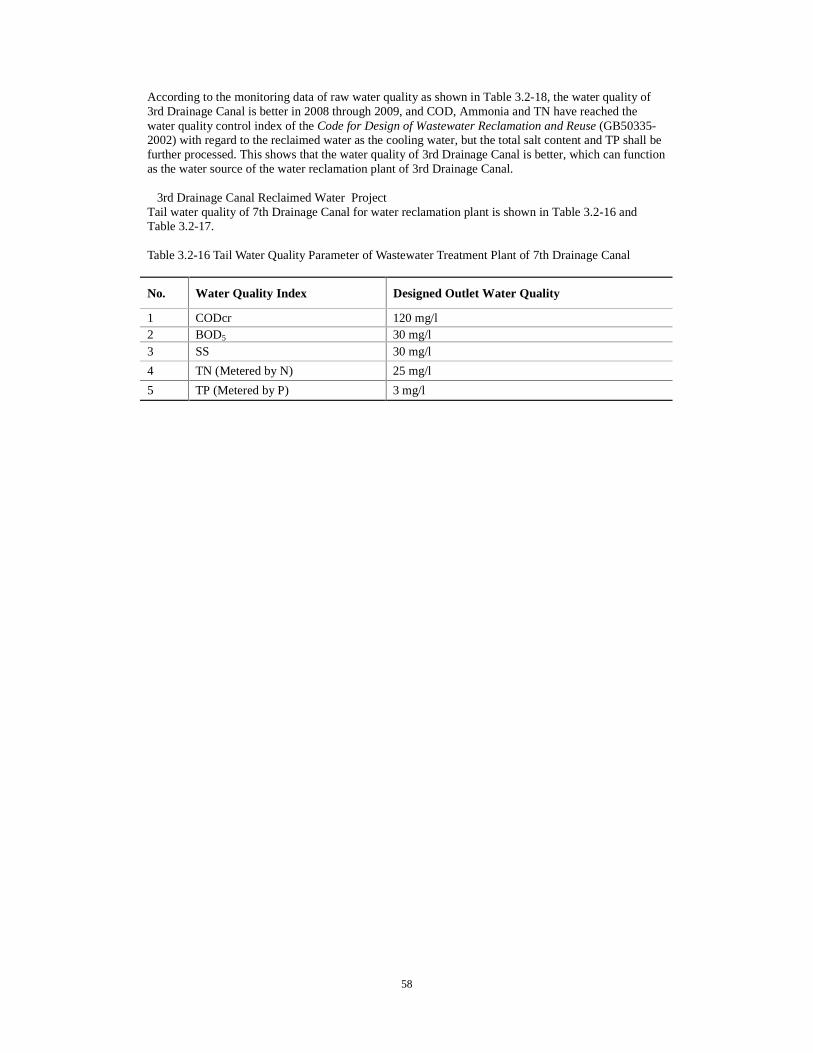
58
According to the monitoring data of raw water quality as shown in Table 3.2-18, the water quality of 3rd Drainage Canal is better in 2008 through 2009, and COD, Ammonia and TN have reached the water quality control index of the Code for Design of Wastewater Reclamation and Reuse (GB50335-2002) with regard to the reclaimed water as the cooling water, but the total salt content and TP shall be further processed. This shows that the water quality of 3rd Drainage Canal is better, which can function as the water source of the water reclamation plant of 3rd Drainage Canal. �3rd Drainage Canal Reclaimed Water Project Tail water quality of 7th Drainage Canal for water reclamation plant is shown in Table 3.2-16 and Table 3.2-17. Table 3.2-16 Tail Water Quality Parameter of Wastewater Treatment Plant of 7th Drainage Canal
No. Water Quality Index Designed Outlet Water Quality
1 CODcr 120 mg/l 2 BOD5 30 mg/l 3 SS 30 mg/l
4 TN (Metered by N) 25 mg/l
5 TP (Metered by P) 3 mg/l
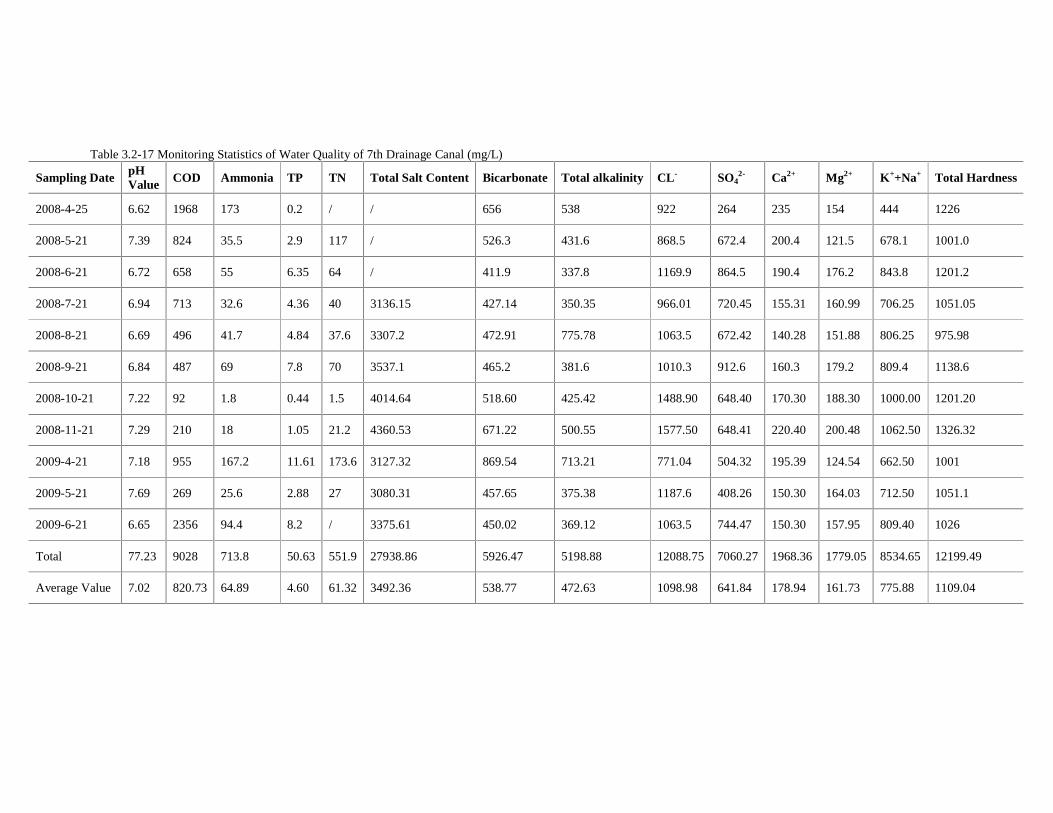
Table 3.2-17 Monitoring Statistics of Water Quality of 7th Drainage Canal (mg/L)
Sampling Date pH Value COD Ammonia TP TN Total Salt Content Bicarbonate Total alkalinity CL- SO4
2- Ca2+ Mg2+ K++Na+ Total Hardness
2008-4-25 6.62 1968 173 0.2 / / 656 538 922 264 235 154 444 1226
2008-5-21 7.39 824 35.5 2.9 117 / 526.3 431.6 868.5 672.4 200.4 121.5 678.1 1001.0
2008-6-21 6.72 658 55 6.35 64 / 411.9 337.8 1169.9 864.5 190.4 176.2 843.8 1201.2
2008-7-21 6.94 713 32.6 4.36 40 3136.15 427.14 350.35 966.01 720.45 155.31 160.99 706.25 1051.05
2008-8-21 6.69 496 41.7 4.84 37.6 3307.2 472.91 775.78 1063.5 672.42 140.28 151.88 806.25 975.98
2008-9-21 6.84 487 69 7.8 70 3537.1 465.2 381.6 1010.3 912.6 160.3 179.2 809.4 1138.6
2008-10-21 7.22 92 1.8 0.44 1.5 4014.64 518.60 425.42 1488.90 648.40 170.30 188.30 1000.00 1201.20
2008-11-21 7.29 210 18 1.05 21.2 4360.53 671.22 500.55 1577.50 648.41 220.40 200.48 1062.50 1326.32
2009-4-21 7.18 955 167.2 11.61 173.6 3127.32 869.54 713.21 771.04 504.32 195.39 124.54 662.50 1001
2009-5-21 7.69 269 25.6 2.88 27 3080.31 457.65 375.38 1187.6 408.26 150.30 164.03 712.50 1051.1
2009-6-21 6.65 2356 94.4 8.2 / 3375.61 450.02 369.12 1063.5 744.47 150.30 157.95 809.40 1026
Total 77.23 9028 713.8 50.63 551.9 27938.86 5926.47 5198.88 12088.75 7060.27 1968.36 1779.05 8534.65 12199.49
Average Value 7.02 820.73 64.89 4.60 61.32 3492.36 538.77 472.63 1098.98 641.84 178.94 161.73 775.88 1109.04
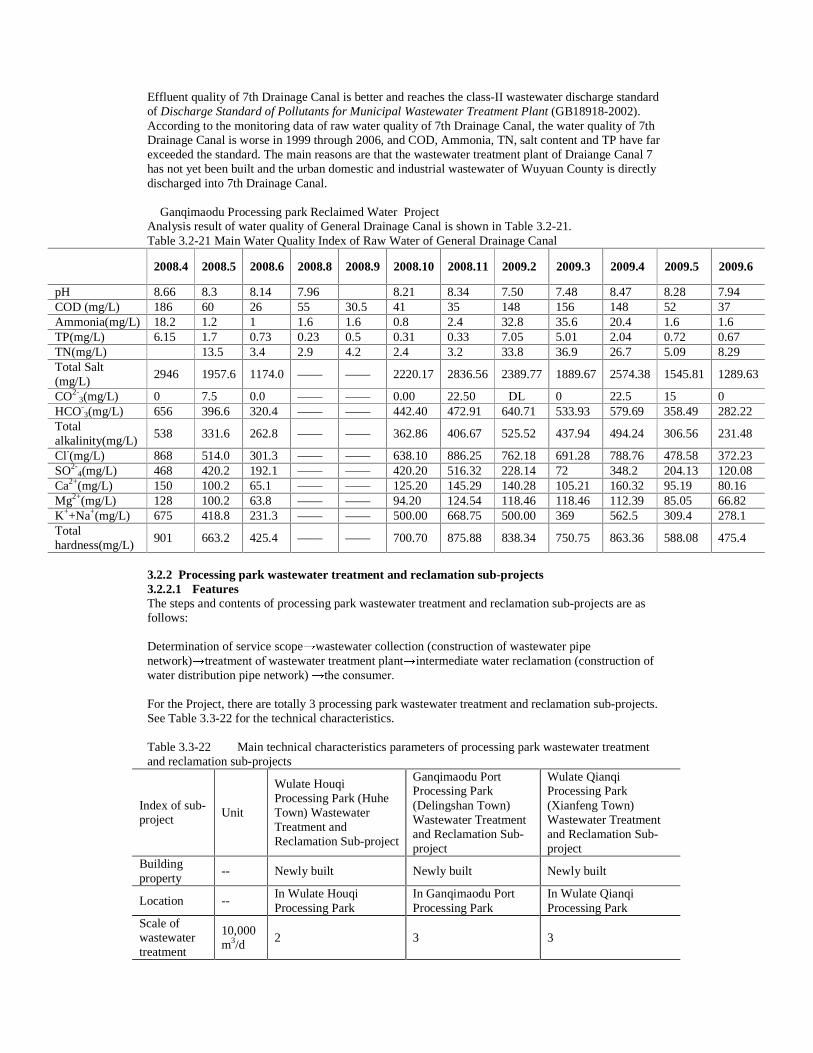
Effluent quality of 7th Drainage Canal is better and reaches the class-II wastewater discharge standard of Discharge Standard of Pollutants for Municipal Wastewater Treatment Plant (GB18918-2002). According to the monitoring data of raw water quality of 7th Drainage Canal, the water quality of 7th Drainage Canal is worse in 1999 through 2006, and COD, Ammonia, TN, salt content and TP have far exceeded the standard. The main reasons are that the wastewater treatment plant of Draiange Canal 7 has not yet been built and the urban domestic and industrial wastewater of Wuyuan County is directly discharged into 7th Drainage Canal. �Ganqimaodu Processing park Reclaimed Water Project Analysis result of water quality of General Drainage Canal is shown in Table 3.2-21. Table 3.2-21 Main Water Quality Index of Raw Water of General Drainage Canal
2008.4 2008.5 2008.6 2008.8 2008.9 2008.10 2008.11 2009.2 2009.3 2009.4 2009.5 2009.6
pH 8.66 8.3 8.14 7.96 8.21 8.34 7.50 7.48 8.47 8.28 7.94 COD (mg/L) 186 60 26 55 30.5 41 35 148 156 148 52 37 Ammonia(mg/L) 18.2 1.2 1 1.6 1.6 0.8 2.4 32.8 35.6 20.4 1.6 1.6 TP(mg/L) 6.15 1.7 0.73 0.23 0.5 0.31 0.33 7.05 5.01 2.04 0.72 0.67 TN(mg/L) 13.5 3.4 2.9 4.2 2.4 3.2 33.8 36.9 26.7 5.09 8.29 Total Salt (mg/L)
2946 1957.6 1174.0 —— —— 2220.17 2836.56 2389.77 1889.67 2574.38 1545.81 1289.63
CO2-3(mg/L) 0 7.5 0.0 —— —— 0.00 22.50 �DL 0 22.5 15 0
HCO-3(mg/L) 656 396.6 320.4 —— —— 442.40 472.91 640.71 533.93 579.69 358.49 282.22
Total alkalinity(mg/L)
538 331.6 262.8 —— —— 362.86 406.67 525.52 437.94 494.24 306.56 231.48
Cl-(mg/L) 868 514.0 301.3 —— —— 638.10 886.25 762.18 691.28 788.76 478.58 372.23 SO2-
4(mg/L) 468 420.2 192.1 —— —— 420.20 516.32 228.14 72 348.2 204.13 120.08 Ca2+(mg/L) 150 100.2 65.1 —— —— 125.20 145.29 140.28 105.21 160.32 95.19 80.16 Mg2+(mg/L) 128 100.2 63.8 —— —— 94.20 124.54 118.46 118.46 112.39 85.05 66.82 K++Na+(mg/L) 675 418.8 231.3 —— —— 500.00 668.75 500.00 369 562.5 309.4 278.1 Total hardness(mg/L)
901 663.2 425.4 —— —— 700.70 875.88 838.34 750.75 863.36 588.08 475.4
3.2.2 Processing park wastewater treatment and reclamation sub-projects 3.2.2.1 Features The steps and contents of processing park wastewater treatment and reclamation sub-projects are as follows: Determination of service scope wastewater collection (construction of wastewater pipe network) treatment of wastewater treatment plant intermediate water reclamation (construction of water distribution pipe network) the consumer. For the Project, there are totally 3 processing park wastewater treatment and reclamation sub-projects. See Table 3.3-22 for the technical characteristics. Table 3.3-22 Main technical characteristics parameters of processing park wastewater treatment and reclamation sub-projects
Index of sub-project
Unit
Wulate Houqi Processing Park (Huhe Town) Wastewater Treatment and Reclamation Sub-project
Ganqimaodu Port Processing Park (Delingshan Town) Wastewater Treatment and Reclamation Sub-project
Wulate Qianqi Processing Park (Xianfeng Town) Wastewater Treatment and Reclamation Sub-project
Building property
-- Newly built Newly built Newly built
Location -- In Wulate Houqi Processing Park
In Ganqimaodu Port Processing Park
In Wulate Qianqi Processing Park
Scale of wastewater treatment
10,000m3/d
2 3 3
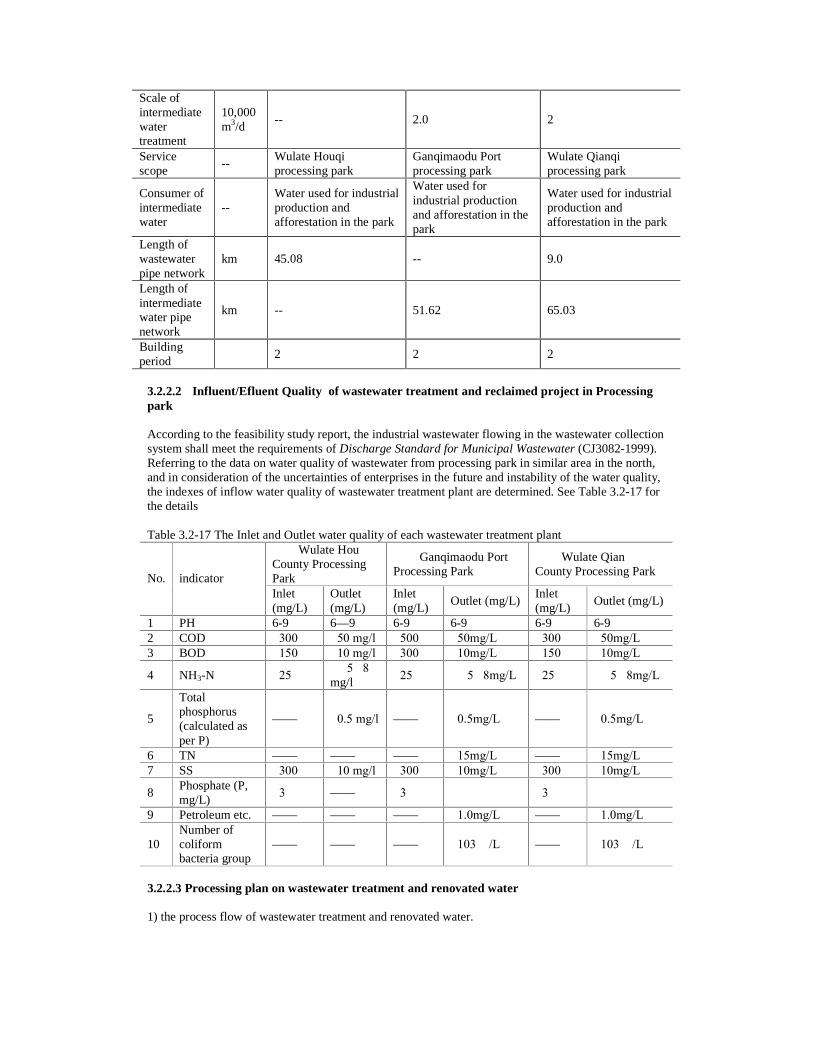
Scale of intermediate water treatment
10,000m3/d
-- 2.0 2
Service scope
-- Wulate Houqi processing park
Ganqimaodu Port processing park
Wulate Qianqi processing park
Consumer of intermediate water
-- Water used for industrial production and afforestation in the park
Water used for industrial production and afforestation in the park
Water used for industrial production and afforestation in the park
Length of wastewater pipe network
km 45.08 -- 9.0
Length of intermediate water pipe network
km -- 51.62 65.03
Building period
2 2 2
3.2.2.2 Influent/Efluent Quality of wastewater treatment and reclaimed project in Processing park According to the feasibility study report, the industrial wastewater flowing in the wastewater collection system shall meet the requirements of Discharge Standard for Municipal Wastewater (CJ3082-1999). Referring to the data on water quality of wastewater from processing park in similar area in the north, and in consideration of the uncertainties of enterprises in the future and instability of the water quality, the indexes of inflow water quality of wastewater treatment plant are determined. See Table 3.2-17 for the details Table 3.2-17 The Inlet and Outlet water quality of each wastewater treatment plant
Wulate Hou County Processing Park
Ganqimaodu Port Processing Park
Wulate Qian County Processing Park
No. indicator Inlet (mg/L)
Outlet (mg/L)
Inlet (mg/L)
Outlet (mg/L) Inlet (mg/L)
Outlet (mg/L)
1 PH 6-9 6—9 6-9 6-9 6-9 6-9 2 COD �300 �50 mg/l �500 �50mg/L �300 �50mg/L 3 BOD �150 �10 mg/l �300 �10mg/L �150 �10mg/L
4 NH3-N �25 ��5�8 mg/l
�25 ��5�8mg/L �25 ��5�8mg/L
5
Total phosphorus (calculated as per P)
—— �0.5 mg/l —— �0.5mg/L —— �0.5mg/L
6 TN —— —— —— �15mg/L —— �15mg/L 7 SS �300 �10 mg/l �300 �10mg/L �300 �10mg/L
8 Phosphate (P, mg/L)
�3 —— �3 �3
9 Petroleum etc. —— —— —— �1.0mg/L —— �1.0mg/L
10 Number of coliform bacteria group
—— —— —— �103 �/L —— �103 �/L
3.2.2.3 Processing plan on wastewater treatment and renovated water 1) the process flow of wastewater treatment and renovated water.
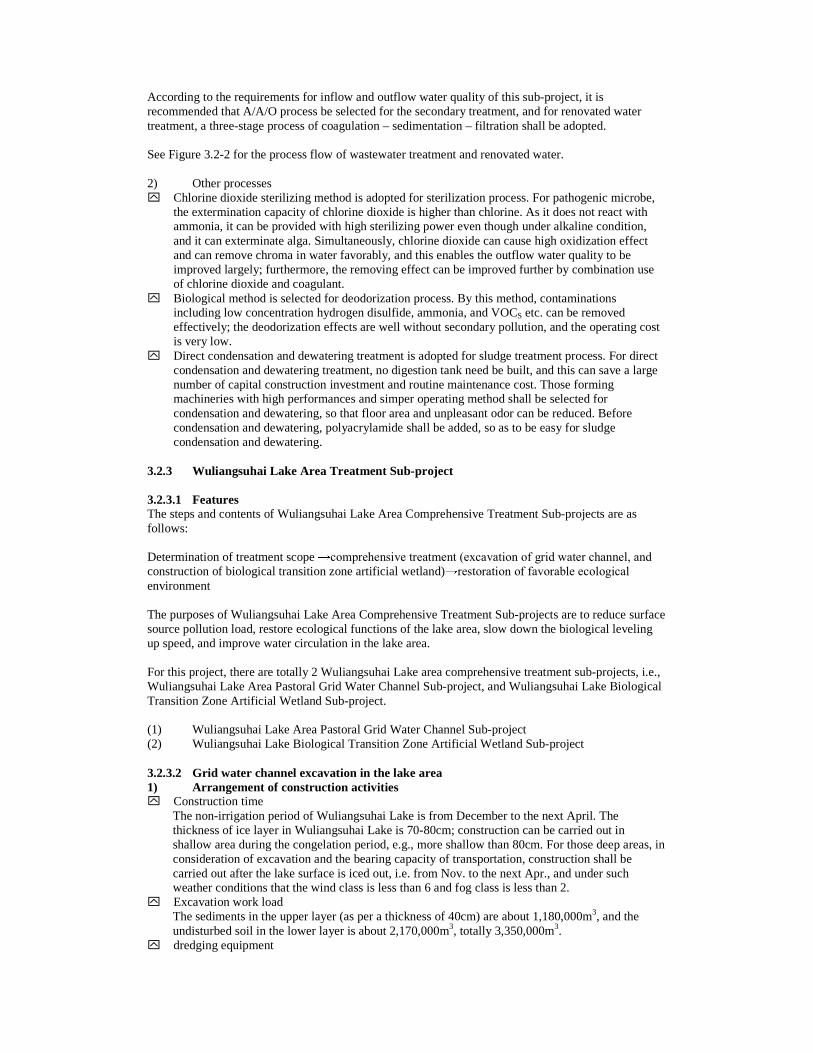
According to the requirements for inflow and outflow water quality of this sub-project, it is recommended that A/A/O process be selected for the secondary treatment, and for renovated water treatment, a three-stage process of coagulation – sedimentation – filtration shall be adopted. See Figure 3.2-2 for the process flow of wastewater treatment and renovated water. 2) Other processes y� Chlorine dioxide sterilizing method is adopted for sterilization process. For pathogenic microbe,
the extermination capacity of chlorine dioxide is higher than chlorine. As it does not react with ammonia, it can be provided with high sterilizing power even though under alkaline condition, and it can exterminate alga. Simultaneously, chlorine dioxide can cause high oxidization effect and can remove chroma in water favorably, and this enables the outflow water quality to be improved largely; furthermore, the removing effect can be improved further by combination use of chlorine dioxide and coagulant.
y� Biological method is selected for deodorization process. By this method, contaminations including low concentration hydrogen disulfide, ammonia, and VOCS etc. can be removed effectively; the deodorization effects are well without secondary pollution, and the operating cost is very low.
y� Direct condensation and dewatering treatment is adopted for sludge treatment process. For direct condensation and dewatering treatment, no digestion tank need be built, and this can save a large number of capital construction investment and routine maintenance cost. Those forming machineries with high performances and simper operating method shall be selected for condensation and dewatering, so that floor area and unpleasant odor can be reduced. Before condensation and dewatering, polyacrylamide shall be added, so as to be easy for sludge condensation and dewatering.
3.2.3 Wuliangsuhai Lake Area Treatment Sub-project 3.2.3.1 Features The steps and contents of Wuliangsuhai Lake Area Comprehensive Treatment Sub-projects are as follows: Determination of treatment scope comprehensive treatment (excavation of grid water channel, and construction of biological transition zone artificial wetland) restoration of favorable ecological environment The purposes of Wuliangsuhai Lake Area Comprehensive Treatment Sub-projects are to reduce surface source pollution load, restore ecological functions of the lake area, slow down the biological leveling up speed, and improve water circulation in the lake area. For this project, there are totally 2 Wuliangsuhai Lake area comprehensive treatment sub-projects, i.e., Wuliangsuhai Lake Area Pastoral Grid Water Channel Sub-project, and Wuliangsuhai Lake Biological Transition Zone Artificial Wetland Sub-project. (1) Wuliangsuhai Lake Area Pastoral Grid Water Channel Sub-project (2) Wuliangsuhai Lake Biological Transition Zone Artificial Wetland Sub-project 3.2.3.2 Grid water channel excavation in the lake area 1) Arrangement of construction activities y� Construction time
The non-irrigation period of Wuliangsuhai Lake is from December to the next April. The thickness of ice layer in Wuliangsuhai Lake is 70-80cm; construction can be carried out in shallow area during the congelation period, e.g., more shallow than 80cm. For those deep areas, in consideration of excavation and the bearing capacity of transportation, construction shall be carried out after the lake surface is iced out, i.e. from Nov. to the next Apr., and under such weather conditions that the wind class is less than 6 and fog class is less than 2.
y� Excavation work load The sediments in the upper layer (as per a thickness of 40cm) are about 1,180,000m3, and the undisturbed soil in the lower layer is about 2,170,000m3, totally 3,350,000m3.
y� dredging equipment
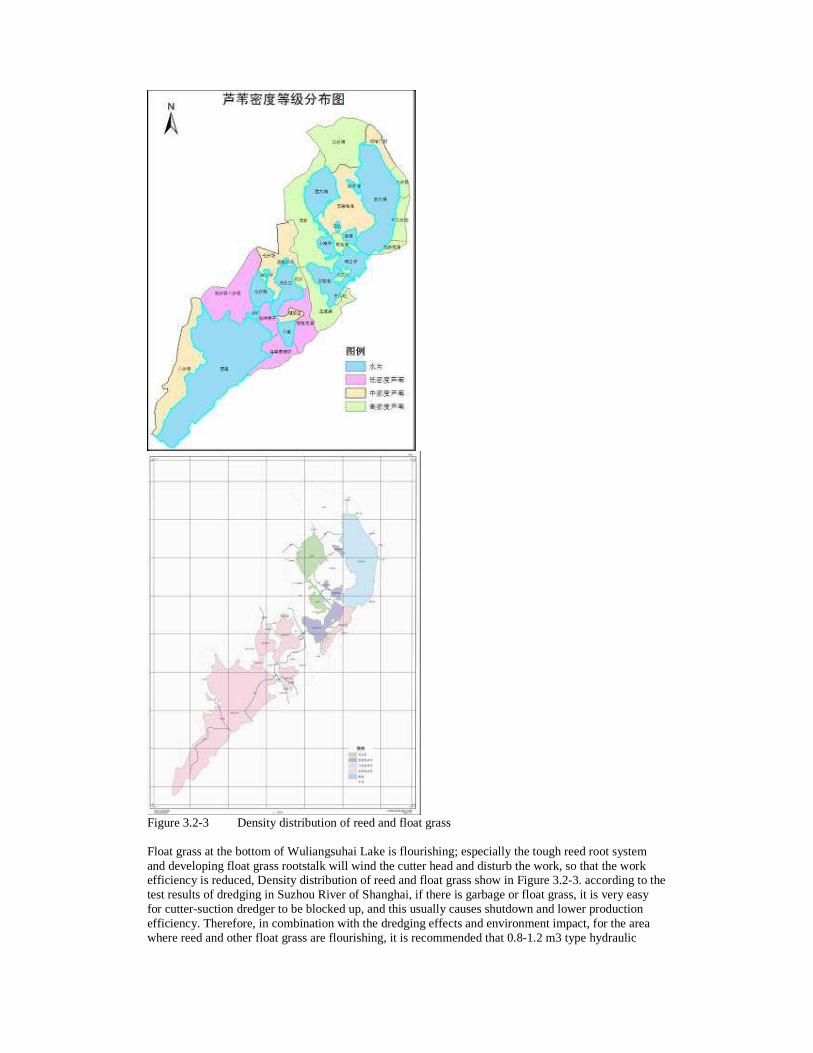
Figure 3.2-3 Density distribution of reed and float grass Float grass at the bottom of Wuliangsuhai Lake is flourishing; especially the tough reed root system and developing float grass rootstalk will wind the cutter head and disturb the work, so that the work efficiency is reduced, Density distribution of reed and float grass show in Figure 3.2-3. according to the test results of dredging in Suzhou River of Shanghai, if there is garbage or float grass, it is very easy for cutter-suction dredger to be blocked up, and this usually causes shutdown and lower production efficiency. Therefore, in combination with the dredging effects and environment impact, for the area where reed and other float grass are flourishing, it is recommended that 0.8-1.2 m3 type hydraulic
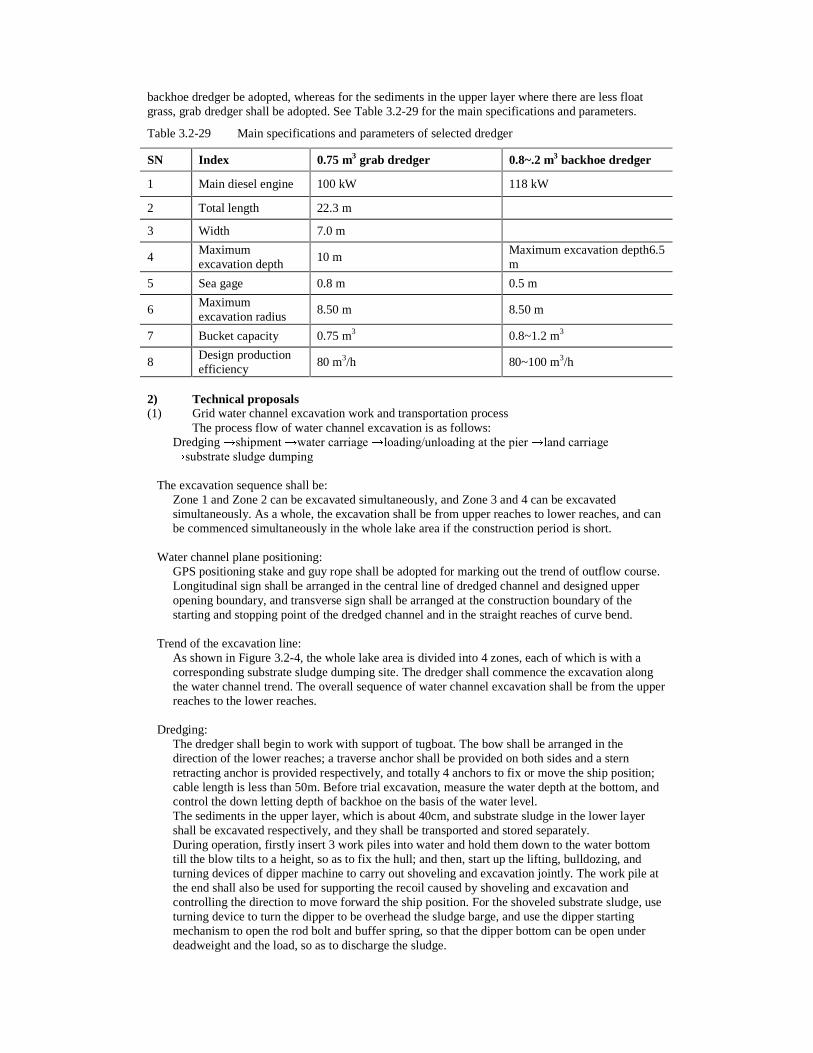
backhoe dredger be adopted, whereas for the sediments in the upper layer where there are less float grass, grab dredger shall be adopted. See Table 3.2-29 for the main specifications and parameters.
Table 3.2-29 Main specifications and parameters of selected dredger
SN Index 0.75 m3 grab dredger 0.8~.2 m3 backhoe dredger
1 Main diesel engine 100 kW 118 kW
2 Total length 22.3 m
3 Width 7.0 m
4 Maximum excavation depth
10 m Maximum excavation depth6.5 m
5 Sea gage 0.8 m 0.5 m
6 Maximum excavation radius
8.50 m 8.50 m
7 Bucket capacity 0.75 m3 0.8~1.2 m3
8 Design production efficiency
80 m3/h 80~100 m3/h
2) Technical proposals (1) Grid water channel excavation work and transportation process � The process flow of water channel excavation is as follows:
Dredging shipment water carriage loading/unloading at the pier land carriage substrate sludge dumping
�The excavation sequence shall be:
Zone 1 and Zone 2 can be excavated simultaneously, and Zone 3 and 4 can be excavated simultaneously. As a whole, the excavation shall be from upper reaches to lower reaches, and can be commenced simultaneously in the whole lake area if the construction period is short.
�Water channel plane positioning:
GPS positioning stake and guy rope shall be adopted for marking out the trend of outflow course. Longitudinal sign shall be arranged in the central line of dredged channel and designed upper opening boundary, and transverse sign shall be arranged at the construction boundary of the starting and stopping point of the dredged channel and in the straight reaches of curve bend.
�Trend of the excavation line:
As shown in Figure 3.2-4, the whole lake area is divided into 4 zones, each of which is with a corresponding substrate sludge dumping site. The dredger shall commence the excavation along the water channel trend. The overall sequence of water channel excavation shall be from the upper reaches to the lower reaches.
�Dredging:
The dredger shall begin to work with support of tugboat. The bow shall be arranged in the direction of the lower reaches; a traverse anchor shall be provided on both sides and a stern retracting anchor is provided respectively, and totally 4 anchors to fix or move the ship position; cable length is less than 50m. Before trial excavation, measure the water depth at the bottom, and control the down letting depth of backhoe on the basis of the water level. The sediments in the upper layer, which is about 40cm, and substrate sludge in the lower layer shall be excavated respectively, and they shall be transported and stored separately. During operation, firstly insert 3 work piles into water and hold them down to the water bottom till the blow tilts to a height, so as to fix the hull; and then, start up the lifting, bulldozing, and turning devices of dipper machine to carry out shoveling and excavation jointly. The work pile at the end shall also be used for supporting the recoil caused by shoveling and excavation and controlling the direction to move forward the ship position. For the shoveled substrate sludge, use turning device to turn the dipper to be overhead the sludge barge, and use the dipper starting mechanism to open the rod bolt and buffer spring, so that the dipper bottom can be open under deadweight and the load, so as to discharge the sludge.
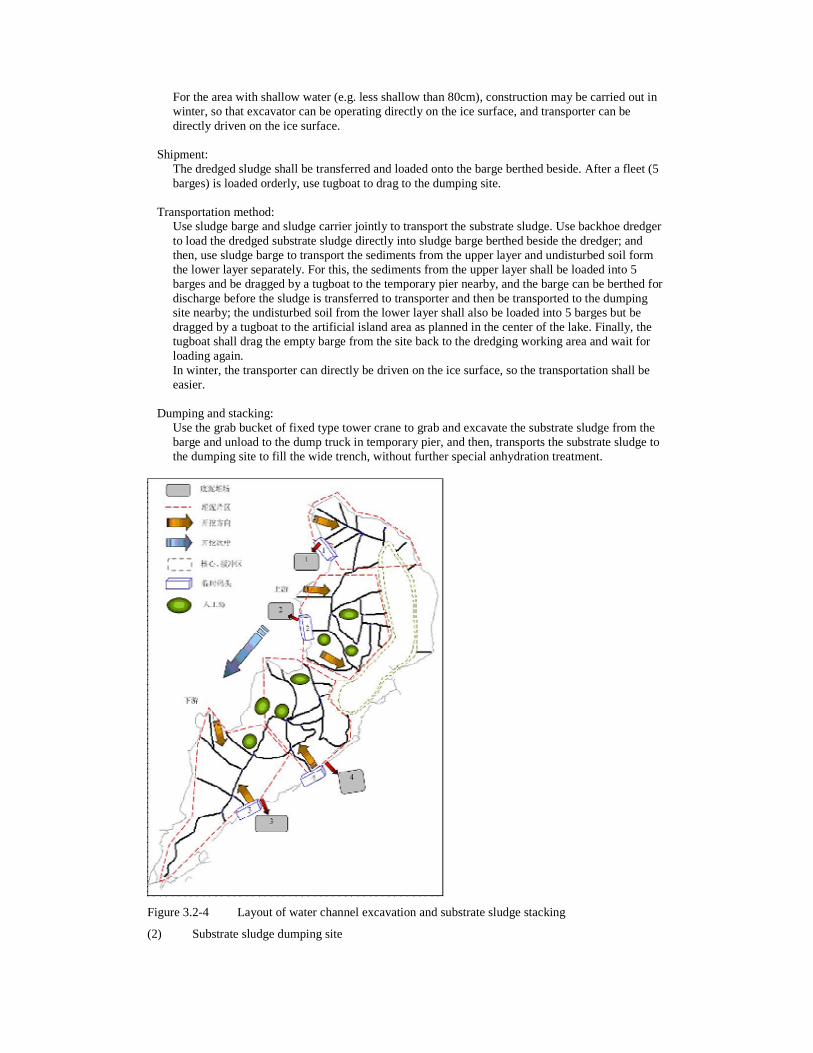
For the area with shallow water (e.g. less shallow than 80cm), construction may be carried out in winter, so that excavator can be operating directly on the ice surface, and transporter can be directly driven on the ice surface.
�Shipment:
The dredged sludge shall be transferred and loaded onto the barge berthed beside. After a fleet (5 barges) is loaded orderly, use tugboat to drag to the dumping site.
�Transportation method:
Use sludge barge and sludge carrier jointly to transport the substrate sludge. Use backhoe dredger to load the dredged substrate sludge directly into sludge barge berthed beside the dredger; and then, use sludge barge to transport the sediments from the upper layer and undisturbed soil form the lower layer separately. For this, the sediments from the upper layer shall be loaded into 5 barges and be dragged by a tugboat to the temporary pier nearby, and the barge can be berthed for discharge before the sludge is transferred to transporter and then be transported to the dumping site nearby; the undisturbed soil from the lower layer shall also be loaded into 5 barges but be dragged by a tugboat to the artificial island area as planned in the center of the lake. Finally, the tugboat shall drag the empty barge from the site back to the dredging working area and wait for loading again. In winter, the transporter can directly be driven on the ice surface, so the transportation shall be easier.
�Dumping and stacking:
Use the grab bucket of fixed type tower crane to grab and excavate the substrate sludge from the barge and unload to the dump truck in temporary pier, and then, transports the substrate sludge to the dumping site to fill the wide trench, without further special anhydration treatment.
Figure 3.2-4 Layout of water channel excavation and substrate sludge stacking
(2) Substrate sludge dumping site
The substrate sludge in the upper layer of the lake bottom is mainly sediments, and the area is about 1,180,000m3. After excavation, the substrate sludge from this part shall be transported to 4 dumping sites for stacking treatment. The substrate sludge in the lower layer is mainly unpolluted soil, and the area is about 2,170,000m3. It shall mainly be used for stacking of artificial island in the lake area and shall not be transported outwards. According to the tourism plan on Wuliangsuhai Lake, many artificial islands will be built up in the lake area. see Figure 3.2-4 for the details of artificial islands. � Location of substrate sludge dumping site According to the space around Wuliangsuhai Lake area, earthwork of water channel in the lake area and the space distribution, 4 substrate sludge dumping sites shall be arranged. See Figure 3.2-4 and Table 3.2-19 for the details.
Table 3.2-19 Details of substrate sludge dumping sites
SN OF dumping site
Name Location Floor area (Mu)
Capacity (10,000m2)
1 DawanggedanDumping Site
Near Dawanggedan (40°02’34’’N, 108°50’31”E)
150 15
2 Beilongtai Dumping Site
Near Beilongtai (40°57’39’’N, 108°50’19”E)
150 15
3 Huihuigou Dumping Site
On the south bank in the lake area, near Huihuigou (40°49’53’’N, 108°47’04”E)
400 40
4 Yuchang Dumping site In the northeast of Wuliangsuhai Lake (40°52’03’’N, 108°51’35”E)
500 50
Total 1200 120 Dumping Site 1 is located in the space near Dawanggedan between Reed Field 4 (Military Farm) and the lake wall of the large lake, and the floor area is about 150Mu; Dumping Site 2 is located in the space between Sifenchang and Beilongtai, and the floor area is about 150Mu; Dumping Site 3 is located in the space on the south bank of Wuliangsuhai Lake and near Huihuigou, and the floor area is 400Mu; Dumping Site 4 is located in the space in the northeast of Wuliangsuhai Lake Fishing Ground, and the floor area is 500Mu. The total area is 1200Mu. Around the 4 substrate sludge dumping sites, there are only a few residents, and little environment impact will be caused. Highways are provided towards the outside, so the traffic conditions are good. � Design for substrate sludge dumping site
The sediments in the upper layer are with high water contents, and they shall be filled and leveled up in wide trench.
y� Dimensions of the wide trench: The trench is 30m wide, and each is 60m long. It shall be excavated locally downwards, and the excavated earthwork shall be used for building dumping site embankment and isolation dam, and then be leveled up. The substrate sludge shall be stacked up to 2m high.
y� Dimensions of embankment and isolation dam: For the embankment, the top width is 4m, outside slope is 1:2.0, and inside slope is 1:1.5; for the inside isolation dam of dumping site, the top width is 3m and slope is 1:1.5.
y� Anti-seepage system: No drainage system shall be arranged in wide trench in the landfill area, and seepage interception ditch shall be excavated around the landfill area; ditch slope shall be provided; the ditch bottom is 1.0m wide, and excavation depth shall be 1.5m. After the filtering water is collected in the effusion well, it shall be pumped to the near reed field or the lake. As the filtering water is actually interstitial water of the substrate sludge, we can analyze the content of dissolvable nutritive matter in the interstitial water. Select 10 points from the distribution map of monitoring points for substrate sludge in the lake area, and analyze the content
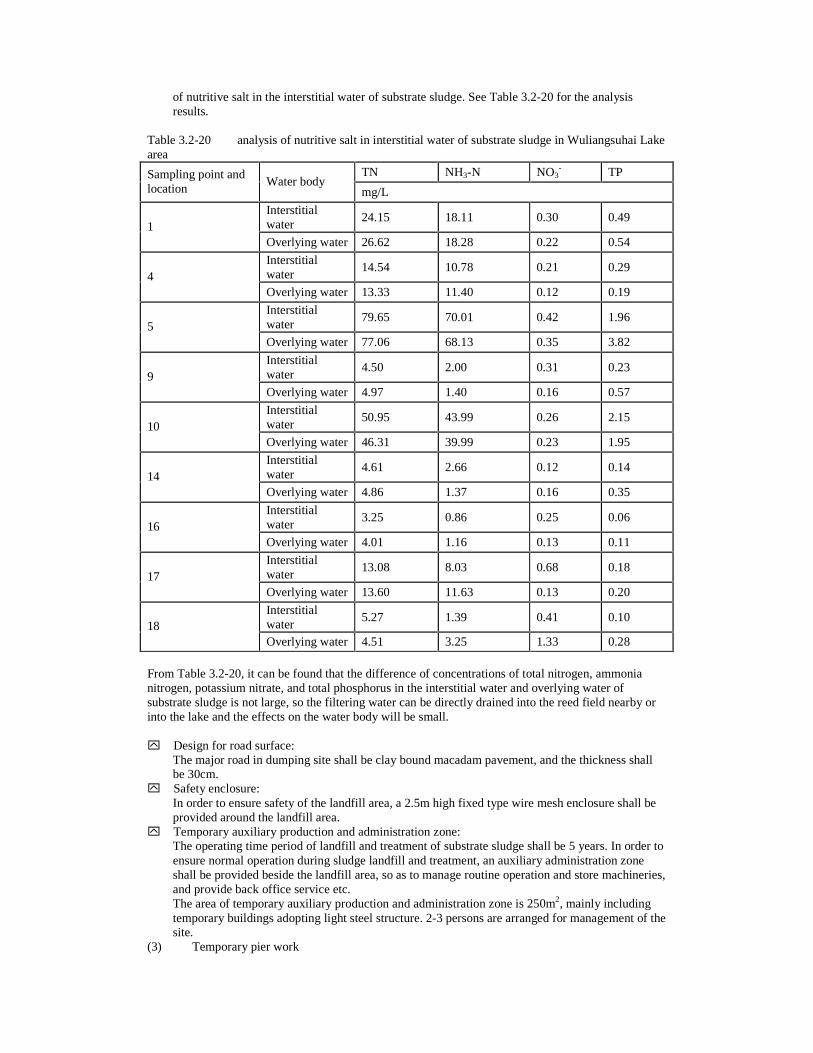
of nutritive salt in the interstitial water of substrate sludge. See Table 3.2-20 for the analysis results.
Table 3.2-20 analysis of nutritive salt in interstitial water of substrate sludge in Wuliangsuhai Lake area
TN NH3-N NO3- TP Sampling point and
location Water body
mg/L
Interstitial water
24.15 18.11 0.30 0.49 1
Overlying water 26.62 18.28 0.22 0.54
Interstitial water
14.54 10.78 0.21 0.29 4
Overlying water 13.33 11.40 0.12 0.19
Interstitial water
79.65 70.01 0.42 1.96 5
Overlying water 77.06 68.13 0.35 3.82
Interstitial water
4.50 2.00 0.31 0.23 9
Overlying water 4.97 1.40 0.16 0.57
Interstitial water
50.95 43.99 0.26 2.15 10
Overlying water 46.31 39.99 0.23 1.95
Interstitial water
4.61 2.66 0.12 0.14 14
Overlying water 4.86 1.37 0.16 0.35
Interstitial water
3.25 0.86 0.25 0.06 16
Overlying water 4.01 1.16 0.13 0.11
Interstitial water
13.08 8.03 0.68 0.18 17
Overlying water 13.60 11.63 0.13 0.20
Interstitial water
5.27 1.39 0.41 0.10 18
Overlying water 4.51 3.25 1.33 0.28
From Table 3.2-20, it can be found that the difference of concentrations of total nitrogen, ammonia nitrogen, potassium nitrate, and total phosphorus in the interstitial water and overlying water of substrate sludge is not large, so the filtering water can be directly drained into the reed field nearby or into the lake and the effects on the water body will be small. y� Design for road surface:
The major road in dumping site shall be clay bound macadam pavement, and the thickness shall be 30cm.
y� Safety enclosure: In order to ensure safety of the landfill area, a 2.5m high fixed type wire mesh enclosure shall be provided around the landfill area.
y� Temporary auxiliary production and administration zone: The operating time period of landfill and treatment of substrate sludge shall be 5 years. In order to ensure normal operation during sludge landfill and treatment, an auxiliary administration zone shall be provided beside the landfill area, so as to manage routine operation and store machineries, and provide back office service etc. The area of temporary auxiliary production and administration zone is 250m2, mainly including temporary buildings adopting light steel structure. 2-3 persons are arranged for management of the site.
(3) Temporary pier work
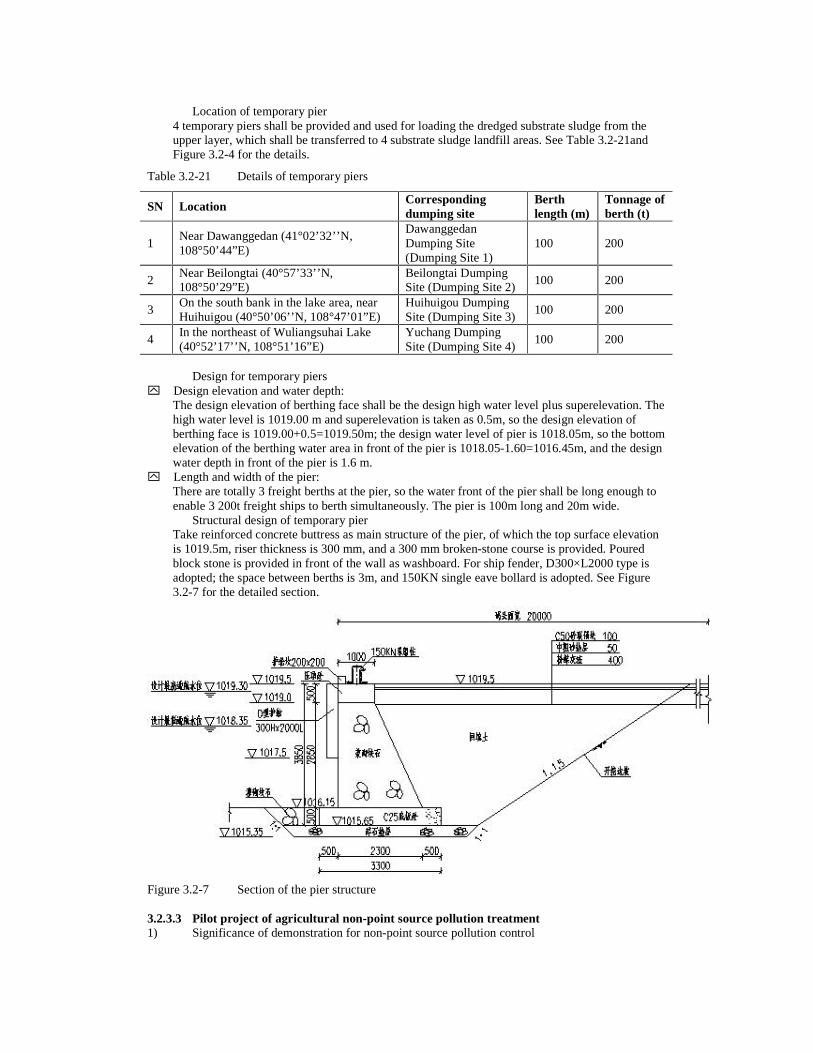
� Location of temporary pier
4 temporary piers shall be provided and used for loading the dredged substrate sludge from the upper layer, which shall be transferred to 4 substrate sludge landfill areas. See Table 3.2-21and Figure 3.2-4 for the details.
Table 3.2-21 Details of temporary piers
SN Location Corresponding dumping site
Berth length (m)
Tonnage of berth (t)
1 Near Dawanggedan (41°02’32’’N, 108°50’44”E)
Dawanggedan Dumping Site (Dumping Site 1)
100 200
2 Near Beilongtai (40°57’33’’N, 108°50’29”E)
Beilongtai Dumping Site (Dumping Site 2)
100 200
3 On the south bank in the lake area, near Huihuigou (40°50’06’’N, 108°47’01”E)
Huihuigou Dumping Site (Dumping Site 3)
100 200
4 In the northeast of Wuliangsuhai Lake (40°52’17’’N, 108°51’16”E)
Yuchang Dumping Site (Dumping Site 4)
100 200
� Design for temporary piers y� Design elevation and water depth:
The design elevation of berthing face shall be the design high water level plus superelevation. The high water level is 1019.00 m and superelevation is taken as 0.5m, so the design elevation of berthing face is 1019.00+0.5=1019.50m; the design water level of pier is 1018.05m, so the bottom elevation of the berthing water area in front of the pier is 1018.05-1.60=1016.45m, and the design water depth in front of the pier is 1.6 m.
y� Length and width of the pier: There are totally 3 freight berths at the pier, so the water front of the pier shall be long enough to enable 3 200t freight ships to berth simultaneously. The pier is 100m long and 20m wide.
� Structural design of temporary pier Take reinforced concrete buttress as main structure of the pier, of which the top surface elevation is 1019.5m, riser thickness is 300 mm, and a 300 mm broken-stone course is provided. Poured block stone is provided in front of the wall as washboard. For ship fender, D300×L2000 type is adopted; the space between berths is 3m, and 150KN single eave bollard is adopted. See Figure 3.2-7 for the detailed section.
Figure 3.2-7 Section of the pier structure 3.2.3.3 Pilot project of agricultural non-point source pollution treatment 1) Significance of demonstration for non-point source pollution control
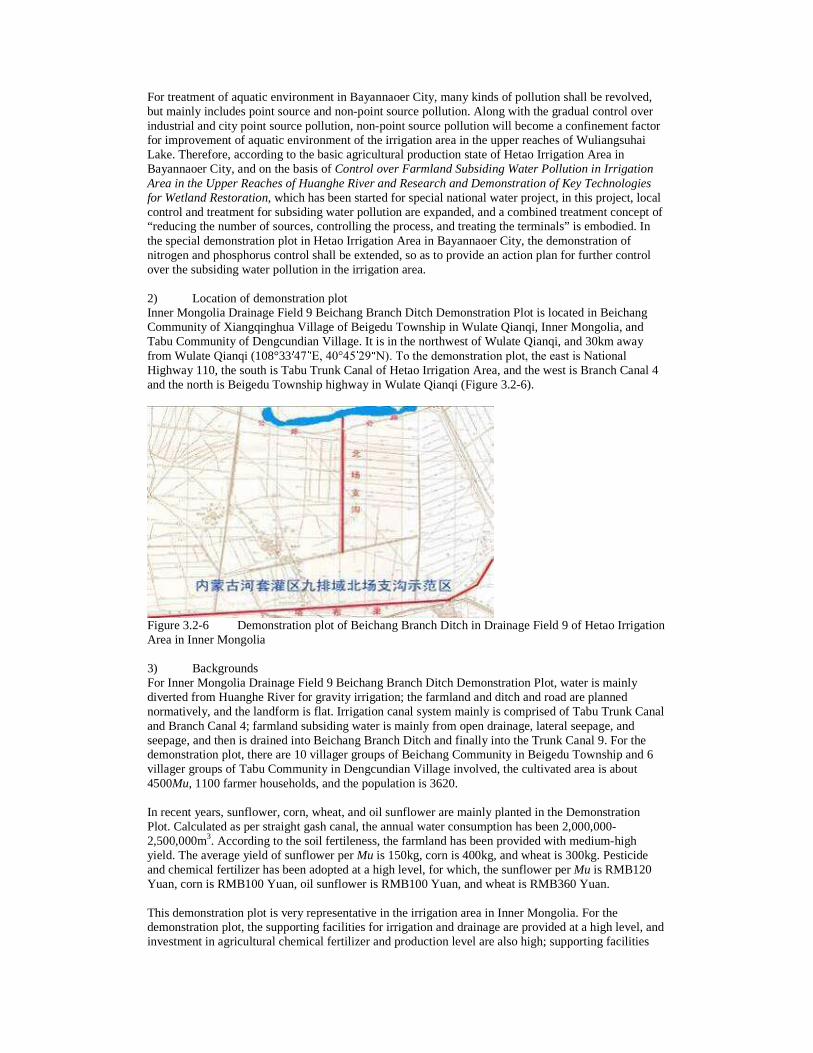
For treatment of aquatic environment in Bayannaoer City, many kinds of pollution shall be revolved, but mainly includes point source and non-point source pollution. Along with the gradual control over industrial and city point source pollution, non-point source pollution will become a confinement factor for improvement of aquatic environment of the irrigation area in the upper reaches of Wuliangsuhai Lake. Therefore, according to the basic agricultural production state of Hetao Irrigation Area in Bayannaoer City, and on the basis of Control over Farmland Subsiding Water Pollution in Irrigation Area in the Upper Reaches of Huanghe River and Research and Demonstration of Key Technologies for Wetland Restoration, which has been started for special national water project, in this project, local control and treatment for subsiding water pollution are expanded, and a combined treatment concept of “reducing the number of sources, controlling the process, and treating the terminals” is embodied. In the special demonstration plot in Hetao Irrigation Area in Bayannaoer City, the demonstration of nitrogen and phosphorus control shall be extended, so as to provide an action plan for further control over the subsiding water pollution in the irrigation area. 2) Location of demonstration plot Inner Mongolia Drainage Field 9 Beichang Branch Ditch Demonstration Plot is located in Beichang Community of Xiangqinghua Village of Beigedu Township in Wulate Qianqi, Inner Mongolia, and Tabu Community of Dengcundian Village. It is in the northwest of Wulate Qianqi, and 30km away from Wulate Qianqi (108°33 47 E, 40°45 29 N). To the demonstration plot, the east is National Highway 110, the south is Tabu Trunk Canal of Hetao Irrigation Area, and the west is Branch Canal 4 and the north is Beigedu Township highway in Wulate Qianqi (Figure 3.2-6).
Figure 3.2-6 Demonstration plot of Beichang Branch Ditch in Drainage Field 9 of Hetao Irrigation Area in Inner Mongolia 3) Backgrounds For Inner Mongolia Drainage Field 9 Beichang Branch Ditch Demonstration Plot, water is mainly diverted from Huanghe River for gravity irrigation; the farmland and ditch and road are planned normatively, and the landform is flat. Irrigation canal system mainly is comprised of Tabu Trunk Canal and Branch Canal 4; farmland subsiding water is mainly from open drainage, lateral seepage, and seepage, and then is drained into Beichang Branch Ditch and finally into the Trunk Canal 9. For the demonstration plot, there are 10 villager groups of Beichang Community in Beigedu Township and 6 villager groups of Tabu Community in Dengcundian Village involved, the cultivated area is about 4500Mu, 1100 farmer households, and the population is 3620. In recent years, sunflower, corn, wheat, and oil sunflower are mainly planted in the Demonstration Plot. Calculated as per straight gash canal, the annual water consumption has been 2,000,000-2,500,000m3. According to the soil fertileness, the farmland has been provided with medium-high yield. The average yield of sunflower per Mu is 150kg, corn is 400kg, and wheat is 300kg. Pesticide and chemical fertilizer has been adopted at a high level, for which, the sunflower per Mu is RMB120 Yuan, corn is RMB100 Yuan, oil sunflower is RMB100 Yuan, and wheat is RMB360 Yuan. This demonstration plot is very representative in the irrigation area in Inner Mongolia. For the demonstration plot, the supporting facilities for irrigation and drainage are provided at a high level, and investment in agricultural chemical fertilizer and production level are also high; supporting facilities
for channels at lower levels are provided well, and the gradient ratio of channel is 1/6000. Therefore, the demonstration plot shall be an ideal site for research of the features of farmland subsiding water pollution. 4) Contents of non-point source control demonstration and promotion Control over agricultural source pollution in the irrigation area is a non-point source control system project, which shall be carried out by stages and be promoted from experiment unit to the whole irrigation area. For the demonstration, the key contents include demonstration and promotion of key technologies for nitrogen and phosphorus control for the main crops on the basis of reduction of nitrogen and phosphorus pollution in farmland subsiding water, and that of the integrating technologies for wetland restoration polluted by farmland subsiding water in the irrigation area. The promotion of controlling technologies for non-point source pollution in the demonstration plot shall be combined in the appropriation budget of World Bank project, and the main contents are as follows: (1) Demonstration of promotion of water saving technologies to reduce running off of nitrogen and phosphorus On the basis of the irrigation management technology optimizing water saving in the demonstration plot, utilize laser grader to level up and divide the farmland into blocks to optimize water saving technology, so as to reduce farmland subsiding water amount and reduce funning off of nitrogen and phosphorus contamination and farmland subsiding water pollution. The area is 4500Mu. (2) Demonstration of fertilization technology For the representative crops in the demonstration plot, under soil determination and fertilizing technologies, utilize advanced fertilizing machines for accurate fertilization and demonstration, so as to reduce the amount of applied fertilizer, improve utilization ratio of chemical fertilizer, and reduce farmland subsiding water pollution caused by running off of nitrogen and phosphorus. The area of accurate fertilization and demonstration by fertilizing machines is 1000Mu, and that artificial fertilization and demonstration for nitrogen and phosphorus control is 200Mu. (3) Economic considerations for farmers The farmers participating in the non-point source pollution in the irrigation area must change the former cultivation, fertilization, irrigation habits but put in more energy, labors, and financial power, so it is necessary for an amount of economic grant to be provided for the farmers. During execution of the project, random investigation should be carried out for the farmers, who are totally 150 households, and questionnaires of fertilization and feedback sheets of compounded fertilizing farmland plot management and record shall be prepared, which are totally 1200 sheets; additionally, sign board shall also be made to provide for the investigated farmer household. Furthermore, sample 50 households of farmers for evaluation of irrigation water consumption, fertilization, and effects of subsiding water reinjection and crop growing etc. (4) Field investigation and testing Provide field investigation for the demonstration plot, divide sampling units; investigate the basic properties of the sampled plots, production of foregoing crops, and fertilization state etc., and the surface water environment conditions in the demonstration plot; investigate and sample the background value of farmland subsiding water pollution state, and monitor, compare and test the effects data after demonstration. (5) Propaganda and promotion On the basis of doing well technical training, deploy fertilizer supply systematically, distribute the proposal card for fertilizing and subsiding water reinjection, and provide fertilization direction for the farmers, so as to change any unreasonable habit, such as blindly fertilizing, excessive fertilization, or preference for nitrogenous fertilizer, and improve the scientific fertilizing level. According to the farmer fertilization questionnaires, analysis result of soil, and fertilizer demand of crops, develop more than 40000 proposal cards for soil determination and compound fertilization, which shall be distributed by the agricultural technicians and village committees, and be signed by the householders for confirmation after receiving. (6) Technical training
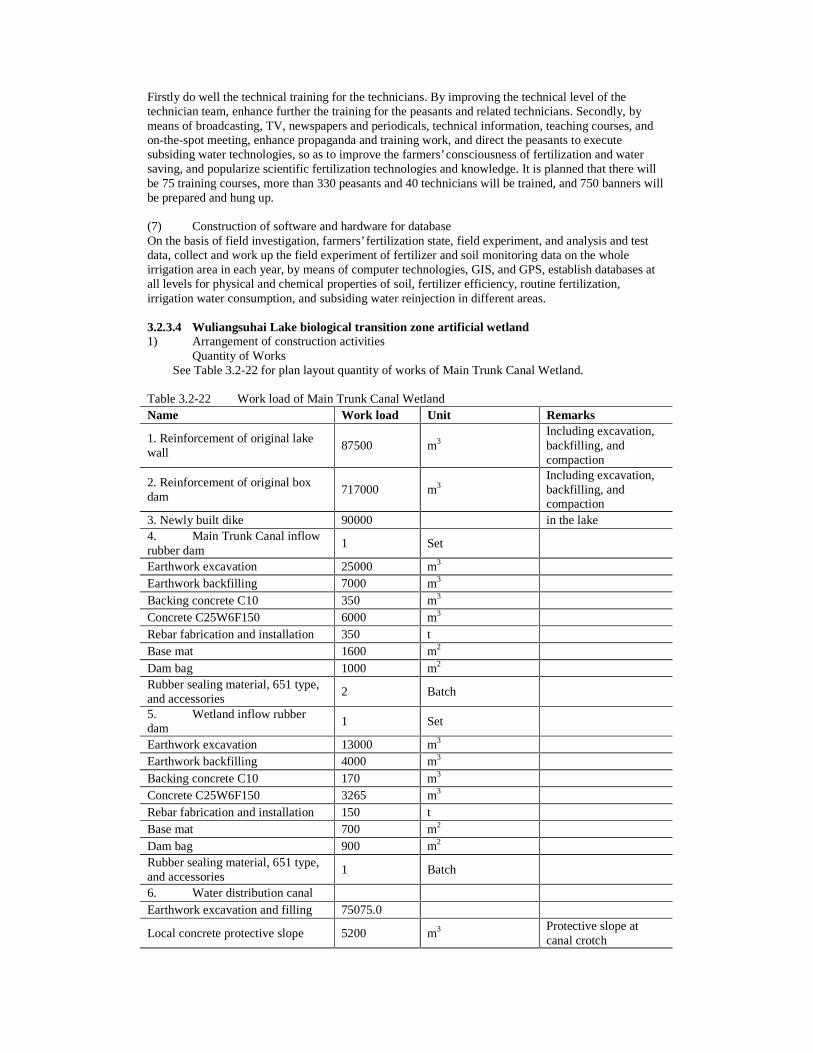
Firstly do well the technical training for the technicians. By improving the technical level of the technician team, enhance further the training for the peasants and related technicians. Secondly, by means of broadcasting, TV, newspapers and periodicals, technical information, teaching courses, and on-the-spot meeting, enhance propaganda and training work, and direct the peasants to execute subsiding water technologies, so as to improve the farmers’ consciousness of fertilization and water saving, and popularize scientific fertilization technologies and knowledge. It is planned that there will be 75 training courses, more than 330 peasants and 40 technicians will be trained, and 750 banners will be prepared and hung up. (7) Construction of software and hardware for database On the basis of field investigation, farmers’ fertilization state, field experiment, and analysis and test data, collect and work up the field experiment of fertilizer and soil monitoring data on the whole irrigation area in each year, by means of computer technologies, GIS, and GPS, establish databases at all levels for physical and chemical properties of soil, fertilizer efficiency, routine fertilization, irrigation water consumption, and subsiding water reinjection in different areas. 3.2.3.4 Wuliangsuhai Lake biological transition zone artificial wetland 1) Arrangement of construction activities � Quantity of Works
See Table 3.2-22 for plan layout quantity of works of Main Trunk Canal Wetland. Table 3.2-22 Work load of Main Trunk Canal Wetland Name Work load Unit Remarks
1. Reinforcement of original lake wall
87500 m3 Including excavation, backfilling, and compaction
2. Reinforcement of original box dam
717000 m3 Including excavation, backfilling, and compaction
3. Newly built dike 90000 in the lake 4. Main Trunk Canal inflow rubber dam
1 Set
Earthwork excavation 25000 m3 Earthwork backfilling 7000 m3 Backing concrete C10 350 m3 Concrete C25W6F150 6000 m3 Rebar fabrication and installation 350 t Base mat 1600 m2 Dam bag 1000 m2 Rubber sealing material, 651 type, and accessories
2 Batch
5. Wetland inflow rubber dam
1 Set
Earthwork excavation 13000 m3 Earthwork backfilling 4000 m3 Backing concrete C10 170 m3 Concrete C25W6F150 3265 m3 Rebar fabrication and installation 150 t Base mat 700 m2 Dam bag 900 m2 Rubber sealing material, 651 type, and accessories
1 Batch
6. Water distribution canal Earthwork excavation and filling 75075.0
Local concrete protective slope 5200 m3 Protective slope at canal crotch
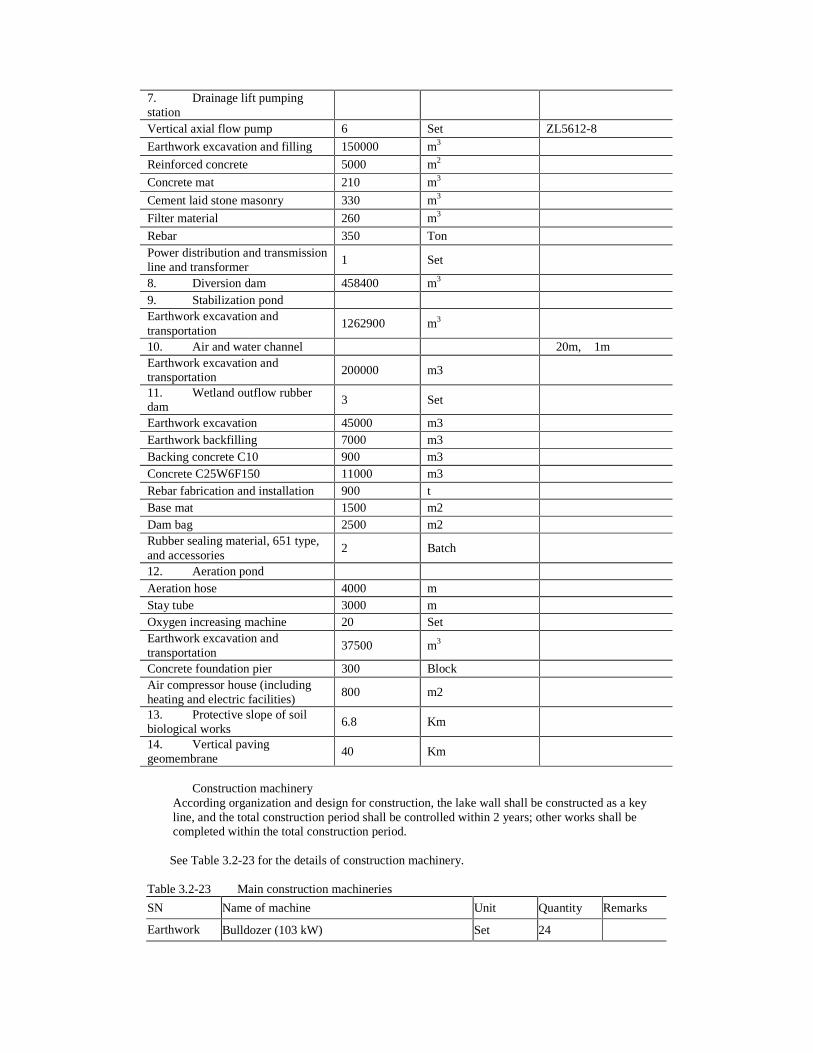
7. Drainage lift pumping station
Vertical axial flow pump 6 Set ZL5612-8
Earthwork excavation and filling 150000 m3
Reinforced concrete 5000 m2
Concrete mat 210 m3
Cement laid stone masonry 330 m3
Filter material 260 m3
Rebar 350 Ton Power distribution and transmission line and transformer
1 Set
8. Diversion dam 458400 m3 9. Stabilization pond Earthwork excavation and transportation
1262900 m3
10. Air and water channel �20m, �1m Earthwork excavation and transportation
200000 m3
11. Wetland outflow rubber dam
3 Set
Earthwork excavation 45000 m3 Earthwork backfilling 7000 m3 Backing concrete C10 900 m3 Concrete C25W6F150 11000 m3 Rebar fabrication and installation 900 t Base mat 1500 m2 Dam bag 2500 m2 Rubber sealing material, 651 type, and accessories
2 Batch
12. Aeration pond Aeration hose 4000 m Stay tube 3000 m Oxygen increasing machine 20 Set Earthwork excavation and transportation
37500 m3
Concrete foundation pier 300 Block Air compressor house (including heating and electric facilities)
800 m2
13. Protective slope of soil biological works
6.8 Km
14. Vertical paving geomembrane
40 Km
� Construction machinery
According organization and design for construction, the lake wall shall be constructed as a key line, and the total construction period shall be controlled within 2 years; other works shall be completed within the total construction period.
See Table 3.2-23 for the details of construction machinery.
Table 3.2-23 Main construction machineries
SN Name of machine Unit Quantity Remarks
Earthwork machines
Bulldozer (103 kW) Set 24
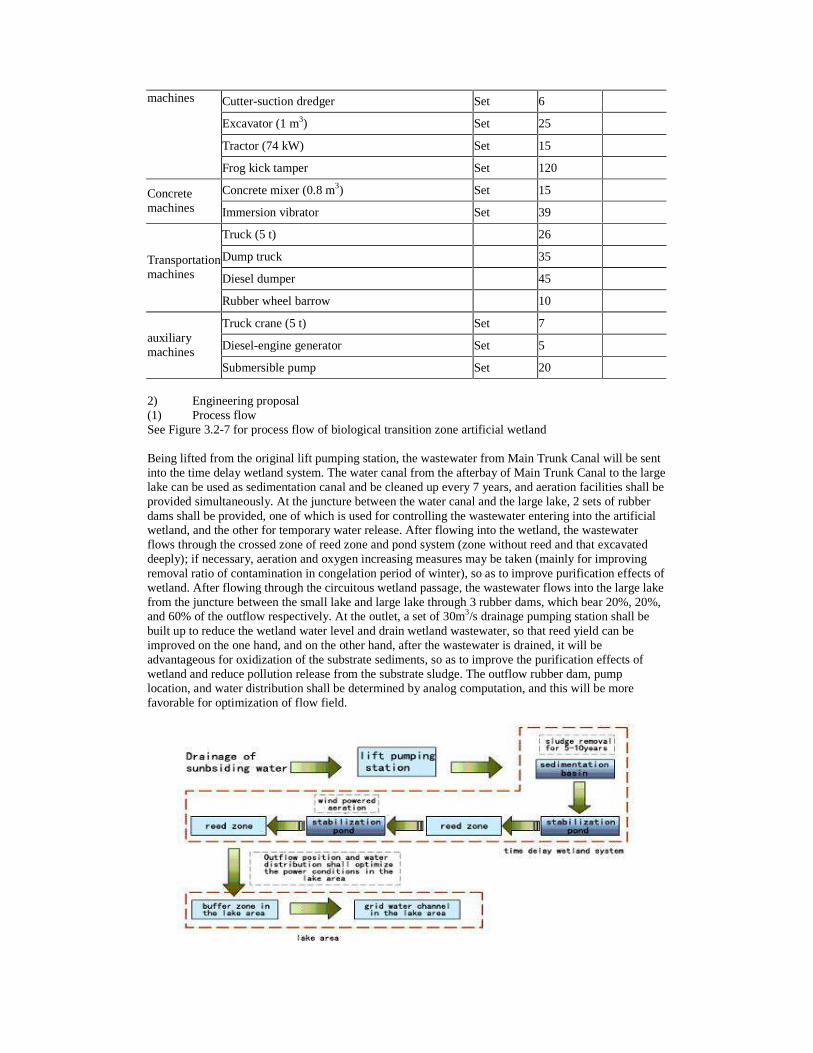
Cutter-suction dredger Set 6
Excavator (1 m3) Set 25
Tractor (74 kW) Set 15
machines
Frog kick tamper Set 120
Concrete mixer (0.8 m3) Set 15 Concrete machines Immersion vibrator Set 39
Truck (5 t) � 26
Dump truck � 35
Diesel dumper � 45
Transportation machines
Rubber wheel barrow � 10
Truck crane (5 t) Set 7
Diesel-engine generator Set 5 auxiliary machines
Submersible pump Set 20
2) Engineering proposal (1) Process flow See Figure 3.2-7 for process flow of biological transition zone artificial wetland Being lifted from the original lift pumping station, the wastewater from Main Trunk Canal will be sent into the time delay wetland system. The water canal from the afterbay of Main Trunk Canal to the large lake can be used as sedimentation canal and be cleaned up every 7 years, and aeration facilities shall be provided simultaneously. At the juncture between the water canal and the large lake, 2 sets of rubber dams shall be provided, one of which is used for controlling the wastewater entering into the artificial wetland, and the other for temporary water release. After flowing into the wetland, the wastewater flows through the crossed zone of reed zone and pond system (zone without reed and that excavated deeply); if necessary, aeration and oxygen increasing measures may be taken (mainly for improving removal ratio of contamination in congelation period of winter), so as to improve purification effects of wetland. After flowing through the circuitous wetland passage, the wastewater flows into the large lake from the juncture between the small lake and large lake through 3 rubber dams, which bear 20%, 20%, and 60% of the outflow respectively. At the outlet, a set of 30m3/s drainage pumping station shall be built up to reduce the wetland water level and drain wetland wastewater, so that reed yield can be improved on the one hand, and on the other hand, after the wastewater is drained, it will be advantageous for oxidization of the substrate sediments, so as to improve the purification effects of wetland and reduce pollution release from the substrate sludge. The outflow rubber dam, pump location, and water distribution shall be determined by analog computation, and this will be more favorable for optimization of flow field.
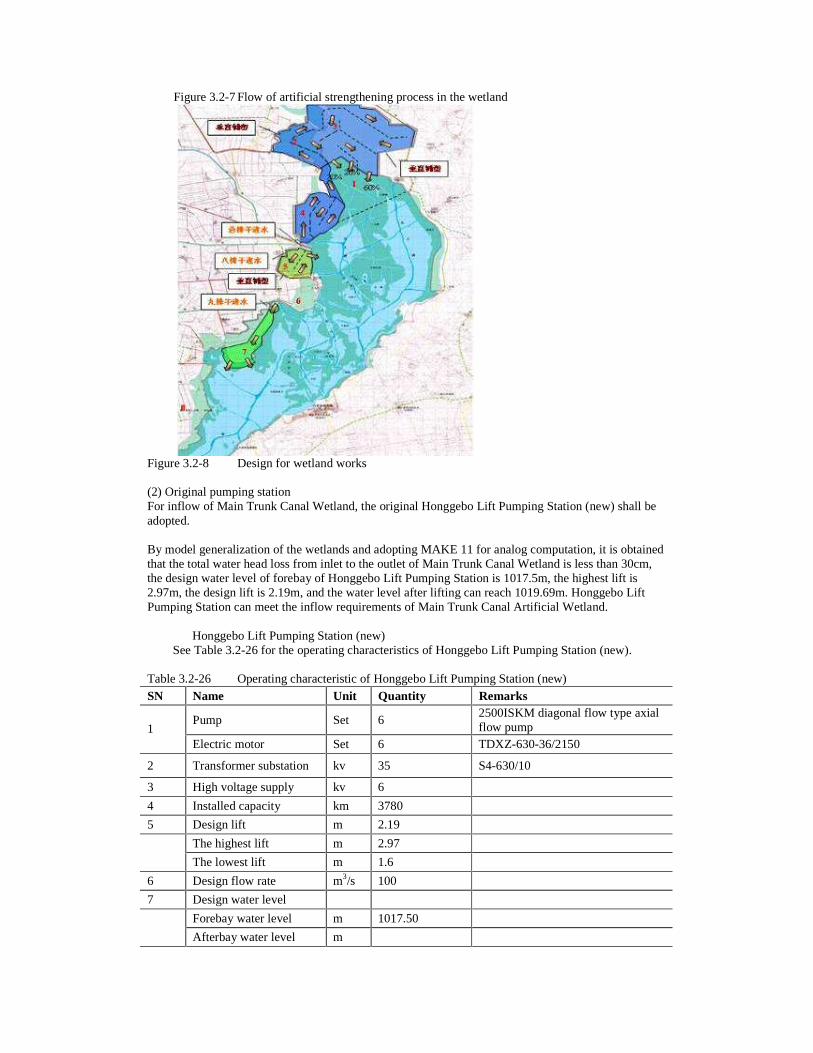
Figure 3.2-7 Flow of artificial strengthening process in the wetland
Figure 3.2-8 Design for wetland works (2) Original pumping station For inflow of Main Trunk Canal Wetland, the original Honggebo Lift Pumping Station (new) shall be adopted. By model generalization of the wetlands and adopting MAKE 11 for analog computation, it is obtained that the total water head loss from inlet to the outlet of Main Trunk Canal Wetland is less than 30cm, the design water level of forebay of Honggebo Lift Pumping Station is 1017.5m, the highest lift is 2.97m, the design lift is 2.19m, and the water level after lifting can reach 1019.69m. Honggebo Lift Pumping Station can meet the inflow requirements of Main Trunk Canal Artificial Wetland. � Honggebo Lift Pumping Station (new)
See Table 3.2-26 for the operating characteristics of Honggebo Lift Pumping Station (new).
Table 3.2-26 Operating characteristic of Honggebo Lift Pumping Station (new)
SN Name Unit Quantity Remarks
Pump Set 6 2500ISKM diagonal flow type axial flow pump 1
Electric motor Set 6 TDXZ-630-36/2150
2 Transformer substation kv 35 S4-630/10
3 High voltage supply kv 6
4 Installed capacity km 3780
5 Design lift m 2.19
The highest lift m 2.97
The lowest lift m 1.6
6 Design flow rate m3/s 100
7 Design water level
Forebay water level m 1017.50
Afterbay water level m
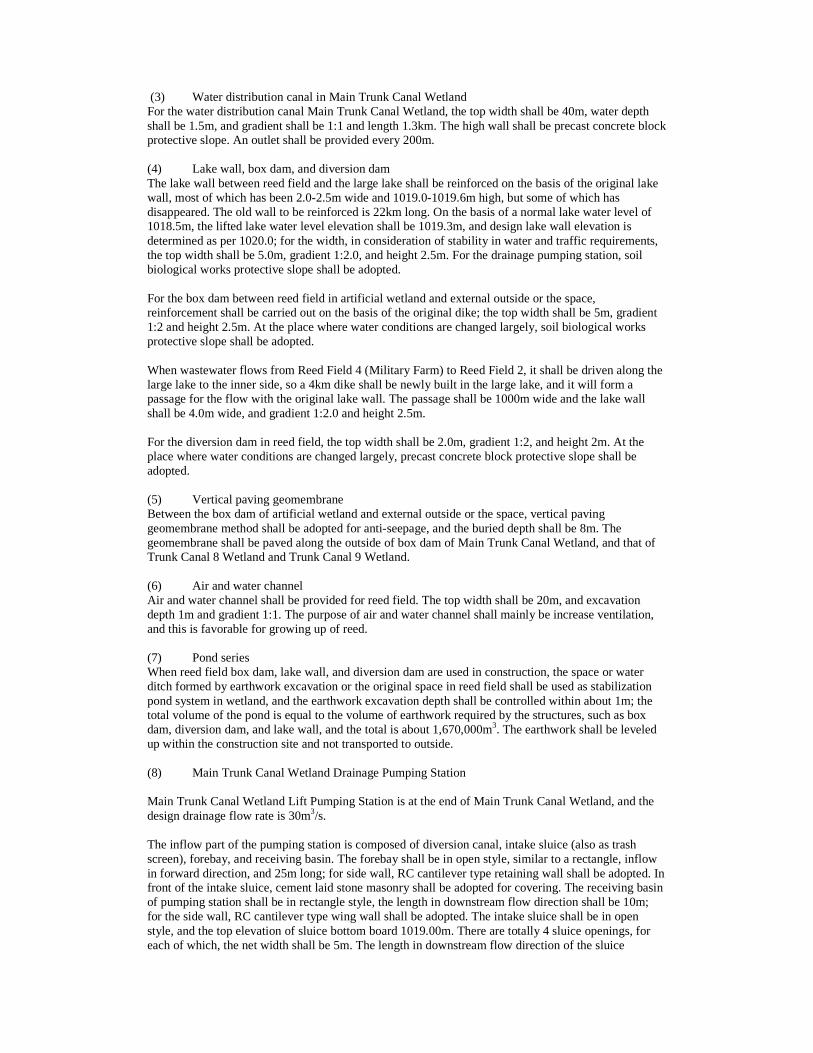
(3) Water distribution canal in Main Trunk Canal Wetland For the water distribution canal Main Trunk Canal Wetland, the top width shall be 40m, water depth shall be 1.5m, and gradient shall be 1:1 and length 1.3km. The high wall shall be precast concrete block protective slope. An outlet shall be provided every 200m. (4) Lake wall, box dam, and diversion dam The lake wall between reed field and the large lake shall be reinforced on the basis of the original lake wall, most of which has been 2.0-2.5m wide and 1019.0-1019.6m high, but some of which has disappeared. The old wall to be reinforced is 22km long. On the basis of a normal lake water level of 1018.5m, the lifted lake water level elevation shall be 1019.3m, and design lake wall elevation is determined as per 1020.0; for the width, in consideration of stability in water and traffic requirements, the top width shall be 5.0m, gradient 1:2.0, and height 2.5m. For the drainage pumping station, soil biological works protective slope shall be adopted. For the box dam between reed field in artificial wetland and external outside or the space, reinforcement shall be carried out on the basis of the original dike; the top width shall be 5m, gradient 1:2 and height 2.5m. At the place where water conditions are changed largely, soil biological works protective slope shall be adopted. When wastewater flows from Reed Field 4 (Military Farm) to Reed Field 2, it shall be driven along the large lake to the inner side, so a 4km dike shall be newly built in the large lake, and it will form a passage for the flow with the original lake wall. The passage shall be 1000m wide and the lake wall shall be 4.0m wide, and gradient 1:2.0 and height 2.5m. For the diversion dam in reed field, the top width shall be 2.0m, gradient 1:2, and height 2m. At the place where water conditions are changed largely, precast concrete block protective slope shall be adopted. (5) Vertical paving geomembrane Between the box dam of artificial wetland and external outside or the space, vertical paving geomembrane method shall be adopted for anti-seepage, and the buried depth shall be 8m. The geomembrane shall be paved along the outside of box dam of Main Trunk Canal Wetland, and that of Trunk Canal 8 Wetland and Trunk Canal 9 Wetland. (6) Air and water channel Air and water channel shall be provided for reed field. The top width shall be 20m, and excavation depth 1m and gradient 1:1. The purpose of air and water channel shall mainly be increase ventilation, and this is favorable for growing up of reed. (7) Pond series When reed field box dam, lake wall, and diversion dam are used in construction, the space or water ditch formed by earthwork excavation or the original space in reed field shall be used as stabilization pond system in wetland, and the earthwork excavation depth shall be controlled within about 1m; the total volume of the pond is equal to the volume of earthwork required by the structures, such as box dam, diversion dam, and lake wall, and the total is about 1,670,000m3. The earthwork shall be leveled up within the construction site and not transported to outside. (8) Main Trunk Canal Wetland Drainage Pumping Station Main Trunk Canal Wetland Lift Pumping Station is at the end of Main Trunk Canal Wetland, and the design drainage flow rate is 30m3/s. The inflow part of the pumping station is composed of diversion canal, intake sluice (also as trash screen), forebay, and receiving basin. The forebay shall be in open style, similar to a rectangle, inflow in forward direction, and 25m long; for side wall, RC cantilever type retaining wall shall be adopted. In front of the intake sluice, cement laid stone masonry shall be adopted for covering. The receiving basin of pumping station shall be in rectangle style, the length in downstream flow direction shall be 10m; for the side wall, RC cantilever type wing wall shall be adopted. The intake sluice shall be in open style, and the top elevation of sluice bottom board 1019.00m. There are totally 4 sluice openings, for each of which, the net width shall be 5m. The length in downstream flow direction of the sluice

chamber shall be 9m. For the front section, 4 control gates shall be provided, and for the rear section, 4 tilting trash screens be provided. Over the sluice, temporary bridge and starting up and shutdown machine room shall be provided. The pump chamber shall be behind the dam and be wet type. The upper part shall be in RC framed structure, and the lower part RC pier wall structure. The top elevation of bottom board of the pump chamber shall be 1011.65m, the length in downstream flow direction 12m, and vertical 23.4m. The auxiliary plant shall be arranged beside the lower reach of the main pump room, and in parallel with the later. The outflow part of the pumping station shall be composed of afterbay, an access bridge across the dam, and exit channel. In which, the afterbay shall be in RC structure, and the length in downstream flow direction shall be 16.6m. There are totally 3 openings for the access bridge, and the net width of each opening shall be 4.2m; the bottom elevation shall be 1015.80m, and the length in downstream flow direction shall be 5m; the exit channel shall be 15m long. The side wall shall be RC cantilever type retaining wall, and spread section shall be connected to the exit channel. In the station, 6 sets of vertical axial flow pump shall be installed, in which 5 sets shall be used and 1 for standby. The type of axial flow pump shall be Zl5650-8, and the flow rate of single unit 6.00 m3/s. For each pump, 1 set of 6KV and 400kW vertical synchronous motor of type TL400-16-××× shall be provided, of which the installed capacity shall be 2000 KW. For the intake sluice, 4X5mX3m plane fixed steel gate shall be provided. (10) Rubber dam For Main Trunk Canal Wetland, 3 outflow rubber dams shall be provided, which shall bear 20%, 20%, and 60% of the outflow. At the juncture between Honggebo Lift Pumping Station and the large lake, 2 rubber dams shall be provided; the one shall be used for controlling water entering into the artificial wetland, of which the water flow rate shall be 29m2/sec, and the other shall be drained directly into the large lake, and the water flow rate through rubber dam shall be 100m2/sec. After flowing through the artificial wetland, some of the wastewater volume shall be lost due to the evaporation of plant in the wetland and that from water surface. According to the reed evaporation data from Zhalong Wetland Administration, the annual reed evaporation volume is 390mm; in consideration of evaporation from water surface and downward seepage, it is estimated that the water volume loss is up to 20%. According to the calculation of water volume, the design flow rate of the 3 outflow rubber dam of Main Trunk Canal Wetland is 4.6m3/s, 4.6 m3/s, and 13.8 m3/s respectively; for the 2 rubber dams at the juncture between Honggebo Lift Pumping Station and the large lake, the design flow rate into the rubber dam is 29 m3/s and that into the large lake is 100 m3/s. See Table 3.2-29 for the main parameters. Table 3.2-25 Main parameters of the rubber dams
Name Design flow rate (m3/s)
Dam bag drainage mode
Dam height (m)
Dam length (m)
Dam 1
11.10 Drainage with dam bag filled
1.50 120.0
Dam 2
3.70 Drainage with dam bag filled
1.50 40.0 Outflow rubber dam of Main Trunk Canal Wetland
Dam 3
3.70 Drainage with dam bag filled
1.50 40.0
Rubber dam at juncture between Honggebo Lift Pumping Station and the large lake
Dam 1
100.00 Drainage with dam bag filled
2.00 90.0

Dam 2
29.00 Drainage with dam bag filled
2.00 30.0
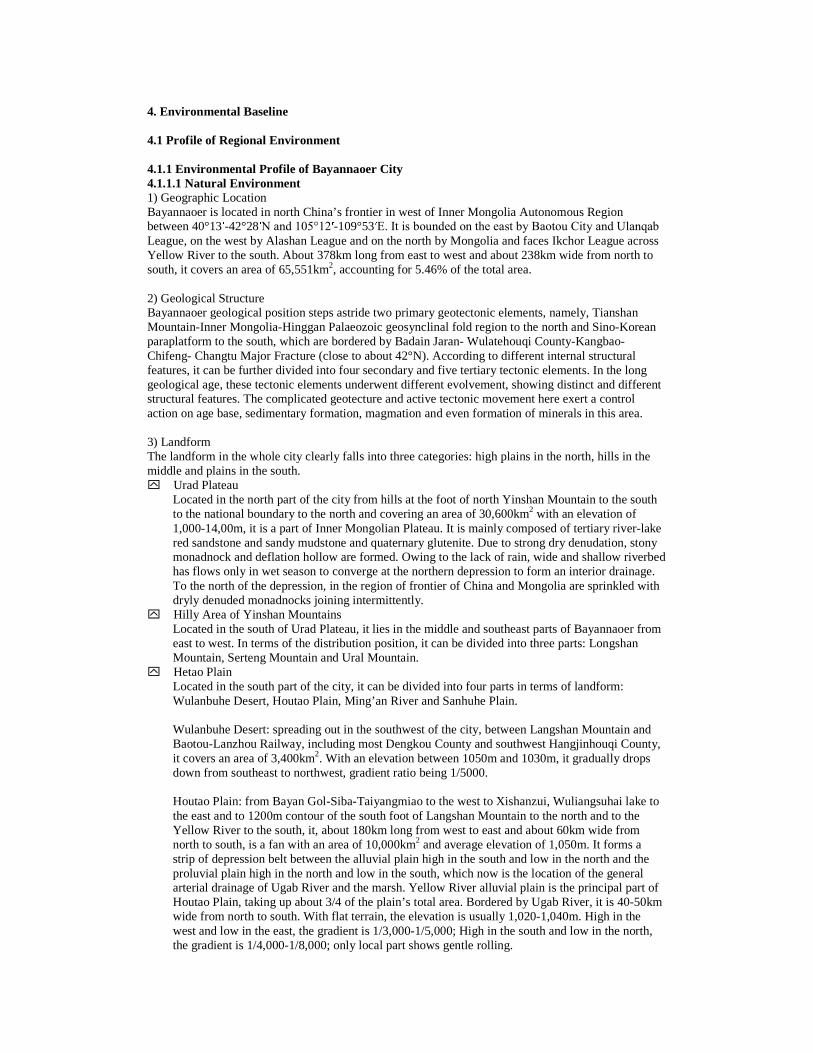
4. Environmental Baseline 4.1 Profile of Regional Environment 4.1.1 Environmental Profile of Bayannaoer City 4.1.1.1 Natural Environment 1) Geographic Location Bayannaoer is located in north China’s frontier in west of Inner Mongolia Autonomous Region between 40°13 -42°28 N and 105°12 -109°53 E. It is bounded on the east by Baotou City and Ulanqab League, on the west by Alashan League and on the north by Mongolia and faces Ikchor League across Yellow River to the south. About 378km long from east to west and about 238km wide from north to south, it covers an area of 65,551km2, accounting for 5.46% of the total area. 2) Geological Structure Bayannaoer geological position steps astride two primary geotectonic elements, namely, Tianshan Mountain-Inner Mongolia-Hinggan Palaeozoic geosynclinal fold region to the north and Sino-Korean paraplatform to the south, which are bordered by Badain Jaran- Wulatehouqi County-Kangbao- Chifeng- Changtu Major Fracture (close to about 42°N). According to different internal structural features, it can be further divided into four secondary and five tertiary tectonic elements. In the long geological age, these tectonic elements underwent different evolvement, showing distinct and different structural features. The complicated geotecture and active tectonic movement here exert a control action on age base, sedimentary formation, magmation and even formation of minerals in this area. 3) Landform The landform in the whole city clearly falls into three categories: high plains in the north, hills in the middle and plains in the south. y� Urad Plateau
Located in the north part of the city from hills at the foot of north Yinshan Mountain to the south to the national boundary to the north and covering an area of 30,600km2 with an elevation of 1,000-14,00m, it is a part of Inner Mongolian Plateau. It is mainly composed of tertiary river-lake red sandstone and sandy mudstone and quaternary glutenite. Due to strong dry denudation, stony monadnock and deflation hollow are formed. Owing to the lack of rain, wide and shallow riverbed has flows only in wet season to converge at the northern depression to form an interior drainage. To the north of the depression, in the region of frontier of China and Mongolia are sprinkled with dryly denuded monadnocks joining intermittently.
y� Hilly Area of Yinshan Mountains Located in the south of Urad Plateau, it lies in the middle and southeast parts of Bayannaoer from east to west. In terms of the distribution position, it can be divided into three parts: Longshan Mountain, Serteng Mountain and Ural Mountain.
y� Hetao Plain Located in the south part of the city, it can be divided into four parts in terms of landform: Wulanbuhe Desert, Houtao Plain, Ming’an River and Sanhuhe Plain.
Wulanbuhe Desert: spreading out in the southwest of the city, between Langshan Mountain and Baotou-Lanzhou Railway, including most Dengkou County and southwest Hangjinhouqi County, it covers an area of 3,400km2. With an elevation between 1050m and 1030m, it gradually drops down from southeast to northwest, gradient ratio being 1/5000.
Houtao Plain: from Bayan Gol-Siba-Taiyangmiao to the west to Xishanzui, Wuliangsuhai lake to the east and to 1200m contour of the south foot of Langshan Mountain to the north and to the Yellow River to the south, it, about 180km long from west to east and about 60km wide from north to south, is a fan with an area of 10,000km2 and average elevation of 1,050m. It forms a strip of depression belt between the alluvial plain high in the south and low in the north and the proluvial plain high in the north and low in the south, which now is the location of the general arterial drainage of Ugab River and the marsh. Yellow River alluvial plain is the principal part of Houtao Plain, taking up about 3/4 of the plain’s total area. Bordered by Ugab River, it is 40-50km wide from north to south. With flat terrain, the elevation is usually 1,020-1,040m. High in the west and low in the east, the gradient is 1/3,000-1/5,000; High in the south and low in the north, the gradient is 1/4,000-1/8,000; only local part shows gentle rolling.
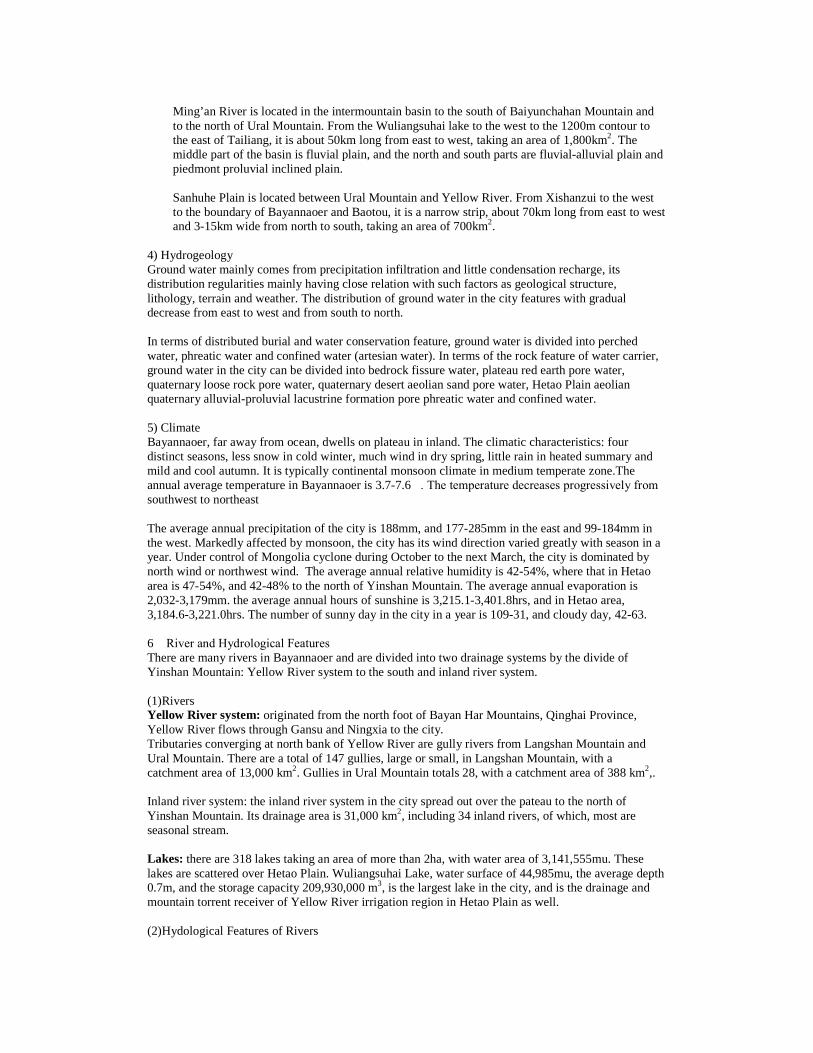
Ming’an River is located in the intermountain basin to the south of Baiyunchahan Mountain and to the north of Ural Mountain. From the Wuliangsuhai lake to the west to the 1200m contour to the east of Tailiang, it is about 50km long from east to west, taking an area of 1,800km2. The middle part of the basin is fluvial plain, and the north and south parts are fluvial-alluvial plain and piedmont proluvial inclined plain.
Sanhuhe Plain is located between Ural Mountain and Yellow River. From Xishanzui to the west to the boundary of Bayannaoer and Baotou, it is a narrow strip, about 70km long from east to west and 3-15km wide from north to south, taking an area of 700km2.
4) Hydrogeology Ground water mainly comes from precipitation infiltration and little condensation recharge, its distribution regularities mainly having close relation with such factors as geological structure, lithology, terrain and weather. The distribution of ground water in the city features with gradual decrease from east to west and from south to north. In terms of distributed burial and water conservation feature, ground water is divided into perched water, phreatic water and confined water (artesian water). In terms of the rock feature of water carrier, ground water in the city can be divided into bedrock fissure water, plateau red earth pore water, quaternary loose rock pore water, quaternary desert aeolian sand pore water, Hetao Plain aeolian quaternary alluvial-proluvial lacustrine formation pore phreatic water and confined water. 5) Climate Bayannaoer, far away from ocean, dwells on plateau in inland. The climatic characteristics: four distinct seasons, less snow in cold winter, much wind in dry spring, little rain in heated summary and mild and cool autumn. It is typically continental monsoon climate in medium temperate zone.The annual average temperature in Bayannaoer is 3.7-7.6�. The temperature decreases progressively from southwest to northeast The average annual precipitation of the city is 188mm, and 177-285mm in the east and 99-184mm in the west. Markedly affected by monsoon, the city has its wind direction varied greatly with season in a year. Under control of Mongolia cyclone during October to the next March, the city is dominated by north wind or northwest wind. The average annual relative humidity is 42-54%, where that in Hetao area is 47-54%, and 42-48% to the north of Yinshan Mountain. The average annual evaporation is 2,032-3,179mm. the average annual hours of sunshine is 3,215.1-3,401.8hrs, and in Hetao area, 3,184.6-3,221.0hrs. The number of sunny day in the city in a year is 109-31, and cloudy day, 42-63. 6� River and Hydrological Features There are many rivers in Bayannaoer and are divided into two drainage systems by the divide of Yinshan Mountain: Yellow River system to the south and inland river system. (1)Rivers Yellow River system: originated from the north foot of Bayan Har Mountains, Qinghai Province, Yellow River flows through Gansu and Ningxia to the city. Tributaries converging at north bank of Yellow River are gully rivers from Langshan Mountain and Ural Mountain. There are a total of 147 gullies, large or small, in Langshan Mountain, with a catchment area of 13,000 km2. Gullies in Ural Mountain totals 28, with a catchment area of 388 km2,. Inland river system: the inland river system in the city spread out over the pateau to the north of Yinshan Mountain. Its drainage area is 31,000 km2, including 34 inland rivers, of which, most are seasonal stream. Lakes: there are 318 lakes taking an area of more than 2ha, with water area of 3,141,555mu. These lakes are scattered over Hetao Plain. Wuliangsuhai Lake, water surface of 44,985mu, the average depth 0.7m, and the storage capacity 209,930,000 m3, is the largest lake in the city, and is the drainage and mountain torrent receiver of Yellow River irrigation region in Hetao Plain as well. (2)Hydological Features of Rivers
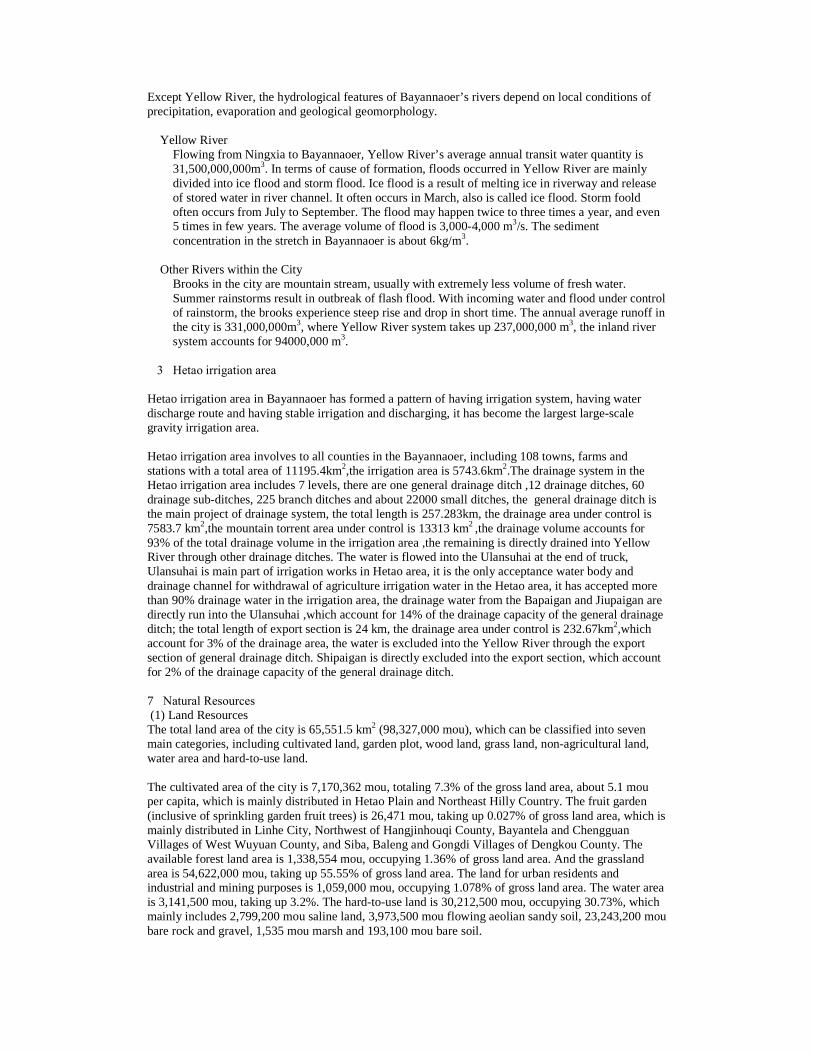
Except Yellow River, the hydrological features of Bayannaoer’s rivers depend on local conditions of precipitation, evaporation and geological geomorphology. � Yellow River
Flowing from Ningxia to Bayannaoer, Yellow River’s average annual transit water quantity is 31,500,000,000m3. In terms of cause of formation, floods occurred in Yellow River are mainly divided into ice flood and storm flood. Ice flood is a result of melting ice in riverway and release of stored water in river channel. It often occurs in March, also is called ice flood. Storm foold often occurs from July to September. The flood may happen twice to three times a year, and even 5 times in few years. The average volume of flood is 3,000-4,000 m3/s. The sediment concentration in the stretch in Bayannaoer is about 6kg/m3.
� Other Rivers within the City
Brooks in the city are mountain stream, usually with extremely less volume of fresh water. Summer rainstorms result in outbreak of flash flood. With incoming water and flood under control of rainstorm, the brooks experience steep rise and drop in short time. The annual average runoff in the city is 331,000,000m3, where Yellow River system takes up 237,000,000 m3, the inland river system accounts for 94000,000 m3.
�3�Hetao irrigation area Hetao irrigation area in Bayannaoer has formed a pattern of having irrigation system, having water discharge route and having stable irrigation and discharging, it has become the largest large-scale gravity irrigation area. Hetao irrigation area involves to all counties in the Bayannaoer, including 108 towns, farms and stations with a total area of 11195.4km2,the irrigation area is 5743.6km2.The drainage system in the Hetao irrigation area includes 7 levels, there are one general drainage ditch ,12 drainage ditches, 60 drainage sub-ditches, 225 branch ditches and about 22000 small ditches, the general drainage ditch is the main project of drainage system, the total length is 257.283km, the drainage area under control is 7583.7 km2,the mountain torrent area under control is 13313 km2 ,the drainage volume accounts for 93% of the total drainage volume in the irrigation area ,the remaining is directly drained into Yellow River through other drainage ditches. The water is flowed into the Ulansuhai at the end of truck, Ulansuhai is main part of irrigation works in Hetao area, it is the only acceptance water body and drainage channel for withdrawal of agriculture irrigation water in the Hetao area, it has accepted more than 90% drainage water in the irrigation area, the drainage water from the Bapaigan and Jiupaigan are directly run into the Ulansuhai ,which account for 14% of the drainage capacity of the general drainage ditch; the total length of export section is 24 km, the drainage area under control is 232.67km2,which account for 3% of the drainage area, the water is excluded into the Yellow River through the export section of general drainage ditch. Shipaigan is directly excluded into the export section, which account for 2% of the drainage capacity of the general drainage ditch. 7�Natural Resources (1) Land Resources The total land area of the city is 65,551.5 km2 (98,327,000 mou), which can be classified into seven main categories, including cultivated land, garden plot, wood land, grass land, non-agricultural land, water area and hard-to-use land. The cultivated area of the city is 7,170,362 mou, totaling 7.3% of the gross land area, about 5.1 mou per capita, which is mainly distributed in Hetao Plain and Northeast Hilly Country. The fruit garden (inclusive of sprinkling garden fruit trees) is 26,471 mou, taking up 0.027% of gross land area, which is mainly distributed in Linhe City, Northwest of Hangjinhouqi County, Bayantela and Chengguan Villages of West Wuyuan County, and Siba, Baleng and Gongdi Villages of Dengkou County. The available forest land area is 1,338,554 mou, occupying 1.36% of gross land area. And the grassland area is 54,622,000 mou, taking up 55.55% of gross land area. The land for urban residents and industrial and mining purposes is 1,059,000 mou, occupying 1.078% of gross land area. The water area is 3,141,500 mou, taking up 3.2%. The hard-to-use land is 30,212,500 mou, occupying 30.73%, which mainly includes 2,799,200 mou saline land, 3,973,500 mou flowing aeolian sandy soil, 23,243,200 mou bare rock and gravel, 1,535 mou marsh and 193,100 mou bare soil.
(2) Water Resources The water resources of city are made up of surface, underground and cross-border water. The surface water is from Continental River and Yellow River. The drainage area of Yellow River water system is 34,000 km2, taking up 52% of total city area. The normal runoff is 237 million m3, occupying 71.6% of that of the whole city. The endothermic river is 31,000 km2, taking up 48% of the whole city. And its normal runoff is 94 million m3, taking up 28.4% of the whole city. The underground water comprehensive recharge capacity of the whole city is 3.21 billion m3 with 1.81 billion m3 workable reserves. The underground water is distributed from east to west and south to north. Along the lower course of Hetao Plain and south of Ugab River, the underground water mineralization degree is more than 3g/l with some area even above 10g/l. Therefore, the water is bad in quality and less in quantity. The hydration type of water is Cl—SO4. The cross-border water is mainly from Yellow River with a normal runoff of 31.50 billion m3. The interannual and inter-monthly change of annual runoff of Yellow River is great with maximum 50.50 billion m3 and minimum 18.30 billion m3. Since the establishment of China, Bayannaoer has constructed a lot of projects to make good use of water resources, including 1 Yellow River Sanshenggong Key Project, one 228.9 km general main cannel, 9 sectional projects, 13 main canals totaling 790.1 km, 43 sub-canals totaling 958.30 km and 249 branch canal totaling 1,750 km. Even the piping engineering under Dounong Canal has been provided with some supporting facilities becoming the largest irrigation area controlling canal in China. The existing irrigation area is 6 million mou, which is the foundation for Bayannaoer to develop agriculture. The drainage system has one main arterial drainage totaling 206 km, 13 main stream gullies totaling 508.5 km, 62 sub-main stream gullies totaling 1,032.3 km and 139 branch gullies totaling 206 km. Therefore, the drainage major projects have taken shape. For the sustainable and stable development of agricultural production in Hetao Irrigation Area, the water diversion irrigation from Yellow River is a major condition. 4.1.1.2 Social Environment 1) Administrative Division At present, Bayannaoer administrative division has 4 banners (Urad Front, Middle and Back and Hangjin Back), 2 counties (Wuyuan and Dengkou) and 1 district (Linhe), covering 106 villages and towns and offices, among which there are 19 sumu (villages), 32 villages, 45 towns (all 96) and 10 offices. The banners, counties and cities administer 18 towns, 82 villages, 23 sumu (villages), 795 villagers’ committees, 141 administrative villages, forming a town layout of one village in 30 Li (half of km) and one town in 50 Li. 2) Urban Population The fertility rate, death rate and natural growth rate of Bayannaoer City are 5.68‰, 2.99‰ and 2.68‰. By the end of year, the gross population of domicile has reached 1,761,300, an increase of 1.15% over the previous year. According to the statistics of family planning departments, the average annual natural population growth is 5,000-6,000 persons with a low mechanical growth rate. According to the statistics of municipal public security bureau, the population growth rate, inclusive of floating population, in central city of Bayannaoer has exceeded 10,000/year. 3) Socioeconomic Development The total output value of Bayannaoer area in 2005 was 21.70 billion Yuan, an increase of 1.1 over 2000 on comparable basis. The agricultural production continued to be rich harvest in successive years and service industry continued to expand in scale and gross amount at the time of industrial optimization and updating. The industrial output doubled in two years and increased by two times in three years becoming an active force to bring along the economic growth. The municipal financial revenue in 2005 reached 2.123 billion Yuan, an increase of 2 times over 2000. Now, the municipal economy has taken on a great-leap-forward development and stepped into a new phase of per capital GDP from USD 1,000 to 3,000. The industrial structure experienced profound changes making the structure of three industries change from 39:26:35 to 30.6:38.5:30.9, among which the primary industry went down 8.4% and secondary industry up 12.5%. The urbanization proportion was improved to 41% from 36.9%.
The per capita disposable income of urban residents reached 8,022 Yuan and per capita net income of farmers and herdsmen was 4,265 Yuan in 2005, an increase of 67� and 76.4� over 2000 respectively. The outstanding of deposits from urban and rural residents increased by 100% over 2000. The poverty-stricken population in agricultural and pastoral areas went down to 150,200 in 2005 toward 259,200 in 2000. Housing, education and tourism became new consumption points. More than 60,000 people entered the labor force. The payout ratio of pension was 100%. The registered unemployment rate of urban residents was controlled at 4.25%. And urban minimum living standard was completely and well implemented. 4.1.2 Environmental Profile of Subitem Location 4.1.2.1 Wulateqianqi County 1) Natural Environment (1) Geographic Location Wulateqianqi County is located at the southeast of Bayannaoer City, Inner Mongolia Autonomous Region, whose geographical coordinates is E108° 12 -109° 54 and N40° 26 -41° 16 and east side is next to Baotou City, south next to Dalate Banner and Hangjin Banner of Erdos City across Yellow River, west close to Wuyuan County and North bordered on Wulatezhongqi County. The banner location, Ural Mountain Town, is 288km from Hohhot City and 142km from the Bayannaoer Municipality. (2) Landform and Physiognomy The project area is a part of Hetao Plain located between Ural Mountain (west section of Yinshan Mountains) and Yellow River. Influenced by regional structure, the area extends in east-west. The plain terrain topography slopes from northwest to southeast, yet, is even and wide with slightly fluctuation at local parts. The topography in front of mountains is a dip plain high in north and low in south, which is formed by the Ural Mountain Front Flood Plain and Yellow River Alluvial Plain. (3) Geology Wulateqianqi County is complex in geological structure with fold, fracture and great block mountain developed by deep fracture. The basement rock is made up of Sangkan and Wutai groups of Archean Group and Zhaertai group of Proterozoic Group. Yanshan movement developed front deep fracture from original one. Because of the existence of deep fracture, three stair block mountains, Chashitai, Bayinchagan and Ural, from north to south were formed along with Ming’an, Large and Small Shetai Rivers and different table-top piedmont benchlands. Along the north side of Yellow River Irrigation Area, there is a deep fracture zone extending to Ural River and the new fracture cutting in front of Ural Mountain, which has enlarged and deepened Hetao fault depression. The north part rise relatively forming high mountains leaving the south part for Hetao Plain. The Ural Mountain Fault Depression is under the latency of Ural Mountain umbos from Xishan Mouth to Sanshenggong along railway. The geotectogene of Wuliangsuhai lake and Sanhu River trough valley formed inland close-type fault basin. From Tertiary to early Quaternary period, the original fracture was further developed into stair-type fracture and undergone the sedimentation of thick and alluviation lacustrine, and alluviation diluvium. The middle and lower Pleistocene Epoch is of successive gyttja and Epipleistocene is of recession of lake water. Yellow River began to develop and experienced gyttja and fluvial facies sedimentation. Later, the diluvial of Yellow River and Front Mountain alluviation formed Hetao Plain. Under the action of human productive activities and Yellow River water, the surface layer was coated with irrigation-warping horizon alluvium. The enclosed geological structure of long-term lacustrine action of Hetao Basin accumulated a very high saline matter in stratum. This gyttja geographical environment has been preventing the smooth running of groundwater runoff leaving an enriched water and soil salt and putting a great influence on the formation of saline soil. (4) River Water System � Surface Water
The main surface waters in Wulateqianqi County are Wuliangsuhai lake, Yellow River and waste cannels and ephemeral streams connecting Wuliangsuhai lake and Yellow River.
Wuliangsuhai lake: Wuliangsuhai lake is located at the east end of Hetao Irrigation Area and north of Xishan Mouth Town of Wulateqianqi County, which is south-narrow and north-wide and
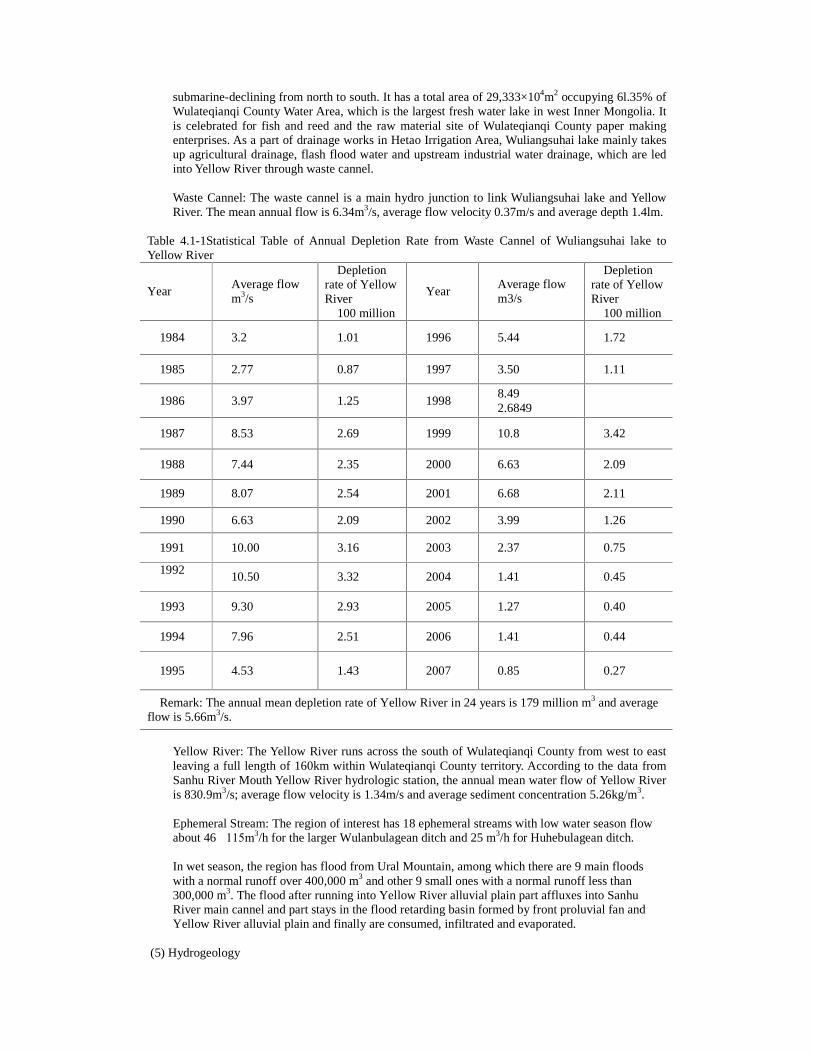
submarine-declining from north to south. It has a total area of 29,333×104m2 occupying 6l.35% of Wulateqianqi County Water Area, which is the largest fresh water lake in west Inner Mongolia. It is celebrated for fish and reed and the raw material site of Wulateqianqi County paper making enterprises. As a part of drainage works in Hetao Irrigation Area, Wuliangsuhai lake mainly takes up agricultural drainage, flash flood water and upstream industrial water drainage, which are led into Yellow River through waste cannel. Waste Cannel: The waste cannel is a main hydro junction to link Wuliangsuhai lake and Yellow River. The mean annual flow is 6.34m3/s, average flow velocity 0.37m/s and average depth 1.4lm.
Table 4.1-1Statistical Table of Annual Depletion Rate from Waste Cannel of Wuliangsuhai lake to Yellow River
Year Average flow m3/s
Depletion rate of Yellow River
100 million 3
Year Average flow m3/s
Depletion rate of Yellow River
100 million 3
1984 3.2 1.01 1996 5.44 1.72
1985 2.77 0.87 1997 3.50 1.11
1986 3.97 1.25 1998 8.49 2.6849
1987 8.53 2.69 1999 10.8 3.42
1988 7.44 2.35 2000 6.63 2.09
1989 8.07 2.54 2001 6.68 2.11
1990 6.63 2.09 2002 3.99 1.26
1991 10.00 3.16 2003 2.37 0.75
1992
10.50 3.32 2004 1.41 0.45
1993 9.30 2.93 2005 1.27 0.40
1994 7.96 2.51 2006 1.41 0.44
1995 4.53 1.43 2007 0.85 0.27
Remark: The annual mean depletion rate of Yellow River in 24 years is 179 million m3 and average flow is 5.66m3/s.
Yellow River: The Yellow River runs across the south of Wulateqianqi County from west to east leaving a full length of 160km within Wulateqianqi County territory. According to the data from Sanhu River Mouth Yellow River hydrologic station, the annual mean water flow of Yellow River is 830.9m3/s; average flow velocity is 1.34m/s and average sediment concentration 5.26kg/m3.
Ephemeral Stream: The region of interest has 18 ephemeral streams with low water season flow about 46�115m3/h for the larger Wulanbulagean ditch and 25 m3/h for Huhebulagean ditch.
In wet season, the region has flood from Ural Mountain, among which there are 9 main floods with a normal runoff over 400,000 m3 and other 9 small ones with a normal runoff less than 300,000 m3. The flood after running into Yellow River alluvial plain part affluxes into Sanhu River main cannel and part stays in the flood retarding basin formed by front proluvial fan and Yellow River alluvial plain and finally are consumed, infiltrated and evaporated.
(5) Hydrogeology
The region of interest is located at the east zone of Hetao Plain with the north for Ural Mountain Front Flood Plain and south for Yellow River alluvial plain. The Epipleistocene-Holocene Series water-bearing formation of region of interest (Q3 and Q4 water-bearing formation, No. 1 water-bearing formation for short) is well developed and abroad distributed with great thickness, rich water content, shallow bury and close relationship with surface water, which is the main water supply water-bearing formation. The underlying Pleistocene Series upper and lower water-bearing formation (Q2 water-bearing formation, No. 2 water-bearing formation for short) is gyttja pile. The Pleistocene Series upper group is mainly silt deposition. The middle Pleistocene Series lower group �Q2
1�aquifer is great in thickness, shallow in bury, fine in aquifer grain and small in water quantity. Therefore, it is of no consequence for total water supply and of exploitation value in some zone. (6) Water Resources Deducting the double counting amount between the surface water and ground water, the multi-year average gross amount of self-produced water resources in the region of interest is 4183.34×104m3/a; under present situation, the utilizable amount of water resources is 5839.2×104m3/a, of which 2898.24×104m3/a is the utilizable amount supplied by the irrigation of the Yellow River; the amount of ground water resources in salt water area is 2610.25×104m3/a, the utilizable amount of the ground water in salt water area is 1957.69×104m3/a. (7) Climate Features Wulateqianqi County has a temperate continental arid and semiarid climate. Scarce rainfall, strong evaporation, dry and windy, large daily temperature range and long sunshine duration are the main climate features. According to the data of Wulateqianqi County weather station, the multi-year mean precipitation is 211.6mm. The multi-year average evaporation capacity is 2379.4mm.the multi-year mean temperature is 7.5°C (1960~2000). The maximum depth of frozen ground is 1.19m and the maximum snow depth is 18cm. (8) Soil and Vegetation Due to the complex topography, landform and geological structure as well as the differences in bio-climate, different soil parent materials are formed in arid mountain areas and Yellow River irrigation areas of Wulateqianqi County. Soil parent materials are generally classified into sedentary, drift bed, pluvial, alluvial and aeolian loess or loess-like, laterite or laterite-like, salt silt loamy texture, sandy and bedrock differentiation crumb parent materials. Soil in Urad includes total 6 types, 18 subtypes, 49 soil genera and 395 soil species. The meadow irrigation-silting soil, saliniferous irrigation-silting soil, irrigation-silting chestnut soil and irrigation-silting light-colored meadow soil in Wulateqianqi County are mainly the cultivated soils. Except the part of light chestnut soil and haplic kastanozems which are wastelands and pasture lands, the rests are dry cultivated lands. The gray cinnamonic soil is forest soil. The saline soil and aeolian sandy soil have sparse vegetation, most of which are wastelands. In addition, soil salinization within the territory is very serious with the trend of deteriorating year by year. (9) Natural Resources �Land
The total land area in Wulateqianqi County is 7,476 km2, equivalent to 11.214 million mu. The present arable area is 1.035 million mu, the grassland area is 6.3594 million mu, accounting for 56.7%. The water area is 0.723 million mu. The non-agricultural land area is 0.9297 million mu, accounting for 8.3%; urban area, 0.25 million mu is the land for special use, 0.236 million mu is the land for transportation, 0.253 million mu is the trench area. The area of land difficult to be used is 0.43 million mu, accounting for 3.8%.
�Wild Plants and Animals There are total 19 families, 33 genera and 69 species of woody plants in the banner, of which there are natural forests such as Chinese pine, juniper, arborvitae, white birch, Morus mongolica and Tilia mongolica, etc.; there are total 75 families, 280 genera and 503 species of woody plants in the banner. There are 240 species of forage plants. There are 305 species of wild plant medicinal materials. The phytoplankton mainly grows in Wuliangsuhai lake, etc. and includes total 86 genera, of which there are 28 genera of chlorophyta, 25 genera of bacillariophyta, 18 genera of cyanophyta, 5 genera of euglenophyta, 4 genera of pyrrophyta, 3 genera of chrysophyta, 2 genera of cryptophyta and 1 genus of xanthophyta. The fungi include mushroom, puffball, long thread moss and nostoc commune, etc.
At present, wild animals living in Ural Mountains and other regions include Tuanyang, goral, roe deer, fox, badger, stoat, wild fox, hare, hedgehog and ground squirrel, etc., of which Tuanyang and goral are the national second class protection animals. There are a large number of birds in Ural Mountains and Wuliangsuhai lake, which is one of China’s important treasure houses for bird resources. It has been listed as the national bird sanctuary. Birds under the national protection include mute swans, whooper swan and spot-billed pelican the three kinds. There are 65 species of zooplankton in Wuliangsuhai lake, including 14 species of protozoa, 33 species of rotifer and 10 species of cladocerans. (3) Mineral Resources There are abundant mineral resources in the banner. There are more than 30 kinds of minerals known, including iron ore, gold, coal, potash feldspar, mica, dolomite, bentonite, gypsum, fluorite and pyrite, etc. In addition, there is lead, zinc, niobium, tantalum, beryl, allanite, phosphate ore, marble, perlite, ore sand, swelling powder, salt, saltpetre, oxytetracycline dihydrate and other mineral reserves. 2) General Situation of Social Economy In 2007, the gross value of production of the whole banner reaches 5.5 billion Yuan, with an average annual growth of 19.2%; GDP per capita reaches 2,227 U.S. dollars. In 2007, the gross industrial output value of the whole banner reaches 5.77 billion Yuan and the five major pillar industries including chemical industry, electric power, mining building materials, paper making, and agricultural & livestock products processing are formed.the total livestock quantity of the whole banner is expected to reach 3.802 million heads.The gross output value of livestock breeding reaches 604 million Yuan. There are no physical cultural relics and historic sites within this project area after the retrieval on the local chronicles, statistical yearbook etc. and confirmed by the Wulateqianqi county cultural relics control center. 4.1.2.2 Wulatezhongqi County 1) Natural Environment (1) Geographic Location The project is located in Delingshan Town, Wulatezhongqi County, Bayannaoer City of Inner Mongolia Autonomous Region. Wulatezhongqi County is located in the west of Inner Mongolia and the northeast of Bayannaoer City with the geographic coordinate of E107°16 ~109°42 and N41°07 ~42°28 . It marches with Mongolia in north, neighbors Damao Banner of Ulanqab League and Guyang County of Baotou City in east, neighbors Wulateqianqi County, Wuyuan County, Linhe City and Gangjinhouqi County in south, adjacent to Wulatehouqi County in west. The whole banner is 203.8km long from east to west, 148.9km wide from north to south, with a total area of 22,606 square kilometers. (2) Geological Features Wulatezhongqi County has complex geological structure, including two first-level tectonic units, i.e. with the boundary of the south edge of Chuanjing—Sanggendalai Mesozoic depression, its north is Greater Khingan Mountains geosynclinal folded system and its south is North China Platform. Due to the influences of tectonic movements, plus the affects of several large-scale magmatic activities, the geological structure is seriously damaged and some strata has flaws, folds, bends or even upside down and breaking, which result in the generation and occurrence of various mineral deposits with industrial value. This project is located in the Wolf Mountain—Zhasitaishan Mountain Fold Belt with very complex geological structure, strata changes and sedimentary formation, strong topography cutting and large relative height difference. The rock constituents include: carbonaceous slate, limestone, mica-quartz schist, quartzite, sericite schist, phyllite as well as the granite, pegmatite, quartz veins and volcanic-sedimentary rock, etc. immersed in different periods. Wulatezhongqi County consists of 3 basic landforms: southern piedmont plain, central mountains and northern hilly plateau, with significant regional differences and transition changes. This project is located in the piedmont plain area of Wulatezhongqi County. The piedmont plain area, a panhandle of 120km long from east to west and 2~10km wide from south to north, belongs to Hetao Plain. It consists of piedmont pluvial fan and Hetao alluvial plain with the south edge adjacent to the deposition plain of
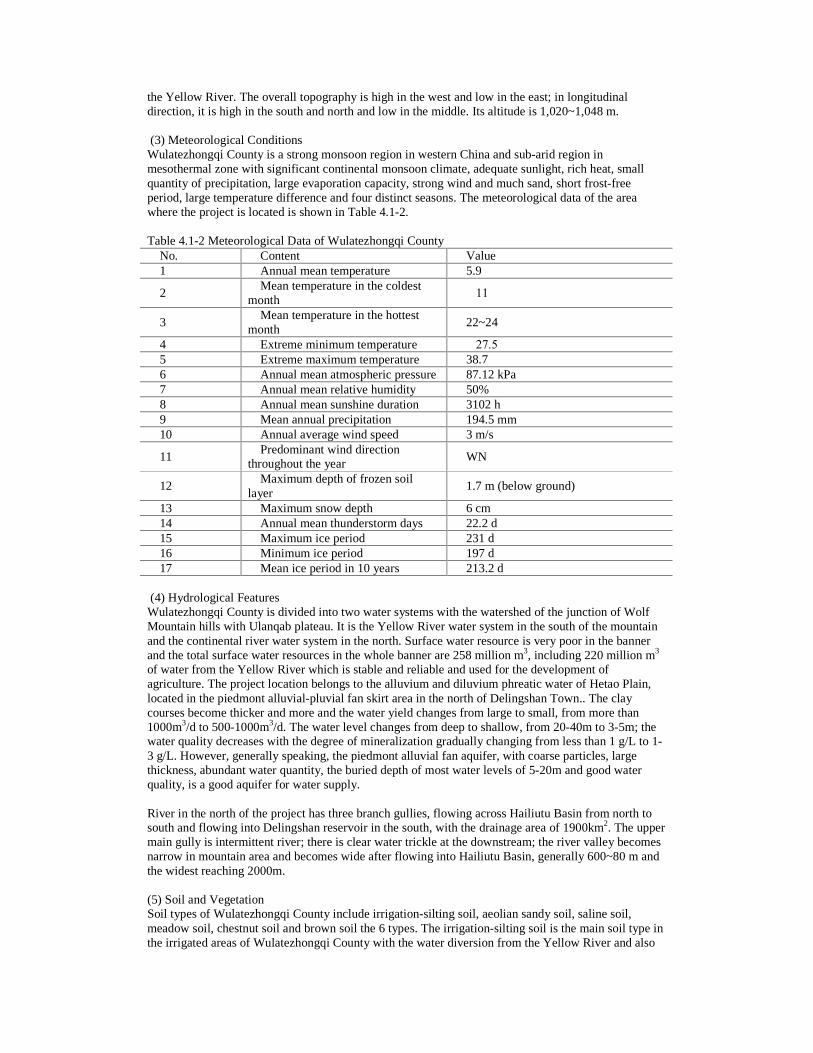
the Yellow River. The overall topography is high in the west and low in the east; in longitudinal direction, it is high in the south and north and low in the middle. Its altitude is 1,020~1,048 m. (3) Meteorological Conditions Wulatezhongqi County is a strong monsoon region in western China and sub-arid region in mesothermal zone with significant continental monsoon climate, adequate sunlight, rich heat, small quantity of precipitation, large evaporation capacity, strong wind and much sand, short frost-free period, large temperature difference and four distinct seasons. The meteorological data of the area where the project is located is shown in Table 4.1-2. Table 4.1-2 Meteorological Data of Wulatezhongqi County
No. Content Value 1 Annual mean temperature 5.9 �
2 Mean temperature in the coldest
month �11 �
3 Mean temperature in the hottest
month 22~24 �
4 Extreme minimum temperature �27.5 � 5 Extreme maximum temperature 38.7 � 6 Annual mean atmospheric pressure 87.12 kPa 7 Annual mean relative humidity 50% 8 Annual mean sunshine duration 3102 h 9 Mean annual precipitation 194.5 mm 10 Annual average wind speed 3 m/s
11 Predominant wind direction
throughout the year WN
12 Maximum depth of frozen soil
layer 1.7 m (below ground)
13 Maximum snow depth 6 cm 14 Annual mean thunderstorm days 22.2 d 15 Maximum ice period 231 d 16 Minimum ice period 197 d 17 Mean ice period in 10 years 213.2 d
(4) Hydrological Features Wulatezhongqi County is divided into two water systems with the watershed of the junction of Wolf Mountain hills with Ulanqab plateau. It is the Yellow River water system in the south of the mountain and the continental river water system in the north. Surface water resource is very poor in the banner and the total surface water resources in the whole banner are 258 million m3, including 220 million m3 of water from the Yellow River which is stable and reliable and used for the development of agriculture. The project location belongs to the alluvium and diluvium phreatic water of Hetao Plain, located in the piedmont alluvial-pluvial fan skirt area in the north of Delingshan Town.. The clay courses become thicker and more and the water yield changes from large to small, from more than 1000m3/d to 500-1000m3/d. The water level changes from deep to shallow, from 20-40m to 3-5m; the water quality decreases with the degree of mineralization gradually changing from less than 1 g/L to 1-3 g/L. However, generally speaking, the piedmont alluvial fan aquifer, with coarse particles, large thickness, abundant water quantity, the buried depth of most water levels of 5-20m and good water quality, is a good aquifer for water supply. River in the north of the project has three branch gullies, flowing across Hailiutu Basin from north to south and flowing into Delingshan reservoir in the south, with the drainage area of 1900km2. The upper main gully is intermittent river; there is clear water trickle at the downstream; the river valley becomes narrow in mountain area and becomes wide after flowing into Hailiutu Basin, generally 600~80 m and the widest reaching 2000m. (5) Soil and Vegetation Soil types of Wulatezhongqi County include irrigation-silting soil, aeolian sandy soil, saline soil, meadow soil, chestnut soil and brown soil the 6 types. The irrigation-silting soil is the main soil type in the irrigated areas of Wulatezhongqi County with the water diversion from the Yellow River and also
the main soil type of the project location; the aeolian sandy soil mainly distributes in the zone along the outer edge of torrents alluvial fan in irrigated areas; the saline soil mainly distributes in the both sides of the low-lying terrain, poor drainage areas and drained gullies in piedmont plain; the meadow soil scatters in terraces along river and some saliferous wastelands; the chestnut soil mainly distributes in the southeastern hilly regions; the brown soil is the most major soil type of the whole banner and the main type of pastoral soil. Wulatezhongqi County is located in semi-desert zone with serious desertification, sparse vegetation, small quantity of arable land, large quantity of wasteland and the main body of desert steppe. The natural grassland has sparse and low vegetation, with the main body of perennial under-shrubs and perennial tufted grasses. (6) Animal and Plant Resources The wild seed plants in Wulatezhongqi County include 67 families, 255 genera and 426 species, of which: the plants with feeding value include 42 families, 150 genera and 289 species with the pasture of grass family ranks top among the forage seed, 29 genera and 58 species; the secondary is compositae, 20 genera and 49 species; the plants with introduction value include 5 families, 7 genera and 12 species; the plants with medicinal value include 186 species, mainly including Ephedra, Rheum Rhaponticum, purslane, stellaria root, Vaccaria, Root of Erect Hypecoum, Prunus Mongolica, licorice, Bunge Corydalis Herb, Polygala, Cynomorium, dodder seed, anemarrhena, henbane, rehmannia root, plantain seed, root of straight ladybeel, oriental wormwood, dandelion, cocklebur, the stem or leaf of cattail, large-leaf gentian root, desert cistanche and gromwell, etc. According to the preliminary survey, wild animals living in the whole banner include: wild ass, blue sheep, Mongolian gazelle, Tuanyang, goral, wolf, leopard, fox, pheasant, chukar, quail, wild duck, Difu, white stork, magpies, crow, eagle, owl, glede, common crane, swan, hare, Steppe Cat, badger, lynx, hedgehog, ground squirrel, squirrel, and snake, etc. 2) Brief Introduction to Social Environment Wulatezhongqi County includes 3 villages: Hongfeng, Shilanji and Wuliangsutai; 5 towns: Delingshan, Hailiutu, Shihahe, Wengeng and Wujiahe; 8 Sumu: Bayin, Bayinhatai, Bayinhanggai, Chuanjing, Hulesitai, Sanggendalai, Wulan and Xinhure. Till the end of 2004, the total population of the whole banner is 139,867, increasing by 1.12% comparing with the previous year. Among the total population, urban population is 29,851, increasing by 7.26%; non-urban population is 110,016, increasing by 0.42%. In 2006, GDP of 876.85 million Yuan was completed, 10.9% more than that of the previous year calculated according to comparable prices. The industrial structure has been further adjusted, from 56.8: 20.4: 22.8 of the previous year to 53.4: 24.3: 22.4.Wulatezhongqi County owns the national category-1 seasonal landway port-Ganqimaodao Port. Its import and export growth is rapid. In 2006, the total volume of foreign trade of the whole banner achieved 36.26 million Yuan. Of which: the total import was 17.46 million Yuan and the total export was 18.8 million Yuan. There are no physical cultural relics and historic sites within this project area after the retrieval on the local chronicles, statistical yearbook etc. and confirmed by the Wulatezhongqi county cultural relics control center. 4.1.2.3 Wulatehouqi County 1� Natural environment �1�Geographic location This project is located at the Industrial Park of Wulatehouqi County, which is in the northwest of the city of Bayannao'er in Inner Mongolia autonomous region at the north latitude of 40°40 �42°22 and the east latitude of 105°14 �107°36 , with the Yinshan Mountains crossing the region from west to east, next to Wulateqianqi County and Wulatezhongqi County at the east, abutting on Alxa Left Banner at the west, connecting with Hangjinhouqi County and Dengkou County, bordering the State of Mongolia at the north with a 195.25km borderline. With the length of 210km from east to west and the width of 130km from south to north, covering an area of 24925 km2, Wulatehouqi County has the largest land area within Bayannao'er with its governmental office 50km away form the Linhe District of Bayannao'er.
�2�Topography and physiognomy The topography and physiognomy in Wulatehouqi County are complicated with the Yinshan Mountains crossing the southern area, forming a watershed between Hetao Plain and the Northern Plateau. The entire landform can be divided into mountainous region, by 15.1%, low mountains and hills, by 10.3%, sand gravel Gobi Plateau, by 52.9%, Gobi dunes and sands, by 20.4%, and piedmont alluvial plain, by 1.3%. There are six major runways within the region, featured by flash flood when heavy raining while in dry season, dried up. The physiognomy is higher in the southern part than that in the northern part of the region, averaging over 1500 meters above sea level with a peak at 2365 meters, belonging to high and cold zone. The major mountains are Erlangshan Mountain and Zagela Mountain. �3�Meteorological conditions Located at the desert zone of Inner Mongolia plateau, belonging to continental arid and semiarid region in temperature-tropic zone, Wulatehouqi County is featured by continental climate, where the climate is arid, less but concentrated rainfall, high evaporation, dry and windy, great difference in temperature during day and night and plenty of sunshine, with the annual mean air temperature of 3.0-6.8�, the yearly maximum mean air temperature of 37.4� and the yearly minimum mean air temperature of -37.1� according to yearly meteorological data. The annual freeze-up period is five months with a maximum depth of frozen ground by 1.8m. The yearly mean amount of precipitation is 115-250mm, asymmetrically concentrating on June to August, accounting for about 70% of the total rainfall in the year. The yearly mean evaporation is 2014mm, the annual mean sunshine duration is 3098-3250 hours and the yearly strong wind (wind velocity) is �17.0m/s. �4�Hydrogeology The surface water within the region of Wulatehouqi County is divided into two major water systems, south of the watershed is the external drainage on the Yellow River erosion basis, totally 13 runways, most of which are intermission rivers with less water; north of the watershed is the interior drainage, running from south to north, finally flowing into the Gobi and deserts areas within the Banner and Mongolia, almost no surface runoffs can be seen owing to less water amount. The underground water is mainly comprised of water from atmospheric condensation infiltration, leakage from irrigation channels and mountain lateral seepage. The total amount of the average water resource of the Banner is 21297m3�of which the annual surface runoff is 5427 m3�and the underground water is 15980 m3�with a total workable underground water resource of 8910 m3. In terms of geology, the formation lithology is mainly made up of loam soil, sandy loam and fine sand, under the stratum below 2m-50m is sandy loam and fine sand, below 50 meters is coarse sand, gravels and pebbly sand. �5�Vegetation and creatures Of abundant wildlife resources, there is Ovis ammon, bharal, wild ass, Mongolian gazelle, fox and wolf and there are 430 species in 63 families of wild plants, of which cynamorlum herba cistanches, known as the “Ginseng in desert”, is a precious medicinal herb with an annual output to 100000 kg. In addition, Cynomorium coccineum and black moss have long enjoyed a good reputation, selling all over the country. At present, the primitive ecosystem in this region does not exist any longer; the surface vegetation has been basically replaced by artificial vegetation due to severe desertization. �6�Soil The soil in Wulatehouqi County has 6 soil groups, 13 subgroups, 60 soil genus and 4 non-pedological features, totally in 16 soil mapping units. The distribution of agrotype from southeast to northwest in turn is brown soil, weak brown desert soil and gypsum brown desert soil and even a small quantity of mountain chestnut soil in the areas above 2000 meters. The mound meadow soil is formed along intermittent rivers, in flood plains and at the edges of mountain diluvia sectors under the influence of underground water. There is a small amount of swamp soil and meadow soil distributing over the low-lying wetlands, among which solonchak scatters. The grey-brown desert soil covers the largest area in the Banner, by 50%, and the brown oil, by 25% and non-pedological features, by 17% and other soil, by 1%. 2� Profile of social environment In 2005, the gross amount of economy of Wulatehouqi County increased from 0.44676 billion Yuan at the end of the Ninth Five-Year Plan to 1.5 billion Yuan, reaching 3400 dollars per capita, yearly increasing by 33%, with the proportion of the three industries reaching to 7.6:66.7:25.7, resulting in financial total revenue of two hundred and seventy five million Yuan, increasing by 74%�with the economic output leaping to fourth of the City. the urban per capita disposable income and the per

capita net income of farmers and herdsmen of the Banner respectively reached 7283 Yuan and 2097 Yuan, keeping the double-digit growth. T During the period of the Tenth Five-Year Plan, one hundred and ten million Yuan was invested in traffic and road construction, newly, alterably and additionally constructing the road of 340 km with the total length of highways open to traffic throughout the Banner reaching 1100 km.There was one 220 kilovolt power transmission station with one under construction, two 110 kilovolt power transmission stations and 35 kilovolt power transmission stations within the Banner with the total mileage of distribution lines reaching 1100 km and the yearly total capability for load increasing to 350,000 KW.The total cultivated area of the Banner reached 70,000 mu and the livestock population reached 727,200.The fiscal expenditure used for science and technology, education, culture, sanitation and sports reached 160 million Yuan, an average increase of 18� year by year. During the period of the Tenth Five-Year Plan, 6801 urban employment positions had been added to in five years, the re-employment of the laid-off and unemployed person was 3030 persons (times), controlling the registered unemployment rate in cities and towns under 4.7�, accumulatively transferring 4363 surplus labor force in farming and stockbreeding areas.. Cultural relics and historic sites include Yinshan rock paintings, stone-chambered tomb groups, the inner and outer city walls and wall barriers of the Great Wall in the Zhao, Qing and Han Dynasties as well as the fossils of Protoceratops and the fossils of Ceratopsian eggs in three places. There are no physical cultural relics and historic sites within this project area after the retrieval on the local chronicles, statistical yearbook etc. and confirmed by the Wulatehouqi county cultural relics control center. 4.1.2.4 Wuyuan County 1� Natural environment �1�Geographic location Wuyuan County is located o n the west of Inner Mongolia Autonomous Region, at the middle of Bayannao’er, on the north bank of the Yellow River and in the middle of Hetao Plain, at the east longitude of 107° 35 20�-108° 37 50� and north latitude of 40° 46 30�-41° 16 45�, next to Wulateqianqi County at the east, bordering Linhe District at the west, across the Yellow River from Hangjin Banner at the south, north of Yinshan Mountain, bordering Wujia River and connecting with Wulatezhongqi County, covering an area of 2493km2 with the total population of 280,000 (2004), governing seven townships: Longxinchang Town, Taerhu Town, Xinzhonggong Town, Tianjitai Town, Shengfeng Town, Bayintaihai Town, Yindingtu Town and state-own Jianfeng Farm. �2�Topography The territory of Wuyaun County belongs to the Yellow River alluvial plain since the Yellow River is running through the region from west to east at the south-southwest. The topography is featured by a slight slope, high southwest and low northeast, with a natural slope at 1/5000�1/7000 from west to east and 1/8000�1/10000 from south to north, and the ground level is 1 019�1 035.3 meters and the highest point above sea level is 1042 meters. The physiognomy can be divided into terrace, erosion accretion topography, the aeolian dune in accretion topography according to the cause of formation or alluvial plain, dunes, lake, high land and low-lying land according to conformation. �3�soil The soil structure in Wuyuan is formed based on the development and variation of the alluvial deposits from the Yellow River, belonging to intrazonal soil, generally through the stages of deposition and erosion, meadow, salinization, paludification and irrigation slaking. According to the result of the second soil census in 1983, the soil can be divided into 5 soil groups of irrigation-silting soil, solonchak, alkali soil, aeolian sandy soil and meadow soil in 8 subgroups, 26 soil genus and 268 soil local types. The bulk density of soil is between 1.32�1.51 with the scope of porosity by 41.6�49.81%, commonly in basicity. The soil nutrients comprise of rich kalium, medium phosphorus and lower OM and total nitrogen, where the equilibrium content of available K is 305.2ppm, exceeding the standard of Class I, the equilibrium content of available P is 11.26ppm, belonging to Class III, the equilibrium content of total nitrogen is 0.0732%, belonging to Class IV, the equilibrium content of OM is 1.109%, belonging to Class IV, according to the grading standards of national soil nutrient contents.
The soil texture and configuration is very complicated in terms of areal distribution, featured by: much sandiness soil covering 40.41% of the total area, over Minzu village, Fengyu village, Bayan village, Haiziyan village and Bashi village in the west or northwest area of the county; much red mud soil covering 40.87% of the total area, over Shengfeng, Hesheng, Chengguan and Meilin villages; the proportion of the mineral soil and loamy soil is much larger, respectively covering 38.5% and 38.2% of the total area, over Jinqi and Jingyanglin villages close to the Yellow River; the loamy soil is of the largest area covering 59.23 of the total area in the eight villages of Nairi, Yongli, Shanhe, Xiangyang, Fuxing, Taohai, Rongfeng, Chengnan in the middle of the county. With severe soil salinization, the salinization area is 249,500 mu, covering69.11% of the total area in the county. �4�Engineering geology As for geotectonic element, Wuyuan belongs to the latitudinal tectonic belt from Yinshan Mountain and Tianshan Mountain, and changes into inland downfaulted basin under the impact of Neocathaysian tectonic system, becoming part of Erdos platform depression, where the base is Archean metamorphic rocks. Depressed at the end of Mesozoic Era, the landform receives continental deposit; during the Himalayan orogeny in the Tertiary period, massive and thick deposits from the Tertiary period piles up since the piedmont depression begins to break and the Hetao Basin rapidly sinks due to heavily swelling of Yinshan Mountain, when the climate is dry and hot, the deposits are oxygenized into red stratum with higher salinity. The entire territory belongs to Hetao Plain, covered with loose stratum of the Quaternary Period, depositing thicker lake facies stratum, where the upper is the alleviation and aeolian deposits with the main lithology of interbedding of fine sand, silt and sand clay, featured by clear sand bedding by 10-70m of thickness; the middle is the alternating layer between lake and river, with the main lithology of interbedding of sludge fine sand and clay; the bottom is the massive and thick lacustrine deposits layer from the Quaternary Period, with the main lithology of sludge and sand clay. The base landform belongs to Yellow River alluvial plain and the engineering geology is basically the same as that at the county seat, where the surface layer is mainly comprised of Yellow River alluvial deposits, with the lithology of fine sand, silt and clay, under which is the lacustrine deposits, with the lithology of sub-clay and clay with gravel layer among them. The base holding capacity: it is 10-14t/m2 for sub-clay with maximum frozen depth of 1.23m and the underground water of 1-2m, from the overall perspective, the base engineering site is very good without obvious unfavorable geology, basically suitable for use of land in construction. �4�Gydrologic condition There are so many deflation hollows formed by Yellow River aluvial deposit under the impact of aeolian erosion for a long time and the natural moats formed by erosion of Yellow River’s change its course, which gradually form into various lakes (locally called Boer Holes) due to water accumulation all year around. There are 171 lakes with the area more than three mu, covering a total area of 54,500 mu, of which there are five lakes with the area more than 1000 mu, covering an total area of 10,600 mu, 37 lakes with the area more than 100 mu, covering a total area of 13,300 mu. There are 116 lakes with the depth mare than 1.5m, covering a total area of 27,100 mu. In 1986, the used lake area was 38,000 mu, accounting for 70%. �5�Hydrogeological condition The underground water distribution is broad and abundant, comprising of phreatic water, shallow confined groundwater and deep confined water. The shallow water and phreatic aquifer from the Quaternary aquifer have an average thickness of 60m with the peak at 120m, where the embedding depth of phreatic water is relatively shallow and the LWL is 2�3m away from the surface with an annual variation of 1�2.7m, deeper in higher land and shallower in low-lying land and irrigated area. The monthly variation of the embedding depth changes greatly due to the leakage of irrigation channels and irrigation water, featured by the underground water level rises during irrigation and decreases when irrigation is stopped. The deep confined water in the settled layer of Lower Pleistocene at the mid-Mesozoic Quaternary is mostly buried under the stable dirt bed, where the semi-confined aquifer (Q+4 aquifer in short) has the most thickness. Under the impact of tectogenesis, the county can be divided into three hydrogeological zones: the latent uplift zone in the south along the Yellow River where the base is latent uplifting and
the buried depth of aquifer plate is 50130m and the thickness is 30100m and the specific capacity
per well is 5 10m2/h; the deep depression zone centered on Yongsheng at Yongli village and Liansheng at Yindingtu village in the middle of the county, where the buried depth of aquifer plate is 130�210m and the thickness is 100�160m and the specific capacity per well is 10�20m2/h; and the shallow depression zone in the north and east areas of the county, where the buried depth of aquifer
plate is 160m and the thickness is 90100m and the specific capacity per well is 5�10m2/h. According to the distribution of phreatic water, the county can be divided into bittern zone, salt water zone, upper-fresh-bottom-salt water zone and fresh water zone. Replenishment runoffs and drainage conditions: the supply of underground water is mainly from irrigation water, annual average of 669.5 million m3/h, and then annual average of 111 million m3/h from infiltration of atmospheric precipitation, and the comprehensive replenishment of annual average of 780.5 million m3/h. the inflow and outflow of groundwater runoff is basically the same, featured by seeping when the Yellow River water level is high and regressing when the level is lower with a less difference. �6�Climate and weather Wuyan County has four distinct seasons with fine weather more than rainy weather and the transmittance of light of the air is very good with abundant light, the intension of solar radiation is very strong with plentiful light energy resources and heavy evaporation capacity; the total annual average sunshine hours are 3230.9 and the percentage of sunshine in an average is 73%. The annual mean temperature is 6.1�; the amplitude of annual extreme air temperature is 73.1�, the annual amplitude is 35.9�; the annual evaporation is 2039.2mm; annual mean frost-free period is 158 days; the average annual thickness of frozen soil layer is 100�120cm, where the plow layer is frozen in late Oct and melted in late April with a frozen period of 180 days; being windy, the annual mean wind velocity of Wuyan is 2.7 m/s. �7�Land resource The total area of various land classifications within the Territory of Wuyuan County is 3,739,300 mu, converting into 2492.9 km2, which can be classified into 39 kinds in 8 classifications according to the classification standards in national Technological Rules of Survey About The Present Situation of Land Use.The arable land is 1,607,600 mu, accounting for 42.99% of the total land area�Garden plot is 1000 mu, accounting for 0.03% of the total land area�Woodland is 128,200 mu, accounting for 3.43% of the total land area�Meadowland is 297,500 mu, accounting for 7.95% of the total land area�Residential, industrial and mining land is 144,600 mu, accounting for 3.87% of the total land area�Lands used for transportation is 24,100 mu, accounting for 0.64% of the total land area�Water area is 350,000 mu, accounting for 9.37% of the total land area�Unused land (including the land hard to use) is 1,186,400 mu, accounting for 31.27% of the total land area. �8�Vegetations The natural vegetations include Cacumen Tamaricis, dryland willow, precarious, reeds, Chinese wildrye, Tribulus terrestris and wormwood. With the expansion of arable and irrigated area, the rising of groundwater level and the aggravation of soil salinization, the vegetation communities have been superseded by artificial vegetations. According to census, there are more than 200 wild plants in 99 species of 15 families in the county with a vegetation coverage rate of 30�50%, where the artificial vegetation is mainly comprised of farm crops and forest plantation�There are six kinds of natural vegetations at present, respectively including: the sand vegetation distributing over aeolian sandy soil and sandlot (such as white Tribulus terrestris, caltrop, Agriophyllum aranarium, Artemisia desertorum and liquorice); the drought-resistance meadow vegetation distributing over relatively highland (such as Peganum harmala, Sophora alopecuroides and celery wormwood); the wetland meadow vegetation distributing over the low-lying places under the high mounds (such as Chinese wildrye, Melilotus officinalis (L. ) Pallas, chickling, reeds, Xanthium sibiricum Patrin, Cirsium segetum Bunge, dandelion, China ixeris, semen plantaginis, Herba Polygoni Avicularis, Johnson evening primrose and sedge); the aquatic meadow vegetation distributing over the flat bogs with perennial or seasonal water (such as reeds, polboschoenus sp, and Typha angustifolia); the salt-resistance vegetation(such as Cacumen Tamaricis, Achnatherum splendens, white Tribulus terrestris, narrow-leaved oleaster, and crawling reeds); the halophytic vegetation distributing over the solonchak (such as Kalidium foliatum, Suaeda and Halimocnemis).

�9�Wildlife According to census, except the vanished Mongolian gazelle and wolf, the wildlife in Wuyuan County includes fox, badger, rabbit, Pallas cat and hedgehog and there are more than 200 wild plants, belonging to 146 species in 99 genuses of 35 families. 2�Social environment In 2008, the total output value in Wuyuan achieved 4.659 billion Yuan, a growth of 21.3 percent year-on-year; the structure of the three industries was adjusted from 35.9�36.1�28 of the last year to 32.2�38�29.8. The investment in fixed assets reached 3.5 billion Yuan, increasing 15% year-on-year. The urban per capita disposable income reached 11,954 Yuan, increasing 22.2% year-on-year; the rural per capita net income reached 7,189 Yuan, increasing 33.7% year-on-year. The energy consumption per 10000 Yuan GDP decreased by 5.1%, the sulfur dioxide emissions decrease by 917t, the emission of chemical oxygen demand decreased by 5029t and various indexes concerning energy conservation and emission reduction were controlled within the scope of the requirements by the City of Bayannao’er. There are no physical cultural relics and historic sites within this project area after the retrieval on the local chronicles, statistical yearbook etc. and confirmed by the Wuyuan county cultural relics control center. 4.1.2.5 Hangjinhouqi County 1� Outlines of natural environment �1�Geographic location Located at the west of the City of Bayannao’er, Hangjinhouqi County is situated in the Hetao Plain, bordering Linhe Town at east, close to Wulanbuhe Desert and Dengkou County at west, opposite to Hangjin Banner in Erdos City at south, backing to Yinshan Mountain at north close to Wulatehouqi County, with geographical coordinates of east longitude 106°34 to 107°34 , north latitude 40°26 to 41°13 , covering an area of 1644km2, and 87km in length from the south to the north and 52km in width from west to east. �2�Topography and physiognomy The landform of Hangjinhouqi County is mainly comprised of three forms of alluvial plain�aggraded flood plain and floodplain, taking the shape of higher southwest and lower northeast, slightly declining from southwest to northeast with an altitude of 1032-1050m. �3�Characteristic of the climate Located above north latitude 40°, Hangjinhouqi County belongs to continental climate in temperate zone, featuring with desiccation, longer sunlight, strong diurnal amplitude, the annual mean air temperature of 8.5�, the annual mean rainfall of 138.2mm, the evaporation capacity of 2096.4mm, the day-night average temperature difference of 8.2�, the annual mean frost-free period of about 130 days, the average wind velocity of 2.3m/s and the annual mean bold wind days of 19.9; the annual sunshine duration is more than 3220 hour and the accumulated temperature is more than 3520�,with a sunlight rate of 73%, it is one of the areas with the most abundant light energy resource in the country; it is one of the eight major gravity irrigation areas of the country with 17 km of Yellow River flowing through the Banner, resulting in an annual flow to cross the border of 22.6 billion m3. �4�Land resource The land area of the whole Banner is 2,650,000 mu, of which farming land is 1,750,000 mu, land for construction is 185,000 mu, land for residents and industry and mining is 173,000 mu, traffic land is 12,000 mu, the unused land is 714,000 mu and the reserve land for other projects industry is 2000ha, converted about 30,000 mu. �5�Water resources The Yellow River flows through the Banner for 17 km, where Wula River, Yangjiahe River and Huang-ji Channel can averagely channel water amount of 0.88 billion m3; the general trunk draining canal flows through the north part of the Banner, discharging an annual delivery volume of 0.12 m3�and the pondage of the lakes and pools within the territory reaches 5,000,000 m3.
The groundwater resource is very rich with the annual gross amount of water resources reaching
265,000,000 m3, of which the groundwater available yield is 45,100,000 m3 the groundwater resource with the mineralization of water less than 2g/L is 55,730,000 m3. At present, the annual groundwater
available yield is 9,000,000 m3 buried at a mean depth of 1.93m, differing from mean 1.11m during high flow period to mean 2.5m during low flow period with an annual mean variation of 1.89m. 2� Outlines of social environment In 2007, the GDP of the Banner reached 5.788 billion Yuanand the financial revenue reached 372,000,000 Yuan. The industrial economy in Hangjinhouqi County develops very rapidly and industries such as wine and liquor manufacturing, tomato and vegetable, high-preserved dairying, Strong flour and paper making form wood have gradually became systematic, building up series leading enterprises represented by Hetao Liquor Industry Group, including Yili, Tunhe, Hetao wood industry, Fumeng, Dahaoda, Temier, Dahoutao and Mingxing. Hangjinhouqi County is one of the important production bases for grain and oil in our country, rich in producing high quality agricultural products such as wheat, corn, apple and pear, tomato, honeydew melon, medlar, black and white melon seeds with annual grain output of 400,000 t; vegetables, 300,000 t, oil materials, 25,000 t, tree mallow, 85,000 t, melons, 88,000 t, medicinal materials 5,500 t; annual crop straw productivity reaches 1.6 billion jin, high quality pasturage is 200,000 y; the forest coverage of the Banner is 27.7% and the total reserve amount of the vivid stumpage is 950,000 m3; the livestock population of the Banner is 1,820,000, annually producing 15,330,000 kg of mutton, 14,200,000 kg of pork, 90000 t of milk. With highways connected, transportation in Hangjinhouqi County is very convenient, reaching the mileage of 1700km�The education and medical treatment and sanitation undertakings in Hangjinhouqi County are flourishing, having 13 middle schools, 3 vocational middle schools, 84 primary schools, 2 county-level hospitals, 8 health clinics in towns. There are no physical cultural relics and historic sites within this region after the retrieval on the local chronicles, statistical yearbook etc. and confirmed by the hangjinhouqi county cultural relics control center. 4.2 Evaluation on the situation of regional environment quality 4.2.1 Evaluation on the situation of air environment quality 4.2.1.1 Monitoring items According to the characteristics of the pollution source of the items and the surrounding environment outlines, the monitoring items for the present situation of the air and environment quality include conventional factors of TSP, SO2, NO2 and H2S and NH3. At the same time, the observation of the meteorological elements such as surface wind direction, wind velocity, air temperature and total cloud cover as well as weather conditions and unusual circumstances have been recorded. 4.2.1.2 Monitoring spots The monitoring sampling points for this situation monitoring have been set up at the up wind and down wind directions of the proposed sites of the wastewater disposal project and reclaimed watersupply project within the industrial zone as well as the nearby residential settlements. Specific monitoring spots are shown in Attached drawing. 4.2-1-4.2-5. Totally six monitoring spots have been set up, respectively two at the place one km away from the up wind direction of the prevailing wind at the proposed site of the treatment project of Wuliangsuhai lake lake, two at the construction area and two at two km away from the down wind direction of the construction site. (See Fig. 4.2-1)
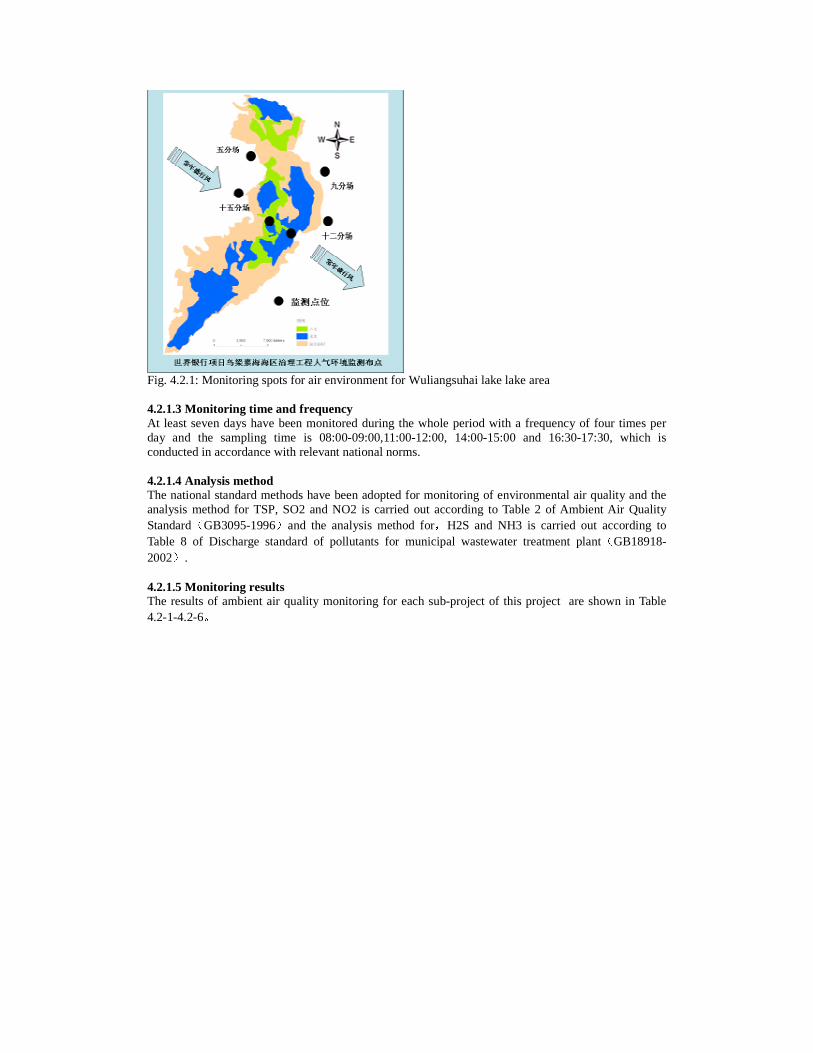
Fig. 4.2.1: Monitoring spots for air environment for Wuliangsuhai lake lake area 4.2.1.3 Monitoring time and frequency At least seven days have been monitored during the whole period with a frequency of four times per day and the sampling time is 08:00-09:00,11:00-12:00, 14:00-15:00 and 16:30-17:30, which is conducted in accordance with relevant national norms. 4.2.1.4 Analysis method The national standard methods have been adopted for monitoring of environmental air quality and the analysis method for TSP, SO2 and NO2 is carried out according to Table 2 of Ambient Air Quality Standard GB3095-1996 and the analysis method forH2S and NH3 is carried out according to Table 8 of Discharge standard of pollutants for municipal wastewater treatment plantGB18918-2002 . 4.2.1.5 Monitoring results The results of ambient air quality monitoring for each sub-project of this project are shown in Table 4.2-1-4.2-6
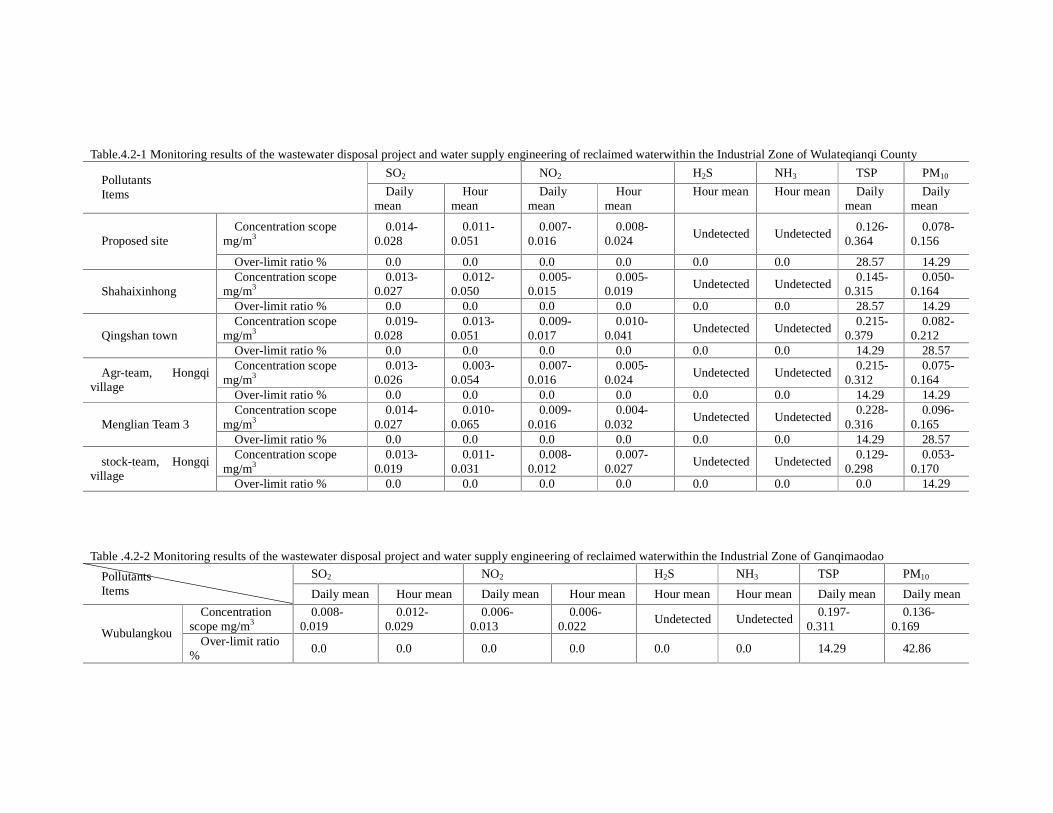
Table.4.2-1 Monitoring results of the wastewater disposal project and water supply engineering of reclaimed waterwithin the Industrial Zone of Wulateqianqi County
SO2 NO2 H2S NH3 TSP PM10 Pollutants Items Daily
mean Hour
mean Daily
mean Hour
mean Hour mean Hour mean Daily
mean Daily
mean
Concentration scope mg/m3
0.014-0.028
0.011-0.051
0.007-0.016
0.008-0.024
Undetected Undetected 0.126-
0.364 0.078-
0.156 Proposed site
Over-limit ratio % 0.0 0.0 0.0 0.0 0.0 0.0 28.57 14.29 Concentration scope
mg/m3 0.013-
0.027 0.012-
0.050 0.005-
0.015 0.005-
0.019 Undetected Undetected
0.145-0.315
0.050-0.164 Shahaixinhong
Over-limit ratio % 0.0 0.0 0.0 0.0 0.0 0.0 28.57 14.29 Concentration scope
mg/m3 0.019-
0.028 0.013-
0.051 0.009-
0.017 0.010-
0.041 Undetected Undetected
0.215-0.379
0.082-0.212 Qingshan town
Over-limit ratio % 0.0 0.0 0.0 0.0 0.0 0.0 14.29 28.57 Concentration scope
mg/m3 0.013-
0.026 0.003-
0.054 0.007-
0.016 0.005-
0.024 Undetected Undetected
0.215-0.312
0.075-0.164
Agr-team, Hongqi village
Over-limit ratio % 0.0 0.0 0.0 0.0 0.0 0.0 14.29 14.29 Concentration scope
mg/m3 0.014-
0.027 0.010-
0.065 0.009-
0.016 0.004-
0.032 Undetected Undetected
0.228-0.316
0.096-0.165 Menglian Team 3
Over-limit ratio % 0.0 0.0 0.0 0.0 0.0 0.0 14.29 28.57 Concentration scope
mg/m3 0.013-
0.019 0.011-
0.031 0.008-
0.012 0.007-
0.027 Undetected Undetected
0.129-0.298
0.053-0.170
stock-team, Hongqi village
Over-limit ratio % 0.0 0.0 0.0 0.0 0.0 0.0 0.0 14.29 Table .4.2-2 Monitoring results of the wastewater disposal project and water supply engineering of reclaimed waterwithin the Industrial Zone of Ganqimaodao
SO2 NO2 H2S NH3 TSP PM10 Pollutants Items Daily mean Hour mean Daily mean Hour mean Hour mean Hour mean Daily mean Daily mean
Concentration scope mg/m3
0.008-0.019
0.012-0.029
0.006- 0.013
0.006-0.022
Undetected Undetected 0.197-
0.311 0.136-
0.169 Wubulangkou
Over-limit ratio %
0.0 0.0 0.0 0.0 0.0 0.0 14.29 42.86
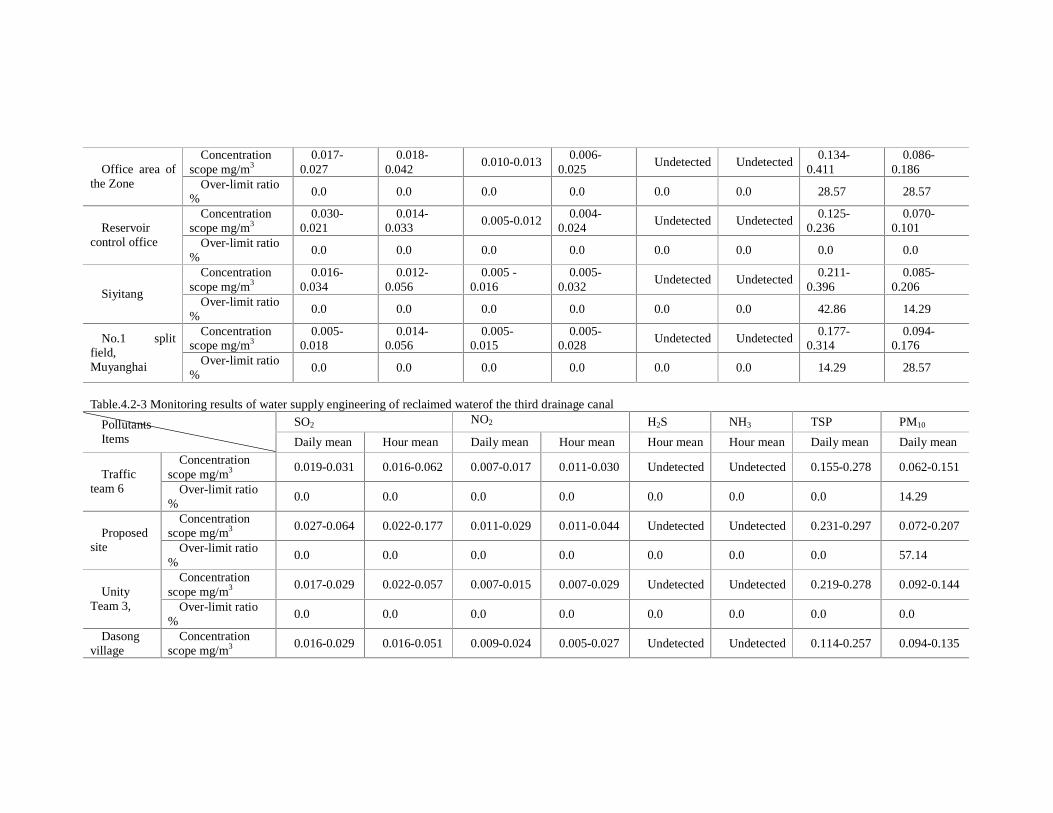
Concentration scope mg/m3
0.017-0.027
0.018-0.042
0.010-0.013 0.006-
0.025 Undetected Undetected
0.134-0.411
0.086-0.186 Office area of
the Zone Over-limit ratio %
0.0 0.0 0.0 0.0 0.0 0.0 28.57 28.57
Concentration scope mg/m3
0.030-0.021
0.014-0.033
0.005-0.012 0.004-
0.024 Undetected Undetected
0.125-0.236
0.070-0.101 Reservoir
control office Over-limit ratio %
0.0 0.0 0.0 0.0 0.0 0.0 0.0 0.0
Concentration scope mg/m3
0.016-0.034
0.012-0.056
0.005 -0.016
0.005-0.032
Undetected Undetected 0.211-
0.396 0.085-
0.206 Siyitang
Over-limit ratio %
0.0 0.0 0.0 0.0 0.0 0.0 42.86 14.29
Concentration scope mg/m3
0.005-0.018
0.014-0.056
0.005- 0.015
0.005-0.028
Undetected Undetected 0.177-
0.314 0.094-
0.176 No.1 split
field, Muyanghai Over-limit ratio
% 0.0 0.0 0.0 0.0 0.0 0.0 14.29 28.57
Table.4.2-3 Monitoring results of water supply engineering of reclaimed waterof the third drainage canal
SO2 NO2 H2S NH3 TSP PM10 Pollutants Items Daily mean Hour mean Daily mean Hour mean Hour mean Hour mean Daily mean Daily mean
Concentration scope mg/m3
0.019-0.031 0.016-0.062 0.007-0.017 0.011-0.030 Undetected Undetected 0.155-0.278 0.062-0.151 Traffic
team 6 Over-limit ratio %
0.0 0.0 0.0 0.0 0.0 0.0 0.0 14.29
Concentration scope mg/m3
0.027-0.064 0.022-0.177 0.011-0.029 0.011-0.044 Undetected Undetected 0.231-0.297 0.072-0.207 Proposed
site Over-limit ratio %
0.0 0.0 0.0 0.0 0.0 0.0 0.0 57.14
Concentration scope mg/m3
0.017-0.029 0.022-0.057 0.007-0.015 0.007-0.029 Undetected Undetected 0.219-0.278 0.092-0.144 Unity
Team 3, Over-limit ratio %
0.0 0.0 0.0 0.0 0.0 0.0 0.0 0.0
Dasong village
Concentration scope mg/m3
0.016-0.029 0.016-0.051 0.009-0.024 0.005-0.027 Undetected Undetected 0.114-0.257 0.094-0.135
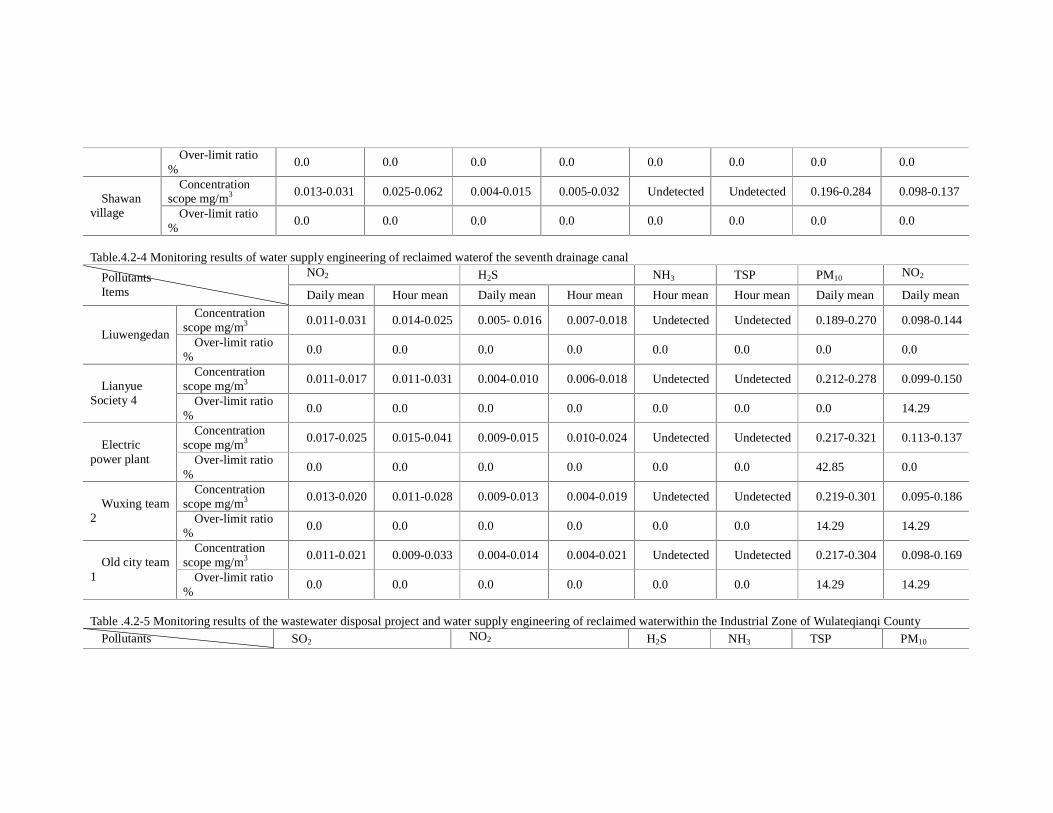
Over-limit ratio %
0.0 0.0 0.0 0.0 0.0 0.0 0.0 0.0
Concentration scope mg/m3
0.013-0.031 0.025-0.062 0.004-0.015 0.005-0.032 Undetected Undetected 0.196-0.284 0.098-0.137 Shawan
village Over-limit ratio %
0.0 0.0 0.0 0.0 0.0 0.0 0.0 0.0
Table.4.2-4 Monitoring results of water supply engineering of reclaimed waterof the seventh drainage canal
NO2 H2S NH3 TSP PM10 NO2 Pollutants Items Daily mean Hour mean Daily mean Hour mean Hour mean Hour mean Daily mean Daily mean
Concentration scope mg/m3
0.011-0.031 0.014-0.025 0.005- 0.016 0.007-0.018 Undetected Undetected 0.189-0.270 0.098-0.144 Liuwengedan
Over-limit ratio %
0.0 0.0 0.0 0.0 0.0 0.0 0.0 0.0
Concentration scope mg/m3
0.011-0.017 0.011-0.031 0.004-0.010 0.006-0.018 Undetected Undetected 0.212-0.278 0.099-0.150 Lianyue
Society 4 Over-limit ratio %
0.0 0.0 0.0 0.0 0.0 0.0 0.0 14.29
Concentration scope mg/m3
0.017-0.025 0.015-0.041 0.009-0.015 0.010-0.024 Undetected Undetected 0.217-0.321 0.113-0.137 Electric
power plant Over-limit ratio %
0.0 0.0 0.0 0.0 0.0 0.0 42.85 0.0
Concentration scope mg/m3
0.013-0.020 0.011-0.028 0.009-0.013 0.004-0.019 Undetected Undetected 0.219-0.301 0.095-0.186 Wuxing team
2 Over-limit ratio %
0.0 0.0 0.0 0.0 0.0 0.0 14.29 14.29
Concentration scope mg/m3
0.011-0.021 0.009-0.033 0.004-0.014 0.004-0.021 Undetected Undetected 0.217-0.304 0.098-0.169 Old city team
1 Over-limit ratio %
0.0 0.0 0.0 0.0 0.0 0.0 14.29 14.29
Table .4.2-5 Monitoring results of the wastewater disposal project and water supply engineering of reclaimed waterwithin the Industrial Zone of Wulateqianqi County
Pollutants SO2 NO2 H2S NH3 TSP PM10

Items Daily mean Hour mean Daily mean Hour mean Hour mean Hour mean Daily mean Daily mean
Concentration scope mg/m3
0.013-0.022 0.011-0.031 0.004-0.014 0.006-0.018 Undetected Undetected 0.148-0.289 0.095-0.135 Lihuiquan
village Over-limit ratio %
0.0 0.0 0.0 0.0 0.0 0.0 0.0 0.0
Concentration scope mg/m3
0.011-0.031 0.017-0.037 0.004- 0.018 0.006-0.029 Undetected Undetected 0.210-0.341 0.097-0.141 Zhongtan
Farm Over-limit ratio %
0.0 0.0 0.0 0.0 0.0 0.0 14.29 0.0
Concentration scope mg/m3
0.018-0.022 0.016-0.041 0.010- 0.016 0.008-0.039 Undetected Undetected 0.234-0.297 0.114-0.194 Proposed
site Over-limit ratio %
0.0 0.0 0.0 0.0 0.0 0.0 0.0 14.29
Concentration scope mg/m3
0.024- 0.038 0.032-0.099 0.008-0.018 0.011-0.029 Undetected Undetected 0.186- 0.348 0.095-0.152 Shagedan
village Over-limit ratio %
0.0 0.0 0.0 0.0 0.0 0.0 14.29 14.29
Table .4.2-6 Monitoring results of the treatment project of Wuliangsuhai lake Lake
SO2 NO2 H2S NH3 TSP PM10 Pollutants Items Daily mean Hour mean Daily mean Hour mean Hour mean Hour mean Daily mean Daily mean
Concentration scope mg/m3
0.011-0.031 0.009-0.045 0.015-0.027 0.010-0.031 Undetected Undetected 0.194-0.357 0.082-0.175 15th
Branch Over-limit ratio %
0.0 0.0 0.0 0.0 0.0 0.0 100
100
Concentration scope mg/m3
0.014-0.024 0.018-0.040 0.015-0.029 0.010-0.032 Undetected Undetected 0.241-0.312 0.093-0.159 5th
Branch Over-limit ratio %
0.0 0.0 0.0 0.0 0.0 0.0 100
100
Concentration scope mg/m3
0.011-0.021 0.019-0.037 0.010-0.030 0.005L-0.028 Undetected Undetected 0.182-0.310 0.073-0.183 9th
Branch Over-limit ratio %
0.0 0.0 0.0 0.0 0.0 0.0 100
100
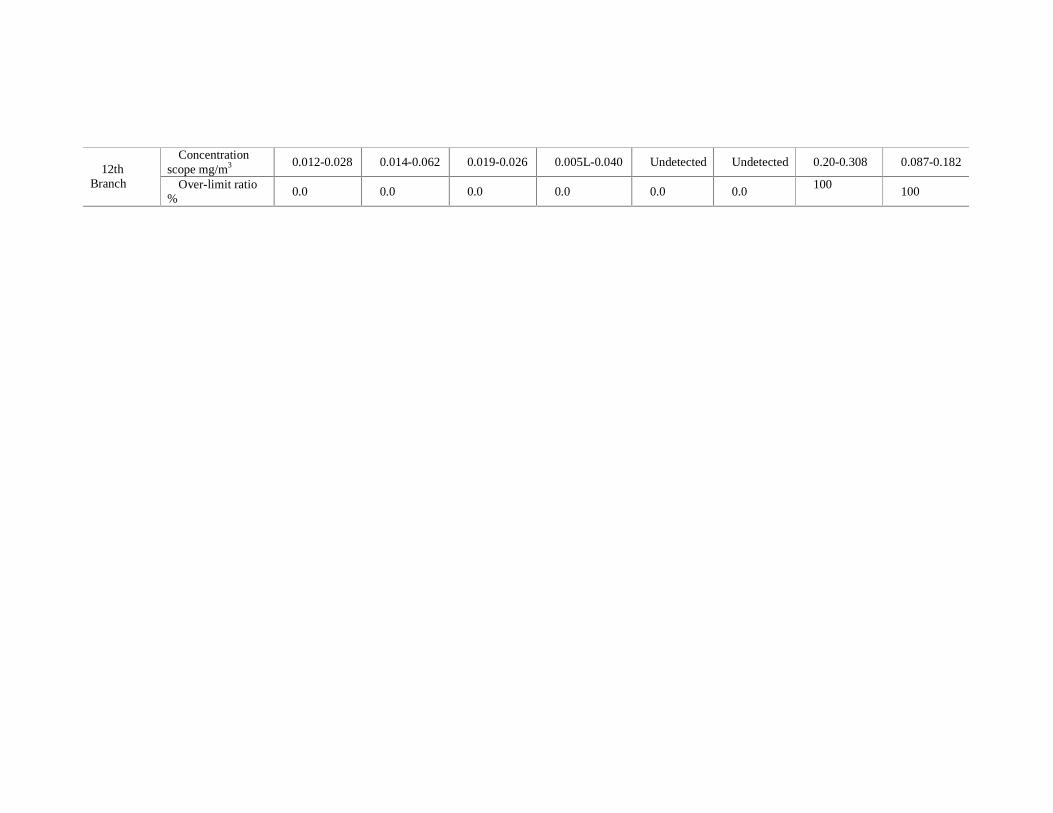
Concentration scope mg/m3
0.012-0.028 0.014-0.062 0.019-0.026 0.005L-0.040 Undetected Undetected 0.20-0.308 0.087-0.182 12th
Branch Over-limit ratio %
0.0 0.0 0.0 0.0 0.0 0.0 100
100
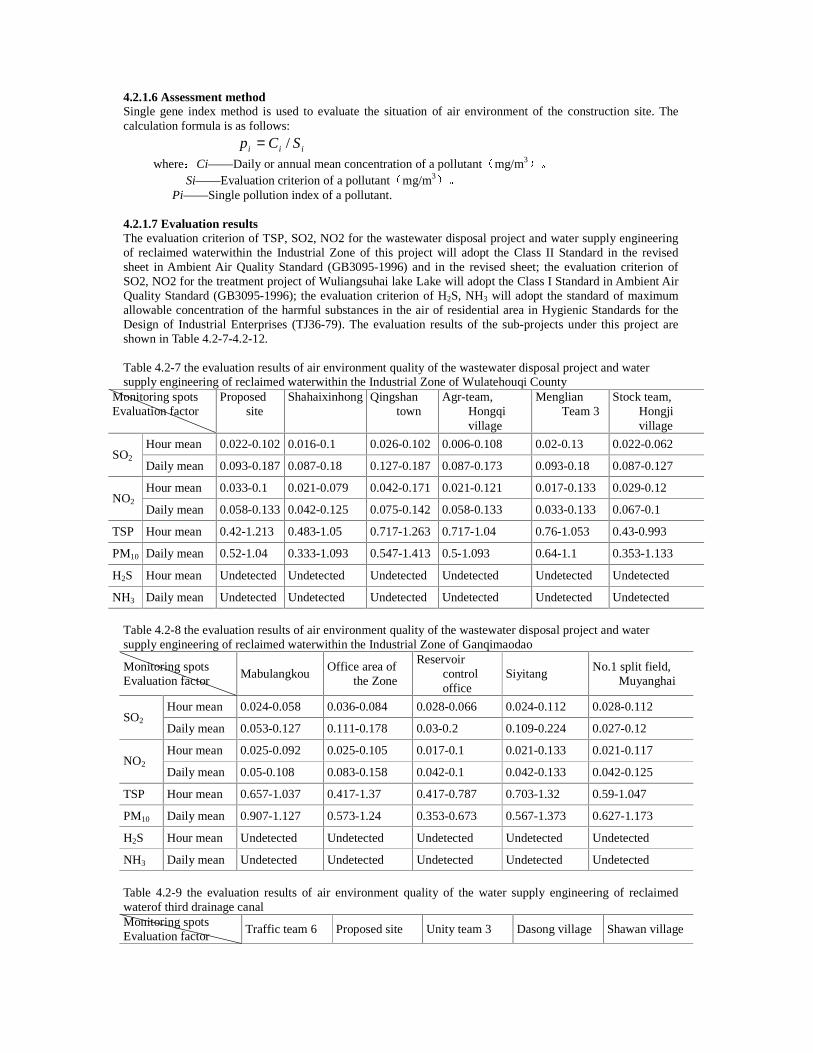
4.2.1.6 Assessment method Single gene index method is used to evaluate the situation of air environment of the construction site. The calculation formula is as follows:
iii SCp /=
where Ci——Daily or annual mean concentration of a pollutant mg/m3 Si——Evaluation criterion of a pollutant mg/m3
Pi——Single pollution index of a pollutant. 4.2.1.7 Evaluation results The evaluation criterion of TSP, SO2, NO2 for the wastewater disposal project and water supply engineering of reclaimed waterwithin the Industrial Zone of this project will adopt the Class II Standard in the revised sheet in Ambient Air Quality Standard (GB3095-1996) and in the revised sheet; the evaluation criterion of SO2, NO2 for the treatment project of Wuliangsuhai lake Lake will adopt the Class I Standard in Ambient Air Quality Standard (GB3095-1996); the evaluation criterion of H2S, NH3 will adopt the standard of maximum allowable concentration of the harmful substances in the air of residential area in Hygienic Standards for the Design of Industrial Enterprises (TJ36-79). The evaluation results of the sub-projects under this project are shown in Table 4.2-7-4.2-12. Table 4.2-7 the evaluation results of air environment quality of the wastewater disposal project and water supply engineering of reclaimed waterwithin the Industrial Zone of Wulatehouqi County
Monitoring spots Evaluation factor
Proposed site
Shahaixinhong Qingshan town
Agr-team, Hongqi village
Menglian Team 3
Stock team, Hongji village
Hour mean 0.022-0.102 0.016-0.1 0.026-0.102 0.006-0.108 0.02-0.13 0.022-0.062 SO2
Daily mean 0.093-0.187 0.087-0.18 0.127-0.187 0.087-0.173 0.093-0.18 0.087-0.127
Hour mean 0.033-0.1 0.021-0.079 0.042-0.171 0.021-0.121 0.017-0.133 0.029-0.12 NO2
Daily mean 0.058-0.133 0.042-0.125 0.075-0.142 0.058-0.133 0.033-0.133 0.067-0.1
TSP Hour mean 0.42-1.213 0.483-1.05 0.717-1.263 0.717-1.04 0.76-1.053 0.43-0.993
PM10 Daily mean 0.52-1.04 0.333-1.093 0.547-1.413 0.5-1.093 0.64-1.1 0.353-1.133
H2S Hour mean Undetected Undetected Undetected Undetected Undetected Undetected
NH3 Daily mean Undetected Undetected Undetected Undetected Undetected Undetected
Table 4.2-8 the evaluation results of air environment quality of the wastewater disposal project and water supply engineering of reclaimed waterwithin the Industrial Zone of Ganqimaodao
Monitoring spots Evaluation factor
Mabulangkou Office area of
the Zone
Reservoir control office
Siyitang No.1 split field,
Muyanghai
Hour mean 0.024-0.058 0.036-0.084 0.028-0.066 0.024-0.112 0.028-0.112 SO2
Daily mean 0.053-0.127 0.111-0.178 0.03-0.2 0.109-0.224 0.027-0.12
Hour mean 0.025-0.092 0.025-0.105 0.017-0.1 0.021-0.133 0.021-0.117 NO2
Daily mean 0.05-0.108 0.083-0.158 0.042-0.1 0.042-0.133 0.042-0.125
TSP Hour mean 0.657-1.037 0.417-1.37 0.417-0.787 0.703-1.32 0.59-1.047
PM10 Daily mean 0.907-1.127 0.573-1.24 0.353-0.673 0.567-1.373 0.627-1.173
H2S Hour mean Undetected Undetected Undetected Undetected Undetected
NH3 Daily mean Undetected Undetected Undetected Undetected Undetected
Table 4.2-9 the evaluation results of air environment quality of the water supply engineering of reclaimed waterof third drainage canal Monitoring spots Evaluation factor
Traffic team 6 Proposed site Unity team 3 Dasong village Shawan village
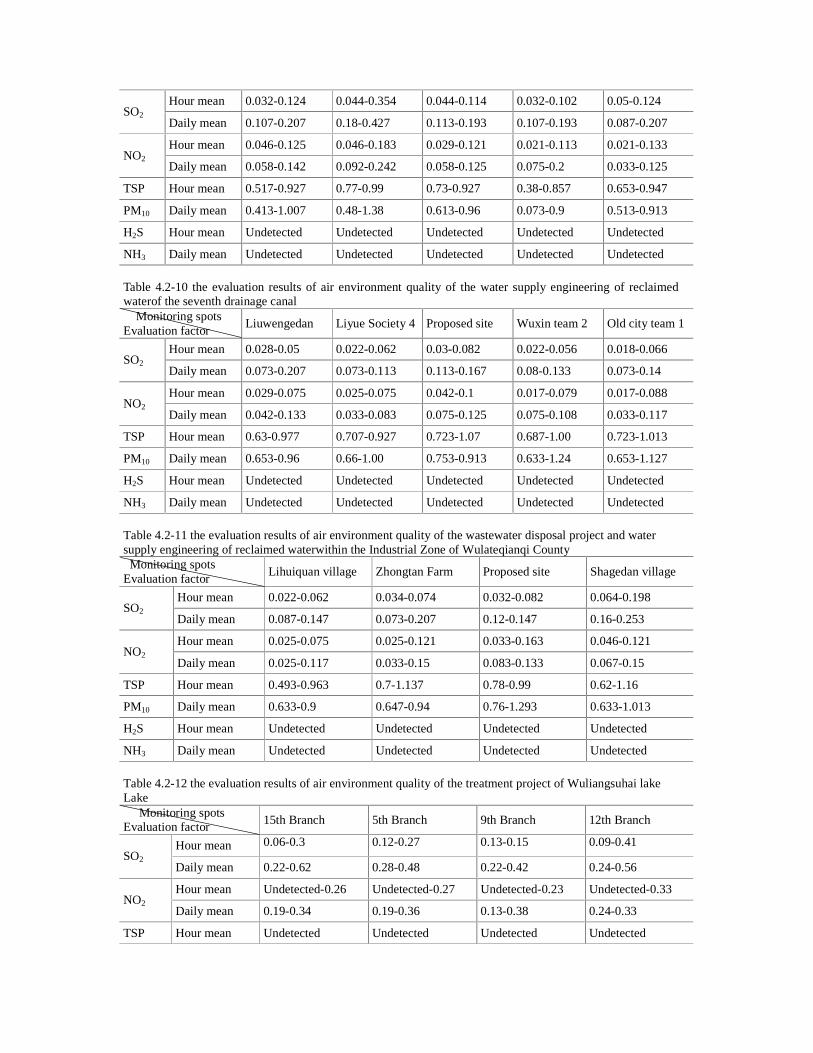
Hour mean 0.032-0.124 0.044-0.354 0.044-0.114 0.032-0.102 0.05-0.124 SO2
Daily mean 0.107-0.207 0.18-0.427 0.113-0.193 0.107-0.193 0.087-0.207
Hour mean 0.046-0.125 0.046-0.183 0.029-0.121 0.021-0.113 0.021-0.133 NO2
Daily mean 0.058-0.142 0.092-0.242 0.058-0.125 0.075-0.2 0.033-0.125
TSP Hour mean 0.517-0.927 0.77-0.99 0.73-0.927 0.38-0.857 0.653-0.947
PM10 Daily mean 0.413-1.007 0.48-1.38 0.613-0.96 0.073-0.9 0.513-0.913
H2S Hour mean Undetected Undetected Undetected Undetected Undetected
NH3 Daily mean Undetected Undetected Undetected Undetected Undetected
Table 4.2-10 the evaluation results of air environment quality of the water supply engineering of reclaimed waterof the seventh drainage canal Monitoring spots Evaluation factor
Liuwengedan Liyue Society 4 Proposed site Wuxin team 2 Old city team 1
Hour mean 0.028-0.05 0.022-0.062 0.03-0.082 0.022-0.056 0.018-0.066 SO2
Daily mean 0.073-0.207 0.073-0.113 0.113-0.167 0.08-0.133 0.073-0.14
Hour mean 0.029-0.075 0.025-0.075 0.042-0.1 0.017-0.079 0.017-0.088 NO2
Daily mean 0.042-0.133 0.033-0.083 0.075-0.125 0.075-0.108 0.033-0.117
TSP Hour mean 0.63-0.977 0.707-0.927 0.723-1.07 0.687-1.00 0.723-1.013
PM10 Daily mean 0.653-0.96 0.66-1.00 0.753-0.913 0.633-1.24 0.653-1.127
H2S Hour mean Undetected Undetected Undetected Undetected Undetected
NH3 Daily mean Undetected Undetected Undetected Undetected Undetected
Table 4.2-11 the evaluation results of air environment quality of the wastewater disposal project and water supply engineering of reclaimed waterwithin the Industrial Zone of Wulateqianqi County Monitoring spots Evaluation factor
Lihuiquan village Zhongtan Farm Proposed site Shagedan village
Hour mean 0.022-0.062 0.034-0.074 0.032-0.082 0.064-0.198 SO2
Daily mean 0.087-0.147 0.073-0.207 0.12-0.147 0.16-0.253
Hour mean 0.025-0.075 0.025-0.121 0.033-0.163 0.046-0.121 NO2
Daily mean 0.025-0.117 0.033-0.15 0.083-0.133 0.067-0.15
TSP Hour mean 0.493-0.963 0.7-1.137 0.78-0.99 0.62-1.16
PM10 Daily mean 0.633-0.9 0.647-0.94 0.76-1.293 0.633-1.013
H2S Hour mean Undetected Undetected Undetected Undetected
NH3 Daily mean Undetected Undetected Undetected Undetected
Table 4.2-12 the evaluation results of air environment quality of the treatment project of Wuliangsuhai lake Lake Monitoring spots Evaluation factor
15th Branch 5th Branch 9th Branch 12th Branch
Hour mean 0.06-0.3 0.12-0.27 0.13-0.15 0.09-0.41 SO2
Daily mean 0.22-0.62 0.28-0.48 0.22-0.42 0.24-0.56
Hour mean Undetected-0.26 Undetected-0.27 Undetected-0.23 Undetected-0.33 NO2
Daily mean 0.19-0.34 0.19-0.36 0.13-0.38 0.24-0.33
TSP Hour mean Undetected Undetected Undetected Undetected
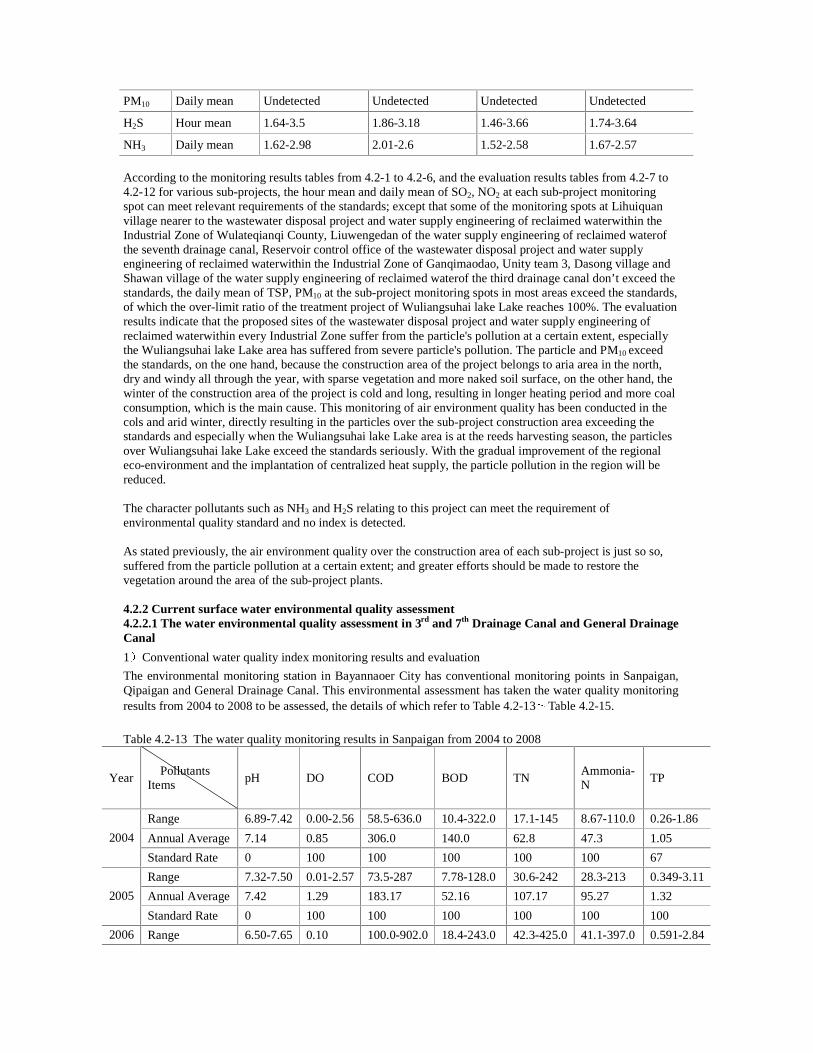
PM10 Daily mean Undetected Undetected Undetected Undetected
H2S Hour mean 1.64-3.5 1.86-3.18 1.46-3.66 1.74-3.64
NH3 Daily mean 1.62-2.98 2.01-2.6 1.52-2.58 1.67-2.57
According to the monitoring results tables from 4.2-1 to 4.2-6, and the evaluation results tables from 4.2-7 to 4.2-12 for various sub-projects, the hour mean and daily mean of SO2, NO2 at each sub-project monitoring spot can meet relevant requirements of the standards; except that some of the monitoring spots at Lihuiquan village nearer to the wastewater disposal project and water supply engineering of reclaimed waterwithin the Industrial Zone of Wulateqianqi County, Liuwengedan of the water supply engineering of reclaimed waterof the seventh drainage canal, Reservoir control office of the wastewater disposal project and water supply engineering of reclaimed waterwithin the Industrial Zone of Ganqimaodao, Unity team 3, Dasong village and Shawan village of the water supply engineering of reclaimed waterof the third drainage canal don’t exceed the standards, the daily mean of TSP, PM10 at the sub-project monitoring spots in most areas exceed the standards, of which the over-limit ratio of the treatment project of Wuliangsuhai lake Lake reaches 100%. The evaluation results indicate that the proposed sites of the wastewater disposal project and water supply engineering of reclaimed waterwithin every Industrial Zone suffer from the particle's pollution at a certain extent, especially the Wuliangsuhai lake Lake area has suffered from severe particle's pollution. The particle and PM10 exceed the standards, on the one hand, because the construction area of the project belongs to aria area in the north, dry and windy all through the year, with sparse vegetation and more naked soil surface, on the other hand, the winter of the construction area of the project is cold and long, resulting in longer heating period and more coal consumption, which is the main cause. This monitoring of air environment quality has been conducted in the cols and arid winter, directly resulting in the particles over the sub-project construction area exceeding the standards and especially when the Wuliangsuhai lake Lake area is at the reeds harvesting season, the particles over Wuliangsuhai lake Lake exceed the standards seriously. With the gradual improvement of the regional eco-environment and the implantation of centralized heat supply, the particle pollution in the region will be reduced. The character pollutants such as NH3 and H2S relating to this project can meet the requirement of environmental quality standard and no index is detected. As stated previously, the air environment quality over the construction area of each sub-project is just so so, suffered from the particle pollution at a certain extent; and greater efforts should be made to restore the vegetation around the area of the sub-project plants. 4.2.2 Current surface water environmental quality assessment 4.2.2.1 The water environmental quality assessment in 3rd and 7th Drainage Canal and General Drainage Canal
1 Conventional water quality index monitoring results and evaluation
The environmental monitoring station in Bayannaoer City has conventional monitoring points in Sanpaigan, Qipaigan and General Drainage Canal. This environmental assessment has taken the water quality monitoring results from 2004 to 2008 to be assessed, the details of which refer to Table 4.2-13 Table 4.2-15.
Table 4.2-13 The water quality monitoring results in Sanpaigan from 2004 to 2008
Year Pollutants Items
pH DO COD BOD TN Ammonia-N
TP
Range 6.89-7.42 0.00-2.56 58.5-636.0 10.4-322.0 17.1-145 8.67-110.0 0.26-1.86
Annual Average 7.14 0.85 306.0 140.0 62.8 47.3 1.05 2004
Standard Rate 0 100 100 100 100 100 67
Range 7.32-7.50 0.01-2.57 73.5-287 7.78-128.0 30.6-242 28.3-213 0.349-3.11
Annual Average 7.42 1.29 183.17 52.16 107.17 95.27 1.32 2005
Standard Rate 0 100 100 100 100 100 100
2006 Range 6.50-7.65 0.10 100.0-902.0 18.4-243.0 42.3-425.0 41.1-397.0 0.591-2.84

Annual Average 7.17 0.10 378.7 97.93 173.3 162.7 1.54
Standard Rate 0 100 100 100 100 100 100
Range 7.61-8.11 0.01-7.05 31.1-298.0 3.40-29.8 2.57-44.7 1.44-34.0 0.14-3.17
Annual Average 7.84 2.36 133.0 13.1 20.3 14.0 1.54 2007
Standard Rate 0 67 100 67 100 67 67
Range 7.75-7.90 1.4-4.2 30.0-64.0 5.5-8.6 2.57-10.8 1.17-7.08 0.219-4.8
Annual Average 7.84 2.7 50.5 7.03 5.25 3.22 1.54 2008
Standard Rate 0 75 100 50 100 50 50
Table 4.2-14 The water quality monitoring results in Qipaigan from 2004 to 2008
Year Pollutants Items
pH DO COD BOD TN Ammonia-N
TP
Range 7.54-8.15 0.00-0.46 218.0-2228.0 23.3-649.0 6.32-118.00 2.84-54.2 0.67-2.01 Annual Average
7.83 0.15 891.0 238.77 58.2 20.0 1.46 2004
Standard Rate 0 100 100 100 100 100 100
Range 7.63-8.10 0.01-4.48 106.0-723.0 38.7-247.0 39.6-144.0 27.4-132.0 0.79-3.28 Annual Average
7.50 2.24 428.0 131.9 87.9 77.6 1.91 2005
Standard Rate 0 50 100 100 100 100 100
Range 7.58-7.82 0.10 300.0-1610.0 41.3-303.0 27.0-212.0 24.7-209.0 1.14-2.01 Annual Average
7.71 0.10 1091.7 199.4 117.3 112.6 1.50 2006
Standard Rate 0 100 100 100 100 100 100
Range 7.45-7.62 0.0-2.0 168.0-1419.0 19.1-428.0 13.4-182.6 6.59-176.0 0.23-3.17
Annual Average
7.56 0.67 596.0 161.0 70.2 65.1 1.55 2007
Standard Rate 0 100 100 100 100 100 67
Range 6.50-7.60 0.01-5.9 542.0-1126.0 74.5-194.0 17.8-150.3 13.9-103.0 0.186-3.64 Annual Average
7.12 1.5 819.0 152.0 69.6 49.7 2.06 2008
Standard Rate 0 75 100 100 100 100 75
Table 4.2-15 The water quality monitoring results in General Drainage Canal from 2004 to 2008
Year Pollutants
Items pH DO COD BOD TN
Ammonia-N
TP
Range 7.57-8.87 0.00-8.81 21.6-329.0 1.00-56.8 1.06-188 0.19-59.5 0.05-1.36 Annual Average
8.27 3.79 85.4 14.3 27.7 7.35 0.38 2004
Standard Rate 0 76 82 54 82 92 76
Range 6.75-8.94 0.01-8.54 20.8-189 1.00-28.1 0.73-74.7 0.26-57.3 0.037-1.35 Annual Average
8.11 6.00 75.8 6.6 15.9 10.60 0.337 2005
Standard Rate 0 25 80 46 87 47 33
Range 7.76-8.76 0.1-8.5 43.7-351.0 1.00-40.4 1.33-113.00 0.187-103.0 0.114-3.10 Annual Average
8.19 4.46 113.3 6.9 20.8 17.74 0.639 2006
Standard Rate 0 33 100 27 67 53 40
2007 Range 7.60-9.10 0.01-8.40 26.3-260.0 1.00-73.1 1.01-87.6 0.225-83.0 0.046-1.24
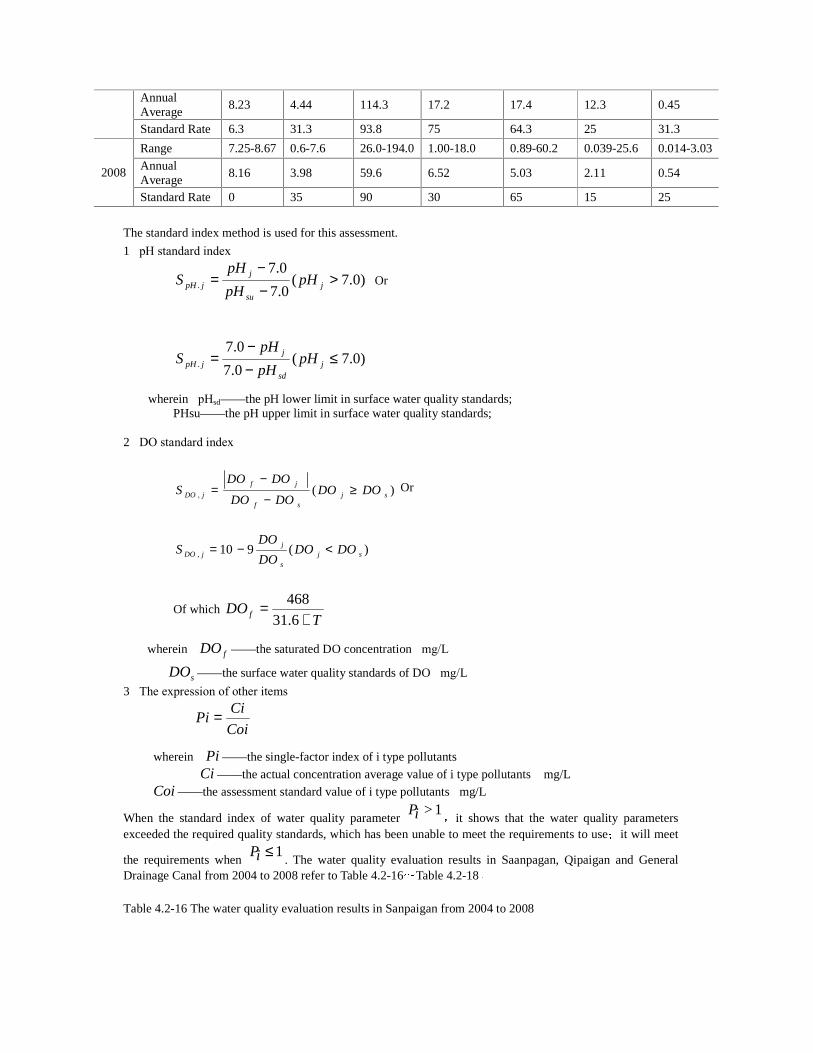
Annual Average
8.23 4.44 114.3 17.2 17.4 12.3 0.45
Standard Rate 6.3 31.3 93.8 75 64.3 25 31.3
Range 7.25-8.67 0.6-7.6 26.0-194.0 1.00-18.0 0.89-60.2 0.039-25.6 0.014-3.03
Annual Average
8.16 3.98 59.6 6.52 5.03 2.11 0.54 2008
Standard Rate 0 35 90 30 65 15 25
The standard index method is used for this assessment.
1�pH standard index�
)0.7(0.7
0.7. >
−−
= jsu
jjpH pH
pH
pHS Or
)0.7(0.7
0.7. ≤
−−
= jsd
jjpH pH
pH
pHS
wherein�pHsd——the pH lower limit in surface water quality standards; PHsu——the pH upper limit in surface water quality standards;
2�DO standard index�
)(, sjsf
jf
jDO DODODODO
DODOS ³
−
−= Or
)(910, sjs
jjDO DODO
DO
DOS <−=
Of which T
DO f +=
6.31
468
wherein� fDO ——the saturated DO concentration�mg/L�
sDO ——the surface water quality standards of DO�mg/L�
3�The expression of other items�
Coi
CiPi =
wherein� Pi ——the single-factor index of i type pollutants�
Ci ——the actual concentration average value of i type pollutants �mg/L�
Coi ——the assessment standard value of i type pollutants�mg/L�
When the standard index of water quality parameter >1Pi it shows that the water quality parameters
exceeded the required quality standards, which has been unable to meet the requirements to use it will meet
the requirements when 1Pi ≤
. The water quality evaluation results in Saanpagan, Qipaigan and General Drainage Canal from 2004 to 2008 refer to Table 4.2-16 Table 4.2-18
Table 4.2-16 The water quality evaluation results in Sanpaigan from 2004 to 2008
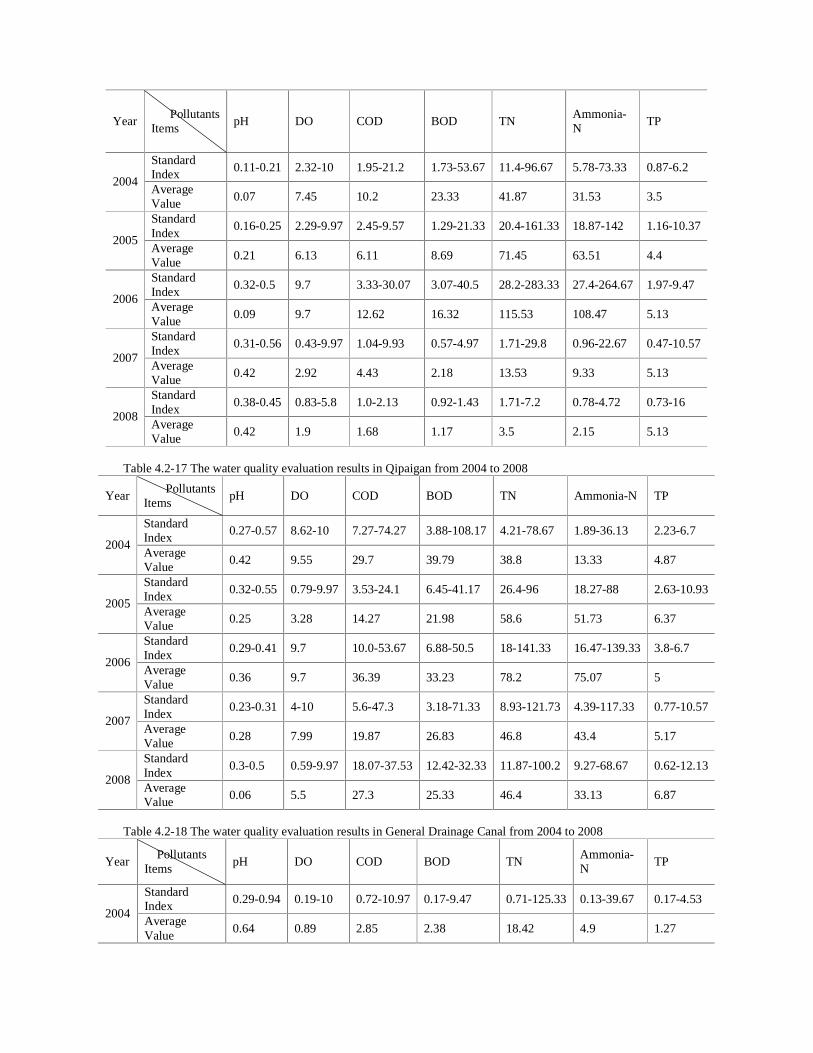
Year Pollutants
Items pH DO COD BOD TN
Ammonia-N
TP
Standard Index
0.11-0.21 2.32-10 1.95-21.2 1.73-53.67 11.4-96.67 5.78-73.33 0.87-6.2 2004
Average Value
0.07 7.45 10.2 23.33 41.87 31.53 3.5
Standard Index
0.16-0.25 2.29-9.97 2.45-9.57 1.29-21.33 20.4-161.33 18.87-142 1.16-10.37 2005
Average Value
0.21 6.13 6.11 8.69 71.45 63.51 4.4
Standard Index
0.32-0.5 9.7 3.33-30.07 3.07-40.5 28.2-283.33 27.4-264.67 1.97-9.47 2006
Average Value
0.09 9.7 12.62 16.32 115.53 108.47 5.13
Standard Index
0.31-0.56 0.43-9.97 1.04-9.93 0.57-4.97 1.71-29.8 0.96-22.67 0.47-10.57 2007
Average Value
0.42 2.92 4.43 2.18 13.53 9.33 5.13
Standard Index
0.38-0.45 0.83-5.8 1.0-2.13 0.92-1.43 1.71-7.2 0.78-4.72 0.73-16 2008
Average Value
0.42 1.9 1.68 1.17 3.5 2.15 5.13
Table 4.2-17 The water quality evaluation results in Qipaigan from 2004 to 2008
Year Pollutants
Items pH DO COD BOD TN Ammonia-N TP
Standard Index
0.27-0.57 8.62-10 7.27-74.27 3.88-108.17 4.21-78.67 1.89-36.13 2.23-6.7 2004
Average Value
0.42 9.55 29.7 39.79 38.8 13.33 4.87
Standard Index
0.32-0.55 0.79-9.97 3.53-24.1 6.45-41.17 26.4-96 18.27-88 2.63-10.93 2005
Average Value
0.25 3.28 14.27 21.98 58.6 51.73 6.37
Standard Index
0.29-0.41 9.7 10.0-53.67 6.88-50.5 18-141.33 16.47-139.33 3.8-6.7 2006
Average Value
0.36 9.7 36.39 33.23 78.2 75.07 5
Standard Index
0.23-0.31 4-10 5.6-47.3 3.18-71.33 8.93-121.73 4.39-117.33 0.77-10.57 2007
Average Value
0.28 7.99 19.87 26.83 46.8 43.4 5.17
Standard Index
0.3-0.5 0.59-9.97 18.07-37.53 12.42-32.33 11.87-100.2 9.27-68.67 0.62-12.13 2008
Average Value
0.06 5.5 27.3 25.33 46.4 33.13 6.87
Table 4.2-18 The water quality evaluation results in General Drainage Canal from 2004 to 2008
Year Pollutants
Items pH DO COD BOD TN
Ammonia-N
TP
Standard Index
0.29-0.94 0.19-10 0.72-10.97 0.17-9.47 0.71-125.33 0.13-39.67 0.17-4.53 2004
Average Value
0.64 0.89 2.85 2.38 18.42 4.9 1.27
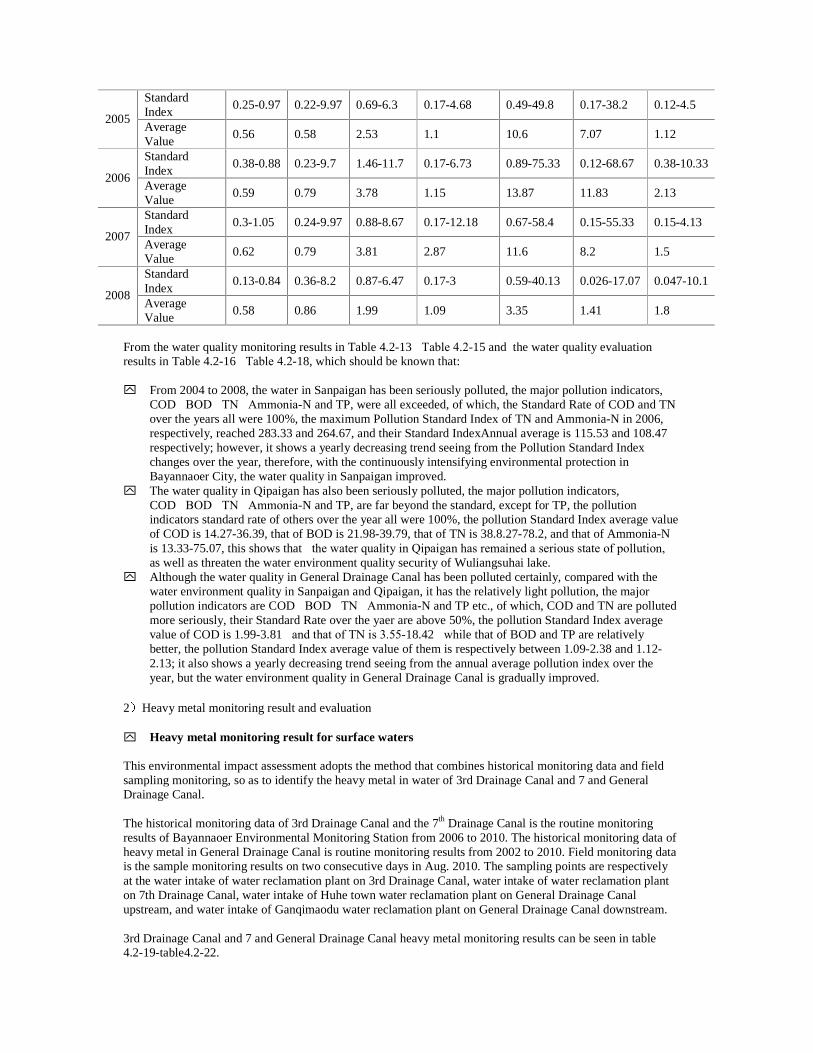
Standard Index
0.25-0.97 0.22-9.97 0.69-6.3 0.17-4.68 0.49-49.8 0.17-38.2 0.12-4.5 2005
Average Value
0.56 0.58 2.53 1.1 10.6 7.07 1.12
Standard Index
0.38-0.88 0.23-9.7 1.46-11.7 0.17-6.73 0.89-75.33 0.12-68.67 0.38-10.33 2006
Average Value
0.59 0.79 3.78 1.15 13.87 11.83 2.13
Standard Index
0.3-1.05 0.24-9.97 0.88-8.67 0.17-12.18 0.67-58.4 0.15-55.33 0.15-4.13 2007
Average Value
0.62 0.79 3.81 2.87 11.6 8.2 1.5
Standard Index
0.13-0.84 0.36-8.2 0.87-6.47 0.17-3 0.59-40.13 0.026-17.07 0.047-10.1 2008
Average Value
0.58 0.86 1.99 1.09 3.35 1.41 1.8
From the water quality monitoring results in Table 4.2-13�Table 4.2-15 and the water quality evaluation results in Table 4.2-16�Table 4.2-18, which should be known that:
y� From 2004 to 2008, the water in Sanpaigan has been seriously polluted, the major pollution indicators,
COD�BOD�TN�Ammonia-N and TP, were all exceeded, of which, the Standard Rate of COD and TN over the years all were 100%, the maximum Pollution Standard Index of TN and Ammonia-N in 2006, respectively, reached 283.33 and 264.67, and their Standard IndexAnnual average is 115.53 and 108.47 respectively; however, it shows a yearly decreasing trend seeing from the Pollution Standard Index changes over the year, therefore, with the continuously intensifying environmental protection in Bayannaoer City, the water quality in Sanpaigan improved.
y� The water quality in Qipaigan has also been seriously polluted, the major pollution indicators, COD�BOD�TN�Ammonia-N and TP, are far beyond the standard, except for TP, the pollution indicators standard rate of others over the year all were 100%, the pollution Standard Index average value of COD is 14.27-36.39, that of BOD is 21.98-39.79, that of TN is 38.8.27-78.2, and that of Ammonia-N is 13.33-75.07, this shows that�the water quality in Qipaigan has remained a serious state of pollution, as well as threaten the water environment quality security of Wuliangsuhai lake.
y� Although the water quality in General Drainage Canal has been polluted certainly, compared with the water environment quality in Sanpaigan and Qipaigan, it has the relatively light pollution, the major pollution indicators are COD�BOD�TN�Ammonia-N and TP etc., of which, COD and TN are polluted more seriously, their Standard Rate over the yaer are above 50%, the pollution Standard Index average value of COD is 1.99-3.81�and that of TN is 3.55-18.42�while that of BOD and TP are relatively better, the pollution Standard Index average value of them is respectively between 1.09-2.38 and 1.12-2.13; it also shows a yearly decreasing trend seeing from the annual average pollution index over the year, but the water environment quality in General Drainage Canal is gradually improved.
2 Heavy metal monitoring result and evaluation y� Heavy metal monitoring result for surface waters This environmental impact assessment adopts the method that combines historical monitoring data and field sampling monitoring, so as to identify the heavy metal in water of 3rd Drainage Canal and 7 and General Drainage Canal. The historical monitoring data of 3rd Drainage Canal and the 7th Drainage Canal is the routine monitoring results of Bayannaoer Environmental Monitoring Station from 2006 to 2010. The historical monitoring data of heavy metal in General Drainage Canal is routine monitoring results from 2002 to 2010. Field monitoring data is the sample monitoring results on two consecutive days in Aug. 2010. The sampling points are respectively at the water intake of water reclamation plant on 3rd Drainage Canal, water intake of water reclamation plant on 7th Drainage Canal, water intake of Huhe town water reclamation plant on General Drainage Canal upstream, and water intake of Ganqimaodu water reclamation plant on General Drainage Canal downstream. 3rd Drainage Canal and 7 and General Drainage Canal heavy metal monitoring results can be seen in table 4.2-19-table4.2-22.

The heavy metal Hg Pb Cu in General Drainage Canal are evaluated by the method of Standards Index. 3rd Drainage Canal and 7 and General Drainage Canal heavy metal evaluation results can be seen in table4.2-23-table4.2-26.

Table 4.2-19 2006-2010 3rd Drainage Canal water heavy metal monitoring result
Time Pollutant
Item Hg Pb Cu Zn Se As Cd Cr VI
Range 0.000005L-0.00014 0.05L 0.01L-0.02 0.062-0.108 —— 0.0011-0.0017 0.002L 0.004L-0.01 yearly value
0.000074 0.05L 0.01L 0.09 —— 0.0013 0.002L 0.0063 2006
Over-limit ratio
0.0 0.0 0.0 0.0 —— 0.0 0.0 0.0
Range 0.00008-0.00015 0.05L 0.01L 0.02L-0.055 —— 0.00064-0.0046 0.002L 0.005-0.007 yearly value
0.00012 0.05L 0.01L 0.03 —— 0.0022 0.002L 0.006 2007
Over-limit ratio
0.0 0.0 0.0 0.0 —— 0.0 0.0 0.0
Range 0.000028-0.00016 0.05L 0.01L-0.016 0.042-0.158 0.00003L-0.00075 0.000799-0.0022 0.002L 0.005-0.007 yearly value
0.00007 0.05L 0.04 0.096 0.00019 0.0015 0.002L 0.0056 2008
Over-limit ratio
0.0 0.0 0.0 0.0 0.0 0.0 0.0 0.0
Range 0.0000272-0.0000668 0.05L 0.01L 0.02L-0.17 0.00018-0.0022 0.00087-0.0036 0.002L 0.004L-0.008
yearly value
0.000048 0.05L 0.01L 0.071 0.00096 0.0021 0.002L 0.0053 2009
Over-limit ratio
0.0 0.0 0.0 0.0 0.0 0.0 0.0 0.0
Range 0.0000188-0.0000296 0.05L 0.01L 0.022-0.044 0.0019-0.00218 0.00013-0.0177 0.002L 0.006-0.008
Value 0.0000242 0.05L 0.01L 0.033 0.002 0.0089 0.002L 0.007 2010 first half year Over-limit
ratio 0.0 0.0 0.0 0.0 0.0 0.0 0.0 0.0
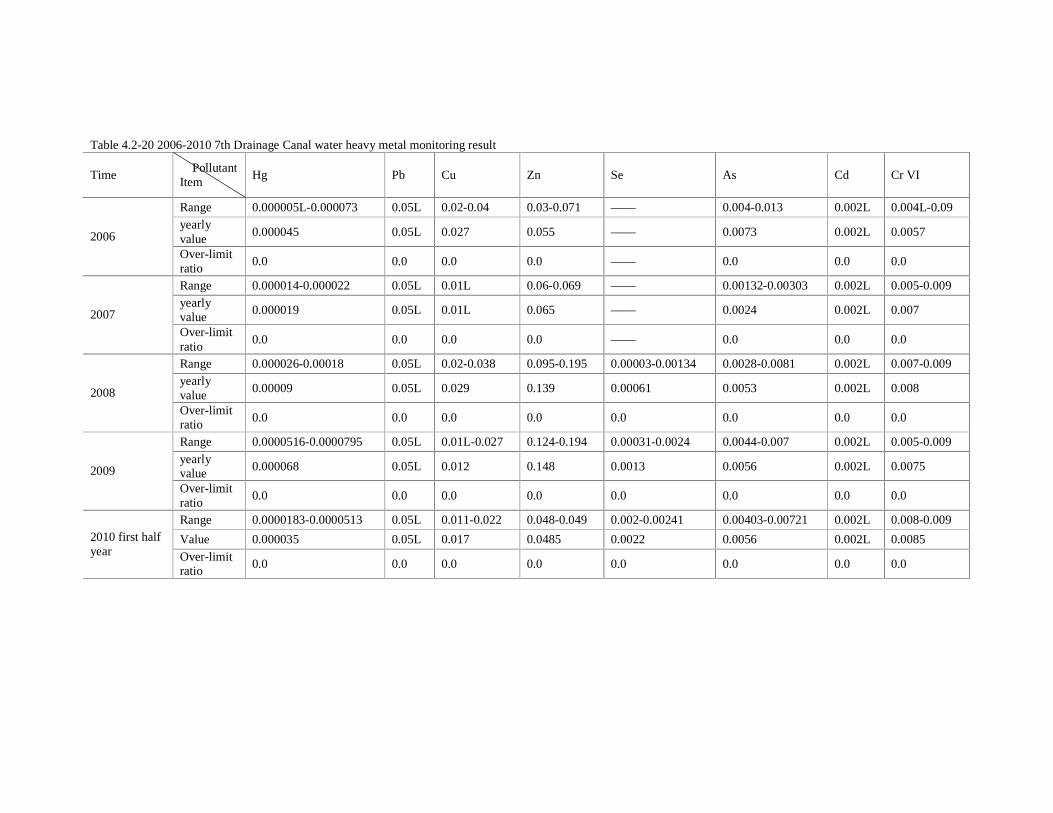
Table 4.2-20 2006-2010 7th Drainage Canal water heavy metal monitoring result
Time Pollutant
Item Hg Pb Cu Zn Se As Cd Cr VI
Range 0.000005L-0.000073 0.05L 0.02-0.04 0.03-0.071 —— 0.004-0.013 0.002L 0.004L-0.09 yearly value
0.000045 0.05L 0.027 0.055 —— 0.0073 0.002L 0.0057 2006
Over-limit ratio
0.0 0.0 0.0 0.0 —— 0.0 0.0 0.0
Range 0.000014-0.000022 0.05L 0.01L 0.06-0.069 —— 0.00132-0.00303 0.002L 0.005-0.009 yearly value
0.000019 0.05L 0.01L 0.065 —— 0.0024 0.002L 0.007 2007
Over-limit ratio
0.0 0.0 0.0 0.0 —— 0.0 0.0 0.0
Range 0.000026-0.00018 0.05L 0.02-0.038 0.095-0.195 0.00003-0.00134 0.0028-0.0081 0.002L 0.007-0.009 yearly value
0.00009 0.05L 0.029 0.139 0.00061 0.0053 0.002L 0.008 2008
Over-limit ratio
0.0 0.0 0.0 0.0 0.0 0.0 0.0 0.0
Range 0.0000516-0.0000795 0.05L 0.01L-0.027 0.124-0.194 0.00031-0.0024 0.0044-0.007 0.002L 0.005-0.009
yearly value
0.000068 0.05L 0.012 0.148 0.0013 0.0056 0.002L 0.0075 2009
Over-limit ratio
0.0 0.0 0.0 0.0 0.0 0.0 0.0 0.0
Range 0.0000183-0.0000513 0.05L 0.011-0.022 0.048-0.049 0.002-0.00241 0.00403-0.00721 0.002L 0.008-0.009
Value 0.000035 0.05L 0.017 0.0485 0.0022 0.0056 0.002L 0.0085 2010 first half year Over-limit
ratio 0.0 0.0 0.0 0.0 0.0 0.0 0.0 0.0
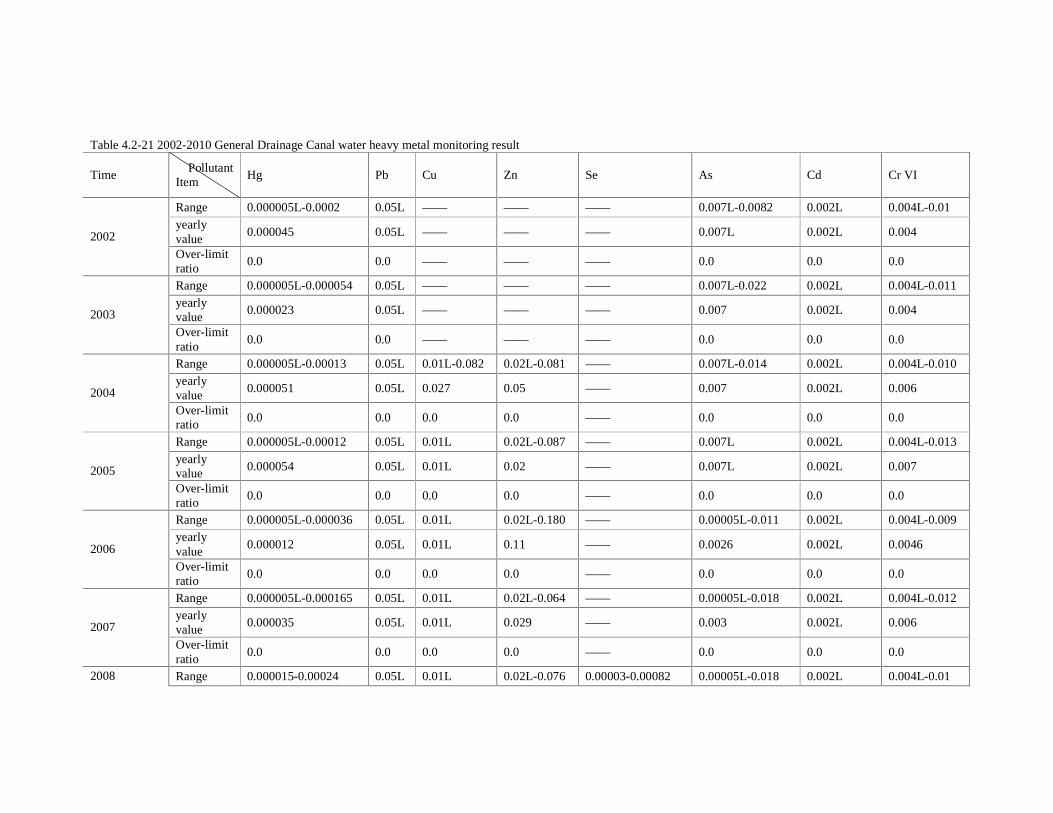
Table 4.2-21 2002-2010 General Drainage Canal water heavy metal monitoring result
Time Pollutant
Item Hg Pb Cu Zn Se As Cd Cr VI
Range 0.000005L-0.0002 0.05L —— —— —— 0.007L-0.0082 0.002L 0.004L-0.01 yearly value
0.000045 0.05L —— —— —— 0.007L 0.002L 0.004 2002
Over-limit ratio
0.0 0.0 —— —— —— 0.0 0.0 0.0
Range 0.000005L-0.000054 0.05L —— —— —— 0.007L-0.022 0.002L 0.004L-0.011 yearly value
0.000023 0.05L —— —— —— 0.007 0.002L 0.004 2003
Over-limit ratio
0.0 0.0 —— —— —— 0.0 0.0 0.0
Range 0.000005L-0.00013 0.05L 0.01L-0.082 0.02L-0.081 —— 0.007L-0.014 0.002L 0.004L-0.010 yearly value
0.000051 0.05L 0.027 0.05 —— 0.007 0.002L 0.006 2004
Over-limit ratio
0.0 0.0 0.0 0.0 —— 0.0 0.0 0.0
Range 0.000005L-0.00012 0.05L 0.01L 0.02L-0.087 —— 0.007L 0.002L 0.004L-0.013
yearly value
0.000054 0.05L 0.01L 0.02 —— 0.007L 0.002L 0.007 2005
Over-limit ratio
0.0 0.0 0.0 0.0 —— 0.0 0.0 0.0
Range 0.000005L-0.000036 0.05L 0.01L 0.02L-0.180 —— 0.00005L-0.011 0.002L 0.004L-0.009 yearly value
0.000012 0.05L 0.01L 0.11 —— 0.0026 0.002L 0.0046 2006
Over-limit ratio
0.0 0.0 0.0 0.0 —— 0.0 0.0 0.0
Range 0.000005L-0.000165 0.05L 0.01L 0.02L-0.064 —— 0.00005L-0.018 0.002L 0.004L-0.012 yearly value
0.000035 0.05L 0.01L 0.029 —— 0.003 0.002L 0.006 2007
Over-limit ratio
0.0 0.0 0.0 0.0 —— 0.0 0.0 0.0
2008 Range 0.000015-0.00024 0.05L 0.01L 0.02L-0.076 0.00003-0.00082 0.00005L-0.018 0.002L 0.004L-0.01
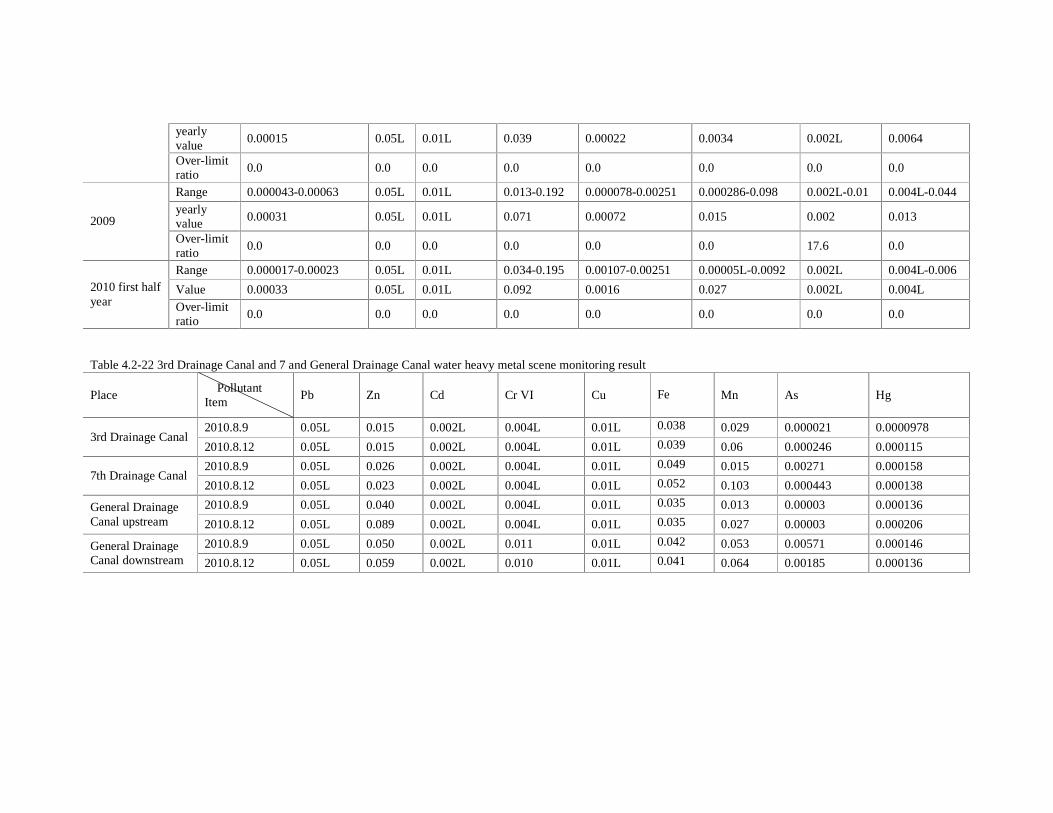
yearly value
0.00015 0.05L 0.01L 0.039 0.00022 0.0034 0.002L 0.0064
Over-limit ratio
0.0 0.0 0.0 0.0 0.0 0.0 0.0 0.0
Range 0.000043-0.00063 0.05L 0.01L 0.013-0.192 0.000078-0.00251 0.000286-0.098 0.002L-0.01 0.004L-0.044
yearly value
0.00031 0.05L 0.01L 0.071 0.00072 0.015 0.002 0.013 2009
Over-limit ratio
0.0 0.0 0.0 0.0 0.0 0.0 17.6 0.0
Range 0.000017-0.00023 0.05L 0.01L 0.034-0.195 0.00107-0.00251 0.00005L-0.0092 0.002L 0.004L-0.006
Value 0.00033 0.05L 0.01L 0.092 0.0016 0.027 0.002L 0.004L 2010 first half year Over-limit
ratio 0.0 0.0 0.0 0.0 0.0 0.0 0.0 0.0
Table 4.2-22 3rd Drainage Canal and 7 and General Drainage Canal water heavy metal scene monitoring result
Place Pollutant
Item Pb Zn Cd Cr VI Cu
Fe Mn As Hg
2010.8.9 0.05L 0.015 0.002L 0.004L 0.01L 0.038 0.029 0.000021 0.0000978 3rd Drainage Canal
2010.8.12 0.05L 0.015 0.002L 0.004L 0.01L 0.039 0.06 0.000246 0.000115
2010.8.9 0.05L 0.026 0.002L 0.004L 0.01L 0.049 0.015 0.00271 0.000158 7th Drainage Canal
2010.8.12 0.05L 0.023 0.002L 0.004L 0.01L 0.052 0.103 0.000443 0.000138
2010.8.9 0.05L 0.040 0.002L 0.004L 0.01L 0.035 0.013 0.00003 0.000136 General Drainage Canal upstream 2010.8.12 0.05L 0.089 0.002L 0.004L 0.01L 0.035 0.027 0.00003 0.000206
2010.8.9 0.05L 0.050 0.002L 0.011 0.01L 0.042 0.053 0.00571 0.000146 General Drainage Canal downstream 2010.8.12 0.05L 0.059 0.002L 0.010 0.01L 0.041 0.064 0.00185 0.000136
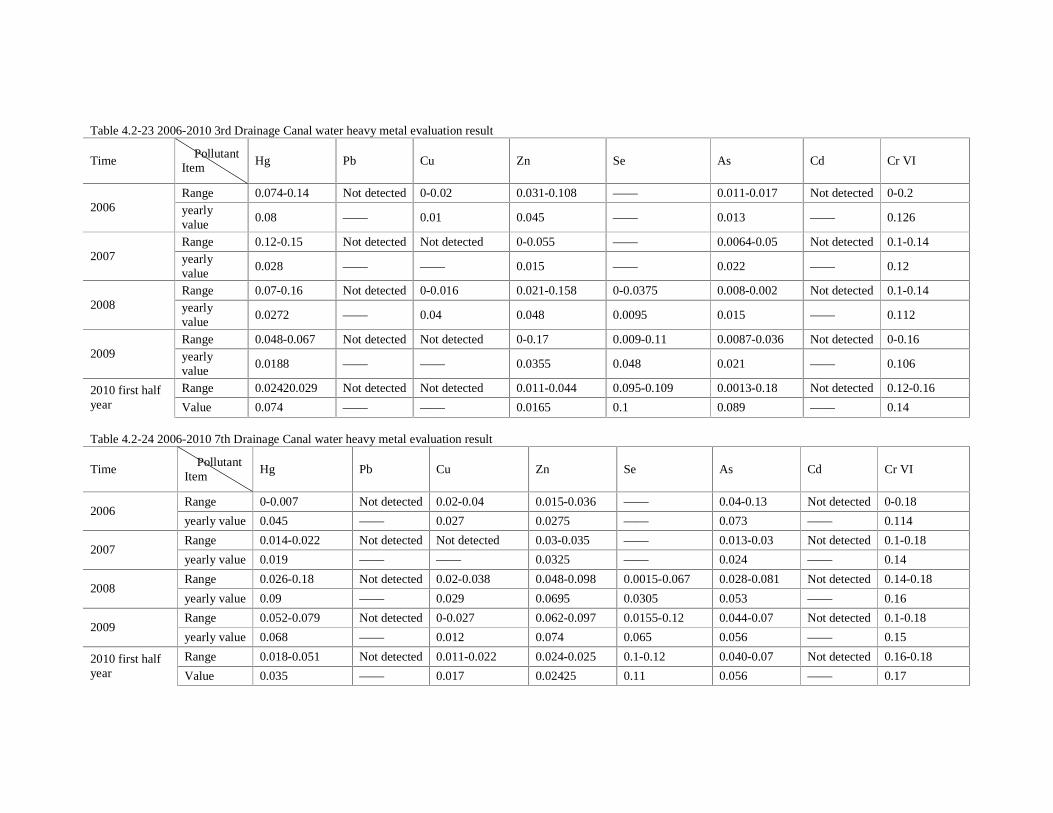
Table 4.2-23 2006-2010 3rd Drainage Canal water heavy metal evaluation result
Time Pollutant
Item Hg Pb Cu Zn Se As Cd Cr VI
Range 0.074-0.14 Not detected 0-0.02 0.031-0.108 —— 0.011-0.017 Not detected 0-0.2 2006 yearly
value 0.08 —— 0.01 0.045 —— 0.013 —— 0.126
Range 0.12-0.15 Not detected Not detected 0-0.055 —— 0.0064-0.05 Not detected 0.1-0.14 2007 yearly
value 0.028 —— —— 0.015 —— 0.022 —— 0.12
Range 0.07-0.16 Not detected 0-0.016 0.021-0.158 0-0.0375 0.008-0.002 Not detected 0.1-0.14 2008 yearly
value 0.0272 —— 0.04 0.048 0.0095 0.015 —— 0.112
Range 0.048-0.067 Not detected Not detected 0-0.17 0.009-0.11 0.0087-0.036 Not detected 0-0.16 2009 yearly
value 0.0188 —— —— 0.0355 0.048 0.021 —— 0.106
Range 0.02420.029 Not detected Not detected 0.011-0.044 0.095-0.109 0.0013-0.18 Not detected 0.12-0.16 2010 first half year Value 0.074 —— —— 0.0165 0.1 0.089 —— 0.14
Table 4.2-24 2006-2010 7th Drainage Canal water heavy metal evaluation result
Time Pollutant
Item Hg Pb Cu Zn Se As Cd Cr VI
Range 0-0.007 Not detected 0.02-0.04 0.015-0.036 —— 0.04-0.13 Not detected 0-0.18 2006
yearly value 0.045 —— 0.027 0.0275 —— 0.073 —— 0.114
Range 0.014-0.022 Not detected Not detected 0.03-0.035 —— 0.013-0.03 Not detected 0.1-0.18 2007
yearly value 0.019 —— —— 0.0325 —— 0.024 —— 0.14
Range 0.026-0.18 Not detected 0.02-0.038 0.048-0.098 0.0015-0.067 0.028-0.081 Not detected 0.14-0.18 2008
yearly value 0.09 —— 0.029 0.0695 0.0305 0.053 —— 0.16
Range 0.052-0.079 Not detected 0-0.027 0.062-0.097 0.0155-0.12 0.044-0.07 Not detected 0.1-0.18 2009
yearly value 0.068 —— 0.012 0.074 0.065 0.056 —— 0.15
Range 0.018-0.051 Not detected 0.011-0.022 0.024-0.025 0.1-0.12 0.040-0.07 Not detected 0.16-0.18 2010 first half year Value 0.035 —— 0.017 0.02425 0.11 0.056 —— 0.17
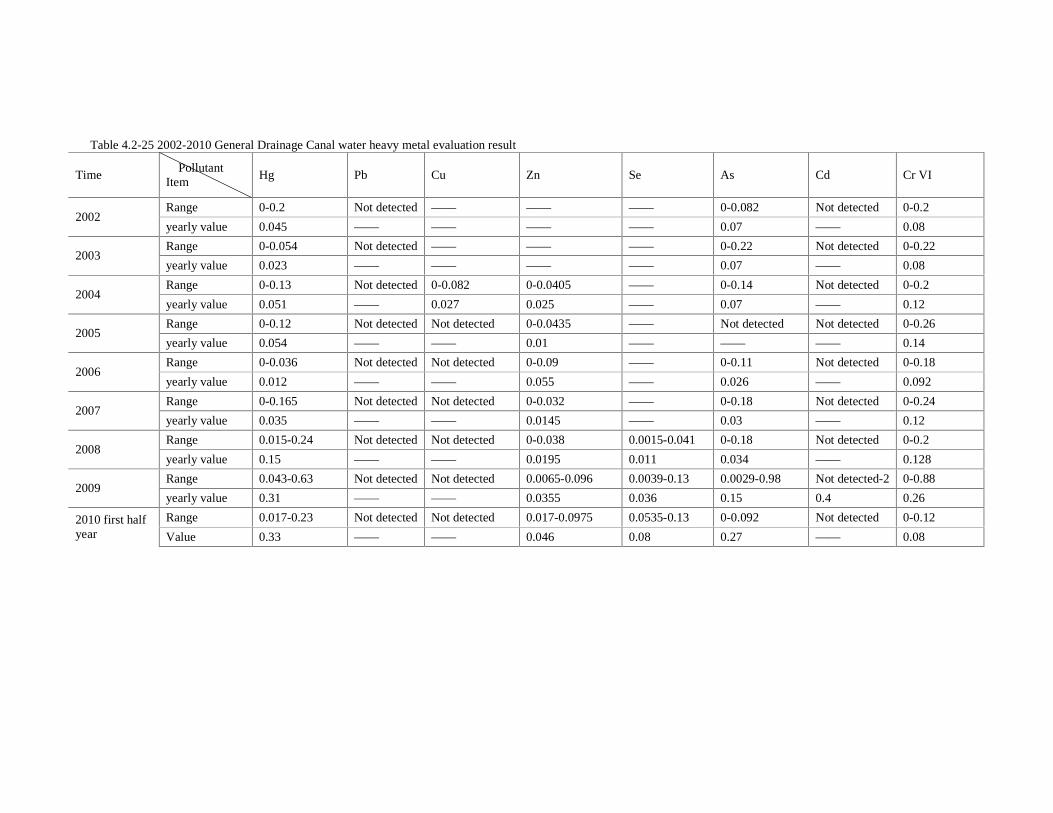
Table 4.2-25 2002-2010 General Drainage Canal water heavy metal evaluation result
Time Pollutant
Item Hg Pb Cu Zn Se As Cd Cr VI
Range 0-0.2 Not detected —— —— —— 0-0.082 Not detected 0-0.2 2002
yearly value 0.045 —— —— —— —— 0.07 —— 0.08
Range 0-0.054 Not detected —— —— —— 0-0.22 Not detected 0-0.22 2003
yearly value 0.023 —— —— —— —— 0.07 —— 0.08
Range 0-0.13 Not detected 0-0.082 0-0.0405 —— 0-0.14 Not detected 0-0.2 2004
yearly value 0.051 —— 0.027 0.025 —— 0.07 —— 0.12
Range 0-0.12 Not detected Not detected 0-0.0435 —— Not detected Not detected 0-0.26 2005
yearly value 0.054 —— —— 0.01 —— —— —— 0.14
Range 0-0.036 Not detected Not detected 0-0.09 —— 0-0.11 Not detected 0-0.18 2006
yearly value 0.012 —— —— 0.055 —— 0.026 —— 0.092
Range 0-0.165 Not detected Not detected 0-0.032 —— 0-0.18 Not detected 0-0.24 2007
yearly value 0.035 —— —— 0.0145 —— 0.03 —— 0.12
Range 0.015-0.24 Not detected Not detected 0-0.038 0.0015-0.041 0-0.18 Not detected 0-0.2 2008
yearly value 0.15 —— —— 0.0195 0.011 0.034 —— 0.128
Range 0.043-0.63 Not detected Not detected 0.0065-0.096 0.0039-0.13 0.0029-0.98 Not detected-2 0-0.88 2009
yearly value 0.31 —— —— 0.0355 0.036 0.15 0.4 0.26
Range 0.017-0.23 Not detected Not detected 0.017-0.0975 0.0535-0.13 0-0.092 Not detected 0-0.12 2010 first half year Value 0.33 —— —— 0.046 0.08 0.27 —— 0.08
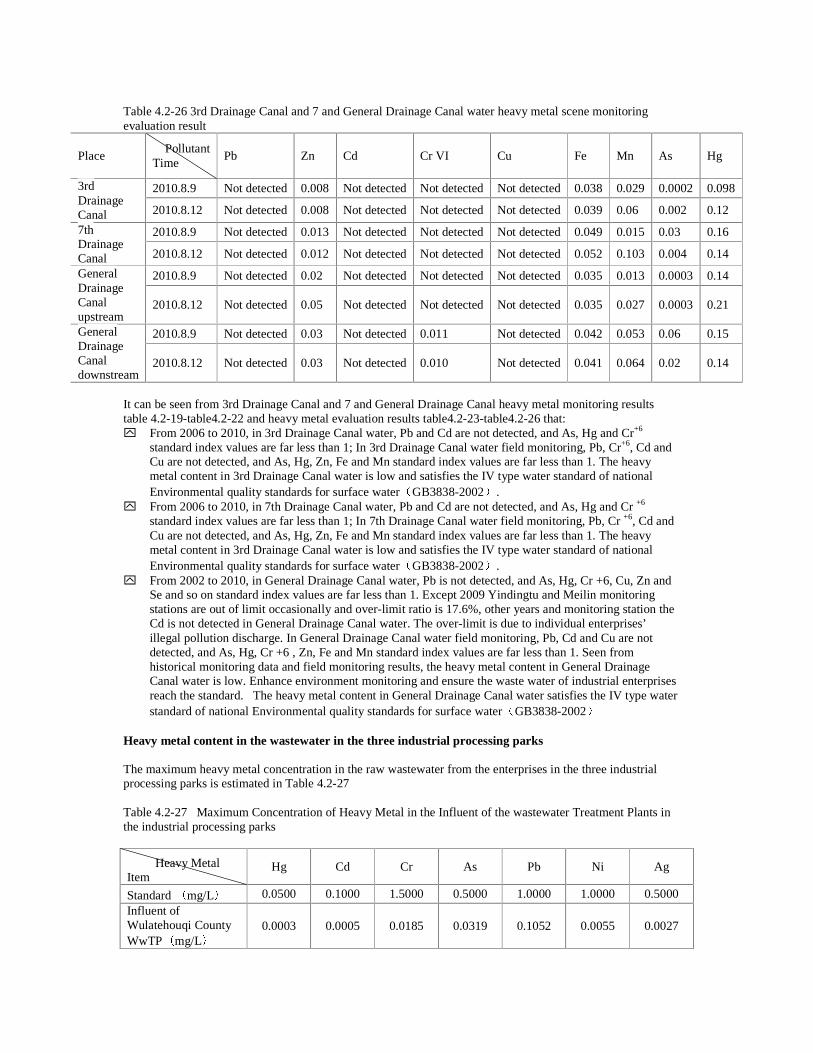
Table 4.2-26 3rd Drainage Canal and 7 and General Drainage Canal water heavy metal scene monitoring evaluation result
Place Pollutant
Time Pb Zn Cd Cr VI Cu Fe Mn As Hg
2010.8.9 Not detected 0.008 Not detected Not detected Not detected 0.038 0.029 0.0002 0.098 3rd Drainage Canal 2010.8.12 Not detected 0.008 Not detected Not detected Not detected 0.039 0.06 0.002 0.12
2010.8.9 Not detected 0.013 Not detected Not detected Not detected 0.049 0.015 0.03 0.16 7th Drainage Canal 2010.8.12 Not detected 0.012 Not detected Not detected Not detected 0.052 0.103 0.004 0.14
2010.8.9 Not detected 0.02 Not detected Not detected Not detected 0.035 0.013 0.0003 0.14 General Drainage Canal upstream
2010.8.12 Not detected 0.05 Not detected Not detected Not detected 0.035 0.027 0.0003 0.21
2010.8.9 Not detected 0.03 Not detected 0.011 Not detected 0.042 0.053 0.06 0.15 General Drainage Canal downstream
2010.8.12 Not detected 0.03 Not detected 0.010 Not detected 0.041 0.064 0.02 0.14
It can be seen from 3rd Drainage Canal and 7 and General Drainage Canal heavy metal monitoring results table 4.2-19-table4.2-22 and heavy metal evaluation results table4.2-23-table4.2-26 that: y� From 2006 to 2010, in 3rd Drainage Canal water, Pb and Cd are not detected, and As, Hg and Cr+6
standard index values are far less than 1; In 3rd Drainage Canal water field monitoring, Pb, Cr+6, Cd and Cu are not detected, and As, Hg, Zn, Fe and Mn standard index values are far less than 1. The heavy metal content in 3rd Drainage Canal water is low and satisfies the IV type water standard of national Environmental quality standards for surface waterGB3838-2002 .
y� From 2006 to 2010, in 7th Drainage Canal water, Pb and Cd are not detected, and As, Hg and Cr +6 standard index values are far less than 1; In 7th Drainage Canal water field monitoring, Pb, Cr +6, Cd and Cu are not detected, and As, Hg, Zn, Fe and Mn standard index values are far less than 1. The heavy metal content in 3rd Drainage Canal water is low and satisfies the IV type water standard of national Environmental quality standards for surface waterGB3838-2002 .
y� From 2002 to 2010, in General Drainage Canal water, Pb is not detected, and As, Hg, Cr +6, Cu, Zn and Se and so on standard index values are far less than 1. Except 2009 Yindingtu and Meilin monitoring stations are out of limit occasionally and over-limit ratio is 17.6%, other years and monitoring station the Cd is not detected in General Drainage Canal water. The over-limit is due to individual enterprises’ illegal pollution discharge. In General Drainage Canal water field monitoring, Pb, Cd and Cu are not detected, and As, Hg, Cr +6 , Zn, Fe and Mn standard index values are far less than 1. Seen from historical monitoring data and field monitoring results, the heavy metal content in General Drainage Canal water is low. Enhance environment monitoring and ensure the waste water of industrial enterprises reach the standard. The heavy metal content in General Drainage Canal water satisfies the IV type water standard of national Environmental quality standards for surface water GB3838-2002
Heavy metal content in the wastewater in the three industrial processing parks The maximum heavy metal concentration in the raw wastewater from the enterprises in the three industrial processing parks is estimated in Table 4.2-27 Table 4.2-27 Maximum Concentration of Heavy Metal in the Influent of the wastewater Treatment Plants in the industrial processing parks�
Heavy Metal Item
Hg Cd Cr As Pb Ni Ag
Standard mg/L 0.0500 0.1000 1.5000 0.5000 1.0000 1.0000 0.5000 Influent of Wulatehouqi County WwTP mg/L
0.0003 0.0005 0.0185 0.0319 0.1052 0.0055 0.0027
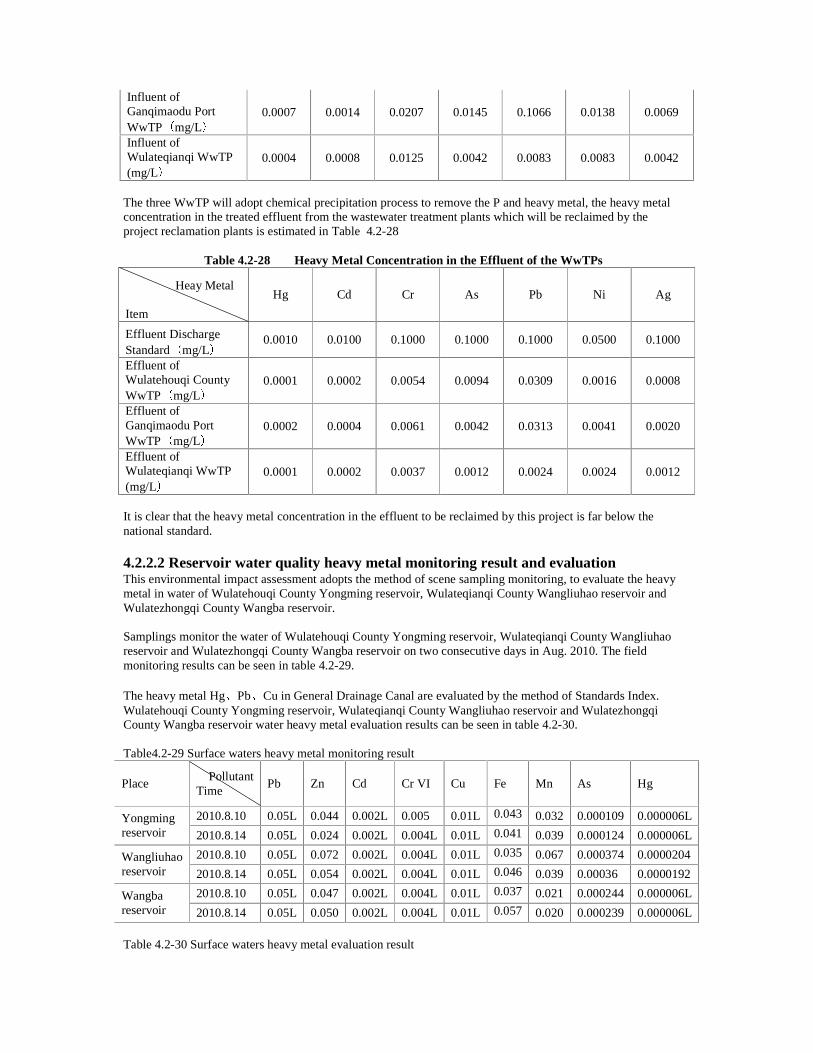
Influent of Ganqimaodu Port WwTP mg/L
0.0007 0.0014 0.0207 0.0145 0.1066 0.0138 0.0069
Influent of Wulateqianqi WwTP (mg/L
0.0004 0.0008 0.0125 0.0042 0.0083 0.0083 0.0042
The three WwTP will adopt chemical precipitation process to remove the P and heavy metal, the heavy metal concentration in the treated effluent from the wastewater treatment plants which will be reclaimed by the project reclamation plants is estimated in Table 4.2-28
Table 4.2-28 Heavy Metal Concentration in the Effluent of the WwTPs
Heay Metal Item
Hg Cd Cr As Pb Ni Ag
Effluent Discharge Standard mg/L
0.0010 0.0100 0.1000 0.1000 0.1000 0.0500 0.1000
Effluent of Wulatehouqi County WwTP mg/L
0.0001 0.0002 0.0054 0.0094 0.0309 0.0016 0.0008
Effluent of Ganqimaodu Port WwTP mg/L
0.0002 0.0004 0.0061 0.0042 0.0313 0.0041 0.0020
Effluent of Wulateqianqi WwTP (mg/L
0.0001 0.0002 0.0037 0.0012 0.0024 0.0024 0.0012
It is clear that the heavy metal concentration in the effluent to be reclaimed by this project is far below the national standard.
4.2.2.2 Reservoir water quality heavy metal monitoring result and evaluation This environmental impact assessment adopts the method of scene sampling monitoring, to evaluate the heavy metal in water of Wulatehouqi County Yongming reservoir, Wulateqianqi County Wangliuhao reservoir and Wulatezhongqi County Wangba reservoir. Samplings monitor the water of Wulatehouqi County Yongming reservoir, Wulateqianqi County Wangliuhao reservoir and Wulatezhongqi County Wangba reservoir on two consecutive days in Aug. 2010. The field monitoring results can be seen in table 4.2-29. The heavy metal Hg Pb Cu in General Drainage Canal are evaluated by the method of Standards Index. Wulatehouqi County Yongming reservoir, Wulateqianqi County Wangliuhao reservoir and Wulatezhongqi County Wangba reservoir water heavy metal evaluation results can be seen in table 4.2-30.
Table4.2-29 Surface waters heavy metal monitoring result
Place Pollutant
Time Pb Zn Cd Cr VI Cu Fe Mn As Hg
2010.8.10 0.05L 0.044 0.002L 0.005 0.01L 0.043 0.032 0.000109 0.000006L Yongming reservoir 2010.8.14 0.05L 0.024 0.002L 0.004L 0.01L 0.041 0.039 0.000124 0.000006L
2010.8.10 0.05L 0.072 0.002L 0.004L 0.01L 0.035 0.067 0.000374 0.0000204 Wangliuhao reservoir 2010.8.14 0.05L 0.054 0.002L 0.004L 0.01L 0.046 0.039 0.00036 0.0000192
2010.8.10 0.05L 0.047 0.002L 0.004L 0.01L 0.037 0.021 0.000244 0.000006L Wangba reservoir 2010.8.14 0.05L 0.050 0.002L 0.004L 0.01L 0.057 0.020 0.000239 0.000006L
Table 4.2-30 Surface waters heavy metal evaluation result
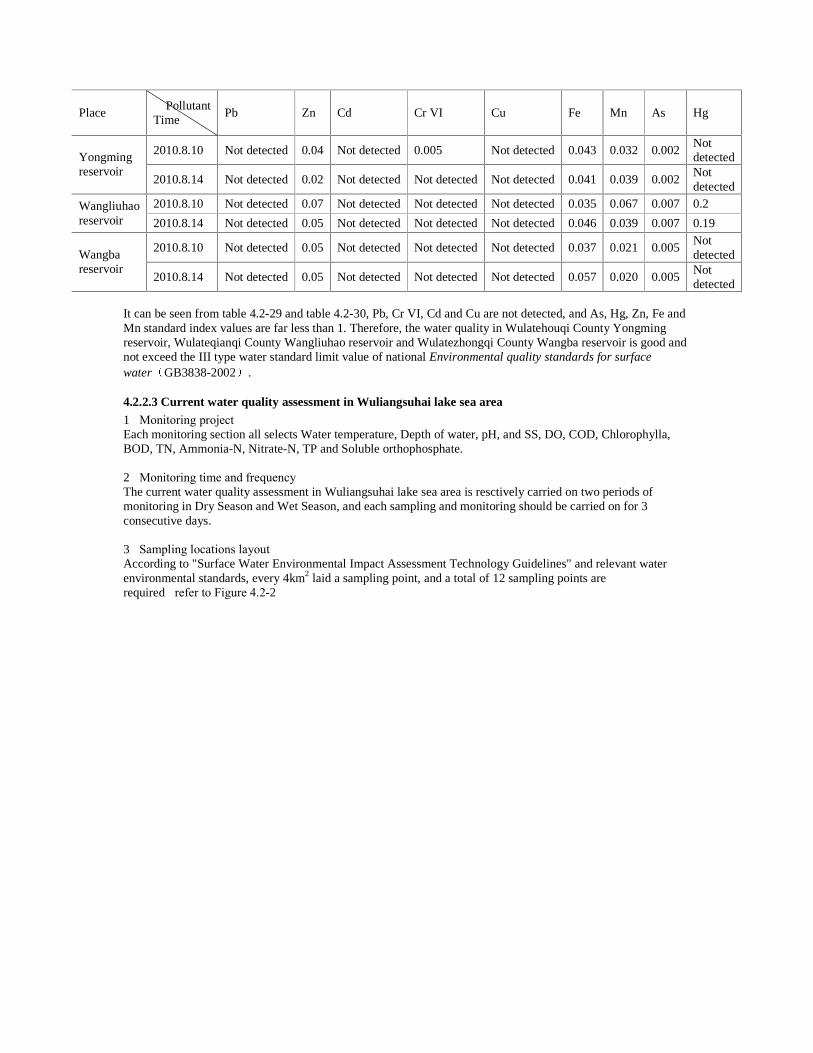
Place Pollutant
Time Pb Zn Cd Cr VI Cu Fe Mn As Hg
2010.8.10 Not detected 0.04 Not detected 0.005 Not detected 0.043 0.032 0.002 Not detected Yongming
reservoir 2010.8.14 Not detected 0.02 Not detected Not detected Not detected 0.041 0.039 0.002
Not detected
2010.8.10 Not detected 0.07 Not detected Not detected Not detected 0.035 0.067 0.007 0.2 Wangliuhao reservoir 2010.8.14 Not detected 0.05 Not detected Not detected Not detected 0.046 0.039 0.007 0.19
2010.8.10 Not detected 0.05 Not detected Not detected Not detected 0.037 0.021 0.005 Not detected Wangba
reservoir 2010.8.14 Not detected 0.05 Not detected Not detected Not detected 0.057 0.020 0.005
Not detected
It can be seen from table 4.2-29 and table 4.2-30, Pb, Cr VI, Cd and Cu are not detected, and As, Hg, Zn, Fe and Mn standard index values are far less than 1. Therefore, the water quality in Wulatehouqi County Yongming reservoir, Wulateqianqi County Wangliuhao reservoir and Wulatezhongqi County Wangba reservoir is good and not exceed the III type water standard limit value of national Environmental quality standards for surface water GB3838-2002 . 4.2.2.3 Current water quality assessment in Wuliangsuhai lake sea area
1�Monitoring project Each monitoring section all selects Water temperature, Depth of water, pH, and SS, DO, COD, Chlorophylla, BOD, TN, Ammonia-N, Nitrate-N, TP and Soluble orthophosphate. 2�Monitoring time and frequency The current water quality assessment in Wuliangsuhai lake sea area is resctively carried on two periods of monitoring in Dry Season and Wet Season, and each sampling and monitoring should be carried on for 3 consecutive days. 3�Sampling locations layout According to "Surface Water Environmental Impact Assessment Technology Guidelines" and relevant water environmental standards, every 4km2 laid a sampling point, and a total of 12 sampling points are required�refer to Figure 4.2-2�
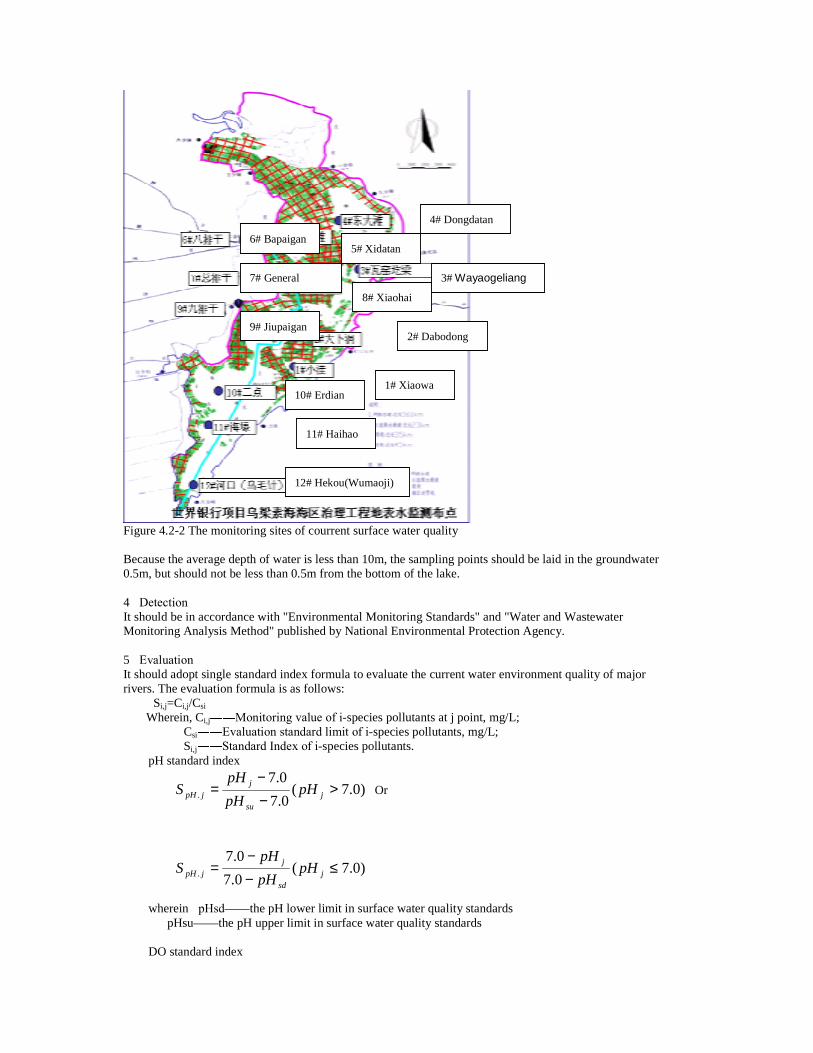
Figure 4.2-2 The monitoring sites of courrent surface water quality Because the average depth of water is less than 10m, the sampling points should be laid in the groundwater 0.5m, but should not be less than 0.5m from the bottom of the lake. 4�Detection It should be in accordance with "Environmental Monitoring Standards" and "Water and Wastewater Monitoring Analysis Method" published by National Environmental Protection Agency. 5�Evaluation It should adopt single standard index formula to evaluate the current water environment quality of major rivers. The evaluation formula is as follows:
Si,j=Ci,j/Csi Wherein, Ci,j Monitoring value of i-species pollutants at j point, mg/L;
Csi Evaluation standard limit of i-species pollutants, mg/L; Si,j Standard Index of i-species pollutants.
pH standard index�
)0.7(0.7
0.7. >
−−
= jsu
jjpH pH
pH
pHS Or
)0.7(0.7
0.7. ≤
−−
= jsd
jjpH pH
pH
pHS
wherein�pHsd——the pH lower limit in surface water quality standards� pHsu——the pH upper limit in surface water quality standards� DO standard index�
4# Dongdatan
5# Xidatan
3# Wayaogeliang
6# Bapaigan
7# General
9# Jiupaigan 2# Dabodong
8# Xiaohai
1# Xiaowa 10# Erdian
11# Haihao
12# Hekou(Wumaoji)

sjsf
jf
jDO DODODODO
DODOS ³
−
−= ,,
sjs
jjDO DODO
DO
DOS <−= ,910,
wherein�SDO,j� Standard Index of DO at j point;
DOf�the saturated DO concentration�mg/L� DOj�Monitoring concentration of DO at j point, mg/L; DOS�the surface water quality standards of DO�mg/L�
If he Standard Index of water quality parameters >1�it shows that this water quality parameters exceeded the required quality standards. The bigger the water quality parameter is, the more serious this water quality parameter exceeded. 6�Monitoring results Monitoring results refer to Table 4.2-31� Table 4.2-31 Water Quality Monitoring Results�mg/L�
Location Period pH SS DO COD BOD5 TN NH3-N
NO3- TP PO4
3- Chla (mg/m3)
Wet Season
8.38 262.33 2.53 36.37 10.79 1.37 0.79 0.12 0.05 Not detected Not detected
Xiaowa Dry Season
7.80 16.67 0.77 66.93 18.00 7.18 4.32 0.37 0.10 Not detected 7.55
Wet Season
8.73 269.67 3.33 35.07 9.72 1.33 0.25 0.33 0.05 Not detected Not detected
Dabudong Dry Season
7.69 13.33 1.75 56.10 12.50 14.65 11.75 0.15 0.26 Not detected 21.63
Wet Season
8.25 218.00 3.80 41.73 12.57 1.35 0.98 0.06 0.06 Not detected Not detected
Wayaogeliang Dry Season
7.63 29.67 0.47 55.80 13.13 12.87 9.30 0.13 0.19 Not detected 36.93
Wet Season
8.20 244.33 3.37 43.83 12.80 1.27 0.75 0.08 0.05 0.01 Not detected
Dongdatan Dry Season
8.93 7.00 0.65 50.10 10.56 3.64 1.67 0.26 0.18 0.09 38.70
Wet Season
7.93 222.33 1.20 35.57 8.61 4.22 3.01 1.26 0.26 0.14 Not detected
Xidatan Dry Season
7.62 89.00 0.47 95.50 23.27 44.83 39.21 0.23 1.93 0.96 42.03
Wet Season
8.41 328.67 4.53 29.50 7.20 1.64 1.08 0.40 0.25 Not detected Not detected
Bapaigan Dry Season
7.69 35.67 4.26 31.67 7.35 4.06 2.35 0.11 0.12 0.01 0.48
Wet Season
8.31 348.67 3.23 44.57 12.90 1.58 1.09 0.26 0.13 0.02 Not detected
Honggebu Dry Season
6.94 11.50 Not detected 158.00 46.27 74.83 67.15 0.36 3.78 1.81 0.00
Wet Season
8.21 291.00 1.47 35.40 9.23 1.17 0.81 0.12 0.11 0.14 Not detected
Xiaohai Dry Season
7.54 27.33 0.66 53.57 17.10 25.23 17.56 0.21 0.52 0.44 41.10
Wet Season
8.21 349.67 5.60 34.20 9.13 0.55 0.13 0.07 0.04 Not detected Not detected
Jiupaigan Dry Season
7.47 289.33 2.06 44.63 11.20 3.09 1.32 0.08 0.09 0.02 0.45
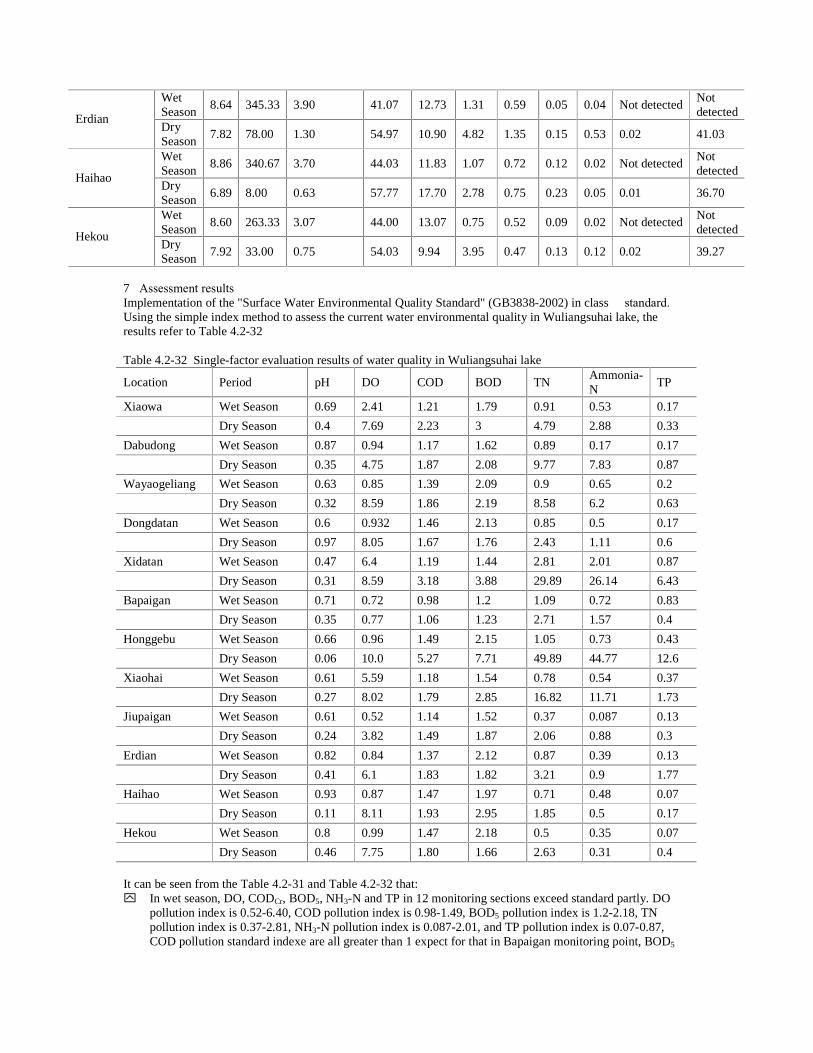
Wet Season
8.64 345.33 3.90 41.07 12.73 1.31 0.59 0.05 0.04 Not detected Not detected
Erdian Dry Season
7.82 78.00 1.30 54.97 10.90 4.82 1.35 0.15 0.53 0.02 41.03
Wet Season
8.86 340.67 3.70 44.03 11.83 1.07 0.72 0.12 0.02 Not detected Not detected
Haihao Dry Season
6.89 8.00 0.63 57.77 17.70 2.78 0.75 0.23 0.05 0.01 36.70
Wet Season
8.60 263.33 3.07 44.00 13.07 0.75 0.52 0.09 0.02 Not detected Not detected
Hekou Dry Season
7.92 33.00 0.75 54.03 9.94 3.95 0.47 0.13 0.12 0.02 39.27
7�Assessment results Implementation of the "Surface Water Environmental Quality Standard" (GB3838-2002) in class � standard. Using the simple index method to assess the current water environmental quality in Wuliangsuhai lake, the results refer to Table 4.2-32 Table 4.2-32 Single-factor evaluation results of water quality in Wuliangsuhai lake
Location Period pH DO COD BOD TN Ammonia-N
TP
Xiaowa Wet Season 0.69 2.41 1.21 1.79 0.91 0.53 0.17 Dry Season 0.4 7.69 2.23 3 4.79 2.88 0.33
Dabudong Wet Season 0.87 0.94 1.17 1.62 0.89 0.17 0.17 Dry Season 0.35 4.75 1.87 2.08 9.77 7.83 0.87
Wayaogeliang Wet Season 0.63 0.85 1.39 2.09 0.9 0.65 0.2 Dry Season 0.32 8.59 1.86 2.19 8.58 6.2 0.63
Dongdatan Wet Season 0.6 0.932 1.46 2.13 0.85 0.5 0.17 Dry Season 0.97 8.05 1.67 1.76 2.43 1.11 0.6
Xidatan Wet Season 0.47 6.4 1.19 1.44 2.81 2.01 0.87 Dry Season 0.31 8.59 3.18 3.88 29.89 26.14 6.43
Bapaigan Wet Season 0.71 0.72 0.98 1.2 1.09 0.72 0.83 Dry Season 0.35 0.77 1.06 1.23 2.71 1.57 0.4
Honggebu Wet Season 0.66 0.96 1.49 2.15 1.05 0.73 0.43 Dry Season 0.06 10.0 5.27 7.71 49.89 44.77 12.6
Xiaohai Wet Season 0.61 5.59 1.18 1.54 0.78 0.54 0.37 Dry Season 0.27 8.02 1.79 2.85 16.82 11.71 1.73
Jiupaigan Wet Season 0.61 0.52 1.14 1.52 0.37 0.087 0.13 Dry Season 0.24 3.82 1.49 1.87 2.06 0.88 0.3
Erdian Wet Season 0.82 0.84 1.37 2.12 0.87 0.39 0.13 Dry Season 0.41 6.1 1.83 1.82 3.21 0.9 1.77
Haihao Wet Season 0.93 0.87 1.47 1.97 0.71 0.48 0.07 Dry Season 0.11 8.11 1.93 2.95 1.85 0.5 0.17
Hekou Wet Season 0.8 0.99 1.47 2.18 0.5 0.35 0.07 Dry Season 0.46 7.75 1.80 1.66 2.63 0.31 0.4
It can be seen from the Table 4.2-31 and Table 4.2-32 that: y� In wet season, DO, CODCr, BOD5, NH3-N and TP in 12 monitoring sections exceed standard partly. DO
pollution index is 0.52-6.40, COD pollution index is 0.98-1.49, BOD5 pollution index is 1.2-2.18, TN pollution index is 0.37-2.81, NH3-N pollution index is 0.087-2.01, and TP pollution index is 0.07-0.87, COD pollution standard indexe are all greater than 1 expect for that in Bapaigan monitoring point, BOD5
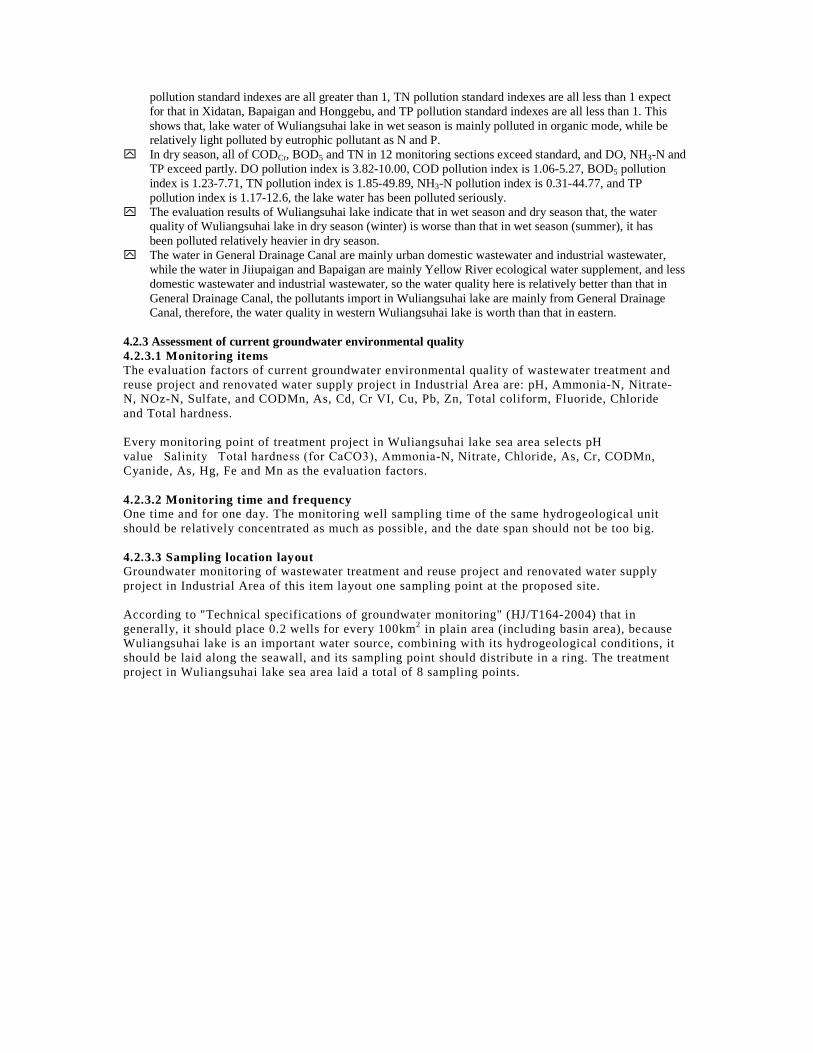
pollution standard indexes are all greater than 1, TN pollution standard indexes are all less than 1 expect for that in Xidatan, Bapaigan and Honggebu, and TP pollution standard indexes are all less than 1. This shows that, lake water of Wuliangsuhai lake in wet season is mainly polluted in organic mode, while be relatively light polluted by eutrophic pollutant as N and P.
y� In dry season, all of CODCr, BOD5 and TN in 12 monitoring sections exceed standard, and DO, NH3-N and TP exceed partly. DO pollution index is 3.82-10.00, COD pollution index is 1.06-5.27, BOD5 pollution index is 1.23-7.71, TN pollution index is 1.85-49.89, NH3-N pollution index is 0.31-44.77, and TP pollution index is 1.17-12.6, the lake water has been polluted seriously.
y� The evaluation results of Wuliangsuhai lake indicate that in wet season and dry season that, the water quality of Wuliangsuhai lake in dry season (winter) is worse than that in wet season (summer), it has been polluted relatively heavier in dry season.
y� The water in General Drainage Canal are mainly urban domestic wastewater and industrial wastewater, while the water in Jiiupaigan and Bapaigan are mainly Yellow River ecological water supplement, and less domestic wastewater and industrial wastewater, so the water quality here is relatively better than that in General Drainage Canal, the pollutants import in Wuliangsuhai lake are mainly from General Drainage Canal, therefore, the water quality in western Wuliangsuhai lake is worth than that in eastern.
4.2.3 Assessment of current groundwater environmental quality 4.2.3.1 Monitoring items The evaluation factors of current groundwater environmental quality of wastewater treatment and reuse project and renovated water supply project in Industrial Area are: pH, Ammonia-N, Nitrate-N, NOz-N, Sulfate, and CODMn, As, Cd, Cr VI, Cu, Pb, Zn, Total coliform, Fluoride, Chloride and Total hardness. Every monitoring point of treatment project in Wuliangsuhai lake sea area selects pH value�Salinity�Total hardness (for CaCO3), Ammonia-N, Nitrate, Chloride, As, Cr, CODMn, Cyanide, As, Hg, Fe and Mn as the evaluation factors. 4.2.3.2 Monitoring time and frequency One time and for one day. The monitoring well sampling time of the same hydrogeological unit should be relatively concentrated as much as possible, and the date span should not be too big. 4.2.3.3 Sampling location layout Groundwater monitoring of wastewater treatment and reuse project and renovated water supply project in Industrial Area of this item layout one sampling point at the proposed site. According to "Technical specifications of groundwater monitoring" (HJ/T164-2004) that in generally, it should place 0.2 wells for every 100km2 in plain area (including basin area), because Wuliangsuhai lake is an important water source, combining with its hydrogeological conditions, it should be laid along the seawall, and its sampling point should distribute in a ring. The treatment project in Wuliangsuhai lake sea area laid a total of 8 sampling points.

Figure 4.2-3 The monitoring sites of current groundwater quality 4.2.3.4 Monitoring The test method should be implemented according to the national satandards GB 5750 “The test method of drinking water standard”. 4.2.3.5 Monitoring results The groundwater monitoring results of wastewater treatment and reuse project and renovated water supply project in Industrial Area refers to Table 4.2-33, and the monitoring results of the treatment project groundwater in Wuliangsuhai lake sea area refer to Table 4.2-34.
Table 4.2-33 Groundwater monitoring results of wastewater treatment and reuse and renovated water supply project
Monitoring points Items
Renovated water supply project in Qipaigan
Wastewater treatment and renovated water projects in Ganqimaodu Processing park
Wastewater treatment and renovated water projects in Wulatehouqi County Industrial Area
Renovated water supply project in Sanpaigan
Wastewater treatment projects in Wulateqianqi County Industrial Area
Well depth m 12 60 20 — —
pH 7.60 7.31 7.74 7.25 8.03
Ammonia-N 1.24 0.044 0.23 0.199 0.296
Wayaotan
Wayaotan
First field
Fifth work area
Sixth field
Fifth field
Ninth field
Fifteenth field
Second field
Third field
Eighth field
Ninth field of Xinan farm
Eighth field of Xishanzui farm
Seed multiplication farm
Erdenii Prague Sumu
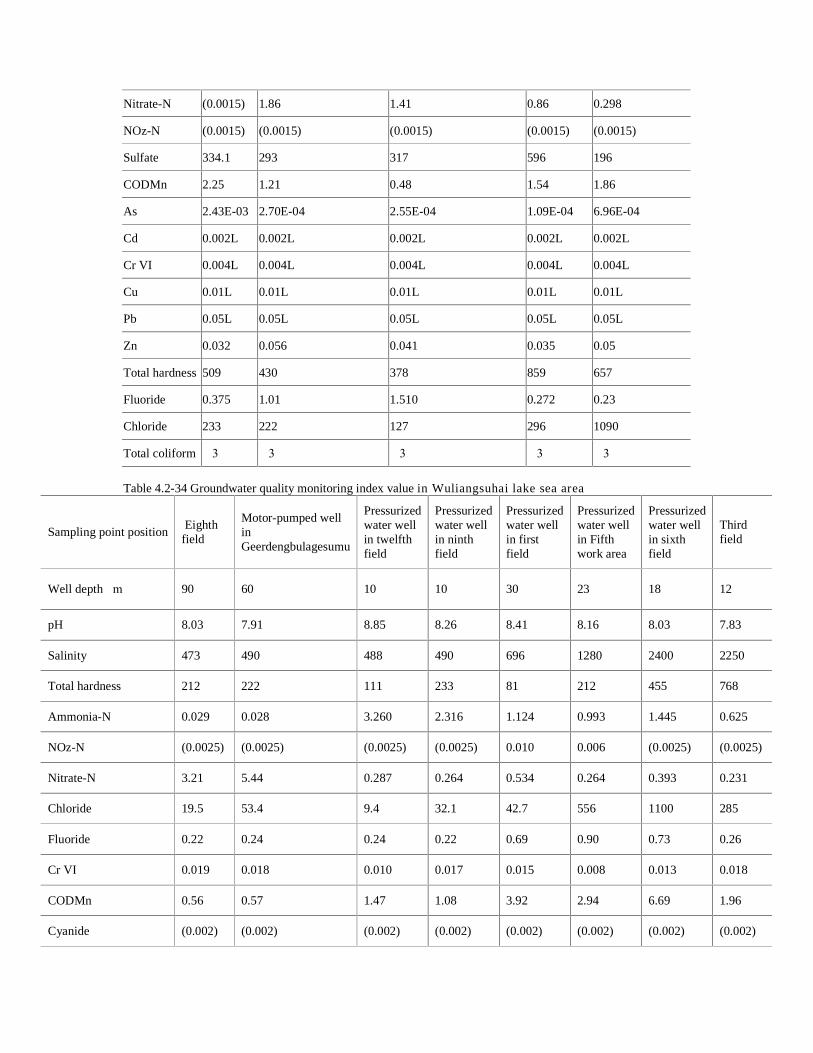
Nitrate-N (0.0015) 1.86 1.41 0.86 0.298
NOz-N (0.0015) (0.0015) (0.0015) (0.0015) (0.0015)
Sulfate 334.1 293 317 596 196
CODMn 2.25 1.21 0.48 1.54 1.86
As 2.43E-03 2.70E-04 2.55E-04 1.09E-04 6.96E-04
Cd 0.002L 0.002L 0.002L 0.002L 0.002L
Cr VI 0.004L 0.004L 0.004L 0.004L 0.004L
Cu 0.01L 0.01L 0.01L 0.01L 0.01L
Pb 0.05L 0.05L 0.05L 0.05L 0.05L
Zn 0.032 0.056 0.041 0.035 0.05
Total hardness 509 430 378 859 657
Fluoride 0.375 1.01 1.510 0.272 0.23
Chloride 233 222 127 296 1090
Total coliform �3 �3 �3 �3 �3
Table 4.2-34 Groundwater quality monitoring index value in Wuliangsuhai lake sea area
Sampling point position Eighth field
Motor-pumped well in Geerdengbulagesumu
Pressurized water well in twelfth field
Pressurized water well in ninth field
Pressurized water well in first field
Pressurized water well in Fifth work area
Pressurized water well in sixth field
Third field
Well depth�m� 90 60 10 10 30 23 18 12
pH 8.03 7.91 8.85 8.26 8.41 8.16 8.03 7.83
Salinity 473 490 488 490 696 1280 2400 2250
Total hardness 212 222 111 233 81 212 455 768
Ammonia-N 0.029 0.028 3.260 2.316 1.124 0.993 1.445 0.625
NOz-N (0.0025) (0.0025) (0.0025) (0.0025) 0.010 0.006 (0.0025) (0.0025)
Nitrate-N 3.21 5.44 0.287 0.264 0.534 0.264 0.393 0.231
Chloride 19.5 53.4 9.4 32.1 42.7 556 1100 285
Fluoride 0.22 0.24 0.24 0.22 0.69 0.90 0.73 0.26
Cr VI 0.019 0.018 0.010 0.017 0.015 0.008 0.013 0.018
CODMn 0.56 0.57 1.47 1.08 3.92 2.94 6.69 1.96
Cyanide (0.002) (0.002) (0.002) (0.002) (0.002) (0.002) (0.002) (0.002)
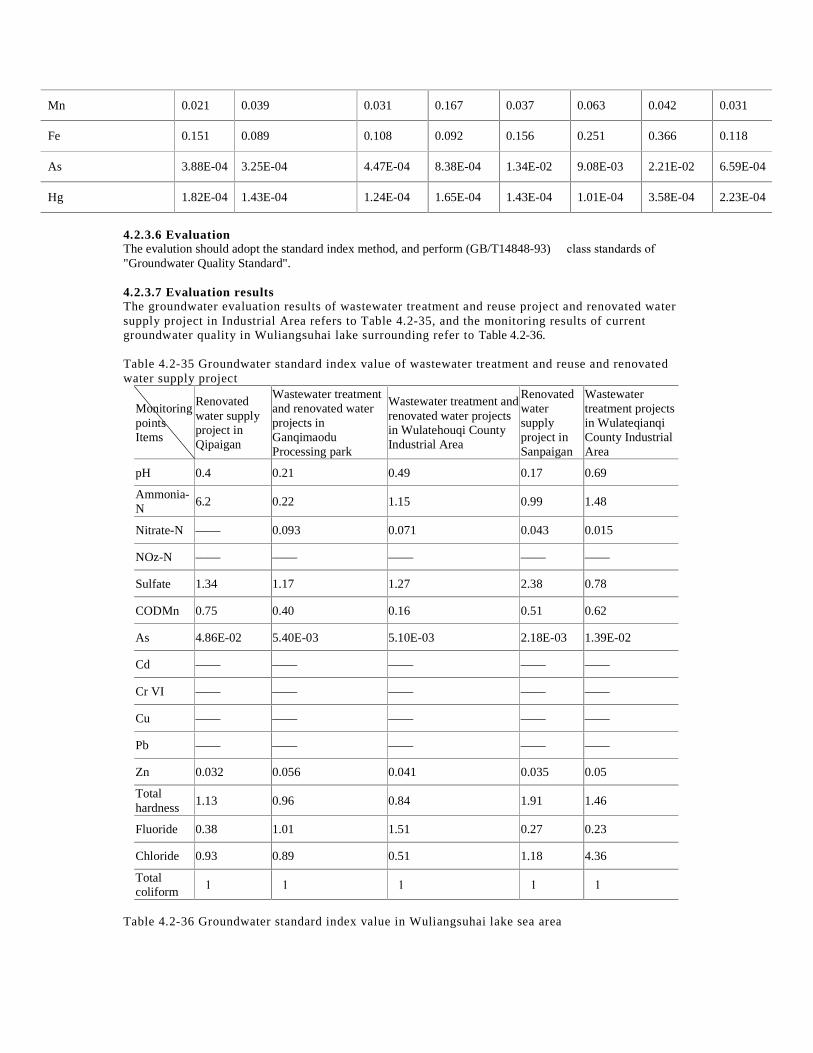
Mn 0.021 0.039 0.031 0.167 0.037 0.063 0.042 0.031
Fe 0.151 0.089 0.108 0.092 0.156 0.251 0.366 0.118
As 3.88E-04 3.25E-04 4.47E-04 8.38E-04 1.34E-02 9.08E-03 2.21E-02 6.59E-04
Hg 1.82E-04 1.43E-04 1.24E-04 1.65E-04 1.43E-04 1.01E-04 3.58E-04 2.23E-04
4.2.3.6 Evaluation The evalution should adopt the standard index method, and perform (GB/T14848-93) � class standards of "Groundwater Quality Standard". 4.2.3.7 Evaluation results The groundwater evaluation results of wastewater treatment and reuse project and renovated water supply project in Industrial Area refers to Table 4.2-35, and the monitoring results of current groundwater quality in Wuliangsuhai lake surrounding refer to Table 4.2-36. Table 4.2-35 Groundwater standard index value of wastewater treatment and reuse and renovated water supply project
Monitoring points Items
Renovated water supply project in Qipaigan
Wastewater treatment and renovated water projects in Ganqimaodu Processing park
Wastewater treatment and renovated water projects in Wulatehouqi County Industrial Area
Renovated water supply project in Sanpaigan
Wastewater treatment projects in Wulateqianqi County Industrial Area
pH 0.4 0.21 0.49 0.17 0.69
Ammonia-N
6.2 0.22 1.15 0.99 1.48
Nitrate-N —— 0.093 0.071 0.043 0.015
NOz-N —— —— —— —— ——
Sulfate 1.34 1.17 1.27 2.38 0.78
CODMn 0.75 0.40 0.16 0.51 0.62
As 4.86E-02 5.40E-03 5.10E-03 2.18E-03 1.39E-02
Cd —— —— —— —— ——
Cr VI —— —— —— —— ——
Cu —— —— —— —— ——
Pb —— —— —— —— ——
Zn 0.032 0.056 0.041 0.035 0.05
Total hardness
1.13 0.96 0.84 1.91 1.46
Fluoride 0.38 1.01 1.51 0.27 0.23
Chloride 0.93 0.89 0.51 1.18 4.36
Total coliform
�1 �1 �1 �1 �1
Table 4.2-36 Groundwater standard index value in Wuliangsuhai lake sea area
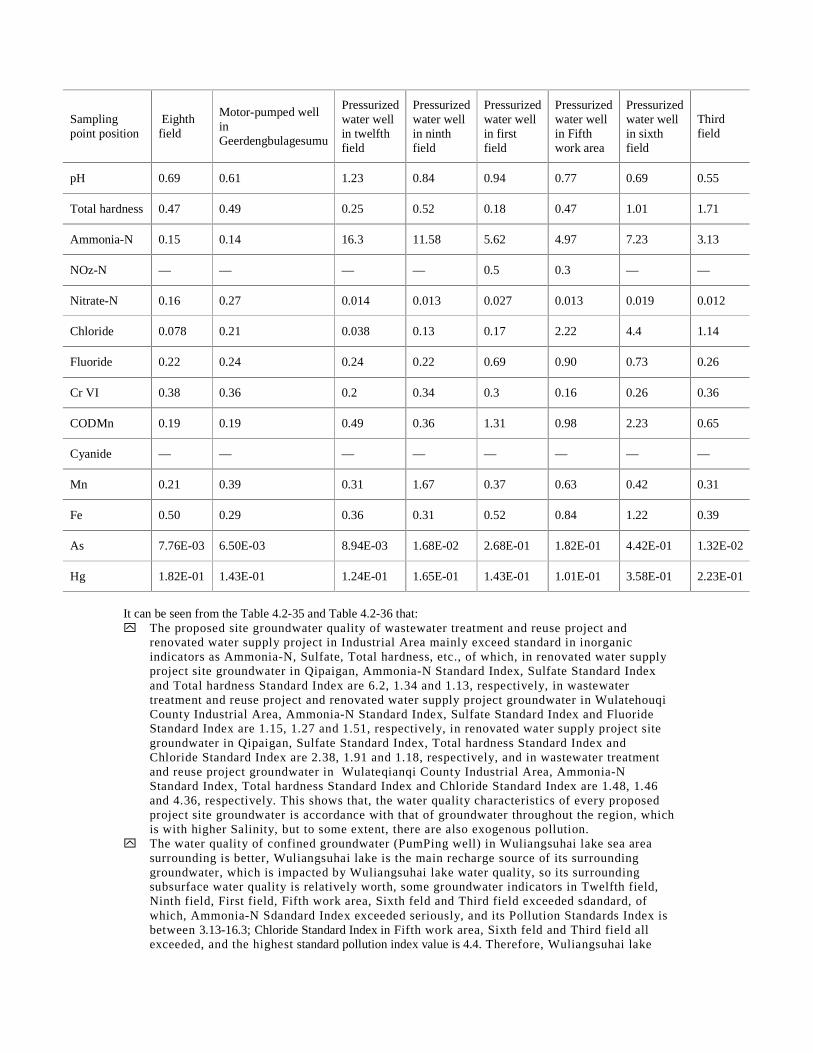
Sampling point position
Eighth field
Motor-pumped well in Geerdengbulagesumu
Pressurized water well in twelfth field
Pressurized water well in ninth field
Pressurized water well in first field
Pressurized water well in Fifth work area
Pressurized water well in sixth field
Third field
pH 0.69 0.61 1.23 0.84 0.94 0.77 0.69 0.55
Total hardness 0.47 0.49 0.25 0.52 0.18 0.47 1.01 1.71
Ammonia-N 0.15 0.14 16.3 11.58 5.62 4.97 7.23 3.13
NOz-N — — — — 0.5 0.3 — —
Nitrate-N 0.16 0.27 0.014 0.013 0.027 0.013 0.019 0.012
Chloride 0.078 0.21 0.038 0.13 0.17 2.22 4.4 1.14
Fluoride 0.22 0.24 0.24 0.22 0.69 0.90 0.73 0.26
Cr VI 0.38 0.36 0.2 0.34 0.3 0.16 0.26 0.36
CODMn 0.19 0.19 0.49 0.36 1.31 0.98 2.23 0.65
Cyanide — — — — — — — —
Mn 0.21 0.39 0.31 1.67 0.37 0.63 0.42 0.31
Fe 0.50 0.29 0.36 0.31 0.52 0.84 1.22 0.39
As 7.76E-03 6.50E-03 8.94E-03 1.68E-02 2.68E-01 1.82E-01 4.42E-01 1.32E-02
Hg 1.82E-01 1.43E-01 1.24E-01 1.65E-01 1.43E-01 1.01E-01 3.58E-01 2.23E-01
It can be seen from the Table 4.2-35 and Table 4.2-36 that: y� The proposed site groundwater quality of wastewater treatment and reuse project and
renovated water supply project in Industrial Area mainly exceed standard in inorganic indicators as Ammonia-N, Sulfate, Total hardness, etc., of which, in renovated water supply project site groundwater in Qipaigan, Ammonia-N Standard Index, Sulfate Standard Index and Total hardness Standard Index are 6.2, 1.34 and 1.13, respectively, in wastewater treatment and reuse project and renovated water supply project groundwater in Wulatehouqi County Industrial Area, Ammonia-N Standard Index, Sulfate Standard Index and Fluoride Standard Index are 1.15, 1.27 and 1.51, respectively, in renovated water supply project site groundwater in Qipaigan, Sulfate Standard Index, Total hardness Standard Index and Chloride Standard Index are 2.38, 1.91 and 1.18, respectively, and in wastewater treatment and reuse project groundwater in Wulateqianqi County Industrial Area, Ammonia-N Standard Index, Total hardness Standard Index and Chloride Standard Index are 1.48, 1.46 and 4.36, respectively. This shows that, the water quality characteristics of every proposed project site groundwater is accordance with that of groundwater throughout the region, which is with higher Salinity, but to some extent, there are also exogenous pollution.
y� The water quality of confined groundwater (PumPing well) in Wuliangsuhai lake sea area surrounding is better, Wuliangsuhai lake is the main recharge source of its surrounding groundwater, which is impacted by Wuliangsuhai lake water quality, so its surrounding subsurface water quality is relatively worth, some groundwater indicators in Twelfth field, Ninth field, First field, Fifth work area, Sixth feld and Third field exceeded sdandard, of which, Ammonia-N Sdandard Index exceeded seriously, and its Pollution Standards Index is between 3.13-16.3; Chloride Standard Index in Fifth work area, Sixth feld and Third field all exceeded, and the highest standard pollution index value is 4.4. Therefore, Wuliangsuhai lake
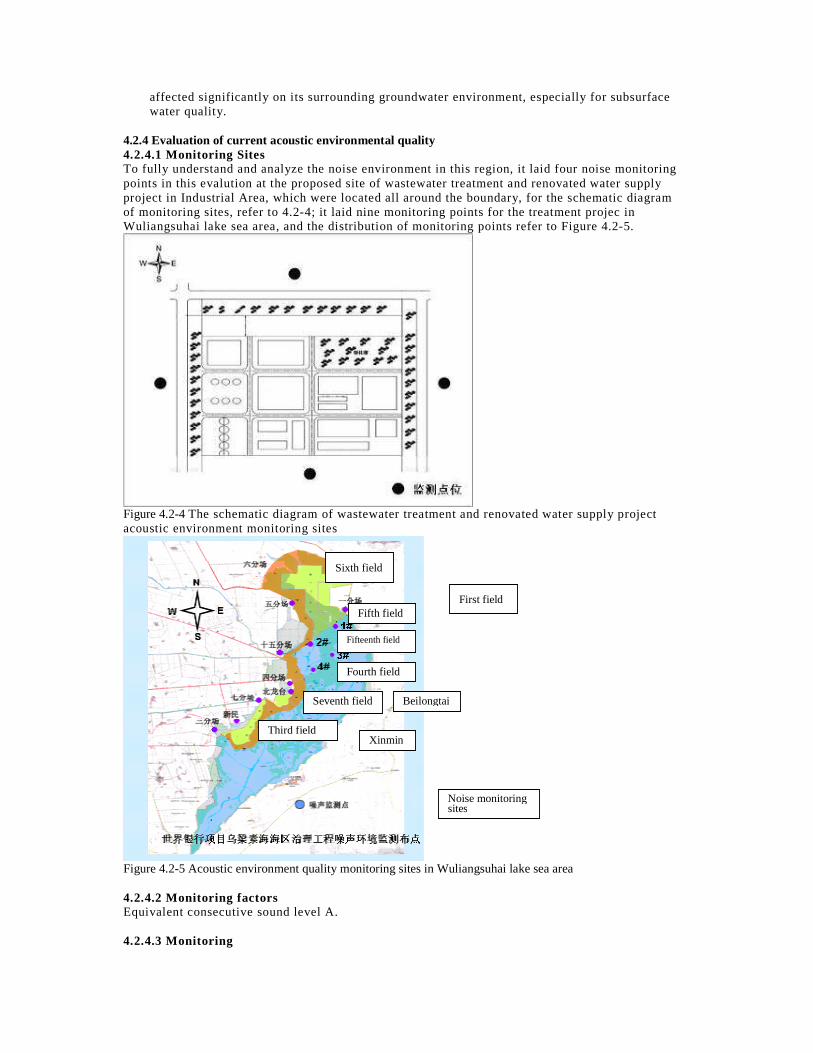
affected significantly on its surrounding groundwater environment, especially for subsurface water quality.
4.2.4 Evaluation of current acoustic environmental quality 4.2.4.1 Monitoring Sites To fully understand and analyze the noise environment in this region, it laid four noise monitoring points in this evalution at the proposed site of wastewater treatment and renovated water supply project in Industrial Area, which were located all around the boundary, for the schematic diagram of monitoring sites, refer to 4.2-4; it laid nine monitoring points for the treatment projec in Wuliangsuhai lake sea area, and the distribution of monitoring points refer to Figure 4.2-5.
Figure 4.2-4 The schematic diagram of wastewater treatment and renovated water supply project acoustic environment monitoring sites
Figure 4.2-5 Acoustic environment quality monitoring sites in Wuliangsuhai lake sea area 4.2.4.2 Monitoring factors Equivalent consecutive sound level A. 4.2.4.3 Monitoring
Xinmin
First field
Sixth field
Fifth field
Third field
Seventh field Beilongtai
Fourth field
Fifteenth field
Noise monitoring sites
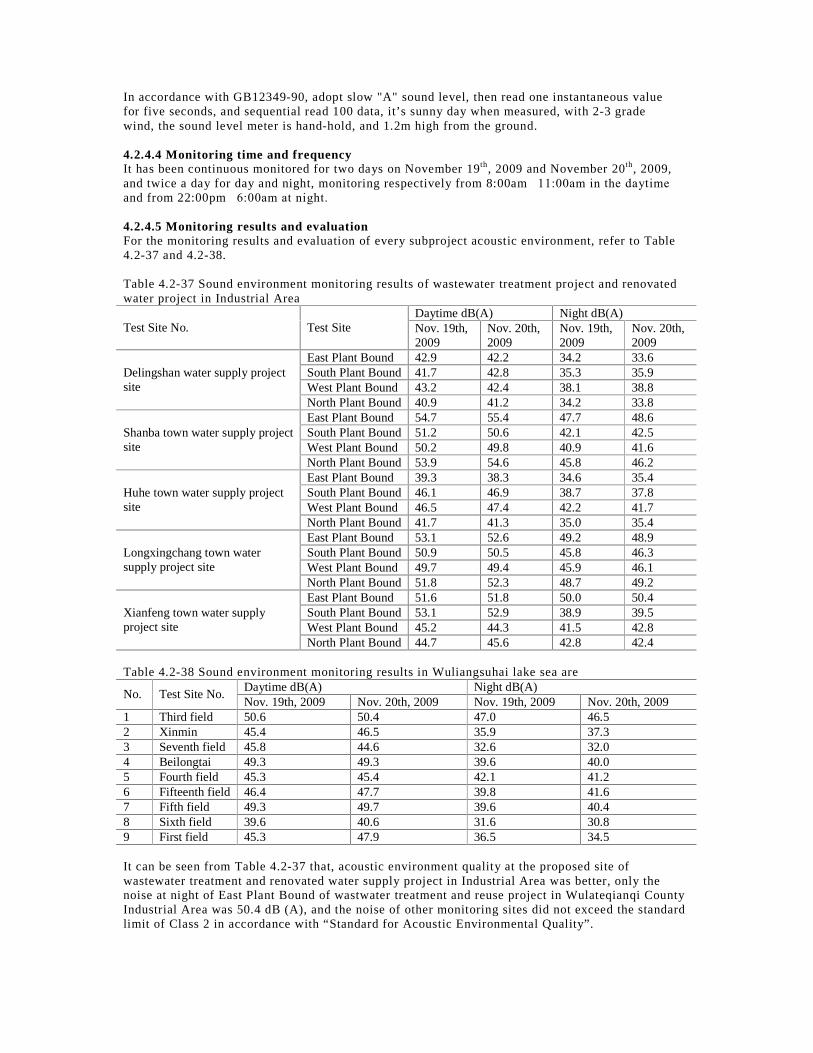
In accordance with GB12349-90, adopt slow "A" sound level, then read one instantaneous value for five seconds, and sequential read 100 data, it’s sunny day when measured, with 2-3 grade wind, the sound level meter is hand-hold, and 1.2m high from the ground. 4.2.4.4 Monitoring time and frequency It has been continuous monitored for two days on November 19th, 2009 and November 20th, 2009, and twice a day for day and night, monitoring respectively from 8:00am�11:00am in the daytime and from 22:00pm�6:00am at night. 4.2.4.5 Monitoring results and evaluation For the monitoring results and evaluation of every subproject acoustic environment, refer to Table 4.2-37 and 4.2-38. Table 4.2-37 Sound environment monitoring results of wastewater treatment project and renovated water project in Industrial Area
Daytime dB(A) Night dB(A) Test Site No. Test Site Nov. 19th,
2009 Nov. 20th, 2009
Nov. 19th, 2009
Nov. 20th, 2009
East Plant Bound 42.9 42.2 34.2 33.6 South Plant Bound 41.7 42.8 35.3 35.9 West Plant Bound 43.2 42.4 38.1 38.8
Delingshan water supply project site
North Plant Bound 40.9 41.2 34.2 33.8 East Plant Bound 54.7 55.4 47.7 48.6 South Plant Bound 51.2 50.6 42.1 42.5 West Plant Bound 50.2 49.8 40.9 41.6
Shanba town water supply project site
North Plant Bound 53.9 54.6 45.8 46.2 East Plant Bound 39.3 38.3 34.6 35.4 South Plant Bound 46.1 46.9 38.7 37.8 West Plant Bound 46.5 47.4 42.2 41.7
Huhe town water supply project site
North Plant Bound 41.7 41.3 35.0 35.4 East Plant Bound 53.1 52.6 49.2 48.9 South Plant Bound 50.9 50.5 45.8 46.3 West Plant Bound 49.7 49.4 45.9 46.1
Longxingchang town water supply project site
North Plant Bound 51.8 52.3 48.7 49.2 East Plant Bound 51.6 51.8 50.0 50.4 South Plant Bound 53.1 52.9 38.9 39.5 West Plant Bound 45.2 44.3 41.5 42.8
Xianfeng town water supply project site
North Plant Bound 44.7 45.6 42.8 42.4 Table 4.2-38 Sound environment monitoring results in Wuliangsuhai lake sea are
Daytime dB(A) Night dB(A) No. Test Site No.
Nov. 19th, 2009 Nov. 20th, 2009 Nov. 19th, 2009 Nov. 20th, 2009 1 Third field 50.6 50.4 47.0 46.5 2 Xinmin 45.4 46.5 35.9 37.3 3 Seventh field 45.8 44.6 32.6 32.0 4 Beilongtai 49.3 49.3 39.6 40.0 5 Fourth field 45.3 45.4 42.1 41.2 6 Fifteenth field 46.4 47.7 39.8 41.6 7 Fifth field 49.3 49.7 39.6 40.4 8 Sixth field 39.6 40.6 31.6 30.8 9 First field 45.3 47.9 36.5 34.5
It can be seen from Table 4.2-37 that, acoustic environment quality at the proposed site of wastewater treatment and renovated water supply project in Industrial Area was better, only the noise at night of East Plant Bound of wastwater treatment and reuse project in Wulateqianqi County Industrial Area was 50.4 dB (A), and the noise of other monitoring sites did not exceed the standard limit of Class 2 in accordance with “Standard for Acoustic Environmental Quality”.
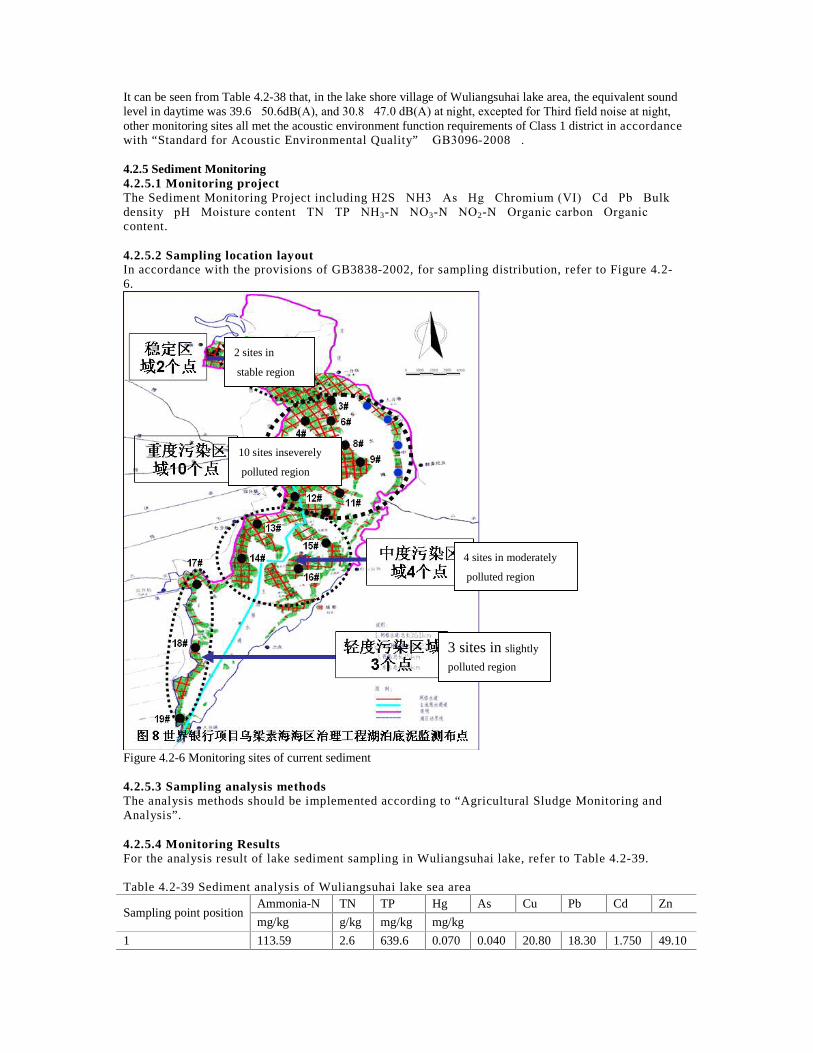
It can be seen from Table 4.2-38 that, in the lake shore village of Wuliangsuhai lake area, the equivalent sound level in daytime was 39.6�50.6dB(A), and 30.8�47.0 dB(A) at night, excepted for Third field noise at night, other monitoring sites all met the acoustic environment function requirements of Class 1 district in accordance with “Standard for Acoustic Environmental Quality” �GB3096-2008�. 4.2.5 Sediment Monitoring 4.2.5.1 Monitoring project The Sediment Monitoring Project including H2S�NH3�As�Hg�Chromium (VI)�Cd�Pb�Bulk density�pH�Moisture content�TN�TP�NH3-N�NO3-N�NO2-N�Organic carbon�Organic content. 4.2.5.2 Sampling location layout In accordance with the provisions of GB3838-2002, for sampling distribution, refer to Figure 4.2-6.
Figure 4.2-6 Monitoring sites of current sediment 4.2.5.3 Sampling analysis methods The analysis methods should be implemented according to “Agricultural Sludge Monitoring and Analysis”. 4.2.5.4 Monitoring Results For the analysis result of lake sediment sampling in Wuliangsuhai lake, refer to Table 4.2-39. Table 4.2-39 Sediment analysis of Wuliangsuhai lake sea area
Ammonia-N TN TP Hg As Cu Pb Cd Zn Sampling point position
mg/kg g/kg mg/kg mg/kg
1 113.59 2.6 639.6 0.070 0.040 20.80 18.30 1.750 49.10
2 sites in
stable region
10 sites inseverely
polluted region
4 sites in moderately
polluted region
3 sites in slightly
polluted region
2 48.05 1.5 638.4 0.125 0.012 30.00 20.30 1.820 57.93
3 77.62 2.4 438.1 0.155 0.020 23.60 14.70 1.410 44.50
4 129.36 1.3 423.4 0.05 0.032 22.95 16.96 1.94 48.68
5 213.64 1.2 355.4 0.082 0.035 25.94 12.77 1.69 53.44
6 163.86 1.1 400.1 0.06 0.027 30.39 16.55 1.95 51.57
7 44.60 1.5 504.3 0.050 0.011 7.118 11.75 0.908 33.43
8 57.90 1.6 603.8 0.048 0.032 16.78 14.99 1.669 47.33
9 60.37 2 245.2 0.047 0.030 10.96 13.61 1.111 34.32
10 93.39 2.3 368.6 0.046 0.036 10.86 13.08 1.284 38.40
11 58.4 1.2 544.6 0.055 0.017 10.8 10.51 1.28 33.76
12 53 1.5 528.7 0.048 0.022 14.82 14.41 1.357 46.23
13 43.12 1.1 447.2 0.048 0.025 14.25 14.19 1.27 45.49
14 75.77 1.1 521.3 0.024 0.018 9.106 5.900 0.584 16.25
15 86.86 1 344.9 0.058 0.059 10.56 10.85 0.904 31.25
16 40.66 0.9 271.6 0.074 0.042 21.60 19.10 1.540 51.21
17 102.5 3.3 586.2 0.056 0.059 9.280 14.30 1.220 38.51
18 35.79 2.6 432.4 0.034 0.041 10.18 13.52 1.245 38.69
19 55.44 2.1 312.6 0.047 0.086 11.31 12.18 1.356 40.64 4.2.5.5 Evaluation results According to “Contaminants Control Standard for Agricultural Sludge” (GB 4284-84), Hg�0.155 (Max=15mg kg-1), Cu�30.39 (Max=500mg kg-1), Pb�20.3 (Max=1000mg kg-1), Cd�1.95 (Max=20mg kg-1) and Zn�57.93 (Max=1000mg kg-1). It can be seen that, the content of heavy metals didi not exceed the “Contaminants Control Standard for Agricultural Sludge”, so Saline soil can be improved. 4,2.5.6 Analysis of sediment release Sediment endogenous pollution and its potential ecological risk are two key problems to decide whether to excavate and how deep to excavate. overlying water whether to be affected by sediment endogenous pollution can be reflected by the intensity factor that is target pollutant release rate; Sediments whether to have a higher potential ecological risk can be evaluated by the breadth factor that is occurrence of pollutants which has an important impact on biological in sediment. The former focuses on reflecting the effect on new surface overlying water after dredging, while the latter reflects the possible potential ecological risk on new surface environment. In order to master the details above before scientifically understand the decision of grid water channel excavation; it must understand the spatial distribution of pollutants in sediments and the release of sediment endogenous. In January 2010 the sediment sampling was conducted at 19 sample points in Wuliangsuhai lake, and simulated the release of N and P in sediment under 25 � indoor. Analysis shows that: the release rate of N in other regions of Wuliangsuhai lake was relatively low, excepted for that in 5# sample point (64.34mg/m2 d on average); while the release rate of P were generally higher, excepted for 19# sample point in fringe of dredging area, the release rate in many other regions were about 2 mg/m2·d, of which, the release rate of P at 5# sample point reached 8.76mg/m2·d, P in Wuliangsuhai lake is the restrictive nutrient element for biological, so it would be extremely important to control the release of P in sediment. It can be seen form the result of N and P release (Figure 4.2-7) that, N release in excavation area show forward and reverse, and forward is greater than reverse. Of which, the release rate is relatively faster in vicinity of Xidatan. However, in terms of P release, all of the sampling points released forward, and the release rate was almost beyond 2.0mg/m2·d, which reflected that the entire excavation area had a obvious character of endogenous pollution in sediment. P is the main substance source to the eutrophication of Wuliangsuhai lake,
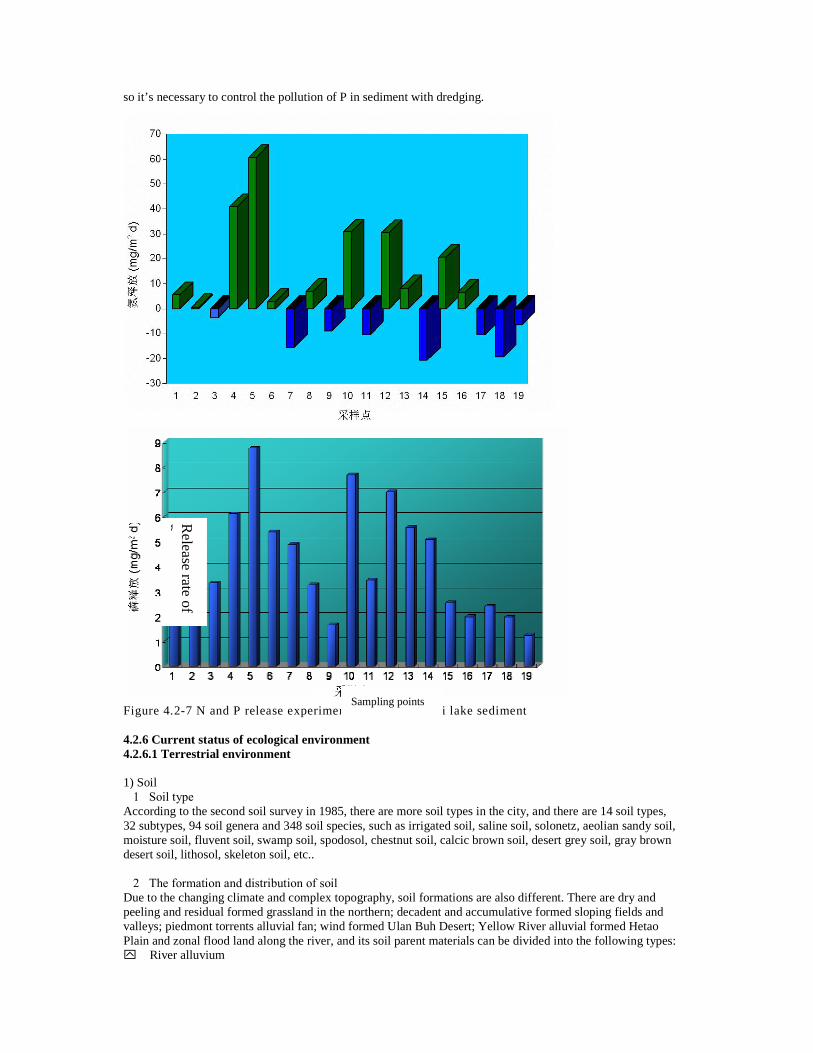
so it’s necessary to control the pollution of P in sediment with dredging.
Figure 4.2-7 N and P release experiment of Wuliangsuhai lake sediment 4.2.6 Current status of ecological environment 4.2.6.1 Terrestrial environment 1) Soil �1�Soil type According to the second soil survey in 1985, there are more soil types in the city, and there are 14 soil types, 32 subtypes, 94 soil genera and 348 soil species, such as irrigated soil, saline soil, solonetz, aeolian sandy soil, moisture soil, fluvent soil, swamp soil, spodosol, chestnut soil, calcic brown soil, desert grey soil, gray brown desert soil, lithosol, skeleton soil, etc.. �2�The formation and distribution of soil Due to the changing climate and complex topography, soil formations are also different. There are dry and peeling and residual formed grassland in the northern; decadent and accumulative formed sloping fields and valleys; piedmont torrents alluvial fan; wind formed Ulan Buh Desert; Yellow River alluvial formed Hetao Plain and zonal flood land along the river, and its soil parent materials can be divided into the following types: y� River alluvium
Sampling points
Release rate of
P
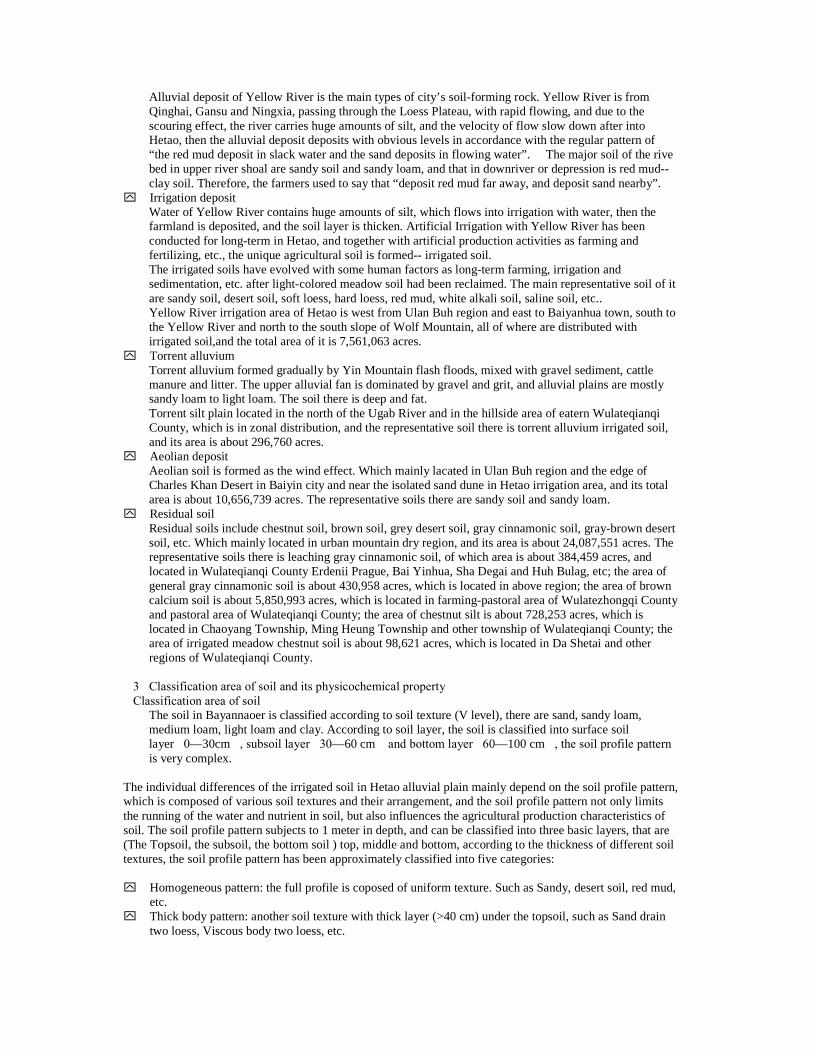
Alluvial deposit of Yellow River is the main types of city’s soil-forming rock. Yellow River is from Qinghai, Gansu and Ningxia, passing through the Loess Plateau, with rapid flowing, and due to the scouring effect, the river carries huge amounts of silt, and the velocity of flow slow down after into Hetao, then the alluvial deposit deposits with obvious levels in accordance with the regular pattern of “the red mud deposit in slack water and the sand deposits in flowing water”. The major soil of the rive bed in upper river shoal are sandy soil and sandy loam, and that in downriver or depression is red mud-- clay soil. Therefore, the farmers used to say that “deposit red mud far away, and deposit sand nearby”.
y� Irrigation deposit Water of Yellow River contains huge amounts of silt, which flows into irrigation with water, then the farmland is deposited, and the soil layer is thicken. Artificial Irrigation with Yellow River has been conducted for long-term in Hetao, and together with artificial production activities as farming and fertilizing, etc., the unique agricultural soil is formed-- irrigated soil. The irrigated soils have evolved with some human factors as long-term farming, irrigation and sedimentation, etc. after light-colored meadow soil had been reclaimed. The main representative soil of it are sandy soil, desert soil, soft loess, hard loess, red mud, white alkali soil, saline soil, etc.. Yellow River irrigation area of Hetao is west from Ulan Buh region and east to Baiyanhua town, south to the Yellow River and north to the south slope of Wolf Mountain, all of where are distributed with irrigated soil,and the total area of it is 7,561,063 acres.
y� Torrent alluvium Torrent alluvium formed gradually by Yin Mountain flash floods, mixed with gravel sediment, cattle manure and litter. The upper alluvial fan is dominated by gravel and grit, and alluvial plains are mostly sandy loam to light loam. The soil there is deep and fat. Torrent silt plain located in the north of the Ugab River and in the hillside area of eatern Wulateqianqi County, which is in zonal distribution, and the representative soil there is torrent alluvium irrigated soil, and its area is about 296,760 acres.
y� Aeolian deposit Aeolian soil is formed as the wind effect. Which mainly lacated in Ulan Buh region and the edge of Charles Khan Desert in Baiyin city and near the isolated sand dune in Hetao irrigation area, and its total area is about 10,656,739 acres. The representative soils there are sandy soil and sandy loam.
y� Residual soil Residual soils include chestnut soil, brown soil, grey desert soil, gray cinnamonic soil, gray-brown desert soil, etc. Which mainly located in urban mountain dry region, and its area is about 24,087,551 acres. The representative soils there is leaching gray cinnamonic soil, of which area is about 384,459 acres, and located in Wulateqianqi County Erdenii Prague, Bai Yinhua, Sha Degai and Huh Bulag, etc; the area of general gray cinnamonic soil is about 430,958 acres, which is located in above region; the area of brown calcium soil is about 5,850,993 acres, which is located in farming-pastoral area of Wulatezhongqi County and pastoral area of Wulateqianqi County; the area of chestnut silt is about 728,253 acres, which is located in Chaoyang Township, Ming Heung Township and other township of Wulateqianqi County; the area of irrigated meadow chestnut soil is about 98,621 acres, which is located in Da Shetai and other regions of Wulateqianqi County.
�3�Classification area of soil and its physicochemical property �Classification area of soil
The soil in Bayannaoer is classified according to soil texture (V level), there are sand, sandy loam, medium loam, light loam and clay. According to soil layer, the soil is classified into surface soil layer�0—30cm�, subsoil layer�30—60 cm� and bottom layer�60—100 cm�, the soil profile pattern is very complex.
The individual differences of the irrigated soil in Hetao alluvial plain mainly depend on the soil profile pattern, which is composed of various soil textures and their arrangement, and the soil profile pattern not only limits the running of the water and nutrient in soil, but also influences the agricultural production characteristics of soil. The soil profile pattern subjects to 1 meter in depth, and can be classified into three basic layers, that are (The Topsoil, the subsoil, the bottom soil ) top, middle and bottom, according to the thickness of different soil textures, the soil profile pattern has been approximately classified into five categories: y� Homogeneous pattern: the full profile is coposed of uniform texture. Such as Sandy, desert soil, red mud,
etc. y� Thick body pattern: another soil texture with thick layer (>40 cm) under the topsoil, such as Sand drain
two loess, Viscous body two loess, etc.
y� Bandwich pattern: another soil texture with middle thick layer (20—40 cm) in the subsoil layer, such as two loess with sand, two loess with clay, etc.
y� Bottom pattern: another soil texture with middle thick layer under the bottom soil, such as sandy soil with clay bottom, two loess with sand bottom, etc.
y� Three segmental patterns: the three layer segments of top, middle and bottom are three kinds of soil texture, such as two loess with sand bottom and clay, two loess with clay bottom and sand, etc.
Each of above soil profile pattern has a different fertility properties, production characteristics, profile morphology, thickness and layer, and there are also significant differences in each growth layer of soil. The soil types in hill arid area include gray desert soil, chestnut, chestnut silt soil, etc. The soil profile pattern there is more complex, such as residual leached gray cinnamonic soil, which has thicker litter layer on the top, dark gray or black humus layer in sequence and caliche at bottom, all profiles of it are with calcium carbonate reaction, and its parent materials are gneiss and granite. 2) Vegetation The type of the vegetation in Bayannaoer is quite complex due to the influence of climat and topographic condition. It can be classified generally into mountain vegetation, desert vegetation, sandyland vegetation, crops, etc. Grassland vegetation includes dry steppe and desert steppe. Desert vegetation includes steppe desert and stony desert. Its distribution is grassland—dry steppe—desert steppe—steppe desert—desert from east to west. And is meadow vegetation—mountain vegetation—plateau dry steppe—desert from south to north. It showed obvious latitude and longitude zonality, which is consistent with the distribution of soil. In addition, there are psammophytic vegetation, halophytic vegetation, meadow vegetation and other non-zoneal vegetations. Accrding to the vegetation type and floristic characteristics, the vegetation of the whole city can be classified into six districts. Due to the farming, almost no original vegetaions were preserved in Hetao plain, and the existing arbors were planted artificially. Herb is the main vegetation there, of which, there mainly are Meadow vegetations which is dominated by Gramineae, Chenopodiaceae, Polygonaceae and Asteraceae. In the low-lying area there are Halophytic vegetations. Around the sparkling lakes there are aquatic and wetland plants. In the arid area of piedmont there are xeric prickly shrubs. �Meadow vegetation
It is distributed in flood land, and is mainly composed of grasses, such as small reed, Crypsis aculeate, serrated melilotus, Xanthium, etc. The Meadow vegetation in sea water is dominated by floatingheart. There is fewer natural vegetation in alluvial plain, and a small amount of wild plants can be seen only in the unoccupied place of farmland. The main vegetations are dominated by Equisetum ramosissimum, Eragrostis and Chloris. In addition, there are also a lot of Ixeris denticulate, Digitaria, Aster altaicus and Setaria. The wild plants which are dominated by Digitaria and Carex, is distributed in lower and wet area, of which, internodes take root sometimes down to the ground with strong spreading force. Xanthium and Chenopodium album L., which consume large amounts of nutrients, are the main weeds in the farmland. In the flat area there are Callitriche Verna, Barnyard grass and Semen Cuscutae. Wild plants which are dominated by Reeds and Barnyard grass are distributed in the shallow depression. The root of reed is corm, and its regeneration capacity is very strong, which prevails over other weeds; the symbiosis grasses include Barnyard grass, Bolboschoenus maritimus and Imperata. Wild plants which are dominated by Imperata, Drought Polygonum, Equisetum ramosissimum and Reeds, are distributed in flood plain, river channel, and sandy soil with high groundwater or coarse sandy meadow soil with slightly saline soil. Many of the Imperata are wild, and have strong growth vigor, which plays a good role in fixing the sand and diking the dam. Drought Polygonum grows in river often flood areas, and willow is its symbiosis grass.
�Halophytic vegetation
The vegetations, which are distributed in the saline soil with hight salinity, include Suaeda, Kalidium foliatum, Red Woodsorrel�Karelinia caspica�, small reed, Polygonum sibiricum, Alkali grass, Allium fistulosum, basio, stubbed rock grass, etc.. The vegetations which are are distributed in less saline areas include sea milkweed, Chinese tamarisk and Halerpestes ruthenica. And the vegetations which are are distributed in lowland saline soil includesalt absorption�suaeda salsa�, which has strong salt tolerance
and adapted to wide rang of area. In the salt accumulation area there is Nitraria tangutorum�jujube �. And in the edge of depressions where are easy for salt accumulation there is saline Chenopodiacea.
�Aquatic vegetation
It is mainly distributed in water zone or moat, the common species include Reed, Typha, yagara and Bolboschoenus maritimus, along the river bank, there are willow and Chinese tamarisk.
�Desert vegetation
There is Agriophyllum squarrosum in the wandering dune�and in the fixed dune or sandpile, there mainly is Nitraria tangutorum, and a small amount of Achnatherum sptendens. In the area with thin sand layer and higher humidity, there are Alopecuroides L, Agriophyllum pungens, Artemisia desertorum, Licorice, Inular flower and Peganum nigellastrum.
�Farmland weed
Hetao plain is irrigated agricultural area. The main weeds of summer crops include Plaque bamboo, Wild Oats, Vetch, Chenopodium album L., etc.. The main weeds of autumn crops include Agropyron, Calamagrostis, Reed, Cirsium setosum and Thistle.
�Desert grassland vegetation
It is mainly distributed in the foothills terrace of Wolf Mountain�composing of drought-tolerant small semi-shrub grasses. The common species include Caragana stenophylla, Saffranine, Pearl, Artemisia frigida, Ziziphus jujube, Caragana intermedia, Lamerei and Nitraria tangutorum.
3) Wild plants The climate in Bayannaoer is cold, drought and windy, and precipitation there decrease gradually from southeast to northwest, which led to that from southeast to northwest the vegetation taken on the distribution series of the dry steppe – the desert steppe – the steppe desert - the desert in sequence. And of which, the desert steppe and the steppe desert make up the main body of zonal vegetation in this area. It is quite lacking of wild plants in Bayannaoer, and the mian plants there is Xerophyte, there are about 94 families 378 genera and 918 species of wild plants, of which, there are 7 families 7 genera and 12 species of Pteridophyte, and the seed plants are remained. The Herbs are the main seed plants there, and there are 728 species of Herbs, which are dominated by Perennial herbs in total of 566 species, and account for 61.65% of the total number of wild plants. In addition, there are 36 families 78 genera and 178 species of xylophyta, most of which are shrubs, and only 31 species of arbors. 4.2-40 The statistical table of wild plant in Bayannaoer City
Quantity Category
Families Genera Species
Dicotyledon 71 296 712 Angiosperm
Monocotyledon 13 70 185 Gymnosperm 3 5 9
Spermatophyte
Subtotal 87 371 906 Pteridophyte 7 7 12 Total 94 378 918
The total number of wild plants in Bayannaoer is not rich, but there are more families and genera. The total number of wild plants there is 40.2% of that of Inner Mongolia Autonomous Region, while the number of sepecies there is 73.4% of the total number of families. Thus increases the complexity of plantage, and plant species are more concentrated in a small number of plant families and genera, which led to a lot of single, few species, genera and families. The wild plantage in the city contains 49 single subjects, which account for 52% of the total number of the subjects, in which, there are 28 single species, more than 20 species of 12-family, in total of 643 species of plants, which account for 67.4% of the total number of wild plants in the city, of which, there are 430 species of plants in Compositae, Gramineae, Leguminosae, Rosaceae and Chenopodiaceae, accounting for 45% of the total number of wild plants in the city. There are 196 genera of single species, while only 9 species of genera more than 10, of which, there are 26 species of Artemisia which is the most, and

secondly, there are 23 species of Astragalus and 22 species of Wilt Potentilla, Carex, Allium, Polygonum, Oxytropis and Saussurea are remained. Hetao plain is located in the southern border city, the vegetation type there is the steppe desert, and there are about 200 species of wild plants, mainly are farmland weed, and aquatic, salt and sand plants, most of wild xylophyta are distributed in shoaly land along the Yellow River, depression before the hill and depression of ancient river, where there mainly are Populus euphratica, Elaeagnus angustifolia L., Elm, Chinese tamarisk, a variety of shrub willow, Myricaria germanica, Nitraria tangutorum, Caragana intermedia, Kalidium foliatum, etc.. In the plain farmland, there are Alopecuroides L, Taraxacum, Chenopodium album L., Xanthium Fructus, Lactuca chinensis and Eragrostis poaeoides; in the waters, there are Reed, Typha, Bolboschoenus maritimus, Duckweed, etc.; in the alkaline land, there are a variety of grasses as Salsola ruthenica and so on. There are more than 150 species of resources plants, of which, more than 130 species can be feed and more than 100 species can be used medicinally. The common species include Taraxacum, Patrinia villosa, Plantain Seed, Semen Cuscutae, Cirsium setosum, Kochia scoparia, Xanthium Fructus, Capillary artemisia, Alopecuroides L, etc. 4) Wild animals The climate of Bayannaoer is dry and cold, and the vegetation there is dominated by low vegetation and shrubs, and there is with high proportion of sandy and gavel surface, so the natural condions there is harsh, and there belongs to the Palaearctic in Asia and Asia’s new Mongolian border area based on geographical divisions on the animal. Due to the limit of natural condition, the wild animal species there are lacking. According to incomplete statistics, there are 7 orders, 15 families and 49 species of animals within the city, which is 43% of the total number of animals in Inner Mongolia Autonomous Region; there are 17 orders, 44 families and 199 species of birds, which is 55% the total number of birds in the Autonomous Region; There are 13 species of reptiles; 4 species of batrachia; and many other insects. Due to the effect of the long-term human activities, wild animals in Hetao plain had disappeared, only over ten kinds of rodents existed in this plain, such as hamster, jerboa, gerbil, field mouse, etc., as well as rabbit, pika and so on. Many kinds of lizards can be found everywhere on isolated sand, as well as snakes and hedgehogs, and dozens of species of birds, such as swallows, warblers, sparrows, crows, upupa epops, long tailed shrikes, pigeons, woodpeckers, cuckoo, quail, bustard, eagle, etc. There are also muskrat living in every waterspace. Wuliangsuhai lake, at the eastern end of Hetao plain, is an important place in western Inner Mongolia for migratory birds to stop for a rest, for waterfow to moult and to reproduce. According to incomplete statistics, there are more than 150 species of birds in this area, which include Whooper Swan, Mute Swan and other birds under State protection( category II), and 97 species under “Sino-Japanese agreement on protection of migratory birds and thier habitats”. The most birds in this area are migratory birds or passing migrant birds with going in winter and coming in summer everyyear, and due to the protection of bird resources, Municipal Government issued a Notice in 1984 to protect bird resources of Wuliangsuhai lake, and this area was designated as a suspended hunting area. 5) Soil erosion The soil ersion areas of Bayannaoer are distributed within Wulateqianqi County, Wulatezhongqi County, Wulatehouqi County and Dengkou County, which belongs to Yellow River basin and inland river basin. There are 35 townships and Sumu in this area, the total population there is 192 610, and the population density is 9/ km2. The natural features of soil ersion area are divided into rocky mountain area and windy and sandy area. The rocky mountain area is used to call arid mountain area, and its total area is 18687 km2, all of which are soil ersion area, this area is located between 106°08’—109°45’E. Longitude and 40°26’—42°20’N. Latitude. The windy and sandy area mainly refers to Ulan Buh Desert within Dengkou County, and its total area is 2747.2 km2, which is located between 106°11’—107°06’E. Longitude and 40°46’—40°08’N. Latitude. The soil ersion mainly are wind erowion, which is more in winter, and water erosion, which is more in June and July. The annual erosion modulus is 2527-6075t/ km2.
4.2.6.2 Existing condition analysis of biological diversity in Lake Wuliangsuhai 1) Zooplankton (1) Role of zooplankton
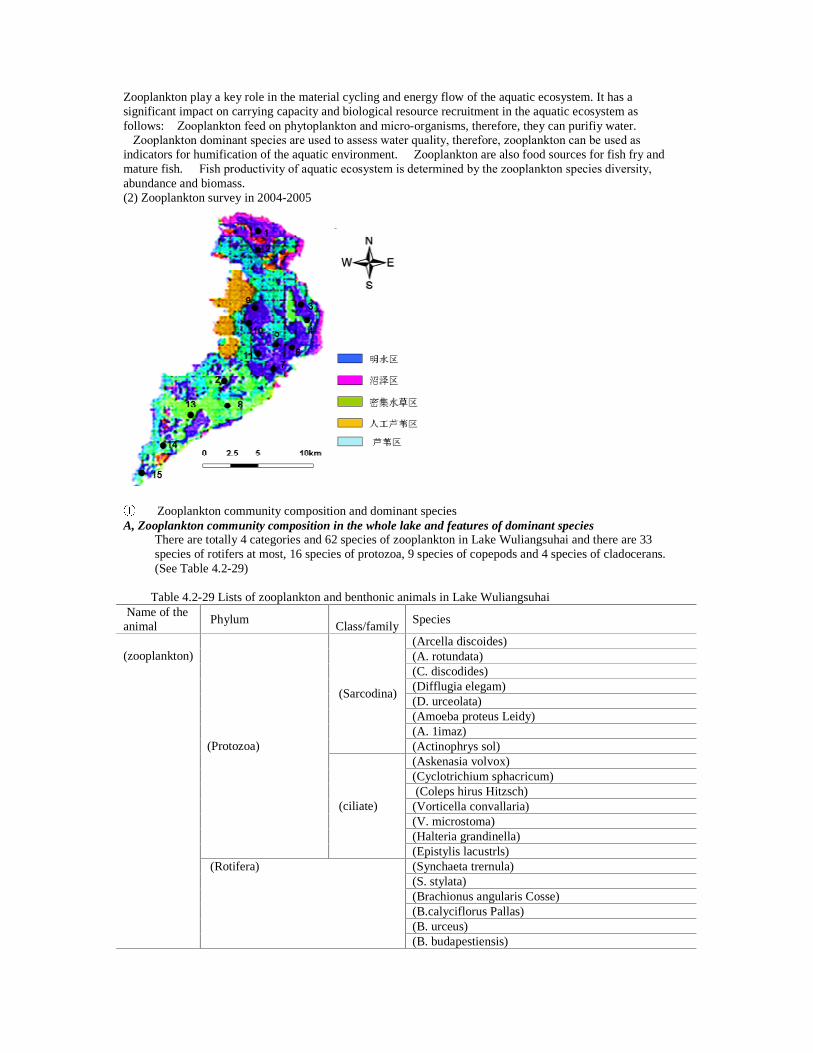
Zooplankton play a key role in the material cycling and energy flow of the aquatic ecosystem. It has a significant impact on carrying capacity and biological resource recruitment in the aquatic ecosystem as follows: �Zooplankton feed on phytoplankton and micro-organisms, therefore, they can purifiy water. �Zooplankton dominant species are used to assess water quality, therefore, zooplankton can be used as indicators for humification of the aquatic environment. � Zooplankton are also food sources for fish fry and mature fish. � Fish productivity of aquatic ecosystem is determined by the zooplankton species diversity, abundance and biomass. (2) Zooplankton survey in 2004-2005
Zooplankton community composition and dominant species A, Zooplankton community composition in the whole lake and features of dominant species
There are totally 4 categories and 62 species of zooplankton in Lake Wuliangsuhai and there are 33 species of rotifers at most, 16 species of protozoa, 9 species of copepods and 4 species of cladocerans. (See Table 4.2-29)
Table 4.2-29 Lists of zooplankton and benthonic animals in Lake Wuliangsuhai
Name of the animal
Phylum Class/family
Species
(Arcella discoides) (A. rotundata) (C. discodides) (Difflugia elegam) (D. urceolata) (Amoeba proteus Leidy) (A. 1imaz)
(Sarcodina)
(Actinophrys sol) (Askenasia volvox) (Cyclotrichium sphacricum) (Coleps hirus Hitzsch) (Vorticella convallaria) (V. microstoma) (Halteria grandinella)
(Protozoa)
(ciliate)
(Epistylis lacustrls) (Synchaeta trernula) (S. stylata) (Brachionus angularis Cosse) (B.calyciflorus Pallas) (B. urceus)
(zooplankton)
(Rotifera)
(B. budapestiensis)
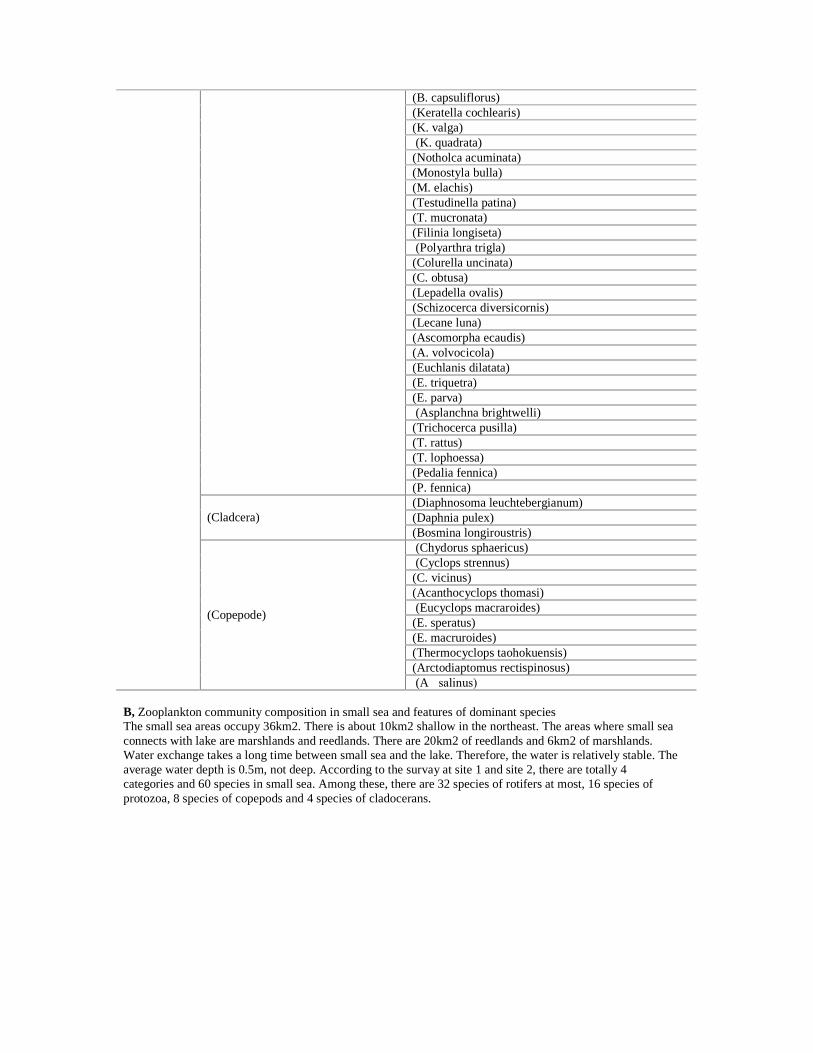
(B. capsuliflorus) (Keratella cochlearis) (K. valga) (K. quadrata) (Notholca acuminata) (Monostyla bulla) (M. elachis) (Testudinella patina) (T. mucronata) (Filinia longiseta) (Polyarthra trigla) (Colurella uncinata) (C. obtusa) (Lepadella ovalis) (Schizocerca diversicornis) (Lecane luna) (Ascomorpha ecaudis) (A. volvocicola) (Euchlanis dilatata) (E. triquetra) (E. parva) (Asplanchna brightwelli) (Trichocerca pusilla) (T. rattus) (T. lophoessa) (Pedalia fennica)
(P. fennica) (Diaphnosoma leuchtebergianum) (Daphnia pulex) (Cladcera) (Bosmina longiroustris) (Chydorus sphaericus) (Cyclops strennus) (C. vicinus) (Acanthocyclops thomasi) (Eucyclops macraroides) (E. speratus) (E. macruroides) (Thermocyclops taohokuensis) (Arctodiaptomus rectispinosus)
(Copepode)
(A�salinus)
B, Zooplankton community composition in small sea and features of dominant species The small sea areas occupy 36km2. There is about 10km2 shallow in the northeast. The areas where small sea connects with lake are marshlands and reedlands. There are 20km2 of reedlands and 6km2 of marshlands. Water exchange takes a long time between small sea and the lake. Therefore, the water is relatively stable. The average water depth is 0.5m, not deep. According to the survay at site 1 and site 2, there are totally 4 categories and 60 species in small sea. Among these, there are 32 species of rotifers at most, 16 species of protozoa, 8 species of copepods and 4 species of cladocerans.
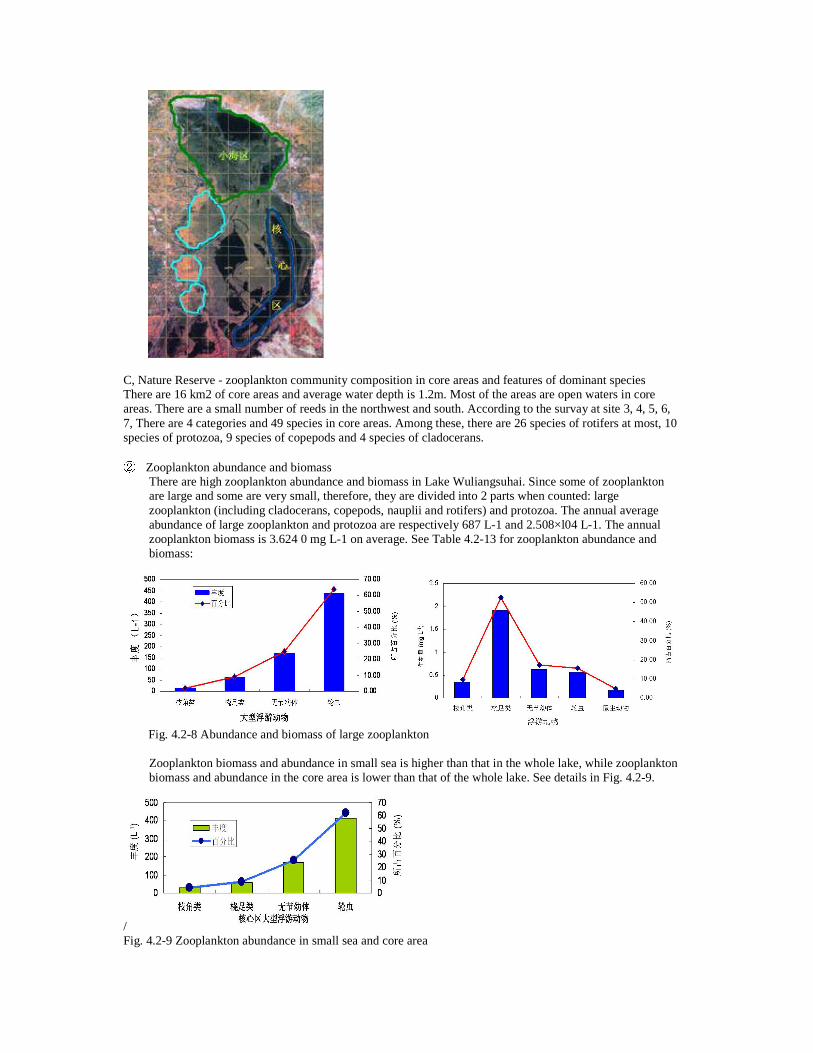
C, Nature Reserve - zooplankton community composition in core areas and features of dominant species There are 16 km2 of core areas and average water depth is 1.2m. Most of the areas are open waters in core areas. There are a small number of reeds in the northwest and south. According to the survay at site 3, 4, 5, 6, 7, There are 4 categories and 49 species in core areas. Among these, there are 26 species of rotifers at most, 10 species of protozoa, 9 species of copepods and 4 species of cladocerans.
Zooplankton abundance and biomass There are high zooplankton abundance and biomass in Lake Wuliangsuhai. Since some of zooplankton are large and some are very small, therefore, they are divided into 2 parts when counted: large zooplankton (including cladocerans, copepods, nauplii and rotifers) and protozoa. The annual average abundance of large zooplankton and protozoa are respectively 687 L-1 and 2.508×l04 L-1. The annual zooplankton biomass is 3.624 0 mg L-1 on average. See Table 4.2-13 for zooplankton abundance and biomass:
Fig. 4.2-8 Abundance and biomass of large zooplankton
Zooplankton biomass and abundance in small sea is higher than that in the whole lake, while zooplankton biomass and abundance in the core area is lower than that of the whole lake. See details in Fig. 4.2-9.
/ Fig. 4.2-9 Zooplankton abundance in small sea and core area
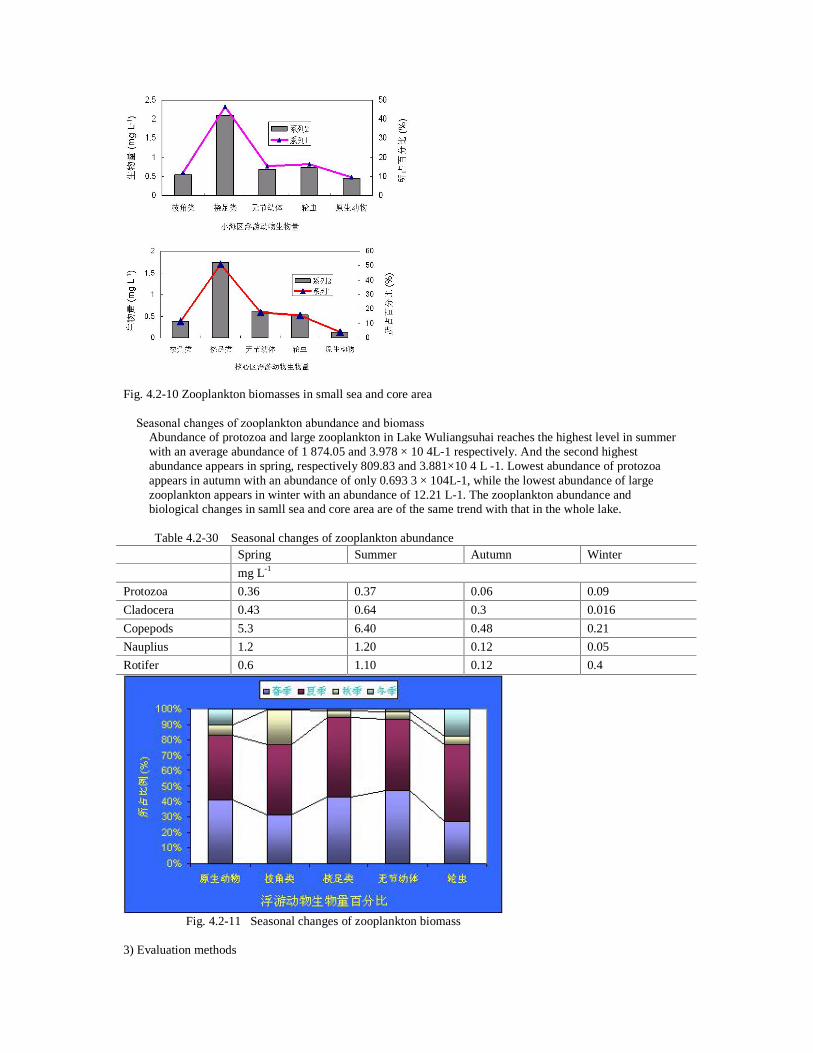
Fig. 4.2-10 Zooplankton biomasses in small sea and core area � Seasonal changes of zooplankton abundance and biomass
Abundance of protozoa and large zooplankton in Lake Wuliangsuhai reaches the highest level in summer with an average abundance of 1 874.05 and 3.978 × 10 4L-1 respectively. And the second highest abundance appears in spring, respectively 809.83 and 3.881×10 4 L -1. Lowest abundance of protozoa appears in autumn with an abundance of only 0.693 3 × 10⁴L-1, while the lowest abundance of large zooplankton appears in winter with an abundance of 12.21 L-1. The zooplankton abundance and biological changes in samll sea and core area are of the same trend with that in the whole lake.
Table 4.2-30 Seasonal changes of zooplankton abundance
Spring Summer Autumn Winter
mg L-1
Protozoa 0.36 0.37 0.06 0.09
Cladocera 0.43 0.64 0.3 0.016
Copepods 5.3 6.40 0.48 0.21
Nauplius 1.2 1.20 0.12 0.05
Rotifer 0.6 1.10 0.12 0.4
Fig. 4.2-11 Seasonal changes of zooplankton biomass
3) Evaluation methods
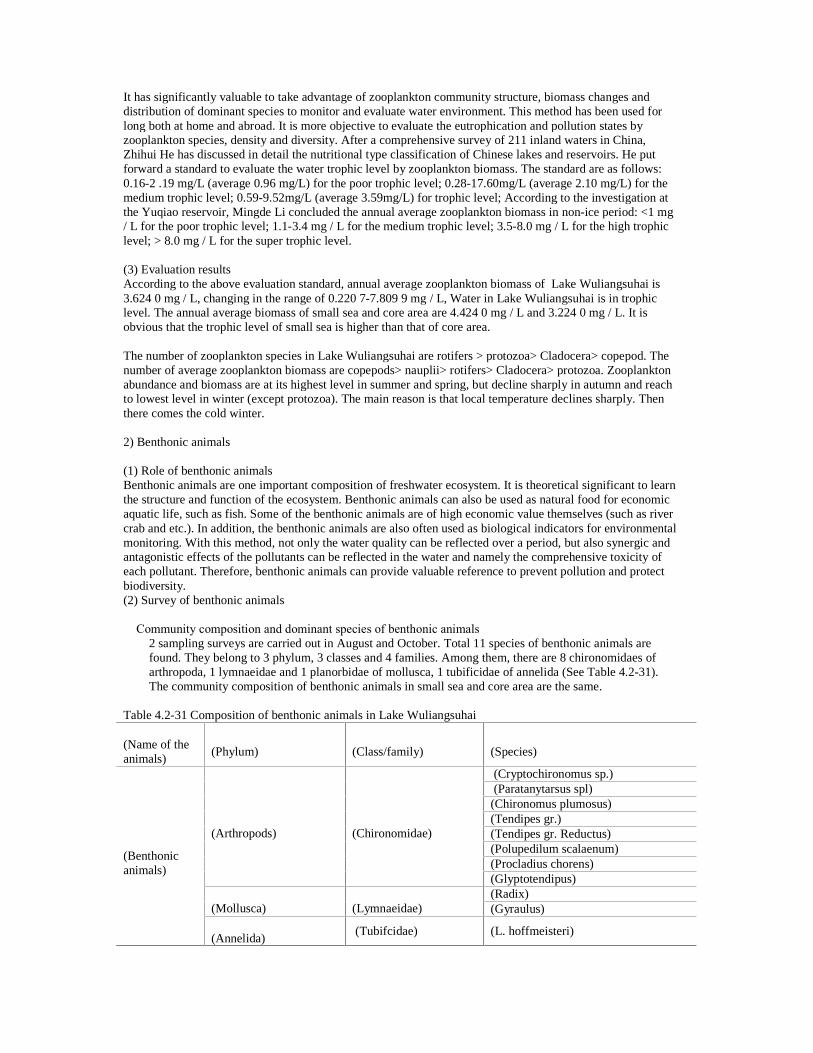
It has significantly valuable to take advantage of zooplankton community structure, biomass changes and distribution of dominant species to monitor and evaluate water environment. This method has been used for long both at home and abroad. It is more objective to evaluate the eutrophication and pollution states by zooplankton species, density and diversity. After a comprehensive survey of 211 inland waters in China, Zhihui He has discussed in detail the nutritional type classification of Chinese lakes and reservoirs. He put forward a standard to evaluate the water trophic level by zooplankton biomass. The standard are as follows: 0.16-2 .19 mg/L (average 0.96 mg/L) for the poor trophic level; 0.28-17.60mg/L (average 2.10 mg/L) for the medium trophic level; 0.59-9.52mg/L (average 3.59mg/L) for trophic level; According to the investigation at the Yuqiao reservoir, Mingde Li concluded the annual average zooplankton biomass in non-ice period: <1 mg / L for the poor trophic level; 1.1-3.4 mg / L for the medium trophic level; 3.5-8.0 mg / L for the high trophic level; > 8.0 mg / L for the super trophic level. (3) Evaluation results According to the above evaluation standard, annual average zooplankton biomass of Lake Wuliangsuhai is 3.624 0 mg / L, changing in the range of 0.220 7-7.809 9 mg / L, Water in Lake Wuliangsuhai is in trophic level. The annual average biomass of small sea and core area are 4.424 0 mg / L and 3.224 0 mg / L. It is obvious that the trophic level of small sea is higher than that of core area. The number of zooplankton species in Lake Wuliangsuhai are rotifers > protozoa> Cladocera> copepod. The number of average zooplankton biomass are copepods> nauplii> rotifers> Cladocera> protozoa. Zooplankton abundance and biomass are at its highest level in summer and spring, but decline sharply in autumn and reach to lowest level in winter (except protozoa). The main reason is that local temperature declines sharply. Then there comes the cold winter. 2) Benthonic animals (1) Role of benthonic animals Benthonic animals are one important composition of freshwater ecosystem. It is theoretical significant to learn the structure and function of the ecosystem. Benthonic animals can also be used as natural food for economic aquatic life, such as fish. Some of the benthonic animals are of high economic value themselves (such as river crab and etc.). In addition, the benthonic animals are also often used as biological indicators for environmental monitoring. With this method, not only the water quality can be reflected over a period, but also synergic and antagonistic effects of the pollutants can be reflected in the water and namely the comprehensive toxicity of each pollutant. Therefore, benthonic animals can provide valuable reference to prevent pollution and protect biodiversity. (2) Survey of benthonic animals � Community composition and dominant species of benthonic animals
2 sampling surveys are carried out in August and October. Total 11 species of benthonic animals are found. They belong to 3 phylum, 3 classes and 4 families. Among them, there are 8 chironomidaes of arthropoda, 1 lymnaeidae and 1 planorbidae of mollusca, 1 tubificidae of annelida (See Table 4.2-31). The community composition of benthonic animals in small sea and core area are the same.
Table 4.2-31 Composition of benthonic animals in Lake Wuliangsuhai (Name of the animals)
(Phylum)
(Class/family)
(Species)
(Cryptochironomus sp.) (Paratanytarsus spl) (Chironomus plumosus) (Tendipes gr.) (Tendipes gr. Reductus) (Polupedilum scalaenum) (Procladius chorens)
(Arthropods)
(Chironomidae)
(Glyptotendipus) (Radix)
(Mollusca) (Lymnaeidae) (Gyraulus)
(Benthonic animals)
(Annelida)
(Tubifcidae) (L. hoffmeisteri)

1 Abundance and biomass of benthonic animals According to the surveys in August and October, 2004, the average abundance of benthonic animals in Lake Wuliangsuhai is 3 031.4 m2, among which the abundance of chironomidae is the highest, occupying 93.58� of the total. The next is the mollusca with 6.07� and there are very few oligochaeta, only 0.35�. The average biomass of benthonic animals is 71.672 g m2. The biomass of chironomidae is at most with 50.30� of the total. The biomass of mollusca takes up 49.64� and there are almost no oligochaeta, only 0.06�of the total.
Fig. 4.2-12 The abundance and biomass of benthonic animals Abundance of benthonic animals in small sea is much higher than that in core area, 1474.2L-1 of chironomidae, 188L-1 of mollusca and of 10.9L-1 oligochaeta more, nearly 10 times.
Fig. 4.2-13 Abundance of benthonic animals Biomasses of benthonic animals in small sea is also much higher than that in core area, 13.6mg L-1 of chironomidae, 112.7mg L-1 of mollusca and 0.128mg L-1 of oligochaeta more, nearly 12 times.
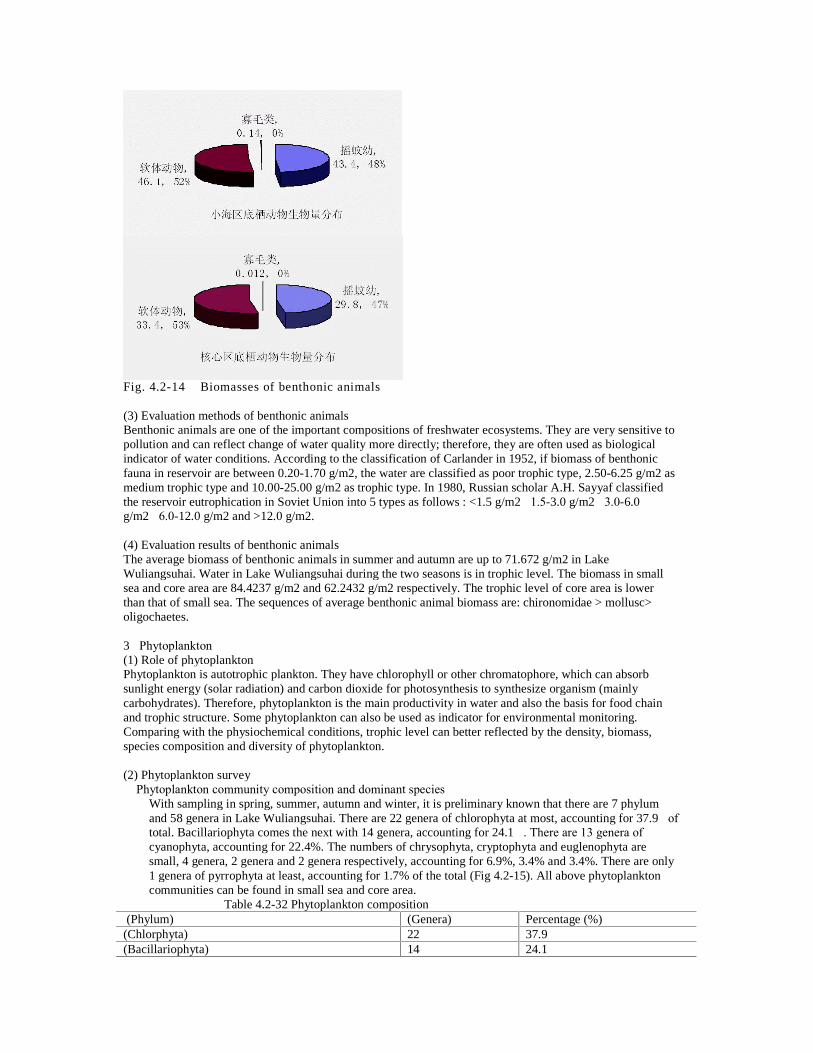
Fig. 4.2-14 Biomasses of benthonic animals (3) Evaluation methods of benthonic animals Benthonic animals are one of the important compositions of freshwater ecosystems. They are very sensitive to pollution and can reflect change of water quality more directly; therefore, they are often used as biological indicator of water conditions. According to the classification of Carlander in 1952, if biomass of benthonic fauna in reservoir are between 0.20-1.70 g/m2, the water are classified as poor trophic type, 2.50-6.25 g/m2 as medium trophic type and 10.00-25.00 g/m2 as trophic type. In 1980, Russian scholar A.H. Sayyaf classified the reservoir eutrophication in Soviet Union into 5 types as follows : <1.5 g/m2�1.5-3.0 g/m2�3.0-6.0 g/m2�6.0-12.0 g/m2 and >12.0 g/m2.
(4) Evaluation results of benthonic animals The average biomass of benthonic animals in summer and autumn are up to 71.672 g/m2 in Lake Wuliangsuhai. Water in Lake Wuliangsuhai during the two seasons is in trophic level. The biomass in small sea and core area are 84.4237 g/m2 and 62.2432 g/m2 respectively. The trophic level of core area is lower than that of small sea. The sequences of average benthonic animal biomass are: chironomidae > mollusc> oligochaetes.
3�Phytoplankton (1) Role of phytoplankton Phytoplankton is autotrophic plankton. They have chlorophyll or other chromatophore, which can absorb sunlight energy (solar radiation) and carbon dioxide for photosynthesis to synthesize organism (mainly carbohydrates). Therefore, phytoplankton is the main productivity in water and also the basis for food chain and trophic structure. Some phytoplankton can also be used as indicator for environmental monitoring. Comparing with the physiochemical conditions, trophic level can better reflected by the density, biomass, species composition and diversity of phytoplankton. (2) Phytoplankton survey � Phytoplankton community composition and dominant species
With sampling in spring, summer, autumn and winter, it is preliminary known that there are 7 phylum and 58 genera in Lake Wuliangsuhai. There are 22 genera of chlorophyta at most, accounting for 37.9�of total. Bacillariophyta comes the next with 14 genera, accounting for 24.1�. There are 13 genera of cyanophyta, accounting for 22.4%. The numbers of chrysophyta, cryptophyta and euglenophyta are small, 4 genera, 2 genera and 2 genera respectively, accounting for 6.9%, 3.4% and 3.4%. There are only 1 genera of pyrrophyta at least, accounting for 1.7% of the total (Fig 4.2-15). All above phytoplankton communities can be found in small sea and core area. Table 4.2-32 Phytoplankton composition
(Phylum) (Genera) Percentage (%) (Chlorphyta) 22 37.9 (Bacillariophyta) 14 24.1
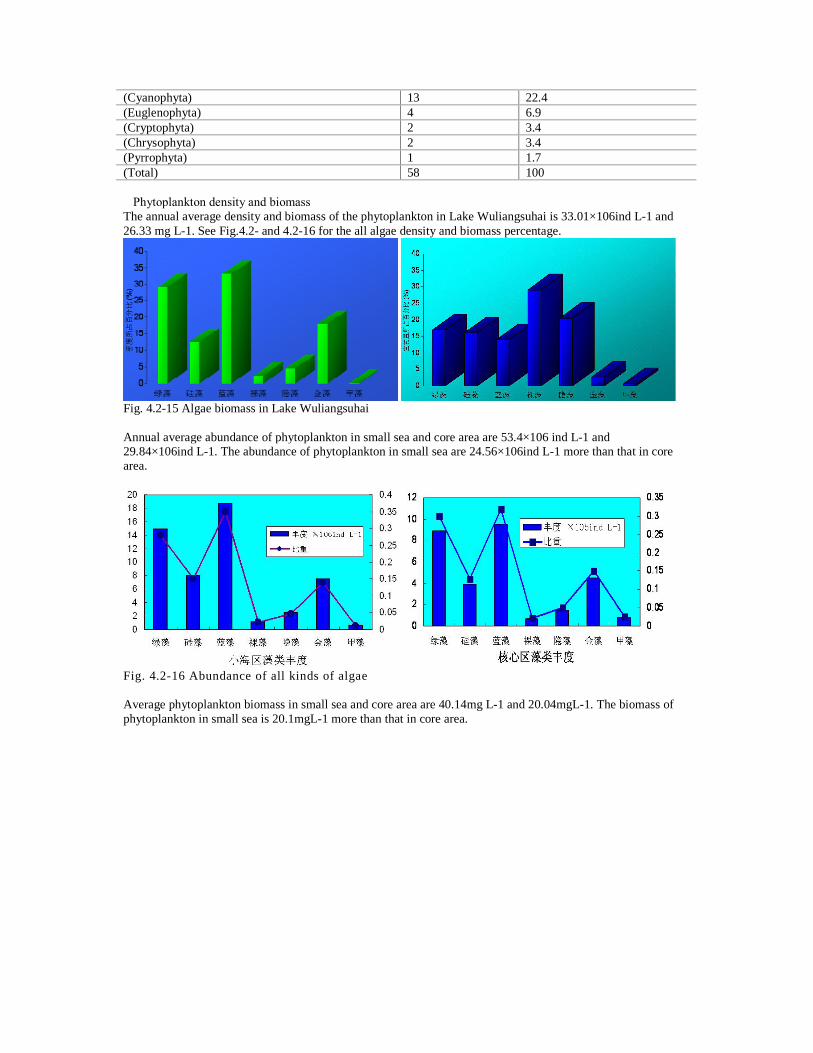
(Cyanophyta) 13 22.4 (Euglenophyta) 4 6.9 (Cryptophyta) 2 3.4 (Chrysophyta) 2 3.4 (Pyrrophyta) 1 1.7 (Total) 58 100 �Phytoplankton density and biomass The annual average density and biomass of the phytoplankton in Lake Wuliangsuhai is 33.01×10⁶ind L-1 and 26.33 mg L-1. See Fig.4.2- and 4.2-16 for the all algae density and biomass percentage.
Fig. 4.2-15 Algae biomass in Lake Wuliangsuhai Annual average abundance of phytoplankton in small sea and core area are 53.4×10⁶ ind L-1 and 29.84×10⁶ind L-1. The abundance of phytoplankton in small sea are 24.56×10⁶ind L-1 more than that in core area.
Fig. 4.2-16 Abundance of all kinds of algae Average phytoplankton biomass in small sea and core area are 40.14mg L-1 and 20.04mgL-1. The biomass of phytoplankton in small sea is 20.1mgL-1 more than that in core area.
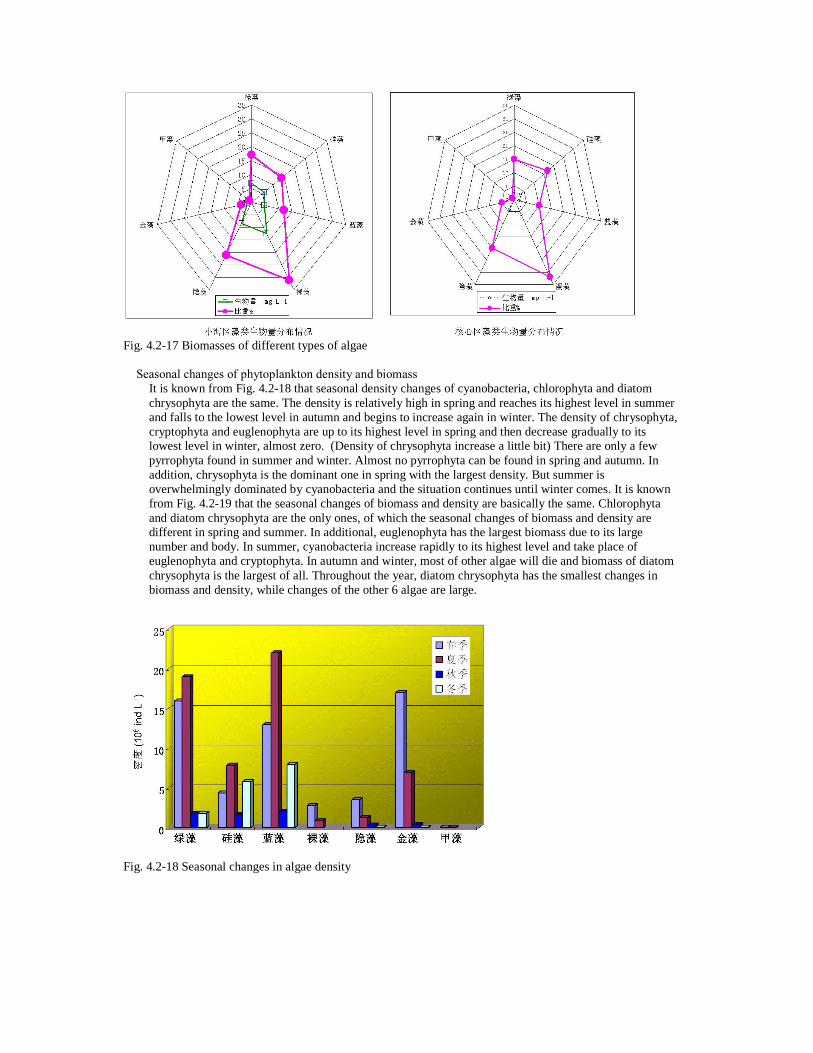
Fig. 4.2-17 Biomasses of different types of algae � Seasonal changes of phytoplankton density and biomass
It is known from Fig. 4.2-18 that seasonal density changes of cyanobacteria, chlorophyta and diatom chrysophyta are the same. The density is relatively high in spring and reaches its highest level in summer and falls to the lowest level in autumn and begins to increase again in winter. The density of chrysophyta, cryptophyta and euglenophyta are up to its highest level in spring and then decrease gradually to its lowest level in winter, almost zero. (Density of chrysophyta increase a little bit) There are only a few pyrrophyta found in summer and winter. Almost no pyrrophyta can be found in spring and autumn. In addition, chrysophyta is the dominant one in spring with the largest density. But summer is overwhelmingly dominated by cyanobacteria and the situation continues until winter comes. It is known from Fig. 4.2-19 that the seasonal changes of biomass and density are basically the same. Chlorophyta and diatom chrysophyta are the only ones, of which the seasonal changes of biomass and density are different in spring and summer. In additional, euglenophyta has the largest biomass due to its large number and body. In summer, cyanobacteria increase rapidly to its highest level and take place of euglenophyta and cryptophyta. In autumn and winter, most of other algae will die and biomass of diatom chrysophyta is the largest of all. Throughout the year, diatom chrysophyta has the smallest changes in biomass and density, while changes of the other 6 algae are large.
Fig. 4.2-18 Seasonal changes in algae density
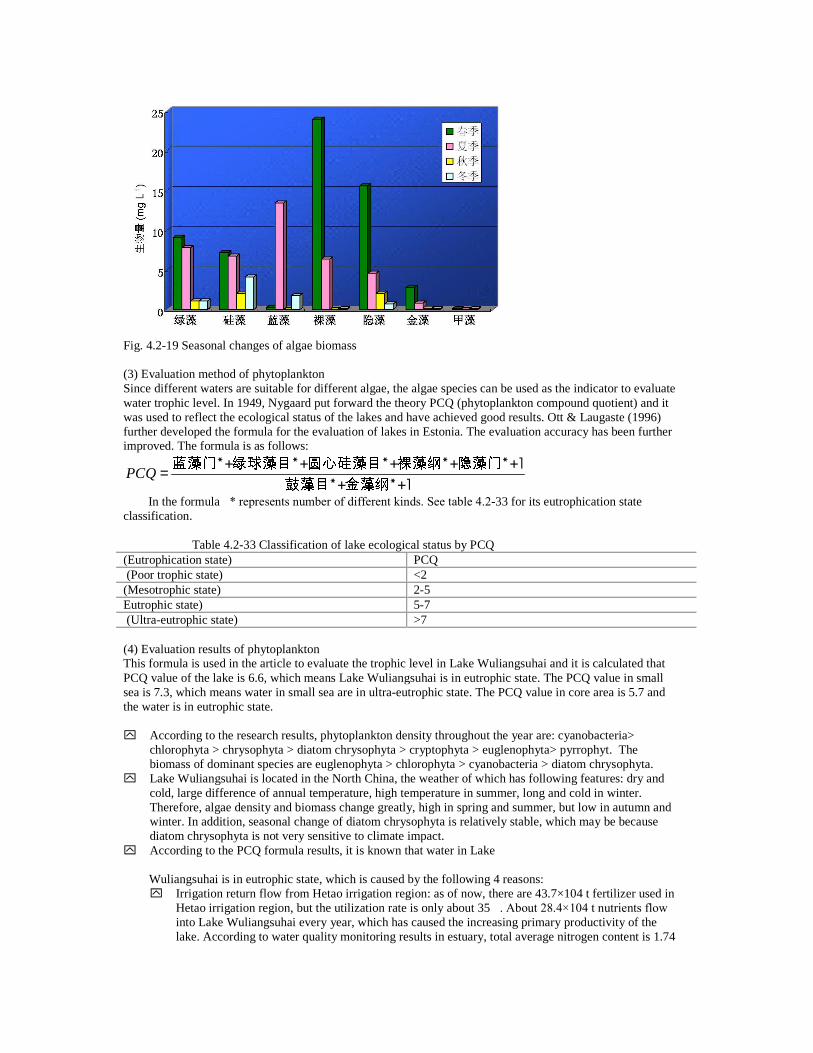
Fig. 4.2-19 Seasonal changes of algae biomass (3) Evaluation method of phytoplankton Since different waters are suitable for different algae, the algae species can be used as the indicator to evaluate water trophic level. In 1949, Nygaard put forward the theory PCQ (phytoplankton compound quotient) and it was used to reflect the ecological status of the lakes and have achieved good results. Ott & Laugaste (1996) further developed the formula for the evaluation of lakes in Estonia. The evaluation accuracy has been further improved. The formula is as follows:
PCQ = *+ *+ *+ *+ *+1*+ *+1
In the formula�* represents number of different kinds. See table 4.2-33 for its eutrophication state classification.
Table 4.2-33 Classification of lake ecological status by PCQ (Eutrophication state) PCQ (Poor trophic state) <2 (Mesotrophic state) 2-5 Eutrophic state) 5-7 (Ultra-eutrophic state) >7 (4) Evaluation results of phytoplankton This formula is used in the article to evaluate the trophic level in Lake Wuliangsuhai and it is calculated that PCQ value of the lake is 6.6, which means Lake Wuliangsuhai is in eutrophic state. The PCQ value in small sea is 7.3, which means water in small sea are in ultra-eutrophic state. The PCQ value in core area is 5.7 and the water is in eutrophic state.
y� According to the research results, phytoplankton density throughout the year are: cyanobacteria>
chlorophyta > chrysophyta > diatom chrysophyta > cryptophyta > euglenophyta> pyrrophyt. The biomass of dominant species are euglenophyta > chlorophyta > cyanobacteria > diatom chrysophyta.
y� Lake Wuliangsuhai is located in the North China, the weather of which has following features: dry and cold, large difference of annual temperature, high temperature in summer, long and cold in winter. Therefore, algae density and biomass change greatly, high in spring and summer, but low in autumn and winter. In addition, seasonal change of diatom chrysophyta is relatively stable, which may be because diatom chrysophyta is not very sensitive to climate impact.
y� According to the PCQ formula results, it is known that water in Lake
Wuliangsuhai is in eutrophic state, which is caused by the following 4 reasons: y� Irrigation return flow from Hetao irrigation region: as of now, there are 43.7×10⁴ t fertilizer used in
Hetao irrigation region, but the utilization rate is only about 35�. About 28.4×10⁴ t nutrients flow into Lake Wuliangsuhai every year, which has caused the increasing primary productivity of the lake. According to water quality monitoring results in estuary, total average nitrogen content is 1.74
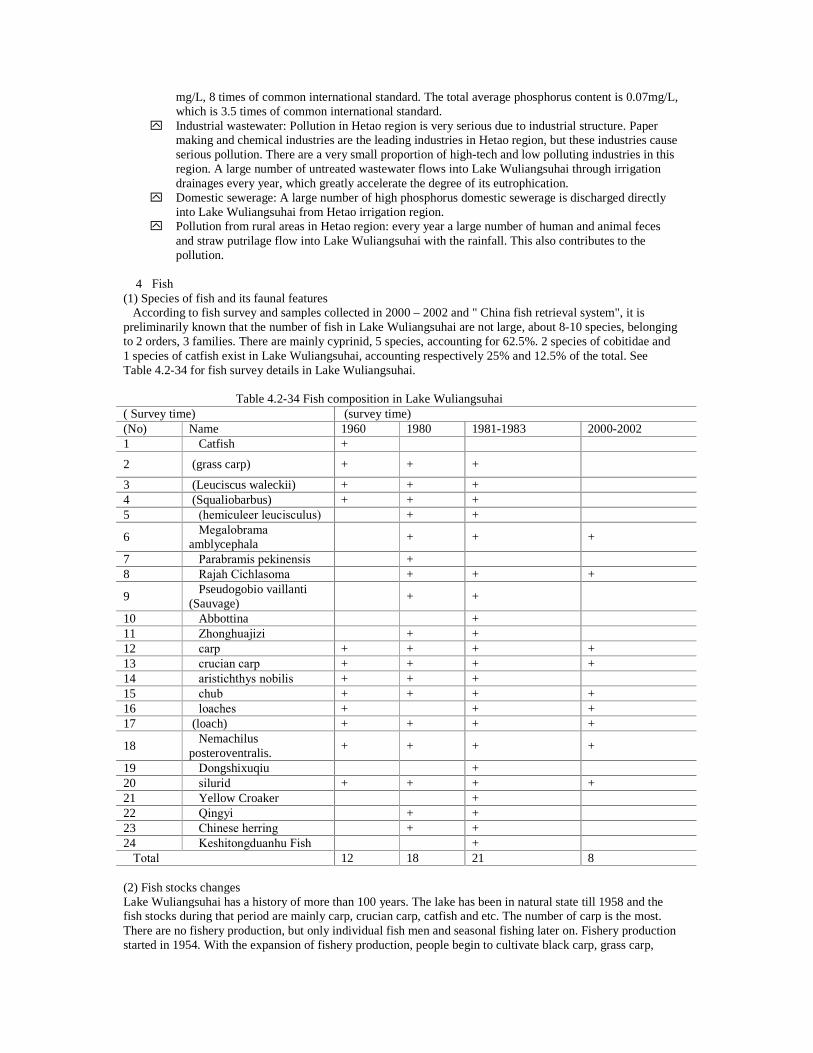
mg/L, 8 times of common international standard. The total average phosphorus content is 0.07mg/L, which is 3.5 times of common international standard.
y� Industrial wastewater: Pollution in Hetao region is very serious due to industrial structure. Paper making and chemical industries are the leading industries in Hetao region, but these industries cause serious pollution. There are a very small proportion of high-tech and low polluting industries in this region. A large number of untreated wastewater flows into Lake Wuliangsuhai through irrigation drainages every year, which greatly accelerate the degree of its eutrophication.
y� Domestic sewerage: A large number of high phosphorus domestic sewerage is discharged directly into Lake Wuliangsuhai from Hetao irrigation region.
y� Pollution from rural areas in Hetao region: every year a large number of human and animal feces and straw putrilage flow into Lake Wuliangsuhai with the rainfall. This also contributes to the pollution.
4�Fish
(1) Species of fish and its faunal features According to fish survey and samples collected in 2000 – 2002 and " China fish retrieval system", it is preliminarily known that the number of fish in Lake Wuliangsuhai are not large, about 8-10 species, belonging to 2 orders, 3 families. There are mainly cyprinid, 5 species, accounting for 62.5%. 2 species of cobitidae and 1 species of catfish exist in Lake Wuliangsuhai, accounting respectively 25% and 12.5% of the total. See Table 4.2-34 for fish survey details in Lake Wuliangsuhai.
Table 4.2-34 Fish composition in Lake Wuliangsuhai
( Survey time) (survey time) (No) Name 1960 1980 1981-1983 2000-2002 1 �Catfish� +
2 (grass carp) + + +
3 (Leuciscus waleckii) + + + 4 (Squaliobarbus) + + + 5 �(hemiculeer leucisculus) + +
6 �Megalobrama amblycephala�
+ + +
7 �Parabramis pekinensis� + 8 �Rajah Cichlasoma� + + +
9 �Pseudogobio vaillanti (Sauvage)�
+ +
10 �Abbottina� + 11 �Zhonghuajizi� + + 12 �carp� + + + + 13 �crucian carp� + + + + 14 �aristichthys nobilis� + + + 15 �chub� + + + + 16 �loaches� + + + 17 (loach) + + + +
18 �Nemachilus posteroventralis.�
+ + + +
19 �Dongshixuqiu� + 20 �silurid� + + + + 21 �Yellow Croaker� + 22 �Qingyi� + + 23 �Chinese herring� + + 24 �Keshitongduanhu Fish� + �Total� 12 18 21 8 (2) Fish stocks changes Lake Wuliangsuhai has a history of more than 100 years. The lake has been in natural state till 1958 and the fish stocks during that period are mainly carp, crucian carp, catfish and etc. The number of carp is the most. There are no fishery production, but only individual fish men and seasonal fishing later on. Fishery production started in 1954. With the expansion of fishery production, people begin to cultivate black carp, grass carp,
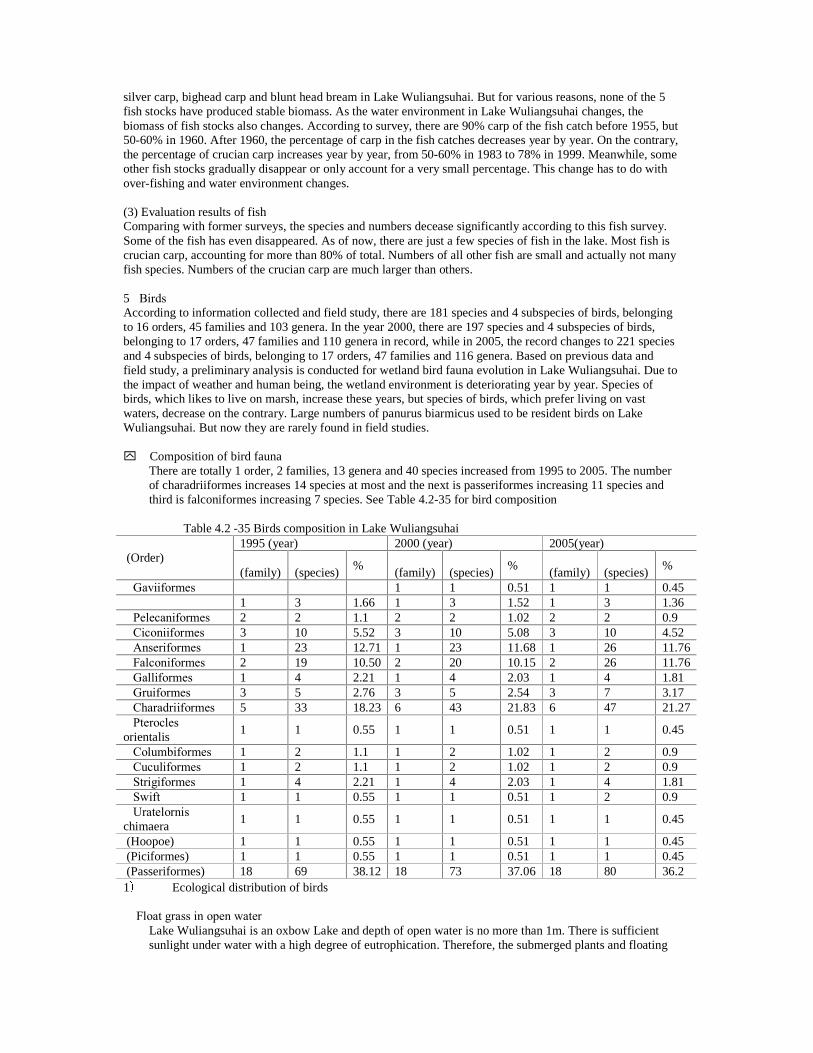
silver carp, bighead carp and blunt head bream in Lake Wuliangsuhai. But for various reasons, none of the 5 fish stocks have produced stable biomass. As the water environment in Lake Wuliangsuhai changes, the biomass of fish stocks also changes. According to survey, there are 90% carp of the fish catch before 1955, but 50-60% in 1960. After 1960, the percentage of carp in the fish catches decreases year by year. On the contrary, the percentage of crucian carp increases year by year, from 50-60% in 1983 to 78% in 1999. Meanwhile, some other fish stocks gradually disappear or only account for a very small percentage. This change has to do with over-fishing and water environment changes. (3) Evaluation results of fish Comparing with former surveys, the species and numbers decease significantly according to this fish survey. Some of the fish has even disappeared. As of now, there are just a few species of fish in the lake. Most fish is crucian carp, accounting for more than 80% of total. Numbers of all other fish are small and actually not many fish species. Numbers of the crucian carp are much larger than others.
5�Birds According to information collected and field study, there are 181 species and 4 subspecies of birds, belonging to 16 orders, 45 families and 103 genera. In the year 2000, there are 197 species and 4 subspecies of birds, belonging to 17 orders, 47 families and 110 genera in record, while in 2005, the record changes to 221 species and 4 subspecies of birds, belonging to 17 orders, 47 families and 116 genera. Based on previous data and field study, a preliminary analysis is conducted for wetland bird fauna evolution in Lake Wuliangsuhai. Due to the impact of weather and human being, the wetland environment is deteriorating year by year. Species of birds, which likes to live on marsh, increase these years, but species of birds, which prefer living on vast waters, decrease on the contrary. Large numbers of panurus biarmicus used to be resident birds on Lake Wuliangsuhai. But now they are rarely found in field studies. y� Composition of bird fauna
There are totally 1 order, 2 families, 13 genera and 40 species increased from 1995 to 2005. The number of charadriiformes increases 14 species at most and the next is passeriformes increasing 11 species and third is falconiformes increasing 7 species. See Table 4.2-35 for bird composition Table 4.2 -35 Birds composition in Lake Wuliangsuhai
1995 (year) 2000 (year) 2005(year) (Order)
(family) (species)
% (family)
(species)
% (family)
(species)
%
�Gaviiformes� 1 1 0.51 1 1 0.45 1 3 1.66 1 3 1.52 1 3 1.36 �Pelecaniformes� 2 2 1.1 2 2 1.02 2 2 0.9 �Ciconiiformes� 3 10 5.52 3 10 5.08 3 10 4.52 �Anseriformes� 1 23 12.71 1 23 11.68 1 26 11.76 �Falconiformes� 2 19 10.50 2 20 10.15 2 26 11.76 �Galliformes� 1 4 2.21 1 4 2.03 1 4 1.81 �Gruiformes� 3 5 2.76 3 5 2.54 3 7 3.17 �Charadriiformes� 5 33 18.23 6 43 21.83 6 47 21.27 �Pterocles orientalis�
1 1 0.55 1 1 0.51 1 1 0.45
�Columbiformes� 1 2 1.1 1 2 1.02 1 2 0.9 �Cuculiformes� 1 2 1.1 1 2 1.02 1 2 0.9 �Strigiformes� 1 4 2.21 1 4 2.03 1 4 1.81 �Swift� 1 1 0.55 1 1 0.51 1 2 0.9 �Uratelornis chimaera�
1 1 0.55 1 1 0.51 1 1 0.45
(Hoopoe) 1 1 0.55 1 1 0.51 1 1 0.45 (Piciformes) 1 1 0.55 1 1 0.51 1 1 0.45 (Passeriformes) 18 69 38.12 18 73 37.06 18 80 36.2 1 Ecological distribution of birds � Float grass in open water
Lake Wuliangsuhai is an oxbow Lake and depth of open water is no more than 1m. There is sufficient sunlight under water with a high degree of eutrophication. Therefore, the submerged plants and floating
plants flourish in the water. All these plants have provided a very good place for the aquatic animals to live and feed. So there are many benthonic animals, phytoplankton, insects and their larvae living in the water. They are good food for many kinds of birds. Many phytophagous birds feed and hover around float grass in open water, such as gulls and herons.
Float grass in open water are also the breeding place for birds, which like to build nest on water, such as chlidoniashybridus and coot.
� Reed and cattail areas There are more reed than cattail in reed and cattail areas. Large areas of reed and cattail distribute in the lake in different shapes. The lake is in eutrophication state and suitable for reed. The height of the plants over water surface is up to 5.5-6.0m. Reed areas are not only good places for birds to build nest, brood and hide when moulting, but also feeding places for many birds, such as panurus biarmicus.
� Shoal areas in the lake Most of the shoal areas are surrounded by reed and cattail. Many grasses grow on the shoal. Birds such as vanellus, wagtail and some ducks nest on the shoal. Some passerine birds also feed here, such as redstart. In addition, shoal areas are also places for anseres, umbrette and laridae to rest and spend the night.
�Shallow and marsh area on the coast
Shallow and marsh areas are mostly around the lake and water depth is no more than 40cm. There are sparse reed or cattail and some other water plants. Many of the aquatic animals live in this area. There are large numbers of various worms and insects and their larvae. This is also a living and feeding place for umbrette. Anseres and coot also come here to feed.
�Surrounding areas around the lake and wetland
Surrounding areas can be divided into following areas: salt marsh areas, nitraria tangutorum desert areas, agricultural areas, residential areas and plantation areas.
Salt marsh area: exposed lake bed after water level decreases. When there is sufficient rainfall, it become shallow and marsh land again. There are saline-alkali tolerant plants living in this area, such as kalidium foliatum and suaeda gtauca. Some birds feed in this area, such as wagtail, water pipit, grey-headed Lapwing and etc. Birds such as vanellus, charadrius alexandrinus and etc often nest and brood here. Nitraria tangutorum desert areas: sandy soil on the surface. There are clusters of drought-resistant plants nitraria tangutorum. Sand soils pile up at the root of nitraria tangutorum year by year. Nitraria tangutorum is an ancient mediterranean plant, resistant to salinity and drought with many hard stabs on the surface. This environment is the feeding and living place for birds like lark, laridae and etc. The hard stab is the nesting and feeding place for small birds like malaconotus alius. It is also a haven for birds like partridges to hide from the prey birds. Farmland areas: wheat, corn, sunflower and others are the main corps in the farmlands around the lake. There are birds like sparrow, jackdaw and etc living in this area in spring, autumn and winter. In spring, summer and autumn, the common birds in the farmland are black-headed gull, mallard, grey goose, quail and so on. Owls and other birds of prey rest and hunt in the open farmland. Residential areas: There are many scattered villages around the Lake Wuliangsuhai with at least several families or dozens of families at most. The common species in residential areas are crested lark, hoopoe, tree sparrow, little owl, eurasian collared dove and etc. Plantation areas: There are often some small pieces of the plantation around the village in the plantation. The trees in the plantation are mainly poplar, willow and sand jujube trees. Weeds grow on the ground of the plantation. The birds here are mainly forest dwellers, such as sparrow hawks, falcon, quail, fieldfare, and brambling and so on.
(3) Analysis of ecological distribution of birds y� Numbers of anseres reduce, while the numbers of sandpiper, falcon and songbirds increase rapidly. The
wetland environment in Lake Wuliangsuhai is of high heterogeneity. Spatial and temporal structures of bird community are of unique features due to the appropriate allocation of many kinds of different
landscapes, such as wetlands, shrub steppe and uplands. the original structure is broken down by the marsh acceleration.
Falconiformes birds and waders, such as charadriformes and gruiformes which like to live on wetland, increase rapidly. The species of anseres breeding here is increasing but the number percentage is decreasing on the contrary. Increase of falconiforme indicates that the wetland, marsh, sparse woodland and cultivated land are increasing in this area, but the large and open lake areas are decreasing. The wetland in Lake Wuliangsuhai is the marsh evolution process. Charadriiformes and gruiformes are waders. They brood and feed in wetland, reed beds, grassland and river shoal. From Table 5.6.5-1, it is concluded that there are 10 species of charadriiformes increased from 1996 to 2000 and 4 species of charadriiformes increased from 2001 to 2005. There are 2 species of gruiformes increased. Over the past 10 years, the species of waders increase rapidly. Not only avoset and tringa totanus live in wetland of Lake Wuliangsuhai, but even Greater Painted-snipe from Japan. This proves that the environmental conditions in the wetland are suitable for waders. Therefore, it can be referred that areas of wetland and marshes are becoming larger and larger and marshland evolution has been intensified in past decade, which is in accordance with the actual situation. According to field study, reed areas are occupying 40% of the areas of Lake Wuliangsuhai and the total reed output in 2000 is 30000-40000 tons more than that in 1996. The wetland dominant species in Spring, summer and autumn are passeriformes. Changes in the species and number have a greater influence on the bird fauna in this area. There are 3 species of anseriformes increased from 2001-2005, but anseriformes species percentage decline due to the increase of wader species. migratory birds like Sarcelle, Common Pochard, shoveller duck and gadwall now also brood here. The increase of anseriformes species indicates the wetland in Lake Wuliangsuhai can provide a good place for migratory anseriformes to nest and feed. But the declining percentage of numbers indicates that its dominant position is becoming weaker and weaker. The water environment, which is suitable for its living, is decreasing. During the study in Lake Wuliangsuhai in April September, 2004, it is seen that there are prosperous reed in the lake. The lake is full of water plants. Many spirals in the sunshine are attaching to the water plants and breathing the oxygen. There are a lot of aquatic insects on the water surface. Tens of thousands of insects are flying above the water. Ducks and snipe are feeding on the water where water plants are prosperous. Reed bed is perfect place for the anseriformes to nest and brood, while the open water environment is good food sources. However, the prosperous water plants are is just the reason why open water areas are decreasing. These water plants cause the marsh evolution and the extinction of the lake. If the situation continues to decline, the marsh evolution in Lake Wuliangsuhai will be more serious. At that time, there will be no prosperity of anseriformes any more. These anseriformes could not live in this area due to the large habitat, but smaller and smaller feeding areas.
y� Significant number change in the birds composition
Comparing with the document record in 1980s, the field study finds below changes: � The number of mute swans has increased; � Number of gray geese and mallards continues to decrease; � Number of water birds breeding in the salt marshes, such as Little tern and snipe increase significantly; � It is hard to find reedling parrotbill living around.
Changes in bird number are mainly due to the great changes in the living environment. There are about 200 couples of mute swans breeding in Lake Wuliangsuhai. The number is much more than before. The reason is that fishermen are aware the necessity to protect the birds. There are fewer fishermen to pick the eggs and hunt for birds; therefore, the hatching and survival rate of mute swans is relatively higher. The document (Lake Wuliangsuhai birds record in Inner Mongolia) say that Yinsun Zhang saw 12000 Grey Geese resting in foot of Ural mountains between Hayehutong and Baiyanhua. however, throughout the field study, only 2 Grey Geese and 8 mallards were seen, which is much less than former record. One of the reasons is that the large number of local residents have poisoned geese and ducks and caused the sharply decrease in number. In addition, with the marsh evolution of lakes and increase of salina, numbers of grass or mud nesting birds increase a lot, such as little tern, common redshank, charadrius alexandrinus and Black-headed Gull.
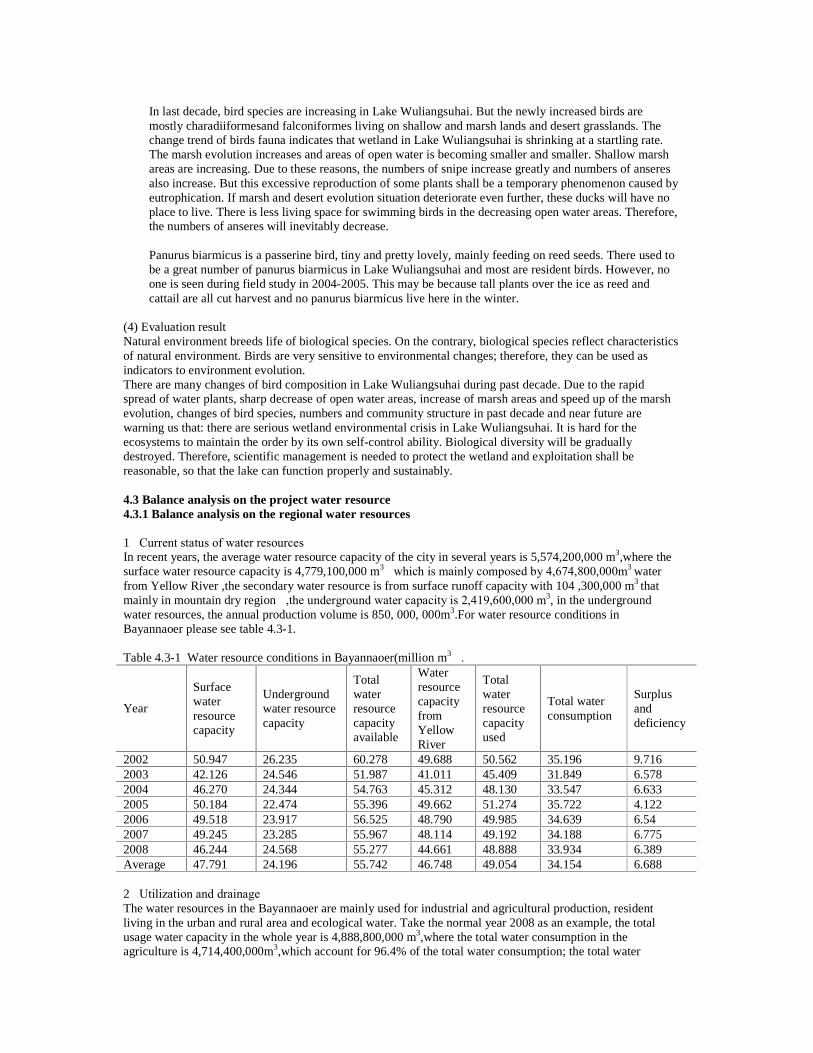
In last decade, bird species are increasing in Lake Wuliangsuhai. But the newly increased birds are mostly charadiiformesand falconiformes living on shallow and marsh lands and desert grasslands. The change trend of birds fauna indicates that wetland in Lake Wuliangsuhai is shrinking at a startling rate. The marsh evolution increases and areas of open water is becoming smaller and smaller. Shallow marsh areas are increasing. Due to these reasons, the numbers of snipe increase greatly and numbers of anseres also increase. But this excessive reproduction of some plants shall be a temporary phenomenon caused by eutrophication. If marsh and desert evolution situation deteriorate even further, these ducks will have no place to live. There is less living space for swimming birds in the decreasing open water areas. Therefore, the numbers of anseres will inevitably decrease. Panurus biarmicus is a passerine bird, tiny and pretty lovely, mainly feeding on reed seeds. There used to be a great number of panurus biarmicus in Lake Wuliangsuhai and most are resident birds. However, no one is seen during field study in 2004-2005. This may be because tall plants over the ice as reed and cattail are all cut harvest and no panurus biarmicus live here in the winter.
(4) Evaluation result Natural environment breeds life of biological species. On the contrary, biological species reflect characteristics of natural environment. Birds are very sensitive to environmental changes; therefore, they can be used as indicators to environment evolution. There are many changes of bird composition in Lake Wuliangsuhai during past decade. Due to the rapid spread of water plants, sharp decrease of open water areas, increase of marsh areas and speed up of the marsh evolution, changes of bird species, numbers and community structure in past decade and near future are warning us that: there are serious wetland environmental crisis in Lake Wuliangsuhai. It is hard for the ecosystems to maintain the order by its own self-control ability. Biological diversity will be gradually destroyed. Therefore, scientific management is needed to protect the wetland and exploitation shall be reasonable, so that the lake can function properly and sustainably. 4.3 Balance analysis on the project water resource 4.3.1 Balance analysis on the regional water resources 1�Current status of water resources In recent years, the average water resource capacity of the city in several years is 5,574,200,000 m3,where the surface water resource capacity is 4,779,100,000 m3�which is mainly composed by 4,674,800,000m3 water from Yellow River ,the secondary water resource is from surface runoff capacity with 104 ,300,000 m3 that mainly in mountain dry region�,the underground water capacity is 2,419,600,000 m3, in the underground water resources, the annual production volume is 850, 000, 000m3.For water resource conditions in Bayannaoer please see table 4.3-1. Table 4.3-1 Water resource conditions in Bayannaoer(million m3�.
Year
Surface water resource capacity
Underground water resource capacity
Total water resource capacity available
Water resource capacity from Yellow River
Total water resource capacity used
Total water consumption
Surplus and deficiency
2002 50.947 26.235 60.278 49.688 50.562 35.196 9.716 2003 42.126 24.546 51.987 41.011 45.409 31.849 6.578 2004 46.270 24.344 54.763 45.312 48.130 33.547 6.633 2005 50.184 22.474 55.396 49.662 51.274 35.722 4.122 2006 49.518 23.917 56.525 48.790 49.985 34.639 6.54 2007 49.245 23.285 55.967 48.114 49.192 34.188 6.775 2008 46.244 24.568 55.277 44.661 48.888 33.934 6.389 Average 47.791 24.196 55.742 46.748 49.054 34.154 6.688 2�Utilization and drainage The water resources in the Bayannaoer are mainly used for industrial and agricultural production, resident living in the urban and rural area and ecological water. Take the normal year 2008 as an example, the total usage water capacity in the whole year is 4,888,800,000 m3,where the total water consumption in the agriculture is 4,714,400,000m3,which account for 96.4% of the total water consumption; the total water
consumption in industry is 95 800 000 m3,which account for 2.0%the total water consumption; the water consumption for living is 78 600 000m3,which account for 1.6% of the total water consumption. The total water consumption volume of the whole city in 2008 is 3,381,200,000 m3,the comprehensive water consumption rate is 69.2%�The water consumption in agriculture, industry and living are respectively: 3,276,900,000 m3, 48, 200, 000 m3 and 56, 100, 000 m3. The total discharge volume of waste water of the whole city in 2008 is 70,090,700 t, the discharge volume of waste water is 22,564,000 t. The discharging volume of main pollutants COD is 58525.39t, which has reduced 3366.43t compared with 2007,where the discharging volume of COD in industry is 48506.85t,the discharging volume of COD in living is 10018.54t;the discharging volume of ammonia nitrogen is 1902.49t,which has reduced 669.51t compared with 2007, where the discharging volume of ammonia nitrogen in industry is 564.87t,the discharging volume of ammonia nitrogen in living is 1337.62t. 3�Water quality of water resource Carry out assessment on the water quality of rivers of the whole city in 2008 according to the GB3838-2002 Surface Water Quality Standards, the water quality of water run into the Ulansuhai from the general drainage ditch can reach Class V, the main items that exceed the standard are permanganate index, COD, ammonia nitrogen, fluoride and mercury, the average annual mineralization degree is 1.700g/l,which has increased 0.08g/l compared with 2007;the water quality in Ulansuhai is Class V and belong to organic contamination, the main items that exceed the standard are COD, permanganate index,BOD5,TP, total nitrogen, ammonia nitrogen etc.. Carry out evaluation according to the class V water quality of surface water, the exceeding standard rate of BOD5 in the whole year is 66.7%,the exceeding standard rate of COD is 50%,the exceeding standard rate of total nitrogen is 33.3%,the exceeding standard rate of total phosphorus is 16.7%. On the aspect of nutrition, the water body of Ulansuhai is heavy eutrophication, where the total nitrogen has reached heavy eutrophication level; the total phosphorus has reached heavy eutrophication level. The average annual mineralization degree of underground water in the Hetao area in 2008 is 3.920 g/l, which has reduced 0.200 g/l compared with 2007.The freshwater area that the mineralization degree of underground water of irrigation area in the drought period of 2008 is less than 3g/l is 5956.6 km2,which account for 56.7% of the total irrigation area�the freshwater area of underground water during the wet season is 5848.8 km2,which account for 55.7% of the total irrigation area, the freshwater area during the drought period is a little larger than those in 2007, the freshwater area during the wet season has a little reduction compared with those in 2007. 4�The existing problems of water resources In recent years, along with the rapid economic development and the rapid increasing of urban population, the resident living water in the urban and rural area over the whole city in 2008 has reached 78, 600, 000m3.Until now, the water quality existing problems in 3 counties of the total 7 counties ,including Wulateqianqi County , Wuyuan county and Wulatehouqi County ,the water for living in the urban and rural area has been significantly affected. Where the water level in the Allah Ben region that is the water source area of Wulateqianqi County, a relatively large groundwater extraction funnel has been formed, the water for industrial production and living of residents in the urban and rural area has existed crisis�good water that meet the drinking water standard for human and animal is lacking in the Wuyuan county, most of the water are brackish water ,the water for living of residents in the urban and rural area has already existed difficulties�for the Dishaiwusu town where the government of Wulatehouqi County is located, the main reason of removing the government of town is due to the extremely lacking of groundwater. So that the shortage of water resources has became the main factor of restricting the city’s economic and social development currently. According to the Yellow River water allocation plan approved by GBF �1987�No.61 issued by state council, the water capacity allocated to the autonomous region in the normal water supply year of Yellow River is 5,860,000,000m3.In October,1999,the president conference office in the autonomous region has initially determined that the water capacity from Yellow River is 4,000,000,000 m3 after the implementation year of water-saving project in the Hetao irrigation area of Bayannaoer according to the water-saving project plan in the Hetao irrigation area. Due to the historical reasons and the actual situation of agriculture water usage in the Hetao irrigation area, the average amount of water from Yellow River in several years is 4,674,800,000m3, based on the water allocation program approved by the country and autonomous region ,now the Hetao irrigation area has introduced 674 800 000 m3 water from Yellow River in each year of which has exceeded the plan. 5�Balance analysis on the water capacity supply and demand
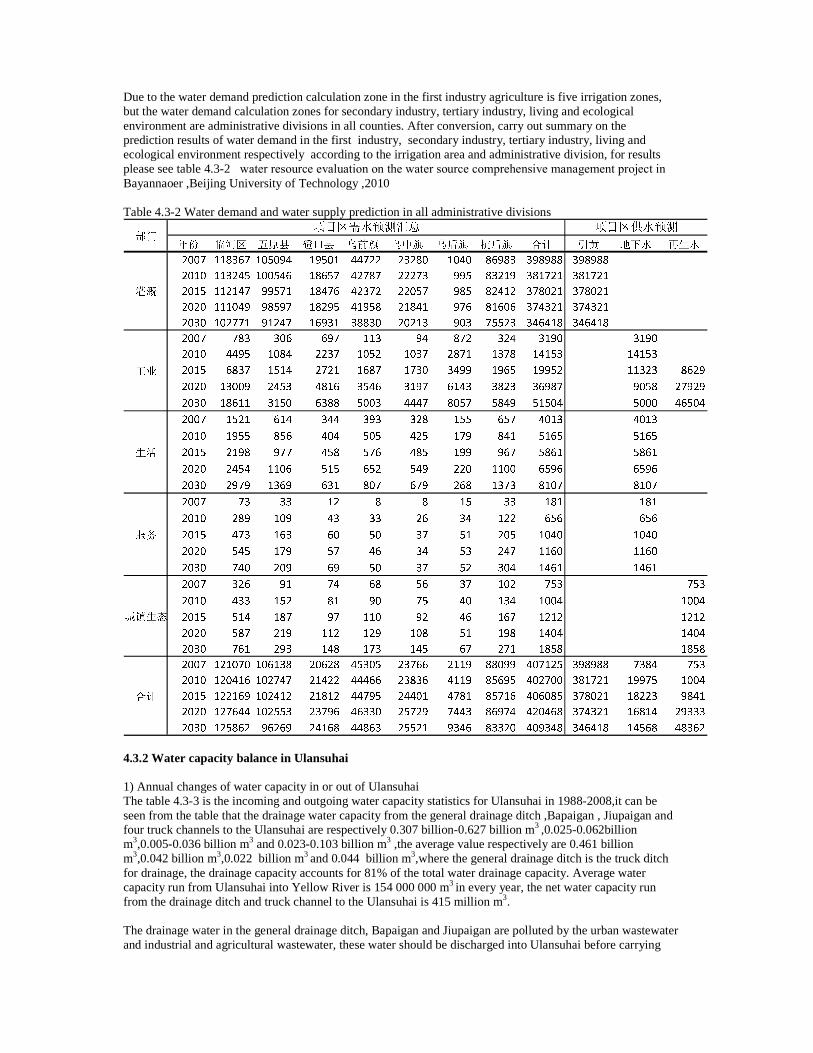
Due to the water demand prediction calculation zone in the first industry agriculture is five irrigation zones, but the water demand calculation zones for secondary industry, tertiary industry, living and ecological environment are administrative divisions in all counties. After conversion, carry out summary on the prediction results of water demand in the first industry, secondary industry, tertiary industry, living and ecological environment respectively according to the irrigation area and administrative division, for results please see table 4.3-2�water resource evaluation on the water source comprehensive management project in Bayannaoer ,Beijing University of Technology ,2010� Table 4.3-2 Water demand and water supply prediction in all administrative divisions
4.3.2 Water capacity balance in Ulansuhai 1) Annual changes of water capacity in or out of Ulansuhai The table 4.3-3 is the incoming and outgoing water capacity statistics for Ulansuhai in 1988-2008,it can be seen from the table that the drainage water capacity from the general drainage ditch ,Bapaigan , Jiupaigan and four truck channels to the Ulansuhai are respectively 0.307 billion-0.627 billion m3 ,0.025-0.062billion m3,0.005-0.036 billion m3 and 0.023-0.103 billion m3 ,the average value respectively are 0.461 billion m3,0.042 billion m3,0.022 billion m3 and 0.044 billion m3,where the general drainage ditch is the truck ditch for drainage, the drainage capacity accounts for 81% of the total water drainage capacity. Average water capacity run from Ulansuhai into Yellow River is 154 000 000 m3 in every year, the net water capacity run from the drainage ditch and truck channel to the Ulansuhai is 415 million m3. The drainage water in the general drainage ditch, Bapaigan and Jiupaigan are polluted by the urban wastewater and industrial and agricultural wastewater, these water should be discharged into Ulansuhai before carrying
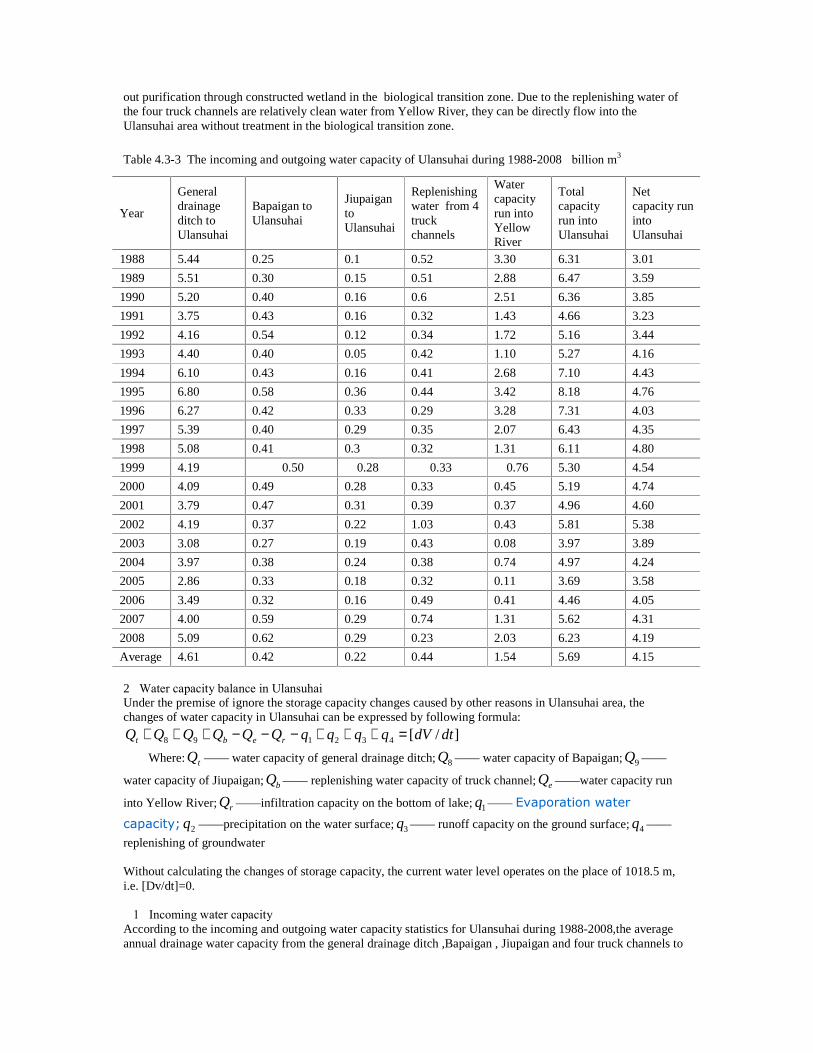
out purification through constructed wetland in the biological transition zone. Due to the replenishing water of the four truck channels are relatively clean water from Yellow River, they can be directly flow into the Ulansuhai area without treatment in the biological transition zone.
Table 4.3-3 The incoming and outgoing water capacity of Ulansuhai during 1988-2008�billion m3�
Year
General drainage ditch to Ulansuhai
Bapaigan to Ulansuhai
Jiupaigan to Ulansuhai
Replenishing water from 4 truck channels
Water capacity run into Yellow River
Total capacity run into Ulansuhai
Net capacity run into Ulansuhai
1988 5.44 0.25 0.1 0.52 3.30 6.31 3.01
1989 5.51 0.30 0.15 0.51 2.88 6.47 3.59
1990 5.20 0.40 0.16 0.6 2.51 6.36 3.85
1991 3.75 0.43 0.16 0.32 1.43 4.66 3.23
1992 4.16 0.54 0.12 0.34 1.72 5.16 3.44
1993 4.40 0.40 0.05 0.42 1.10 5.27 4.16
1994 6.10 0.43 0.16 0.41 2.68 7.10 4.43
1995 6.80 0.58 0.36 0.44 3.42 8.18 4.76
1996 6.27 0.42 0.33 0.29 3.28 7.31 4.03
1997 5.39 0.40 0.29 0.35 2.07 6.43 4.35
1998 5.08 0.41 0.3 0.32 1.31 6.11 4.80
1999 4.19 0.50 0.28 0.33 0.76 5.30 4.54
2000 4.09 0.49 0.28 0.33 0.45 5.19 4.74
2001 3.79 0.47 0.31 0.39 0.37 4.96 4.60
2002 4.19 0.37 0.22 1.03 0.43 5.81 5.38
2003 3.08 0.27 0.19 0.43 0.08 3.97 3.89
2004 3.97 0.38 0.24 0.38 0.74 4.97 4.24
2005 2.86 0.33 0.18 0.32 0.11 3.69 3.58
2006 3.49 0.32 0.16 0.49 0.41 4.46 4.05
2007 4.00 0.59 0.29 0.74 1.31 5.62 4.31
2008 5.09 0.62 0.29 0.23 2.03 6.23 4.19
Average 4.61 0.42 0.22 0.44 1.54 5.69 4.15 2�Water capacity balance in Ulansuhai Under the premise of ignore the storage capacity changes caused by other reasons in Ulansuhai area, the changes of water capacity in Ulansuhai can be expressed by following formula:
]/[432198 dtdVqqqqQQQQQQ rebt =+++−−−+++
Where: tQ —— water capacity of general drainage ditch; 8Q —— water capacity of Bapaigan; 9Q ——
water capacity of Jiupaigan; bQ —— replenishing water capacity of truck channel; eQ ——water capacity run
into Yellow River; rQ ——infiltration capacity on the bottom of lake; 1q —— Evaporation water capacity; 2q ——precipitation on the water surface; 3q —— runoff capacity on the ground surface; 4q ——
replenishing of groundwater Without calculating the changes of storage capacity, the current water level operates on the place of 1018.5 m, i.e. [Dv/dt]=0. �1�Incoming water capacity According to the incoming and outgoing water capacity statistics for Ulansuhai during 1988-2008,the average annual drainage water capacity from the general drainage ditch ,Bapaigan , Jiupaigan and four truck channels to
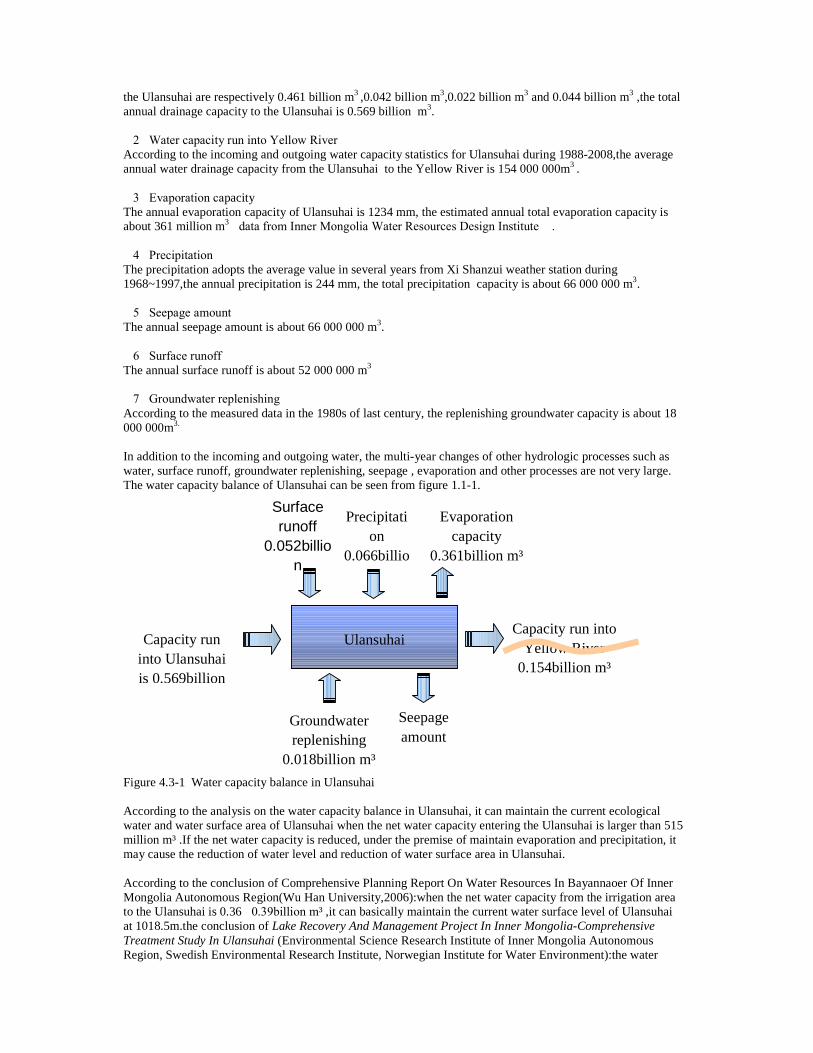
the Ulansuhai are respectively 0.461 billion m3 ,0.042 billion m3,0.022 billion m3 and 0.044 billion m3 ,the total annual drainage capacity to the Ulansuhai is 0.569 billion m3. �2�Water capacity run into Yellow River According to the incoming and outgoing water capacity statistics for Ulansuhai during 1988-2008,the average annual water drainage capacity from the Ulansuhai to the Yellow River is 154 000 000m3 . �3�Evaporation capacity The annual evaporation capacity of Ulansuhai is 1234 mm, the estimated annual total evaporation capacity is about 361 million m3�data from Inner Mongolia Water Resources Design Institute �. �4�Precipitation The precipitation adopts the average value in several years from Xi Shanzui weather station during 1968~1997,the annual precipitation is 244 mm, the total precipitation capacity is about 66 000 000 m3. �5�Seepage amount The annual seepage amount is about 66 000 000 m3. �6�Surface runoff The annual surface runoff is about 52 000 000 m3 �7�Groundwater replenishing According to the measured data in the 1980s of last century, the replenishing groundwater capacity is about 18 000 000m3. In addition to the incoming and outgoing water, the multi-year changes of other hydrologic processes such as water, surface runoff, groundwater replenishing, seepage , evaporation and other processes are not very large. The water capacity balance of Ulansuhai can be seen from figure 1.1-1.
Figure 4.3-1 Water capacity balance in Ulansuhai According to the analysis on the water capacity balance in Ulansuhai, it can maintain the current ecological water and water surface area of Ulansuhai when the net water capacity entering the Ulansuhai is larger than 515 million m³ .If the net water capacity is reduced, under the premise of maintain evaporation and precipitation, it may cause the reduction of water level and reduction of water surface area in Ulansuhai. According to the conclusion of Comprehensive Planning Report On Water Resources In Bayannaoer Of Inner Mongolia Autonomous Region(Wu Han University,2006):when the net water capacity from the irrigation area to the Ulansuhai is 0.36�0.39billion m³ ,it can basically maintain the current water surface level of Ulansuhai at 1018.5m.the conclusion of Lake Recovery And Management Project In Inner Mongolia-Comprehensive Treatment Study In Ulansuhai (Environmental Science Research Institute of Inner Mongolia Autonomous Region, Swedish Environmental Research Institute, Norwegian Institute for Water Environment):the water
Ulansuhai Capacity run
into Ulansuhai is 0.569billion
Precipitation
0.066billio
Evaporation capacity
0.361billion m³
Capacity run into Yellow River
0.154billion m³
Seepage amount
Groundwater replenishing
0.018billion m³
Surface runoff
0.052billion
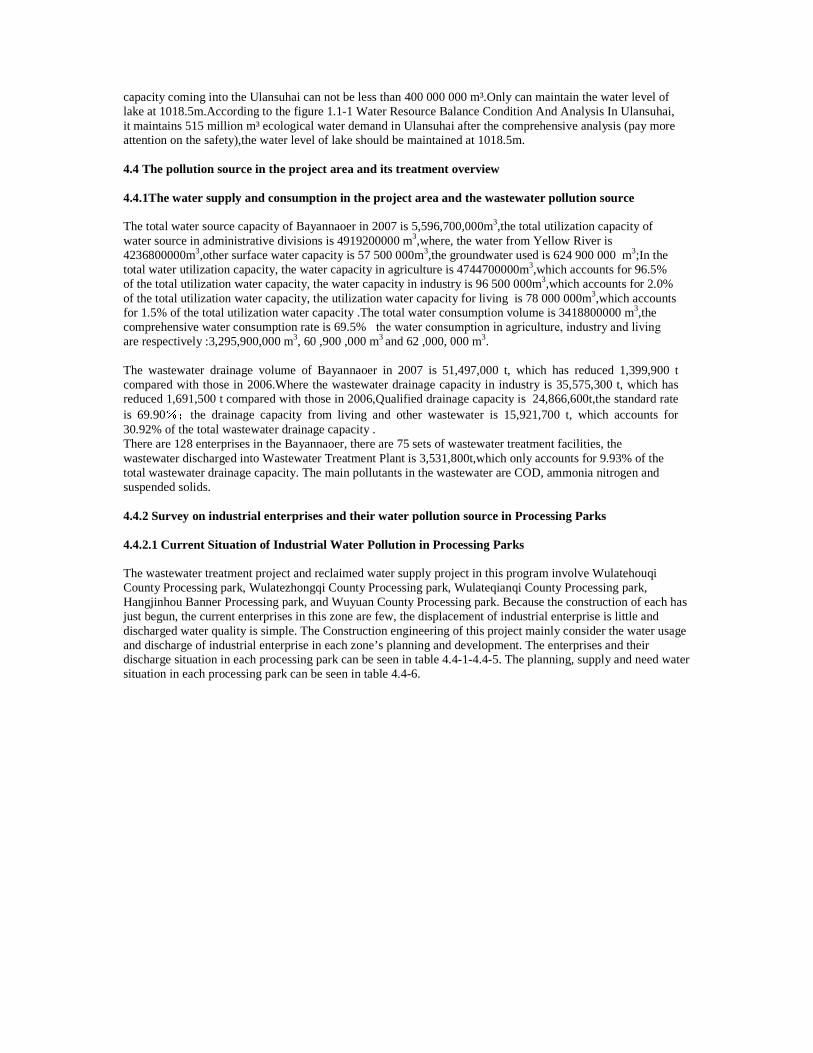
capacity coming into the Ulansuhai can not be less than 400 000 000 m³.Only can maintain the water level of lake at 1018.5m.According to the figure 1.1-1 Water Resource Balance Condition And Analysis In Ulansuhai, it maintains 515 million m³ ecological water demand in Ulansuhai after the comprehensive analysis (pay more attention on the safety),the water level of lake should be maintained at 1018.5m. 4.4 The pollution source in the project area and its treatment overview 4.4.1The water supply and consumption in the project area and the wastewater pollution source The total water source capacity of Bayannaoer in 2007 is 5,596,700,000m3,the total utilization capacity of water source in administrative divisions is 4919200000 m3,where, the water from Yellow River is 4236800000m3,other surface water capacity is 57 500 000m3,the groundwater used is 624 900 000 m3;In the total water utilization capacity, the water capacity in agriculture is 4744700000m3,which accounts for 96.5% of the total utilization water capacity, the water capacity in industry is 96 500 000m3,which accounts for 2.0% of the total utilization water capacity, the utilization water capacity for living is 78 000 000m3,which accounts for 1.5% of the total utilization water capacity .The total water consumption volume is 3418800000 m3,the comprehensive water consumption rate is 69.5%�the water consumption in agriculture, industry and living are respectively :3,295,900,000 m3, 60 ,900 ,000 m3 and 62 ,000, 000 m3. The wastewater drainage volume of Bayannaoer in 2007 is 51,497,000 t, which has reduced 1,399,900 t compared with those in 2006.Where the wastewater drainage capacity in industry is 35,575,300 t, which has reduced 1,691,500 t compared with those in 2006,Qualified drainage capacity is 24,866,600t,the standard rate is 69.90 the drainage capacity from living and other wastewater is 15,921,700 t, which accounts for 30.92% of the total wastewater drainage capacity . There are 128 enterprises in the Bayannaoer, there are 75 sets of wastewater treatment facilities, the wastewater discharged into Wastewater Treatment Plant is 3,531,800t,which only accounts for 9.93% of the total wastewater drainage capacity. The main pollutants in the wastewater are COD, ammonia nitrogen and suspended solids. 4.4.2 Survey on industrial enterprises and their water pollution source in Processing Parks 4.4.2.1 Current Situation of Industrial Water Pollution in Processing Parks The wastewater treatment project and reclaimed water supply project in this program involve Wulatehouqi County Processing park, Wulatezhongqi County Processing park, Wulateqianqi County Processing park, Hangjinhou Banner Processing park, and Wuyuan County Processing park. Because the construction of each has just begun, the current enterprises in this zone are few, the displacement of industrial enterprise is little and discharged water quality is simple. The Construction engineering of this project mainly consider the water usage and discharge of industrial enterprise in each zone’s planning and development. The enterprises and their discharge situation in each processing park can be seen in table 4.4-1-4.4-5. The planning, supply and need water situation in each processing park can be seen in table 4.4-6.
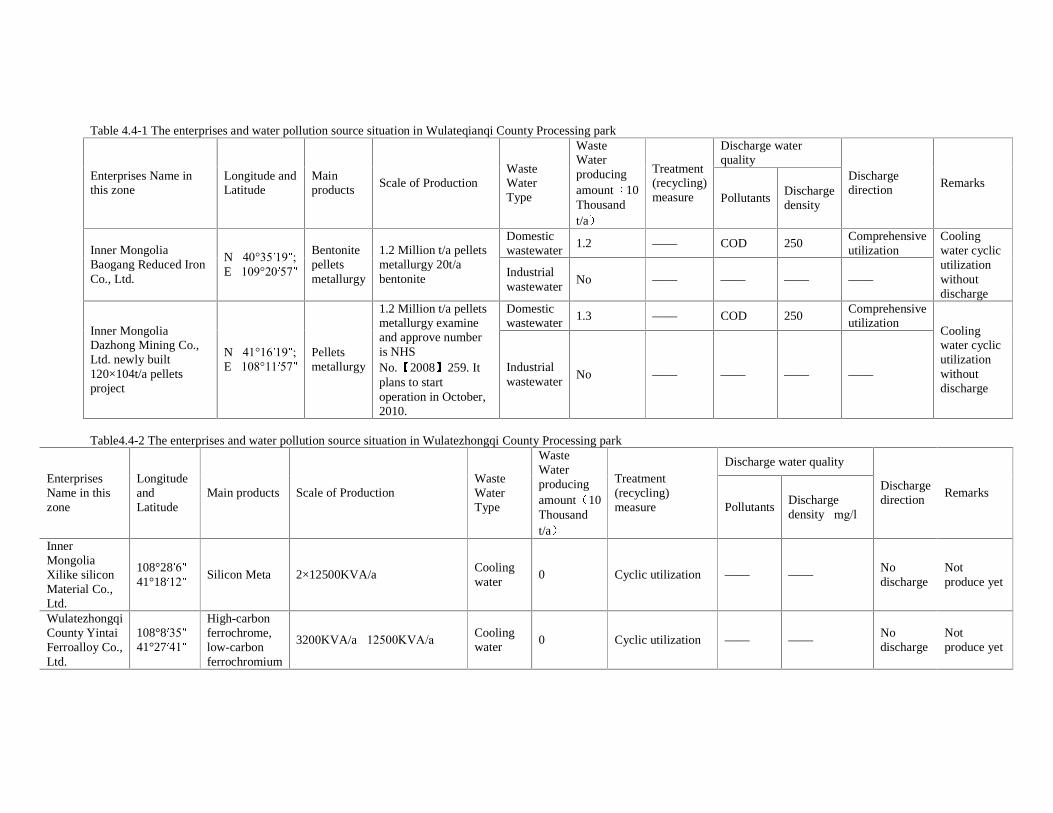
Table 4.4-1 The enterprises and water pollution source situation in Wulateqianqi County Processing park Discharge water quality
Enterprises Name in this zone
Longitude and Latitude
Main products
Scale of Production Waste Water Type
Waste Water producing amount 10 Thousand t/a
Treatment (recycling) measure Pollutants
Discharge density
Discharge direction
Remarks
Domestic wastewater
1.2 —— COD 250 Comprehensive utilization Inner Mongolia
Baogang Reduced Iron Co., Ltd.
N�40°35 19 ; E�109°20 57
Bentonite pellets metallurgy
1.2 Million t/a pellets metallurgy 20t/a bentonite Industrial
wastewater No —— —— —— ——
Cooling water cyclic utilization without discharge
Domestic wastewater
1.3 —— COD 250 Comprehensive utilization
Inner Mongolia Dazhong Mining Co., Ltd. newly built 120×104t/a pellets project
N�41°16 19 ; E�108°11 57
Pellets metallurgy
1.2 Million t/a pellets metallurgy examine and approve number is NHS No. 2008 259. It plans to start operation in October, 2010.
Industrial wastewater
No —— —— —— ——
Cooling water cyclic utilization without discharge
Table4.4-2 The enterprises and water pollution source situation in Wulatezhongqi County Processing park
Discharge water quality Enterprises Name in this zone
Longitude and Latitude
Main products Scale of Production Waste Water Type
Waste Water producing amount 10 Thousand t/a
Treatment (recycling) measure Pollutants
Discharge density�mg/l�
Discharge direction
Remarks
Inner Mongolia Xilike silicon Material Co., Ltd.
108°28 6 41°18 12
Silicon Meta 2×12500KVA/a Cooling water
0 Cyclic utilization —— —— No discharge
Not produce yet
Wulatezhongqi County Yintai Ferroalloy Co., Ltd.
108°8 35 41°27 41
High-carbon ferrochrome, low-carbon ferrochromium
3200KVA/a�12500KVA/a Cooling water
0 Cyclic utilization —— —— No discharge
Not produce yet
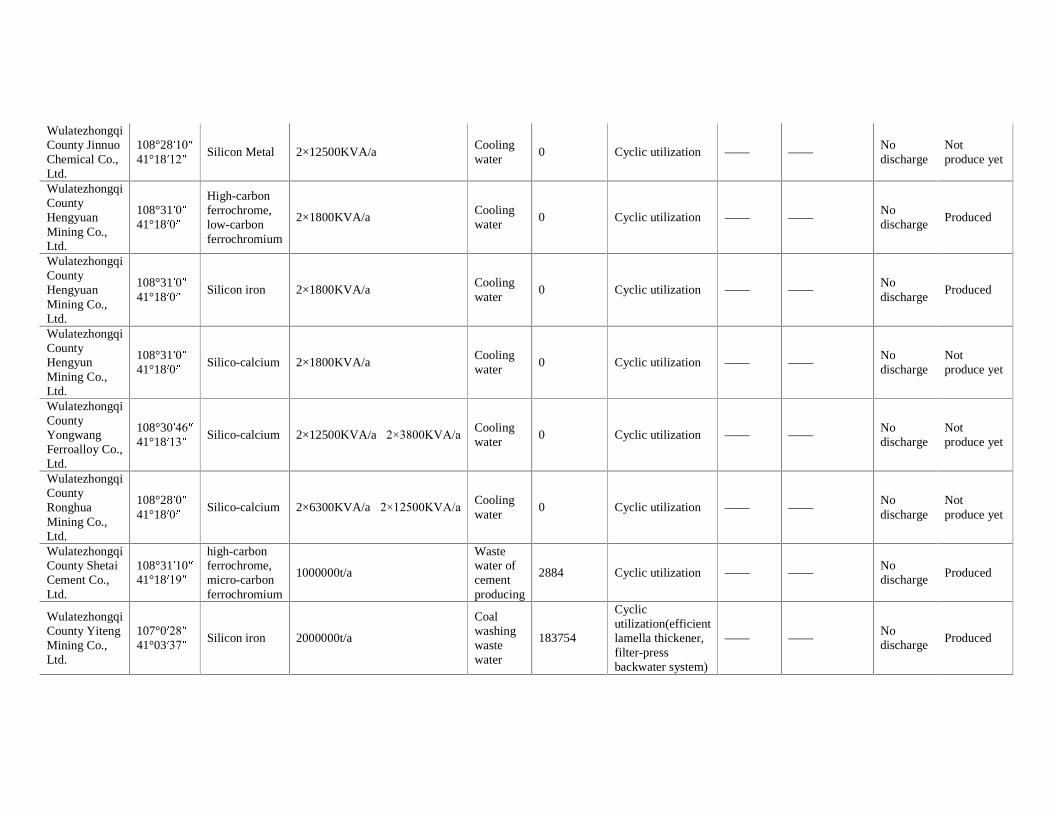
Wulatezhongqi County Jinnuo Chemical Co., Ltd.
108°28 10 41°18 12
Silicon Metal 2×12500KVA/a Cooling water
0 Cyclic utilization —— —— No discharge
Not produce yet
Wulatezhongqi County Hengyuan Mining Co., Ltd.
108°31 0 41°18 0
High-carbon ferrochrome, low-carbon ferrochromium
2×1800KVA/a Cooling water
0 Cyclic utilization —— —— No discharge
Produced
Wulatezhongqi County Hengyuan Mining Co., Ltd.
108°31 0 41°18 0
Silicon iron 2×1800KVA/a Cooling water
0 Cyclic utilization —— —— No discharge
Produced
Wulatezhongqi County Hengyun Mining Co., Ltd.
108°31 0 41°18 0
Silico-calcium 2×1800KVA/a Cooling water
0 Cyclic utilization —— —— No discharge
Not produce yet
Wulatezhongqi County Yongwang Ferroalloy Co., Ltd.
108°30 46 41°18 13
Silico-calcium 2×12500KVA/a�2×3800KVA/a Cooling water
0 Cyclic utilization —— —— No discharge
Not produce yet
Wulatezhongqi County Ronghua Mining Co., Ltd.
108°28 0 41°18 0
Silico-calcium 2×6300KVA/a�2×12500KVA/a Cooling water
0 Cyclic utilization —— —— No discharge
Not produce yet
Wulatezhongqi County Shetai Cement Co., Ltd.
108°31 10 41°18 19
high-carbon ferrochrome, micro-carbon ferrochromium
1000000t/a
Waste water of cement producing
2884 Cyclic utilization —— —— No discharge
Produced
Wulatezhongqi County Yiteng Mining Co., Ltd.
107°0 28 41°03 37
Silicon iron 2000000t/a
Coal washing waste water
183754
Cyclic utilization(efficient lamella thickener, filter-press backwater system)
—— —— No discharge
Produced
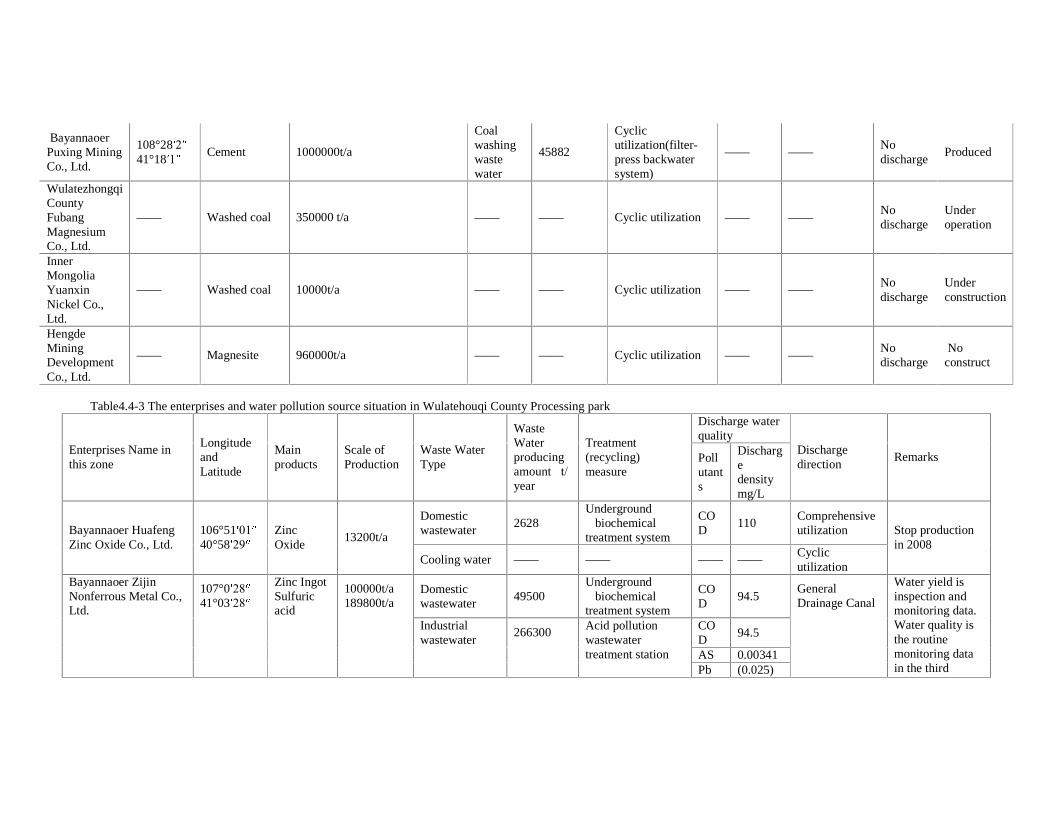
Bayannaoer Puxing Mining Co., Ltd.
108°28 2 41°18 1
Cement 1000000t/a
Coal washing waste water
45882
Cyclic utilization(filter-press backwater system)
—— —— No discharge
Produced
Wulatezhongqi County Fubang Magnesium Co., Ltd.
—— Washed coal 350000 t/a —— —— Cyclic utilization —— —— No discharge
Under operation
Inner Mongolia Yuanxin Nickel Co., Ltd.
—— Washed coal 10000t/a —— —— Cyclic utilization —— —— No discharge
Under construction
Hengde Mining Development Co., Ltd.
—— Magnesite 960000t/a —— —— Cyclic utilization —— —— No discharge
No construct
Table4.4-3 The enterprises and water pollution source situation in Wulatehouqi County Processing park
Discharge water quality
Enterprises Name in this zone
Longitude and Latitude
Main products
Scale of Production
Waste Water Type
Waste Water producing amount�t/year�
Treatment (recycling) measure
Pollutants
Discharge density�mg/L�
Discharge direction
Remarks
Domestic wastewater
2628 Underground �biochemical treatment system
COD
110 Comprehensive utilization Bayannaoer Huafeng
Zinc Oxide Co., Ltd. 106°51 01 40°58 29
Zinc Oxide
13200t/a
Cooling water —— —— —— —— Cyclic utilization
Stop production in 2008
Domestic wastewater
49500 Underground �biochemical treatment system
COD
94.5
COD
94.5
AS 0.00341
Bayannaoer Zijin Nonferrous Metal Co., Ltd.
107°0 28 41°03 28
Zinc Ingot Sulfuric acid
100000t/a� 189800t/a
Industrial wastewater
266300 Acid pollution wastewater treatment station
Pb (0.025)
General Drainage Canal
Water yield is inspection and monitoring data. Water quality is the routine monitoring data in the third season in 2010.
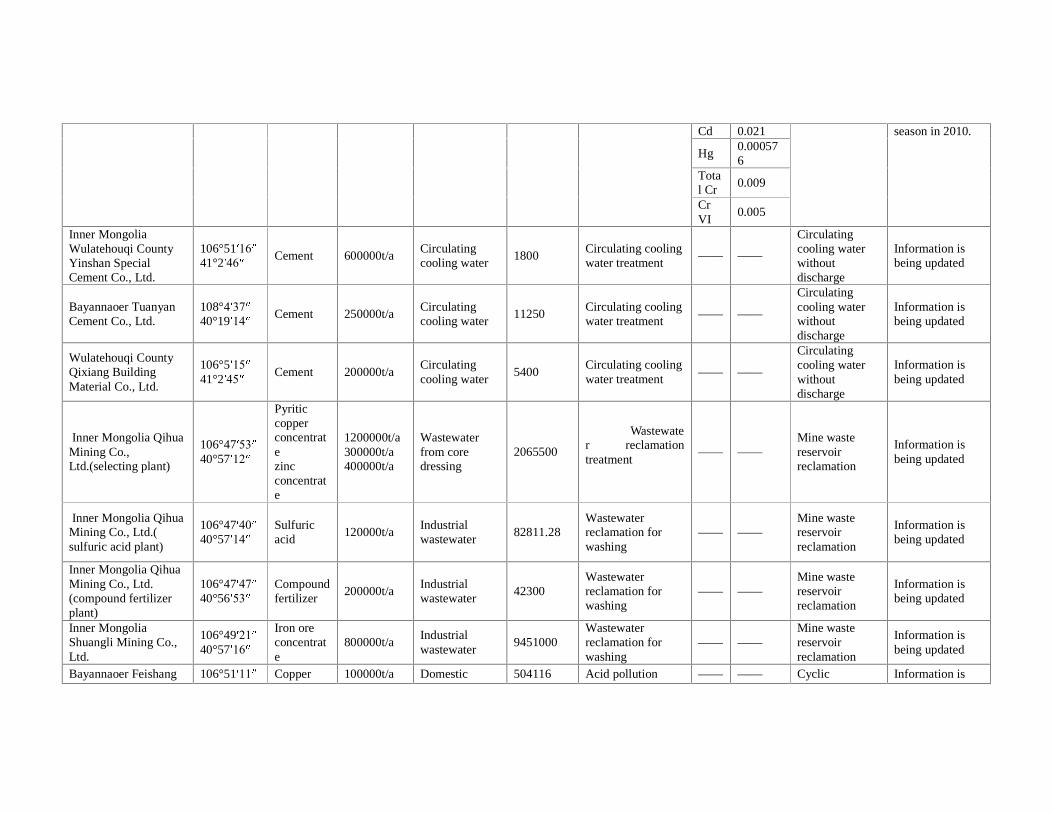
Cd 0.021
Hg 0.000576
Total Cr
0.009
Cr VI
0.005
season in 2010.
Inner Mongolia Wulatehouqi County Yinshan Special Cement Co., Ltd.
106°51 16 41°2 46
Cement 600000t/a Circulating cooling water
1800 Circulating cooling water treatment
—— ——
Circulating cooling water without discharge
Information is being updated
Bayannaoer Tuanyan Cement Co., Ltd.
108°4 37 40°19 14
Cement 250000t/a Circulating cooling water
11250 Circulating cooling water treatment
—— ——
Circulating cooling water without discharge
Information is being updated
Wulatehouqi County Qixiang Building Material Co., Ltd.
106°5 15 41°2 45
Cement 200000t/a Circulating cooling water
5400 Circulating cooling water treatment
—— ——
Circulating cooling water without discharge
Information is being updated
Inner Mongolia Qihua Mining Co., Ltd.(selecting plant)
106°47 53 40°57 12
Pyritic copper concentrate zinc concentrate
1200000t/a 300000t/a 400000t/a
Wastewater from core dressing
2065500
Wastewater reclamation treatment
—— —— Mine waste reservoir reclamation
Information is being updated
Inner Mongolia Qihua Mining Co., Ltd.( sulfuric acid plant)
106°47 40 40°57 14
Sulfuric acid
120000t/a Industrial wastewater
82811.28 Wastewater reclamation for washing
—— —— Mine waste reservoir reclamation
Information is being updated
Inner Mongolia Qihua Mining Co., Ltd. (compound fertilizer plant)
106°47 47 40°56 53
Compound fertilizer
200000t/a Industrial wastewater
42300 Wastewater reclamation for washing
—— —— Mine waste reservoir reclamation
Information is being updated
Inner Mongolia Shuangli Mining Co., Ltd.
106°49 21 40°57 16
Iron ore concentrate
800000t/a Industrial wastewater
9451000 Wastewater reclamation for washing
—— —— Mine waste reservoir reclamation
Information is being updated
Bayannaoer Feishang Copper Co., Ltd.
106°51 11 Copper bars
100000t/a Domestic industrial
504116 Acid pollution wastewater
—— —— Cyclic utilization
Information is being updated
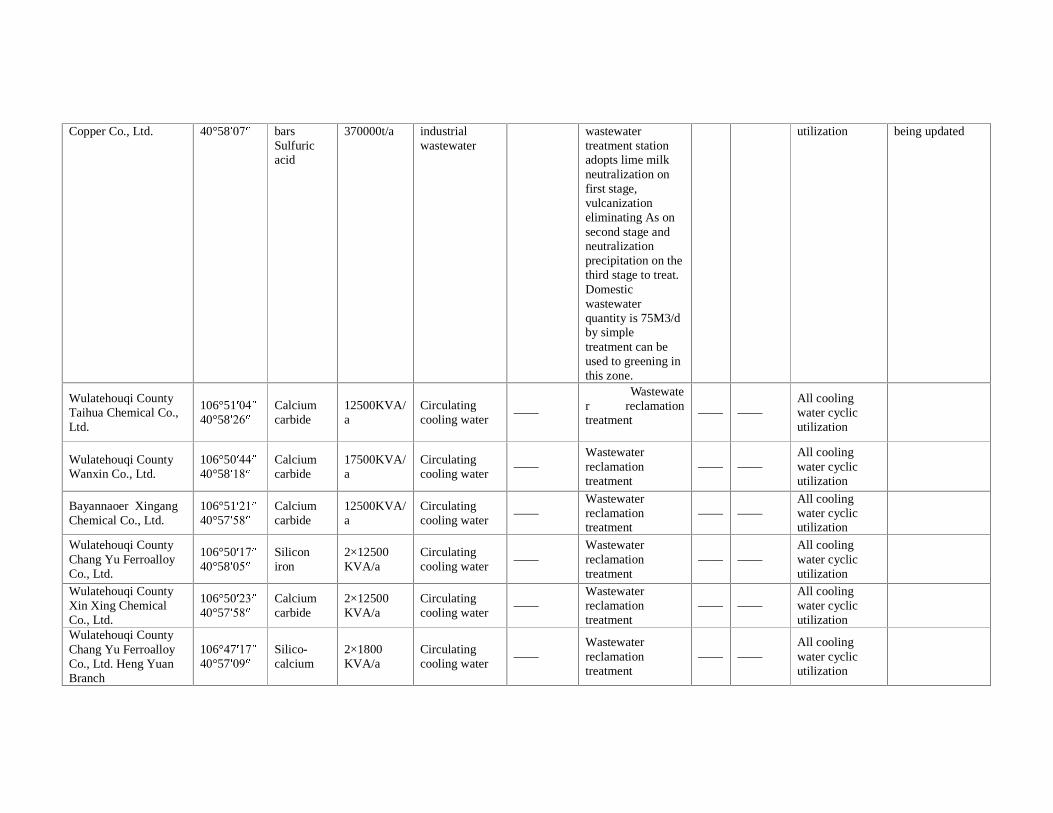
Copper Co., Ltd. 40°58 07 bars Sulfuric acid
370000t/a industrial wastewater
wastewater treatment station adopts lime milk neutralization on first stage, vulcanization eliminating As on second stage and neutralization precipitation on the third stage to treat. Domestic wastewater quantity is 75M3/d by simple treatment can be used to greening in this zone.
utilization being updated
Wulatehouqi County Taihua Chemical Co., Ltd.
106°51 04 40°58 26
Calcium carbide
12500KVA/a
Circulating cooling water
——
Wastewater reclamation treatment
—— —— All cooling water cyclic utilization
Wulatehouqi County Wanxin Co., Ltd.
106°50 44 40°58 18
Calcium carbide
17500KVA/a
Circulating cooling water
—— Wastewater reclamation treatment
—— —— All cooling water cyclic utilization
Bayannaoer Xingang Chemical Co., Ltd.
106°51 21 40°57 58
Calcium carbide
12500KVA/a
Circulating cooling water
—— Wastewater reclamation treatment
—— —— All cooling water cyclic utilization
Wulatehouqi County Chang Yu Ferroalloy Co., Ltd.
106°50 17 40°58 05
Silicon iron
2×12500 KVA/a
Circulating cooling water
—— Wastewater reclamation treatment
—— —— All cooling water cyclic utilization
Wulatehouqi County Xin Xing Chemical Co., Ltd.
106°50 23 40°57 58
Calcium carbide
2×12500 KVA/a
Circulating cooling water
—— Wastewater reclamation treatment
—— —— All cooling water cyclic utilization
Wulatehouqi County Chang Yu Ferroalloy Co., Ltd. Heng Yuan Branch
106°47 17 40°57 09
Silico-calcium
2×1800 KVA/a
Circulating cooling water
—— Wastewater reclamation treatment
—— —— All cooling water cyclic utilization
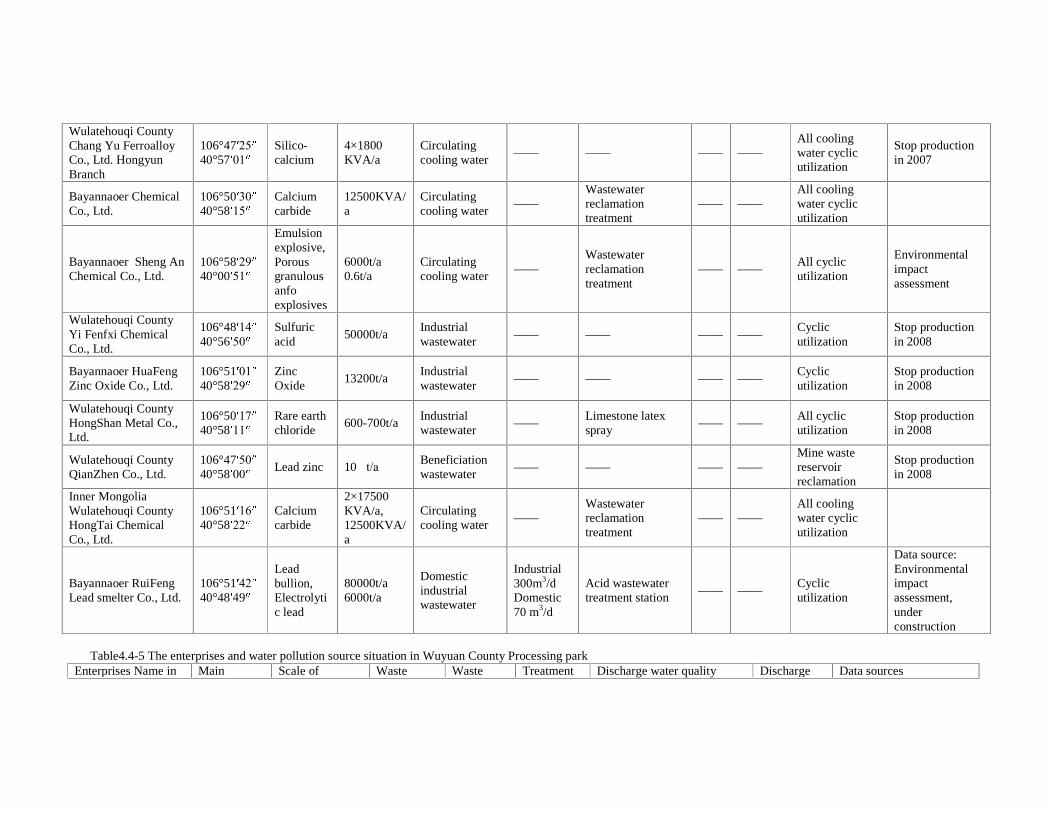
Wulatehouqi County Chang Yu Ferroalloy Co., Ltd. Hongyun Branch
106°47 25 40°57 01
Silico-calcium
4×1800 KVA/a
Circulating cooling water
—— —— —— —— All cooling water cyclic utilization
Stop production in 2007
Bayannaoer Chemical Co., Ltd.
106°50 30 40°58 15
Calcium carbide
12500KVA/a
Circulating cooling water
—— Wastewater reclamation treatment
—— —— All cooling water cyclic utilization
Bayannaoer Sheng An Chemical Co., Ltd.
106°58 29 40°00 51
Emulsion explosive, Porous granulous anfo explosives
6000t/a 0.6t/a
Circulating cooling water
—— Wastewater reclamation treatment
—— —— All cyclic utilization
Environmental impact assessment
Wulatehouqi County Yi Fenfxi Chemical Co., Ltd.
106°48 14 40°56 50
Sulfuric acid
50000t/a Industrial wastewater
—— —— —— —— Cyclic utilization
Stop production in 2008
Bayannaoer HuaFeng Zinc Oxide Co., Ltd.
106°51 01 40°58 29
Zinc Oxide
13200t/a Industrial wastewater
—— —— —— —— Cyclic utilization
Stop production in 2008
Wulatehouqi County HongShan Metal Co., Ltd.
106°50 17 40°58 11
Rare earth chloride
600-700t/a Industrial wastewater
—— Limestone latex spray
—— —— All cyclic utilization
Stop production in 2008
Wulatehouqi County QianZhen Co., Ltd.
106°47 50 40°58 00
Lead zinc 10�t/a Beneficiation wastewater
—— —— —— —— Mine waste reservoir reclamation
Stop production in 2008
Inner Mongolia Wulatehouqi County HongTai Chemical Co., Ltd.
106°51 16 40°58 22
Calcium carbide
2×17500 KVA/a, 12500KVA/a
Circulating cooling water
—— Wastewater reclamation treatment
—— —— All cooling water cyclic utilization
Bayannaoer RuiFeng Lead smelter Co., Ltd.
106°51 42 40°48 49
Lead bullion, Electrolytic lead
80000t/a 6000t/a
Domestic industrial wastewater
Industrial 300m3/d Domestic 70 m3/d
Acid wastewater treatment station
—— —— Cyclic utilization
Data source: Environmental impact assessment, under construction
Table4.4-5 The enterprises and water pollution source situation in Wuyuan County Processing park
Enterprises Name in Main Scale of Waste Waste Treatment Discharge water quality Discharge Data sources
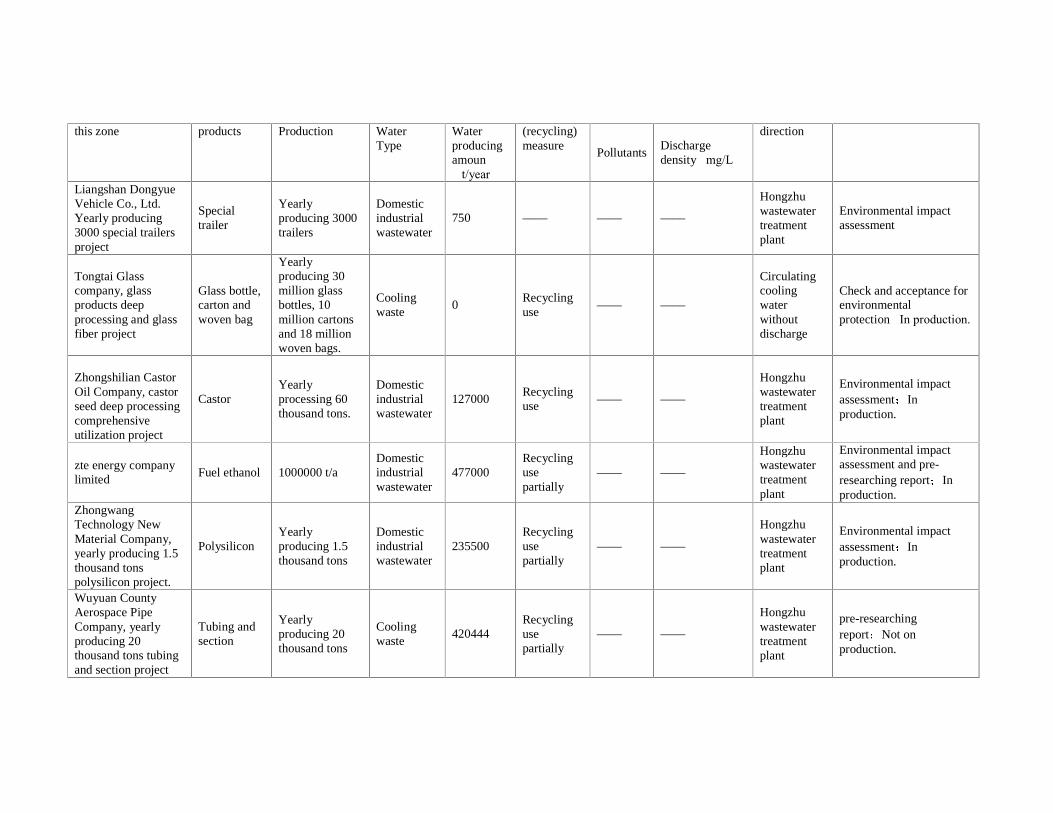
this zone products Production Water Type
Water producing amoun �t/year�
(recycling) measure
Pollutants Discharge density�mg/L�
direction
Liangshan Dongyue Vehicle Co., Ltd. Yearly producing 3000 special trailers project
Special trailer
Yearly producing 3000 trailers
Domestic industrial wastewater
750 —— —— ——
Hongzhu wastewater treatment plant
Environmental impact assessment
Tongtai Glass company, glass products deep processing and glass fiber project
Glass bottle, carton and woven bag
Yearly producing 30 million glass bottles, 10 million cartons and 18 million woven bags.
Cooling waste
0 Recycling use
—— ——
Circulating cooling water without discharge
Check and acceptance for environmental protection�In production.
Zhongshilian Castor Oil Company, castor seed deep processing comprehensive utilization project
Castor Yearly processing 60 thousand tons.
Domestic industrial wastewater
127000 Recycling use
—— ——
Hongzhu wastewater treatment plant
Environmental impact assessment In production.
zte energy company limited
Fuel ethanol 1000000 t/a Domestic industrial wastewater
477000 Recycling use partially
—— ——
Hongzhu wastewater treatment plant
Environmental impact assessment and pre-researching report In production.
Zhongwang Technology New Material Company, yearly producing 1.5 thousand tons polysilicon project.
Polysilicon Yearly producing 1.5 thousand tons
Domestic industrial wastewater
235500 Recycling use partially
—— ——
Hongzhu wastewater treatment plant
Environmental impact assessment In production.
Wuyuan County Aerospace Pipe Company, yearly producing 20 thousand tons tubing and section project
Tubing and section
Yearly producing 20 thousand tons
Cooling waste
420444 Recycling use partially
—— ——
Hongzhu wastewater treatment plant
pre-researching report Not on production.
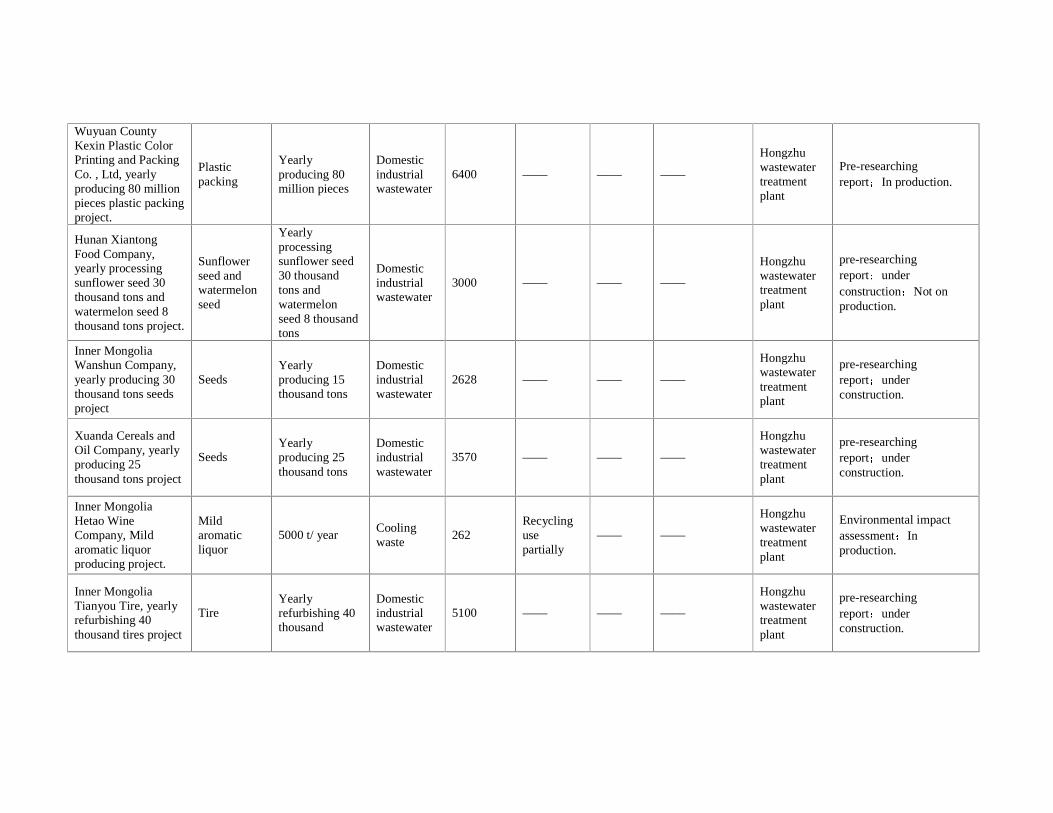
Wuyuan County Kexin Plastic Color Printing and Packing Co. , Ltd, yearly producing 80 million pieces plastic packing project.
Plastic packing
Yearly producing 80 million pieces
Domestic industrial wastewater
6400 —— —— ——
Hongzhu wastewater treatment plant
Pre-researching report In production.
Hunan Xiantong Food Company, yearly processing sunflower seed 30 thousand tons and watermelon seed 8 thousand tons project.
Sunflower seed and watermelon seed
Yearly processing sunflower seed 30 thousand tons and watermelon seed 8 thousand tons
Domestic industrial wastewater
3000 —— —— ——
Hongzhu wastewater treatment plant
pre-researching report under construction Not on production.
Inner Mongolia Wanshun Company, yearly producing 30 thousand tons seeds project
Seeds Yearly producing 15 thousand tons
Domestic industrial wastewater
2628 —— —— ——
Hongzhu wastewater treatment plant
pre-researching report under construction.
Xuanda Cereals and Oil Company, yearly producing 25 thousand tons project
Seeds Yearly producing 25 thousand tons
Domestic industrial wastewater
3570 —— —— ——
Hongzhu wastewater treatment plant
pre-researching report under construction.
Inner Mongolia Hetao Wine Company, Mild aromatic liquor producing project.
Mild aromatic liquor
5000 t/ year Cooling waste
262 Recycling use partially
—— ——
Hongzhu wastewater treatment plant
Environmental impact assessment In production.
Inner Mongolia Tianyou Tire, yearly refurbishing 40 thousand tires project
Tire Yearly refurbishing 40 thousand
Domestic industrial wastewater
5100 —— —— ——
Hongzhu wastewater treatment plant
pre-researching report under construction.
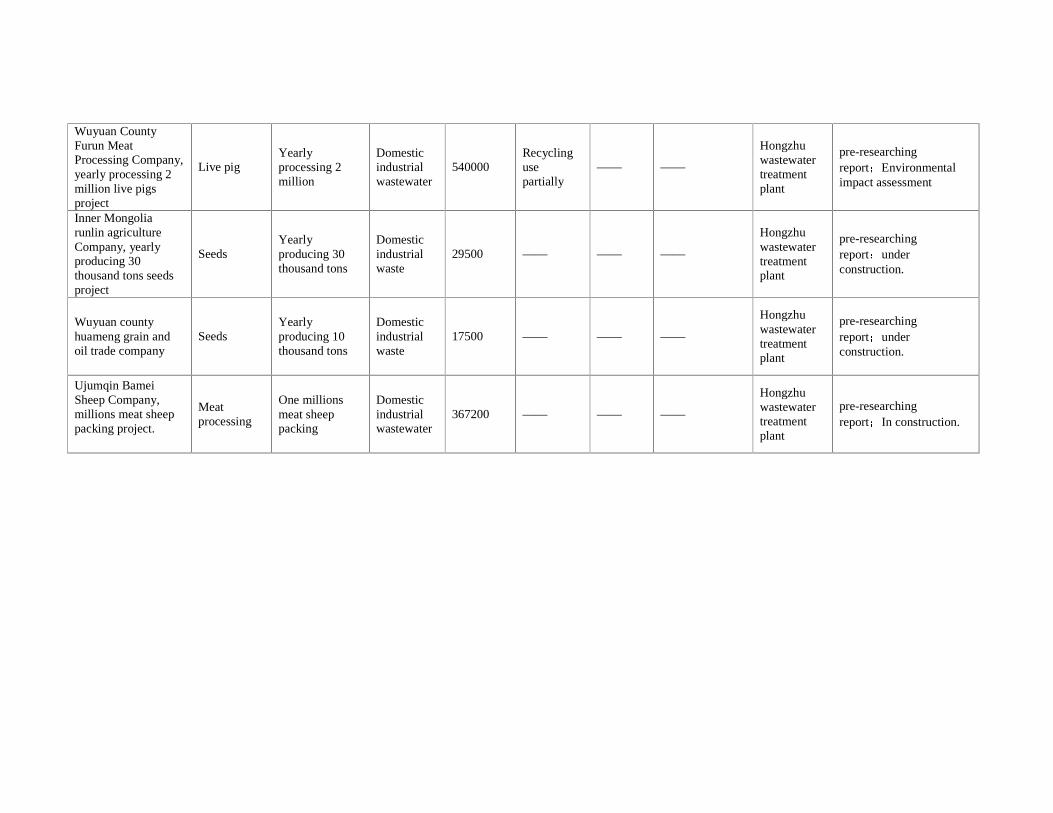
Wuyuan County Furun Meat Processing Company, yearly processing 2 million live pigs project
Live pig Yearly processing 2 million
Domestic industrial wastewater
540000 Recycling use partially
—— ——
Hongzhu wastewater treatment plant
pre-researching report Environmental impact assessment
Inner Mongolia runlin agriculture Company, yearly producing 30 thousand tons seeds project
Seeds Yearly producing 30 thousand tons
Domestic industrial waste
29500 —— —— ——
Hongzhu wastewater treatment plant
pre-researching report under construction.
Wuyuan county huameng grain and oil trade company
Seeds Yearly producing 10 thousand tons
Domestic industrial waste
17500 —— —— ——
Hongzhu wastewater treatment plant
pre-researching report under construction.
Ujumqin Bamei Sheep Company, millions meat sheep packing project.
Meat processing
One millions meat sheep packing
Domestic industrial wastewater
367200 —— —— ——
Hongzhu wastewater treatment plant
pre-researching report In construction.
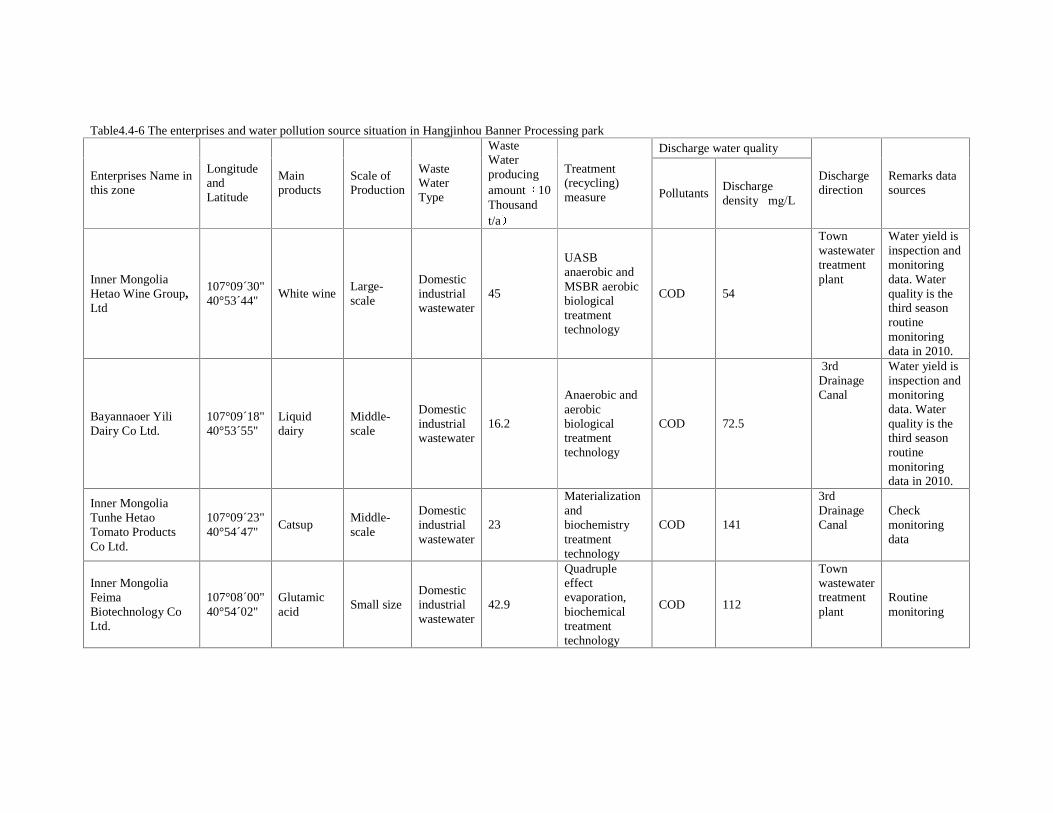
Table4.4-6 The enterprises and water pollution source situation in Hangjinhou Banner Processing park
Discharge water quality
Enterprises Name in this zone
Longitude and Latitude
Main products
Scale of Production
Waste Water Type
Waste Water producing amount 10 Thousand t/a
Treatment (recycling) measure Pollutants
Discharge density�mg/L�
Discharge direction
Remarks data sources
Inner Mongolia Hetao Wine Group, Ltd
107°09´30" 40°53´44"
White wine Large-scale
Domestic industrial wastewater
45
UASB anaerobic and MSBR aerobic biological treatment technology
COD 54
Town wastewater treatment plant
Water yield is inspection and monitoring data. Water quality is the third season routine monitoring data in 2010.
Bayannaoer Yili Dairy Co Ltd.
107°09´18" 40°53´55"
Liquid dairy
Middle-scale
Domestic industrial wastewater
16.2
Anaerobic and aerobic biological treatment technology
COD 72.5
3rd Drainage Canal
Water yield is inspection and monitoring data. Water quality is the third season routine monitoring data in 2010.
Inner Mongolia Tunhe Hetao Tomato Products Co Ltd.
107°09´23" 40°54´47"
Catsup Middle-scale
Domestic industrial wastewater
23
Materialization and biochemistry treatment technology
COD 141
3rd Drainage Canal
Check monitoring data
Inner Mongolia Feima Biotechnology Co Ltd.
107°08´00" 40°54´02"
Glutamic acid
Small size Domestic industrial wastewater
42.9
Quadruple effect evaporation, biochemical treatment technology
COD 112
Town wastewater treatment plant
Routine monitoring
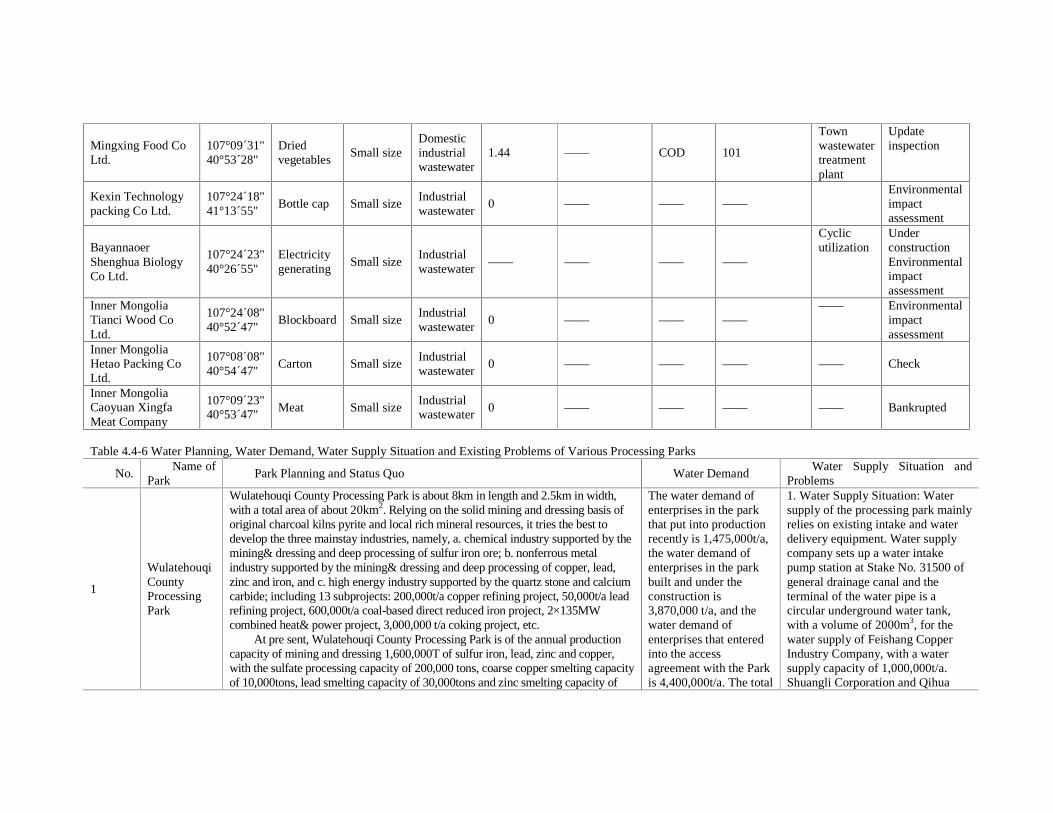
Mingxing Food Co Ltd.
107°09´31" 40°53´28"
Dried vegetables
Small size Domestic industrial wastewater
1.44 —— COD 101
Town wastewater treatment plant
Update inspection
Kexin Technology packing Co Ltd.
107°24´18" 41°13´55"
Bottle cap Small size Industrial wastewater
0 —— —— —— Environmental
impact assessment
Bayannaoer Shenghua Biology Co Ltd.
107°24´23" 40°26´55"
Electricity generating
Small size Industrial wastewater
—— —— —— ——
Cyclic utilization
Under construction Environmental impact assessment
Inner Mongolia Tianci Wood Co Ltd.
107°24´08" 40°52´47"
Blockboard Small size Industrial wastewater
0 —— —— —— —— Environmental
impact assessment
Inner Mongolia Hetao Packing Co Ltd.
107°08´08" 40°54´47"
Carton Small size Industrial wastewater
0 —— —— —— —— Check
Inner Mongolia Caoyuan Xingfa Meat Company
107°09´23" 40°53´47"
Meat Small size Industrial wastewater
0 —— —— —— —— Bankrupted
Table 4.4-6 Water Planning, Water Demand, Water Supply Situation and Existing Problems of Various Processing Parks
No. Name of
Park Park Planning and Status Quo Water Demand
Water Supply Situation and Problems
1
Wulatehouqi County Processing Park
Wulatehouqi County Processing Park is about 8km in length and 2.5km in width, with a total area of about 20km2. Relying on the solid mining and dressing basis of original charcoal kilns pyrite and local rich mineral resources, it tries the best to develop the three mainstay industries, namely, a. chemical industry supported by the mining& dressing and deep processing of sulfur iron ore; b. nonferrous metal industry supported by the mining& dressing and deep processing of copper, lead, zinc and iron, and c. high energy industry supported by the quartz stone and calcium carbide; including 13 subprojects: 200,000t/a copper refining project, 50,000t/a lead refining project, 600,000t/a coal-based direct reduced iron project, 2×135MW combined heat& power project, 3,000,000 t/a coking project, etc.
At pre sent, Wulatehouqi County Processing Park is of the annual production capacity of mining and dressing 1,600,000T of sulfur iron, lead, zinc and copper, with the sulfate processing capacity of 200,000 tons, coarse copper smelting capacity of 10,000tons, lead smelting capacity of 30,000tons and zinc smelting capacity of
The water demand of enterprises in the park that put into production recently is 1,475,000t/a, the water demand of enterprises in the park built and under the construction is 3,870,000 t/a, and the water demand of enterprises that entered into the access agreement with the Park is 4,400,000t/a. The total
1. Water Supply Situation: Water supply of the processing park mainly relies on existing intake and water delivery equipment. Water supply company sets up a water intake pump station at Stake No. 31500 of general drainage canal and the terminal of the water pipe is a circular underground water tank, with a volume of 2000m3, for the water supply of Feishang Copper Industry Company, with a water supply capacity of 1,000,000t/a. Shuangli Corporation and Qihua
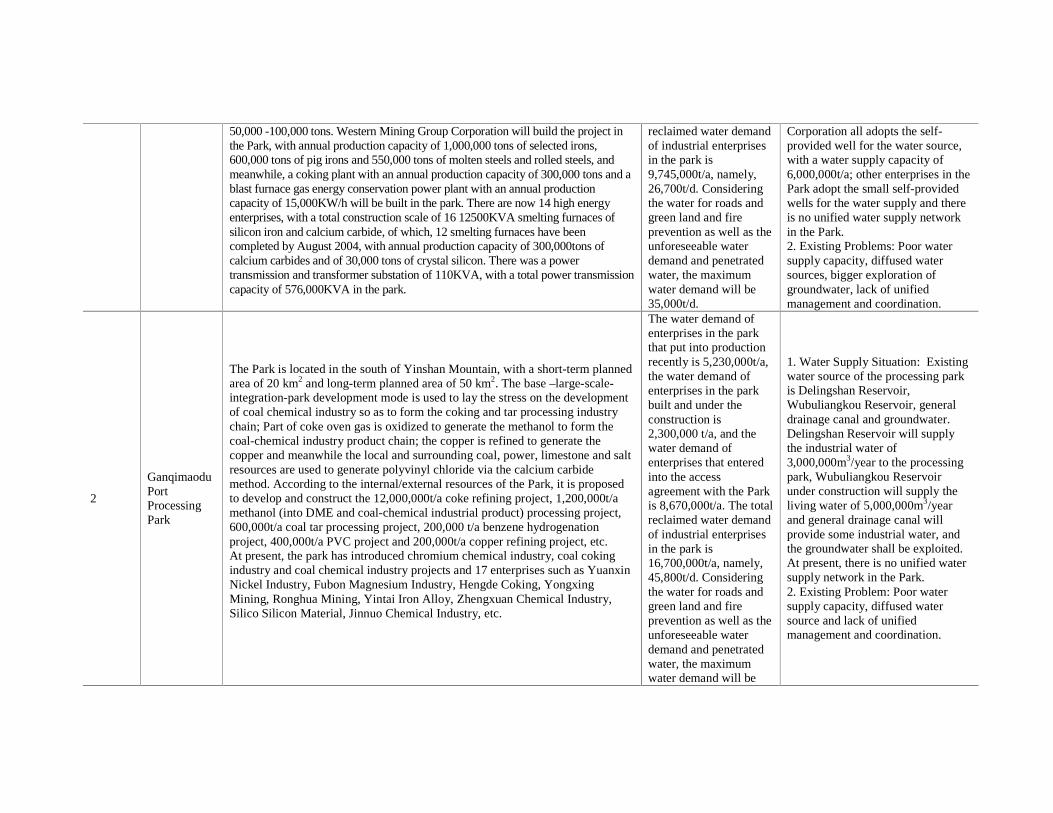
50,000 -100,000 tons. Western Mining Group Corporation will build the project in the Park, with annual production capacity of 1,000,000 tons of selected irons, 600,000 tons of pig irons and 550,000 tons of molten steels and rolled steels, and meanwhile, a coking plant with an annual production capacity of 300,000 tons and a blast furnace gas energy conservation power plant with an annual production capacity of 15,000KW/h will be built in the park. There are now 14 high energy enterprises, with a total construction scale of 16 12500KVA smelting furnaces of silicon iron and calcium carbide, of which, 12 smelting furnaces have been completed by August 2004, with annual production capacity of 300,000tons of calcium carbides and of 30,000 tons of crystal silicon. There was a power transmission and transformer substation of 110KVA, with a total power transmission capacity of 576,000KVA in the park.
reclaimed water demand of industrial enterprises in the park is 9,745,000t/a, namely, 26,700t/d. Considering the water for roads and green land and fire prevention as well as the unforeseeable water demand and penetrated water, the maximum water demand will be 35,000t/d.
Corporation all adopts the self-provided well for the water source, with a water supply capacity of 6,000,000t/a; other enterprises in the Park adopt the small self-provided wells for the water supply and there is no unified water supply network in the Park. 2. Existing Problems: Poor water supply capacity, diffused water sources, bigger exploration of groundwater, lack of unified management and coordination.
2
Ganqimaodu Port Processing Park
The Park is located in the south of Yinshan Mountain, with a short-term planned area of 20 km2 and long-term planned area of 50 km2. The base –large-scale- integration-park development mode is used to lay the stress on the development of coal chemical industry so as to form the coking and tar processing industry chain; Part of coke oven gas is oxidized to generate the methanol to form the coal-chemical industry product chain; the copper is refined to generate the copper and meanwhile the local and surrounding coal, power, limestone and salt resources are used to generate polyvinyl chloride via the calcium carbide method. According to the internal/external resources of the Park, it is proposed to develop and construct the 12,000,000t/a coke refining project, 1,200,000t/a methanol (into DME and coal-chemical industrial product) processing project, 600,000t/a coal tar processing project, 200,000 t/a benzene hydrogenation project, 400,000t/a PVC project and 200,000t/a copper refining project, etc. At present, the park has introduced chromium chemical industry, coal coking industry and coal chemical industry projects and 17 enterprises such as Yuanxin Nickel Industry, Fubon Magnesium Industry, Hengde Coking, Yongxing Mining, Ronghua Mining, Yintai Iron Alloy, Zhengxuan Chemical Industry, Silico Silicon Material, Jinnuo Chemical Industry, etc.
The water demand of enterprises in the park that put into production recently is 5,230,000t/a, the water demand of enterprises in the park built and under the construction is 2,300,000 t/a, and the water demand of enterprises that entered into the access agreement with the Park is 8,670,000t/a. The total reclaimed water demand of industrial enterprises in the park is 16,700,000t/a, namely, 45,800t/d. Considering the water for roads and green land and fire prevention as well as the unforeseeable water demand and penetrated water, the maximum water demand will be
1. Water Supply Situation: Existing water source of the processing park is Delingshan Reservoir, Wubuliangkou Reservoir, general drainage canal and groundwater. Delingshan Reservoir will supply the industrial water of 3,000,000m3/year to the processing park, Wubuliangkou Reservoir under construction will supply the living water of 5,000,000m3/year and general drainage canal will provide some industrial water, and the groundwater shall be exploited. At present, there is no unified water supply network in the Park. 2. Existing Problem: Poor water supply capacity, diffused water source and lack of unified management and coordination.
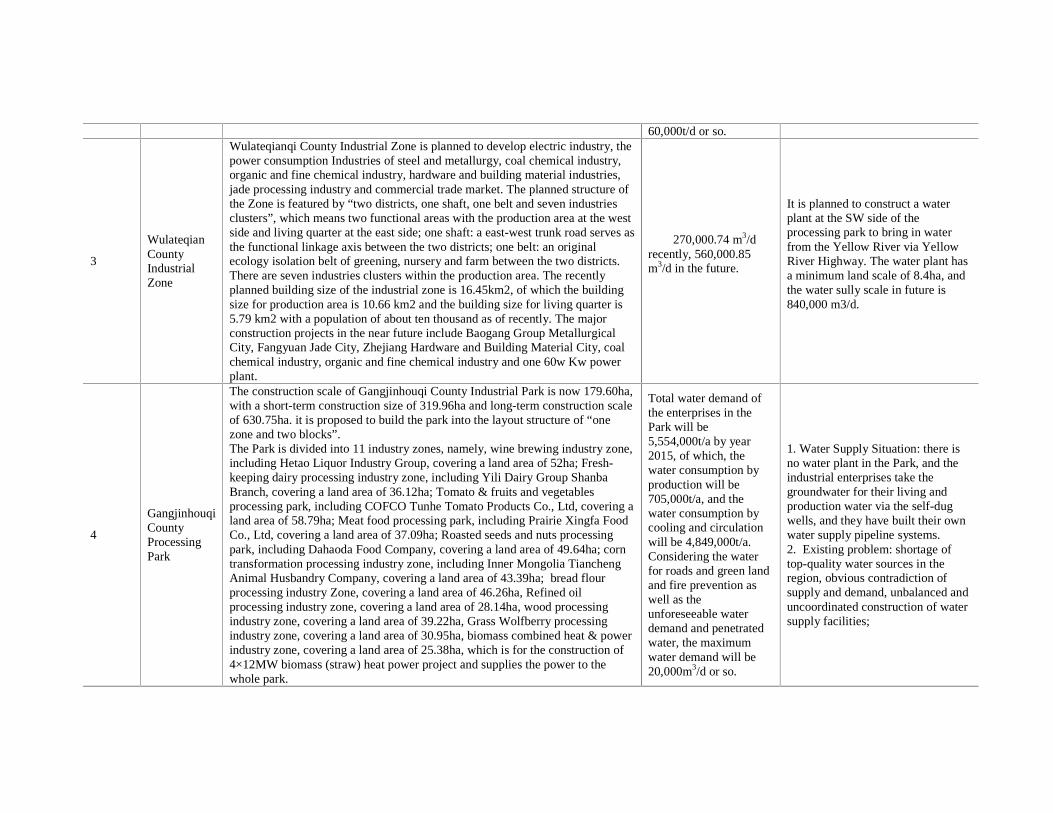
60,000t/d or so.
3
Wulateqian County Industrial Zone
Wulateqianqi County Industrial Zone is planned to develop electric industry, the power consumption Industries of steel and metallurgy, coal chemical industry, organic and fine chemical industry, hardware and building material industries, jade processing industry and commercial trade market. The planned structure of the Zone is featured by “two districts, one shaft, one belt and seven industries clusters”, which means two functional areas with the production area at the west side and living quarter at the east side; one shaft: a east-west trunk road serves as the functional linkage axis between the two districts; one belt: an original ecology isolation belt of greening, nursery and farm between the two districts. There are seven industries clusters within the production area. The recently planned building size of the industrial zone is 16.45km2, of which the building size for production area is 10.66 km2 and the building size for living quarter is 5.79 km2 with a population of about ten thousand as of recently. The major construction projects in the near future include Baogang Group Metallurgical City, Fangyuan Jade City, Zhejiang Hardware and Building Material City, coal chemical industry, organic and fine chemical industry and one 60w Kw power plant.
270,000.74 m3/d recently, 560,000.85 m3/d in the future.
It is planned to construct a water plant at the SW side of the processing park to bring in water from the Yellow River via Yellow River Highway. The water plant has a minimum land scale of 8.4ha, and the water sully scale in future is 840,000 m3/d.
4
Gangjinhouqi County Processing Park
The construction scale of Gangjinhouqi County Industrial Park is now 179.60ha, with a short-term construction size of 319.96ha and long-term construction scale of 630.75ha. it is proposed to build the park into the layout structure of “one zone and two blocks”. The Park is divided into 11 industry zones, namely, wine brewing industry zone, including Hetao Liquor Industry Group, covering a land area of 52ha; Fresh-keeping dairy processing industry zone, including Yili Dairy Group Shanba Branch, covering a land area of 36.12ha; Tomato & fruits and vegetables processing park, including COFCO Tunhe Tomato Products Co., Ltd, covering a land area of 58.79ha; Meat food processing park, including Prairie Xingfa Food Co., Ltd, covering a land area of 37.09ha; Roasted seeds and nuts processing park, including Dahaoda Food Company, covering a land area of 49.64ha; corn transformation processing industry zone, including Inner Mongolia Tiancheng Animal Husbandry Company, covering a land area of 43.39ha; bread flour processing industry Zone, covering a land area of 46.26ha, Refined oil processing industry zone, covering a land area of 28.14ha, wood processing industry zone, covering a land area of 39.22ha, Grass Wolfberry processing industry zone, covering a land area of 30.95ha, biomass combined heat & power industry zone, covering a land area of 25.38ha, which is for the construction of 4×12MW biomass (straw) heat power project and supplies the power to the whole park.
Total water demand of the enterprises in the Park will be 5,554,000t/a by year 2015, of which, the water consumption by production will be 705,000t/a, and the water consumption by cooling and circulation will be 4,849,000t/a. Considering the water for roads and green land and fire prevention as well as the unforeseeable water demand and penetrated water, the maximum water demand will be 20,000m3/d or so.
1. Water Supply Situation: there is no water plant in the Park, and the industrial enterprises take the groundwater for their living and production water via the self-dug wells, and they have built their own water supply pipeline systems. 2. Existing problem: shortage of top-quality water sources in the region, obvious contradiction of supply and demand, unbalanced and uncoordinated construction of water supply facilities;
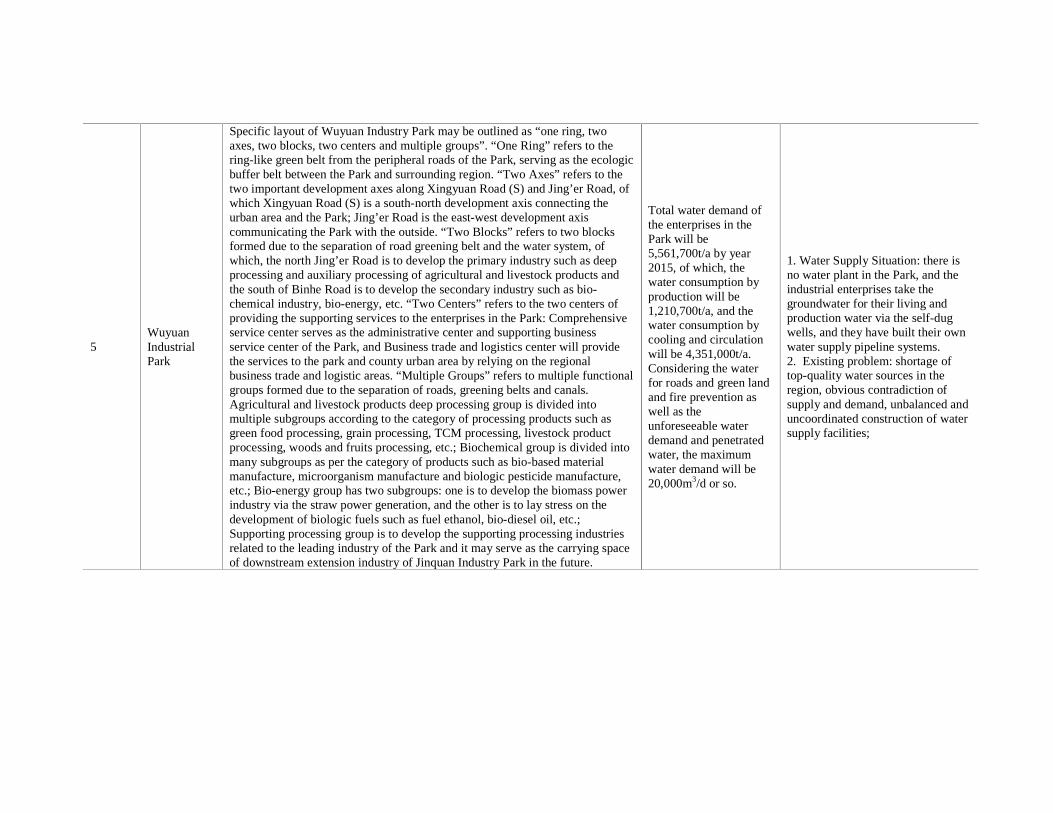
5 Wuyuan Industrial Park
Specific layout of Wuyuan Industry Park may be outlined as “one ring, two axes, two blocks, two centers and multiple groups”. “One Ring” refers to the ring-like green belt from the peripheral roads of the Park, serving as the ecologic buffer belt between the Park and surrounding region. “Two Axes” refers to the two important development axes along Xingyuan Road (S) and Jing’er Road, of which Xingyuan Road (S) is a south-north development axis connecting the urban area and the Park; Jing’er Road is the east-west development axis communicating the Park with the outside. “Two Blocks” refers to two blocks formed due to the separation of road greening belt and the water system, of which, the north Jing’er Road is to develop the primary industry such as deep processing and auxiliary processing of agricultural and livestock products and the south of Binhe Road is to develop the secondary industry such as bio-chemical industry, bio-energy, etc. “Two Centers” refers to the two centers of providing the supporting services to the enterprises in the Park: Comprehensive service center serves as the administrative center and supporting business service center of the Park, and Business trade and logistics center will provide the services to the park and county urban area by relying on the regional business trade and logistic areas. “Multiple Groups” refers to multiple functional groups formed due to the separation of roads, greening belts and canals. Agricultural and livestock products deep processing group is divided into multiple subgroups according to the category of processing products such as green food processing, grain processing, TCM processing, livestock product processing, woods and fruits processing, etc.; Biochemical group is divided into many subgroups as per the category of products such as bio-based material manufacture, microorganism manufacture and biologic pesticide manufacture, etc.; Bio-energy group has two subgroups: one is to develop the biomass power industry via the straw power generation, and the other is to lay stress on the development of biologic fuels such as fuel ethanol, bio-diesel oil, etc.; Supporting processing group is to develop the supporting processing industries related to the leading industry of the Park and it may serve as the carrying space of downstream extension industry of Jinquan Industry Park in the future.
Total water demand of the enterprises in the Park will be 5,561,700t/a by year 2015, of which, the water consumption by production will be 1,210,700t/a, and the water consumption by cooling and circulation will be 4,351,000t/a. Considering the water for roads and green land and fire prevention as well as the unforeseeable water demand and penetrated water, the maximum water demand will be 20,000m3/d or so.
1. Water Supply Situation: there is no water plant in the Park, and the industrial enterprises take the groundwater for their living and production water via the self-dug wells, and they have built their own water supply pipeline systems. 2. Existing problem: shortage of top-quality water sources in the region, obvious contradiction of supply and demand, unbalanced and uncoordinated construction of water supply facilities;
4.4.2.2 Management of processing parks 1�Admittance license of enterprises Industrial enterprises entering the processing park shall meet the admittance conditions so as to ensure the smooth implementation of the programming of the processing park and to effectively control water resource consumption and pollutants emission. y� It is strictly prohibited that any project or technology formally banned by the State for construction or
investment, or any project or technology involved in or related to the items listed by the Guideline Catalogue for Industrial Structure Adjustment (2005 edition) (No.40 Decree of State Development and Reform Commission) enter this processing park.
y� Any enterprise included into the Scheme for Industry Development of the Processing park shall meet the detailed rules for admittance threshold and the clean production-index of the accessing enterprises as prescribed in Technical Guiding Catalog of Cleaner Production of National Key industry issued by State Economic and Trade Commission and State Environmental Protection Administration on 27 Feb, 2003, and on 15 Feb, 2000.
y� Any enterprise that can meet demands with regard to supplementary industry cycle and network connections; Any high and new-technology industries encouraged by the State for development; any capital and knowledge intensive enterprises.
y� Concentrate on developing the readily marketable products with large market capacity and yielding good economic returns as well as the products with high technology contents that cannot be produced at home at all; Restrict lower-end products without market demand.
y� Enterprises entering the processing park shall have advanced manufacturing techniques, with fine product quality and market demand, featured by high level of resources utilization, low energy consumption and lighter pollution, meeting the general requirements for cleaner production.
y� Any project entering the processing park shall adopt cleaner production technology, use cleaner raw and auxiliary materials and it is strictly forbidden to purchase from outside the raw and auxiliary materials with significant toxicity; the products whose final product has significant toxicity, or raw and auxiliary materials with significant toxicity have to be used, or components with significant toxicity may be produced during manufacture, are restricted to enter the processing park.
y� The utilization of repeat wafer of the enterprise shall reach 75%, the water intaking coefficient for per ten-thousand Yuan of added value of industrial output shall respectively be 76t/ ten-thousand Yuan in Wuyuan Industrial Zone and Hangjinhou Banner Industrial Zone, and 114t/ ten-thousand Yuan in Wulateqianqi County, Wulatezhongqi County and Wulatehouqi County.
y� The wastewater from the enterprises entering the processing park to the wastewater disposal plant of the processing park shall reach the standard of Class III in Integrated Wastewater Discharge Standard. All the wastewater within the processing park shall be reused through disposal and the water quality of the reused water shall meet the standard of recycled water.
2�Supervision and management of environment. It is necessary to strengthen the supervision and management of the environment of the enterprises entering the processing park so as to ensure the construction of the enterprises within the processing parks and their operations to comply with national environmental protection laws and regulations to avoid causing vital environment issues. y� Strictly enforce environmental impact assessing regime, control the construction of the enterprises within
the processing parks to cause serious negative impact on the environment to minimize the environmental impact on environment caused by the projects entering the processing parks.
y� Strictly enforce National "Three Simultaneous" System in construction projects, carry our environmental protection measures, prevent the projects entering the processing parks from bringing in new environmental problems after these projects have been completed and put into production.
y� Intensify supervision and inspection, establish strict control and supervision systems at the level of municipality and county; the environmental protection bureaus of Banner/County shall dispatch personnel to enter the processing parks for 24-hour monitoring and to inspect frequently by numerous methods; municipal environmental bureau shall conduct random inspections regularly or irregularly.
y� Implement source control; stress on overall process management of the construction projects, strictly control the key points, constitute rigorous checking system; supervise and urge the enterprises to carry out "Three Simultaneous" System for environmental protection through three links of self-inspection by enterprises, preliminary inspection by bureaus at county level and on-site inspection by experts invited by municipal bureau so as to promote the environmental protection in processing parks.
y� Strengthen point source control, analyze the point source within the processing parks to determine reform scheme; Heavy penalties shall be given to any enterprise with the construction in violation of the laws or
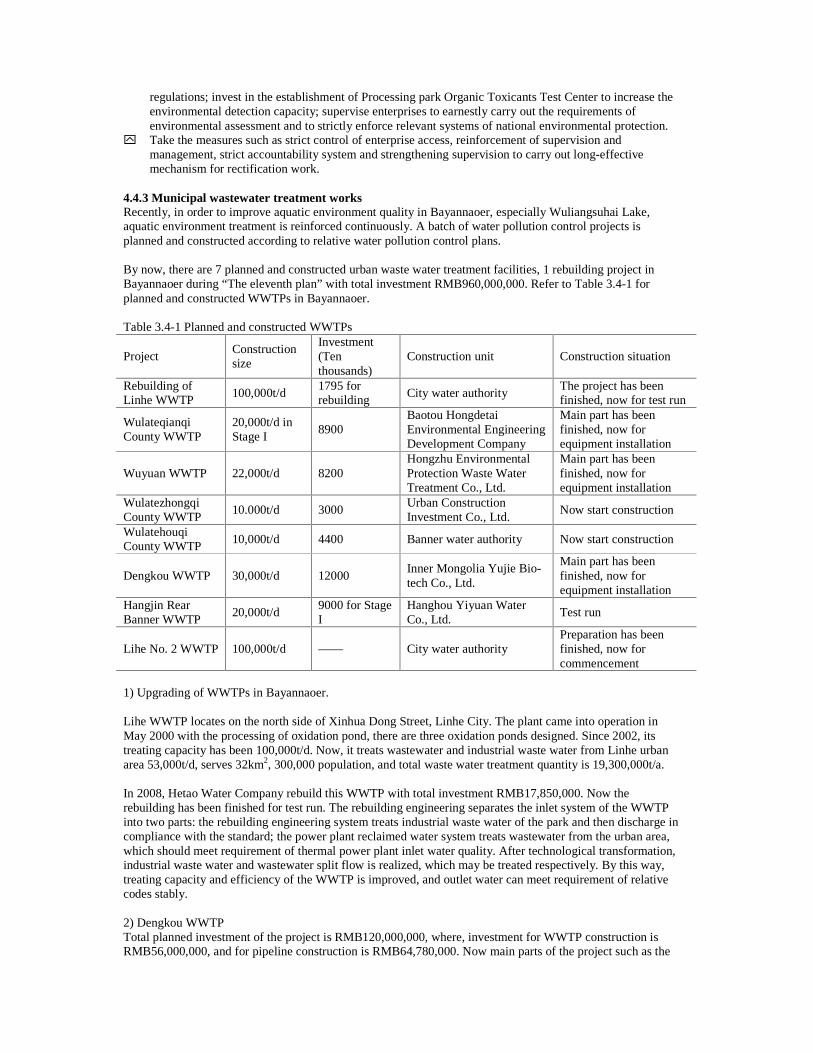
regulations; invest in the establishment of Processing park Organic Toxicants Test Center to increase the environmental detection capacity; supervise enterprises to earnestly carry out the requirements of environmental assessment and to strictly enforce relevant systems of national environmental protection.
y� Take the measures such as strict control of enterprise access, reinforcement of supervision and management, strict accountability system and strengthening supervision to carry out long-effective mechanism for rectification work.
4.4.3 Municipal wastewater treatment works Recently, in order to improve aquatic environment quality in Bayannaoer, especially Wuliangsuhai Lake, aquatic environment treatment is reinforced continuously. A batch of water pollution control projects is planned and constructed according to relative water pollution control plans. By now, there are 7 planned and constructed urban waste water treatment facilities, 1 rebuilding project in Bayannaoer during “The eleventh plan” with total investment RMB960,000,000. Refer to Table 3.4-1 for planned and constructed WWTPs in Bayannaoer. Table 3.4-1 Planned and constructed WWTPs
Project Construction size
Investment (Ten thousands)
Construction unit Construction situation
Rebuilding of Linhe WWTP
100,000t/d 1795 for rebuilding
City water authority The project has been finished, now for test run
Wulateqianqi County WWTP
20,000t/d in Stage I
8900 Baotou Hongdetai Environmental Engineering Development Company
Main part has been finished, now for equipment installation
Wuyuan WWTP 22,000t/d 8200 Hongzhu Environmental Protection Waste Water Treatment Co., Ltd.
Main part has been finished, now for equipment installation
Wulatezhongqi County WWTP
10.000t/d 3000 Urban Construction Investment Co., Ltd.
Now start construction
Wulatehouqi County WWTP
10,000t/d 4400 Banner water authority Now start construction
Dengkou WWTP 30,000t/d 12000 Inner Mongolia Yujie Bio-tech Co., Ltd.
Main part has been finished, now for equipment installation
Hangjin Rear Banner WWTP
20,000t/d 9000 for Stage I
Hanghou Yiyuan Water Co., Ltd.
Test run
Lihe No. 2 WWTP 100,000t/d —— City water authority Preparation has been finished, now for commencement
1) Upgrading of WWTPs in Bayannaoer. Lihe WWTP locates on the north side of Xinhua Dong Street, Linhe City. The plant came into operation in May 2000 with the processing of oxidation pond, there are three oxidation ponds designed. Since 2002, its treating capacity has been 100,000t/d. Now, it treats wastewater and industrial waste water from Linhe urban area 53,000t/d, serves 32km2, 300,000 population, and total waste water treatment quantity is 19,300,000t/a. In 2008, Hetao Water Company rebuild this WWTP with total investment RMB17,850,000. Now the rebuilding has been finished for test run. The rebuilding engineering separates the inlet system of the WWTP into two parts: the rebuilding engineering system treats industrial waste water of the park and then discharge in compliance with the standard; the power plant reclaimed water system treats wastewater from the urban area, which should meet requirement of thermal power plant inlet water quality. After technological transformation, industrial waste water and wastewater split flow is realized, which may be treated respectively. By this way, treating capacity and efficiency of the WWTP is improved, and outlet water can meet requirement of relative codes stably. 2) Dengkou WWTP Total planned investment of the project is RMB120,000,000, where, investment for WWTP construction is RMB56,000,000, and for pipeline construction is RMB64,780,000. Now main parts of the project such as the
office building, the employees living building, relative waste water treatment facilities are finished, equipment installation has been finished, the project has been complete and put into service. Construction size of Dengkou WWTP is 30,000t/d. The plant adopts advanced “Mobile bed biofilm” processing is used there, which has not only advantages of traditional biofilm such as impact resistance, long sludge age and less excess sludge, but also advantage of active sludge such as high efficiency and free operation. The sludge concentration can reach 30~40g/L with little head loss, no blockage, not need back wash and reflux. In addition, it can remove P and N well. Construction of the WWTP can meet requirement of waste water treatment at Dengkou county now and in future, change the history that production waste water and wastewater drain to Yellow River at Dengkou county, so water quality in Yellow River can be improved effectively, and drinking water safety and cleaning downstream can be guaranteed. 3) Wuyuan WWTP The construction size of Wuyuan WWTP is 22,000t/d with total investment of RMB82,000,000. Now all civil works have been finished, in addition to 95% equipment installation. It will be put into service on September 15, 2010. The WWTP adopt advanced Germany BIOLAK’s processing, which uses low load active sludge processing to make a wave type mixing oxidation effect by a mobile aeration chain, thereby create good habitat for all special microorganism with good effect of N and P removal. Construction of this WWTP enables wastewater and part industrial waste water in Wuyuan to drain directly in compliance with national codes, or reusing to saving water resource. 4) Hangjin Rear Banner WWTP The construction of Hangjin Rear Banner WWTP is 20,000t/d for Stage I, and 50,000t/d for Stage II. Total investment is RMB120,000,000, and RMB89,000,000 for Stage I, where, RMB32,000,000 for construction of WWTP, and RMB57,000,000 for pipeline. Now, the project has been complete, all equipments are installed, all pipelines are laid, road surface hardening and plant area afforestation are finished too. The project starts test running and will be put into service in October 2010. The WWTP uses the advanced Germany BIOLAK’s processing too, with outlet water quality in Grade 1, B, which can be used for urban planting, farmland irrigation and industry after further reclamation treatment. 5) Wulateqianqi County WWTP The construction size of Wulateqianqi County WWTP Stage I is 20,000t/d with total investment RMB85,500,000, where RMB39,850,000 for construction of the WWTP, and RMB45,650,000 for pipeline. The project commenced in May 2008, all civil works and installation have been finished, and started test run in September 2009 for three months, all operating indexes reach the standard, and it was put into service on November 30, 2009. The WWTP uses the advanced Germany BIOLAK’s processing too, with outlet water quality in Grade 1, A, which can be used for farmland irrigation, urban planting, and industry, for water resource cyclic utilization . 6) Wulatezhongqi County Hailiutu Town WWTP Wulatezhongqi County Hailiutu Town WWTP locates 2km south from Hailiutu town with design capacity of 10000t/d for wastewater, and 29.65km pipelines. Total investment of the project is RMB50,180,000, and pipeline construction investment is RMB29,960,000. Now civil works is constructing, the oxidation ditch, oxidation pond, secondary sedimentation tank have excavated and rolled, in addition, 12km urban pipeline has been laid. Carrousel oxidation ditch processing is used for treatment, which has simple process flow, less structures and civil work cost; advanced and proven technology and simple management and maintenance; reliable and stable operation, good treatment effect, good COD removal rate, stable N and P removal capacity; and better capacity of impact resistance. Construction of the project, can not only improve urban aquatic environment quality, but also provide good life and working environment to the towner. In addition, it may improve environment of investment, and promote healthy and fast development of economy and society. 7) Wulatehouqi County WWTP The Stage I size of Wulatehouqi County WWTP is 6000t/d, while Stage II is 12,000t/d. Total investment of the project is RMB64,890,000, where RMB35,600,000 for the WWTP, and RMB29,290,000 for pipeline.
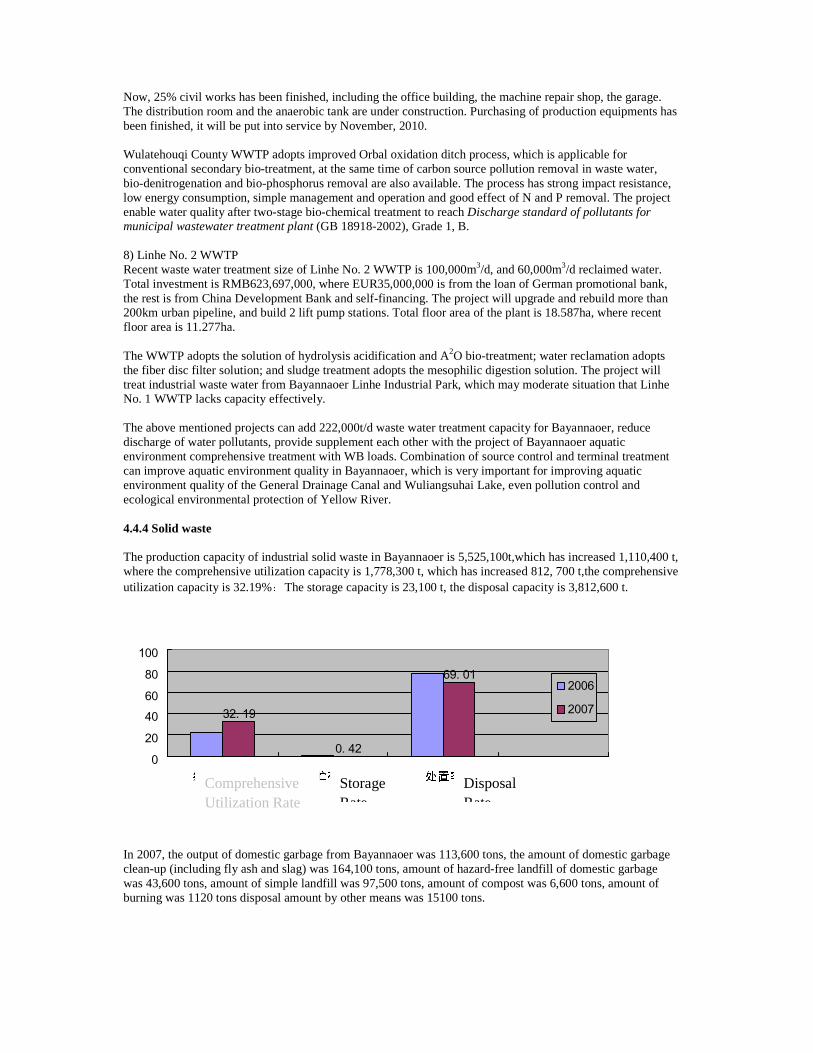
Now, 25% civil works has been finished, including the office building, the machine repair shop, the garage. The distribution room and the anaerobic tank are under construction. Purchasing of production equipments has been finished, it will be put into service by November, 2010. Wulatehouqi County WWTP adopts improved Orbal oxidation ditch process, which is applicable for conventional secondary bio-treatment, at the same time of carbon source pollution removal in waste water, bio-denitrogenation and bio-phosphorus removal are also available. The process has strong impact resistance, low energy consumption, simple management and operation and good effect of N and P removal. The project enable water quality after two-stage bio-chemical treatment to reach Discharge standard of pollutants for municipal wastewater treatment plant (GB 18918-2002), Grade 1, B. 8) Linhe No. 2 WWTP Recent waste water treatment size of Linhe No. 2 WWTP is 100,000m3/d, and 60,000m3/d reclaimed water. Total investment is RMB623,697,000, where EUR35,000,000 is from the loan of German promotional bank, the rest is from China Development Bank and self-financing. The project will upgrade and rebuild more than 200km urban pipeline, and build 2 lift pump stations. Total floor area of the plant is 18.587ha, where recent floor area is 11.277ha. The WWTP adopts the solution of hydrolysis acidification and A2O bio-treatment; water reclamation adopts the fiber disc filter solution; and sludge treatment adopts the mesophilic digestion solution. The project will treat industrial waste water from Bayannaoer Linhe Industrial Park, which may moderate situation that Linhe No. 1 WWTP lacks capacity effectively. The above mentioned projects can add 222,000t/d waste water treatment capacity for Bayannaoer, reduce discharge of water pollutants, provide supplement each other with the project of Bayannaoer aquatic environment comprehensive treatment with WB loads. Combination of source control and terminal treatment can improve aquatic environment quality in Bayannaoer, which is very important for improving aquatic environment quality of the General Drainage Canal and Wuliangsuhai Lake, even pollution control and ecological environmental protection of Yellow River. 4.4.4 Solid waste The production capacity of industrial solid waste in Bayannaoer is 5,525,100t,which has increased 1,110,400 t, where the comprehensive utilization capacity is 1,778,300 t, which has increased 812, 700 t,the comprehensive utilization capacity is 32.19%The storage capacity is 23,100 t, the disposal capacity is 3,812,600 t.
32. 19
0. 42
69. 01
020406080100
2006
2007
In 2007, the output of domestic garbage from Bayannaoer was 113,600 tons, the amount of domestic garbage clean-up (including fly ash and slag) was 164,100 tons, amount of hazard-free landfill of domestic garbage was 43,600 tons, amount of simple landfill was 97,500 tons, amount of compost was 6,600 tons, amount of burning was 1120 tons disposal amount by other means was 15100 tons.
Comprehensive Utilization Rate
Storage Rate
Disposal Rate
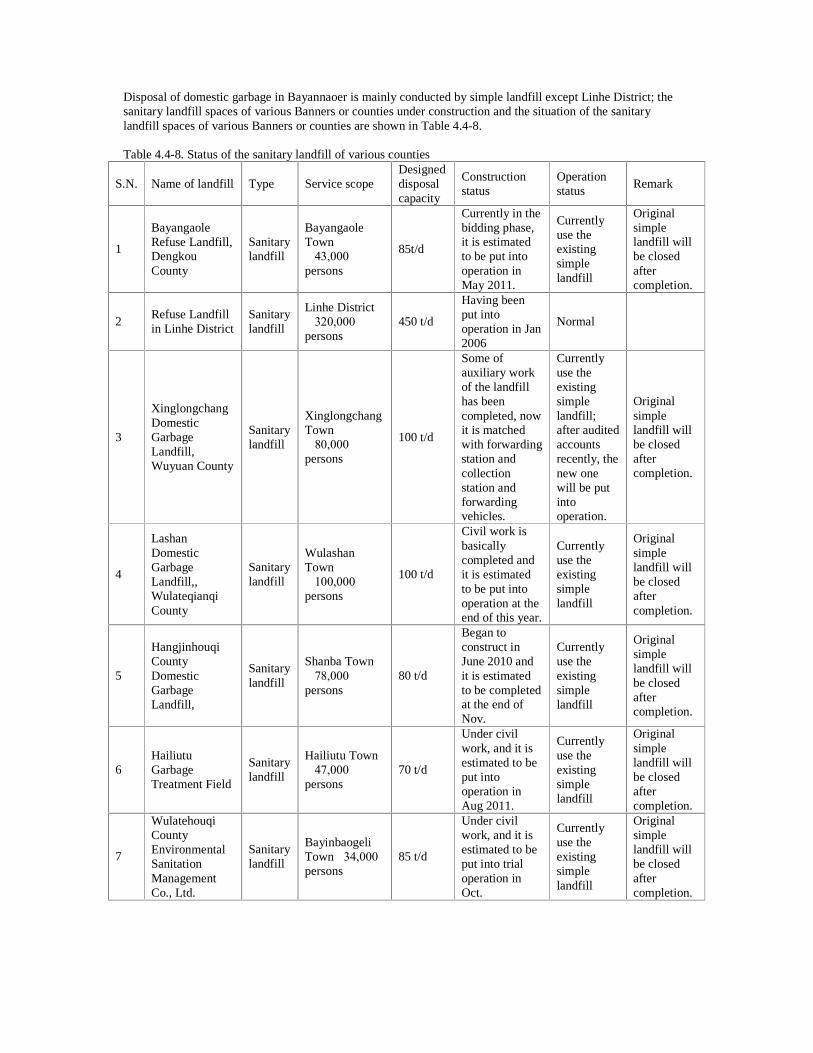
Disposal of domestic garbage in Bayannaoer is mainly conducted by simple landfill except Linhe District; the sanitary landfill spaces of various Banners or counties under construction and the situation of the sanitary landfill spaces of various Banners or counties are shown in Table 4.4-8. Table 4.4-8. Status of the sanitary landfill of various counties
S.N. Name of landfill Type Service scope Designed disposal capacity
Construction status
Operation status
Remark
1
Bayangaole Refuse Landfill, Dengkou County
Sanitary landfill
Bayangaole Town �43,000 persons�
85t/d
Currently in the bidding phase, it is estimated to be put into operation in May 2011.
Currently use the existing simple landfill
Original simple landfill will be closed after completion.
2 Refuse Landfill in Linhe District
Sanitary landfill
Linhe District �320,000 persons�
450 t/d
Having been put into operation in Jan 2006
Normal
3
Xinglongchang Domestic Garbage Landfill, Wuyuan County
Sanitary landfill
Xinglongchang Town �80,000 persons�
100 t/d
Some of auxiliary work of the landfill has been completed, now it is matched with forwarding station and collection station and forwarding vehicles.
Currently use the existing simple landfill; after audited accounts recently, the new one will be put into operation.
Original simple landfill will be closed after completion.
4
Lashan Domestic Garbage Landfill,, Wulateqianqi County
Sanitary landfill
Wulashan Town �100,000 persons�
100 t/d
Civil work is basically completed and it is estimated to be put into operation at the end of this year.
Currently use the existing simple landfill
Original simple landfill will be closed after completion.
5
Hangjinhouqi County Domestic Garbage Landfill,
Sanitary landfill
Shanba Town �78,000 persons�
80 t/d
Began to construct in June 2010 and it is estimated to be completed at the end of Nov.
Currently use the existing simple landfill
Original simple landfill will be closed after completion.
6 Hailiutu Garbage Treatment Field
Sanitary landfill
Hailiutu Town �47,000 persons�
70 t/d
Under civil work, and it is estimated to be put into operation in Aug 2011.
Currently use the existing simple landfill
Original simple landfill will be closed after completion.
7
Wulatehouqi County Environmental Sanitation Management Co., Ltd.
Sanitary landfill
Bayinbaogeli Town�34,000 persons�
85 t/d
Under civil work, and it is estimated to be put into trial operation in Oct.
Currently use the existing simple landfill
Original simple landfill will be closed after completion.
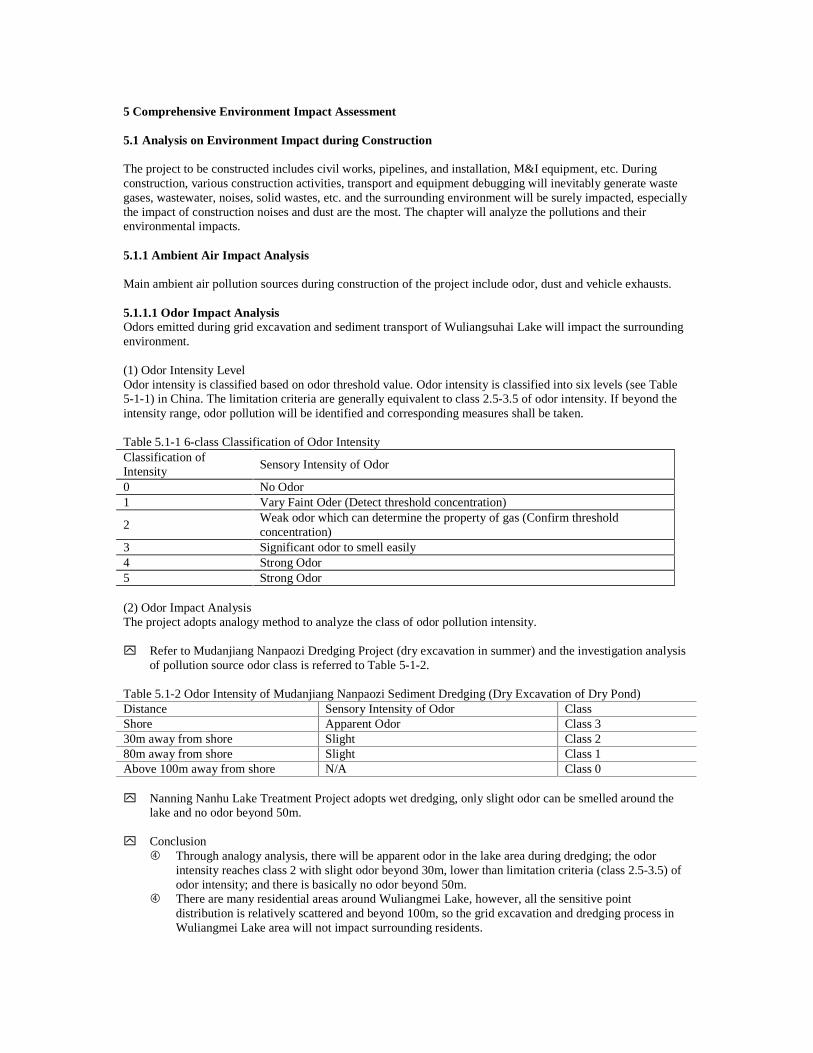
5 Comprehensive Environment Impact Assessment 5.1 Analysis on Environment Impact during Construction The project to be constructed includes civil works, pipelines, and installation, M&I equipment, etc. During construction, various construction activities, transport and equipment debugging will inevitably generate waste gases, wastewater, noises, solid wastes, etc. and the surrounding environment will be surely impacted, especially the impact of construction noises and dust are the most. The chapter will analyze the pollutions and their environmental impacts. 5.1.1 Ambient Air Impact Analysis Main ambient air pollution sources during construction of the project include odor, dust and vehicle exhausts. 5.1.1.1 Odor Impact Analysis Odors emitted during grid excavation and sediment transport of Wuliangsuhai Lake will impact the surrounding environment. (1) Odor Intensity Level Odor intensity is classified based on odor threshold value. Odor intensity is classified into six levels (see Table 5-1-1) in China. The limitation criteria are generally equivalent to class 2.5-3.5 of odor intensity. If beyond the intensity range, odor pollution will be identified and corresponding measures shall be taken. Table 5.1-1 6-class Classification of Odor Intensity Classification of Intensity
Sensory Intensity of Odor
0 No Odor 1 Vary Faint Oder (Detect threshold concentration)
2 Weak odor which can determine the property of gas (Confirm threshold concentration)
3 Significant odor to smell easily 4 Strong Odor 5 Strong Odor (2) Odor Impact Analysis The project adopts analogy method to analyze the class of odor pollution intensity. y� Refer to Mudanjiang Nanpaozi Dredging Project (dry excavation in summer) and the investigation analysis
of pollution source odor class is referred to Table 5-1-2. Table 5.1-2 Odor Intensity of Mudanjiang Nanpaozi Sediment Dredging (Dry Excavation of Dry Pond) Distance Sensory Intensity of Odor Class Shore Apparent Odor Class 3 30m away from shore Slight Class 2 80m away from shore Slight Class 1 Above 100m away from shore N/A Class 0 y� Nanning Nanhu Lake Treatment Project adopts wet dredging, only slight odor can be smelled around the
lake and no odor beyond 50m. y� Conclusion
�� Through analogy analysis, there will be apparent odor in the lake area during dredging; the odor intensity reaches class 2 with slight odor beyond 30m, lower than limitation criteria (class 2.5-3.5) of odor intensity; and there is basically no odor beyond 50m.
�� There are many residential areas around Wuliangmei Lake, however, all the sensitive point distribution is relatively scattered and beyond 100m, so the grid excavation and dredging process in Wuliangmei Lake area will not impact surrounding residents.
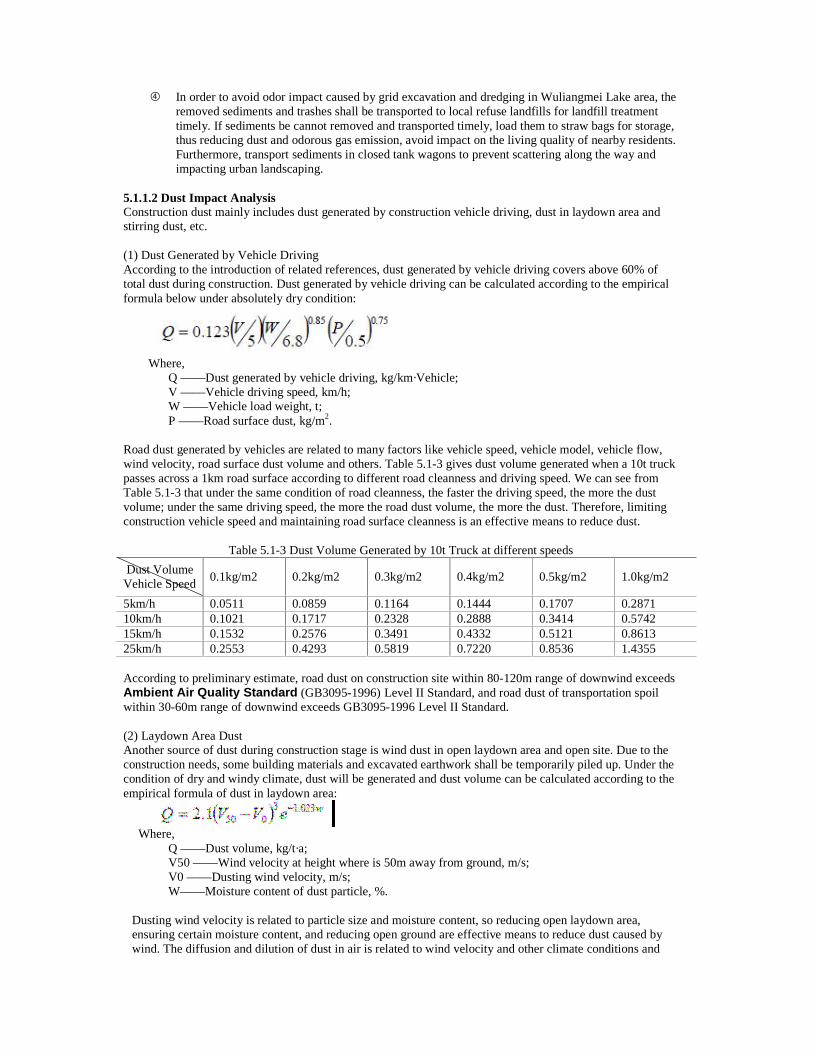
�� In order to avoid odor impact caused by grid excavation and dredging in Wuliangmei Lake area, the removed sediments and trashes shall be transported to local refuse landfills for landfill treatment timely. If sediments be cannot removed and transported timely, load them to straw bags for storage, thus reducing dust and odorous gas emission, avoid impact on the living quality of nearby residents. Furthermore, transport sediments in closed tank wagons to prevent scattering along the way and impacting urban landscaping.
5.1.1.2 Dust Impact Analysis Construction dust mainly includes dust generated by construction vehicle driving, dust in laydown area and stirring dust, etc. (1) Dust Generated by Vehicle Driving According to the introduction of related references, dust generated by vehicle driving covers above 60% of total dust during construction. Dust generated by vehicle driving can be calculated according to the empirical formula below under absolutely dry condition:
Where,
Q ——Dust generated by vehicle driving, kg/km·Vehicle; V ——Vehicle driving speed, km/h; W ——Vehicle load weight, t; P ——Road surface dust, kg/m2.
Road dust generated by vehicles are related to many factors like vehicle speed, vehicle model, vehicle flow, wind velocity, road surface dust volume and others. Table 5.1-3 gives dust volume generated when a 10t truck passes across a 1km road surface according to different road cleanness and driving speed. We can see from Table 5.1-3 that under the same condition of road cleanness, the faster the driving speed, the more the dust volume; under the same driving speed, the more the road dust volume, the more the dust. Therefore, limiting construction vehicle speed and maintaining road surface cleanness is an effective means to reduce dust.
Table 5.1-3 Dust Volume Generated by 10t Truck at different speeds
Dust Volume Vehicle Speed
0.1kg/m2 0.2kg/m2 0.3kg/m2 0.4kg/m2 0.5kg/m2 1.0kg/m2
5km/h 0.0511 0.0859 0.1164 0.1444 0.1707 0.2871 10km/h 0.1021 0.1717 0.2328 0.2888 0.3414 0.5742 15km/h 0.1532 0.2576 0.3491 0.4332 0.5121 0.8613 25km/h 0.2553 0.4293 0.5819 0.7220 0.8536 1.4355 According to preliminary estimate, road dust on construction site within 80-120m range of downwind exceeds Ambient Air Quality Standard (GB3095-1996) Level II Standard, and road dust of transportation spoil within 30-60m range of downwind exceeds GB3095-1996 Level II Standard. (2) Laydown Area Dust Another source of dust during construction stage is wind dust in open laydown area and open site. Due to the construction needs, some building materials and excavated earthwork shall be temporarily piled up. Under the condition of dry and windy climate, dust will be generated and dust volume can be calculated according to the empirical formula of dust in laydown area:
Where,
Q ——Dust volume, kg/t·a; V50 ——Wind velocity at height where is 50m away from ground, m/s; V0 ——Dusting wind velocity, m/s; W——Moisture content of dust particle, %.
Dusting wind velocity is related to particle size and moisture content, so reducing open laydown area, ensuring certain moisture content, and reducing open ground are effective means to reduce dust caused by wind. The diffusion and dilution of dust in air is related to wind velocity and other climate conditions and
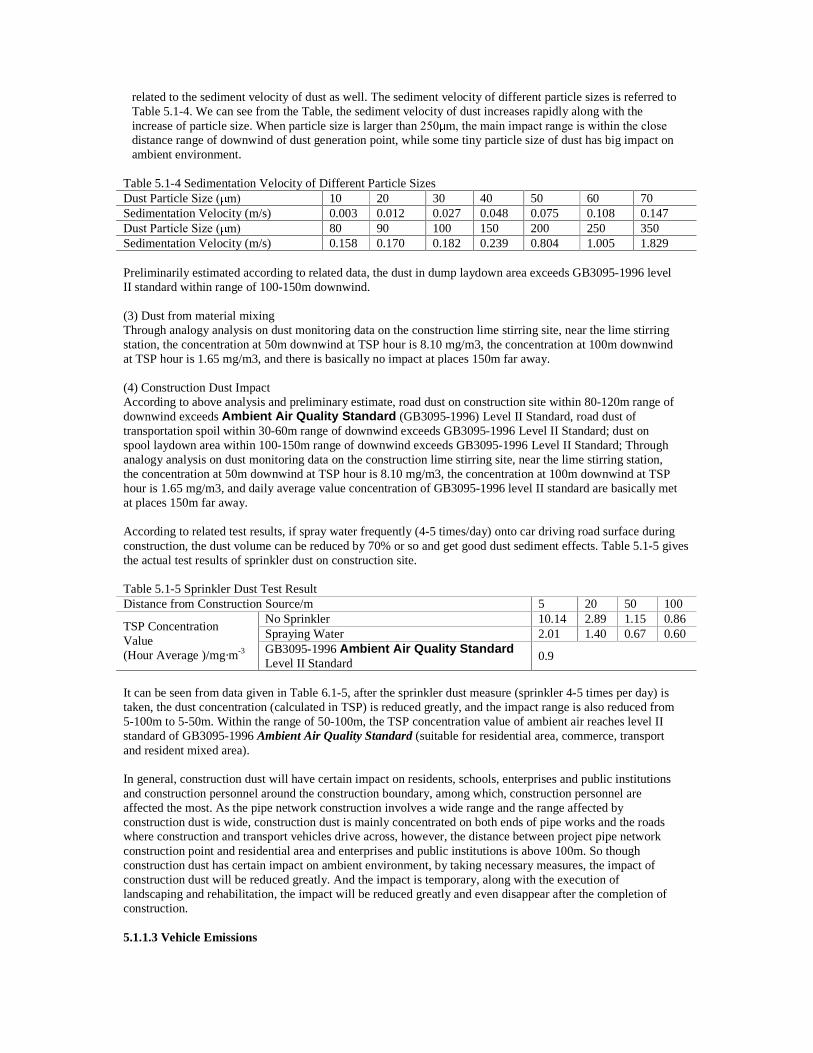
related to the sediment velocity of dust as well. The sediment velocity of different particle sizes is referred to Table 5.1-4. We can see from the Table, the sediment velocity of dust increases rapidly along with the increase of particle size. When particle size is larger than 250 m, the main impact range is within the close distance range of downwind of dust generation point, while some tiny particle size of dust has big impact on ambient environment.
Table 5.1-4 Sedimentation Velocity of Different Particle Sizes Dust Particle Size ( m) 10 20 30 40 50 60 70 Sedimentation Velocity (m/s) 0.003 0.012 0.027 0.048 0.075 0.108 0.147 Dust Particle Size ( m) 80 90 100 150 200 250 350 Sedimentation Velocity (m/s) 0.158 0.170 0.182 0.239 0.804 1.005 1.829 Preliminarily estimated according to related data, the dust in dump laydown area exceeds GB3095-1996 level II standard within range of 100-150m downwind. (3) Dust from material mixing Through analogy analysis on dust monitoring data on the construction lime stirring site, near the lime stirring station, the concentration at 50m downwind at TSP hour is 8.10 mg/m3, the concentration at 100m downwind at TSP hour is 1.65 mg/m3, and there is basically no impact at places 150m far away. (4) Construction Dust Impact According to above analysis and preliminary estimate, road dust on construction site within 80-120m range of downwind exceeds Ambient Air Quality Standard (GB3095-1996) Level II Standard, road dust of transportation spoil within 30-60m range of downwind exceeds GB3095-1996 Level II Standard; dust on spool laydown area within 100-150m range of downwind exceeds GB3095-1996 Level II Standard; Through analogy analysis on dust monitoring data on the construction lime stirring site, near the lime stirring station, the concentration at 50m downwind at TSP hour is 8.10 mg/m3, the concentration at 100m downwind at TSP hour is 1.65 mg/m3, and daily average value concentration of GB3095-1996 level II standard are basically met at places 150m far away. According to related test results, if spray water frequently (4-5 times/day) onto car driving road surface during construction, the dust volume can be reduced by 70% or so and get good dust sediment effects. Table 5.1-5 gives the actual test results of sprinkler dust on construction site. Table 5.1-5 Sprinkler Dust Test Result Distance from Construction Source/m 5 20 50 100
No Sprinkler 10.14 2.89 1.15 0.86 Spraying Water 2.01 1.40 0.67 0.60
TSP Concentration Value (Hour Average )/mg·m-3 GB3095-1996 Ambient Air Quality Standard
Level II Standard 0.9
It can be seen from data given in Table 6.1-5, after the sprinkler dust measure (sprinkler 4-5 times per day) is taken, the dust concentration (calculated in TSP) is reduced greatly, and the impact range is also reduced from 5-100m to 5-50m. Within the range of 50-100m, the TSP concentration value of ambient air reaches level II standard of GB3095-1996 Ambient Air Quality Standard (suitable for residential area, commerce, transport and resident mixed area). In general, construction dust will have certain impact on residents, schools, enterprises and public institutions and construction personnel around the construction boundary, among which, construction personnel are affected the most. As the pipe network construction involves a wide range and the range affected by construction dust is wide, construction dust is mainly concentrated on both ends of pipe works and the roads where construction and transport vehicles drive across, however, the distance between project pipe network construction point and residential area and enterprises and public institutions is above 100m. So though construction dust has certain impact on ambient environment, by taking necessary measures, the impact of construction dust will be reduced greatly. And the impact is temporary, along with the execution of landscaping and rehabilitation, the impact will be reduced greatly and even disappear after the completion of construction. 5.1.1.3 Vehicle Emissions
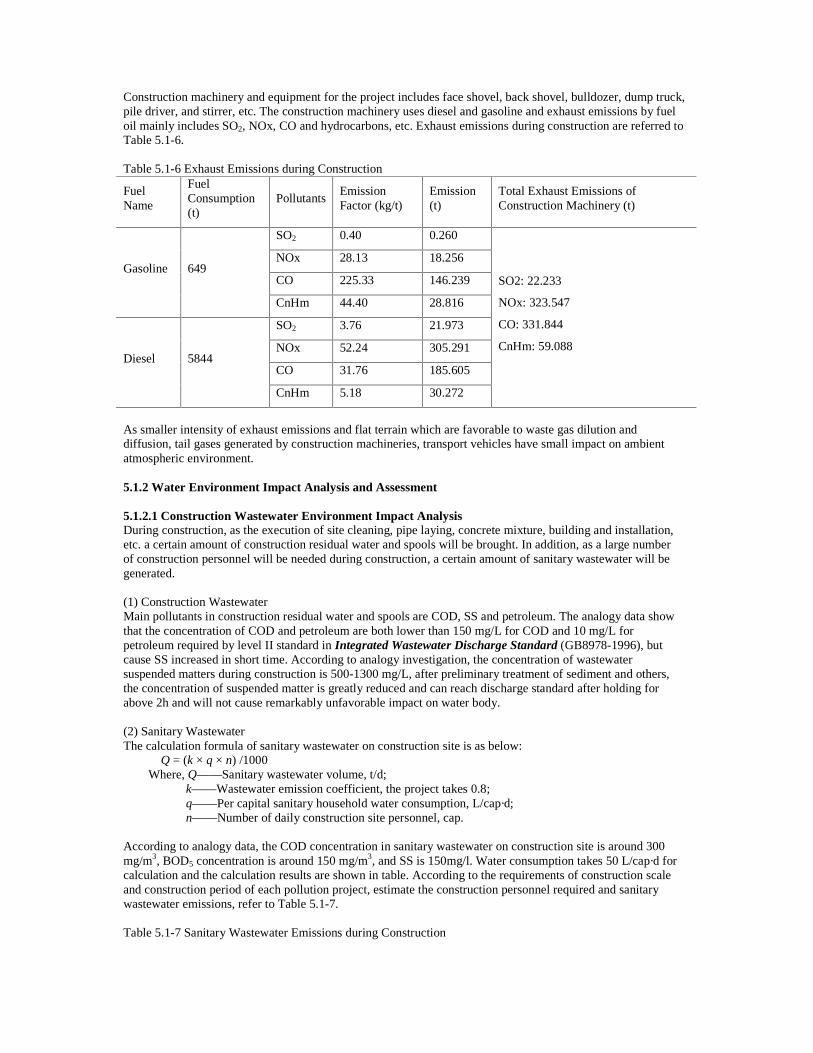
Construction machinery and equipment for the project includes face shovel, back shovel, bulldozer, dump truck, pile driver, and stirrer, etc. The construction machinery uses diesel and gasoline and exhaust emissions by fuel oil mainly includes SO2, NOx, CO and hydrocarbons, etc. Exhaust emissions during construction are referred to Table 5.1-6. Table 5.1-6 Exhaust Emissions during Construction
Fuel Name
Fuel Consumption (t)
Pollutants Emission Factor (kg/t)
Emission (t)
Total Exhaust Emissions of Construction Machinery (t)
SO2 0.40 0.260
NOx 28.13 18.256
CO 225.33 146.239 Gasoline 649
CnHm 44.40 28.816
SO2 3.76 21.973
NOx 52.24 305.291
CO 31.76 185.605 Diesel 5844
CnHm 5.18 30.272
SO2: 22.233
NOx: 323.547
CO: 331.844
CnHm: 59.088
As smaller intensity of exhaust emissions and flat terrain which are favorable to waste gas dilution and diffusion, tail gases generated by construction machineries, transport vehicles have small impact on ambient atmospheric environment. 5.1.2 Water Environment Impact Analysis and Assessment 5.1.2.1 Construction Wastewater Environment Impact Analysis During construction, as the execution of site cleaning, pipe laying, concrete mixture, building and installation, etc. a certain amount of construction residual water and spools will be brought. In addition, as a large number of construction personnel will be needed during construction, a certain amount of sanitary wastewater will be generated. (1) Construction Wastewater Main pollutants in construction residual water and spools are COD, SS and petroleum. The analogy data show that the concentration of COD and petroleum are both lower than 150 mg/L for COD and 10 mg/L for petroleum required by level II standard in Integrated Wastewater Discharge Standard (GB8978-1996), but cause SS increased in short time. According to analogy investigation, the concentration of wastewater suspended matters during construction is 500-1300 mg/L, after preliminary treatment of sediment and others, the concentration of suspended matter is greatly reduced and can reach discharge standard after holding for above 2h and will not cause remarkably unfavorable impact on water body. (2) Sanitary Wastewater The calculation formula of sanitary wastewater on construction site is as below:
Q = (k × q × n) /1000 Where, Q——Sanitary wastewater volume, t/d;
k——Wastewater emission coefficient, the project takes 0.8; q——Per capital sanitary household water consumption, L/cap·d; n——Number of daily construction site personnel, cap.
According to analogy data, the COD concentration in sanitary wastewater on construction site is around 300 mg/m3, BOD5 concentration is around 150 mg/m3, and SS is 150mg/l. Water consumption takes 50 L/cap·d for calculation and the calculation results are shown in table. According to the requirements of construction scale and construction period of each pollution project, estimate the construction personnel required and sanitary wastewater emissions, refer to Table 5.1-7. Table 5.1-7 Sanitary Wastewater Emissions during Construction
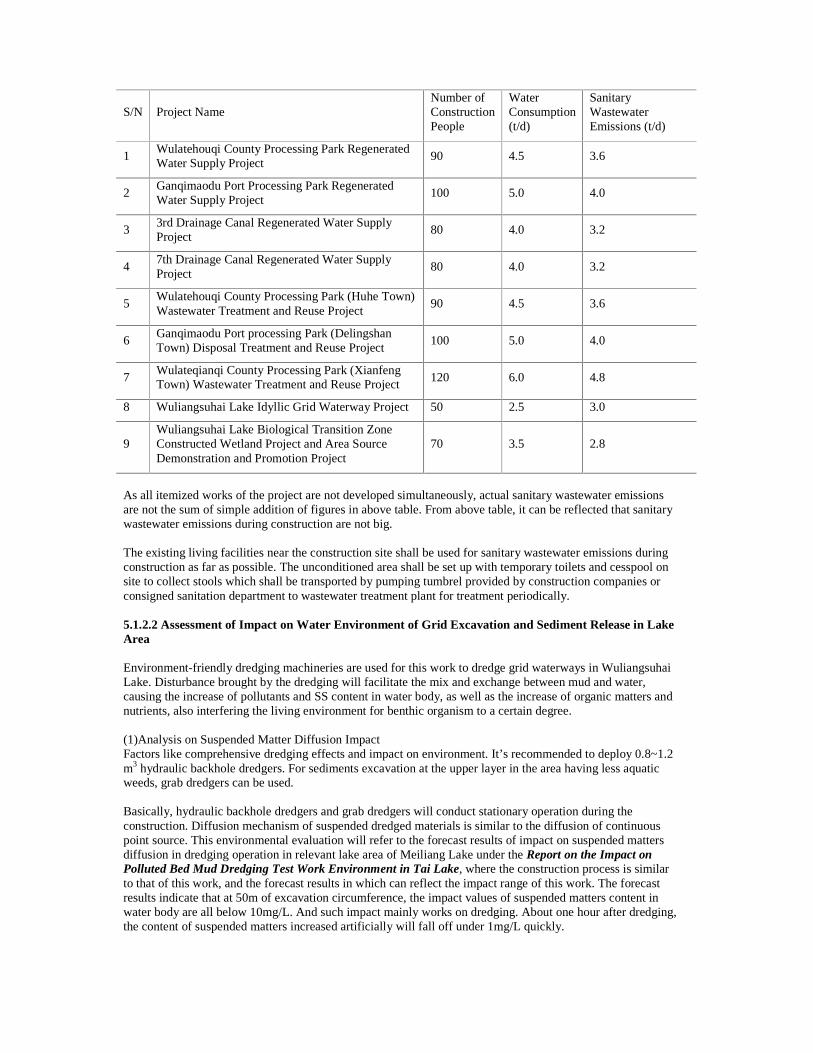
S/N Project Name Number of Construction People
Water Consumption (t/d)
Sanitary Wastewater Emissions (t/d)
1 Wulatehouqi County Processing Park Regenerated Water Supply Project
90 4.5 3.6
2 Ganqimaodu Port Processing Park Regenerated Water Supply Project
100 5.0 4.0
3 3rd Drainage Canal Regenerated Water Supply Project
80 4.0 3.2
4 7th Drainage Canal Regenerated Water Supply Project
80 4.0 3.2
5 Wulatehouqi County Processing Park (Huhe Town) Wastewater Treatment and Reuse Project
90 4.5 3.6
6 Ganqimaodu Port processing Park (Delingshan Town) Disposal Treatment and Reuse Project
100 5.0 4.0
7 Wulateqianqi County Processing Park (Xianfeng Town) Wastewater Treatment and Reuse Project
120 6.0 4.8
8 Wuliangsuhai Lake Idyllic Grid Waterway Project 50 2.5 3.0
9 Wuliangsuhai Lake Biological Transition Zone Constructed Wetland Project and Area Source Demonstration and Promotion Project
70 3.5 2.8
As all itemized works of the project are not developed simultaneously, actual sanitary wastewater emissions are not the sum of simple addition of figures in above table. From above table, it can be reflected that sanitary wastewater emissions during construction are not big. The existing living facilities near the construction site shall be used for sanitary wastewater emissions during construction as far as possible. The unconditioned area shall be set up with temporary toilets and cesspool on site to collect stools which shall be transported by pumping tumbrel provided by construction companies or consigned sanitation department to wastewater treatment plant for treatment periodically. 5.1.2.2 Assessment of Impact on Water Environment of Grid Excavation and Sediment Release in Lake Area Environment-friendly dredging machineries are used for this work to dredge grid waterways in Wuliangsuhai Lake. Disturbance brought by the dredging will facilitate the mix and exchange between mud and water, causing the increase of pollutants and SS content in water body, as well as the increase of organic matters and nutrients, also interfering the living environment for benthic organism to a certain degree. (1)Analysis on Suspended Matter Diffusion Impact Factors like comprehensive dredging effects and impact on environment. It’s recommended to deploy 0.8~1.2 m3 hydraulic backhole dredgers. For sediments excavation at the upper layer in the area having less aquatic weeds, grab dredgers can be used. Basically, hydraulic backhole dredgers and grab dredgers will conduct stationary operation during the construction. Diffusion mechanism of suspended dredged materials is similar to the diffusion of continuous point source. This environmental evaluation will refer to the forecast results of impact on suspended matters diffusion in dredging operation in relevant lake area of Meiliang Lake under the Report on the Impact on Polluted Bed Mud Dredging Test Work Environment in Tai Lake, where the construction process is similar to that of this work, and the forecast results in which can reflect the impact range of this work. The forecast results indicate that at 50m of excavation circumference, the impact values of suspended matters content in water body are all below 10mg/L. And such impact mainly works on dredging. About one hour after dredging, the content of suspended matters increased artificially will fall off under 1mg/L quickly.
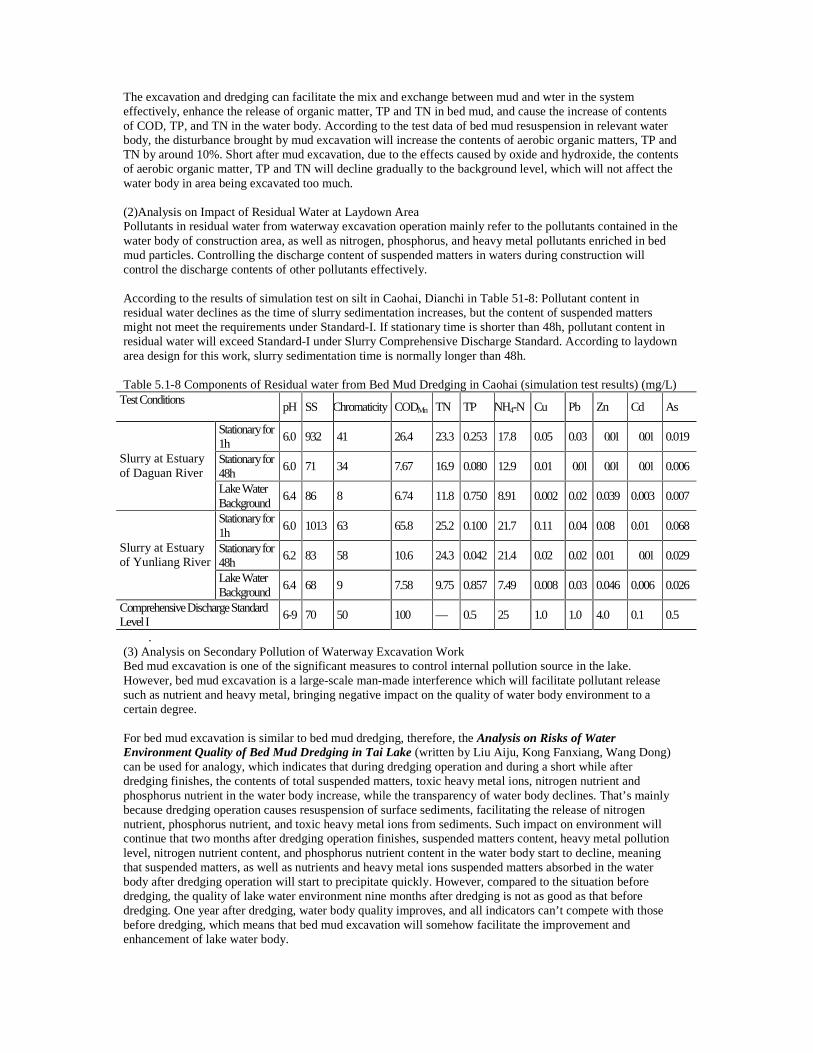
The excavation and dredging can facilitate the mix and exchange between mud and wter in the system effectively, enhance the release of organic matter, TP and TN in bed mud, and cause the increase of contents of COD, TP, and TN in the water body. According to the test data of bed mud resuspension in relevant water body, the disturbance brought by mud excavation will increase the contents of aerobic organic matters, TP and TN by around 10%. Short after mud excavation, due to the effects caused by oxide and hydroxide, the contents of aerobic organic matter, TP and TN will decline gradually to the background level, which will not affect the water body in area being excavated too much. (2)Analysis on Impact of Residual Water at Laydown Area Pollutants in residual water from waterway excavation operation mainly refer to the pollutants contained in the water body of construction area, as well as nitrogen, phosphorus, and heavy metal pollutants enriched in bed mud particles. Controlling the discharge content of suspended matters in waters during construction will control the discharge contents of other pollutants effectively. According to the results of simulation test on silt in Caohai, Dianchi in Table 51-8: Pollutant content in residual water declines as the time of slurry sedimentation increases, but the content of suspended matters might not meet the requirements under Standard-I. If stationary time is shorter than 48h, pollutant content in residual water will exceed Standard-I under Slurry Comprehensive Discharge Standard. According to laydown area design for this work, slurry sedimentation time is normally longer than 48h. Table 5.1-8 Components of Residual water from Bed Mud Dredging in Caohai (simulation test results) (mg/L)
Test Conditions
pH SS Chromaticity CODMn TN TP NH4-N Cu Pb Zn Cd As
Stationary for 1h
6.0 932 41 26.4 23.3 0.253 17.8 0.05 0.03 �0.01 �0.01 0.019
Stationary for 48h
6.0 71 34 7.67 16.9 0.080 12.9 0.01 �0.01 �0.01 �0.01 0.006 Slurry at Estuary of Daguan River
Lake Water Background
6.4 86 8 6.74 11.8 0.750 8.91 0.002 0.02 0.039 0.003 0.007
Stationary for 1h
6.0 1013 63 65.8 25.2 0.100 21.7 0.11 0.04 0.08 0.01 0.068
Stationary for 48h
6.2 83 58 10.6 24.3 0.042 21.4 0.02 0.02 0.01 �0.01 0.029 Slurry at Estuary of Yunliang River
Lake Water Background
6.4 68 9 7.58 9.75 0.857 7.49 0.008 0.03 0.046 0.006 0.026
Comprehensive Discharge Standard Level I
6-9 70 50 100 — 0.5 25 1.0 1.0 4.0 0.1 0.5
. (3) Analysis on Secondary Pollution of Waterway Excavation Work Bed mud excavation is one of the significant measures to control internal pollution source in the lake. However, bed mud excavation is a large-scale man-made interference which will facilitate pollutant release such as nutrient and heavy metal, bringing negative impact on the quality of water body environment to a certain degree. For bed mud excavation is similar to bed mud dredging, therefore, the Analysis on Risks of Water Environment Quality of Bed Mud Dredging in Tai Lake (written by Liu Aiju, Kong Fanxiang, Wang Dong) can be used for analogy, which indicates that during dredging operation and during a short while after dredging finishes, the contents of total suspended matters, toxic heavy metal ions, nitrogen nutrient and phosphorus nutrient in the water body increase, while the transparency of water body declines. That’s mainly because dredging operation causes resuspension of surface sediments, facilitating the release of nitrogen nutrient, phosphorus nutrient, and toxic heavy metal ions from sediments. Such impact on environment will continue that two months after dredging operation finishes, suspended matters content, heavy metal pollution level, nitrogen nutrient content, and phosphorus nutrient content in the water body start to decline, meaning that suspended matters, as well as nutrients and heavy metal ions suspended matters absorbed in the water body after dredging operation will start to precipitate quickly. However, compared to the situation before dredging, the quality of lake water environment nine months after dredging is not as good as that before dredging. One year after dredging, water body quality improves, and all indicators can’t compete with those before dredging, which means that bed mud excavation will somehow facilitate the improvement and enhancement of lake water body.
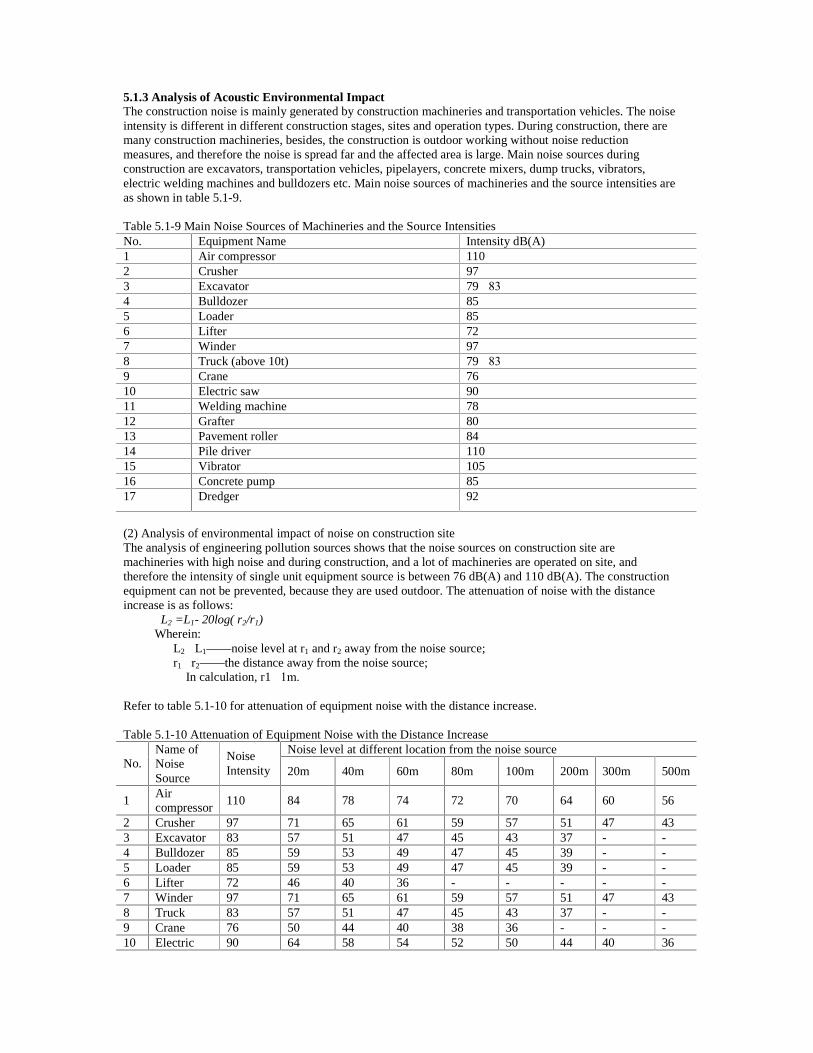
5.1.3 Analysis of Acoustic Environmental Impact The construction noise is mainly generated by construction machineries and transportation vehicles. The noise intensity is different in different construction stages, sites and operation types. During construction, there are many construction machineries, besides, the construction is outdoor working without noise reduction measures, and therefore the noise is spread far and the affected area is large. Main noise sources during construction are excavators, transportation vehicles, pipelayers, concrete mixers, dump trucks, vibrators, electric welding machines and bulldozers etc. Main noise sources of machineries and the source intensities are as shown in table 5.1-9. Table 5.1-9 Main Noise Sources of Machineries and the Source Intensities No. Equipment Name Intensity dB(A) 1 Air compressor 110 2 Crusher 97 3 Excavator 79�83 4 Bulldozer 85 5 Loader 85 6 Lifter 72 7 Winder 97 8 Truck (above 10t) 79�83 9 Crane 76 10 Electric saw 90 11 Welding machine 78 12 Grafter 80 13 Pavement roller 84 14 Pile driver 110 15 Vibrator 105 16 Concrete pump 85 17 Dredger 92
(2) Analysis of environmental impact of noise on construction site The analysis of engineering pollution sources shows that the noise sources on construction site are machineries with high noise and during construction, and a lot of machineries are operated on site, and therefore the intensity of single unit equipment source is between 76 dB(A) and 110 dB(A). The construction equipment can not be prevented, because they are used outdoor. The attenuation of noise with the distance increase is as follows:
L2 =L1- 20log( r2/r1) Wherein:
L2�L1——noise level at r1 and r2 away from the noise source; r1�r2——the distance away from the noise source;
In calculation, r1�1m. Refer to table 5.1-10 for attenuation of equipment noise with the distance increase. Table 5.1-10 Attenuation of Equipment Noise with the Distance Increase
Noise level at different location from the noise source No.
Name of Noise Source
Noise Intensity 20m 40m 60m 80m 100m 200m 300m 500m
1 Air compressor
110 84 78 74 72 70 64 60 56
2 Crusher 97 71 65 61 59 57 51 47 43 3 Excavator 83 57 51 47 45 43 37 - - 4 Bulldozer 85 59 53 49 47 45 39 - - 5 Loader 85 59 53 49 47 45 39 - - 6 Lifter 72 46 40 36 - - - - - 7 Winder 97 71 65 61 59 57 51 47 43 8 Truck 83 57 51 47 45 43 37 - - 9 Crane 76 50 44 40 38 36 - - - 10 Electric 90 64 58 54 52 50 44 40 36
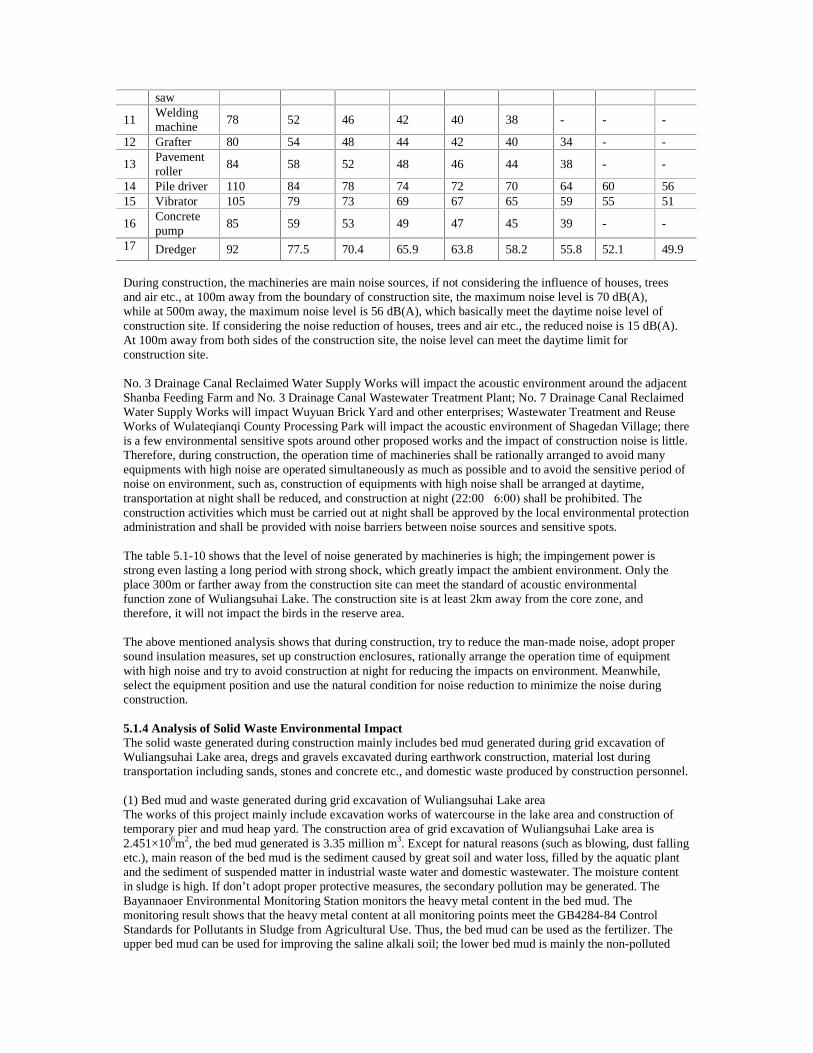
saw
11 Welding machine
78 52 46 42 40 38 - - -
12 Grafter 80 54 48 44 42 40 34 - -
13 Pavement roller
84 58 52 48 46 44 38 - -
14 Pile driver 110 84 78 74 72 70 64 60 56 15 Vibrator 105 79 73 69 67 65 59 55 51
16 Concrete pump
85 59 53 49 47 45 39 - -
17 Dredger 92 77.5 70.4 65.9 63.8 58.2 55.8 52.1 49.9
During construction, the machineries are main noise sources, if not considering the influence of houses, trees and air etc., at 100m away from the boundary of construction site, the maximum noise level is 70 dB(A), while at 500m away, the maximum noise level is 56 dB(A), which basically meet the daytime noise level of construction site. If considering the noise reduction of houses, trees and air etc., the reduced noise is 15 dB(A). At 100m away from both sides of the construction site, the noise level can meet the daytime limit for construction site. No. 3 Drainage Canal Reclaimed Water Supply Works will impact the acoustic environment around the adjacent Shanba Feeding Farm and No. 3 Drainage Canal Wastewater Treatment Plant; No. 7 Drainage Canal Reclaimed Water Supply Works will impact Wuyuan Brick Yard and other enterprises; Wastewater Treatment and Reuse Works of Wulateqianqi County Processing Park will impact the acoustic environment of Shagedan Village; there is a few environmental sensitive spots around other proposed works and the impact of construction noise is little. Therefore, during construction, the operation time of machineries shall be rationally arranged to avoid many equipments with high noise are operated simultaneously as much as possible and to avoid the sensitive period of noise on environment, such as, construction of equipments with high noise shall be arranged at daytime, transportation at night shall be reduced, and construction at night (22:00�6:00) shall be prohibited. The construction activities which must be carried out at night shall be approved by the local environmental protection administration and shall be provided with noise barriers between noise sources and sensitive spots. The table 5.1-10 shows that the level of noise generated by machineries is high; the impingement power is strong even lasting a long period with strong shock, which greatly impact the ambient environment. Only the place 300m or farther away from the construction site can meet the standard of acoustic environmental function zone of Wuliangsuhai Lake. The construction site is at least 2km away from the core zone, and therefore, it will not impact the birds in the reserve area. The above mentioned analysis shows that during construction, try to reduce the man-made noise, adopt proper sound insulation measures, set up construction enclosures, rationally arrange the operation time of equipment with high noise and try to avoid construction at night for reducing the impacts on environment. Meanwhile, select the equipment position and use the natural condition for noise reduction to minimize the noise during construction. 5.1.4 Analysis of Solid Waste Environmental Impact The solid waste generated during construction mainly includes bed mud generated during grid excavation of Wuliangsuhai Lake area, dregs and gravels excavated during earthwork construction, material lost during transportation including sands, stones and concrete etc., and domestic waste produced by construction personnel. (1) Bed mud and waste generated during grid excavation of Wuliangsuhai Lake area The works of this project mainly include excavation works of watercourse in the lake area and construction of temporary pier and mud heap yard. The construction area of grid excavation of Wuliangsuhai Lake area is 2.451×10⁶m2, the bed mud generated is 3.35 million m3. Except for natural reasons (such as blowing, dust falling etc.), main reason of the bed mud is the sediment caused by great soil and water loss, filled by the aquatic plant and the sediment of suspended matter in industrial waste water and domestic wastewater. The moisture content in sludge is high. If don’t adopt proper protective measures, the secondary pollution may be generated. The Bayannaoer Environmental Monitoring Station monitors the heavy metal content in the bed mud. The monitoring result shows that the heavy metal content at all monitoring points meet the GB4284-84 Control Standards for Pollutants in Sludge from Agricultural Use. Thus, the bed mud can be used as the fertilizer. The upper bed mud can be used for improving the saline alkali soil; the lower bed mud is mainly the non-polluted

undisturbed soil about 2.17 million m3, and used for building the artificial island in the lake area. The lower bed mud is consumed internally and not transported outside. In accordance with the tourism planning of Wuliangsuhai Lake, many artificial islands shall be constructed in the lake area. (2) Spoil During construction, spoil will be generated from the earth excavation. During transportation and disposal, the spoil may impact the environment. Based on the estimation, earth in all works of this project is basically balanced without shortage of soil. But the construction of water supply and distribution pipeline network will generate the spoil. During pipe-laying, the soil generated during pipe trench excavation is heaped at one side of the pipe trench. At the bottom of the trench, firstly fill the foundation stuffing with the thickness of 400mm and then laying the pipeline. Therefore, the works spoil volume is at least equal to addition of pipeline volume and volume of foundation depth. In accordance with the estimation of pipeline work earth volume, the spoil volume of works lines of this project is as shown in table 5.1-11. Table 5.1-11 Spoil Volume of Works Lines
No. Works Name Length of the Water Supply and Distribution Pipeline Network (km)
Spoil Volume (m3)
1 Wulatehouqi County Processing Park Reclaimed Water Supply Works
35.5(500) 14066.88
2 Ganqimaodu Port Processing Park Reclaimed Water Supply Works
28.0(600) 14632.8
3 No. 3 Drainage Canal Reclaimed Water Supply Works 11.6(300) 2211.54 4 No. 7 Drainage Canal Reclaimed Water Supply Works 11.8(700) 7842.87
5 Wulatehouqi County Processing Park (Huhe Town) Wastewater Treatment Reuse Works
67.6(400) 19306.56
6 Ganqimaodu Port Processing Park (Delingshan Town) Wastewater Treatment Reuse Works
45.08(400) 12874.85
7 Wulateqianqi County Processing Park (Xianfeng Town) Wastewater Treatment Reuse Works
32.4(530) 14013.21
8 Wuliangsuhai Lake Ruralized Grid Watercourse Works —— ——
9 Wuliangsuhai Lake Bio-transition Zone Artificial Wetland and Non-point Source Pollution Control Demonstration Promotion Works
—— 1118223
(3) Construction Waste The construction waste will be generated due to consumption and desertion of stones, clinkers and building materials during construction of all works. If the construction waste is not be handled promptly, it is not only unsightly and influence the landscape of the city, but also be blown to generate the dust raise phenomenon in gale and dry weather. The soil and construction waste of the works transported outward is common solid waste without the toxic and harmful content. The waste can be used for filling the foundation of construction works specified by the municipal and planning departments, filling the swag or greening along the river for disposal. Rest waste can be delivered to local landfill site. Generally, disposal of the discard will not take the adverse impact on environment. (4) Domestic Waste In accordance with that the construction period is 36 months and the waste is 1.16kg/person·d, the domestic waste volume during construction period of all works is as shown in table 5.1-12. The total domestic waste output during construction is 977.4t which is delivered to the site specified by Environmental Sanitation Administration for disposal. Table 5.1-12 Domestic Waste Volume during Construction of All Works
No. Works name Number of constructor
Domestic waste volume (t/d)
Total domestic waste volume (t)
1 Wulatehouqi County Processing Park Reclaimed Water 90 0.10 108.0
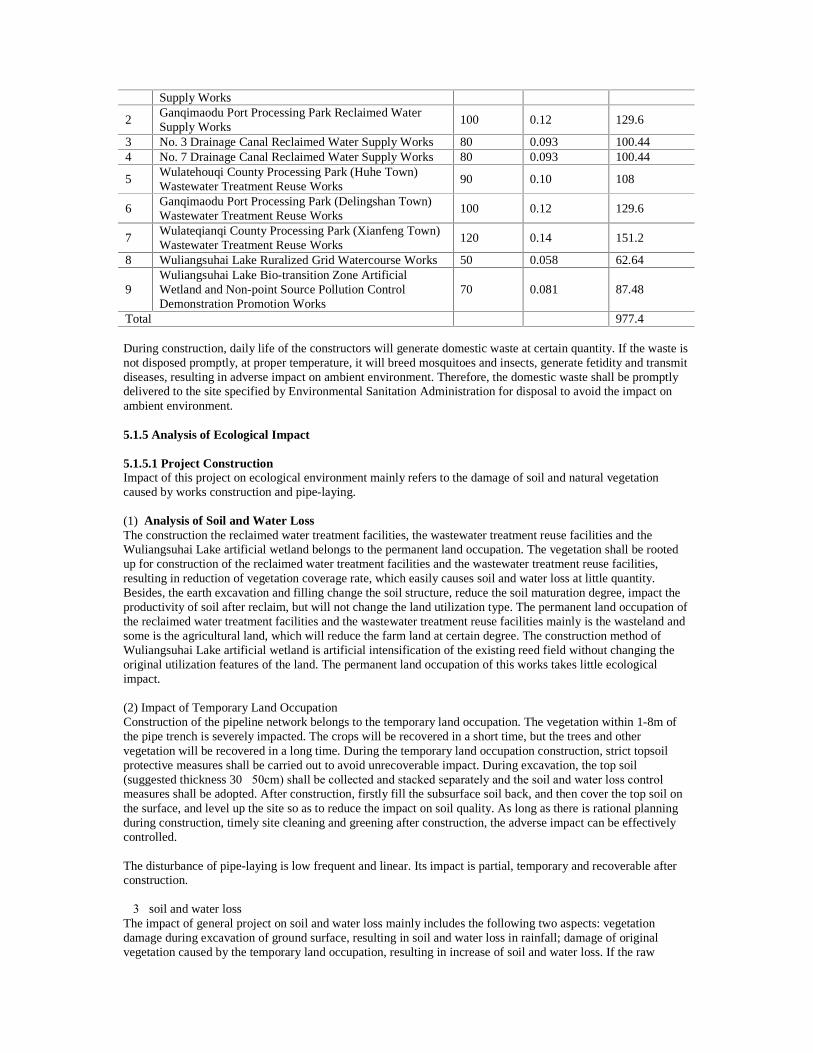
Supply Works
2 Ganqimaodu Port Processing Park Reclaimed Water Supply Works
100 0.12 129.6
3 No. 3 Drainage Canal Reclaimed Water Supply Works 80 0.093 100.44 4 No. 7 Drainage Canal Reclaimed Water Supply Works 80 0.093 100.44
5 Wulatehouqi County Processing Park (Huhe Town) Wastewater Treatment Reuse Works
90 0.10 108
6 Ganqimaodu Port Processing Park (Delingshan Town) Wastewater Treatment Reuse Works
100 0.12 129.6
7 Wulateqianqi County Processing Park (Xianfeng Town) Wastewater Treatment Reuse Works
120 0.14 151.2
8 Wuliangsuhai Lake Ruralized Grid Watercourse Works 50 0.058 62.64
9 Wuliangsuhai Lake Bio-transition Zone Artificial Wetland and Non-point Source Pollution Control Demonstration Promotion Works
70 0.081 87.48
Total 977.4 During construction, daily life of the constructors will generate domestic waste at certain quantity. If the waste is not disposed promptly, at proper temperature, it will breed mosquitoes and insects, generate fetidity and transmit diseases, resulting in adverse impact on ambient environment. Therefore, the domestic waste shall be promptly delivered to the site specified by Environmental Sanitation Administration for disposal to avoid the impact on ambient environment. 5.1.5 Analysis of Ecological Impact 5.1.5.1 Project Construction Impact of this project on ecological environment mainly refers to the damage of soil and natural vegetation caused by works construction and pipe-laying. (1) Analysis of Soil and Water Loss The construction the reclaimed water treatment facilities, the wastewater treatment reuse facilities and the Wuliangsuhai Lake artificial wetland belongs to the permanent land occupation. The vegetation shall be rooted up for construction of the reclaimed water treatment facilities and the wastewater treatment reuse facilities, resulting in reduction of vegetation coverage rate, which easily causes soil and water loss at little quantity. Besides, the earth excavation and filling change the soil structure, reduce the soil maturation degree, impact the productivity of soil after reclaim, but will not change the land utilization type. The permanent land occupation of the reclaimed water treatment facilities and the wastewater treatment reuse facilities mainly is the wasteland and some is the agricultural land, which will reduce the farm land at certain degree. The construction method of Wuliangsuhai Lake artificial wetland is artificial intensification of the existing reed field without changing the original utilization features of the land. The permanent land occupation of this works takes little ecological impact. (2) Impact of Temporary Land Occupation Construction of the pipeline network belongs to the temporary land occupation. The vegetation within 1-8m of the pipe trench is severely impacted. The crops will be recovered in a short time, but the trees and other vegetation will be recovered in a long time. During the temporary land occupation construction, strict topsoil protective measures shall be carried out to avoid unrecoverable impact. During excavation, the top soil (suggested thickness 30�50cm) shall be collected and stacked separately and the soil and water loss control measures shall be adopted. After construction, firstly fill the subsurface soil back, and then cover the top soil on the surface, and level up the site so as to reduce the impact on soil quality. As long as there is rational planning during construction, timely site cleaning and greening after construction, the adverse impact can be effectively controlled. The disturbance of pipe-laying is low frequent and linear. Its impact is partial, temporary and recoverable after construction. �3�soil and water loss The impact of general project on soil and water loss mainly includes the following two aspects: vegetation damage during excavation of ground surface, resulting in soil and water loss in rainfall; damage of original vegetation caused by the temporary land occupation, resulting in increase of soil and water loss. If the raw
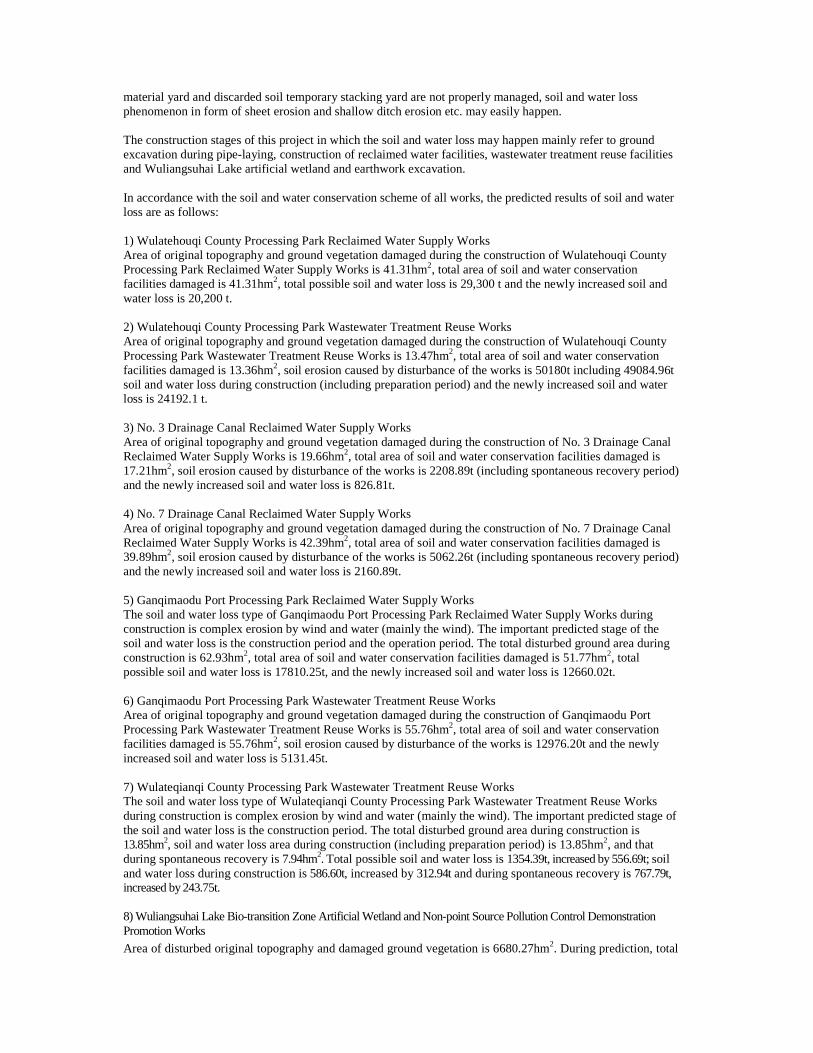
material yard and discarded soil temporary stacking yard are not properly managed, soil and water loss phenomenon in form of sheet erosion and shallow ditch erosion etc. may easily happen. The construction stages of this project in which the soil and water loss may happen mainly refer to ground excavation during pipe-laying, construction of reclaimed water facilities, wastewater treatment reuse facilities and Wuliangsuhai Lake artificial wetland and earthwork excavation. In accordance with the soil and water conservation scheme of all works, the predicted results of soil and water loss are as follows: 1) Wulatehouqi County Processing Park Reclaimed Water Supply Works Area of original topography and ground vegetation damaged during the construction of Wulatehouqi County Processing Park Reclaimed Water Supply Works is 41.31hm2, total area of soil and water conservation facilities damaged is 41.31hm2, total possible soil and water loss is 29,300 t and the newly increased soil and water loss is 20,200 t. 2) Wulatehouqi County Processing Park Wastewater Treatment Reuse Works Area of original topography and ground vegetation damaged during the construction of Wulatehouqi County Processing Park Wastewater Treatment Reuse Works is 13.47hm2, total area of soil and water conservation facilities damaged is 13.36hm2, soil erosion caused by disturbance of the works is 50180t including 49084.96t soil and water loss during construction (including preparation period) and the newly increased soil and water loss is 24192.1 t. 3) No. 3 Drainage Canal Reclaimed Water Supply Works Area of original topography and ground vegetation damaged during the construction of No. 3 Drainage Canal Reclaimed Water Supply Works is 19.66hm2, total area of soil and water conservation facilities damaged is 17.21hm2, soil erosion caused by disturbance of the works is 2208.89t (including spontaneous recovery period) and the newly increased soil and water loss is 826.81t. 4) No. 7 Drainage Canal Reclaimed Water Supply Works Area of original topography and ground vegetation damaged during the construction of No. 7 Drainage Canal Reclaimed Water Supply Works is 42.39hm2, total area of soil and water conservation facilities damaged is 39.89hm2, soil erosion caused by disturbance of the works is 5062.26t (including spontaneous recovery period) and the newly increased soil and water loss is 2160.89t. 5) Ganqimaodu Port Processing Park Reclaimed Water Supply Works The soil and water loss type of Ganqimaodu Port Processing Park Reclaimed Water Supply Works during construction is complex erosion by wind and water (mainly the wind). The important predicted stage of the soil and water loss is the construction period and the operation period. The total disturbed ground area during construction is 62.93hm2, total area of soil and water conservation facilities damaged is 51.77hm2, total possible soil and water loss is 17810.25t, and the newly increased soil and water loss is 12660.02t. 6) Ganqimaodu Port Processing Park Wastewater Treatment Reuse Works Area of original topography and ground vegetation damaged during the construction of Ganqimaodu Port Processing Park Wastewater Treatment Reuse Works is 55.76hm2, total area of soil and water conservation facilities damaged is 55.76hm2, soil erosion caused by disturbance of the works is 12976.20t and the newly increased soil and water loss is 5131.45t. 7) Wulateqianqi County Processing Park Wastewater Treatment Reuse Works The soil and water loss type of Wulateqianqi County Processing Park Wastewater Treatment Reuse Works during construction is complex erosion by wind and water (mainly the wind). The important predicted stage of the soil and water loss is the construction period. The total disturbed ground area during construction is 13.85hm2, soil and water loss area during construction (including preparation period) is 13.85hm2, and that during spontaneous recovery is 7.94hm2. Total possible soil and water loss is 1354.39t, increased by 556.69t; soil and water loss during construction is 586.60t, increased by 312.94t and during spontaneous recovery is 767.79t, increased by 243.75t. 8) Wuliangsuhai Lake Bio-transition Zone Artificial Wetland and Non-point Source Pollution Control Demonstration Promotion Works
Area of disturbed original topography and damaged ground vegetation is 6680.27hm2. During prediction, total

soil and water loss caused by the works is 6239.80t including 4161.50t during construction and 2078.30t during spontaneous recovery, and the newly increased soil and water loss is 2312.80t.
9) Wuliangsuhai Lake Grid Watercourse Works In accordance with the prediction, area of original topography and ground vegetation damaged during the construction of this works is 688.47hm2, total area of soil and water conservation facilities damaged is 3.87hm2, soil erosion caused by disturbance of the works is 58016.64t including 20152.84t during preparation and construction and 37863.8t during spontaneous recovery; the newly increased soil and water loss is 33760.27t including 14127.17t during preparation and construction and 19633.1t during recovery. The soil and water loss of all works is as shown in table 5.1-13. Table 5.1-13 The Soil and Water Loss of All Works
No. Works name Soil and water loss volume (104t)
1 Wulatehouqi County Processing Park Reclaimed Water Supply Works
2.93
2 Ganqimaodu Port Processing Park Reclaimed Water Supply Works
1.78
3 No. 3 Drainage Canal Reclaimed Water Supply Works 0.22 4 No. 7 Drainage Canal Reclaimed Water Supply Works 0.51
5 Wulatehouqi County Processing Park (Huhe Town) Wastewater Treatment Reuse Works
4.91
6 Ganqimaodu Port Processing Park (Delingshan Town) Wastewater Treatment Reuse Works
1.3
7 Wulateqianqi County Processing Park (Xianfeng Town) Wastewater Treatment Reuse Works
0.14
8 Wuliangsuhai Lake Bio-transition Zone Artificial Wetland and Non-point Source Pollution Control Demonstration Promotion Works
0.62
9 Wuliangsuhai Lake Grid Watercourse Works 1.41 5.1.5.2 Impact on Landscape Ecology The coverage of this project is large. During the construction of pipeline network and lake area treatment works, the excavation and soil stacking will make the pipeline network laying area in disorder. Although there is the disclosure, the construction site will make the disorder impression; the spill of discarded soil during outward transportation will not only dirty the roads and but also raise the dusts, which will take adverse impact on surrounding landscape. Therefore, the cleaning work on construction site is very important. The impact on landscape during construction is short-term and recoverable. 5.1.5.3 Impact of Wuliangsuhai Lake Pollution Control Works in Construction Stage 1) Wuliangsuhai Lake Grid Watercourse Excavation Works Suspended matters generated during grid watercourse construction will form a high density distributed zone around the construction site, resulting in species and quantity reduction of plankton and zooplankton. However, this impact is reversible. After completion of the works, the impact will eliminate soon. The disturbance of construction of grid watercourse on benthonic habitat will cause damage of habitat for zoobenthos, resulting in stable reduction of biocoenosis structure. Noise and air pollution generated by the construction of grid watercourse will take impact on birds and reduce the species and quantity of plankton and zooplankton, resulting in impact on wading birds. The mud yard and hydraulic fill works will damage original terrestrial vegetation, resulting in the loss of vegetation in species and quantity. 2) Wuliangsuhai Lake Artificial Wetland Works Impact of the works on vegetation mainly refers to the damage of reed caused by land occupation. During construction, channel dredge and trench excavation excavate the subsoil out, which totally change the soil mass structure. During construction, vegetation on the excavation area is all damaged, and the vegetation at both sides of the trench is damaged and impacted at different degree; in the area with severe damage, not only the vegetation but also the soil is damaged, which will impact the further growth of vegetation; in moderate
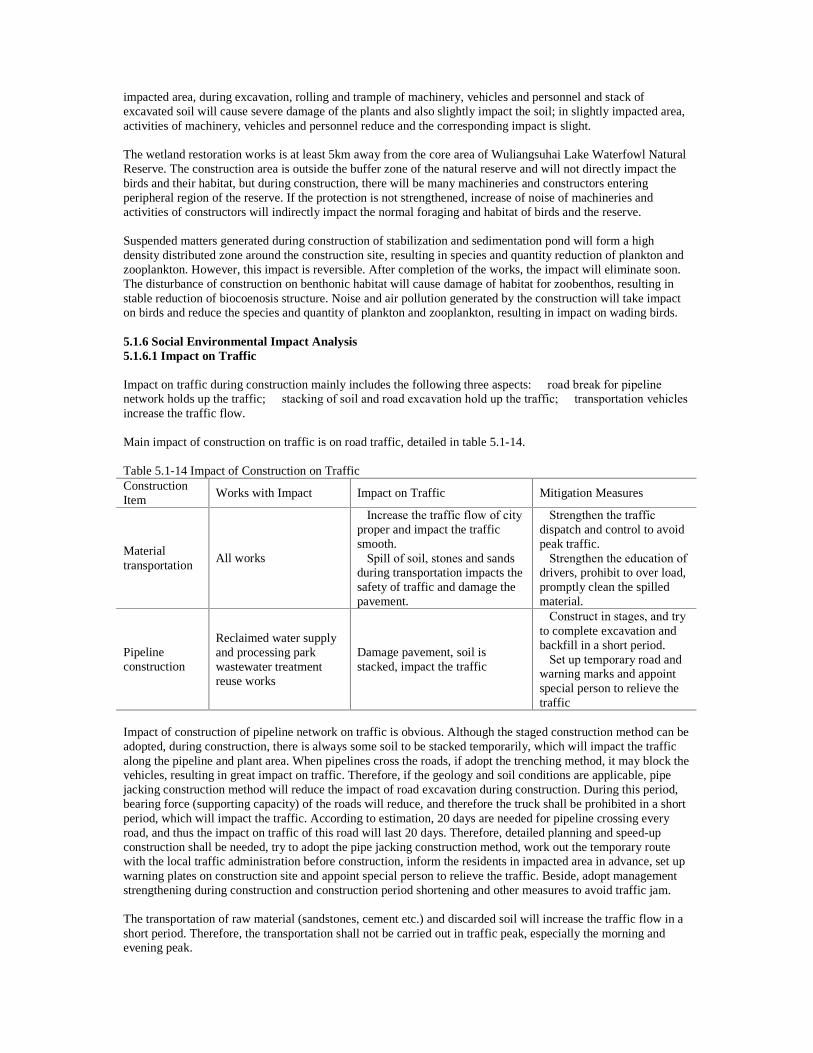
impacted area, during excavation, rolling and trample of machinery, vehicles and personnel and stack of excavated soil will cause severe damage of the plants and also slightly impact the soil; in slightly impacted area, activities of machinery, vehicles and personnel reduce and the corresponding impact is slight. The wetland restoration works is at least 5km away from the core area of Wuliangsuhai Lake Waterfowl Natural Reserve. The construction area is outside the buffer zone of the natural reserve and will not directly impact the birds and their habitat, but during construction, there will be many machineries and constructors entering peripheral region of the reserve. If the protection is not strengthened, increase of noise of machineries and activities of constructors will indirectly impact the normal foraging and habitat of birds and the reserve. Suspended matters generated during construction of stabilization and sedimentation pond will form a high density distributed zone around the construction site, resulting in species and quantity reduction of plankton and zooplankton. However, this impact is reversible. After completion of the works, the impact will eliminate soon. The disturbance of construction on benthonic habitat will cause damage of habitat for zoobenthos, resulting in stable reduction of biocoenosis structure. Noise and air pollution generated by the construction will take impact on birds and reduce the species and quantity of plankton and zooplankton, resulting in impact on wading birds. 5.1.6 Social Environmental Impact Analysis 5.1.6.1 Impact on Traffic Impact on traffic during construction mainly includes the following three aspects: � road break for pipeline network holds up the traffic; � stacking of soil and road excavation hold up the traffic; � transportation vehicles increase the traffic flow. Main impact of construction on traffic is on road traffic, detailed in table 5.1-14. Table 5.1-14 Impact of Construction on Traffic Construction Item
Works with Impact Impact on Traffic Mitigation Measures
Material transportation
All works
�Increase the traffic flow of city proper and impact the traffic smooth. �Spill of soil, stones and sands during transportation impacts the safety of traffic and damage the pavement.
�Strengthen the traffic dispatch and control to avoid peak traffic. �Strengthen the education of drivers, prohibit to over load, promptly clean the spilled material.
Pipeline construction
Reclaimed water supply and processing park wastewater treatment reuse works
Damage pavement, soil is stacked, impact the traffic
�Construct in stages, and try to complete excavation and backfill in a short period. �Set up temporary road and warning marks and appoint special person to relieve the traffic
Impact of construction of pipeline network on traffic is obvious. Although the staged construction method can be adopted, during construction, there is always some soil to be stacked temporarily, which will impact the traffic along the pipeline and plant area. When pipelines cross the roads, if adopt the trenching method, it may block the vehicles, resulting in great impact on traffic. Therefore, if the geology and soil conditions are applicable, pipe jacking construction method will reduce the impact of road excavation during construction. During this period, bearing force (supporting capacity) of the roads will reduce, and therefore the truck shall be prohibited in a short period, which will impact the traffic. According to estimation, 20 days are needed for pipeline crossing every road, and thus the impact on traffic of this road will last 20 days. Therefore, detailed planning and speed-up construction shall be needed, try to adopt the pipe jacking construction method, work out the temporary route with the local traffic administration before construction, inform the residents in impacted area in advance, set up warning plates on construction site and appoint special person to relieve the traffic. Beside, adopt management strengthening during construction and construction period shortening and other measures to avoid traffic jam. The transportation of raw material (sandstones, cement etc.) and discarded soil will increase the traffic flow in a short period. Therefore, the transportation shall not be carried out in traffic peak, especially the morning and evening peak.
5.1.6.2 Health and Safety This works includes many works, such as reclaimed water supply works, wastewater treatment reuse works and Wuliangsuhai Lake comprehensive treatment works. The construction sites are in different banners and counties. The works not only includes reclaimed water treatment facilities and wastewater treatment reuse facilities, but also includes pipelines of rainwater, wastewater and reclaimed water, water fetching and supply pump stations, and excavation of Wuliangsuhai Lake grid and artificial wetland construction. Therefore, there are many constructors from all corners of the land and the mobility is strong. Because the construction places and construction sites of all works are not centralized. Living and sanitary conditions are poor and labor intensity is strong, and therefore diseases may be easily transmitted. In order to guarantee the construction safety, complete physical examination shall be carried out for all constructors. Constructors with infectious diseases are prohibited to enter the construction site. Regular physical examination shall be carried out for the personnel in canteen of all works. If the personnel has the infectious disease, the personnel shall be promptly cured and not work in the canteen to prevent the disease transmission. The centralized water supply facilities shall be equipped in each construction site. The water source shall be sterilized and monitored. The construction site shall be provided with the medical facilities. Labor protection measures shall be carried out for constructors to protect their health and safety so as to make the construction smooth.
5.2 Environmental Impact Analysis of Operation Period 5.2.1 Reclaimed Water Supply Works 5.2.1.1 Reclaimed water treating process and pollution factors analysis Treating processes of reclaimed water supply projects are different because of water quality of their sources. Except for the project of Wulatehouqi County Manufacture Park where raw water is only treated by disinfection, the other projects add relative process units like the pre-aeration tank and the RO workshop based on conventional treatment such as coagulation, sedimentation and filtration to guarantee quality of reclaimed water. Refer to Fig. 5.2-1 for treating process of reclaimed water and discharge nodes. Main positions generating and discharging pollutants during operation of the project� (1) Waste gas Waste gases of the reclaimed water supply project are chlorine dioxide G1 leaked from the chlorine dioxide generator that runs with fault; and fugitive emission odor G2 from the sludge pump house, the sludge thickener, sludge dewaterer house and the sludge yard; In addition, the plant with pre-aeration process includes odor gas G3 from the pre-aeration unit. (2) Waste water Waste water of the planned project during operation comes from the reaction sedimentation tank for sludge thickening W1, filter backwashing W2, sludge dewatering and filter pressing W3 and wastewater, containing main pollutants such as SS, CODcr and BOD5. Otherwise, the plants with RO process also include brine W4. (3) Solid waste Sludge S1 is generated by the flocculating tank, sedimentation, filtration sand cylinder, automatic valveless gravity filter and so on. Furthermore, a little domestic garbage. (4) Noise Noise comes from the intake pump house N1, intermediate lift pump house N2, back wash pump house N3, blower house N4, sludge pump house N5 and sludge dewaterer house N6. 5.2.1.2 Pollution source analysis for the project According to intake water quality of the project, dosage, and the principle of material balance, confirm pollution source intensity of each engineering. (1) Waste gas pollution source intensity H2S and NH3 are used as the characteristic pollutants of waste gas for environmental assessment of odor from the plant. The analogy method is used to determine fugitive emission odor pollution source intensity of each engineering, odor emission coefficient of each treating unit can be characterized by emission in unit duration and on unit area. Based on data of Tianjin Jizhuangzi WWTP, Hangzhou Sipu WWTP and Stage I of Shenzhen Baoan Gushu WWTP, determine odorant emission coefficient of each plant in this project, refer to Table 5.2-1. Waste gas source intensity can be estimated according to surface area of designed structures. The feasibility study report does not provide any deodorizing measures, so the bio-deodorization method is recommended to treat main odor pollution source. Refer to Table 5.2-2 for generation of odor pollution source and emission intensity of each plant. Table 5.2-1 Emission coefficient of odor pollutant on unit area of structures at the plant Structure NH3(mg/s.m2) H2S(mg/s.m2) Coarse grille and intake pump house, thin grille and aeration sand tank
0.30 1.39×10⁻³
Sludge tank, sludge bin and sludge thickening and dewatering house 0.10 7.12×10⁻³
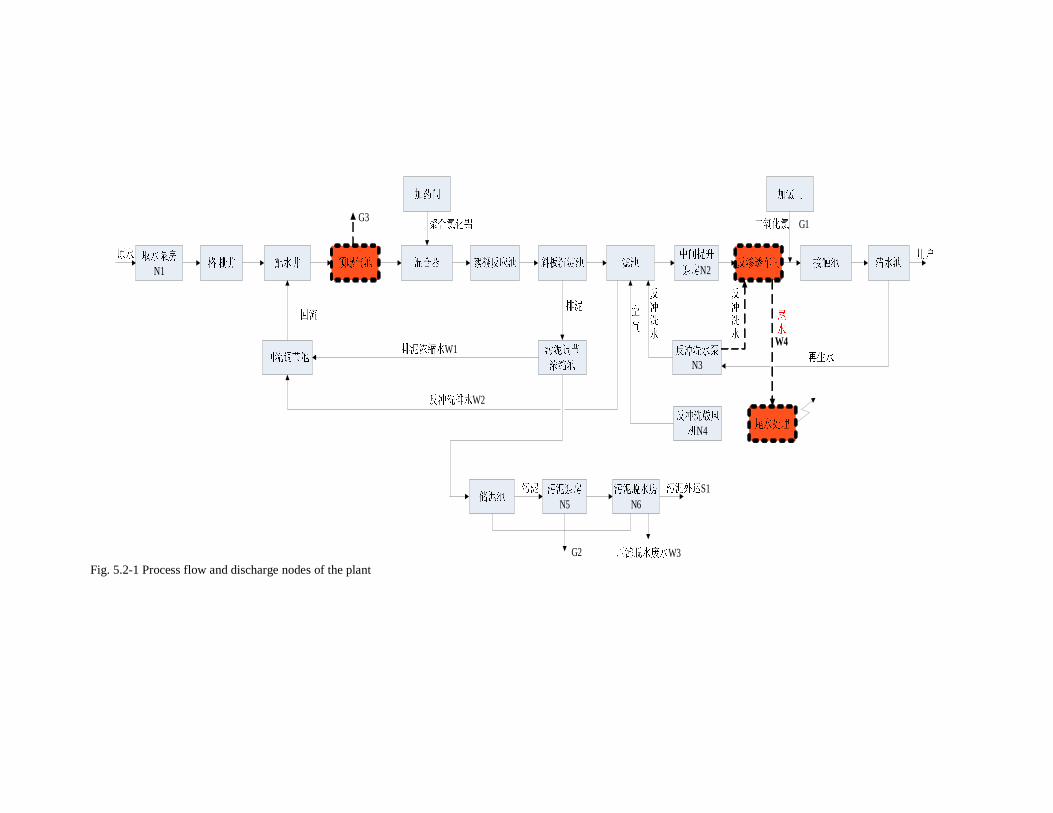
N2
W3
W1
N5 N6S1
N1
N3
N4
W2
W4
G1G3
G2 Fig. 5.2-1 Process flow and discharge nodes of the plant
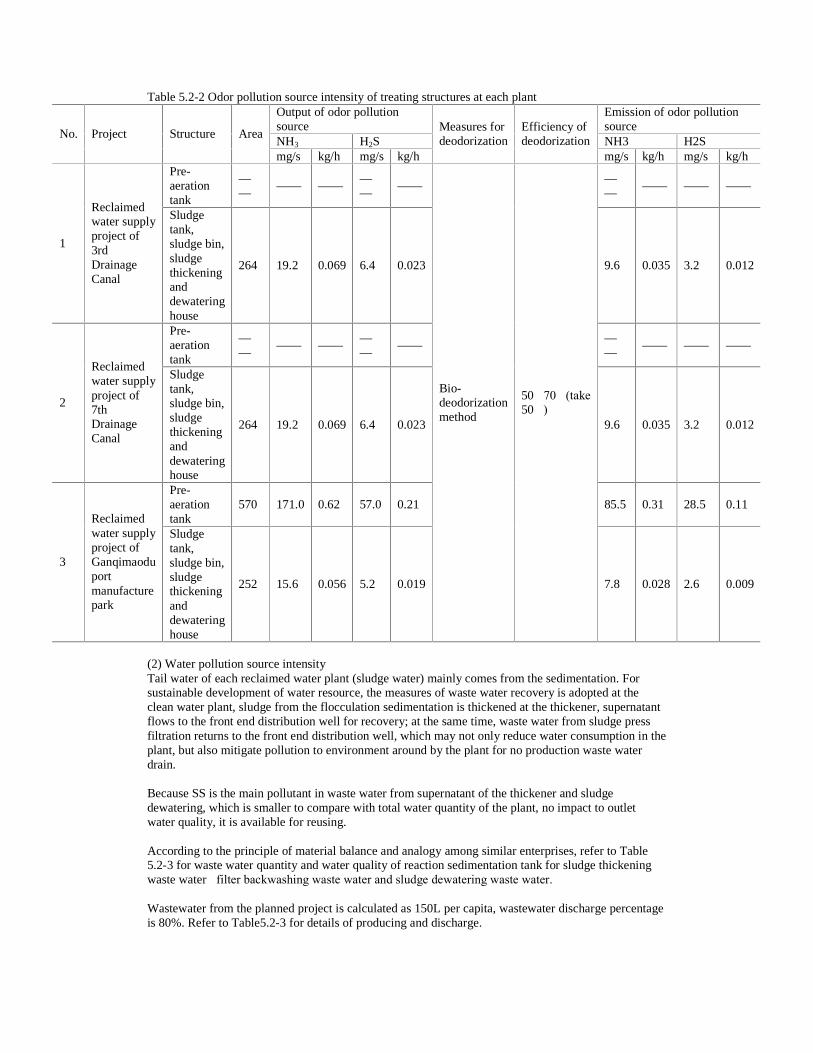
Table 5.2-2 Odor pollution source intensity of treating structures at each plant Output of odor pollution source
Emission of odor pollution source
NH3 H2S NH3 H2S No. Project Structure Area
mg/s kg/h mg/s kg/h
Measures for deodorization
Efficiency of deodorization
mg/s kg/h mg/s kg/h Pre-aeration tank
——
—— —— ——
—— ——
—— —— ——
1
Reclaimed water supply project of 3rd Drainage Canal
Sludge tank, sludge bin, sludge thickening and dewatering house
264 19.2 0.069 6.4 0.023 9.6 0.035 3.2 0.012
Pre-aeration tank
——
—— —— ——
—— ——
—— —— ——
2
Reclaimed water supply project of 7th Drainage Canal
Sludge tank, sludge bin, sludge thickening and dewatering house
264 19.2 0.069 6.4 0.023 9.6 0.035 3.2 0.012
Pre-aeration tank
570 171.0 0.62 57.0 0.21 85.5 0.31 28.5 0.11
3
Reclaimed water supply project of Ganqimaodu port manufacture park
Sludge tank, sludge bin, sludge thickening and dewatering house
252 15.6 0.056 5.2 0.019
Bio-deodorization method
50�70�(take 50�)
7.8 0.028 2.6 0.009
(2) Water pollution source intensity Tail water of each reclaimed water plant (sludge water) mainly comes from the sedimentation. For sustainable development of water resource, the measures of waste water recovery is adopted at the clean water plant, sludge from the flocculation sedimentation is thickened at the thickener, supernatant flows to the front end distribution well for recovery; at the same time, waste water from sludge press filtration returns to the front end distribution well, which may not only reduce water consumption in the plant, but also mitigate pollution to environment around by the plant for no production waste water drain. Because SS is the main pollutant in waste water from supernatant of the thickener and sludge dewatering, which is smaller to compare with total water quantity of the plant, no impact to outlet water quality, it is available for reusing. According to the principle of material balance and analogy among similar enterprises, refer to Table 5.2-3 for waste water quantity and water quality of reaction sedimentation tank for sludge thickening waste water�filter backwashing waste water and sludge dewatering waste water. Wastewater from the planned project is calculated as 150L per capita, wastewater discharge percentage is 80%. Refer to Table5.2-3 for details of producing and discharge.
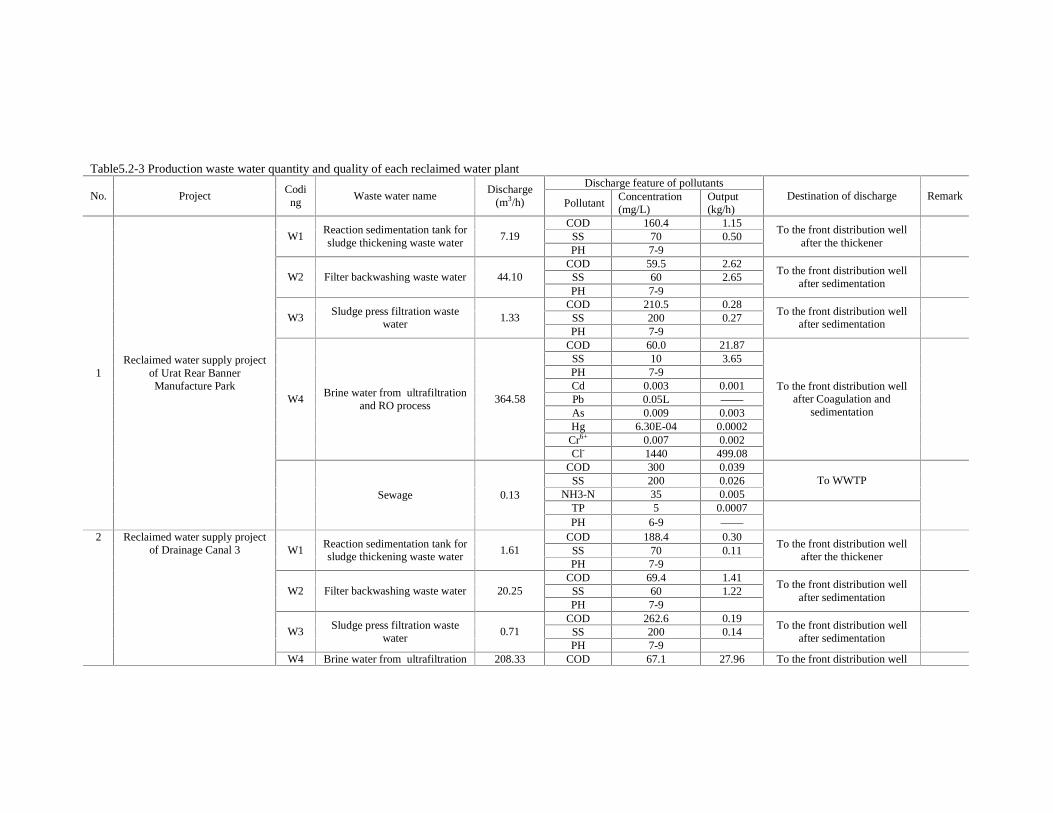
Table5.2-3 Production waste water quantity and quality of each reclaimed water plant
Discharge feature of pollutants No. Project
Coding
Waste water name Discharge
(m3/h) Pollutant Concentration (mg/L)
Output (kg/h)
Destination of discharge Remark
COD 160.4 1.15 SS 70 0.50 W1
Reaction sedimentation tank for sludge thickening waste water
7.19 PH 7-9
To the front distribution well after the thickener
COD 59.5 2.62 SS 60 2.65 W2 Filter backwashing waste water 44.10 PH 7-9
To the front distribution well after sedimentation
COD 210.5 0.28 SS 200 0.27 W3
Sludge press filtration waste water
1.33 PH 7-9
To the front distribution well after sedimentation
COD 60.0 21.87 SS 10 3.65 PH 7-9 Cd 0.003 0.001 Pb 0.05L —— As 0.009 0.003 Hg 6.30E-04 0.0002
Cr6+ 0.007 0.002
W4 Brine water from ultrafiltration
and RO process 364.58
Cl- 1440 499.08
To the front distribution well after Coagulation and
sedimentation
COD 300 0.039 SS 200 0.026
NH3-N 35 0.005 To WWTP
TP 5 0.0007
1 Reclaimed water supply project
of Urat Rear Banner Manufacture Park
Sewage 0.13
PH 6-9 ——
COD 188.4 0.30 SS 70 0.11 W1
Reaction sedimentation tank for sludge thickening waste water
1.61 PH 7-9
To the front distribution well after the thickener
COD 69.4 1.41 SS 60 1.22 W2 Filter backwashing waste water 20.25 PH 7-9
To the front distribution well after sedimentation
COD 262.6 0.19 SS 200 0.14 W3
Sludge press filtration waste water
0.71 PH 7-9
To the front distribution well after sedimentation
2 Reclaimed water supply project of Drainage Canal 3
W4 Brine water from ultrafiltration 208.33 COD 67.1 27.96 To the front distribution well
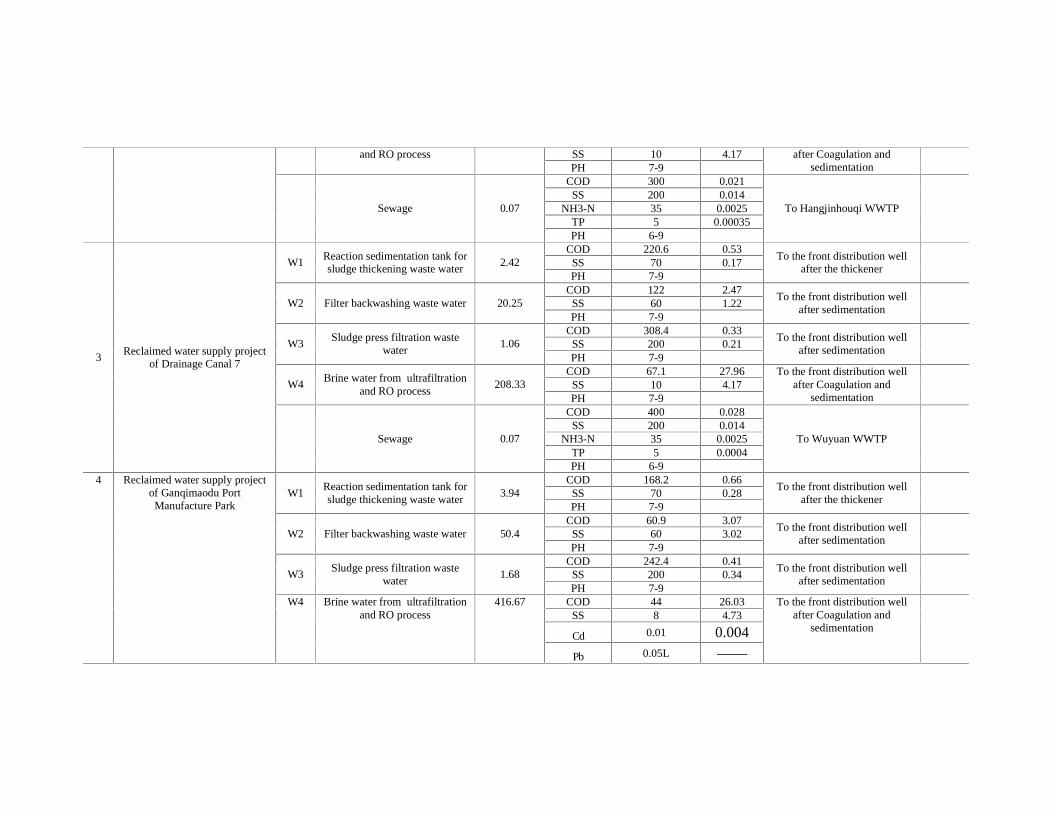
SS 10 4.17 and RO process PH 7-9
after Coagulation and sedimentation
COD 300 0.021 SS 200 0.014
NH3-N 35 0.0025 TP 5 0.00035
Sewage 0.07
PH 6-9
To Hangjinhouqi WWTP
COD 220.6 0.53 SS 70 0.17 W1
Reaction sedimentation tank for sludge thickening waste water
2.42 PH 7-9
To the front distribution well after the thickener
COD 122 2.47 SS 60 1.22 W2 Filter backwashing waste water 20.25 PH 7-9
To the front distribution well after sedimentation
COD 308.4 0.33 SS 200 0.21 W3
Sludge press filtration waste water
1.06 PH 7-9
To the front distribution well after sedimentation
COD 67.1 27.96 SS 10 4.17 W4
Brine water from ultrafiltration and RO process
208.33 PH 7-9
To the front distribution well after Coagulation and
sedimentation
COD 400 0.028 SS 200 0.014
NH3-N 35 0.0025 TP 5 0.0004
3 Reclaimed water supply project
of Drainage Canal 7
Sewage 0.07
PH 6-9
To Wuyuan WWTP
COD 168.2 0.66 SS 70 0.28 W1
Reaction sedimentation tank for sludge thickening waste water
3.94 PH 7-9
To the front distribution well after the thickener
COD 60.9 3.07 SS 60 3.02 W2 Filter backwashing waste water 50.4 PH 7-9
To the front distribution well after sedimentation
COD 242.4 0.41 SS 200 0.34 W3
Sludge press filtration waste water
1.68 PH 7-9
To the front distribution well after sedimentation
COD 44 26.03 SS 8 4.73
Cd 0.01 0.004
4 Reclaimed water supply project of Ganqimaodu Port Manufacture Park
W4 Brine water from ultrafiltration and RO process
416.67
Pb 0.05L ——
To the front distribution well after Coagulation and
sedimentation
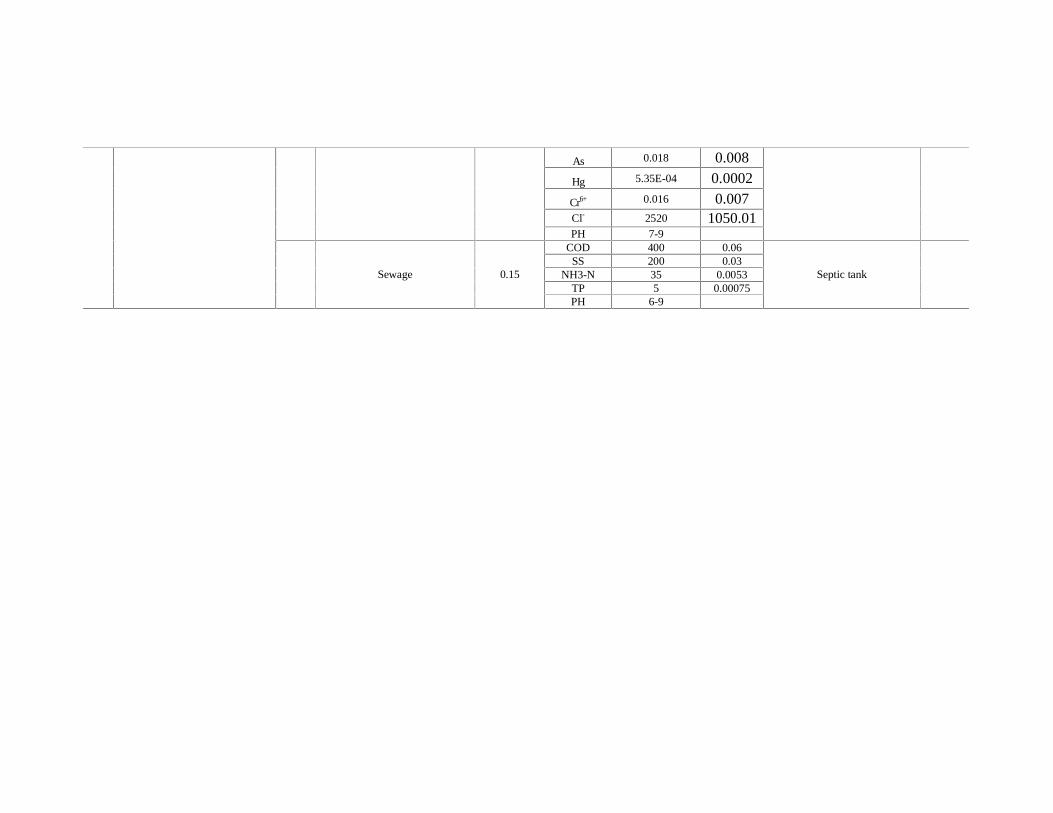
As 0.018 0.008
Hg 5.35E-04 0.0002
Cr6+ 0.016 0.007
Cl- 2520 1050.01
PH 7-9
COD 400 0.06 SS 200 0.03
NH3-N 35 0.0053 TP 5 0.00075
Sewage 0.15
PH 6-9
Septic tank

(3) Noise pollution source intensity Noise of this project comes from various pumps (including the intake pump, rinse pump and lift pump), blower, sludge dewaterer and so on, and noise of mechanical, friction, impacting and so on during their operation, typically noise level is about 95dB (A), and the wall may stop more than 10~20dB (A). Refer to Table 5.2-4 for main noise source and source intensity. Table 5.2-4 Main noise source and source intensity of each plant
No. Main noise sources
Qty.
Noise level (single machine) dB(A)
Workshop (section)
Measures of noise reduction
Effect of noise reduction
1 Intake pump N1
6 95 Intake pump house
Noise reduction 25dB(A)
2 Line lift pump N2
4 95 Lift pump house
Noise reduction 25dB(A)
3 Filter back wash pump N3
2 95 Noise reduction 25dB(A)
4 Filter back wash blower N4
2 110
Back wash comprehensive house Noise reduction
25dB(A)
5 Sludge pump N5
2 95 Noise reduction 25dB(A)
6 Dewatering house press filter N6
2 90
Sludge dewatering house
Measures such as silencing, damping, indoor sound insulation and so on.
Noise reduction 25dB(A)
(4) Solid waste In order to protect surface water bodies and use water resource reasonably, it is necessary to separate solid and liquid of sludge water during operation of the plant. Sludge water drained from the sedimentation should be collected in the balancing tank, and then transport sludge after thickening and dewatering. Filter back wash waste water is drained to the waste water tank and lifted to the front end for reusing by the pump. Solid waste from each plant of the project is mainly sludge after thickening and dewatering and domestic garbage. Sludge quantity of the reclaimed water project is calculated according to SS concentration of inlet water and consumption of flocculant. Sludge is treated by centrifugal dewatering with water content 75%. Since there is no hazard chemicals, no poison, which may be used as cover soil of landfills, backfill soil of municipal road construction and brickmaking. While domestic garbage from the reclaimed water supply projects is calculated as 1.16kg/d·person, which should be collected and delivered to the environmental sanitation administrations. Refer to Table 5.2-5 for solid waste of each reclaimed water supply project. Table 5.2-5 Solid waste of each reclaimed water supply project
No. Project Solid waste
Output (t/a)
Compositions and characters
Water content(%)
Comprehensive utilization and quantity (t/a)
Treatment and quantity (t/a)
Sludge 3066.0 Solid-liquid, innocuity
75.0
To the solid waste treatment center of Wulatehouqi County Manufacture Park
——
1
Reclaimed water supply project of Wulatehouqi County Manufacture Park
Domestic garbage
10.59 Solid, innocuity
—— ——
Clean and landfill by the environmental sanitation administration
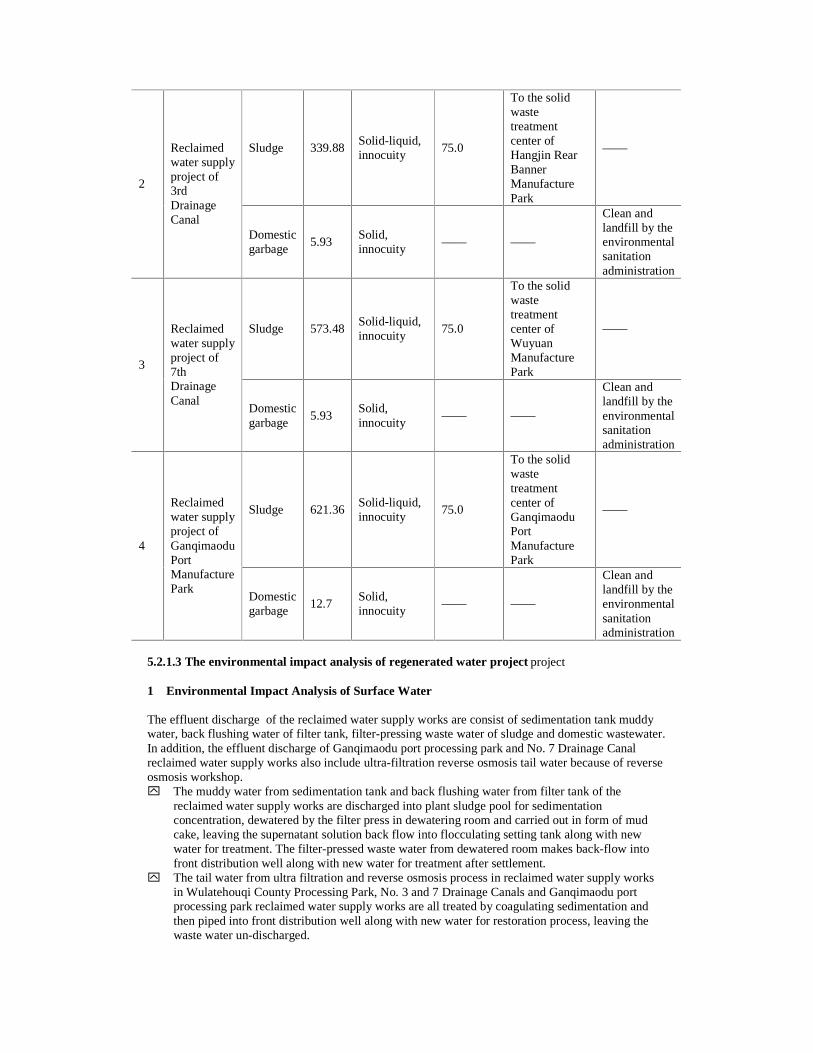
Sludge 339.88 Solid-liquid, innocuity
75.0
To the solid waste treatment center of Hangjin Rear Banner Manufacture Park
——
2
Reclaimed water supply project of 3rd Drainage Canal
Domestic garbage
5.93 Solid, innocuity
—— ——
Clean and landfill by the environmental sanitation administration
Sludge 573.48 Solid-liquid, innocuity
75.0
To the solid waste treatment center of Wuyuan Manufacture Park
——
3
Reclaimed water supply project of 7th Drainage Canal
Domestic garbage
5.93 Solid, innocuity
—— ——
Clean and landfill by the environmental sanitation administration
Sludge 621.36 Solid-liquid, innocuity
75.0
To the solid waste treatment center of Ganqimaodu Port Manufacture Park
——
4
Reclaimed water supply project of Ganqimaodu Port Manufacture Park
Domestic garbage
12.7 Solid, innocuity
—— ——
Clean and landfill by the environmental sanitation administration
5.2.1.3 The environmental impact analysis of regenerated water project project 1� Environmental Impact Analysis of Surface Water The effluent discharge of the reclaimed water supply works are consist of sedimentation tank muddy water, back flushing water of filter tank, filter-pressing waste water of sludge and domestic wastewater. In addition, the effluent discharge of Ganqimaodu port processing park and No. 7 Drainage Canal reclaimed water supply works also include ultra-filtration reverse osmosis tail water because of reverse osmosis workshop. y� The muddy water from sedimentation tank and back flushing water from filter tank of the
reclaimed water supply works are discharged into plant sludge pool for sedimentation concentration, dewatered by the filter press in dewatering room and carried out in form of mud cake, leaving the supernatant solution back flow into flocculating setting tank along with new water for treatment. The filter-pressed waste water from dewatered room makes back-flow into front distribution well along with new water for treatment after settlement.
y� The tail water from ultra filtration and reverse osmosis process in reclaimed water supply works in Wulatehouqi County Processing Park, No. 3 and 7 Drainage Canals and Ganqimaodu port processing park reclaimed water supply works are all treated by coagulating sedimentation and then piped into front distribution well along with new water for restoration process, leaving the waste water un-discharged.

y� The domestic water of this reclaimed water supply works is treated with different methods and ways based on the surrounding infrastructure conditions. The domestic water from Wulatehouqi County processing park reclaimed water supply works will be diverted to its wastewater treatment works for treatment and that of No. 3 and 7 Drainage Canals are diverted to their corresponding Hangjin Rear Banner and Wuyuan County Wastewater Treatment Plants, leaving that of Ganqimaodu Port to be treated by the plant ground-embedded biochemical treatment equipment in accordance with the requirements of The Reuse of Urban Recycling Water.—Water Quality Standard for Miscellaneous Water Consumption (GB/T18920-2002)without drainage.
Therefore, this project has no effluent discharge making no impact on the surface water environment. 2� Environmental Impact Analysis of Waste Gas The reclaimed water supply works will not bear any odor, yet, produce slight odor in the sludge tank, thickener tank and sludge thickening dewatering room. In addition, the reclaimed water supply works of pr-eaeration unit also produces odor. Since the water source of this reclaimed water supply works are inevitable in bringing slight pollution of water. Therefore, the odor is too slight to making environmental hazard. And since the sludge treatment area of this reclaimed water supply works is equally distributed at the down-wind direction of water treatment plant along with green isolated area to separate production and living areas, therefore, waste gas will not have any impact on the plant production and living. 3� Acoustic Environmental Impact Assessment According to the property and environmental characteristics of sound, the corresponding computation schema shall be used to calculate the sound level of sound source for future position. Efforts shall be also made to estimate the acoustic environmental impact of the project after completion. (1)Acoustic Environment Quality Forecast Mode The forecast mode selected based on requirements of acoustic environment assessment guide rules shall be simplified according to concrete conditions. � Octave band pressure level of outdoor point sound source for future position
a. Octave band pressure level of one point sound source for future position
( ) octoctoct LrrrLrL ∆−−= 00 lg20)()(
Among which�Loct(r)——Octave band pressure level of point sound source for future position� Loct(r0)——Octave band pressure level of reference position r0� r——Distance from future position to sound source�m� r0——Distance from reference position to sound source�m�
Loct——Decrement caused by all kinds of factors, including acoustic barrier, air absorption and ground effect.
b. If the octave band pressure level (Lw cot) of sound source is known and considering source is above ground, then Lcot=Lwcot-20lgr0-8
c.Caculaitng the sound level A (LA) of this sound source by all octave band pressure levels�
( )
= ∑
=
∆−n
i
LLA
ipiL1
1.010lg10
Among the formula, li stand for the correction value of weighing networks A. d. Synthesis of sound level of sound sources for future position
= ∑
=
n
i
LTP
piL1
1.010lg10
� Prediction of indoor point sound source
a. Octave band pressure level of sound source for near building enclosure�
++= ⋅ Rr
QLL woct
4
4lg10
21
cot1, π
Among the formula�r1 is the distance from indoors sound source point to building enclosure� R is room constant�
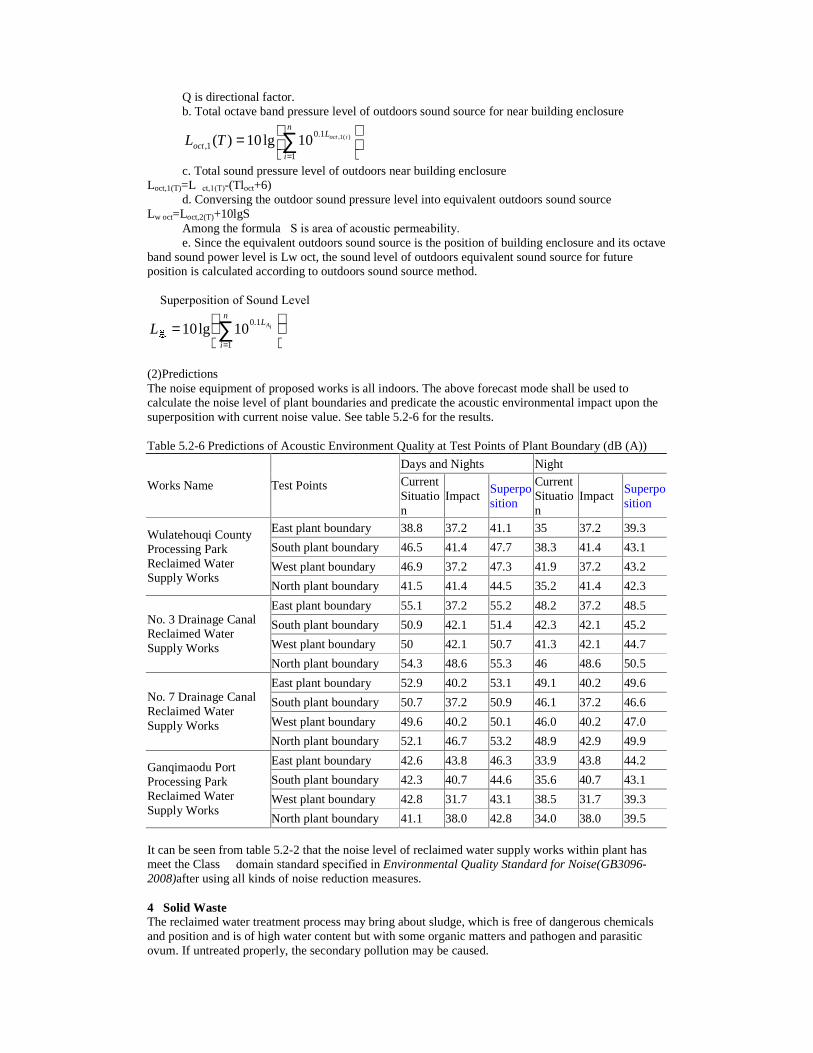
Q is directional factor. b. Total octave band pressure level of outdoors sound source for near building enclosure�
= ∑
=
n
i
Loct
ioctTL1
1.01,
)(1,10lg10)(
c. Total sound pressure level of outdoors near building enclosure� Loct,1(T)=L�ct,1(T)-(Tloct+6)
d. Conversing the outdoor sound pressure level into equivalent outdoors sound source� Lw oct=Loct,2(T)+10lgS
Among the formula�S is area of acoustic permeability. e. Since the equivalent outdoors sound source is the position of building enclosure and its octave
band sound power level is Lw oct, the sound level of outdoors equivalent sound source for future position is calculated according to outdoors sound source method. � Superposition of Sound Level
= ∑
=
n
i
LiAL
1
1.010lg10
(2)Predictions The noise equipment of proposed works is all indoors. The above forecast mode shall be used to calculate the noise level of plant boundaries and predicate the acoustic environmental impact upon the superposition with current noise value. See table 5.2-6 for the results. Table 5.2-6 Predictions of Acoustic Environment Quality at Test Points of Plant Boundary (dB (A))
Days and Nights Night
Works Name Test Points Current Situation
Impact Superposition
Current Situation
Impact Superposition
East plant boundary 38.8 37.2 41.1 35 37.2 39.3
South plant boundary 46.5 41.4 47.7 38.3 41.4 43.1
West plant boundary 46.9 37.2 47.3 41.9 37.2 43.2
Wulatehouqi County Processing Park Reclaimed Water Supply Works
North plant boundary 41.5 41.4 44.5 35.2 41.4 42.3
East plant boundary 55.1 37.2 55.2 48.2 37.2 48.5
South plant boundary 50.9 42.1 51.4 42.3 42.1 45.2
West plant boundary 50 42.1 50.7 41.3 42.1 44.7
No. 3 Drainage Canal Reclaimed Water Supply Works
North plant boundary 54.3 48.6 55.3 46 48.6 50.5
East plant boundary 52.9 40.2 53.1 49.1 40.2 49.6
South plant boundary 50.7 37.2 50.9 46.1 37.2 46.6
West plant boundary 49.6 40.2 50.1 46.0 40.2 47.0
No. 7 Drainage Canal Reclaimed Water Supply Works
North plant boundary 52.1 46.7 53.2 48.9 42.9 49.9
East plant boundary 42.6 43.8 46.3 33.9 43.8 44.2
South plant boundary 42.3 40.7 44.6 35.6 40.7 43.1
West plant boundary 42.8 31.7 43.1 38.5 31.7 39.3
Ganqimaodu Port Processing Park Reclaimed Water Supply Works
North plant boundary 41.1 38.0 42.8 34.0 38.0 39.5 It can be seen from table 5.2-2 that the noise level of reclaimed water supply works within plant has meet the Class � domain standard specified in Environmental Quality Standard for Noise(GB3096-2008)after using all kinds of noise reduction measures. 4�Solid Waste The reclaimed water treatment process may bring about sludge, which is free of dangerous chemicals and position and is of high water content but with some organic matters and pathogen and parasitic ovum. If untreated properly, the secondary pollution may be caused.
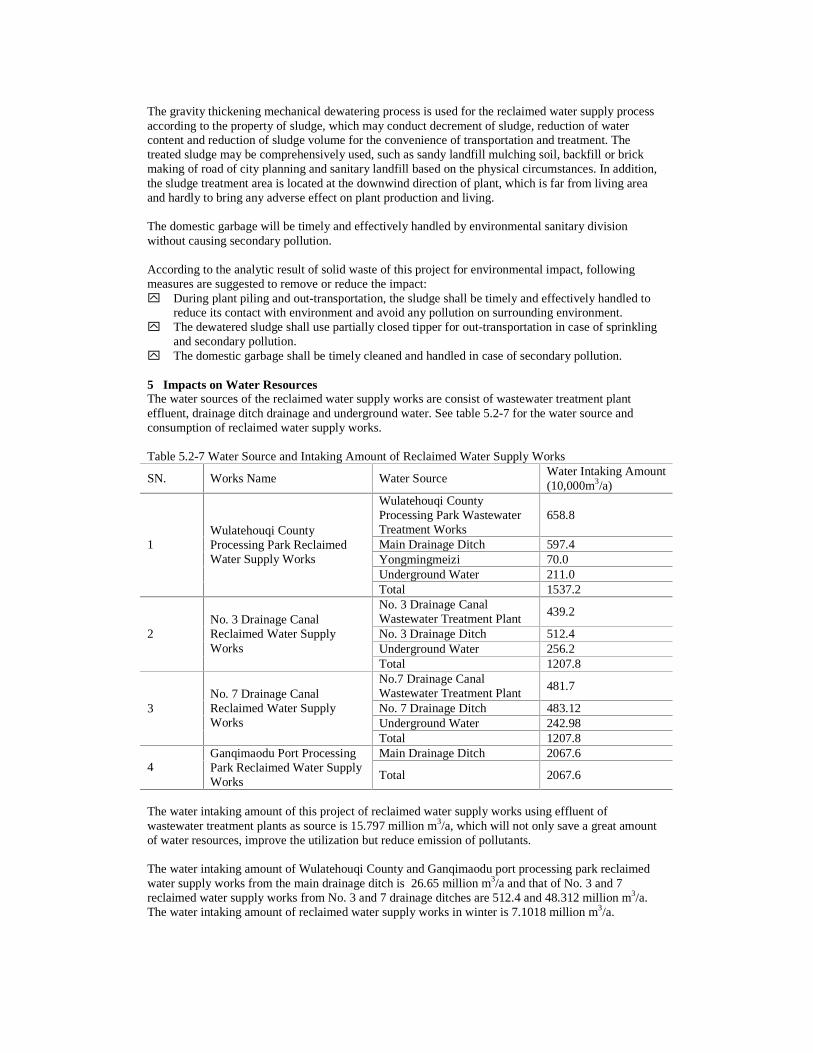
The gravity thickening mechanical dewatering process is used for the reclaimed water supply process according to the property of sludge, which may conduct decrement of sludge, reduction of water content and reduction of sludge volume for the convenience of transportation and treatment. The treated sludge may be comprehensively used, such as sandy landfill mulching soil, backfill or brick making of road of city planning and sanitary landfill based on the physical circumstances. In addition, the sludge treatment area is located at the downwind direction of plant, which is far from living area and hardly to bring any adverse effect on plant production and living. The domestic garbage will be timely and effectively handled by environmental sanitary division without causing secondary pollution. According to the analytic result of solid waste of this project for environmental impact, following measures are suggested to remove or reduce the impact: y� During plant piling and out-transportation, the sludge shall be timely and effectively handled to
reduce its contact with environment and avoid any pollution on surrounding environment. y� The dewatered sludge shall use partially closed tipper for out-transportation in case of sprinkling
and secondary pollution. y� The domestic garbage shall be timely cleaned and handled in case of secondary pollution. 5�Impacts on Water Resources The water sources of the reclaimed water supply works are consist of wastewater treatment plant effluent, drainage ditch drainage and underground water. See table 5.2-7 for the water source and consumption of reclaimed water supply works. Table 5.2-7 Water Source and Intaking Amount of Reclaimed Water Supply Works
SN. Works Name Water Source Water Intaking Amount (10,000m3/a)
Wulatehouqi County Processing Park Wastewater Treatment Works
658.8
Main Drainage Ditch 597.4 Yongmingmeizi 70.0 Underground Water 211.0
1 Wulatehouqi County Processing Park Reclaimed Water Supply Works
Total 1537.2 No. 3 Drainage Canal Wastewater Treatment Plant
439.2
No. 3 Drainage Ditch 512.4 Underground Water 256.2
2 No. 3 Drainage Canal Reclaimed Water Supply Works
Total 1207.8 No.7 Drainage Canal Wastewater Treatment Plant
481.7
No. 7 Drainage Ditch 483.12 Underground Water 242.98
3 No. 7 Drainage Canal Reclaimed Water Supply Works
Total 1207.8 Main Drainage Ditch 2067.6
4 Ganqimaodu Port Processing Park Reclaimed Water Supply Works Total 2067.6
The water intaking amount of this project of reclaimed water supply works using effluent of wastewater treatment plants as source is 15.797 million m3/a, which will not only save a great amount of water resources, improve the utilization but reduce emission of pollutants. The water intaking amount of Wulatehouqi County and Ganqimaodu port processing park reclaimed water supply works from the main drainage ditch is 26.65 million m3/a and that of No. 3 and 7 reclaimed water supply works from No. 3 and 7 drainage ditches are 512.4 and 48.312 million m3/a. The water intaking amount of reclaimed water supply works in winter is 7.1018 million m3/a.
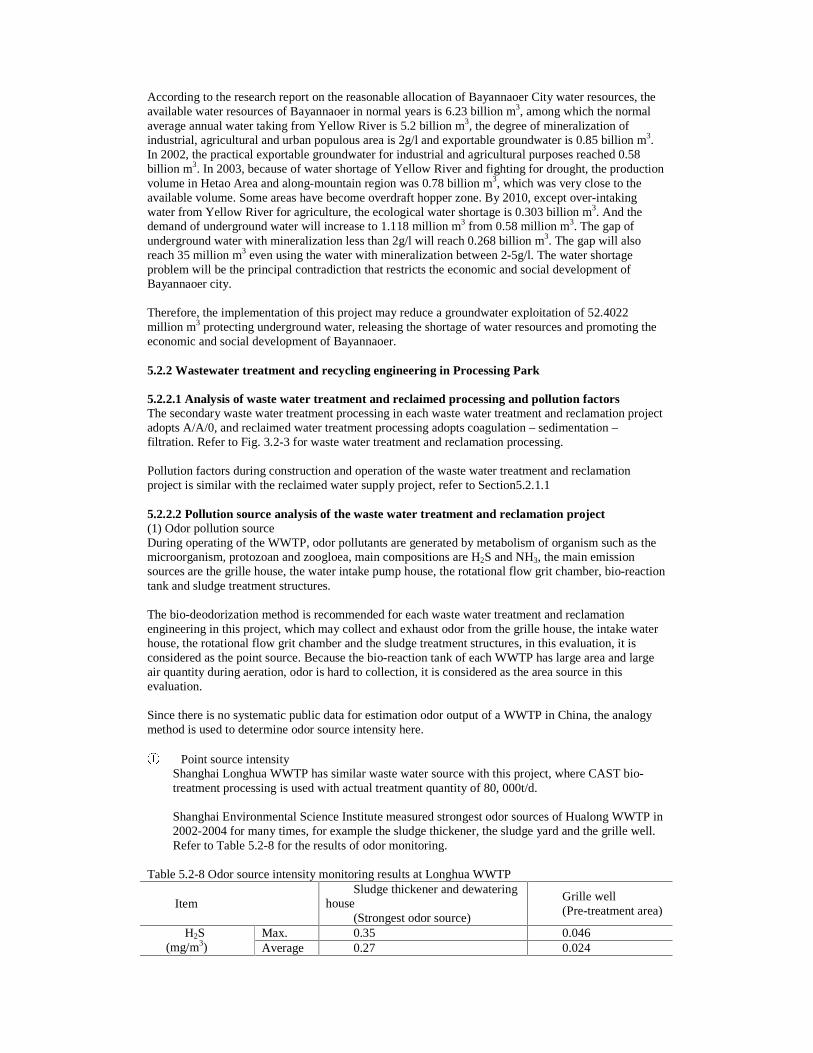
According to the research report on the reasonable allocation of Bayannaoer City water resources, the available water resources of Bayannaoer in normal years is 6.23 billion m3, among which the normal average annual water taking from Yellow River is 5.2 billion m3, the degree of mineralization of industrial, agricultural and urban populous area is 2g/l and exportable groundwater is 0.85 billion m3. In 2002, the practical exportable groundwater for industrial and agricultural purposes reached 0.58 billion m3. In 2003, because of water shortage of Yellow River and fighting for drought, the production volume in Hetao Area and along-mountain region was 0.78 billion m3, which was very close to the available volume. Some areas have become overdraft hopper zone. By 2010, except over-intaking water from Yellow River for agriculture, the ecological water shortage is 0.303 billion m3. And the demand of underground water will increase to 1.118 million m3 from 0.58 million m3. The gap of underground water with mineralization less than 2g/l will reach 0.268 billion m3. The gap will also reach 35 million m3 even using the water with mineralization between 2-5g/l. The water shortage problem will be the principal contradiction that restricts the economic and social development of Bayannaoer city. Therefore, the implementation of this project may reduce a groundwater exploitation of 52.4022 million m3 protecting underground water, releasing the shortage of water resources and promoting the economic and social development of Bayannaoer. 5.2.2 Wastewater treatment and recycling engineering in Processing Park 5.2.2.1 Analysis of waste water treatment and reclaimed processing and pollution factors The secondary waste water treatment processing in each waste water treatment and reclamation project adopts A/A/0, and reclaimed water treatment processing adopts coagulation – sedimentation – filtration. Refer to Fig. 3.2-3 for waste water treatment and reclamation processing. Pollution factors during construction and operation of the waste water treatment and reclamation project is similar with the reclaimed water supply project, refer to Section5.2.1.1� 5.2.2.2 Pollution source analysis of the waste water treatment and reclamation project (1) Odor pollution source During operating of the WWTP, odor pollutants are generated by metabolism of organism such as the microorganism, protozoan and zoogloea, main compositions are H2S and NH3, the main emission sources are the grille house, the water intake pump house, the rotational flow grit chamber, bio-reaction tank and sludge treatment structures. The bio-deodorization method is recommended for each waste water treatment and reclamation engineering in this project, which may collect and exhaust odor from the grille house, the intake water house, the rotational flow grit chamber and the sludge treatment structures, in this evaluation, it is considered as the point source. Because the bio-reaction tank of each WWTP has large area and large air quantity during aeration, odor is hard to collection, it is considered as the area source in this evaluation. Since there is no systematic public data for estimation odor output of a WWTP in China, the analogy method is used to determine odor source intensity here.
Point source intensity Shanghai Longhua WWTP has similar waste water source with this project, where CAST bio-treatment processing is used with actual treatment quantity of 80, 000t/d.
Shanghai Environmental Science Institute measured strongest odor sources of Hualong WWTP in 2002-2004 for many times, for example the sludge thickener, the sludge yard and the grille well. Refer to Table 5.2-8 for the results of odor monitoring.
Table 5.2-8 Odor source intensity monitoring results at Longhua WWTP
Item Sludge thickener and dewatering
house (Strongest odor source)
Grille well (Pre-treatment area)
Max. 0.35 0.046 H2S (mg/m3) Average 0.27 0.024
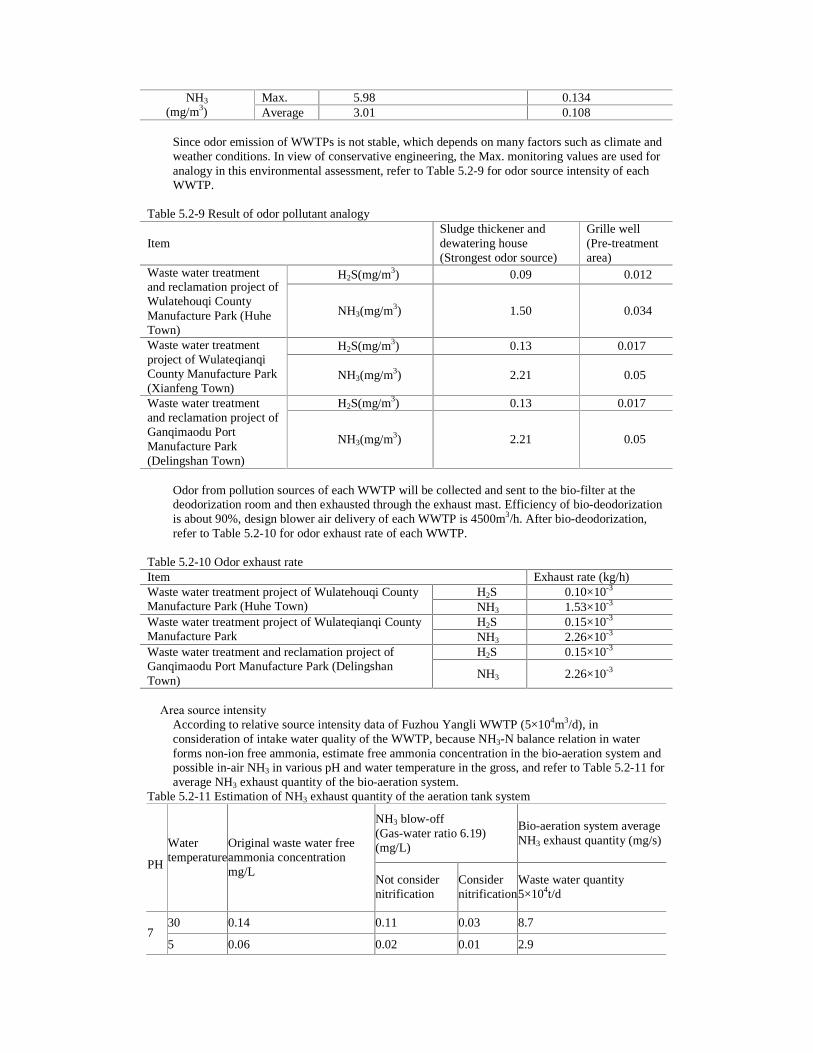
Max. 5.98 0.134 NH3 (mg/m3) Average 3.01 0.108
Since odor emission of WWTPs is not stable, which depends on many factors such as climate and weather conditions. In view of conservative engineering, the Max. monitoring values are used for analogy in this environmental assessment, refer to Table 5.2-9 for odor source intensity of each WWTP.
Table 5.2-9 Result of odor pollutant analogy
Item Sludge thickener and dewatering house (Strongest odor source)
Grille well (Pre-treatment area)
H2S(mg/m3) 0.09 0.012 Waste water treatment and reclamation project of Wulatehouqi County Manufacture Park (Huhe Town)
NH3(mg/m3) 1.50 0.034
H2S(mg/m3) 0.13 0.017 Waste water treatment project of Wulateqianqi County Manufacture Park (Xianfeng Town)
NH3(mg/m3) 2.21 0.05
H2S(mg/m3) 0.13 0.017 Waste water treatment and reclamation project of Ganqimaodu Port Manufacture Park (Delingshan Town)
NH3(mg/m3) 2.21 0.05
Odor from pollution sources of each WWTP will be collected and sent to the bio-filter at the deodorization room and then exhausted through the exhaust mast. Efficiency of bio-deodorization is about 90%, design blower air delivery of each WWTP is 4500m3/h. After bio-deodorization, refer to Table 5.2-10 for odor exhaust rate of each WWTP.
Table 5.2-10 Odor exhaust rate Item Exhaust rate (kg/h)
H2S 0.10×10⁻³ Waste water treatment project of Wulatehouqi County Manufacture Park (Huhe Town) NH3 1.53×10⁻³
H2S 0.15×10⁻³ Waste water treatment project of Wulateqianqi County Manufacture Park NH3 2.26×10⁻³
H2S 0.15×10⁻³ Waste water treatment and reclamation project of Ganqimaodu Port Manufacture Park (Delingshan Town) NH3 2.26×10⁻³
� Area source intensity
According to relative source intensity data of Fuzhou Yangli WWTP (5×10⁴m3/d), in consideration of intake water quality of the WWTP, because NH3-N balance relation in water forms non-ion free ammonia, estimate free ammonia concentration in the bio-aeration system and possible in-air NH3 in various pH and water temperature in the gross, and refer to Table 5.2-11 for average NH3 exhaust quantity of the bio-aeration system.
Table 5.2-11 Estimation of NH3 exhaust quantity of the aeration tank system
NH3 blow-off (Gas-water ratio 6.19) (mg/L)
Bio-aeration system average NH3 exhaust quantity (mg/s)
PH
Water temperature �
Original waste water free ammonia concentration mg/L
Not consider nitrification
Consider nitrification
Waste water quantity 5×10⁴t/d
30 0.14 0.11 0.03 8.7 7
5 0.06 0.02 0.01 2.9
30 2.24 0.179 0.054 15.7 8
5 0.28 0.06 0.02 5.8
Based on relative experience, exhaust intensity of H2S can be estimated in the gross at about 10% of exhaust intensity of NH3. In view of conservative engineering, the Max. monitoring values are used for analogy in this environmental assessment, refer to Table 5.2-12 for odor source intensity of bio-aeration tank at each WWTP. Table 5.2-12 Odor exhaust rate Item Exhaust rate (kg/h)
H2S 2.26×10⁻³ Waste water treatment and reclamation project of Wulatehouqi County Manufacture Park (Huhe Town) NH3 2.26×10⁻²
H2S 3.39×10⁻³ Waste water treatment project of Wulateqianqi County Manufacture Park NH3 3.39×10⁻²
H2S 3.39×10⁻³ Waste water treatment and reclamation project of Ganqimaodu Port Manufacture Park (Delingshan Town) NH3 3.39×10⁻²
(2) Water pollution source No waste water drain outside in each WWTP of this project, waste water will be treated further and then used for production and planting in the parks. According to discharge nodes analysis of each WWTP, main nodes producing water are sludge thickening and dewatering, filter backwashing, wastewater and equipment cleaning. Refer to Table 5.2-13 for quantity of waste water. Table 5.2-13 Waste water output (m3/a)
Item Type
Wulatehouqi County
Ganqimaodu Port
Wulateqianqi County
Final treatment
Sludge dewater 15×103 22.5×10³ 22.5×10³ Return to the front end of the WWTP
Backwash -- 14.6×10³ 14.6×10³ Return to the front end of the WWTP
Wastewater 2100 2100 1140 Return to the front end of the WWTP
Cleaning 730 730 730 Return to the front end of the WWTP
(3) Solid wastes When the project starts operation, solid wastes mainly are the grille dreg, grit chamber sludge, excess sludge and domestic garbage. � Grille dreg and sand
Most fine grille dregs are blocky solid materials, including both inorganic and organic substances, like domestic garbage. Stop diameter of a fine grille is substances with diameter more than 6mm; while grit is inorganic particles, such as argillaceous silt and carpolite. The rotational flow grit chamber removes oily substances and sand particles with specific gravity more than 2.65 and grain size more than 0.22mm mainly. According to Code of outdoor drainage design, grit quantity of urban waste water can be calculated as 0.03kg/m3, while quantity of grille dreg can be calculated as 0.1 kg/m3, refer to Table 3.3-12 for the output. Treatment of dreg and grit is performed by the grille machine, the belt conveyor, and the presser, which may avoid odor emission and vermination. After treatment, they can be landfilled as urban garbage.
� Sludge Excess sludge in the sludge tank will be lifted to the combined thickening and dewatering machine with 0.5% high molecular organic flocculant PAM. Water content of sludge after dewatering should be less than 80%, refer to Table 3.3-12 for dewatering sludge quantity.
� Domestic garbage

According to the Stat. data of Bayannaoer garbage station, average garbage output per day per capita is about 0.8kg/d, it is reduced by half for employees. So garbage quantity can be calculation by employees during operation of each plant. Refer to Table 3.3-12 for details. By calculation, refer to Table 5.2-14 for solid waste output of each waste water treatment and reclamation plant.
Table5.2-14 Main solid waste output of each plant (t/a)
Item Type
Wulatehouqi County
Ganqimaodu Port Wulateqianqi County
Final treatment
Grille dreg and grit
949 1265 1265 To the landfill
Sludge 1155 1576 1576 To the landfill Wastewater 3 5 5 To the landfill Total 2107 2846 2846 (4) Noise pollution source Noise sources of all waste water treatment and reclamation plants during operation are same basically, main noise source comes from the pump house, the sludge thickening and dewatering equipments, and the blower house. Refer to Table 5.2-15 for equipment quantity and noise values of equipments. Table 5.2-15 Main equipments with high noise at the plant Section Equipment with high noise Near-field sound level dB(A) Water intake pump house Waste water pump 90-95
Reflux sludge pump 85-90 CAST tank or CASS tank
Excess sludge pump 80-85 Blower house Centrifugal blower 100-105
Sludge thickening and dewatering machine
90-100
Flushing pump 90 Sludge thickening and dewatering house
Dosing pump 90 Blower house 100-105
Deodorization room Flushing pump 90
5.2.2.3 The environmental impact analysis of wastewater treatment project 1�Prediction and Analysis of malodor Environmental Effect (1) Pollutant concentration prediction The evaluation is to predict pollutant concentration, taking Wastewater treatment and recycling plant in Processing Park in Wulateqianqi County as an example. Pollutant concentrations in the other two plants is the same or lower than this wastewater treatment plant, so the prediction can be analyzed as a reference for the other 2 plants. According to the prediction of pollutant sources of NH3 and H2S in the previous section, SCREEN estimation model, recommended by Technical Guidelines for Environmental Impact Assessment Atmospheric Environment (HJ2.2-2008), is adopted to predict the sphere of influence of discharge concentration. Point source and point source prediction results are shown in Table 5.2-16 and 5.2-17. Table 5.2-16 predictions under point source estimation model
Source 1: NH3 Source 2: H2S Predict downwind concentrations of Ci1 ( g/m3) predict downwind concentrations of Ci1
( g/m3) Pollution Source 1: NH3 Pollution Source 2� H2S
downwind Distance from the source center D (m) Predicted concentration
downwind Ci1( g/ m3) Predicted concentration downwind Ci1( g/ m3)
10 0.2688E-17 0.1792E-18 100 0.07 0.005 200 0.09 0.006 300 0.10 0.007
500 0.08 0.006 1000 0.05 0.004 1500 0.06 0.004 2000 0.05 0.003 Table 5.2-17 Predictions under Area Source estimation model
Pollution Source 1: NH3 Pollution Source 2� H2S downwind Distance from the source center D (m) Predicted concentration
downwind Ci1( g/m3) Predicted concentration downwind Ci1( g/m3)
10 1.143 0.114 100 11.37 1.137 200 10.54 1.054 300 9.911 0.991 500 9.266 0.926 1000 4.826 0.482 1500 2.883 0.288 2000 1.943 0.194 According to Table 5.2-16 and Table 5.2-17, the largest point source concentration of NH3 and H2S is 0.10 × 10⁻³mg/m3 and 0.007 × 10⁻³mg/m3, accounting for 0.05% and 0.07% of the maximum allowable emission of the harmful substances in “ health standards Industrial Enterprises Design”(TJ36-1979 ). The largest area source concentration of NH3 and H2S is 0.011g/m3 0.001mg/m3, accounting for 5.5% and 10% of the maximum allowable emission of harmful substances in atmosphere in " health standards Industrial Enterprises Design " (TJ36-1979 ). In Totalmary, the concentration of NH3 and H2S emissions of the wastewater treatment plants is low, thus have little influence on the surrounding atmosphere. (2) Health protection distance According to "Municipal Wastewater Treatment Plant Pollutant Emission Standards" (GB18918-2002), the new site (including reform, expansion) of urban Wastewater treatment plant should be consistent with the overall planning requirements of local urban and rural construction. Green belt should be built around urban wastewater treatment plants, and certain protective distance should be kept, the size of which is determined by the environmental impact assessment. The evaluation is to calculate the Health Protection distance based on the example of wastewater treatment plant in Wulateqianqi County. The scale of pollution Source of the other two plants is the same, so the health protection distance is applied accordingly. The calculation method, which is about unorganized harmful gas emissions of health protection distance given in" local technical methods of air pollutant emission standards (GB/T3840-91) ", is adopted, and it is as follows:
The meaning of symbols and units are shown in Table 5.2-18. Table 5.2-18 List of symbols NO Symbol Meaning Unit 1 Qc control level of non-organization emissions standards kg/h 2 Cm Standard concentration limits mg/Nm3
3 L Required Health Protection distance of industrial enterprises
m
4 R Equivalent radius of emission sources in production unit m 5 A �B�C�D Calculation parameters of Health Protection distance Table 5.2-19 List of source concentration parameter NH3 H2S Qc 0.15kg/h 3.39×10⁻³kg/h Cm 0.20mg/Nm3 0.01mg/Nm3 L 15 35

S 800 A �B�C�D A=350�B=0.021�C=1.85�D=0.84 According to the prediction, health protection distance of NH3 and H2S is calculated as 15m and 35m. According to the relevant provisions of technical methods of development of local air pollution emission standard (GB/T3840-91), health protection distance of the wastewater treatment plant is 50m. All the wastewater treatment plant sites selected in the project are 500m away from residents, so the impact of the project on the surrounding residents is within the permission of the state. According to forecasts and integrated analysis of analog, the project has little effect on the regional air environment and will not have a significant impact on the neighborhood. 2� Water environment impact analysis (1) Surface water environment impact analysis The water process link of various wastewater treatment and reclaimed wateris water sedimentation, sludge thickening, filter backwash water and cleaning life water and water for equipment. The wastewater of this part goes from the wastewater pipes in the plant and then will be collected and processed in the wastewater treatment without discharging and have no impact on surface water. In addition, the scale of wastewater treatment and water recycling project in Ganqimaodu Port processing park is 30,000 m3 / d, the scale of renewable water treatment is 2.4 m3/ d, and the remaining 6,000 m3 / d water discharge into the main channel as a landscape of water; Wulateqianqi County wastewater treatment and reuse of the wastewater capacity is 30,000 m3 / d, and the scale of renewable water treatment is 2 m3 / d, and the remaining 10,000 m3/ d water discharge into the fourth channel as a landscape. The above two wastewater treatment plants is implemented according to standard A of "Municipal Wastewater Treatment Plant Pollutant Emission Standards," and also meet the need of landscape water requirements. It will not be drained totally and has little impact on the water quality of the fourth channel. The treated wastewater of Wulatehouqi County Processing Park goes into wastewater treatment plants of Wulatehouqi County to be recycled without discharging. Meanwhile, due to the wastewater treatment and the construction project of regenerated water cycling, it enhances the industrial wastewater treatment, increases water reuse rate, reduce pollutants load from processing parks effectively and decrease the quantity of pollutant discharged into rivers and benefit water quality improvement in the project area. After the project of wastewater treatment and recycling is completed, according to wastewater treatment capacity of 80,000 m3/ d, reuse water of 64 000 t / d, it can save water 22.63 million m3/ a, reduce water pollutants CODcr 14271t / a, BOD8694t / a, ammonia 697t / a. It is of great importance to reduce regional water pollutants discharge load. In Totalmary, after the project of the wastewater treatment and reclaimed water reuse project is completed and operated, it can effectively reduce the regional emissions, and can promote regional water environment with little impact on surface water bodies. (2) Analysis of groundwater environmental impact After the completion and operation of wastewater treatment plants, domestic wastewater and industrial wastewater of all processing parks will be discharged into the wastewater treatment plant. The construction of pipe network collection and harmless treatment of wastewater reduces the bad effect of water infiltration on underground water pollution in processing parks. Therefore, the implementation of the project has a positive influence on regional groundwater environment. However, in the course of operation of the project, strict measures should be taken to prevent leakage of wastewater pipes and wastewater treatment facilities and avoid leachate into the groundwater in the course of dumping sludge. Seepage coefficient is less than 10-7 cm / s, the sludge generated by the project will be removed periodically, and sludge-dumping ground will be seepage proofing to ensure the effective protection of groundwater sources. 3� Acoustic Environmental Impact Prediction and Analysis (1) Prediction model In accordance with HJ/T2.3-95 “environmental impact assessment technology guidance Acoustic Environment”, the noise source is regarded as a state of semi-free point source. It is tested in noise source coordinate system and floor plan to identify noise sources position, forecast positions, the distance between forecast position and sound source according to forecasts point. Equivalent sound
level of sound pressure at any point LeqdB (A) is calculated with accordance of air attenuation model of acoustic energy in the environment. 1 the effect of single point sound source on predicted position, the mode of calculation is as follows:
LA (r) = LA (r0)-20lg (r/r0) The formula: LA (r) - sound level value from sound source r, dB (A); LA (r0) - sound level value from reference position r0, dB (A); r - distance between predicted point and sound source, m; distance between reference position and sound source, 1m.
2 noise sound level of more than one sound source to a certain predicted position on the T-time, the mode of calculation is as follows: The formula: Leq (T) - the total sound level of predicted position, dB (A); n - the number of outdoor sound source.
(2) Environmental noise prediction of wastewater treatment plant
Judged from the distribution of noise source, noise source are all in the plant. Blowers and all kinds of pumps are fixed in a separate device room, and the after the room acoustic shielding, green noise and distance attenuation effects, noise made by the equipment can be attenuated. Noise prediction results of various projects can be seen in Table 5.2-20. Table 5.2-20 Noise Prediction of Wastewater Treatment Plant and surrounding Area
Daytime Night Project Measuring point
Noise at boundary Noise at boundary East boundary 53.4 53.4 South boundary 54.2 54.2 West boundary 52.4 52.4
Wulateqianqi County Processing Park (Huhe Township) Wastewater treatment project North boundary 53.6 53.6
East boundary 52.7 52.7 South boundary 53.4 53.4 West boundary 54.6 54.6
Ganqimaodu Port Processing Park(Delingshan Township)wastewater treatment and recycling project North boundary 54.2 54.2
East boundary 52.8 52.8 South boundary 53.4 53.4 West boundary 52.4 52.4
Wulateqianqi County Processing Park (Xianfeng Township)wastewater treatment recycling project North boundary 52.7 52.7
According to the above table, noise at plant boundary of the wastewater treatment plants confirm to three functional areas standard criteria of daytime and night: 65dB (A ) and 55dB (A) provided by “Industrial enterprises plant boundary noise emission standard” (GB12348-2008). Moreover, no people live within 500 meters around the wastewater treatment plants and there is little noise impact on the surrounding environment. 4� Analysis of Solid Waste Environmental Impact (1) Impact of sludge dewatering process on the environment Before dewatered, generally speaking, sludge should be concentrated. Concentration tank often exudes stench, especially in the hot Totalmer months, there are floating mud on the pool surface, and it is easy to infest mosquitoes. When concentrated sludge is dewatered, the dewatering room will emit foul smell; in case of spilling in the process of dewatering sludge, environment will be polluted. (2) Impact of sludge dumping on the environment Dewatered sludge should be timely removed. The sludge, which cannot be transported in time, should be put in temporary stacking areas. Dewatered sludge is easy to turn into slurry with water, which is of good fluidity and wash away easily; when it rains, water integrates with a large number of pollutants,
polluting surface and groundwater. Therefore, the dehydrated sludge can not be cluttered, but should be treated with the impermeable layer of the temporary dumping place specially, and then stamp rain-shelter; In addition, the dehydrated sludge is not completely stable, long-term stacking will produce sludge anaerobic digestion. H2S odor produced by such substances will affect air quality; dehydrated sludge stack place is the breeding ground for mosquitoes, and have an undesirable effect on environmental health. For these reasons, sludge should be removed after dewatering time to avoid piling up in the factory. (3) Impact of sludge transportation on the environment Although the sludge in the plant have been treated to various extend, the sludge still has some harmful pollutants. The sludge of the project in various wastewater treatment plant is only concentrated and dehydrated and fail to meet the requirement of sludge stabilization and harmless condition. The sludge contains large amounts of perishable organic matter and coli, ascaris eggs and other pathogens microorganisms. Therefore, transportation process of sludge is a very important environmental issue. At present, the main transportation of sludge is trucks. If the sludge hangs on the body and wheels of trucks in the handling process, or the vehicles are poor sealed, the trucks will spill sludge around wastewater treatment plant and along the road, which cause pollution along the road. Muddy water flowing and malodorous spreading should be prevented in the process of sludge transportation. Wastewater Treatment Plant should use special closed vehicles to prevent water leakage, mud leakage and scattering. Meanwhile, the sludge transportation time should be strictly controlled, trying to avoid heavy traffic times. In short, the sludge transportation is a very important problem to be taken seriously. (4) Sludge treatment program of wastewater treatment plant Sludge is the product of the wastewater process and it is an important component of the wastewater treatment. Sludge treatment aims to decrease the sludge moisture content and sludge volume to stabilize its nature and then create conditions for further disposal and comprehensive utilization. The general process includes “concentration - Dewatering –Disposal” or “concentration- digestion - Dewatering – Disposal”. According to feasibility study report, due to biological nutrient removal technology adopted by the wastewater treatment, sludge age is a little longer and the sludge is relatively stable, so there is no need to carry out nitrification. In the case of nitrification, a digestion pool, heating, stirring and a series of gas treatment and utilization structures and equipment are needed while investment increases. However, land area in the wastewater treatment park is limited, so sludge nitrification system cannot be built. According to analog data, sludge components of the wastewater treatment plant relate with water quality of wastewater. Generally, excess sludge of industrial waste water in wastewater treatment plant contain high amount of heavy metals, far beyond the agricultural sludge standard, therefore it should be safely landfill ed instead of being used as agricultural fertilizer. 5�Ecological environmental impact analysis (1) Land use and soil restoration Since the original crops, natural vegetation are replaced by various types of buildings, roads, green belt and other land. The function of land-use changes greatly. After completion of the project, discarded soil can be reused to build green belt of the plant. At the same time, ground hardening and green belt building can hold the soil, reduce soil erosion; and it can also be used to cover soil in reuse landfill. (2) Vegetation cover After completion, the plant’s green area with trees on both sides of the road, the total green vegetation coverage rate will be higher than before. It keeps soil and water as well as beautifies the environment. The greening rates of all projects are seen in Table 5.2-21. Table 5.2-21 Green rates of the projects
NO. Project Plant area
m2
Green coverage
m2
Green rate %
1 Ganqimaodu Port Processing Park(Delingshan Township)wastewater treatment and recycling project
111000 53125.6 47
2 Wulatehouqi County Processing park (Huhe Township) Wastewater treatment project
70000 39074.5 55
3 Wulateqianqi County Processing Park (Xianfeng Township)wastewater treatment recycling project
111000 53380 46
(3) Landscape Ecological Analysis Before project construction, landscape patterns are simple, the degree of connectivity is poor, and the degree of heterogeneity is low. After completion of the project, there are various types of buildings, roads, green belt, and other kinds of combination. As there are more tree species, species diversity increased, correspondingly landscape heterogeneity increases. However, trees introduced by manual work require a certain process of selection and adaptation to the environment. When the project has just completed, the variability of trees is large and anti-interference ability is poor, but all of these will greatly improve over time. 5.2.3 Wuliangsuhai Lake Lake Administration Project 5.2.3.1 Pollution factor analysis of Wuliangsuhai Lake area comprehensive treatment Pollution factors during operation are mainly from operation of the Wuliangsuhai Lake artificial wetland. (1) Noise Noise mainly comes from the artificial wetland pump station with noise source intensity 80dB(A). (2) Solid waste Main solid wastes during operation of the artificial wetland are sludge in the sedimentation pond, which will be dredged about every 7-10 years, transporting outside to avoid secondary pollution. 5.2.3.2 Pollution source and main pollutants discharge analysis Refer to Chapter 5 of this report for pollution sources and pollutants discharge during construction of the project of Wuliangsuhai Lake area comprehensive treatment. Main environmental impact during operation of the project of Wuliangsuhai Lake area comprehensive treatment is pollution source discharge of Wuliangsuhai Lake area artificial wetland. 1) Noise Noise during operation comes from the pump station and the aeration pond mainly. Refer to Table 3.3-14 for noise source intensity. 2) Solid wastes Solid waste during operation of the artificial wetland is mainly sludge in the sedimentation pond, which will be dredged about every 7-10 years; in addition, people for management and maintenance of the wetland will produce domestic garbage. 3) Pollution source intensity analysis Refer to Table 3.3-14 for producing and estimated discharge of main pollutants of the project of Wuliangsuhai Lake area comprehensive treatment. Table 3.3-14 Producing and discharge of main pollutants of the project
Type Emission source
Main pollutant
Concentration and quantity before treatment (Unit)
Remedy
Mixed-flow pump
Equipment noise
90-100dB (A) Sound insulation and damping Noise
Air compressor Equipment noise
90-100dB(A) Sound insulation, silencing and
damping Stabilization pond and sedimentation pond
Bed mud Dredging every 5 years
Use as fertilizer or send to the landfill
Solid waste
Domestic garbage
Domestic garbage
6.4 t/a Deliver to the environmental sanitation administration to the landfill
5.2.3.3 Analysis on Environmental Impact of Wuliangsuhai Lake Treatment Works The project, ecological works with no pollution features no permanent constructions in existence or operation during its operation period. The unfavorable environmental impacts in the operation period of the project mainly include the waste gas and noises of artificial wetland in operation and the change of partial water circulation system and can be effectively alleviated in adoption of proper measures; and favorable environmental impacts of the project in the operation period mainly include the cut-off of the pollutants in the lake and the improvement of the quality of water of Wuliangsuhai Lake flowing into the sea and ecological landscape pattern of Wuliangsuhai Lake valley and sea area waterway system. 1�Analysis on Adverse Environmental Impact of Wuliangsuhai Lake Sea Area Treatment Works (1) Impact on Atmospheric Environment The proposed project emissions are mainly produced by microbial decomposition of CO2, as well as stench of decaying animal and plant and other microbial life. The quantity is small, and the concentration produced can reach the maximum allowable concentration of secondary standards given by “municipal wastewater treatment plant emission standards” (GB18918-2002) factory sector. (2) Noise Noise generated by the project is mainly from mechanical noise made by pumping equipment. Source intensity noise value is about 80dB (A). By status monitoring and predicting (predicting model: use HJ/T2.4-1995 “Environmental Impact Assessment Technical Guide: sound environment” indoor point source model and outdoor plane source model are recommended), Sound Pressure Level prediction of different distance pumping equipment is shown in table 5.2-23� Table 5.2-23 List of sound pressure level projections at different distance of running pumping equipment Distance (m) 100 200 300 400 500 600 700 800 900 1000 1050 Noise value dB (A) 66.7 61.3 58.3 56.3 54.8 53.6 52.6 51.7 50.9 50.3 50 As it can be seen from Table 5.2-23, due to using pump in operating period, noise value is high, the impact is strong, and some has long duration and accompanied by a strong shock. Since the core construction area is 5-10 km from the nature reserve area, it will not affect birds nesting, foraging, courtship and incubation of birds of national-level protection. (3) Changes in the local water cycle After the completion of the proposed project, wetlands treatment system will have certain impact on groundwater environment, water balance is seen in the following table 5.2-1.
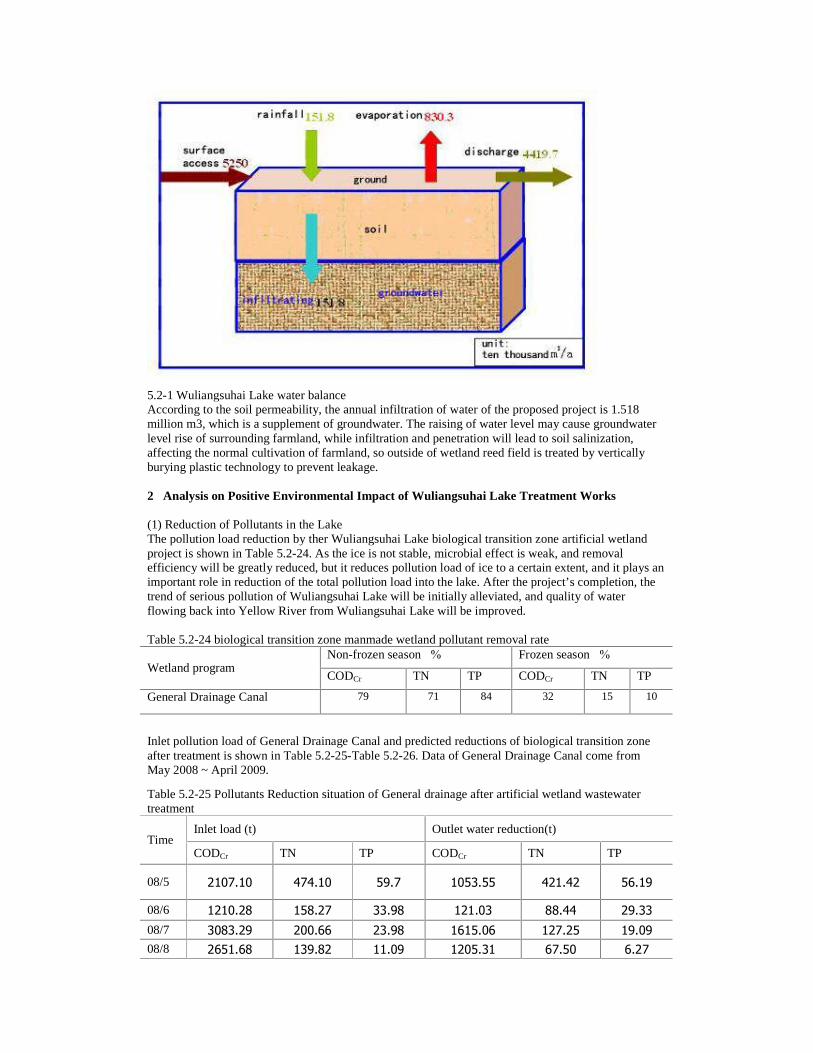
5.2-1 Wuliangsuhai Lake water balance According to the soil permeability, the annual infiltration of water of the proposed project is 1.518 million m3, which is a supplement of groundwater. The raising of water level may cause groundwater level rise of surrounding farmland, while infiltration and penetration will lead to soil salinization, affecting the normal cultivation of farmland, so outside of wetland reed field is treated by vertically burying plastic technology to prevent leakage. 2�Analysis on Positive Environmental Impact of Wuliangsuhai Lake Treatment Works (1) Reduction of Pollutants in the Lake The pollution load reduction by ther Wuliangsuhai Lake biological transition zone artificial wetland project is shown in Table 5.2-24. As the ice is not stable, microbial effect is weak, and removal efficiency will be greatly reduced, but it reduces pollution load of ice to a certain extent, and it plays an important role in reduction of the total pollution load into the lake. After the project’s completion, the trend of serious pollution of Wuliangsuhai Lake will be initially alleviated, and quality of water flowing back into Yellow River from Wuliangsuhai Lake will be improved. Table 5.2-24 biological transition zone manmade wetland pollutant removal rate
Non-frozen season�%� Frozen season�%� Wetland program
CODCr TN TP CODCr TN TP
General Drainage Canal 79 71 84 32 15 10
Inlet pollution load of General Drainage Canal and predicted reductions of biological transition zone after treatment is shown in Table 5.2-25-Table 5.2-26. Data of General Drainage Canal come from May 2008 ~ April 2009.
Table 5.2-25 Pollutants Reduction situation of General drainage after artificial wetland wastewater treatment
Inlet load (t) Outlet water reduction(t) Time
CODCr TN TP CODCr TN TP
08/5 2107.10 474.10 59.7 1053.55 421.42 56.19
08/6 1210.28 158.27 33.98 121.03 88.44 29.33 08/7 3083.29 200.66 23.98 1615.06 127.25 19.09 08/8 2651.68 139.82 11.09 1205.31 67.50 6.27
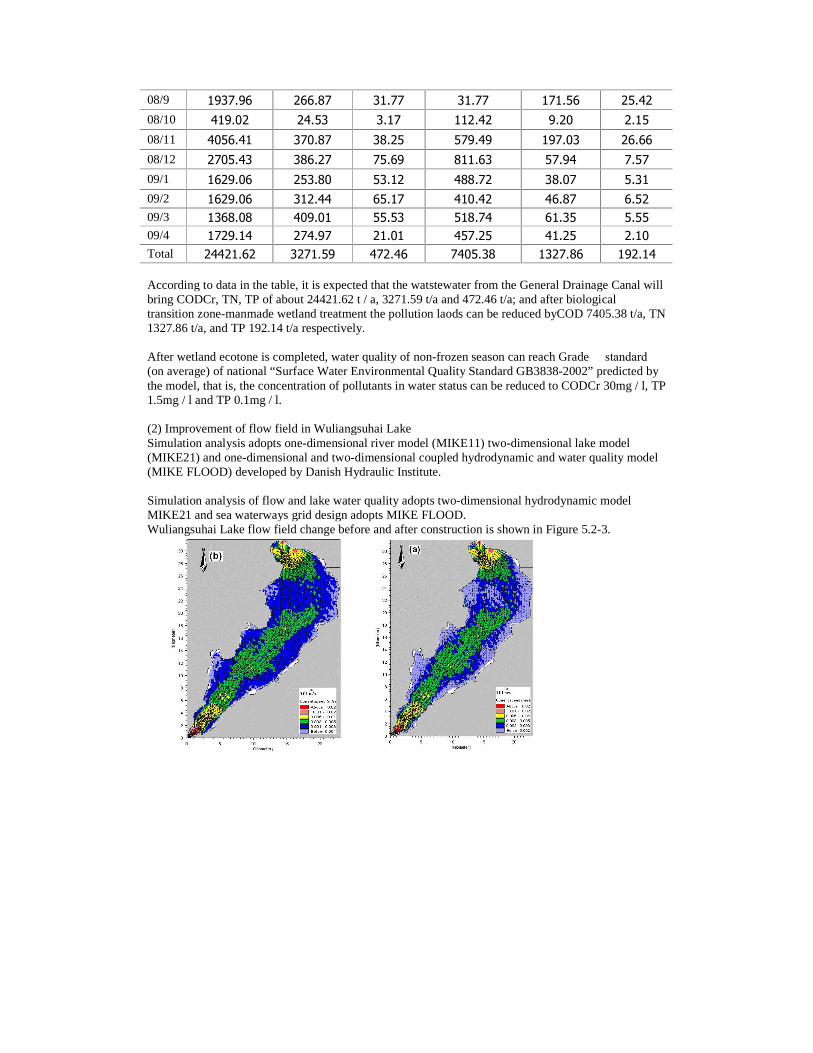
08/9 1937.96 266.87 31.77 31.77 171.56 25.42 08/10 419.02 24.53 3.17 112.42 9.20 2.15 08/11 4056.41 370.87 38.25 579.49 197.03 26.66 08/12 2705.43 386.27 75.69 811.63 57.94 7.57 09/1 1629.06 253.80 53.12 488.72 38.07 5.31 09/2 1629.06 312.44 65.17 410.42 46.87 6.52 09/3 1368.08 409.01 55.53 518.74 61.35 5.55 09/4 1729.14 274.97 21.01 457.25 41.25 2.10 Total 24421.62 3271.59 472.46 7405.38 1327.86 192.14 According to data in the table, it is expected that the watstewater from the General Drainage Canal will bring CODCr, TN, TP of about 24421.62 t / a, 3271.59 t/a and 472.46 t/a; and after biological transition zone-manmade wetland treatment the pollution laods can be reduced byCOD 7405.38 t/a, TN 1327.86 t/a, and TP 192.14 t/a respectively. After wetland ecotone is completed, water quality of non-frozen season can reach Grade � standard (on average) of national “Surface Water Environmental Quality Standard GB3838-2002” predicted by the model, that is, the concentration of pollutants in water status can be reduced to CODCr 30mg / l, TP 1.5mg / l and TP 0.1mg / l. (2) Improvement of flow field in Wuliangsuhai Lake Simulation analysis adopts one-dimensional river model (MIKE11) two-dimensional lake model (MIKE21) and one-dimensional and two-dimensional coupled hydrodynamic and water quality model (MIKE FLOOD) developed by Danish Hydraulic Institute. Simulation analysis of flow and lake water quality adopts two-dimensional hydrodynamic model MIKE21 and sea waterways grid design adopts MIKE FLOOD. Wuliangsuhai Lake flow field change before and after construction is shown in Figure 5.2-3.
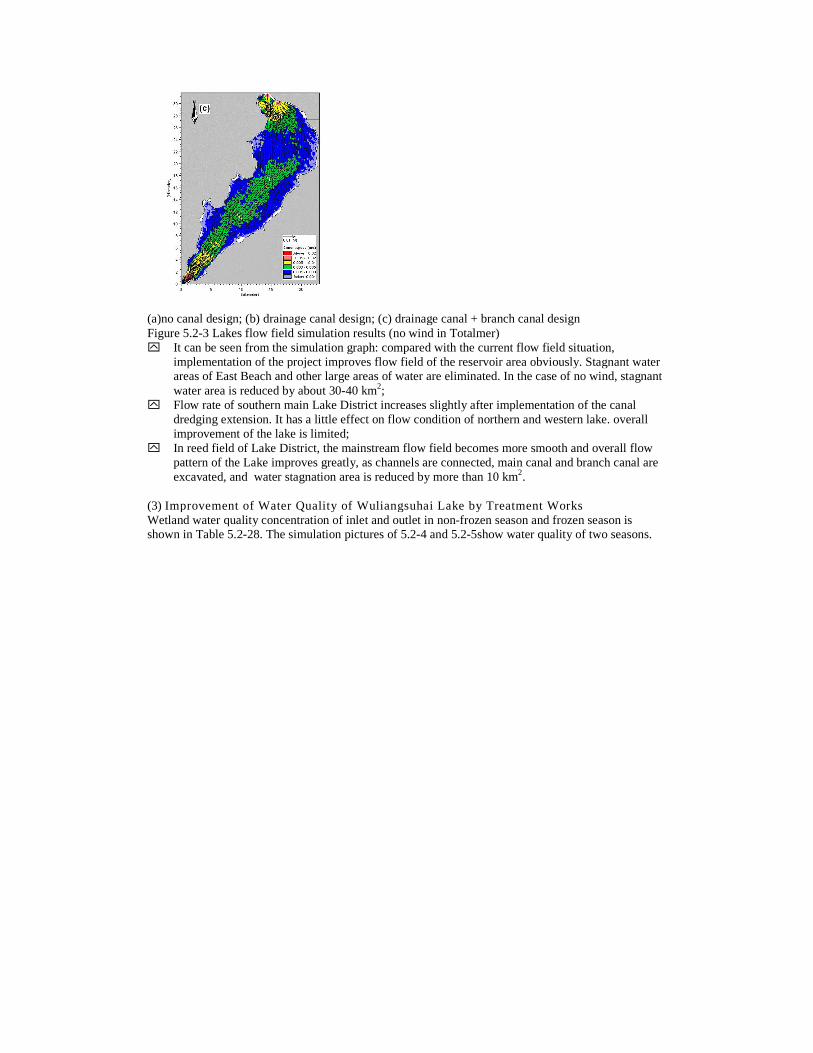
(a)no canal design; (b) drainage canal design; (c) drainage canal + branch canal design Figure 5.2-3 Lakes flow field simulation results (no wind in Totalmer) y� It can be seen from the simulation graph: compared with the current flow field situation,
implementation of the project improves flow field of the reservoir area obviously. Stagnant water areas of East Beach and other large areas of water are eliminated. In the case of no wind, stagnant water area is reduced by about 30-40 km2;
y� Flow rate of southern main Lake District increases slightly after implementation of the canal dredging extension. It has a little effect on flow condition of northern and western lake. overall improvement of the lake is limited;
y� In reed field of Lake District, the mainstream flow field becomes more smooth and overall flow pattern of the Lake improves greatly, as channels are connected, main canal and branch canal are excavated, and water stagnation area is reduced by more than 10 km2.
(3) Improvement of Water Quality of Wuliangsuhai Lake by Treatment Works Wetland water quality concentration of inlet and outlet in non-frozen season and frozen season is shown in Table 5.2-28. The simulation pictures of 5.2-4 and 5.2-5show water quality of two seasons.
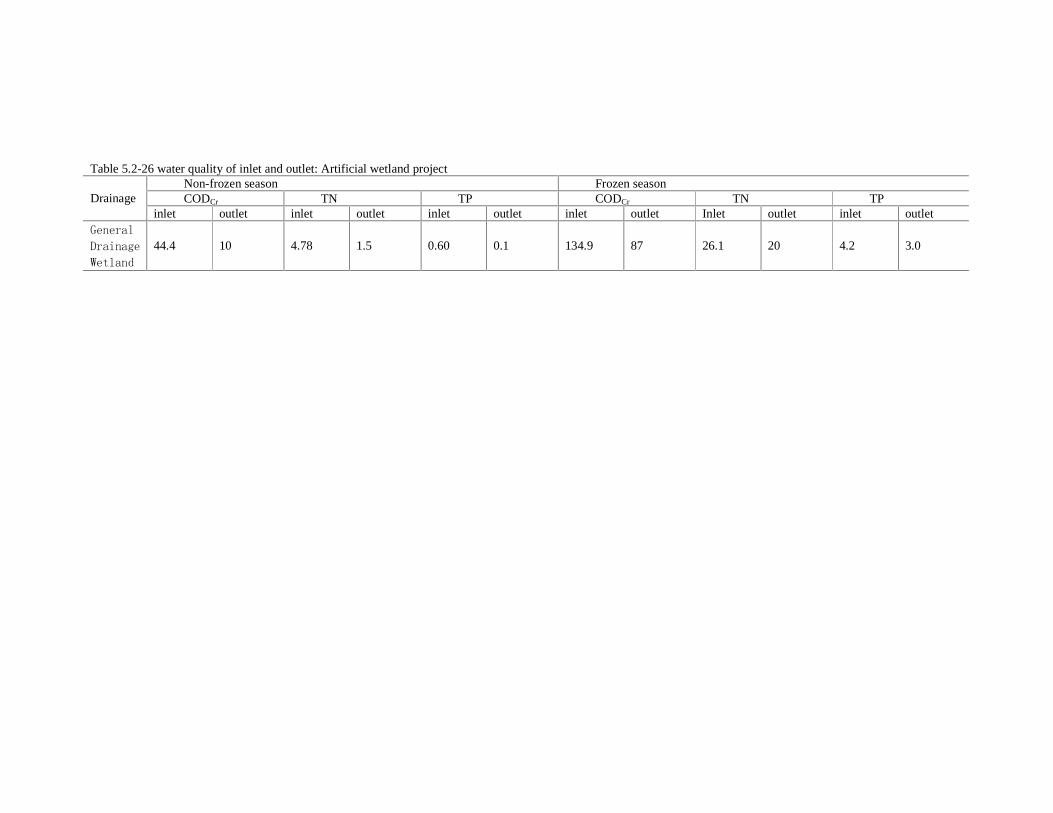
Table 5.2-26 water quality of inlet and outlet: Artificial wetland project
Non-frozen season Frozen season CODCr TN TP CODCr TN TP Drainage
inlet outlet inlet outlet inlet outlet inlet outlet Inlet outlet inlet outlet *HQHUDO�
'UDLQDJH�
:HWODQG�
44.4 10 4.78 1.5 0.60 0.1 134.9 87 26.1 20 4.2 3.0
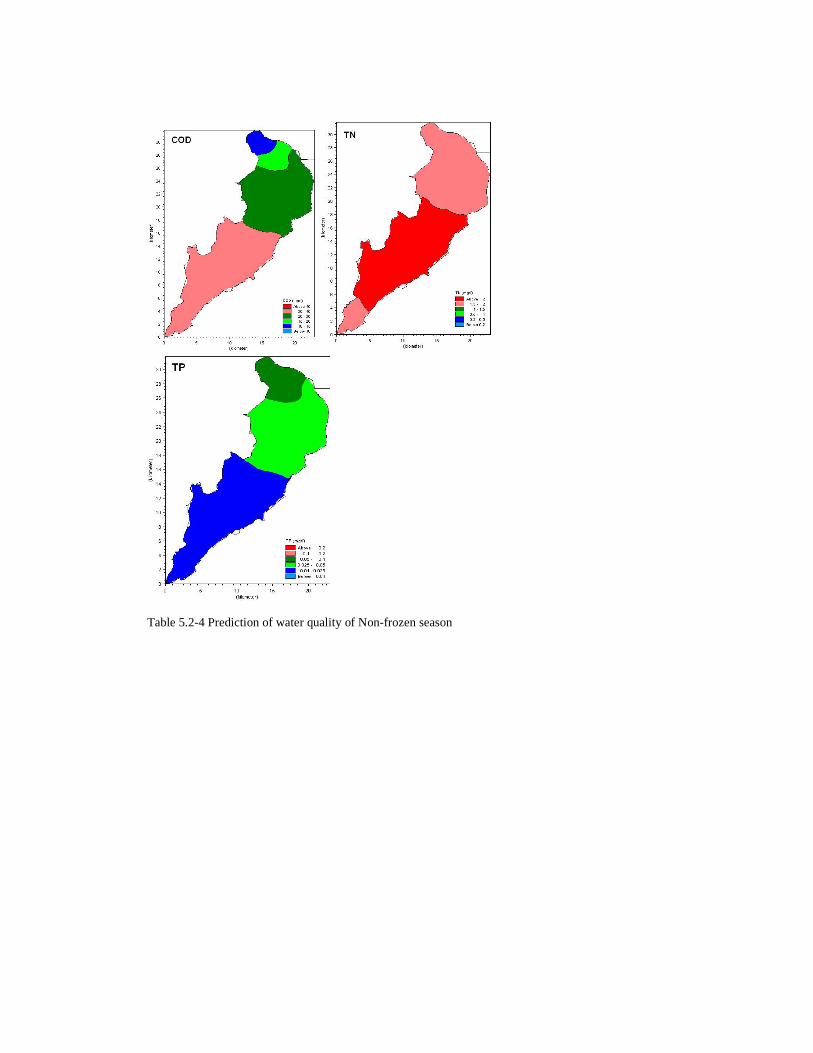
Table 5.2-4 Prediction of water quality of Non-frozen season
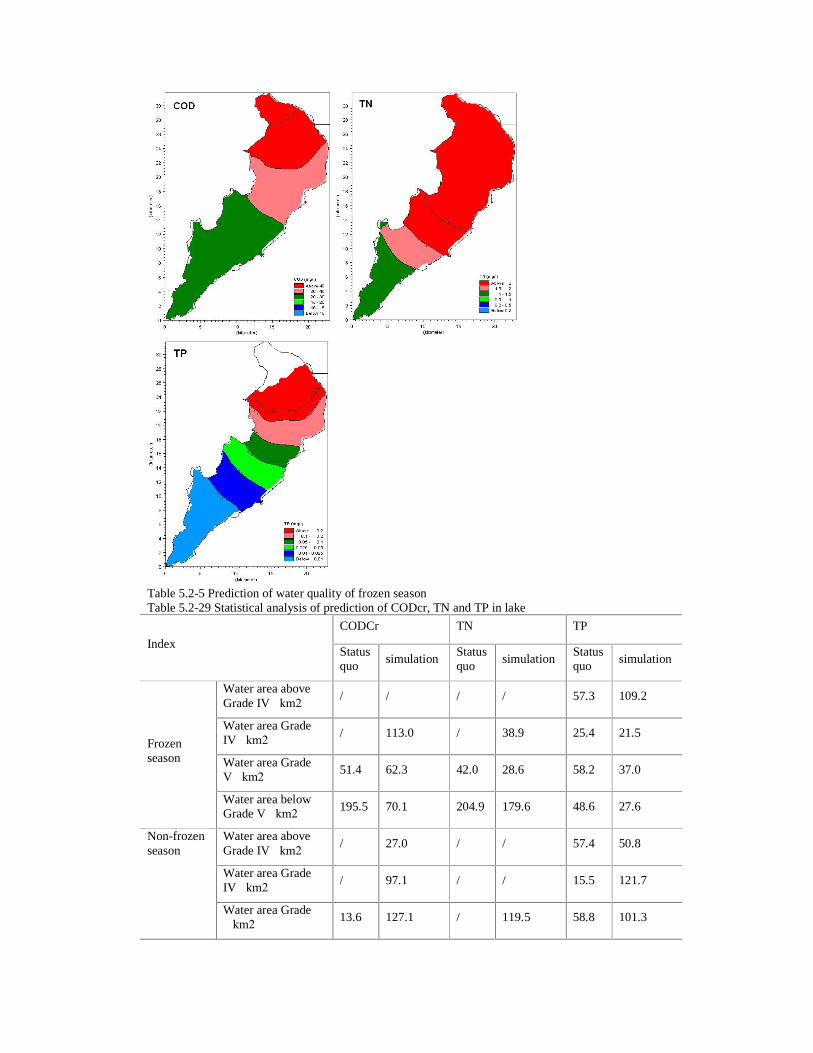
Table 5.2-5 Prediction of water quality of frozen season Table 5.2-29 Statistical analysis of prediction of CODcr, TN and TP in lake
CODCr TN TP
Index Status quo
simulation Status quo
simulation Status quo
simulation
Water area above Grade IV�km2�
/ / / / 57.3 109.2
Water area Grade IV�km2�
/ 113.0 / 38.9 25.4 21.5
Water area Grade V�km2�
51.4 62.3 42.0 28.6 58.2 37.0
Frozen season
Water area below Grade V�km2�
195.5 70.1 204.9 179.6 48.6 27.6
Water area above Grade IV�km2�
/ 27.0 / / 57.4 50.8
Water area Grade IV�km2�
/ 97.1 / / 15.5 121.7
Non-frozen season
Water area Grade �km2�
13.6 127.1 / 119.5 58.8 101.3
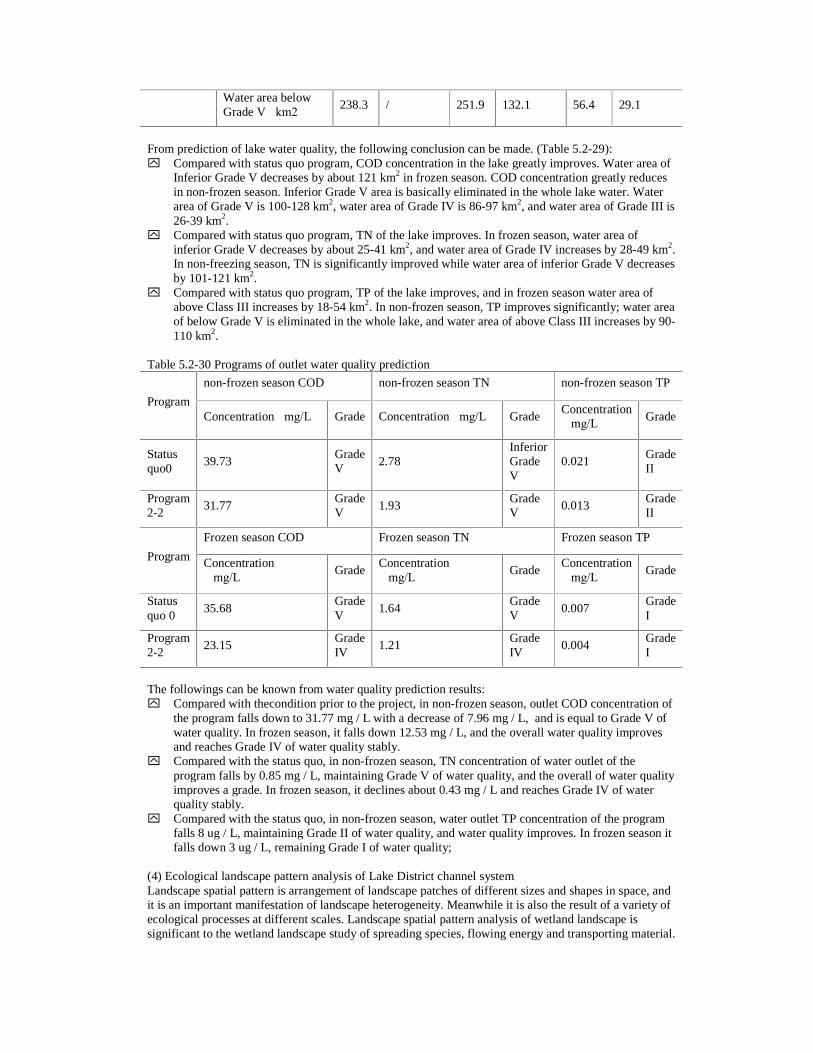
Water area below Grade V�km2�
238.3 / 251.9 132.1 56.4 29.1
From prediction of lake water quality, the following conclusion can be made. (Table 5.2-29): y� Compared with status quo program, COD concentration in the lake greatly improves. Water area of
Inferior Grade V decreases by about 121 km2 in frozen season. COD concentration greatly reduces in non-frozen season. Inferior Grade V area is basically eliminated in the whole lake water. Water area of Grade V is 100-128 km2, water area of Grade IV is 86-97 km2, and water area of Grade III is 26-39 km2.
y� Compared with status quo program, TN of the lake improves. In frozen season, water area of inferior Grade V decreases by about 25-41 km2, and water area of Grade IV increases by 28-49 km2. In non-freezing season, TN is significantly improved while water area of inferior Grade V decreases by 101-121 km2.
y� Compared with status quo program, TP of the lake improves, and in frozen season water area of above Class III increases by 18-54 km2. In non-frozen season, TP improves significantly; water area of below Grade V is eliminated in the whole lake, and water area of above Class III increases by 90-110 km2.
Table 5.2-30 Programs of outlet water quality prediction
non-frozen season COD non-frozen season TN non-frozen season TP
Program Concentration�mg/L� Grade Concentration�mg/L� Grade
Concentration �mg/L�
Grade
Status quo0
39.73 Grade V
2.78 Inferior Grade V
0.021 Grade II
Program 2-2
31.77 Grade V
1.93 Grade V
0.013 Grade II
Frozen season COD Frozen season TN Frozen season TP
Program Concentration �mg/L�
Grade Concentration �mg/L�
Grade Concentration �mg/L�
Grade
Status quo 0
35.68 Grade V
1.64 Grade V
0.007 Grade I
Program 2-2
23.15 Grade IV
1.21 Grade IV
0.004 Grade I
The followings can be known from water quality prediction results: y� Compared with thecondition prior to the project, in non-frozen season, outlet COD concentration of
the program falls down to 31.77 mg / L with a decrease of 7.96 mg / L, and is equal to Grade V of water quality. In frozen season, it falls down 12.53 mg / L, and the overall water quality improves and reaches Grade IV of water quality stably.
y� Compared with the status quo, in non-frozen season, TN concentration of water outlet of the program falls by 0.85 mg / L, maintaining Grade V of water quality, and the overall of water quality improves a grade. In frozen season, it declines about 0.43 mg / L and reaches Grade IV of water quality stably.
y� Compared with the status quo, in non-frozen season, water outlet TP concentration of the program falls 8 ug / L, maintaining Grade II of water quality, and water quality improves. In frozen season it falls down 3 ug / L, remaining Grade I of water quality;
(4) Ecological landscape pattern analysis of Lake District channel system Landscape spatial pattern is arrangement of landscape patches of different sizes and shapes in space, and it is an important manifestation of landscape heterogeneity. Meanwhile it is also the result of a variety of ecological processes at different scales. Landscape spatial pattern analysis of wetland landscape is significant to the wetland landscape study of spreading species, flowing energy and transporting material.
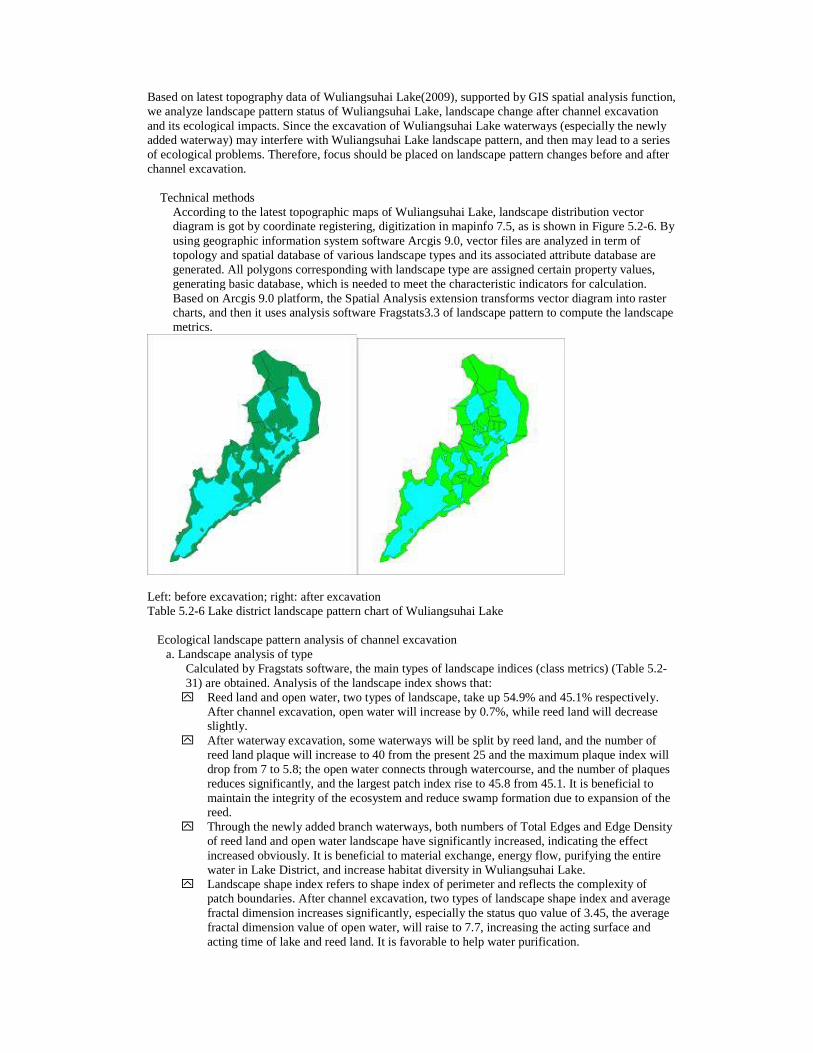
Based on latest topography data of Wuliangsuhai Lake(2009), supported by GIS spatial analysis function, we analyze landscape pattern status of Wuliangsuhai Lake, landscape change after channel excavation and its ecological impacts. Since the excavation of Wuliangsuhai Lake waterways (especially the newly added waterway) may interfere with Wuliangsuhai Lake landscape pattern, and then may lead to a series of ecological problems. Therefore, focus should be placed on landscape pattern changes before and after channel excavation. � Technical methods
According to the latest topographic maps of Wuliangsuhai Lake, landscape distribution vector diagram is got by coordinate registering, digitization in mapinfo 7.5, as is shown in Figure 5.2-6. By using geographic information system software Arcgis 9.0, vector files are analyzed in term of topology and spatial database of various landscape types and its associated attribute database are generated. All polygons corresponding with landscape type are assigned certain property values, generating basic database, which is needed to meet the characteristic indicators for calculation. Based on Arcgis 9.0 platform, the Spatial Analysis extension transforms vector diagram into raster charts, and then it uses analysis software Fragstats3.3 of landscape pattern to compute the landscape metrics.
Left: before excavation; right: after excavation Table 5.2-6 Lake district landscape pattern chart of Wuliangsuhai Lake �Ecological landscape pattern analysis of channel excavation
a. Landscape analysis of type Calculated by Fragstats software, the main types of landscape indices (class metrics) (Table 5.2-31) are obtained. Analysis of the landscape index shows that: y� Reed land and open water, two types of landscape, take up 54.9% and 45.1% respectively.
After channel excavation, open water will increase by 0.7%, while reed land will decrease slightly.
y� After waterway excavation, some waterways will be split by reed land, and the number of reed land plaque will increase to 40 from the present 25 and the maximum plaque index will drop from 7 to 5.8; the open water connects through watercourse, and the number of plaques reduces significantly, and the largest patch index rise to 45.8 from 45.1. It is beneficial to maintain the integrity of the ecosystem and reduce swamp formation due to expansion of the reed.
y� Through the newly added branch waterways, both numbers of Total Edges and Edge Density of reed land and open water landscape have significantly increased, indicating the effect increased obviously. It is beneficial to material exchange, energy flow, purifying the entire water in Lake District, and increase habitat diversity in Wuliangsuhai Lake.
y� Landscape shape index refers to shape index of perimeter and reflects the complexity of patch boundaries. After channel excavation, two types of landscape shape index and average fractal dimension increases significantly, especially the status quo value of 3.45, the average fractal dimension value of open water, will raise to 7.7, increasing the acting surface and acting time of lake and reed land. It is favorable to help water purification.
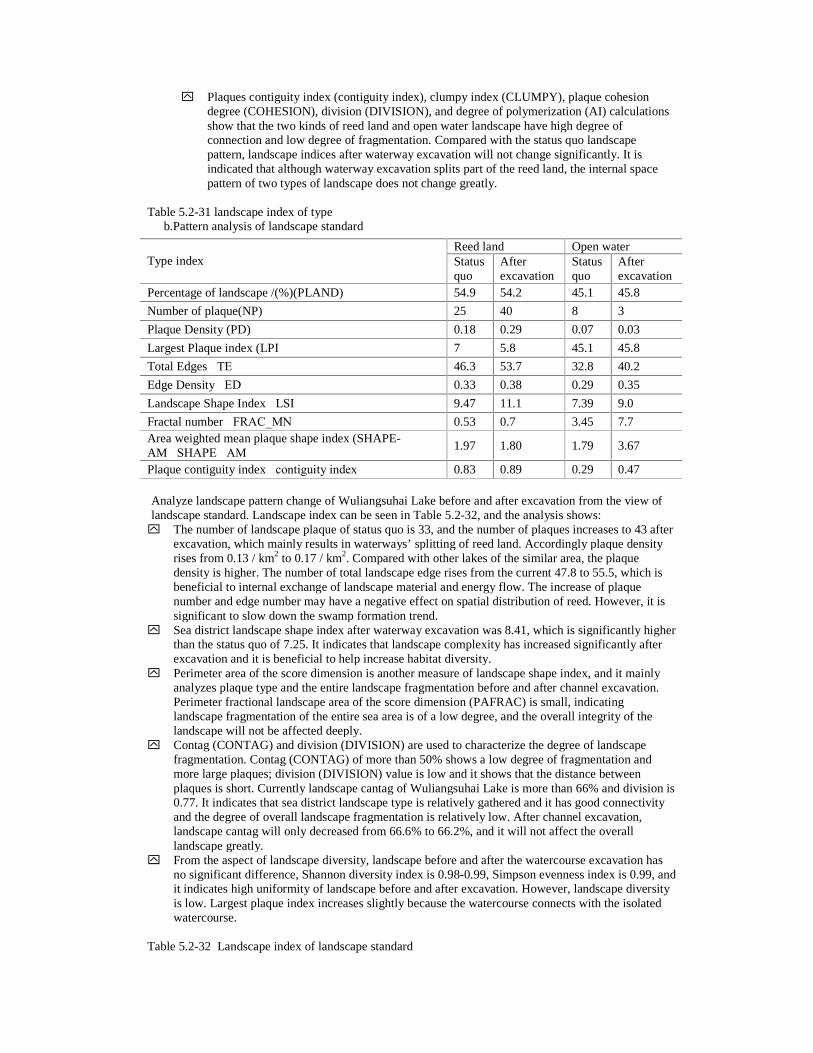
y� Plaques contiguity index (contiguity index), clumpy index (CLUMPY), plaque cohesion degree (COHESION), division (DIVISION), and degree of polymerization (AI) calculations show that the two kinds of reed land and open water landscape have high degree of connection and low degree of fragmentation. Compared with the status quo landscape pattern, landscape indices after waterway excavation will not change significantly. It is indicated that although waterway excavation splits part of the reed land, the internal space pattern of two types of landscape does not change greatly.
Table 5.2-31 landscape index of type
b.Pattern analysis of landscape standard
Analyze landscape pattern change of Wuliangsuhai Lake before and after excavation from the view of landscape standard. Landscape index can be seen in Table 5.2-32, and the analysis shows: y� The number of landscape plaque of status quo is 33, and the number of plaques increases to 43 after
excavation, which mainly results in waterways’ splitting of reed land. Accordingly plaque density rises from 0.13 / km2 to 0.17 / km2. Compared with other lakes of the similar area, the plaque density is higher. The number of total landscape edge rises from the current 47.8 to 55.5, which is beneficial to internal exchange of landscape material and energy flow. The increase of plaque number and edge number may have a negative effect on spatial distribution of reed. However, it is significant to slow down the swamp formation trend.
y� Sea district landscape shape index after waterway excavation was 8.41, which is significantly higher than the status quo of 7.25. It indicates that landscape complexity has increased significantly after excavation and it is beneficial to help increase habitat diversity.
y� Perimeter area of the score dimension is another measure of landscape shape index, and it mainly analyzes plaque type and the entire landscape fragmentation before and after channel excavation. Perimeter fractional landscape area of the score dimension (PAFRAC) is small, indicating landscape fragmentation of the entire sea area is of a low degree, and the overall integrity of the landscape will not be affected deeply.
y� Contag (CONTAG) and division (DIVISION) are used to characterize the degree of landscape fragmentation. Contag (CONTAG) of more than 50% shows a low degree of fragmentation and more large plaques; division (DIVISION) value is low and it shows that the distance between plaques is short. Currently landscape cantag of Wuliangsuhai Lake is more than 66% and division is 0.77. It indicates that sea district landscape type is relatively gathered and it has good connectivity and the degree of overall landscape fragmentation is relatively low. After channel excavation, landscape cantag will only decreased from 66.6% to 66.2%, and it will not affect the overall landscape greatly.
y� From the aspect of landscape diversity, landscape before and after the watercourse excavation has no significant difference, Shannon diversity index is 0.98-0.99, Simpson evenness index is 0.99, and it indicates high uniformity of landscape before and after excavation. However, landscape diversity is low. Largest plaque index increases slightly because the watercourse connects with the isolated watercourse.
Table 5.2-32 Landscape index of landscape standard
Reed land Open water Type index Status
quo After excavation
Status quo
After excavation
Percentage of landscape /(%)(PLAND) 54.9 54.2 45.1 45.8
Number of plaque(NP) 25 40 8 3
Plaque Density (PD) 0.18 0.29 0.07 0.03
Largest Plaque index (LPI� 7 5.8 45.1 45.8
Total Edges�TE� 46.3 53.7 32.8 40.2
Edge Density�ED� 0.33 0.38 0.29 0.35
Landscape Shape Index�LSI� 9.47 11.1 7.39 9.0
Fractal number�FRAC_MN � 0.53 0.7 3.45 7.7 Area weighted mean plaque shape index (SHAPE-AM�SHAPE�AM�
1.97 1.80 1.79 3.67
Plaque contiguity index�contiguity index� 0.83 0.89 0.29 0.47
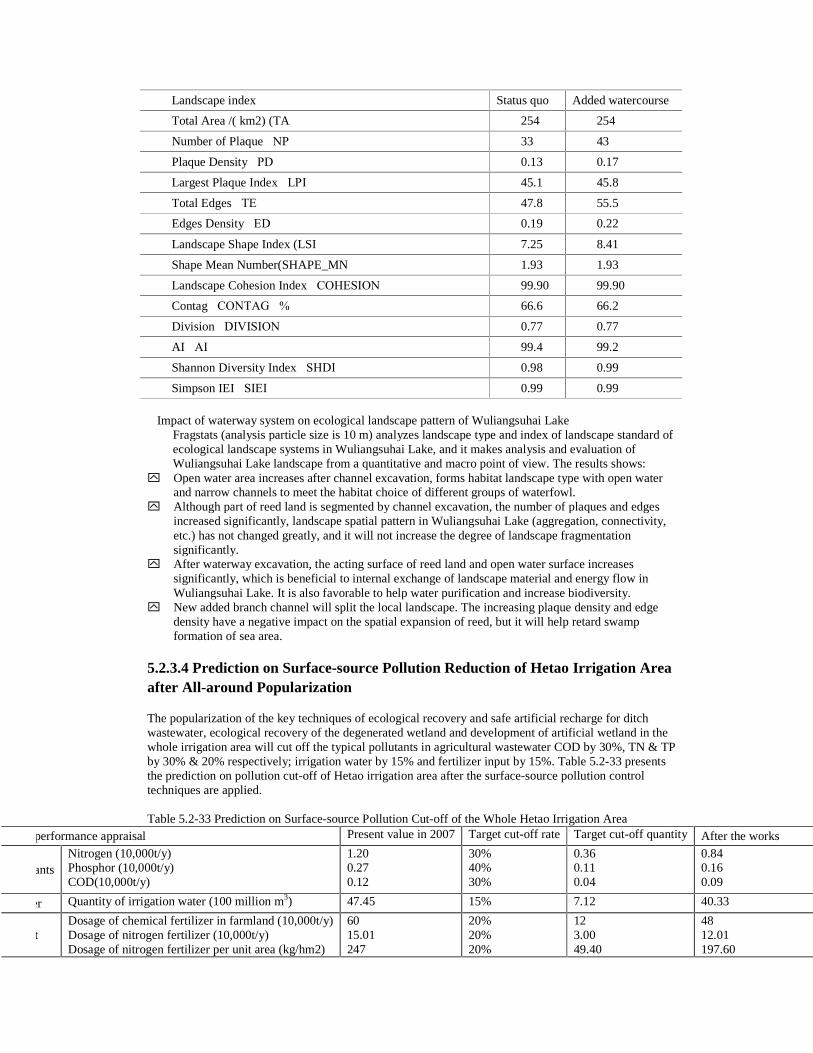
Landscape index Status quo Added watercourse
Total Area /( km2) (TA� 254 254
Number of Plaque�NP� 33 43
Plaque Density�PD� 0.13 0.17
Largest Plaque Index�LPI� 45.1 45.8
Total Edges�TE� 47.8 55.5
Edges Density�ED� 0.19 0.22
Landscape Shape Index (LSI� 7.25 8.41
Shape Mean Number(SHAPE_MN� 1.93 1.93
Landscape Cohesion Index�COHESION� 99.90 99.90
Contag�CONTAG�% 66.6 66.2
Division�DIVISION� 0.77 0.77
AI�AI� 99.4 99.2
Shannon Diversity Index�SHDI� 0.98 0.99
Simpson IEI�SIEI� 0.99 0.99
�Impact of waterway system on ecological landscape pattern of Wuliangsuhai Lake
Fragstats (analysis particle size is 10 m) analyzes landscape type and index of landscape standard of ecological landscape systems in Wuliangsuhai Lake, and it makes analysis and evaluation of Wuliangsuhai Lake landscape from a quantitative and macro point of view. The results shows:
y� Open water area increases after channel excavation, forms habitat landscape type with open water and narrow channels to meet the habitat choice of different groups of waterfowl.
y� Although part of reed land is segmented by channel excavation, the number of plaques and edges increased significantly, landscape spatial pattern in Wuliangsuhai Lake (aggregation, connectivity, etc.) has not changed greatly, and it will not increase the degree of landscape fragmentation significantly.
y� After waterway excavation, the acting surface of reed land and open water surface increases significantly, which is beneficial to internal exchange of landscape material and energy flow in Wuliangsuhai Lake. It is also favorable to help water purification and increase biodiversity.
y� New added branch channel will split the local landscape. The increasing plaque density and edge density have a negative impact on the spatial expansion of reed, but it will help retard swamp formation of sea area.
5.2.3.4 Prediction on Surface-source Pollution Reduction of Hetao Irrigation Area after All-around Popularization The popularization of the key techniques of ecological recovery and safe artificial recharge for ditch wastewater, ecological recovery of the degenerated wetland and development of artificial wetland in the whole irrigation area will cut off the typical pollutants in agricultural wastewater COD by 30%, TN & TP by 30% & 20% respectively; irrigation water by 15% and fertilizer input by 15%. Table 5.2-33 presents the prediction on pollution cut-off of Hetao irrigation area after the surface-source pollution control techniques are applied. Table 5.2-33 Prediction on Surface-source Pollution Cut-off of the Whole Hetao Irrigation Area
Indicators for performance appraisal Present value in 2007 Target cut-off rate Target cut-off quantity After the works is implemented
Typical pollutants Nitrogen (10,000t/y) Phosphor (10,000t/y) COD(10,000t/y)
1.20 0.27 0.12
30% 40% 30%
0.36 0.11 0.04
0.84 0.16 0.09
Irrigation water Quantity of irrigation water (100 million m3) 47.45 15% 7.12 40.33
Fertilizer input Dosage of chemical fertilizer in farmland (10,000t/y) Dosage of nitrogen fertilizer (10,000t/y) Dosage of nitrogen fertilizer per unit area (kg/hm2)
60 15.01 247
20% 20% 20%
12 3.00 49.40
48 12.01 197.60
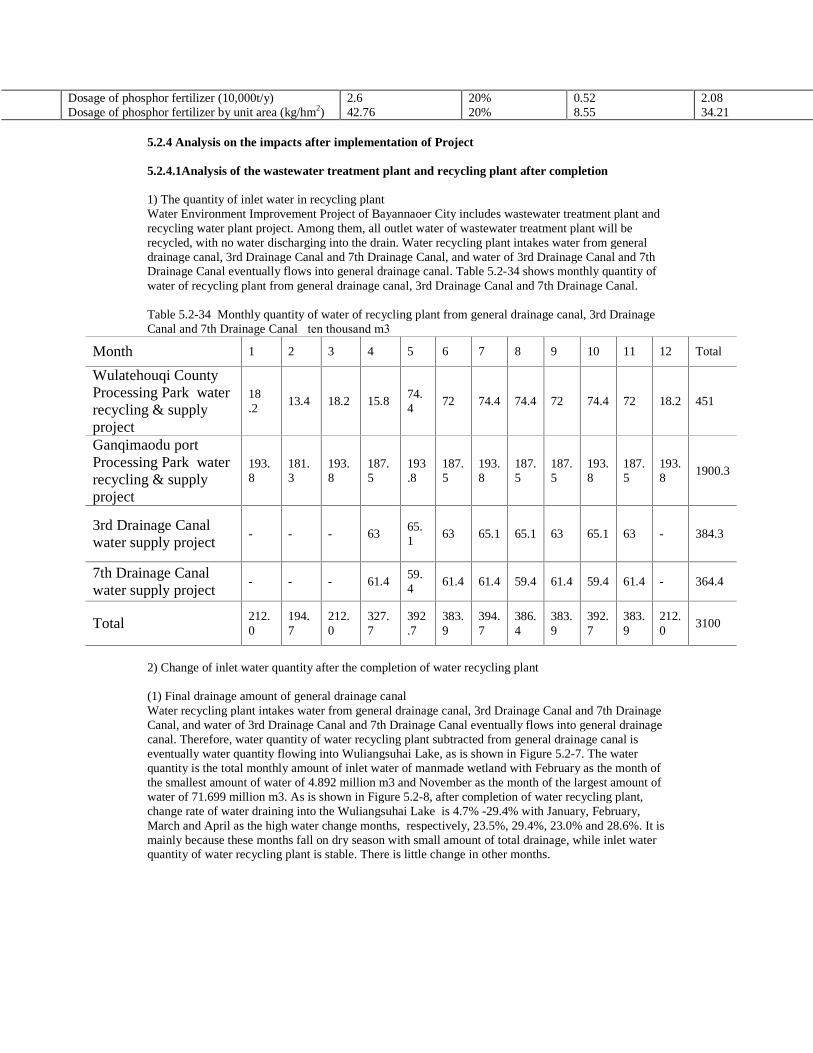
Dosage of phosphor fertilizer (10,000t/y) Dosage of phosphor fertilizer by unit area (kg/hm2)
2.6 42.76
20% 20%
0.52 8.55
2.08 34.21
5.2.4 Analysis on the impacts after implementation of Project 5.2.4.1Analysis of the wastewater treatment plant and recycling plant after completion 1) The quantity of inlet water in recycling plant Water Environment Improvement Project of Bayannaoer City includes wastewater treatment plant and recycling water plant project. Among them, all outlet water of wastewater treatment plant will be recycled, with no water discharging into the drain. Water recycling plant intakes water from general drainage canal, 3rd Drainage Canal and 7th Drainage Canal, and water of 3rd Drainage Canal and 7th Drainage Canal eventually flows into general drainage canal. Table 5.2-34 shows monthly quantity of water of recycling plant from general drainage canal, 3rd Drainage Canal and 7th Drainage Canal. Table 5.2-34 Monthly quantity of water of recycling plant from general drainage canal, 3rd Drainage Canal and 7th Drainage Canal�ten thousand m3�
Month 1 2 3 4 5 6 7 8 9 10 11 12 Total
Wulatehouqi County Processing Park water recycling & supply project
18.2
13.4 18.2 15.8 74.4
72 74.4 74.4 72 74.4 72 18.2 451
Ganqimaodu port Processing Park water recycling & supply project
193.8
181.3
193.8
187.5
193.8
187.5
193.8
187.5
187.5
193.8
187.5
193.8
1900.3
3rd Drainage Canal water supply project
- - - 63 65.1
63 65.1 65.1 63 65.1 63 - 384.3
7th Drainage Canal water supply project
- - - 61.4 59.4
61.4 61.4 59.4 61.4 59.4 61.4 - 364.4
Total 212.0
194.7
212.0
327.7
392.7
383.9
394.7
386.4
383.9
392.7
383.9
212.0
3100
2) Change of inlet water quantity after the completion of water recycling plant (1) Final drainage amount of general drainage canal Water recycling plant intakes water from general drainage canal, 3rd Drainage Canal and 7th Drainage Canal, and water of 3rd Drainage Canal and 7th Drainage Canal eventually flows into general drainage canal. Therefore, water quantity of water recycling plant subtracted from general drainage canal is eventually water quantity flowing into Wuliangsuhai Lake, as is shown in Figure 5.2-7. The water quantity is the total monthly amount of inlet water of manmade wetland with February as the month of the smallest amount of water of 4.892 million m3 and November as the month of the largest amount of water of 71.699 million m3. As is shown in Figure 5.2-8, after completion of water recycling plant, change rate of water draining into the Wuliangsuhai Lake is 4.7% -29.4% with January, February, March and April as the high water change months, respectively, 23.5%, 29.4%, 23.0% and 28.6%. It is mainly because these months fall on dry season with small amount of total drainage, while inlet water quantity of water recycling plant is stable. There is little change in other months.
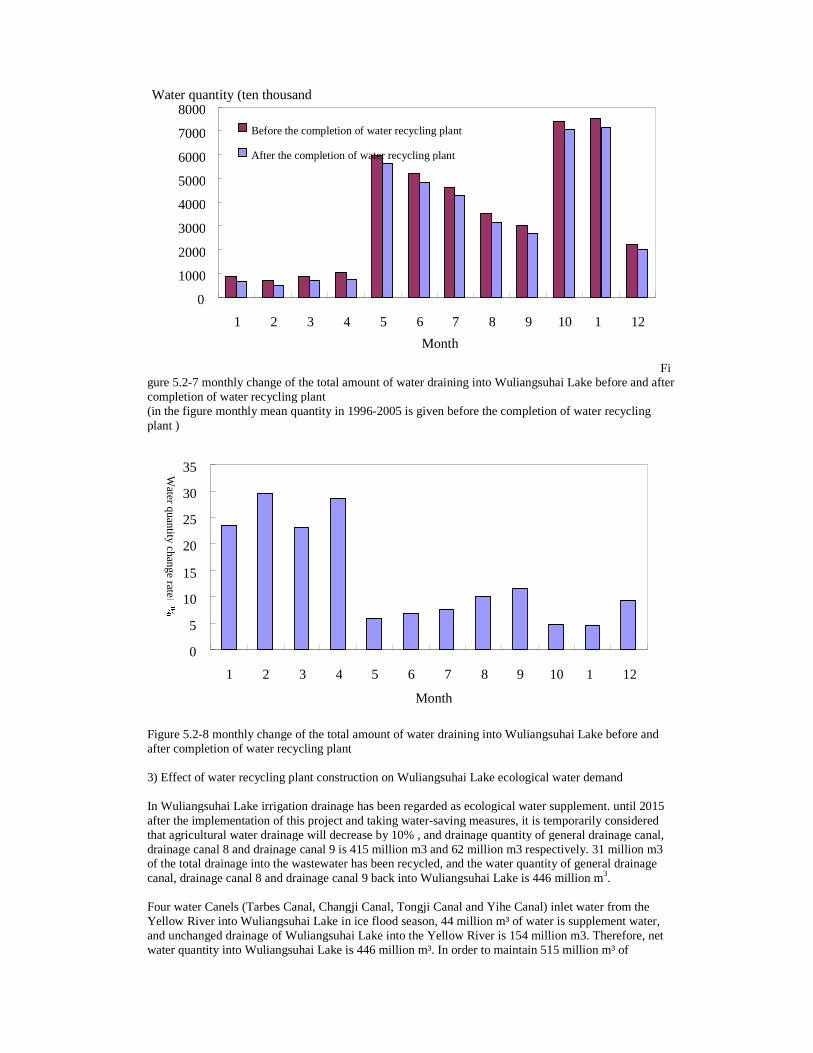
Figure 5.2-7 monthly change of the total amount of water draining into Wuliangsuhai Lake before and after completion of water recycling plant (in the figure monthly mean quantity in 1996-2005 is given before the completion of water recycling plant )
Figure 5.2-8 monthly change of the total amount of water draining into Wuliangsuhai Lake before and after completion of water recycling plant 3) Effect of water recycling plant construction on Wuliangsuhai Lake ecological water demand In Wuliangsuhai Lake irrigation drainage has been regarded as ecological water supplement. until 2015 after the implementation of this project and taking water-saving measures, it is temporarily considered that agricultural water drainage will decrease by 10% , and drainage quantity of general drainage canal, drainage canal 8 and drainage canal 9 is 415 million m3 and 62 million m3 respectively. 31 million m3 of the total drainage into the wastewater has been recycled, and the water quantity of general drainage canal, drainage canal 8 and drainage canal 9 back into Wuliangsuhai Lake is 446 million m3. Four water Canels (Tarbes Canal, Changji Canal, Tongji Canal and Yihe Canal) inlet water from the Yellow River into Wuliangsuhai Lake in ice flood season, 44 million m³ of water is supplement water, and unchanged drainage of Wuliangsuhai Lake into the Yellow River is 154 million m3. Therefore, net water quantity into Wuliangsuhai Lake is 446 million m³. In order to maintain 515 million m³ of
0
1000
2000
3000
4000
5000
6000
7000
8000
1 2 3 4 5 6 7 8 9 10 1 12
Month
Before the completion of water recycling plant
After the completion of water recycling plant
0
5
10
15
20
25
30
35
1 2 3 4 5 6 7 8 9 10 1 12
Month
Water quantity change rate�
��
Water quantity (ten thousand
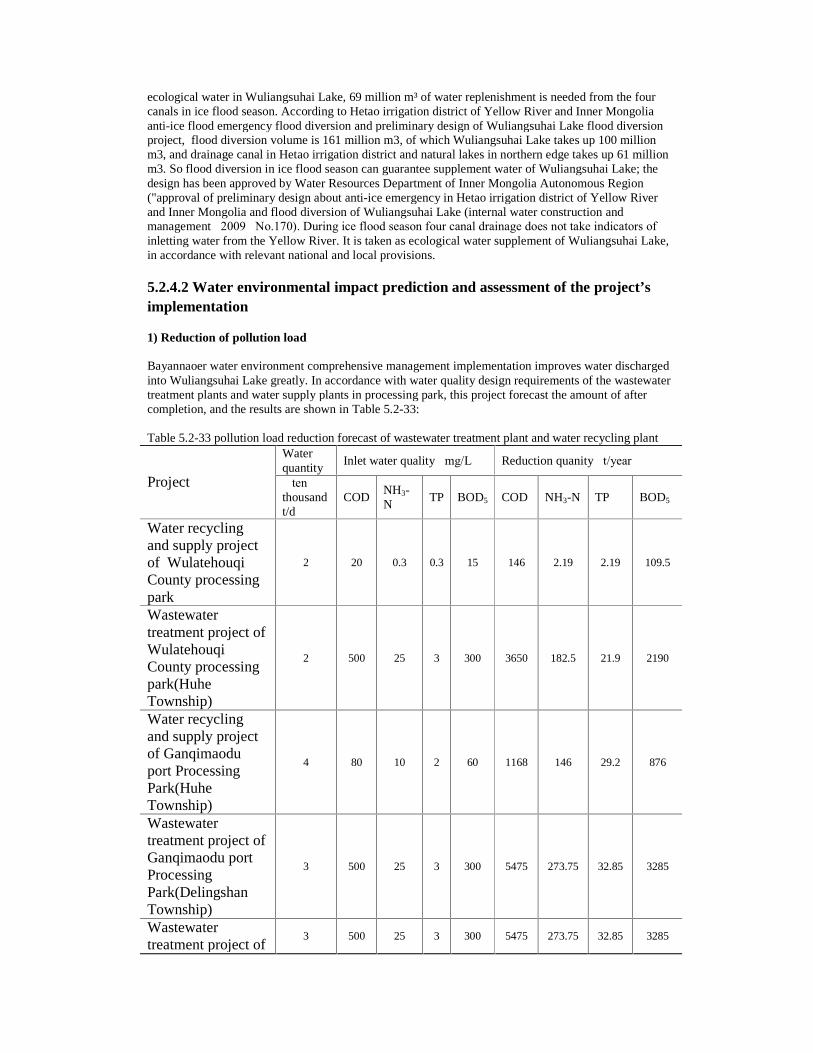
ecological water in Wuliangsuhai Lake, 69 million m³ of water replenishment is needed from the four canals in ice flood season. According to Hetao irrigation district of Yellow River and Inner Mongolia anti-ice flood emergency flood diversion and preliminary design of Wuliangsuhai Lake flood diversion project, flood diversion volume is 161 million m3, of which Wuliangsuhai Lake takes up 100 million m3, and drainage canal in Hetao irrigation district and natural lakes in northern edge takes up 61 million m3. So flood diversion in ice flood season can guarantee supplement water of Wuliangsuhai Lake; the design has been approved by Water Resources Department of Inner Mongolia Autonomous Region ("approval of preliminary design about anti-ice emergency in Hetao irrigation district of Yellow River and Inner Mongolia and flood diversion of Wuliangsuhai Lake (internal water construction and management�2009�No.170). During ice flood season four canal drainage does not take indicators of inletting water from the Yellow River. It is taken as ecological water supplement of Wuliangsuhai Lake, in accordance with relevant national and local provisions.
5.2.4.2 Water environmental impact prediction and assessment of the project’s implementation 1) Reduction of pollution load Bayannaoer water environment comprehensive management implementation improves water discharged into Wuliangsuhai Lake greatly. In accordance with water quality design requirements of the wastewater treatment plants and water supply plants in processing park, this project forecast the amount of after completion, and the results are shown in Table 5.2-33: Table 5.2-33 pollution load reduction forecast of wastewater treatment plant and water recycling plant
Water quantity
Inlet water quality�mg/L� Reduction quanity�t/year�
Project �ten thousand t/d�
COD NH3-N
TP BOD5 COD NH3-N TP BOD5
Water recycling and supply project of Wulatehouqi County processing park
2 20 0.3 0.3 15 146 2.19 2.19 109.5
Wastewater treatment project of Wulatehouqi County processing park(Huhe Township)
2 500 25 3 300 3650 182.5 21.9 2190
Water recycling and supply project of Ganqimaodu port Processing Park(Huhe Township)
4 80 10 2 60 1168 146 29.2 876
Wastewater treatment project of Ganqimaodu port Processing Park(Delingshan Township)
3 500 25 3 300 5475 273.75 32.85 3285
Wastewater treatment project of
3 500 25 3 300 5475 273.75 32.85 3285
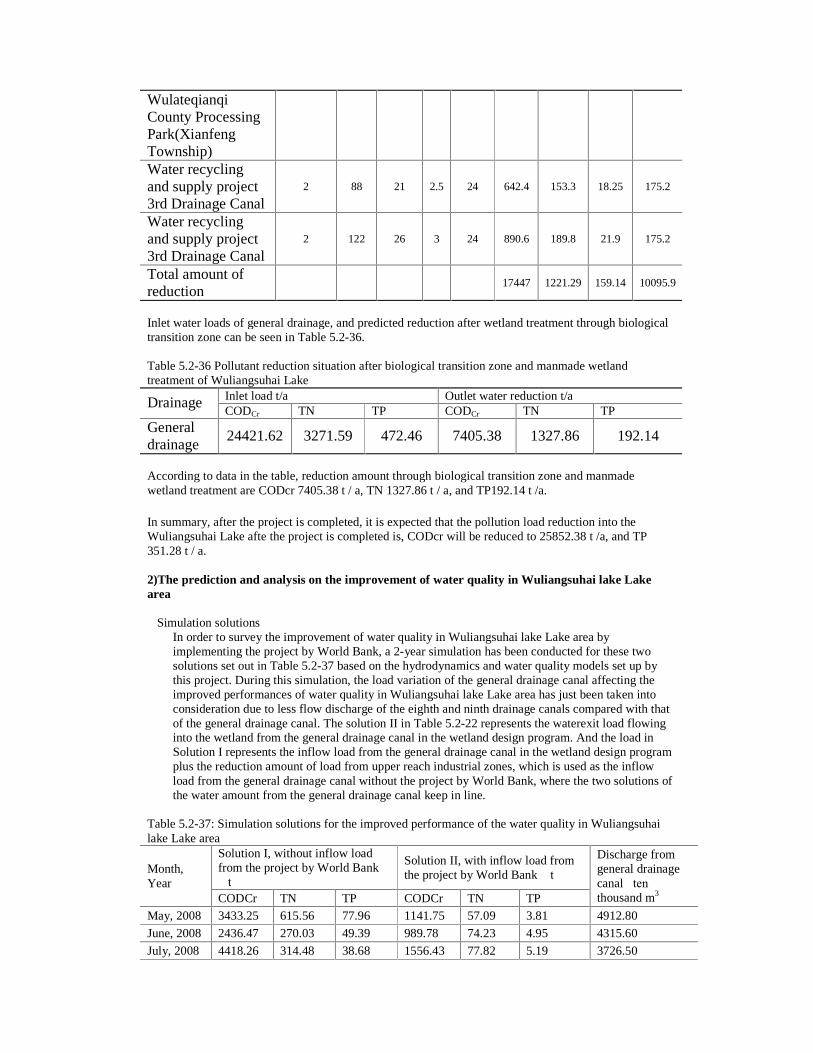
Wulateqianqi County Processing Park(Xianfeng Township) Water recycling and supply project 3rd Drainage Canal
2 88 21 2.5 24 642.4 153.3 18.25 175.2
Water recycling and supply project 3rd Drainage Canal
2 122 26 3 24 890.6 189.8 21.9 175.2
Total amount of reduction
17447 1221.29 159.14 10095.9
Inlet water loads of general drainage, and predicted reduction after wetland treatment through biological transition zone can be seen in Table 5.2-36. Table 5.2-36 Pollutant reduction situation after biological transition zone and manmade wetland treatment of Wuliangsuhai Lake
Inlet load t/a Outlet water reduction t/a Drainage CODCr TN TP CODCr TN TP
General drainage
24421.62 3271.59 472.46 7405.38 1327.86 192.14
According to data in the table, reduction amount through biological transition zone and manmade wetland treatment are CODcr 7405.38 t / a, TN 1327.86 t / a, and TP192.14 t /a. In summary, after the project is completed, it is expected that the pollution load reduction into the Wuliangsuhai Lake afte the project is completed is, CODcr will be reduced to 25852.38 t /a, and TP 351.28 t / a. 2)The prediction and analysis on the improvement of water quality in Wuliangsuhai lake Lake area �Simulation solutions
In order to survey the improvement of water quality in Wuliangsuhai lake Lake area by implementing the project by World Bank, a 2-year simulation has been conducted for these two solutions set out in Table 5.2-37 based on the hydrodynamics and water quality models set up by this project. During this simulation, the load variation of the general drainage canal affecting the improved performances of water quality in Wuliangsuhai lake Lake area has just been taken into consideration due to less flow discharge of the eighth and ninth drainage canals compared with that of the general drainage canal. The solution II in Table 5.2-22 represents the waterexit load flowing into the wetland from the general drainage canal in the wetland design program. And the load in Solution I represents the inflow load from the general drainage canal in the wetland design program plus the reduction amount of load from upper reach industrial zones, which is used as the inflow load from the general drainage canal without the project by World Bank, where the two solutions of the water amount from the general drainage canal keep in line.
Table 5.2-37: Simulation solutions for the improved performance of the water quality in Wuliangsuhai lake Lake area
Solution I, without inflow load from the project by World Bank �t�
Solution II, with inflow load from the project by World Bank �t� Month,
Year CODCr TN TP CODCr TN TP
Discharge from general drainage canal�ten thousand m3�
May, 2008 3433.25 615.56 77.96 1141.75 57.09 3.81 4912.80
June, 2008 2436.47 270.03 49.39 989.78 74.23 4.95 4315.60
July, 2008 4418.26 314.48 38.68 1556.43 77.82 5.19 3726.50
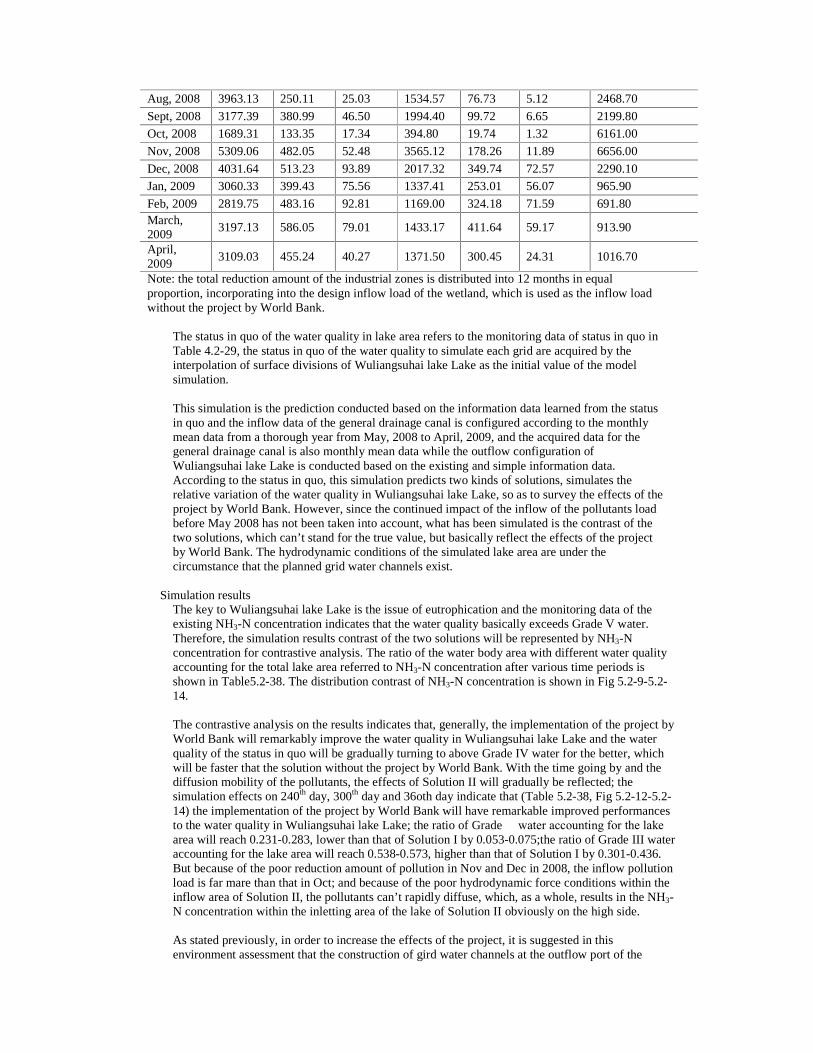
Aug, 2008 3963.13 250.11 25.03 1534.57 76.73 5.12 2468.70
Sept, 2008 3177.39 380.99 46.50 1994.40 99.72 6.65 2199.80
Oct, 2008 1689.31 133.35 17.34 394.80 19.74 1.32 6161.00
Nov, 2008 5309.06 482.05 52.48 3565.12 178.26 11.89 6656.00
Dec, 2008 4031.64 513.23 93.89 2017.32 349.74 72.57 2290.10
Jan, 2009 3060.33 399.43 75.56 1337.41 253.01 56.07 965.90
Feb, 2009 2819.75 483.16 92.81 1169.00 324.18 71.59 691.80 March, 2009
3197.13 586.05 79.01 1433.17 411.64 59.17 913.90
April, 2009
3109.03 455.24 40.27 1371.50 300.45 24.31 1016.70
Note: the total reduction amount of the industrial zones is distributed into 12 months in equal proportion, incorporating into the design inflow load of the wetland, which is used as the inflow load without the project by World Bank.
The status in quo of the water quality in lake area refers to the monitoring data of status in quo in Table 4.2-29, the status in quo of the water quality to simulate each grid are acquired by the interpolation of surface divisions of Wuliangsuhai lake Lake as the initial value of the model simulation. This simulation is the prediction conducted based on the information data learned from the status in quo and the inflow data of the general drainage canal is configured according to the monthly mean data from a thorough year from May, 2008 to April, 2009, and the acquired data for the general drainage canal is also monthly mean data while the outflow configuration of Wuliangsuhai lake Lake is conducted based on the existing and simple information data. According to the status in quo, this simulation predicts two kinds of solutions, simulates the relative variation of the water quality in Wuliangsuhai lake Lake, so as to survey the effects of the project by World Bank. However, since the continued impact of the inflow of the pollutants load before May 2008 has not been taken into account, what has been simulated is the contrast of the two solutions, which can’t stand for the true value, but basically reflect the effects of the project by World Bank. The hydrodynamic conditions of the simulated lake area are under the circumstance that the planned grid water channels exist.
� Simulation results
The key to Wuliangsuhai lake Lake is the issue of eutrophication and the monitoring data of the existing NH3-N concentration indicates that the water quality basically exceeds Grade V water. Therefore, the simulation results contrast of the two solutions will be represented by NH3-N concentration for contrastive analysis. The ratio of the water body area with different water quality accounting for the total lake area referred to NH3-N concentration after various time periods is shown in Table5.2-38. The distribution contrast of NH3-N concentration is shown in Fig 5.2-9-5.2-14.
The contrastive analysis on the results indicates that, generally, the implementation of the project by World Bank will remarkably improve the water quality in Wuliangsuhai lake Lake and the water quality of the status in quo will be gradually turning to above Grade IV water for the better, which will be faster that the solution without the project by World Bank. With the time going by and the diffusion mobility of the pollutants, the effects of Solution II will gradually be reflected; the simulation effects on 240th day, 300th day and 36oth day indicate that (Table 5.2-38, Fig 5.2-12-5.2-14) the implementation of the project by World Bank will have remarkable improved performances to the water quality in Wuliangsuhai lake Lake; the ratio of Grade � water accounting for the lake area will reach 0.231-0.283, lower than that of Solution I by 0.053-0.075;the ratio of Grade III water accounting for the lake area will reach 0.538-0.573, higher than that of Solution I by 0.301-0.436. But because of the poor reduction amount of pollution in Nov and Dec in 2008, the inflow pollution load is far mare than that in Oct; and because of the poor hydrodynamic force conditions within the inflow area of Solution II, the pollutants can’t rapidly diffuse, which, as a whole, results in the NH3-N concentration within the inletting area of the lake of Solution II obviously on the high side. As stated previously, in order to increase the effects of the project, it is suggested in this environment assessment that the construction of gird water channels at the outflow port of the
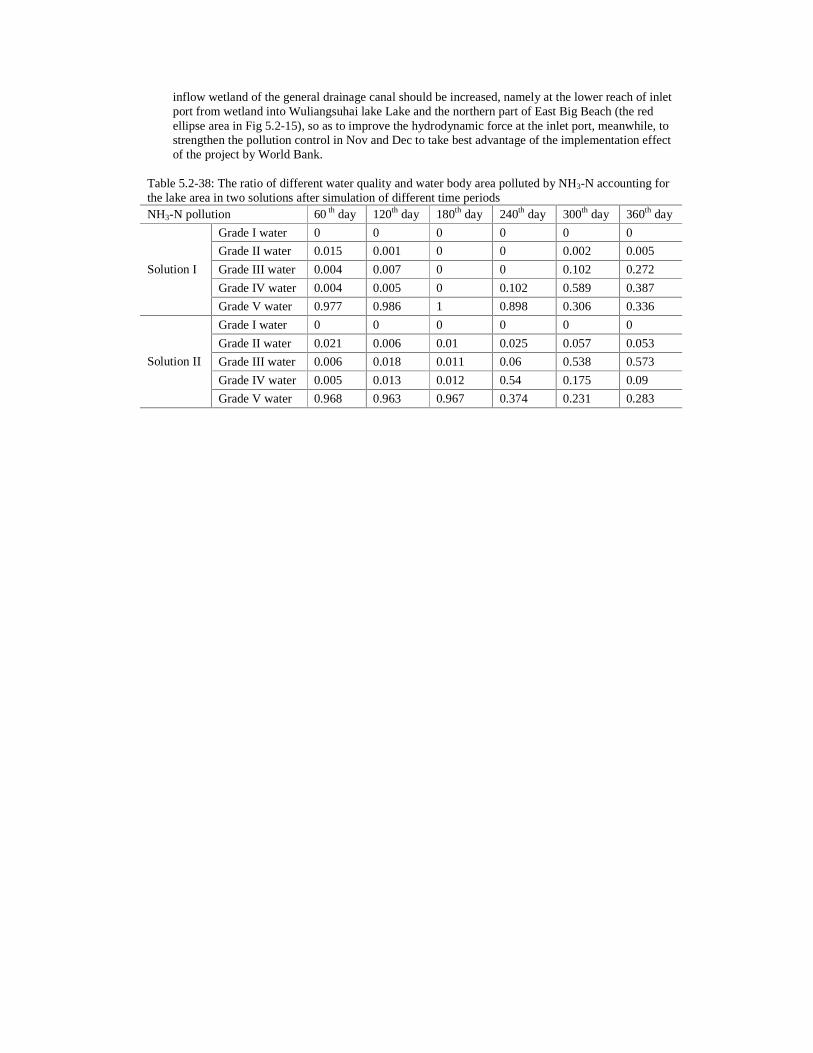
inflow wetland of the general drainage canal should be increased, namely at the lower reach of inlet port from wetland into Wuliangsuhai lake Lake and the northern part of East Big Beach (the red ellipse area in Fig 5.2-15), so as to improve the hydrodynamic force at the inlet port, meanwhile, to strengthen the pollution control in Nov and Dec to take best advantage of the implementation effect of the project by World Bank.
Table 5.2-38: The ratio of different water quality and water body area polluted by NH3-N accounting for the lake area in two solutions after simulation of different time periods NH3-N pollution 60 th day 120th day 180th day 240th day 300th day 360th day
Grade I water 0 0 0 0 0 0
Grade II water 0.015 0.001 0 0 0.002 0.005
Grade III water 0.004 0.007 0 0 0.102 0.272
Grade IV water 0.004 0.005 0 0.102 0.589 0.387
Solution I
Grade V water 0.977 0.986 1 0.898 0.306 0.336
Grade I water 0 0 0 0 0 0
Grade II water 0.021 0.006 0.01 0.025 0.057 0.053
Grade III water 0.006 0.018 0.011 0.06 0.538 0.573
Grade IV water 0.005 0.013 0.012 0.54 0.175 0.09
Solution II
Grade V water 0.968 0.963 0.967 0.374 0.231 0.283
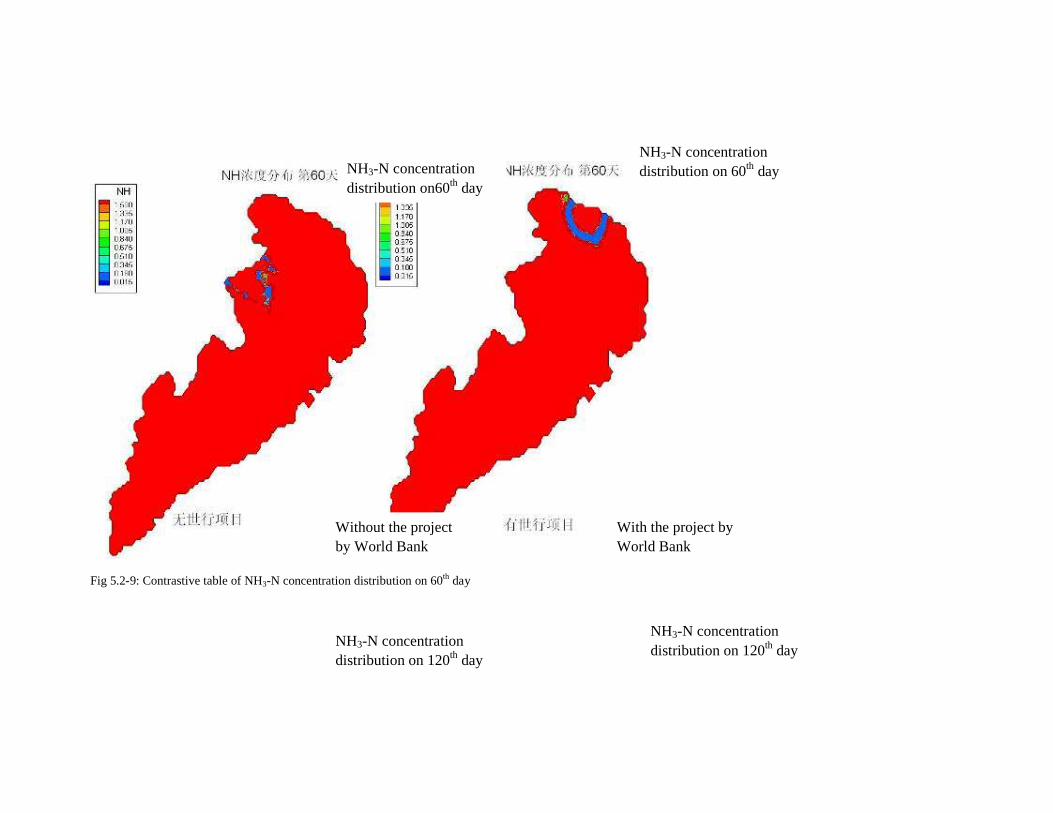
Fig 5.2-9: Contrastive table of NH3-N concentration distribution on 60th day
NH3-N concentration distribution on 120th day
NH3-N concentration distribution on 120th day
NH3-N concentration distribution on60th day
NH3-N concentration distribution on 60th day
Without the project by World Bank
With the project by World Bank
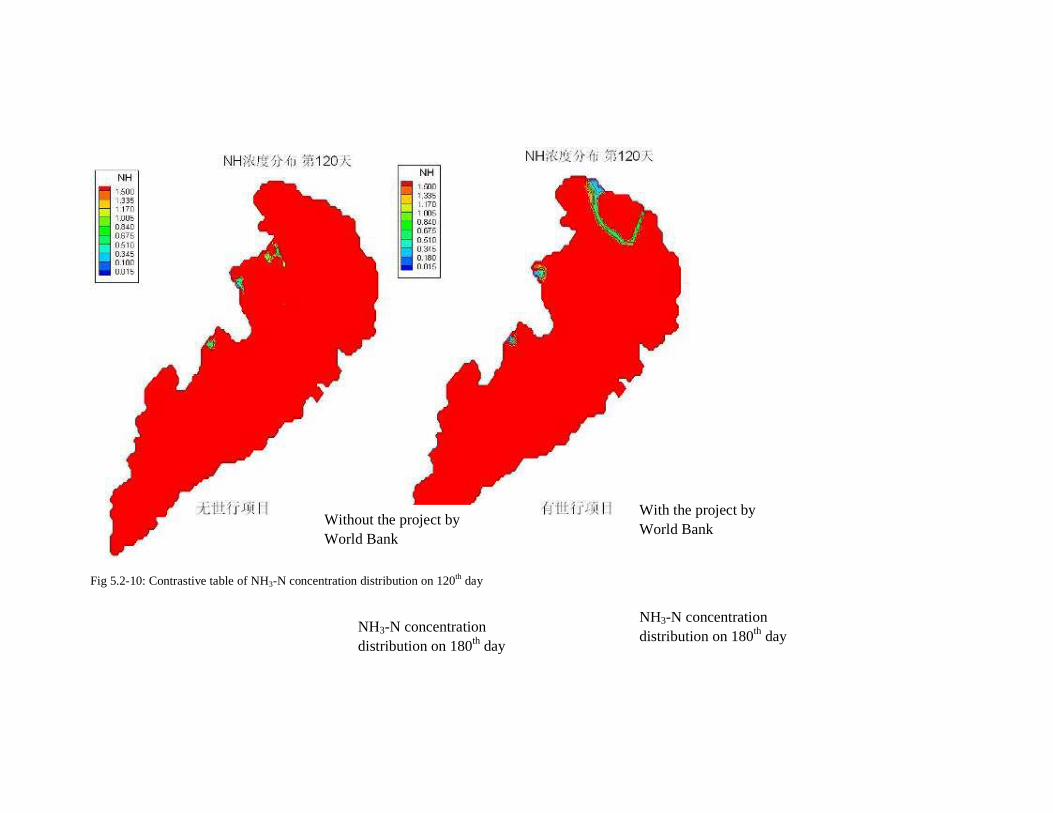
Fig 5.2-10: Contrastive table of NH3-N concentration distribution on 120th day
NH3-N concentration distribution on 180th day
NH3-N concentration distribution on 180th day
Without the project by World Bank
With the project by World Bank

Fig 5.2-11: Contrastive table of NH3-N concentration distribution on 180th day NH3-N concentration
distribution on 240th day NH3-N concentration distribution on 240th day
With the project by World Bank
Without the project by World Bank
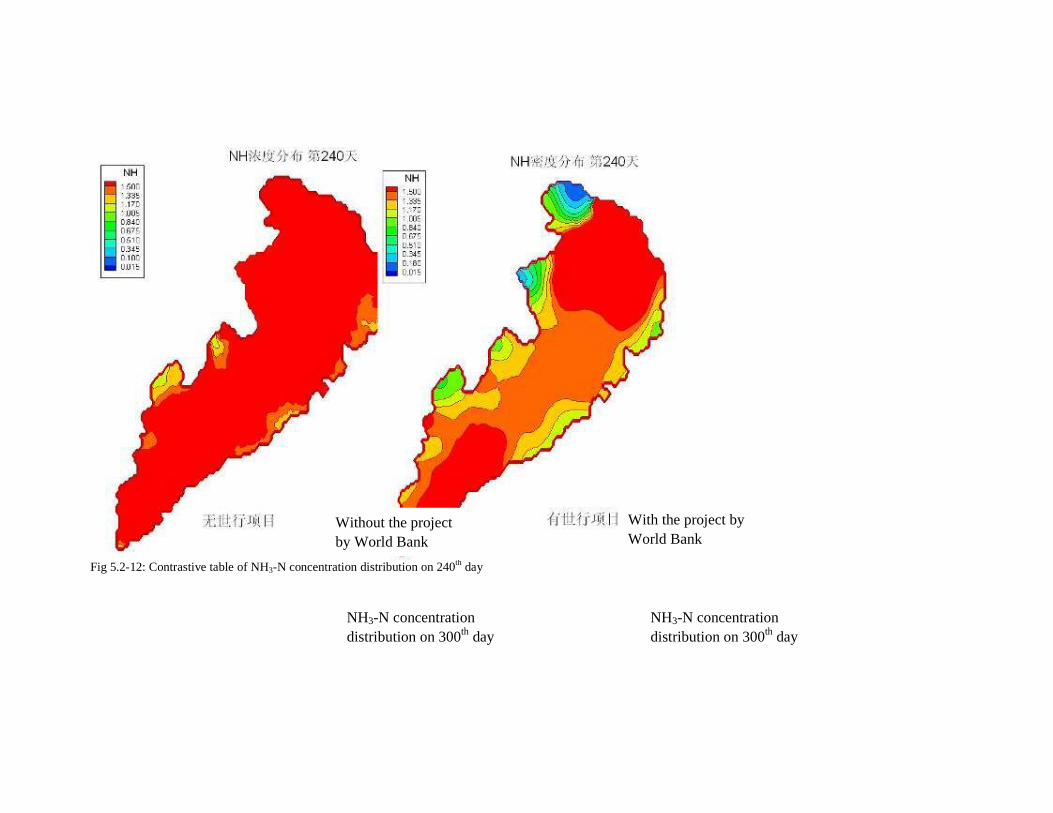
Fig 5.2-12: Contrastive table of NH3-N concentration distribution on 240th day NH3-N concentration
distribution on 300th day NH3-N concentration distribution on 300th day
With the project by World Bank
Without the project by World Bank
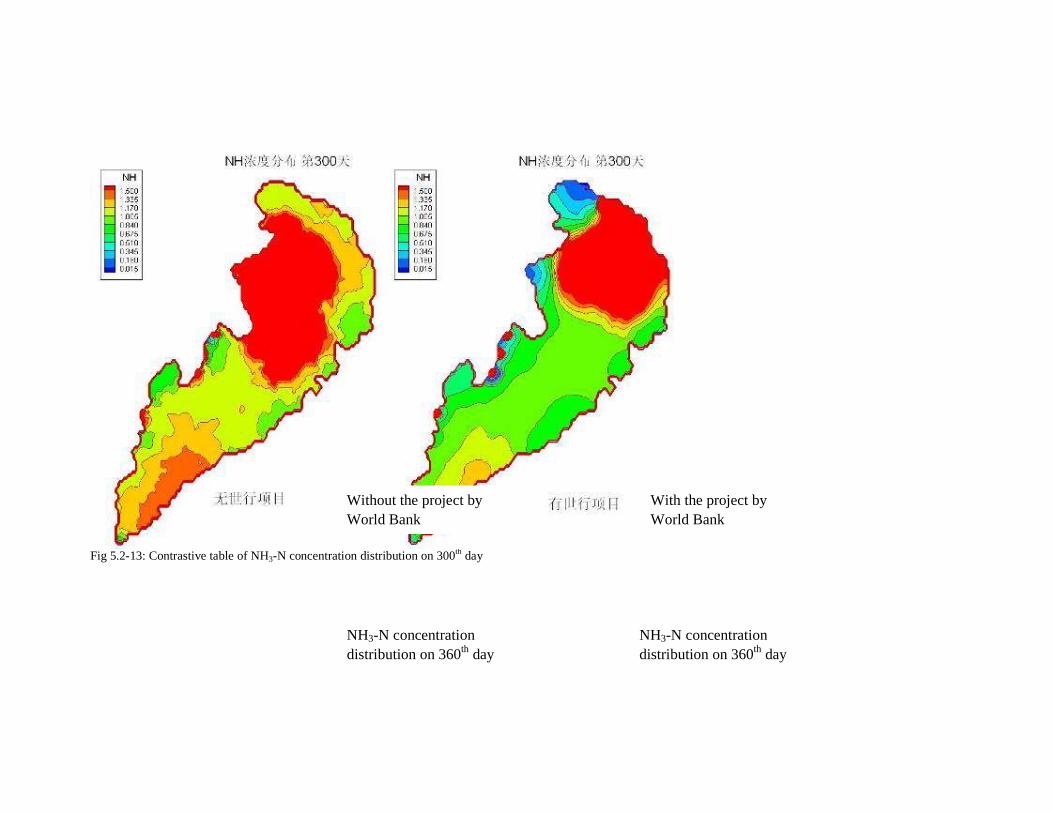
Fig 5.2-13: Contrastive table of NH3-N concentration distribution on 300th day NH3-N concentration
distribution on 360th day NH3-N concentration distribution on 360th day
Without the project by World Bank
With the project by World Bank
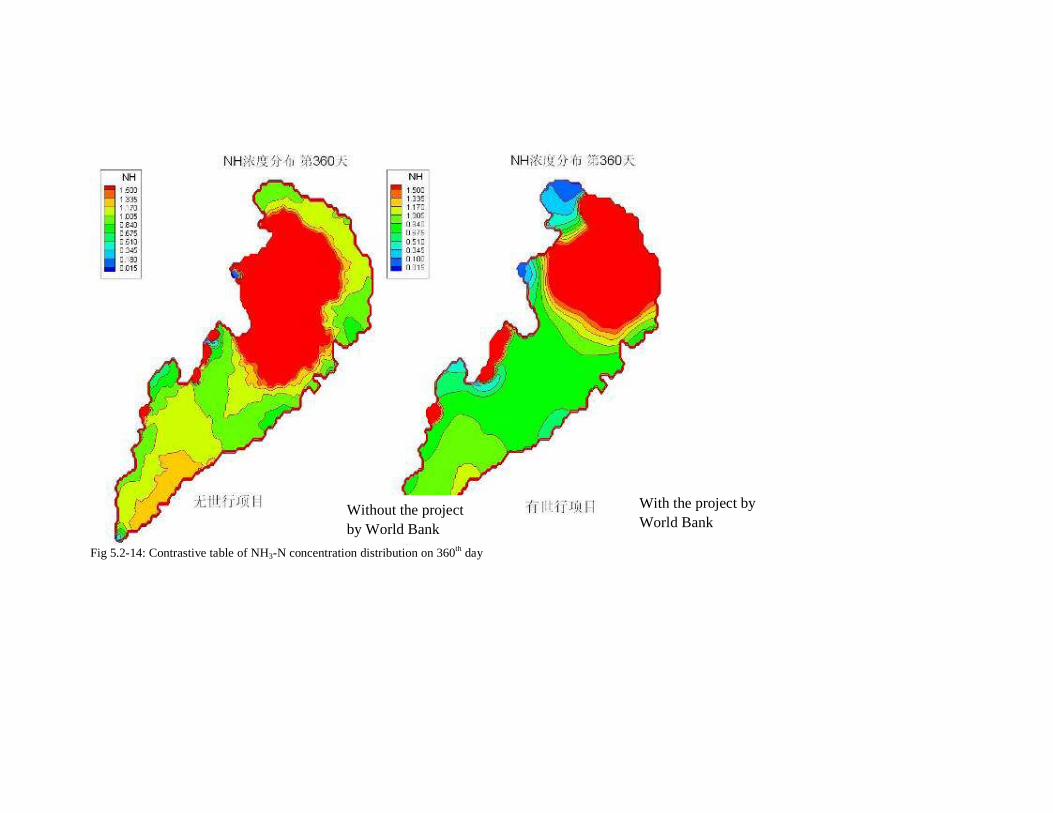
Fig 5.2-14: Contrastive table of NH3-N concentration distribution on 360th day
Without the project by World Bank
With the project by World Bank
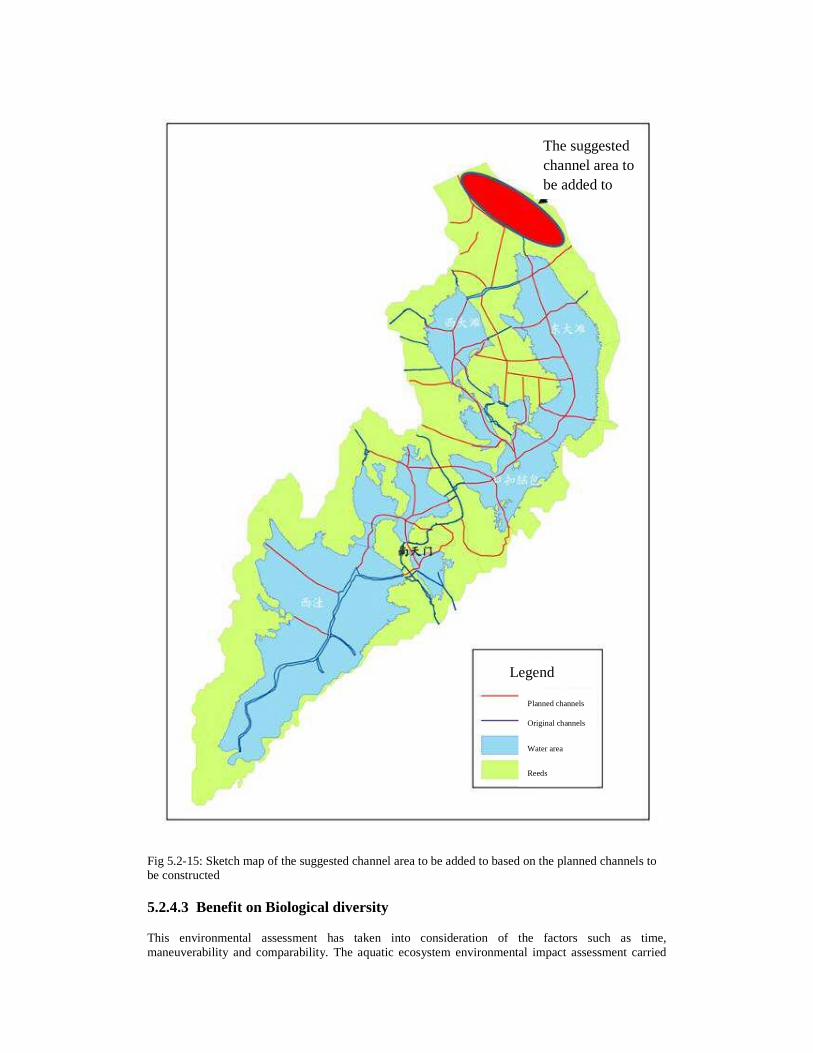
Fig 5.2-15: Sketch map of the suggested channel area to be added to based on the planned channels to be constructed
5.2.4.3 Benefit on Biological diversity This environmental assessment has taken into consideration of the factors such as time, maneuverability and comparability. The aquatic ecosystem environmental impact assessment carried
Planned channels
Original channels
Water area
Reeds
Legend
The suggested channel area to be added to
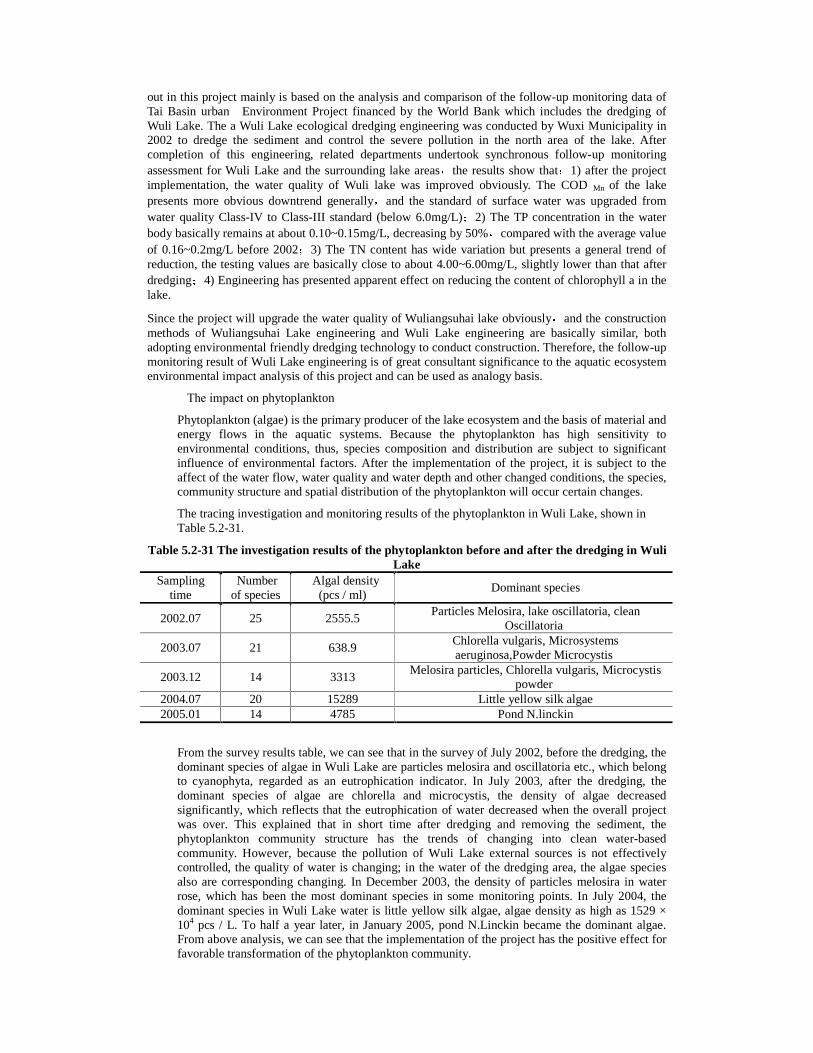
out in this project mainly is based on the analysis and comparison of the follow-up monitoring data of Tai Basin urban� Environment Project financed by the World Bank which includes the dredging of Wuli Lake. The a Wuli Lake ecological dredging engineering was conducted by Wuxi Municipality in 2002 to dredge the sediment and control the severe pollution in the north area of the lake. After completion of this engineering, related departments undertook synchronous follow-up monitoring assessment for Wuli Lake and the surrounding lake areasthe results show that1) after the project implementation, the water quality of Wuli lake was improved obviously. The COD Mn of the lake presents more obvious downtrend generallyand the standard of surface water was upgraded from water quality Class-IV to Class-III standard (below 6.0mg/L)2) The TP concentration in the water body basically remains at about 0.10~0.15mg/L, decreasing by 50%compared with the average value of 0.16~0.2mg/L before 20023) The TN content has wide variation but presents a general trend of reduction, the testing values are basically close to about 4.00~6.00mg/L, slightly lower than that after dredging 4) Engineering has presented apparent effect on reducing the content of chlorophyll a in the lake.
Since the project will upgrade the water quality of Wuliangsuhai lake obviouslyand the construction methods of Wuliangsuhai Lake engineering and Wuli Lake engineering are basically similar, both adopting environmental friendly dredging technology to conduct construction. Therefore, the follow-up monitoring result of Wuli Lake engineering is of great consultant significance to the aquatic ecosystem environmental impact analysis of this project and can be used as analogy basis.
�The impact on phytoplankton
Phytoplankton (algae) is the primary producer of the lake ecosystem and the basis of material and energy flows in the aquatic systems. Because the phytoplankton has high sensitivity to environmental conditions, thus, species composition and distribution are subject to significant influence of environmental factors. After the implementation of the project, it is subject to the affect of the water flow, water quality and water depth and other changed conditions, the species, community structure and spatial distribution of the phytoplankton will occur certain changes.
The tracing investigation and monitoring results of the phytoplankton in Wuli Lake, shown in Table 5.2-31.
Table 5.2-31 The investigation results of the phytoplankton before and after the dredging in Wuli Lake
Sampling time
Number of species
Algal density (pcs / ml)
Dominant species
2002.07 25 2555.5 Particles Melosira, lake oscillatoria, clean
Oscillatoria
2003.07 21 638.9 Chlorella vulgaris, Microsystems aeruginosa,Powder Microcystis
2003.12 14 3313 Melosira particles, Chlorella vulgaris, Microcystis
powder 2004.07 20 15289 Little yellow silk algae 2005.01 14 4785 Pond N.linckin
From the survey results table, we can see that in the survey of July 2002, before the dredging, the dominant species of algae in Wuli Lake are particles melosira and oscillatoria etc., which belong to cyanophyta, regarded as an eutrophication indicator. In July 2003, after the dredging, the dominant species of algae are chlorella and microcystis, the density of algae decreased significantly, which reflects that the eutrophication of water decreased when the overall project was over. This explained that in short time after dredging and removing the sediment, the phytoplankton community structure has the trends of changing into clean water-based community. However, because the pollution of Wuli Lake external sources is not effectively controlled, the quality of water is changing; in the water of the dredging area, the algae species also are corresponding changing. In December 2003, the density of particles melosira in water rose, which has been the most dominant species in some monitoring points. In July 2004, the dominant species in Wuli Lake water is little yellow silk algae, algae density as high as 1529 × 104 pcs / L. To half a year later, in January 2005, pond N.Linckin became the dominant algae. From above analysis, we can see that the implementation of the project has the positive effect for favorable transformation of the phytoplankton community.
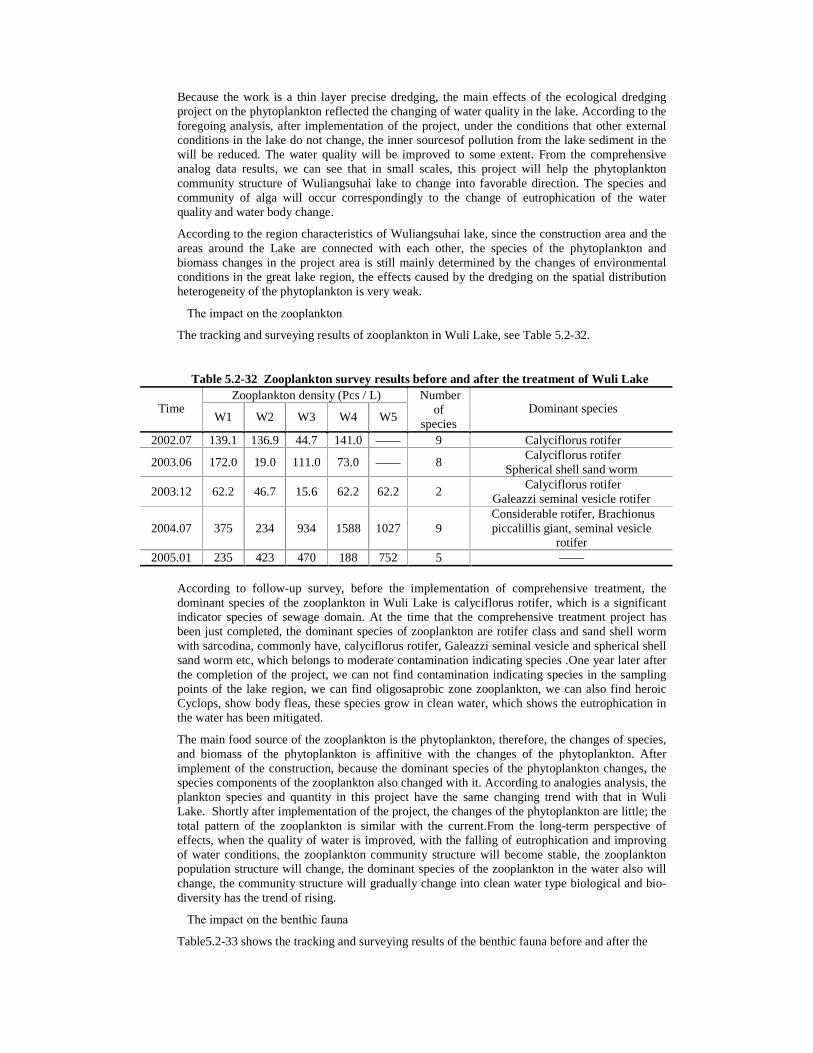
Because the work is a thin layer precise dredging, the main effects of the ecological dredging project on the phytoplankton reflected the changing of water quality in the lake. According to the foregoing analysis, after implementation of the project, under the conditions that other external conditions in the lake do not change, the inner sourcesof pollution from the lake sediment in the will be reduced. The water quality will be improved to some extent. From the comprehensive analog data results, we can see that in small scales, this project will help the phytoplankton community structure of Wuliangsuhai lake to change into favorable direction. The species and community of alga will occur correspondingly to the change of eutrophication of the water quality and water body change.
According to the region characteristics of Wuliangsuhai lake, since the construction area and the areas around the Lake are connected with each other, the species of the phytoplankton and biomass changes in the project area is still mainly determined by the changes of environmental conditions in the great lake region, the effects caused by the dredging on the spatial distribution heterogeneity of the phytoplankton is very weak.
�The impact on the zooplankton
The tracking and surveying results of zooplankton in Wuli Lake, see Table 5.2-32.
Table 5.2-32 Zooplankton survey results before and after the treatment of Wuli Lake Zooplankton density (Pcs / L)
Time W1 W2 W3 W4 W5
Number of
species Dominant species
2002.07 139.1 136.9 44.7 141.0 —— 9 Calyciflorus rotifer
2003.06 172.0 19.0 111.0 73.0 —— 8 Calyciflorus rotifer
Spherical shell sand worm
2003.12 62.2 46.7 15.6 62.2 62.2 2 Calyciflorus rotifer
Galeazzi seminal vesicle rotifer
2004.07 375 234 934 1588 1027 9 Considerable rotifer, Brachionus piccalillis giant, seminal vesicle
rotifer 2005.01 235 423 470 188 752 5 ——
According to follow-up survey, before the implementation of comprehensive treatment, the dominant species of the zooplankton in Wuli Lake is calyciflorus rotifer, which is a significant indicator species of sewage domain. At the time that the comprehensive treatment project has been just completed, the dominant species of zooplankton are rotifer class and sand shell worm with sarcodina, commonly have, calyciflorus rotifer, Galeazzi seminal vesicle and spherical shell sand worm etc, which belongs to moderate contamination indicating species .One year later after the completion of the project, we can not find contamination indicating species in the sampling points of the lake region, we can find oligosaprobic zone zooplankton, we can also find heroic Cyclops, show body fleas, these species grow in clean water, which shows the eutrophication in the water has been mitigated.
The main food source of the zooplankton is the phytoplankton, therefore, the changes of species, and biomass of the phytoplankton is affinitive with the changes of the phytoplankton. After implement of the construction, because the dominant species of the phytoplankton changes, the species components of the zooplankton also changed with it. According to analogies analysis, the plankton species and quantity in this project have the same changing trend with that in Wuli Lake. Shortly after implementation of the project, the changes of the phytoplankton are little; the total pattern of the zooplankton is similar with the current.From the long-term perspective of effects, when the quality of water is improved, with the falling of eutrophication and improving of water conditions, the zooplankton community structure will become stable, the zooplankton population structure will change, the dominant species of the zooplankton in the water also will change, the community structure will gradually change into clean water type biological and bio-diversity has the trend of rising.
�The impact on the benthic fauna
Table5.2-33 shows the tracking and surveying results of the benthic fauna before and after the
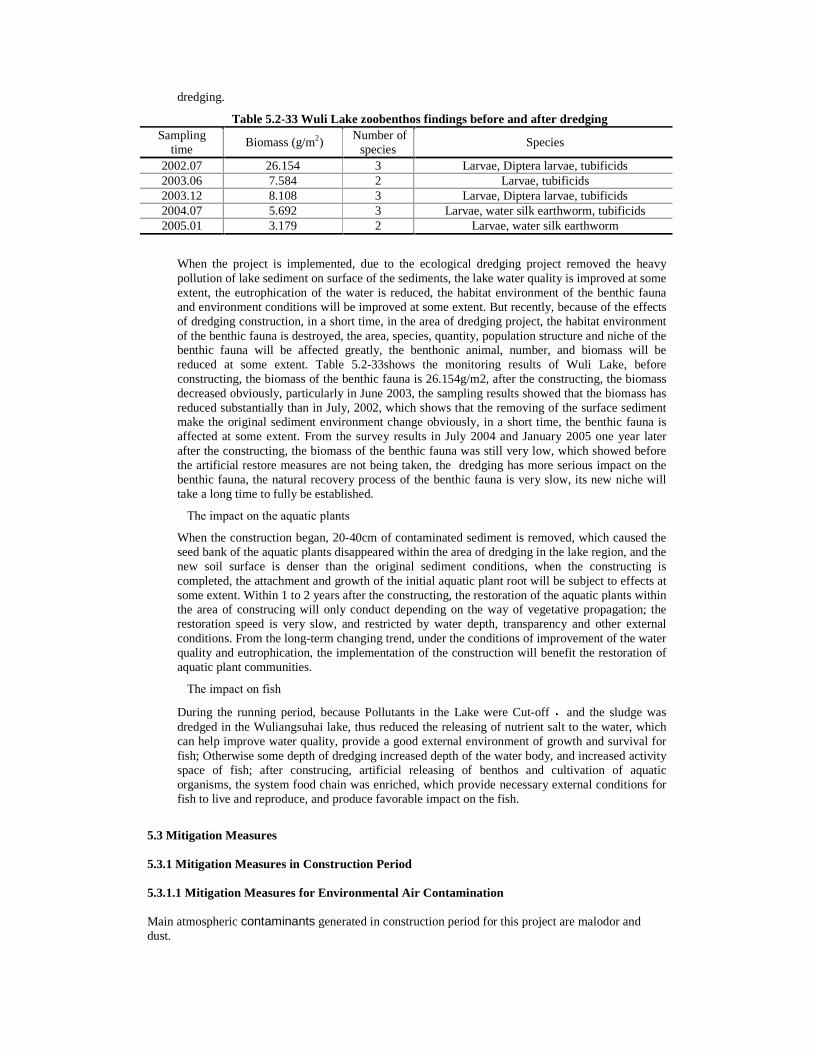
dredging.
Table 5.2-33 Wuli Lake zoobenthos findings before and after dredging Sampling
time Biomass (g/m2)
Number of species
Species
2002.07 26.154 3 Larvae, Diptera larvae, tubificids 2003.06 7.584 2 Larvae, tubificids 2003.12 8.108 3 Larvae, Diptera larvae, tubificids 2004.07 5.692 3 Larvae, water silk earthworm, tubificids 2005.01 3.179 2 Larvae, water silk earthworm
When the project is implemented, due to the ecological dredging project removed the heavy pollution of lake sediment on surface of the sediments, the lake water quality is improved at some extent, the eutrophication of the water is reduced, the habitat environment of the benthic fauna and environment conditions will be improved at some extent. But recently, because of the effects of dredging construction, in a short time, in the area of dredging project, the habitat environment of the benthic fauna is destroyed, the area, species, quantity, population structure and niche of the benthic fauna will be affected greatly, the benthonic animal, number, and biomass will be reduced at some extent. Table 5.2-33shows the monitoring results of Wuli Lake, before constructing, the biomass of the benthic fauna is 26.154g/m2, after the constructing, the biomass decreased obviously, particularly in June 2003, the sampling results showed that the biomass has reduced substantially than in July, 2002, which shows that the removing of the surface sediment make the original sediment environment change obviously, in a short time, the benthic fauna is affected at some extent. From the survey results in July 2004 and January 2005 one year later after the constructing, the biomass of the benthic fauna was still very low, which showed before the artificial restore measures are not being taken, the dredging has more serious impact on the benthic fauna, the natural recovery process of the benthic fauna is very slow, its new niche will take a long time to fully be established.
�The impact on the aquatic plants
When the construction began, 20-40cm of contaminated sediment is removed, which caused the seed bank of the aquatic plants disappeared within the area of dredging in the lake region, and the new soil surface is denser than the original sediment conditions, when the constructing is completed, the attachment and growth of the initial aquatic plant root will be subject to effects at some extent. Within 1 to 2 years after the constructing, the restoration of the aquatic plants within the area of construcing will only conduct depending on the way of vegetative propagation; the restoration speed is very slow, and restricted by water depth, transparency and other external conditions. From the long-term changing trend, under the conditions of improvement of the water quality and eutrophication, the implementation of the construction will benefit the restoration of aquatic plant communities.
�The impact on fish
During the running period, because Pollutants in the Lake were Cut-off and the sludge was dredged in the Wuliangsuhai lake, thus reduced the releasing of nutrient salt to the water, which can help improve water quality, provide a good external environment of growth and survival for fish; Otherwise some depth of dredging increased depth of the water body, and increased activity space of fish; after construcing, artificial releasing of benthos and cultivation of aquatic organisms, the system food chain was enriched, which provide necessary external conditions for fish to live and reproduce, and produce favorable impact on the fish.
5.3 Mitigation Measures 5.3.1 Mitigation Measures in Construction Period 5.3.1.1 Mitigation Measures for Environmental Air Contamination Main atmospheric contaminants generated in construction period for this project are malodor and dust.
�1�Control Measures for Malodor y� Construction for the grid-like watercourse work of Wuliangsuhai Lake area will be done in dry
season section by section. The excavated sediments and wastes shall be transported to local landfill in time for harmless disposal.
y� If the excavated sediments and wastes can not be transported in time, to avoid the effects on the life quality of nearby residents, the sediments shall be loaded into the straw bags for storing to reduce the release of dust and malodor.
y� The transporting of the sediments shall be closed to prevent them from scattering along the road for which will affect the image of the city.
y� Attention shall be paid to the personal protection of the construction staff as well as the inspection work and first aid.
�2�Control Measures for Dusts y� Project management shall be strengthened and the construction being civilized. Loading and
unloading for building materials shall be proper and gentle. The soil adhered to the surface of vehicles shall be removed as much as possible before they leaving from construction sites. When transport limes, aggregates, cement, fly ash and others, transporting vehicles shall be covered with tarpaulin, for which are very easy to generate dusts.
y� Dusts in construction sites and construction roads can be controlled by watering and cleaning. If only do the watering and then cleaning, the amount of dusts can reduce 70 to 80%, while first do the cleaning and then watering, the efficiency of dust control can reach 90%. Tests show that each day do the watering 4 to 5 times to control the dusts in construction site, the dust contamination can be reduced from the scope of 20 ~ 50m. One sprinkling truck shall be provided for each construction site.
y� In addition, lime, sand and others can not be stockpiled in the open as much as possible. If these materials must be stockpiled in the open, watering shall be done for these stockpiled materials to improve their surface water content for which can also play a dust control effect.
y� The selected construction unit shall have a certain strength/qualification, which use commercialized plant-mixed cement and closed-transporting vehicles.
y� For temporary and scattered cement mixing sites, the selection of the site shall consider as far as possible away from the residential buildings.
y� The spoil shall be transported to the low-lying site appointed by the municipal administration department for filling disposal or to the landfill as soon as possible.
y� For the temporary used land, vegetation cover shall be restored to against soil erosion once the work is finished.
y� Dust contamination shall be controlled in construction period, for the residential areas being distributed around each construction site of this project.
(3) Control Measures for Waste Gas of Vehicles The fuel machine and transport veicle for construction shall be equipped with tail-gas purifying devices before operation on the site and use high-grade lead-free fuel so as to ensure the tail gas in conformity with emission criteria.
5.3.1.2 Mitigation Measures for Water Environmental Contamination 1�Treatment Measure of Wastewater in Construction A sedimentation tank shall be built by the construction unit in construction period. With the tank, waste water, piling mud water and standing water and others generated in construction can be discharged outside after precipitating and meeting the requirements. y� Simple living facilities built on construction sites mainly are temporary canteens and temporary
toilets. The waste water from the canteen shall be pretreated by grease trap before combining with domestic wastewater. All waste water shall be sent into the nearby wastewater treatment plant for treatment and discharging outside after meeting the requirements. If there is no nearby wastewater treatment facility, necessary classification shall be done for the waste water generated from the project construction and pipeline construction through the collecting pools, sand pools, drains and other water treatment structures. And the nearby farmers can take them as agricultural fertilizer.
y� During construction, construction workers shall make use of the existing living facilities near the construction site as much as possible. The contractor shall take all necessary measures to prevent
the untreated waste water directly flowing into the existing drainage canals or other surface water bodies.
y� The management of construction site shall be strengthened. The working field and the stockpiling slope of the earthwork shall be keep tidy and in order, so that the earth can be reduced to flow into the nearby rivers.
y� To reduce the amount of generated waste water, materials loss, scattering and overflowing shall be controlled as much as possible.
y� Construction materials such as cement, sand and lime shall be concentrated for stockpiling. Note such material can be stockpiled near the rivers or other water bodies, it is better that the stockpiling site is far away from the rivers with some water against measures being taken. Scattered materials for the above during transporting shall be cleaned in time, so that the materials can be avoided being washed into the water bodies by rainwater. Environmental management shall be strengthened. Note the oil leakage or waste oil dumping for construction machines or construction vessels shall be avoided, for the oil can cause water pollution after entering into water bodies. It is recommended that the leaked oil from construction machines shall be received by some means.
y� All construction waste water is strictly forbidden to discharge into the ground surface water body near the construction site without treatment.
2) Control Measures for Water Pollution in Excavation of Grid Canals in Wuliangsuhai Lake y� A reasonable proposal should be selected for the construction of sea area grid waterway works of
Wuliangsuhai Lake, so as to minminze the decline of water environment quality of some sea area of Wuliangsuhai Lake caused by the release of pollutants in grid excavation.
y� Hydraulic backhoe dredger & grab-type dredger with little disturbance should be used in the construction. After substrate sludge is shoveled up, the turning device moves the bucket to over the sludge barge. A bucket opening device drives a pin and presses down a buffer spring. The bottom of the bucket will open with the force of dead weight & load and unload sludge. No leakage of substrate sludge in excavation exists by and large. The excavated sludge is directly conveyed to the barge around and fills up a fleet of barges, which will be dragged by a tractor to the dumping grounds.
y� Hydraulic backhoe dredger and grab-type dredger work on designated positions in the construction, so as to reduce the disturbance upon substrate sludge and the impact on suspended substance in spreading.
y� Seepage cut-off ditch is set up at dumping ground of substrate sludge, and the leakage water is timely pumped into reed wetlands for treatment after at least 48h settlement.
5.3.1.3 Mitigation Measures for Noise Contamination According to the acoustic environmental impact analysis of construction period, we can see that noise from the construction site has a greater effect on surrounding acoustic environment. Moreover, there are a lot of sensitive points being distributed around each worksite. Therefore, corresponding noise control measures shall be taken by construction units to minimize noise effects on the environment. �1�Strengthening project management and arranging construction schedule properly A scientific schedule shall be prepared with construction work time being arranged properly and noise control regulations for the construction being observed strictly. Note the high noise equipments shall not be applied intensively at the same time as much as possible. The construction is not allowed from 11 pm to 6 am of the next day, if the worksite is � 200m to the residential areas. Furthermore, low noise machines shall be considered in the selection of construction equipments and plans as much as possible. Construction time for high noise equipments shall be arranged in the day time and minimize their working time at night. For some of working sites, if the construction must be done at night with the noise affect the environment of the surrounding residents greatly, a permit shall be obtained from the local environmental protection authorities in advance, and this permit shall be posted. �2�Arranging the construction site properly To avoid noise level for part of place being too high, the powered mechanical equipments shall not be arranged in one place intensively. Preparation work shall be well done before the concrete need continuous pouring work. The running time for the mixer shall be minimized.
�3�Reducing equipment noise level y� The selection of equipments shall consider low-noise equipments as much as possible, for
example, use the hydraulic machines to replace the fuel oil one, and the vibrator use the high-frequency type. Moreover, low noise construction methods shall be considered as much as possible.
y� The noise for stationary machines and earth excavation & transporting equipments such as excavators and bulldozers can be reduced by exhaust silencer and isolation of engine vibration components.
y� As the noise level for mechanical equipments can be increased due to the vibration of loose part or the damage of silencer, the maintenance of construction equipments shall be strengthened in the construction, so that the increasing of noise level caused by the poor performance can be avoided.
y� The idle equipments should be closed immediately, and transporting vehicles entering into the site should be slowed down and reduced the times of whistle
�4�Reducing man-made noise y� The operation of equipments shall be in accordance with specification. And in the process of
dismantling for baffles and supports, operational guideline shall be observed to reduce the impact noise.
y� The use of whistle, bell and flute and others shall be minimized in work commanding, while modern equipments shall be applied.
�5�Establishing of temporary sound barrier Around the high-noise equipment, a temporary cover shall be established. And for the location being relatively fixed equipments, these equipments shall be put into the shed as much as possible. Otherwise, a single sound barrier shall be established properly for these equipments outside the shed. �6�During construction, the noise level along the road will be increased for the operation of transporting vehicles. Therefore, the management of transporting vehicles shall be strengthened. The number of vehicles and traffic density on worksite shall be minimized and the whistle for vehicles will be controlled. And the commissioning for equipments shall be done in the day time. Besides the above noise reduction measures for the construction site, good relationship also have to be established with the peripheral units and residents. Before the construction, the units and residents shall be informed in advance if their living affected by the work. To seek a common understanding, the construction progress and the noise reduction measures taken in the construction shall be reported to them. Proper compensation shall be paid to some of units and residents if the construction affects their living greatly. In addition, a telephone hotline shall be established for the complaints from the affected residents, and the complaining information shall be handled actively. 5.3.1.4 Mitigation Measures for Solid Waste Contamination The wastes include the wastes generated from the construction, the garbage created from the living of construction staff and the sediments excavated from grid-like watercause of lake area. �1�According to the results of the monitoring on heavy metal contents of substrate sludge in sea area of Wuliangsuhai Lake by Bayannaoer Environmental Monitoring Station, heavy metal contents of substrate sludge on monitoring points all aren’t higher than the standard in Control Criteria on Pollutants in Agricultural Sludge (GB4284-84) of the State. Therefore, the substrate sludge excavated in sea area grid works of Wuliangsuhai Lake can be used as fertilizer, and upper layer of substrate sludge is used in improving alkaline saline soil; and lower layer is the parent soil with no pollution, about 2.17 million m3, and can be used in piling up artificial island in the lake area, instead of shipment. According to the tourist plan of Wuliangsuhai Lake, many artificial islands will be constructed on the lake. The excavated substrate sludge on upper layer should be shipped to the dumping ground of substrate sludge as soon as possible for pile-up & disposal. The project is built up with four dumping grounds for substrate sludge, which with land occupation of totally 1200mu and operating period of about five years, are equipped with enclosure bank and seepage-prevention system and can meet the pile-up requirements of substrate sludge in the project.
A closed transport vehicle must be used for substrate sludge in order to prevent any leakage on the way, which may deteriorate the sight and sanitation conditions. The burying process of substrate sludge includes operations i.e. transport on designated point, discharge along the ditch and level-off. The workflow is as follows: transport vehicle daily conveys substrate sludge to a dumping ground, unloads from one end of wide ditch to another in the dumping ground, and the excavator will level off and ensure the even distribution of substrate sludge in wide ditch with a thickness of about 0.5m. The ditches are filled up one after another. With high water content, substrate sludge will be dried by strong sunlight and vaporization naturally, instead of compaction or coverage. Later, it will be piled up again to 2.0m high. To prevent the generation of fly and maggot, liquid medicine or lime can be sprayed on the surface of substrate sludge every several days, and moreover, labor safety and protection for workers are required for preventing epidemic. After substrate sludge is filled up to a preset height, a 30cm-thick undisturbed soil should be covered on the sludge. In light of the daily treatment quantity of the substrate sludge and effective operation distance of excavator, the workload quantity per day is taken as one operating unit. �2�Spoil and construction wastes shall be filled in appointed site according to the requirements of municipal administration department and planning department. If the backfill site is not used temporarily, vegetation cover shall be cultured to prevent the soil erosion. �3�Abandoned material in the construction such as gravel, building materials, steel, packaging materials shall be recovered by special people. And the working face shall be cleaned timely without any sequelae left. �4�To prevent secondary pollution, domestic garbage shall be collected specially and sent to landfill regularly for proper disposal. Huddle and throw is forbidden strictly. In addition, to ensure the living environment and hygienic quality of the surrounding environment for the workers, the contractor shall strengthen the education of construction staff that waste can not be thrown at their will. �5�When confront hazardous wastes in the construction, the work shall be stopped temporarily,. And the local environmental protection department and health department shall be contacted in time. After handling measures being taken, the construction can be started again. 5.3.1.5 Protection Measures for Ecological Environment 1)Mitigation Measures for Soil Erosion During construction period, because the excavation amount for the ground surface is very large with lots of spoil and serious damage to vegetation cover, proper measures have to be taken for this situation. Otherwise, soil erosion will appear with a several-fold increasing trend for the project site. Therefore, strict environmental protection measures shall be taken to control the soil erosion effectively. y� Before the construction of each engineering facility and the pipe work, conditions of underground
engineering geology and underground obstacles shall be understood firstly, for which is the prerequisite and basis of a project.
y� The construction of each engineering facility and the pipe work shall avoid the rainy season. And drainage channels shall be built of the construction sites with serious soil erosion. The construction will take methods of stratified excavation, layered stacked and layered backfill. After completion, the landscape will be restored and the construction shall be in accordance with the design requirements of water-soil conservation strictly. During the construction of water intake work for the reclaimed water supply project, this work shall be done in dray season in order to avoid the effects of wet season for which is a flood season and last from June to August.
y� The planning and design shall be considered properly. The existing roads shall be used fully with no or less construction road working.
y� To reduce construction errors and increase work efficiency, the information based construction shall be strengthened.
y� The earthwork in the construction shall be done properly. Excavated earth shall be used for backfilling of the construction site as much as possible. Besides for backfilling, the spoil
generated from pipe-laying and construction shall be sent to other construction sites for filling and greening work soil or sending to the landfill.
y� Project construction shall be done in phases and area by area. Do not spread the work fully to shorten the single completion period, especially the pipe-laying work. Measures shall be taken for the excavated exposed ground surface, and the exposed time shall be minimized to reduce the soil erosion.
y� To fully consider the effects of greening work on soil erosion control, it is recommended that the construction of each work for individual structure shall be done one by one if possible. To minimize the soil erosion, the greening work shall be done based on worksite greening plans as soon as the work finished.
y� Building materials like cement are not allowed to stockpile near the water bodies, canopy cover and fence shall be set to prevent the rainwater washing them into the water bodies. Appropriate sites shall be selected for the construction wastes (including spoil and abandoned stone) to backfill or stockpile after consultation with the local people. The spoil and abandoned stone shall be used as much as possible for road foundation work and soil conservation project.
y� If the pipeline construction faces these items such as high voltage pole, overpass, main traffic road, municipal pipe network and relevant road, reports have to submit to the relevant management departments. Based on their approvals, the work can be performed. The supports for the nearby buildings (structures) like residential areas and bridges for which are in the scope of the pipeline construction effects shall be considered, especially the effects on ground settlement, nearby buildings (structures) and existing underground pipeline.
y� During construction, the damage to vegetation cover shall be minimized. After construction, measures like planting tree and grass shall be done to speed up the recovery process of vegetation with some engineering measures also being taken for protection. To protect the integrity of the ecosystem, the original land surface height shall be maintained and the landform be restored as original after the completion of construction.
y� Before construction, the construction unit shall prepare detailed construction plans and establish environmental management systems. Special people have to arrange to responsible for the environment protection work during construction. Corresponding control measures and disposal methods shall be made for the “three wastes” generated in the construction. The environment management shall be in accordance with the national environmental guidelines, policies, regulations and standards. To be rule-based and scientific management, various environmental management system shall be established which take post responsibility as the center.
y� To be civilized and cleaned construction, the education of construction staff shall be strengthened with environmental regulations and environmental knowledge being learned.
2) Mitigation Measures for Landscape Ecology Impact y� Define a proper construction proposal, carry out scientific organization and orderly construction,
pile up waste soil of the works at designated place, and take protective measures such as water spraying for preventing flying dust of dumping ground.
y� Strengthen the management of construction site, and cover building material and earthwork transport vehicles with tarpaulin and prevent & control flying dust in transport.
y� Clean and spray water over the construction site and construction road regularly, and prevent & control flying dust on the road.
3) Mitigation Measure for the Impact of Sea Area Treatment Works of Wuliangsuhai Lake y� To prevent the impact of aquatic ecological environment, scientific and reasonable construction
management should be applied in the construction of lake area grid waterway works. y� Zone-by-zone & site-by-site construction and operation at designated place can be used for
preventing widespread disturbance of substrate sludge, so as to reduce the spreading of suspended substance and the impact on the aquatic ecology.
y� The equipment and tool with little disturbance upon substrate sludge should be selected in the construction for reducing disturbance on benthonic realm.
y� Select low-noise construction machine, reasonably organize & arrange the construction, take artificial noise-reducing measure, and lower the impact of construction noises.
y� Strengthen construction management, reduce damage of vegetation, take artificial measures after construction, and speed up recovering process of vegetation, and take some engineering measures for protection.
5.3.1.6 Mitigation Measures for Social Environmental Impact
y� The reasonable acquired land compensation for the villagers shall be in accordance with the land acquisition and resettlement policy and compensation approach of the relevant national government and local government. The villagers’ opinion shall be listened carefully. The working and living conditions for the villagers shall be guaranteed that not lower than the current level.
y� Construction for pipeline and lake area shall be done section by section. The excavation and backfilling shall be done as soon as possible. The construction sites, which near the public facilities such as hospital, school and bus station, shall have temporary pavements and warning signs. During the rush hour, traffic policemen shall give guide and dispatch to ensure smooth flow of pedestrians and vehicles. To reduce the pressure of urban traffic, the transporting of materials shall avoid the rush hour.
y� Awareness training and education of cultural-relics protection for the management and construction staff shall be strengthened. According to field survey information, no cultural-relics have been found currently in the project area. However, if find any cultural-relics in the construction, the local conservation department shall be informed immediately. The site shall be preserved in time and the construction shall be stopped before the proper handling done by the conservation department.
y� To reduce the possibility of traffic jam and the effects on traveling of the residents, the transporting of building materials and waste earth shall be done at night or avoiding the rush hour.
5.3.1.7 Human Health To ensure the construction safety, the contractor shall prepare the health and safety approved by the relevant project management unit (PMU). The contractor shall prepare the induction training program for the construction staff. The facilities like cranes, supports and other shall be fixed rigidly. To avoid the occurrence of personnel casualties, the construction staff shall observe the construction specifications such as Code of Design on Building Fire Protection and Prevention and Specification of Building Safety strictly and wear the personal protection equipments like safety helmet. During construction, the contractor shall avoid transporting the materials in rainy day or at the time of go on/off shift to against traffic jam or accident. To avoid public casualties, proper isolation and protection facilities shall be installed and warning device shall be set up for dangerous sites with special personnel for caring. An effective organization responsible for environment supervising and monitoring shall be established, which can start a fast and efficient procedure for any violation. Detailed environmental and social impact specifications shall be prepared for the contractor and which shall be included into the tender documents. And the obligation for environment must be taken as part of the contract documents. 5.3.1.8 Cultural Resources Although the local cultural departments and site survey for each component have confirmed that there are no physical cultural resources within the project area, the followng Chance-fine procedure should be followed once any physical cultural relics are found during the construction stage: The construction should be stoped immediately once any physical cultural heritages are discovered and the local cultural department and specialist should be reported; The site should be protected by the contractor and should not constructed until the local cultural department issued a permit. 5.3.2 Mitigation Measures in Operation Stage 5.3.2.1 Reclaimed water supply Project 1�Analysis on Water Pollution Control Measures �1�Pollution control measures of Reclaimed water supply project

The pollution control measures of this reclaimed water supply project mainly include pollution control method of industrial wastewater and domestic wastewater.
y� The settling tank sludge water, filter backwashing water and pressure-filtered water from sludge dewatering chamber of this reclaimed water supply project shall be settled then flow back to front distributing well and be treated together with source water.
y� Ultra-filtered and reverse-osmosis tail water from reclaimed water supply projects of Drainage Cannel 3, Drainage Cannel 7 and Ganqimaodu Port Processing Park be send to front distributing after coagulation & and settling treatment and reclaimed with source water from reclaimed water treatment plant; the wastewater will not be drained outside.
y� The process of reverse-osmosis tail water treatment is: tail water coagulation settling effluent reclaimed water treatment device. The main buildings and structures of reverse
osmosis tail water treatment are indicated in diagram 5.3-1 5.3-1 Main buildings & structures of reverse-osmosis tail water treatment
Sn Buildings & Structures
Specification Remarks
1 Regulation tank L×B×H =6m×5m×5m
2 Coagulation Tank L×B×H=5m×5m×3m Chemicals adding device 2 sets, speed reducing mixing device 1 set
3 Settling Tank L×B×H=13m×6m×5m Mud scraper 2 sets, sludge discharge valve 4 sets
4 Reservoir L×B×H=10m×8m×5m Clean water pump 3 sets y� The domestic wastewater of this reclaimed water supply project will be sent to Wulatehouqi
County Processing Park Wastewater Treatment Plant together with domestic wastewater from water supply project of Wulatehouqi County Processing Park. The domestic wastewater of Drainage Cannel 3 reclaimed water supply project will be sent to Hangjin Rear Banner Wastewater Treatment Plant. The domestic wasterwater of Drainage Cannel 7 reclaimed water supply project will be sent to Wuyuan Country Wastewater Treatment Plant. The domestic wastewater of Ganqimaodu Port Processing Park reclaimed water supply project will be treated in underground treatment equipments in factory to meet standard of Reuse of urban recycling water--Water quality standard for urban miscellaneous water conTotalption �GB/T18920-2002�, be used as miscellaneous water for factory but shall not be discharged outside.
�2�Feasibilities Analysis of Water Pollution Control Measures of Reclaimed Water Supply Project
y� The pollutants components of settling tank sludge water, filter backwashing water and pressure-filtered water from sludge dewatering chamber of this reclaimed water supply project are rather simple and main of them are SS. So, after settling, the water quality will be improved greatly, meanwhile rather little wastewater will be generated. This will take a small proportion of the scale of the whole reclaimed water supply project; also, this will have little effect on inlet water quality of reclaimed water plant but will not cause shocks to normal operation of reclaimed water supply facilities.
y� In consideration of brine wastewater caused by ultra-filtered and reverse-osmosis technologies applied in reclaimed water supply project of Drainage Cannel 3, Drainage Cannel 7 and Ganqimaodu Port Processing Park, the wastewater will be coagulated settled then sent to front distribution and be reclaimed together with source water of reclaimed water plant; such wastewater will not drained outside.
y� Suspended matter and salt content of tail water after reverse-osmosis treatment are rather high, but after neutralization, coagulation and settling treatment, not only the suspended matter but also the salt content will be reduced. After treatment, such wastewater will be reclaimed together with resource water to fully utilize and save water resources. So, this method is feasible to treat brine water.
y� The Wulatehouqi County Processing Park wastewater treatment plant, which is related to this project, is also a project benefit from the World Bank loan; now this plant is under construction and the designed scale is 20,000 m3/d (recent-term); ICEAS process is applied and the construction will be performed from May, 2010 to Feb 2010. Drainage Cannel 3 wastewater treatment plant is located at the south of the Drainage Cannel 3 reclaimed water supply project; A2/O process is applied and this plant is completed and in trial operation, the designed scale is 20,000 m3/d. Drainage Cannel 7 reclaimed water treatment plant is located at the south of the Drainage Cannel 3 reclaimed water supply project; this plant is under
construction and the designed scale is 22,000 m3/d in recent term and 44,000 m3/d in future term; active sludge Biolak wastewater treatment process is applied. The domestic wastewater drained quantity of Wulatehouqi County reclaimed water supply project, Drainage Cannel 3 reclaimed water supply project and Drainage Cannel 7 reclaimed water supply project take a rather small proportion of the quantity. Meanwhile the pollutant of such domestic wastewater is single and the content is rather low. When the water flows to the plant, it will take little effect on designed inlet water quantity and quality of the wastewater treatment plant.
y� Therefore, it is feasible that the domestic wastewater caused by reclaimed water supply project engineering and operation is sent to wastewater via network treatment plant nearby and to be treated
�3�Proposal for Water Pollution Control Measures of Reclaimed Water Supply Project
y� People shall strengthen management to ensure normal operation of equipments in design, construction and operation. Standby equipments shall be set. Accident prevention program shall be prepared to prevent serious consequences caused by problems.
y� People shall strengthen management of project construction and operation to ensure the wastewater treatment facilities and the efficiency meet the design standard and requirement, also to ensure long-term, stable and normal operation and qualified tail water discharge.
y� People shall set up sound environmental management rules & regulations and fully implement staff training program.
y� People shall maintain and keep the equipments in good conditions to reduce abnormal running to avoid unqualified discharge and accident discharge risk.
2� Measures of Noise Pollution Control The noises of this project when running may come from the water intake pump chamber, lift pump chamber of reclaimed water plant, sludge dewater system and clean water lift pump station. Noise elimination, vibration elimination and noise isolation measures will be applied to control noise, like low-noise equipments, vibration-reduce method and noise isolated buildings, etc. There are no residents in 50m around the reclaimed water project. Silencers and bumpers are applied in this water in-take pump chamber. The pump chambers are sealed; also double-layer silence doors & windows are equipped. Measures such as installing silencers, bumpers and isolation booth on the noise sources of reclaimed water plant to ensure the noise level in the plant is qualified and meet 2 class as per Standard of noise at boundary of industrial enterprises, ie. 60dB(A)in day and 50dB(A) in night. If lift pumps are added, to reduce noises, it is required that: y� Sound isolation test shall be performed in the plant to ensure that the sound isolation performance
shall not be lower than 25dB(A). y� Low power and low noise type pumps and ventilators shall be selected. Flexible joints shall be
applied to connect the equipments and pipes to avoid vibration. Low noise and low vibration equipments shall be selected in procurement.
y� Make a good layout in consideration of the direction of sound, the shielding function of building and noise-absorbs ion of green plants to reduce noise hazard to staff.
y� Double-layer windows and wall materials with good sound absorption performance shall be applied in the Central Control Room. In structure, dumper ceiling, damper wall and damper floor shall be selected to avoid transmission of noises.
y� Bumper cushions shall be installed in equipments with serious noises as noise-reduce treatment: All pumps and ventilators shall be equipped with bumper base and connected with pipes with flexible joints. All machines and pumps shall be installed on independent bases to avoid noises caused by resonance.
y� Vibration-proof and shock-proof shall be considered in arranging, designing pipes and selecting brackets to abate noises to environment
y� Install silencers to reduce noises of ventilators. y� Make a good and reasonable layout of the plant. Pay high attention of noise distance; arrange the
noise sources centralized and away from office area. y� Pay high attention to greening work. Make a three-dimensional isolation belt near the reclaimed
water plant and pump chamber with flowers, grasslands, woodlands and trees. Grow more high and dense trees to abate noises to circumstances.

y� Noises from equipments can be abated effectively to meet concerned national standard by above methods.
3� Solid Wastes Management Measures �1�Solid wastes control measures of reclaimed water supply project The solid wastes produced by the water supply engineering of reclaimed waterof this project mainly include sludge from reclaimed waterdisposal and the domestic garbage. The sludge from reclaimed waterdisposal is first treated through concentration and dewatering until the water content of the sludge is lower than 80%; since the draining water from drainage canals has micro scale of heavy metals, it is necessary to identify the sludge from reclaimed waterdisposal so as to select the final disposal solution for sludge after completion and operation of this project.
In terms of domestic garbage, an agreement has been reached with local department of environmental sanitation that is responsible for immediate cleaning and transportation to ensure the domestic garbage to be cleaned, transported and disposed of promptly and effectively to prevent such materials from producing secondary pollution. y� It is suggested in this environmental assessment that the domestic garbage produced by the water
supply engineering of reclaimed waterof Wulatehouqi County Processing park shall be transported to Wulatehouqi County Refuse Landfill, the domestic garbage produced by the water supply engineering of reclaimed waterof 3rd Drainage Canal to Hangjinhou Banner Refuse Landfill, the domestic garbage produced by the water supply engineering of reclaimed waterof Wuyuan County Processing park to Wuyuan County Refuse Landfill, the domestic garbage produced by the water supply engineering of reclaimed waterof Gqimaodu Processing park to Wulatezhongqi County Refuse Landfill for disposal.
The details on the capacity and construction progress of the landfills to accommodate the sludge from this component are shown in Table 4.4-8. The design capacity of the municipal refuse landfill of Longxingchang Town, Wuyuan County, is 199t/d. The technique adopted is in line with the mordern sanitary landfill. The service scope covers Longxingchang Town. So far the main civil works and part of the affiliated structures have been completed, the transfer stations, and transporting vehicles have been in preparation.
The design capacity of the municipal refuse landfill capacity of Hangjinhouqi County is 80t/d, which is started to construct in June 2010 and will be operational by the end of November 2010. The service scope covers Shanba Town. The technique are sanitary land fill. It is expected that the refuse landfill capacity of all counties under the project will have adequate idle capacity to accommodate the garbage from this project.
y� Qualified departments will be entrusted to identify the constituent of sludge produced from the
wastewater treatment and reclaimed water plants with reference to Identification Standards for Hazardous Wastes- Identification for Extraction Toxicity (GB5085.3-2007) .Two disposal solutions for sludge are as follows:
The first is that when the sludge from wastewater treatment and reclaimed water plants is identified not to be hazardous waste, it will be treated as common industrial wastes, together with the domestic garbage produced by the water supply engineering of reclaimed water, respectively transported to Wulatehouqi County Refuse Landfill, Hangjinhou Banner Refuse Landfill, Wuyuan County Refuse Landfill, Wulatezhongqi County Refuse Landfill for disposal. The second is that if the sludge from wastewater treatment and reclaimed water plants is identified to be hazardous waste, it must be disposed by Baotou Hazardous Waste Disposal Center, Inner Mongolia, for disposal ( at Midwest of Inner Mongolia). Baotou Hazardous Waste Disposal Center has been operated in line with national regulations for hazardous waste management and it has a cerified tanker fleet and a certified waste transportation procedure. A preliminary agreement has been reached with Baotou Hazardous Waste Disposal Center on the transportation and disposal of the sludge.
Inner Mongolia Baotou (Mid-west area of Inner Mongolia) Hazardous Waste Disposal Center has been established in line with the National Construction Planning of Hazardous Waste and Medical Waste Disposal Facilities, issued by the national State Council. The overall investment is 198 million RMB and the site is located in the west of Hatamen Valley, Agarusutaimu, Jiuyuan District, Baotou City. The hazardous substances from eight cities, including Baotou City, Hohhot City, Erdos City, Wuhai City, Xilin Gol City, Ulan Qab City, Bayannaoer City, Alashan League, and medical waste disposal facilities of Baotou City will be disposed safely here. This center (1st stage) takes coverage of 36 thousand m3 and the overall capacity is 203367m3 The annual landfill quantity is 28760m3/a. The disposing capacities include: incineration 10,800t/a, waste acid 30,000t/a, physical & chemical disposing 5,000t/a and curing process 15,500t/a. Because that sludge produced in the reclaimed water plant is only 4,600.72t/a, Inner Mongolia Baotou (Mid-west area of Inner Mongolia) Hazardous Waster Disposal Center is capable to treat sludge from the reclaimed water plant. This disposal method is feasible.
�2�Proposal for reclaimed water project solid waste control y� Solid wastage of wastewater treatment plant, especially the sludge shall not disposed casually but
be collected and stored properly, and be sent to an agreeable domestic waste landfill site periodically.
y� It is forbidden to discharge sludge of reclaimed water plant to any ground waters, valleys, depressed land, caves or farmland but not exclusive discharge site.
y� In temporary sludge deposit site of reclaimed water plant, foundation anti-seepage, rain proof, odor concentrating and emission and secondary pollution control measures shall be taken.
y� Sludge shelter shall be rain-proof; the ground to deposit sludge shall be hardened. Coffer wall, draining and collection well shall be arranged near the shelter. The collected wastewater from the deposit sludge shall be fed back to reclaimed water treatment system.
y� The dewatered sludge and solid waste of wastewater treatment plant shall be loaded and removed timely. Sludge shall be transported by closed tank trucks.
y� The sludge shall be transported punctually and when the traffic is not so heavy if possible. y� The advance concentrating and dewatering equipments shall be used to reduce the water content
to 75�80%, so as to reduce the quantity of sludge and facilitate utilization. y� The sludge attached on the trucks and wheels shall be removed when the solid waste storage and
transportation vehicles leave the plant (pump station). Also, please check if the vehicle can be well closed or not to avoid pollution to roads.
y� It is suggested that the construction enterprises shall cooperate with agriculture and landscape department to study the sludge serving as greening fertilizer so as to realized recycling of solid waste.
4�Safety measures of Chlorination Room Chlorine leakage accident is the biggest potential pollutant. The leakage will cause hazard to production stuff member and even some influence to circumstances outside the plant. Natural ventilation conditions shall be utilized, if natural ventilation is not practical, mechanical ventilation shall be applied. The ventilation frequency shall be 8~12 times per hour as per standard to ensure fresh air in the room. Meanwhile, the chlorine leakage alarm and absorption systems are equipped. As soon as leakage is happen, the chlorine detecting gauges will detect. If the detected leakage is higher up to preset value, the fan of leakage absorption system and alkaline liquid pumps will run to neutralize the leaked chlorine. Installation of chlorine leakage detecting and alarming devices, layout, quantities and installation method shall comply with concerned regulations in Specification for the Design of Combustible Gas and Toxic Gas Detection and Alarm for Petrochemical Enterprises �SH3063-1999�. The auto-alarm system shall act when chlorine content in air is up to 2~3ppm. The chlorination room shall equip with protection devices such as gas mask for staff members in case of accidents. To avoid chlorine accident caused by wrong operation, the chlorination staff shall be strictly trained; they can work only if they are aware of safety in using chlorine and detailed chlorination operation. All possible measures shall be taken to avoid bursting, oozing, dripping, leaking chlorine. Only operation staff members are allowed to enter chlorination room
Check the equipments periodically to ensure they are in good conditions. Chlorination chamber shall open externally and equip with easy-handle locks to ensure quick escape in emergency situation. 5� Greening To ensure a graceful environment in the reclaimed water supply project plant, double-layer greening program around building and beside roads shall be implemented to increase greening area maximally, while the green-cover percentage shall be higher than 30%. Select good tree species combined with flowers & grasses, fountain, the sculpture & artistic creation and flower beds to make a good layout and graceful environment. Arrange the tree species reasonably and three-dimensional tree belt organically combined with trees & shrubs, grasses and flowers to form a multi-layer greening environment and seasonal beauty of color. Make use of tanks, which are higher than ground, to let climbing plants climb up. Expand the flower bed to make a three-dimensional greening to form an all-season, graceful and beautiful garden-like factory. Set up sanitary protection isolation belt in each reclaimed water supply plants. Use the isolation odor & protection function of greening belt, and especially isolate the living & administration area (front factory area) from production area by greening belt to create a good environment. Grow high and evergreen arbors around the production area and sludge treatment area to make the environment better. 6� List of “Three Simultaneousness” Environment Protection Measures Acceptance “Three Simultaneousness” measures, results and investment estimation are indicated in diagram 5.3-1 5.3-1 List of “Three Simultaneousness” Environment Protection Measure Acceptance
Item Measures and equipments to control Investment(10,000
RMB) Wastewater neutralization coagulation settling buildings and facilities 80 Sludge Sludge treatment facilities 1300
Noise Noise isolation, vibration and noise abatement List and get from
equipments Greening Trees, flowers & grasses 560
Detector Pollutant detectors, sign board of wastewater discharge port and
solid waste site, .etc. 100
Net work construction
Clean & waste water network 25
Chlorine leakage
accident
Set up chlorine leakage detect & alarm device and chlorine absorption device in chlorine chamber. Set up chlorine leakage detect & alarm device in chlorination room
800
Construction period
Control and management measures for wastewater, odor and ecology during construction period
200
Total 4115 5.3.2.2 Mitigation Measures of Wastewater Treatment and Re-use Project in Processing Park 1�Measures to Mitigate Air pollution to Circumstances y� The wastewater treatment plants have effects on environments, mainly it means odor, but odor is
insufferable for people. So, control measures must be taken to reduce the effect of odor. In this project, biological de-odor device is designed to remove odor, so as to control generated odor effectively, therefore, following supplementary measures are represented in this EIR report:
y� Strengthen greening construction in factory area. Green coverage in factory shall not be less than 30%. Greening shall be executed mainly around the grid, sludge treatment system and factory boundary. Generally, high arbors shall be mainly selected as greening trees; also, low shrubs can be supplementary. The green belt around the factory boundary shall be bigger than 5m.
y� Strengthen management of each treatment system of wastewater treatment plant and remove deposited sludge. When the wastewater tanks are stopped to maintenance, the sludge will be emerged, so that the odor will come out. The sludge shall be removed timely to reduce odor.
y� The sanitary protection distance of this project is 50m. The sources of odor are 10m or farther to factory boundary. It is recommended that 40m distance away from the boundary shall be arranged as plan control area, in this area, no civil building or other sensitive permanent buildings are allowed to be built. 2� Measures to Mitigate Water Pollution After this project is completed, the water quality of general drainage cannel in Hetao District will
be improved tremendously. To ensure normal operation of wastewater treatment plant, following measures shall be taken during plant operation:
�1�Reform the heavy pollution enterprises on-site. Close, stop, merge, change or shift unqualified enterprises.
�2�To ensure normal operation and qualified tail water to be discharged as per national standard, enterprises in the Park shall discharge their wastewater to network before their wastewater is treated respectively as well as the industrial feature pollutants are removed. The wastewater to be discharged shall meet Discharge standard for municipal wastewater (CJ3082-1999). The wastewater from sludge de-water chamber and domestic wastewater shall be collected in wastewater network and then be send to treatment process.
�3�The wastewater from heavy pollutant enterprises shall be pretreated in their factories before being discharged. An accident reservoir shall be built to void high load shock to wastewater treatment plant so that the treatment efficiency and tail water quality being affected.
�4�To prevent risk of accidents, starting from design and management, practicable measures shall be taken and accident emergency disposal system shall be established.
�5�Strengthen water pollution monitoring. Install online monitoring devices, which are linked with local environment protection department, in inlet and outlet of wastewater treatment plant. All wastewater treatment plant shall equipped with accident emergency reservoir.
�6�Operation management and operation responsibility system shall be well established; Staff members shall be well trained and technical evaluation files shall be set up for them. The unqualified staff shall not work.
3�Measures to Mitigate Noise Pollution
The noises of wastewater treatment project mainly come from the equipments, which include mechanical equipments like wastewater pump and ventilators, in wastewater treatment plant and wastewater lift pump station. Following measures can be applied to control noise pollution.
1 To select low-noise ventilator, wastewater pump.
2 Compound impedance silences are applied in the inlet and outlet.
3 Use Isolation booth to control noises.
4 Take measures like vibration elimination, noise isolation and underground channel ventilation for aeration tank ventilator room.
5 The ventilator room control can be realized in Central Control Room so that the operators are not required to work in the ventilator room.
�6�A greening belt with certain width is required in the factory boundary. Arrange tri-layer arbor-shrub-arbor green belt and grassland under trees to eliminate the noises.
4�Measures to Mitigate Solid Waste Pollution �1�Sludge Treatment Method There are several methods to treat sludge, major of them are landfill, compost and incineration.
Although the constituents of the sludge to be genrated by this component is not clearly identified in the EA stage, according to analog data, the constituents of sludge of wastewater treatment plant are related to the properties of wastewater to be treated. Normally, the sludge from a wastewater treatment plant, which mainly take up industrial wastewater, contains high level heavy metal content which is much higher than the standard for sludge for agricultural application. Therefore, the sludge from processing park shall not be utilized as agricultural fertilizer. Instead, it shall be disposed by means of sanitary landfill. Inner Mongolia Baotou (Mid-west area of Inner Mongolia) Hazardous Waster Disposal Center will be assigned to treat such sludge. The profile of Baotou Hazardous Waste Disposal Center is showed in 5.3.2.1�Because that sludge produced in this processing park wastewater treatment plant is only 4,307t/a, Inner Mongolia Baotou (Mid-west area of Inner Mongolia) Hazardous Waster Disposal Center is capable to treat sludge from this processing park wastewater treatment plant. This disposal method is feasible. See hazardous and waste treatment agreement of this project in attachment.
(2) Disposal of screenings and domestic garbage
The screenings intercepted by fine and coarse screens are mainly solid substance, including both inorganic and organic substance. They have the properties similar to the domestic garbage and must be properly collected, stored and disposed of. Specific pile-up, packing and transport shall strictly follow the regulations. All domestic garbage must be in bagged. Full-time personnel should be designated to collect and send to the pile-up site designated by local environmental department, and conveyed by garbage truck in timely manner to the solid waste landfill facilities. It is suggested that the screenings in wastewater treatment and domestic garbage of Wulatehouqi County Processing Park should be hauled to the garbage landfill site of Wulatehouqi County; the sludge in wastewater treatment and domestic garbage of Wulateqianqi County Processing Park to thelandfill site of Wulateqianqi County, and the screenings in wastewater treatment and domestic garbage of Ganqimaodu Processing Park to the garbagelandfill site of Wulatezhongqi County. The capacities and construction progress of the garbage landfill sites in the project counties for the project are included in Table 4.4-8. It shows that the construction progress and disposal capacity of the garbage landfill site in the countires can meet the requirement of the project.
Dredged sediment and doimestic garbage shall be transported in tankers, in order to avoid spillage or affect scenery and sanitation. The capacity and construction status of refuse landfills of the project counties are shown in Table 4.4-8. The design landfill capacity of Wulashan Town, Wulateqianqi County is 100t/d. The techniques are sanitary land fill. The service scope covers Wulashan Town. So far the civil works of the landfill have been completede and will be ready for use by the end of 2010. The design landfill capacity of Hai liutu Town, Wulatezhongqi County is 70t/d. The techniques are sanitary land fill. The service scope covers Hailitu Town. So far the civil works is under construction and will be ready for use by the end of August 2011. The design landfill capacity of Wulatehouqi County is 85t/d. The techniqus are sanitary land fill. The service scope covers Ba Yinbaolige Town. So far the civil works in this town is under construction and will be ready for use by the end of October 2011. It can be expected that the design landfill capacity of all the counties can meet the need for disposal of sludge and screenings of the project
5� Measure to Protect Ecological Environment The green coverage may reduce owing to construction. Greening in factory, including greening belt around the factory, grassland in factory and trees beside the roads, shall be performed as compensation. Following measures are recommended to take during greening construction: �1�Pay Attention to Proportion of Arbors, shrubs and grasslands. Keep a certain hierarchical structure. As per greening equivalence defined by ecological service function, an arbor or shrub is equal to 1.5m2 of dense grassland. So, if we enhance the proportion of arbors and shrubs in certain area, the ecological service function will be improved. Meanwhile, a plant community structure including three layer arbor—shrubs—grasses has higher anti-interference abilities. Normally, the green projected area of arbors shall take a proportion higher than 50%, while shrubs 30% at least and grassland 50%(overlapped percentage 130%) �2�Select Mixed Forest Instead of Single-specie Forest Multiple tree species formed by coniferous and broadleaved mixed forest may be applied in greening. Do not use single-specie forest. Economic tree species like poplar, willow and elm are suitable trees to be grown in factory. �3�Use Indigenous Species As Possible The indigenous species fit with local circumstances better and the survival rate is higher. With stronger adaptabilities and capabilities for resisting natural disasters, the indigenous species are preferred tree (grass) species for greening. Local shrubs and grass species shall be selected with sand fixation function.. �4�Strengthen Management
The factory people shall appoint special people for greening and management, also, concerned rules and regulations shall be stipulated to protect grassland and ecological circumstances. 5.3.2.3 Mitigation Measures of Wuliangsuhai Lake Project The operation stage of Wuliangsuhai Lake regulation project is focusing on noise of man-made wetland engineering and solid waste. 1 Measures to Mitigate Noise Pollution The noises of this project mainly come from the pumps of water lift station and compressor of aeration tank. Following measures may be taken to control noise pollution.
y� Double-layer windows and wall material with good sound absorption performance shall be applied in the pump chamber and compressor chamber. In structure, dumper ceiling, damper wall and damper floor shall be selected to avoid transmission of noises. The sound isolation performance shall not be lower than 25dB(A).
y� Low power and low noise type pumps and ventilators shall be selected. y� All pumps and ventilators shall be equipped with bumper base and connected with pipes with
flexible joints. All machines and pumps shall be installed on independent bases to avoid noises caused by resonance.
y� Install silencers to reduce noises of ventilators y� Make a good layout as per the direction of sound, the shielding function of building and
noise-absorbs ion of green plants to reduce noise hazard to staff. y� Vibration-proof and shock-proof shall be considered in arranging, designing pipes and
selecting brackets to abate noises to environment. y� Pay high attention to greening work. Make a three-dimensional isolation belt near the
reclaimed water plant and pump chamber with flowers, grasslands, woodlands and trees. Grow more high and dense trees to abate noises to circumstances.
y� Noises from equipments can be abated effectively to meet concerned national standard by above methods.
2�Measures to Mitigate Solid Waste Pollution Solid wastes produced in lake area regulation project operation mainly include sludge in settling tank and domestic solid waste. The main solid waste generated in the operation of the artificial wetland is sludge in deposition pond, is cleaned every 5-10 years, and should be timely cleaned and shipped out and sent to the garbage dumping site of Wulateqian County for burial treatment. In transportation, some measures shall be taken to prevent secondary pollution caused by leakage. Domestic wastes will be collected and loaded by environmental sanitation department as per the agreement with such department to ensure domestics wastes are removed and sent to the garbage dumping site of Wulateqian County for burial treatment. 3�Mitigation measures for local water cycle impact y� Anti seepage treatment will be adopted by using the buried plastic technology at the outer side of
the reed field in wetland to prevent lateral seepage and infiltration, avoiding soil salinization� y� Strengthen the management of artificial wetland operation, maintain the normal operation of the
anti seepage system to prevent leakage accidents from occurring.

6. Environmental Risk Analysis and Relief Measures 6.1 Environmental Risk Analysis and Relief Measures of Reclaimed Water Supply Works 6.1.1 Environmental Risk Analysis of Reclaimed Water Supply Works The failure of individual equipment of the planned reclaimed water supply works will have no impact on the reclaimed water disposal system by and large; two-way power supply can prevent power cut-off accident and in case of failure of power supply, standby electric generators will timely discharge the untreated reclaimed water into surrounding surface water system for ensuring the safety of reclaimed water supply works while the surrounding surface water system is to be influenced to some extent. Therefore, we’d strengthen the management and maintenance of reclaimed water supply works, and compile an emergency handling proposal for preventing pollution accident of water environment. Chlorine dioxide is used in the planned reclaimed water supply works for disinfection. Sodium chlorate and muriatic acid are purchased for producing chlorine dioxide, with a little chlorine gas as the by-product. Moreover, another key environmental risk of reclaimed water supply works is accident caused by the failure of chlorine dioxide generator in the disinfection. On the basis of the analysis on the damage of the accident, reasonable and feasible prevention measures are put forward for minimizing accident rate, loss and environmental damage of the construction project. Chlorine dioxide, a yellowish red gas with irritative smell can scatter on the ground and is usually diluted to a solution with lower than 10% concentration in use and storage; and with high oxidizability, it may have an explosion reaction with many chemical substance, is extremely sensitive to heat, shock, hit and friction and tends to decompose and explode. Chlorine gas, a yellowish green poisonous gas with irritative smell has a relative density 1.47(0�, 369.77kPa), melting point -101� and boiling point -34.5�, and is dissolved in water and lye. It produces hypochlorous acid and muriatic acid with water, where the hypochlorous acid is then decomposed into muriatic acid nascent chlorine, oxygen, chlorine gas density 2.49, and vapor pressure 506.62kPa (5atm10.3�) and acid. Chlorine and carbon monoxide produces phosgene in intensively heat case. Chlorine gas is non-combustible gas while can support combustion, and explode in mixing with combustible gas in daylight and cause inflammation and explosion with many substances. The chlorine dioxide generator of the project has extremely low output of chlorine dioxide & chlorine gas in abnormal working status. Moreover, chlorine adding workshop is equipped with a lye spraying and absorbing device with processing efficiency of over 98%. Therefore, the accident of the project has a small scope, and in case of accident, timely measures will alleviate the impact rapidly in a short period. In sum, perfect accident handling measures can minimize environmental risk of this project. 6.1.2 Environmental Risk Relief Measures of Reclaimed Water Supply Works 6.1.2.1 Environmental Risk Counter-measures (1) Prevention Measures against Environmental Risk and Accident taken in Design y� Strictly define the production danger area of reclaimed water plant, set up the plan under the
principle of safety and sanitation, take into account wind direction, safe protection distance and other factors, and select corresponding flameproof electric equipment.
y� Set up relevant fire-prevention, explosion-proof, poison prevention, and monitoring, and alarming and other safety facilities for the equipments and pipelines in use according to the properties of chlorine dioxide and chlorine gas.
y� Chemical adding room should be set up with lye spraying system as well as automatic chlorine gas monitoring alarm system.
y� Chemical adding room should be set up with a closed operating cabin of the accident disposal system and waste gas alkaline collecting device in handling accident.
(2) Risk & Accident Prevention Measures in Operation and Management
y� Sophisticated automation system should be used for chemical adding device for effectively controlling production process, timely feeding back the information and shutting down the device in case of accident, so as to reduce the leakage of chlorine dioxide and chlorine gas caused by the accident.
y� Strictly implement the operating regulations, keep to the post, closely monitor the change of process parameters of the equipment, timely report and take effective measures in case of any failure.
y� Chlorine adding room should be provided with forced ventilating equipments. y� Strictly put an end to the leakage of pipeline system, especially the joint between the valve and
pipe, as well as flexible hose and equipment; and carry out regular inspection over pressurized vessel and pressurized component and material.
y� Set up lightning-proof system and fire prevention system; y� Set up cofferdam around the muriatic acid tank with switching device, and build up one accident
collection basin with more than 2m3 volume. In case of leakage accident of muriatic acid, the accident should stay in empty status as usual.
y� The reclaimed water plant should be set up with emergency accident rescue system covering monitoring, early-warning communication, command, first-aide repair and rescue;
6.1.2.2 Relief Measures of Risk Accident (1) Emergency Handling Measures Evacuate the people in leakage polluted area to higher windward position, and close off till the gas completely disappears. Cut off the sources of fire and gas, spray water for diluting, carry out forced ventilation (indoor) or ventilation (outdoor). Gas leaking vessel cannot be reused, for which technical treatment is required for eliminating the remaining gas. (2) Protective Measures
y� Protection of respiratory system: gas mask is required in case of high concentration in the air. In emergency rescue or withdrawal, positive-pressure self-supported respirator is recommended.
y� Protection of eyes: chemical safety protective glasses are required. y� Protection of body: working clothes required. y� Protection of hand: chemical gloves are required for possible touch with poisonous
substance. y� Others: no smoking on the working site. Bath and re-dressing after work, and good sanitation
habits are required. (3) First-aide Measures
y� Skin touch: put off the polluted clothes, and rinse with much flowing fresh water for at least 15min. See a doctor.
y� Eye touch: open the upper & lower eyelids, rinse with much flowing fresh water or physiological salt solution for at least 15min. See a doctor.
y� Inhalation: rapidly leave the site and move to the area with fresh air. Keep smooth breath. Have oxygen therapy in case of difficult breath. See a doctor.
6.2 Environmental Risk Analysis and Relief Measures of Wastewater Treatment and Recycling Works The operation of wastewater disposal plant is usually stable. To minimize the failure, some emergency measure should be defined for wastewater disposal plant and operating management should be strengthened. Several possible cases are analyzed as follows. 6.2.1 Potential Environmental Risk and Accident (1) Emergency Accident Quality problem or improper maintenance of wastewater treatment equipment and facility will cause failure of the equipment and facility. As a result, wastewater treatment efficiency declines and wastewater may be directly discharged instead of any treatment; or some force majeure, such as power shutdown and sudden natural disaster may interrupt the operation of wastewater treatment facility, and a lot of untreated wastewater is directly discharged. This case is extremely abnormal emission of
wastewater disposal plant. In case of abnormal operation of wastewater treatment facility caused by electric power failure, wastewater can only be directly discharged into and pollute the surface water system through overflow pipes. (2) Equipment Failure The failure of wastewater or sludge treatment system lowers the treatment capacity of wastewater. The indicators of outlet water quality fail to comply with the design or sludge fails to timely shrink and dehydrate. As a result, sludge is fermented, and the storage tank is completely packed and smells unfavorably. (3) Impact on Inlet Water Quality The treatment effect of wastewater disposal plant is greatly subject to the inlet wastewater capacity, water quality and other parameters of the plant. According to the State’s statutes on the environmental protection, the emission of industrial wastewater of various enterprises must comply with the standards and the requirements of wastewater disposal plant. In case of sudden accident of wastewater disposal plant of enterprises e.g. power cut-off, its wastewater may be discharged into the wastewater pipeline of the processing area with no treatment and enter a wastewater disposal plant of newly built processing area. In case that inlet waste water causes excessively high impact load, pH value exceeding the scope of 6-9 and the non-decomposable organic poisonous substance higher than the criteria, biochemical and microbe activity of wastewater disposal plant will decline. More seriously, biota is damaged, and sludge is swollen. Finally, outlet water quality deteriorates and exceeds emission standards of the State, and causes decisive unfavorable impact upon water environment and ecological system. (4) Risk and Accident in Normal Operation Due to the suddenness of risk and accident of wastewater treatment system, it may bring vital damage to the personnel maintaining the system and even endanger their lives. In case of environmental risk and accident, the health and safety of the working personnel in wastewater disposal plant are firstly influenced. In case of accident of one construction of wastewater system, the accident must be immediately eliminated. In this case, repair workers should enter wastewater pipe, inlet well or wastewater basin, where poisonous H2S gas tends to exist and accumulate and with no protective measures, repair personnel may breathe in poisonous gas due to bad ventilation and suffer from symptoms such as swirl, unsmooth breath and death in serious case. The wastewater or sludge contains various pathogeny bacteria and helminth eggs. In direct touch with wastewater or sludge, operators may suffer from some intestines diseases and verminosis if sanitation conditions are terrible. 6.2.2 Prevention Countermeasure and Measures of Risk and Accident 6.2.2.1 Prevention Countermeasure of Source Accident Source accident means if the production of enterprise producing wastewater is consecutive, outlet water quality is stable and pretreatment device on the site runs smoothly. The abnormal emission of individual enterprise may cause sharp increase of relevant wastewater concentration and finally influence stable operation of wastewater disposal plant. Therefore, source enterprise should notify wastewater disposal plant timely in the construction start, in order to take some measures. Production limit or shutdown proposal should be implemented for a plant with accident if necessary, for reducing the load and environment risk of wastewater disposal plant.
y� Carry out technical treatment for the reason of abnormal emission, add nutritional substance to aerobiosis basin in case of swelling trend of sludge for improving the properties of the sludge, and strictly control the air quantity of van so as to resolve the swelling problem of sludge on very start.
y� Control the quality of the wastewater of the pipe-connected enterprises, and carry out strict inspection and monitoring of the quality of wastewater, and control water quality in anaerobic hydrolysis basin according to the load design, and ensure the normal operation of anaerobic hydrolysis basin.
y� Clean production should be taken for reducing the arbitrary emission of stench. Production source of stench is to be regularly eliminated. Strengthen the adjustment of gas capacity of aeration basin for reducing arbitrary emission of stench.
6.2.2.2 Accident Countermeasure & Measure of Wastewater Disposal Plant Itself

The accident of wastewater disposal plant itself comes from equipment failure, overhaul or change of process parameter, which deteriorates the efficiency of treatment. With serious water pollution, an accident should be prevented and some emergency measures be prepared.
y� To enable wastewater disposal plant to restore production in the accident status rapidly, main buildings should be provided with relevant buffer capacity and the equipment (e.g. backflow pump, backflow pipe, valve and instrument).
y� Top quality equipments are selected. Top-quality products with low failure rate and easy maintenance should be selected as various machines, instruments and other equipments of wastewater disposal plant. Key equipments should run with one in standby. Wearing parts should be prepared for timely renewal in case of accident.
y� Strengthen the monitoring and control of accident symptom, carry out regular patrol inspection, adjustment, maintenance and repair. Timely find out the symptoms that may cause accident, and eliminate potential accident.
y� Strictly control the process parameters of various disposal units such as water quantity, water quality, residence time and load strength, and ensure the stability of treatment effect. Provide some automatic water flow and quality analyzing and monitoring instruments, and carry out regular sampling and determination. The operators should timely adjust and keep the equipment in good status.
y� To strengthen technical management work of wastewater disposal plant, and improve the treatment efficiency of different process segments are main items of the work for ensuring qualified emission. Wastewater disposal plant shall try to import talents proficient in wastewater treatment technique and management, and meet technical demand of the plant and realize scientific and regularized management. The managerial staff of wastewater disposal plant should have high technical level and management capability. Main operators should have strict trainings on theory and practical operation before work start.
y� Strengthen the operating management and the monitoring of inlet and outlet water. Prohibit any discharge of unqualified wastewater before treatment.
y� Rainwater pipeline outlet and wastewater outlet should be equipped with cut-off control valve. Turn off the valve in case of accident so as to timely hold back the wastewater and prevent the direct entrance of wastewater into water system.
6.2.2.3 Emergency Handling Proposal for Risk and Accident (1) Classification and Organizational Structure of Emergency Handling Proposal In case of accidental emission of the wastewater, the leadership group of the plant for emergency rescue should make judgment on the impact and damage of the accident according to the accident information from the duty room of the emergency rescue command center. For an average accident, only Class-III emergency rescue can be actuated. The head of plant on duty, the person on duty on the site and technical operator should establish a Class-III emergency team for carrying out the rescue action. For large-scale accident with serious damage, the leadership group of the plant for emergency rescue should rapidly set up a field emergency rescue command center comprising the director and deputy director of the wastewater plant and technical, instrument and equipment engineers. According to the demands of rescue on the site of the accident, on the basis of part-time rescue workers of the plant, special teams e.g. rescue, medical service, security guard, communication & information release should be set up and mobilized for emergency rescue action. According to the harm of an accident and emergency rescue required, the emergency rescue actions are divided into three classes: Class-III emergency (early warning emergency, for average accident), Class-II emergency (field emergency, for big accident) and Class-I emergency (overall emergency, for major accident).
y� Class-III emergency: in case of controllable abnormal event or sudden event to be easily controlled e.g. small-size wastewater leakage, and equipment failure, wastewater plant carries out emergency actions such as leakage stopping, medical service, repair and rescue according to the preset procedures;
y� Class-II emergency: in case of any large-size wastewater leakage, sharp increase of pollutant concentration of inlet water and power cut-off of wastewater plant, the harm and impact of the accident exceed the handling capability of Class-III emergency rescue and need the whole emergency rescue force of the plant for disposal;
y� Class-I emergency: the impact of an accident goes outside the bound of wastewater plant and requires the leadership institution of the plant for emergency rescue to coordinate
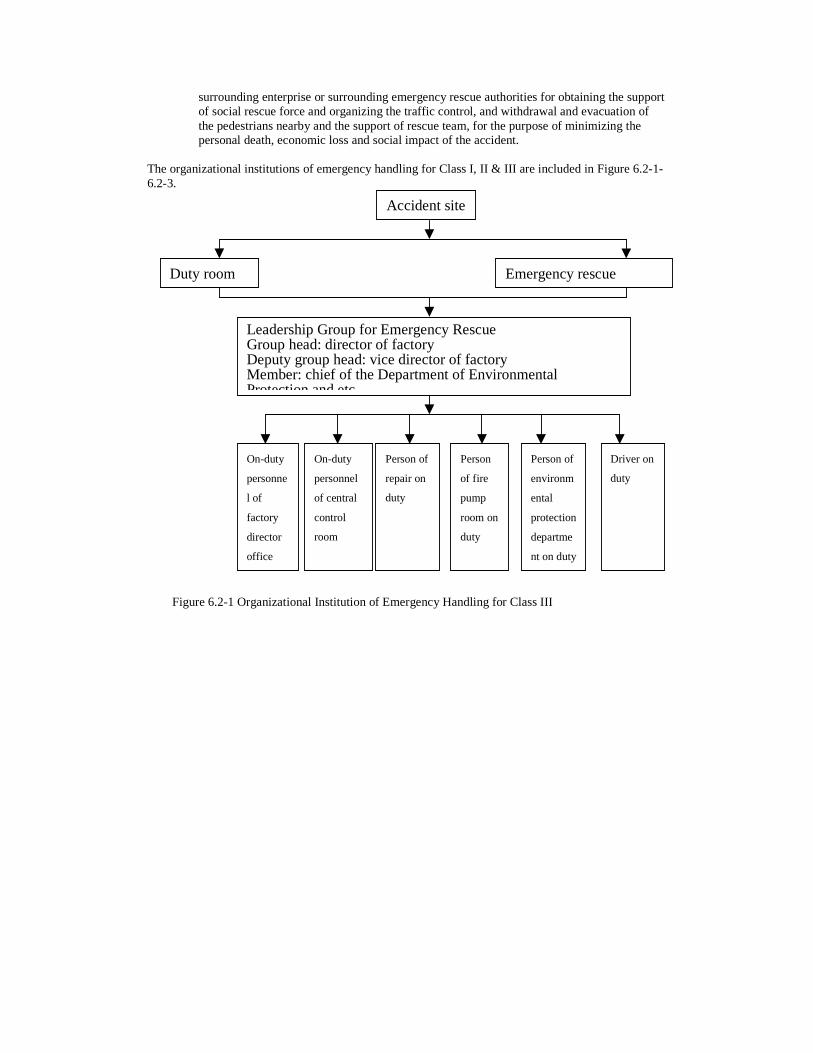
surrounding enterprise or surrounding emergency rescue authorities for obtaining the support of social rescue force and organizing the traffic control, and withdrawal and evacuation of the pedestrians nearby and the support of rescue team, for the purpose of minimizing the personal death, economic loss and social impact of the accident.
The organizational institutions of emergency handling for Class I, II & III are included in Figure 6.2-1-6.2-3.
Figure 6.2-1 Organizational Institution of Emergency Handling for Class III
Accident site
Duty room Emergency rescue
Leadership Group for Emergency Rescue Group head: director of factory Deputy group head: vice director of factory Member: chief of the Department of Environmental Protection and etc.
On-duty
personne
l of
factory
director
office
On-duty
personnel
of central
control
room
Person of
repair on
duty
Person
of fire
pump
room on
duty
Person of
environm
ental
protection
departme
nt on duty
Driver on
duty

Figure 6.2-2 Organizational Institution of Emergency Handling for Class II
Accident site
Duty room Emergency rescue
Leadership Group for Emergency Rescue
Group head: director of factory
Deputy group head: vice director of factory
Member: chief of the Department of
Environmental Protection and etc
Factory
director
office
Central
control
room
Repair
team
Fire
pump
room
Department
of
Environment
Driver
team
Alarm
Emergency Rescue HQ
General director: director of factory
Vice General director: vice director of factory
Member: chief of the Department of Environmental Protection
and head of rescue personnel.
Set up
technica
l team
Expo
rt
team
Environ
ment
monitor
ing
team
News
repor
t
team
After
-
treat
ment
team
Prod
uctio
n
restor
ation
Rescue
and
repair
team
Accide
nt
survey
team
Commu
nication
and
liaison
team
Logistic
s supply
team
Traffic
and
security
guard
team
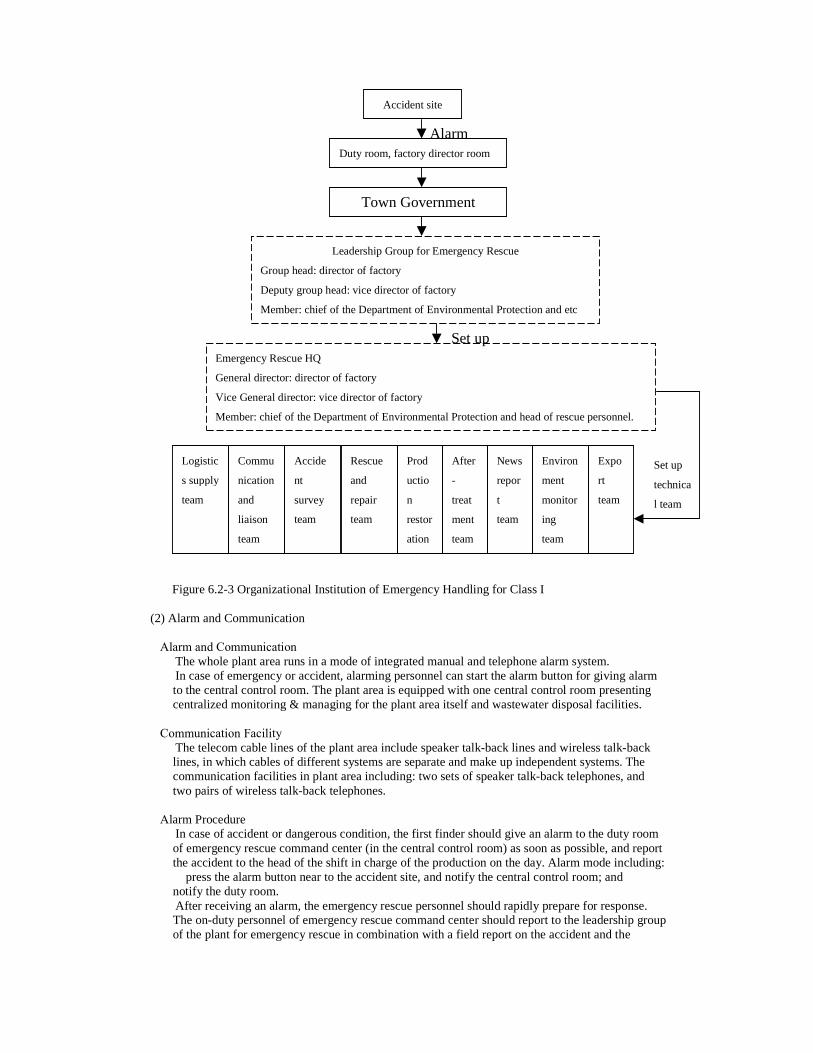
Figure 6.2-3 Organizational Institution of Emergency Handling for Class I
(2) Alarm and Communication � Alarm and Communication
The whole plant area runs in a mode of integrated manual and telephone alarm system. In case of emergency or accident, alarming personnel can start the alarm button for giving alarm to the central control room. The plant area is equipped with one central control room presenting centralized monitoring & managing for the plant area itself and wastewater disposal facilities.
� Communication Facility
The telecom cable lines of the plant area include speaker talk-back lines and wireless talk-back lines, in which cables of different systems are separate and make up independent systems. The communication facilities in plant area including: two sets of speaker talk-back telephones, and two pairs of wireless talk-back telephones.
� Alarm Procedure
In case of accident or dangerous condition, the first finder should give an alarm to the duty room of emergency rescue command center (in the central control room) as soon as possible, and report the accident to the head of the shift in charge of the production on the day. Alarm mode including: � press the alarm button near to the accident site, and notify the central control room; and � notify the duty room. After receiving an alarm, the emergency rescue personnel should rapidly prepare for response. The on-duty personnel of emergency rescue command center should report to the leadership group of the plant for emergency rescue in combination with a field report on the accident and the
Accident site
Duty room, factory director room
Leadership Group for Emergency Rescue
Group head: director of factory
Deputy group head: vice director of factory
Member: chief of the Department of Environmental Protection and etc
Alarm
Emergency Rescue HQ
General director: director of factory
Vice General director: vice director of factory
Member: chief of the Department of Environmental Protection and head of rescue personnel.
Set up
Town Government
Expo
rt
team
Environ
ment
monitor
ing
team
News
repor
t
team
After
-
treat
ment
team
Prod
uctio
n
restor
ation
Rescue
and
repair
team
Accide
nt
survey
team
Commu
nication
and
liaison
team
Logistic
s supply
team
Set up
technica
l team
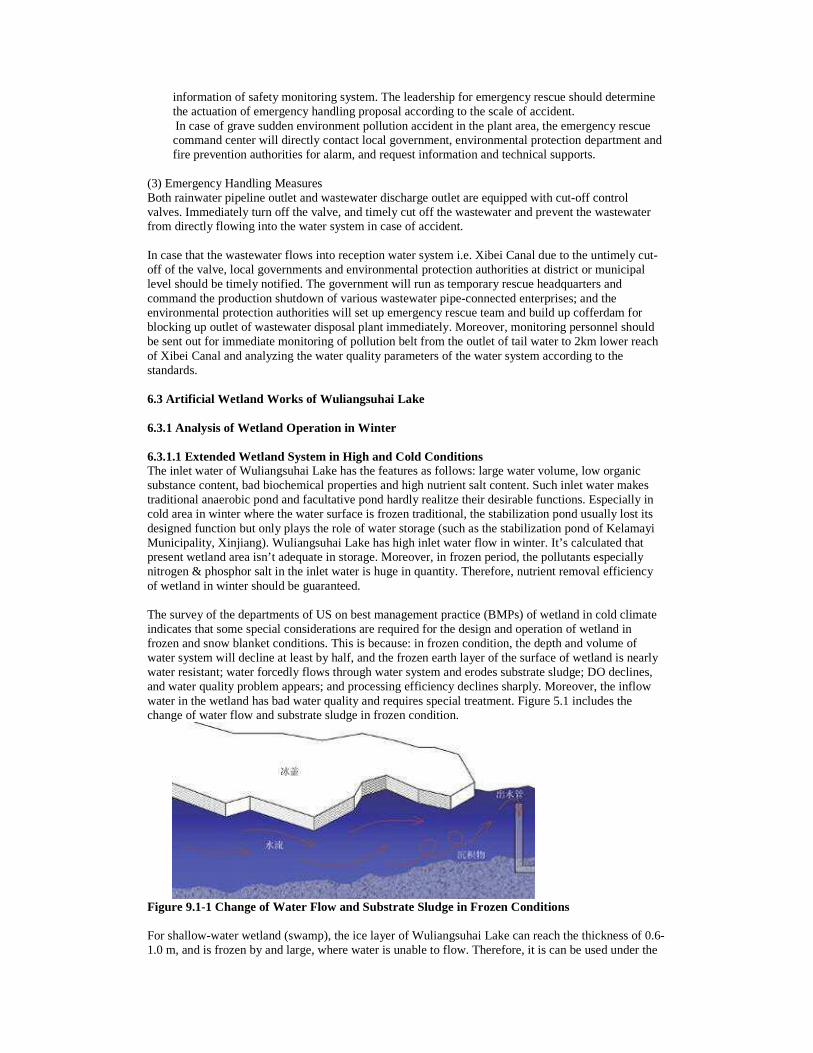
information of safety monitoring system. The leadership for emergency rescue should determine the actuation of emergency handling proposal according to the scale of accident. In case of grave sudden environment pollution accident in the plant area, the emergency rescue command center will directly contact local government, environmental protection department and fire prevention authorities for alarm, and request information and technical supports.
(3) Emergency Handling Measures Both rainwater pipeline outlet and wastewater discharge outlet are equipped with cut-off control valves. Immediately turn off the valve, and timely cut off the wastewater and prevent the wastewater from directly flowing into the water system in case of accident. In case that the wastewater flows into reception water system i.e. Xibei Canal due to the untimely cut-off of the valve, local governments and environmental protection authorities at district or municipal level should be timely notified. The government will run as temporary rescue headquarters and command the production shutdown of various wastewater pipe-connected enterprises; and the environmental protection authorities will set up emergency rescue team and build up cofferdam for blocking up outlet of wastewater disposal plant immediately. Moreover, monitoring personnel should be sent out for immediate monitoring of pollution belt from the outlet of tail water to 2km lower reach of Xibei Canal and analyzing the water quality parameters of the water system according to the standards. 6.3 Artificial Wetland Works of Wuliangsuhai Lake 6.3.1 Analysis of Wetland Operation in Winter 6.3.1.1 Extended Wetland System in High and Cold Conditions The inlet water of Wuliangsuhai Lake has the features as follows: large water volume, low organic substance content, bad biochemical properties and high nutrient salt content. Such inlet water makes traditional anaerobic pond and facultative pond hardly realitze their desirable functions. Especially in cold area in winter where the water surface is frozen traditional, the stabilization pond usually lost its designed function but only plays the role of water storage (such as the stabilization pond of Kelamayi Municipality, Xinjiang). Wuliangsuhai Lake has high inlet water flow in winter. It’s calculated that present wetland area isn’t adequate in storage. Moreover, in frozen period, the pollutants especially nitrogen & phosphor salt in the inlet water is huge in quantity. Therefore, nutrient removal efficiency of wetland in winter should be guaranteed. The survey of the departments of US on best management practice (BMPs) of wetland in cold climate indicates that some special considerations are required for the design and operation of wetland in frozen and snow blanket conditions. This is because: in frozen condition, the depth and volume of water system will decline at least by half, and the frozen earth layer of the surface of wetland is nearly water resistant; water forcedly flows through water system and erodes substrate sludge; DO declines, and water quality problem appears; and processing efficiency declines sharply. Moreover, the inflow water in the wetland has bad water quality and requires special treatment. Figure 5.1 includes the change of water flow and substrate sludge in frozen condition.
Figure 9.1-1 Change of Water Flow and Substrate Sludge in Frozen Conditions For shallow-water wetland (swamp), the ice layer of Wuliangsuhai Lake can reach the thickness of 0.6-1.0 m, and is frozen by and large, where water is unable to flow. Therefore, it is can be used under the
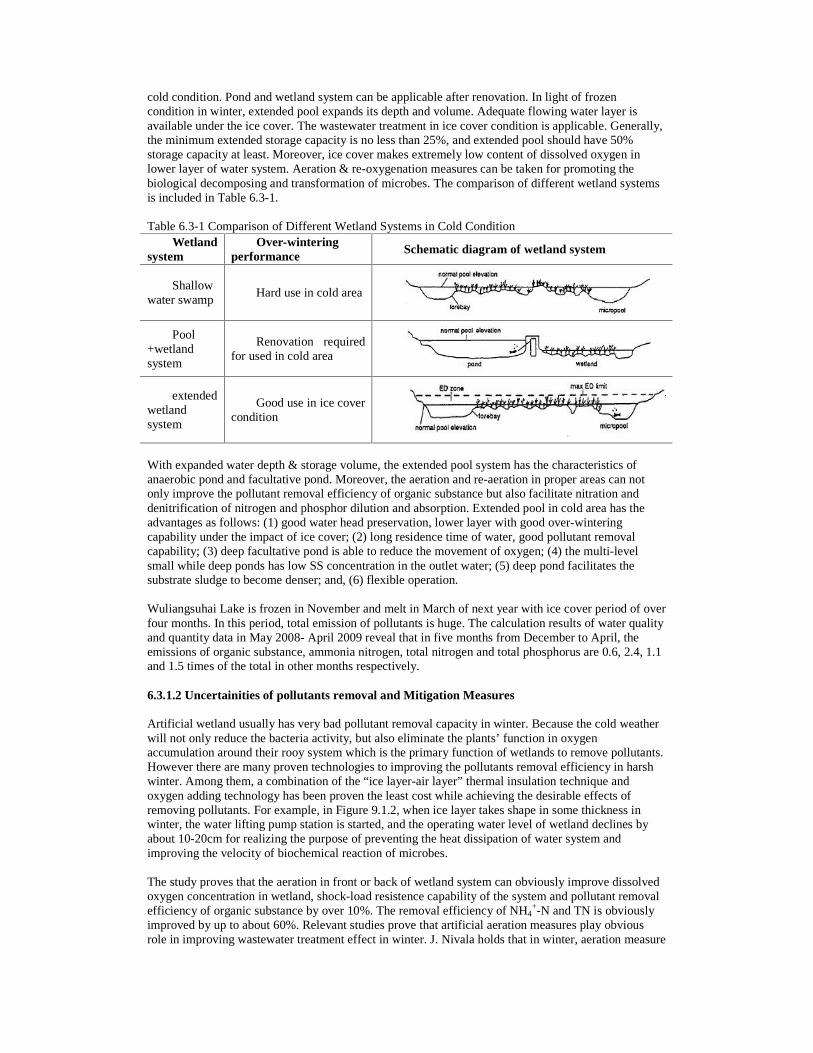
cold condition. Pond and wetland system can be applicable after renovation. In light of frozen condition in winter, extended pool expands its depth and volume. Adequate flowing water layer is available under the ice cover. The wastewater treatment in ice cover condition is applicable. Generally, the minimum extended storage capacity is no less than 25%, and extended pool should have 50% storage capacity at least. Moreover, ice cover makes extremely low content of dissolved oxygen in lower layer of water system. Aeration & re-oxygenation measures can be taken for promoting the biological decomposing and transformation of microbes. The comparison of different wetland systems is included in Table 6.3-1. Table 6.3-1 Comparison of Different Wetland Systems in Cold Condition
Wetland system
Over-wintering performance
Schematic diagram of wetland system
Shallow water swamp
Hard use in cold area
Pool +wetland system
Renovation required for used in cold area
extended wetland system
Good use in ice cover condition
With expanded water depth & storage volume, the extended pool system has the characteristics of anaerobic pond and facultative pond. Moreover, the aeration and re-aeration in proper areas can not only improve the pollutant removal efficiency of organic substance but also facilitate nitration and denitrification of nitrogen and phosphor dilution and absorption. Extended pool in cold area has the advantages as follows: (1) good water head preservation, lower layer with good over-wintering capability under the impact of ice cover; (2) long residence time of water, good pollutant removal capability; (3) deep facultative pond is able to reduce the movement of oxygen; (4) the multi-level small while deep ponds has low SS concentration in the outlet water; (5) deep pond facilitates the substrate sludge to become denser; and, (6) flexible operation. Wuliangsuhai Lake is frozen in November and melt in March of next year with ice cover period of over four months. In this period, total emission of pollutants is huge. The calculation results of water quality and quantity data in May 2008- April 2009 reveal that in five months from December to April, the emissions of organic substance, ammonia nitrogen, total nitrogen and total phosphorus are 0.6, 2.4, 1.1 and 1.5 times of the total in other months respectively. 6.3.1.2 Uncertainities of pollutants removal and Mitigation Measures Artificial wetland usually has very bad pollutant removal capacity in winter. Because the cold weather will not only reduce the bacteria activity, but also eliminate the plants’ function in oxygen accumulation around their rooy system which is the primary function of wetlands to remove pollutants. However there are many proven technologies to improving the pollutants removal efficiency in harsh winter. Among them, a combination of the “ice layer-air layer” thermal insulation technique and oxygen adding technology has been proven the least cost while achieving the desirable effects of removing pollutants. For example, in Figure 9.1.2, when ice layer takes shape in some thickness in winter, the water lifting pump station is started, and the operating water level of wetland declines by about 10-20cm for realizing the purpose of preventing the heat dissipation of water system and improving the velocity of biochemical reaction of microbes. The study proves that the aeration in front or back of wetland system can obviously improve dissolved oxygen concentration in wetland, shock-load resistence capability of the system and pollutant removal efficiency of organic substance by over 10%. The removal efficiency of NH4
+-N and TN is obviously improved by up to about 60%. Relevant studies prove that artificial aeration measures play obvious role in improving wastewater treatment effect in winter. J. Nivala holds that in winter, aeration measure

and thermal insulating measure can realize best treatment effect if applied together, where the removal rate of BOD, COD and NH4
+-N reaches up to 88%, 44% and 93% respectively. An under-ice aeration device can be set up in Wuliangsuhai Lake wetland for improving the pollutant removal efficiency especially in frozen period in winter. Under-ice aeration technique can be used according to local condition.
Figure 6.3.2 Schematic Diagram of Ice Layer-Air Layer Thermal Insulation and Under-ice Aeration 6.3.1.3 Wetland Plant Configuration In small lake-area of Wuliangsuhai Lake, reed is outstanding variety and plays a dominant role. Existing reed can be directly used as the wetland plant, instead of more expensive new species of plants. To improve the tourism value in respect of landscape, a series of landscape plants can be configured. Wetland renovation needs higher water level in operation. The water level should be controlled for realizing optimal pollutant eliminating water depth and maintaining the growth of reed. According to the results of observations on three sampling points of Wuliangsuhai Lake at 37 times, the distribution of reed at water depth of 0-0.5m, 0.5-1.0m and 1-1.5m is 19%, 35% & 36% respectively, with an average of 0.91+0.13 m (95% reliable scope). It proves that reed isn’t fit for the area with 0-0.5m water depth, and most reeds are fit for water depth of 0.5-1.0m. Therefore, the water depth of wetland should be controlled at 0.5-1.0m. 6.3.1.4 Flow Scheme of Extended Wetland System The schematic diagram of the section of compound wetland is included in Figure 6.3-.3.
Figure 6.3-3 Schematic Diagram of the Section of Compound Wetland System 6.3.2 Inlet Water Quantity of Wetland in Winter and Water Quality Analysis 6.3.2.1 Water Quantity Analysis
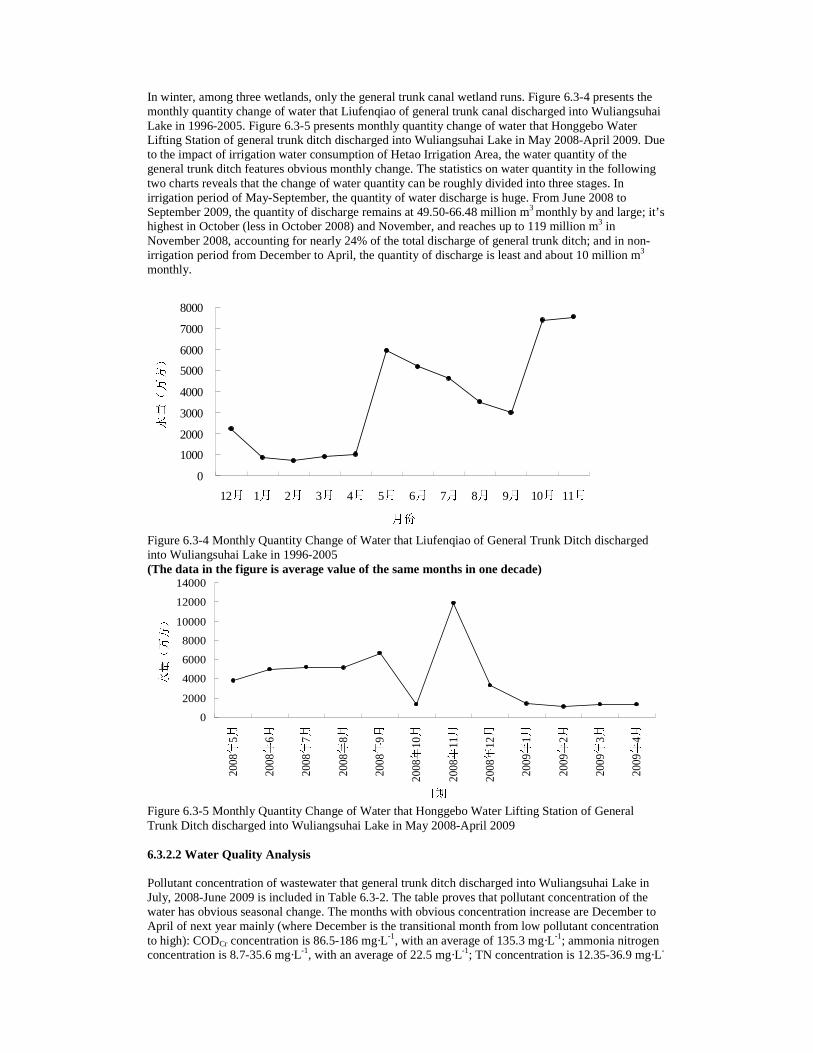
In winter, among three wetlands, only the general trunk canal wetland runs. Figure 6.3-4 presents the monthly quantity change of water that Liufenqiao of general trunk canal discharged into Wuliangsuhai Lake in 1996-2005. Figure 6.3-5 presents monthly quantity change of water that Honggebo Water Lifting Station of general trunk ditch discharged into Wuliangsuhai Lake in May 2008-April 2009. Due to the impact of irrigation water consumption of Hetao Irrigation Area, the water quantity of the general trunk ditch features obvious monthly change. The statistics on water quantity in the following two charts reveals that the change of water quantity can be roughly divided into three stages. In irrigation period of May-September, the quantity of water discharge is huge. From June 2008 to September 2009, the quantity of discharge remains at 49.50-66.48 million m3 monthly by and large; it’s highest in October (less in October 2008) and November, and reaches up to 119 million m3 in November 2008, accounting for nearly 24% of the total discharge of general trunk ditch; and in non-irrigation period from December to April, the quantity of discharge is least and about 10 million m3
monthly.
0
1000
2000
3000
4000
5000
6000
7000
8000
12 1 2 3 4 5 6 7 8 9 10 11
Figure 6.3-4 Monthly Quantity Change of Water that Liufenqiao of General Trunk Ditch discharged into Wuliangsuhai Lake in 1996-2005 (The data in the figure is average value of the same months in one decade)
0
2000
4000
6000
8000
10000
12000
14000
2008
5
2008
6
2008
7
2008
8
2008
9
2008
10
2008
11
2008
12
2009
1
2009
2
2009
3
2009
4
Figure 6.3-5 Monthly Quantity Change of Water that Honggebo Water Lifting Station of General Trunk Ditch discharged into Wuliangsuhai Lake in May 2008-April 2009 6.3.2.2 Water Quality Analysis Pollutant concentration of wastewater that general trunk ditch discharged into Wuliangsuhai Lake in July, 2008-June 2009 is included in Table 6.3-2. The table proves that pollutant concentration of the water has obvious seasonal change. The months with obvious concentration increase are December to April of next year mainly (where December is the transitional month from low pollutant concentration to high): CODCr concentration is 86.5-186 mg·L-1, with an average of 135.3 mg·L-1; ammonia nitrogen concentration is 8.7-35.6 mg·L-1, with an average of 22.5 mg·L-1; TN concentration is 12.35-36.9 mg·L-
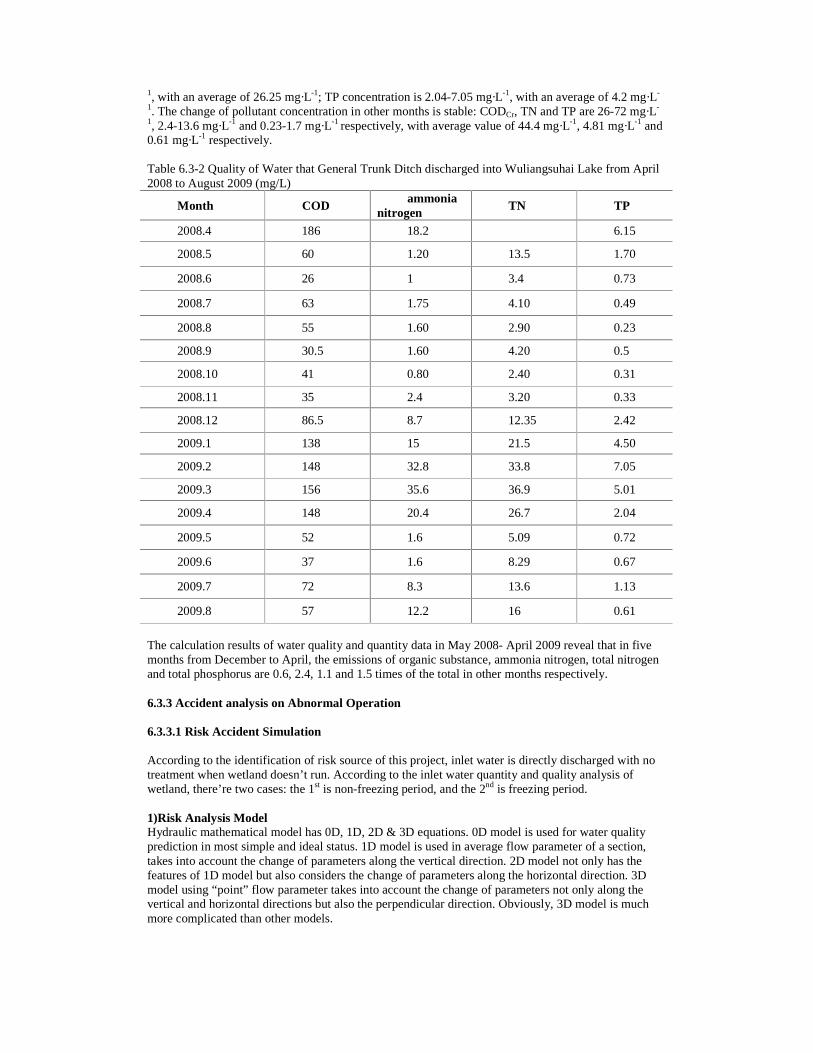
1, with an average of 26.25 mg·L-1; TP concentration is 2.04-7.05 mg·L-1, with an average of 4.2 mg·L-
1. The change of pollutant concentration in other months is stable: CODCr, TN and TP are 26-72 mg·L-
1, 2.4-13.6 mg·L-1 and 0.23-1.7 mg·L-1 respectively, with average value of 44.4 mg·L-1, 4.81 mg·L-1 and 0.61 mg·L-1 respectively. Table 6.3-2 Quality of Water that General Trunk Ditch discharged into Wuliangsuhai Lake from April 2008 to August 2009 (mg/L)
Month COD ammonia
nitrogen TN TP
2008.4 186 18.2 6.15
2008.5 60 1.20 13.5 1.70
2008.6 26 1 3.4 0.73
2008.7 63 1.75 4.10 0.49
2008.8 55 1.60 2.90 0.23
2008.9 30.5 1.60 4.20 0.5
2008.10 41 0.80 2.40 0.31
2008.11 35 2.4 3.20 0.33
2008.12 86.5 8.7 12.35 2.42
2009.1 138 15 21.5 4.50
2009.2 148 32.8 33.8 7.05
2009.3 156 35.6 36.9 5.01
2009.4 148 20.4 26.7 2.04
2009.5 52 1.6 5.09 0.72
2009.6 37 1.6 8.29 0.67
2009.7 72 8.3 13.6 1.13
2009.8 57 12.2 16 0.61
The calculation results of water quality and quantity data in May 2008- April 2009 reveal that in five months from December to April, the emissions of organic substance, ammonia nitrogen, total nitrogen and total phosphorus are 0.6, 2.4, 1.1 and 1.5 times of the total in other months respectively. 6.3.3 Accident analysis on Abnormal Operation 6.3.3.1 Risk Accident Simulation According to the identification of risk source of this project, inlet water is directly discharged with no treatment when wetland doesn’t run. According to the inlet water quantity and quality analysis of wetland, there’re two cases: the 1st is non-freezing period, and the 2nd is freezing period. 1)Risk Analysis Model Hydraulic mathematical model has 0D, 1D, 2D & 3D equations. 0D model is used for water quality prediction in most simple and ideal status. 1D model is used in average flow parameter of a section, takes into account the change of parameters along the vertical direction. 2D model not only has the features of 1D model but also considers the change of parameters along the horizontal direction. 3D model using “point” flow parameter takes into account the change of parameters not only along the vertical and horizontal directions but also the perpendicular direction. Obviously, 3D model is much more complicated than other models.
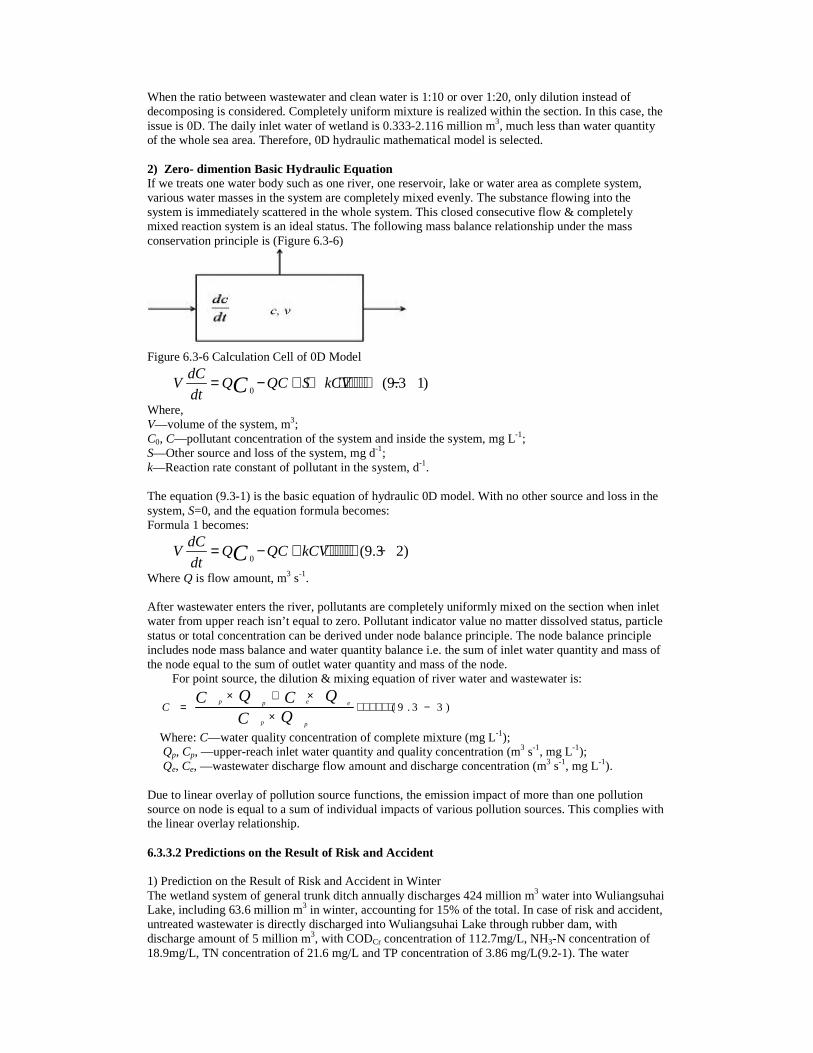
When the ratio between wastewater and clean water is 1:10 or over 1:20, only dilution instead of decomposing is considered. Completely uniform mixture is realized within the section. In this case, the issue is 0D. The daily inlet water of wetland is 0.333-2.116 million m3, much less than water quantity of the whole sea area. Therefore, 0D hydraulic mathematical model is selected. 2) Zero- dimention Basic Hydraulic Equation If we treats one water body such as one river, one reservoir, lake or water area as complete system, various water masses in the system are completely mixed evenly. The substance flowing into the system is immediately scattered in the whole system. This closed consecutive flow & completely mixed reaction system is an ideal status. The following mass balance relationship under the mass conservation principle is (Figure 6.3-6)
Figure 6.3-6 Calculation Cell of 0D Model
0(9.3 1)
dCV Q QC S kCV
dt C= − + + ⋅⋅⋅⋅ ⋅ ⋅ −
Where, V—volume of the system, m3; C0, C—pollutant concentration of the system and inside the system, mg L-1; S—Other source and loss of the system, mg d-1; k—Reaction rate constant of pollutant in the system, d-1. The equation (9.3-1) is the basic equation of hydraulic 0D model. With no other source and loss in the system, S=0, and the equation formula becomes: Formula 1 becomes:
0(9.3 2)
dCV Q QC kCV
dt C= − + ⋅⋅⋅⋅ ⋅ ⋅ −
Where Q is flow amount, m3 s-1. After wastewater enters the river, pollutants are completely uniformly mixed on the section when inlet water from upper reach isn’t equal to zero. Pollutant indicator value no matter dissolved status, particle status or total concentration can be derived under node balance principle. The node balance principle includes node mass balance and water quantity balance i.e. the sum of inlet water quantity and mass of the node equal to the sum of outlet water quantity and mass of the node.
For point source, the dilution & mixing equation of river water and wastewater is:
( 9 . 3 3 )
p ep e
p p
CQ QC C
QC
× + ×= ⋅ ⋅ ⋅ ⋅ ⋅ ⋅ −
×
Where: C—water quality concentration of complete mixture (mg L-1); Qp, Cp, —upper-reach inlet water quantity and quality concentration (m3 s-1, mg L-1); Qe, Ce, —wastewater discharge flow amount and discharge concentration (m3 s-1, mg L-1). Due to linear overlay of pollution source functions, the emission impact of more than one pollution source on node is equal to a sum of individual impacts of various pollution sources. This complies with the linear overlay relationship. 6.3.3.2 Predictions on the Result of Risk and Accident 1) Prediction on the Result of Risk and Accident in Winter The wetland system of general trunk ditch annually discharges 424 million m3 water into Wuliangsuhai Lake, including 63.6 million m3 in winter, accounting for 15% of the total. In case of risk and accident, untreated wastewater is directly discharged into Wuliangsuhai Lake through rubber dam, with discharge amount of 5 million m3, with CODCr concentration of 112.7mg/L, NH3-N concentration of 18.9mg/L, TN concentration of 21.6 mg/L and TP concentration of 3.86 mg/L(9.2-1). The water
storage capacity of Wuliangsuhai Lake is 360 million m3, with CODCr concentration of 67.1mg/L, NH3-N concentration of 15.9mg/L, TN concentration of 19.9 mg/L, TP concentration of 0.77 mg/L (5.2-1). If the above-said values are used in the formula 9.3-3, the concentrations of CODCr, NH3-N, TN and TP are 67.7 mg/L, 15.94mg/L, 19.92 mg/L and 0.81 mg/L respectively. Obviously, leakage has no decisive impact upon the water quality of sea area. 2) Prediction on the Result of Risk and Accident in Summer The wetland system of general trunk ditch annually discharges 424 million m3 water into Wuliangsuhai Lake including 2756 million m3 in summer, accounting for 65% of the total. In case of risk and accident, untreated wastewater is directly discharged into Wuliangsuhai Lake through rubber dam, with discharge amount of 10 million m3 with CODCr concentration of 73.2mg/L, NH3-N concentration of 8.82mg/L, TN concentration of 13.94 mg/L and TP concentration of 1.034 mg/L(9.2-1) . The water storage capacity of Wuliangsuhai Lake is 560 million m3, with CODCr concentration of 38.1mg/L, NH3-N concentration of 0.955mg/L, TN concentration of 2.83 mg/L, and TP concentration of 0.098 mg/L (5.2-1) . If the above-said values are used in the formula 9.3-3, the concentrations of CODCr, NH3, TN & TP are 38.4 mg/L, 1.06mg/L, 2.94 mg/L & 0.106 mg/L respectively. Obviously, leakage has no decisive impact upon the water quality of sea area.
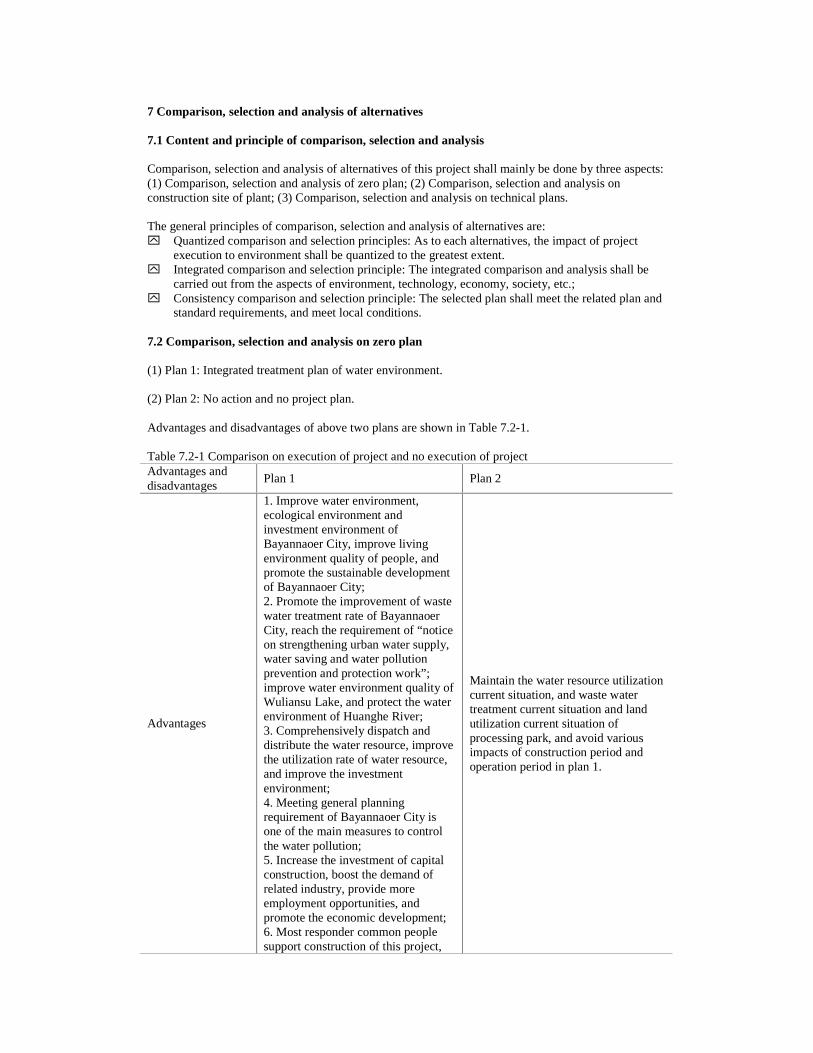
7 Comparison, selection and analysis of alternatives 7.1 Content and principle of comparison, selection and analysis Comparison, selection and analysis of alternatives of this project shall mainly be done by three aspects: (1) Comparison, selection and analysis of zero plan; (2) Comparison, selection and analysis on construction site of plant; (3) Comparison, selection and analysis on technical plans. The general principles of comparison, selection and analysis of alternatives are: y� Quantized comparison and selection principles: As to each alternatives, the impact of project
execution to environment shall be quantized to the greatest extent. y� Integrated comparison and selection principle: The integrated comparison and analysis shall be
carried out from the aspects of environment, technology, economy, society, etc.; y� Consistency comparison and selection principle: The selected plan shall meet the related plan and
standard requirements, and meet local conditions. 7.2 Comparison, selection and analysis on zero plan (1) Plan 1: Integrated treatment plan of water environment. (2) Plan 2: No action and no project plan. Advantages and disadvantages of above two plans are shown in Table 7.2-1. Table 7.2-1 Comparison on execution of project and no execution of project Advantages and disadvantages
Plan 1 Plan 2
Advantages
1. Improve water environment, ecological environment and investment environment of Bayannaoer City, improve living environment quality of people, and promote the sustainable development of Bayannaoer City; 2. Promote the improvement of waste water treatment rate of Bayannaoer City, reach the requirement of “notice on strengthening urban water supply, water saving and water pollution prevention and protection work”; improve water environment quality of Wuliansu Lake, and protect the water environment of Huanghe River; 3. Comprehensively dispatch and distribute the water resource, improve the utilization rate of water resource, and improve the investment environment; 4. Meeting general planning requirement of Bayannaoer City is one of the main measures to control the water pollution; 5. Increase the investment of capital construction, boost the demand of related industry, provide more employment opportunities, and promote the economic development; 6. Most responder common people support construction of this project,
Maintain the water resource utilization current situation, and waste water treatment current situation and land utilization current situation of processing park, and avoid various impacts of construction period and operation period in plan 1.

and construction of project meets the requirement of common people.
Disadvantages
1. Minor dust, waste water, noise, and solid waste, etc., generated during construction period shall destroy the ground surface vegetation and incur soil erosion; it temporarily increases the transport pressure and destroys the landscape of construction site; 2. Water reclamation plant, waste water treatment plant and pump room, etc. permanently occupy part land, and change the utilization mode for such land. The pollutant as waste water, noise, offensive odor and sludge, etc., during run of intended project construction shall incur certain impact to environment in the circumference; 2. Improve the treatment cost of water supply and wastewater, increase the outlay of water consumption of enterprise;
1. With the industrial development of Bayannaoer City, the wastewater quantity is increasing, a large number of wastewater without treatment shall be directly discharged into the ground surface water system, the pollution of water system shall be worsened continually, and it shall impact the living quality of residents and sustainable development of economy. 2. The treatment rate of industrial wastewater is far below the environment protection requirement of China, and this seriously restricts the economic development of Bayannaoer City; 3. The groundwater is exploited greatly, the level of groundwater is continually decreased, forming underground funnel. If this situation is continued for a long term, in the future there shall have no water for exploitation, water environment quality shall be further worsened, and this shall impact the residential environment of residents in the circumference of drainage area. 4. The worsening of water quality of water environment of Wuliansu Lake is speeded up, paludification process is speeded up, wetland function disappears, and destruction speed of ecological environment is speeded up, and this threats the safety of water environment of Huanghe River. 5. It does not meet the requirement of general planning.
According to table 7.2-1, after execution of plan 1, although it shall incur certain environmental impact during construction and operation of this project, these impacts are limited by time and space aspects, through various measures the impact can be eliminated or reduced to the greatest extent, and shall not incur unfavorable impact of large area to regional environment, furthermore, execution of plan 1 can change the current situation of pollution of water environment of Bayannaoer City, comprehensively dispatch and distribute the water resource, improve regional ecological environment, improve the living environment quality of people, promote the sustainable development of Bayannaoer City, and this also meets the requirement of vast common people. Thus plan 1 is deemed as reasonable during this appraisal. 7.3 Comparison, selection and analysis on alternatives of reclaimed water supply project 7.3.1Comparison, selection and analysis on restoration process of reclaimed water supply project The process of reclaimed water is generally fairly matured. Under precondition of ensuring quality of effluent water, following two water treatment process plans are selected to carry out comparison, selection and analysis thereof:
y� Plan 1. General treatment process flow:
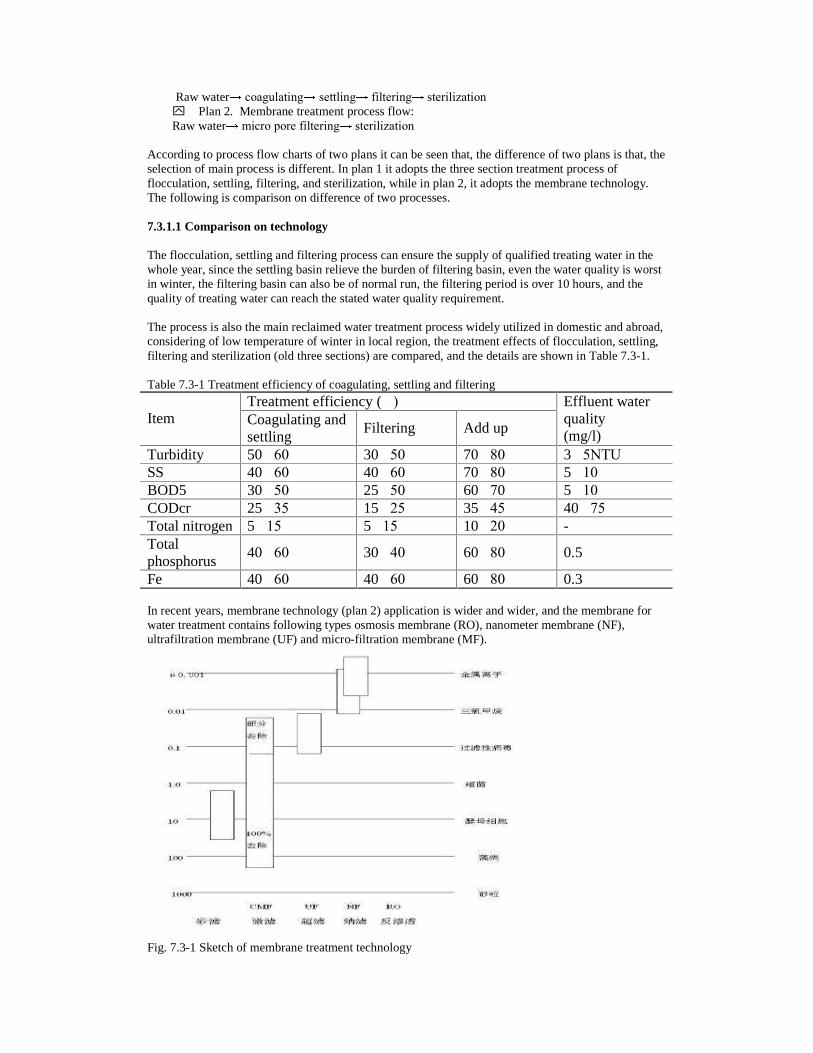
Raw water coagulating settling filtering sterilization y� Plan 2. Membrane treatment process flow: Raw water micro pore filtering sterilization
According to process flow charts of two plans it can be seen that, the difference of two plans is that, the selection of main process is different. In plan 1 it adopts the three section treatment process of flocculation, settling, filtering, and sterilization, while in plan 2, it adopts the membrane technology. The following is comparison on difference of two processes. 7.3.1.1 Comparison on technology The flocculation, settling and filtering process can ensure the supply of qualified treating water in the whole year, since the settling basin relieve the burden of filtering basin, even the water quality is worst in winter, the filtering basin can also be of normal run, the filtering period is over 10 hours, and the quality of treating water can reach the stated water quality requirement. The process is also the main reclaimed water treatment process widely utilized in domestic and abroad, considering of low temperature of winter in local region, the treatment effects of flocculation, settling, filtering and sterilization (old three sections) are compared, and the details are shown in Table 7.3-1. Table 7.3-1 Treatment efficiency of coagulating, settling and filtering
Treatment efficiency (�) Item Coagulating and
settling Filtering Add up
Effluent water quality (mg/l)
Turbidity 50�60 30�50 70�80 3�5NTU SS 40�60 40�60 70�80 5�10 BOD5 30�50 25�50 60�70 5�10 CODcr 25�35 15�25 35�45 40�75 Total nitrogen 5�15 5�15 10�20 - Total phosphorus
40�60 30�40 60�80 0.5
Fe 40�60 40�60 60�80 0.3 In recent years, membrane technology (plan 2) application is wider and wider, and the membrane for water treatment contains following types osmosis membrane (RO), nanometer membrane (NF), ultrafiltration membrane (UF) and micro-filtration membrane (MF).
Fig. 7.3-1 Sketch of membrane treatment technology
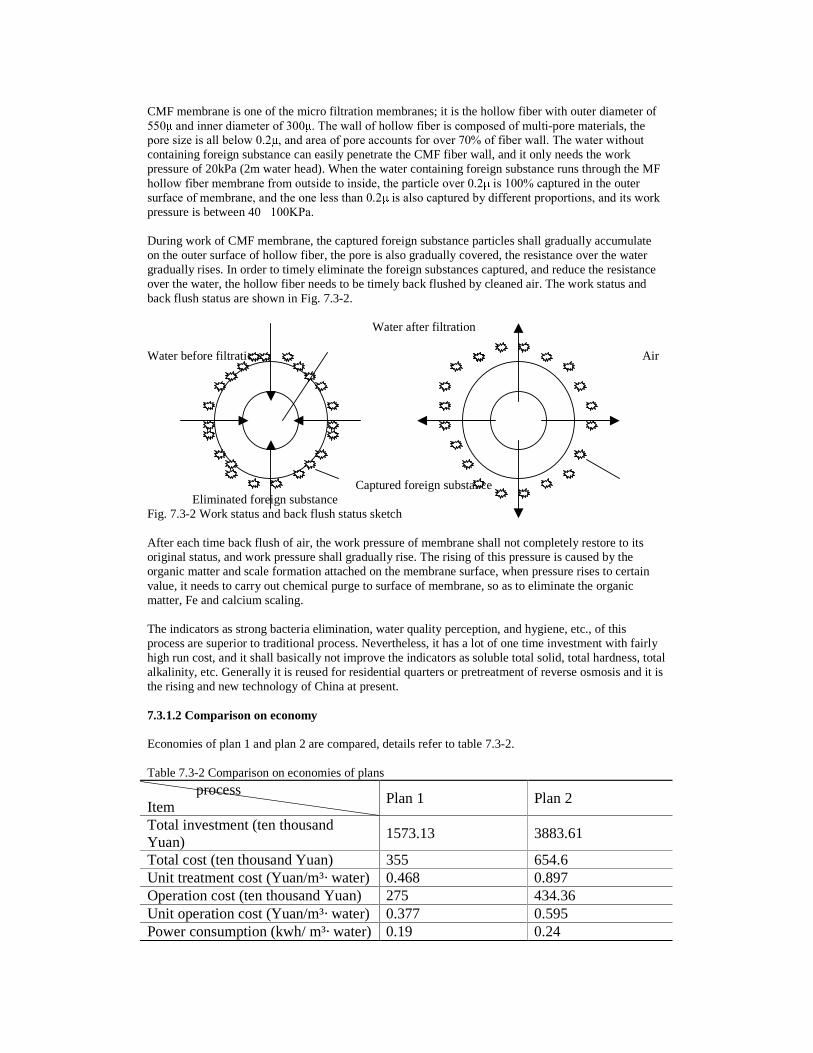
CMF membrane is one of the micro filtration membranes; it is the hollow fiber with outer diameter of 550 and inner diameter of 300 . The wall of hollow fiber is composed of multi-pore materials, the pore size is all below 0.2 , and area of pore accounts for over 70% of fiber wall. The water without containing foreign substance can easily penetrate the CMF fiber wall, and it only needs the work pressure of 20kPa (2m water head). When the water containing foreign substance runs through the MF hollow fiber membrane from outside to inside, the particle over 0.2 is 100% captured in the outer surface of membrane, and the one less than 0.2 is also captured by different proportions, and its work pressure is between 40�100KPa. During work of CMF membrane, the captured foreign substance particles shall gradually accumulate on the outer surface of hollow fiber, the pore is also gradually covered, the resistance over the water gradually rises. In order to timely eliminate the foreign substances captured, and reduce the resistance over the water, the hollow fiber needs to be timely back flushed by cleaned air. The work status and back flush status are shown in Fig. 7.3-2.
Water after filtration
Water before filtration Air Captured foreign substance Eliminated foreign substance Fig. 7.3-2 Work status and back flush status sketch After each time back flush of air, the work pressure of membrane shall not completely restore to its original status, and work pressure shall gradually rise. The rising of this pressure is caused by the organic matter and scale formation attached on the membrane surface, when pressure rises to certain value, it needs to carry out chemical purge to surface of membrane, so as to eliminate the organic matter, Fe and calcium scaling. The indicators as strong bacteria elimination, water quality perception, and hygiene, etc., of this process are superior to traditional process. Nevertheless, it has a lot of one time investment with fairly high run cost, and it shall basically not improve the indicators as soluble total solid, total hardness, total alkalinity, etc. Generally it is reused for residential quarters or pretreatment of reverse osmosis and it is the rising and new technology of China at present. 7.3.1.2 Comparison on economy Economies of plan 1 and plan 2 are compared, details refer to table 7.3-2. Table 7.3-2 Comparison on economies of plans
process Item
Plan 1 Plan 2
Total investment (ten thousand Yuan)
1573.13 3883.61
Total cost (ten thousand Yuan) 355 654.6 Unit treatment cost (Yuan/m³· water) 0.468 0.897 Operation cost (ten thousand Yuan) 275 434.36 Unit operation cost (Yuan/m³· water) 0.377 0.595 Power consumption (kwh/ m³· water) 0.19 0.24
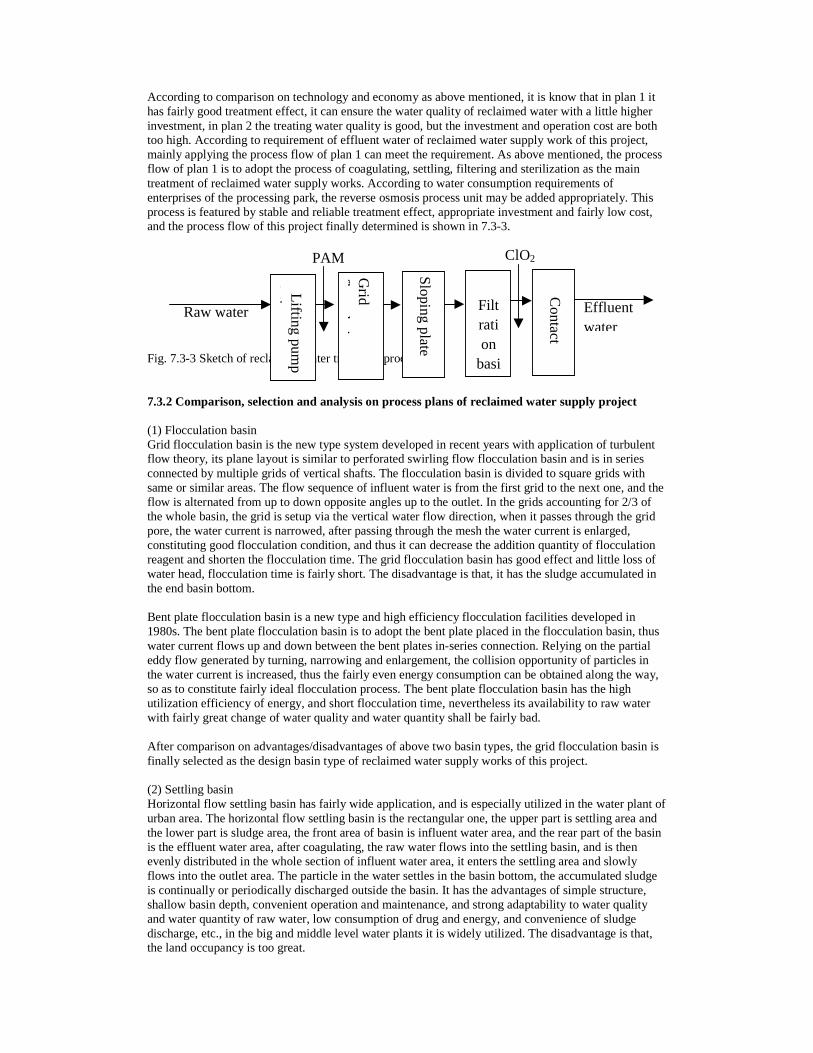
According to comparison on technology and economy as above mentioned, it is know that in plan 1 it has fairly good treatment effect, it can ensure the water quality of reclaimed water with a little higher investment, in plan 2 the treating water quality is good, but the investment and operation cost are both too high. According to requirement of effluent water of reclaimed water supply work of this project, mainly applying the process flow of plan 1 can meet the requirement. As above mentioned, the process flow of plan 1 is to adopt the process of coagulating, settling, filtering and sterilization as the main treatment of reclaimed water supply works. According to water consumption requirements of enterprises of the processing park, the reverse osmosis process unit may be added appropriately. This process is featured by stable and reliable treatment effect, appropriate investment and fairly low cost, and the process flow of this project finally determined is shown in 7.3-3.
Fig. 7.3-3 Sketch of reclaimed water treatment process
7.3.2 Comparison, selection and analysis on process plans of reclaimed water supply project (1) Flocculation basin Grid flocculation basin is the new type system developed in recent years with application of turbulent flow theory, its plane layout is similar to perforated swirling flow flocculation basin and is in series connected by multiple grids of vertical shafts. The flocculation basin is divided to square grids with same or similar areas. The flow sequence of influent water is from the first grid to the next one, and the flow is alternated from up to down opposite angles up to the outlet. In the grids accounting for 2/3 of the whole basin, the grid is setup via the vertical water flow direction, when it passes through the grid pore, the water current is narrowed, after passing through the mesh the water current is enlarged, constituting good flocculation condition, and thus it can decrease the addition quantity of flocculation reagent and shorten the flocculation time. The grid flocculation basin has good effect and little loss of water head, flocculation time is fairly short. The disadvantage is that, it has the sludge accumulated in the end basin bottom. Bent plate flocculation basin is a new type and high efficiency flocculation facilities developed in 1980s. The bent plate flocculation basin is to adopt the bent plate placed in the flocculation basin, thus water current flows up and down between the bent plates in-series connection. Relying on the partial eddy flow generated by turning, narrowing and enlargement, the collision opportunity of particles in the water current is increased, thus the fairly even energy consumption can be obtained along the way, so as to constitute fairly ideal flocculation process. The bent plate flocculation basin has the high utilization efficiency of energy, and short flocculation time, nevertheless its availability to raw water with fairly great change of water quality and water quantity shall be fairly bad. After comparison on advantages/disadvantages of above two basin types, the grid flocculation basin is finally selected as the design basin type of reclaimed water supply works of this project. (2) Settling basin Horizontal flow settling basin has fairly wide application, and is especially utilized in the water plant of urban area. The horizontal flow settling basin is the rectangular one, the upper part is settling area and the lower part is sludge area, the front area of basin is influent water area, and the rear part of the basin is the effluent water area, after coagulating, the raw water flows into the settling basin, and is then evenly distributed in the whole section of influent water area, it enters the settling area and slowly flows into the outlet area. The particle in the water settles in the basin bottom, the accumulated sludge is continually or periodically discharged outside the basin. It has the advantages of simple structure, shallow basin depth, convenient operation and maintenance, and strong adaptability to water quality and water quantity of raw water, low consumption of drug and energy, and convenience of sludge discharge, etc., in the big and middle level water plants it is widely utilized. The disadvantage is that, the land occupancy is too great.
Grid
flocculation
Lifting pum
p station
Sloping plate settling basin
Filtration
basi
Contact
basin
ClO2
Raw water Effluent water
PAM
The slope plate settling basin is the one developed on the basis of shallow basin theory. Various slope plates forming certain angle with horizontal plane are placed in the settling basin, the water flows from downward to upward, and the particles settle in the bottom of slope plate. When particles accumulated reach certain level, they shall automatically slide down. The advantage of slope plate settling basin is that, the settling efficiency is high, the volume is small, and the land occupancy area is small. The disadvantage is that, the anti-impact capacity is inferior to that of horizontal flow settling basin, with more material consumption and higher cost. After comparison on advantages/disadvantages of above two basin types, the slope plate settling basin is finally selected as the design basin type of this project. (3) Filtration basin The four valves filtration basin is the traditional one of filtering process of water cleaning plant, till now it has over 100 years history, nevertheless it is also one of the basin types with widest application till now. Its characteristic is that, it has stable work status, good quality of effluent water, matured run experience, its operation is stable and reliable, and it adopts the programmable controller to realize the one-step operation; The shortcoming of the four valves filtration basin is that, the basin volume is fairly great, the back flush water consumption is fairly great with more inlet and outlet water valves and great work volume of maintenance. Adopting electrical valve can realize the one-step automatic operation, but it cannot finely adjust the openness of outlet water valve and control the filtering speed of filtration basin. V type filtration basin is a new type one, and its advantage is that, the filtering period is long, the fairly coarse and thick filtering material layer has high utilization rate, the filtering speed is fairly high, and the water quality after filtering is good, with the utilization of air-water back wash, the back wash effect is good with minor water consumption. According to variation of water level of filtration basin, the openness of outlet water valve can be finely adjusted, so as to reach the purpose of controlling filtering speed of filtration basin. V filtration basin also has the advantages of good quality of effluent water and fairly small volume of filtration basin. Its shortcoming is that, it has fairly high automatic control requirement, with more back wash equipments and fairly higher cost. After comparing the advantages and disadvantages of above two basin types, finally the V type filtration basin is selected for this design of this project. 7.3.3 Selection of sterilization mode The microorganisms in the water are mostly attached on the suspended particles, after treatment of coagulating, settling and filtering, the bacteria and virus in the water can be greatly eliminated. Nevertheless, in order to ensure the bacteriology indicator of drinking water, the sterilization process is necessary. The sterilization treatment of water is usually the last work sequence of drinking water treatment. The purpose of sterilization is to eliminate the hazard pathogenic microbe (pathogenic bacteria, virus, etc.) in the water, and prevent from the hazard of waterborne infection. It consists of chemical method and physical method, the chemical method is to add chemical agent in the water, such as chlorine, ozone, heavy metal and other oxidizing agent, etc. The physical method is to carry out heating sterilization and ultraviolet ray sterilization, etc., instead of adding drug agent in the water. The comparison on properties of various disinfectants is shown in Table 7.3-3. Table 7.3-3 Comparison on property of disinfectant
Disinfectant Property
Chlorine, and bleaching powder
Chloramines chlorine dioxide
Ozone Ultraviolet radiation
Sterilization and bacteria elimination
Excellent
Middle level, inferior to chlorine
Excellent Excellent Good
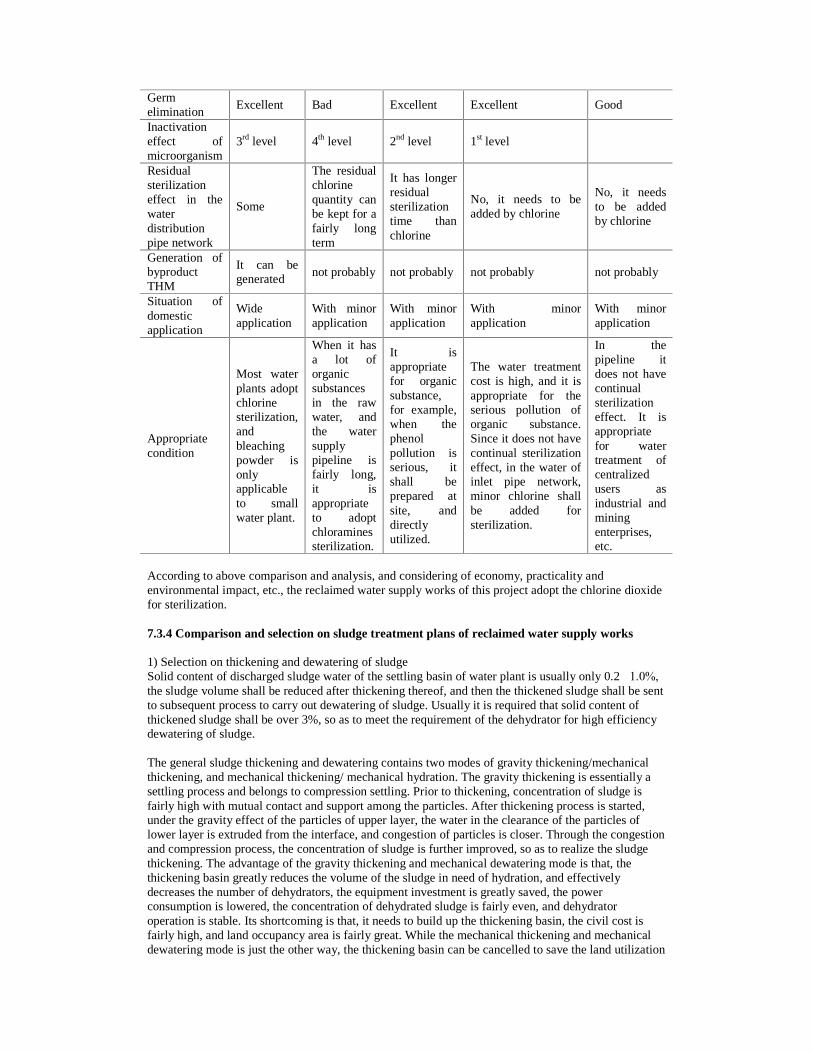
Germ elimination
Excellent Bad Excellent Excellent Good
Inactivation effect of microorganism
3rd level 4th level 2nd level 1st level
Residual sterilization effect in the water distribution pipe network
Some
The residual chlorine quantity can be kept for a fairly long term
It has longer residual sterilization time than chlorine
No, it needs to be added by chlorine
No, it needs to be added by chlorine
Generation of byproduct THM
It can be generated
not probably not probably not probably not probably
Situation of domestic application
Wide application
With minor application
With minor application
With minor application
With minor application
Appropriate condition
Most water plants adopt chlorine sterilization, and bleaching powder is only applicable to small water plant.
When it has a lot of organic substances in the raw water, and the water supply pipeline is fairly long, it is appropriate to adopt chloramines sterilization.
It is appropriate for organic substance, for example, when the phenol pollution is serious, it shall be prepared at site, and directly utilized.
The water treatment cost is high, and it is appropriate for the serious pollution of organic substance. Since it does not have continual sterilization effect, in the water of inlet pipe network, minor chlorine shall be added for sterilization.
In the pipeline it does not have continual sterilization effect. It is appropriate for water treatment of centralized users as industrial and mining enterprises, etc.
According to above comparison and analysis, and considering of economy, practicality and environmental impact, etc., the reclaimed water supply works of this project adopt the chlorine dioxide for sterilization. 7.3.4 Comparison and selection on sludge treatment plans of reclaimed water supply works 1) Selection on thickening and dewatering of sludge Solid content of discharged sludge water of the settling basin of water plant is usually only 0.2�1.0%, the sludge volume shall be reduced after thickening thereof, and then the thickened sludge shall be sent to subsequent process to carry out dewatering of sludge. Usually it is required that solid content of thickened sludge shall be over 3%, so as to meet the requirement of the dehydrator for high efficiency dewatering of sludge. The general sludge thickening and dewatering contains two modes of gravity thickening/mechanical thickening, and mechanical thickening/ mechanical hydration. The gravity thickening is essentially a settling process and belongs to compression settling. Prior to thickening, concentration of sludge is fairly high with mutual contact and support among the particles. After thickening process is started, under the gravity effect of the particles of upper layer, the water in the clearance of the particles of lower layer is extruded from the interface, and congestion of particles is closer. Through the congestion and compression process, the concentration of sludge is further improved, so as to realize the sludge thickening. The advantage of the gravity thickening and mechanical dewatering mode is that, the thickening basin greatly reduces the volume of the sludge in need of hydration, and effectively decreases the number of dehydrators, the equipment investment is greatly saved, the power consumption is lowered, the concentration of dehydrated sludge is fairly even, and dehydrator operation is stable. Its shortcoming is that, it needs to build up the thickening basin, the civil cost is fairly high, and land occupancy area is fairly great. While the mechanical thickening and mechanical dewatering mode is just the other way, the thickening basin can be cancelled to save the land utilization
area, reduce civil cost, nevertheless, since the sludge number in need of dewatering is great with low and uneven concentrations, the treatment capacities of thickening and dewatering equipments are decreased, the number is increased, and thus the equipment cost is greatly increased, with increase of power consumption, and the solid content of the sludge cake is not stable. As above mentioned, the technology of gravity thickening and mechanical dewatering is superior to mechanical thickening and mechanical dewatering mode. Civil cost of gravity thickening and mechanical dewatering is fairly high but equipment cost fairly low, its total cost is lower than that of the mechanical thickening and mechanical dewatering, although gravity thickening increases the land occupancy area, in this project the high concentration thickening basin is adopted to improve the effective settling area of the thickening basin, this saves the land utilization without additional requisition of land. In this project, it intends to adopt the gravity thickening and mechanical dewatering mode to carry out thickening and dewatering treatment of sludge. 2) Basic structure and characteristic of sludge dewatering equipment At present it mainly adopts three types of sludge dewatering machines as plate-and-frame press filter, centrifugal dehydrator and Band type press filter. The basic characteristics of three types of sludge dewatering equipments are respectively briefed as below: a. Plate-and-frame press filter
Plate-and-frame press filter is the pressurization and filtering equipment of clearance operation and is widely utilized in the sectors of sugar making, pharmacy, chemical industry, dyeing, metallurgy, coal washing, food and water treatment, the solid and liquid are separated via the filtering mode, and this is a large/middle separator with fairly wide adaptability for materials. Box type press filter has fairly low requirement to solid content of the incoming sludge, and 2%-3% shall usually be appropriate, while the solid content of outgoing sludge is higher than that of band type press filter and centrifugal dehydrator, the run process is the intermittent process of periodic operation of pump-in, pressing and filtering of sludge, and elimination of sludge. Its shortcoming is that, the continual operation is not available, according to blocking situation of filtering board, the filter cloth needs to be washed by one time after certain run period, the filtering board or rubber diaphragm are easy of damage and need to be frequently replaced, and the equipment volume is large with high price.
b. Centrifugal dehydrator
Horizontal spiral sludge dehydrator is a complete set of unit consisting of principal machine and auxiliaries. The unit is full closeness structure without leakage and is available for continual run of 24 hours, its main structure characteristic is that, it adopts fairly large length-to-diameter factor to extend the staying time of material and improve the elimination rate of solid substance. It adopts the exclusive spiral structure to reinforce the extrusion strength of spire upon the sludge cake, and improve the solid content of solid cake. It adopts the advanced dynamic balance technology to reduce the vibration; it adopts the unique differential rotation speed regulation technology to increase the discharge torsion moment of spire and load capacity. The centrifugal equipment has high efficiency, small land occupancy, the environment of machine room is clean, the complete set of unit adopts the advanced automatic integration and control technology, the rotation speed and differential rotation speed are stepless and adjustable. It has the safety protection and automatic alarm devices, and its run is stable and reliable. The main shortcoming is that, the noise is great, power consumption is high, the rotation blade, etc., has high requirement of wearing resistance, the requirement for quality of manufacturing material and processing accuracy is rigid, and the price is expensive.
c. Band type press filter
Band type press filter is a high efficiency solid and liquid separation equipment, and its theory is that, the sludge after flocculation is repeatedly extruded and compressed through the varied-direction bend between the roller systems, and tension effect of filter band, shear force is generated accordingly and thus there is a relative displacement for the sludge particles, and the free water and capillary water in the sludge are separated to obtain the sludge cake with fairly high solid content, so as to realize the dewatering of sludge. Its characteristic is that, it has high
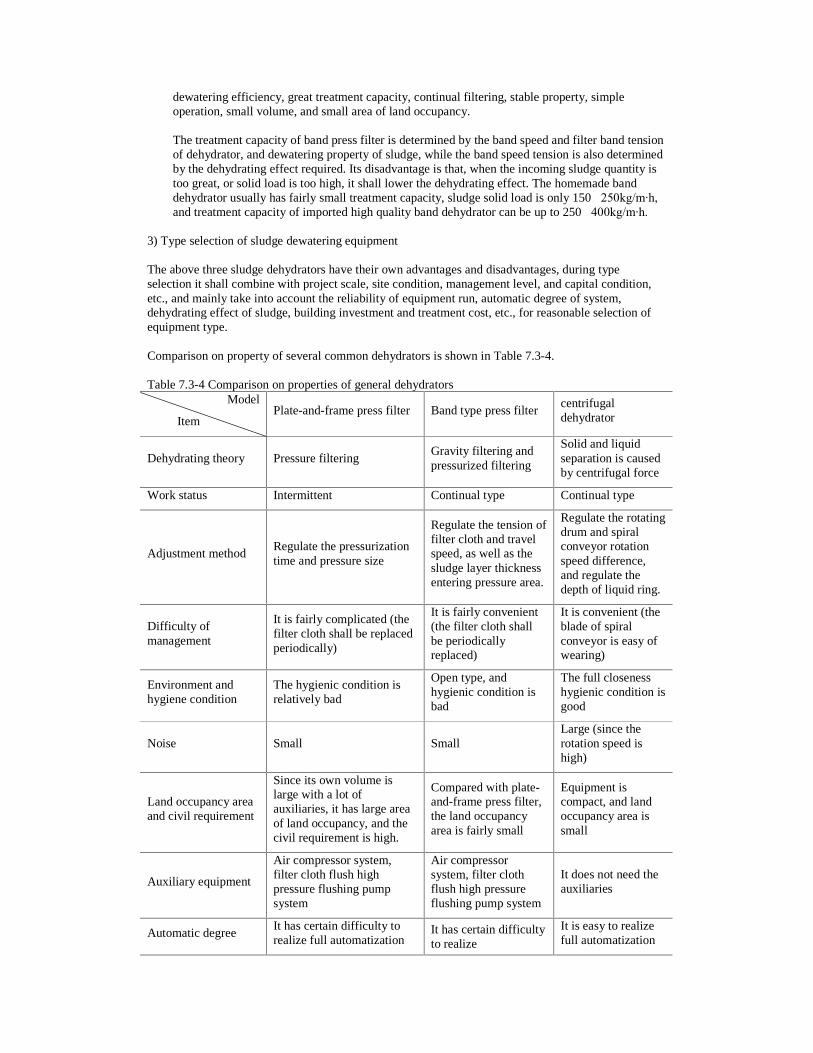
dewatering efficiency, great treatment capacity, continual filtering, stable property, simple operation, small volume, and small area of land occupancy. The treatment capacity of band press filter is determined by the band speed and filter band tension of dehydrator, and dewatering property of sludge, while the band speed tension is also determined by the dehydrating effect required. Its disadvantage is that, when the incoming sludge quantity is too great, or solid load is too high, it shall lower the dehydrating effect. The homemade band dehydrator usually has fairly small treatment capacity, sludge solid load is only 150�250kg/m·h, and treatment capacity of imported high quality band dehydrator can be up to 250�400kg/m·h.
3) Type selection of sludge dewatering equipment The above three sludge dehydrators have their own advantages and disadvantages, during type selection it shall combine with project scale, site condition, management level, and capital condition, etc., and mainly take into account the reliability of equipment run, automatic degree of system, dehydrating effect of sludge, building investment and treatment cost, etc., for reasonable selection of equipment type. Comparison on property of several common dehydrators is shown in Table 7.3-4. Table 7.3-4 Comparison on properties of general dehydrators
Model
Item Plate-and-frame press filter Band type press filter
centrifugal dehydrator
Dehydrating theory Pressure filtering Gravity filtering and pressurized filtering
Solid and liquid separation is caused by centrifugal force
Work status Intermittent Continual type Continual type
Adjustment method Regulate the pressurization time and pressure size
Regulate the tension of filter cloth and travel speed, as well as the sludge layer thickness entering pressure area.
Regulate the rotating drum and spiral conveyor rotation speed difference, and regulate the depth of liquid ring.
Difficulty of management
It is fairly complicated (the filter cloth shall be replaced periodically)
It is fairly convenient (the filter cloth shall be periodically replaced)
It is convenient (the blade of spiral conveyor is easy of wearing)
Environment and hygiene condition
The hygienic condition is relatively bad
Open type, and hygienic condition is bad
The full closeness hygienic condition is good
Noise Small Small Large (since the rotation speed is high)
Land occupancy area and civil requirement
Since its own volume is large with a lot of auxiliaries, it has large area of land occupancy, and the civil requirement is high.
Compared with plate-and-frame press filter, the land occupancy area is fairly small
Equipment is compact, and land occupancy area is small
Auxiliary equipment
Air compressor system, filter cloth flush high pressure flushing pump system
Air compressor system, filter cloth flush high pressure flushing pump system
It does not need the auxiliaries
Automatic degree It has certain difficulty to realize full automatization
It has certain difficulty to realize automatization
It is easy to realize full automatization
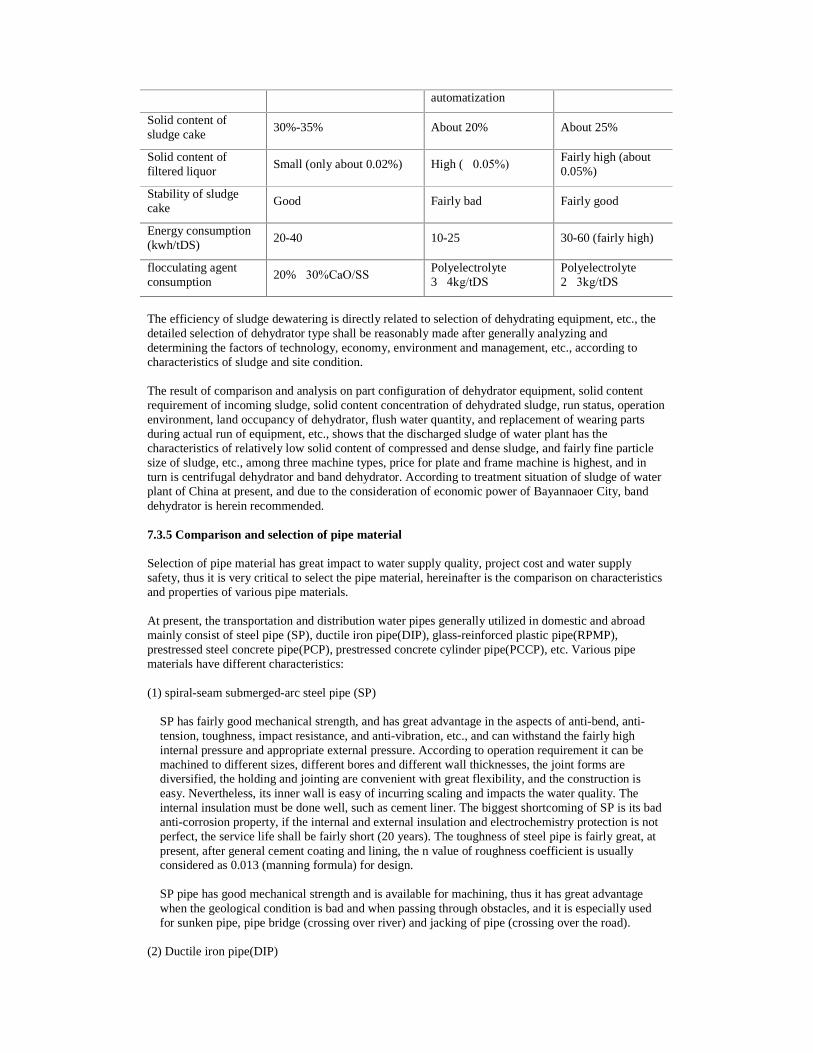
automatization
Solid content of sludge cake
30%-35% About 20% About 25%
Solid content of filtered liquor
Small (only about 0.02%) High (�0.05%) Fairly high (about 0.05%)
Stability of sludge cake
Good Fairly bad Fairly good
Energy consumption (kwh/tDS)
20-40 10-25 30-60 (fairly high)
flocculating agent consumption
20%�30%CaO/SS Polyelectrolyte 3�4kg/tDS
Polyelectrolyte 2�3kg/tDS
The efficiency of sludge dewatering is directly related to selection of dehydrating equipment, etc., the detailed selection of dehydrator type shall be reasonably made after generally analyzing and determining the factors of technology, economy, environment and management, etc., according to characteristics of sludge and site condition. The result of comparison and analysis on part configuration of dehydrator equipment, solid content requirement of incoming sludge, solid content concentration of dehydrated sludge, run status, operation environment, land occupancy of dehydrator, flush water quantity, and replacement of wearing parts during actual run of equipment, etc., shows that the discharged sludge of water plant has the characteristics of relatively low solid content of compressed and dense sludge, and fairly fine particle size of sludge, etc., among three machine types, price for plate and frame machine is highest, and in turn is centrifugal dehydrator and band dehydrator. According to treatment situation of sludge of water plant of China at present, and due to the consideration of economic power of Bayannaoer City, band dehydrator is herein recommended. 7.3.5 Comparison and selection of pipe material Selection of pipe material has great impact to water supply quality, project cost and water supply safety, thus it is very critical to select the pipe material, hereinafter is the comparison on characteristics and properties of various pipe materials. At present, the transportation and distribution water pipes generally utilized in domestic and abroad mainly consist of steel pipe (SP), ductile iron pipe(DIP), glass-reinforced plastic pipe(RPMP), prestressed steel concrete pipe(PCP), prestressed concrete cylinder pipe(PCCP), etc. Various pipe materials have different characteristics: (1) spiral-seam submerged-arc steel pipe (SP)
SP has fairly good mechanical strength, and has great advantage in the aspects of anti-bend, anti-tension, toughness, impact resistance, and anti-vibration, etc., and can withstand the fairly high internal pressure and appropriate external pressure. According to operation requirement it can be machined to different sizes, different bores and different wall thicknesses, the joint forms are diversified, the holding and jointing are convenient with great flexibility, and the construction is easy. Nevertheless, its inner wall is easy of incurring scaling and impacts the water quality. The internal insulation must be done well, such as cement liner. The biggest shortcoming of SP is its bad anti-corrosion property, if the internal and external insulation and electrochemistry protection is not perfect, the service life shall be fairly short (20 years). The toughness of steel pipe is fairly great, at present, after general cement coating and lining, the n value of roughness coefficient is usually considered as 0.013 (manning formula) for design. SP pipe has good mechanical strength and is available for machining, thus it has great advantage when the geological condition is bad and when passing through obstacles, and it is especially used for sunken pipe, pipe bridge (crossing over river) and jacking of pipe (crossing over the road).
(2) Ductile iron pipe(DIP)
Raw material of DIP is also pig iron with carbon constituent of 3.5-4.0%. Through spheroidization and annealing treatment after molding of pipe casting, the stable and even fine texture is obtained with fairly high specific elongation. According to standard of ISO2531, its specific elongation, tensile strength and water pressure test, etc., are all equivalent to steel pipe, and its anticorrosion is superior to that of steel pipe. The burying service life can be up to 50 years. DIP wall thickness is fairly thin and is only about 55% of that of the grey cast iron pipe. Inner wall is coated and sealed by cement. The roughness coefficient n is considered as 0.013(manning formula) for this design. At present, the diameter of DIP pipe produced in domestic is DN100�2600, it adopts the T form slide-in interface with water stop rubber ring, in general foundation condition the base shall not be treated, the mechanical and machining property is good, it can be welded, cut and bored.
(3) glass-reinforced plastic pipe(RPMP)
RPMP is a composite material pipe consisting of unsaturated polyester resin, glass fiber and quartz sand filler. The pipe wall is divided to external protection layer, reinforced layer, structure layer and liner layer according to different roles. The mechanical strength can be sorted according to design requirement, and its nominal rigidity is 2500�20000N/m2 and work pressure 0.4�2.5MPa. RPMP has small specific gravity (only 1700�2200kg/m3) since the weight is light it is relatively convenient for transportation and construction. The layer of inner wall contacting with water is polyester resin, it has fairly small roughness, and n value is 0.0095�0.01 for this design. Thus it can greatly lower the loss of water head and is not easy of scaling and corrosion, it has no impact to water quality, and has no need of internal and external insulation treatment. According to introduction, its service life shall be over 50 years. Joint of RPMP is usually socket connected or sleeve connected, with rubber ring or reversely grouted by rubber for water-stop, it is not easy of incurring water leakage and pipe explosion. Since the weight is light, it is more in favor of pipe laying and installation, in most foundation condition, it has no need to make base, and it is one of the ideal pipe materials for long distance water transportation.
RPMP consists of two processes of short fiber outer formwork centrifugal manufacturing and long fiber inner formwork winding manufacturing, the rigidity of the previous one is superior to the latter one, while the uneven settling resistance of the latter is superior to the previous one. Both of them can meet the general operation requirement of rigidity and withstanding of internal pressure, while the uneven settling of pipe foundation is usually one of the main causes of pipe accident, at present, the long fiber inner formwork winding manufacturing of RMPM has more utilization in domestic.
(4) Prestressed steel concrete pipe(PCP)
PCP is composed of longitudinal and loop prestressed steel wire (reinforcement) and coagulating earth, and its wall thickness is usually fairly large. Although its mechanical strength is inferior to SP, it can withstand fairly great internal pressure, at present, the common internal work pressure is below 1.0MPa, during ex-factory test, the external pressure (bending) can be over 1000MPa. PCP has best anticorrosion property without internal and external insulation, the service life is long and can be over 50 years. According to report, the PCP with good manufacturing shall seldom have the phenomenon of pipe explosion; hydraulic roughness of PCP is relatively small, at present the designed flow speed coefficient C is 130 (Hazen-Williams formula). In addition to corrosion resistance, the pipe is also not easy of incurring scaling, and has no impact to water quality. The joint usually adopts the socket connected type, with rubber ring water stop and convenient pipe laying, nevertheless weight of PCP is great and not in favor of transportation and hoisting. Under general foundation condition it may not be set by base. PCP pipe price is fairly cheap, when the pipe diameter is less than or equivalent to DN1000 and pipe work pressure less than 0.5MPa, it is an available pipe material.
(6) Prestressed concrete cylinder pipe (PCCP)
PCCP manufacturing is similar to PCP, and its difference is that, it adopts the integrated steel sleeve (fairly thin) to substitute the longitudinal prestressed reinforcement of PCP, thus it has better watertightness and is mostly of pipe of large diameter, such as DN1400-DN4000; usually the wall thickness is fairly large, as above mentioned, the wall thickness is respectively 100 and 270mm. the
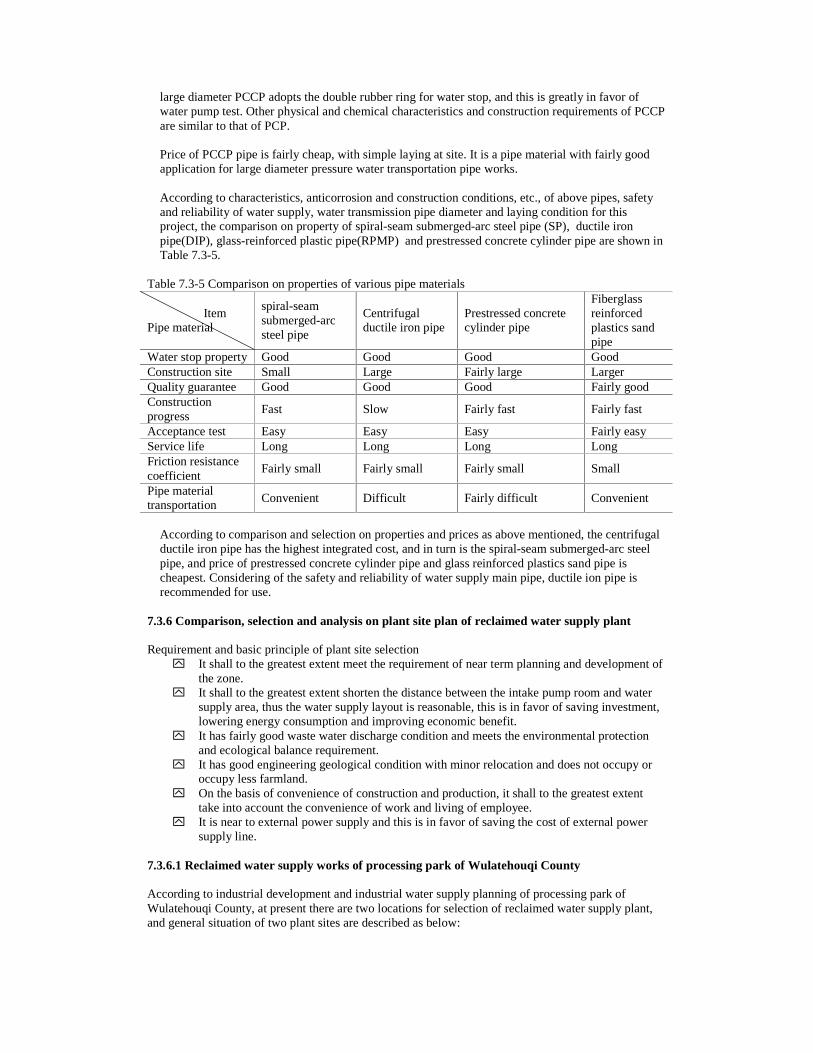
large diameter PCCP adopts the double rubber ring for water stop, and this is greatly in favor of water pump test. Other physical and chemical characteristics and construction requirements of PCCP are similar to that of PCP. Price of PCCP pipe is fairly cheap, with simple laying at site. It is a pipe material with fairly good application for large diameter pressure water transportation pipe works. According to characteristics, anticorrosion and construction conditions, etc., of above pipes, safety and reliability of water supply, water transmission pipe diameter and laying condition for this project, the comparison on property of spiral-seam submerged-arc steel pipe (SP), ductile iron pipe(DIP), glass-reinforced plastic pipe(RPMP) and prestressed concrete cylinder pipe are shown in Table 7.3-5.
Table 7.3-5 Comparison on properties of various pipe materials
Item Pipe material
spiral-seam submerged-arc steel pipe
Centrifugal ductile iron pipe
Prestressed concrete cylinder pipe
Fiberglass reinforced plastics sand pipe
Water stop property Good Good Good Good Construction site Small Large Fairly large Larger Quality guarantee Good Good Good Fairly good Construction progress
Fast Slow Fairly fast Fairly fast
Acceptance test Easy Easy Easy Fairly easy Service life Long Long Long Long Friction resistance coefficient
Fairly small Fairly small Fairly small Small
Pipe material transportation
Convenient Difficult Fairly difficult Convenient
According to comparison and selection on properties and prices as above mentioned, the centrifugal ductile iron pipe has the highest integrated cost, and in turn is the spiral-seam submerged-arc steel pipe, and price of prestressed concrete cylinder pipe and glass reinforced plastics sand pipe is cheapest. Considering of the safety and reliability of water supply main pipe, ductile ion pipe is recommended for use.
7.3.6 Comparison, selection and analysis on plant site plan of reclaimed water supply plant Requirement and basic principle of plant site selection
y� It shall to the greatest extent meet the requirement of near term planning and development of the zone.
y� It shall to the greatest extent shorten the distance between the intake pump room and water supply area, thus the water supply layout is reasonable, this is in favor of saving investment, lowering energy consumption and improving economic benefit.
y� It has fairly good waste water discharge condition and meets the environmental protection and ecological balance requirement.
y� It has good engineering geological condition with minor relocation and does not occupy or occupy less farmland.
y� On the basis of convenience of construction and production, it shall to the greatest extent take into account the convenience of work and living of employee.
y� It is near to external power supply and this is in favor of saving the cost of external power supply line.
7.3.6.1 Reclaimed water supply works of processing park of Wulatehouqi County According to industrial development and industrial water supply planning of processing park of Wulatehouqi County, at present there are two locations for selection of reclaimed water supply plant, and general situation of two plant sites are described as below:
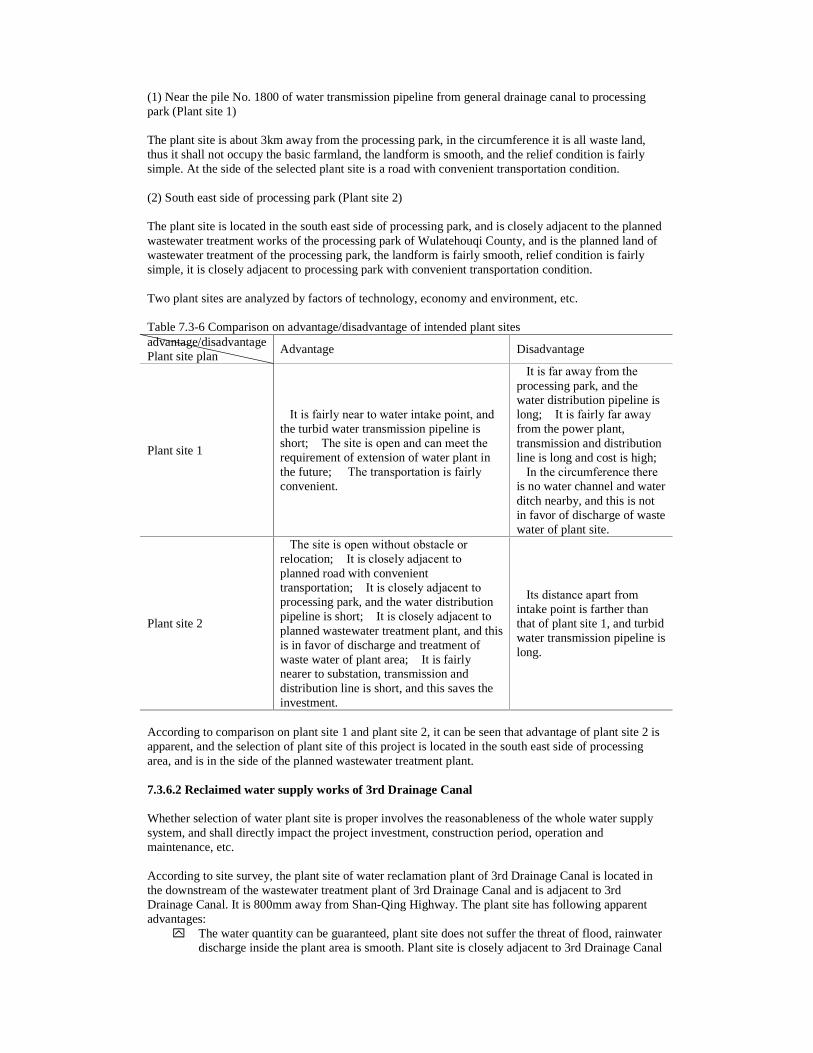
(1) Near the pile No. 1800 of water transmission pipeline from general drainage canal to processing park (Plant site 1) The plant site is about 3km away from the processing park, in the circumference it is all waste land, thus it shall not occupy the basic farmland, the landform is smooth, and the relief condition is fairly simple. At the side of the selected plant site is a road with convenient transportation condition. (2) South east side of processing park (Plant site 2) The plant site is located in the south east side of processing park, and is closely adjacent to the planned wastewater treatment works of the processing park of Wulatehouqi County, and is the planned land of wastewater treatment of the processing park, the landform is fairly smooth, relief condition is fairly simple, it is closely adjacent to processing park with convenient transportation condition. Two plant sites are analyzed by factors of technology, economy and environment, etc. Table 7.3-6 Comparison on advantage/disadvantage of intended plant sites advantage/disadvantage Plant site plan
Advantage Disadvantage
Plant site 1
�It is fairly near to water intake point, and the turbid water transmission pipeline is short; �The site is open and can meet the requirement of extension of water plant in the future; � The transportation is fairly convenient.
�It is far away from the processing park, and the water distribution pipeline is long; �It is fairly far away from the power plant, transmission and distribution line is long and cost is high; �In the circumference there is no water channel and water ditch nearby, and this is not in favor of discharge of waste water of plant site.
Plant site 2
�The site is open without obstacle or relocation; �It is closely adjacent to planned road with convenient transportation; �It is closely adjacent to processing park, and the water distribution pipeline is short; �It is closely adjacent to planned wastewater treatment plant, and this is in favor of discharge and treatment of waste water of plant area; �It is fairly nearer to substation, transmission and distribution line is short, and this saves the investment.
�Its distance apart from intake point is farther than that of plant site 1, and turbid water transmission pipeline is long.
According to comparison on plant site 1 and plant site 2, it can be seen that advantage of plant site 2 is apparent, and the selection of plant site of this project is located in the south east side of processing area, and is in the side of the planned wastewater treatment plant.
7.3.6.2 Reclaimed water supply works of 3rd Drainage Canal Whether selection of water plant site is proper involves the reasonableness of the whole water supply system, and shall directly impact the project investment, construction period, operation and maintenance, etc. According to site survey, the plant site of water reclamation plant of 3rd Drainage Canal is located in the downstream of the wastewater treatment plant of 3rd Drainage Canal and is adjacent to 3rd Drainage Canal. It is 800mm away from Shan-Qing Highway. The plant site has following apparent advantages:
y� The water quantity can be guaranteed, plant site does not suffer the threat of flood, rainwater discharge inside the plant area is smooth. Plant site is closely adjacent to 3rd Drainage Canal
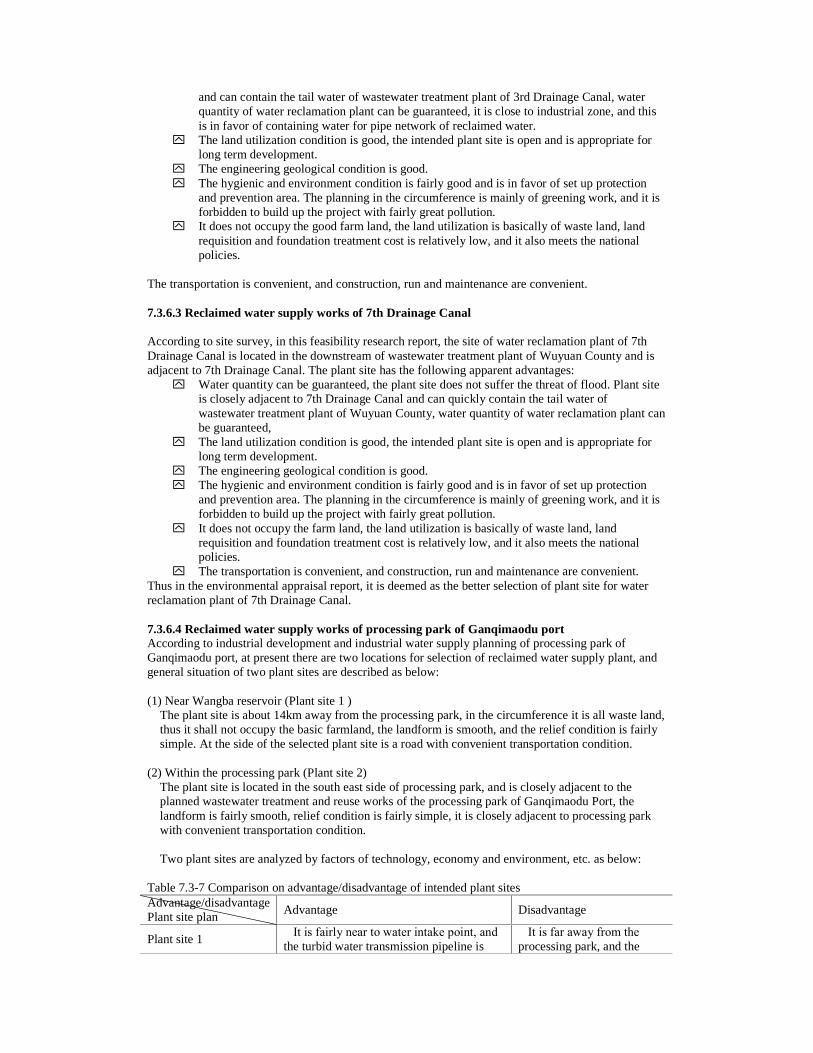
and can contain the tail water of wastewater treatment plant of 3rd Drainage Canal, water quantity of water reclamation plant can be guaranteed, it is close to industrial zone, and this is in favor of containing water for pipe network of reclaimed water.
y� The land utilization condition is good, the intended plant site is open and is appropriate for long term development.
y� The engineering geological condition is good. y� The hygienic and environment condition is fairly good and is in favor of set up protection
and prevention area. The planning in the circumference is mainly of greening work, and it is forbidden to build up the project with fairly great pollution.
y� It does not occupy the good farm land, the land utilization is basically of waste land, land requisition and foundation treatment cost is relatively low, and it also meets the national policies.
The transportation is convenient, and construction, run and maintenance are convenient. 7.3.6.3 Reclaimed water supply works of 7th Drainage Canal According to site survey, in this feasibility research report, the site of water reclamation plant of 7th Drainage Canal is located in the downstream of wastewater treatment plant of Wuyuan County and is adjacent to 7th Drainage Canal. The plant site has the following apparent advantages:
y� Water quantity can be guaranteed, the plant site does not suffer the threat of flood. Plant site is closely adjacent to 7th Drainage Canal and can quickly contain the tail water of wastewater treatment plant of Wuyuan County, water quantity of water reclamation plant can be guaranteed,
y� The land utilization condition is good, the intended plant site is open and is appropriate for long term development.
y� The engineering geological condition is good. y� The hygienic and environment condition is fairly good and is in favor of set up protection
and prevention area. The planning in the circumference is mainly of greening work, and it is forbidden to build up the project with fairly great pollution.
y� It does not occupy the farm land, the land utilization is basically of waste land, land requisition and foundation treatment cost is relatively low, and it also meets the national policies.
y� The transportation is convenient, and construction, run and maintenance are convenient. Thus in the environmental appraisal report, it is deemed as the better selection of plant site for water reclamation plant of 7th Drainage Canal.
7.3.6.4 Reclaimed water supply works of processing park of Ganqimaodu port According to industrial development and industrial water supply planning of processing park of Ganqimaodu port, at present there are two locations for selection of reclaimed water supply plant, and general situation of two plant sites are described as below: (1) Near Wangba reservoir (Plant site 1 )
The plant site is about 14km away from the processing park, in the circumference it is all waste land, thus it shall not occupy the basic farmland, the landform is smooth, and the relief condition is fairly simple. At the side of the selected plant site is a road with convenient transportation condition.
(2) Within the processing park (Plant site 2)
The plant site is located in the south east side of processing park, and is closely adjacent to the planned wastewater treatment and reuse works of the processing park of Ganqimaodu Port, the landform is fairly smooth, relief condition is fairly simple, it is closely adjacent to processing park with convenient transportation condition. Two plant sites are analyzed by factors of technology, economy and environment, etc. as below:
Table 7.3-7 Comparison on advantage/disadvantage of intended plant sites Advantage/disadvantage Plant site plan
Advantage Disadvantage
Plant site 1 �It is fairly near to water intake point, and the turbid water transmission pipeline is
�It is far away from the processing park, and the
short; �The site is open and can meet the requirement of extension of water plant in the future; � The transportation is fairly convenient; �There are a lot of waste lands in the circumference, and this is in favor of building up evaporation pond and lower the cost thereof.
water distribution pipeline is long.
Plant site 2
�It is closely adjacent to processing park, and the water distribution pipeline is short; �It is closely adjacent to planned wastewater treatment plant, and this is in favor of discharge and treatment of waste water of plant area.
�Its distance apart from intake point is farther than that of plant site 1, and turbid water transmission pipeline is long.�The land requisition cost is more than that of plant site 1.
As above mentioned, when compared with plant site 2, the advantage of plant site 1 is apparent, and the plant site of the project is located in the circumference of Wangba reservoir. 7.4 Comparison, selection and analysis on alternatives of wastewater treatment and reuse item 7.4.1Comparison and selection on wastewater treatment process plan According to feasibility research report, the discharge of effluent water of wastewater treatment plant conforms to A standard of grade 1 of “pollutant discharge standard of wastewater treatment plant of urban area”, after grade2 treatment of the wastewater, it needs to be further treated to meet the discharge standard of standard A of grade 1. Effluent water quality indicator of wastewater treatment plant is compared with indicator of reclaimed water, and effluent water after further treatment can meet the reuse standard of reclaimed water. 7.4.1.1 Comparison and selection on grade 2 biological treatment process According to the predicted influent water quality of wastewater treatment plant of this project in feasibility research report, and the discharge standard requirement of effluent water, in this project it adopts the grade2 biological treatment process with functions of eliminating organic pollutant and suspended solid, as well as nitrogen and phosphorus elimination. According to development of wastewater treatment technology in abroad and abroad, the various processes of A2O process, oxidation ditch process, and SBR process, etc., not only have the function of eliminating organic pollutant, but also have different nitrogen elimination effect. In the “urban wastewater treatment and pollution protection and prevention technical policy” printed and issued by construction ministry, national administration of environmental protection, and science and technology ministry, it is recommended that A2O process, oxidation ditch process, and SBR process shall be used for grade2 biological treatment process aiming at wastewater treatment plant with scale of wastewater quantity below 100000m³/d. According to various technical properties of processes, construction scale of this project, influent water characteristics, treatment requirement and local situation, in this appraisal it intends to select the SBR series CAST process and composite A/A/O process as the comparison and selection plan for wastewater grade 2 treatment of this project. (1) CAST process (Plan 1)
Periodic circle type activated sludge method (CAST process) is a transformation of intermittent activated sludge method. The biological degradation and sludge water separation processes are completed in one or multiple ponds with parallel run and variable reaction volume. Thus in this process it does not need to set the separate settling basin. In this system, activated sludge is continually repeated by “aeration—non-aeration”. In the stage of aeration it is mainly to complete the biological degeneration process, in the non-aeration stage, although it has part biological effect, it is mainly to complete the sludge water separation process. In circulated activated sludge
method process, the treatment process is completed as per sequence of “water filling— discharge” and “aeration—non-aeration”, it belongs to sequencing batch activated sludge method. Each operation circulation of this process is composed of influent water/aeration stage, settling stage, decantion stage and idle stage, each state constitutes a circulation and is continually repeated. When the circulation is started, the incoming of wastewater enables the water level in the pond start to rise from the lowest level. After some time’s aeration and mixing, the system stops the aeration so that the activated sludge in the reactor carries out flocculation settling, and activated sludge shall settle in the static environment. After completion of settling stage, the supernatant at the upper part of the pond is discharged outside the system by decanter, at the same time the level shall drop to initial depth. Then the system shall repeat the above processes. Main advantages of CAST process: y� The process is advanced and simple; the treatment building structure is small and equipment
number is small. Compared with A/A/O process it does not have secondary settling basin, the SBR process sludge adopting delay aeration is relatively aerobic and stable, and has no need to carry out treatment of anaerobic digestion, thus it has no need to set up building structures of anaerobic digestion system for sludge, etc., the operation management is convenient; it has very high phosphorus and nitrogen elimination effect, the process run is stable, and effluent water quality is good.
y� It does not have expansion of sludge, and growth of filamentous bacteria can be restricted. y� It has the double advantage of complete mixing type and plug flow aeration basin, and can
bear the fairly great impact load of water quantity and water quality change, and the treatment effect is stable.
y� The output of wastewater is small, the sludge can be gradually aerobic and stable, the number of wastewater treatment building structure is small, and the sludge only needs to be thickened and dehydrated.
Main disadvantage of CAST process: y� In the periodic circular activated sludge method, the reaction basin has fairly high
requirement of automatic control, and high requirement of reliability of equipment. y� The run effect in the low temperature is not stable. y� Idle rate of equipment is high.
(2) A/A/O process (Plan 2)
A/A/O process is anaerobe—oxygen deficient—aerobic activated sludge method. In front of aerobic area it is designed by oxygen deficient area and anaerobe area which shall respectively realize the denitrification nitrogen elimination and phosphorus elimination function. When the wastewater passes through three different function areas, under the effect of different microorganism bacteria group, the pollutants in the wastewater as organic substance, nitrogen and phosphorus, etc., are eliminated. When it has sufficient sludge age condition, BOD5 in the wastewater shall at first be degenerated in the aerobic basin, and at the same time the nitration is completed, the wastewater after nitration is lifted by reflux pump into the oxygen deficient basin to carry out denitrification and nitrogen elimination. Through the effect of backflow sludge for greatly absorbing phosphorus, the element of phosphorus is eliminate. The integral process includes following processes:
Assimilation process, some part of ammonia and nitrogen in the wastewater are assimilated into new cell substance, and eliminated via the form of residual sludge. The assimilation works is the process to eliminate the organic substance, and some part of nitrogen can be eliminated even there is no specific biological nitrogen elimination measure. Nitration process; The nitrifying bacteria shall oxidize the ammonia and nitrogen in the wastewater into nitrate nitrogen. Denitrification process, in the oxygen deficient environment and with participation of denitrify bacteria, the nitrate is deoxidized to nitrogen and emitted to atmosphere. The nitrogen effect of denitrification design is determined by the reflux ratio of activated sludge, usually 100%�150% can meet the requirement.
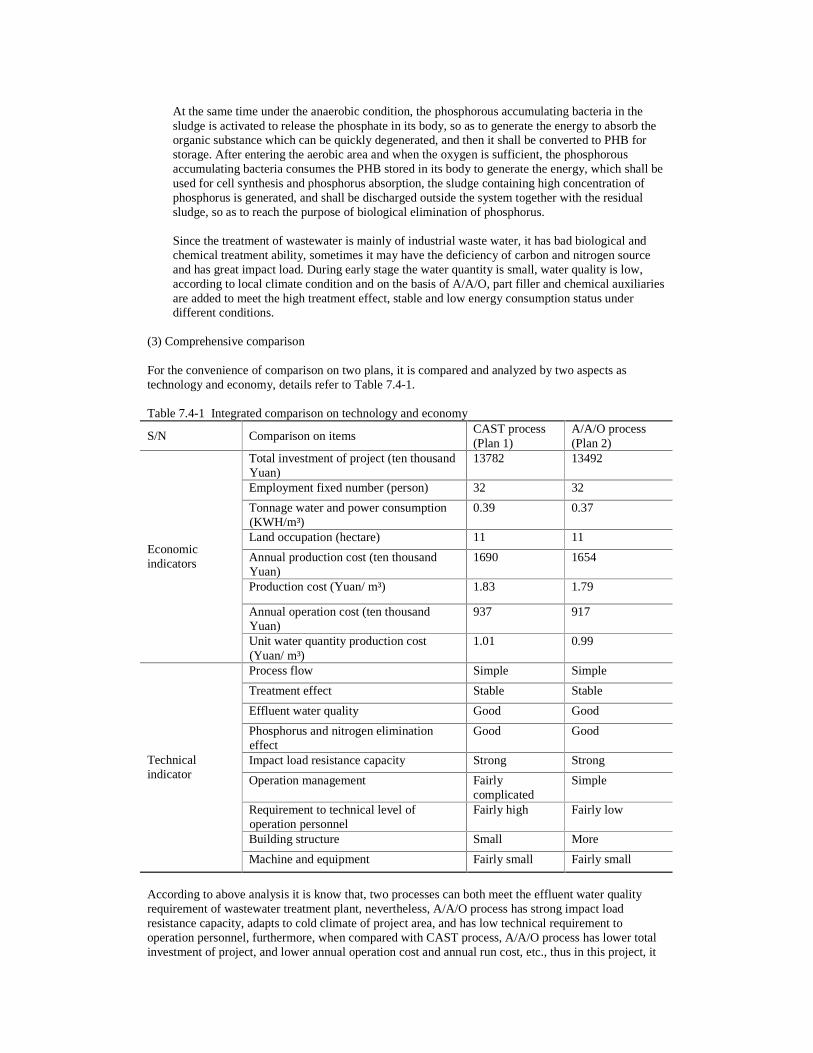
At the same time under the anaerobic condition, the phosphorous accumulating bacteria in the sludge is activated to release the phosphate in its body, so as to generate the energy to absorb the organic substance which can be quickly degenerated, and then it shall be converted to PHB for storage. After entering the aerobic area and when the oxygen is sufficient, the phosphorous accumulating bacteria consumes the PHB stored in its body to generate the energy, which shall be used for cell synthesis and phosphorus absorption, the sludge containing high concentration of phosphorus is generated, and shall be discharged outside the system together with the residual sludge, so as to reach the purpose of biological elimination of phosphorus. Since the treatment of wastewater is mainly of industrial waste water, it has bad biological and chemical treatment ability, sometimes it may have the deficiency of carbon and nitrogen source and has great impact load. During early stage the water quantity is small, water quality is low, according to local climate condition and on the basis of A/A/O, part filler and chemical auxiliaries are added to meet the high treatment effect, stable and low energy consumption status under different conditions.
(3) Comprehensive comparison For the convenience of comparison on two plans, it is compared and analyzed by two aspects as technology and economy, details refer to Table 7.4-1. Table 7.4-1 Integrated comparison on technology and economy
S/N Comparison on items CAST process (Plan 1)
A/A/O process (Plan 2)
Total investment of project (ten thousand Yuan)
13782 13492
Employment fixed number (person) 32 32
Tonnage water and power consumption (KWH/m³)
0.39 0.37
Land occupation (hectare) 11 11
Annual production cost (ten thousand Yuan)
1690 1654
Production cost (Yuan/ m³) 1.83 1.79
Annual operation cost (ten thousand Yuan)
937 917
Economic indicators
Unit water quantity production cost (Yuan/ m³)
1.01 0.99
Process flow Simple Simple
Treatment effect Stable Stable
Effluent water quality Good Good
Phosphorus and nitrogen elimination effect
Good Good
Impact load resistance capacity Strong Strong
Operation management Fairly complicated
Simple
Requirement to technical level of operation personnel
Fairly high Fairly low
Building structure Small More
Technical indicator
Machine and equipment Fairly small Fairly small
According to above analysis it is know that, two processes can both meet the effluent water quality requirement of wastewater treatment plant, nevertheless, A/A/O process has strong impact load resistance capacity, adapts to cold climate of project area, and has low technical requirement to operation personnel, furthermore, when compared with CAST process, A/A/O process has lower total investment of project, and lower annual operation cost and annual run cost, etc., thus in this project, it
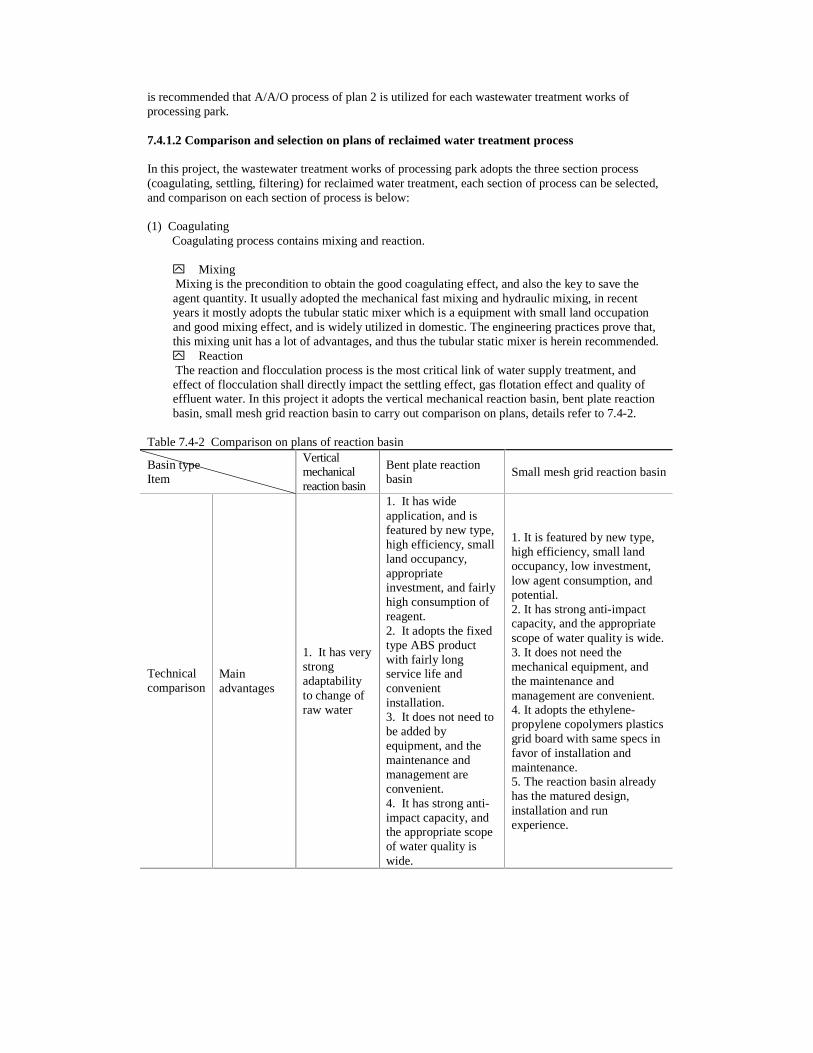
is recommended that A/A/O process of plan 2 is utilized for each wastewater treatment works of processing park. 7.4.1.2 Comparison and selection on plans of reclaimed water treatment process In this project, the wastewater treatment works of processing park adopts the three section process (coagulating, settling, filtering) for reclaimed water treatment, each section of process can be selected, and comparison on each section of process is below: (1) Coagulating
Coagulating process contains mixing and reaction. y� Mixing Mixing is the precondition to obtain the good coagulating effect, and also the key to save the agent quantity. It usually adopted the mechanical fast mixing and hydraulic mixing, in recent years it mostly adopts the tubular static mixer which is a equipment with small land occupation and good mixing effect, and is widely utilized in domestic. The engineering practices prove that, this mixing unit has a lot of advantages, and thus the tubular static mixer is herein recommended. y� Reaction The reaction and flocculation process is the most critical link of water supply treatment, and effect of flocculation shall directly impact the settling effect, gas flotation effect and quality of effluent water. In this project it adopts the vertical mechanical reaction basin, bent plate reaction basin, small mesh grid reaction basin to carry out comparison on plans, details refer to 7.4-2.
Table 7.4-2 Comparison on plans of reaction basin
Basin type Item
Vertical mechanical reaction basin
Bent plate reaction basin
Small mesh grid reaction basin
Technical comparison
Main advantages
1. It has very strong adaptability to change of raw water
1. It has wide application, and is featured by new type, high efficiency, small land occupancy, appropriate investment, and fairly high consumption of reagent. 2. It adopts the fixed type ABS product with fairly long service life and convenient installation. 3. It does not need to be added by equipment, and the maintenance and management are convenient. 4. It has strong anti-impact capacity, and the appropriate scope of water quality is wide.
1. It is featured by new type, high efficiency, small land occupancy, low investment, low agent consumption, and potential. 2. It has strong anti-impact capacity, and the appropriate scope of water quality is wide. 3. It does not need the mechanical equipment, and the maintenance and management are convenient. 4. It adopts the ethylene-propylene copolymers plastics grid board with same specs in favor of installation and maintenance. 5. The reaction basin already has the matured design, installation and run experience.
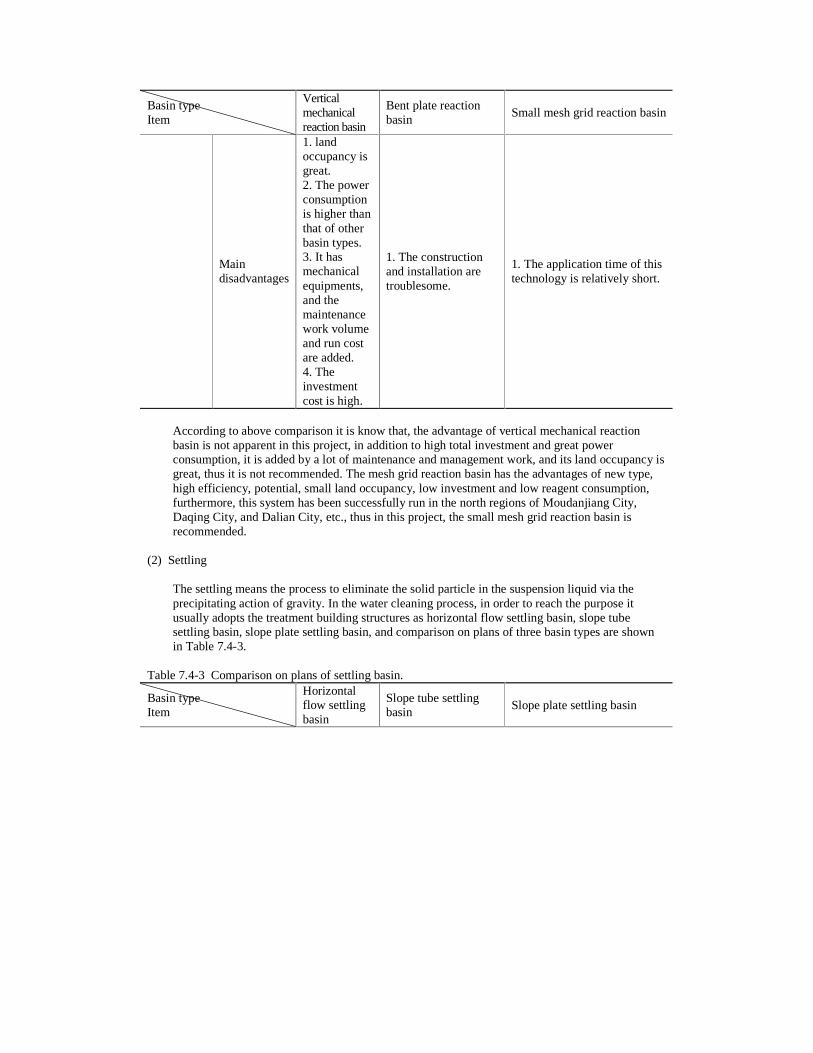
Basin type Item
Vertical mechanical reaction basin
Bent plate reaction basin
Small mesh grid reaction basin
Main disadvantages
1. land occupancy is great. 2. The power consumption is higher than that of other basin types. 3. It has mechanical equipments, and the maintenance work volume and run cost are added. 4. The investment cost is high.
1. The construction and installation are troublesome.
1. The application time of this technology is relatively short.
According to above comparison it is know that, the advantage of vertical mechanical reaction basin is not apparent in this project, in addition to high total investment and great power consumption, it is added by a lot of maintenance and management work, and its land occupancy is great, thus it is not recommended. The mesh grid reaction basin has the advantages of new type, high efficiency, potential, small land occupancy, low investment and low reagent consumption, furthermore, this system has been successfully run in the north regions of Moudanjiang City, Daqing City, and Dalian City, etc., thus in this project, the small mesh grid reaction basin is recommended.
(2) Settling
The settling means the process to eliminate the solid particle in the suspension liquid via the precipitating action of gravity. In the water cleaning process, in order to reach the purpose it usually adopts the treatment building structures as horizontal flow settling basin, slope tube settling basin, slope plate settling basin, and comparison on plans of three basin types are shown in Table 7.4-3.
Table 7.4-3 Comparison on plans of settling basin.
Basin type Item
Horizontal flow settling basin
Slope tube settling basin
Slope plate settling basin
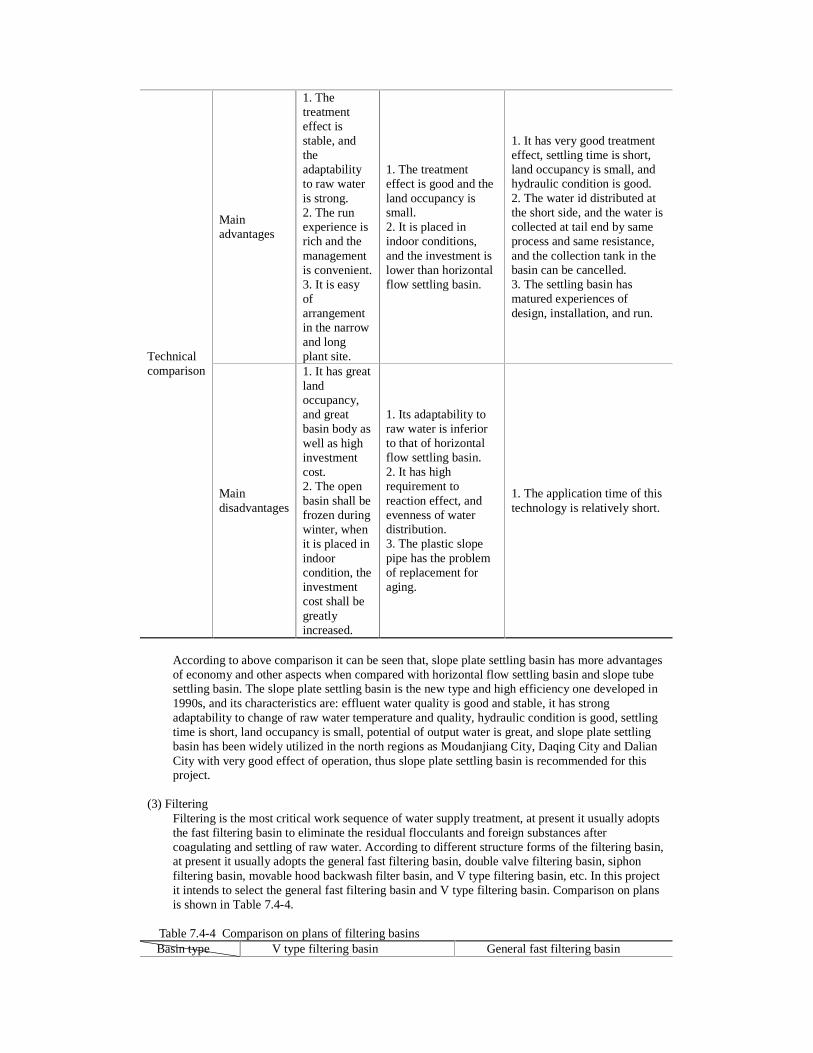
Main advantages
1. The treatment effect is stable, and the adaptability to raw water is strong. 2. The run experience is rich and the management is convenient. 3. It is easy of arrangement in the narrow and long plant site.
1. The treatment effect is good and the land occupancy is small. 2. It is placed in indoor conditions, and the investment is lower than horizontal flow settling basin.
1. It has very good treatment effect, settling time is short, land occupancy is small, and hydraulic condition is good. 2. The water id distributed at the short side, and the water is collected at tail end by same process and same resistance, and the collection tank in the basin can be cancelled. 3. The settling basin has matured experiences of design, installation, and run.
Technical comparison
Main disadvantages
1. It has great land occupancy, and great basin body as well as high investment cost. 2. The open basin shall be frozen during winter, when it is placed in indoor condition, the investment cost shall be greatly increased.
1. Its adaptability to raw water is inferior to that of horizontal flow settling basin. 2. It has high requirement to reaction effect, and evenness of water distribution. 3. The plastic slope pipe has the problem of replacement for aging.
1. The application time of this technology is relatively short.
According to above comparison it can be seen that, slope plate settling basin has more advantages of economy and other aspects when compared with horizontal flow settling basin and slope tube settling basin. The slope plate settling basin is the new type and high efficiency one developed in 1990s, and its characteristics are: effluent water quality is good and stable, it has strong adaptability to change of raw water temperature and quality, hydraulic condition is good, settling time is short, land occupancy is small, potential of output water is great, and slope plate settling basin has been widely utilized in the north regions as Moudanjiang City, Daqing City and Dalian City with very good effect of operation, thus slope plate settling basin is recommended for this project.
(3) Filtering
Filtering is the most critical work sequence of water supply treatment, at present it usually adopts the fast filtering basin to eliminate the residual flocculants and foreign substances after coagulating and settling of raw water. According to different structure forms of the filtering basin, at present it usually adopts the general fast filtering basin, double valve filtering basin, siphon filtering basin, movable hood backwash filter basin, and V type filtering basin, etc. In this project it intends to select the general fast filtering basin and V type filtering basin. Comparison on plans is shown in Table 7.4-4.
Table 7.4-4 Comparison on plans of filtering basins
Basin type V type filtering basin General fast filtering basin
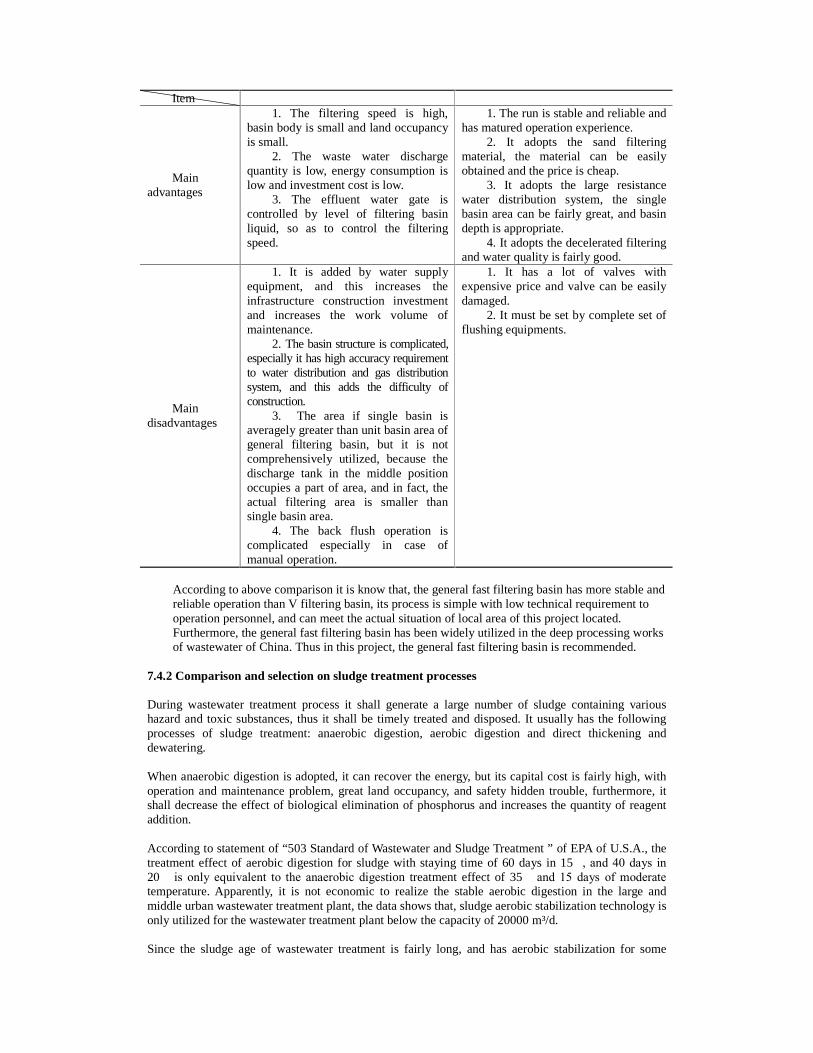
Item
Main advantages
1. The filtering speed is high, basin body is small and land occupancy is small.
2. The waste water discharge quantity is low, energy consumption is low and investment cost is low.
3. The effluent water gate is controlled by level of filtering basin liquid, so as to control the filtering speed.
1. The run is stable and reliable and has matured operation experience.
2. It adopts the sand filtering material, the material can be easily obtained and the price is cheap.
3. It adopts the large resistance water distribution system, the single basin area can be fairly great, and basin depth is appropriate.
4. It adopts the decelerated filtering and water quality is fairly good.
Main disadvantages
1. It is added by water supply equipment, and this increases the infrastructure construction investment and increases the work volume of maintenance.
2. The basin structure is complicated, especially it has high accuracy requirement to water distribution and gas distribution system, and this adds the difficulty of construction.
3. The area if single basin is averagely greater than unit basin area of general filtering basin, but it is not comprehensively utilized, because the discharge tank in the middle position occupies a part of area, and in fact, the actual filtering area is smaller than single basin area.
4. The back flush operation is complicated especially in case of manual operation.
1. It has a lot of valves with expensive price and valve can be easily damaged.
2. It must be set by complete set of flushing equipments.
According to above comparison it is know that, the general fast filtering basin has more stable and reliable operation than V filtering basin, its process is simple with low technical requirement to operation personnel, and can meet the actual situation of local area of this project located. Furthermore, the general fast filtering basin has been widely utilized in the deep processing works of wastewater of China. Thus in this project, the general fast filtering basin is recommended.
7.4.2 Comparison and selection on sludge treatment processes During wastewater treatment process it shall generate a large number of sludge containing various hazard and toxic substances, thus it shall be timely treated and disposed. It usually has the following processes of sludge treatment: anaerobic digestion, aerobic digestion and direct thickening and dewatering. When anaerobic digestion is adopted, it can recover the energy, but its capital cost is fairly high, with operation and maintenance problem, great land occupancy, and safety hidden trouble, furthermore, it shall decrease the effect of biological elimination of phosphorus and increases the quantity of reagent addition. According to statement of “503 Standard of Wastewater and Sludge Treatment ” of EPA of U.S.A., the treatment effect of aerobic digestion for sludge with staying time of 60 days in 15�, and 40 days in 20� is only equivalent to the anaerobic digestion treatment effect of 35� and 15 days of moderate temperature. Apparently, it is not economic to realize the stable aerobic digestion in the large and middle urban wastewater treatment plant, the data shows that, sludge aerobic stabilization technology is only utilized for the wastewater treatment plant below the capacity of 20000 m³/d. Since the sludge age of wastewater treatment is fairly long, and has aerobic stabilization for some
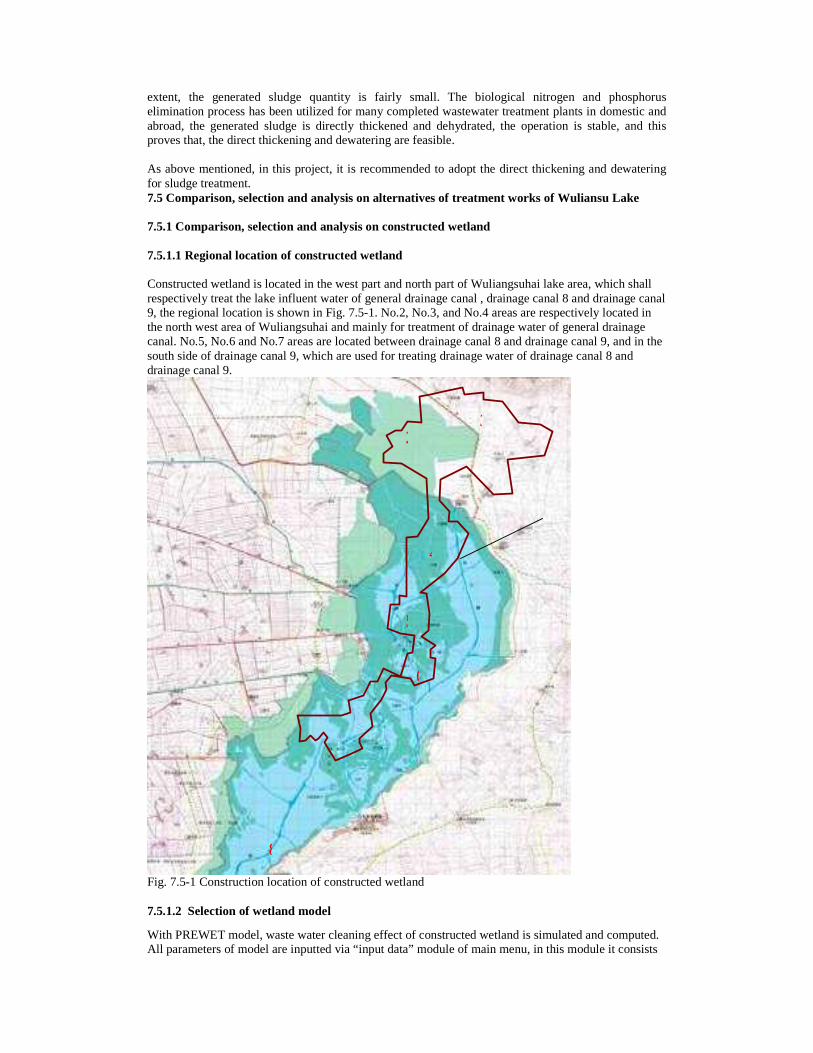
extent, the generated sludge quantity is fairly small. The biological nitrogen and phosphorus elimination process has been utilized for many completed wastewater treatment plants in domestic and abroad, the generated sludge is directly thickened and dehydrated, the operation is stable, and this proves that, the direct thickening and dewatering are feasible. As above mentioned, in this project, it is recommended to adopt the direct thickening and dewatering for sludge treatment. 7.5 Comparison, selection and analysis on alternatives of treatment works of Wuliansu Lake 7.5.1 Comparison, selection and analysis on constructed wetland 7.5.1.1 Regional location of constructed wetland Constructed wetland is located in the west part and north part of Wuliangsuhai lake area, which shall respectively treat the lake influent water of general drainage canal , drainage canal 8 and drainage canal 9, the regional location is shown in Fig. 7.5-1. No.2, No.3, and No.4 areas are respectively located in the north west area of Wuliangsuhai and mainly for treatment of drainage water of general drainage canal. No.5, No.6 and No.7 areas are located between drainage canal 8 and drainage canal 9, and in the south side of drainage canal 9, which are used for treating drainage water of drainage canal 8 and drainage canal 9.
Fig. 7.5-1 Construction location of constructed wetland 7.5.1.2 Selection of wetland model
With PREWET model, waste water cleaning effect of constructed wetland is simulated and computed. All parameters of model are inputted via “input data” module of main menu, in this module it consists
1
23
4
5
6
7
8
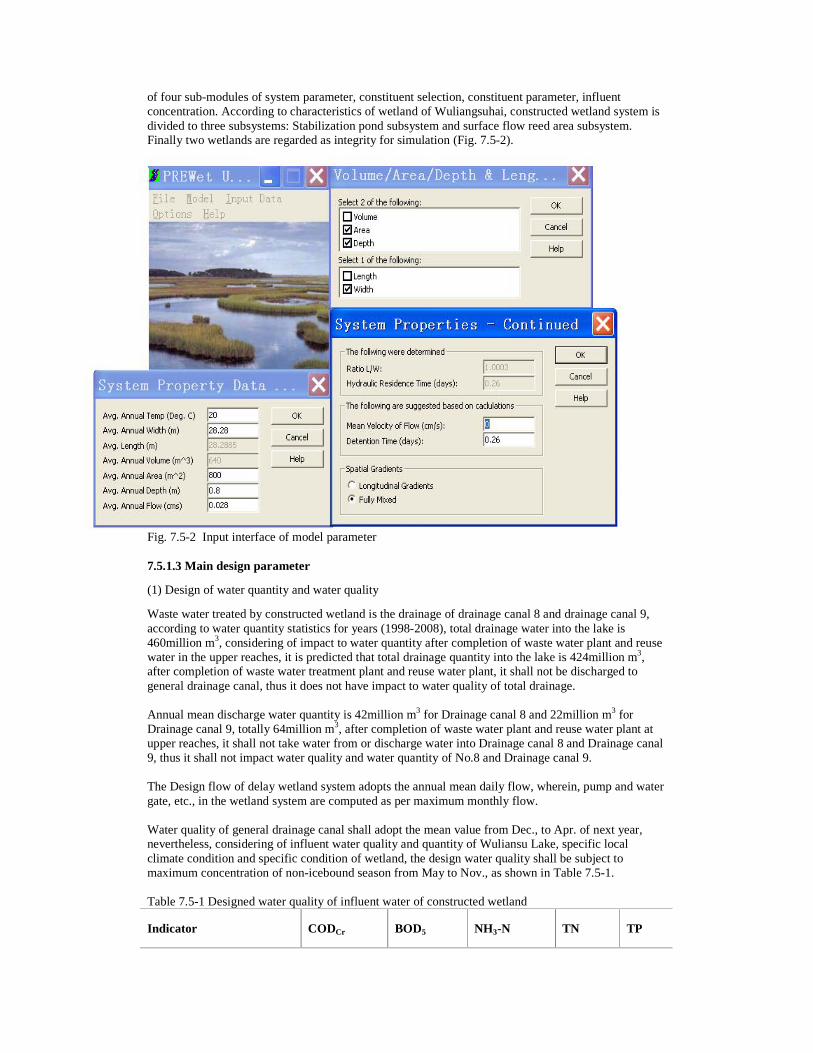
of four sub-modules of system parameter, constituent selection, constituent parameter, influent concentration. According to characteristics of wetland of Wuliangsuhai, constructed wetland system is divided to three subsystems: Stabilization pond subsystem and surface flow reed area subsystem. Finally two wetlands are regarded as integrity for simulation (Fig. 7.5-2).
Fig. 7.5-2 Input interface of model parameter 7.5.1.3 Main design parameter
(1) Design of water quantity and water quality
Waste water treated by constructed wetland is the drainage of drainage canal 8 and drainage canal 9, according to water quantity statistics for years (1998-2008), total drainage water into the lake is 460million m3, considering of impact to water quantity after completion of waste water plant and reuse water in the upper reaches, it is predicted that total drainage quantity into the lake is 424million m3, after completion of waste water treatment plant and reuse water plant, it shall not be discharged to general drainage canal, thus it does not have impact to water quality of total drainage. Annual mean discharge water quantity is 42million m3 for Drainage canal 8 and 22million m3 for Drainage canal 9, totally 64million m3, after completion of waste water plant and reuse water plant at upper reaches, it shall not take water from or discharge water into Drainage canal 8 and Drainage canal 9, thus it shall not impact water quality and water quantity of No.8 and Drainage canal 9. The Design flow of delay wetland system adopts the annual mean daily flow, wherein, pump and water gate, etc., in the wetland system are computed as per maximum monthly flow. Water quality of general drainage canal shall adopt the mean value from Dec., to Apr. of next year, nevertheless, considering of influent water quality and quantity of Wuliansu Lake, specific local climate condition and specific condition of wetland, the design water quality shall be subject to maximum concentration of non-icebound season from May to Nov., as shown in Table 7.5-1. Table 7.5-1 Designed water quality of influent water of constructed wetland
Indicator CODCr BOD5 NH3-N TN TP
Value (mg/L) 60 - 2.4 13.5 1.7
Note: BOD5 lacks measured data. (2) Elimination rate In the wetland, elimination of biochemical oxygen demand can be described by following order 1 reaction dynamics, with apparent correlation (P<0.1) .
)exp(]/[ tKCC TOe −=
Wherein, Ce ——Influent water BOD5�mg/L; Co ——Exfluent water BOD5�mg/L; KT ——First order reaction constant, d-1; t ——Hydraulic power staying time, d.
(2) Hydraulic load and staying time According to the elimination rate predicted, the above formula can be used to compute the hydraulic power staying time required for wetland. In the delay wetland, since great growth of reed occupies a part of space, and the staying time is the function of wetland porosity, during calculation, porosity n shall be taken into account. (3) Area and water depth of delay wetland system In the wetland system, water depth of stabilization pond is about 2.0m, water depth of wetland is controlled by about 1.0m. (4) Water flow status In the wetland system, length to width ratio of hydraulic unit has important impact to hydraulic characteristic. Since area of reed field is very great with irregular form, during design of flow channel, it shall to the greatest extent adopt the diversion dam to make the water flow status gradually approach to plug-flow mode, hydraulic characteristic is improved to increase the elimination rate. (5) Accumulation depth and clearing period of sludge of pond bottom Accumulated depth of sludge is 0.3m, it shall be cleared for interval of every 5-10 years. 7.5.1.4 Plan 1 In plan 1 it adopts 2#, 3#, 4#, 5#, 6# and 7# reed field, wetland of general drainage canal is 2#, 3# and 4# reed field. Wetland of Drainage canal 8 is 5# and 6# reed field, wetland of Drainage canal 9 is 7# reed field. Total land occupancy area is 116914 mou. (1) General drainage canal wetland Wetland of general drainage canal adopts the 2#, 3# and 3# reed field as shown in Fig. 7.5-3, and its total area is 90514 mou. Returned water is lifted by Honggebu pump station and then enters reed field of 4# military area farm via the diversion sluice, through the diversion dam set in the reed field, it is diverted and enter 2# reed field and then 3# reed field via the water channel with width of 1000m in the inner side of lake dam, wherein, the incoming water of Yihewu channel has small quantity and seasonality as well as also directly enter wetland system, finally, through three outlets at the connection between reed field and lake, it enters grid water channel of big lake area via the rubber dam. At present, water level of reed field is lower than level of lake area, effluent water of wetland enters lake area (mostly relies on self flow), therefore it shall run by raising the water level, on the basis of existing water level it shall be raised by 50-70cm. In the branch current from general drainage canal to 4# reed field it is built up by a water interception gate (rubber dam) to control the water current into 4# reed field. When the incoming water of upper reaches during flood season is fairly great, or when water quality is fairly good, the water quantity can be directly regulated for entering the lake. Effluent water
of wetland mainly relies on self flow, facilities at location of three outlets comprehensively takes into account the requirement for improving hydraulic power condition of lake area, and water quantity distributed is respectively 20%, 20% and 60%. If the dam in the circumference of reed field needs to be reinforced and heightened, it may be done on the previous foundation. The border-in position between reed field and lake is the lake dyke, width of previous lake dyke is mostly about 2.0-2.5m and height 1019.0-1019.6 m, and there is no lake dyke at individual section. Elevation of normal lake water level is 1018.5m, maximum elevation of lake level is 1019.3m, thus designed elevation of lake dyke is determined as 1020.0m; Its width shall take into account the stability and transport requirement in the water, dyke top width is 5.0m, slope 1:2.0, and height is 2.5m. Rising water level may incur rise of groundwater level of farm in the circumference and impact normal farming work, at the outside of reed field of wetland it shall adopt vertical plastic laying technology for reverse osmosis treatment. Vertical plastic laying burying depth is about 8m, along a circle of periphery of constructed wetland it shall be set by vertical plastic laying facilities for reverse osmosis purpose, and its total length is 40km. At the water outlet is set by one discharge station with flow of 30 m3/s playing the role of drainage of wetland and lowering wetland level. Since run level of wetland is raised, during icing in winter, the ice layer cannot reach the bottom of wetland, and there is also a part of flow cross-section remained, thus freezing period of wetland of general drainage canal can continue with its run. Nevertheless, oxygen cannot reach water system beneath the ice due to blockage of ice layer, in order to improve elimination rate in winter, in the stabilized pond it is set by aerating apparatus. (2) Drainage canal 8 wetland Wetland of Drainage canal 8 adopts No.5 wetland and No.6 wetland with area of 15300mou. Incoming water enters 5# reed field to raise the water level for its run. Through culvert pipe it enters 6# reed field via Changji channel. Since water level is raised for run, in the periphery of reed field it is done by reverse osmosis treatment via the method of vertical plastic burying, and its length is 4.7km. Drainage canal 8 during winter basically does not have incoming water and has no operation in winter, and aerating pond shall not be set up. Prior to coming of freezing period, water of reed field can be discharged to rear pond of pump station and then into the lake, so as to lower the level of wetland and to the greatest extent avoid the reduction of output of reed. (3) Drainage canal 9 wetland Wetland of Drainage canal 9 adopts part area in No.7 reed field with area of 11100 mou. Incoming water enters 7# reed field to raise the water level for its run, it in turns passes through reed field and then enters the lake via south west corner of reed field. It is set by vertical laying of plastics of 8.5km. After raising the water level it shall impact the output of reed, prior to coming of freezing period the water in the reed field shall be discharged to rear pond of pump station of Drainage canal 9 and then into the lake, so as to reduce water level in the reed field and avoid reduction of output of reed. Drainage canal 9 basically has no incoming water in winter, and is not run in winter, and aerated pond is not setup.
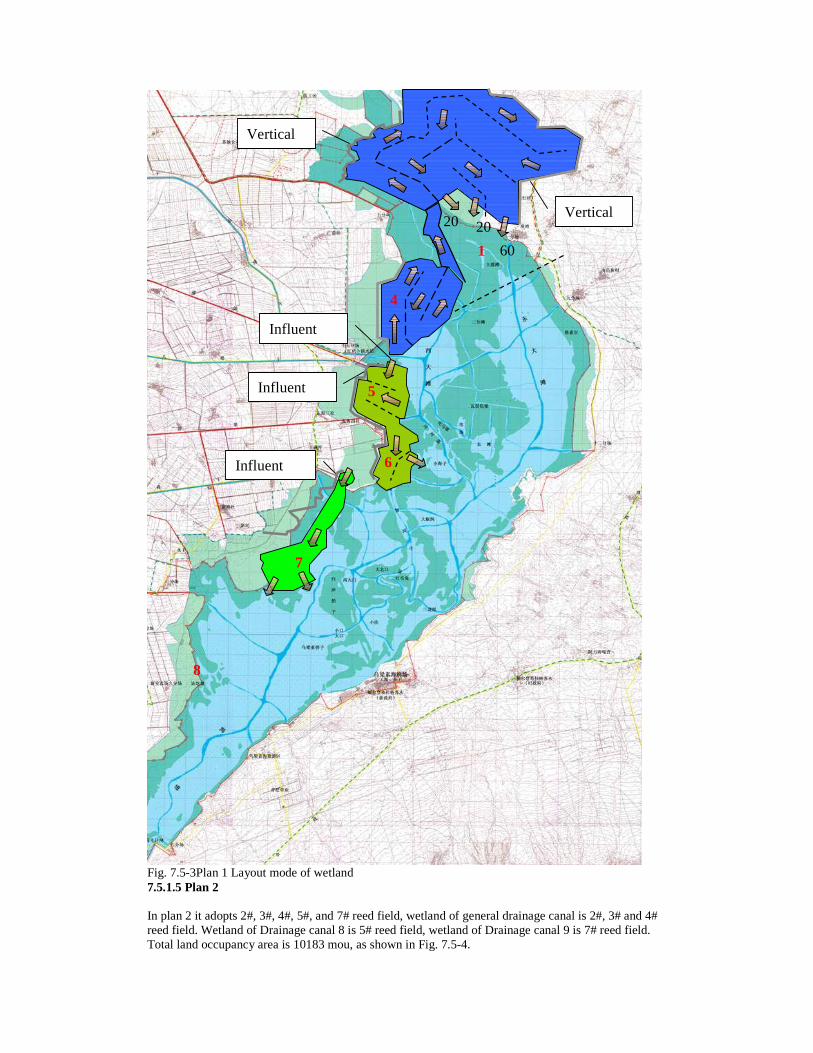
Fig. 7.5-3Plan 1 Layout mode of wetland 7.5.1.5 Plan 2 In plan 2 it adopts 2#, 3#, 4#, 5#, and 7# reed field, wetland of general drainage canal is 2#, 3# and 4# reed field. Wetland of Drainage canal 8 is 5# reed field, wetland of Drainage canal 9 is 7# reed field. Total land occupancy area is 10183 mou, as shown in Fig. 7.5-4.
Influent
Influent
Influent
20
601
3
2
20
5
6
Vertical
8
Vertical
7
4
(1) General drainage canal wetland Wetland of general drainage canal is completely same as that in Plan 1. (2) Drainage canal 8 wetland Wetland of Drainage canal 8 only adopts 5# reed field with area of 8569mou. Incoming water enters reed field to raise the water level for run, it in turn passes through wetland along direction of diversion dam, and finally enters the lake area from the diversion sluice (as shown in location of Fig.). Since it is run with rising of water level, in the periphery of reed field it shall be done by reverse osmosis treatment via the vertical plastic burying method. After raising the water level it shall impact the output of reed, prior to coming of freezing period the water in the reed field shall be discharged to front pond of pump station of Drainage canal 8 and then enter lake via the pump station, so as to reduce water level in the reed field and maintain output of reed. Drainage canal 8 basically has no incoming water in winter, and is not run in winter, and wind energy aerated pond is not setup. (3) Drainage canal 9 wetland Wetland of Drainage canal 9 is completely same as that in Plan 1.
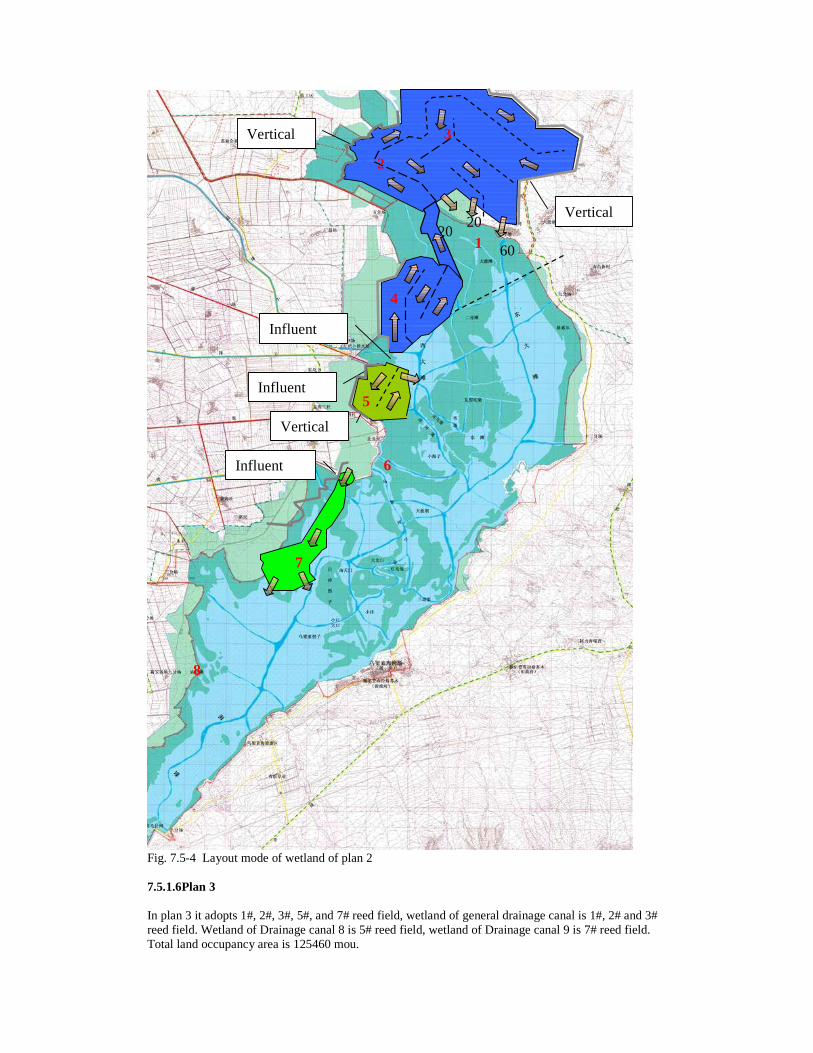
Fig. 7.5-4 Layout mode of wetland of plan 2 7.5.1.6Plan 3 In plan 3 it adopts 1#, 2#, 3#, 5#, and 7# reed field, wetland of general drainage canal is 1#, 2# and 3# reed field. Wetland of Drainage canal 8 is 5# reed field, wetland of Drainage canal 9 is 7# reed field. Total land occupancy area is 125460 mou.
Influent
Influent
Influent
20601
3
2
20
6
Vertical
8
Vertical
7
5
Vertical
4
(1) General drainage canal wetland Wetland of general drainage canal adopts the 1#, 2# and 3# reed field as shown in Fig. 7.5-5, (4# shall not be utilized), and its total area is 105791 mou. Returned water is lifted by Honggebu pump station and then enters 2# reed field along water channel between 4# reed field and lake via the diversion sluice, through the diversion dam set in the reed field, it is diverted and enter 3# reed field, finally, through three diversion sluices between 3# reed field and lake it enters 1# area of the lake, and then enters grid water channel of lake via the water outlet. Since wetland is in the lake with fairly great difficulty of construction, it shall not be made by diversion dam works. (2) Drainage canal 8 wetland Design of wetland of Drainage canal 8 is same as that in Plan 2. (3) Drainage canal 9 wetland Design of wetland of Drainage canal 9 is same as that in Plan 2.
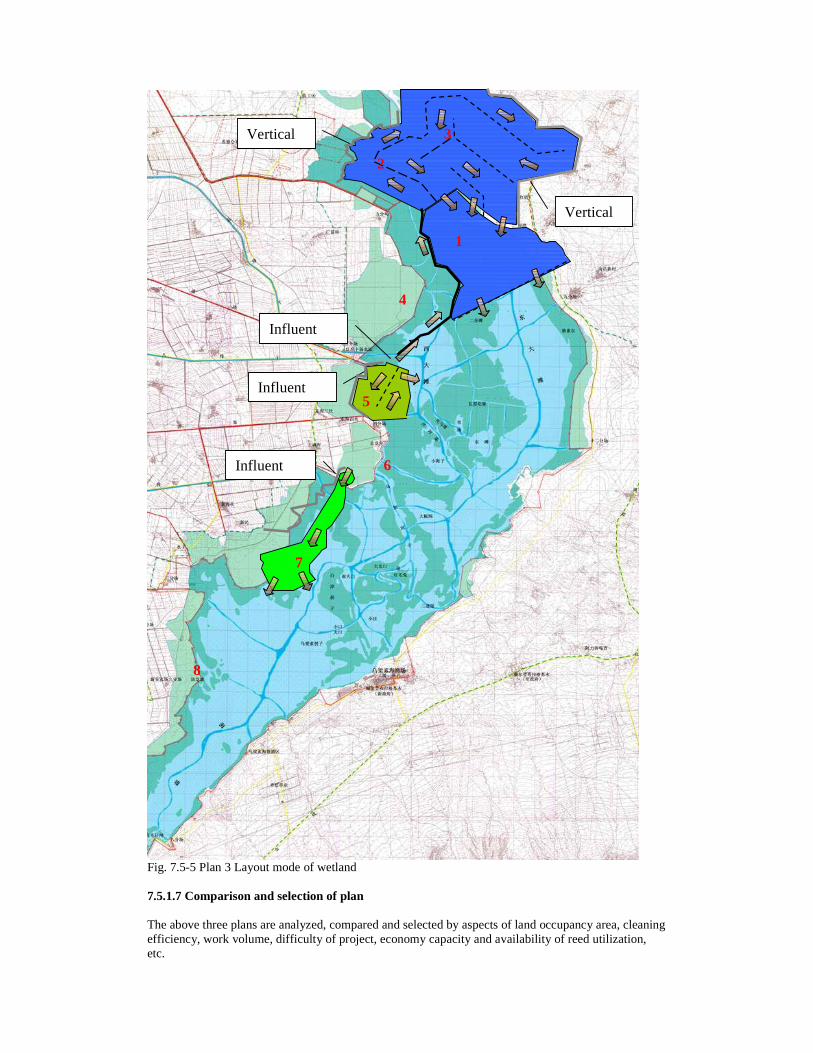
Fig. 7.5-5 Plan 3 Layout mode of wetland 7.5.1.7 Comparison and selection of plan The above three plans are analyzed, compared and selected by aspects of land occupancy area, cleaning efficiency, work volume, difficulty of project, economy capacity and availability of reed utilization, etc.
Influent
Influent
Influent
1
3
4
2
6
Vertical
8
Vertical
5
7
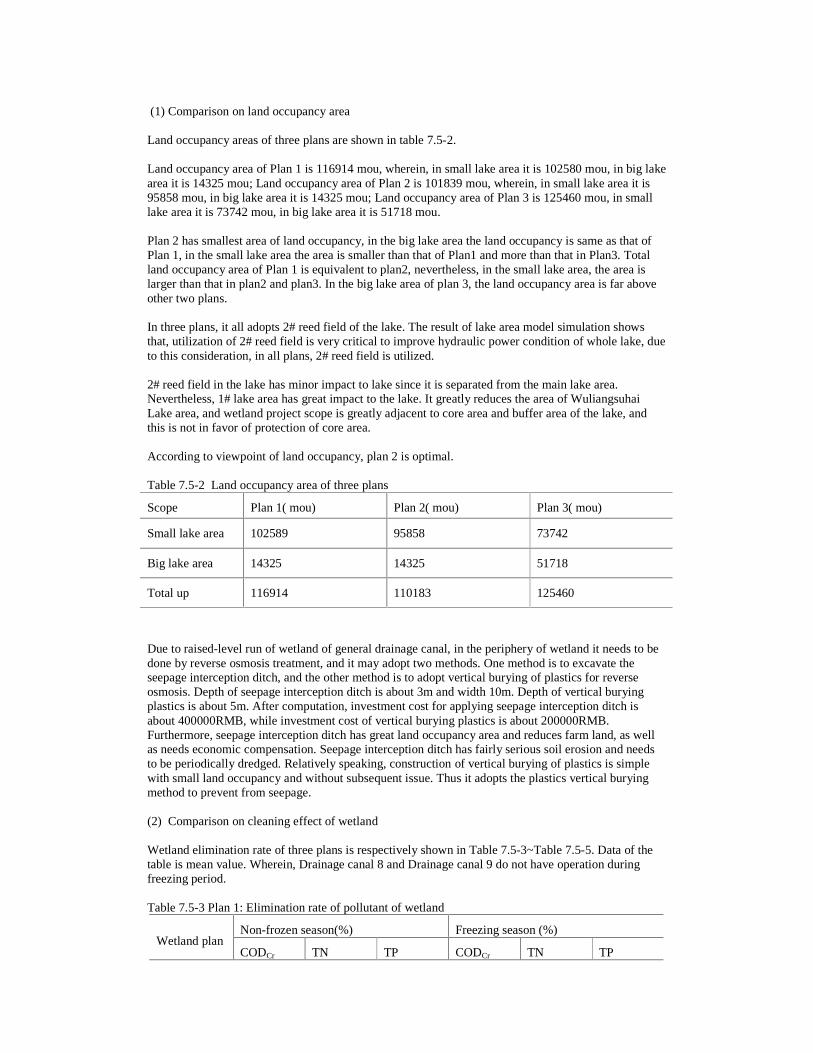
(1) Comparison on land occupancy area Land occupancy areas of three plans are shown in table 7.5-2. Land occupancy area of Plan 1 is 116914 mou, wherein, in small lake area it is 102580 mou, in big lake area it is 14325 mou; Land occupancy area of Plan 2 is 101839 mou, wherein, in small lake area it is 95858 mou, in big lake area it is 14325 mou; Land occupancy area of Plan 3 is 125460 mou, in small lake area it is 73742 mou, in big lake area it is 51718 mou. Plan 2 has smallest area of land occupancy, in the big lake area the land occupancy is same as that of Plan 1, in the small lake area the area is smaller than that of Plan1 and more than that in Plan3. Total land occupancy area of Plan 1 is equivalent to plan2, nevertheless, in the small lake area, the area is larger than that in plan2 and plan3. In the big lake area of plan 3, the land occupancy area is far above other two plans. In three plans, it all adopts 2# reed field of the lake. The result of lake area model simulation shows that, utilization of 2# reed field is very critical to improve hydraulic power condition of whole lake, due to this consideration, in all plans, 2# reed field is utilized. 2# reed field in the lake has minor impact to lake since it is separated from the main lake area. Nevertheless, 1# lake area has great impact to the lake. It greatly reduces the area of Wuliangsuhai Lake area, and wetland project scope is greatly adjacent to core area and buffer area of the lake, and this is not in favor of protection of core area. According to viewpoint of land occupancy, plan 2 is optimal. Table 7.5-2 Land occupancy area of three plans
Scope Plan 1( mou) Plan 2( mou) Plan 3( mou)
Small lake area 102589 95858 73742
Big lake area 14325 14325 51718
Total up 116914 110183 125460
Due to raised-level run of wetland of general drainage canal, in the periphery of wetland it needs to be done by reverse osmosis treatment, and it may adopt two methods. One method is to excavate the seepage interception ditch, and the other method is to adopt vertical burying of plastics for reverse osmosis. Depth of seepage interception ditch is about 3m and width 10m. Depth of vertical burying plastics is about 5m. After computation, investment cost for applying seepage interception ditch is about 400000RMB, while investment cost of vertical burying plastics is about 200000RMB. Furthermore, seepage interception ditch has great land occupancy area and reduces farm land, as well as needs economic compensation. Seepage interception ditch has fairly serious soil erosion and needs to be periodically dredged. Relatively speaking, construction of vertical burying of plastics is simple with small land occupancy and without subsequent issue. Thus it adopts the plastics vertical burying method to prevent from seepage. (2) Comparison on cleaning effect of wetland Wetland elimination rate of three plans is respectively shown in Table 7.5-3~Table 7.5-5. Data of the table is mean value. Wherein, Drainage canal 8 and Drainage canal 9 do not have operation during freezing period. Table 7.5-3 Plan 1: Elimination rate of pollutant of wetland
Non-frozen season(%) Freezing season (%) Wetland plan
CODCr TN TP CODCr TN TP
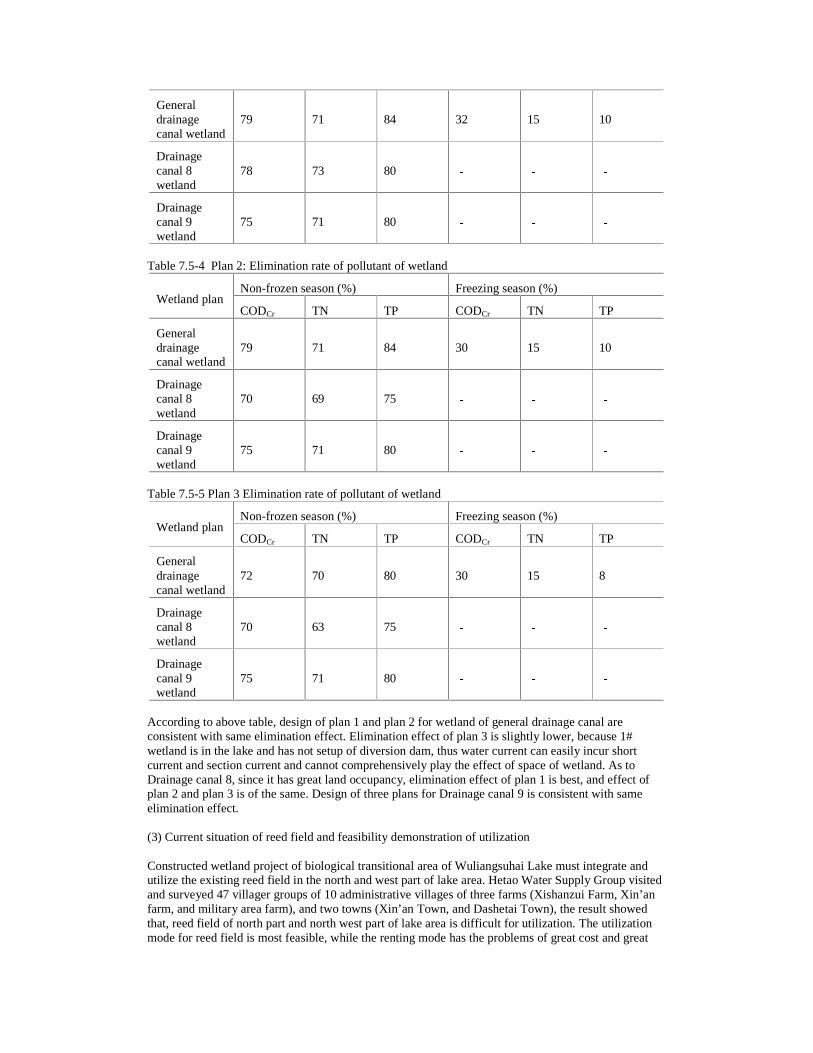
General drainage canal wetland
79 71 84 32 15 10
Drainage canal 8 wetland
78 73 80
Drainage canal 9 wetland
75 71 80
Table 7.5-4 Plan 2: Elimination rate of pollutant of wetland
Non-frozen season (%) Freezing season (%) Wetland plan
CODCr TN TP CODCr TN TP
General drainage canal wetland
79 71 84 30 15 10
Drainage canal 8 wetland
70 69 75
Drainage canal 9 wetland
75 71 80
Table 7.5-5 Plan 3 Elimination rate of pollutant of wetland
Non-frozen season (%) Freezing season (%) Wetland plan
CODCr TN TP CODCr TN TP
General drainage canal wetland
72 70 80 30 15 8
Drainage canal 8 wetland
70 63 75
Drainage canal 9 wetland
75 71 80
According to above table, design of plan 1 and plan 2 for wetland of general drainage canal are consistent with same elimination effect. Elimination effect of plan 3 is slightly lower, because 1# wetland is in the lake and has not setup of diversion dam, thus water current can easily incur short current and section current and cannot comprehensively play the effect of space of wetland. As to Drainage canal 8, since it has great land occupancy, elimination effect of plan 1 is best, and effect of plan 2 and plan 3 is of the same. Design of three plans for Drainage canal 9 is consistent with same elimination effect. (3) Current situation of reed field and feasibility demonstration of utilization Constructed wetland project of biological transitional area of Wuliangsuhai Lake must integrate and utilize the existing reed field in the north and west part of lake area. Hetao Water Supply Group visited and surveyed 47 villager groups of 10 administrative villages of three farms (Xishanzui Farm, Xin’an farm, and military area farm), and two towns (Xin’an Town, and Dashetai Town), the result showed that, reed field of north part and north west part of lake area is difficult for utilization. The utilization mode for reed field is most feasible, while the renting mode has the problems of great cost and great
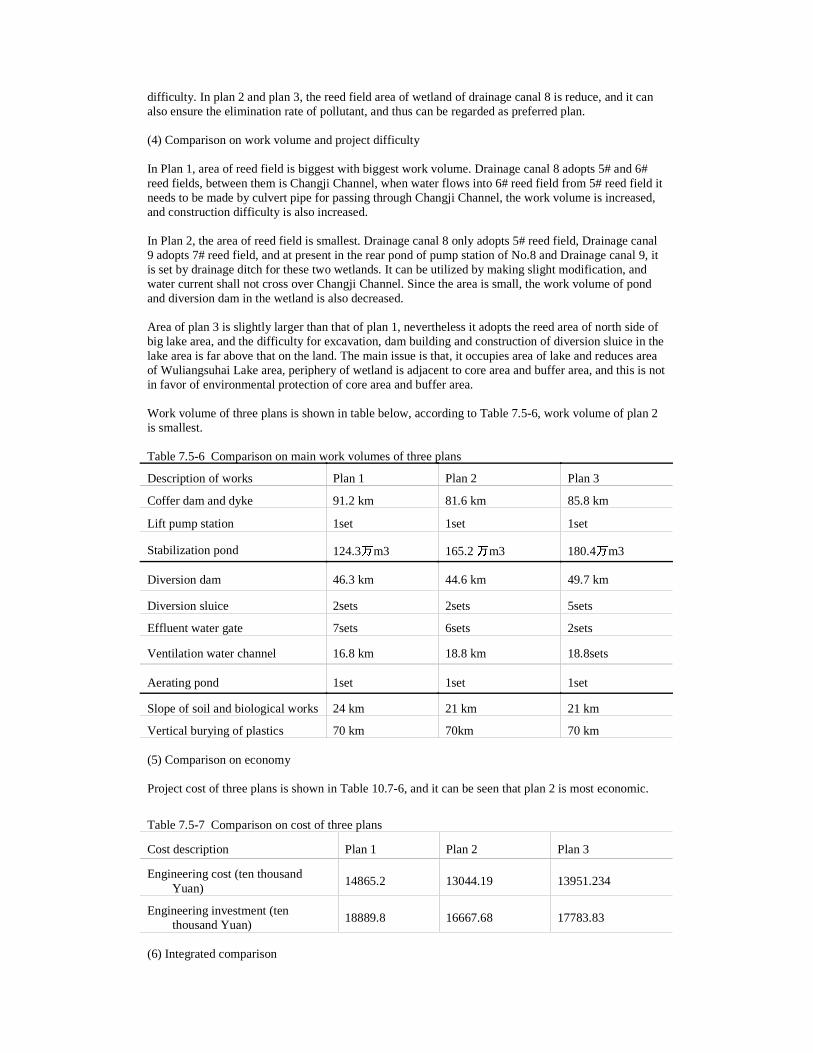
difficulty. In plan 2 and plan 3, the reed field area of wetland of drainage canal 8 is reduce, and it can also ensure the elimination rate of pollutant, and thus can be regarded as preferred plan. (4) Comparison on work volume and project difficulty In Plan 1, area of reed field is biggest with biggest work volume. Drainage canal 8 adopts 5# and 6# reed fields, between them is Changji Channel, when water flows into 6# reed field from 5# reed field it needs to be made by culvert pipe for passing through Changji Channel, the work volume is increased, and construction difficulty is also increased. In Plan 2, the area of reed field is smallest. Drainage canal 8 only adopts 5# reed field, Drainage canal 9 adopts 7# reed field, and at present in the rear pond of pump station of No.8 and Drainage canal 9, it is set by drainage ditch for these two wetlands. It can be utilized by making slight modification, and water current shall not cross over Changji Channel. Since the area is small, the work volume of pond and diversion dam in the wetland is also decreased. Area of plan 3 is slightly larger than that of plan 1, nevertheless it adopts the reed area of north side of big lake area, and the difficulty for excavation, dam building and construction of diversion sluice in the lake area is far above that on the land. The main issue is that, it occupies area of lake and reduces area of Wuliangsuhai Lake area, periphery of wetland is adjacent to core area and buffer area, and this is not in favor of environmental protection of core area and buffer area. Work volume of three plans is shown in table below, according to Table 7.5-6, work volume of plan 2 is smallest. Table 7.5-6 Comparison on main work volumes of three plans
Description of works Plan 1 Plan 2 Plan 3
Coffer dam and dyke 91.2 km 81.6 km 85.8 km
Lift pump station 1set 1set 1set
Stabilization pond 124.3 m3 165.2 m3 180.4 m3
Diversion dam 46.3 km 44.6 km 49.7 km
Diversion sluice 2sets 2sets 5sets
Effluent water gate 7sets 6sets 2sets
Ventilation water channel 16.8 km 18.8 km 18.8sets
Aerating pond 1set 1set 1set
Slope of soil and biological works 24 km 21 km 21 km
Vertical burying of plastics 70 km 70km 70 km (5) Comparison on economy Project cost of three plans is shown in Table 10.7-6, and it can be seen that plan 2 is most economic.
Table 7.5-7 Comparison on cost of three plans
Cost description Plan 1 Plan 2 Plan 3
Engineering cost (ten thousand Yuan)
14865.2 13044.19 13951.234
Engineering investment (ten thousand Yuan)
18889.8 16667.68 17783.83
(6) Integrated comparison
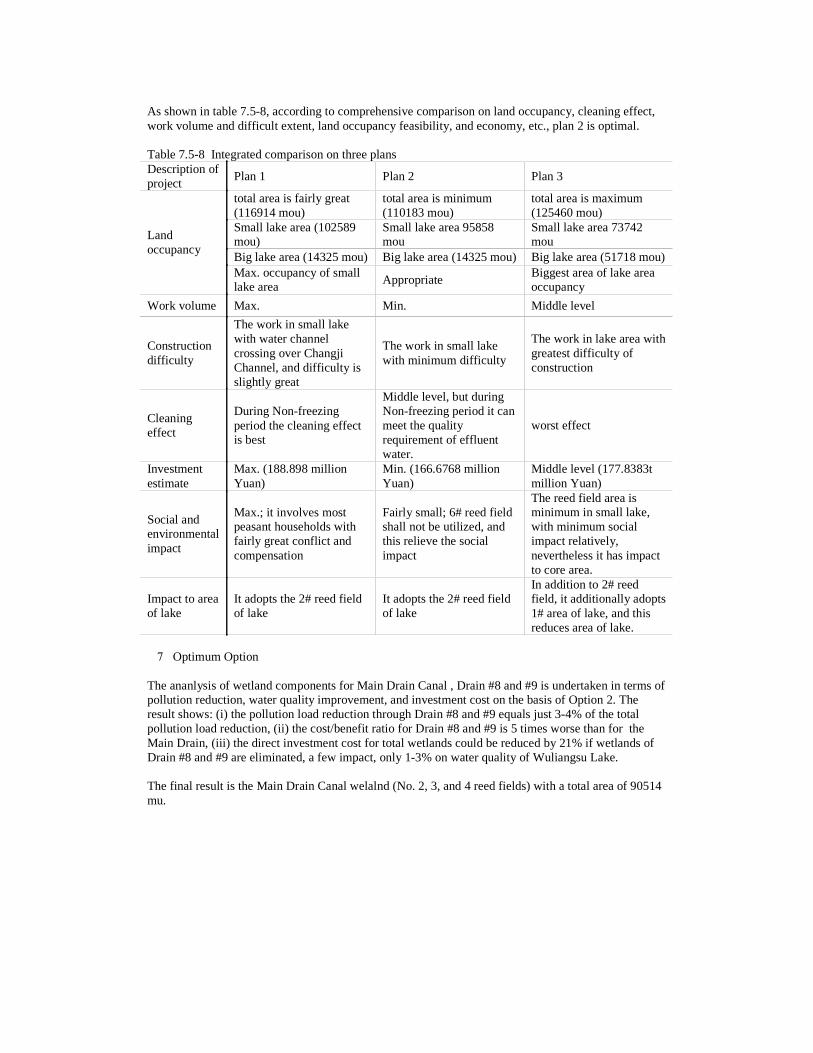
As shown in table 7.5-8, according to comprehensive comparison on land occupancy, cleaning effect, work volume and difficult extent, land occupancy feasibility, and economy, etc., plan 2 is optimal. Table 7.5-8 Integrated comparison on three plans Description of project
Plan 1 Plan 2 Plan 3
total area is fairly great (116914 mou)
total area is minimum (110183 mou)
total area is maximum (125460 mou)
Small lake area (102589 mou)
Small lake area 95858 mou
Small lake area 73742 mou
Big lake area (14325 mou) Big lake area (14325 mou) Big lake area (51718 mou)
Land occupancy
Max. occupancy of small lake area
Appropriate Biggest area of lake area occupancy
Work volume Max. Min. Middle level
Construction difficulty
The work in small lake with water channel crossing over Changji Channel, and difficulty is slightly great
The work in small lake with minimum difficulty
The work in lake area with greatest difficulty of construction
Cleaning effect
During Non-freezing period the cleaning effect is best
Middle level, but during Non-freezing period it can meet the quality requirement of effluent water.
worst effect
Investment estimate
Max. (188.898 million Yuan)
Min. (166.6768 million Yuan)
Middle level (177.8383t million Yuan)
Social and environmental impact
Max.; it involves most peasant households with fairly great conflict and compensation
Fairly small; 6# reed field shall not be utilized, and this relieve the social impact
The reed field area is minimum in small lake, with minimum social impact relatively, nevertheless it has impact to core area.
Impact to area of lake
It adopts the 2# reed field of lake
It adopts the 2# reed field of lake
In addition to 2# reed field, it additionally adopts 1# area of lake, and this reduces area of lake.
�7�Optimum Option The ananlysis of wetland components for Main Drain Canal , Drain #8 and #9 is undertaken in terms of pollution reduction, water quality improvement, and investment cost on the basis of Option 2. The result shows: (i) the pollution load reduction through Drain #8 and #9 equals just 3-4% of the total pollution load reduction, (ii) the cost/benefit ratio for Drain #8 and #9 is 5 times worse than for the Main Drain, (iii) the direct investment cost for total wetlands could be reduced by 21% if wetlands of Drain #8 and #9 are eliminated, a few impact, only 1-3% on water quality of Wuliangsu Lake. The final result is the Main Drain Canal welalnd (No. 2, 3, and 4 reed fields) with a total area of 90514 mu.

7.5.2 Comparison and selection on execution plans of grid water channel 7.5.2.1 Design plan on grid water channel system of lake area 1) Lake-entry location and flow setup plan of wetland According to lake-entry flow statistics and analysis of each drainage cannel of lake area in recent years, the treated water quantity of each wetland plan is shown in Table 7.5-9. Table 7.5-9 Designed treatment capacity of each wetland plan
2) Design plan of grid channel In order to improve the flow status of lake area, and due to general consideration of factors of water channel treatment planning and core protection area, etc., as well as after repeated computation and test via hydraulic model, the design of water channel of lake area with relation to each wetland plan are shown in Table 7.5-10, Fig. 7.5-6 and Fig. 7.5-7.
Table 7.5-10 Design plans for each grid channel options
Drainage canal design Drainage canal design
Wetland plan Drainage
canal plan
Channel bottom width (m)
Slope (m)
Channel length (km)
Drainage canal plan
Channel width (m)
Slope (m)
Channel length (km)
Wetland plan 1
Drainage canal plan 1
45 1:6 40.0 Drainage canal plan 1
10 1:2 99.30
Wetland plan 2
Drainage canal plan 1
45 1:6 40.0 Drainage canal plan 2
10 1:2 100.0
Wetland plan 3
Drainage canal plan 1
45 1:6 40.0 Drainage canal plan 3
10 1:2 68.20
Lake-entry flow (ten thousand m3/d) Wetland plan
May- Sep. Oct.- Nov. Dec. –Apr. of next year
General drainage canal
150 250 73.3
Drainage canal 8
10.7 38.3 / Wetland plan 1
Drainage canal 9
5.87 28.0 /
General drainage canal
150 250 73.3
Drainage canal 8
10.7 38.3 / Wetland plan 2
Drainage canal 9
5.87 28.0 /
General drainage canal
150 250 73.3
Drainage canal 8
10.7 38.3 / Wetland plan 3
Drainage canal 9
5.87 28.0 /
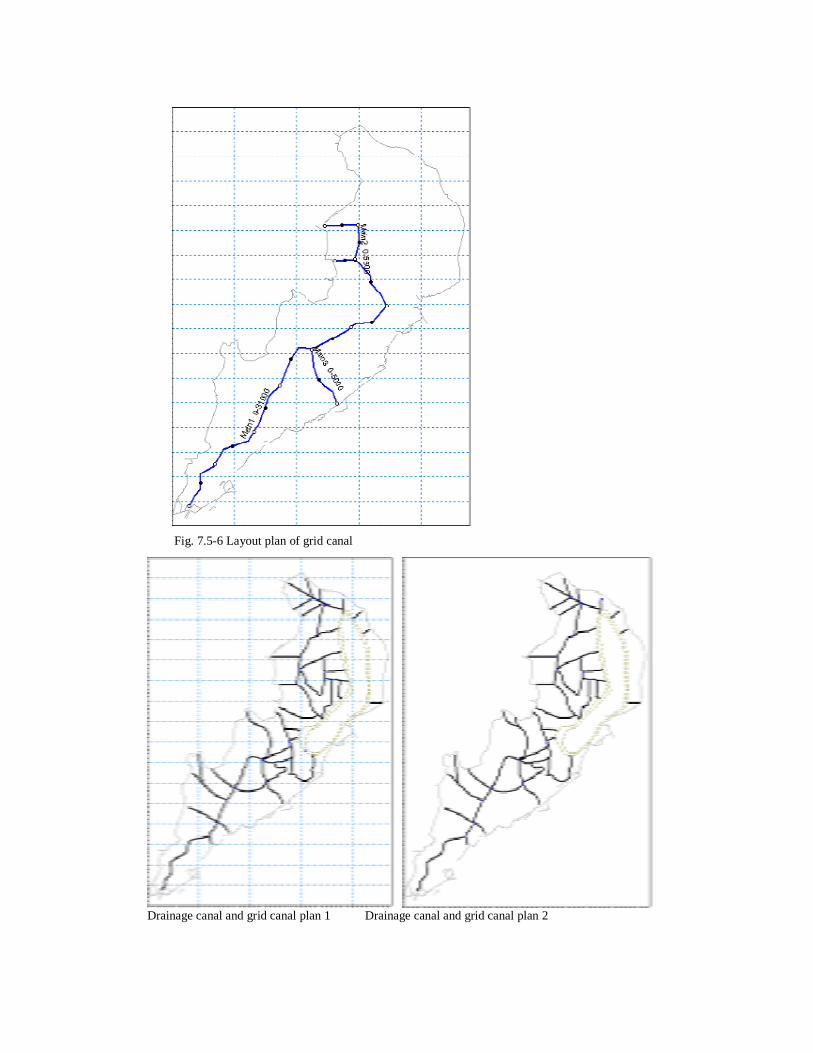
Fig. 7.5-6 Layout plan of grid canal
Drainage canal and grid canal plan 1 Drainage canal and grid canal plan 2
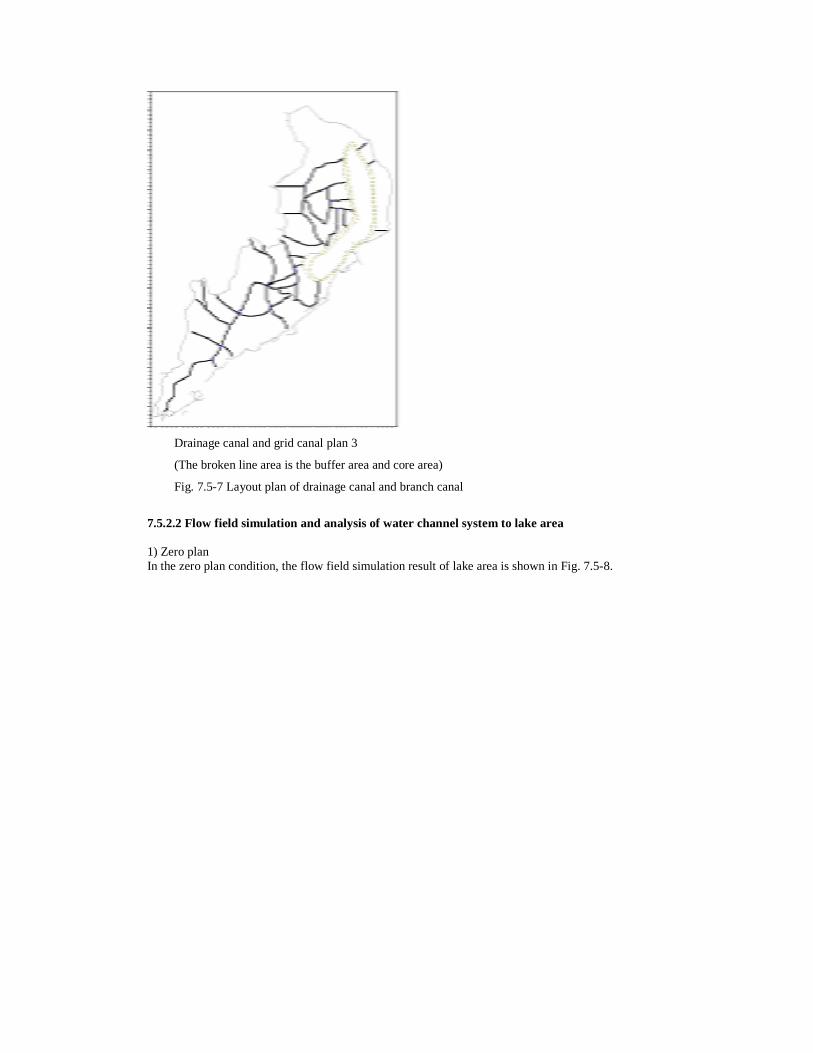
Drainage canal and grid canal plan 3
(The broken line area is the buffer area and core area)
Fig. 7.5-7 Layout plan of drainage canal and branch canal
7.5.2.2 Flow field simulation and analysis of water channel system to lake area 1) Zero plan In the zero plan condition, the flow field simulation result of lake area is shown in Fig. 7.5-8.
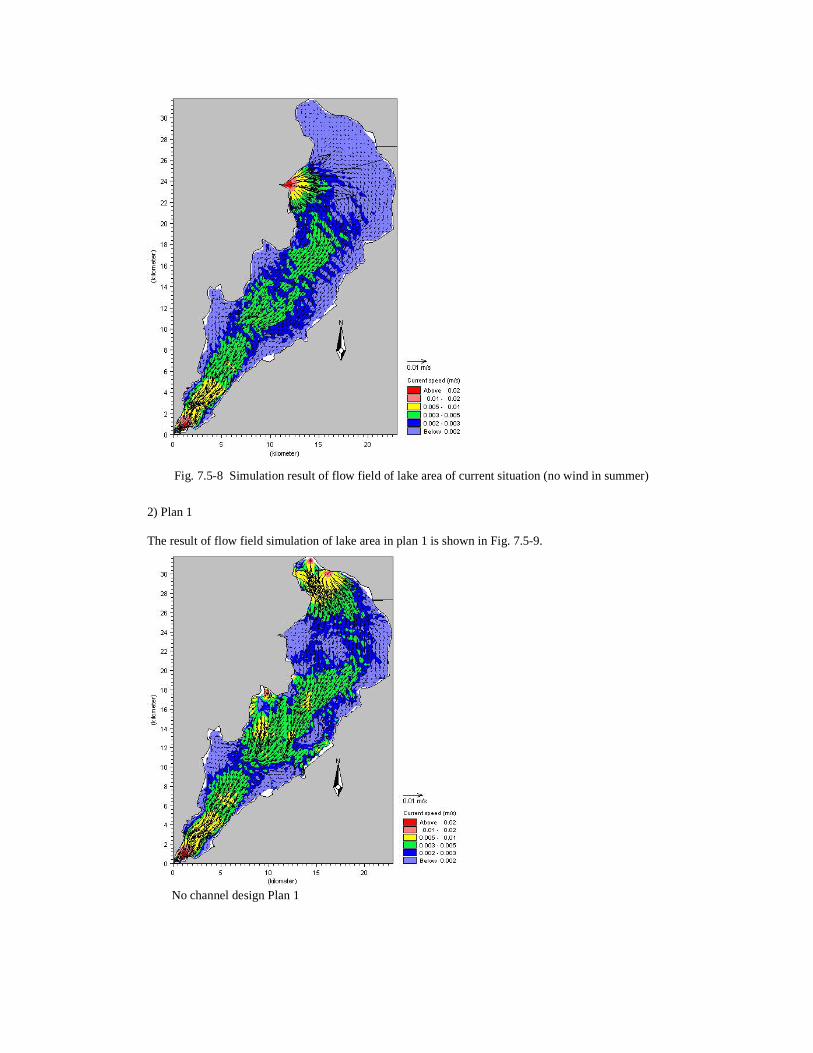
Fig. 7.5-8 Simulation result of flow field of lake area of current situation (no wind in summer)
2) Plan 1 The result of flow field simulation of lake area in plan 1 is shown in Fig. 7.5-9.
No channel design Plan 1
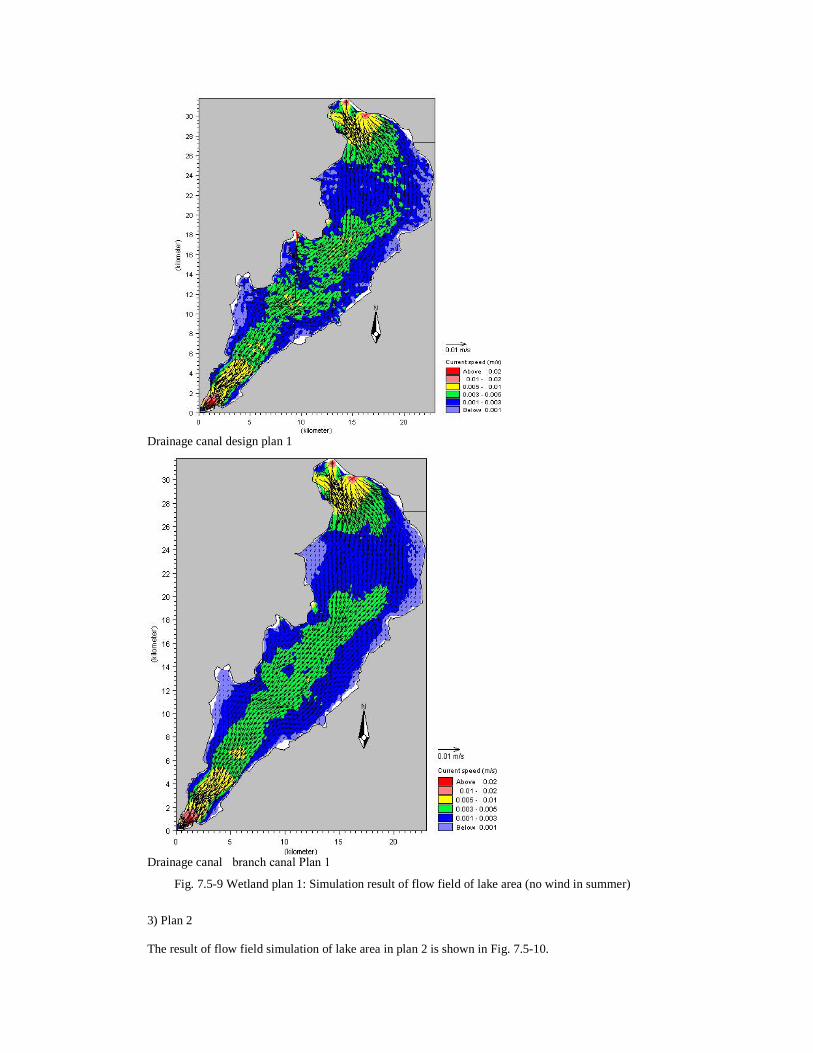
Drainage canal design plan 1
Drainage canal�branch canal Plan 1
Fig. 7.5-9 Wetland plan 1: Simulation result of flow field of lake area (no wind in summer)
3) Plan 2 The result of flow field simulation of lake area in plan 2 is shown in Fig. 7.5-10.
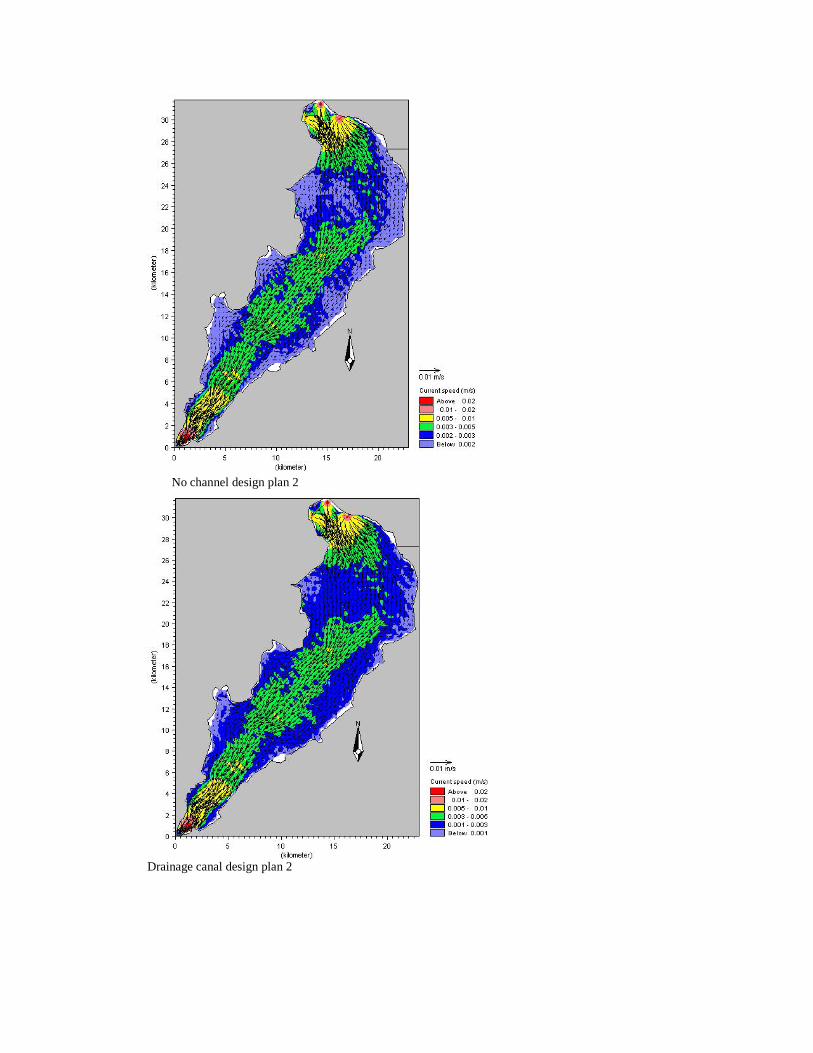
No channel design plan 2
Drainage canal design plan 2
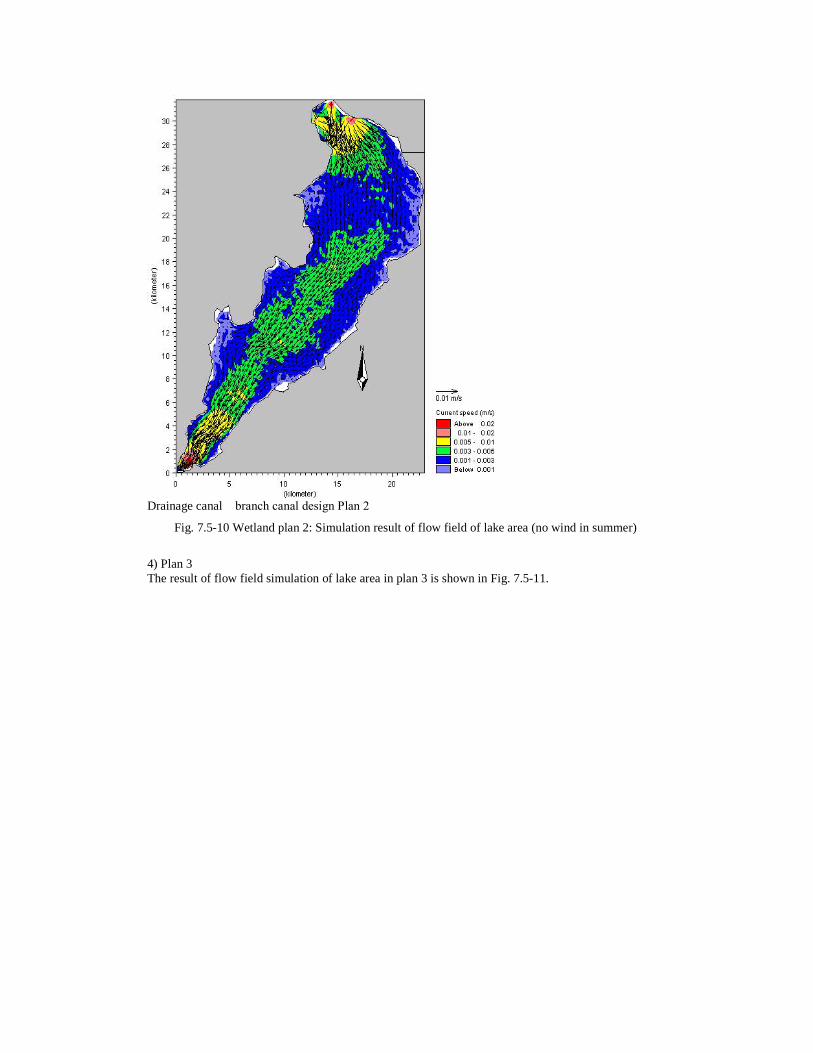
Drainage canal� branch canal design Plan 2
Fig. 7.5-10 Wetland plan 2: Simulation result of flow field of lake area (no wind in summer)
4) Plan 3 The result of flow field simulation of lake area in plan 3 is shown in Fig. 7.5-11.

No-canal design plan 3
Drainage canal design plan 3
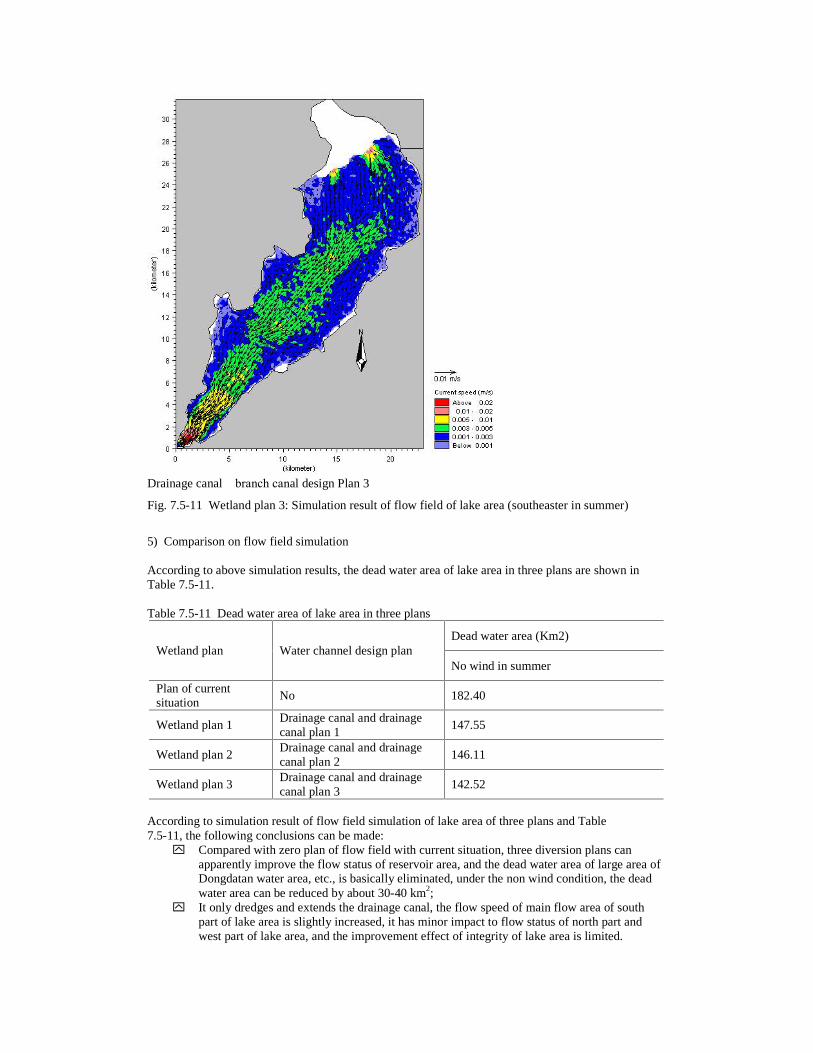
Drainage canal� branch canal design Plan 3
Fig. 7.5-11 Wetland plan 3: Simulation result of flow field of lake area (southeaster in summer)
5) Comparison on flow field simulation According to above simulation results, the dead water area of lake area in three plans are shown in Table 7.5-11. Table 7.5-11 Dead water area of lake area in three plans
Dead water area (Km2) Wetland plan Water channel design plan
No wind in summer
Plan of current situation
No 182.40
Wetland plan 1 Drainage canal and drainage canal plan 1
147.55
Wetland plan 2 Drainage canal and drainage canal plan 2
146.11
Wetland plan 3 Drainage canal and drainage canal plan 3
142.52
According to simulation result of flow field simulation of lake area of three plans and Table 7.5-11, the following conclusions can be made:
y� Compared with zero plan of flow field with current situation, three diversion plans can apparently improve the flow status of reservoir area, and the dead water area of large area of Dongdatan water area, etc., is basically eliminated, under the non wind condition, the dead water area can be reduced by about 30-40 km2;
y� It only dredges and extends the drainage canal, the flow speed of main flow area of south part of lake area is slightly increased, it has minor impact to flow status of north part and west part of lake area, and the improvement effect of integrity of lake area is limited.

y� In the reed area of the lake, the water channel is dredged and extended, the drainage canal and branch canal are executed, dead water area of lake area is reduced by over 10 km2, main flow field of lake area is smoother, and integral flow status of lake is greatly improved.
y� Dead water area of plan 1 is basically equivalent to that of plan 2, compared with plan 1, dead water area of plan 2 is reduced by 1.40 km2 without apparent difference. The dead water area of plan 3 is minimum, because the 1# area of lake area is occupied by wetland and lake area is accordingly reduced. According to viewpoint of optimization of flow field of lake area, plan 2 is optimal, and is related to water outlet plan of wetland.

8. Analysis on Environmental and Economic Loss and Profit The integrated water environmental improvement works of Bayannaoer Municipality with WB loan is important component of the infrastructure of the city, which has far-reaching significance in improving the water environment of Bayannaoer Municipality, dispatching water resources, maintaining the normal operation of urban functions and promoting the harmonious development of the society, economy and environment. 8.1 Project Development Target and Impact Analysis The development target and overall impact of the project are included in Table 8.1-1. Table 8.1-1 Development Target and Overall Impact of the Project Development target of the project Predicted project impact
Dispatch water resources, improve utilization rate of water resources Cut off pollutant, improve the quality of water environment Improve the water circulation of lake, strengthen the self-purifying capability of lake, and retard the process of paludification
Reclaimed water supply works, wastewater treatment and recycling works of processing park and sea area treatment works of Wuliangsuhai Lake will cut off the pollutants discharged into the lake, alleviate the deterioration trend of water environment of Wuliangsuhai Lake, and provide necessary urban environment and infrastructure for the development of Bayannaoer Municipality and finally support the sustained development of economy from the environment
Improve water environment and quality of Wuliangsuhai Lake, and protect the safety of ecological water environment of the Yellow River
8.2 Economic Benefits (1) Economic Benefits of Reclaimed Water Supply Works The unit water sale price of different reclaimed water supply works of the project is calculated with VAT, urban maintenance & construction tax, additive education fee and others expenses plus proper profits on the basis of total costs. The reclaimed water supply works can realize annual average operating incomes of RMB79.7525 million & total annual average profits of RMB19.3925 million after completed. Financial analysis reveals that the net profit rate of all the investments of various reclaimed water supply works is 5.16% on average, the period of the returns on investment is 12.9-13.32 years, various financial indicators are predicted as good and the balance point of profit and loss is safe. It proves that the project still has some economic benefits from the angle of financial evaluation although the project is urban infrastructure. (2) Economic Benefits of Wastewater Treatment and Recycling Works of Processing Park According to Interim Regulations on the Charges for Drainage Facilities of the Ministry of Construction, with reference to the experiences of relevant cities, in combination with the practical situation of this works, the collection of the charges for disposing pollutants enables this works to realize some economic benefits. The wastewater treatment and recycling works of processing park of the project can realize annual average operating incomes of RMB61.612 million, and total annual average profits of RMB18.032 after completed. The financial analysis shows that the net profit ratio of all investments of wastewater treatment and recycling works of processing park is 5.20% on average, and the period of investment recovery is 14.21 years. Various financial indicators are predicted as good and the balance point of profit and loss is safe. It proves that the project still has some economic benefits from the angle of financial evaluation although the project is urban infrastructure. Indirect economic benefits of the investment of the wastewater treatment and recycling works of processing park are also obvious, and mainly realized via less economic loss of the society produced by emission reduction of pollutants, with main forms as follows: y� Industrial Enterprises
Additional investments and operation managing expenses of the industrial enterprises for scattered in-depth wastewater treatment can be reduced and the environmental protection burden of enterprises can be alleviated; and project construction includes domestic wastewater disposal
system in service area and as a result, the project will exert the large-scale and low-cost advantages of the whole works, reduce wastewater disposal construction cost of individual enterprise and promote the construction and development of the enterprise in processing park after completed.
y� Agriculture After the project is implemented, the waste water of wastewater disposal plant is used in industrial enterprises of processing park after in-depth treatment. As a result, the project can save water resources and adjust the conflict between industrial water consumption and agricultural water consumption.
y� Personal Health The project can improve the water quality of the general trunk channel and Wuliangsuhai Lake, boost up local sanitation conditions, reduce the morbidity of diseases, cut off medical care and service expenses, and promote the labor productivity after completed.
The wastewater treatment and recycling works of processing park, important component of urban infrastructure is one public welfare project protecting the environment and benefiting the people. Direct and indirect economic benefits of the project are very obvious. It can improve water quality of trunk channels and Wuliangsuhai Lake, the water environment status of the project area and the investment environment of Bayannaoer Municipality, and promote the land value increment of potential area. Therefore, the implementation of the project has certain benefits for national economy, and plays an important role in improving water environment quality of Bayannaoer Municipality and promoting harmonious development of society, economy and environment. (3) Economic Benefits of Sea Area Works of Wuliangsuhai Lake The economic benefit of the sea area works of Wuliangsuhai Lake is realized mainly through the incomes of the reed industry, fishery and tourism of artificial wetland works of Wuliangsuhai Lake: In virtue of reed land of artificial wetland, annual reed output can increase from 120,000t to 150,000t, and as per RMB100 unit price, additional RMB3.0 million incomes can be created; the fish culture in stabilization pond of artificial wetland can add breeding area of 2000mu and create an additional output of 1000t, and as per RMB4000/t unit price, RMB6.0-12.0 million can be created; and the improvement of ecological environment of the wetland of Wuliangsuhai Lake could provide better conditions for ecologic tourism. It’s predicted that the area can accommodate 100,000 tourists/time, and realize annual operating income of RMB35 million and annual average after-tax profits of about RMB14 million. Therefore, sea area treatment works of Wuliangsuhai Lake has good economic benefits. The construction of artificial wetland works can obviously improve water quality and eutrophication of the whole Wuliangsuhai Lake. Wastewater flows into the lake after wetland treatment and is able to improve water quality by one grade. Inlet water quality of wetland in summer is Cat-IV or better Cat-IV by and large. In frozen season, the pollutant in water is largely cut off. Sea area grid works can obviously improve the self-purifying capability and environment capacity of Wuliangsuhai Lake. Artificial wetland and sea area grid works can greatly reduce the probability of the pollution accident of Wuliangsuhai Lake and the Yellow River, avoid the direct and indirect loss of the accident, and cut off pollution treatment expenses of the accident.
8.3 Social Benefits The project as urban infrastructure construction project will improve urban infrastructure level, better the quality of regional water environment and play a key role in beautifying the city after completed. Moreover, the construction of the project will improve investment environment, facilitate foreign investment, and play active role in promoting sustainable development of the economy. The reclaimed water supply works can adjust water resources, alleviate the water consumption conflict between industry and agriculture, inconsistency of the demand and inadequate water supply of processing park, improve the investment environment of the processing park, and ensure the sustainable development of processing park as per the overall planning after completed. The wastewater treatment and recycling works will improve the surface water quality of the trunk channels and Wuliangsuhai Lake, avoid or reduce the loss of industry & agriculture caused by
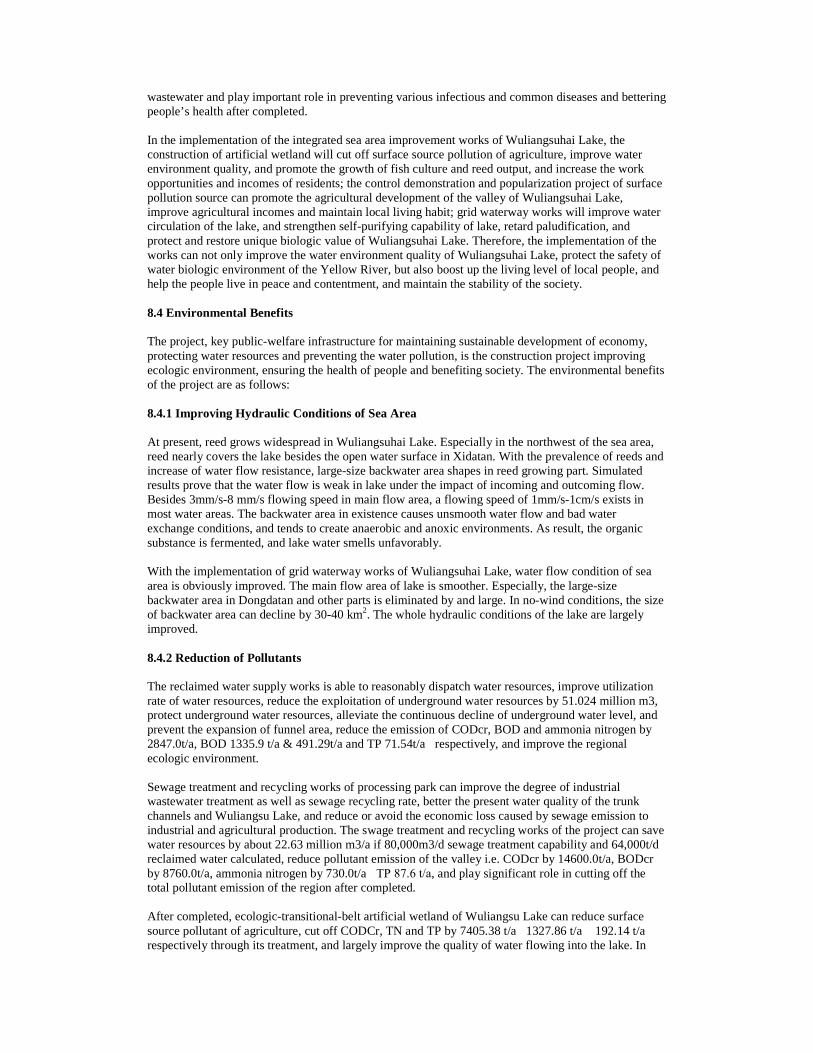
wastewater and play important role in preventing various infectious and common diseases and bettering people’s health after completed. In the implementation of the integrated sea area improvement works of Wuliangsuhai Lake, the construction of artificial wetland will cut off surface source pollution of agriculture, improve water environment quality, and promote the growth of fish culture and reed output, and increase the work opportunities and incomes of residents; the control demonstration and popularization project of surface pollution source can promote the agricultural development of the valley of Wuliangsuhai Lake, improve agricultural incomes and maintain local living habit; grid waterway works will improve water circulation of the lake, and strengthen self-purifying capability of lake, retard paludification, and protect and restore unique biologic value of Wuliangsuhai Lake. Therefore, the implementation of the works can not only improve the water environment quality of Wuliangsuhai Lake, protect the safety of water biologic environment of the Yellow River, but also boost up the living level of local people, and help the people live in peace and contentment, and maintain the stability of the society. 8.4 Environmental Benefits The project, key public-welfare infrastructure for maintaining sustainable development of economy, protecting water resources and preventing the water pollution, is the construction project improving ecologic environment, ensuring the health of people and benefiting society. The environmental benefits of the project are as follows: 8.4.1 Improving Hydraulic Conditions of Sea Area At present, reed grows widespread in Wuliangsuhai Lake. Especially in the northwest of the sea area, reed nearly covers the lake besides the open water surface in Xidatan. With the prevalence of reeds and increase of water flow resistance, large-size backwater area shapes in reed growing part. Simulated results prove that the water flow is weak in lake under the impact of incoming and outcoming flow. Besides 3mm/s-8 mm/s flowing speed in main flow area, a flowing speed of 1mm/s-1cm/s exists in most water areas. The backwater area in existence causes unsmooth water flow and bad water exchange conditions, and tends to create anaerobic and anoxic environments. As result, the organic substance is fermented, and lake water smells unfavorably. With the implementation of grid waterway works of Wuliangsuhai Lake, water flow condition of sea area is obviously improved. The main flow area of lake is smoother. Especially, the large-size backwater area in Dongdatan and other parts is eliminated by and large. In no-wind conditions, the size of backwater area can decline by 30-40 km2. The whole hydraulic conditions of the lake are largely improved. 8.4.2 Reduction of Pollutants The reclaimed water supply works is able to reasonably dispatch water resources, improve utilization rate of water resources, reduce the exploitation of underground water resources by 51.024 million m3, protect underground water resources, alleviate the continuous decline of underground water level, and prevent the expansion of funnel area, reduce the emission of CODcr, BOD and ammonia nitrogen by 2847.0t/a, BOD 1335.9 t/a & 491.29t/a and TP 71.54t/a�respectively, and improve the regional ecologic environment. Sewage treatment and recycling works of processing park can improve the degree of industrial wastewater treatment as well as sewage recycling rate, better the present water quality of the trunk channels and Wuliangsu Lake, and reduce or avoid the economic loss caused by sewage emission to industrial and agricultural production. The swage treatment and recycling works of the project can save water resources by about 22.63 million m3/a if 80,000m3/d sewage treatment capability and 64,000t/d reclaimed water calculated, reduce pollutant emission of the valley i.e. CODcr by 14600.0t/a, BODcr by 8760.0t/a, ammonia nitrogen by 730.0t/a�TP 87.6 t/a, and play significant role in cutting off the total pollutant emission of the region after completed. After completed, ecologic-transitional-belt artificial wetland of Wuliangsu Lake can reduce surface source pollutant of agriculture, cut off CODCr, TN and TP by 7405.38 t/a�1327.86 t/a �192.14 t/a respectively through its treatment, and largely improve the quality of water flowing into the lake. In
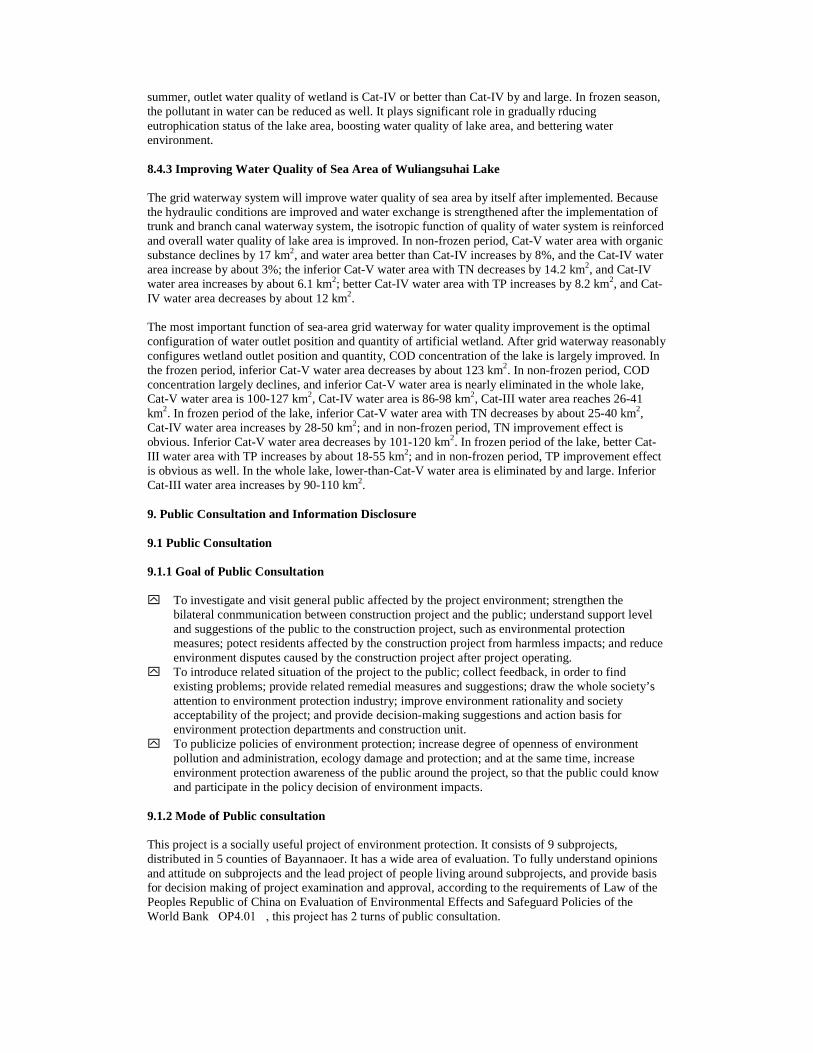
summer, outlet water quality of wetland is Cat-IV or better than Cat-IV by and large. In frozen season, the pollutant in water can be reduced as well. It plays significant role in gradually rducing eutrophication status of the lake area, boosting water quality of lake area, and bettering water environment. 8.4.3 Improving Water Quality of Sea Area of Wuliangsuhai Lake The grid waterway system will improve water quality of sea area by itself after implemented. Because the hydraulic conditions are improved and water exchange is strengthened after the implementation of trunk and branch canal waterway system, the isotropic function of quality of water system is reinforced and overall water quality of lake area is improved. In non-frozen period, Cat-V water area with organic substance declines by 17 km2, and water area better than Cat-IV increases by 8%, and the Cat-IV water area increase by about 3%; the inferior Cat-V water area with TN decreases by 14.2 km2, and Cat-IV water area increases by about 6.1 km2; better Cat-IV water area with TP increases by 8.2 km2, and Cat-IV water area decreases by about 12 km2. The most important function of sea-area grid waterway for water quality improvement is the optimal configuration of water outlet position and quantity of artificial wetland. After grid waterway reasonably configures wetland outlet position and quantity, COD concentration of the lake is largely improved. In the frozen period, inferior Cat-V water area decreases by about 123 km2. In non-frozen period, COD concentration largely declines, and inferior Cat-V water area is nearly eliminated in the whole lake, Cat-V water area is 100-127 km2, Cat-IV water area is 86-98 km2, Cat-III water area reaches 26-41 km2. In frozen period of the lake, inferior Cat-V water area with TN decreases by about 25-40 km2, Cat-IV water area increases by 28-50 km2; and in non-frozen period, TN improvement effect is obvious. Inferior Cat-V water area decreases by 101-120 km2. In frozen period of the lake, better Cat-III water area with TP increases by about 18-55 km2; and in non-frozen period, TP improvement effect is obvious as well. In the whole lake, lower-than-Cat-V water area is eliminated by and large. Inferior Cat-III water area increases by 90-110 km2. 9. Public Consultation and Information Disclosure 9.1 Public Consultation 9.1.1 Goal of Public Consultation y� To investigate and visit general public affected by the project environment; strengthen the
bilateral conmmunication between construction project and the public; understand support level and suggestions of the public to the construction project, such as environmental protection measures; potect residents affected by the construction project from harmless impacts; and reduce environment disputes caused by the construction project after project operating.
y� To introduce related situation of the project to the public; collect feedback, in order to find existing problems; provide related remedial measures and suggestions; draw the whole society’s attention to environment protection industry; improve environment rationality and society acceptability of the project; and provide decision-making suggestions and action basis for environment protection departments and construction unit.
y� To publicize policies of environment protection; increase degree of openness of environment pollution and administration, ecology damage and protection; and at the same time, increase environment protection awareness of the public around the project, so that the public could know and participate in the policy decision of environment impacts.
9.1.2 Mode of Public consultation This project is a socially useful project of environment protection. It consists of 9 subprojects, distributed in 5 counties of Bayannaoer. It has a wide area of evaluation. To fully understand opinions and attitude on subprojects and the lead project of people living around subprojects, and provide basis for decision making of project examination and approval, according to the requirements of Law of the Peoples Republic of China on Evaluation of Environmental Effects and Safeguard Policies of the World Bank�OP4.01�, this project has 2 turns of public consultation.
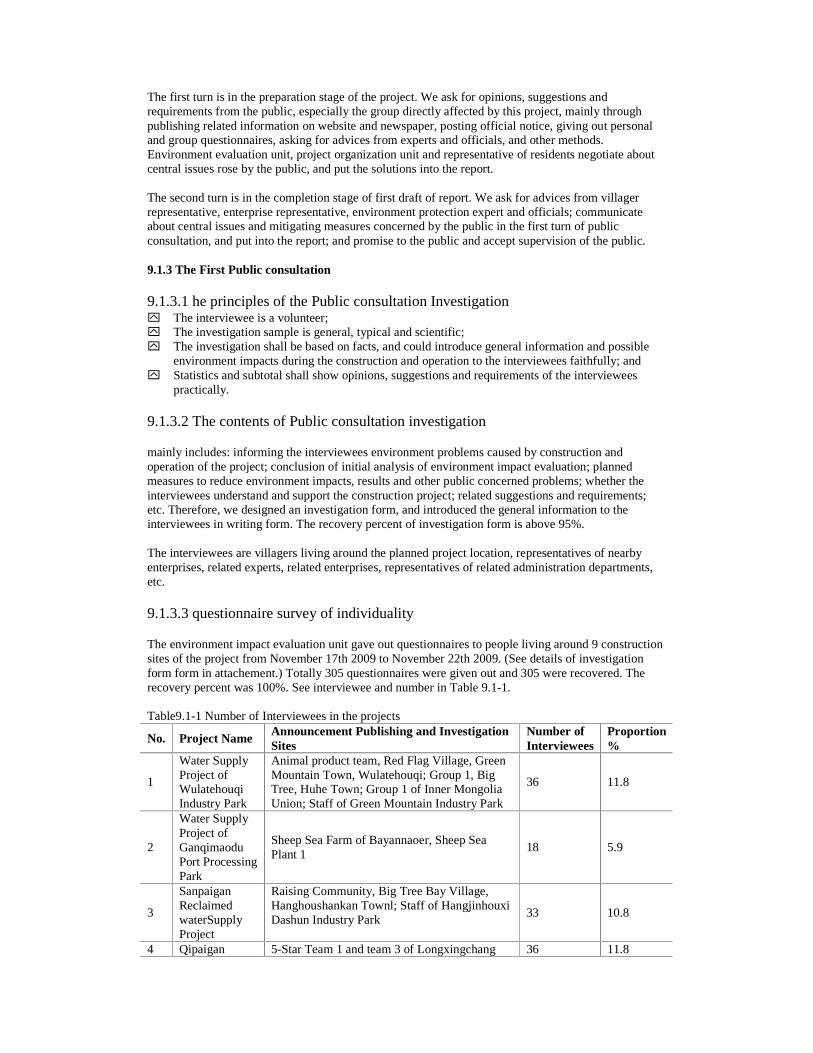
The first turn is in the preparation stage of the project. We ask for opinions, suggestions and requirements from the public, especially the group directly affected by this project, mainly through publishing related information on website and newspaper, posting official notice, giving out personal and group questionnaires, asking for advices from experts and officials, and other methods. Environment evaluation unit, project organization unit and representative of residents negotiate about central issues rose by the public, and put the solutions into the report. The second turn is in the completion stage of first draft of report. We ask for advices from villager representative, enterprise representative, environment protection expert and officials; communicate about central issues and mitigating measures concerned by the public in the first turn of public consultation, and put into the report; and promise to the public and accept supervision of the public. 9.1.3 The First Public consultation 9.1.3.1 he principles of the Public consultation Investigation y� The interviewee is a volunteer; y� The investigation sample is general, typical and scientific; y� The investigation shall be based on facts, and could introduce general information and possible
environment impacts during the construction and operation to the interviewees faithfully; and y� Statistics and subtotal shall show opinions, suggestions and requirements of the interviewees
practically. 9.1.3.2 The contents of Public consultation investigation mainly includes: informing the interviewees environment problems caused by construction and operation of the project; conclusion of initial analysis of environment impact evaluation; planned measures to reduce environment impacts, results and other public concerned problems; whether the interviewees understand and support the construction project; related suggestions and requirements; etc. Therefore, we designed an investigation form, and introduced the general information to the interviewees in writing form. The recovery percent of investigation form is above 95%. The interviewees are villagers living around the planned project location, representatives of nearby enterprises, related experts, related enterprises, representatives of related administration departments, etc. 9.1.3.3 questionnaire survey of individuality The environment impact evaluation unit gave out questionnaires to people living around 9 construction sites of the project from November 17th 2009 to November 22th 2009. (See details of investigation form form in attachement.) Totally 305 questionnaires were given out and 305 were recovered. The recovery percent was 100%. See interviewee and number in Table 9.1-1. Table9.1-1 Number of Interviewees in the projects
No. Project Name Announcement Publishing and Investigation Sites
Number of Interviewees
Proportion %
1
Water Supply Project of Wulatehouqi Industry Park
Animal product team, Red Flag Village, Green Mountain Town, Wulatehouqi; Group 1, Big Tree, Huhe Town; Group 1 of Inner Mongolia Union; Staff of Green Mountain Industry Park
36 11.8
2
Water Supply Project of Ganqimaodu Port Processing Park
Sheep Sea Farm of Bayannaoer, Sheep Sea Plant 1
18 5.9
3
Sanpaigan Reclaimed waterSupply Project
Raising Community, Big Tree Bay Village, Hanghoushankan Townl; Staff of Hangjinhouxi Dashun Industry Park
33 10.8
4 Qipaigan 5-Star Team 1 and team 3 of Longxingchang 36 11.8
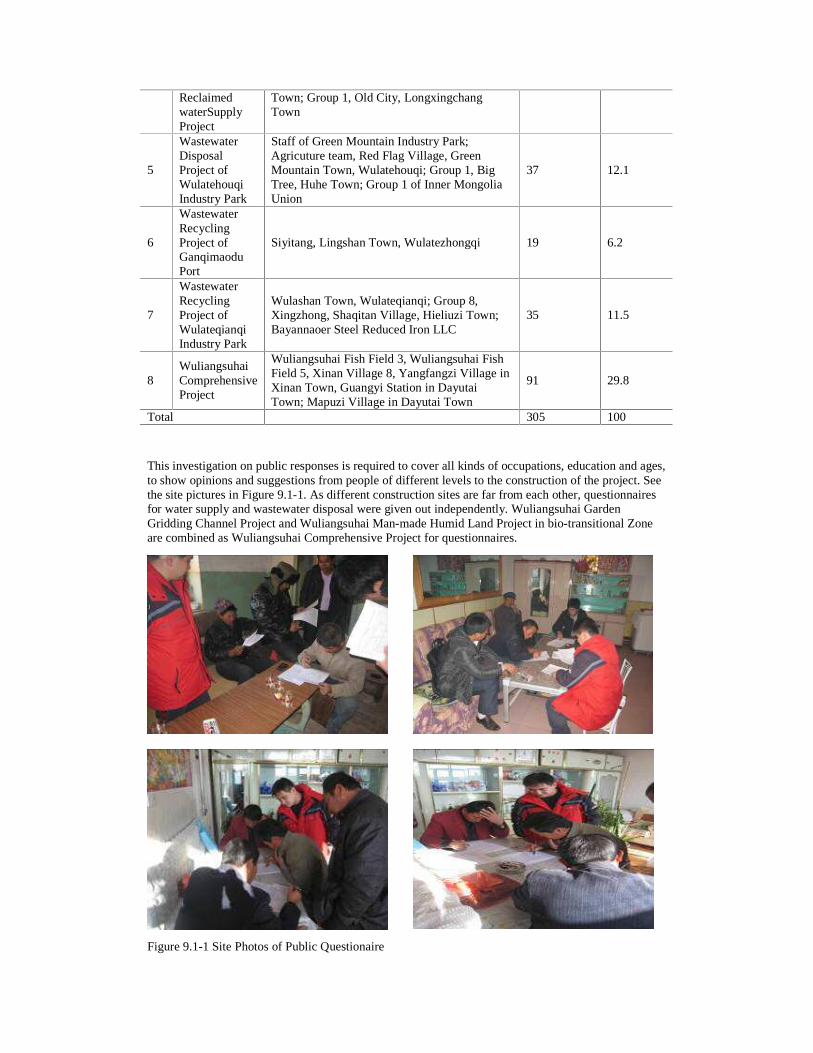
Reclaimed waterSupply Project
Town; Group 1, Old City, Longxingchang Town
5
Wastewater Disposal Project of Wulatehouqi Industry Park
Staff of Green Mountain Industry Park; Agricuture team, Red Flag Village, Green Mountain Town, Wulatehouqi; Group 1, Big Tree, Huhe Town; Group 1 of Inner Mongolia Union
37 12.1
6
Wastewater Recycling Project of Ganqimaodu Port
Siyitang, Lingshan Town, Wulatezhongqi 19 6.2
7
Wastewater Recycling Project of Wulateqianqi Industry Park
Wulashan Town, Wulateqianqi; Group 8, Xingzhong, Shaqitan Village, Hieliuzi Town; Bayannaoer Steel Reduced Iron LLC
35 11.5
8 Wuliangsuhai Comprehensive Project
Wuliangsuhai Fish Field 3, Wuliangsuhai Fish Field 5, Xinan Village 8, Yangfangzi Village in Xinan Town, Guangyi Station in Dayutai Town; Mapuzi Village in Dayutai Town
91 29.8
Total 305 100
This investigation on public responses is required to cover all kinds of occupations, education and ages, to show opinions and suggestions from people of different levels to the construction of the project. See the site pictures in Figure 9.1-1. As different construction sites are far from each other, questionnaires for water supply and wastewater disposal were given out independently. Wuliangsuhai Garden Gridding Channel Project and Wuliangsuhai Man-made Humid Land Project in bio-transitional Zone are combined as Wuliangsuhai Comprehensive Project for questionnaires.
Figure 9.1-1 Site Photos of Public Questionaire
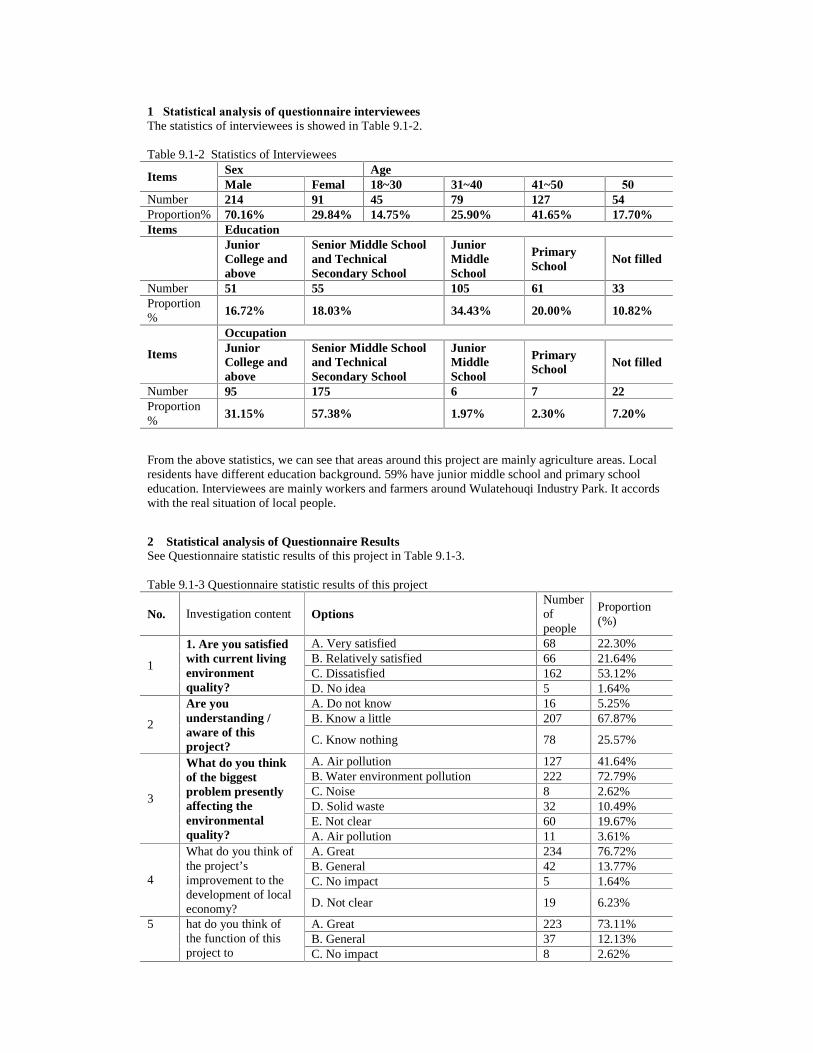
1�Statistical analysis of questionnaire interviewees The statistics of interviewees is showed in Table 9.1-2. Table 9.1-2 Statistics of Interviewees
Sex Age Items
Male Femal 18~30 31~40 41~50 �50 Number 214 91 45 79 127 54 Proportion% 70.16% 29.84% 14.75% 25.90% 41.65% 17.70% Items Education
Junior College and above
Senior Middle School and Technical Secondary School
Junior Middle School
Primary School
Not filled
Number 51 55 105 61 33 Proportion % 16.72% 18.03% 34.43% 20.00% 10.82%
Occupation
Items Junior College and above
Senior Middle School and Technical Secondary School
Junior Middle School
Primary School Not filled
Number 95 175 6 7 22 Proportion % 31.15% 57.38% 1.97% 2.30% 7.20%
From the above statistics, we can see that areas around this project are mainly agriculture areas. Local residents have different education background. 59% have junior middle school and primary school education. Interviewees are mainly workers and farmers around Wulatehouqi Industry Park. It accords with the real situation of local people.
2� Statistical analysis of Questionnaire Results See Questionnaire statistic results of this project in Table 9.1-3. Table 9.1-3 Questionnaire statistic results of this project
No. Investigation content Options Number of people
Proportion (%)
A. Very satisfied 68 22.30% B. Relatively satisfied 66 21.64% C. Dissatisfied 162 53.12%
1
1. Are you satisfied with current living environment quality? D. No idea 5 1.64%
A. Do not know 16 5.25% B. Know a little 207 67.87% 2
Are you understanding / aware of this project?
C. Know nothing 78 25.57%
A. Air pollution 127 41.64% B. Water environment pollution 222 72.79% C. Noise 8 2.62% D. Solid waste 32 10.49% E. Not clear 60 19.67%
3
What do you think of the biggest problem presently affecting the environmental quality? A. Air pollution 11 3.61%
A. Great 234 76.72% B. General 42 13.77% C. No impact 5 1.64% 4
What do you think of the project’s improvement to the development of local economy? D. Not clear 19 6.23%
A. Great 223 73.11% B. General 37 12.13%
5 hat do you think of the function of this project to comprehensive
C. No impact 8 2.62%
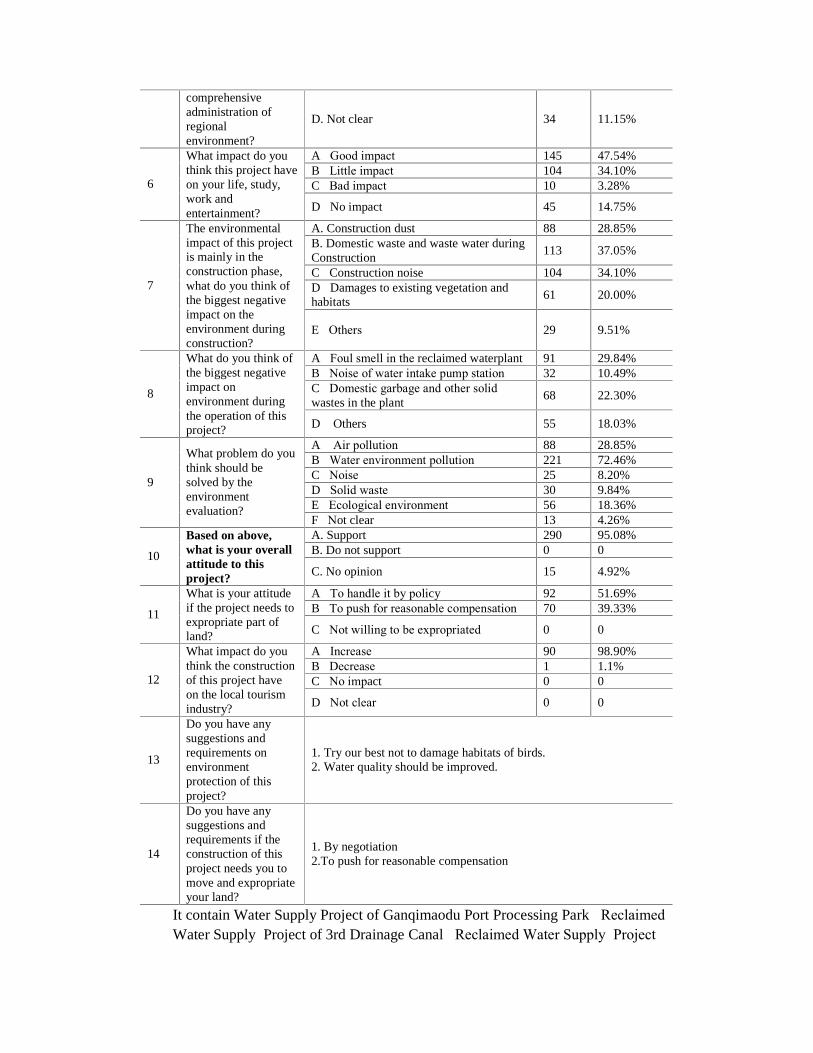
comprehensive administration of regional environment?
D. Not clear 34 11.15%
A�Good impact 145 47.54% B�Little impact 104 34.10% C�Bad impact 10 3.28% 6
What impact do you think this project have on your life, study, work and entertainment? D�No impact 45 14.75%
A. Construction dust 88 28.85% B. Domestic waste and waste water during Construction
113 37.05%
C�Construction noise 104 34.10% D�Damages to existing vegetation and habitats
61 20.00% 7
The environmental impact of this project is mainly in the construction phase, what do you think of the biggest negative impact on the environment during construction?
E�Others 29 9.51%
A�Foul smell in the reclaimed waterplant 91 29.84% B�Noise of water intake pump station 32 10.49% C�Domestic garbage and other solid wastes in the plant
68 22.30% 8
What do you think of the biggest negative impact on environment during the operation of this project? D� Others 55 18.03%
A� Air pollution 88 28.85% B�Water environment pollution 221 72.46% C�Noise 25 8.20% D�Solid waste 30 9.84% E�Ecological environment 56 18.36%
9
What problem do you think should be solved by the environment evaluation?
F�Not clear 13 4.26% A. Support 290 95.08% B. Do not support 0 0 10
Based on above, what is your overall attitude to this project?
C. No opinion 15 4.92%
A�To handle it by policy 92 51.69% B�To push for reasonable compensation 70 39.33% 11
What is your attitude if the project needs to expropriate part of land? C�Not willing to be expropriated 0 0
A�Increase 90 98.90% B�Decrease 1 1.1% C�No impact 0 0 12
What impact do you think the construction of this project have on the local tourism industry? D�Not clear 0 0
13
Do you have any suggestions and requirements on environment protection of this project?
1. Try our best not to damage habitats of birds. 2. Water quality should be improved.
14
Do you have any suggestions and requirements if the construction of this project needs you to move and expropriate your land?
1. By negotiation� 2.To push for reasonable compensation�
It contain Water Supply Project of Ganqimaodu Port Processing Park�Reclaimed Water Supply Project of 3rd Drainage Canal�Reclaimed Water Supply Project
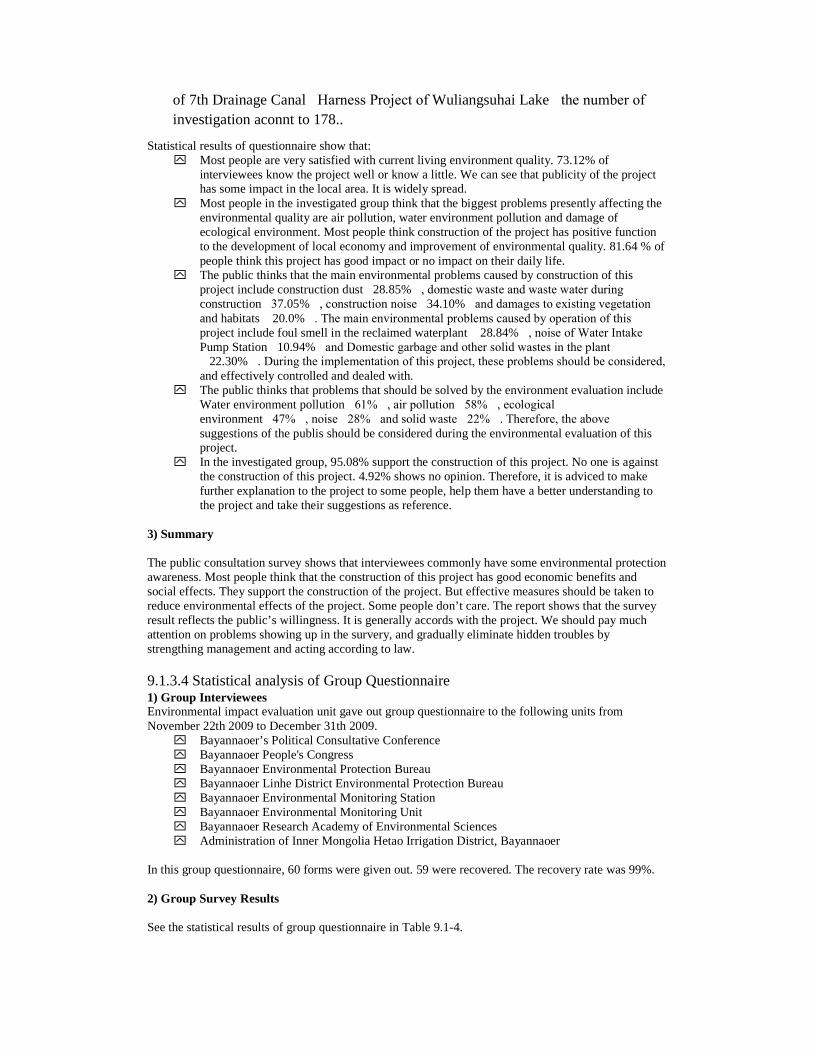
of 7th Drainage Canal�Harness Project of Wuliangsuhai Lake�the number of investigation aconnt to 178..
Statistical results of questionnaire show that: y� Most people are very satisfied with current living environment quality. 73.12% of
interviewees know the project well or know a little. We can see that publicity of the project has some impact in the local area. It is widely spread.
y� Most people in the investigated group think that the biggest problems presently affecting the environmental quality are air pollution, water environment pollution and damage of ecological environment. Most people think construction of the project has positive function to the development of local economy and improvement of environmental quality. 81.64 % of people think this project has good impact or no impact on their daily life.
y� The public thinks that the main environmental problems caused by construction of this project include construction dust�28.85%�, domestic waste and waste water during construction�37.05%�, construction noise�34.10%�and damages to existing vegetation and habitats �20.0%�. The main environmental problems caused by operation of this project include foul smell in the reclaimed waterplant �28.84%�, noise of Water Intake Pump Station�10.94%�and Domestic garbage and other solid wastes in the plant �22.30%�. During the implementation of this project, these problems should be considered, and effectively controlled and dealed with.
y� The public thinks that problems that should be solved by the environment evaluation include Water environment pollution�61%�, air pollution�58%�, ecological environment�47%�, noise�28%�and solid waste�22%�. Therefore, the above suggestions of the publis should be considered during the environmental evaluation of this project.
y� In the investigated group, 95.08% support the construction of this project. No one is against the construction of this project. 4.92% shows no opinion. Therefore, it is adviced to make further explanation to the project to some people, help them have a better understanding to the project and take their suggestions as reference.
3) Summary The public consultation survey shows that interviewees commonly have some environmental protection awareness. Most people think that the construction of this project has good economic benefits and social effects. They support the construction of the project. But effective measures should be taken to reduce environmental effects of the project. Some people don’t care. The report shows that the survey result reflects the public’s willingness. It is generally accords with the project. We should pay much attention on problems showing up in the survery, and gradually eliminate hidden troubles by strengthing management and acting according to law.
9.1.3.4 Statistical analysis of Group Questionnaire 1) Group Interviewees Environmental impact evaluation unit gave out group questionnaire to the following units from November 22th 2009 to December 31th 2009.
y� Bayannaoer’s Political Consultative Conference y� Bayannaoer People's Congress y� Bayannaoer Environmental Protection Bureau y� Bayannaoer Linhe District Environmental Protection Bureau y� Bayannaoer Environmental Monitoring Station y� Bayannaoer Environmental Monitoring Unit y� Bayannaoer Research Academy of Environmental Sciences y� Administration of Inner Mongolia Hetao Irrigation District, Bayannaoer
In this group questionnaire, 60 forms were given out. 59 were recovered. The recovery rate was 99%. 2) Group Survey Results See the statistical results of group questionnaire in Table 9.1-4.
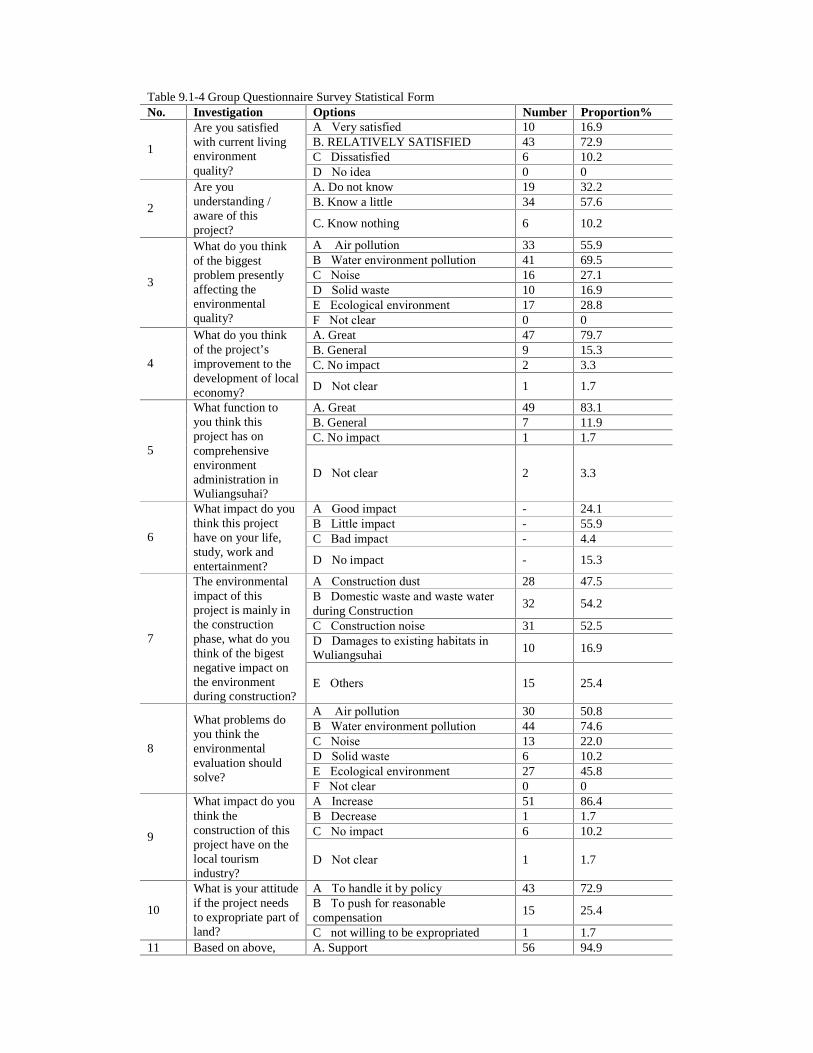
Table 9.1-4 Group Questionnaire Survey Statistical Form No. Investigation Options Number Proportion%
A�Very satisfied 10 16.9 B. RELATIVELY SATISFIED 43 72.9 C�Dissatisfied 6 10.2
1
Are you satisfied with current living environment quality? D�No idea 0 0
A. Do not know 19 32.2 B. Know a little 34 57.6 2
Are you understanding / aware of this project? C. Know nothing 6 10.2
A� Air pollution 33 55.9 B�Water environment pollution 41 69.5 C�Noise 16 27.1 D�Solid waste 10 16.9 E�Ecological environment 17 28.8
3
What do you think of the biggest problem presently affecting the environmental quality? F�Not clear 0 0
A. Great 47 79.7 B. General 9 15.3 C. No impact 2 3.3 4
What do you think of the project’s improvement to the development of local economy? D�Not clear 1 1.7
A. Great 49 83.1 B. General 7 11.9 C. No impact 1 1.7
5
What function to you think this project has on comprehensive environment administration in Wuliangsuhai?
D�Not clear 2 3.3
A�Good impact - 24.1 B�Little impact - 55.9 C�Bad impact - 4.4 6
What impact do you think this project have on your life, study, work and entertainment? D�No impact - 15.3
A�Construction dust 28 47.5 B�Domestic waste and waste water during Construction
32 54.2
C�Construction noise 31 52.5 D�Damages to existing habitats in Wuliangsuhai
10 16.9 7
The environmental impact of this project is mainly in the construction phase, what do you think of the bigest negative impact on the environment during construction?
E�Others 15 25.4
A� Air pollution 30 50.8 B�Water environment pollution 44 74.6 C�Noise 13 22.0 D�Solid waste 6 10.2 E�Ecological environment 27 45.8
8
What problems do you think the environmental evaluation should solve?
F�Not clear 0 0 A�Increase 51 86.4 B�Decrease 1 1.7 C�No impact 6 10.2 9
What impact do you think the construction of this project have on the local tourism industry?
D�Not clear 1 1.7
A�To handle it by policy 43 72.9 B�To push for reasonable compensation
15 25.4 10
What is your attitude if the project needs to expropriate part of land? C�not willing to be expropriated 1 1.7
11 Based on above, A. Support 56 94.9
B. Do not support 0 0 what is your overall attitude to this project? C. No opinion 3 5.1
12
Do you have any suggestions and requirements if the construction of this project needs you to move and expropriate your land?
1. Save lands and protect the existing farmland area; 2. Give the residents maximum economic remedies. Solve social security, medical security and other problems. Try not to influence residents’ normal life; 3. Provide more remedies. Make expropriation known to the public and make move easy.
13
Do you have any suggestions and requirements on environment protection of this project?
1. As a comprehensive project, this project is good for water environment protection. During the implementation of project, environment protection measures and disturb impact shall be paid attention to in the process of construction. 2. Protect plants around during the construction process. 3. During the construction process environmental problems shall be paid attention to. Decrease damages to ecological environment to minimum. 4 Make government finance know to the public. Invite bids according to regulations. Reasonable staff distribution. 5. Protect gardens and water. Solve waste water emission reasonably.
Statistical results of group questionnaire show that:
y� This project has big impact in the investigated area. 90% of people in the investigated units know the project well or know a little.
y� 95% of interviewees are vert satisfied or relatively satisfied with current living environment quality. Interviewees think that the biggest problem presently affecting the environmental quality are water environment pollution �70%�, air pollution�56%�, ecological environment�29%�, noise�27%�and solid waste�17%�. Most people think that the construction of the project has positive function to the development of local economy and improvement of local environmental quality, and they also think that this project has good impact or no impact on their daily life.
y� The public thinks that the main environmental problems caused by construction of this project include domestic waste and waste water during construction�54%�, construction noise�53%�, construction dust�48%�and damages to birds’ habitats in Wuliangsuhai�17%�. Therefore, during the implementation of this project, these problems should be considered, and effectively controlled and dealed with.
y� The interviewees think that problems that should be solved by the environment evaluation include water environment pollution�75%�, air pollution�51%�, noise(22%�, solid waste�10%� and ecological environment �7%�. When asked for opinions on expropriating their land, 73% of people accept to be expropriated according to related policies. 25% agree to push for reasonable compensation. 2% is not willing to be expropriated. Therefore, the above suggestions of the public should be considered during the environmental evaluation of this project.
y� In the investigated group, 95% interviewees support the construction of this project. No one is against the construction of this project. 5% show no opinion.
At the same time, the investigated groups provide the following opinions and suggestions:
y� When the construction of project needs to expropriate the residents’ land, the expropriation shall be made known to the public. Give the residents maximum economic remedies. Solve social security, medical security and other problems. Try not to influence residents’ normal life. Try not to influence residents’ normal life. Save the land and protect the existing farm area.
y� This project is a comprehensive project. It is good for the protection of water environment. During the implementation of project, environmental protection measures shall be paid attention to. Control disturbing impact during construction process.
y� Environmental problems shall be paid attention to during construction. Protect plants around and decrease damages to ecological environment to minimum.
y� Protect gardens and water. Solve waste water emission reasonably.
3) Summary Generally, the investigated groups have strong environmental protection awareness. They know possible causes of environmental pollution well. Therefore, local environmental department and construction unit should pay attention the above problems. During different stages of construction, related environmental protection laws and regulations shall be strictly followed. Increase impact on local environmental quality to the minimum. 9.1.4 The Second Public consultation For the investigation result of the first turn of public consultation, to fully understand and ask the public for advices to the project, after the first draft of EIA Report was completed, the EIA unit held Implementing Bayannaoer Water Environment Comprehensive Administration Project with World Bank Loan Environmental Impact Public Forum in conference room of Inner Mongolia Bayannaoer Hetao Water Group Co. Ltd. on February 1st 2010.19 people participated in the conference, including resident representatives of subprojects, representative of Bayannaoer Hetao Area Administration Bureau and experts of Bayannaoer Environmental Protection Bureau. See name list of participants in Table 9.1-5.
Table 9.1-5 Name list of forum participants
No. Name Title Working place/Living place 1 Yang Zhen Environmental
protection expert Bayannaoer Environmental Protection Bureau
2 Liu Jing Environmental protection expert
Bayannaoer Environmental Protection Bureau
3 Xue Zhiguo Officer of Water Bureau
Water Law Department, Bayannaoer Water Bureau
4 Liu Xinli Officer of Water Bureau
Water Law Department, Bayannaoer Water Bureau
5 Bai Bo Officer of Water Bureau
Water Law Department, Bayannaoer Water Bureau
6 Zhao Ping Enterprise representative
Director of Wulatehouqi Zijin Corperation
7 Liu Bingjun Enterprise representative
Person in Charge of Wuyuan Hetao Wine Corporation
8 Gao Guangyin Resident representative
Village Director, Dengcundian, West Xiaozhao Town, Wulateqianqi
9 Zhang Eryong Resident Representative, Hongqipu Village, Xinan Town, Wulateqianqi
10 Su Yue Resident Representative, Yangshuhao Village, Xinan Town, Wulateqianqi
11 Wang Saikou Resident Representative, Xinfeng Village, Dulun Town, Wulateqianqi
12 He Ru Resident Representative, Hongqipu Village, Shulinzi Town, Wulateqianqi
13 Guan Li Resident Representative, Sheep Sea Farm, Wulatezhongqi
14 Zhang Jun Resident Representative, Guangtieqidan Village, Denglingshan Town, Wulatezhongqi
15 Yang San Resident Representative, Wuzhen Village, Denglingshan Town, Wulatezhongqi
16 Kang Long Resident Representative, Menglian Village, Green Mountain Town, Wulatehouqi
17 Hao Limin Resident Representative, Old City Village, Longxingchang Town, Wuyuan County
18 Li Sanhong Resident Representative, Xinhong Village, Shahai Town, Hangjinhouqi
19 Li Ping Resident Representative, Sizu Village, Dashun
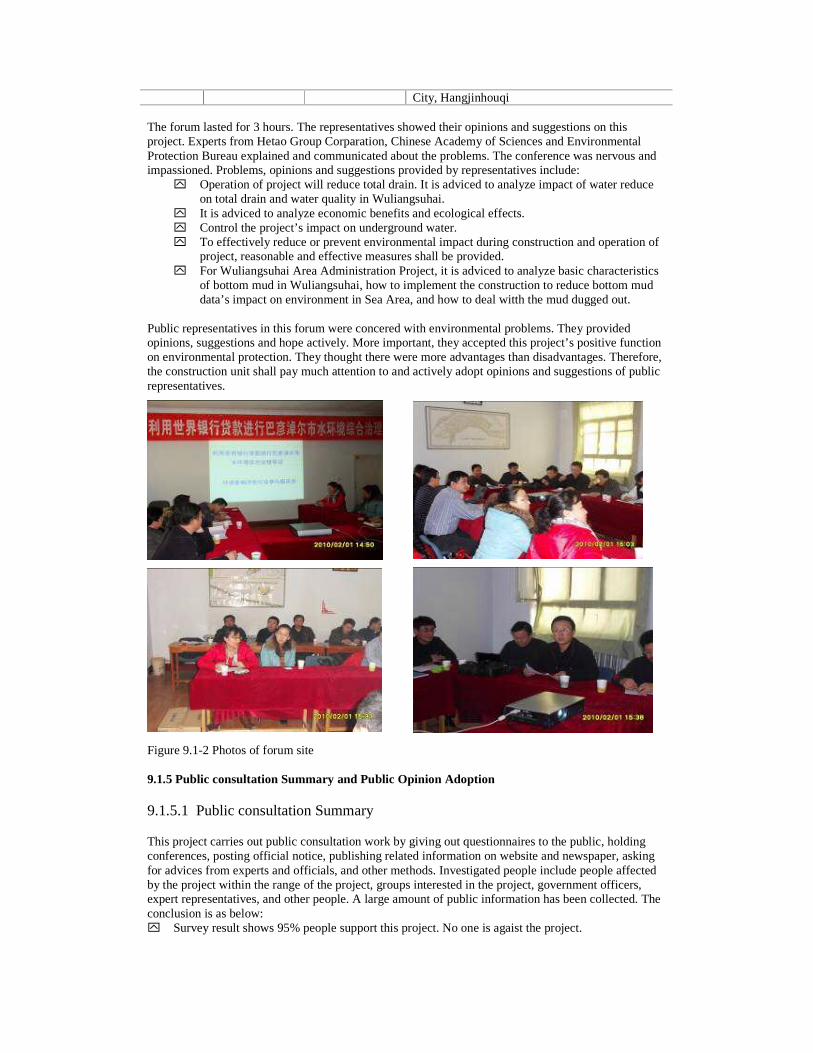
City, Hangjinhouqi The forum lasted for 3 hours. The representatives showed their opinions and suggestions on this project. Experts from Hetao Group Corparation, Chinese Academy of Sciences and Environmental Protection Bureau explained and communicated about the problems. The conference was nervous and impassioned. Problems, opinions and suggestions provided by representatives include:
y� Operation of project will reduce total drain. It is adviced to analyze impact of water reduce on total drain and water quality in Wuliangsuhai.
y� It is adviced to analyze economic benefits and ecological effects. y� Control the project’s impact on underground water. y� To effectively reduce or prevent environmental impact during construction and operation of
project, reasonable and effective measures shall be provided. y� For Wuliangsuhai Area Administration Project, it is adviced to analyze basic characteristics
of bottom mud in Wuliangsuhai, how to implement the construction to reduce bottom mud data’s impact on environment in Sea Area, and how to deal witth the mud dugged out.
Public representatives in this forum were concered with environmental problems. They provided opinions, suggestions and hope actively. More important, they accepted this project’s positive function on environmental protection. They thought there were more advantages than disadvantages. Therefore, the construction unit shall pay much attention to and actively adopt opinions and suggestions of public representatives.
Figure 9.1-2 Photos of forum site 9.1.5 Public consultation Summary and Public Opinion Adoption
9.1.5.1 Public consultation Summary This project carries out public consultation work by giving out questionnaires to the public, holding conferences, posting official notice, publishing related information on website and newspaper, asking for advices from experts and officials, and other methods. Investigated people include people affected by the project within the range of the project, groups interested in the project, government officers, expert representatives, and other people. A large amount of public information has been collected. The conclusion is as below: y� Survey result shows 95% people support this project. No one is agaist the project.
y� Interviewees consider waste water, noicse, dust, rubbish, construction land, damages to plants, damages to habitats in Wuliangsuhai and other problems.
y� Construction unit should strengthen environmental protection administration, ensure normal operation of environmental protection facilities and control emission of pollution.
y� Administration and supervision shall be strengthed. Prevent emergency accident and made contingency plan.
y� Most people think that the biggest problem presently affecting the environmental quality is water environment pollution. But they think the construction of this project has positive impact on the area. To some degree, it can improve the quality of water environment, ecological environment and the development of local economy.
y� Local people think that environmental education can strengthen environmental awareness. According to the report, investigation of public consultation reflects willingness of the public well. Problems showing up in the investigation should be paid attention to. In different stages of the construction, related regulations and rules of environment protection should be strictly complied with. Impact to local environmental quality should be reduced to the minimum.
9.1.5.2 Public Opinion Adoption During the EIA, EIA unit analyzed problems concerned by the public and brought forth corresponding mitigating measures to reduce environmental impact of construction to acceptable degree. See detailed in Table 9.1-6. Through the different forms of public consultation, construction unit shall provide the following adoption suggestions for opinions and suggestions feedback by the public. (1) Environmental administration must be strengthened. Normal operation of environmental
protection facilities shall be ensured. Control emission of pollution, prevent emergency accident and made contingency plan. At the same time accept supervision from people around.
(2) Strengthen environmental protection measures during construction. Prevent dusts, keep roads clean, prevent water loss and soil erosion, reduce noise and bottom mud’s impact on ecological environment in Wuliangsuhai, strengthen environmental protection supervision during construction and accept supervision from people around.
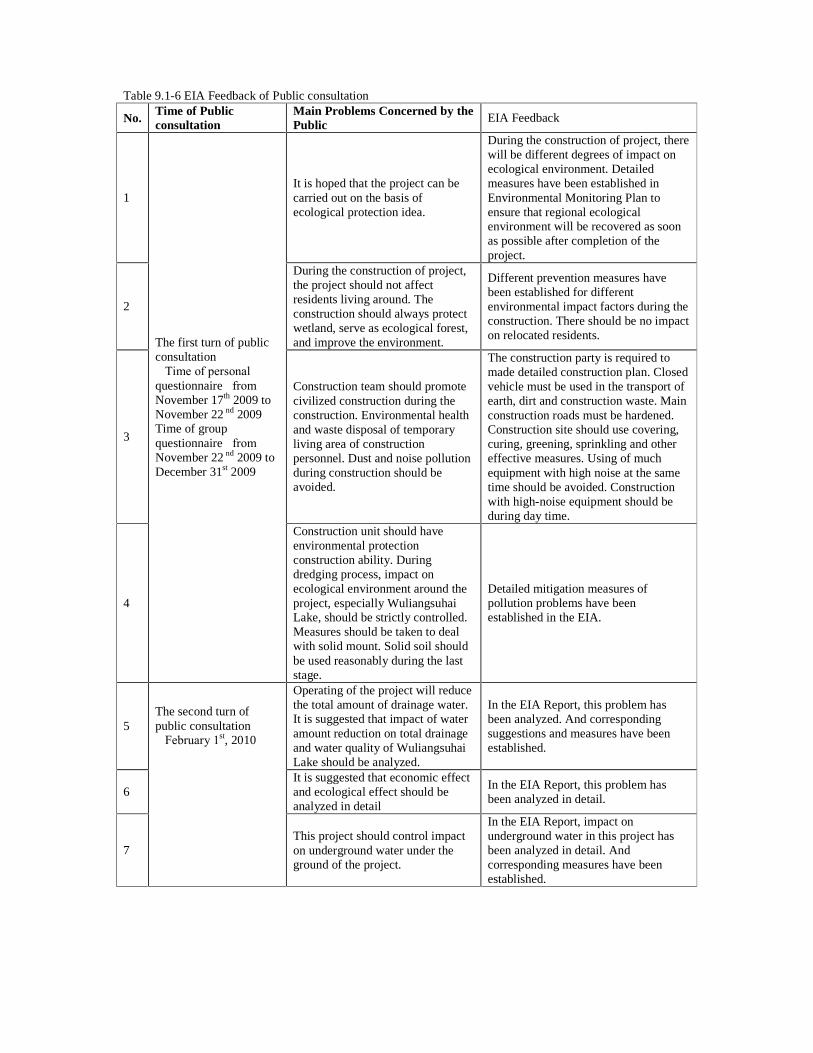
Table 9.1-6 EIA Feedback of Public consultation
No. Time of Public consultation
Main Problems Concerned by the Public
EIA Feedback
1 It is hoped that the project can be carried out on the basis of ecological protection idea.
During the construction of project, there will be different degrees of impact on ecological environment. Detailed measures have been established in Environmental Monitoring Plan to ensure that regional ecological environment will be recovered as soon as possible after completion of the project.
2
During the construction of project, the project should not affect residents living around. The construction should always protect wetland, serve as ecological forest, and improve the environment.
Different prevention measures have been established for different environmental impact factors during the construction. There should be no impact on relocated residents.
3
Construction team should promote civilized construction during the construction. Environmental health and waste disposal of temporary living area of construction personnel. Dust and noise pollution during construction should be avoided.
The construction party is required to made detailed construction plan. Closed vehicle must be used in the transport of earth, dirt and construction waste. Main construction roads must be hardened. Construction site should use covering, curing, greening, sprinkling and other effective measures. Using of much equipment with high noise at the same time should be avoided. Construction with high-noise equipment should be during day time.
4
The first turn of public consultation �Time of personal questionnaire�from November 17th 2009 to November 22 nd 2009� Time of group questionnaire�from November 22 nd 2009 to December 31st 2009�
Construction unit should have environmental protection construction ability. During dredging process, impact on ecological environment around the project, especially Wuliangsuhai Lake, should be strictly controlled. Measures should be taken to deal with solid mount. Solid soil should be used reasonably during the last stage.
Detailed mitigation measures of pollution problems have been established in the EIA.
5
Operating of the project will reduce the total amount of drainage water. It is suggested that impact of water amount reduction on total drainage and water quality of Wuliangsuhai Lake should be analyzed.
In the EIA Report, this problem has been analyzed. And corresponding suggestions and measures have been established.
6 It is suggested that economic effect and ecological effect should be analyzed in detail
In the EIA Report, this problem has been analyzed in detail.
7
The second turn of public consultation �February 1st, 2010�
This project should control impact on underground water under the ground of the project.
In the EIA Report, impact on underground water in this project has been analyzed in detail. And corresponding measures have been established.

8
To effectively reduce or avoid environmental impact during the construction and operating of the project, effective control measures should be brought forth.
In the EIA Report, environmental impact during the construction and operating of the project has been analyzed in detail. And corresponding migration measures have been established.
9.2 Disclosure of information According to related regulations of Regulation for Public consultation in the Environmental Impact Assessment�State Environmental Protection Administration 2006 No.[28]�, environment impact evaluation information is published to the public for 2 times in the preparation stage of evaluation report. y� The first information publishment: During the beginning stage of the environment impact evaluation,
engineering content of the project is informed to the public, to allow them to have an elementary understanding.
y� The second information publishment: After the completion of conclution of evaluation report, the conclution shall be included in the evaluation report. The public is allowed to have a clear understanding of environment impact of the construction project through Internet, newspaper, questionnaire and other methods.
9.2.1 Time and Details of the First Media Annoucement The first media announcement of this project was made on Inner Mongolia Channel of xinghuanet.com (URL: http://www.nmg.xinhuanet.com/nmgwq/2009-11/26/content_18341728.htm�on November 26th 2009 and Bayannaoer Daily on November 26th 2009. The announcement mainly includes the followings: (1) Name and summary of the construction project; (2) Possible impacts to the environment; (3) Protection policies of environment impacts; (4) Working procedures and main content of environment impact evaluation; (5) Name and contact information of construction unit and environment evaluation unit; and (6) Range and main items when asking for the public’s advices. Website screenshot of the first media announcement is shown in Figure 9.3-1. See the announcement published on Bayannaoer Daily in attachment.
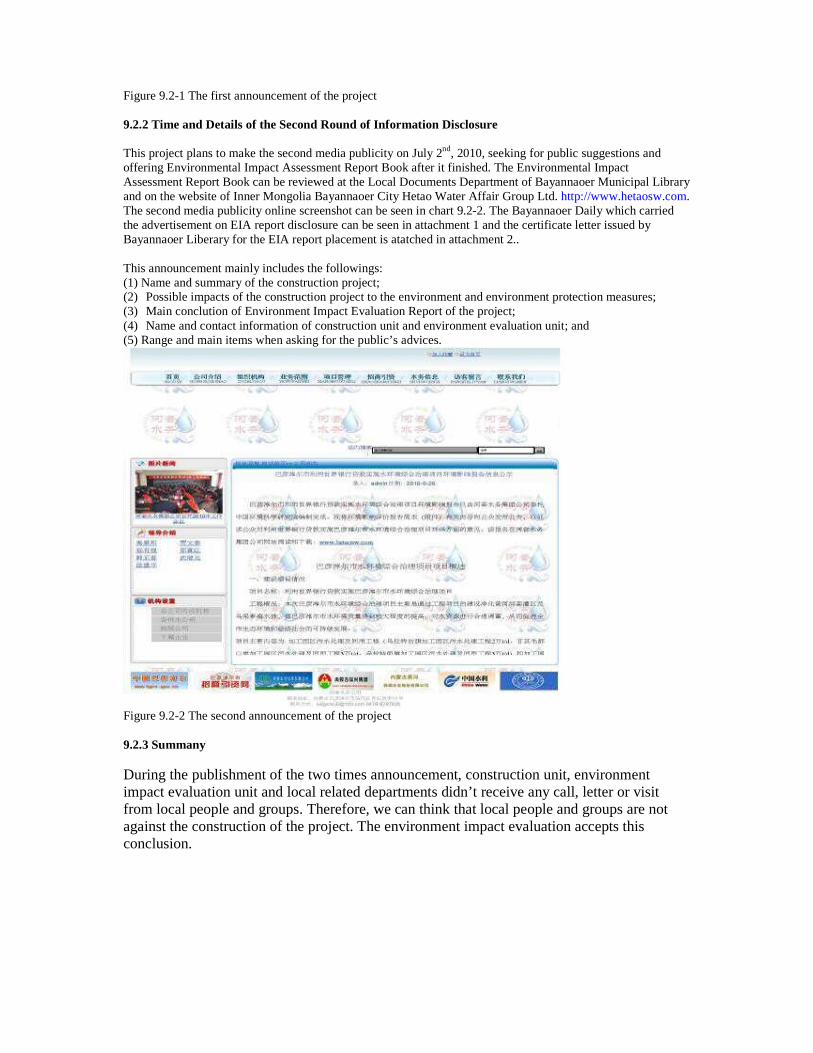
Figure 9.2-1 The first announcement of the project 9.2.2 Time and Details of the Second Round of Information Disclosure This project plans to make the second media publicity on July 2nd, 2010, seeking for public suggestions and offering Environmental Impact Assessment Report Book after it finished. The Environmental Impact Assessment Report Book can be reviewed at the Local Documents Department of Bayannaoer Municipal Library and on the website of Inner Mongolia Bayannaoer City Hetao Water Affair Group Ltd. http://www.hetaosw.com. The second media publicity online screenshot can be seen in chart 9.2-2. The Bayannaoer Daily which carried the advertisement on EIA report disclosure can be seen in attachment 1 and the certificate letter issued by Bayannaoer Liberary for the EIA report placement is atatched in attachment 2.. This announcement mainly includes the followings: (1) Name and summary of the construction project; (2) Possible impacts of the construction project to the environment and environment protection measures; (3) Main conclution of Environment Impact Evaluation Report of the project; (4) Name and contact information of construction unit and environment evaluation unit; and (5) Range and main items when asking for the public’s advices.
Figure 9.2-2 The second announcement of the project 9.2.3 Summany During the publishment of the two times announcement, construction unit, environment impact evaluation unit and local related departments didn’t receive any call, letter or visit from local people and groups. Therefore, we can think that local people and groups are not against the construction of the project. The environment impact evaluation accepts this conclusion.

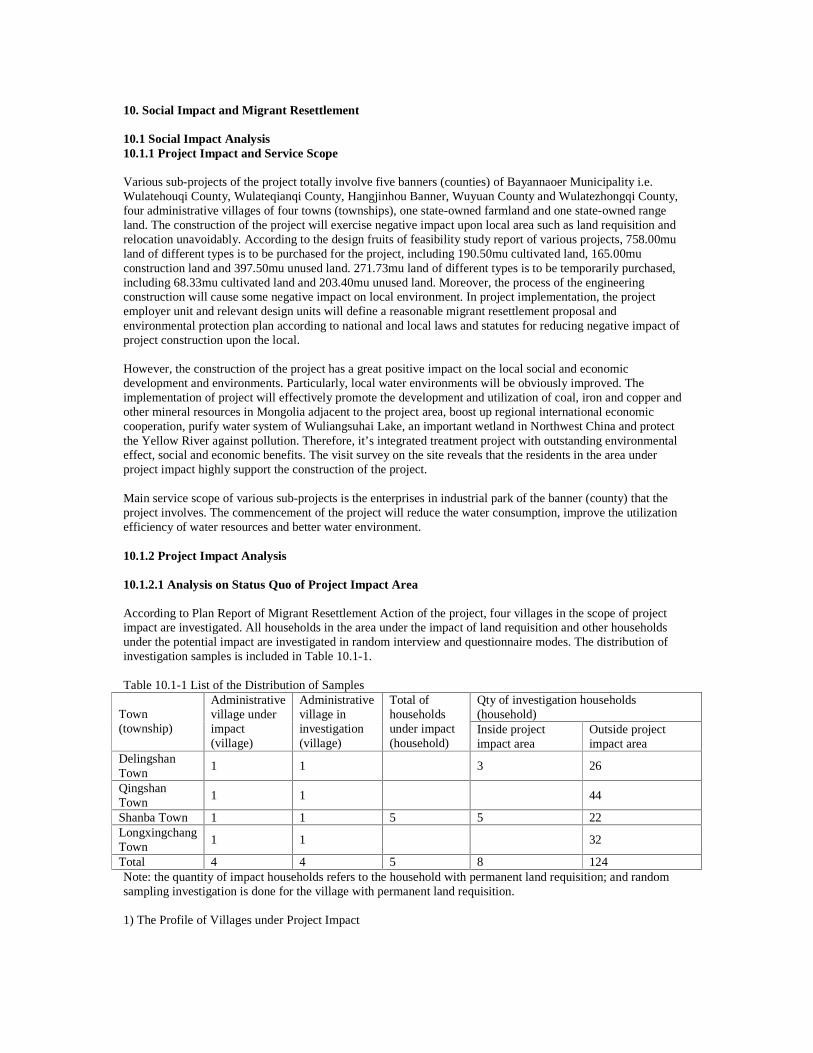
10. Social Impact and Migrant Resettlement 10.1 Social Impact Analysis 10.1.1 Project Impact and Service Scope Various sub-projects of the project totally involve five banners (counties) of Bayannaoer Municipality i.e. Wulatehouqi County, Wulateqianqi County, Hangjinhou Banner, Wuyuan County and Wulatezhongqi County, four administrative villages of four towns (townships), one state-owned farmland and one state-owned range land. The construction of the project will exercise negative impact upon local area such as land requisition and relocation unavoidably. According to the design fruits of feasibility study report of various projects, 758.00mu land of different types is to be purchased for the project, including 190.50mu cultivated land, 165.00mu construction land and 397.50mu unused land. 271.73mu land of different types is to be temporarily purchased, including 68.33mu cultivated land and 203.40mu unused land. Moreover, the process of the engineering construction will cause some negative impact on local environment. In project implementation, the project employer unit and relevant design units will define a reasonable migrant resettlement proposal and environmental protection plan according to national and local laws and statutes for reducing negative impact of project construction upon the local. However, the construction of the project has a great positive impact on the local social and economic development and environments. Particularly, local water environments will be obviously improved. The implementation of project will effectively promote the development and utilization of coal, iron and copper and other mineral resources in Mongolia adjacent to the project area, boost up regional international economic cooperation, purify water system of Wuliangsuhai Lake, an important wetland in Northwest China and protect the Yellow River against pollution. Therefore, it’s integrated treatment project with outstanding environmental effect, social and economic benefits. The visit survey on the site reveals that the residents in the area under project impact highly support the construction of the project. Main service scope of various sub-projects is the enterprises in industrial park of the banner (county) that the project involves. The commencement of the project will reduce the water consumption, improve the utilization efficiency of water resources and better water environment. 10.1.2 Project Impact Analysis 10.1.2.1 Analysis on Status Quo of Project Impact Area According to Plan Report of Migrant Resettlement Action of the project, four villages in the scope of project impact are investigated. All households in the area under the impact of land requisition and other households under the potential impact are investigated in random interview and questionnaire modes. The distribution of investigation samples is included in Table 10.1-1. Table 10.1-1 List of the Distribution of Samples
Qty of investigation households (household) Town
(township)
Administrative village under impact (village)
Administrative village in investigation (village)
Total of households under impact (household)
Inside project impact area
Outside project impact area
Delingshan Town
1 1 3 26
Qingshan Town
1 1 44
Shanba Town 1 1 5 5 22 Longxingchang Town
1 1 32
Total 4 4 5 8 124 Note: the quantity of impact households refers to the household with permanent land requisition; and random sampling investigation is done for the village with permanent land requisition. 1) The Profile of Villages under Project Impact
The impact of the project involves Wuzhen Village of Delingshan Town (for temporary land use in the construction only), Hongqi Village of Qingshan Town, Shawan Village of Shanba Town & Jiucheng Village of Longxingchang Town. The field visit survey reveals that four villages under the impact of the project all mainly rely upon traditional agriculture, of which Hongqi Village and Shawan Village features good animal husbandry. y� Wuzhen Village of Delingshan Town
Wuzhen Village, about 13km in the west of Delingshan Town, bordering the 5th Wengeng Team, and Hongqi Village and Muyang Lake Rangeland of Delingshan Town, Dasheng Village of Delingshan Town and Shengli Village of Delingshan Town on the north, west, east and south respectively features convenient traffic conditions. The village with totally 14 communities, and over 1900 households in total, population of 8137 and cultivated area of 10900mu mainly plants wheat, corn and sunflower; and the animal husbandry mainly includes pig and sheep breeding. In 2008, the whole village has realized total agricultural incomes of RMB28.5 million and total animal husbandry incomes of RMB1.14 million.
y� Hongqi Village of Qingshan Town
Hongqi Village Committee located in about 12km east of Qingshan Town, is the final village on the east of Qingshan Town, and borders Wulagacha of Bayinbaoli Town on north and is adjacent to Xinguang Village of Hangjinhou Banner on the south. The village has totally two villager groups, population of 801 including 221 households at the end of 2008, cultivated area of 5517mu and per-capita cultivated land of 6.89mu/person. There’re totally 651 persons as labor force, 81.27% of the total population.
y� Jiucheng Village of Longxingchang Town
Jiucheng Village, about 11km in the northwest of Longxingchang Town features convenient traffic conditions, and borders the 1st and 2nd groups of Wuxing Village, Lianfeng Village, Zhongqi Road of Wuyuan County and Yihe Trunk Canal on the north, west, east and south respectively. The village has four groups, 412 households and population of 1309 and 658 persons as labor force in total. With cultivated area of 5000mu, it mainly plants sunflower, corn and tomato; and animal husbandry is mainly cattle and sheep. In 2008, the village has realized total agricultural incomes of RMB4.80 million, animal husbandry incomes of RMB120,000. Net per-capita incomes of farmers are RMB4800.0.
y� Shawan Village of Shanba Town
Shawan Village, about 3km in the northwest of Shanba Town features convenient traffic conditions, and borders Zhongguang Village, Yongsheng Village, Chenguang Village and Jiatong Village on the north, west, east and south respectively. The village has four communities, over 295 households, population of 1200 and 540 persons as labor force in total. With cultivated area of 4000mu, it mainly plants sunflower and corn; and animal husbandry is mainly cattle and sheep. In 2008, the village has realized total agricultural incomes of RMB7.6 million and animal husbandry incomes of RMB820,000. Net per-capita incomes of farmers are RMB7016.
2) Analysis on Basic Information of Households under Project Impact (1) Population Profile Profile of Household Population The migrants involved in the project are five households and 22 persons in total, in which there are 10 females, accounting for 45.5% of the total, 12 males, accounting for 54.5%, and one is Mongolian nationality and the rest all are Han nationality. Age Distribution of Household Population Among 22 persons, there’re two under 18, accounting for 9.1% of the total; 18 from 18-60, accounting for 81.8%; two over 61, accounting for 9.1%. Household Scale In respect of the scale of households under impact, the minimum is 4 persons while the maximum is 5 persons. Each household has 4.4 persons on average. Distribution of the Educational Background Among the population under land requisition impact, there’re 5 illiterates, accounting for 22.7%; one preschool person, 4.5%; 5 with elementary school education, 22.7%; 9 with junior high school education, 40.9%; and 2 with senior high school education, 9.1%. (2) Possession of Land Resources The survey statistics reveal that five sample households with 22 persons have total contracting farmland of 90mu, 4.09mu per capita and mainly plant wheat, corn and sunflower.
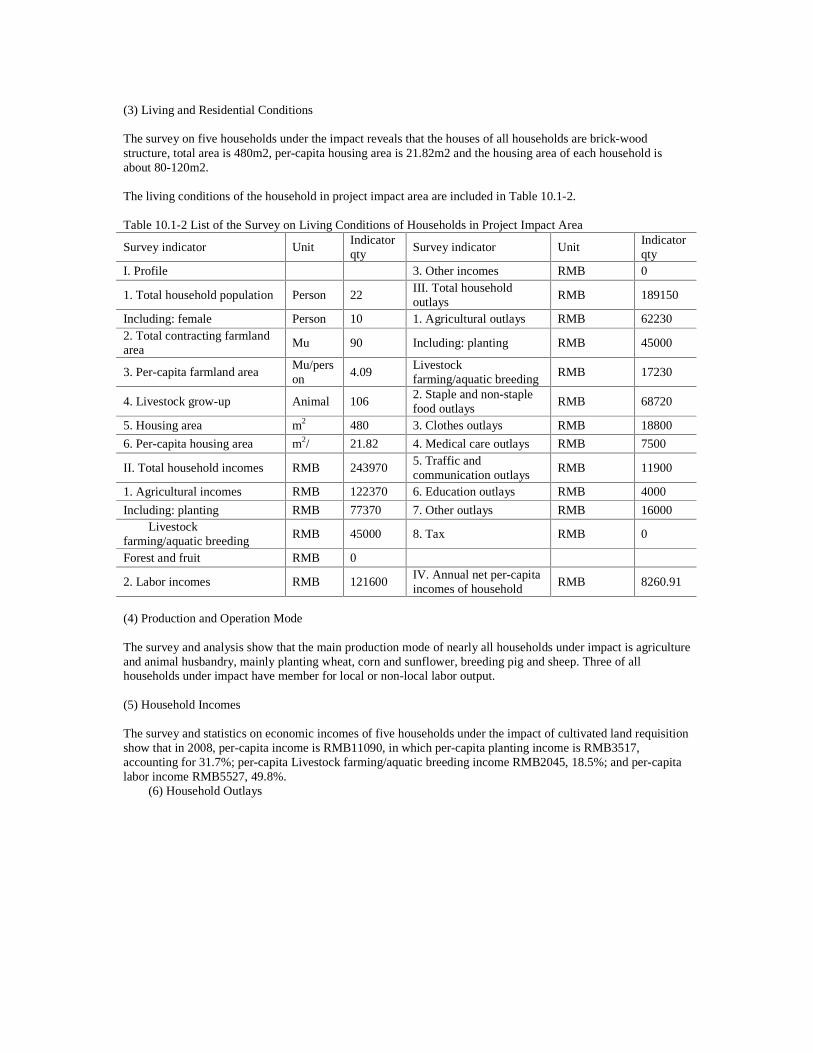
(3) Living and Residential Conditions The survey on five households under the impact reveals that the houses of all households are brick-wood structure, total area is 480m2, per-capita housing area is 21.82m2 and the housing area of each household is about 80-120m2. The living conditions of the household in project impact area are included in Table 10.1-2. Table 10.1-2 List of the Survey on Living Conditions of Households in Project Impact Area
Survey indicator Unit Indicator qty
Survey indicator Unit Indicator qty
I. Profile 3. Other incomes RMB 0
1. Total household population Person 22 III. Total household outlays
RMB 189150
Including: female Person 10 1. Agricultural outlays RMB 62230 2. Total contracting farmland area
Mu 90 Including: planting RMB 45000
3. Per-capita farmland area Mu/person
4.09 Livestock farming/aquatic breeding
RMB 17230
4. Livestock grow-up Animal 106 2. Staple and non-staple food outlays
RMB 68720
5. Housing area m2 480 3. Clothes outlays RMB 18800
6. Per-capita housing area m2/� 21.82 4. Medical care outlays RMB 7500
II. Total household incomes RMB 243970 5. Traffic and communication outlays
RMB 11900
1. Agricultural incomes RMB 122370 6. Education outlays RMB 4000
Including: planting RMB 77370 7. Other outlays RMB 16000 Livestock
farming/aquatic breeding RMB 45000 8. Tax RMB 0
Forest and fruit RMB 0
2. Labor incomes RMB 121600 IV. Annual net per-capita incomes of household
RMB 8260.91
(4) Production and Operation Mode The survey and analysis show that the main production mode of nearly all households under impact is agriculture and animal husbandry, mainly planting wheat, corn and sunflower, breeding pig and sheep. Three of all households under impact have member for local or non-local labor output. (5) Household Incomes The survey and statistics on economic incomes of five households under the impact of cultivated land requisition show that in 2008, per-capita income is RMB11090, in which per-capita planting income is RMB3517, accounting for 31.7%; per-capita Livestock farming/aquatic breeding income RMB2045, 18.5%; and per-capita labor income RMB5527, 49.8%.
(6) Household Outlays
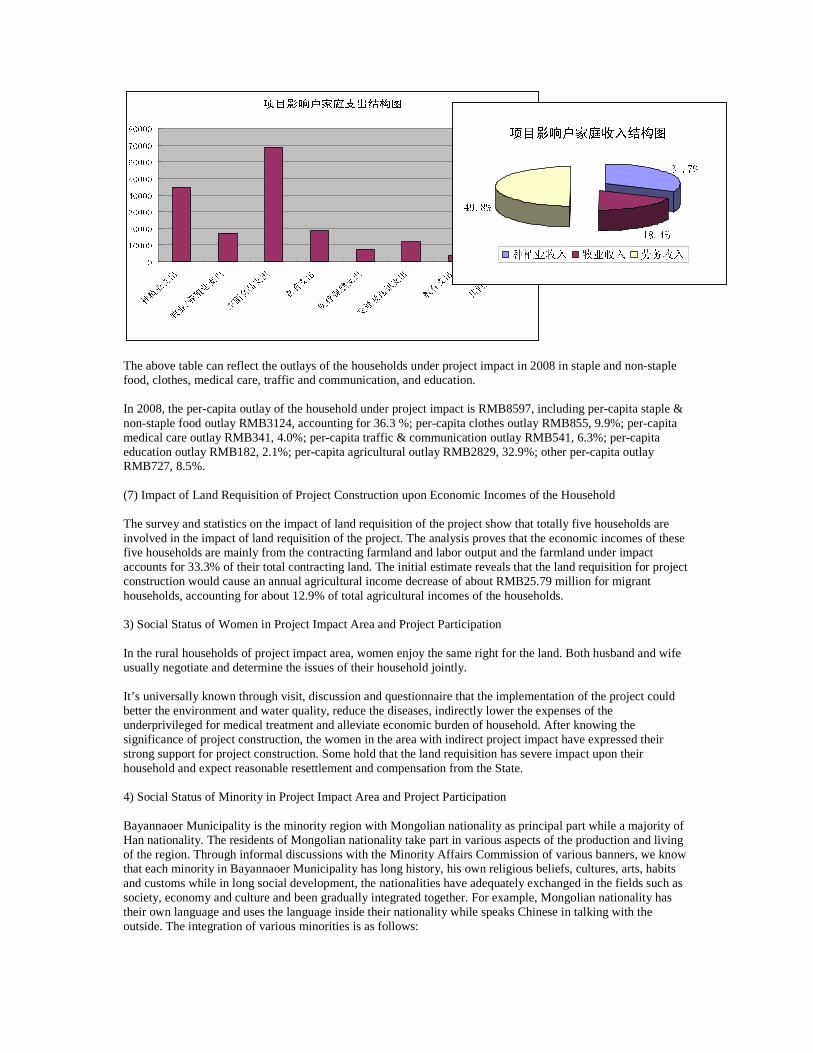
�
�����
�����
�����
�����
�����
�����
�����
�����
�
The above table can reflect the outlays of the households under project impact in 2008 in staple and non-staple food, clothes, medical care, traffic and communication, and education. In 2008, the per-capita outlay of the household under project impact is RMB8597, including per-capita staple & non-staple food outlay RMB3124, accounting for 36.3 %; per-capita clothes outlay RMB855, 9.9%; per-capita medical care outlay RMB341, 4.0%; per-capita traffic & communication outlay RMB541, 6.3%; per-capita education outlay RMB182, 2.1%; per-capita agricultural outlay RMB2829, 32.9%; other per-capita outlay RMB727, 8.5%. (7) Impact of Land Requisition of Project Construction upon Economic Incomes of the Household The survey and statistics on the impact of land requisition of the project show that totally five households are involved in the impact of land requisition of the project. The analysis proves that the economic incomes of these five households are mainly from the contracting farmland and labor output and the farmland under impact accounts for 33.3% of their total contracting land. The initial estimate reveals that the land requisition for project construction would cause an annual agricultural income decrease of about RMB25.79 million for migrant households, accounting for about 12.9% of total agricultural incomes of the households. 3) Social Status of Women in Project Impact Area and Project Participation In the rural households of project impact area, women enjoy the same right for the land. Both husband and wife usually negotiate and determine the issues of their household jointly. It’s universally known through visit, discussion and questionnaire that the implementation of the project could better the environment and water quality, reduce the diseases, indirectly lower the expenses of the underprivileged for medical treatment and alleviate economic burden of household. After knowing the significance of project construction, the women in the area with indirect project impact have expressed their strong support for project construction. Some hold that the land requisition has severe impact upon their household and expect reasonable resettlement and compensation from the State. 4) Social Status of Minority in Project Impact Area and Project Participation Bayannaoer Municipality is the minority region with Mongolian nationality as principal part while a majority of Han nationality. The residents of Mongolian nationality take part in various aspects of the production and living of the region. Through informal discussions with the Minority Affairs Commission of various banners, we know that each minority in Bayannaoer Municipality has long history, his own religious beliefs, cultures, arts, habits and customs while in long social development, the nationalities have adequately exchanged in the fields such as society, economy and culture and been gradually integrated together. For example, Mongolian nationality has their own language and uses the language inside their nationality while speaks Chinese in talking with the outside. The integration of various minorities is as follows:
�����
�����
�����
Firstly, Chinese is common and official language of various minorities. The minorities i.e. Mongolian nationality, Hui nationality and Manchu nationality in the region use Chinese as written language. On the occasion of major festivals, the people of different nationalities will celebrate e.g. Spring Festival of Han nationality and “Nadamu” Festival of Mongolian nationality. Secondly, the minorities not only enjoy the same right in society, economy and culture as Han nationality but also the preferential policies in education, employment and financial support. Bayannaoer Municipality offers a policy-based preference for poverty-stricken minority villages and minority enterprises. Thirdly, the people of different nationalities keep in close touch, and give no highlight to nationality status. The marriage between different nationalities widely exists. Therefore, the minorities in the project area presently are integrated with Han and other nationalities by and large. Among all households under land requisition impact, one person is the resident of Mongolian nationality. The survey shows the Mongolian resident actively supports the project construction, and expects more development opportunities from the project construction. 10.1.2.2 Analysis on Impact of Project Construction on Local Residents The project construction will have varying impacts on various aspects of local residents including production, living and social economy. Such impacts are divided into positive impact and negative impact. Positive impacts mainly include: y� The construction and operation of the project will improve the level of infrastructure in the project area,
boost up the wastewater disposal capability and industrial water supply capacity of different banners and counties and provide reliable water resources guarantee for the development of regional economy.
y� The implementation of the project can improve the wastewater disposal capability of the enterprises in industrial park, effectively control the wastewater discharged into the drainage channel, and consequently better water quality of various drainage channels indirectly, change negative impact on residents around the drainage channel and finally boost up the health level of residents.
y� The implementation of the project can directly improve water quality of various drainage channels. Better water quality in drainage channels can alleviate the purifying pressure of Wuliangsuhai Lake and improve the ecological environment of Wuliangsuhai Lake, retard the swamping process, and gradually restore the biodiversity of wetlands, enable water quality of drainage system in Hetao irrigation zone to reach relevant national criteria, effectively change water quality of the Yellow River in Bayannaoer Municipality, and finally protect the water system of the Yellow River against pollution damage.
y� The implementation of the project can enable the industrial parks of five banners/counties to have reclaimed water supply and wastewater treatment and recycling works, so as to improve infrastructure level and industrial base service capability of various banners/counties, facilitate the work of attracting foreign investments and better overall investment environment of Bayannaoer Municipality.
y� In construction period of the project, surrounding residents can have the opportunities for providing labor or trade services, so as to increase their incomes. Moreover, the improvement of investment environments in project area can attract more enterprises to develop in Bayannaoer, which as a result, will provide more jobs for the residents in the project area.
Negative impacts mainly include:
y� The construction of the project must unavoidably take over some land for use permanently or occupy temporarily. A field survey and interview show that local villages attach great attention to the land requisition and relocation. Therefore, the work of relevant compensation and resettlement is decisive to the smooth implementation of the project.
y� The construction of the project may cause noises pollution, dust, traffic accident and other potential problems to the residents and enterprises around: for example, the pavement of pipelines may destroy existing infrastructure of the farmers, intercept or occupy some road, hinder the passage of residents in villages and trigger off noises, dust and public security problems during the construction. Moreover, temporary land occupation in the construction period may impact the cultivation of farmland. These issues require some proper construction arrangement by project employer and construction unit in order to minimize the impact upon residents.
10.1.3 Determination of project affected area
10.1.3.1 Measures to reduce resettlement tasks
1) During Project planning and design phase
Land expropriation, removal and resettlement required for the construction of works will inevitably affect the original production and living conditions of the local residents. During the planning and design phase of the Project, when conducting the scheme optimization and comparison, considerations shall be taken to the influence of the construction of the Project on the local society and economy, and such consideration shall be the key factors for optimization and comparison of schemes. For the purpose of reduction of land expropriation and resettlement as for as possible, some effective measures have been taken by the design institute and the Owner of this Project. As far as scheme selection and other supporting facilities concerned, efforts shall be made to keep away from the residential area, to occupy less farm land and to satisfy the local planning and the opinions of local governments.
y� The routing and location of pipelines shall follow the existing roads and planned roads. Efforts shall be made to keep the pipelines away from the concentrated residential areas and to reduce the removal tasks.
y� Attention shall be paid to environmental protection, the land occupation layout, distribution of rivers, landform, geological conditions, prevailing wind direction and other factors of the industrial area shall be considered comprehensively and certain protection space between the industrial area and the residential area shall be set.
y� The construction design shall be optimized and construction period shall be shortened as far as possible. The construction phases shall be arranged reasonably to reduce the impact of construction of works. For example, in general, land expropriation shall be conducted after the crops are harvested.
2) During construction phase
y� Strengthen the public consultation mechanism
Prior to construction of the works, the commencing date and construction schedule shall be publicized by means of notice in the project affected area. The compensation policies relating to land expropriation and resettlement shall be publicized as well to facilitate the supervision by immigrants; During the construction stage, the local materials shall be prior choice. If technology is allowed, local transportation service and labor force shall have priority so as to have the personnel affected by the works benefited from the construction of works.
y� Select reasonable construction time and methods
The construction time shall be combined with the farming time of local farmers and shall be within the slack farming seasons so as to avoid the impact on local farming and production. If any pipe network shall cross any drain ditch, irrigation channel and other Irrigation and water conservancy facilities or houses of local residents, pipe jacking technique will be applied to avoid the reconstruction of water conservancy facilities and houses.
y� Strengthen construction management
The construction organization shall, during the construction, according to the soil treatment plans, carry away the soil and ensure no overloading happens during the transportation, no soil falls from the vehicle. The vehicle shall be cleaned of the mud on the wheel before running out of the construction site to prevent the falling of soil from the vehicle. During the construction, the excavation of channels, the trumpet of the vehicle, the sound of engine, the sound of concrete mixer and the sound of road roller will cause noise. For the purpose to soften impact of such noise on nearby residents, the construction in the area 200 away from the residential houses is prohibited during o’clock 11 in the evening and o’clock 6 in the next morning. Meanwhile, priority shall be given to low-noise construction equipment and methods. If construction at night is required and will affect the sound environment near the residential area, then noise reduction measures shall be taken on the construction machines, meanwhile, temporary equipment such as sound barrier may be established near the construction site or the concentrated residential area so as to guarantee the quality of sound environment in the residential area.
y� Civilized construction and environmental protection are encouraged.
Construction organization shall make efforts to reduce the impact of construction on nearby residents, plants, and school, etc. Civilized construction is encouraged. Liaison meeting between construction
organization, street administration authority, and owners shall be organized to conduction in timely manner consultation on the issues such the impact of construction on environment; The Owner of this Project and the construction organization shall contact the local environmental protection authority, and shall clear off the domestic wastes on the construction site. The construction organization shall strengthen the instruction for construction personnel about avoidance of littering so as to guarantee the quality of of the living and working environment of workers.
3) Land expropriation, removal and resettlement plans and implementation phase
y� The fundamental data shall be collected adequately for the analysis and study of local social and economic conditions. Feasible resettlement plans shall be formulated by combination with the local conditions to reduce the impact on the construction of works and to ensure that the living level of personnel affected by the Project will not be lowered by the construction of this Project.
y� Internal supervision and outsider independent supervision shall be strengthened, smooth and efficient information feedback channels shall be established and the time of information treatment shall be shortened so as to ensure that any problem during the construction of this Project will be solved in time manner.
4) After completion of Project
For the purpose to reduce the unfavorable impact of this Project on the production and life of local residents during the construction of this Project and after completion of this Project, following measures will be taken after completion of this Project:
y� After completion of this Project, all wastes and abandoned materials, equipment and machines on the construction site shall be cleaned properly. The areas excavated during the construction shall be leveled timely.
y� During operation of this Project, the main pollutants mainly include noise and odor. Therefore, the wastes generated during the operation of wastewater treatment shall be cleaned off or buried timely, the rubbish fallen on the entrance access and road shall be cleaned out so as to prevent such rubbish being raised by the wind. Meanwhile, proper trees, grasses and other greening measures shall be taken; management and maintenance shall be strengthened. Currently existing trees and tree belt shall be kept as far as possible to beautify the environment, purify the air and reduce the noise.
10.1.3.2 Permanent expropriated land
Land expropriated permanently for the Project includes the land for following works: the wastewater treatment work in Wulatehouqi County Industrial Party (Huhe Town), regenerated water supply work in Wulatehouqi County, wastewater treatment and recycling work in Ganqimaodu Port Industrial Park (Delingshan Town), regenerated water supply work in Ganqimaodu Port Industrial Park, Sanpaigan regenerated water supply project, Qipaigan regenerated water work, wastewater treatment and recycling work in Wulateqianqi County Industrial Park (Xianfeng Town).The area within the expropriated land is the area affected by the land expropriation and removal of this Project. The area affected by land expropriation and removal of this Project is determined on the site according to the design results in the Feasibility Study Report prepared by China Municipal Engineering Design & Research Institute (Southwest). According to the on-site investigation and the inquiry with local land administrative bureau, the land permanently expropriated by this Project mainly belongs to uncultivated land (uneven land) and farm land. No basic farmland is expropriated.
10.1.3.3 Temporary land expropriation for construction
Temporary land expropriation includes the land necessary for construction of main works and the land occupied by pollutant interception pipeline, and water supply pipeline. According to the on-site investigation and the inquiry with local land administrative bureau, the land permanently expropriated by this Project mainly belongs to uncultivated land (uneven land) and farm land. No basic farmland is expropriated.
10.1.4 Impact indicator of Project
Totally four towns (streets), four villages and one state owned farm and one state owned pasture in five banners (counties) of Bayannaoer City are affected by this Project. Five households, totally 22 residents, are affected by the land expropriation, no resettlement is required. No house will be removed. Totally 3597.25 mu of land of various types are taken over for use temporarily or expropriated, where land expropriated covers 758.00mu, land taken over for use temporary covers 2839.25mu, and 150 fruit trees are also expropriated. Impact indicator of land expropriation is shown in Table 3.3-1.
10.1.4.1 Land expropriation
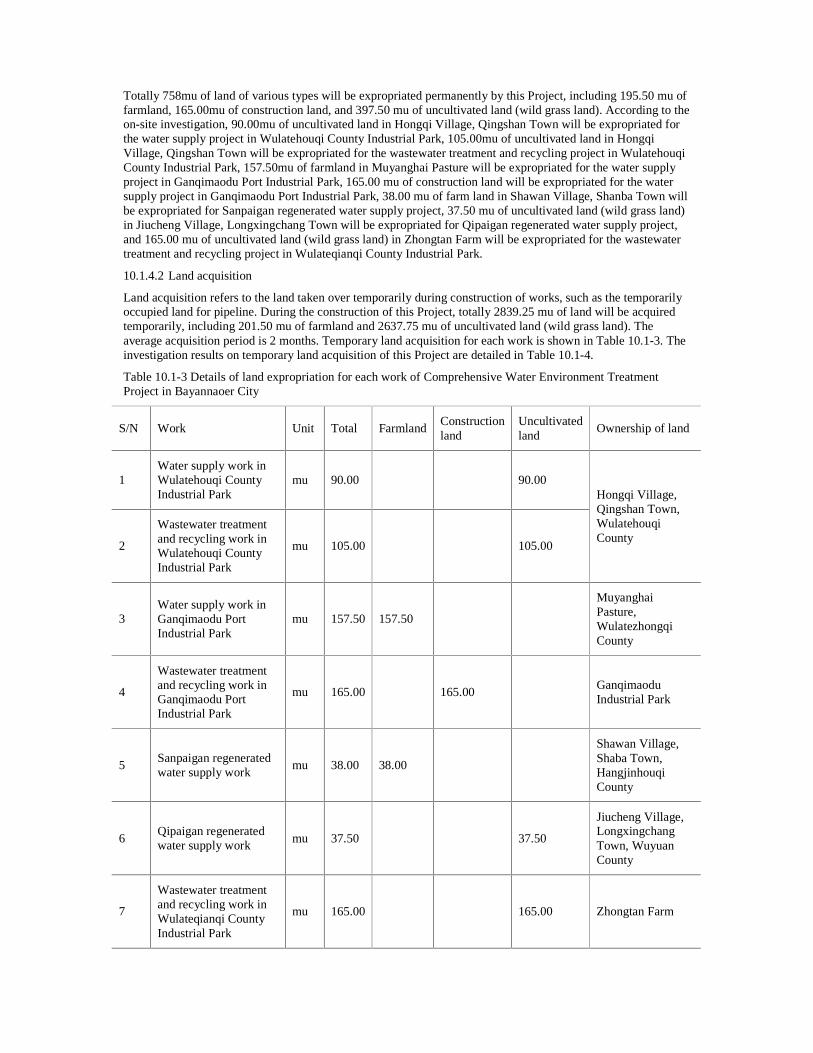
Totally 758mu of land of various types will be expropriated permanently by this Project, including 195.50 mu of farmland, 165.00mu of construction land, and 397.50 mu of uncultivated land (wild grass land). According to the on-site investigation, 90.00mu of uncultivated land in Hongqi Village, Qingshan Town will be expropriated for the water supply project in Wulatehouqi County Industrial Park, 105.00mu of uncultivated land in Hongqi Village, Qingshan Town will be expropriated for the wastewater treatment and recycling project in Wulatehouqi County Industrial Park, 157.50mu of farmland in Muyanghai Pasture will be expropriated for the water supply project in Ganqimaodu Port Industrial Park, 165.00 mu of construction land will be expropriated for the water supply project in Ganqimaodu Port Industrial Park, 38.00 mu of farm land in Shawan Village, Shanba Town will be expropriated for Sanpaigan regenerated water supply project, 37.50 mu of uncultivated land (wild grass land) in Jiucheng Village, Longxingchang Town will be expropriated for Qipaigan regenerated water supply project, and 165.00 mu of uncultivated land (wild grass land) in Zhongtan Farm will be expropriated for the wastewater treatment and recycling project in Wulateqianqi County Industrial Park.
10.1.4.2 Land acquisition
Land acquisition refers to the land taken over temporarily during construction of works, such as the temporarily occupied land for pipeline. During the construction of this Project, totally 2839.25 mu of land will be acquired temporarily, including 201.50 mu of farmland and 2637.75 mu of uncultivated land (wild grass land). The average acquisition period is 2 months. Temporary land acquisition for each work is shown in Table 10.1-3. The investigation results on temporary land acquisition of this Project are detailed in Table 10.1-4.
Table 10.1-3 Details of land expropriation for each work of Comprehensive Water Environment Treatment Project in Bayannaoer City
S/N Work Unit Total Farmland Construction land
Uncultivated land
Ownership of land
1 Water supply work in Wulatehouqi County Industrial Park
mu 90.00 90.00
2
Wastewater treatment and recycling work in Wulatehouqi County Industrial Park
mu 105.00 105.00
Hongqi Village, Qingshan Town, Wulatehouqi County
3 Water supply work in Ganqimaodu Port Industrial Park
mu 157.50 157.50
Muyanghai Pasture, Wulatezhongqi County
4
Wastewater treatment and recycling work in Ganqimaodu Port Industrial Park
mu 165.00 165.00 Ganqimaodu Industrial Park
5 Sanpaigan regenerated water supply work
mu 38.00 38.00
Shawan Village, Shaba Town, Hangjinhouqi County
6 Qipaigan regenerated water supply work
mu 37.50 37.50
Jiucheng Village, Longxingchang Town, Wuyuan County
7
Wastewater treatment and recycling work in Wulateqianqi County Industrial Park
mu 165.00 165.00 Zhongtan Farm
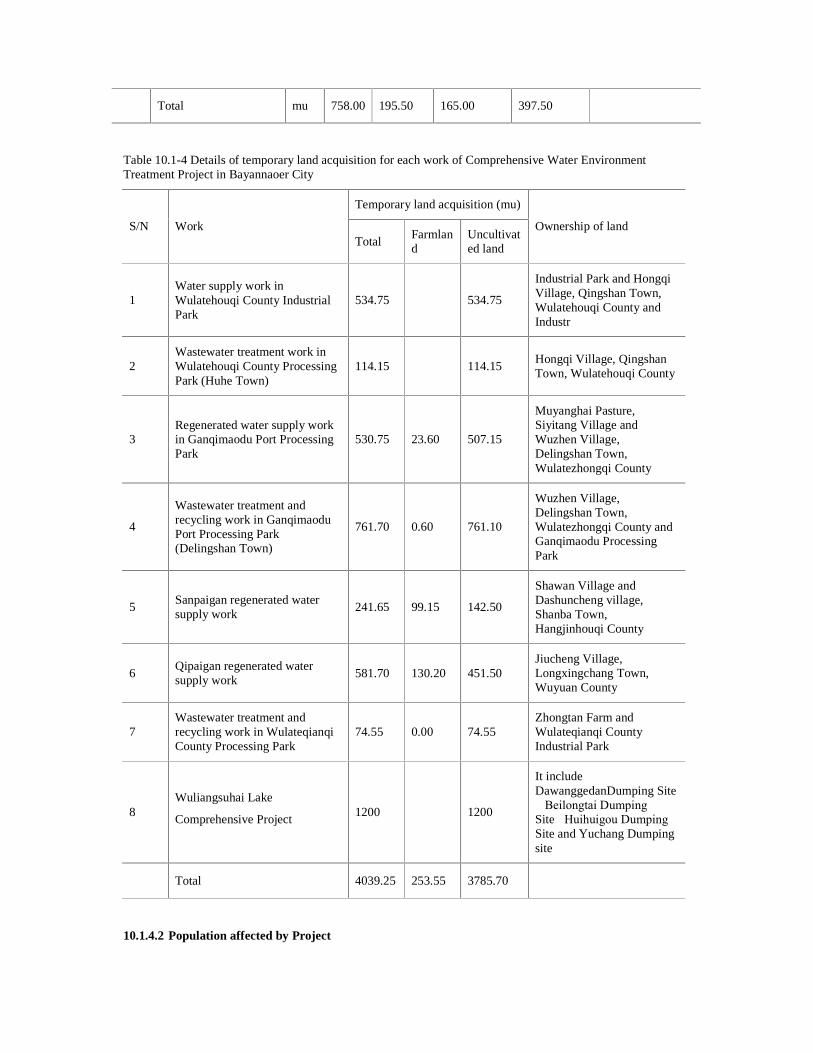
Total mu 758.00 195.50 165.00 397.50
Table 10.1-4 Details of temporary land acquisition for each work of Comprehensive Water Environment Treatment Project in Bayannaoer City
Temporary land acquisition (mu)
S/N Work Total
Farmland
Uncultivated land
Ownership of land
1 Water supply work in Wulatehouqi County Industrial Park
534.75 534.75
Industrial Park and Hongqi Village, Qingshan Town, Wulatehouqi County and Industr
2 Wastewater treatment work in Wulatehouqi County Processing Park (Huhe Town)
114.15 114.15 Hongqi Village, Qingshan Town, Wulatehouqi County
3 Regenerated water supply work in Ganqimaodu Port Processing Park
530.75 23.60 507.15
Muyanghai Pasture, Siyitang Village and Wuzhen Village, Delingshan Town, Wulatezhongqi County
4
Wastewater treatment and recycling work in Ganqimaodu Port Processing Park (Delingshan Town)
761.70 0.60 761.10
Wuzhen Village, Delingshan Town, Wulatezhongqi County and Ganqimaodu Processing Park
5 Sanpaigan regenerated water supply work
241.65 99.15 142.50
Shawan Village and Dashuncheng village, Shanba Town, Hangjinhouqi County
6 Qipaigan regenerated water supply work
581.70 130.20 451.50 Jiucheng Village, Longxingchang Town, Wuyuan County
7 Wastewater treatment and recycling work in Wulateqianqi County Processing Park
74.55 0.00 74.55 Zhongtan Farm and Wulateqianqi County Industrial Park
8 Wuliangsuhai Lake
Comprehensive Project 1200 1200
It include DawanggedanDumping Site �Beilongtai Dumping Site�Huihuigou Dumping Site and Yuchang Dumping site
Total 4039.25 253.55 3785.70
10.1.4.2 Population affected by Project
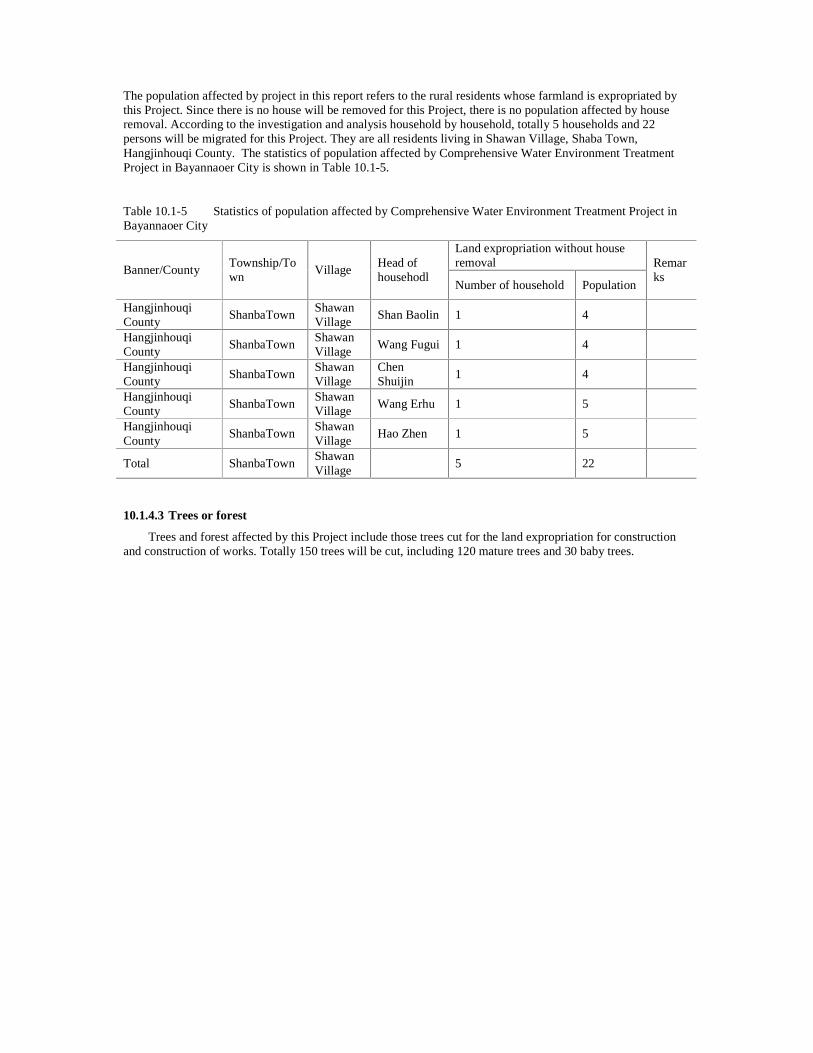
The population affected by project in this report refers to the rural residents whose farmland is expropriated by this Project. Since there is no house will be removed for this Project, there is no population affected by house removal. According to the investigation and analysis household by household, totally 5 households and 22 persons will be migrated for this Project. They are all residents living in Shawan Village, Shaba Town, Hangjinhouqi County. The statistics of population affected by Comprehensive Water Environment Treatment Project in Bayannaoer City is shown in Table 10.1-5.
Table 10.1-5 Statistics of population affected by Comprehensive Water Environment Treatment Project in Bayannaoer City
Land expropriation without house removal
Banner/County Township/Town
Village Head of househodl
Number of household Population
Remarks
Hangjinhouqi County
ShanbaTown Shawan Village
Shan Baolin 1 4
Hangjinhouqi County
ShanbaTown Shawan Village
Wang Fugui 1 4
Hangjinhouqi County
ShanbaTown Shawan Village
Chen Shuijin
1 4
Hangjinhouqi County
ShanbaTown Shawan Village
Wang Erhu 1 5
Hangjinhouqi County
ShanbaTown Shawan Village
Hao Zhen 1 5
Total ShanbaTown Shawan Village
5 22
10.1.4.3 Trees or forest
Trees and forest affected by this Project include those trees cut for the land expropriation for construction and construction of works. Totally 150 trees will be cut, including 120 mature trees and 30 baby trees.
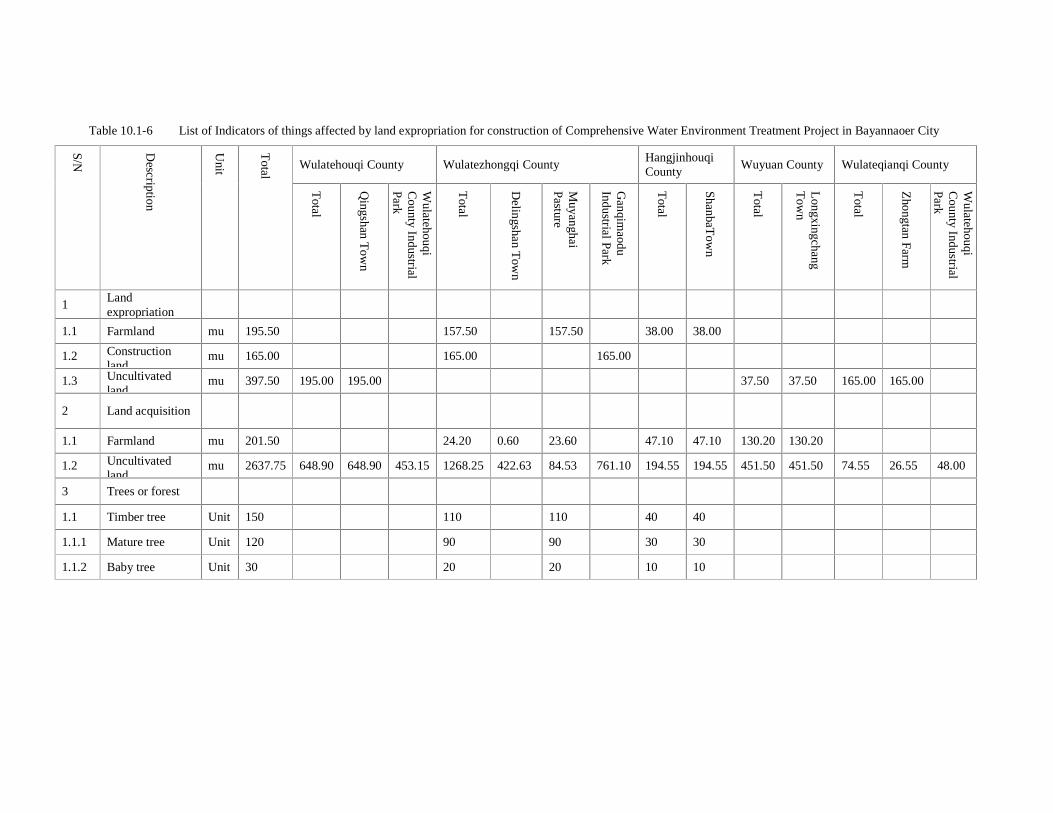
Table 10.1-6 List of Indicators of things affected by land expropriation for construction of Comprehensive Water Environment Treatment Project in Bayannaoer City
Wulatehouqi County Wulatezhongqi County Hangjinhouqi County
Wuyuan County Wulateqianqi County
S/N
Description
Unit
Tota
l
Tota
l
Qingshan T
own
Wula
tehouqi
Cou
nty Industrial
Pa
rk
Tota
l
De
lingsha
n Tow
n
Muya
ngha
i P
asture
Ga
nqim
aodu
Industrial P
ark
Tota
l
Sha
nbaT
own
Tota
l
Lon
gxingchang
Tow
n
Tota
l
Zho
ngtan Fa
rm
Wula
tehouqi
Cou
nty Industrial
Pa
rk
1 Land expropriation
1.1 Farmland mu 195.50 157.50 157.50 38.00 38.00
1.2 Construction land
mu 165.00 165.00 165.00
1.3 Uncultivated land
mu 397.50 195.00 195.00 37.50 37.50 165.00 165.00
2 Land acquisition
1.1 Farmland mu 201.50 24.20 0.60 23.60 47.10 47.10 130.20 130.20
1.2 Uncultivated land
mu 2637.75 648.90 648.90 453.15 1268.25 422.63 84.53 761.10 194.55 194.55 451.50 451.50 74.55 26.55 48.00
3 Trees or forest
1.1 Timber tree Unit 150 110 110 40 40
1.1.1 Mature tree Unit 120 90 90 30 30
1.1.2 Baby tree Unit 30 20 20 10 10
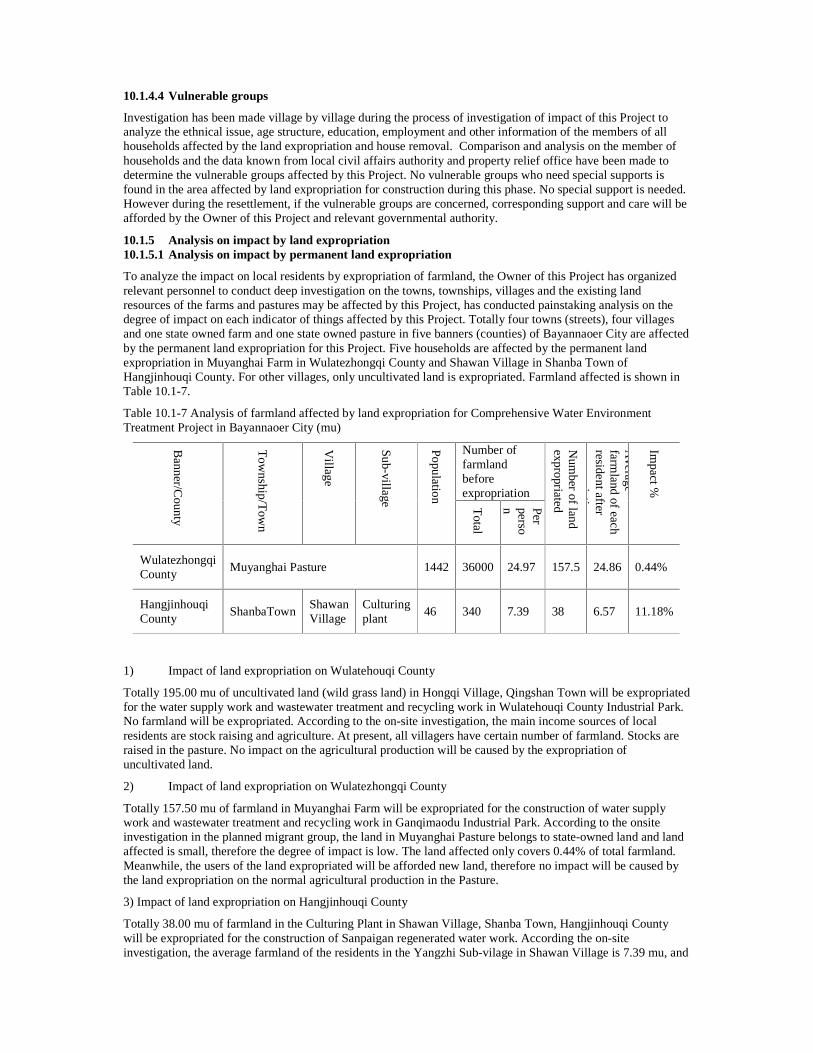
10.1.4.4 Vulnerable groups
Investigation has been made village by village during the process of investigation of impact of this Project to analyze the ethnical issue, age structure, education, employment and other information of the members of all households affected by the land expropriation and house removal. Comparison and analysis on the member of households and the data known from local civil affairs authority and property relief office have been made to determine the vulnerable groups affected by this Project. No vulnerable groups who need special supports is found in the area affected by land expropriation for construction during this phase. No special support is needed. However during the resettlement, if the vulnerable groups are concerned, corresponding support and care will be afforded by the Owner of this Project and relevant governmental authority.
10.1.5 Analysis on impact by land expropriation 10.1.5.1 Analysis on impact by permanent land expropriation
To analyze the impact on local residents by expropriation of farmland, the Owner of this Project has organized relevant personnel to conduct deep investigation on the towns, townships, villages and the existing land resources of the farms and pastures may be affected by this Project, has conducted painstaking analysis on the degree of impact on each indicator of things affected by this Project. Totally four towns (streets), four villages and one state owned farm and one state owned pasture in five banners (counties) of Bayannaoer City are affected by the permanent land expropriation for this Project. Five households are affected by the permanent land expropriation in Muyanghai Farm in Wulatezhongqi County and Shawan Village in Shanba Town of Hangjinhouqi County. For other villages, only uncultivated land is expropriated. Farmland affected is shown in Table 10.1-7.
Table 10.1-7 Analysis of farmland affected by land expropriation for Comprehensive Water Environment Treatment Project in Bayannaoer City (mu)
Number of farmland before expropriation
Banner/C
ounty
Tow
nship/Tow
n
Village
Sub-village
Population Total
Per person
Num
ber of land expropriated
Average
farmland of each
resident after expropriation
Impact %
Wulatezhongqi County
Muyanghai Pasture 1442 36000 24.97 157.5 24.86 0.44%
Hangjinhouqi County
ShanbaTown Shawan Village
Culturing plant
46 340 7.39 38 6.57 11.18%
1) Impact of land expropriation on Wulatehouqi County
Totally 195.00 mu of uncultivated land (wild grass land) in Hongqi Village, Qingshan Town will be expropriated for the water supply work and wastewater treatment and recycling work in Wulatehouqi County Industrial Park. No farmland will be expropriated. According to the on-site investigation, the main income sources of local residents are stock raising and agriculture. At present, all villagers have certain number of farmland. Stocks are raised in the pasture. No impact on the agricultural production will be caused by the expropriation of uncultivated land.
2) Impact of land expropriation on Wulatezhongqi County
Totally 157.50 mu of farmland in Muyanghai Farm will be expropriated for the construction of water supply work and wastewater treatment and recycling work in Ganqimaodu Industrial Park. According to the onsite investigation in the planned migrant group, the land in Muyanghai Pasture belongs to state-owned land and land affected is small, therefore the degree of impact is low. The land affected only covers 0.44% of total farmland. Meanwhile, the users of the land expropriated will be afforded new land, therefore no impact will be caused by the land expropriation on the normal agricultural production in the Pasture.
3) Impact of land expropriation on Hangjinhouqi County
Totally 38.00 mu of farmland in the Culturing Plant in Shawan Village, Shanba Town, Hangjinhouqi County will be expropriated for the construction of Sanpaigan regenerated water work. According the on-site investigation, the average farmland of the residents in the Yangzhi Sub-vilage in Shawan Village is 7.39 mu, and
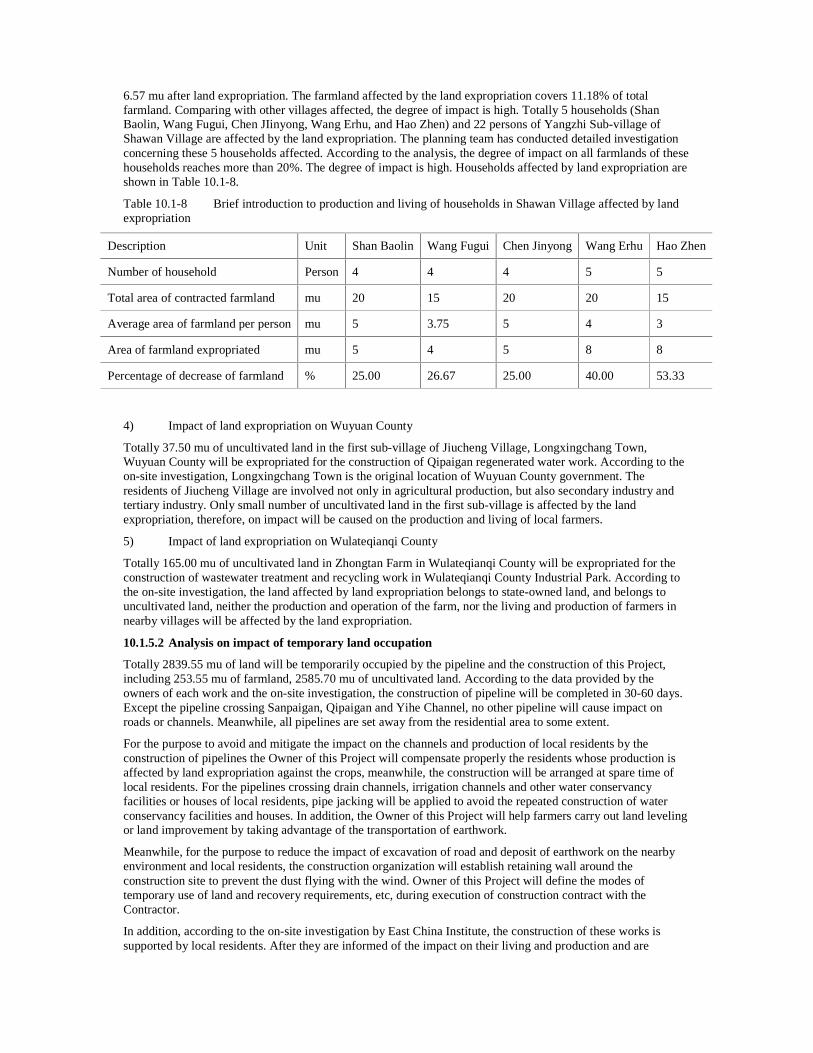
6.57 mu after land expropriation. The farmland affected by the land expropriation covers 11.18% of total farmland. Comparing with other villages affected, the degree of impact is high. Totally 5 households (Shan Baolin, Wang Fugui, Chen JIinyong, Wang Erhu, and Hao Zhen) and 22 persons of Yangzhi Sub-village of Shawan Village are affected by the land expropriation. The planning team has conducted detailed investigation concerning these 5 households affected. According to the analysis, the degree of impact on all farmlands of these households reaches more than 20%. The degree of impact is high. Households affected by land expropriation are shown in Table 10.1-8.
Table 10.1-8 Brief introduction to production and living of households in Shawan Village affected by land expropriation
Description Unit Shan Baolin Wang Fugui Chen Jinyong Wang Erhu Hao Zhen
Number of household Person 4 4 4 5 5
Total area of contracted farmland mu 20 15 20 20 15
Average area of farmland per person mu 5 3.75 5 4 3
Area of farmland expropriated mu 5 4 5 8 8
Percentage of decrease of farmland % 25.00 26.67 25.00 40.00 53.33
4) Impact of land expropriation on Wuyuan County
Totally 37.50 mu of uncultivated land in the first sub-village of Jiucheng Village, Longxingchang Town, Wuyuan County will be expropriated for the construction of Qipaigan regenerated water work. According to the on-site investigation, Longxingchang Town is the original location of Wuyuan County government. The residents of Jiucheng Village are involved not only in agricultural production, but also secondary industry and tertiary industry. Only small number of uncultivated land in the first sub-village is affected by the land expropriation, therefore, on impact will be caused on the production and living of local farmers.
5) Impact of land expropriation on Wulateqianqi County
Totally 165.00 mu of uncultivated land in Zhongtan Farm in Wulateqianqi County will be expropriated for the construction of wastewater treatment and recycling work in Wulateqianqi County Industrial Park. According to the on-site investigation, the land affected by land expropriation belongs to state-owned land, and belongs to uncultivated land, neither the production and operation of the farm, nor the living and production of farmers in nearby villages will be affected by the land expropriation.
10.1.5.2 Analysis on impact of temporary land occupation
Totally 2839.55 mu of land will be temporarily occupied by the pipeline and the construction of this Project, including 253.55 mu of farmland, 2585.70 mu of uncultivated land. According to the data provided by the owners of each work and the on-site investigation, the construction of pipeline will be completed in 30-60 days. Except the pipeline crossing Sanpaigan, Qipaigan and Yihe Channel, no other pipeline will cause impact on roads or channels. Meanwhile, all pipelines are set away from the residential area to some extent.
For the purpose to avoid and mitigate the impact on the channels and production of local residents by the construction of pipelines the Owner of this Project will compensate properly the residents whose production is affected by land expropriation against the crops, meanwhile, the construction will be arranged at spare time of local residents. For the pipelines crossing drain channels, irrigation channels and other water conservancy facilities or houses of local residents, pipe jacking will be applied to avoid the repeated construction of water conservancy facilities and houses. In addition, the Owner of this Project will help farmers carry out land leveling or land improvement by taking advantage of the transportation of earthwork.
Meanwhile, for the purpose to reduce the impact of excavation of road and deposit of earthwork on the nearby environment and local residents, the construction organization will establish retaining wall around the construction site to prevent the dust flying with the wind. Owner of this Project will define the modes of temporary use of land and recovery requirements, etc, during execution of construction contract with the Contractor.
In addition, according to the on-site investigation by East China Institute, the construction of these works is supported by local residents. After they are informed of the impact on their living and production and are
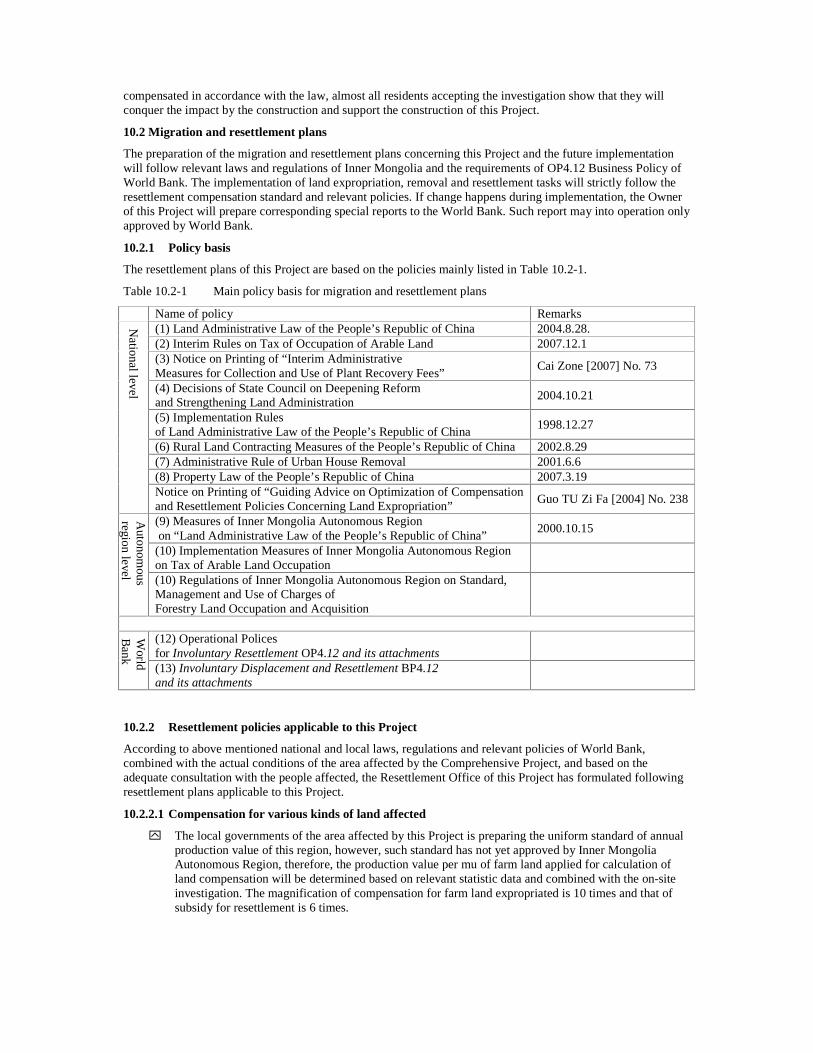
compensated in accordance with the law, almost all residents accepting the investigation show that they will conquer the impact by the construction and support the construction of this Project.
10.2 Migration and resettlement plans
The preparation of the migration and resettlement plans concerning this Project and the future implementation will follow relevant laws and regulations of Inner Mongolia and the requirements of OP4.12 Business Policy of World Bank. The implementation of land expropriation, removal and resettlement tasks will strictly follow the resettlement compensation standard and relevant policies. If change happens during implementation, the Owner of this Project will prepare corresponding special reports to the World Bank. Such report may into operation only approved by World Bank.
10.2.1 Policy basis
The resettlement plans of this Project are based on the policies mainly listed in Table 10.2-1.
Table 10.2-1 Main policy basis for migration and resettlement plans
Name of policy Remarks (1) Land Administrative Law of the People’s Republic of China 2004.8.28. (2) Interim Rules on Tax of Occupation of Arable Land 2007.12.1 (3) Notice on Printing of “Interim Administrative Measures for Collection and Use of Plant Recovery Fees”
Cai Zone [2007] No. 73
(4) Decisions of State Council on Deepening Reform and Strengthening Land Administration
2004.10.21
(5) Implementation Rules of Land Administrative Law of the People’s Republic of China
1998.12.27
(6) Rural Land Contracting Measures of the People’s Republic of China 2002.8.29 (7) Administrative Rule of Urban House Removal 2001.6.6 (8) Property Law of the People’s Republic of China 2007.3.19
National level
Notice on Printing of “Guiding Advice on Optimization of Compensation and Resettlement Policies Concerning Land Expropriation”
Guo TU Zi Fa [2004] No. 238
(9) Measures of Inner Mongolia Autonomous Region on “Land Administrative Law of the People’s Republic of China”
2000.10.15
(10) Implementation Measures of Inner Mongolia Autonomous Region on Tax of Arable Land Occupation
Autonom
ous region level (10) Regulations of Inner Mongolia Autonomous Region on Standard,
Management and Use of Charges of Forestry Land Occupation and Acquisition
(12) Operational Polices for Involuntary Resettlement OP4.12 and its attachments
World
Bank
(13) Involuntary Displacement and Resettlement BP4.12 and its attachments
10.2.2 Resettlement policies applicable to this Project
According to above mentioned national and local laws, regulations and relevant policies of World Bank, combined with the actual conditions of the area affected by the Comprehensive Project, and based on the adequate consultation with the people affected, the Resettlement Office of this Project has formulated following resettlement plans applicable to this Project.
10.2.2.1 Compensation for various kinds of land affected
y� The local governments of the area affected by this Project is preparing the uniform standard of annual production value of this region, however, such standard has not yet approved by Inner Mongolia Autonomous Region, therefore, the production value per mu of farm land applied for calculation of land compensation will be determined based on relevant statistic data and combined with the on-site investigation. The magnification of compensation for farm land expropriated is 10 times and that of subsidy for resettlement is 6 times.
y� If there are crops in the land expropriated, the compensation for crops will be 1 time of the annual production value of this tract of land; no compensation will be given for uncultivated land such barren mountain, wild land, and barren sand
y� Compensation for fruit trees will be determined according the type, age, and size o trees. Since only timber trees are affected by the land expropriation, referring to the nearby project completed recently, the compensation standard for mature trees is 100Yuan/tree and 50Yuan/tree for baby trees.
y� Compensation for temporary land occupation (wasted soil yard, access and construction camp, etc) will be calculated according to the annual production value and the actual occupation time. One-year term will be applied if the time is less than 1 year. The construction organization shall be responsible for recovery of temporary occupied land.
10.2.2.2 Resettlement of rural residents affected
y� If the village or sub-village committee has adjusted the land or explored the land to have the household whose land is expropriated obtain new land or other production materials, then the land compensation and resettlement subsidy shall be managed and utilized by the village committee. If the village or sub-village committee has not adjusted the land or explored the land and the households affected do not obtain any production materials, then the village committee shall pay the resettlement subsidy to the households whose land is expropriated, the land compensation will be managed and utilized by village committee, and will be distributed and utilized according to the decision of general meeting of villagers.
y� During construction, new employment opportunity will be given, and priority will be given to the people affected by this Project. These employment opportunities will benefit the local residents.
10.2.2.3 Public consultation and information disclosure
y� Public consultation meeting
Irregular official consultation meeting will be held by the Resettlement Office. Resettlement Office will organize such meeting irregularly according to the actual conditions of land expropriation and resettlement. The theme, scale, participants of the meeting will be determined as the change of demands, and will be supervised by independent outsider supervising institute.
y� The use plans of land funds will be made via public consultation, and may be put into implementation upon approval by the general meeting of villagers.
y� Resettlement information system based on computer will be applied to strengthen the management of resettlement and ensure the consistence between the implementation of resettlement and the policy concerning resettlement. Resettlement information will be publicized from time to time to set up a bridge between the Resettlement Office and the people affected. Feedback of immigrants will be collected and any possible bias will be remedied in timely manner.
10.2.3 Compensation standard
10.2.3.1 Compensation standard for land acquisition and expropriation
1) Annual production value of farmland
The local governments of the area affected by this Project is preparing the uniform standard of annual production value of this region, however, such standard has not yet approved by Inner Mongolia Autonomous Region, therefore, the production value per mu of farm land applied for calculation of land compensation will be determined based on relevant statistic data and combined with the on-site investigation. The production amount per mu of farmland will be calculated as per the average production amount per mu in recent three years from 2006 to 2008. According to the on-site investigation and combined with the similar project completed recently, the price of farm products will be calculated as per the price of second quarter of 2009. After calculation, the average annual production value of farm land in Wulateqianqi County, Wulatezhongqi County, Wulatehouqi County, Hangjinhouqi County and Wuyuan County in recent three years is 1129 Yuan/mu, 765Yuan/mu, 810Yuan/mu, 1331Yuan/mu and 1384 Yuan/mu respectively.
2) Compensation standard for rural collectively-owned land
According to the relevant provisions on land compensation provided in “Implementation Measures of the Land Administrative Law of the People’ Republic of China”, the compensation for land will be 6-10 times of the average annual production value of recent three years and the resettlement subsidy for each rural resident will be 4-10 times of average annual production value of farmland of recent years. According to the investigation by the
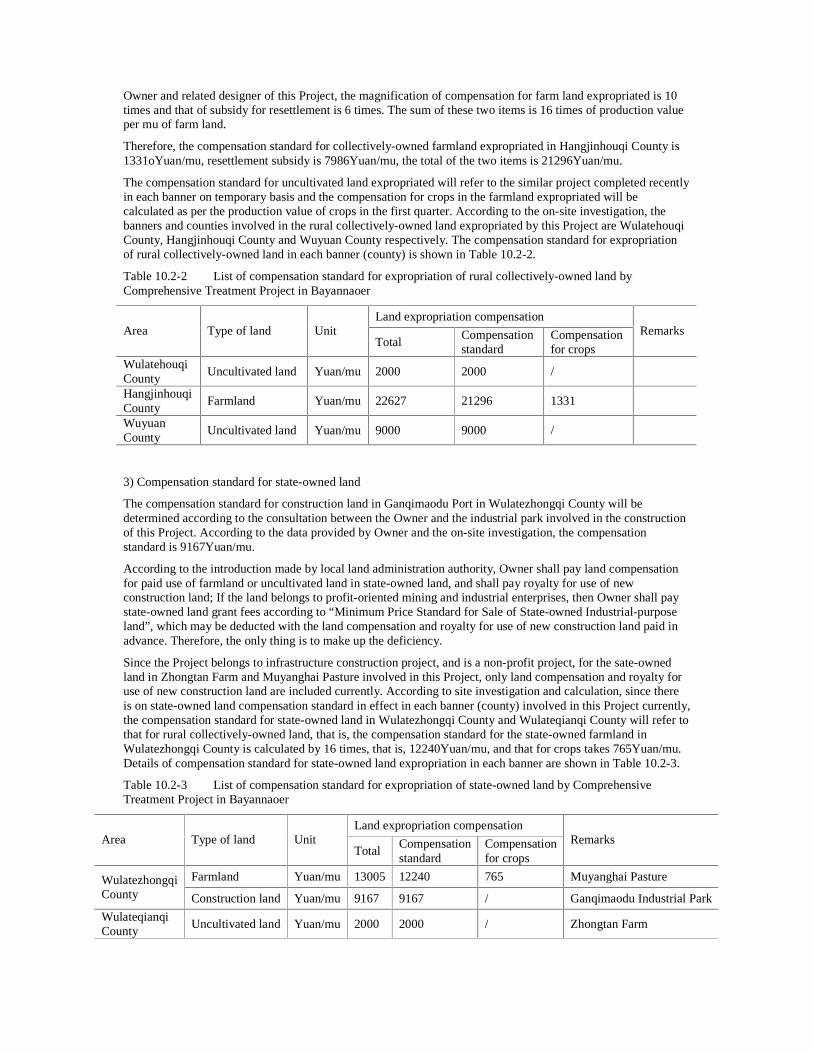
Owner and related designer of this Project, the magnification of compensation for farm land expropriated is 10 times and that of subsidy for resettlement is 6 times. The sum of these two items is 16 times of production value per mu of farm land.
Therefore, the compensation standard for collectively-owned farmland expropriated in Hangjinhouqi County is 1331oYuan/mu, resettlement subsidy is 7986Yuan/mu, the total of the two items is 21296Yuan/mu.
The compensation standard for uncultivated land expropriated will refer to the similar project completed recently in each banner on temporary basis and the compensation for crops in the farmland expropriated will be calculated as per the production value of crops in the first quarter. According to the on-site investigation, the banners and counties involved in the rural collectively-owned land expropriated by this Project are Wulatehouqi County, Hangjinhouqi County and Wuyuan County respectively. The compensation standard for expropriation of rural collectively-owned land in each banner (county) is shown in Table 10.2-2.
Table 10.2-2 List of compensation standard for expropriation of rural collectively-owned land by Comprehensive Treatment Project in Bayannaoer
Land expropriation compensation Area Type of land Unit
Total Compensation standard
Compensation for crops
Remarks
Wulatehouqi County
Uncultivated land Yuan/mu 2000 2000 /
Hangjinhouqi County
Farmland Yuan/mu 22627 21296 1331
Wuyuan County
Uncultivated land Yuan/mu 9000 9000 /
3) Compensation standard for state-owned land
The compensation standard for construction land in Ganqimaodu Port in Wulatezhongqi County will be determined according to the consultation between the Owner and the industrial park involved in the construction of this Project. According to the data provided by Owner and the on-site investigation, the compensation standard is 9167Yuan/mu.
According to the introduction made by local land administration authority, Owner shall pay land compensation for paid use of farmland or uncultivated land in state-owned land, and shall pay royalty for use of new construction land; If the land belongs to profit-oriented mining and industrial enterprises, then Owner shall pay state-owned land grant fees according to “Minimum Price Standard for Sale of State-owned Industrial-purpose land”, which may be deducted with the land compensation and royalty for use of new construction land paid in advance. Therefore, the only thing is to make up the deficiency.
Since the Project belongs to infrastructure construction project, and is a non-profit project, for the sate-owned land in Zhongtan Farm and Muyanghai Pasture involved in this Project, only land compensation and royalty for use of new construction land are included currently. According to site investigation and calculation, since there is on state-owned land compensation standard in effect in each banner (county) involved in this Project currently, the compensation standard for state-owned land in Wulatezhongqi County and Wulateqianqi County will refer to that for rural collectively-owned land, that is, the compensation standard for the state-owned farmland in Wulatezhongqi County is calculated by 16 times, that is, 12240Yuan/mu, and that for crops takes 765Yuan/mu. Details of compensation standard for state-owned land expropriation in each banner are shown in Table 10.2-3.
Table 10.2-3 List of compensation standard for expropriation of state-owned land by Comprehensive Treatment Project in Bayannaoer
Land expropriation compensation Area Type of land Unit
Total Compensation standard
Compensation for crops
Remarks
Farmland Yuan/mu 13005 12240 765 Muyanghai Pasture Wulatezhongqi County Construction land Yuan/mu 9167 9167 / Ganqimaodu Industrial Park
Wulateqianqi County
Uncultivated land Yuan/mu 2000 2000 / Zhongtan Farm
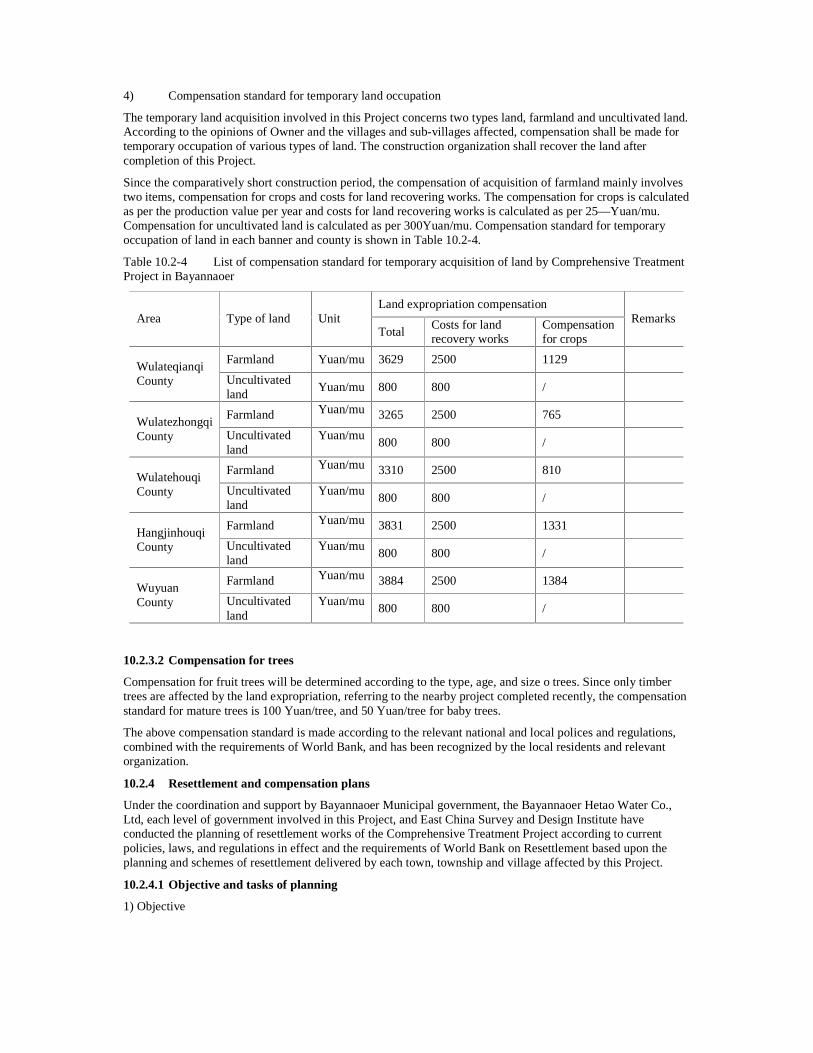
4) Compensation standard for temporary land occupation
The temporary land acquisition involved in this Project concerns two types land, farmland and uncultivated land. According to the opinions of Owner and the villages and sub-villages affected, compensation shall be made for temporary occupation of various types of land. The construction organization shall recover the land after completion of this Project.
Since the comparatively short construction period, the compensation of acquisition of farmland mainly involves two items, compensation for crops and costs for land recovering works. The compensation for crops is calculated as per the production value per year and costs for land recovering works is calculated as per 25—Yuan/mu. Compensation for uncultivated land is calculated as per 300Yuan/mu. Compensation standard for temporary occupation of land in each banner and county is shown in Table 10.2-4.
Table 10.2-4 List of compensation standard for temporary acquisition of land by Comprehensive Treatment Project in Bayannaoer
Land expropriation compensation Area Type of land Unit
Total Costs for land recovery works
Compensation for crops
Remarks
Farmland Yuan/mu 3629 2500 1129 Wulateqianqi County Uncultivated
land Yuan/mu 800 800 /
Farmland Yuan/mu 3265 2500 765 Wulatezhongqi County Uncultivated
land Yuan/mu
800 800 /
Farmland Yuan/mu 3310 2500 810 Wulatehouqi County Uncultivated
land Yuan/mu
800 800 /
Farmland Yuan/mu 3831 2500 1331 Hangjinhouqi County Uncultivated
land Yuan/mu
800 800 /
Farmland Yuan/mu 3884 2500 1384 Wuyuan County Uncultivated
land Yuan/mu
800 800 /
10.2.3.2 Compensation for trees
Compensation for fruit trees will be determined according to the type, age, and size o trees. Since only timber trees are affected by the land expropriation, referring to the nearby project completed recently, the compensation standard for mature trees is 100 Yuan/tree, and 50 Yuan/tree for baby trees.
The above compensation standard is made according to the relevant national and local polices and regulations, combined with the requirements of World Bank, and has been recognized by the local residents and relevant organization.
10.2.4 Resettlement and compensation plans
Under the coordination and support by Bayannaoer Municipal government, the Bayannaoer Hetao Water Co., Ltd, each level of government involved in this Project, and East China Survey and Design Institute have conducted the planning of resettlement works of the Comprehensive Treatment Project according to current policies, laws, and regulations in effect and the requirements of World Bank on Resettlement based upon the planning and schemes of resettlement delivered by each town, township and village affected by this Project.
10.2.4.1 Objective and tasks of planning
1) Objective
According to the characters of impact caused by this Project, the objective of resettlement planning is to: mitigate the impact on the living and production conditions of migrants, and make the production and living level of them not lower than the original level or be improved to some extent.
2) Tasks
According to the investigation and statistics, the no household will be involved in house removal of this Project. For the uncultivated rural collectively-owned land of villages and sub-villages and the state-owned farm expropriated for this Project, cash compensation and resettlement subsidy will be offered according to relevant policies and the opinions of relevant villages and sub-villages. For the five households, totally 22 persons, affected by the expropriation of farmland in Shawan Village, Shaba Town, Hangjinhouqi County, cash compensation combined with land adjustment within the villages and sub-villages will be applied.
10.2.4.2 Production and resettlement recovery planning
Based upon the full consultation with each village, organization, representative of villagers and immigrants affected, to respect the choice of majority of immigrants, cash compensation will be applied.
According to the on-site investigation, except a small number of villagers, almost all of the villagers investigated prefer to the cash compensation for settlement. The final resettlement plans are determined according to the opinions of majority of immigrants. If any immigrant chooses to continue to live on farming, the Owner of each work in each banner (county) will allocate flexibly the collectively-owned land for them or help them obtain the land from those households who are unwilling to live on farming.
According to the resettlement means by cash compensation, the compensation for land will be paid via payment channel directly to each relevant village, organization and individual affected for their free disposal The resettlement plans for each village are detailed respectively as follows:
y� Hongqi Village, Qingshan Town, Wulatehouqi County
Totally 195.00 mu of uncultivated land in Muye Sub-village in Hongqi Village is expropriated for the water supply and wastewater treatment and recycling works in Wulatehouqi County Industrial Park. No house will be removed. According to the on-site investigation conducted by resettlement planning team, the land affected by the expropriation for construction belongs to uncultivated land collectively owned by Muye Sub-village in Hongqi Village, and the farming and production of local residents are not affected. After soliciting the opinions of relevant sub-village and representatives of villagers, the villagers committee decides, after mutual discussion, that cash compensation will be applied, the land compensation will be transferred directly to the sub-villages, which will be used for the construction of roads, water conservancy, farmland restructuring in the sub-village.
y� Jiucheng Village, Longxingchang Town, Wuyuan County
Totally 37.5 mu of uncultivated land in Jiucheng Village, Longxignchang Town will be expropriated for the Qipaigan regenerated water supply work. No house will be removed. According to the on-site investigation conducted by resettlement planning team, the land affected by the expropriation for construction belongs to uncultivated land collectively owned by Jiucheng Village, and the farming and production of local residents are not affected. After soliciting the opinions of relevant sub-village and representatives of villagers, the villagers committee decides, after mutual discussion, that cash compensation will be applied, the land compensation will be transferred directly to the sub-villages. Land compensation will be used for the construction of roads, water conservancy, farmland restructuring in the sub-village.
y� Shawan Village, Shaba Town, Hangjinhouqi County
Totally 38.00 mu of farm land in Yangzhi Sub-village in Shawan Village, Shanba Town will be expropriated for the Sanpaigan regenerated water supply work. No house will be removed. Total five households (Shan Baolin, Wange Fugui, Chen Jinyong, Wang Erhu and Hao Zhen) or 22 residents of Yangzhi Sub-village of Shawan Village will be affected by the land expropriation. On-site investigation and analysis of these five households have been made by the Owner of Project and resettlement planning team. The details of living and producing conditions of each household affected are shown in Table 10.2-5.
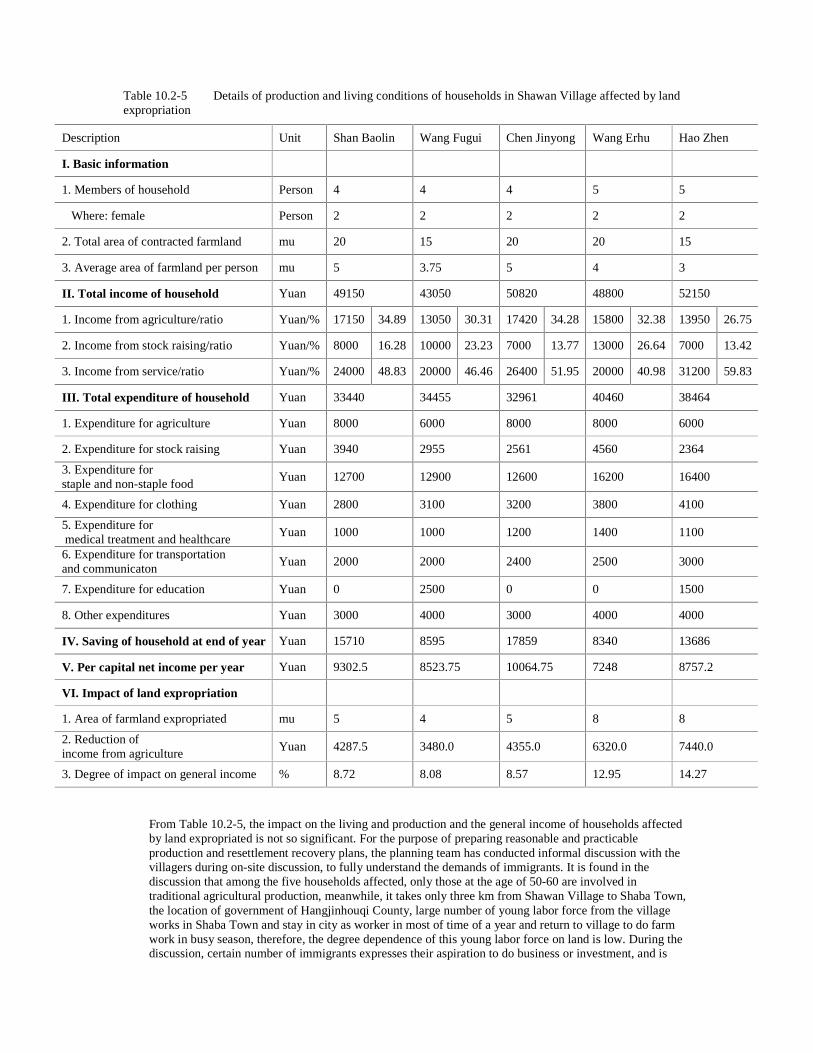
Table 10.2-5 Details of production and living conditions of households in Shawan Village affected by land expropriation
Description Unit Shan Baolin Wang Fugui Chen Jinyong Wang Erhu Hao Zhen
I. Basic information
1. Members of household Person 4 4 4 5 5
Where: female Person 2 2 2 2 2
2. Total area of contracted farmland mu 20 15 20 20 15
3. Average area of farmland per person mu 5 3.75 5 4 3
II. Total income of household Yuan 49150 43050 50820 48800 52150
1. Income from agriculture/ratio Yuan/% 17150 34.89 13050 30.31 17420 34.28 15800 32.38 13950 26.75
2. Income from stock raising/ratio Yuan/% 8000 16.28 10000 23.23 7000 13.77 13000 26.64 7000 13.42
3. Income from service/ratio Yuan/% 24000 48.83 20000 46.46 26400 51.95 20000 40.98 31200 59.83
III. Total expenditure of household Yuan 33440 34455 32961 40460 38464
1. Expenditure for agriculture Yuan 8000 6000 8000 8000 6000
2. Expenditure for stock raising Yuan 3940 2955 2561 4560 2364
3. Expenditure for staple and non-staple food
Yuan 12700 12900 12600 16200 16400
4. Expenditure for clothing Yuan 2800 3100 3200 3800 4100
5. Expenditure for medical treatment and healthcare
Yuan 1000 1000 1200 1400 1100
6. Expenditure for transportation and communicaton
Yuan 2000 2000 2400 2500 3000
7. Expenditure for education Yuan 0 2500 0 0 1500
8. Other expenditures Yuan 3000 4000 3000 4000 4000
IV. Saving of household at end of year Yuan 15710 8595 17859 8340 13686
V. Per capital net income per year Yuan 9302.5 8523.75 10064.75 7248 8757.2
VI. Impact of land expropriation
1. Area of farmland expropriated mu 5 4 5 8 8
2. Reduction of income from agriculture
Yuan 4287.5 3480.0 4355.0 6320.0 7440.0
3. Degree of impact on general income % 8.72 8.08 8.57 12.95 14.27
From Table 10.2-5, the impact on the living and production and the general income of households affected by land expropriated is not so significant. For the purpose of preparing reasonable and practicable production and resettlement recovery plans, the planning team has conducted informal discussion with the villagers during on-site discussion, to fully understand the demands of immigrants. It is found in the discussion that among the five households affected, only those at the age of 50-60 are involved in traditional agricultural production, meanwhile, it takes only three km from Shawan Village to Shaba Town, the location of government of Hangjinhouqi County, large number of young labor force from the village works in Shaba Town and stay in city as worker in most of time of a year and return to village to do farm work in busy season, therefore, the degree dependence of this young labor force on land is low. During the discussion, certain number of immigrants expresses their aspiration to do business or investment, and is
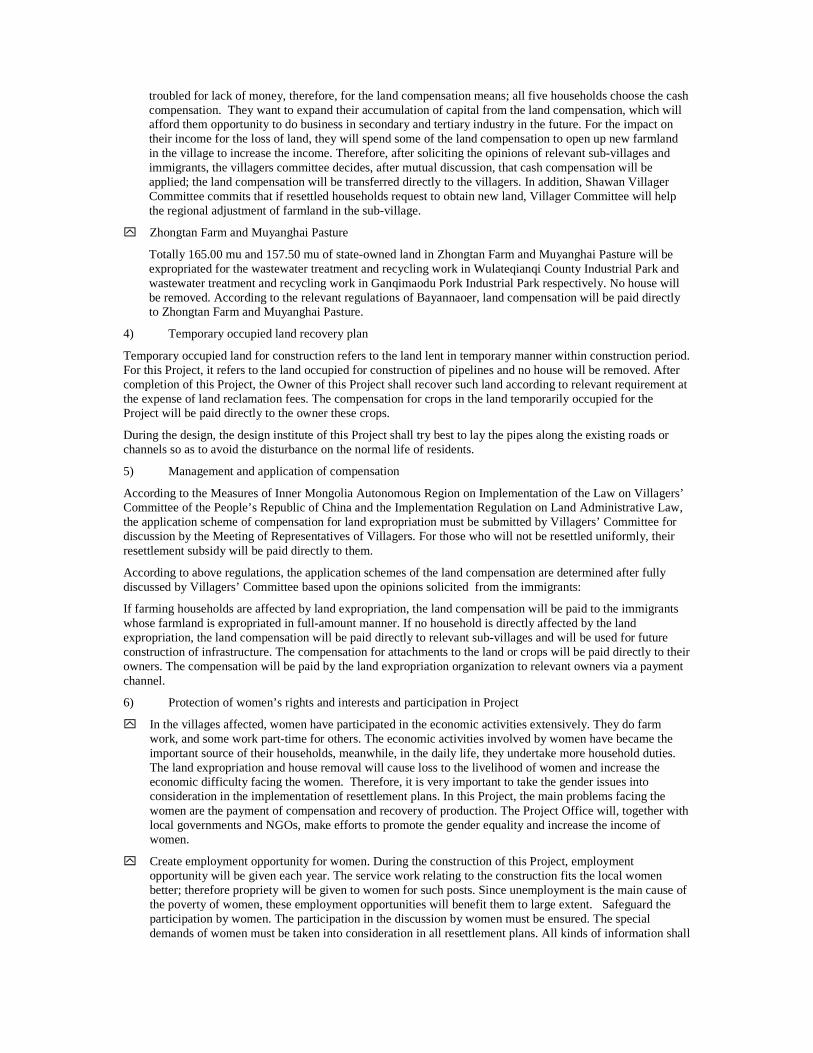
troubled for lack of money, therefore, for the land compensation means; all five households choose the cash compensation. They want to expand their accumulation of capital from the land compensation, which will afford them opportunity to do business in secondary and tertiary industry in the future. For the impact on their income for the loss of land, they will spend some of the land compensation to open up new farmland in the village to increase the income. Therefore, after soliciting the opinions of relevant sub-villages and immigrants, the villagers committee decides, after mutual discussion, that cash compensation will be applied; the land compensation will be transferred directly to the villagers. In addition, Shawan Villager Committee commits that if resettled households request to obtain new land, Villager Committee will help the regional adjustment of farmland in the sub-village.
y� Zhongtan Farm and Muyanghai Pasture
Totally 165.00 mu and 157.50 mu of state-owned land in Zhongtan Farm and Muyanghai Pasture will be expropriated for the wastewater treatment and recycling work in Wulateqianqi County Industrial Park and wastewater treatment and recycling work in Ganqimaodu Pork Industrial Park respectively. No house will be removed. According to the relevant regulations of Bayannaoer, land compensation will be paid directly to Zhongtan Farm and Muyanghai Pasture.
4) Temporary occupied land recovery plan
Temporary occupied land for construction refers to the land lent in temporary manner within construction period. For this Project, it refers to the land occupied for construction of pipelines and no house will be removed. After completion of this Project, the Owner of this Project shall recover such land according to relevant requirement at the expense of land reclamation fees. The compensation for crops in the land temporarily occupied for the Project will be paid directly to the owner these crops.
During the design, the design institute of this Project shall try best to lay the pipes along the existing roads or channels so as to avoid the disturbance on the normal life of residents.
5) Management and application of compensation
According to the Measures of Inner Mongolia Autonomous Region on Implementation of the Law on Villagers’ Committee of the People’s Republic of China and the Implementation Regulation on Land Administrative Law, the application scheme of compensation for land expropriation must be submitted by Villagers’ Committee for discussion by the Meeting of Representatives of Villagers. For those who will not be resettled uniformly, their resettlement subsidy will be paid directly to them.
According to above regulations, the application schemes of the land compensation are determined after fully discussed by Villagers’ Committee based upon the opinions solicited from the immigrants:
If farming households are affected by land expropriation, the land compensation will be paid to the immigrants whose farmland is expropriated in full-amount manner. If no household is directly affected by the land expropriation, the land compensation will be paid directly to relevant sub-villages and will be used for future construction of infrastructure. The compensation for attachments to the land or crops will be paid directly to their owners. The compensation will be paid by the land expropriation organization to relevant owners via a payment channel.
6) Protection of women’s rights and interests and participation in Project
y� In the villages affected, women have participated in the economic activities extensively. They do farm work, and some work part-time for others. The economic activities involved by women have became the important source of their households, meanwhile, in the daily life, they undertake more household duties. The land expropriation and house removal will cause loss to the livelihood of women and increase the economic difficulty facing the women. Therefore, it is very important to take the gender issues into consideration in the implementation of resettlement plans. In this Project, the main problems facing the women are the payment of compensation and recovery of production. The Project Office will, together with local governments and NGOs, make efforts to promote the gender equality and increase the income of women.
y� Create employment opportunity for women. During the construction of this Project, employment opportunity will be given each year. The service work relating to the construction fits the local women better; therefore propriety will be given to women for such posts. Since unemployment is the main cause of the poverty of women, these employment opportunities will benefit them to large extent. Safeguard the participation by women. The participation in the discussion by women must be ensured. The special demands of women must be taken into consideration in all resettlement plans. All kinds of information shall
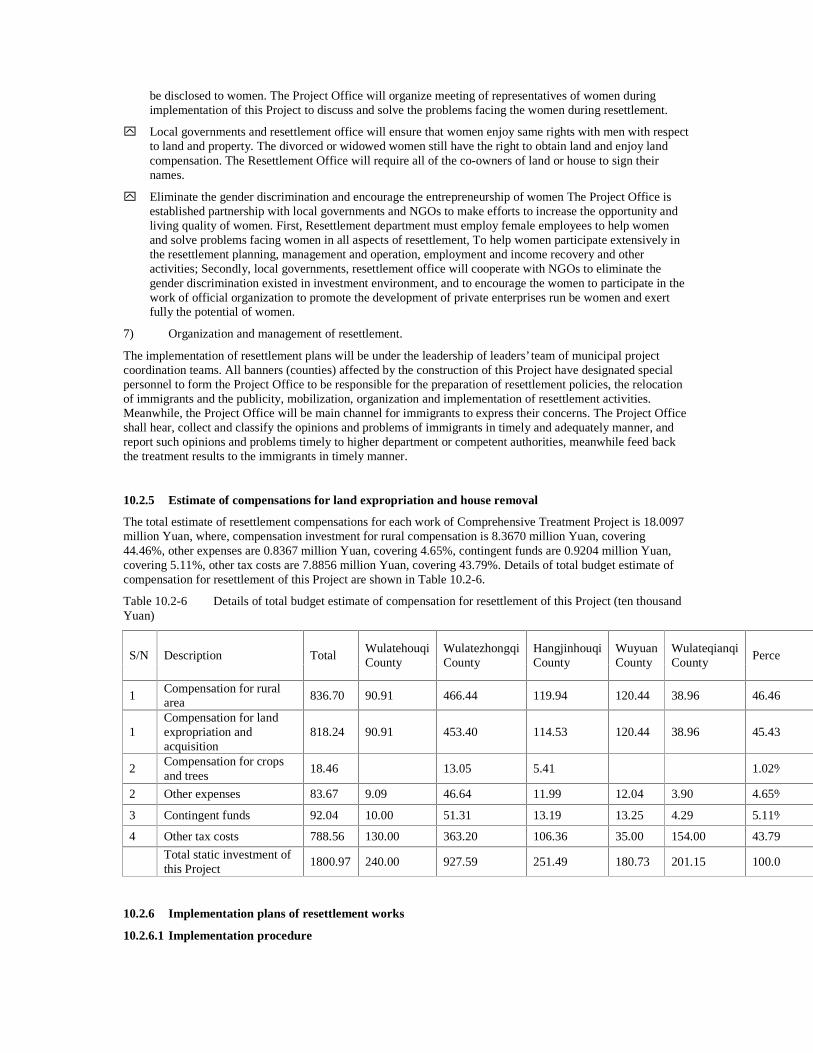
be disclosed to women. The Project Office will organize meeting of representatives of women during implementation of this Project to discuss and solve the problems facing the women during resettlement.
y� Local governments and resettlement office will ensure that women enjoy same rights with men with respect to land and property. The divorced or widowed women still have the right to obtain land and enjoy land compensation. The Resettlement Office will require all of the co-owners of land or house to sign their names.
y� Eliminate the gender discrimination and encourage the entrepreneurship of women The Project Office is established partnership with local governments and NGOs to make efforts to increase the opportunity and living quality of women. First, Resettlement department must employ female employees to help women and solve problems facing women in all aspects of resettlement, To help women participate extensively in the resettlement planning, management and operation, employment and income recovery and other activities; Secondly, local governments, resettlement office will cooperate with NGOs to eliminate the gender discrimination existed in investment environment, and to encourage the women to participate in the work of official organization to promote the development of private enterprises run be women and exert fully the potential of women.
7) Organization and management of resettlement.
The implementation of resettlement plans will be under the leadership of leaders’ team of municipal project coordination teams. All banners (counties) affected by the construction of this Project have designated special personnel to form the Project Office to be responsible for the preparation of resettlement policies, the relocation of immigrants and the publicity, mobilization, organization and implementation of resettlement activities. Meanwhile, the Project Office will be main channel for immigrants to express their concerns. The Project Office shall hear, collect and classify the opinions and problems of immigrants in timely and adequately manner, and report such opinions and problems timely to higher department or competent authorities, meanwhile feed back the treatment results to the immigrants in timely manner.
10.2.5 Estimate of compensations for land expropriation and house removal
The total estimate of resettlement compensations for each work of Comprehensive Treatment Project is 18.0097 million Yuan, where, compensation investment for rural compensation is 8.3670 million Yuan, covering 44.46%, other expenses are 0.8367 million Yuan, covering 4.65%, contingent funds are 0.9204 million Yuan, covering 5.11%, other tax costs are 7.8856 million Yuan, covering 43.79%. Details of total budget estimate of compensation for resettlement of this Project are shown in Table 10.2-6.
Table 10.2-6 Details of total budget estimate of compensation for resettlement of this Project (ten thousand Yuan)
S/N Description Total Wulatehouqi County
Wulatezhongqi County
Hangjinhouqi County
Wuyuan County
Wulateqianqi County
Percentage
1 Compensation for rural area
836.70 90.91 466.44 119.94 120.44 38.96 46.46%
1 Compensation for land expropriation and acquisition
818.24 90.91 453.40 114.53 120.44 38.96 45.43%
2 Compensation for crops and trees
18.46 13.05 5.41 1.02%
2 Other expenses 83.67 9.09 46.64 11.99 12.04 3.90 4.65%
3 Contingent funds 92.04 10.00 51.31 13.19 13.25 4.29 5.11%
4 Other tax costs 788.56 130.00 363.20 106.36 35.00 154.00 43.79%
Total static investment of this Project
1800.97 240.00 927.59 251.49 180.73 201.15 100.00%
10.2.6 Implementation plans of resettlement works
10.2.6.1 Implementation procedure
A. Land expropriation and compensation
Land expropriation and compensation will be completed by relevant department. The detailed procedure is as follow:
y� Project design institute provides the detailed map of land expropriation scope, which shall be verified jointly by the Project Office, Owner of Project and each local government, local land administrative department, and the organization (individual) affected by this Project, to define the scope and quantity of land expropriation and house removal;
y� Owner of Project applies to relevant local land administrative departments for land expropriation;
y� Relevant land administrative department replies the application for land expropriation;
y� The Owner of this Project and local land administrative departments conduct consultation on the issues with respect to land compensation, enter into land compensation agreement and transact relevant land acquisition procedures;
y� County land administrative departments and each township (town), village affected affirm the scope and quantity of land expropriation;
y� County land administrative department enters into “Land Expropriation Agreement” with each township (town) affected;
y� Relevant party pays the compensations;
y� Relevant party transacts legal procedures;
y� Relevant parties implement the land expropriation procedure.
B. Production recovery
Production and relocation recovery will be implemented by relevant Villagers’ Committee. The working procedure is as follow:
y� The sub-village with the task of resettlement organizes the meeting of representatives of villagers to discuss and make the distribution schemes of land compensations;
y� The Villagers’ Committee discloses the distribution schemes of land compensations to solicit further the opinions of all villagers and immigrants in its sub-village;
y� The Villagers’ Committee distributes the land compensations.
10.2.6.2 Schedule
The schedule of implementation of land expropriation and re-settlement of this Project will be made according to the construction schedule of works. Detailed schedules shall follow following principles:
y� All land expropriation works shall be completed prior to commencement of works of each bid section;
y� The land compensation schemes shall be subject to the full consultation with villagers;
y� Efforts shall be made to complete the land expropriation after the crops are harvested;
y� The payment of land compensation shall be completed prior to the expropriation of land;
According the overall schedule of this Project, the schedule of land expropriation and house removal of this Project is shown in Table 10.2-6.
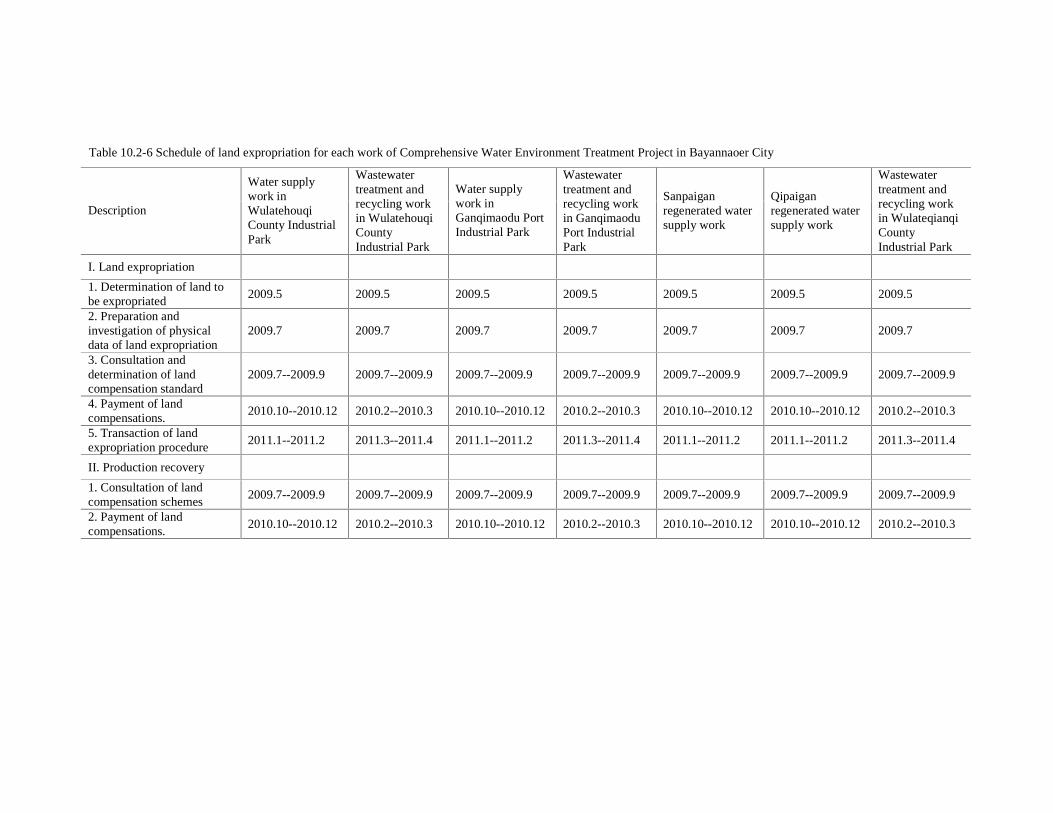
Table 10.2-6 Schedule of land expropriation for each work of Comprehensive Water Environment Treatment Project in Bayannaoer City
Description
Water supply work in Wulatehouqi County Industrial Park
Wastewater treatment and recycling work in Wulatehouqi County Industrial Park
Water supply work in Ganqimaodu Port Industrial Park
Wastewater treatment and recycling work in Ganqimaodu Port Industrial Park
Sanpaigan regenerated water supply work
Qipaigan regenerated water supply work
Wastewater treatment and recycling work in Wulateqianqi County Industrial Park
I. Land expropriation
1. Determination of land to be expropriated
2009.5 2009.5 2009.5 2009.5 2009.5 2009.5 2009.5
2. Preparation and investigation of physical data of land expropriation
2009.7 2009.7 2009.7 2009.7 2009.7 2009.7 2009.7
3. Consultation and determination of land compensation standard
2009.7--2009.9 2009.7--2009.9 2009.7--2009.9 2009.7--2009.9 2009.7--2009.9 2009.7--2009.9 2009.7--2009.9
4. Payment of land compensations.
2010.10--2010.12 2010.2--2010.3 2010.10--2010.12 2010.2--2010.3 2010.10--2010.12 2010.10--2010.12 2010.2--2010.3
5. Transaction of land expropriation procedure
2011.1--2011.2 2011.3--2011.4 2011.1--2011.2 2011.3--2011.4 2011.1--2011.2 2011.1--2011.2 2011.3--2011.4
II. Production recovery
1. Consultation of land compensation schemes
2009.7--2009.9 2009.7--2009.9 2009.7--2009.9 2009.7--2009.9 2009.7--2009.9 2009.7--2009.9 2009.7--2009.9
2. Payment of land compensations.
2010.10--2010.12 2010.2--2010.3 2010.10--2010.12 2010.2--2010.3 2010.10--2010.12 2010.10--2010.12 2010.2--2010.3
10.2.7 Organization and structure
10.2.7.1 Organization structuring
1) Departments to be established
To ensure the smooth construction of each work of Comprehensive Treatment Project in Bayannaoer, relevant coordination department will be established by Bayannaoer People’s Government, the governments of each banner (county) affected and the Owner of Project to coordinate and supervise all activities relating to resettlement. Departments responsible for the land expropriation, house removal, and resettlement relating to each work of Comprehensive Treatment Project in Bayannaoer include:
(1) Leaders’ Team of Municipal Project Coordination Teams
(2) Office of Leaders’ Team of Municipal Project Coordination Teams
(3) Project Office of banner (county) affected by this Project
(4) Owner’s organization
(5) Villagers’ Committee and sub-villages
(6) Independent outsider supervision and evaluation institute
2) Constitution and duty of each department
A. Leaders’ Team of Municipal Project Coordination Teams
For the purpose to strengthen the tasks of Comprehensive Treatment Project and to promote the approval and implementation of this Project, the municipal government decides, according to the change of leaders of municipal government of project member organizations, that the Project Coordination Leadership Team (“Leadership Team”) set up pursuant to original Ba Zheng Ba Zi [2006] No. 355 file will be adjusted. The Leadership Team is the decision-making body of this Project will make decision on all material issues. Its main duties are:
y� Determine the construction scale, contents of this Project according to the demands of social and economic development of whole city;
y� Give instruction to the performance of activities such as project application, project verification and project implementation according to the requirements of project invested by domestic and foreign investors;
y� Coordinate with each member organization of this Project to complete the preliminary work and the construction, management and operation of this Project;
y� Be responsible for the verification and approval of construction schemes, the award of commencement order, and the acceptance of this Project;
y� Be responsible for the financing and repayment of loans and other material decisions.
The Leadership Team will hold at least one working meeting per half year to discuss and make decision on relevant issues.
B. Office of Project Coordination Leadership Team
Office of Project Leadership Team will be established. The Office will be located in Hetao Water Group and includes general office, administrative department, financial department, engineering and technical department, tendering and purchase department. Duties of each department will be defined clearly and the responsibility system of special personnel will be applied. The main duties of Owners' Office are:
y� Carry out the decision of Project Leadership Team and organize the promotion activities of this Project;
y� Coordinate with each member organization to carry out the project application and verification, and organize the implementation of detailed tasks;
y� Report to Leadership Team in regular or irregular manner.
C. Project Office of banner (county) affected by this Project
The principal leaders of each banner (county)’ people’s government will be take charge of the Project Office of each banner (county) affected. All of them will be located in water authority. Members include the leaders of water bureau, development and reform commission, construction bureau, land administrative bureau and relevant townships and towns. The main duties are to assist in the implementation of this Project, coordinate and solve relevant major issues.
(4) Owner’s organization
The duties of Owner's organization concerning land expropriation, removal and resettlement include:
y� Authorize design institute to define the area affected by Project, and authorize local resettlement authorities to conduct social and economical investigation and statistics, and storage of data;
y� Be responsible for the financing of resettlement funds and transfer of funds;
y� Prepare activities and schedule of implementation of resettlement;
y� Guide, coordinate and supervise each resettlement authority to implement the resettlement plans as required in “Resettlement Plans”;
y� Coordinate the inner supervision activities and preparation of reports;
y� Coordinate the outside supervision activities.
E. Villagers’ Committee and sub-villages
The main leaders of Villagers’ Committee and sub-villages will form a resettlement working group. Its main duties include:
y� Participate in social, economical investigation and the investigation of impact of Project;
y� Organize the public to consult and publicize the land expropriation and removal policies;
y� Afford help for households in hardship;
y� Select place for resettlement and arrange house site for households whose houses are removed;
y� Carry out the adjustment of land, and organize production and development and other resettlement activities;
y� Be responsible for management and distribution of funds;
y� Report the opinions and suggestions of immigrants to higher-level authorities;
y� Report the resettlement implementation progress.
F. Resettlement supervision and evaluation institutes
The outside independent supervision and evaluation work of this Project will be undertaken by the independent outsider supervision and evaluation institutes recognized by the Owner of this Project. Independent outsider supervision and evaluation institute will implement all supervision and evaluation tasks by providing technical help to relevant department and carrying out investigation on the migrants and the living standard of personnel affected by this Project. Their main duties include:
y� As an independent supervision institute, supervise the planning and implementation of resettlement and submit resettlement supervision and evaluation report to the Owner, and World Bank. This duty will be detailed in relevant chapters in Independent Outsider Supervision and Evaluation;
y� Provide technical consultancy concerning data investigation and treatment of inner supervision for Owner and other relevant departments.
y� Staffing
To safeguard the smooth implementation of this Project and resettlement tasks, large number of material and human resource has been input by Bayannaoer People’s Government, people’s
governments of relevant banner (county) and Owner of this Project. Resettlement teams have been established and relevant personnel have been staffed.
10.2.7.2 Intercommunication between different departments
During the land expropriation, removal and resettlement process, each resettlement department will enter into authorization contracts or agreements to define the working contents and duties of each department. Execution of authorization contract/agreement will be made as follow:
y� Owner of this Project enters into “Agreement on Land Expropriation, Removal and Resettlement” with project office of each banner (county) of Bayannaoer respectively;
y� Owner of this Project enters into “Contract of Independent Supervision and Evaluation Tasks Concerning Resettlement" with outsider supervision and evaluation institutes;
y� Project office of each banner (county) enters into “Agreement on Land Expropriation, Removal and Resettlement” with Villagers’ Committee;
y� Villagers’ Committee enters into “Resettlement Compensation Agreement" with transmigrated households.
11 Abstracts of Environmental Management Plan 11.1 Environmental Management System As the main body in charge of the administrative management and administrative enforcement of law in respect to environmental protection throughout the country, the Ministry of Environmental Protection supervises the implementation of this project; as the competent administrative department of the natural reserve, national forestry sector supervises and administrates the protection of this natural reserve in the course of project implementation. According to the spirit of the administration authority as prescribed by the Law of Environmental Protection of the People’s Republic of China and Regulations on the Administration of Construction Project Environmental Protection, the Environment Appraisal Report of this project shall be examined and approved by Department of Environmental Protection of Inner Mongolia Autonomous Region. Bayannaoer Municipal Bureau of Environmental Protection is the environment supervision institution for this project and its main functions are to propose the environmental protection requirements in accordance with the contents of Environmental Impact Assessment Statement of this project, to harmonize the administrations of environmental protection among various departments, and to take charge of organization of the Three Simultaneous check and acceptance for environmental-protection facilities; Bayannaoer Municipal Bureau of Forestry and Wulateqianqi County Bureau of Forestry are responsible for the supervision and administration of the Natural Reserve. Under the general framework of the administrative management institutions for this project, Bayannaoer WB Loan Project Office, under the leadership of Bayannaoer Municipal Government, takes charge of the management of implementation of the entire project; below the WB Loan Project Office, the project employers carry out the sub-projects if their own. In order to ensure the smooth implementation of the environmental management activities of this project, several full-time or part-time environmental management personnel has been set up among the WB Loan Project Office, the project employers, the contractors and operators to specifically carry out EMP. Bayannaoer WB Loan Project Office is responsible for the planning and design of this project as well as the provision of superintendence to the environmental protection of this project according to the procedures; organizes and develops skills training for the environmental management personnel of this project all over the region and carries out the project implementation schemes and various technical standards. Bureaus of Environmental Protection and Bureaus of Forestry at the level of Municipality and Banner/County are mainly responsible for the daily supervision for the environmental management of this project; the Environment Monitoring Stations of Banner/County accept the commission of the project employers to be in charge of the monitoring of the environmental quality within the project region during the construction and operation of the projects; environment supervising engineers entrusted by the project employers are responsible for the environment supervision during the construction of the projects. The project employers are planning to appoint dedicated environmental management personnel to take the charge of the environmental management for their own projects at various stages, to follow out environmental protection laws and regulations as well as the schemes, to inspect the implementation of the environmental solutions for their own projects, to promote the application of advanced technologies and experiences with regard to environmental protection, to organize to engage in the training of environmental protection technology for relevant personnel working for the sub-projects to raise the overall quality of such personnel. Since the contents in respect to the environmental management between the period of project construction and the operation period vary considerably and the working hours of such two circumstances have the differences between the provisionality and the protracted nature, the contractors and operators shall respectively establish organizational institutions according to various stages in a manner of staging responsibility. When completion of the construction period, relevant administrative organizations shall be revoked, while the administrative organizations within the operation period shall start operation, during which a certain amount of overlapping time intervals are allowed according to specific work circumstances. Schematic Diagram of Organizational Institution is shown in Fig11.1-1 and Scheme for Environmental Management and Supervision of the projects is shown in Table 11.1-1.
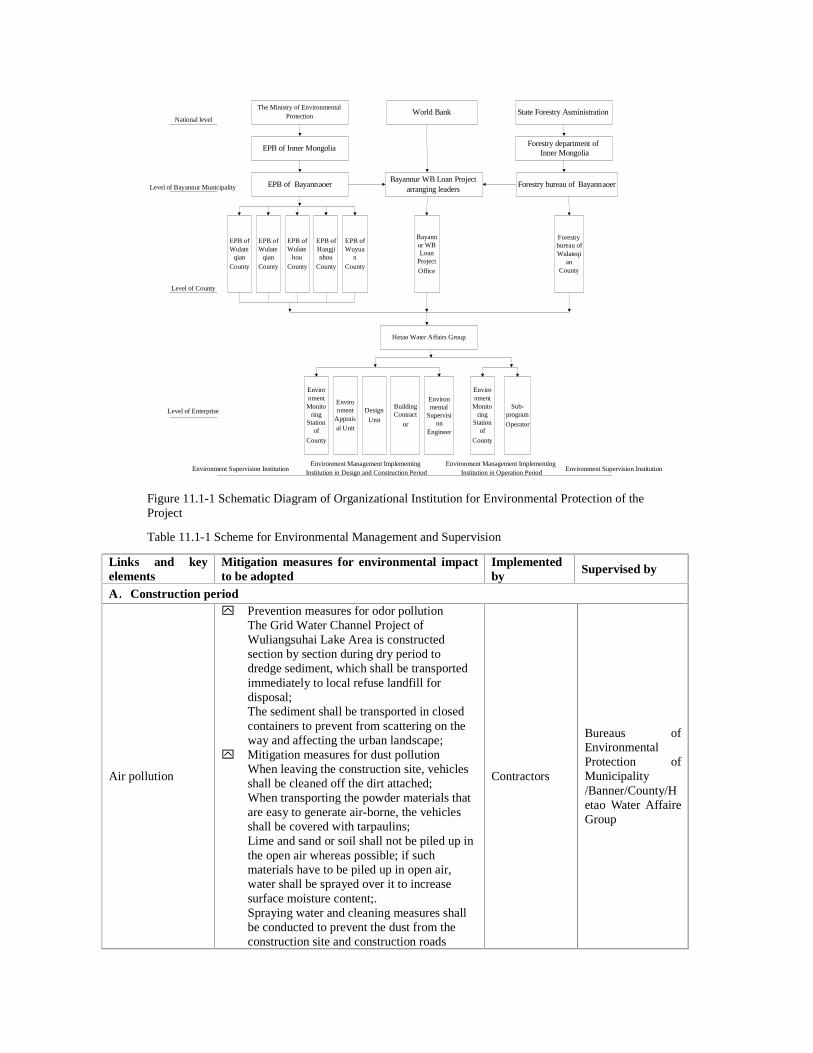
The Ministry of Environmental Protection
EPB of Inner Mongolia
EPB of Bayannaoer
World Bank
Bayannur WB Loan Projectarranging leaders
Bayannur WB Loan
Project
Office
EPB of Wuyua
n County
EPB of Wulate
qian County
EPB of Wulate
qian County
EPB of Wulate
hou County
EPB of Hangjinhou
County
Hetao Water Affairs Group
Environment Monito
ring Station
of
County
Environment
Appraisal Unit
Design
Unit
Building Contract
or
Environmental
Supervision
Engineer
Environment Monito
ring Station
of
County
Sub-program
Operator
National level
Level of Bayannur Municipality
Level of County
Level of Enterprise
Environment Supervision Institution Environment Management Implementing
Institution in Design and Construction PeriodEnvironment Management Implementing
Institution in Operation Period
Forestry bureau of Bayannaoer
Forestry bureau of Wulateqi
an County
State Forestry Asministration
Forestry department of Inner Mongolia
Environment Supervision Institution
Figure 11.1-1 Schematic Diagram of Organizational Institution for Environmental Protection of the Project
Table 11.1-1 Scheme for Environmental Management and Supervision
Links and key elements
Mitigation measures for environmental impact to be adopted
Implemented by
Supervised by
A Construction period
Air pollution
y� Prevention measures for odor pollution The Grid Water Channel Project of Wuliangsuhai Lake Area is constructed section by section during dry period to dredge sediment, which shall be transported immediately to local refuse landfill for disposal; The sediment shall be transported in closed containers to prevent from scattering on the way and affecting the urban landscape;
y� Mitigation measures for dust pollution When leaving the construction site, vehicles shall be cleaned off the dirt attached; When transporting the powder materials that are easy to generate air-borne, the vehicles shall be covered with tarpaulins; Lime and sand or soil shall not be piled up in the open air whereas possible; if such materials have to be piled up in open air, water shall be sprayed over it to increase surface moisture content;. Spraying water and cleaning measures shall be conducted to prevent the dust from the construction site and construction roads
Contractors
Bureaus of Environmental Protection of Municipality /Banner/County/Hetao Water Affaire Group
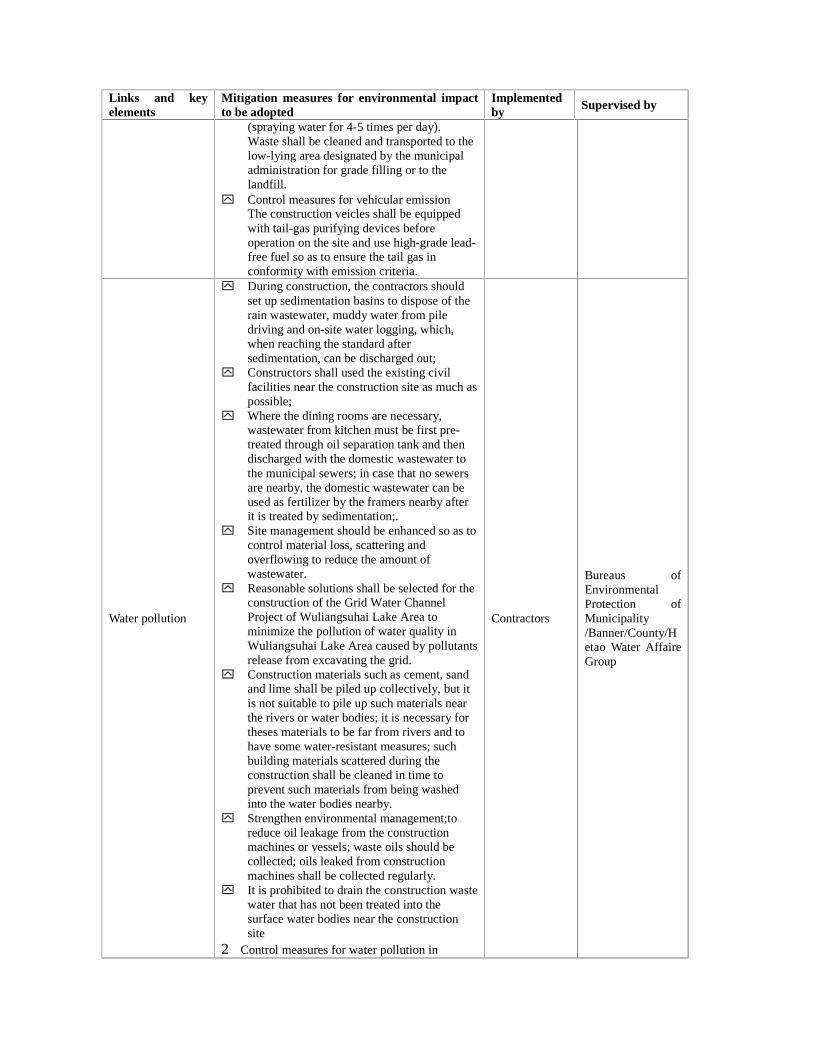
Links and key elements
Mitigation measures for environmental impact to be adopted
Implemented by
Supervised by
(spraying water for 4-5 times per day). Waste shall be cleaned and transported to the low-lying area designated by the municipal administration for grade filling or to the landfill.
y� Control measures for vehicular emission The construction veicles shall be equipped with tail-gas purifying devices before operation on the site and use high-grade lead-free fuel so as to ensure the tail gas in conformity with emission criteria.
Water pollution
y� During construction, the contractors should set up sedimentation basins to dispose of the rain wastewater, muddy water from pile driving and on-site water logging, which, when reaching the standard after sedimentation, can be discharged out;
y� Constructors shall used the existing civil facilities near the construction site as much as possible;
y� Where the dining rooms are necessary, wastewater from kitchen must be first pre-treated through oil separation tank and then discharged with the domestic wastewater to the municipal sewers; in case that no sewers are nearby, the domestic wastewater can be used as fertilizer by the framers nearby after it is treated by sedimentation;.
y� Site management should be enhanced so as to control material loss, scattering and overflowing to reduce the amount of wastewater.
y� Reasonable solutions shall be selected for the construction of the Grid Water Channel Project of Wuliangsuhai Lake Area to minimize the pollution of water quality in Wuliangsuhai Lake Area caused by pollutants release from excavating the grid.
y� Construction materials such as cement, sand and lime shall be piled up collectively, but it is not suitable to pile up such materials near the rivers or water bodies; it is necessary for theses materials to be far from rivers and to have some water-resistant measures; such building materials scattered during the construction shall be cleaned in time to prevent such materials from being washed into the water bodies nearby.
y� Strengthen environmental management;to reduce oil leakage from the construction machines or vessels; waste oils should be collected; oils leaked from construction machines shall be collected regularly.
y� It is prohibited to drain the construction waste water that has not been treated into the surface water bodies near the construction site
2�Control measures for water pollution in
Contractors
Bureaus of Environmental Protection of Municipality /Banner/County/Hetao Water Affaire Group
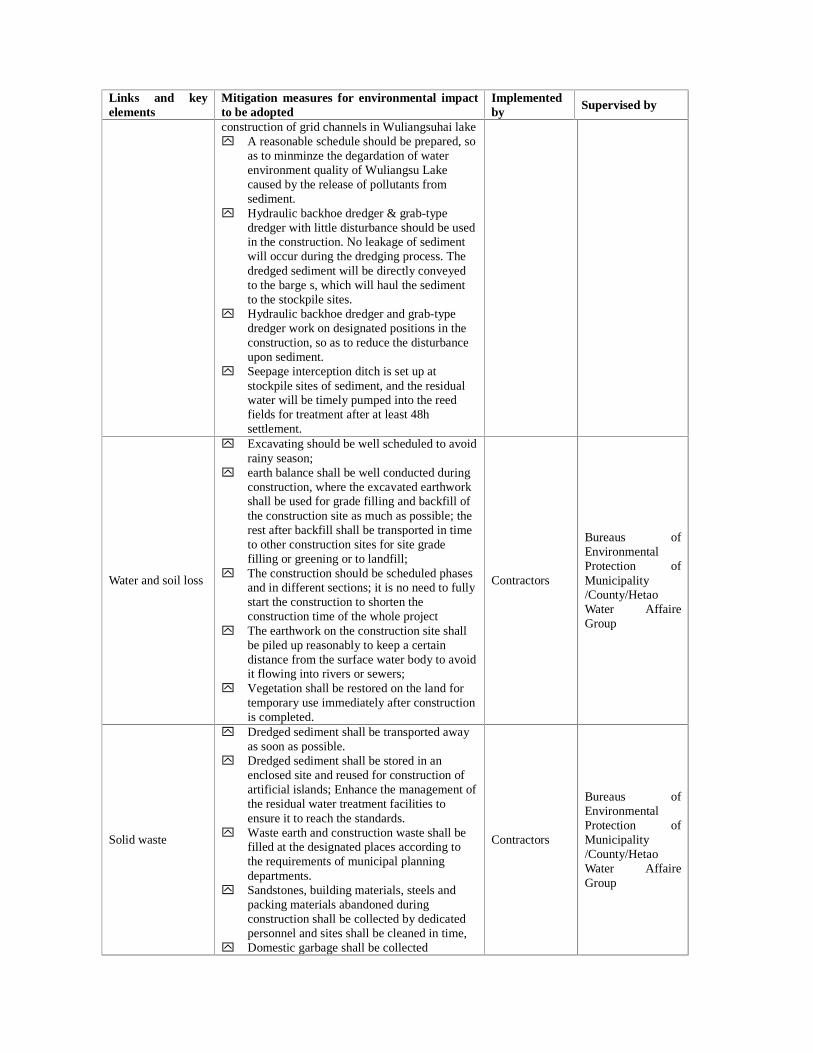
Links and key elements
Mitigation measures for environmental impact to be adopted
Implemented by
Supervised by
construction of grid channels in Wuliangsuhai lake y� A reasonable schedule should be prepared, so
as to minminze the degardation of water environment quality of Wuliangsu Lake caused by the release of pollutants from sediment.
y� Hydraulic backhoe dredger & grab-type dredger with little disturbance should be used in the construction. No leakage of sediment will occur during the dredging process. The dredged sediment will be directly conveyed to the barge s, which will haul the sediment to the stockpile sites.
y� Hydraulic backhoe dredger and grab-type dredger work on designated positions in the construction, so as to reduce the disturbance upon sediment.
y� Seepage interception ditch is set up at stockpile sites of sediment, and the residual water will be timely pumped into the reed fields for treatment after at least 48h settlement.
Water and soil loss
y� Excavating should be well scheduled to avoid rainy season;
y� earth balance shall be well conducted during construction, where the excavated earthwork shall be used for grade filling and backfill of the construction site as much as possible; the rest after backfill shall be transported in time to other construction sites for site grade filling or greening or to landfill;
y� The construction should be scheduled phases and in different sections; it is no need to fully start the construction to shorten the construction time of the whole project
y� The earthwork on the construction site shall be piled up reasonably to keep a certain distance from the surface water body to avoid it flowing into rivers or sewers;
y� Vegetation shall be restored on the land for temporary use immediately after construction is completed.
Contractors
Bureaus of Environmental Protection of Municipality /County/Hetao Water Affaire Group
Solid waste
y� Dredged sediment shall be transported away as soon as possible.
y� Dredged sediment shall be stored in an enclosed site and reused for construction of artificial islands; Enhance the management of the residual water treatment facilities to ensure it to reach the standards.
y� Waste earth and construction waste shall be filled at the designated places according to the requirements of municipal planning departments.
y� Sandstones, building materials, steels and packing materials abandoned during construction shall be collected by dedicated personnel and sites shall be cleaned in time,
y� Domestic garbage shall be collected
Contractors
Bureaus of Environmental Protection of Municipality /County/Hetao Water Affaire Group
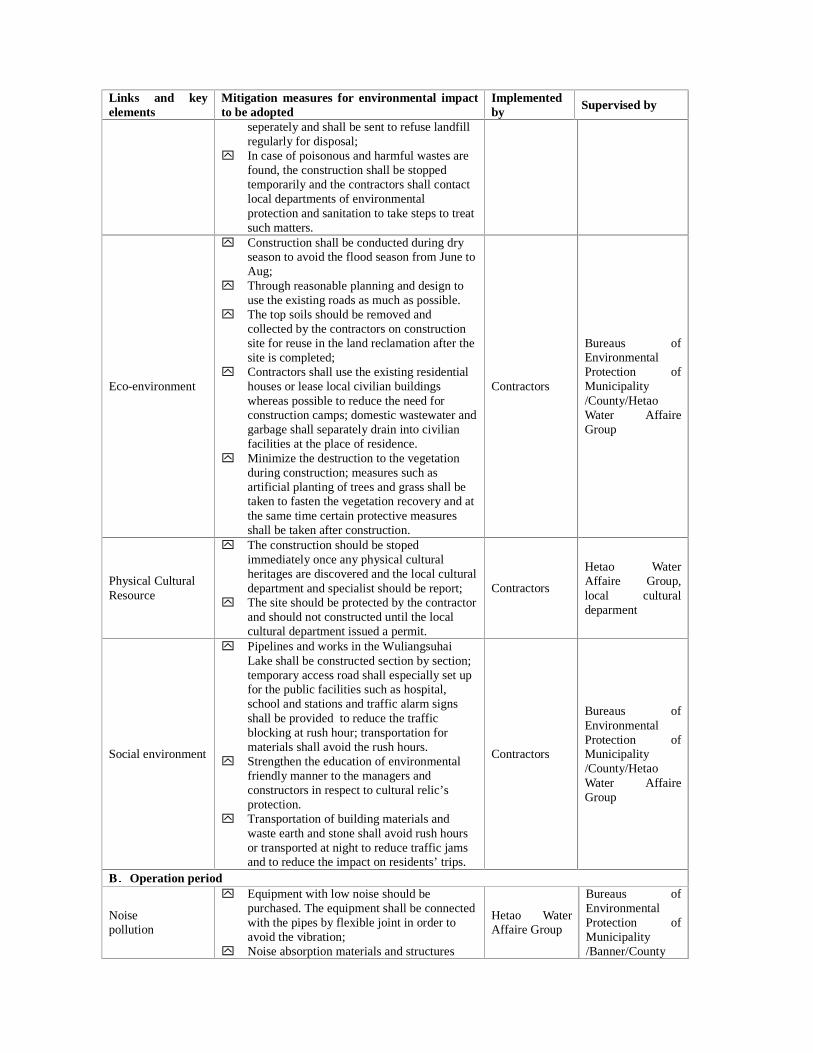
Links and key elements
Mitigation measures for environmental impact to be adopted
Implemented by
Supervised by
seperately and shall be sent to refuse landfill regularly for disposal;
y� In case of poisonous and harmful wastes are found, the construction shall be stopped temporarily and the contractors shall contact local departments of environmental protection and sanitation to take steps to treat such matters.
Eco-environment
y� Construction shall be conducted during dry season to avoid the flood season from June to Aug;
y� Through reasonable planning and design to use the existing roads as much as possible.
y� The top soils should be removed and collected by the contractors on construction site for reuse in the land reclamation after the site is completed;
y� Contractors shall use the existing residential houses or lease local civilian buildings whereas possible to reduce the need for construction camps; domestic wastewater and garbage shall separately drain into civilian facilities at the place of residence.
y� Minimize the destruction to the vegetation during construction; measures such as artificial planting of trees and grass shall be taken to fasten the vegetation recovery and at the same time certain protective measures shall be taken after construction.
Contractors
Bureaus of Environmental Protection of Municipality /County/Hetao Water Affaire Group
Physical Cultural Resource
y� The construction should be stoped immediately once any physical cultural heritages are discovered and the local cultural department and specialist should be report;
y� The site should be protected by the contractor and should not constructed until the local cultural department issued a permit.
Contractors
Hetao Water Affaire Group, local cultural deparment
Social environment
y� Pipelines and works in the Wuliangsuhai Lake shall be constructed section by section; temporary access road shall especially set up for the public facilities such as hospital, school and stations and traffic alarm signs shall be provided to reduce the traffic blocking at rush hour; transportation for materials shall avoid the rush hours.
y� Strengthen the education of environmental friendly manner to the managers and constructors in respect to cultural relic’s protection.
y� Transportation of building materials and waste earth and stone shall avoid rush hours or transported at night to reduce traffic jams and to reduce the impact on residents’ trips.
Contractors
Bureaus of Environmental Protection of Municipality /County/Hetao Water Affaire Group
B Operation period
Noise pollution���
y� Equipment with low noise should be purchased. The equipment shall be connected with the pipes by flexible joint in order to avoid the vibration; ���
y� Noise absorption materials and structures
Hetao Water Affaire Group
Bureaus of Environmental Protection of Municipality /Banner/County
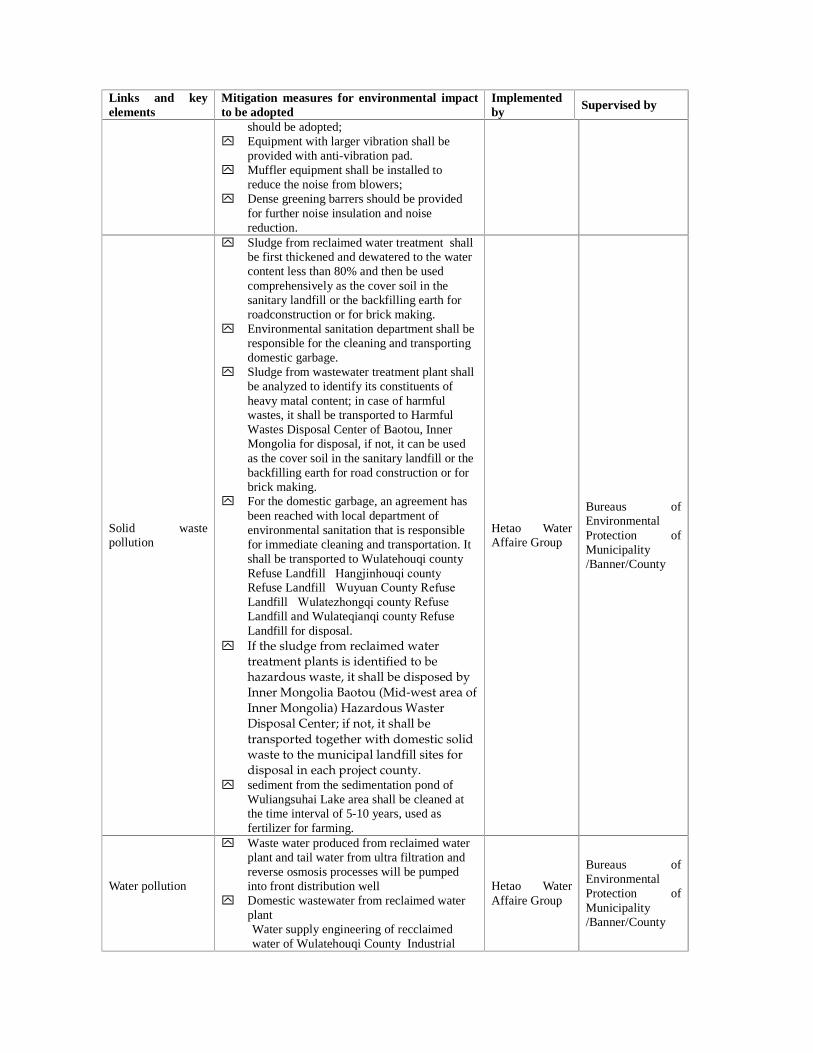
Links and key elements
Mitigation measures for environmental impact to be adopted
Implemented by
Supervised by
should be adopted; ��� y� Equipment with larger vibration shall be
provided with anti-vibration pad. ��� y� Muffler equipment shall be installed to
reduce the noise from blowers;��� y� Dense greening barrers should be provided
for further noise insulation and noise reduction. ���
Solid waste pollution ���
y� Sludge from reclaimed water treatment shall be first thickened and dewatered to the water content less than 80% and then be used comprehensively as the cover soil in the sanitary landfill or the backfilling earth for roadconstruction or for brick making. �
y� Environmental sanitation department shall be responsible for the cleaning and transporting domestic garbage. ���
y� Sludge from wastewater treatment plant shall be analyzed to identify its constituents of heavy matal content; in case of harmful wastes, it shall be transported to Harmful Wastes Disposal Center of Baotou, Inner Mongolia for disposal, if not, it can be used as the cover soil in the sanitary landfill or the backfilling earth for road construction or for brick making. �
y� For the domestic garbage, an agreement has been reached with local department of environmental sanitation that is responsible for immediate cleaning and transportation. It shall be transported to Wulatehouqi county Refuse Landfill�Hangjinhouqi county Refuse Landfill�Wuyuan County Refuse Landfill�Wulatezhongqi county Refuse Landfill and Wulateqianqi county Refuse Landfill for disposal.���
y� If the sludge from reclaimed water treatment plants is identified to be hazardous waste, it shall be disposed by Inner Mongolia Baotou (Mid-west area of Inner Mongolia) Hazardous Waster Disposal Center; if not, it shall be transported together with domestic solid waste to the municipal landfill sites for disposal in each project county.�
y� sediment from the sedimentation pond of Wuliangsuhai Lake area shall be cleaned at the time interval of 5-10 years, used as fertilizer for farming. �
Hetao Water Affaire Group
Bureaus of Environmental Protection of Municipality /Banner/County
Water pollution ��
y� Waste water produced from reclaimed water plant and tail water from ultra filtration and reverse osmosis processes will be pumped into front distribution well �
y� Domestic wastewater from reclaimed water plant� Water supply engineering of recclaimed water of Wulatehouqi County Industrial
Hetao Water Affaire Group
Bureaus of Environmental Protection of Municipality /Banner/County
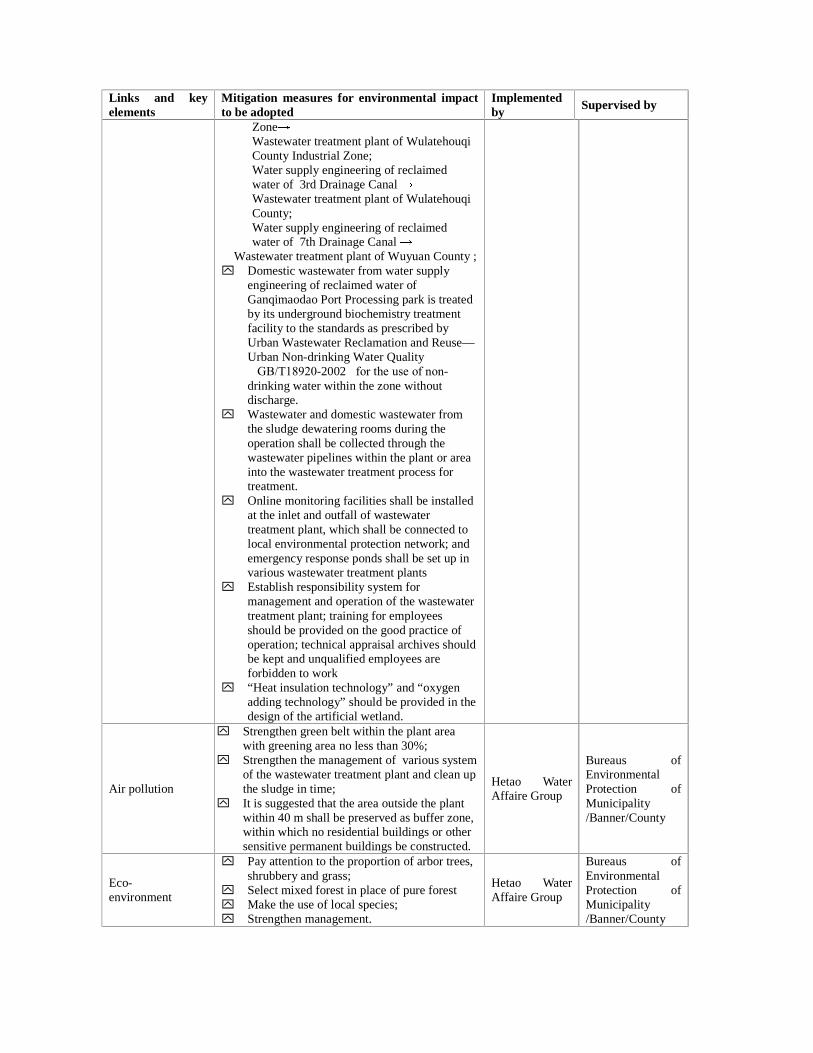
Links and key elements
Mitigation measures for environmental impact to be adopted
Implemented by
Supervised by
Zone Wastewater treatment plant of Wulatehouqi County Industrial Zone; Water supply engineering of reclaimed water of 3rd Drainage Canal Wastewater treatment plant of Wulatehouqi County; Water supply engineering of reclaimed water of 7th Drainage Canal
Wastewater treatment plant of Wuyuan County ; y� Domestic wastewater from water supply
engineering of reclaimed water of Ganqimaodao Port Processing park is treated by its underground biochemistry treatment facility to the standards as prescribed by Urban Wastewater Reclamation and Reuse—Urban Non-drinking Water Quality �GB/T18920-2002�for the use of non-drinking water within the zone without discharge.
y� Wastewater and domestic wastewater from the sludge dewatering rooms during the operation shall be collected through the wastewater pipelines within the plant or area into the wastewater treatment process for treatment. �
y� Online monitoring facilities shall be installed at the inlet and outfall of wastewater treatment plant, which shall be connected to local environmental protection network; and emergency response ponds shall be set up in various wastewater treatment plants �
y� Establish responsibility system for management and operation of the wastewater treatment plant; training for employees should be provided on the good practice of operation; technical appraisal archives should be kept and unqualified employees are forbidden to work �
y� “Heat insulation technology” and “oxygen adding technology” should be provided in the design of the artificial wetland.
Air pollution�
y� Strengthen green belt within the plant area with greening area no less than 30%;
y� Strengthen the management of various system of the wastewater treatment plant and clean up the sludge in time;
y� It is suggested that the area outside the plant within 40 m shall be preserved as buffer zone, within which no residential buildings or other sensitive permanent buildings be constructed.
Hetao Water Affaire Group
Bureaus of Environmental Protection of Municipality /Banner/County
Eco-environment��
y� Pay attention to the proportion of arbor trees, shrubbery and grass;
y� Select mixed forest in place of pure forest y� Make the use of local species; y� Strengthen management.
Hetao Water Affaire Group
Bureaus of Environmental Protection of Municipality /Banner/County
Note: �Component of Reclaimed Water Supply; � Component of Wastewater Treatment and Reuse within Industrial Processing Parks; �Treatment project of Wuliangsuhai Lake Area
11.1.1 Organization of Environmental Protection in Construction Period 1) Wetland Management The Inner Mongolia Autonomous Region government and the organization committee of Bayannaoer city have jointly pproved the establishment of the Wulate National Level Natural Reserves Administration( directly supervised under the Bayannaoer Forestry Bureau and sub-set the Wuliangsuhai Lake Wetland Waterfowl Natural Reserves Management Station. Its main fuctions related to the screening, approval and supervision and evaluation of any schemes to be developed and impelmented within the natural reserve are as follows:
y� The Bayannaoer Forestry Bureau has approved the management plan for the Wuliangsuhai Nature Reserve submitted by the Administration of the Reserve which will guide and review the whole process of development and implementation and evaluation of any projects within the management zone;
y� The Administration of the Wuliangsuhai Lake Nature Reserve is in charge of the daily management of the reserve and organize the project development within the management zone which are to be developed in line with relevant national and local regulations;
y� The Bayannaoer Forestry Bureau and the Bayannaoer Reform and Development Bureau will jointly organize an expert panel to review and appraise any project to be developed within the management zone, including all of the design documents, including the feasibility study report and the preliminary design;
y� The Administration of the Wuliangsuhai Lake Nature Reserve will be responsible for the management of the project implementation including the environemntal management and supervision and preparation of the completion report of the project;
y� The Bayannaoer Forestry Bureau is responsible for review and evaluation of the completion of the project.
2) Organization Technical level: on the technical level of environmental management, the municipal project office will employ five experts for project management. Project office level: the municipal project office will send an environment manager for the project, who will supervise implementation of environmental management plan and be liable for all the issues related to the World Bank and the environment. The project office of county/banner shall be staffed with one environment manager, who is liable for the implementation of environmental management plan of the project in its area and the communication on relevant environment issues with the municipal project office. Contractor level: one or two environment managing coordinators will be provided by itself, liable for supervising the implementation of environmental protection measures in construction period, and negotiating with surrounding residents for resolving environment issue and communicating with the project office and environment authorities. Operator level: each enterprise is set up with an environmental managing division comprising two full-time environmental protection engineers. Other employees of the corporation will assist these two engineers in carrying out the environmental management in operation period. The corporation will provide Internet, telephone and other communication facilities for keeping in touch with the environmental management authorities.
The level of environment supervising engineer: each project employer will employ one environment supervising engineer for the project, who will present field supervision on the site in the construction period.
3) Position and Liability A. Technical Environment Expert Technical environment expert, the technical support of local project office will track the whole course of the project in the first six months and offer regular service of two weeks quarterly within four years after the project implemented. Technical environment expert will ensure that all compulsory requirements are met when the project starts and environmental management rules effectively implemented in conformity with the environment laws and regulations and the safety rules of the World Bank. y� Provide necessary training for environment managers of project office, and environmental
managing personnel & environment supervising engineers of contractor and operator. y� Offer expert consulting service for project office, employer, contractor and operator. y� Assist environmental managing personnel of enterprise in organizing monitoring activities. B. Project office: Environment Manager The municipal project office, Hangjin Banner, Wulatehouqi County, Wulatezhongqi County, Wulatehouqi County and Wuyuan County each are set up with one environment manager. The environment manager of the municipal project office is the expert liable for reporting to WB and supervising project environment. Environment manager of project office of banner/county is liable for the supervision of local project and reporting to the municipal project office. Environment manager will assist land authorities and immigration authorities in preventing the above-said from obstructing the implementation of the project, with liabilities as follows: y� Provide training for managers in charge of environmental management with the help of assistant. y� Define monitoring plan with the help of assistant. y� Communicate with managers in chare of environmental management and construction workers,
with methods as follows: —Provide regular monitoring report for project office and the World Bank monthly. —Provide special non-conformity report in case of the 2nd and 3rd cases; —Communicate orally with the staff of construction unit and operating unit and jointly define a
solution proposal in case of any solution to the problem available; —Present remedy measures with environmental managing engineer and the manager in charge
of environmental management jointly in case of non-conformity y� Attend the joint meeting that the environment engineers of the project office and manager in
charge of environmental management of the corporation, construction unit and operating unit take part in.
y� Coordinate the communication & report of environmental management experts with the World Bank.
C. Project Employer: environment manager coordinator EMC The employer is provided with EMC liable for environment monitoring, who reports environmental protection implementation of the construction unit and operating unit to the project office of banner/county and governmental institutions. Detailed liabilities of EMC are as follows: y� Compile the detailed rules on environmental protection, and detailed monitoring rules and
environmental protection procedures of construction unit and operating unit, and collect the outlines of managing and design personnel of the project on the preliminary stage of the project with the help of technical assistant.
y� Authorize the items in need of special equipments for monitoring, such as air, water environment quality monitoring.
y� Provide monthly monitoring update for project office, implementation of the project and feasibility study and the remedy measures. Organize meetings with the project office for reporting project monitoring, and discuss conformity of the project.
y� Select experts and counselors from the universities and institutions for consulting on training
methodology and technology as per the demands. y� Organize the special study and public survey related to special building requirement or
compulsory alteration according to the actual situation of the project. y� Report solution and emergency handling measures to environment manager of the project office
and environment supervising authorities in case of any non-conformity with the feasibility study report.
y� Information Disclosure through Meeting and Local Media. D. environment supervising engineer Environment supervising engineer is mainly responsible for architectural engineering activities of the supervising party and other related activities such as land occupation and resident relocation. It’ll guarantee that the above-said activities comply with the environmental protection requirement, environmental protection investment and protection target. It’s liable for coordinating the land authorities, migration and relocation authorities and environment monitoring & control authorities on the site. The main liabilities of environment supervising engineer are as follows: y� Ensure the implementation of all project licenses and requirements and environmental
management plans before commencement of the project. y� Check and verify that all employees of construction unit and operating unit have implemented
environmental protection measures as per the contract. y� Compile standard report statements on monthly remuneration as per their qualification in light of
the contribution of construction unit and operating unit to environmental protection activities of the project.
y� Compile the documents on environmental protection monitoring. y� Identify the case in need of special study and activity, communicate with EMC, and implement
effective special measures regularly. y� Communicate with the construction personnel for explaining the field environment requirement;
provide proposal on remedy measures, offer some remedy measures for the items not in conformity with the original purpose of the project; and issue very formal guide to construction unit and operating unit as required.
y� Communicate with the construction unit, operating unit and building consultant for strengthening information exchange; obtain some other points of view on special issues for the purpose of rapidly feeding back some problem in the construction to the building managing engineer so as to facilitate solution of the problem; and shutdown should be immediately applied for in case that the project causes potential damage to sensitive targets or serious non-conformity case in the existence of the project.
y� Communicate with building supervising engineer of the project and the building workers; compile regular monitoring weekly update; compile records on non-conformity, and bring forward remedy measures with project designer if necessary in case of non-conformity of the project with the design.
11.1.2 Environmental Management Organ in Operation Period Project operator will have a special-purpose environmental management division that is liable for the implementation of the environmental management plan in operation period. Detailed liabilities of the environmental management division are: y� Manage the implementation of environmental protection measures of the project; y� Coordinate relevant environment problem with environment authorities and surrounding
residents; y� Authorize monitoring station of banner/county for regular monitoring of three wastes discharged
by the facilities of the project and environment quality in the region; y� Implement emergency handling of the environment risk in case of any environment risk; y� Report environmental management-related information of enterprise in time to Bureau of
Environmental Protection of the Prefecture/Municipality and provincial project office; y� Be liable for sorting out the environmental management archives of enterprise and putting in
archives. 11.1.3 Schedule of Environmental Management Institutions for Sub-projects Configuration of the environmental management institutions for sub-projects is shown in Table11.1-2
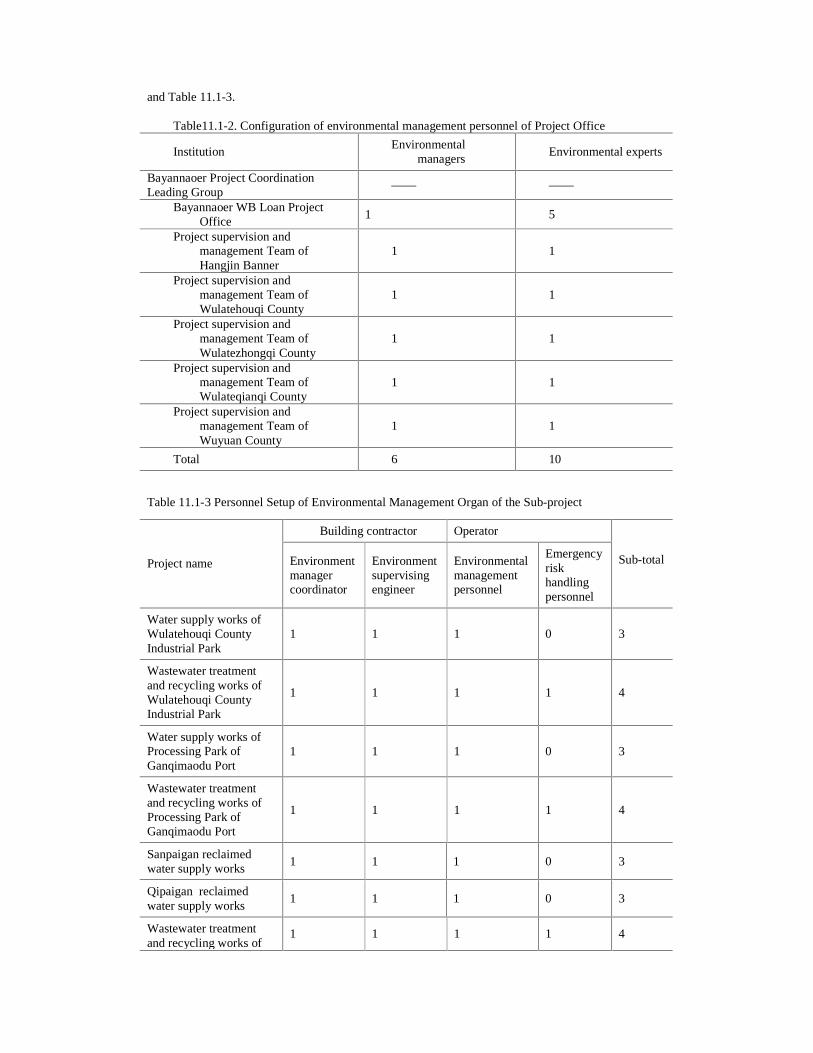
and Table 11.1-3.
Table11.1-2. Configuration of environmental management personnel of Project Office
Institution Environmental
managers Environmental experts
Bayannaoer Project Coordination Leading Group
—— ——
Bayannaoer WB Loan Project Office
1 5
Project supervision and management Team of Hangjin Banner
1 1
Project supervision and management Team of Wulatehouqi County
1 1
Project supervision and management Team of Wulatezhongqi County
1 1
Project supervision and management Team of Wulateqianqi County
1 1
Project supervision and management Team of Wuyuan County
1 1
Total 6 10
Table 11.1-3 Personnel Setup of Environmental Management Organ of the Sub-project
Building contractor Operator
Project name Environment manager coordinator
Environment supervising engineer
Environmental management personnel
Emergency risk handling personnel
Sub-total
Water supply works of Wulatehouqi County Industrial Park
1 1 1 0 3
Wastewater treatment and recycling works of Wulatehouqi County Industrial Park
1 1 1 1 4
Water supply works of Processing Park of Ganqimaodu Port
1 1 1 0 3
Wastewater treatment and recycling works of Processing Park of Ganqimaodu Port
1 1 1 1 4
Sanpaigan reclaimed water supply works
1 1 1 0 3
Qipaigan reclaimed water supply works
1 1 1 0 3
Wastewater treatment and recycling works of
1 1 1 1 4
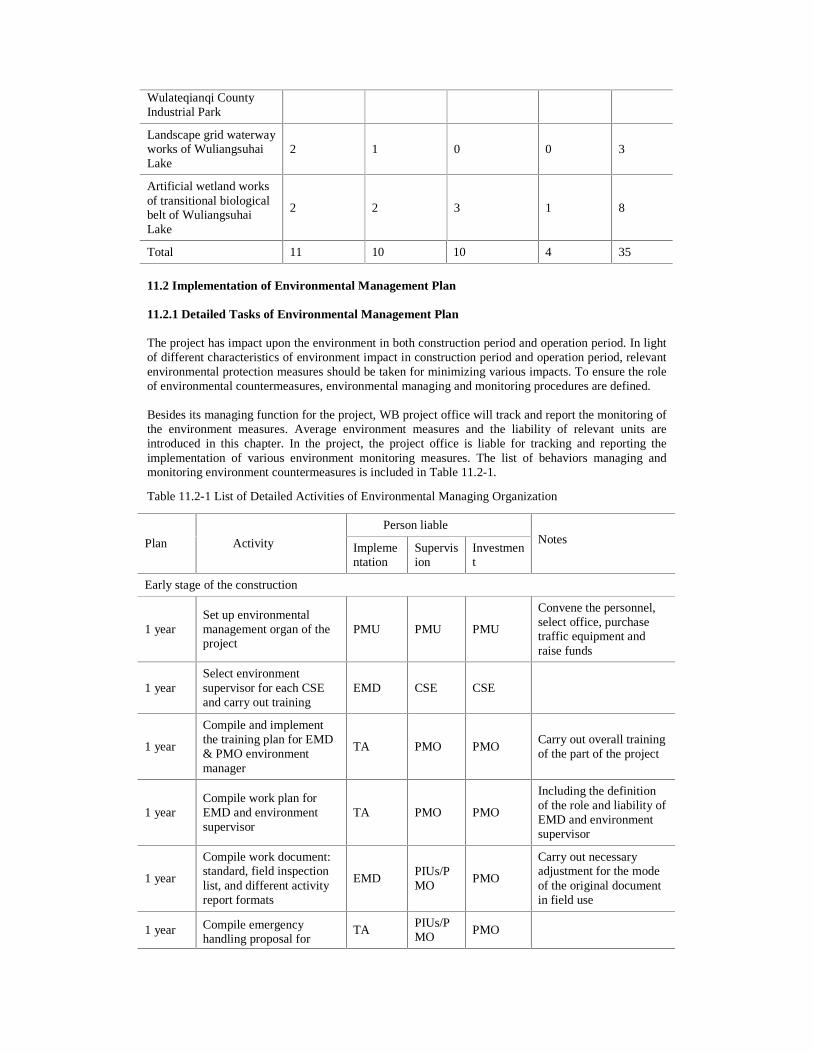
Wulateqianqi County Industrial Park
Landscape grid waterway works of Wuliangsuhai Lake
2 1 0 0 3
Artificial wetland works of transitional biological belt of Wuliangsuhai Lake
2 2 3 1 8
Total 11 10 10 4 35
11.2 Implementation of Environmental Management Plan 11.2.1 Detailed Tasks of Environmental Management Plan The project has impact upon the environment in both construction period and operation period. In light of different characteristics of environment impact in construction period and operation period, relevant environmental protection measures should be taken for minimizing various impacts. To ensure the role of environmental countermeasures, environmental managing and monitoring procedures are defined. Besides its managing function for the project, WB project office will track and report the monitoring of the environment measures. Average environment measures and the liability of relevant units are introduced in this chapter. In the project, the project office is liable for tracking and reporting the implementation of various environment monitoring measures. The list of behaviors managing and monitoring environment countermeasures is included in Table 11.2-1.
Table 11.2-1 List of Detailed Activities of Environmental Managing Organization
Person liable
Plan Activity Implementation
Supervision
Investment
Notes
Early stage of the construction
1 year Set up environmental management organ of the project
PMU PMU PMU
Convene the personnel, select office, purchase traffic equipment and raise funds
1 year Select environment supervisor for each CSE and carry out training
EMD CSE CSE
1 year
Compile and implement the training plan for EMD & PMO environment manager
TA PMO PMO Carry out overall training of the part of the project
1 year Compile work plan for EMD and environment supervisor
TA PMO PMO
Including the definition of the role and liability of EMD and environment supervisor
1 year
Compile work document: standard, field inspection list, and different activity report formats
EMD PIUs/PMO
PMO
Carry out necessary adjustment for the mode of the original document in field use
1 year Compile emergency handling proposal for EMD
TA PIUs/PMO
PMO
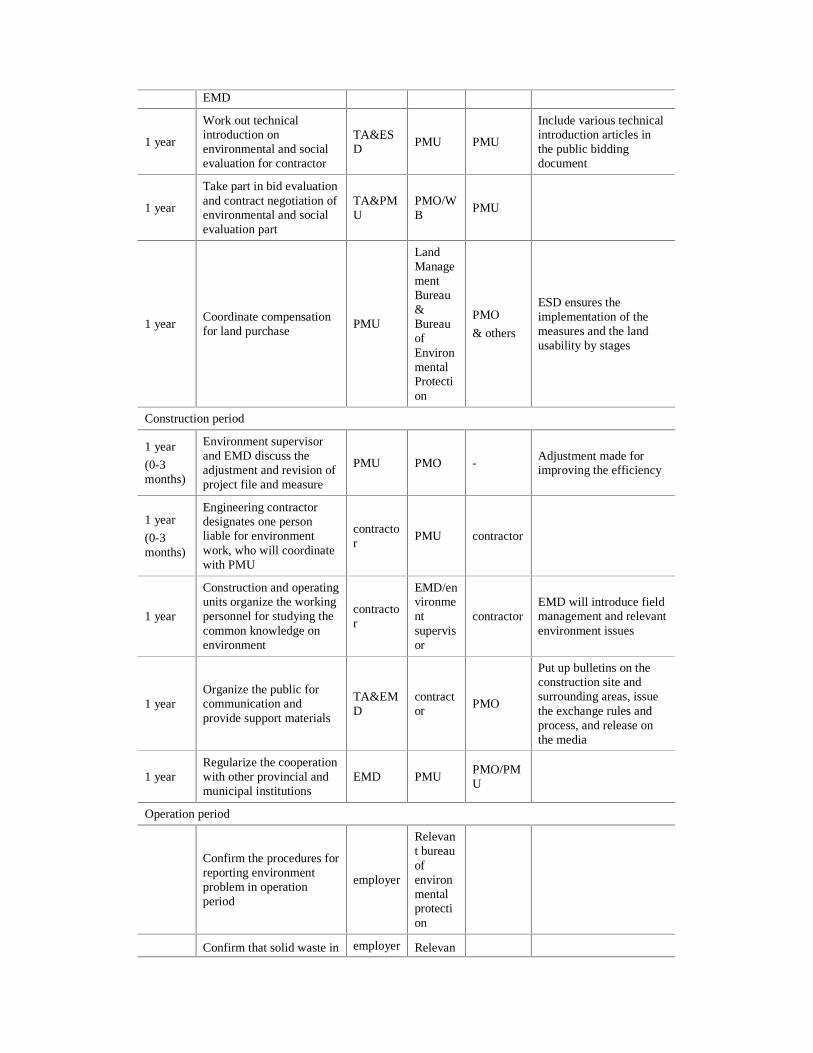
EMD
1 year
Work out technical introduction on environmental and social evaluation for contractor
TA&ESD
PMU PMU
Include various technical introduction articles in the public bidding document
1 year
Take part in bid evaluation and contract negotiation of environmental and social evaluation part
TA&PMU
PMO/WB
PMU
1 year Coordinate compensation for land purchase
PMU
Land Management Bureau & Bureau of Environmental Protection
PMO
& others
ESD ensures the implementation of the measures and the land usability by stages
Construction period
1 year
(0-3 months)
Environment supervisor and EMD discuss the adjustment and revision of project file and measure
PMU PMO - Adjustment made for improving the efficiency
1 year
(0-3 months)
Engineering contractor designates one person liable for environment work, who will coordinate with PMU
contractor
PMU contractor
1 year
Construction and operating units organize the working personnel for studying the common knowledge on environment
contractor
EMD/environment supervisor
contractor EMD will introduce field management and relevant environment issues
1 year Organize the public for communication and provide support materials
TA&EMD
contractor
PMO
Put up bulletins on the construction site and surrounding areas, issue the exchange rules and process, and release on the media
1 year Regularize the cooperation with other provincial and municipal institutions
EMD PMU PMO/PMU
Operation period
Confirm the procedures for reporting environment problem in operation period
employer
Relevant bureau of environmental protection
Confirm that solid waste in the project is piled up
employer Relevant bureau
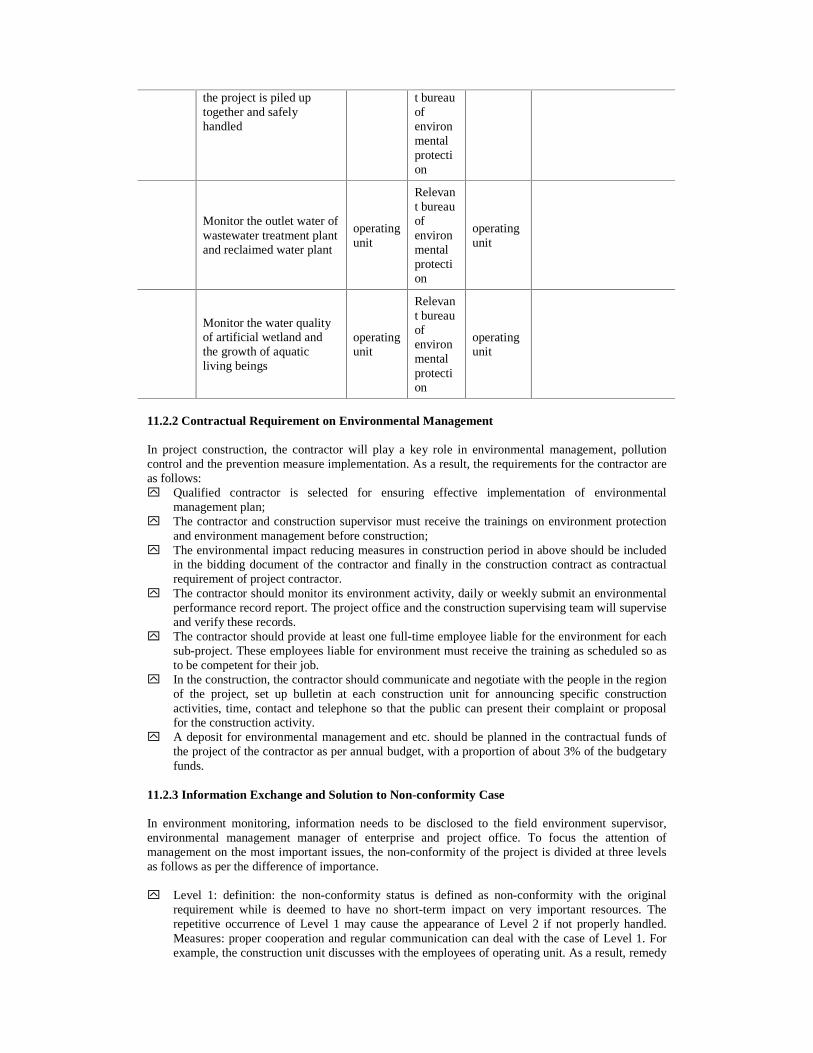
the project is piled up together and safely handled
t bureau of environmental protection
Monitor the outlet water of wastewater treatment plant and reclaimed water plant
operating unit
Relevant bureau of environmental protection
operating unit
Monitor the water quality of artificial wetland and the growth of aquatic living beings
operating unit
Relevant bureau of environmental protection
operating unit
11.2.2 Contractual Requirement on Environmental Management In project construction, the contractor will play a key role in environmental management, pollution control and the prevention measure implementation. As a result, the requirements for the contractor are as follows: y� Qualified contractor is selected for ensuring effective implementation of environmental
management plan; y� The contractor and construction supervisor must receive the trainings on environment protection
and environment management before construction; y� The environmental impact reducing measures in construction period in above should be included
in the bidding document of the contractor and finally in the construction contract as contractual requirement of project contractor.
y� The contractor should monitor its environment activity, daily or weekly submit an environmental performance record report. The project office and the construction supervising team will supervise and verify these records.
y� The contractor should provide at least one full-time employee liable for the environment for each sub-project. These employees liable for environment must receive the training as scheduled so as to be competent for their job.
y� In the construction, the contractor should communicate and negotiate with the people in the region of the project, set up bulletin at each construction unit for announcing specific construction activities, time, contact and telephone so that the public can present their complaint or proposal for the construction activity.
y� A deposit for environmental management and etc. should be planned in the contractual funds of the project of the contractor as per annual budget, with a proportion of about 3% of the budgetary funds.
11.2.3 Information Exchange and Solution to Non-conformity Case In environment monitoring, information needs to be disclosed to the field environment supervisor, environmental management manager of enterprise and project office. To focus the attention of management on the most important issues, the non-conformity of the project is divided at three levels as follows as per the difference of importance. y� Level 1: definition: the non-conformity status is defined as non-conformity with the original
requirement while is deemed to have no short-term impact on very important resources. The repetitive occurrence of Level 1 may cause the appearance of Level 2 if not properly handled. Measures: proper cooperation and regular communication can deal with the case of Level 1. For example, the construction unit discusses with the employees of operating unit. As a result, remedy
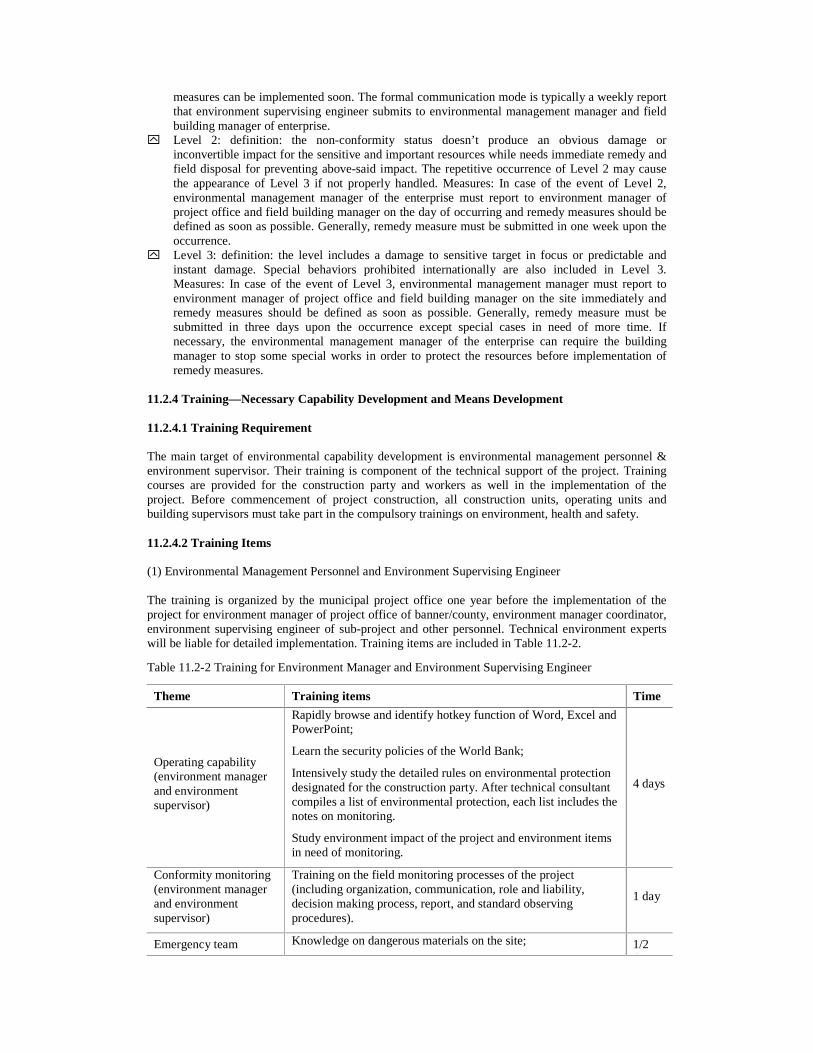
measures can be implemented soon. The formal communication mode is typically a weekly report that environment supervising engineer submits to environmental management manager and field building manager of enterprise.
y� Level 2: definition: the non-conformity status doesn’t produce an obvious damage or inconvertible impact for the sensitive and important resources while needs immediate remedy and field disposal for preventing above-said impact. The repetitive occurrence of Level 2 may cause the appearance of Level 3 if not properly handled. Measures: In case of the event of Level 2, environmental management manager of the enterprise must report to environment manager of project office and field building manager on the day of occurring and remedy measures should be defined as soon as possible. Generally, remedy measure must be submitted in one week upon the occurrence.
y� Level 3: definition: the level includes a damage to sensitive target in focus or predictable and instant damage. Special behaviors prohibited internationally are also included in Level 3. Measures: In case of the event of Level 3, environmental management manager must report to environment manager of project office and field building manager on the site immediately and remedy measures should be defined as soon as possible. Generally, remedy measure must be submitted in three days upon the occurrence except special cases in need of more time. If necessary, the environmental management manager of the enterprise can require the building manager to stop some special works in order to protect the resources before implementation of remedy measures.
11.2.4 Training—Necessary Capability Development and Means Development 11.2.4.1 Training Requirement The main target of environmental capability development is environmental management personnel & environment supervisor. Their training is component of the technical support of the project. Training courses are provided for the construction party and workers as well in the implementation of the project. Before commencement of project construction, all construction units, operating units and building supervisors must take part in the compulsory trainings on environment, health and safety. 11.2.4.2 Training Items (1) Environmental Management Personnel and Environment Supervising Engineer The training is organized by the municipal project office one year before the implementation of the project for environment manager of project office of banner/county, environment manager coordinator, environment supervising engineer of sub-project and other personnel. Technical environment experts will be liable for detailed implementation. Training items are included in Table 11.2-2.
Table 11.2-2 Training for Environment Manager and Environment Supervising Engineer
Theme Training items Time
Operating capability (environment manager and environment supervisor)
Rapidly browse and identify hotkey function of Word, Excel and PowerPoint;
Learn the security policies of the World Bank;
Intensively study the detailed rules on environmental protection designated for the construction party. After technical consultant compiles a list of environmental protection, each list includes the notes on monitoring.
Study environment impact of the project and environment items in need of monitoring.
4 days
Conformity monitoring (environment manager and environment supervisor)
Training on the field monitoring processes of the project (including organization, communication, role and liability, decision making process, report, and standard observing procedures).
1 day
Emergency team (environment manager
Knowledge on dangerous materials on the site; 1/2 days
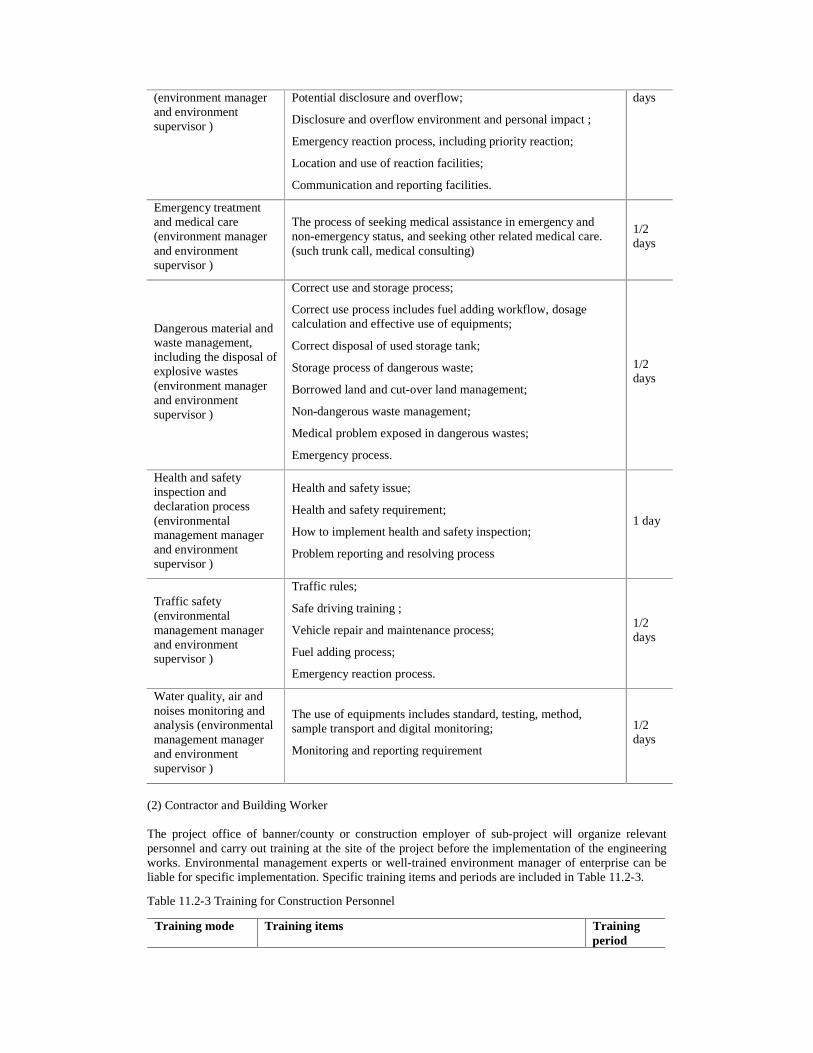
(environment manager and environment supervisor )
Potential disclosure and overflow;
Disclosure and overflow environment and personal impact ;
Emergency reaction process, including priority reaction;
Location and use of reaction facilities;
Communication and reporting facilities.
days
Emergency treatment and medical care (environment manager and environment supervisor )
The process of seeking medical assistance in emergency and non-emergency status, and seeking other related medical care. (such trunk call, medical consulting)
1/2 days
Dangerous material and waste management, including the disposal of explosive wastes (environment manager and environment supervisor )
Correct use and storage process;
Correct use process includes fuel adding workflow, dosage calculation and effective use of equipments;
Correct disposal of used storage tank;
Storage process of dangerous waste;
Borrowed land and cut-over land management;
Non-dangerous waste management;
Medical problem exposed in dangerous wastes;
Emergency process.
1/2 days
Health and safety inspection and declaration process (environmental management manager and environment supervisor )
Health and safety issue;
Health and safety requirement;
How to implement health and safety inspection;
Problem reporting and resolving process
1 day
Traffic safety (environmental management manager and environment supervisor )
Traffic rules;
Safe driving training ;
Vehicle repair and maintenance process;
Fuel adding process;
Emergency reaction process.
1/2 days
Water quality, air and noises monitoring and analysis (environmental management manager and environment supervisor )
The use of equipments includes standard, testing, method, sample transport and digital monitoring;
Monitoring and reporting requirement
1/2 days
(2) Contractor and Building Worker The project office of banner/county or construction employer of sub-project will organize relevant personnel and carry out training at the site of the project before the implementation of the engineering works. Environmental management experts or well-trained environment manager of enterprise can be liable for specific implementation. Specific training items and periods are included in Table 11.2-3.
Table 11.2-3 Training for Construction Personnel
Training mode Training items Training period
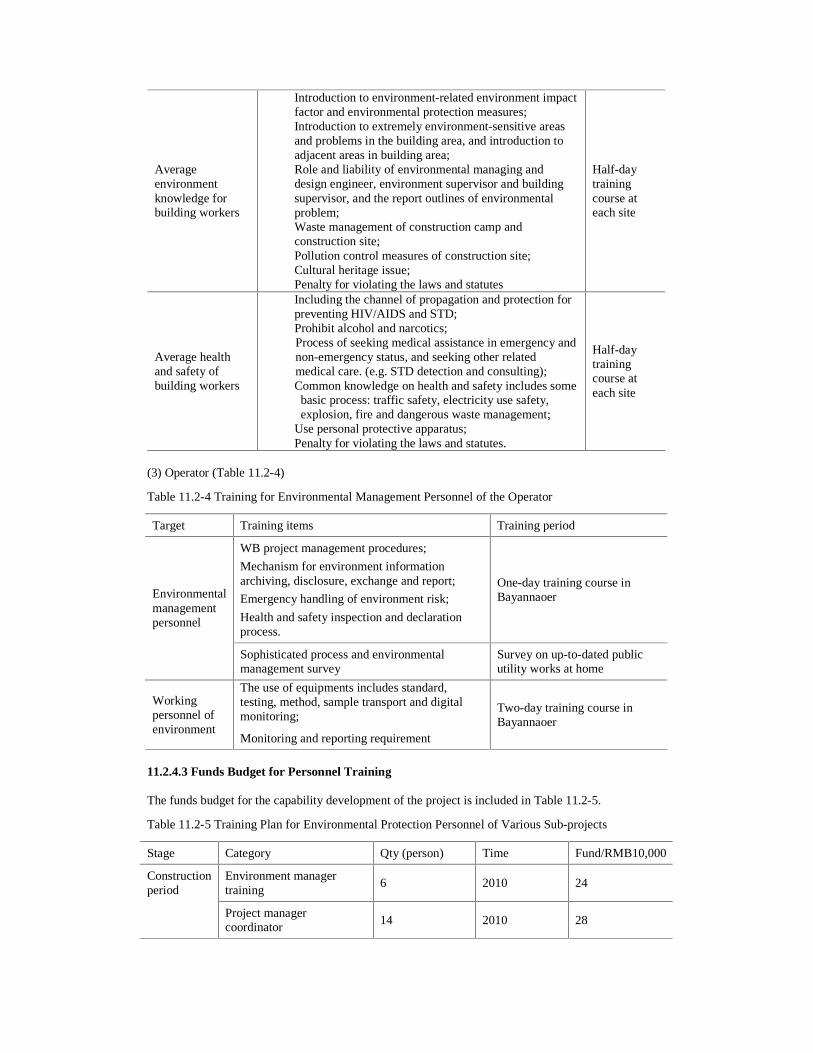
Average environment knowledge for building workers
Introduction to environment-related environment impact factor and environmental protection measures; Introduction to extremely environment-sensitive areas and problems in the building area, and introduction to adjacent areas in building area; Role and liability of environmental managing and design engineer, environment supervisor and building supervisor, and the report outlines of environmental problem; Waste management of construction camp and construction site; Pollution control measures of construction site; Cultural heritage issue; Penalty for violating the laws and statutes
Half-day training course at each site
Average health and safety of building workers
Including the channel of propagation and protection for preventing HIV/AIDS and STD; Prohibit alcohol and narcotics; Process of seeking medical assistance in emergency and non-emergency status, and seeking other related medical care. (e.g. STD detection and consulting); Common knowledge on health and safety includes some basic process: traffic safety, electricity use safety, explosion, fire and dangerous waste management;
Use personal protective apparatus; Penalty for violating the laws and statutes.
Half-day training course at each site
(3) Operator (Table 11.2-4)
Table 11.2-4 Training for Environmental Management Personnel of the Operator
Target Training items Training period
WB project management procedures;
Mechanism for environment information archiving, disclosure, exchange and report;
Emergency handling of environment risk;
Health and safety inspection and declaration process.
One-day training course in Bayannaoer Environmental
management personnel
Sophisticated process and environmental management survey
Survey on up-to-dated public utility works at home
Working personnel of environment
The use of equipments includes standard, testing, method, sample transport and digital monitoring;
Monitoring and reporting requirement
Two-day training course in Bayannaoer
11.2.4.3 Funds Budget for Personnel Training The funds budget for the capability development of the project is included in Table 11.2-5.
Table 11.2-5 Training Plan for Environmental Protection Personnel of Various Sub-projects
Stage Category Qty (person) Time Fund/RMB10,000
Environment manager training
6 2010 24 Construction period
Project manager coordinator
14 2010 28
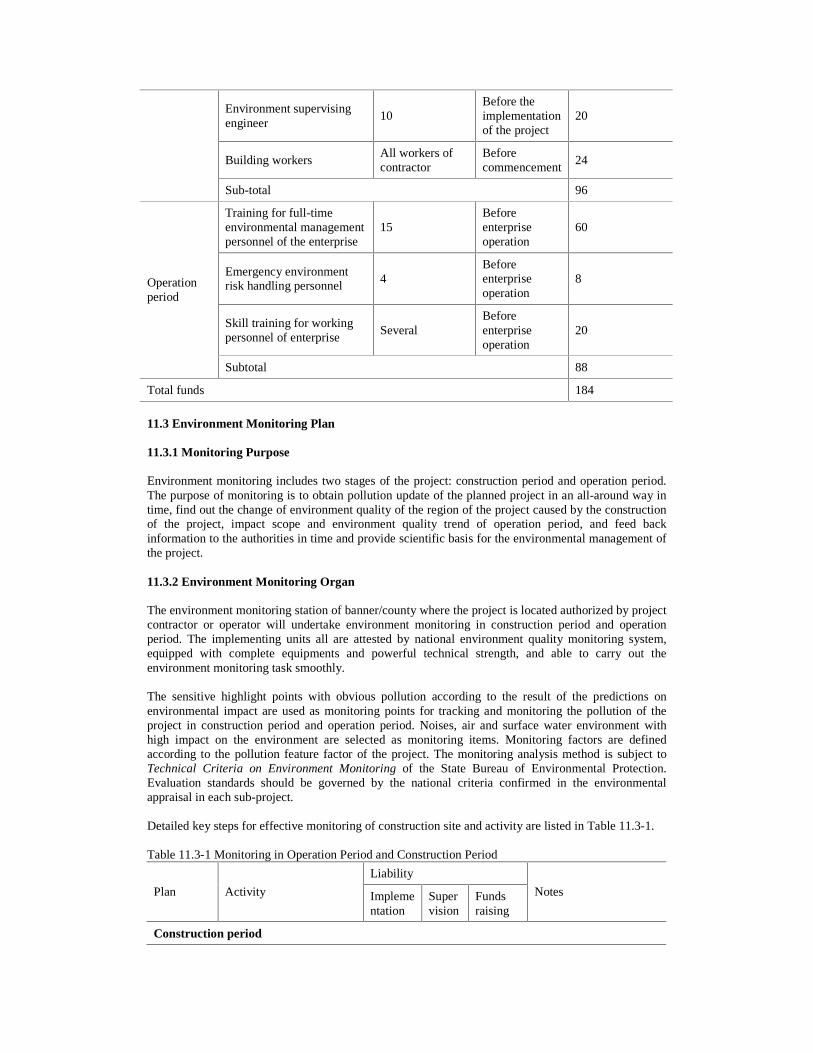
Environment supervising engineer
10 Before the implementation of the project
20
Building workers All workers of contractor
Before commencement
24
Sub-total 96
Training for full-time environmental management personnel of the enterprise
15 Before enterprise operation
60
Emergency environment risk handling personnel
4 Before enterprise operation
8
Skill training for working personnel of enterprise
Several Before enterprise operation
20
Operation period
Subtotal 88
Total funds 184
11.3 Environment Monitoring Plan 11.3.1 Monitoring Purpose Environment monitoring includes two stages of the project: construction period and operation period. The purpose of monitoring is to obtain pollution update of the planned project in an all-around way in time, find out the change of environment quality of the region of the project caused by the construction of the project, impact scope and environment quality trend of operation period, and feed back information to the authorities in time and provide scientific basis for the environmental management of the project. 11.3.2 Environment Monitoring Organ The environment monitoring station of banner/county where the project is located authorized by project contractor or operator will undertake environment monitoring in construction period and operation period. The implementing units all are attested by national environment quality monitoring system, equipped with complete equipments and powerful technical strength, and able to carry out the environment monitoring task smoothly. The sensitive highlight points with obvious pollution according to the result of the predictions on environmental impact are used as monitoring points for tracking and monitoring the pollution of the project in construction period and operation period. Noises, air and surface water environment with high impact on the environment are selected as monitoring items. Monitoring factors are defined according to the pollution feature factor of the project. The monitoring analysis method is subject to Technical Criteria on Environment Monitoring of the State Bureau of Environmental Protection. Evaluation standards should be governed by the national criteria confirmed in the environmental appraisal in each sub-project. Detailed key steps for effective monitoring of construction site and activity are listed in Table 11.3-1. Table 11.3-1 Monitoring in Operation Period and Construction Period
Liability
Plan Activity Implementation
Supervision
Funds raising
Notes
Construction period
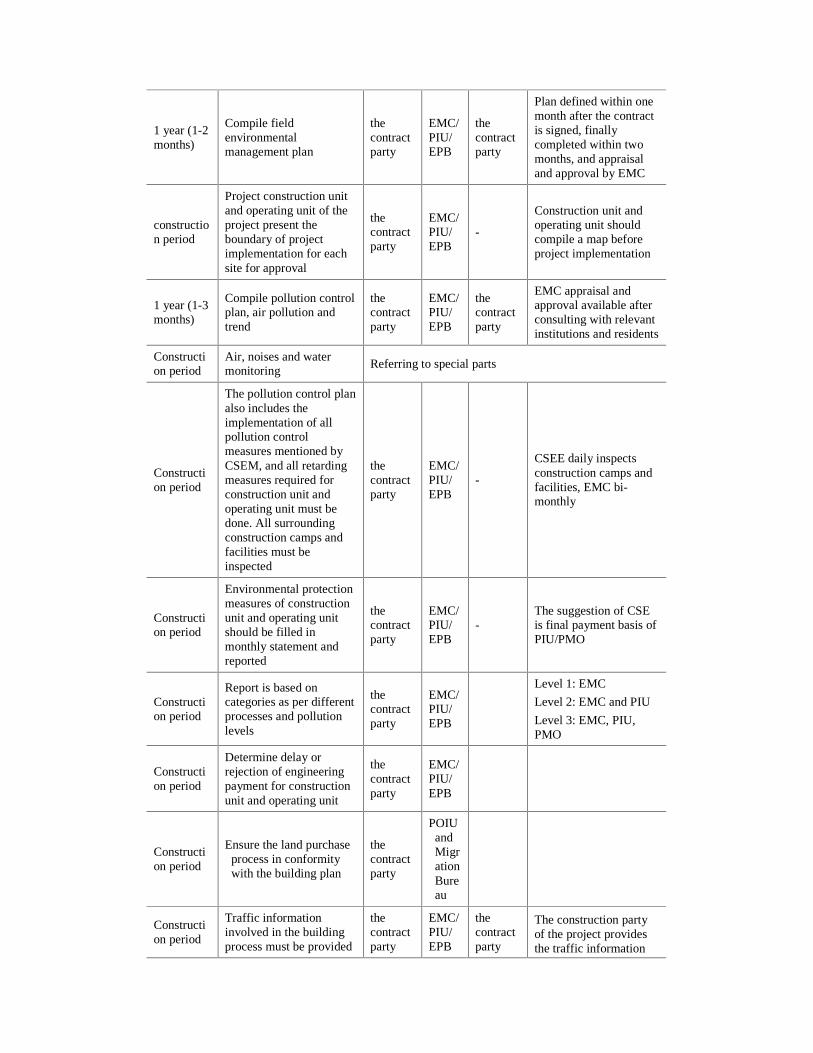
1 year (1-2 months)
Compile field environmental management plan
the contract party
EMC/PIU/ EPB
the contract party
Plan defined within one month after the contract is signed, finally completed within two months, and appraisal and approval by EMC
construction period
Project construction unit and operating unit of the project present the boundary of project implementation for each site for approval
the contract party
EMC/PIU/ EPB
-
Construction unit and operating unit should compile a map before project implementation
1 year (1-3 months)
Compile pollution control plan, air pollution and trend
the contract party
EMC/PIU/ EPB
the contract party
EMC appraisal and approval available after consulting with relevant institutions and residents
Construction period
Air, noises and water monitoring
Referring to special parts
Construction period
The pollution control plan also includes the implementation of all pollution control measures mentioned by CSEM, and all retarding measures required for construction unit and operating unit must be done. All surrounding construction camps and facilities must be inspected
the contract party
EMC/PIU/ EPB
-
CSEE daily inspects construction camps and facilities, EMC bi-monthly
Construction period
Environmental protection measures of construction unit and operating unit should be filled in monthly statement and reported
the contract party
EMC/PIU/ EPB
- The suggestion of CSE is final payment basis of PIU/PMO
Construction period
Report is based on categories as per different processes and pollution levels
the contract party
EMC/PIU/ EPB
Level 1: EMC
Level 2: EMC and PIU
Level 3: EMC, PIU, PMO
Construction period
Determine delay or rejection of engineering payment for construction unit and operating unit
the contract party
EMC/PIU/ EPB
Construction period
Ensure the land purchase process in conformity with the building plan
the contract party
POIU and Migration Bureau
Construction period
Traffic information involved in the building process must be provided
the contract party
EMC/PIU/ EPB
the contract party
The construction party of the project provides the traffic information update, which CSEE &
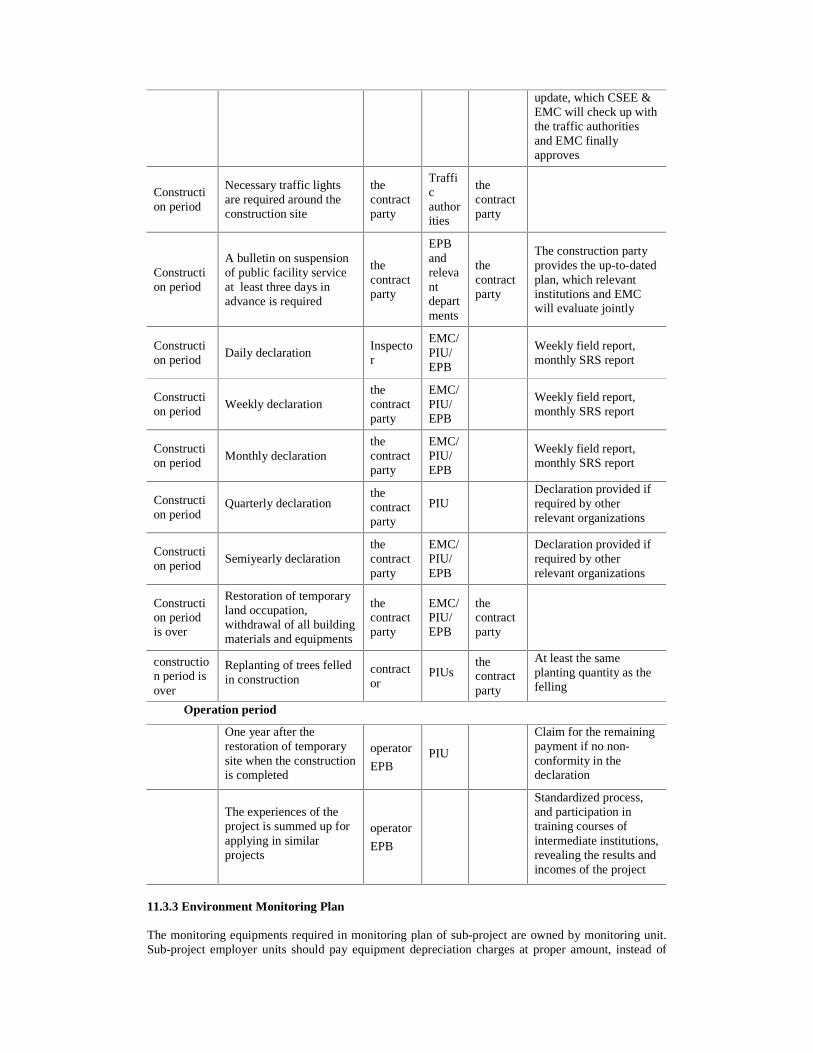
update, which CSEE & EMC will check up with the traffic authorities and EMC finally approves
Construction period
Necessary traffic lights are required around the construction site
the contract party
Traffic authorities
the contract party
Construction period
A bulletin on suspension of public facility service at least three days in advance is required
the contract party
EPB and relevant departments
the contract party
The construction party provides the up-to-dated plan, which relevant institutions and EMC will evaluate jointly
Construction period
Daily declaration Inspector
EMC/PIU/ EPB
Weekly field report, monthly SRS report
Construction period
Weekly declaration the contract party
EMC/PIU/ EPB
Weekly field report, monthly SRS report
Construction period
Monthly declaration the contract party
EMC/PIU/ EPB
Weekly field report, monthly SRS report
Construction period
Quarterly declaration the contract party
PIU
Declaration provided if required by other relevant organizations
Construction period
Semiyearly declaration the contract party
EMC/PIU/ EPB
Declaration provided if required by other relevant organizations
Construction period is over
Restoration of temporary land occupation, withdrawal of all building materials and equipments
the contract party
EMC/PIU/ EPB
the contract party
construction period is over
Replanting of trees felled in construction
contractor
PIUs the contract party
At least the same planting quantity as the felling
Operation period
One year after the restoration of temporary site when the construction is completed
operator
EPB PIU
Claim for the remaining payment if no non-conformity in the declaration
The experiences of the project is summed up for applying in similar projects
operator
EPB
Standardized process, and participation in training courses of intermediate institutions, revealing the results and incomes of the project
11.3.3 Environment Monitoring Plan The monitoring equipments required in monitoring plan of sub-project are owned by monitoring unit. Sub-project employer units should pay equipment depreciation charges at proper amount, instead of
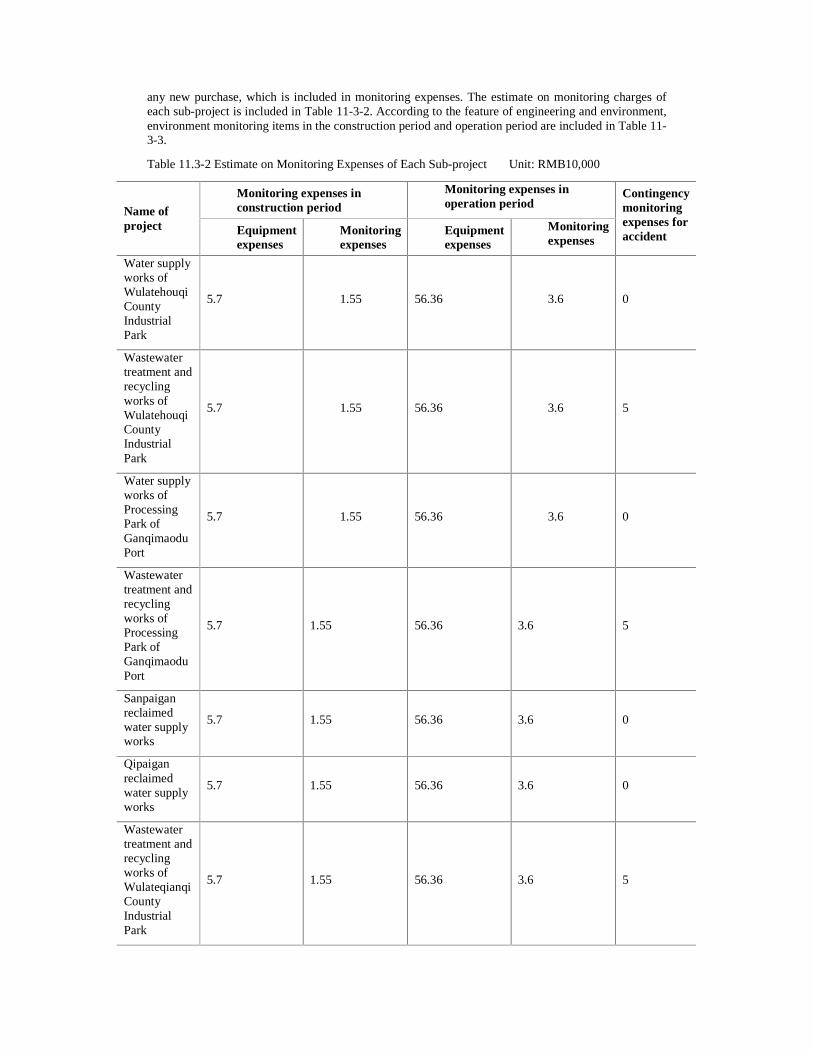
any new purchase, which is included in monitoring expenses. The estimate on monitoring charges of each sub-project is included in Table 11-3-2. According to the feature of engineering and environment, environment monitoring items in the construction period and operation period are included in Table 11-3-3.
Table 11.3-2 Estimate on Monitoring Expenses of Each Sub-project Unit: RMB10,000
Monitoring expenses in construction period
Monitoring expenses in operation period
Name of project Equipment
expenses Monitoring expenses
Equipment expenses
Monitoring expenses
Contingency monitoring expenses for accident
Water supply works of Wulatehouqi County Industrial Park
5.7 1.55 56.36 3.6 0
Wastewater treatment and recycling works of Wulatehouqi County Industrial Park
5.7 1.55 56.36 3.6 5
Water supply works of Processing Park of Ganqimaodu Port
5.7 1.55 56.36 3.6 0
Wastewater treatment and recycling works of Processing Park of Ganqimaodu Port
5.7 1.55 56.36 3.6 5
Sanpaigan reclaimed water supply works
5.7 1.55 56.36 3.6 0
Qipaigan reclaimed water supply works
5.7 1.55 56.36 3.6 0
Wastewater treatment and recycling works of Wulateqianqi County Industrial Park
5.7 1.55 56.36 3.6 5
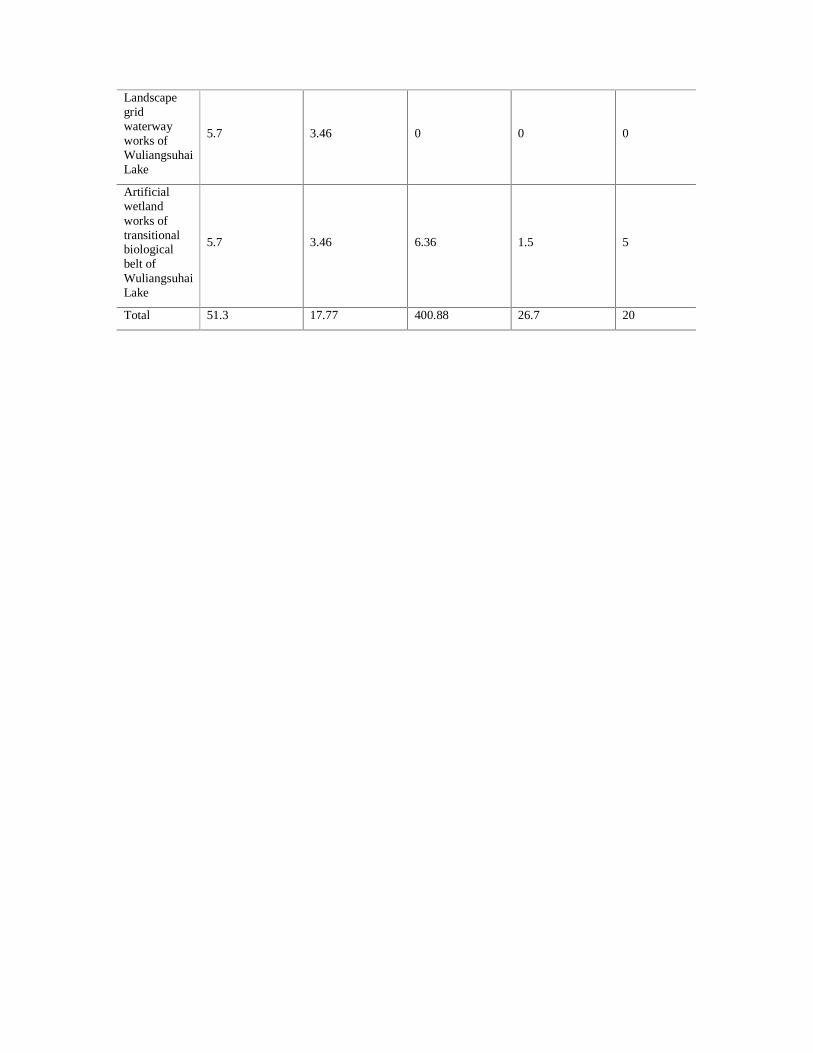
Landscape grid waterway works of Wuliangsuhai Lake
5.7 3.46 0 0 0
Artificial wetland works of transitional biological belt of Wuliangsuhai Lake
5.7 3.46 6.36 1.5 5
Total 51.3 17.77 400.88 26.7 20

Table 11.3-3 Environment Monitoring Plan
Sub-project Monitoring period
Environment factor Monitoring point Monitoring items Monitoring frequency
Environmental air
Residential locations around construction site and both sides of road
TSP 6 periods/year, 2 days/period, 2 times/day
Catch sink of construction wastewater
pH, SS, COD, , petroleum 6 periods/year, 1 day/period, 1 time/day
Water quality Upper and lower 500m of reception water system
temperature, pH, COD, petroleum
3 periods/year, one period in dry, monsoon and average period respectively, 3 days/period, 1 time/day
construction period
Noises Boundary of construction site Leq dB (A) 6 periods/year, 1 day/period, 2 times/day, one time in day and night separately
Water quality Water outlet of factory pH�DO�SS�COD�NH3-N�TP�heavy metal�As�Hg�Pb�Cr�Cd�Cu�
Automatic online monitoring
Noises Factory area and pump station boundary
Leq dB(A) 4 periods/year, 1 day/period, 2 times/day, one time in day and night separately
Reclaimed water supply and midwater recycling works
operation period
Substrate sludge
Sludge discharged from sludge sink
Heavy metal (As, Hg, Pb, Cr, Cd, Cu) 2 periods/year, 1 day/period, 1 time/day
Environmental air
Residential locations around construction site and both sides of road
TSP 6 periods/year, 2 day/period, 2 times/day
Wastewater treatment works
construction period
water quality Catch sink of construction wastewater
pH, SS, COD, , petroleum 6 periods/year, 1 day/period, 1 time/day
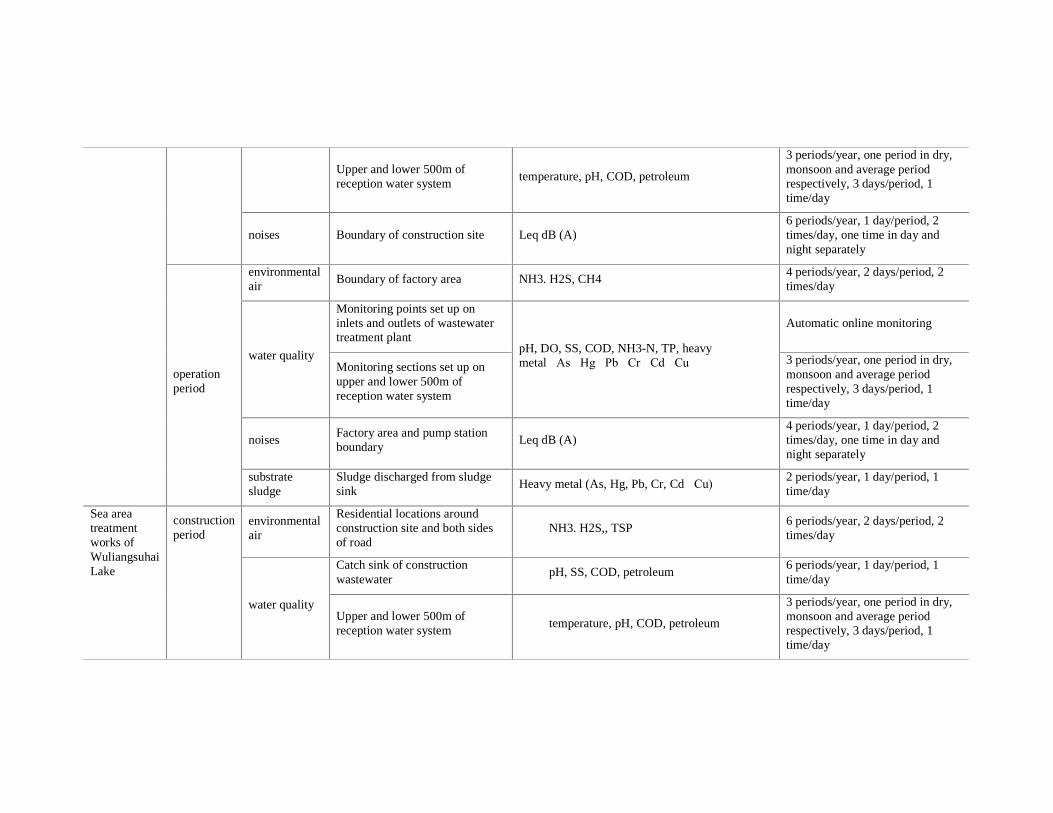
Upper and lower 500m of reception water system
temperature, pH, COD, petroleum
3 periods/year, one period in dry, monsoon and average period respectively, 3 days/period, 1 time/day
noises Boundary of construction site Leq dB (A) 6 periods/year, 1 day/period, 2 times/day, one time in day and night separately
environmental air
Boundary of factory area NH3. H2S, CH4 4 periods/year, 2 days/period, 2 times/day
Monitoring points set up on inlets and outlets of wastewater treatment plant
Automatic online monitoring
water quality Monitoring sections set up on upper and lower 500m of reception water system
pH, DO, SS, COD, NH3-N, TP, heavy metal�As�Hg�Pb�Cr�Cd�Cu� 3 periods/year, one period in dry,
monsoon and average period respectively, 3 days/period, 1 time/day
noises Factory area and pump station boundary
Leq dB (A) 4 periods/year, 1 day/period, 2 times/day, one time in day and night separately
operation period
substrate sludge
Sludge discharged from sludge sink
Heavy metal (As, Hg, Pb, Cr, Cd�Cu) 2 periods/year, 1 day/period, 1 time/day
environmental air
Residential locations around construction site and both sides of road
NH3. H2S,, TSP 6 periods/year, 2 days/period, 2 times/day
Catch sink of construction wastewater
pH, SS, COD, petroleum 6 periods/year, 1 day/period, 1 time/day
Sea area treatment works of Wuliangsuhai Lake
construction period
water quality Upper and lower 500m of reception water system
temperature, pH, COD, petroleum
3 periods/year, one period in dry, monsoon and average period respectively, 3 days/period, 1 time/day
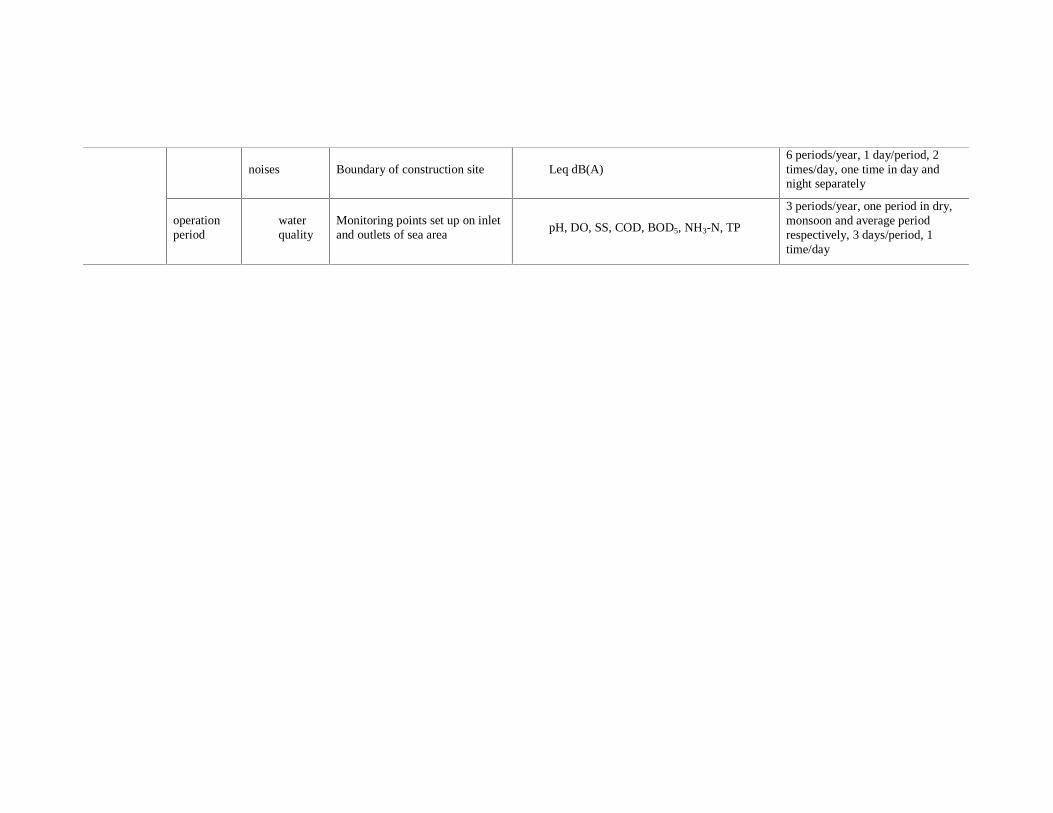
noises Boundary of construction site Leq dB(A)
6 periods/year, 1 day/period, 2 times/day, one time in day and night separately
operation period
water quality
Monitoring points set up on inlet and outlets of sea area
pH, DO, SS, COD, BOD5, NH3-N, TP
3 periods/year, one period in dry, monsoon and average period respectively, 3 days/period, 1 time/day

11.4 Estimates on Environmental Management Expenses and Source of Capital 11.4.1 Budget Distribution The implementation of EMP measures involves many units. As a result, different sources of capital exist. Most environmental protection activities are engineering measures. Therefore, the construction unit and operating unit of the project should provide the expenses and include in their engineering costs, which are defined and listed in their bidding documents. The expenses in EMP are mainly used in environmental management in construction period and operation period, primarily including: environment monitoring expenses, environment supervisor expenses, personnel training expenses, running costs of environmental management institutions as well as risk preventing expenses in some projects. EMC activities will be included in the international project management expenses of PMO and PIUs. So does the monitoring of water quality, atmosphere and noises, CSEE and EFSI. The CSEE monitoring and supervising activity is part of building and supervising expenses. Local environment monitoring stations will monitor water, noises and atmosphere in the operation of project as authorized by project employer, where project employer pays the monitoring expenses. If regular monitoring of local environmental protection authorities synchronizes with the project, their data of regular monitoring can be used. 11.4.2 Capital Source and EMP Budget
Table 11.4-1 is a list of environmental management expenses (excluding contingency monitoring expenses for accident) of sub-project in construction period and operation period.
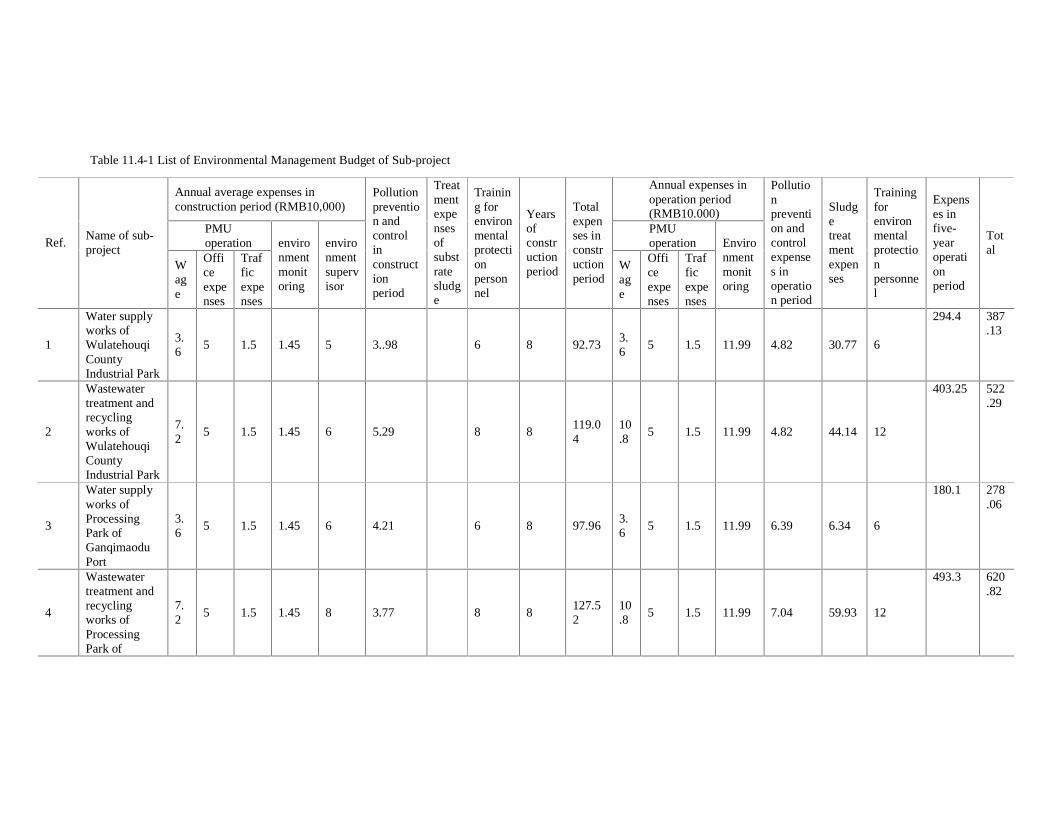
Table 11.4-1 List of Environmental Management Budget of Sub-project
Annual average expenses in construction period (RMB10,000)
Annual expenses in operation period (RMB10.000)
PMU operation
PMU operation Ref.
Name of sub-project
Wage
Office expenses
Traffic expenses
environment monitoring
environment supervisor
Pollution prevention and control in construction period
Treatment expenses of substrate sludge
Training for environmental protection personnel
Years of construction period
Total expenses in construction period
Wage
Office expenses
Traffic expenses
Environment monitoring
Pollution prevention and control expenses in operation period
Sludge treatment expenses
Training for environmental protection personnel
Expenses in five-year operation period
Total
1
Water supply works of Wulatehouqi County Industrial Park
3.6
5 1.5 1.45 5 3..98 6 8 92.73 3.6
5 1.5 11.99 4.82 30.77 6
294.4 387.13
2
Wastewater treatment and recycling works of Wulatehouqi County Industrial Park
7.2
5 1.5 1.45 6 5.29 8 8 119.04
10.8
5 1.5 11.99 4.82 44.14 12
403.25 522.29
3
Water supply works of Processing Park of Ganqimaodu Port
3.6
5 1.5 1.45 6 4.21 6 8 97.96 3.6
5 1.5 11.99 6.39 6.34 6
180.1 278.06
4
Wastewater treatment and recycling works of Processing Park of
7.2
5 1.5 1.45 8 3.77 8 8 127.52
10.8
5 1.5 11.99 7.04 59.93 12
493.3 620.82
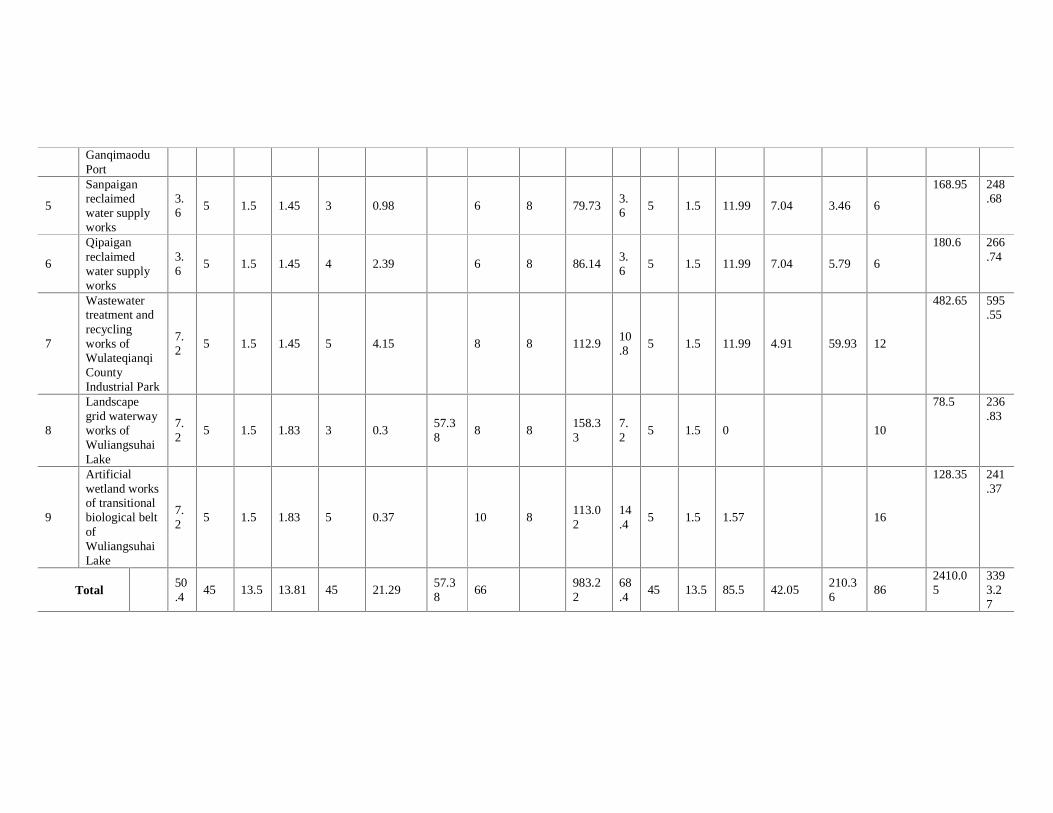
Ganqimaodu Port
5
Sanpaigan reclaimed water supply works
3.6
5 1.5 1.45 3 0.98 6 8 79.73 3.6
5 1.5 11.99 7.04 3.46 6
168.95 248.68
6
Qipaigan reclaimed water supply works
3.6
5 1.5 1.45 4 2.39 6 8 86.14 3.6
5 1.5 11.99 7.04 5.79 6
180.6 266.74
7
Wastewater treatment and recycling works of Wulateqianqi County Industrial Park
7.2
5 1.5 1.45 5 4.15 8 8 112.9 10.8
5 1.5 11.99 4.91 59.93 12
482.65 595.55
8
Landscape grid waterway works of Wuliangsuhai Lake
7.2
5 1.5 1.83 3 0.3 57.38
8 8 158.33
7.2
5 1.5 0 10
78.5 236.83
9
Artificial wetland works of transitional biological belt of Wuliangsuhai Lake
7.2
5 1.5 1.83 5 0.37 10 8 113.02
14.4
5 1.5 1.57 16
128.35 241.37
Total 50.4
45 13.5 13.81 45 21.29 57.38
66 983.22
68.4
45 13.5 85.5 42.05 210.36
86 2410.05
3393.27
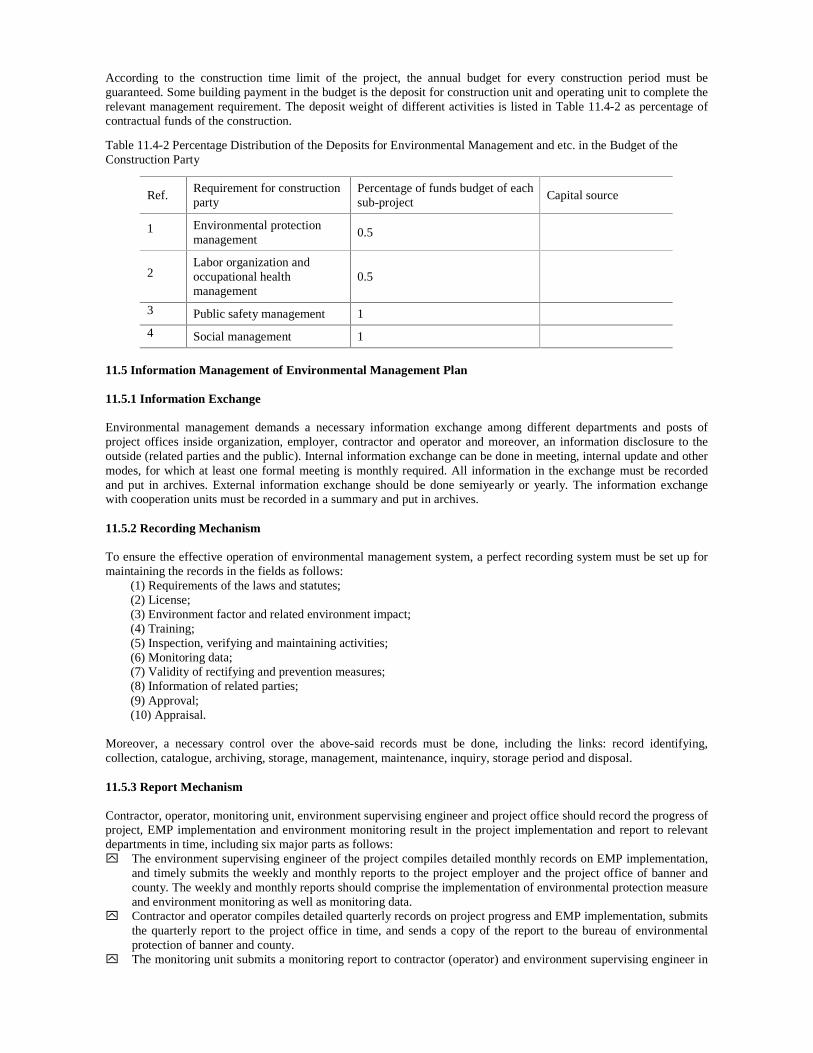
According to the construction time limit of the project, the annual budget for every construction period must be guaranteed. Some building payment in the budget is the deposit for construction unit and operating unit to complete the relevant management requirement. The deposit weight of different activities is listed in Table 11.4-2 as percentage of contractual funds of the construction.
Table 11.4-2 Percentage Distribution of the Deposits for Environmental Management and etc. in the Budget of the Construction Party
Ref. Requirement for construction party
Percentage of funds budget of each sub-project
Capital source
1 Environmental protection management
0.5
2 Labor organization and occupational health management
0.5
3 Public safety management 1
4 Social management 1
11.5 Information Management of Environmental Management Plan 11.5.1 Information Exchange Environmental management demands a necessary information exchange among different departments and posts of project offices inside organization, employer, contractor and operator and moreover, an information disclosure to the outside (related parties and the public). Internal information exchange can be done in meeting, internal update and other modes, for which at least one formal meeting is monthly required. All information in the exchange must be recorded and put in archives. External information exchange should be done semiyearly or yearly. The information exchange with cooperation units must be recorded in a summary and put in archives. 11.5.2 Recording Mechanism To ensure the effective operation of environmental management system, a perfect recording system must be set up for maintaining the records in the fields as follows:
(1) Requirements of the laws and statutes; (2) License; (3) Environment factor and related environment impact; (4) Training; (5) Inspection, verifying and maintaining activities; (6) Monitoring data; (7) Validity of rectifying and prevention measures; (8) Information of related parties; (9) Approval; (10) Appraisal.
Moreover, a necessary control over the above-said records must be done, including the links: record identifying, collection, catalogue, archiving, storage, management, maintenance, inquiry, storage period and disposal. 11.5.3 Report Mechanism Contractor, operator, monitoring unit, environment supervising engineer and project office should record the progress of project, EMP implementation and environment monitoring result in the project implementation and report to relevant departments in time, including six major parts as follows: y� The environment supervising engineer of the project compiles detailed monthly records on EMP implementation,
and timely submits the weekly and monthly reports to the project employer and the project office of banner and county. The weekly and monthly reports should comprise the implementation of environmental protection measure and environment monitoring as well as monitoring data.
y� Contractor and operator compiles detailed quarterly records on project progress and EMP implementation, submits the quarterly report to the project office in time, and sends a copy of the report to the bureau of environmental protection of banner and county.
y� The monitoring unit submits a monitoring report to contractor (operator) and environment supervising engineer in
time after completing the authorized monitoring task. y� The project office of banner and county submits the report on project progress to the municipal project office in
time, and sends a copy of the report to Municipal Bureau of Environmental Protection. A report on project progress compiled by the project office (monthly, quarterly and yearly) must comprise EMP progress, such as EMP implementing progress and result, especially the environment monitoring result.
y� In case of any violation of the regulations in environmental protection, the environment supervising engineer and the project office will notify the local environmental protection authorities and report level-by-level if necessary.
y� Annual EMP implementation report of the project must be completed and submitted to WB before March 31 of the following year. EMP implementing report can include the items as follows:
a. The implementation of training plan; b. Project progress, such as riverway improvement works, garbage burial yard, wastewater treatment plant, and
completed length and construction progress of pipelines; c. The implementation of environmental protection measures of the project, environment monitoring and main
monitoring results; d. Main items of the complaints from the public, solution and satisfaction of the public if any; e. EMP implementing plan of the next year.
12 Conclusion of Environmental Appraisal 12.1 Relevant Policies and Conformity with the Planning The reclaimed water supply works and wastewater treatment and recycling works of the project belong to “brackish water, bad quality water, seawater development and utilization and seawater desalting works” and “three wastes” integrated utilization and treatment works within the category of encouraging environmental protection and integrated resources saving and utilization in the national guide inventory of the industrial structure adjustment (Version 2005) respectively; the sea area treatment works of the project, a water environment treatment works aims at protecting & restoring wetland function of Wuliangsuhai Lake, and is implemented in buffer zone and test area, instead of core area. As per Circular of General Office of the State Council for Strengthening Wetland Protection Management (GOSC [2004] No.50), wetland protection & wetland function restoration as one priority in improving living conditions and building a well-off society in all-around way should be strengthened. Sea area treatment works of Wuliangsuhai Lake complies with the laws and statutes of the State. According to the environmental appraisal policies (OP 4.04) of the World Bank, it supports the protection, maintenance and restoration of natural habitat and its function, and assists and expects the borrowing party in taking defense measures in natural resources management for guaranteeing the sustainable development of environment. It provides assistance funds for natural habitat and ecologic function protection project helpful for the development of the country and region, and advocates restoring and rebuilding work for natural habitat with deteriorating environment. In the “11th Five-Year Plan” period, the economic and social development planning of Bayannaoer Municipality brings forward the construction of resources saving & environment friendly society. On one hand, integrate water resources, plan and utilize the water of the Yellow River, surface water, underground water and rainwater in unified way, and try to realize the circulated use of water resources. On the other hand, strengthen the protection and treatment of water environment and construction of urban wastewater disposal facility and auxiliary pipelines, and gradually realize the emission of urban and industrial wastewater in conformity with the standards, and cut off the pollution source for the Yellow River and underground water. Moreover, plan treatment works of Wuliangsuhai Lake, urban road and pipeline, water supply and drainage, garbage disposal and wastewater treatment works as key infrastructure construction projects in the “11th Five-Year Plan” period. The implementation of various works of the integrated water environment treatment projects of Bayannaoer Municipality with WB loan complies with overall urban planning and city planning with regard to the site selection, and is also important measures for realizing the urban target of overall urban planning and city planning of Bayannaoer Municipality, water resources configuration and the environment protection targets. In sum, the construction of the project complies with not only industrial policies, laws and statutes of the State and environmental appraisal polices of the World Bank for the loan project but also the national economy and social development planning, overall urban planning and city planning of Bayannaoer Municipality. 12.2 Analysis on Water Resources Balance Total annual average water resources in Bayannaoer Municipality in many years are 5.5742 billion m3, including surface water resources 4.7791 billion m3. Water resources are mainly used in industrial and agricultural production, domestic and ecologic water consumption of urban and rural residents. As per the water resources allocation plan approved by the State and the autonomous region, the quota of water that Bayannaoer Municipality imports from the Yellow River is 4 billion m3. Due to historic reasons and actual situation of agricultural water consumption of Hetao irrigation area, annual average quantity of water imported from the Yellow River in many years is 4.6748 billion m3. At present, Hetao irrigation area imports 674.8 million m3 water of the Yellow River more than the quota annually. The water demand and supply of the primary, secondary, third industries, domestic purpose and ecologic environment are predicted. The result shows that the annual water demand in 2010-2030 is 4.0965025 billion m3, and the water supply available includes the water from the Yellow River, underground water and reclaimed water. The annual average supply of water is predicted as 4.0965025 billion m3. The analysis on water quantity balance of Wuliangsuhai Lake reveals that in case of the net quantity of water that irrigation area discharges into Wuliangsuhai Lake more than 515 million m³, present ecologic water consumption and the water area of Wuliangsuhai Lake can be kept. After the project is implemented in 2015 and water-saving measures are taken in agriculture, if the water break of farmland decreases by 10%, the water break of general trunk ditch as well as Bapaigan and Jiupaigan is 415 million m3 and 62 million m3 respectively. After the project is implemented, if 31 million m3 is reused, water return from general trunk ditch and Bapaigan and Jiupaigan into Wuliangsuhai Lake is 446
million m3. To maintain the ecologic water demand of Wuliangsuhai Lake at 515 million m³, it requires Shiganqu to provide makeup water of 69 million m³ in ice flood season. According to the preliminary engineering design of the works of Inner Mongolia for diverting the flood of the Yellow River to Hetao irrigation area & Wuliangsuhai Lake in the emergency ice flood control proposal, the flood diverting amount is defined as 161 million m3, including 100 million m3 for Wuliangsuhai Lake and 61 million m3 for the trunk channel of Hetao irrigation area and natural lake in the north of irrigation area. Therefore, the flood diversion in ice flood season can ensure the water makeup quantity of Wuliangsuhai Lake; the preliminary design of the project has already won approval of the Department of Water Resources of Inner Mongolia Autonomous Region (Approval for Preliminary Engineering Design of the Works of Inner Mongolia for Diverting the Flood of the Yellow River to Hetao Irrigation Area & Wuliangsuhai Lake in the Emergency Ice Flood Control Proposal IWRCM [2009] No.170). Moreover, the water import through Shiganqu in ice flood season isn’t included in the quota, and complies with the national and local regulations as ecologic makeup water of Wuliangsuhai Lake. 12.3 Appraisal Result of Present Environment Quality 12.3.1 Present Situation of Air Environment Quality The mean value per hour and daily mean value of SO2, NO2 at each monitoring spot of the sub-projects can meet the requirements of relevant standards; the specific pollutants such as NH3 and H2S relating to this project can meet the requirements of environmental quality standard and the indicators of each item have not been detected; the daily mean value of TSP and PM10 at most monitoring points of each sub project exceeds the environmental standard, of which the over-limit ratio in Wuliangsuhai Lake Area reaches 100% at the most, with particle pollution at certain extent. 12.3.2 Present Situation of Quality of Surface Water Environment The water quality in 3rd Drainage Canal and 7th Drainage Canal is polluted seriously, and the major contamination index such as chemical oxygen demand, (COD), biochemical oxygen demand (BOD), total nitrogen, ammonia nitrogen and total phosphorus exceed the standards; compared with the quality of water environment in 3rd Drainage Canal and 7th Drainage Canal, the pollution water quality in General Drainage Canal is relatively light, where the major contamination index is chemical oxygen demand, (COD), biochemical oxygen demand (BOD), total nitrogen, ammonia nitrogen and total phosphorus and so on, of which the pollution of COD and total nitrogen is serious; the quality of the water environment in General Drainage Canal is gradually being improved. The contents of heavy metals such as cadmium, mercury and lead in 3rd Drainage Canal, 7th Drainage Canal, General Drainage Canal, Yongming Reservoir in Wulatehouqi County, Wangliuhao Reservoir in Wulateqianqi County and Wangba Reservoir in Wulatezhongqi County are relatively lower on the whole, meeting the national standard for quality of surface water environment. Water in rainy season in Wuliangsuhai Lake is mainly featured by organic pollution and the dissolved oxygen, CODC, BOD5, NH3-N and TP at the monitoring sections partially exceed the standards, and pollution caused by eutrophication pollutants such as nitrogen and phosphor is relatively light in rainy season; while in dry season, CODC, BOD5 and total nitrogen at the monitoring sections all exceed the standards, and dissolved oxygen, NH3-N and TP partially exceed the standards, so the water pollution is extremely serious. In addition, the water quality at the west part is worse than that at the east part in Wuliangsuhai Lake. 12.3.3 Present Situation of Quality of Ground Water Environment The quality of groundwater at each planned plant site of the wastewater disposal and reuse engineering and water supply engineering of reclaimed waterin processing parks exceeds the standards mainly in inorganic indicators such as ammonia nitrogen, sulphate and total hardness; no heavy metal exceeds the standards, and the groundwater at each planned plant site of each project coincides with the characteristics of the groundwater quality of the entire region, having a higher mineralization of water quality and some exogenous pollution at certain extent. The water quality of the confined water (pumping well) in groundwater around Wuliangsuhai Lake is better and the water quality of the underflow water is worse; some of the indicators of the groundwater at Branch Farm 12, Branch Farm 9, Branch Farm 1, Work Area 5, Branch Farm 6, and Branch Farm 3 exceed the standards, of which ammonia nitrogen is extremely exceeding the standard, Chlorides at Work Area 5, Branch Farm 6, and Branch Farm 3 exceed the standard. Wuliangsuhai Lake has a remarkable impact on the groundwater environment around it, especially on the water quality of the underflow water. 12.3.4 Present Situation of Quality of Acoustic Environment
The quality of acoustic environment at each planned plant site of the wastewater disposal and reuse engineering and water supply engineering of reclaimed waterin processing parks is better, except that the noise value within the east site boundary of the wastewater disposal and reuse engineering of Wulateqianqi County Processing park is 50.4 dB (A) at night, values at other monitoring points doesn’t exceed the standard limits of Class II in Environmental Quality Standard for Noise (GB3096-2008). The daytime equivalent noise level at the villages around Wuliangsuhai Lake is 39.6�50.6dB(A) and the night time equivalent noise level is 30.8�47.0 dB(A); except that the night time noise at Branch Farm 3 exceeds the standard, values at other monitoring points can meet the functional requirements of Class I acoustic environment in Environmental Quality Standard for Noise (GB3096-2008). 12.3.5 Monitoring results for sediment The heavy metals in sediment of Wuliangsuhai Lake don’t exceed the limits in Control Standards for Pollutants in Sludge from Agricultural Use. 12.3.6 Present Situation of Ecological Environment The annual mean biomass of zooplankton in Wuliangsuhai Lake is 3.6240 mg/L, varying from 0.220 7 to 7.809 9 mg/L, belonging to eutrophy type; the reducing order of the mean biomass of zooplankton is copepods>nauplius larva>rotifer >Cladocera> protozoan; the mean biomass of zoobenthos in Wuliangsuhai Lake in summer and fall is up to 71.672 g/m2, belonging to eutrophy type, the reducing order of the mean biomass of zoobenthos is chironmus larva> mollusc >oligochaeta; the PCQ value in Wuliangsuhai Lake is 6.6, belonging to eutrophy type. The PCQ value in small lake is 7.3, belonging to super-eutrophy type; comparing the results of ichthyologic survey this time with the historical results, the species and quantity of have reduced remarkably; some species such as snail carp, grass carp, Leuciscus waleckii, Xenocypris argentea Gunther and plaice have already been extinct; the wetland environment in Wuliangsuhai Lake is increasingly worsening, though birds suitable for swamp environment are gradually increasing, the birds species suitable for vast waters are relatively decreasing. 12.4 Appraisal Result of Environmental Impact 12.4.1 Environmental Impact in Construction Period (1) Appraisal Result of Water Environmental Impact The main pollutants for water system in construction period are: domestic wastewater of construction personnel and construction wastewater. With proper measures, the impact upon environment can be controlled within allowed limit. A backhoe sludge excavating ship & bucket-grab sludge excavating ship are used in the grid waterway works of Wuliangsuhai Lake for excavating grid waterway, and can effectively reduce pollutants and secondary pollution of SS scattering around. Moreover, sludge excavating ship operates at fixed position with little disturbance for the substrate sludge of sea area, where the leakage of substrate sludge is little, and the construction impact on water environment is within the scope of 50-60m. The sludge excavation works will promote the removal of pollutants such as nutritional salt and heavy metal and exercise a negative impact on water environment quality. In the dredging period and short time after the dredging is over, the content of total suspended solid, poisonous heavy metal ion, nitrogen and phosphor nutritional salt in water will increase, and the transparency of water will decline. Such environmental impact features some duration. However, one year after dredging, the quality of water system improves, and various indicators are lower than the level before dredging. As a result, the substrate sludge excavation will promote the improvement of water quality of the lake. (2) Conclusion of the Analysis on Atmospheric Environmental Impact On the construction stage, air pollution mainly comes from the flying dust of construction vehicle in running, pile-up yard and agitation as well as tail gas of vehicles. The analysis and preliminary estimate prove that the flying dust in the
construction will cause some impact upon the resident, school, enterprises and government-sponsored institutions around the construction site and the construction personnel, in which the impact upon construction personnel is the biggest. However, after necessary measures taken, the impact of flying dust in construction can be minimized. Moreover, such impact is temporary. After the construction is over, the impact will decline rapidly with the implementation of greening and replanting works and even disappear. The tail gas of construction machine and transport vehicles includes nitrogen oxide, carbon monoxide and hydrocarbon mainly. Such pollutant can easily be diluted and scattered due to less emission strength and open site. (3) Appraisal Conclusion of Sound Environmental Impact In the construction, the noises of construction machine are main source. Sanbaigan reclaimed water supply works will cause impact on the surrounding environments of Shanba Husbandry Union and Sanbaigan Wastewater Disposal Plant nearby; Qibaigan reclaimed water supply works has impact on Wuyuan Brick Plant and other enterprises; the wastewater treatment and recycling works of processing park of Wuleteqian Banner has impact upon sound environments of adjacent Shagedan Village; sea area works of Wuliangsuhai Lake has some impact on sound environment of the sea area; and other planned works have less environment sensitive points around and the impact of construction noises is little. Do lower the artificial noises, take proper sound insulation measures and set up construction enclosure, and reasonably arrange the running time of high-noise equipment and avoid operation at night for reducing environmental impact in the construction of the project. Moreover, select proper positions for equipments, leverage national conditions for reducing noises so as to minimize the noises impact in construction period. (4) Appraisal Conclusion of Environmental Impact of Solid Domestic and construction garbage should be timely transported to a site designated by environment and sanitation authorities for disposal, in order to avoid environmental impact around. Try to use the waste soil of the works in the construction of various works of the project; contact local muck authorities for arranging disposal for the unused waste soil. If waste soil is piled up on the yard, ecologic greening should be immediately done after the construction over, and moreover, anti-flood ditch is required for preventing land erosion. The construction area of the sea area grid excavation works of Wuliangsuhai Lake is 2.451×10⁶m2, where about 2.295×10⁵m3 substrate sludge is produced. With high water content, the excavated sludge may cause secondary pollution with no proper protective measures. The Environment Monitoring Station of Bayannaoer Municipality has monitored the heavy metal content of the substrate sludge of the sea area of Wuliangsuhai Lake. According to the result of monitoring, heavy metal content of substrate sludge on various monitoring points all aren’t higher than the standard in Control Criteria on Pollutants in Agricultural Sludge (GB4284-84) of the State. Therefore, the substrate sludge excavated in sea area grid works of Wuliangsuhai Lake can be used as fertilizer, and upper layer of substrate sludge is used in improving alkaline saline soil; and lower layer is the parent soil with no pollution, about 2.17 million m3, and can be used in piling up artificial island in the lake area, instead of shipment. (5) Appraisal Conclusion of Ecologic Environmental Impact The impact of project construction upon ecologic environment is mainly the damage of soil and natural vegetation caused in the construction of various works and laying of pipelines. The construction of the reclaimed water disposal facility, wastewater disposal & recycling facility and artificial wetland of Wuliangsuhai Lake with permanent land occupation is done mainly on wasteland and partly on farmland, and will reduce the land of farmers to some extent; present reed land is manly used in artificial wetland construction of Wuliangsuhai Lake, instead of any nature change of present land, and ecologic impact of permanent land occupation is little. The construction of project pipelines features temporary land occupation, and produces partial and temporary impact and is restorable after the construction is over. The unfavorable impact upon landscape in the construction period of the project is short-term and restorable. The construction segments of the project with probable land erosion are mainly ground excavation in pipeline laying, and the construction of reclaimed water facility, wastewater disposal and recycling facility and artificial wetland of Wuliangsuhai Lake as well as earthwork excavation. The land erosion impact of pipelines construction on the construction stage strictly in conformity with the water and land conservation proposal and managing measures defined by various works is under control. Floating substance of sea area grid waterway works of Wuliangsuhai Lake in the construction will shape a high-density floating substance distribution zone in some scope around the construction site, which may consequently cause a decline of aquatic plankton, zooplankton variety and quantity. However, such impact is reversible. With the completion of the engineering construction, such impact will disappear soon. Floating substance of stability pond and deposition pond of artificial wetland works of Wuliangsuhai Lake in construction will shape a high-density floating substance distribution zone in some scope around the construction site, which may consequently cause a decline of aquatic plankton, zooplankton variety and quantity. However, such impact is reversible. With the completion of the engineering construction, such impact will disappear soon.
(6) Appraisal Conclusion of Social Environmental Impact The impact upon traffic in construction period has three aspects: � road is broken in pipeline construction and the traffic is hindered; �earthwork pile-up and road excavation hinder the traffic; and, � transport vehicles will increase the vehicle flow on the road. For ensuring construction safety, overall medical examination is required for all construction persons on the site, and any person with infectious diseases should be prohibited on the construction site; regular medical examination is required for the working staff of mess, and any person with epidemic disease should be timely treated and transferred out of the mess immediately for preventing the prevalence of the disease. The construction site should be provided with centralized water supply facility. Water source should be sterilized and monitored. Medical service facilities should be available on construction site. Proper labor protection should be provided for construction personnel for their health and safety and smooth implementation of the project. 12.4.2 Environmental Impact in Operation Period 12.4.2.1 Air Environmental Impact In the operation period of the planned reclaimed water supply works, the sludge disposal area will emit some stench, and the sterilizing device may emit chlorine dioxide and chlorine gas in abnormal working status. Chlorine adding room is equipped with alkaline solution spraying facility. Therefore, no obvious impact will occur on atmospheric environment. The site of wastewater treatment and recycling works of the project is within relevant processing park. Analogy analysis reveals that stench substance will have no impact upon surrounding villages. A preset 150m sanitation protection distance is reasonable. Moreover, the most adjacent sensitive target is 200m away from the boundary of wastewater treatment & recycling works of processing park of Wulateqianqi County. The impact of stench pollutant is slight. The waste gas of the artificial wetland works of the sea area the project of Wuliangsuhai Lake mainly includes CO2 in microbe decomposition as well as the stench from rotten plant & animal and living microbes, is little and has emission concentration in conformity with the Grade-II standard of the allowed highest concentration of plants in Emission Standards on Pollutants of Urban Wastewater Disposal Plant (GB18918-2002). 12.4.2.2 Water Environmental Impact Wastewater treatment and recycling works of the project produces reclaimed water for industrial enterprises in processing park with no wastewater, is able to save 22.63 million m3/a water resources, reduce a pollutant emission of the valley i.e. CODcr by 10950.0t/a, BODcr by 6022.5t/a and ammonia nitrogen by 730.0t/a at designed wastewater scale and plays significant role in cutting off total water pollutants of the region after put into operation. The planned reclaimed water supply works can reasonably dispatch water resources, boost utilization efficiency of water resources, reduce exploitation of underground water resources by 51.024 million m3, protect underground water resources, alleviate the continuously declining status of underground water, and prevent the expansion of funnel area. Moreover, it can cut off the emission in the valley i.e. CODcr by 2847.0t/a, BOD by 1335.9 t/a & ammonia nitrogen by 491.29t/a, and improve water environment of the region. Backwash water of filtration sink, sludge water of deposition sink, waste water in sludge pressure filtration produced in the operation of various works of the project are recycled. The ultra-filtration and hyper-filtration tail water in Sanbaigan reclaimed water supply works, Qibaigan reclaimed water supply works and reclaimed water supply works of Ganqimaodu Port Processing Park all is sent to the front water distribution terminal after deposition treatment for recycling treatment with the raw water of reclaimed water. Waste water isn’t discharged. Different disposal measures and modes are applied for the domestic wastewater of reclaimed water supply works according to the infrastructure around the works. The wastewater of reclaimed water supply works of processing park of Wulatehouqi County is sent to the wastewater disposal works of the processing park of Wulatehouqi County for treatment; domestic wastewater of Sanbaigan reclaimed water supply works is sent to Sanbaigan wastewater disposal plant to the north of the works for treatment; domestic wastewater of Qibaigan reclaimed water supply works is sent to Qibaigan wastewater disposal plant to the north of the works for treatment; and the domestic wastewater of reclaimed water supply works of Ganqimaodu Port Processing Park is treated in underground biochemical treatment equipment in conformity with Urban Wastewater Recycling—Quality of Urban Water for Different Purposes (GB/T18920-2002), and used for different purposes in the plant, instead of any emission. After completed, ecologic-transitional-belt artificial wetland of Wuliangsuhai Lake of the project can cut off the pollutants discharged into the lake: CODcr by 9781.19 t/a, NH3-N by 1990.57t/a & 299.24t/a. The model predicts that in non-frozen period, outlet water quality could reach Cat-IV standard (average) of the State’s Quality Criteria on

Surface Water Environment GB3838-2002. That is to reduce pollutant concentration of water: CODCr 30mg/l, TP 1.5mg/l and TP 0.1mg/l. In sum, after the project is completed, the total reduction of pollution loads of Wuliangsuhai Lake is: COD by 23578.19t/a, TP by 458.38t/a. Therefore, the project has no negative impact upon the surface water environment. With the implementation of the project, the trend of serious pollution of Wuliangsuhai Lake will be preliminarily controlled. The quality of water returning from Wuliangsuhai Lake into the Yellow River will be largely improved. 12.4.2.3 Sound Environmental Impact The predicted plant noise values of reclaimed water supply works and wastewater treatment and recycling works all comply with Grade-II standards in Criteria on Plant Noises of Industrial Enterprises (GB12348-90). The results of overlapping with present noises prove that with no densely populated point around the plant site, the impact of various noises upon prediction points aren’t exceeding the standard at daytime and night after the project is completed. As a result, in operation period, the equipment noises of reclaimed water supply works and wastewater treatment and recycling works have little impact upon the surrounding environmental. Water pumps of sea-area artificial wetland of Wuliangsuhai Lake in operation period produce high noises value and strong strike, and some may last for long time with violent shock. With the construction area 5-10km away from natural protection zone, the impact will occur for the birds in the region in nidification, food seek, wooing and hatching under national protection. 12.4.2.4 Solid Waste Impact (1) The solid wastes of the reclaimed water supply works in operation may include domestic garbage and dehydrated sludge. The output of solid waste of various reclaimed water supply works is included in Table 3.3-5. The plant area is set up with garbage station, where domestic garbage and dehydrated sludge will be piled up together, and regularly cleaned & transported to local garbage plant for burial treatment. Therefore, it has no impact upon the environment. (2) The solid waste of wastewater treatment & recycling works of processing park after put into production mainly includes domestic garbage, bar residue, deposited sand and biochemical sludge. The output of solid waste of wastewater treatment and recycling works of processing park is included in 3.3-12.
� The plant area is set up with garbage station, where domestic garbage will be piled up together, and regularly cleaned & transported to local garbage plant for burial treatment. Therefore, it has no impact upon the environment. � The bar residue, deposited sand and biochemical sludge of wastewater treatment and recycling works of processing park will be treated as different categories. Set up bar residue and deposited sand drying yard for lowering the water content; set up a sludge-piling shed for temporary storage of sludge with canopy on top. The ground of piling shed must be completely hardened, and cofferdam, drainage ditch and collecting well should be set around piling shed. The drainage in sludge piling process should be sent back to the wastewater disposal system for circulation and treatment. The impact of sludge piling upon shallow underground water around the plant site should be prevented. Sludge is regularly transported to Baotou Dangerous Waste Disposal Center of Inner Mongolia (in the middle and west of Inner Mongolia) for burial treatment.
Closed tank is used for sludge transport in order to avoid public hazard in the transport. 12.5 Relief Measures of Environmental Impact The environmental protection measures of the project involve two stages i.e. construction period and operation period, including the relief measures of water environmental impact, ecologic environment, atmospheric environmental impact and noises pollution as well as water & soil conservation measures. Generally speaking, the relief measures of environmental impact of the project are feasible by and large. If relief measure of environmental pollution of the project is well-prepared, pollutant emission can comply with the standard. The investment of the project for the environment protection is RMB63.8675 million, accounting for 6.41% of the total investment of the project. 12.6 Conclusion of Analysis on Environmental Benefits The project through the construction of reclaimed water supply works and wastewater treatment and recycling works of processing park and implementation of integrated sea-area improvement works of Wuliangsuhai Lake can dispatch the water resources comprehensively, improve utilization rate of water resources, adjust a water demand conflict between
industry and agriculture, and promote and drive regional economic cooperation and development; cut off pollutant emission, improve water environment quality of Wuliangsuhai Lake, protect and restore ecologic environment of Wuliangsuhai Lake, and have decisive impact on urban infrastructure construction, ecologic environment protection and even the development of national economy and society in the project area. The project can (1) improve the water environment quality of Bayannaoer Municipality, and protect and restore water ecologic environment of Wuliangsuhai Lake; (2) improve the production and living conditions of local residents, and living quality and health level of the people; (3) promote the development of reed industry, fishery and tourism in project region through the improvement of water ecologic environment of Wuliangsuhai Lake; (4) promote market-oriented construction and management of the infrastructure of Bayannaoer Municipality through importing and referring to sophisticated technique and management experiences at home and abroad, and realize the favorable self-development of urban infrastructure; (5) boost up harmonious development of environment, economy and society of Bayannaoer Municipality, and create favorable condition for the sustainable development strategy and overall development of well-off society of Bayannaoer Municipality. The project with good environment, social and economic benefits complies with the national and local national economy development planning, and is able to promote the sustainable development of Bayannaoer Municipality. 12.7 Conclusion of Public consultation The results of surveys on public consultation in several rounds reveal that 95% of the public support the project and hold no objection. Main opinions and proposals include: waste water, noises, flying dust, garbage, land occupation in construction, and the damage to vegetation and wildlife habitat of Wuliangsuhai Lake must be considered in project construction and operation; construction unit should strengthen the supervision over environmental protection, ensure normal operation of environmental protection facility, control pollutant emission; strengthen the management and supervision, prevent “sudden accident”, and define emergency handling proposal. 12.8 General Conclusion In sum, the project complies with the industrial policies, laws and statutes, relevant environmental appraisal policies of the World Bank, and overall urban development planning, environmental function zone and ecologic environment function zone planning of Bayannaoer Municipality, and features reasonable site selection by and large. After it is completed, the project is predicted with good environmental benefits, economic benefits & social benefits and can dispatch water resources reasonably, improve utilization rate of water resources, save water resources; and after implemented, the project can cut off total pollutant emission in lake water i.e. COD by 23578.19t/a and TP by 458.38t/a, improve water environment quality of Bayannaoer Municipality and the water circulation of sea area of Wuliangsuhai Lake, retard paludification process, and protect and restore ecologic water environment. Through environmental protection and prevention measures, the pollutant emission is controlled within allowed limit, and water environment quality of Wuliangsuhai Lake can be obviously improved. Obviously, the project is feasible with regard to environmental protection after the substitute proposal, relief measures, environment management plan, public negotiation and other countermeasure and measures submitted by the project are employed.
Attachment 1 Advertisement for EIA Report Disclosure
Attachment 2 Certificate Letter from Bayannaoer Library on EIA Report Disclosure