
E1895 vol. 3 rev. - World Bank Documents & Reports
205
Municipal Solid Waste Management & Carbon Finance in Amman Greater Amman Municipality Environmental and Social Impact Assessment Final Environmental & Social Impact Assessment (ESIA) Report Prepared by: June 22 nd , 2008 E1895 vol. 3 rev. Public Disclosure Authorized Public Disclosure Authorized Public Disclosure Authorized Public Disclosure Authorized Public Disclosure Authorized Public Disclosure Authorized Public Disclosure Authorized Public Disclosure Authorized
-
Upload
khangminh22 -
Category
Documents
-
view
2 -
download
0
Transcript of E1895 vol. 3 rev. - World Bank Documents & Reports

Municipal Solid Waste Management & Carbon Finance in Amman
Greater Amman Municipality
Environmental and Social Impact Assessment
Final Environmental & Social Impact Assessment (ESIA) Report
Prepared by:
June 22nd, 2008
E1895 vol. 3 rev.
Pub
lic D
iscl
osur
e A
utho
rized
Pub
lic D
iscl
osur
e A
utho
rized
Pub
lic D
iscl
osur
e A
utho
rized
Pub
lic D
iscl
osur
e A
utho
rized
Pub
lic D
iscl
osur
e A
utho
rized
Pub
lic D
iscl
osur
e A
utho
rized
Pub
lic D
iscl
osur
e A
utho
rized
Pub
lic D
iscl
osur
e A
utho
rized

ECO Consult
Municipal SWM & Carbon Finance
2
TABLE OF CONTENTS
1. INTRODUCTION ...................................................................................................... 28 1.1 THIS REPORT........................................................................................................... 28 1.2 BACKGROUND TO THE PROJECT ................................................................................. 28 1.3 APPROACH AND ASSESSMENT METHODOLOGY ............................................................ 31
2. PROJECT DESCRIPTION .......................................................................................... 33 2.1 PROJECT OBJECTIVES AND KEY PERFORMANCE INDICATORS........................................... 33 2.2 LANDFILL CONSTRUCTION AND UPGRADE OF LEACHATE TREATMENT PLANT .................. 35
2.2.1 Construction of Cell 3 and Operation of Cells 2 & 3................................................. 35 2.2.2 Leachate Treatment Plant ................................................................................... 37
2.3 CONSTRUCTION OF A LANDFILL GAS (LFG) EXTRACTION SYSTEM AND LFG-ENERGY PLANT .. 38 2.3.1 Closure and Rehabilitation of Cell 1 ...................................................................... 39 2.3.2 LFG Extraction Wells ........................................................................................ 39 2.3.3 LFG Collection Pipes ......................................................................................... 40 2.3.4 Blower or Gas Pumps......................................................................................... 40 2.3.5 LFG Treatment: Flaring and Electricity Generation................................................. 40
2.4 TRANSFER SERVICES ................................................................................................ 41 2.4.1 New Transfer Stations ....................................................................................... 41
3. LEGAL AND INSTITUTIONAL FRAMEWORK ........................................................ 43 3.1 LEGAL FRAMEWORK ASSOCIATED WITH ENVIRONMENTAL APPROVALS ........................... 43 3.2 LEGAL FRAMEWORK ASSOCIATED WITH THE TRANSFER STATIONS................................... 45 3.3 LEGAL FRAMEWORK ASSOCIATED TO THE LANDFILL AND LEACHATE TREATMENT PLANT .. 49 3.4 LEGAL FRAMEWORK ASSOCIATED TO THE LFG TO ENERGY PLANT .................................. 52 3.5 INSTITUTIONAL FRAMEWORK ASSOCIATED WITH THE PROJECT ....................................... 53
3.5.1 Institutional Framework for SWM Operations and Follow up.................................... 53 3.5.2 Institutional Framework for Environmental Clearance and Ongoing Performance Monitoring ……………………………………………………………………………………...55 3.5.3 Applicable World Bank Policies............................................................................ 55
4. CONSULTATION AND PUBLIC DISCLOSURE ........................................................ 57 4.1 PURPOSE AND REQUIREMENTS OF CONSULTATION:....................................................... 57 4.2 SCOPING SESSION.................................................................................................... 57 4.3 SECOND PUBLIC CONSULTATION SESSION ................................................................... 61
5. BASELINE ENVIRONMENT ..................................................................................... 64 5.1 EXISTING CONDITIONS AT GHABAWI LANDFILL .............................................................. 64
5.1.1 Conditions of Cell 1 ........................................................................................... 65 5.1.2 Conditions of Cell 2 ........................................................................................... 67 5.1.3 Leachate Treatment Plant ................................................................................... 68
5.2 PHYSICAL ENVIRONMENT AT GHABAWI...................................................................... 70 5.2.2 Socio-Economic Environment at Ghabawi.............................................................. 81
6. EXISTING AND POTENTIAL ENVIRONMENTAL & SOCIAL IMPACTS OF THE PROJECT ...................................................................................................................... 85
6.1 PROJECT SIGNIFICANT IMPACTS ................................................................................ 90 6.1.1 Benefits of the Project......................................................................................... 90 6.1.2 Drawbacks of the Project..................................................................................... 91
6.2 GHABAWI LANDFILL AND LEACHATE TREATMENT PLANT UPGRADE .............................. 91 6.2.1 Construction of Cell 3 and Leachate Treatment Plant ............................................... 91 6.2.2 Operation of the Ghabawi Landfill and the Leachate Treatment Plant.......................... 92
6.3 LANDFILL GAS TO ENERGY PLANT AND CELLS CAPPING................................................... 95 6.3.1 Construction of LFG Plant and Capping................................................................ 95 6.3.2 Operation of LFG Plant ...................................................................................... 96
E1895 vol. 3 rev.

ECO Consult
Municipal SWM & Carbon Finance
3
6.5 TRANSFER STATIONS................................................................................................ 99 6.5.1 Construction of Two New Transfer Stations........................................................... 99 6.5.2 Operation of the New Transfer Stations................................................................100
7. ANALYSIS OF ALTERNATIVES ..............................................................................103 7.1 STRATEGIC WASTE MANAGEMENT ALTERNATIVES ......................................................103
7.1.1 Decentralized versus Centralized Landfill .............................................................103 7.1.2 Increased Pre-Landfill Intervention......................................................................104
7.2 TRANSFER ALTERNATIVES........................................................................................107 7.2.1 No Project - Current Situation ..........................................................................107 7.2.2 Two Additional Transfer Stations........................................................................107
7.3 TREATMENT ALTERNATIVES ....................................................................................109 7.3.1 No project – Current Situation ...........................................................................109 7.3.2 Leachate Treatment Only...................................................................................109 7.3.3 LFG Flaring ....................................................................................................109 7.3.4 Gas to Energy Production ..................................................................................109 7.3.5 Full project (LT & LFG flaring & generation)........................................................110
7.4 LEACHATE TREATMENT ALTERNATIVES .....................................................................112 7.4.1 No project – Current Situation ...........................................................................112 7.4.2 Typical Treatment ............................................................................................112 7.4.3 Synthesis Approach ..........................................................................................113
8. MITIGATION AND MONITORING ........................................................................116 8.1 GROUNDWATER MONITORING PROGRAM ..................................................................116 8.2 AMBIENT AIR QUALITY MONITORING PROGRAM.........................................................116 8.3 LEACHATE QUALITY MONITORING ...........................................................................116 8.4 SITE SELECTION FRAMEWORK FOR NEW TRANSFER STATIONS........................................117 8.5 EMERGENCY ACTION PLAN .....................................................................................119
9. INSTITUTIONAL STRENGTHENING & COMPLIANCE; ........................................121 9.1 PROJECT MANAGEMENT UNIT (PMU) .......................................................................121 9.2 IMPLEMENTING THE EMP........................................................................................121 9.3 REQUIRED CAPACITY ..............................................................................................122 9.4 TRAINING .............................................................................................................122
10. ENVIRONMENTAL MITIGATION PLAN ..............................................................124 10.1 INSTITUTIONAL RESPONSIBILITIES OF PARTIES INVOLVED ............................................124 10.2 ENVIRONMENTAL AND SOCIAL MANAGEMENT PLAN (ESMP) ....................................124
REFERENCES ANNEX I: AIR QUALITY ASSESSMENT ANNEX II: WATER RESOURCES QUALITY ASSESSMENT ANNEX III: BIODIVERSITY ASSESSMENT ANNEX IV: MINUTES OF MEETING – SECOND PUBLIC CONSULTATION SESSION
E1895 vol. 3 rev.

ECO Consult
Municipal SWM & Carbon Finance
4
LIST OF TABLES Table 2.1: Planning of Construction and Operation of Cell 3………………......................................36 Table 2.2: Comparison of Cells 1, 2 & 3 proposed capacities ………………………………………..37 Table 3.1: Regulations Applying to Each of the Project Components to Limit the Environmental
Risks Associated ……………………………………………………………………………...45 Table 3.2: The standard lists the allowable emission limits for air pollutants …………………….48 Table 3.3: Maximum Allowable Noise Levels ………………………………………………………..49 Table 4.1: List of environmental issues included in the Scoping Report…………………………...60 Table 4.2: List of Comments and Responses Addressed at the Second Consultation Session…...62 Table 5.1: Mean Temperatures, Precipitation, Evaporation and Humidity data from 1976-2005..71 Table 5.2: Al -Ghabawi Leachate Characteristics (only tested quality parameters are reported...75 Table 5.3: Characteristics of the Groundwater from the well at Al-Ghabawi Landfill contrasted
to the Jordanian Standard (DJS 286: 2007), only tested parameters are reported………77 Table 5.4: Average concentrations of Al Ghabawi Landfill gases in parts per million by volume
(ppmv) in the three monitored sites ..………………………………………………………79 Table 5.5: Wind Speed and Direction Measured in the Period of February 6-7th, 2008……….....80 Table 5.6: Landfill Surrounding Population…………………………………………………………..83 Table 5.7: Nearest Main Roads to Ghabawi Landfill.………………………………………………....84 Table 5.8: Nearest Infrastructures to Ghabawi Landfill……………………………………………...84 Table: 6.1 Characterization of Impacts resulting from the Implementation of Each Project
Component..………………………………………………………………………………….88 Table 7.1: Relative Environmental Impacts of Strategic Options…………………………………..107 Table 7.2: Relative Environmental Impacts of Leachate Treatment Options...…………………...109 Table 7.3: Relative Environmental Impacts of Strategic Options..………………………………..112 Table 7.4: Relative Environmental Impacts of Leachate Treatment Options...…………..............116 Table 8.1: Monitoring Parameters for Groundwater Sampling...…………………………………..117 Table 8.2: Monitoring Parameters for Leachate Sampling..………………………………………...118 Table 8.3: Environmental Site Selection Criteria……………..............................................................119 Table 8.4: Priority Scale for Transfer Stations’ Selection Criteria......................................................120 Table 9.1: ESMP-Institutional Strengthening Summary…... ……………………………………….125 Table 10.1: ESMP-Mitigation Plan for Construction and Operation ..…………………………….128 Table 10.2: ESMP Monitoring Plan for Construction and Operation..…………………………….133 Table 10.3: ESMP-Institutional Strengthening Summary..... ……………………………………….134
E1895 vol. 3 rev.

ECO Consult
Municipal SWM & Carbon Finance
5
LIST OF FIGURES
Figure 1.1: Expansion of GAM Districts per year in the last Century……………………………....30 Figure 1.2: Basic design for the Ghabawi Landfill included in CM’s Priority Project in 2002 …...31 Figure 2.1: Leachate Drainage System at Cell 2 ….…………………………………….……………...38 Figure 2.2: Location of the Existing Transfer Stations and the Ghabawi Landfill………………….43 Figure 4.1 Scoping Session Presentation………………………………………………………………..59 Figure 5.1: Panoramic View of Ghabawi Landfill …………………………………………………….65 Figure 5.2: Existing Conditions of Cell 1 where SW is accumulating Out of the cell limits……....65 Figure 5.3: Leachate Emergency Ponds at Ghabawi Landfill…………………………………...........67 Figure 5.4: Installation of Geo–synthetic Materials for Environmental Protection ……………......69 Figure 5.5: General Excavation and Installation of Drainage Pipes in Cell 2 ………………………69 Figure 5.6: Evaporation Pond constructed as part of the Leachate Treatment Plant ………..........70 Figure 5.7: Leachate Treatment System ….………………………………………………………….....71 Figure 5.8: Leachate Accumulated in the Western Side of Cell 1 ……………………………...........73 Figure 5.9: Leachate & Groundwater Sampling Locations at the landfill site ……………………..75 Figure 5.10: Existing well at the Landfill Site …………………………………………………………77 Figure 5.11: Air Quality Sampling Locations at the landfill site…………. .………………………........78
E1895 vol. 3 rev.

ECO Consult
Municipal SWM & Carbon Finance
6
ACRONYMS
AC: Advisory Committee ACES: Arab Center for Engineering Studies BOD: Biochemical Oxygen Demand CDM: Clean Development Mechanism CDM-PDD: Clean Development Mechanism Project Design Document CEMP: Construction Environmental Management Plan CERs: Certified Emission Reductions CM: Cabinet Merlin COD: Chemical Oxygen Demand DB-CTSL: Design & Build Contractor – Collection, Transfer Stations & Landfill DBO: Design-Build-Operate DBO-LFG: Design, Build & Operate Contractor – LFG-Energy Plant DoA: Department of Antiquities DOE: Designated Operational Entity EH&STP: Environment, Health & Safety Training Plan EMP: Environmental Management Plan EPA: Environmental Protection Agency EPS: Environmental Protection Section ERPA: Emission Reduction Purchase Agreement ESIA: Environmental & Social Impact Assessment ESIS: Environmental & Social Impact Statement GAM: Greater Amman Municipality GCL: Geosynthetic Clay Liner GHG: Greenhouse Gas HDPE: High Density Polyethylene Geomembrane H&S: Health & Safety IBRD: International Bank for Reconstruction and Development JISM: Jordan Institute for Standards and Meteorology JVA: Jordan Valley Authority LFG: Landfill Gas LT: Leachate Treatment MoE: Ministry of Environment MSWM: Municipal Solid Waste Management NGOs: Non Governmental Organizations OEMP: Operation Environmental Management Plan PMU: Project Management Unit PPE: Personal Protective Equipment PSP: Private Sector Participation QA: Quality Assurance QC: Quality Control RPF: Resettlement Policy Framework RSS: Royal Science Society SW: Solid Waste SWM: Solid Waste Management SWMDP: Solid Waste Management Development Plan TDS: Total Dissolved Solids TOR: Terms of Reference TSP: Total Suspended Particulates UNFCCC: The United Nations Framework Convention on Climate Change WAJ: Water Authority of Jordan WB: World Bank
E1895 vol. 3 rev.

ECO Consult
Municipal SWM & Carbon Finance
7
EXECUTIVE SUMMARY
Introduction
1. This executive summary is aimed at presenting the main findings of the Environmental and Social Assessment conducted for Municipal Solid Waste Management and Carbon Finance Project in Amman. The objective of the environmental and the social assessment is to examine the environmental, economic, physical, and biological impacts in the areas which may be affected by the project, and propose mitigation measures, as well as construction and operation environmental management and monitoring plans.
2. This executive summary is intended to be a self-contained, stand-alone document that can be relied upon to provide major information necessary to understand the environmental and social sensitivities, potentially significant impacts, and mitigation measures to be undertaken under the proposed project. The reader is referred to the main body of the environment and social impact assessment report for specific information or further details not presented in depth in this summary, in particular for a description of the existing social and ecological environment as well as relevant baseline data.
The proposed project falls under the World Bank environmental category A classification due to its size, magnitude, severity, and irreversibility of potential environmental impacts. Of the World Bank’s ten safeguard policies, two policies are triggered: Operation Policy (OP) 4.01 on Environmental Assessment and Operational Policy (OP) 4.12 Involuntary Resettlement. This executive summary was prepared on order to comply with OP 4.01 a full Environmental and Social Impact Assessment (ESIA) was carried out by a Jordanian independent consulting firm, ECO CONSULT, according to the Terms of Reference approved by the World Bank, prepared the ESIA report . Furthermore in order to comply with OP 4.12, a resettlement policy framework (RPF) has been prepared and was disclosed in a separate document. This ESIA was also carried out in accordance with Jordanian regulations Background In 2006 the Greater Amman Municipality (GAM) initiated the preparation of a new investment project to enhance the existing conditions of Municipal Solid Waste Management in Amman. The project included the construction of new cells at the existing landfill site at Ghabawi and the construction of a Leachate Treatment Plant. However, the construction activities were delayed and the environmental conditions at the landfill continued to be at risk. As a consequence, GAM requested financial and technical assistance from the World Bank to prepare and implement an Integrated Municipal Solid Waste Management Project. Project Objective The development objective of the proposed project is to strengthen the operational, financial, and environmental performance of municipal solid waste management in Amman. More specifically, the project will help: (i) environmentally upgrade and expand the existing municipal solid waste landfill of El Ghabawi to meet the city’s disposal needs up to 2014 and generate “green” electricity while mitigating GHGs; and (ii) improve the cost effectiveness of the existing municipal solid waste collection and transport system, improve overall cost recovery, and encourage the private sector participation in municipal solid waste management. The total project cost was estimated
E1895 vol. 3 rev.

ECO Consult
Municipal SWM & Carbon Finance
8
at US$ 39.4 million of which the World Bank will provide a loan to GAM guaranteed by the Government of Jordan, of US$ 18.0 million The project’s objectives will be achieved through two main components: 1. Institutional strengthening and capacity development of GAM 2. Investment component:
2.1: Landfill construction and upgrade of leachate treatment facility 2.2: Construction of two transfer stations 2.3: Construction of an LFG recovery system
Location of the Existing Transfer Stations and the Ghabawi Landfill
ESIA Methodology To carry out the ESIA Study, several approaches and processes were applied individually and collectively. The study extended over 3 months and involved several visits to the Ghabawi Landfill and the existing transfer stations, in addition to meetings with Solid Waste Management representatives, the consulting company who is carrying out the Feasibility Study for the project, Cabinet Merlin, and the World Bank. A Scoping Session was held in 5th February 2008, and comments from this were taken into consideration during the assessment. Site monitoring and laboratory analysis techniques were employed for air quality monitoring, surface water and biodiversity at the landfill site and its surroundings. Leachate and groundwater samples were taken and analyzed to examine the pollution levels and extents from the uncontrolled leachate generation around Cell 1 resulting from malfunction of the leachate collection system.
E1895 vol. 3 rev.

ECO Consult
Municipal SWM & Carbon Finance
9
The project will also finance the construction of two transfer stations that were not yet identified at the time of appraisal. Site selection analysis as well as generic mitigation and monitoring measures were included in the ESIA report and its Environment and Social Management Plan (ESMP). Once the final sites of the two proposed transfer stations areidentified and approved, and environment and social management plan (ESMP) will be conducted in accordance with the World Bank policies and Jordanian regulations Project Description The fulfilment of GAM’s objective of enhancing Municipal Solid Waste Management includes strategic planning, policy-setting and regulations, in addition to increasing the private sector participation involved in Municipal Solid Waste services provision. As a result of discussions carried out between GAM and the World Bank, the project components as defined for this study are: (i) Institutional Strengthening and Capacity Development, which includes strategic planning and Private Sector Participation; development of information systems to track the performance of the MSWM services; public information, education and communication program, in addition to training and capacity development in the CDM; (ii) Infrastructure Investment, including the landfill construction and upgrading of the leachate treatment, construction of two new transfer stations and construction of the landfill gas recovery system; (iii) a project management component. Legal and Institutional Framework An overview of the key environmental, health & safety and planning legislation and regulations of relevance to each project component were taken into account during the ESIA. The environmental regulatory context for Solid Waste Management including laws, regulations and standards are also described in the Legal Section. The most relevant regulations considered during the assessment and the development of mitigation and monitoring measures are the Solid Waste Management Regulation No. 27/2005, the Environment Protection Law No. 52/2006, the Environmental Impact Assessment Regulation No. 37/2005, the Ambient Air Quality Standards JS 1140/2006, the Maximum Allowable Limits of Air Pollution Emitted from Stationary Sources JS 1189/2006, the Groundwater Control Regulation No. 85/2002 and the Labour Law No. 8/1996, regarding occupational health, work and injuries and occupational diseases. Based on these regulations, a control framework has been established to guarantee that the minimum standards for groundwater, air, health & safety for residents and SW workers are established as well as the protection of the environmental resources potentially affected by the project is ensured. Additionally, the Decree (12) of 1987, commonly referred to as the Land Acquisition Law, has been taken into consideration as it is the Regulation that applies in all cases of land acquisition in the Kingdom, which will be potentially happening for the construction of the new transfer stations. However, this regulation has been described more in detail in the Resettlement Policy Framework (RPF) for the Ghabawi Landfill and the Transfer Stations Report. In addition, the international conventions governing the conservation of biodiversity and the control of greenhouse gases emissions have been considered, and their relevance to each of the components assessed. Finally, a revision of the institutions and ministries directly related to the environmental issues associated with the project was conducted to identify and furthermore, recommend, institutional strengthening and capacity building development.
E1895 vol. 3 rev.

ECO Consult
Municipal SWM & Carbon Finance
10
Scoping A Scoping and Consultation Session with the stakeholders and the government agencies was held on February 5th, 2008. The project was presented in the Scoping Session and the opinions and main issues discussed were recorded. Moreover, a list with issues included in the GAM/World Bank Terms of Reference together with the scoping discussions related to these items, and the final list of issues included in the Scoping Report were identified and addressed in this ESIA. See below the table summarizing the main issues discussed:
GAM/WB TOR Listed Issues Scoping Session Discussions Status in the final Scoping
Report/TOR
Surface Water Quality
The landfill site is located in a dry area with no permanent water bodies. The landfill site is dry with rainfall of less than 150 mm/year. The participants discussed the potential of leachate water runoff to the water catchment, and concluded that is not likely for this to happen.
Excluded from the ESIA study
Groundwater Quality
This issue was discussed at length in the scoping session. Many participants including the Ministry of Water and irrigation and the Water Authority of Jordan indicated that groundwater is a very precious resource that warrant extensive analysis in the ESIA study to ensure that the levels of impacts on groundwater aquifers quality are assessed, and that existing and future water users will not be affected
Included as a significant issue for ESIA Study
Geology
The geology of the area is inherently related to the groundwater conditions. Depending of the existing geology at the landfill the risk of leachate reaching the groundwater table will vary and therefore, it has to be included in the assessment. This parameter was not discussed during the Scoping Session but it will be considered during the assessment.
Included in the ESIA Study
Topography
The same as geology, the topography of the landfill site will determine the leachate flow direction which influences the potential risk of soil and groundwater contamination. This parameter was not discussed during the Scoping Session but it will be considered during the assessment.
Included in the ESIA Study
Soil
This issue was discussed during the Session in several occasions. The need to study the interaction between the leachate and the soil was pointed out. The potential uncontrolled leachate generation is currently impacting the soil in some areas of Cell 1 and there’s a potential risk that other areas will be contaminated if the construction of Cells 2 & 3 is done incorrectly.
Included as a significant issue for ESIA Study
Climate and Meteorology
These parameters will determine the amounts of leachate generation as a consequence of the rainfall received in the area as well as the evaporation rate caused by high temperatures. These parameters were not discussed during the Scoping Session but they will be considered during the assessment.
Included in the ESIA Study
Air Quality, including Existing Sources of Air
Emissions
The potential impacts on Air Quality such as odour generation affecting population nearby the existing and future transfer stations as well as at the landfill was discussed during the Session. In addition, the improvements of Air Quality by constructing the
Included as a significant issue for ESIA Study
E1895 vol. 3 rev.

ECO Consult
Municipal SWM & Carbon Finance
11
GAM/WB TOR Listed Issues Scoping Session Discussions Status in the final Scoping
Report/TOR LFG-to Energy Plant and reducing the LFG emissions were pointed out.
Coastal and Oceanic Parameters
Not discussed and not applicable Not applicable in this Study
Existing Water Pollution Discharges
The existing leachate contamination and the potential discharges resulting from an incorrect installation of the lining systems were also extensively discussed during the Session and pointed out as one of the main issues to be assessed during the ESIA. In addition, several treatment procedures for the leachate discharges were discussed by the attendees.
Included as a significant issue for ESIA Study
As mentioned before, the potential groundwater contamination resulting from leachate infiltration in the soil and sub-soil layers was addressed during the discussion.
Included as a significant issue for ESIA Study Receiving Water
Quality Regarding the risk of leachate reception in the surface water catchments, it was concluded that is not likely for this to happen.
Excluded from the ESIA Study
Biodiversity
This issue was discussed during the Scoping Session. There is a need to study and assess the potential impacts on existing flora, fauna and the existence of rare or endangered species, sensitive habitats and species of commercial importance that may be affected by the construction and operation of the project components. In addition, the study of species with potential to become nuisance, vectors or dangerous will have to be carried out.
Included in the ESIA Study
Population
The existing population living nearby the transfer stations and the landfill may be impacted from traffic and odour impacts. However, during the Session the participants indicated that there are no concerns related to the existing transfer stations. Once the location of the new transfer station is identified, potential impacts on nearby residents will have to be assessed.
Included in the ESIA Study
Land Use
This issue has to be taken into consideration as one of the criteria parameters to be assessed during the Suitability Study for new locations of transfer stations.
Included in the Feasibility Study for new locations but not in the ESIA Study
Involuntary Resettlement
This issue has to be taken into account during the selection assessment for locations of the new transfer stations.
Included in the Resettlement Policy Framework document but not in the ESIA Study
Planned Development Activities
This issue has to be taken into consideration as one of the criteria parameters to be assessed during the Suitability Study for new locations of transfer stations. The new Amman Master Plan which includes the future developments planned for GAM has to be considered during the Suitability Study.
Included in the Feasibility Study for new locations but not in the ESIA Study
Community Structure
The landfill site is far away from communities and commercial activities. However, for new transfer stations this issue will be discussed when locations are identified.
Included in the ESIA Study
Employment
From the implementation of the different project components the number of workers involved in SWM may vary. There is a clear need for workers at the landfill to construct and operate the new facilities. This issue was not addressed during the Scoping Session but will be assessed during the ESIA Study.
Included in the ESIA Study
Distribution of Income The landfill site is far away from communities and Included in the ESIA Study
E1895 vol. 3 rev.

ECO Consult
Municipal SWM & Carbon Finance
12
GAM/WB TOR Listed Issues Scoping Session Discussions Status in the final Scoping
Report/TOR commercial activities. However, for new transfer stations this issue will be discussed when locations are identified.
Goods and Services
The landfill site is far away from communities and commercial activities. However, for new transfer stations this issue will be discussed when locations are identified.
Included in the ESIA Study
Recreation Activities
The landfill site is far away from communities and commercial activities. However, for new transfer stations this issue will be discussed when locations are identified.
Included in the ESIA Study
Public Health
The need to assess the potential impacts on public health for residents living nearby the new transfer stations was discussed. In addition, the need to protect workers from direct contact with SW at the existing transfer stations and the landfill was also pointed out.
Included in the ESIA Study
Cultural Properties
A preliminary Suitability Study for the landfill location was already carried out in 2002 where no cultural or archaeological heritage was found. Therefore, this issue was not mentioned during the Session. However, in the case any site was discovered during the construction of the new landfill facilities or the excavation works for new cells, the Department of Antiquities will be informed.
Included in the ESIA Study
Tribal Peoples Not applicable Not applicable
Attitudes A public consultation process will take place to assess the attitudes from nearby residents towards the new transfer stations once their locations are identified.
Included in the ESIA Study
Customs and Aspirations
Not applicable Not applicable
Description of Baseline Environment An assessment of the existing conditions related at Ghabawi Landfill, was conducted. Currently, there are only two cells constructed at the landfill: Cell 1, which has been operational since 2003 and whose maximum capacity has significantly been exceeded, and Cell 2, which started being operational in April 2008. Both cells were constructed based on Cabinet Merlin Feasibility Study conducted in 2002 but some changes were made by the contractor, which have resulted in a poor landfill gas and leachate management. As part of the leachate management actions undertaken during the uncontrolled leachate generation, 3 emergency ponds were constructed to dispose of the leachate discharged out from various locations of Cell 1. In addition, 3 evaporation ponds have recently been constructed to become part of a proposed Leachate Treatment Plant, which has not been constructed and has been integrated into the current proposed project.
E1895 vol. 3 rev.

ECO Consult
Municipal SWM & Carbon Finance
13
Panoramic View of Ghabawi Landfill
Source: CM’s Feasibility Study 2007-08 The key environmental issues addressed at the landfill site are the potential effects of landfill gases generated on the ambient air quality and the possible risks of groundwater contamination from leachate. Landfill gas generated from waste degradation under bacterial activity, which is composed typically of CH4, CO2, ammonia, sulfides and volatile organic compounds. There is dust also released to the ambient air due to the low amounts of covering in the cell. Moreover, high amounts of leachate are released as a consequence of the cell’s collection system malfunctioning, and in exceedance of the cell’s disposal capacity. An assessment of these two parameters has been carried out. The results showed that the risk of groundwater contamination is not high due to the physical characteristics of the Ghabawi site. Regarding the air quality, the parameters measured have no specific Jordanian Standards to be compared with, and the international standards available refer to measurements based on samples taken inside the cell. Since the measurements taken at Ghabawi were at the top cover, a comparison between results and standards would not be applicable. The landfill site is located in a dry area with no permanent water bodies. Therefore, the risk of polluting the surface water is unlikely to be significant. In addition, the groundwater depth in the area ranges from 182 to 248 meters. Therefore, the risk of groundwater pollution is also minimal. With regards to biodiversity, there are no rare species in the area that might be under risk. Under the current conditions, public health and safety a, the surroundings of the existing transfer stations and workers may be at some risk from direct contact with solid waste. Impacts There are significant environmental, socio-economic and financial benefits anticipated as a result of the MSWM Project such as improvement of health & safety conditions for workers and nearby residents to transfer stations and the landfill; reduction of traffic to Ghabawi Landfill and therefore, reduction of TSP, SOx, NOx, and CO2 emissions; reduction of odour emissions and potential threats to the soil and groundwater at the landfill site by treating the leachate; reduction of GHG and LFG emissions by collecting
E1895 vol. 3 rev.

ECO Consult
Municipal SWM & Carbon Finance
14
and treating the LFG; reduction on operation costs by minimizing the consumption of fossil fuels; creation of revenues from LFG emissions reduction (CERs) and power sales to the grid, in addition to potential economic benefits for waste pickers. There is however some potential negative impacts on the environmental and socio-economic conditions anticipated during construction and operation phases of the project components (transfer stations, new cell, leachate treatment and LFG facilities at the landfill), and for which mitigation measures are proposed in the attached table. The most significant potential impact relates to the exposure of workers to particles and gases emissions as well as handling machinery. Moreover, several temporary impacts, unlikely to be significant, relate to noise nuisance, increased traffic volumes in the surroundings of the construction works in addition to increased dust and particle emissions. During the implementation and operation of the different project components significant impacts have also been described with regard to the health and safety conditions of the workers at the landfill; groundwater pollution from uncontrolled leachate generation and consequently, increase of odours at the landfill and surrounding areas; potential contamination of soil and groundwater from using leachate concrete manholes inside the waste body and undetected liner leakage; increase of LFG and GHG generation before the LFG to Energy Plant is operational by increasing the landfill capacity, as well as from the proposed leachate treatment; increase of LFG pollution at the landfill area and risk of diseases transmissions from vectors on landfill nearby residents among others. At present there are no scavengers working regularly at the El Ghabawi landfill which is fenced. Occasionally few waste pickers ( 5-10 people) cross the fence at night in order to collect recyclable materials. These waste pickers are also sorting waste during waste collection near bins and existing transfer stations and their revenues are not depending on the waste collected at the El Ghabawi landfill. As part of the technical assistance support for strategic planning to GAM, the project will finance a socio-economic survey to obtain more accurate information on the informal sector including the waste pickers at the source Analysis of Alternatives
An analysis of alternatives was carried out during the ESIA preparation. A number of the key alternatives have been included in this report as potential options to be implemented for each project component. For each alternative, the potential benefits and impacts resulting from its implementation have been identified. The ‘no-project’ scenario would result in continuing with the current negative environmental consequences at Ghabawi. Waste management alternatives such as centralization and decentralization of landfill in several areas of GAM were considered, with the conclusion that the current management option of centralization, given the generally low capacity of local authorities outside Amman, their small budgets, and the lack of experienced engineering staff in the Solid Waste Management sector, represents the best approach.
Regarding SW transfer procedures and management, the option of constructing 2 new transfer stations is also considered as a positive alternative for improving the existing conditions. In addition, strategic treatment activities at the landfill were examined. Upgrading the Leachate Treatment Plant and constructing the Landfill Gas to Energy Plant, which is the full project alternative, provides the best overall reduction in negative environmental impacts. For the Leachate Treatment Plant, the most effective approach is a combination of several treatments since the proposed treatments will not be effective individually.
E1895 vol. 3 rev.

ECO Consult
Municipal SWM & Carbon Finance
15
Mitigation and Monitoring Some of the mitigation and monitoring measures are already taken into consideration at the design stage. Others represent tasks that must be carried out during construction and must be included in the contractors’ contracts while other measures would have to be implemented during the operational phase. Health and Safety Plans have been recommended to ensure the maximum protection to workers participating in collection, transfer and landfill activities. Periodic inspections to guarantee the correct operation of all proposed project activities would need to be implemented. For the key environmental issues mentioned above, groundwater, surface water and air quality, specific monitoring programs have been proposed to monitor the leachate flow and soil penetration to ensure that no contamination is occurring and that the levels of landfill gases generated do not exceed the maximum permissible levels as specified under Jordanian regulations and international standards:
• Groundwater and Treated Surface Water Monitoring Program. • Leachate Quality Assessment. • Air Quality Monitoring Program.
Additionally, an Emergency Action Plan including measures for fire control will also be prepared as part of the operational manual. Environmental and Social Management Plan (ESMP) All the mitigation and monitoring measures proposed as above mentioned have been defined for each of the construction and operation phases, and synthesized into and Environmental and Social Management Plan during the construction and operation phases. Additionally, a Project Management Unit (PMU) has been defined, to be in charge of the management of the project. This Unit should coordinate with the various GAM departments the implementation of all Solid Waste Management activities and supervise all technical, fiduciary and environmental and social project related matters. Institutional Strengthening Measures were also included as the third component of the ESMP The different entities responsible for various aspects of the project and Solid Waste Management have been defined and the specific role of each of them clarified, in order to set out the responsibilities of each entity. The design and construction of the transfer stations and the landfill activities, except for those related to landfill gas, would be the responsibility of civil work contractor, whose performance will be monitored by the Health and Environment Department of GAM and the PMU. All activities related to landfill gases, including operation of the plant, would be undertaken by another private sector entity under a design build and operate contract which will be monitored by the PMU The following tables include a summary of the EMP including the implementation schedule for the actions proposed. The majority of the costs for the Mitigation and Monitoring Plan will be included within the private contracts and within GAM budget. The incremental costs for the EMSP were estimated at US$ 490,000 and are as follows:
E1895 vol. 3 rev.

ECO Consult
Municipal SWM & Carbon Finance
16
Mitigation Plan: US$ 250,000 Monitoring Plan: US$ 70,000 Institutional Strengthening US$ 170,000 Total US$ 490,000
E1895 vol. 3 rev.

ECO Consult
Municipal SWM & Carbon Finance
17
Mitigation Measures Plan: Construction
A. Mitigation plan during construction and operation
Resource Impact Description Mitigation Actions Costs Responsible
Party Legal Requirements Applying to
Mitigations Environmental Impact Assessment Regulation No.37, 2005
Transfer Stations
-Apply selection criteria for the selection of the sites , and conduct consultation with stakeholders - Conduct a full EIA Study once specific sites have been identified and agreed upon with local community The main impacts to be assessed during the EIA process are similar to the impacts for the construction of El Ghabawi landfill and included below.
US$ 50,000
Will be included
within the project budget
GAM Environment Protection Law No. 52, 2006
Solid Waste Management Regulation No. 27,2005. Municipalities Law No.29,1955.
Environment Protection Law No. 52, 2006. Traffic
Increasing traffic loads on approach roads
Control of traffic in collaboration with the Traffic Department and the Municipalities
Will be included in
the civil work contract
GAM, contractor and Traffic Department
Supplies and Works Regulation for Municipalities and Village Councils No. 55, 1989, and Supplies and Works Regulation for the Municipality of Greater Amman, No.12, 1988. Solid Waste Management Regulation No.27 of the year 2005
Dust control measures such as watering and paving ) will be applied where deemed necessary by GAM
Will be included
within the civil work
contract and DBO contract
(LFG)
JS 1140, 2006 Air Quality – Ambient Air Quality Standards
Contractor
Environment Protection Law No. 52, 2006
Ghabawi Landfill:
(Construction of Cell 3 Leachate Treatment Plant
Upgrade and LFG)
Air Quality Increase of dust and particle emissions during construction
Transport vehicles to be covered until reaching the cell under construction.
Will be included Contractor Environment Protection Law No. 52, 2006
E1895 vol. 3 rev.

ECO Consult
Municipal SWM & Carbon Finance
18
Resource Impact Description Mitigation Actions Costs Responsible
Party Legal Requirements Applying to
Mitigations Vehicles to be properly maintained. within the
civil work contract and
DBO contractor
(LFG)
Section 4.10.3 Lifting-Tilting of the Loaded Container, JS 12105/1999, Containers – Mobile Waste Containers-Part 5: Performance Requirements &Methods
Reduction and Prevention of Noise 2003 Noise
Increase of noise levels due to construction activities and traffic
Noise levels should not exceed 75 dBA during the day and 65 dBA during the night.
Will be included in
the civil work contract
Contractor Environment Protection Law No.52, 2006
Labour Law and its amendments No. 8, 1996, Chapter 9.
Health & Safety
General construction –related Health and Safety risks for workers
Provide workers with protection equipment and clothing (eye shields, globes, ear noise suppressors, etc). -Develop Heallh and Safety Plan for workers
Will be included
within the civil work
contract and DBO
contractor (LFG)
Contractor The Protection and Safety from Industrial Tools, Machines and Work Sites Regulation No. 43 1998
Surface water management
Ensure proper drainage of rain water and Minimise the amount of soil and sediment entrained in run-off
-Water courses must be maintained clear of obstructions, debris and siltation -Employ silt traps and barriers to prevent the transfer of soil and sediment into the surface water management system for the Site
Will be included in civil work contract and DBO contractor (LFG)
Contractor Environment Protection law No 52.
E1895 vol. 3 rev.

ECO Consult
Municipal SWM & Carbon Finance
19
Mitigation Measures Plan: Operation
Resource Impact Description Mitigation Actions Costs Respon
sible Party
Legal Requirements Applying to Mitigations
Environment Protection Law No. 52, 2006, article 19,12
Transfer Stations
Operation
An Environment and Social management Plan will be developed as part of the EIA of the two transfer stations. Generic impacts will be similar to those of the El Gabawi mitigations impacts described below Management.
Will be included within the project
budget GAM
Environmental Impact Assessment Regulation No.37, 2005
Increase of LFG and GHG emissions from Cells 2 & 3 operations before LFG to Energy Plant is operational
Proper application of cover material (soil) at the close of each day
Included in GAM operations
costs GAM The Environment Protection Law No. 52, 2006,
article 19.
Increase of dust and emissions from plant and trucks
Dust control measures to be applied where deemed necessary by GAM (could include paving or watering of internal roads)
Included in GAM contract GAM
Odour emissions from SW disposal operations at the operating cell
Proper application of cover material (soil) at the close of each day
Included in GAM operations
costs GAM
JS 1140/2006 Pollutants – Ambient Air Quality Standards.
Air Quality
Odours during handling and treatment of leachate at the Leachate treatment Plant
The collection system and the lining of the treatment ponds should be correctly installed
Will be included within the civil work contract
GAM The Environment Protection Law No. 52, 2006, article 19
The Environment Protection Law No. 52, 2006. Proper leachate pumping should be applied to minimize contamination
Use available staff (No
additional cost) GAM
Soil Protection Regulation No. 25, 2005.
The Groundwater Control Regulation No. 85, 2002, Issued pursuant to articles 6 and 32 for Water Authority Law No.18, 1988.
Waste should be removed from the borders of Cell 1 to Cell 2 to reduce the risk of uncontrolled leachate generation
Use available staff (No
additional cost) GAM
The Soil Protection Regulation No. 25, 2005, article 3.
Operation of Ghabawi
Landfill and Leachate
Treatment Plan and LFG
Soil & Groundwater
Potential contamination of soil, sub-soil & groundwater from leachate leakage
Monitor the head of leachate in the cell - not to exceed 1 ft in accordance with international specifications
Use available staff (No
additional cost) GAM
The Groundwater Control Regulation No. 85, 2002, Issued pursuant to articles 6 and 32 for Water Authority Law No.18, 1988.
E1895 vol. 3 rev.

ECO Consult
Municipal SWM & Carbon Finance
20
Resource Impact Description Mitigation Actions Costs Respon
sible Party
Legal Requirements Applying to Mitigations
The Soil Protection Regulation No. 25, 2005, article 3. Implement groundwater monitoring
program – see below GAM will
assume the costs GAM Solid Waste Management No. 27, 2005
The Groundwater Control Regulation No. 85, 2002, Issued pursuant to articles 6 and 32 for Water Authority Law No.18, 1988.
Contamination of soil & sub-soil from undetected liner leakage
The cells lining and the collection system should be correctly installed in Cell 3 to avoid potential leachate infiltration in the soil and sub-soil layers
Will be included within the civil work contract
Civil work
contract The Soil Protection Regulation No. 25, 2005, article 3.
Surface water pollution from leachate overflow
Definition of a storm water management system for Cells 1, 2 & 3 is required to collect and treat the water run off and specification of the slope for future cells
GAM will assume the costs, included in the
civil work contract of cell #
3
GAM The Environment Protection Law No. 52, 2006, article 11
H&S impacts on landfill workers from direct contact with SW and potential fires
Development of a H&S Plan establishing disposal procedures as well as including requirements of the applicable Labor Law No.8, 1996
Use available staff (No
additional cost) GAM Jordanian Labor Law No. 8, 1996, and its
amendments Health &
Safety Risk of nuisance or disease from vectors (concern raised by stakeholders)
Proper application of cover material (soil) at the close of each day
Already implemented
(No additional costs)
GAM
Water Quality
Potential contamination of ground and surface water during operations Discharge of treated leachate
Implement monthly monitoring program of perimeter wells and surface effluents Must meet Jordanian effluent discharge standards of
GAM will assume costs
GAM, MOE
Flaring Gas Monitor the levels of gases and their potential explosiveness
Install gas monitoring wells at conventional spacing and/or in sensitive locations, as dictated by international standards for monitoring the potential migration of landfill gases from the New Facility
Part of the DBO contract ( LFG)
Contractor
E1895 vol. 3 rev.

ECO Consult
Municipal SWM & Carbon Finance
21
Resource Impact Description Mitigation Actions Costs Respon
sible Party
Legal Requirements Applying to Mitigations
Information Dissemination
Community Liaison and Public Information Program
Develop the Community Liaison and Public Information Program
US$ 200,000 for 5 years . Included
as part of the technical
component of the project
GAM
E1895 vol. 3 rev.

ECO Consult
Municipal SWM & Carbon Finance
22
B. Monitoring plan during construction and operation
Responsible Party
Mitigation
Actions
Parameter to be
Monitored Location Measurements Frequency of
Measurements Review Reporti
ng
Costs
Legal Requirements Applying
to Monitoring
Air Quality
Minimization of dust and particle emissions during construction
Dust (particulate matter)
At and around new transfer station sites
Measurements of dust (PM10) at 4 locations to be selected just outside borders of site
Weekly during excavation or
erection of buildings
GAM PMU $ 18,000 (JD12800)
JS 1140, 2006, Air Quality – Ambient Air Quality standards
New transfer stations
surroundings
Measurements of noise at 3 locations to be selected just outside borders of site
Weekly during excavation or
erection of buildings
$21,000 (JD 14,400)
Cell under construction at
Ghabawi Leachate
Treatment Plant
Construction
Noise
The noise levels during construction should not exceed 75 dBA during the day and 65 dBA at night
Decibels (dB)
LFG to Energy Plant
Measurements of noise at 3 locations at landfill site boundary
Weekly during construction
works.
GAM PMU
$ 31000 (JD 21,600)
The Instruction for the Reduction and Prevention of Noise, 2003
New transfer stations
surroundings
Noise measurements to be made only if complaints received, or if noise levels suspected to be excessive. Locations to be determined.
Cell under construction at
Ghabawi Leachate
Treatment Plant
Operation Noise
The noise levels during operation should not exceed 75 dBA during the day and 65 dBA at night
Decibels (dB)
LFG to Energy Plant
Noise measurements to be made only if complaints received, or if noise levels suspected to be excessive. Locations to be determined depending on source of noise.
Weekly GAM PMU -
The Instruction for the Reduction and Prevention of Noise, 2003
Groundw
ater Quality
Minimize potential infiltration of uncontrolled leachate into the
pH Alkalinity Total Chlorides BOD
1 well upstream and 1 well
downstream at the landfill site
Groundwater samples will be collected and parameters will be measured
Monthly GAM PMU GAM will
assume the costs
The Groundwater Control Regulation No. 85, 2002,
E1895 vol. 3 rev.

ECO Consult
Municipal SWM & Carbon Finance
23
Responsible Party
Mitigation
Actions
Parameter to be
Monitored Location Measurements Frequency of
Measurements Review Reporti
ng
Costs
Legal Requirements Applying
to Monitoring
groundwater COD Metals
Issued Pursuant to articles 6 and 32 for Water Authority Law No. 18 1988.
Treated Leachate effluent Quality
Leachate generated at the cells will be collected and treated
pH Alkalinity BOD COD Temperature Oil and grease Total chlorides Total Suspended Solids Metals
At point of discharge at the
Leachate Treatment Plant
Samples of treated leachate will be collected and parameters will be measured
Weekly GAM PMU GAM will
assume the costs
The Environment Protection Law No. 52, 2006
Community Liaison
Develop the Community Liaison and Public Information Program
Complaint Center GAM Review complaints for waste
management services Semi annually GAM PMU GAM will
assume the costs
E1895 vol. 3 rev.

ECO Consult
Municipal SWM & Carbon Finance
24
C. Institutional Strengthening
Activities/Tasks Objectives Target Group Cost Estimate Responsibility
Recruitment Actions
Recruit Environmental Specialist for PMU on a part time basis ( 6 monts/year)
Build capacity of PMU for monitoring of environmental performance of contract and GAM
PMU $ 100,000 (JD 70,000) GAM
Training Actions
Two training workshops per year in environmental monitoring and contract supervision of environmental performance
Develop capacity for monitoring contractor and GAM performance of EMP measures.
Environmental specialist (PMU) , PMU staff, GAM operators in landfills and in transfer stations
$ 35,000 ( JD 25,000) GAM
Training in water quality sampling & analysis
Confirm and strengthen technical capacity to sample and analyze water, to appropriate standards
GAM – water quality labs $ 35,000 (JD 25,000) GAM
E1895 vol. 3 rev.

ECO Consult
Municipal SWM & Carbon Finance
25
Public Consultation and Disclosure The purpose of the public consultation meetings was multifold, namely:
i To disseminate information about the nature of the proposed project.
i To raise the awareness of the public regarding the nature and purpose of the Environmental and Social Impact Assessment process in simple-to-follow terms.
i To identify a preliminary list of potential environmental and social issues and impacts.
i To explore, discuss, and document the issues of concern to the public; which would be addressed in the future phase of impact assessment.
i To disclose to the public how the impacts were determined, the magnitude and severity of the impacts, and the proposed mitigation measures.
As required by the World Bank Operational Policies, a Second Consultation Session was held on June 12, 2008 in which all main findings and recommendations included in this ESIA were presented to the public. During this session, various affected stakeholders were invited once again in order to review and provide feedback on the Environmental & Social Impact Assessment (ESIA) draft report and the Resettlement Policy Framework, which both were made available in Arabic in a form understandable to the general public. Approximately 40 people attended the session from different institutions including governmental, non-governmental organizations, civil society and local communities. The main comments and concerns raised are included below and in the final ESIA report. For more details regarding the invitees and attendees, please see Annex IV – Minutes of Meeting - Second Public Consultation Session.
Comments Responses Ghabawi Landfill site is within close proximity of the Albeidah area; have the impacts on the community been addressed in the study?
The communities located near the landfill are relatively small and impacts on them are minimal based on the air quality studies carried out since all standards were met. Since the Ghabawi project is a CDM, emissions to the nearby communities will be reduced thus positively impacting them. There is a chance that winds will carry odour but according to wind studies carried out, wind directions is not directed towards the towns during the majority of the year.
The presence of Ghabawi Landfill within close proximity of residential areas a main source of health issues that must be addressed
The potential increase of health problems, in particular those related to vector transmission, a daily cover is being implemented at the site in order to reduce such impacts. GAM has all incentives to protect and improve human and environmental health. All alternatives that provide such support will be considered. The implementation of this project will in fact reduce negative environmental impacts since in it improves solid waste management, an essential element to the community's health and safety.
E1895 vol. 3 rev.

ECO Consult
Municipal SWM & Carbon Finance
26
Comments Responses Landfills must be located at a distance of 60 km away from any neighbouring community which is not the case for Albeideh and Ohod areas. What are the potential impacts on these communities? What are the precautionary methods to prevent detrimental errors from taking place? There are currently 4 million tones of solid waste at Ghabawi, what are the potential impacts of gases emitted from the site on people?
According to site visits the closest community to the sire is 10km with a population of 559. Impacts on the communities and environmental have been thoroughly studied, that is the main objective of carrying out an ESIA. Based on soil sampling and geophysical testing of the site and based on the current design of the landfill liner and cover, no great impacts on the aquifers were identified and thus the Ghabawi site was chosen. The location is 37 km away from central Amman. The initial siting of the location took into consideration all the nearby communities' concerns through broadcasted messages on the radio in addition to regular letters.
The current location of Ghabawi Landfill will have to be reconsidered due to urban expansion and increased economical trading activities witnessed in the area.
The current location has been chosen based on many studies performed before the initial site selection which was not part of this ESIA. These studies were carried in order to eliminate all impacts related to the Ghabawi Landfill.
Did the assessment for waste to energy generation include best economical techniques? How were the different technologies assessed?
No answer was provided
Why has this project not used innovative alternative techniques such as mixed energy generation technologies, pyrolysis, etc?
The decision on energy generation was a strategic choice; even though there are alternative technologies available, this was the technology with the least risks.
Queried the potential formation of cracks leading to contamination of the groundwater in particular since an aquifer is located within 200 m.
The potential of cracks taking place in the site has been studied in the ESIA and the findings indicated that none are present and since the site is not close to any major fault lines none are anticipated. Furthermore, the water is not potable that is located in the aquifer within close proximity to the site. However, extensive analysis was carried out which illustrated that if water from the landfill was to reach the aquifer it would have 100% no negative impacts. There are no cracks discovered thus far, however in the event any become present the different technologies such as lining and treatment will minimize if not completely prevent any contamination from taking place. As for groundwater monitoring, this aspect has also been thoroughly studied and is included in the ESIA.
A weakness of the ESIA lies within its lack to fully take into consideration the local communities. For example, the revenue produced from carbon trading could contribute to projects within the local communities to enhance their quality of living.
There is an agreement between the WB and GAM that allocates 15% of CDM revenues to sustainable development.
The details of the project can be presented to the local communities as a means to include them and further transparency.
The socio-economic aspects of the project have been studied thoroughly and included within the ESIA. However, the recommendation of presenting the project
E1895 vol. 3 rev.
ECO Consult
Municipal SWM & Carbon Finance
27
Comments Responses to the local communities is an excellent one and will be
further looked into.
Furthermore, once the locations of the two transfer stations are identified and approved, as part of the EIA study that will be undertaken, consultations in the form of a series of Focus Group Discussions and Structured Interviews will be organized with specifically identified key stakeholders in the surrounding communities. The ESMP for the transfer stations will be translated into Arabic, and shared with the stakeholder during a consulting meeting. The ESMP will also be disclosed at several specific locations in Jordan and at the World Bank Info Shop
Public Disclosure The Executive Summary of the Draft ESIA Report in Arabic was distributed to the Governmental Institutions and NGOs invited to the Public Consultation Session for their review. In addition, copies of the full ESIA report are available at the Ministry of the Environment, the World Bank website and the Greater Amman Municipality website for the general public.
E1895 vol. 3 rev.

1. INTRODUCTION
1.1 This Report
This Environmental Social Impact Assessment (ESIA) report has been prepared on Behalf of Greater Amman Municipality (GAM), by ECO Consult for undertaking a Solid Waste Management Plan in order to enhance the existing Solid Waste Management (SWM) procedures in Amman, which are currently undergoing technical and environmental assessment and development planning by GAM. This report sets out information on the project required for an Environmental and Social Impact Assessment (ESIA) following the World Bank (WB) Operational Policies OP 4.01 and under the Jordanian Environmental Impact Assessment Regulation No.37 for the year 2005, and is structured as follows: Section 1- Introduction Section 2- Project Description Section 3- Legal Framework Section 4- Consultation Process Section 5- Baseline Environment Section 6- Environmental Impacts Section 7- Analysis of Alternatives Section 8- Mitigation & Monitoring Measures Section 9- Institutional Strengthening & Compliance Section 10- Environmental Management Plan Section 11- Implementation Schedule & Costs As identified in the Environmental Impact Assessment Regulation No.37 for the year 2005, the Environmental & Social Impact Assessment (ESIA) report will need to:
• Describe the existing environmental conditions. • Discuss the legal framework for environmental management in relation to the project.
• Identify the likely negative and positive impacts of construction and operation of the
project.
• Design the mitigation and monitoring plans for construction and operations activities.
• Discuss the project alternatives including the no action alternative.
• Present the Environmental Management Plan for the project construction and operation.
1.2 Background to the project
The city of Amman currently has approximately about 2,300,000 inhabitants. This number has been reached after an extremely fast growth in the last century (in 1921 there were only 3,000 inhabitants, in 1964 around 65,000 and in 1988 around 1,000,000). This significant growth is a consequence of an important stream of immigration stemming from the conflict s in the surrounding countries. As a result, this fast growth of population brought the GAM to face in the
E1895 vol. 3 rev.

ECO Consult
Municipal SWM & Carbon Finance
29
urgency of very numerous issues. One of the most important issues is associated with Municipal Solid Waste Management (MSWM).
Figure 1.1: Expansion of GAM Districts per year in the last Century In 2001-2002 GAM prepared its first Solid Waste Management Development Plan (SWMDP). The main objectives of the SWMDP were:
• To maintain the overall urban environmental quality and the public hygiene, and contribute to limit the current landfill site environmental and health hazards.
• To implement some degree of selective collection of municipal solid waste (MSW).
• To operate and maintain an efficient and environmentally sustainable solid waste (SW)
collection system.
• To enhance the landfill life-time, by reusing and recycling a higher proportion of reusable and recyclable waste.
• To enhance the landfill life-time, by treating more waste.
• To operate and maintain efficient and environmentally sustainable waste treatment and
disposal facilities.
• To close and secure the existing Ruseifeh Landfill.
• To improve the occupational health and safety among workers in the sector. The first priority project identified under the above plan included the construction of a new sanitary landfill at Al Ghabawi site (construction of the first three cells) as well as the construction
E1895 vol. 3 rev.

ECO Consult
Municipal SWM & Carbon Finance
30
of a transfer station network around Amman to optimize SW transport from production areas to the new landfill. The new disposal site, also called Ghabawi Landfill, was established in 2003. The site selection was based on a Feasibility Study carried out by Cabinet Merlin (CM) in 2002 where the main criteria analyzed were environmental, social and technical aspects. At that time, Jordan had no national regulations on environment and thus only a kind of environmental diagnostic was carried out. The basic design of the priority project was prepared under the same feasibility study, including the preliminary design of the whole landfill (lay-out of the 9 cells) and the detailed design and Tender Documents for the first 3 cells. However, only the first cell, Cell 1, was constructed with no proper gas and leachate management system.
Figure 1.2: Basic design for the Ghabawi Landfill included in CM’s Priority Project in 2002.
Currently, GAM has a fully functional waste management system that handles all types of SW (household, commercial, demolition, hospital, industrial, demolition, etc…) generated within the municipal boundaries as well as 93% and 35% of municipal waste quantity produced respectively in Zarqa and Balqa'a Municipalities. The design capacity of Cell 1 was originally nearly 2 million tons for an area of 132,000 m2. However, a total of 3.57 million tons have been land filled by December 2007 as a consequence of an average disposal of 2,400 tons per day in the cell. Therefore, Cell 1 is now nearly 100% over its design capacity. This situation, coupled with poor leachate management, is affecting the whole environment of the site.
E1895 vol. 3 rev.

ECO Consult
Municipal SWM & Carbon Finance
31
In order to address the urgent issue in terms of disposal capacity and uncontrolled leachate generation, GAM initiated in 2006 the preparation of new investment project consisting of the construction of Cell 2 and the construction of a Leachate Treatment Plant. The detailed design and the tender documents for those investments were based in the 2002 feasibility study. Related contracting process is in its final stage and the construction of the new cell has already started. The total duration of this project was estimated to 3 months including the lining of Cell 2, construction of leachate drainage for Cell 2, and the construction of Leachate Treatment Plant (first phase). In addition, GAM requested the WB technical and financial assistance to prepare and implement an Integrated Municipal SWM Project. After revising the existing SWM conditions, the WB established the Terms of Reference (TOR) to be followed in order to develop a complete assessment to analyze the environmental issues affected by the project. The preliminary definition of the project included:
• Institutional strengthening and capacity development system. • Enhancement of transfer services.
• Upgrade of the existing landfill including construction of Cells 2 & 3 and enhanced
leachate management.
• Construction of Landfill Gas to Energy Facility under Clean Development Mechanism framework.
TOR were then given to GAM and the consulting firm, ECO Consult as the basis for the work to be carried out. Evaluations including public consultations in order to identify the major impacts during the ESIA were also undertaken. After meetings held between the WB, GAM and ECO Consult in March 2008 where the ESIA progress and the project definition was revised, it has been agreed that ECO Consult will assess all the above components financed in the Project and will not include collection services enhancement.
1.3 Approach and Assessment Methodology
A number of elements have been brought together to complete this assessment. The steps followed are summarised below: Stakeholder Consultation A collaborative process with relevant stakeholders was followed. Stakeholders input during the Scoping Session held on February 5th, 2008 was assessed and discussed according to the potential concerns related to the project. Views and concerns of the stakeholders informed both the listing and ranking of impacts. These concerns were then taken into account and incorporated into the ESIA report.
E1895 vol. 3 rev.

ECO Consult
Municipal SWM & Carbon Finance
32
Review of Existing Reports & Studies A number of existing documents including various previous assessment, reports and studies were reviewed. These related to the development and design of the works and the characterisation of the Baseline document. This included the Feasibility Study carried out by CM, in 2002 and its updated version for 2007-2008. Additional documents reviewed were the Draft Aide Mémoire provided by the WB in March 2007 and the Clean Development Mechanism Project Design Document (CDM-PDD) submitted by GAM and revised by the WB in July 2006 among others. See references at the end of this report. In addition, sampling activities to assess ambient air quality, biodiversity and groundwater potential contamination were undertaken at the landfill by ECO Consult and other consultants. Consultation Meetings and Site Inspections Several meetings were held with different representatives from GAM SWM Departments. Background information on the project and the Ghabawi Landfill was provided to ECO Consult in addition to information regarding the existing environmental issues currently occurring. Site visits to the Ghabawi Landfill site and the transfer stations were also conducted to assess the current conditions of the site. Meetings and consultations with the Ghabawi staff and the transfer stations staff on infrastructure and environmental issues were held. Additional Baseline Data Collection In addition to the baseline characterisation provided by CM, additional data collection on air quality, surface and ground water as well biodiversity at the landfill and its surroundings was undertaken by several consultants for this ESIA. Results of such including the methodology followed in each assessment and some recommendations have been included in this ESIS report and the Appendix Section. Additionally, mitigation and monitoring measures have been proposed in the EMP tables included in Section 10.
E1895 vol. 3 rev.

ECO Consult
Municipal SWM & Carbon Finance
33
2. PROJECT DESCRIPTION
2.1 Project Objectives and Key Performance Indicators
The development objectives of the proposed project are to strengthen the operational, financial and environmental performance of MSWM in Amman. Specifically, the project will help to achieve the following:
• Enhance GAM capacity to develop private sector participation in MSWM in Amman. • Environmentally upgrade and expand the existing MSW landfill to meet the city’s
disposal needs up to 2014 and generate “green” electricity while mitigating GHGs.
• Improve the cost effectiveness of the existing municipal SW collection and transport system and improve overall cost recovery.
The Key Performances Indicators are the following:
• Number of performance-based contracts introduced for outsourcing segments of SW services to the private sector.
• Percentage of collected municipal waste disposed of in a sanitary landfill increased from 0 to 100%.
• Power generation generated through the LFG recovery system estimated at 4MWe.
• Reduction by 900,000 JD/year in total costs of collection and transfer of MSW in Amman.
• Revenues raised through the sale of CERs and the LFG-generated electricity estimated for
2009 in an amount of approximately 3 million USD.
The total project cost has been estimated at US$ 39.5 million of which US$ 18.0 million is a loan from the World Bank to GAM guaranteed by the Government of Jordan . The project duration is for five years with an estimated completion date of 2014
In order to achieve the project objective, the following three (3) main project components have been defined as follows:
• Component 1: Institutional Strengthening and Capacity Development Component (US$ 1.9 million): The primary objective of this component is to finance technical assistance and capacity building activities benefiting GAM departments involved in the development, planning, operation, and evaluation of municipal waste management projects. This component will include:
o Support for Strategic Planning and Private Sector Participation:
- Support to GAM to define strategic actions toward the establishment of a sustainable and affordable municipal SWM system that will satisfy the city needs during the upcoming fifteen years. Those actions will cover policy, the institutional and legal framework, investment planning, financial management, cost recovery, and scope of recycling and recovery activities.
E1895 vol. 3 rev.

ECO Consult
Municipal SWM & Carbon Finance
34
- Support to GAM in exploring opportunities and defining appropriate options for private sector participation in providing MSW services. As a first phase, the project will support the preparation of bidding documents to outsource the extension of Al Ghabawi Landfill, including design, construction, operations and finance for the extension of the landfill for the period 2014-2028. Under this activity, technical assistance and capacity building activities would support GAM’s contracting supervision and monitoring.
o Development of information systems to track technical and financial performance of MSWM services;
o Development and implementation of a Public Information, Education, and Communication Program: This sub-component will finance public information and education campaigns to raise public awareness and build partnerships in various areas of SWM. This activity will also finance a sustained awareness campaign involving the production of education and learning materials and its systematic dissemination. Attention will be given to working with NGOs and informal organizations.
o Training and Capacity Development in the Clean Development Mechanism (CDM) and Carbon Finance: This sub-component will support GAM in establishing the required capacity for monitoring and supervision of CDM activities, and to identify and assess opportunities under the CDM framework prior to and beyond 2012.
This component will also finance (i) technical assistance to GAM in operating the landfill site and monitoring the LFG recovery contract; and (ii) engineering services for supervising all civil works contracts, including construction of Cell 2 and upgrade of the leachate treatment facilities.
• Component 2: Infrastructure Investment (US$ 28.4 million): Component 2 includes three sub-components aimed at improving the cost recovery and effectiveness of disposal and transfer, strengthening management of the existing landfill, and generating electricity. The investment activities are:
o Landfill Construction and Upgrade of Leachate Treatment Plant;
o Construction of Two (2) Transfer Stations;
o Construction of a Landfill Gas (LFG) recovery system;
These sub-components are explained in detail in Sections 2.1 to 2.3.
• Component 3: Project Management Component (US$ 0.3 million.): Component 3 will finance necessary technical assistance to the Project Management Unit (PMU), which is being established to undertake the day-to-day management of the project. The project will finance technical assistance to the PMU to facilitate its overall supervisory, coordinating, and monitoring role.
The following is a description of the Component 2 - Infrastructure Investment assessed by ECO Consult based on meetings with GAM, site visits to the landfill and the transfer stations, as well as the CM’s Feasibility Study of MSWM, February 2008:
E1895 vol. 3 rev.

ECO Consult
Municipal SWM & Carbon Finance
35
2.2 Landfill Construction and Upgrade of Leachate Treatment Plant
The Project will to finance the civil works for construction of Cell 3 of Al Ghabawi Landfill. This cell will have a capacity estimated for 2-3 years based on annual quantity of waste around 3,000 tons per day. It will also finance the upgrading of the existing Leachate Treatment Pant. It is expected that these two works will be undertaken under a single civil works contract in order to maximize synergies in the work. The following is a description of the proposed activities to be undertaken to improve the existing conditions of the landfill:
2.2.1 Construction of Cell 3 and Operation of Cells 2 & 3 Operations have started recently in Cell 2 where SW is currently being disposed. Additionally, some activities will also have to be undertaken in Cell 2 to enhance the existing conditions at the landfill: the transfer of SW from Cell 1 and the connection of the lining from Cells 1 & 2. Ghabawi is currently equipped to receive only 2.5 million tons of MSW in Cell 2, which represents the MSW for the served area until the end of 2010. Therefore, the construction of Cell 3 should be planned ahead to avoid exceeding Cell 2 capacity. These are the tentative dates for Cell 3 construction and operation:
ACTIVITY DATE Tender Issue June 2009 Construction starting date November 2009 Operation starting date November 2010
Table 2.1: Planning of Construction and Operation of Cell 3 Design of Cell 3: The design of Cell 3 should consider:
• Reducing the volume of excavation to reduce costs, avoiding accumulation of soil in the site and limiting the impacts on the LFG extraction wells and the manholes. The proposed excavation depth for Cell 3 is 4-5 m.
• Reducing the cell size to optimize LFG extraction and related revenues, reinforcing the
leachate collection system: drainage layer, pumping well along the slope.
• Increasing amounts of leachate to be treated.
• Optimization of LFG generation. The following table includes the dimension and capacity proposed for Cell 3 in comparison to Cells 1 & 2 as indicated in the feasibility study by CM:
E1895 vol. 3 rev.
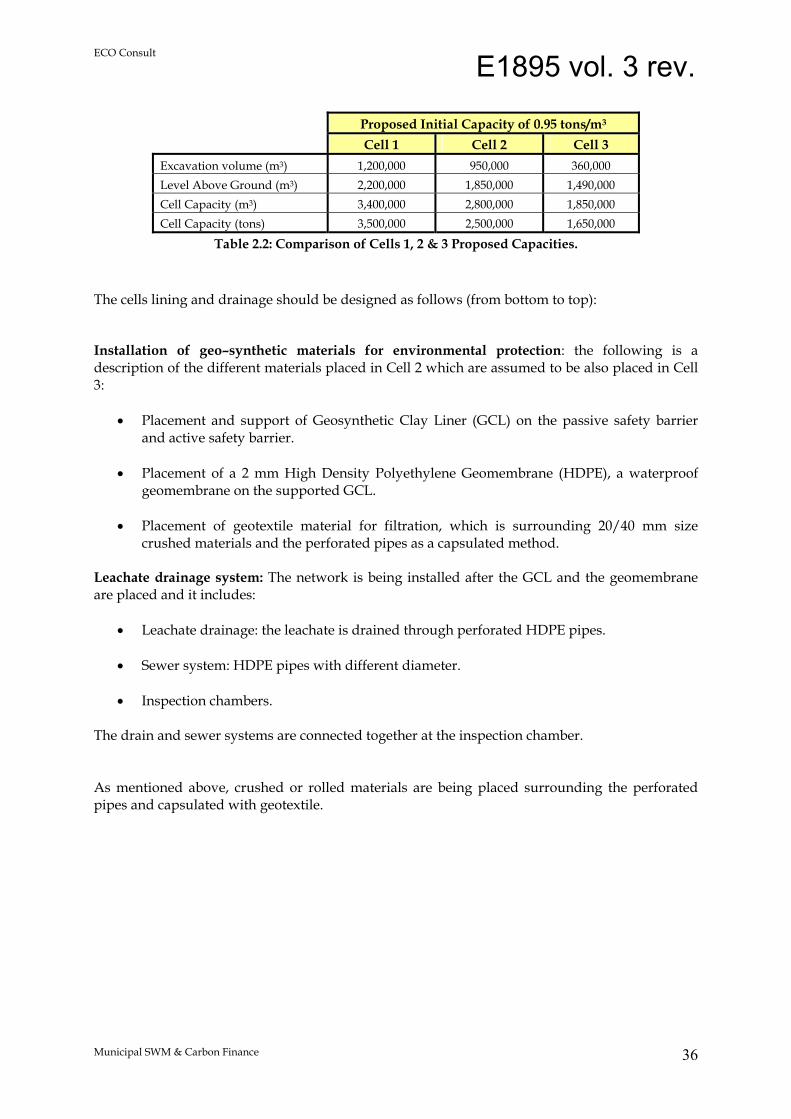
ECO Consult
Municipal SWM & Carbon Finance
36
Proposed Initial Capacity of 0.95 tons/m3 Cell 1 Cell 2 Cell 3 Excavation volume (m3) 1,200,000 950,000 360,000 Level Above Ground (m3) 2,200,000 1,850,000 1,490,000 Cell Capacity (m3) 3,400,000 2,800,000 1,850,000 Cell Capacity (tons) 3,500,000 2,500,000 1,650,000
Table 2.2: Comparison of Cells 1, 2 & 3 Proposed Capacities. The cells lining and drainage should be designed as follows (from bottom to top): Installation of geo–synthetic materials for environmental protection: the following is a description of the different materials placed in Cell 2 which are assumed to be also placed in Cell 3:
• Placement and support of Geosynthetic Clay Liner (GCL) on the passive safety barrier and active safety barrier.
• Placement of a 2 mm High Density Polyethylene Geomembrane (HDPE), a waterproof
geomembrane on the supported GCL.
• Placement of geotextile material for filtration, which is surrounding 20/40 mm size crushed materials and the perforated pipes as a capsulated method.
Leachate drainage system: The network is being installed after the GCL and the geomembrane are placed and it includes:
• Leachate drainage: the leachate is drained through perforated HDPE pipes. • Sewer system: HDPE pipes with different diameter.
• Inspection chambers.
The drain and sewer systems are connected together at the inspection chamber. As mentioned above, crushed or rolled materials are being placed surrounding the perforated pipes and capsulated with geotextile.
E1895 vol. 3 rev.

ECO Consult
Municipal SWM & Carbon Finance
37
Figure 2.1: Leachate Drainage System at Cell 2
2.2.2 Leachate Treatment Plant The aim of the leachate treatment is recirculation of the treated leachate into the cells. This approach reduces the cost of leachate management and increase the LFG generation. The leachate collection system installed on the bottom of Cell 1 has been clogged with SW, what has resulted in leachate flowing out of the cell in addition to leachate accumulated on several meters inside the cell. There are several risks associated with leachate accumulation that are described in the Section 6. One of Those impacts is related to LFG production. When the cell is saturated with leachate, LFG production and capture are very limited. Therefore, one of the priorities is to lower the leachate level in Cell 1 to allow LFG production. Recirculating leachate would add more leachate to the waste body, thus make it more difficult to lower the leachate level in Cell 1. For that reason, recirculation should not be made in Cell 2 before the waste thickness reaches at least 5 m. A Leachate Pre-treatment Plant has been constructed recently in Ghabawi. This plant was designed for the first 3 cells and a maximum of 750 m3/day in winter season and consists in the following treatment line:
• 1 aeration pond: 14,000 m3, equipped with 12 aerators 7.5 kW. • 1 settling pond: 9,000 m3
• 1 filtration pond: 6,500 m3
• 1 leachate recovery pit: 400 m3
• 2 sludge drying beds
However, site visits suggest that evaporation is the only treatment applied to the collected leachate. Based on the analysis of the existing environmental conditions at Ghabawi and the existing infrastructure, the proposed design for leachate treatment is as follows:
Fruition slab 2.00 m x 2.00 m
leachate pipe ? 400 mm
back fill
slope 0.5%
WASTE
back fill 0.50
leachate drain? 280 mm
0.40
0.20
WASTE
fixing piece
well base back fill
leachate pipe ? 400 mm
back fill
geomembrane
Geomembrane
GCL
SAND 10CM
SAND 10CM
E1895 vol. 3 rev.
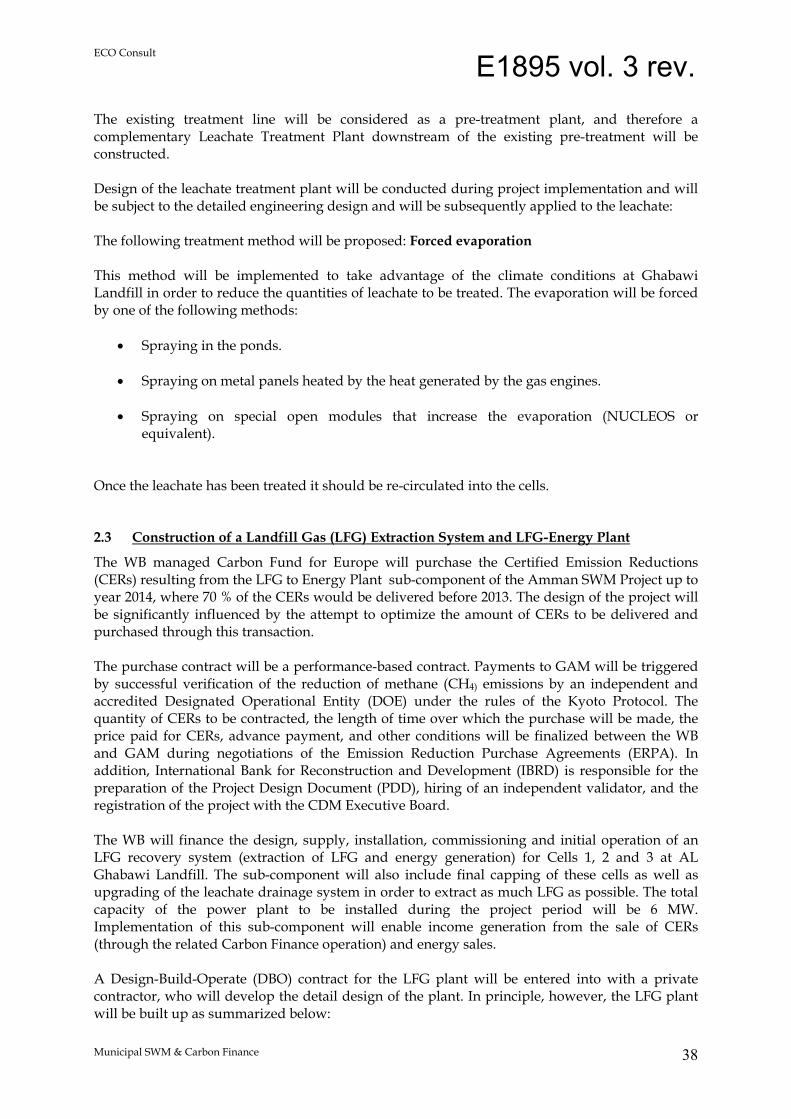
ECO Consult
Municipal SWM & Carbon Finance
38
The existing treatment line will be considered as a pre-treatment plant, and therefore a complementary Leachate Treatment Plant downstream of the existing pre-treatment will be constructed. Design of the leachate treatment plant will be conducted during project implementation and will be subject to the detailed engineering design and will be subsequently applied to the leachate: The following treatment method will be proposed: Forced evaporation This method will be implemented to take advantage of the climate conditions at Ghabawi Landfill in order to reduce the quantities of leachate to be treated. The evaporation will be forced by one of the following methods:
• Spraying in the ponds. • Spraying on metal panels heated by the heat generated by the gas engines.
• Spraying on special open modules that increase the evaporation (NUCLEOS or
equivalent). Once the leachate has been treated it should be re-circulated into the cells.
2.3 Construction of a Landfill Gas (LFG) Extraction System and LFG-Energy Plant
The WB managed Carbon Fund for Europe will purchase the Certified Emission Reductions (CERs) resulting from the LFG to Energy Plant sub-component of the Amman SWM Project up to year 2014, where 70 % of the CERs would be delivered before 2013. The design of the project will be significantly influenced by the attempt to optimize the amount of CERs to be delivered and purchased through this transaction. The purchase contract will be a performance-based contract. Payments to GAM will be triggered by successful verification of the reduction of methane (CH4) emissions by an independent and accredited Designated Operational Entity (DOE) under the rules of the Kyoto Protocol. The quantity of CERs to be contracted, the length of time over which the purchase will be made, the price paid for CERs, advance payment, and other conditions will be finalized between the WB and GAM during negotiations of the Emission Reduction Purchase Agreements (ERPA). In addition, International Bank for Reconstruction and Development (IBRD) is responsible for the preparation of the Project Design Document (PDD), hiring of an independent validator, and the registration of the project with the CDM Executive Board. The WB will finance the design, supply, installation, commissioning and initial operation of an LFG recovery system (extraction of LFG and energy generation) for Cells 1, 2 and 3 at AL Ghabawi Landfill. The sub-component will also include final capping of these cells as well as upgrading of the leachate drainage system in order to extract as much LFG as possible. The total capacity of the power plant to be installed during the project period will be 6 MW. Implementation of this sub-component will enable income generation from the sale of CERs (through the related Carbon Finance operation) and energy sales. A Design-Build-Operate (DBO) contract for the LFG plant will be entered into with a private contractor, who will develop the detail design of the plant. In principle, however, the LFG plant will be built up as summarized below:
E1895 vol. 3 rev.

ECO Consult
Municipal SWM & Carbon Finance
39
2.3.1 Closure and Rehabilitation of Cell 1 In order to commence with the LFG collection and treatment activities, a final cover should be applied to the operating cell once it has reached its maximum capacity. At Ghabawi Landfill, the final cover should be immediately applied to Cell 1. There are five (5) activities that need to be implemented for closure and rehabilitation of this cell:
A. Reshaping Cell 1 by removing the waste settled out of the limits of Cell 1. The purposes of reshaping are to reduce the slopes and reinforce the stability in the cell and to allow rainwater running-off without eroding the final cover applied to the cell.
B. Repairing the lining system where it has been damaged. Damage caused by heavy machinery when removing waste settled out of Cell 1 has been discovered in the eastern and western borders of the cell. Some repairs have been poorly done for the geomembrane in the western border, although no repairs on the Geosynthetic Clay Liner (GCL), the geotextile material for filtration, the welding of the geomembrane or anchor trench have been undertaken.
C. Connecting the lining of Cell 2 with the lining of Cell 1. This connection could not be done during the works for the construction of Cell 2 because of the presence of waste and leachate in the eastern border of Cell 1.
D. Applying the final cover over Cell 1. There are three (3) basic requirements, low permeability, slope and enough thickness to hide all waste.
E. LFG capture and treatment system. The system will be described in the following sub-section.
2.3.2 LFG Extraction Wells Approximately 46 gas extraction wells will be established at Cell 1. The number advised is 5 to 6 wells per hectare to maximize the LFG collection and flaring. The depth of Cell 1 ranges from 12 to 37 m, and therefore while the average depth is approximately 30 m, the depth of individual wells will vary depending on their location on the landfill. The wells will be drilled with a diameter of 600 mm, and HDPE perforated vertical pipes will be inserted and surrounded by gravel in the wells. In this manner LFG can be extracted from the surrounding waste. Considering the potential problems of the leachate collection system and the expected high volume of leachate stored in Cell 1 that may prevent LFG generation, a leachate pumping system should be combined with some LFG - collection wells to allow leachate pumping from Those wells. After operations in Cells 2 & 3 are finished (expected to take place in 2010 and 2012 respectively), a similar gas extraction system as described for Cell 1 will be installed. This system will also have approximately 46 wells in each cell, but because the average depth of Cell 2 is expected to be only 23 m and only 17 m for Cell 3, the depth in Cell 2 will be less than that in Cell 1 and the depth in Cell 3 lower than Cell 2. A leachate/water pumping system is still expected to be necessary in 50% of the LFG wells for both cells.
E1895 vol. 3 rev.

ECO Consult
Municipal SWM & Carbon Finance
40
2.3.3 LFG Collection Pipes The individual gas extraction wells are connected to horizontal suction pipes that conduct the gas to a main collection pipe which will be connected to a blower. Pipes should be laid on top of the final cover for easier monitoring and maintenance and identification of potential leaks. The LFG has approximately 100% humidity when extracted from the landfill, and will therefore form condensate in the gas pipelines when the gas temperature decreases, especially during wintertime. For this reason an adequate condensate trap must be established. The collected condensate should be pumped and treated with the leachate.
2.3.4 Blower or Gas Pumps Blowers or gas pumps should be placed in a pump station from where the LFG is sucked from the landfill and then under pressure fed into the flare(s) and, when the energy plant is established, into the gas engine/generator unit(s). The total capacity of the gas pump(s) for Cell 1 has to be approximately 2,500 Nm3/hour. When the gas extraction system is in place at Cell 2, an expansion of the pumping system, with an additional pump capacity of 1,000 Nm3/hour, will need to be installed in the pump station. A third expansion should also take place when the gas extraction system is in place at cell 3, with an additional pump capacity of 1,000 Nm3/hour. Before the pumps are operated, a gas pre-treatment system has to be installed. The gas has to be treated according to the actual trace components in the LFG, but in most cases an efficient condensate removal system is sufficient, although in a few cases hydrogen sulphide has to be removed separately when used in gas engines. Furthermore, flame arresters, a control and regulation system, etc., have to be installed.
2.3.5 LFG Treatment: Flaring and Electricity Generation Flaring: From the pump station the LFG from Cell 1 is pressed to the utilization system, which during the first 9-month period will consist of a number of flares with a total capacity of 2,500 Nm3/hour. The flares have to be enclosed, which allows the highest emission reductions from a flare. An expansion of the flare system, with an additional flare capacity of 1,000 Nm3/hour, will also need to be installed at Cell 2 & 3 respectively. This first treatment with flaring reduces the impact on global warming by burning the CH4 with a Global Warming Potential (GWP)=21 which converts it into carbon dioxide (CO2) with a GWP=1. After a 3-month period of extraction of LFG from Cell 1, the amount of gas can be estimated, the size of the Power Production Plant can be verified and the appropriate size of equipment can be ordered. At the moment, however, it is assumed that the total capacity of the power plant will be 4 MW. Electricity Generation: The Power Production Plant should consist of a number of gas engine/generator units, preferably installed in containers. The engines run a power generator that produces electricity and is
E1895 vol. 3 rev.

ECO Consult
Municipal SWM & Carbon Finance
41
connected to a transformer station, from where the electricity is delivered to the grid. The gas engine/generator units can be different sizes, but a production of 0.7 MW to 1 MW of electricity is a normal size for installation in containers. A control and regulation system is installed for each gas engine/generator unit. The electricity from 4-5 MW can be delivered to the existing 11kV power line, but cables from the engines as well as a new transformer has to be included in the investment. When the power plant is installed the first priority is to use the LFG in gas engine/generator units; the excess gas, if any, would be burned off in flare(s). In case the power plant or parts of it is temporarily shut down, the rest of the LFG will be flared. At the power plant additional 1 MW gas engines/generator units will need to be installed and connected to the grid as described for Cell 1, when operations at Cells 2 & 3 are finished respectively.
2.4 Transfer Services
2.4.1 New Transfer Stations Under this sub-component, the project will reinforce the existing transfer system by financing the construction and equipment of two transfer stations to service the north and south-west areas of Amman. These areas are very far from the existing transfer stations and collection vehicles have to travel 1 to 2 hours in the traffic to unload in one the existing transfer stations and come back to their collection area. Moreover, these two facilities aim at increasing the proportion of MSW transported through transfer station from 75% to 95% and thereby, reducing the cost of collection services in Amman. The location of these two stations has not been identified yet although a Site Suitability Study is currently being undertaken by CM. Additionally, a Resettlement Policy Framework (RPF) has also been developed by ECO Consult in a different document to assess the land acquisition process and resettlement of people residing at the potential locations for these two new stations, if needed. Once the site of the transfer stations will be selected an Environment and Social Impact Assessment (ESIA) plan will be prepared in accordance with TOR approved by the Bank. The ESIA will be discussed at public consultations and disclosed in specific locations in Jordan as well in the Bank info- shop.
The following is a summary of the minimum requirements to be taken into account when designing the transfer stations:
• The new transfer stations should use a certain degree of compaction rather than a transfer by gravity to reduce potential impacts on ambient air quality and public health, among others.
• The transfer stations should be built to serve until 2013 based on the following receiving
capacities:
o Northwestern transfer station: 450 tons/day. o Southwestern transfer station: 600 tons/day.
E1895 vol. 3 rev.

ECO Consult
Municipal SWM & Carbon Finance
42
• The implementation of the transfer stations should allow improvements on the productivity and cost-efficiency of the collection, thus to reduce the collection fleet by the equivalent of 25 to 28 vehicles.
Figure 2.2: Location of the Existing Transfer Stations and the Ghabawi Landfill
E1895 vol. 3 rev.

ECO Consult
Municipal SWM & Carbon Finance
43
3. LEGAL AND INSTITUTIONAL FRAMEWORK
As mentioned before, this report sets out information on the project required for an ESIA following the WB Operational Policies OP 4.01 and under the Jordanian Environmental Impact Assessment Regulation No.37 for the year 2005. This ESIA is designed to meet both sets of requirements, and once the ESIA, is finished, the Ministry of Environment becomes the Jordanian regulatory entity responsible for its approval. This section provides an overview of the key environmental, planning, and health & safety legislation and regulations of relevance to the project and which will be taken into account during the ESIA. The section has been structured according to the main project components and the specific regulations associated to each of them. See Table 3.1 below.
3.1 Legal Framework associated with Environmental Approvals
• Environmental Impact Assessment Regulation No.37, for the year 2005
The EIA Regulation sets out the process for conducting an Environmental Impact Assessment (EIA) Study, which includes any procedure that aims to identify the impact of all the phases of the establishment of a certain project, in this case the enhancement of the transfer stations, and describes and study this impact on the project and its impact from the social and economic aspects, and identify the methods for limiting any adverse impact on the environment. The assessment shall be conducted during the preparation of the economic feasibility study, planning, design, implementation, operation and removal of the project. The Regulation also lists the projects that require a full EIA or a Preliminary Environmental Impact Assessment study. Any project which may have a significant impact on the environment, must have a comprehensive EIA carried out, before permission to operate (or license to begin construction) can be given. This is applicable to the proposed Municipal SWM and Carbon Finance Project. In accordance with Regulation 37, upon the Ministry's receipt of the draft ESIA Document, a Technical Committee will review and analyze the draft to ascertain its compliance with the provisions of the Regulation. If the draft ESIA Document fulfills all of the requirements of the provisions of this Regulation, the Minister, will approve the draft and consider it the final ESIA Document. This is to occur within 45 days from receipt of the draft. Once approved, the requirements of the ESIA, and the EMP become a legal requirement on the project, and the project owner should abide by the contents of the ESIA Document and any other conditions issued by the Ministry when granting its approval. The Ministry is also responsible to monitor the extent of the compliance of the project owner with the conditions and requirements stipulated in the Environmental Approval during any of the activities of the project including its implementation, operation, and disassembling.
E1895 vol. 3 rev.

Table 3.1: Regulations Applying to Each of the Project Components to Limit the Environmental Risks Associated
REGULATIONS APPLYING TO EACH OF THE PROJECT COMPONENTS TO LIMIT THE ENVIRONMENTAL RISKS ASSOCIATED Transfer Stations Landfill and Leachate Treatment Plant LFG to Energy Plant
SWM Regulation No.27 for the year 2005 Common Services Council Regulation No.17 for the year 1983 Environment Protection Law No. 52 for the year 2006
Protecting the Environment from Pollution in Emergency Situation Regulation No.26 for 2005
Groundwater Control Regulation No. 85 for the year 2002, Issued pursuant to articles 6 and 32 for Water Authority Law No. 18 for the year
1988.
Protection and Safety from Industrial Tools, Machines and Work Sites Regulation No. 43 For the year 1998
Protection and Safety from Industrial Tools, Machines and Work Sites Regulation No. 43 For the year 1998
Environment Protection Law No. 52 for the year 2006 JS 1140/2006 Air Quality - Ambient Air Quality Standards
Municipalities Law No.29 for the year 1955 The Antiquities Law No.12, 1988, as amended By Law No.23 for the year 2004
JS 1189/2006, Pollutants - Maximum Allowable Limits of Air Pollution Emitted from the Stationary Sources
Environment Protection Law No. 52 for the year 2006 Municipalities Law No.29 for the year 1955 The United Nations Framework Convention on Climate Change, 1992
Environmental Impact Assessment Regulation No.37 for the year 2005 Protection and Safety from Industrial Tools, Machines and Work Sites
Regulation No. 43 For the year 1998
The Kyoto Protocol, 1997
JS 12105/1999, Containers – Mobile waste containers-Part 5: Performance Requirements & Methods JS 1140/2006, Air Quality - Ambient Air Quality Standards Environmental Impact Assessment Regulation No.37 for the year 2005
Planning of Towns and Villages and Buildings Law No. 79 for the year 1966
JS 1189/2006, Pollutants - Maximum Allowable Limits of Air Pollution Emitted from the Stationary Sources Protection of the Environment, CFR, Title 40. Subchapter I: Solid Waste
Labour Law No.8 for year 1996 and amendments, Chapter IX: safety and Occupational Health and Chapter X: Work and Injuries and
occupational diseases Instruction for the Reduction and Prevention of Noise for the year 2003
Protecting the Environment from Pollution in Emergency Situation Regulation No.26 for 2005 (it also applies to all
landfill emergency situations) Supplies and Works Regulation for Municipalities and Village Councils
No. 55, 1989, and Supplies and Works Regulation for the Municipality of Greater Amman No.12, 1988
Environmental Impact Assessment Regulation No.37 for the year 2005
JS 1140/2006, Air Quality - Ambient Air Quality Standards Labour Law No.8 for year 1996 and amendments, Chapter IX: safety and
Occupational Health and Chapter X: Work and Injuries and occupational diseases
Instruction for the Reduction and Prevention of Noise for the year 2003 Supplies and Works Regulation for Municipalities and Village Councils
No. 55, 1989, and Supplies and Works Regulation for the Municipality of Greater Amman No.12, 1988
Protection of the Environment CFR, Title 40. Subchapter I: Solid Waste Soil Protection Regulation No.25 for the year 2005
Decree (12) of 1987 or Land Acquisition Law and its amendments Protection of the Environment CFR, Title 40. Subchapter I: Solid Waste The Antiquities Law No.12, 1988, as amended By Law No.23 for the year
2004
Temporary Public Health law No.54 for the year 2002
E1895 vol. 3 rev.

ECO Consult
Municipal SWM & Carbon Finance
45
3.2 Legal Framework associated with the Transfer Stations
The following is a review of the main regulations to be applicable during the construction and operation of the new transfer stations.
• Solid Waste Management Regulation No.27 for the year 2005 This regulation ensures the management of SW in a way that maintains environmental protection and public health. Details, responsibilities and tasks to be undertaken including observing and collecting operations, transportation of wastes, permitting, supervising, scheduling and archiving and outlining the responsibilities and tasks for the Ministry of Municipalities and the MoE are listed. Article 4 defines the specifications of the equipment used in SWM, rules for the collection, sorting, transportation, storage, recycling, treatment and disposal of SW. This regulation is relevant to the project activities- especially health and safety – as article 4 demands training and awareness programmes in the field of SWM. Article 5 of the regulation explains that qualified manpower resources for SWM and public safety measures for it workers should be provided. In addition, article 5 of the regulation explains the need for supervising the sorting of waste, excavation and landfill activities and the need to monitor the compliance with the stipulations appearing in SWM contactor's contracts. It again demands that all mitigation measures for preventing hazardous waste from reaching SW containers and transportation means should be taken into account. Finally, it forbids the burning of SW or disposal thereof in an exposed manner.
• Protecting the Environment from Pollution in Emergency Situation Regulation No. 26, for the year 2005
This regulation sets out the plan related to protecting the environment and controlling pollution in emergency situations and the methods of implementation. It also identifies the manpower, machinery and equipment necessary for the Emergency Plan and sets plan related to handling emergency situations and review such plans.
Article 7 of this regulation requires the preparation of a local emergency plan and its submission to the national committee for ratification.
• Protection and Safety from Industrial Tools and Machines and Work Sites Regulation No.43, for the year 1998
This regulation discusses the precautionary measures and procedures at establishments that should guarantee the protection and safety from equipments and work sites. Article 5 of the Law discusses all precautionary procedures which prevent workers from being harmed on injured when gas, dust, waste or any impurities are generated during work.
• Municipalities Law No.29, for the year 1955 The Municipalities Law No. 29, 1955 is the most relevant piece of legislation governing SWM in Jordan. This law gives the various Municipal Councils the responsibility for cleaning, collection and transportation and disposal of SW form households and commercial areas. It also stipulates that the Municipal Councils are responsible for monitoring households and other places to ensure
E1895 vol. 3 rev.

ECO Consult
Municipal SWM & Carbon Finance
46
their disposal of SW regularly and the cleanliness of sanitary tools. In addition, the Municipal Councils are empowered to collect fees for their services, including SWM. This law is supported by a number of Regulations.
• Environment Protection Law No. 52, for the year 2006 This Law, among other things, imposes upon firms, institutions, companies and others, to prepare studies of the environmental impact assessment for their projects and activities. It obliges the owners of factories, vehicles and work shops, who exercise activities with negative impacts on the environment and who emit environmental pollutants, to install devices to prevent or minimize the dissemination of these pollutants. Article 4 of the regulation sets out the principles of handling of materials harmful and hazardous to the environment, which includes the collection, transportation, destruction and disposal. It also necessitates the preparation of an environmental emergency plan. Article 12 sets out the fine which the owner of a vehicle or machine or person will need to settle for causing noise; this fine according to the regulation is not less than 10 JD and not exceeding 20 JD. Article 19 describes that the owners of factories or vehicles that conduct any activities with a negative impact on the environment and might emit environmental pollutants must install equipment and take necessary measures to prevent and reduce emissions of such pollutants. If penalised a fine of not less than 10 JD and not exceeding 20 JD should be settled.
• Jordanian Standard JS 12105, for the year 1999, Containers – Mobile waste containers-Part 5: Performance Requirements & Methods
The standard discusses the before and after visual inspections of containers and the actual elements that need to be assessed. These will include the body, lid, wheels and other fittings. Sizes and functional dimensions are provided in the standard as well. The Capacities of the containers are also discussed and should be measured for each component in accordance with the standard. Other tests required are also mentioned in the standard. Article 4.10.3 describes the lifting and tilting of the loaded container.
• Planning of Towns, Villages and Buildings Law No. 79, for the year 1966 This Law declares the establishment of several planning boards and provides the manner in which their work must proceed and the considerations and standards they must observe. At the highest level is the Higher Town Planning Council. This council is given the responsibility of declaring planning zones for the towns, their enlargement and amendment, endorsing regional plans, annulling licenses issued contrary to this law, etc. The subordinate authority is the Central Department for the Planning of Towns and Villages, which among other responsibilities, has the duty preparing regional plans for all districts. In addition, there is the District, Town, Village and Building Planning Council. Since GAM is proposing the construction of two new transfer stations, the planning zone for each location needs to be taken into consideration.
• Labour Law No.8, for year 1996 and amendments. Chapter IX: Work Injuries and Occupational Diseases
The Law contains regulations concerned with the health and safety of workers and their affairs and sets the responsibilities of the employer to protect workers against hazards and diseases,
E1895 vol. 3 rev.

ECO Consult
Municipal SWM & Carbon Finance
47
including providing workers with the necessary equipment, information regarding potential occupational diseases and precautionary measures before taking up the job. In addition, this Law sets the duties to be fulfilled by the Ministry of Labour regarding the issuance of instructions regarding precautions to be taken by establishments to protect workers, as well as the equipment, conditions and standards to be met in order to provide a safe environment in accordance to the adopted international standards. It relates to the labour injuries and occupational diseases on the employees who are not subject to the provisions of the applicable social security law. It takes into consideration all safety measures that are required for the occupational health and safety level of the employees. Compensation actions and fines are also discussed within the instruction.
• Supplies and Works Regulation for Municipalities and Village Councils No. 55, for the year 1989, and Supplies and Works Regulation for the Municipality of Greater Amman, No. 12 for year 1988.
These Regulations govern all issues related to procurement by municipalities. They set the purchasing powers, methods of procurement of works and supplies, and the procedure to be followed when procuring. These regulations have been used (and are being used) to let out service contracts relating to maintenance, parking fee collection, and other services. The regulations have also been used to purchase SW collection and transport services, and disposal site management services, over a period of time, from the private sector.
• Jordanian Standard JS 1140, for the year 2006, Air Quality - Ambient Air Quality Standards
The maximum allowable limits of concentration of ambient air pollutants, beyond which, responsible parties should take action have to be followed. The Standards specifies the maximum allowable limits of concentration of ambient air pollutants, beyond which, responsible parties should take action. The parameters defined include SO2, CO, TSP (total suspended particles), NO2, H2S, O3, NH3, PM10, PM2.5, Pb, P2O5 and Cd. These standards describe also methods to be used for measuring the above parameters. As shown in Table 3.2 below,
Pollutant Duration Maximum Allowable limits
Allowable times for exceeding limits
SO2 1 hour 0.135 ppm 3 times during a year 24 hours 0.13 ppm Once a year Annual 0.03 ppm
CO 1 hour 26 ppm 3 times a year 8 hours 9 ppm 3 times a year
NO2 1 hour 0.21 ppm 3 times a year 24 hours 0.08 ppm 3 times a year Annual 0.05 ppm
H2S 1 hour 0.030 ppm 3 times a year 24 hours 0.01 ppm 3 times a year
O3 8 hours 0.08 mg/kg 1 hour 0.12 mg/kg
NH3 24 hours 270 mg/kg 3 times a year Annual 8 mg/kg
TSP 24 hours 260 µmg/m3 3 times a year Annual 75 µmg/m3
E1895 vol. 3 rev.

ECO Consult
Municipal SWM & Carbon Finance
48
Pollutant Duration Maximum Allowable limits
Allowable times for exceeding limits
PM10 24 hours 120 µmg/m3 3 times a year Annual 70 µmg/m3
PM2.5 24 hours 65 mg/kg 3 times a year Annual 15 mg/kg
Pb Seasonal 1 µmg/m3 Annual 0.5 µmg/m3
P2O5 24 hours 100 mg/kg 3 times a year Annual 40 mg/kg
Cd Annual 0.005 mg/kg
Table 3.2: Allowable Emission Limits for Air Pollutants
• Instruction for the Reduction and Prevention of Noise for the year 2003 This Instruction is in accordance with the Article 12 of the Environmental Protection Law No. 52 for the year 2006, and it relates the concern on the subject of controlling and preventing noise outside the work environment. Instructions for controlling and preventing noise issued by the Ministry of Labour are applied inside the work environment. It establishes the limits of noise sources such as bells and car honking. In addition, this instruction sets the penalties applied when maximum noise levels are exceeded. Article 5 of the regulation sets out the working hours for all construction activities causing noise such as mixers, etc. working hours for such activities should take place between 8 pm and 6 am; and is exceptional for cases approved by the minister. Article 6 presents a table showing the allowable noise levels for different types of areas. These are shown below:
Maximum allowable Noise level (Decibel A) Area Day Night
Urban residential areas. 60 50 Sub urban residential areas. 55 45 Rural residential areas. 50 40 Residential areas with shops, handicrafts, commercial areas and the city centre.
65 55
Industrial areas 75 65 Areas for education, worshipping, therapy purposes.
45 35
Table 3.3: Maximum Allowable Noise Levels
• Protection of the Environment, Code of Federal Regulation Title 40. Subchapter I: Solid Waste
The Protection of the Environment Regulation as mentioned above should be taken into account as it also sets out the Criteria for Municipal SW landfills and the criteria for SW disposal facilities and practices.
• Decree (12) of 1987 or Land Acquisition Law (LAL) and its amendments
E1895 vol. 3 rev.

ECO Consult
Municipal SWM & Carbon Finance
49
The Land Acquisition Law applies in all cases of land acquisition in the Kingdom, which in the present assessment applies to potential land acquisition to construct the new transfer stations. According to Article 9 of the law, direct negotiation between GAM and land owners may be conducted until agreement is reached. In the event that an agreement cannot be found between the two parties, the cases are referred to the Primary Court that has jurisdiction in this area, and to higher courts if necessary. This Law is described in more detail in the Resettlement Policy Framework for the Ghabawi Landfill and the Transfer Stations Document. Other laws pertaining to land acquisition that might potentially be relevant to the present project once the location for the transfer stations is selected have been included in the RPF.
• The Antiquities Law No.12, 1988, as amended By Law No.23, for the year 2004 During the construction of the transfer stations the “Chance Find “procedures of the World Bank will apply.
• Temporary public health law No.54 for the year 2002 Article 10 of the temporary public health law No.54 for the year 2002 prohibits under penalty of legal liability events or accidents causing unsanitary conditions. This includes the improper disposal of solid, liquid or other waste on the streets, sidewalks, public squares or open land.
3.3 Legal Framework associated to the Landfill and Leachate Treatment Plant
The following is a review of the main regulations to be applicable during the assessment of the existing conditions of the landfill and the construction of the Leachate Treatment Plant.
• Common Services Council Regulation No.17, for the year 1983 This regulation gives the Common Services Councils the authority to establish waste disposal sites and to dispose of wastes, on behalf of the municipalities and in collaboration with the relevant entities. It also assigns the Common Council as the responsible entity to implement and manage common service projects.
• Groundwater Control Regulation No. 85 for the year 2002, Issued pursuant to articles 6 and 32 for Water Authority Law No. 18 for the year 1988.
This Regulation was issued pursuant to Articles 6 and 32 of Water Authority Law No. 18 of 1988. The general rules of the Groundwater Control Regulation are that the groundwater is state-owned and it is subject to its control. The regulation emphasizes on other licensing rules and fees for drilling wells and any pumping activities as well as water prices, pollution control, and requirements from private well owners.
• Environment Protection Law No. 52, for the year 2006 As mentioned before, this Law, among other things, imposes upon firms, institutions, companies and others, to prepare studies of the environmental impact assessment for their projects and activities. It obliges the owners of factories, vehicles and work shops, who exercise activities with negative impacts on the environment and who emit environmental pollutants, to install devices to prevent or minimize the dissemination of these pollutants.
E1895 vol. 3 rev.

ECO Consult
Municipal SWM & Carbon Finance
50
Article 4 of the regulation sets out the principles of handling of materials harmful and hazardous to the environment, which includes the collection, transportation, destruction and disposal. It also necessitates the preparation of an environmental emergency plan. Article 12 sets out the fine which the owner of a vehicle or machine or person will need to settle for causing noise; this fine according to the regulation is not less than 10 JD and not exceeding 20 JD. Article 19 describes that the owners of factories or vehicles that conduct any activities with a negative impact on the environment and might emit environmental pollutants must install equipment and take necessary measures to prevent and reduce emissions of such pollutants. If penalised a fine of not less than 10 JD and not exceeding 20 JD should be settled. Article 11 on the other hand prohibits the storage of any material such as solid, liquid, gaseous, radioactive or thermal in the proximity of water sources with in the safe limits set by the Ministers by virtue of instructions issued for that purpose, including the protection of water basins in coordination with the concerned parties. The article sets out the punishment and fines for disobeying any previously mentioned conditions.
• Jordanian Standard JS 12105, for the year 1999, Containers – Mobile waste containers-Part 5: Performance Requirements & Methods
The standard discusses the before and after visual inspections of containers and the actual elements that need to be assessed. These will include the body, lid, wheels and other fittings. Sizes and functional dimensions are provided in the standard as well. The capacities of the containers are also discussed and should be measured for each component in accordance with the standard. Other tests required are also mentioned in the standard. Article 4.10.3 describes the lifting and tilting of the loaded container.
• Municipalities Law No.29, for the year 1955 As previously stated, the Municipalities Law No. 29, 1955 is the most relevant piece of legislation governing SWM in Jordan. This law gives the various Municipal Councils the responsibility for disposal of SW form households and commercial areas.
• Protection and Safety from Industrial Tools and Machines and Work Sites Regulation No.43, for the year 1998
This regulation discusses the precautionary measures and procedures at establishments that should guarantee the protection and safety from equipments and work sites. Article 5 of the Law discusses all precautionary procedures which prevent workers from being harmed on injured when gas, dust, waste or any impurities are generated during work.
• Jordanian Standards JS 1140, for the year 2006, Air Quality - Ambient Air Quality Standards
The maximum allowable limits of concentration of ambient air pollutants, beyond which, responsible parties should take action will be followed for the LFG generated at the landfill. Table 3.2 above describes the maximum allowable Emission Limits for Air Pollutants.
• Jordanian Standard JS 1189 for the year 2006, Pollutants - Maximum Allowable Limits of Air Pollution Emitted from the Stationary Sources
The Standards specifies the maximum permissible emission levels of air pollutants according to the type of activity. It also specifies the maximum permissible limits for the emission of gases and
E1895 vol. 3 rev.

ECO Consult
Municipal SWM & Carbon Finance
51
vapours such as CO, SO2, NOx, and hydrocarbons, as well as the measuring methods for each pollutant.
• Instruction for the Reduction and Prevention of Noise for the year 2003 The maximum allowable limits of noise levels during the disposal of SW and the construction of the Leachate Treatment Plant must be followed. Article 6 of the regulation presents a table showing the allowable noise levels for different types of area, as shown in table 3.3 above.
• Environmental Impact Assessment Regulation No.37, for the year 2005 As pointed out above, this regulation sets out the process for conducting an EIA Study, which includes any procedure that aims to identify the impact of the construction at Cell 3 and the Leachate Treatment Plant; it also describes and studies the impacts on the project from a social and economical aspect.
• Labour Law No.8, for year 1996 and amendments. Chapter IX: Work Injuries and Occupational Diseases
As mentioned before, the Law contains regulations concerned with the health and safety of workers and their affairs and sets the responsibilities of the employer, as well as the precautions to be taken by establishments to protect workers and the equipment.
• Supplies and Works Regulation for Municipalities and Village Councils No 55, 1989, and Supplies and Works Regulation for the Municipality of Greater Amman, No 12, 1988.
Occasionally, these regulations have been used to purchase, among other things, the disposal site management services, over a period of time, from the private sector.
• Soil Protection Regulation No. 25. for the year 2005 This regulation is in accordance with article 23 of the Environmental Protection Law No. 1 of the year 2003. It discusses the need for setting a comprehensive plan to protect the soil and determine optimal land uses; monitors sources of soil pollution and controls them to the limit permitted environmentally, in accordance with the locally established standards and specifications. Article 3 also considers the need of setting up a national plan for collecting all required information and data in the field of soil protection and land use. It prepares the necessary programmes for rehabilitation of waste dumping sites after their reclamation, exploitation and cultivation with the appropriate crops.
• Protection of the Environment, Code of Federal Regulation (CFR) Title 40. Subchapter I: Solid Waste
The Protection of the Environment Regulation discusses the Criteria for Municipal SW landfills and the criteria for SW disposal facilities and practices. The regulation also describes the ground water and leachate monitoring techniques and standards to be followed.
• Protecting the Environment from Pollution in Emergency Situation Regulation No. 26, for the year 2005
E1895 vol. 3 rev.

ECO Consult
Municipal SWM & Carbon Finance
52
This regulation sets out the plan related to protecting the environment and controlling pollution in emergency situations and the methods of implementation. It also identifies the manpower, machinery and equipment necessary for the emergency plan and sets plan related to handling emergency situations and review such plans.
Article 7 of this regulation requires the preparation of a local emergency plan and its submission to the national committee for ratification.
3.4 Legal Framework associated to the LFG to Energy Plant
The following is a review of the main regulations to be applicable during the assessment of the construction of the LFG to Energy Plant.
• Environment Protection Law No. 52, for the year 2006 As mentioned before, this Law, among other things, imposes upon firms, institutions, companies and others, to prepare studies of the environmental impact assessment for their projects and activities. Article 11 as previously mentioned prohibits the storage of any material such as solid, liquid, gaseous, radioactive or thermal in the proximity of water sources with in the safe limits set by the Ministers by virtue of instructions issued for that purpose, including the protection of water basins in coordination with the concerned parties. The article sets out the punishment and fines for disobeying any previously mentioned conditions.
• Protection and Safety from Industrial Tools and Machines and Work Sites Regulation No.43, for the year 1998
This regulation discusses the precautionary measures and procedures at establishments that should guarantee the protection and safety from equipments and work sites. Article 5 of the Law discusses all precautionary procedures which prevent workers from being harmed on injured when gas, dust, waste or any impurities are generated during work.
• Jordanian Standards JS 1140, for the year 2006 Air Quality - Ambient Air Quality Standards
As mentioned in table 3.2 above, this regulation establishes the maximum allowable limits of concentration of ambient air pollutants, beyond which, responsible parties should take action will be followed for the construction of the LFG to Energy Plant.
• Jordanian Standard 1189 for the year 2006 Pollutants - Maximum Allowable Limits of Air Pollution Emitted from the Stationary Sources
The Standards specifies the maximum permissible emission levels of air pollutants according to the type of activity. It also specifies the maximum permissible limits for the emission of gases and vapours such as CO, SO2, NOx, and hydrocarbons, as well as the measuring methods for each pollutant.
• The United Nations Framework Convention on Climate Change (UNFCCC), 1992 The Convention, adopted in 1992, sets an overall framework for intergovernmental efforts to tackle the challenge posed by climate change. It recognizes that the climate system is a shared
E1895 vol. 3 rev.

ECO Consult
Municipal SWM & Carbon Finance
53
resource whose stability can be affected by industrial and other emissions of CO2 and other greenhouse gases (GHG). Under the Convention, governments, among other things, launch national strategies for addressing GHG emissions and adapting to expected impacts, including the provision of financial and technological support to developing countries.
• The Kyoto Protocol, ratified by Jordan in 2003 The Protocol, adopted on 1997, shares the objective and institutions of the UNFCCC. The major distinction between the two, however, is that while the Convention encouraged developed countries to stabilize GHG emissions, the Protocol commits them to do so. Because it will affect virtually all major sectors of the economy, the Kyoto Protocol is considered to be the most far-reaching agreement on environment and sustainable development ever adopted.
• Environmental Impact Assessment Regulation No.37, for the year 2005 As previously mentioned, this Regulation sets out the process for conducting an EIA Study, which includes any procedure that aims to identify the impact of the LFG to Energy Plant, and describes and study this impact on the project and its impact from the social and economic aspects.
• Protection of the Environment, Code of Federal Regulation (CFR) Title 40. Subchapter I: Solid Waste
The Protection of the Environment Regulation discusses the Criteria for Municipal SW landfills and the criteria for SW disposal facilities and practices. It also mentions a Hazardous waste Management system and land disposal restrictions.
• Protecting the Environment from Pollution in Emergency Situation Regulation No. 26, for the year 2005
This regulation sets out the plan related to protecting the environment and controlling pollution in emergency situations and the methods of implementation. It also identifies the manpower, machinery and equipment necessary for the emergency plan and sets plan related to handling emergency situations and review such plans.
Article 7 of this regulation requires the preparation of a local emergency plan and its submission to the national committee for ratification.
3.5 Institutional Framework associated with the Project
3.5.1 Institutional Framework for SWM Operations and Follow up The Institutions and Ministries most directly related to the environmental issues associated with the project are summarized below.
• Greater Amman Municipality GAM is the entity responsible for providing services to the private and public sectors as well as the institution in charge of developing the legal framework related to the existing services as well
E1895 vol. 3 rev.

ECO Consult
Municipal SWM & Carbon Finance
54
as for new arising municipal aspects. In addition, GAM is in charge of issuing licenses, construction permits, certification of lease contracts and zoning site plans, among other things. The organization of GAM is based on different departments specialized according to the services provided by each of them, such as the Research and Development Department, the Zoning Department or the Works Department, among others. In relation to SWM, since mid of 2007 the administrative responsibility of the collection and cleaning equipment and staff has been transferred to the Cleanliness and Environment Department as part of the Health and Environment Department. However, the management of these staff and equipment is still under the responsibility of the districts managers and their engineers. The Cleanliness and Environment Department is also responsible for managing the transfer stations and Ghabawi Landfill, and to inspect the performance of the collection and city cleaning made by the districts. Other departments which are highly involved in MSWM are: The Transportation and Supply Department: This department is responsible for the supply, licensing and insurance of vehicles for GAM, except the heavy vehicles. In addition, they provide fuel & oil to the vehicles, the spare drivers and the water supply. The Workshop Department: This department is responsible for the maintenance of all vehicles from the Transportation and Supply Department. In particular, it is in charge of all the collection vehicles, most of the transfer vehicles, the mechanical sweepers and the containers washing vehicles. The Heavy Vehicles Department: This department is responsible for the supply and maintenance of the heavy equipment for all GAM departments, which include the heavy vehicles in use at the landfill and some transfer head trucks and trailers. In addition, they provide spare drivers for the heavy vehicles. The Services and Building Maintenance Department: This department is responsible for the containers maintenance.
• Ministry of Environment (MoE) The MoE was established in 2003 with a mandate to maintain and improve the quality of the Jordanian Environment by sustaining and conserving Jordan's environmental resources and contributing to sustainable development. The Ministry is in charge of the development of policies, strategies and legislation and enhancing the integration of environmental concepts into national development plans. MoE also undertakes monitoring and inspection to ensure that legislation is correctly enforced and information management programs are developed in order to facilitate the decision-making and analysis process of environmental data. MoE also undertakes work on raising public awareness, strengthening its capacity and promoting co-operation with relevant national, regional and international parties. All projects which might impact the environment as scheduled in Jordanian legislation must undertake an Environmental Impact Assessment which must be approved by the Ministry.
• Ministry of Water and Irrigation (including Jordan Valley Authority (JVA) and Water Authority of Jordan (WAJ)
These organizations work collectively in determining the national water policy, monitoring and protecting water against pollution, in addition to studying water, irrigation and sewerage.
E1895 vol. 3 rev.

ECO Consult
Municipal SWM & Carbon Finance
55
Groundwater, aquifer management and abstraction monitoring and licensing are the responsibility of WAJ.
• Ministry of Health Established in 1950, the Ministry of Health undertakes all health affairs in Jordan and its tasks and duties include maintaining public health by offering preventive, treatment and health control services, organizing and supervising health services offered by the public and private sectors as well as providing health insurance for the public within available means.
• Jordan Institute for Standards and Meteorology (JISM) This institute is the issuer of standards and specifications for weather and climate.
3.5.2 Institutional Framework for Environmental Clearance and Ongoing Performance Monitoring
As discussed above, the Ministry of Environment is responsible for environmental clearance of projects deemed to be a threat to the environment. Clearance is regulated by the EIA Regulation, No 37, 2005. Based on a study conducted by the project sponsor, Environmental Approval is granted by the Ministry, after which the project can be implemented. If there is an EMP associated with the study, this (together with any other conditions stipulated by the Ministry) become a requirement on the project. The Ministry of Environment has the authority under the Law to monitor and inspect any industry which may be pollutive. Currently its capacity for this is weak, and focused on larger pollutant industries. Routine regulatory monitoring of the cleanliness of roads and urban areas is not performed, and the Ministry only steps in when complaints are received, or where there is a clear and unusual problem. The Ministry of Health, the Governor, and thew local municipality (GAM in this case) may also intervene in case of a significant public health problem. There is also no formal institutional arrangement for the monitoring of the implementation of EMPs. However, the Ministry of Environment is keen to improve its capacity in these areas, and plans are underway to upgrade the staff levels, and the equipment and monitoring capacity. The Ministry of Environment does, however, make an annual inspection of each landfill site in the country, and complies are report. GAM currently does no formal monitoring of its SWM service performance, and its response to complaints is reactive, rather than proactive. Recommendations on institutional re-structuring are made later, in Section 9.
3.5.3 Applicable World Bank Policies
• Operational Policy 4.01 on Environmental Assessment. The World Bank undertakes environmental screening of each proposed project to determine the appropriate extent and type of Environmental Assessment (EA). The World Bank classifies any proposed project into one of four categories (A, B, C, FI), depending on the type, location, sensitivity, and scale of the project and the nature and magnitude of its potential environmental
E1895 vol. 3 rev.

ECO Consult
Municipal SWM & Carbon Finance
56
impacts. A Category ‘A’ project is likely to have significant adverse environmental impacts that are sensitive, diverse, or unprecedented. These impacts may affect an area broader than the sites or facilities subject to physical works. The proposed project is considered Category A project as the rehabilitation, improvement and expansion of the SWM landfill in El Ghabawi will produce impacts from noise, dust and water quality degradation during construction and operation that could be significant. It should be noted that there will also be a number of nominal benefits resulting from this projects including improved water quality, waste management, access to clean water supply , and most importantly improvement of public health.
• Operational Policy 4.12 on Involuntary Resettlement: This operational policy examines whether the development project would require any involuntary resettlement and/or land acquisition. A resettlement framework was prepared as the operational policy on involuntary resettlement is triggered. The implementation of the proposed project will not induce any resettlement. Rehabilitation, additional treatment processes and increase in the capacities of cells and LFG treatment will be implemented within the land of the existing site and within public lands. The contraction of the two transfer sites might require access to private lands and therefore a RPF was prepared and disclosed during public consultation meeting on June 12, 2008
• Operational Policy 4.11 on Cultural Property: This operational policy addresses the impact on physical cultural properties having archaeological (prehistoric), paleontological, historical, religious, and unique natural values. The policy aims at ensuring the preservation of cultural heritage. There is no cultural property on the Al Ghabawi. Moreover, during the execution of works of the LDFG or the transfer stations, if a “chance find “ of archaeological significance occurs the civil work contract will require the contractor to immediately inform the employer and stop further work as this is standard practice in Jordan. Employer will in turn inform the Ministry of Antiquity for further investigation and action.
E1895 vol. 3 rev.

ECO Consult
Municipal SWM & Carbon Finance
57
4. CONSULTATION AND PUBLIC DISCLOSURE
4.1 Purpose and Requirements of Consultation:
The purpose of public consultation is to seek meaningful stakeholder involvement in project planning and design. This often leads to improved project design, facilitates implementation and assures sustainability. It further develops transparency and accountability between contractor and stakeholders. Three typical levels of public consultation exist and include; • Conveying information to the public. • Listening to the opinions and preferences of the public. • Involving public in decision making. The nature of the consultation will be influenced by the size and nature of the project, number and background of stakeholders as well as the legislative framework related to the project. The WB Operational Policies, OP 4.01, require initiation of public consultations at the very early stages of a project so that exchanged information with affected groups can influence key stages and components of the project. All affected groups such as local communities, nongovernmental organizations (NGOs) and governmental organizations should be involved in the consultation process. In particular, category A projects as defined by WB require the consultation of affected groups at least twice: (a) post submission of draft TOR/Scoping Report; and (b) post submission of draft ESIS. During the consultation session, it is essential that the communication methods utilized convey transparency and openness. In general, this involves: Notification – inform affected groups as to when, how and where to participate. It is crucial that this information is clear and delivered in a timely manner utilizing different media sources. Record-keeping – a record of the consultation procedures carried out, the stakeholders involved and the project stage that the specific information was conveyed. Also, a summary of the comments and concerns raised by stakeholders should be documented. Feedback – a method (e.g. document) of providing involved stakeholders with the actions taken in response to their concerns and comments. The Jordanian Environmental Impact Assessment Law 37, 2005 requires a Scoping Session to be held as part of the ESIA. During this public consultation session, project affected groups, local nongovernmental organizations (NGOs), governmental organizations, civil societies and private sector representatives are invited to engage in discussions in order to collect and take into account their views.
4.2 Scoping Session
A Scoping Session was held on the 5th of February at the King Hussein Cultural Centre in Amman. As per the Jordanian EIA Regulation, the list of invitees was identified by the Client
E1895 vol. 3 rev.

ECO Consult
Municipal SWM & Carbon Finance
58
(and the environmental consultant) together with the MoE. Approximately 40 attendees from various affected institutions: governmental and non-governmental organizations, civil societies, and private sector bodies, were present. The session itself was compromised of a series of presentations carried out by ECO Consult on the different project components. The sessions included; • Project Description and Baseline. • Methodology of Assessment. • Environmental Impacts. • Socioeconomic impacts. A full list of invitees, and the agenda, as well as the minutes of the meeting and consultations, can be found in the Final Scoping Report /TOR prepared by ECO Consult submitted in February 2008 to the MoE and in March 2008 to GAM and the WB, which is currently under its last final revision.
Figure 4.1 Scoping Session Presentation
The definition of these project components was based on internal discussions with GAM and the WB technical teams. The expected impacts on the physical, social and cultural environment during the various project phases were identified and included in the Scoping Report. The participants of the Scoping Session received a copy of the Scoping Report as well as the MoE in Jordan and the EIA Committee. ECO Consult facilitated discussions throughout the session in order for stakeholders to learn more about the project and to voice their comments and concerns with regards to different issues specific to the project and its components. Meeting minutes were documented during the session as a record of the concerns and comments of the affected stakeholders which also added to impacts and mitigation measures included in the Scoping Report. Table 4.1 below summarizes the issues as listed in the GAM/WB TOR together with the scoping discussions related to these items, and the final list of issues included in the Scoping Report. This list of issues was used to inform the entire environmental assessment process, and all issues are addressed in the study.
E1895 vol. 3 rev.

ECO Consult
Municipal SWM & Carbon Finance
59
GAM/WB TOR
Listed Issues Scoping Session Discussions Status in the final Scoping Report/TOR
Surface Water Quality
The landfill site is located in a dry area with no permanent water bodies. The landfill site is dry with rainfall of less than 150 mm/year. The participants discussed the potential of leachate water runoff to the water catchment, and concluded that is not likely for this to happen.
Excluded from the ESIA study
Groundwater Quality
This issue was discussed at length in the scoping session. Many participants including the Ministry of Water and irrigation and the Water Authority of Jordan indicated that groundwater is a very precious resource that warrant extensive analysis in the ESIA study to ensure that the levels of impacts on groundwater aquifers quality are assessed, and that existing and future water users will not be affected
Included as a significant issue for ESIA Study
Geology
The geology of the area is inherently related to the groundwater conditions. Depending of the existing geology at the landfill the risk of leachate reaching the groundwater table will vary and therefore, it has to be included in the assessment. This parameter was not discussed during the Scoping Session but it will be considered during the assessment.
Included in the ESIA Study
Topography
The same as geology, the topography of the landfill site will determine the leachate flow direction which influences the potential risk of soil and groundwater contamination. This parameter was not discussed during the Scoping Session but it will be considered during the assessment.
Included in the ESIA Study
Soil
This issue was discussed during the Session in several occasions. The need to study the interaction between the leachate and the soil was pointed out. The potential uncontrolled leachate generation is currently impacting the soil in some areas of Cell 1 and there’s a potential risk that other areas will be contaminated if the construction of Cells 2 & 3 is done incorrectly.
Included as a significant issue for ESIA Study
Climate and Meteorology
These parameters will determine the amounts of leachate generation as a consequence of the rainfall received in the area as well as the evaporation rate caused by high temperatures. These parameters were not discussed during the Scoping Session but they will be considered during the assessment.
Included in the ESIA Study
Ambient Air Quality, including Existing
Sources of Air Emissions
The potential impacts on Ambient Air Quality such as odour generation affecting population nearby the existing and future transfer stations as well as at the landfill was discussed during the Session. In addition, the improvements of Air Quality by constructing the LFG-to Energy Plant and reducing the LFG emissions were pointed out.
Included as a significant issue for ESIA Study
Coastal and Oceanic Parameters
Not discussed and not applicable Not applicable in this Study
Existing Water Pollution Discharges
The existing leachate contamination and the potential discharges resulting from an incorrect installation of the lining systems were also extensively discussed during the Session and pointed out as one of the main issues to be assessed during the ESIA. In addition, several treatment procedures for the leachate discharges were discussed by the attendees.
Included as a significant issue for ESIA Study
E1895 vol. 3 rev.

ECO Consult
Municipal SWM & Carbon Finance
60
GAM/WB TOR Listed Issues Scoping Session Discussions Status in the final Scoping
Report/TOR As mentioned before, the potential groundwater contamination resulting from leachate infiltration in the soil and sub-soil layers was addressed during the discussion.
Included as a significant issue for ESIA Study Receiving Water
Quality Regarding the risk of leachate reception in the surface water catchments, it was concluded that is not likely for this to happen.
Excluded from the ESIA Study
Biodiversity
This issue was discussed during the Scoping Session. There is a need to study and assess the potential impacts on existing flora, fauna and the existence of rare or endangered species, sensitive habitats and species of commercial importance that may be affected by the construction and operation of the project components. In addition, the study of species with potential to become nuisance, vectors or dangerous will have to be carried out.
Included in the ESIA Study
Population
The existing population living nearby the transfer stations and the landfill may be impacted from traffic and odour impacts. However, during the Session the participants indicated that there are no concerns related to the existing transfer stations. Once the location of the new transfer station is identified, potential impacts on nearby residents will have to be assessed.
Included in the ESIA Study
Land Use
This issue has to be taken into consideration as one of the criteria parameters to be assessed during the Suitability Study for new locations of transfer stations.
Included in the Feasibility Study for new locations but not in the ESIA Study
Involuntary Resettlement
This issue has to be taken into account during the selection assessment for locations of the new transfer stations.
Included in the Resettlement Policy Framework document but not in the ESIA Study
Planned Development Activities
This issue has to be taken into consideration as one of the criteria parameters to be assessed during the Suitability Study for new locations of transfer stations. The new Amman Master Plan which includes the future developments planned for GAM has to be considered during the Suitability Study.
Included in the Feasibility Study for new locations but not in the ESIA Study
Community Structure
The landfill site is far away from communities and commercial activities. However, for new transfer stations this issue will be discussed when locations are identified.
Included in the ESIA Study
Employment
From the implementation of the different project components the number of workers involved in SWM may vary. There is a clear need for workers at the landfill to construct and operate the new facilities. This issue was not addressed during the Scoping Session but will be assessed during the ESIA Study.
Included in the ESIA Study
Distribution of Income
The landfill site is far away from communities and commercial activities. However, for new transfer stations this issue will be discussed when locations are identified.
Included in the ESIA Study
Goods and Services
The landfill site is far away from communities and commercial activities. However, for new transfer stations this issue will be discussed when locations are identified.
Included in the ESIA Study
Recreation Activities
The landfill site is far away from communities and commercial activities. However, for new transfer stations this issue will be discussed when locations are identified.
Included in the ESIA Study
E1895 vol. 3 rev.

ECO Consult
Municipal SWM & Carbon Finance
61
GAM/WB TOR Listed Issues Scoping Session Discussions Status in the final Scoping
Report/TOR
Public Health
The need to assess the potential impacts on public health for residents living nearby the new transfer stations was discussed. In addition, the need to protect workers from direct contact with SW at the existing transfer stations and the landfill was also pointed out.
Included in the ESIA Study
Cultural Properties
A preliminary Suitability Study for the landfill location was already carried out in 2002 where no cultural or archaeological heritage was found. Therefore, this issue was not mentioned during the Session. However, in the case any site was discovered during the construction of the new landfill facilities or the excavation works for new cells, the Department of Antiquities will be informed.
Included in the ESIA Study
Tribal Peoples Not applicable Not applicable
Attitudes A public consultation process will take place to assess the attitudes from nearby residents towards the new transfer stations once their locations are identified.
Included in the ESIA Study
Customs and Aspirations
Not applicable Not applicable
Table 4.1: List of Environmental Issues included in the Scoping Report
4.3 Second Public Consultation Session
As required by the World Bank Operational Policies, a Second Consultation Session was held on June 12, 2008 in which all main findings and recommendations included in this ESIA was e presented to the public. During this session, various affected stakeholders were invited once again in order to review and provide feedback on the Environmental & Social Impact Assessment (ESIA) draft report and the Resettlement Policy Framework, which both were made available in Arabic in a form understandable to the general public. Approximately 40 people attended the session from different institutions including governmental, non-governmental organizations, civil society and local communities. The comments and concerns raised are included in the Table 4.2 below. The session was composed of one presentation carried out by ECO Consult with further clarifications and discussions by members of GAM. The ESIA process, project objectives, project components, baseline, methodology, environmental and socio-economic impacts, alternatives, mitigation and monitoring measures proposed in addition to recommendations for institutional strengthening and compliance, were described during the presentation. The main comments and responses that were brought up during the session are outlined in the table below, and the detailed minutes of meeting are included in Annex IV.
Comments Responses Ghabawi Landfill site is within close proximity of the Albeidah area; have the impacts on the community been addressed in the study?
The communities located near the landfill are relatively small and impacts on them are minimal based on the air quality studies carried out since all standards were met. Since the Ghabawi project is a CDM, emissions to the nearby communities will be reduced thus positively impacting them. There is a chance that winds will carry odour but
E1895 vol. 3 rev.

ECO Consult
Municipal SWM & Carbon Finance
62
Comments Responses according to wind studies carried out, wind directions is not directed towards the towns during the majority of the year.
The presence of Ghabawi Landfill within close proximity of residential areas a main source of health issues that must be addressed
The potential increase of health problems, in particular those related to vector transmission, a daily cover is being implemented at the site in order to reduce such impacts. GAM has all incentives to protect and improve human and environmental health. All alternatives that provide such support will be considered. The implementation of this project will in fact reduce negative environmental impacts since in it improves solid waste management, an essential element to the community's health and safety.
Landfills must be located at a distance of 60 km away from any neighbouring community which is not the case for Albeideh and Ohod areas. What are the potential impacts on these communities? What are the precautionary methods to prevent detrimental errors from taking place? There are currently 4 million tones of solid waste at Ghabawi, what are the potential impacts of gases emitted from the site on people?
According to site visits the closest community to the sire is 10km with a population of 559. Impacts on the communities and environmental have been thoroughly studied, that is the main objective of carrying out an ESIA. Based on soil sampling and geophysical testing of the site and based on the current design of the landfill liner and cover, no great impacts on the aquifers were identified and thus the Ghabawi site was chosen. The location is 37 km away from central Amman. The initial siting of the location took into consideration all the nearby communities' concerns through broadcasted messages on the radio in addition to regular letters.
The current location of Ghabawi Landfill will have to be reconsidered due to urban expansion and increased economical trading activities witnessed in the area.
The current location has been chosen based on many studies performed before the initial site selection which was not part of this ESIA. These studies were carried in order to eliminate all impacts related to the Ghabawi Landfill.
Did the assessment for waste to energy generation include best economical techniques? How were the different technologies assessed?
No answer was provided
Why has this project not used innovative alternative techniques such as mixed energy generation technologies, pyrolysis, etc?
The decision on energy generation was a strategic choice; even though there are alternative technologies available, this was the technology with the least risks.
Queried the potential formation of cracks leading to contamination of the groundwater in particular since an aquifer is located within 200 m.
The potential of cracks taking place in the site has been studied in the ESIA and the findings indicated that none are present and since the site is not close to any major fault lines none are anticipated. Furthermore, the water is not potable that is located in the aquifer within close proximity to the site. However, extensive analysis was carried out which illustrated that if water from the landfill was to reach the aquifer it would have 100% no negative impacts. There are no cracks discovered thus far, however in the
E1895 vol. 3 rev.

ECO Consult
Municipal SWM & Carbon Finance
63
Comments Responses event any become present the different technologies such as lining and treatment will minimize if not completely prevent any contamination from taking place. As for groundwater monitoring, this aspect has also been thoroughly studied and is included in the ESIA.
A weakness of the ESIA lies within its lack to fully take into consideration the local communities. For example, the revenue produced from carbon trading could contribute to projects within the local communities to enhance their quality of living.
There is an agreement between the WB and GAM that allocates 15% of CDM revenues to sustainable development.
The details of the project can be presented to the local communities as a means to include them and further transparency.
The socio-economic aspects of the project have been studied thoroughly and included within the ESIA. However, the recommendation of presenting the project to the local communities is an excellent one and will be further looked into.
Table 4.2: List of Comments and Responses Addressed at the Second Consultation Session Furthermore, once the locations of the two transfer stations are identified and approved, consultations in the form of a series of Focus Group Discussions and Structured Interviews will be organized with specifically identified key stakeholders in the surrounding communities. The ESIA for the transfer stations will be translated into Arabic, and shared with the stakeholder during a consulting meeting. The ESIA will also be disclosed at several specific locations in Jordan and at the World Bank Info Shop.
Public Disclosure The Executive Summary of the Draft ESIA Report in Arabic was distributed to the Governmental Institutions and NGOs invited to the Public Consultation Session for their review. In addition, copies of the full ESIA report are available at the Ministry of the Environment, the World Bank website and the Greater Amman Municipality website for the general public
E1895 vol. 3 rev.

ECO Consult
Municipal SWM & Carbon Finance
64
5. BASELINE ENVIRONMENT
This section provides a summary of currently available information with regard to the nature and status of the Project area. This includes a summary of:
• . • Existing conditions of the Transfer Stations. • Existing conditions of the Ghabawi Landfill. • Physical and Socio-economic Environment at Ghabawi.
5.1 Existing Conditions at Ghabawi Landfill
Al Ghabawi site is an area of approximately 2,000,000 m2 where 560,000 m2 are occupied by peripheral buildings, equipment, plants and roads. It is located in Madunah area, 23 km east from GAM’s boundary and 16 km from Zarqa. It used to be a military land and was never classified within residential, agricultural or industrial land uses. Moreover, there are no historical or cultural sites in this area.
Figure 5.1: Panoramic View of Ghabawi Landfill
Source: CM’s Feasibility Study 2007-08 The site is currently equipped with:
• A fence surrounding the whole site that needs to be fixed in some areas. A deep trench has also been digged along the fence in some locations to prevent waste pickers to enter the site. In addition, some trees have also been planted around the site.
• A peripheral track around the site.
• An administration building and a workshop building.
• An electrical transformer.
E1895 vol. 3 rev.

ECO Consult
Municipal SWM & Carbon Finance
65
• An asphalted road leading from the entrance to the administration building, the workshop building and Cell 1.
• A single weighing bridge which is not connected to a computerized management system,
but it should be shortly.
• Cells 1 & 2.
• Three (3) emergency leachate storage ponds.
• Three (3) evaporation ponds as part of the Leachate Treatment Plant where leachate is being disposed of by trucks but no treatment has still been applied.
No phone land line is available on-site and the telecommunications with mobile phones may be difficult depending on site locations and phone operators coverage. Besides, no water or sewerage network reaches the site. Water is delivered by tank trucks and stored in tanks.
5.1.1 Conditions of Cell 1 The preliminary design of the Ghabawi Landfill (lay-out of 9 cells) was prepared under CM’s Feasibility Study in 2002, including the detailed design and Tender Documents for the first 3 cells. However, the original design of Cell 1 defined by CM was not completely followed by GAM. The final characteristics of the cell are as follows: General excavation to reach the required levels: A general excavation (levelling) to reach the required levels in accordance to the drawing of cell No.2 ± 30cm was carried out for this cell.
Installation of geosynthetic materials for environmental protection, including the following materials:
• Placement and support of Geosynthetic Clay Liner (GCL). • Placement of a High Density Polyethylene Geomembrane (HDPE), a waterproof
geomembrane on the supported GCL.
• Placement of geotextile material for filtration, which is surrounding crushed materials and the perforated pipes as a capsulated method.
The leachate drainage system, including:
• Drainage trenches were made in some areas at the bottom of the cell where filtration geotextile was installed together with HDPE perforated pipes and filled with 20-40 mm gravels. The trenches were then covered with filtration geotextile.
• The space between the trenches was backfilled with soil.
Installation of leachate control wells, which were initially constructed to observe the leachate hydraulic level of the cell. Currently, these wells have been destroyed and the leachate level can not be observed.
E1895 vol. 3 rev.

ECO Consult
Municipal SWM & Carbon Finance
66
The design capacity of Cell 1 was originally nearly 2 million tons for an area of 132,000 m2. However, a total of 3.57 million tons had been landfilled by December 2007 and therefore the cell’s capacity has extensively been exceeded resulting in the accumulation of waste out of Cell 1, among other problems.
Figure 5.2: Existing Conditions of Cell 1 where SW is accumulating Out of the cell limits
Cell 2 is operational since the end of April 2008. Until then, SW has continuesly being disposed at Cell 1. The landfill receives approximately 2,500 tons of MSW/day, which are disposed on top of the operating cell and dozers push it to the northern side. Temporary cover is made at the moment on the southern side of the cell with approximately 0.5 m chalk marl layer (taken from the excavation of Cell 2) which has very low permeability. This will probably provide adequate permeability to allow rainfall infiltration in the landfill, so that the moisture content necessary for microbial activity is maintained. The leachate collection system installed on the bottom of Cell 1 has been clogged with SW, which has resulted in leachate flowing out of the cell, especially in the western border. GAM has tried to build a trench to contain this flow but during this operation, the lining was heavily damaged by the heavy machinery used. Some repairs were made in 2006-2007 by a local installer but with only 1 HDPE mm geomembrane and poor welding. In the beginning of 2007, 4 emergency storage ponds were constructed to deal with leachate flowing from Cell 1, especially on the western border. For months, only about 60 to 70% of the storage capacity was used, but since December 2007, they are used to their maximum capacity. These ponds have not been constructed in a proper way: collapsing in some parts, one 1 mm HDPE geomembrane with no GCL or geotextile protection.
E1895 vol. 3 rev.

ECO Consult
Municipal SWM & Carbon Finance
67
Figure 5.3: Leachate Emergency Ponds at Ghabawi Landfill. Although the leachate spilled in the eastern and western sides has been pumped and disposed in the ponds, the level of leachate hydraulic level in the bottom of the cell has been calculated as over 10 m.
5.1.2 Conditions of Cell 2 As already mentioned, Cell 2, with a total surface area of approximately 132,000 m2, has started being operational since the end of April 2008. The final design specifications for Cell 2, very similar to those of Cell 1, are: General excavation to reach the required levels: A general excavation (levelling) to reach the required levels in accordance to the drawing of cell No.2 ± 30cm was carried out for this cell. Installation of geosynthetic materials for environmental protection, including the following materials:
• Placement and support of GCL. • Placement of a HDPE on the supported GCL.
• Placement of geotextile material for filtration, which is surrounding crushed materials
and the perforated pipes as a capsulated method. The leachate drainage system: The network has been installed after the GCL and the geomembrane have been placed and it includes:
• Leachate drainage: the leachate is drained through perforated HDPE pipes placed within a distance of approximately 60 m. It consists of a slotted plastic drainage pipe placed and covered with gravel (in a 0.4 m deep and 1.0 m broad gravel ditch). Between the drainage pipes, soil is placed similar to that in Cell 1, which unfortunately has not worked well.
E1895 vol. 3 rev.

ECO Consult
Municipal SWM & Carbon Finance
68
Figure 5.4: Installation of Geo–synthetic Materials for Environmental Protection
The drainage pipes are connected to a reinforced concrete observation well at the northern end of Cell 2, and from there the leachate will be led by a pipeline to a pumping well placed in the northwest corner of Cell 2, from where it will be pumped to the evaporation ponds and the Leachate Treatment Plant still under construction.
Figure 5.5: General Excavation and Installation of Drainage Pipes in Cell 2
The drainage system is in the south of the cell and it is connected to a 300 mm plastic pipe, which has been placed directly on the membrane at the slope of the landfill side. It is expected that the pipe will destroy the membrane when the waste is disposed of on top of it as a consequence of the weight of SW. Currently at Cell 2, a temporary road has been made of waste and soil in the bottom of the cell. It is built up to a height of 3 m, which, according to the landfill manager, should have been only 1 m. This road will be used as an access road to the eastern side of the landfill and as a temporary measure implemented to protect the drainage system.
5.1.3 Leachate Treatment Plant Three (3) evaporation ponds have been constructed on the west side of Cell 1 where 2,000—3,000 m3 leachate/day, seven days a week, is being pumped and transported by trucks from the emergency ponds to the evaporation ponds. These ponds are part of the proposed Leachate
E1895 vol. 3 rev.

ECO Consult
Municipal SWM & Carbon Finance
69
Treatment Plant to be constructed by GAM 5 years ago according to CM Feasibility Study from 2002.
Figure 5.6: Evaporation Pond constructed as part of the Leachate Treatment Plant
The planned purpose of the 3 ponds, specified in the original design as part of 2 identical lines of treatment, is: Storage, aeration and evaporation: Storage, aeration and evaporation should be operated in the aeration pond. The design’s retention time in the aeration pond is 3 weeks. The total volume of this pond allows the storage and the aeration of 2 weeks of maximum leachate generation. The variation of the water level in the pond also allows buffer for one week of maximum leachate generation. The purposes of the aeration process are the stirring of the leachate to avoid deposits and the conservation of the freshness of the leachate to avoid evolution to an anaerobic condition. Settling: Settling should be operated in a settling pond divided into 2 sub-ponds which are used alternatively. When the quantity of sludge deposited in one of the operating sub-pond becomes critical, operation is stopped and the sludge is dewatered by natural evaporation. The retention period in the settling pond is about 3 days. Filtration: Filtration, using sand bed, should be operated in a filtration pond divided into 2 sub-ponds which are used alternatively. When the permeability of sand bed in a sub-pond becomes critical, the bed is cleaned or removed and replaced.
E1895 vol. 3 rev.
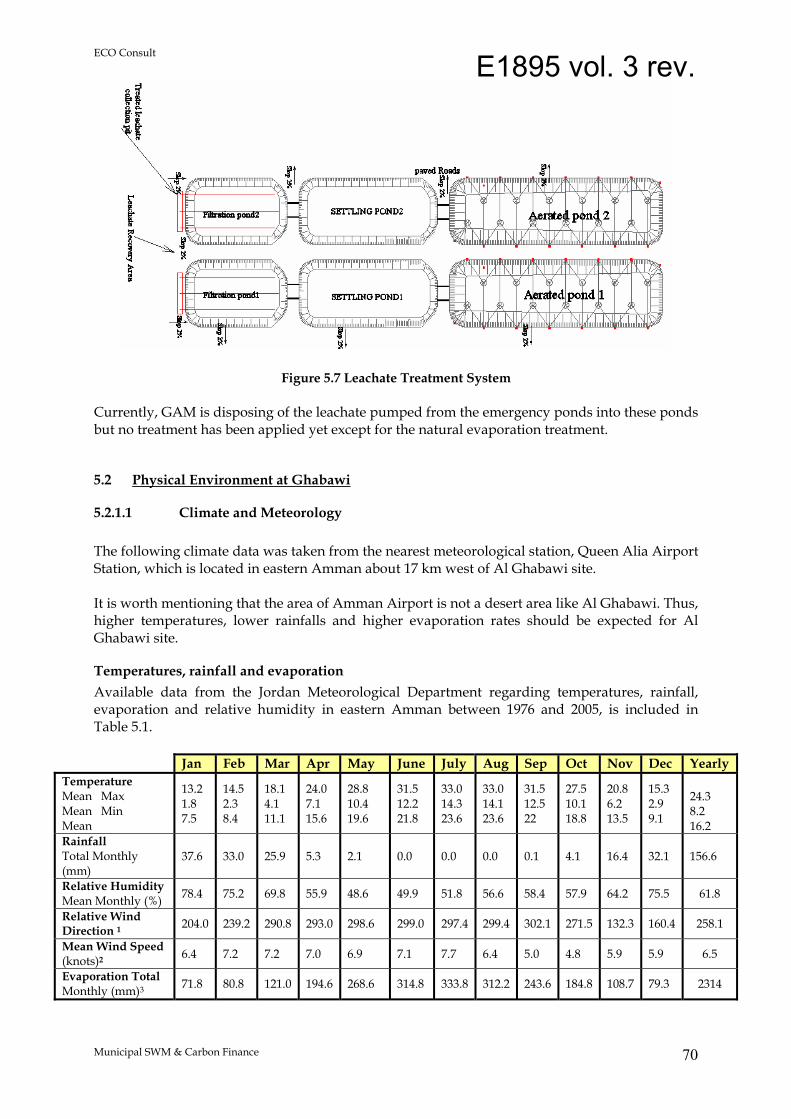
ECO Consult
Municipal SWM & Carbon Finance
70
Figure 5.7 Leachate Treatment System
Currently, GAM is disposing of the leachate pumped from the emergency ponds into these ponds but no treatment has been applied yet except for the natural evaporation treatment.
5.2 Physical Environment at Ghabawi
5.2.1.1 Climate and Meteorology The following climate data was taken from the nearest meteorological station, Queen Alia Airport Station, which is located in eastern Amman about 17 km west of Al Ghabawi site. It is worth mentioning that the area of Amman Airport is not a desert area like Al Ghabawi. Thus, higher temperatures, lower rainfalls and higher evaporation rates should be expected for Al Ghabawi site.
Temperatures, rainfall and evaporation Available data from the Jordan Meteorological Department regarding temperatures, rainfall, evaporation and relative humidity in eastern Amman between 1976 and 2005, is included in Table 5.1.
Jan Feb Mar Apr May June July Aug Sep Oct Nov Dec Yearly Temperature Mean Max Mean Min Mean
13.2 1.8 7.5
14.5 2.3 8.4
18.1 4.1 11.1
24.0 7.1 15.6
28.8 10.4 19.6
31.5 12.2 21.8
33.0 14.3 23.6
33.0 14.1 23.6
31.5 12.5 22
27.5 10.1 18.8
20.8 6.2 13.5
15.3 2.9 9.1
24.3 8.2 16.2
Rainfall Total Monthly (mm)
37.6 33.0 25.9 5.3 2.1 0.0 0.0 0.0 0.1 4.1 16.4 32.1 156.6
Relative Humidity Mean Monthly (%) 78.4 75.2 69.8 55.9 48.6 49.9 51.8 56.6 58.4 57.9 64.2 75.5 61.8
Relative Wind Direction 1 204.0 239.2 290.8 293.0 298.6 299.0 297.4 299.4 302.1 271.5 132.3 160.4 258.1
Mean Wind Speed (knots)2 6.4 7.2 7.2 7.0 6.9 7.1 7.7 6.4 5.0 4.8 5.9 5.9 6.5
Evaporation Total Monthly (mm)3 71.8 80.8 121.0 194.6 268.6 314.8 333.8 312.2 243.6 184.8 108.7 79.3 2314
E1895 vol. 3 rev.

ECO Consult
Municipal SWM & Carbon Finance
71
Table 5.1 Mean Temperatures, Precipitation, Evaporation and Humidity data from 1976-2005 Source: Jordan Meteorological Department
Note: 1. Data from 1992 to 2005 2. Data from 1977 to 2005 3. Data from 1980 to 1999 (1 knot is approximately 1.85 km/hr) The coldest months are January and February, with temperature means of 7.5°C and 8.4°C. They are also the months with the greatest mean rainfall, 37.6 mm and 33.0 mm and mean rainfall, respectively. The warmer months are July and August, with temperature means near 23°C. These two months also have the lowest rainfall (almost no rain) and have the highest evaporation rates of 333.8mm and 312.2 mm respectively. It thus follows that due to the high summer temperatures, high evaporation rates also occur during this season. During these summer months evaporation rates get higher than the rainfall.
Wind The average wind speed in the last 20 years was 5.4 knot (9.9 km/hr, 2.75 m/s). The average prevailing wind direction (from true north degree) between and 1980 and 1999 was 253 degrees. This helps the transfer of possible gases and odours away from the population gathering around the western villages (Manakher, Madunah, Al Baida) and south-west of the site (Magaier Mhana). The nearest population to the east is Azraq, located 60 km east from the site. Therefore, there should be very few odour impacts from the site on the nearby population.
5.2.1.2 Topography and Geology Al Ghabawi site lies over a semi-flat area with general an average slope of 1.4 % slightly from the south-east towards the north-west. Data obtained from a survey (Arab Center for Engineering Studies (ACES), July 1999) based on the deduced resistivity contour maps and profiles, indicated that the landfill site is characterized by a homogenous horizontal layering. The site lies in a chalk marl unit called Muwaqqar formation consisting of soft, thick-bedded chalky marl, marl and chalky limestone with bedded and nodules of microcrystalline limestone and chert. Some thin lenses (2-5 cm thick) of coarse grain granular phosphate are occasionally present. From a hydrogeological point of view, the Muwaqqar chalk marl formation is considered as aquaclude with low permeability (10-2 to 10-4 mm/s) to very low permeability (10-4 to 10-6 mm/s). Some layers in the boreholes have permeability between 10-6 and 10-7 mm/s, which means impervious. The difference in permeability values is according to the difference of ground materials and occurrence of some chert lenses through MCM stratum. It is also caused by the presence of fine and very fine materials mixed sometimes with sand or silty sand. Regarding the seismicity of the landfill site, and according to the Ministry of Public Work and Housing in Jordan’s seismic map, the Ghabawi Landfill and surrounding area lies over region B which has 0-5 factor of intensity and has an earthquake intensity of 6-8 on Mercalli scale. This region is considered as the second active seismological zone of Jordan. Therefore, in case of
E1895 vol. 3 rev.

ECO Consult
Municipal SWM & Carbon Finance
72
earthquakes, major hazards shall be expected in region B. However, according to historical records, there were no earthquakes over the site and surrounding area. The Jordanian researcher Dr Malkawi, who is a specialist in seismology, developed maps dealing with the probability of exceedance for many return periods (time which is needed to accumulate enough energy for a new earthquake to take place). Based on his research, for return period of 50, 100 and 200 years with probability of 90% of non-exceedance (10% of exceedance), the seismicity factor will get higher with the return period in some areas of Jordan. The landfill site has a “moderate risk” factor for return periods of 50 and 100 years, and reaches the “strong risk” factor only for a 200 years return period.
5.2.1.3 Surface Water and Drainage Surface Water The only natural source of surface water on the project area is rainfall with an annual average of 157 mm. Due to the absence of dams, reservoirs and other activities within the landfill proximity, the water is not collect and/or used. Furthermore, a large portion of the surface water is expected to evaporate since evaporation rate is very high in the area coupled with low permeable top-soil. The destination of surface water over the site is as sub-catchments for various wadis in the area. The site lies at the most southern part of a large geomorphologic unit consisting of plateau draining northward via a net of sub-parallel wadis towards Zarqa river, i.e. a northward oriented watershed that leads to Zarqa river about 15 km away. The gentle slope (about 15%) of the site towards the north and the presence of many shallow and small wadis crossing the area acting as recharge tributaries (sub catchments) for major wadis, influence surface water to travel towards the north and into these wadis. In particular, the drainage system over the site follows two directions:
• To the north - northwest towards Zarqa river: through Wadi-Janna’a in the north and Wadi Al-Hajar in the northwest sides of the site.
• And to the northeast towards Zarqa river through Wadi Al Ghabawi which is laying to
the east and turns to the north towards Zarqa river. All the channels over the site are sub-parallel channels forming part of an upstream area for the Zarqa river in a dendritic form. The first direction followed by surface water is running out of the site through shallow channels as follows:
• Channels oriented to the north are running to Wadi Janna’a which is located about 6 km away from the site.
• Channels oriented to the northwest are running to Wadi Al Hajar which is located about 5 km away from the site.
These two wadis (Wadi Janna’a and Wadi Al Hajar) are considered as part of the Zarqa river catchment area from the Ruseifeh side. The second direction of drainage is represented by Wadi Al Ghabawi, which crosses the site at its southeastern border for a few meters and then runs out of the site towards the northeast direction to reach Wadi Al Duleih, which is located about 25 km from the site.
E1895 vol. 3 rev.

ECO Consult
Municipal SWM & Carbon Finance
73
Since there are no historic records of any floods in the project area, low amounts of rainfall, high evaporation rates, rough terrain made of the excess SW piles at Cell 2, and the isolated leachate ponds, it is anticipated that there are no significant risks of surface water pollution. Drainage Significant amounts of leachate have been generated in Cell 1 as a consequence of rainfall infiltration through the high amounts of waste disposed and liquid waste within the cell. At present, there is an apparent clogging of the leachate collection system in this cell. Consequently, leachate is currently discharged out from various locations around the cell, especially in the western border, at an average amount of 340 m3/day. In some areas, the leachate is uncontrolled to the point where ponds of 2 m depth have formed on the surface.
Figure 5.8: Leachate Accumulated in the Western Side of Cell 1
Samples were taken from the leachate ponds at the west border of Cell 1 and taken to the laboratory to be analyzed by the Royal Science Society (RSS) and the Water Authority of Jordan (WAJ). See Annexes Section for full report. Figure 5.17 shows the sampling locations:
E1895 vol. 3 rev.

ECO Consult
Municipal SWM & Carbon Finance
74
Figure 5.9: Leachate & Groundwater Sampling Locations at the landfill site
The characteristics of the leachate are included in Table 5.2.
Royal Science Society (RSS) Water Authority of Jordan (WAJ
Constituent Range (mg/L
except as indicated) (1)
Combined leachate sample from 4
emergency ponds
Leachate sample
from unlined
pond South of
Cell 1
Leachate sample
from unlined
pond West of Cell 1
Combined leachate sample from 4
emergency ponds
Leachate sample
from unlined
pond South of
Cell 1
Leachate sample
from unlined
pond West of Cell 1
Aluminum ND - 85 0.549 0.915 0.559 BOD ND – 195,000 35,000 53,250 31,938 7,488 4,341 4,736 COD 6.6 – 99,000 67,004 101,286 68,092 84,959 >233,663 83,370 Calcium 3.0 – 2,500 3,559 5,629 2,720 Chloride 2.0 – 11,375 7,993 8,604 8,355 13,992 8,320 9,783 Kjeldahl nitrogen 2.0 – 3,320 4,109 3,899 4,456 Magnesium 4 – 780 739 976 684 Molybdenum 0.01 – 1.43 <0.08 <0.008 <0.08 Nitrogen - Total 2,438 2,458 2,531 pH (units ) 3.7 – 8.9 7.35 6.21 7.58 7.76 7.54 7.63 Phosphorous ND – 234 24.0 31.5 32.0 13.23 9.74 5.04 Sodium 12 – 6,010 5,795 5810 5,660 Total Dissolved Solids 584 – 55,000 62,960 59,671 43,355 52,110 37,795 Total Suspended Solids 2 – 140,900 3,385 2,873 4,080 1,999 3,090 4,125
Total Coliform MPN/100ml 2,300
Table 5.2: Al-Ghabawi Leachate Characteristics (only tested quality parameters are reported). (1) Source: Bagchi (1994). ND: Not detectable.
E1895 vol. 3 rev.

ECO Consult
Municipal SWM & Carbon Finance
75
Note: Due to the clogged conditions of the leachate wells, the samples could not be taken from the wells. As shown in Table 5.2, the range is based on reported data published in the Integrated Waste Management Manual. However, it is possible to exceed these levels. This is illustrated for the leachate constituents such as Calcium, Chloride, COD, Magnesium and TDS. In order to reduce leachate pollution risks, leachate is currently being pumped into lined aeration ponds to the west of Cell 1 by utilizing the treatment plant pumping system as opposed to the previous method of pumping leachate from the ground and disposing it in emergency ponds. A polluting risk to the soil and sub-soil surrounding Cell 1 still exists due to the continuous leachate generation and accumulation. GAM has tried to build a trench to contain this flow along the western border but during this operation, the heavy machinery used has heavily damaged the lining. Some repairs have been made in 2006-2007 by a local installer but with only 1 high density polyethylene (HDPE) mm geomembrane and poor welding. The emergency ponds are compromised of 4 lined leachate storage ponds (excavated by GAM) with a 1mm HDPE geomembrane.
5.2.1.4 Groundwater
• Aquifer features The water saturation zone within B2/A7 aquifer system is one of the main water aquifers in Jordan and it is the aquifer system found in the landfill site and surrounding area. It has an average thickness of 108 m and a depth of water ranging from 182-248 m below ground surface. The overall groundwater flow direction is east and southeast with a hydraulic gradient of 0.007. This aquifer is bound from the top by the Muwaqqar –chalk marl (B3) aquitard with a thickness ranging from 80-132 m. Shallow top soil layer that ranges in thickness from 0.5 to 1 m also exists. The Muwaqqar –chalk marl formation consists of soft, thick bedded chalky marl, marl and chalky limestone with bedded and nodules of microcrystalline limestone and chert. Some thin lenses (2-5 cm thick) of coarse grain granular phosphate are occasionally present. The hydraulic conductivity of this formation ranges from 10-3 to 10-7 mm/s, low to very low permeability. This renders the Muwaqqar –chalk marl formation as aquiclude. The specific gravity ranges from 2.5 to 2.857 with an average of 2.67. The bulk density was estimated at 2.247 gr. /cm3. The moisture content, on a mass basis, ranges from 0.3 to 11.1 % with an average of 4.23 %. The cation exchange capacity ranges from 4.09 to 12.94 meq/100g with an average of 10.2 meq/100 gr. No major faults or cracks have been identified in the project area and a homogeneous horizontal layering exist up to a depth of 6 meters as deduced from the resistivity contour maps and the cross sections (profiles) prepared by the ACEA. From the information included above regarding the characteristics of the area, it appears that the risk of groundwater contamination is not high.
• Catchments According to the Ministry of Water, there is no piezometer in this area. Three (3) private wells are located in a 3 km area around the site. In addition, 2 private wells and 4 public wells are located in Madunah, 3 and 10 km far from the site. Moreover, 3 out of 4 public wells were drilled only for
E1895 vol. 3 rev.

ECO Consult
Municipal SWM & Carbon Finance
76
exploration and are closed now. All these wells are more than 2.5 km far from the site. The minimum distance required by the World Health Organization is 1 km.
Figure 5.10: Existing well at the Landfill Site. In addition, there is a well in the landfill site in which the water level is about 250 m. The water from this well has not been used for drinking purposes because of the high sulfur content and its uses had been limited to irrigation, cleaning and non potable purposes. Recently, on January 8th, 2008 a new water sample from this well was tested by the WAJ laboratories. More details of the groundwater characteristics obtained from the well are shown in the following table:
Constituent of Al-
Ghabawi Well
WA Laboratories Value (mg/L except as
indicated)
DJS 286 (mg/L except as indicated)
Bicarbonate 501.42 Within TDS
Calcium 130.26 Within TH /TDS
Chloride 126.38 500
Hardness 579 as CaCO3 about 191.91 mg/l 500
Magnesium 61.65 Within TH /TDS
Nitrate 2.37 50 pH (units ) 7.41 6.5 – 8.5
Potassium 5.08 Within TDS Sodium 80.27 400
Sulfate 183.36 500
Total Dissolved Solids 1243 πs/cm (about 833 mg/L)
1000
Total Coliform MPN/100ml Less than 2 Less than 1.1
Table 5.3: Characteristics of the Groundwater from the well at Al-Ghabawi Landfill contrasted to the Jordanian Standard (DJS 286: 2007), only tested parameters are reported. Note: Hardness in mg/L estimated by summing the concentrations of divalent cations. TDS converted from µs/cm to mg/l by multiplying by 0.67
E1895 vol. 3 rev.

ECO Consult
Municipal SWM & Carbon Finance
77
Many parameter that are included in the table above have not explicit standards under Jordanian Regulations. However, they are used for the calculation of the TDS and/or TH (total hardness), thus, whenever standards are not defined, TDS or TH were used as the reference value for compliance. As indicated in the table above, for all measured parameters, there is no violation in any of the measurements with the exception of Total Coliforms which is a little higher in the sample than the Jordanian Standard. What is more, the results indicated that the sulfate concentration conforms to the Jordanian Drinking Water Standard (DJS 286:2007). Even though, sulfate level concentrations are within the limits for potable water, other water parameters must be tested.
5.2.1.5 Ambient Air Quality Al Ghabawi Landfill currently has no historical air data or an air-pollution monitoring system in place mainly due to the area previously being a military land and used for army purposes. At present, the main source of air pollution and odour is the LFG generated from the waste disposal in Cell 1. There are several gases emitted to the atmosphere such as CH4, CO2 and volatile organic compounds (VOCs). In addition, hydrogen sulphide (H2S) is also emitted, which is the major constituent responsible for the rotten odour in the area. The following figure 5.11 shows the air quality sampling locations undertaken at the landfill site on February 6-7, 2008 that were analyzed at JUST Air Quality Calibration Laboratory (See Full Report in the Annexes Section).
Figure 5.11: Ambient Air Quality Sampling Locations at the landfill site
E1895 vol. 3 rev.

ECO Consult
Municipal SWM & Carbon Finance
78
Parameters were measured during variable sampling periods. For each sampling period, an average of the measured concentrations obtained was calculated. However, there are no set standards for the gases emitted from the landfill in Jordan and therefore, it can not be concluded that the values obtained are not exceeding any limits.
Pollutant Concentration (ppm) at key monitored sites Al Ghabawi
Landfill sampled Gas
Sampling day.
Sampling period.
Cell 1 west (1 meter from
leachate collection)
East of leachate- treatment ponds
(at the edge of the pond)
Cell 1 Top of dumping location
Methane (CH4)
Day 1 9:30-11:30 49.8 24.2 12:30-14:30 16.1 3:00-5:00 55.0 30.8 6:30-8:30 11.9 Day 2 9:00-11:00 5.7 12:00-14:0 91.2 23.3 3:00-5:00 8.3 6:30-8:30 92.8 20.9 Mean Concentration 72.2 24.4 9.8 Carbon dioxide (CO2) Day 1 9:30-11:30 180 224.7 12:30-14:30 131.2 3:00-5:00 176 221.3 6:30-8:30 126.8 Day 2 9:00-11:00 181.0 12:00-14:0 182.6 233.0 3:00-5:00 189.0 6:30-8:30 189.4 243.0 Mean Concentration 182.0 230.5 157.0 Ammonia (NH3) Day 1 9:30-11:30 5.2 0.7 12:30-14:30 0.40 3:00-5:00 6.0 0.7 6:30-8:30 0.42 Day 2 9:00-11:00 0.44 12:00-14:0 7.6 1.1 3:00-5:00 0.42 6:30-8:30 7.2 1.3 Mean Concentration 6.5 0.95 0.42 Hydrogen sulfide (H2S) Day 1 9:30-11:30 4.7 2.1 12:30-14:30 0.2 3:00-5:00 4.3 1.9 6:30-8:30 0.2 Day 2 9:00-11:00 0.10 12:00-14:0 4.6 2.7 3:00-5:00 0.10 9:30-11:30 4.8 2.5 Mean Concentration 4.6 2.3 0.15 Volatile organic compounds (VOCs) Day 1 9:30-11:30 12.0 11.9 12:30-14:30 3.6 3:00-5:00 11.4 12.5 6:30-8:30 3,8 Day 2 9:00-11:00 4.0 12:00-14:0 13.0 8.9 3:00-5:00 4.4
E1895 vol. 3 rev.

ECO Consult
Municipal SWM & Carbon Finance
79
9:30-11:30 13.4 9.1 Mean Concentration 12.5 10.6 4.0 Table 5.4: Average concentrations of Al Ghabawi Landfill gases in parts per million by volume (ppmv) in the three monitored sites. Notes:
1) There are no set standards for the gases emitted from the landfill in Jordan. 2) The concentrations reported in the results are far less than the landfill expected ranges of concentration of these
gases because the ranges of concentrations are for gases emitted from landfills completely covered by soil and for soil sampling.
3) Al Ghabawi Cell 1 is not fully covered by compacted soil, therefore gases are emitted from every where and the dilution is great especially at the prevailing wind speed at the time surface sampling.
4) Gases are not escaping from cracks in the land fill; the landfill is an open dumping place where most of the waste is not fully covered. The emitted gases are released in the open air.
5) Since near surface sampling method for landfill emitted gases was used, high dilution of emitted gases is expected, leading to concentration much lower than expected especially for CH4.
6) Gas monitoring will be better in Cell 2 if the waste disposal is managed in a sanitary way. Significant amounts of dust are also present in the area as a consequence of truck traffic during unloading operations. In addition, there are quarries located 10 km west from the site which also produce high amounts of dust. During the sampling period, the wind direction and speed measured in each of the sampling locations was:
Day & Date Time Location W.S. W.D. 09:00 Cell 1 west (1 meter from leachate collection) 4.3 South Eastern
12:00 East of leachate- treatment ponds (at the edge of the pond) 3.8 South Western
Wednesday
6/2/2008 14:00 Cell 1 Top of dumping location 7.7 South western 09:00 AL Ghabawi Landfill Administration building 5.2 South Eastern 12:00 Cell 2 9.7 South western
Thursday
7/2/2008 15:00 Cell 1 Top of dumping location 8.3 South western Table 5.5: Wind Speed and Direction Measured in the Period of February 6-7th, 2008
As mentioned before, the average prevailing wind is from west-southwest which helps the transfer of air pollution and odours away from the population gathering west (Manakher, Madunah, Al Baida) and south-west of the site (Magaier Mhana). Noise: The nearest infrastructures are a farm located 2.5 km south of the site, two main roads reaching the site and a road that leads to the site and the farm (around 2 km south of the site). The farm causes no noise and this last road is used only by a few cars and lorries which go to the farm. However, the access roads to the landfill cause significant noise levels as a consequence of the traffic of big lorries and compactors to and from the landfill.
5.2.1.6 Landscape The surrounding area of the site is quite flat to the north and west. From the site, some hills can be seen quite near in the east and far in the south. As mentioned before, the topography of the site itself is almost flat with a maximum level variation of 20-25 meters, 785-790 to 810-815 meters
E1895 vol. 3 rev.

ECO Consult
Municipal SWM & Carbon Finance
80
above sea level. From the road and the farm in the south, only a small part of the site can be seen. Indeed, a higher area, more than 820 meters above sea level, hides the site. The site can be seen only from the eastern surrounding hills (Al Ghabawi and Al Adam) which are Army land, and from a few kilometers north and west. It is not seen from any house or farm. However, according to the final design of the landfill which includes the Leachate Treatment Plant and the LFG to Energy Facility, it is possible that some parts of these facilities might then be seen from the farm and other places. This will be studied in the ESIA. The site is surrounded by a fence.
5.2.1.7 Flora and Fauna The proposed project area is represented in one major Ecosystem, Scrap and Highland Ecosystem. This ecosystem consists of escarpments and mountains, hills and undulating plateaus, which extend mainly from Irbid in the north to Ras Al Naqab in the south, and, from Rift Valley region in the west to the Badia in the east. The mountains in the south of this zone are higher on average, and some range between 1200 m and 1600 m high. Mediterranean woodland of pine and oak, with juniper and cypress is believed to have originally covered large tracts of the Jordanian highlands, but human and climatic factors resulted in high deforestation and replacement of natural vegetation by secondary species. The largest remaining areas of natural woodland occur in the highlands between Amman and North of Jordan, and are dominated by Pinus halepensis above 700 m, whilst mixed evergreen/deciduous oak woodland of Quercus calliprinos and Q. ithaburensis dominate at lower elevations where the original pine-dominated woodland has been degraded. Cultivation of rain fed wheat widespread on the plateau between Madaba and Irbid, and olive groves cover a large part of the northwestern mountains above 700 m. More than 80% of Jordan’s cities and villages occur within this zone. Flora: The project area is characterized by two vegetation types:
o Steppe Vegetation – commonly found in area.
o Mediterranean Non-Forest Vegetation - found in the area's shallow depressions. The site has a very low diversity of plant species of which only two naturally occurring are found that represent the two vegetation types. These two plant species are not of conservation importance since they are common at their vegetation type.
• Recorded Plant Species:
Rhamnus palaestinus: common but decreasing population size due to use as firewood by nomad communities. Anabasis syriaca: common and do not have any conservation value. Fauna: The proposed site of the project is part of a transitional area between two zoogeographic zones; Mediterranean and Saharo – Sindian zones.
E1895 vol. 3 rev.

ECO Consult
Municipal SWM & Carbon Finance
81
The project area is not located at a major bird migration routes, however it is within the proximity of the raptors flyway to the west and bird migratory route to the east. Due to the deterioration and the absence of the natural vegetation at the site, the faunal diversity recorded at the site is very minimal. The recorded fauna species and their conservation are the following:
• Reptiles:
Acanthodactylus boskianus: common at various habitats in Jordan in spite that this species prefer natural vegetation cover but it also found in high numbers at agriculture lands.
• Mammals:
Lepus capensis; Cape Hare: conservation status of this species in Jordan is not well defined due to the insufficient data about this species. However, it is more common in the eastern parts of Jordan where the open desert is considered a very suitable habitat for the Cape Hare. Rattus rattus; Common Rat: common in and near human settlements and its distribution is connected to the human activities especially agriculture where in might be considered as a pest in the cases of out spread. Vulpes vulpes; Red Fox: common large mammals in Jordan, found in most Jordanian habitats and ecosystems.
• Birds:
Streptopelia senegalensis; Laughing Dove: common bird species found at various habitats. It has no important conservation value. Galerida cristata; Crested Lark: common bird species in the northern half of Jordan. It is resident at almost all of the habitats in the country and known to follow the cultivated lands in its distribution. It has no important conservative value. Pycnonotus xanthopygos; Yellow-vented Bulbul: very common resident bird species found mainly at the semi urban habitats, and Those contain cultivated lands. Oenanthe deserti; Desert Wheatear: widespread desert bird species found at the transitional zones between the desert habitats and others. Passer domesticus; House Sparrow: common resident bird species linked to human activity and settlements.
5.2.2 Socio-Economic Environment at Ghabawi
5.2.2.1 Surrounding Population The population surrounding the site is concentrated into:
• 2 major cities, Amman and Zarqa; • 4 little villages or groups of isolated houses located at a distance inferior to 10 km; • 2 farms, as the closest houses.
The following Table 5.6 includes a summary of the surrounding population:
E1895 vol. 3 rev.

ECO Consult
Municipal SWM & Carbon Finance
82
Distance from the
site Type of
agglomeration Population in
2000 Population
expected in 2020 MAJOR CITIES (> 10,000 inhab.) Amman Zarqa
23 km west of the site 16 km northwest of site
City City
1,745,230 inhab. 431,280 inhab.
2,810,000 inhab. 1,190,000 inhab.
NEAREST VILLAGES (<10 km) Madunah Magaier Mhana Al Manakher Al Baida
8 km west of the site 10 km southwest of site 10 km west of the site 10 km west of the site
Isolated houses Village Village Isolated houses
300 1363 343 559
526 2,381 602 981
CLOSEST NEIGHBOURHOOD Big farm Some smaller farm
2.5 km south of the site 5 km southwest of site
Dairy farming Cultures
Sahab 17 km southwest of site Village 39,926 inhab. 70,034 inhab.
Zamlet El Alia 11 km southwest of site Village 27 inhab. 47 inhab.
Kashafiyat El Dabaiba 12.5 km West of the site Village 2,883 inhab. 5,229 inhab.
Faycalieh 13 km southwest Village 3,898 inhab. 6,837 inhab.
Nguera 14 km southwest of site Village 1,261 inhab. 2,212 inhab.
Menshiat Muwaqqar 14 km southwest of site Village 1,358 inhab. 2,383 inhab.
Muwaqqar 14.5 km southwest Village 2,891 inhab. 5,071 inhab.
Al Abdaliya 15 km west of the site Village 3,798 inhab. 6,663 inhab.
Table: 5.6: Landfill Surrounding Population The housing is supposed to reach the surrounding area of the site in 2030 (according to GAM planners). The growth of the population is suitable with the operation of the landfill which is planned to stop in 2024.
5.2.2.2 Waste Pickers At present there are no scavengers working regularly at the El Ghabawi landfill which is fenced. Occasionally few waste pickers (5-10 people) cross the fence at night in order to collect recyclable materials. Prevention has been taken to avoid the entrance of these individuals to minimize potential impacts they might be exposed to. These waste pickers are also sorting waste during waste collection near bins and existing transfer stations and their revenues are not depending on the waste collected at the El Ghabawi landfill. As part of the technical assistance support for strategic planning to GAM, the project will finance a socio-economic survey to obtain more accurate information on the informal sector including the waste pickers at the source.
5.2.2.3 Surrounding infrastructures
Roads and Traffic Two main roads reach the site, a 2-double lane road from Amman Ring Road and a 2 lane road from Zarqa. These roads were built by GAM to adapt the traffic of big lorries and compactors to and from the landfill.
E1895 vol. 3 rev.

ECO Consult
Municipal SWM & Carbon Finance
83
In addition, the following is a summary of the nearest roads:
• Main roads: The nearest main roads are the following:
Main roads Km to the site (aerial distance)
Average traffic in 1996
(vehicles/day)
Expected traffic in 2020
(vehicles/day)
Type of road
Ring Road 16.5 km west 14,072 35 000-50,000 International
Mwaqqar-Azraq 13 km south 1,000-3,000 0-10,000 International
Zarqa Highway 15 km north west >15,000 >50,000 International
Zarqa-Khaou 15 km north 3,000-8,000 10,000-20,000 International
Zarqa-Azraq 18 km north 1,000-3,000 20,000-35,000 International
Table: 5.7: Nearest Main Roads to Ghabawi Landfill As indicated in the table above, the nearest main roads, which could be used by the waste hauling vehicles, are far from the site at about 15 km. Therefore, a site access road should be built.
• Local roads: One tarried road joins the farm near the site. The distance between the site and this road is 2 km. The traffic on this road is scarce: it is only used to access the farm.
Nearest infrastructures: The distance to the nearest infrastructures is summarized in the following 5.8: Type of infrastructure Km from the site Direction from the site Name
Mosque 6 South West Maisser Hadid
Commercial area 23 West Amman
Clinic 10 West
Manakher, Magaier Mhana
Cemetery 10 West
Manakher, Magaier Mhana
Airport 17 West-North-West Amman Civil Airport
Historic site
16 18 20
North West South East North East
Ain Ghazal (prehistoric) Qasr Mushash (roman) Qasr Hammamas Sarh
Agricultural area
2.5 4
South south-west
Cow farming Culture
Green area 4 south-west Culture
Mining resources 10 West Quarry
Forest 14 West
Nature reserve 40 East Shaumari Wildlife reserve
Potential drinking catchment
9 17 13
West-Southwest Southwest North-Northwest
Public catchment 11 West-Southwest
Private well
2.5 2.5 2.5
South South West South
Dam reservoir NO NO NO
Table 5.8: Nearest Infrastructures to Ghabawi Landfill.
E1895 vol. 3 rev.

ECO Consult
Municipal SWM & Carbon Finance
84
The nearest infrastructures to the landfill (an agricultural area, a potential drinking catchment and 3 private wells) are located at about 2.5 km at the South of the site.
Supply infrastructure: The nearest connection to electricity, telephone and water networks is in Al Manakher village at about 10 km. For the operation of the landfill, it is possible to use the water (as raw water, not drinking water) from the well on the site with a yield of 40 m3/hour.
5.2.2.4 Impacts from the GAM Master Plan GAM has instituted a Master Plan to control growth over the next 20 years. Key components of the Master Plan are the intensification and densification of the urban areas. This will see the majority of the open and unused areas in the city becoming developed (intensification). In addition, 4 zones for high rise buildings have been designated. These will allow for high density usages (densification). One of the overall effects will be an increase in the usage per km2 within the city. One result will be an increase in the tones/km2 of SW which need to be collected, as well as a significantly increasing population, leading to increased SWM quantities. This will affect the collection planning and scheduling, transportation and haulage, and also the management of the landfill site. It may also require the addition of more transfer stations, as the city grows. The above information describes the current conditions at the Ghabawi Landfil Site. However, as a result of population and the extension and intensification of residential areas throughout the city of Amman, the quantities of SW will increase. At present, the only landfill for non-hazardous waste in Amman in Ghabawi and therefore, the higher amounts of SW produced as a consequence of this growth will be disposed at this landfill in the coming years. However, this has been allowed for in the design of Ghabawi, since the total capacity of this landfill includes a total of 6 more cells in addition to the first 3 cells included in this project scope.
E1895 vol. 3 rev.

ECO Consult
Municipal SWM & Carbon Finance
85
6. EXISTING AND POTENTIAL ENVIRONMENTAL & SOCIAL IMPACTS OF THE PROJECT
According to the WB projects classification, this project falls under Category A, which means that it is likely to have significant adverse environmental impacts that may affect an area broader than the site or facilities subject to the physical works. Therefore, a review of each project component and the information available has been conducted and the impacts of the project during construction, operation and implementation on the physical, ecological and socio-economic environment associated to each component have been identified. This work will help to ensure that adequate mitigation is included in the project design and that the optimal technical requirements for construction and operation are understood and implemented. In addition, a qualitative assessment of each identified impact has been undertaken using simple, objective and representative indicators. By following this approach, the importance of each potential impact caused by the activities of the project has been categorized. Firstly, the likely significance of the potential issues of concerns has been determined and ranked according to the following:
A. Potential environmental impacts which are deemed to be highly significant and need thorough investigation in the ESIA. These impacts will be studied extensively by consulting expertise in the areas of the identified impacts to design needed mitigation and environmental management measures. Moreover, conducting specific studies and assessments to some of the key issues identified.
B. Potential environmental impacts that are deemed to be moderately significant, and will
require reasonable investigation in the ESIA. These impacts will be studied by expertise in the areas of the identified impacts to design needed mitigation and environmental management measures.
C. Potential environmental impacts that are deemed unlikely to be significant, and will
need to be listed, and addressed in some way, but which will not require detailed assessment in the ESIA.
Secondly, the following characteristics have been defined for each impact: Nature:
• Positive: applies to impacts that have a beneficial economic, environmental or social result, such as additional economic activity or enhancement of the existing environmental conditions.
• Negative: applies to impacts that have a harmful or economical aspect associated with them such as economical cost, loss or degradation of environmental resources.
Effect:
• Direct: applies to impacts which can be clearly and directly attributed to a particular impacting activity.
• Indirect: applies to impacts which may be associated with or subsequent to a particular impacting activity, but which cannot be directly attributed to it.
E1895 vol. 3 rev.

ECO Consult
Municipal SWM & Carbon Finance
86
Time Range:
• Short Term: applies to impacts whose effects on the environment will disappear within a 1 year period, or within the construction phase.
• Medium Term: applies to impacts whose effects on the environment will disappear within a 5 year period following the construction phase.
• Long Term: applies to impacts whose effects on the environment will disappear in a period greater than 5 years following the construction phase.
Reversibility:
• Reversible: applies to impacts whose significance will be reduced and disappeared over time (either naturally or artificially), once the impacting activity ceases.
• Irreversible: applies to impacts whose significance will not be reduced nor disappeared over time (either naturally or artificially), once the impacting activity ceases.
E1895 vol. 3 rev.

ECO Consult
Municipal SWM & Carbon Finance
87
Highly SignificantModerately SignificantUnlikely to be Significant
Resource Impact Description Positive Negative Direct Indirect Short Term Medium Term Long Term Reversible Irreversible
Traffic Increasing traffic loads on approach roads X X X X
Air Quality Increase of dust and particle emissions X X X X
Noise Increase of noise levels dued construction activities and traffic X X X X
Health & Safety General construction related health and safety risks for workers X X X X
Increase of LFG and GHG emissions before Cell 2 and 3 operations before LFG to Energy Plant is operational X X X X
Increase of dust and particle emissions from plant and trucks X X X X
Odour emissions from SW disposal operations at the operating cell X X X X
Reduction of odours after collecting and treating the leachate X X X X
Odours during handling and treatment of leachate at the Leachate Treatment Plant X X X X
Contamination of soil and sub-soil from undetected linerleakage X X X X
Potential contamination of soil & sub-soil from leachate leakage X X X X
Contamination of groundwater from undeteced leachate leakage X X X X
Reduction of potential threats to soil, sub-soil and groundwater by treating the leachate X X X X
Suface water pollution from leachate overflow X X X X
Health and safety impacts on landfill workers from continuous direct contact with SW X X X X
Risk of diseases transmissions from vector to nearby residents X X X X
Risk of fires at the landfill. X X X X
Socio-economics Employment generation at the Leachate Treatment Plant X X X X
Characterization of ImpactsNature Effect Time Range Reversibility
Ghabawi Landfill and Leachate Treatment Plant Operation
Ambient Air Quality
Soil and Water Resources
Health & Safety
Ghabawi Landfill and Leachate Treatment Plant Upgrade
Construction
E1895 vol. 3 rev.

ECO Consult
Municipal SWM & Carbon Finance
88
Highly SignificantModerately SignificantUnlikely to be Significant
Resource Impact Description Positive Negative Direct Indirect Short Term Medium Term Long Term Reversible IrreversibleTraffic Increasing traffic on approach roads X X X X
Air Quality Increased levels of dust and particle emissions due to construction and capping activities X X X X
Noise Increased noise levels due to increased construction and capping works X X X X
Health & Safety Decreased health & safety conditions for workers X X X X
Reduction of GHG emissions such as CH4 and CO2 X X X X
Reduction of local pollutant emissions and trace constituents such as VOCs X X X X
Reduction of odour emissions X X X X
Increase of control and monitoring activities reducing potential air emissions X X X X
Reduction on operation costs by minimizing the consumption of fossil fuels X X X X
Creationg of a revenue X X X X
Employment generation X X X X
Development of local capacities X X X X
Improvement of the quality of living for local residents as well as facilitating a sustainable growth X X X X
Improvement of leachate management reducing the risk of groundwater pollution X X X X
Increase of control and monitoring activities reducing potential leachate contamination X X X X
Improvements on public work and safety by reducing LFG migration X X X X
Reduction of potential threats to the natural resources of the area improving the environment conditions of the nearby populations
X X X X
Landfill Gas to Energy Plant and Cell Capping Construction
Landfill Gas to Energy Plant and Cell Capping Operation
Water resources
Finances
Socio-economics
Health & Safety
Air Quality
Characterization of ImpactsNature Effect Time Range Reversibility
E1895 vol. 3 rev.

ECO Consult
Municipal SWM & Carbon Finance
89
Highly SignificantModerately SignificantUnlikely to be Significant
Resource Impact Description Positive Negative Direct Indirect Short Term Medium Term Long Term Reversible Irreversible
Traffic Increasing traffic loads on approach roads X X X X
Air Quality Increased levels of dust, particulate and gas emissions due to construction activities X X X X
Noise Increased noise levels from construction works and unloading services X X X X
Health & Safety General construction related health and safety risks for workers X X X X
Archaeology & Cultural Heritage Disruption of hidden archaeological sites. X X X X
Socio-economics Potential need for resettlement, depending on specific location X X X X
Altering traffic patterns by increasing volumes of truck traffic on approach roads X X X X
Reduction of traffic to Ghabawi Landfill X X X X
Health & Safety Potential risk of accidental spills and discharges, fires or other accidents X X X X
Water resources Risk of soil/groundwater pollution from leachate leakage during the compaction process X X X X
Noise Increase noise levels from trucks and transfer station X X X X
Risk od odour from transfer stations X X X X
Reduction of dust and particule emissions X X X X
Reduction of CO2 emissions X X X X
New Transfer Stations Operation
Traffic
Air Quality
New Transfer Stations Construction
Characterization of ImpactsNature Effect Time Range Reversibility
Table: 6.1 Characterization of Impacts resulting from the Implementation of Each Project Component
E1895 vol. 3 rev.

ECO Consult
Municipal SWM & Carbon Finance
90
6.1 Project Significant Impacts
In the following sections 6.2 to 6.5 a description of negative and positive impacts has been included and the significance for each impact has been determined. In this section, a summary has been included to show a clearer outline of the benefits and drawbacks of the project.
6.1.1 Benefits of the Project There are significant environmental, socio-economic and financial benefits anticipated as a result of the MSWM Project: Environmental Benefits:
• Reduction of traffic to Ghabawi Landfill and therefore, reduction of CO2 emissions.
• Reduction of potential threats to the soil, sub-soil and groundwater at the landfill site by
treating the leachate. • Reduction of odours at the landfill area and its surroundings by treating the leachate. • Reduction of GHG emissions such as CH4 and CO2 and LFG emissions including local
pollutant emissions and trace constituents such as VOCs, by collecting and treating the LFG.
• Improvement of leachate management which reduces risk of groundwater pollution. • Increase of control and monitoring activities reducing potential air emissions and leachate
contamination. Socio-Economic Benefits:
• Reduction of potential threats to the water resources and air quality which improves the nearby populations’ environment conditions.
• Employment generation. • Development of local capacities in building, managing and monitoring LFG collection
and power generating equipments.
• Improvement of the quality of living for local residents as well as facilitating a sustainable growth.
• Improvements on public work and safety by reducing LFG migration.
Financial Benefits:
• Reduction on operation costs by minimizing the consumption of fossil fuels. • Creation of revenues from LFG emissions reduction (CERs) and power sales to the grid.
E1895 vol. 3 rev.

ECO Consult
Municipal SWM & Carbon Finance
91
6.1.2 Drawbacks of the Project Additionally, there are also significant potential negative impacts on the environmental and socio-economic conditions anticipated as a result of the MSWM Project. Negative Environmental Impacts during construction: Several potential negative impacts have been identified during construction of the transfer stations as well as the new cell and the new facilities planned at the landfill. These impacts are generally unlikely to be significant and relate to noise nuisance of the area, increased traffic volumes in the surroundings of the construction works, potential disruption of the existing biodiversity and unfound archaeological sites, in addition to increased dust and particle emissions. In addition, a more significant potential impact relates to a decrease of the health & safety conditions of workers during construction of the transfer stations and the landfill as they are exposed to particles and gases emissions as well as handling machinery. Negative Environmental Impacts during operation: The following is a summary of the most significant negative impacts associated to the implementation and operation of the different project components:
• Potential contamination of soil, sub-soil & groundwater from leachate leakage.
• Increase of LFG and GHG generation before the LFG to Energy Plant is operational by increasing the landfill capacity.
• Risk of diseases transmissions from vectors on landfill nearby residents.
• Increase of odours from emissions during handling and treatment of leachate at the
landfill and its surroundings.
• Potential risk of accidental spills and discharges, fires or other accidents at the transfer stations and the landfill.
6.2 Ghabawi Landfill and Leachate Treatment Plant Upgrade
The Ghabawi Landfill is associated with a number of impacts related to its existing operational conditions as well as its future expansion and operational conditions. In addition, during the Leachate Treatment Plant construction, there are several environmental issues associated with the construction activities and the construction camp and crews. The following is a description of the potential impacts identified
6.2.1 Construction of Cell 3 and Leachate Treatment Plant
6.2.1.1 Traffic
• Increasing traffic loads on approach roads.
E1895 vol. 3 rev.

ECO Consult
Municipal SWM & Carbon Finance
92
Construction of the new cells would require the transport of construction material in and out of the site. This will lead to increased traffic levels around the construction site thus altering traffic patterns by increasing volumes and loads on roads. This impact is considered negative, direct, short term, reversible and unlikely to be significant.
6.2.1.2 Air Quality
• Increase of dust and particle emissions during construction. An increase in traffic activity in the Ghabawi Landfill site is anticipated during the construction phase. Such increase will lead to an increase of dust emissions, particulates and fuel combustion. This impact is considered negative, direct, short term, reversible and unlikely to be significant.
6.2.1.3 Noise
• Increase of noise levels due to construction activities and traffic. The construction phase consists of various activities such as the excavation activities, the installation of impermeable lining at the bottom of the cells as well as the installation of the berms at the borders of the cell. These activities will in turn increase noise levels. This impact is considered negative, direct, short term, reversible and unlikely to be significant.
6.2.1.4 Health and Safety • General construction related health and safety risks for workers.
Construction often involves exposure of workers to increased levels of emissions, particulates, and gases as well as handling machinery. This exposure increases the health and safety risks of workers and the surrounding environment. This impact is considered negative, indirect, short term, reversible and moderately significant.
6.2.2 Operation of the Ghabawi Landfill and the Leachate Treatment Plant
6.2.2.1 Air Quality • Increase of GHG and LFG emissions from Cells 2 & 3 operations before LFG to Energy
Plant is operational. One of the main subproducts generated in a landfill site is biogas, which is produced by the biological decomposition of wastes in anaerobic conditions. LFG is composed primarily of two greenhouse gases (GHG), CO2 and CH4, which has approximately 21 times the global warming potential of CO2. LFG also commonly contains additional trace constituents such as volatile organic compounds (VOCs), ammonia (NH3) and hydrogen sulphide (H2S). The type and rate of
E1895 vol. 3 rev.
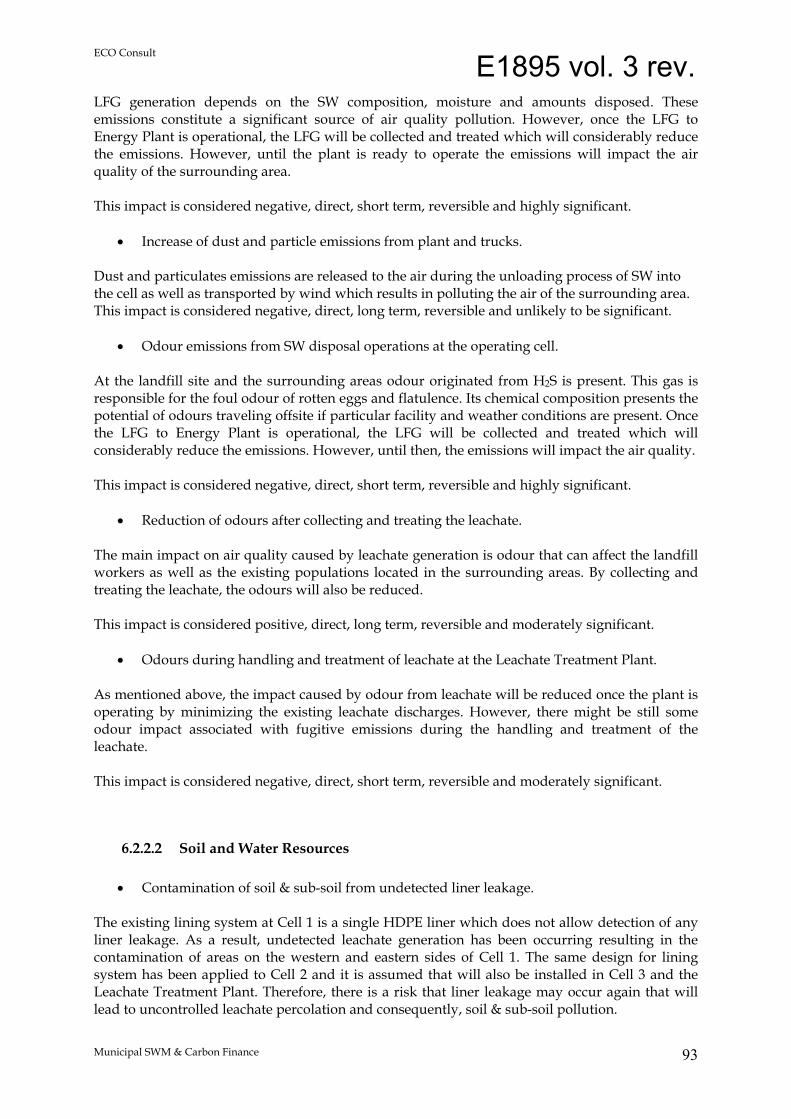
ECO Consult
Municipal SWM & Carbon Finance
93
LFG generation depends on the SW composition, moisture and amounts disposed. These emissions constitute a significant source of air quality pollution. However, once the LFG to Energy Plant is operational, the LFG will be collected and treated which will considerably reduce the emissions. However, until the plant is ready to operate the emissions will impact the air quality of the surrounding area. This impact is considered negative, direct, short term, reversible and highly significant.
• Increase of dust and particle emissions from plant and trucks. Dust and particulates emissions are released to the air during the unloading process of SW into the cell as well as transported by wind which results in polluting the air of the surrounding area. This impact is considered negative, direct, long term, reversible and unlikely to be significant.
• Odour emissions from SW disposal operations at the operating cell. At the landfill site and the surrounding areas odour originated from H2S is present. This gas is responsible for the foul odour of rotten eggs and flatulence. Its chemical composition presents the potential of odours traveling offsite if particular facility and weather conditions are present. Once the LFG to Energy Plant is operational, the LFG will be collected and treated which will considerably reduce the emissions. However, until then, the emissions will impact the air quality. This impact is considered negative, direct, short term, reversible and highly significant.
• Reduction of odours after collecting and treating the leachate. The main impact on air quality caused by leachate generation is odour that can affect the landfill workers as well as the existing populations located in the surrounding areas. By collecting and treating the leachate, the odours will also be reduced. This impact is considered positive, direct, long term, reversible and moderately significant.
• Odours during handling and treatment of leachate at the Leachate Treatment Plant. As mentioned above, the impact caused by odour from leachate will be reduced once the plant is operating by minimizing the existing leachate discharges. However, there might be still some odour impact associated with fugitive emissions during the handling and treatment of the leachate. This impact is considered negative, direct, short term, reversible and moderately significant.
6.2.2.2 Soil and Water Resources • Contamination of soil & sub-soil from undetected liner leakage.
The existing lining system at Cell 1 is a single HDPE liner which does not allow detection of any liner leakage. As a result, undetected leachate generation has been occurring resulting in the contamination of areas on the western and eastern sides of Cell 1. The same design for lining system has been applied to Cell 2 and it is assumed that will also be installed in Cell 3 and the Leachate Treatment Plant. Therefore, there is a risk that liner leakage may occur again that will lead to uncontrolled leachate percolation and consequently, soil & sub-soil pollution.
E1895 vol. 3 rev.

ECO Consult
Municipal SWM & Carbon Finance
94
This impact is negative, direct, long term, reversible and highly significant.
• Potential contamination of soil and sub-soil from leachate leakage.
There is a potential risk that uncontrolled leachate will contaminate soil and sub-soil layers within the vicinity of the Cells since these layers are the direct point of contact. This impact is negative, direct, long term, reversible and highly significant.
• Contamination of groundwater from undetected leachate leakage. Since there are no historic records in the project area, low amounts of rainfall, high evaporation rates, and ground table depth ranging from 180-248 m, it is anticipated that the risk of contamination to groundwater is not significant. In addition, analyses by the use of 3 technical approaches indicate that worse case scenario would not result in detrimental impacts. This impact is negative, direct, long term, irreversible and unlikely to be significant.
• Reduction of potential threats to soil, sub-soil and groundwater by treating the leachate. The risk of soil, sub-soil and groundwater pollution as a consequence of leachate accumulation in unprotected areas due to potential discharges will be reduced. As already mentioned, the leachate will be collected through the collection system installed at the bottom of each cell and pumped into the treatment plant. This impact is considered positive, direct, long term, reversible and moderately significant.
• Surface water pollution from leachate overflow. The landfill site is located in the Amman/Zarqa Basin which drains into Zarqa River 15 km to the northwest of the Ghabawi site. The landfill area does not have permanent water bodies and is dry most of the year. Therefore, there are no potential risks on the surface and water quality in the catchment area, although it is being considered in case of an extreme flooding event that could impact negatively the surface water of the area. This impact is negative, indirect, long term, reversible and unlikely to be significant.
6.2.2.3 Health & Safety
• H&S impacts on landfill workers from continuous direct contact with SW. As mentioned before, there are several biodegradation byproducts generated in a landfill such as VOCs, which can cause effects such as irritations and damage on various organs in the human body; H2S, highly toxic gas which interferes with cellular respiration; and dioxins and organochlorines byproducts, both highly toxic potential pollutants. Workers at the landfill are in continuous contact with SW during the handling processes and therefore, exposed to all these contaminants and potential diseases. In addition, inadequate handling can create certain conditions by increasing susceptibility of catching these diseases.
E1895 vol. 3 rev.

ECO Consult
Municipal SWM & Carbon Finance
95
There are also H&S concerns that may be associated with the operation of heavy trucks such as workers falling from the cabin, injuries while performing various functions as for instance field-repairing works, etc. This impact is considered negative, direct, long term, reversible and moderately significant.
• Risk of diseases transmission from vectors to nearby populations.
SW is a source of diseases that can be transmitted through air or groundwater as well as through food contaminated by flies and other vectors (flies, mosquitoes, rodents, etc.). Populations living in the landfill surrounding areas are also potentially exposed to contaminants transmitted by vectors. This impact is negative, direct, long term, reversible and moderately significant.
• Risk of fires at the landfill. The accumulation of SW at the landfill cells results in natural degradation processes. CH4 and high temperatures are generated during this process and in some occasions, a reaction between these two subproducts might result in fires which pose risk on workers’ safety. This impact is negative, direct, long term, reversible and moderately significant.
6.2.2.4 Socio-Economic Conditions
• Employment generation at the Leachate Treatment Plant. Additionally, a minor impact on the socio-economic environment of the area will take place as a result of the employment generated during the operation of the plant. This impact is considered positive, direct, long term, reversible and unlikely to be significant.
6.3 Landfill Gas to Energy Plant and Cells Capping
6.3.1 Construction of LFG Plant and Capping
6.3.1.1 Traffic
• Increasing traffic on approach roads. Construction of the LFG to Energy Plant would require the transport of construction material in and out of the site. This will lead to increased traffic levels around the construction site thus altering traffic patterns by increasing volumes and loads on roads. This impact is considered negative, direct, short term, reversible and unlikely to be significant.
6.3.1.2 Air Quality
• Increased levels of dust and particle emissions due to construction and capping activities.
E1895 vol. 3 rev.

ECO Consult
Municipal SWM & Carbon Finance
96
The activities required for construction are often linked with increased dust emissions and reduced air quality. Increased levels of traffic necessary for construction further contribute to decreased air quality as it is associated with increased fuel combustion gas emissions. The construction of the LFG Energy Plan will thus impact air quality negatively due to increase of dust, particulates and gas emissions. This impact is considered negative, direct, short term, reversible and unlikely to be significant.
6.3.1.3 Noise
• Increased noise levels due to increased construction works and capping works. The construction of the LFG Energy Plant will involve an increase in noise levels as there will increased traffic in the area as well as construction activities. Increased noise levels are considered a nuisance to both the residents and biodiversity in the area. This impact is considered negative, direct, short term, reversible and unlikely to be significant.
6.3.1.4 Health and Safety • Decreased H&S conditions for workers.
Construction often involves exposure of workers to increased levels of emissions, particulates, and gases as well as handling machinery. This exposure increases the health and safety risks of works and the surrounding environment. This impact is considered negative, indirect, short term, reversible and moderately significant.
6.3.2 Operation of LFG Plant
6.3.2.1 Air Quality
• Reduction of GHG emissions such as CH4 and CO2. The LFG to Energy Plant design includes the installation of a LFG collection system to collect the gas generated in the cell as a consequence of the biological decomposition of wastes. As already mentioned, CH4 and CO2 are two of the main constituents of the LFG and the two most significant GHG. The LFG is extracted and burned in a flare or combusted as fuel in an energy plant during the process: CH4 + O2 = CO2 + 2H2O, in which the CH4 is transformed to CO2. Since the CH4 contribute 21 times more to the greenhouse effect than CO2 (and in this case the CO2 is even neutral), it has a considerable positive impact on the global environment. By collecting the gas, the GHG emissions will be reduced. Moreover, these emissions are also reduced by cutting the consumption of fossil-based fuels needed to operate the plant by using the electricity generated. This impact is considered positive, direct, long term, reversible and highly significant.
• Reduction of local pollutants emissions and trace constituents such as VOCs.
E1895 vol. 3 rev.

ECO Consult
Municipal SWM & Carbon Finance
97
The collection system will also improve the air quality of the area by reducing the emissions of local pollutants such as VOCs and other trace constituents present in LFG. This will reduce potential threats to the populations living nearby since the pollutants can easily be transported by the wind. This impact is considered positive, direct, long term, reversible and highly significant.
• Reduction of odour emissions. Likewise, by collecting the LFG, the system proactively avoids the potential for another LFG related problem at site such as odour minimization. This impact is considered positive, direct, long term, reversible and highly significant.
• Increase of control and monitoring activities reducing potential air emissions. In addition, with the CDM project, the landfill will also remain controlled and monitored at least up to 2029. This will enable an appropriate risk limitation of potential impacts into the local air emissions. This impact is considered positive, indirect, long term, reversible and moderately significant.
6.3.2.2 Finances
• Reduction of operation costs by minimizing the consumption of fossil fuels. As already mentioned, the project activity includes a LFG collection and electricity generation plant. The electricity is delivered to the grid and replaces the energy produced on a power plant using heavy fuel oil. As a result, the generation of electricity reduces the need to consume fossil fuels to provide an equivalent amount of energy. Taking into consideration the recent increase of fuel prices during the last months and the predictions of its continuous growth, the operation costs of the facility would be expected to increase in the medium-long term. However, by reducing the fossil fuel consumption, the operation costs will be lower and less dependent of the effect from variations in fuel prices. This impact is positive, direct, long term, reversible and highly significant.
• Creation of revenue. As mentioned above, revenues will be generated from CERs sales from LFG emissions reduction and the electricity sales, as power will be generated and delivered to the grid creating revenue from power sales, which will provide financial resources necessary for further improvements to the landfill operations. This impact is considered positive, direct, long term, reversible and highly significant.
6.3.2.3 Socio-Economic Conditions
• Employment generation.
E1895 vol. 3 rev.

ECO Consult
Municipal SWM & Carbon Finance
98
Economic activities will increase significantly as a direct result of the project. The establishment of the plant will also require the need to employ specialized staff during the lifetime of the project. Different personnel will be hired to be responsible for the operation, management, control and monitoring activities, which will impact positively on the area’s socio-economic environment. This impact is considered positive, direct, long term, reversible and unlikely to be significant.
• Development of local capacity. The project will also develop endogenous capacities in building, managing and monitoring LFG collection and power generating equipments. Jordan is planning to develop/improve MSW facilities through the countries. Advance technologies for LFG recovery and utilization will serve to demonstrate the social-economical and environmental benefits for such systems. This impact is considered positive, indirect, long term, reversible and unlikely to be significant.
• Improvement of the quality of living for local residents as well as facilitating a sustainable growth.
With the implementation of this project, GAM can also demonstrate that a properly designed, constructed and operated landfill site with LFG recovery and utilization can be effectively integrated into the long term land use planning of a municipality, thereby greatly improving the quality of local residents and helping to facilitate sustainable growth. This impact is considered positive, indirect, long term, reversible and unlikely to be significant.
6.3.2.4 Water resources
• Improvement of leachate management reducing the risk of groundwater pollution. As already mentioned, the additional revenues from carbon finance will also help to improve the overall operation of the site. The project will lead to better site lining, enhancement of waste compaction and leachate management. As a result of these improvements, potential risks of groundwater contamination from uncontrolled leachate generation will be reduced. This impact is considered positive, indirect, long term, reversible and moderately significant.
• Increase of control and monitoring activities reducing potential leachate contamination In addition, with the CDM project, the LFG to Energy Plant will be operational at least up to 2029. This will enable an appropriate risk limitation of potential impacts into the groundwater. This impact is considered positive, indirect, long term, reversible and moderately significant.
6.3.2.5 Health & Safety
• Improvements of public work & safety by reducing LFG migration. As described before, LFG consists mainly of CH4, CO2 and NH3. Besides that, there are minor volumes of VOC, which even in small concentrations can be injurious to health. More than a
E1895 vol. 3 rev.

ECO Consult
Municipal SWM & Carbon Finance
99
hundred different types of VOC have been identified in LFG around the world, of which the major parts are toxic in heavy concentration. By collecting and treating the LGF the project will reduce the threat of LFG migration, thereby eliminating a potential threat to nearby properties and improving public work and work health and safety. This impact is considered positive, direct, long term, reversible and moderately significant.
• Reduction of potential threats to the natural resources of the area improving the environment conditions of the nearby populations.
The improvements to the landfill operation mentioned above will reduce potential threats to the environment and therefore, improve the quality of living, i.e. the air quality, for local residents. This impact is considered positive, indirect, long term, reversible and highly significant.
6.4 Transfer Stations
Currently there are 3 transfer stations located at various locations within GAM whose operational activities have been the source of many negative activities. However, the project understudy considers the impact related to the implementation of enhancement activities. The following section outlines general impacts associated with transfer stations, details will be included in a full ESIA that will be carried out for the construction and operation of these new transfer stations.
6.4.1 Construction of Two New Transfer Stations
6.4.1.1 Traffic
• Increasing traffic on approach roads. Construction of the new transfer stations would require the transport of construction material in and out of the site. This will lead to increased traffic levels around the transfer station construction sites thus altering traffic patterns by increasing volumes and loads on roads. This impact is considered negative, direct, long term, reversible and unlikely to be significant.
6.4.1.2 Air Quality
• Increased levels of dust, particulate and gas emissions due to construction activities. Construction activities are often linked with increased dust emissions and reduced air quality. These activities will also result in increased levels of traffic in the area that will lead to an increase of fuel combustion gas emissions. The construction of the transfer stations will thus impact air quality negatively due to increase of dust, particulate and gas emissions. This impact is considered negative, direct, short term, reversible and unlikely to be significant.
6.4.1.3 Noise
• Increased noise levels from construction works and unloading services.
E1895 vol. 3 rev.

ECO Consult
Municipal SWM & Carbon Finance
100
An increase in noise levels is anticipated during the construction phase of the transfer stations at the site and surrounding area due to increased traffic as well as construction activities. This increased noise levels is considered a nuisance to the residents in the area. This impact is considered negative, direct, short term, reversible and unlikely to be significant.
6.4.1.4 Health and Safety
• General construction related health and safety risks for workers. There is a potential risk for people working at the construction site of the transfer stations since they are exposed to particle and gases emissions, as well as handling machinery. This impact is considered negative, indirect, short term, reversible and moderately significant.
6.4.1.5 Archaeology and Cultural Heritage
• Disruption of hidden archaeological sites. Construction activities may uncover archaeological remains. Depending on the construction activity being carried out, damage to the remains may take place. This impact is considered negative, direct, long term, irreversible and unlikely to be significant.
6.4.1.6 Socio-Economic Conditions
• Potential need for resettlement, depending on specific location It is most likely that the locations selected for the new transfer stations will be government land and therefore, until this date, there is no effect through potential loss of resources, nor need for any land confiscation or any resettlement. This is fully discussed in the RPF. This impact would be considered negative, direct, long term, irreversible but is unlikely to be significant.
6.4.2 Operation of the New Transfer Stations
6.4.2.1 Traffic
• Altering traffic patterns by increasing volumes of truck traffic on approach roads. The existing transfer stations are located in urban areas, one is located by a main road but the access to the other two stations is through narrower streets. According to the Feasibility Study submitted by CM in December 2007, the amounts of SW being taken to the transfer stations instead of directly to Ghabawi Landfill has increased in the last months. In addition, GAM is planning to close Yarmouk Transfer Station at the end of 2008. Until the new transfer stations are constructed the number of trucks around Ain Gazal and Sha’er transfer stations, especially this last one, will increase affecting the existing and future traffic levels which will negatively impact the road and street users of the surrounding areas.
E1895 vol. 3 rev.

ECO Consult
Municipal SWM & Carbon Finance
101
This impact is considered as negative, direct, long term, reversible and unlikely to be significant.
• Reduction of traffic to Ghabawi Landfill. The operation of the 2 new transfer stations in conjunction with the existing transfer stations will reduce the overall trips made to Ghabawi Landfill. This is due to efficient and effective transfer of SW from collection points via transfer stations to Ghabawi Landfill. Also, the technology to be implemented at the transfer stations, including compaction systems, reduces the volume of SW leading to further reduction of needed trips to Ghabawi Landfill. This impact is considered as positive, indirect, long term, reversible and unlikely to be significant.
6.4.2.2 Health & Safety
• Potential risk of accidental spills and discharges, fires or other accidents. There is a potential risk of accidental spills and discharges at the transfer stations, in addition to fires or other accidents caused by accumulation of combustible SW material. This impact is considered negative, indirect, short term, reversible and moderately significant.
6.4.2.3 Noise
• Increased noise levels from trucks and transfer station. Currently noise pollution exists at the traffic stations and the surrounding areas due to the loading and unloading activities of SW into the trucks as well as from the access of trucks in the stations. Increasing the number of trucks operating at the existing transfer stations and the implementation of operating activities in the areas where the new transfer stations are constructed will result in an increase of the existing noise levels which will impact negatively on the nearby residents. This impact is considered negative, direct, long term, reversible and unlikely to be significant.
6.4.2.4 Air Quality
• Risk of odour from the transfer stations. Since the new transfer stations will be located in areas where no loading and unloading activities took place before, the levels of odour and particle emissions will increase. This impact is considered negative, direct, long term, reversible and unlikely to be significant.
• Reduction of dust and particle emissions. Dust and particulates are also released to the air during transportation, loading and unloading of SW as well as a result of fuel combustion from trucks. Increasing the number of trucks transferring waste at the stations will result in an increase of these emissions. Although it is planned to open new transfer stations that could reduce the volume of trucks going through the existing transfer stations and therefore, emissions will be reduced.
E1895 vol. 3 rev.

ECO Consult
Municipal SWM & Carbon Finance
102
This impact is considered positive, direct, long term, reversible and unlikely to be significant.
• Reduction of CO2 emissions. As mentioned before, traffic levels around the Sha’er and Ain Gazal Transfer Stations are increasing. This will result in an increase of the combustion gases from trucks and therefore, the CO2 emissions until the new transfer stations are constructed. However, once the new transfer stations are operational, the overall CO2 emissions will be reduced as a consequence of minimizing the trips needed for collection vehicles driving directly to the landfill. This impact is considered positive, indirect, short term, reversible and unlikely to be significant.
6.4.2.5 Water Resources
• Risk of soil/groundwater pollution from leachate leackage during the compaction process.
The compaction process to be used at the transfer station may lead to the generation of leachate which will be hauled and stored in special tanks. This process pose additional risks to the area’s groundwater if potential spills and soil percolation occurs. However, the leachate will be transferred to Ghabawi Landfill and disposed at the Leachate Treatment Plant therefore the risk of groundwater and soil contamination is minimal. This impact is considered negative, direct, long term, irreversible and moderately significant
E1895 vol. 3 rev.

ECO Consult
Municipal SWM & Carbon Finance
103
7. ANALYSIS OF ALTERNATIVES
This section examines a number of the key alternatives to the present project, and discusses their relative environmental merits. Note that for some issues, little data is available on which to base the assessment, and that many of the judgments are generic. Also, despite a number of detailed technological alternatives have been discussed by the project designers, only Those alternatives with the potential to materially affect the outcome on the environment have been discussed here.
7.1 Strategic Waste Management Alternatives
7.1.1 Decentralized versus Centralized Landfill One of the strategic decisions taken by Jordan with regard to SWM in recent years has been the reduction in the number of landfill sites throughout the country, and the establishment of transfer stations. This decision was based on a specific study of the situation and the needs and capacities of the municipalities in terms of final disposal. The rationalization began in 2001, and consisted of establishing 22 transfer stations in some of the kingdom's municipalities, on lands owned by municipalities. By 2003, the first phase of the project had seen 12 transfer stations established, at a cost of 250,000 JD each (333,333US$). Each station was equipped with a compacter and trailers, in addition to the infrastructure at each site. The next phase of the project was to realize a further 10 similar transfer stations created. The total cost for the project is expected to be 5.9 million JD (7.86 million US$). Rationalization theoretically allows for the more efficient running of landfill sites, making use of economies of scale, and also for more investment in landfill site establishment. With the exception of Amman, the landfill sites are run by dedicated supra-municipal entities known as Common Services Councils. This arrangement also has theoretical advantages, removing the burden from smaller municipalities who have insufficient resources and capacity. This centralized approach also reduces the problem which a number of smaller municipalities have had in collecting and transferring MSW to final disposal sites. These problems include the low numbers of collection containers, the limited numbers and low capacity of compacters and trucks available for use on the streets, and the distances between many municipalities and their final disposal sites. It was not effective or economic for the smaller collection vehicles to have to transport waste for long distances. This creation of transfer stations allowed municipalities to carry on with the daily collection routines, transferring the SW by smaller vehicles, to a transfer station located close to the municipal area. The transfer station would compact the waste and allow it to be transferred into larger capacity vehicles for transport to the final disposal sites, many of which are a significant distance away, thereby releasing the smaller capacity vehicles for the municipal collection routines. Regarding Amman, the closure of Ruseifeh, and the establishment of the site at Ghabawi was also planned to realize economies of scale. Provided an adequate transfer infrastructure is established, the centralized approach for Amman should have the following advantages at the landfill site:
E1895 vol. 3 rev.

ECO Consult
Municipal SWM & Carbon Finance
104
• Opportunity to develop and concentrate technical expertise in landfill site management.
• Improved landfill site management and operational efficiency, due to economies of scale. • Increased opportunities for investment in environmental protection (leachate collection &
treatment, LFG collection and flaring, etc).
• Improved environmental management at site. Possible advantages with respect to collection and haulage include:
• Reduced haulage distance for collection trucks (only need to haul to nearest transfer station, not to Ghabawi).
• Opportunity for initial compaction at Transfer Stations, rather than Landfill.
• Reduce spill rate and GHG emissions.
However, it is likely that some of the financial and efficiency savings which could have resulted from the rationalization were under-realized, due to the difficulty of downsizing municipal workforces. Also, the design and management of the new landfill sites – like Ghabawi – need continuous improvement in order to achieve the benefits from improved financial and environmental performance. Overall, given the generally low capacity of local authorities outside Amman, their small budgets, and the lack of experienced engineering staff in the SWM sector, it is likely that the idea of concentrating landfill site management in a small number of larger, well managed sites with proper investment is a sound approach. It will be easier for larger sites to attract better investment, and to retain more qualified staff. Monitoring of fewer, larger sites is also easier, and more likely to be carried out effectively. The establishment of new larger sites will require a proper Environmental Impact Assessment, and the costs of proper environmental management can be better borne by bigger sites. However, additional consideration needs to be given to management of these sites. Few of the landfill sites in Jordan are managed to adequate environmental standards. Even the new site at Ghabawi has reportedly had difficulty in implementing some of the design recommendations. It is hoped that this WB funded project, and the establishment of the PMU, will improve the situation.
7.1.2 Increased Pre-Landfill Intervention Another strategic decision facing Jordan is whether and how to improve pre-landfill intervention. This relates to the variety of activities which can be applied to waste before its final destination. These include:
• Consumer reuse.
• Recycling.
• Separation or segregation of waste.
• Composting
E1895 vol. 3 rev.
ECO Consult
Municipal SWM & Carbon Finance
105
Jordan has limited experience with any of these options, although there are several projects currently understudy. Such projects include:
• A recycling agreement between GAM and TADWEER, local private company for MSW sorting.
• A recycling project in 10 districts of GAM by a GAM-MoE joint-venture.
• A source separation of recyclable material project as a PSP under EU, Executive
Privatization Commission and GAM financing.
• Waste sorting and recycling by local NGOs.
Taken together, such interventions are increasingly required by regulators in developed countries. Jordan is becoming more interested in examining the advantages of such interventions. All will require effort, changes in public awareness and attitude, investment on the part of the SWM operators, and additional regulatory attention, to various degrees. The potential advantages include;
• Reduction of waste quantities going to landfill.
• Potential source of compost material.
• Potential economic returns from recyclables.
• Gradually increasing consumer awareness on waste reduction. However, all efforts planned in the near future are local and small scale. The balance between the investment (financial and institutional) and the potential returns (environmental and economic) are difficult to determine in the absence of many unknowns, and should be studied.
E1895 vol. 3 rev.

ECO Consult
Municipal SWM & Carbon Finance
106
Table 7.1: Relative Environmental Impacts of Decentralized versus Centralized Landfill Options
Option Advantages Impacts to Ground Other Impacts/Disadvantages
Cost Implications
1. Decentralized versus Centralized Landfill
• Opportunity to develop and concentrate technical expertise in landfill site management.
• Improved landfill site management and
operational efficiency. • Increased opportunities for investment
in environmental protection.
• Improved environmental management at site.
• Reduced haulage distance for collection
trucks.
• Opportunity for initial compaction at Transfer Stations, rather than Landfill.
• Reduce spill rate and GHG emissions.
Potential impacts due to poor management of the landfill. Potential impacts due to poor management of the landfill.
2. Increased Pre-Landfill Intervention
• Reduction of waste quantities going to landfill.
• Potential source of compost material.
• Potential economic returns from
recyclables.
• Gradually increasing consumer awareness on waste reduction.
E1895 vol. 3 rev.

ECO Consult
Municipal SWM & Carbon Finance
107
7.2 Transfer Alternatives
7.2.1 No Project - Current Situation Currently, waste which is taken to Ghabawi is taken via 1 of 3 transfer stations; Ain Ghazal, Yarmouk and Sha’er. The waste is taken from head trucks (with a capacity of 8-10 tons) and transferred to trailors (with a capacity of 10-12 tons) for haulage to the landfill at Ghabawi. This is a sound system which allows the smaller collection vehicles to concentrate on collection inside Amman, while a fleet of larger vehicles makes the longer haulage trip to the landfill. However, with the expanding size of Amman additional transfer stations are needed. The negative environmental consequences of the current situation, with specific reference to the transfer stations include: • Less efficient transfer and haulage. • Increase of road traffic load. • Increase of GHG emissions from the trucks. • Increased debris along haulage routes due to smaller vehicles engaged in long distance
haulage and truck overfilling.
7.2.2 Two Additional Transfer Stations The creation of 2 additional transfer stations will have the positive effects of: • Increasing the haulage efficiency. • Reducing total number of haulage trips. • Reducing the net GHG and particulates emissions. However, there are possible negative consequences from the sitting of the transfer stations themselves, possibly creating new haulage access to and from the transfer stations. There are also likely negative impacts from the use of urban land for transfer station, with the attendant risks of noise, odour, vermin, and wind-blown debris, not to mention the social impacts of creating such facilities in or close to urban areas, and the risk of the introduction of waste pickers or waste pickers to the areas around the transfer station. Much of the negative impacts are site-specific and are dealt with in more detail in Section 6.
E1895 vol. 3 rev.

ECO Consult
Municipal SWM & Carbon Finance
108
Table 7.2 Relative Environmental Impacts of Transfer Options.
Option Advantages Impacts to Ground
Other Impacts/Disadvantages Cost Implications
1. No project- current situation.
Negative – Increase GHG emissions from the trucks.
2. Two additional transfer stations.
• Increasing the haulage efficiency. • Reducing total number of haulage trips. • Reducing the net GHG and particulates emissions
Positive – Reduce the net GHG and the particulates emissions
E1895 vol. 3 rev.

ECO Consult
Municipal SWM & Carbon Finance
109
7.3 Treatment Alternatives
The project under assessment includes the improvement of leachate collection, establishment of leachate treatment, and the collection and flaring of LFG. There is also an option to generate electricity from the LFG if there is sufficient gas production. The following section addresses the various alternative combinations of treatment approached. Leachate treatment technologies are dealt with in a later section.
7.3.1 No project – Current Situation Without the project, the situation will remain as described in the baseline of this report. Cell 1 is saturated in the lower levels and has a ruptured membrane and pipe network. The establishment of Cell 2 was behind schedule. There is leachate infiltration to the ground at Cell 1. The negative environmental consequences of the current situation include:
• Continuing Infiltration of leachate into the ground.
• Over-saturation of part of Cell 1 inhibiting decomposition and reduction of the LFG production.
• No leachate re-circulation.
7.3.2 Leachate Treatment Only If leachate collection and treatment were to be improved, in accordance with the project proposals, the negative impacts of infiltration to the ground would be reduced. Oversaturation of the lower levels of the cell would reduce and leachate could be re-circulated in the cell. The level of decomposition would therefore be increased, and LFG production increased. The environmental consequences are:
• Reduced infiltration of leachate to the ground – positive • Increased decomposition in the cells – positive
• Increased emission of uncaptured LFG to the atmosphere - negative
7.3.3 LFG Flaring If LFG flaring were to be introduced, the CH4with GWP of 21 is converted to CO2 with a GWP of 1. Emissions of GHG would therefore be reduced significantly, and thus alternative represents a marked improvement.
7.3.4 Gas to Energy Production If the LFG were used to generate energy, rather than flaring, an estimated 1MWh could be generated from 0.712 tCO2. As well as the direct GHG reduction, this would induce a complementary indirect reduction in emissions from other generating plant. This option further reduces the overall negative impacts.
E1895 vol. 3 rev.

ECO Consult
Municipal SWM & Carbon Finance
110
7.3.5 Full project (LT & LFG flaring & generation) If the full project were to be implemented, the negative impacts of leachate infiltration to the soil would be reduced/eliminated, the efficiency of decomposition would be increased, LFG capture would be enhanced, and greenhouse gas emissions would be reduced, both direct emissions from the Ghabawi Landfill, and substitution emissions from other gas or oil fired power plants. The full project therefore provides the best overall reduction in negative environmental impacts. The relative impacts of the above options are summarized in the following table;
E1895 vol. 3 rev.
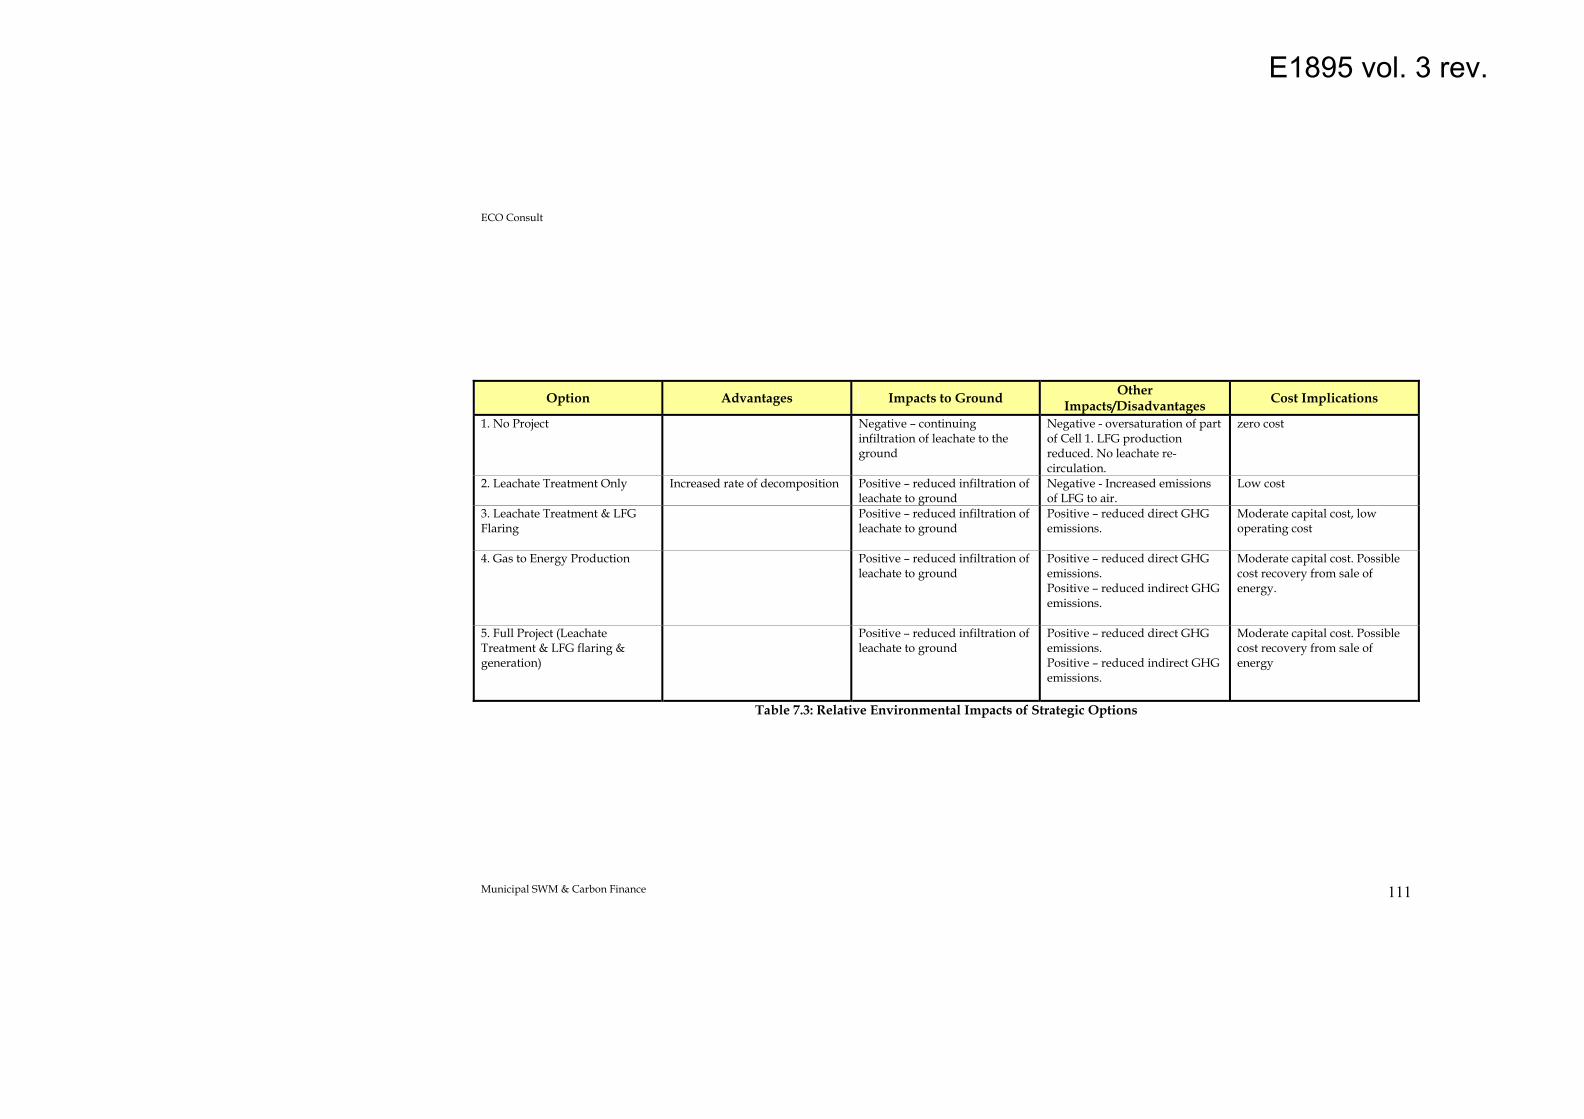
ECO Consult
Municipal SWM & Carbon Finance
111
Option Advantages Impacts to Ground Other Impacts/Disadvantages Cost Implications
1. No Project Negative – continuing infiltration of leachate to the ground
Negative - oversaturation of part of Cell 1. LFG production reduced. No leachate re-circulation.
zero cost
2. Leachate Treatment Only Increased rate of decomposition Positive – reduced infiltration of leachate to ground
Negative - Increased emissions of LFG to air.
Low cost
3. Leachate Treatment & LFG Flaring
Positive – reduced infiltration of leachate to ground
Positive – reduced direct GHG emissions.
Moderate capital cost, low operating cost
4. Gas to Energy Production Positive – reduced infiltration of leachate to ground
Positive – reduced direct GHG emissions. Positive – reduced indirect GHG emissions.
Moderate capital cost. Possible cost recovery from sale of energy.
5. Full Project (Leachate Treatment & LFG flaring & generation)
Positive – reduced infiltration of leachate to ground
Positive – reduced direct GHG emissions. Positive – reduced indirect GHG emissions.
Moderate capital cost. Possible cost recovery from sale of energy
Table 7.3: Relative Environmental Impacts of Strategic Options
E1895 vol. 3 rev.

ECO Consult
Municipal SWM & Carbon Finance
112
7.4 Leachate Treatment Alternatives
Four treatment alternatives were initially considered. These are discussed below, along with the no project option.
7.4.1 No project – Current Situation In this case, the existing pre-treatment plant consists of 3 evaporation ponds where no additional treatment is applied. This plant was designed to serve the first 3 cells only, with a maximum capacity of 750 m3/day, and the output does not reach the Standard for the Reuse of Wastewater for Irrigation (JS 893). In the case where no additional treatment is established, the effluent will remain below the standard, and thus be unusable for discharge or reuse. Evaporation or recirculation will be the only options. The dry nature of the Ghabawi Landfill promote the use of recirculation as it increases biodegradation rates and has low operational costs. The process involves the recirculation of leachate within the cell which is either sorbed or evaporated. It is unlikely that significant leachate will remain after a properly managed recirculation system, and some natural evaporation.
7.4.2 Typical Treatment Leachate characteristics determine the type of treatment required. Based on whether the leachate is biodegradable or not various types of treatment can be applied. Biodegradable treatments include constructed wetlands and aeration ponds. Non-biodegradable treatments include physico-chemical treatments such as forced evaporation, ultrafiltration and reverse osmosis. With such additional treatment components, the quality of the effluent could be raised to become acceptable for discharge to the ground. However, given the level of concentration of the effluent, such treatment would be very expensive, and produce a low proportion of usable water. Given the dry nature of the cells at present, the leachate would be better re-circulated at zero cost, and go towards increasing LFG production.
7.4.2.1 Constructed Wetlands The use of vegetation (reeds) planted in gravel beds to reduce the pollutant content in the effluent is one option to reduce BOD and COD, oxidise ammoniacal nitrogen, reduce suspended solids, and also reduce somewhat the concentration of nutrients. Advantages of the wetland approach include its low investment and operation costs, as well as the knock on benefits of the creation of additional green habitat. However, in this case, the leachate concentration is so high and is likely to be unsuitable for wetland irrigation, especially in an area of low rainfall. Another disadvantage of this approach is the large land area required. Again, the leachate would be better re-circulated to increase production of LFG.
E1895 vol. 3 rev.

ECO Consult
Municipal SWM & Carbon Finance
113
7.4.2.2 Thermal Treatment The thermal treatment of part of the leachate and/or the concentrate from the reverse osmosis process using heat from the flared LFG is a further option. Advantages of this option include the elimination of excess leachate and the need to evaporate or dispose of sludge. However, there is little advantage in removing a needed source of re-circulatory leachate, unless the quantities were excess to requirements for re-circulation. If so, this is a sensible option. The key disadvantage is that this option is dependant on the availability of the flared gas, since until gas flaring is established, this approach is not feasible.
7.4.2.3 Forced Evaporation The climatic conditions at Ghabawi could be made use of by allowing the effluent to be sprayed onto plates heated from the flared gas or generators, sprayed onto open modules to simply increase the evaporative area, or sprayed on closed modules which are blown , possibly using hot air from the generator or flared gas. This method uses existing energy sources (sun or LFG) to increase the evaporation and reduce the effluent. Advantages include its low operation cost (provided the energy sources low cost or natural i.e. sun). It is assumed that only leachate excess to re-circulation requirements would be treated in this way. Disadvantages include cost in the event an energy source need to be supplied, and the use of an energy source that would increase emissions and GHGs.
7.4.3 Synthesis Approach Note – none of the above options has received detailed study, for example looking at future leachate volumes, the need to enhance the re-circulation to increase LFG production, and the amount each option could treat in the specific conditions. No detailed costing has been made. The CM Task 2 Report recommends a phased combination of approaches, as follows; Phase 1 - beginning as soon as possible; i) pump the leachate from Cells 1 & 2 and pre-treat in the existing aeration ponds (30,000 m3 storage capacity), ii) construct a second line of pre-treatment with additional capacity. iii) enhance the evaporation by spraying and sprinkling. iv) re-circulate in Cell 2 when waste reaches 5 m. v) construct a pilot wetland to test efficiency of pre-treatment leachate. Phase 2 – once LFG extraction is implemented, but without gas – energy; i) as above, ii) preheat and inject leachate to flare to enhance evaporation, iii) construct additional wetlands (if pilot successful), iv) if wetlands not successful, adopt additional physico-chemical and/or reverse osmosis to remaining leachate, v) forced evaporation Phase 3 – once LFG – energy is established; i) as with Phase 2 but using additional heat from gas engine to enhance evaporation. Such an appropriate combination of solutions could minimize cost and complexity, although it is unlikely that a physico-chemical treatment option would be cost effective. There are no significant differential environmental impacts from the various potential combinations.
E1895 vol. 3 rev.

ECO Consult
Municipal SWM & Carbon Finance
114
Reduction of under-treated leachate discharge to the ground is avoided in each case. Provided that the re-circulation needs of the cells have priority over leachate removal, then evaporation (natural or assisted) will probably be sufficient to remove the remainder, with any additional sludge fed into the landfill. The wetland option is unlikely to provide a suitable wetland environment, because of the concentration of the effluent and low natural rainfall in the area. The relative advantages and disadvantages are summarized in the following table:
E1895 vol. 3 rev.

ECO Consult
Municipal SWM & Carbon Finance
115
Option Advantages Impacts to Ground Other Impacts/Disadvantages Cost Implications
1. No Additional Treatment Effluent can be re-circulated without additional treatment
Negative - effluent unable to be discharged or reused.
Odours and vectors from evaporation
Low cost
2. Typical Treatment Better quality effluent could be discharged or reused.
Positive - effluent could be discharged or reused
Reduced impacts from evaporation Need to prioritize re-circulation.
High cost
3. Constructed Wetland Simple & cheap. Negative - potential leakage of contaminated leachate from wetland
Reduced impacts from evaporation. Need to prioritize re-circulation. Unnecessary
Low capital and operating cost, high land area needs
4. Thermal Treatment Eliminates excess leachate Positive - removes risk of pollution to ground
Only feasible once LFG flaring is implemented
Some cost in LFG flaring infrastructure
5. Forced Evaporation Eliminates excess leachate Positive - removes risk of pollution to ground
Some cost in LFG flaring infrastructure
6. Synthesis Approach (assumes no wetland, no physico-chemical treatment)
Eliminates excess leachate. Positive – removes risk of pollution to ground
Need to prioritize re-circulation Little marginal cost, since building on other planned infrastructure.
Table 7.4: Relative Environmental Impacts of Leachate Treatment Options.
E1895 vol. 3 rev.

ECO Consult
Municipal SWM & Carbon Finance 116
8. MITIGATION AND MONITORING
Mitigation and monitoring measures have been defined for the main impacts identified in this assessment. These measures can be found in the EMP tables under the Mitigation and Monitoring Plans. See Section 10. The following is a description of the specific monitoring programs included in the Monitoring Plan table.
8.1 Groundwater Monitoring Program
The following is a list of the minimum requirements defined to monitor groundwater. Requirements:
• Minimum of 1 groundwater well upstream and 1 groundwater well downstream. • The frequency of measurements should be monthly unless from a sample taken in the
previous measurement pollution was detected. In this case, the frequency should increase according to the assessment of the current situation.
• Suggested sampling parameters should include the following:
Field Parameters Laboratory Parameters
pH Metals Total Chlorides BOD COD Alkalinity
Table 8.1: Monitoring Parameters for Groundwater Sampling
8.2 Ambient Air Quality Monitoring Program
The following is a list of the minimum requirements that should be applied to carry on with this program. Requirements for Dust (Particulate Matter):
• Ambient Monitoring Points should be located just outside the borders of site.
• All Ambient Monitoring Points should be sampled weekly during excavation or erection of buildings.
8.3 Leachate Quality Monitoring
In addition to the groundwater monitoring, weekly samples will be collected by GAM and submitted to the PMU including specific leachate characteristics in order to assess the quality of this sub-product. The following parameters should be measured:
E1895 vol. 3 rev.

ECO Consult
Municipal SWM & Carbon Finance 117
Field Parameters Laboratory Parameters
pH Metals Temperature Total Chlorides
Alkalinity Total Dissolved Solids (TDS) Biochemical Oxygen Demand (BOD5) Chemical Oxygen Demand (COD) Oil and Grease
Table 8.2: Monitoring Parameters for Leachate Sampling
8.4 Site Selection Framework for New Transfer Stations
GAM is currently undertaking a Site Suitability Study to identify and evaluate potential sites for construction of two new transfer stations. The goal of the facilities is outlined within GAM's MSW strategy which is to: (a) increase existing transfer stations efficiency; (b) provide new trailers and compacter systems; (b) construct new transfer stations in the northwest and southwest of Amman; (c) comply with sanitary and environmental standards. This section provides a framework along with the criteria to be considered during site selection for the two transfer stations. Although the typical potential impacts resulting from the construction and operation of new transfer stations have been defined together with mitigation and monitoring measures, specific site selection criteria have also been identified. The following is a description of these criteria which should include: • Location – new sites should be located in areas that are not within the same vicinity of the
existing transfer stations or landfill in order to facilitate even collection from all areas within GAM. Factors such as cost and availability should also be considered for site selection as they may limit potential areas. Most preferable sites are located northwest and southwest of GAM.
• Ownership of the land – high prices and lengthy purchasing procedures of land within GAM
poses an obstacle in the selection process. Thus, it is convenient and effective to select sites that are either municipal and/or governmental lands.
• Availability of the land – sites selected should be located in areas that are currently unused
and designated as industrial according to GAM Zoning Plan. • Environmental Justice Considerations - During the site selection process, steps should be
taken to ensure that sitting decisions are not imposing a disproportionate burden upon low-income or minority communities. It can also have a negative economic impact by lowering property values and hindering community revitalization plans.
• The site area – based on operations of current transfer stations and feasibility studies, an area
of 4 donums is suggested to be of sufficient capacity for operations. This area also takes into consideration the potential future capacity expansion.
• Access – the sites must be located in an area that is easily accessed with roads wide enough to
accommodate easy maneuvering of collection vehicles and hauling trucks. The access roads to potential sites should be able to withstand high volumes of traffic.
E1895 vol. 3 rev.

ECO Consult
Municipal SWM & Carbon Finance 118
• Topography – the construction of the new transfer stations should be in an area that would not impact the natural terrain of the area, as in not requiring earthworks.
• Environmental – the site selection should take into consideration the following
environmental elements:
Element Description
Terrestrial flora and fauna The site should not be in proximity of habitat, migratory routes, feeding or breeding ground of sensitive species. The site should not destroy or disturb terrestrial flora and fauna to the extent of leading to their endangerment.
Groundwater resources and overall drainage
The site should not be in proximity of valuable groundwater resources. The site should not be located in areas that may be impacted by storm water drainage (as to prevent leachate from traveling into water bodies within vicinity). The site should not be located near porous ground as to prevent seepage.
Soil quality The site should not be in proximity of fertile land (farming land) as to prevent pollution via vectors or air emissions.
Wind direction The surrounding communities should not be located downwind of transfer station sites as to prevent traveling of odours and dust emissions.
Table 8.3: Environmental Site Selection Criteria
• Social – the sites should not be located in close proximity of residential areas as to eliminate and/or reduce risks associated with health and safety. It is recommended that the sites' wind direction is taken into consideration in order to avoid emissions and odour from reaching nearby communities.
Based on the site selection criteria, evaluation of proposed sites should be carried out. It is suggested that the following priority scale is used for the evaluation:
High Priority Social Access Environmental Medium Priority Ownership of Land Site Area Topography Availability of Land
Table 8.4: Priority Scale for Transfer Stations’ Selection Criteria
E1895 vol. 3 rev.

ECO Consult
Municipal SWM & Carbon Finance 119
8.5 Emergency Action Plan
The proper operation of SWM services should not result in any event detrimental to the environment under normal or certain abnormal conditions. Potential problems created by extremely adverse weather conditions producing, for instance, SW dissemination around the collection points as well as around the transfer stations, high leachate flows exceeding the collection system or flooding events at the landfill site, should be addressed in an Emergency Action Plan for SW by GAM in agreement with the MoE as specified in the Environmental Protection Law No.52/2006. In addition, a fire control system should also be defined to avoid potential risks taking place mainly at the transfer stations and the landfill site. The response of the Operating personnel to any serious emergency situation such as but not limited to an adverse weather conditions event, a fire or personal injury should be as follows:
• Notification of the collection services manager and supervisor, the transfer station manager or landfill site engineers and supervisor.
• Notification of emergency service (Civil Defense, ambulance) by the collection services manager and supervisor, the transfer station manager or landfill site engineers and supervisor.
• Notification of the GAM or DBO-LFG designated official(s) by the collection services manager and supervisor, the transfer station manager or landfill site engineers and supervisor.
• Notification of the Project Management Unit (PMU) designated official(s) by the collection services manager and supervisor, the transfer station manager or landfill site engineers and supervisor.
• As appropriate, notification of regulatory agencies by the PMU official.
This notification procedure including the names of responsible personnel should be facilitated to each worker implicated in the collection services and posted next to each telephone at the transfer stations and at the landfill site. It should also include records of each incidence submitted to the authority within twenty-four (24) hours of occurrence. Fire Control In addition, the HDE and the DBO-LFG should be responsible for the control and extinguishing of all types of fires which may occur at the transfer stations and the Ghabawi Landfill including the immediate reporting of all fires to local fire-fighting offices. Occasionally, a collection truck may arrive at the transfer station or at the landfill site with a «hot load», that is, with its contents smoldering or on fire. Such vehicle should be directed to a point pre-designated by the Contractor away from the working area. There, the burning material should be dumped and extinguished by the operating personnel. Most fires at sanitary landfills are caused by hot loads or carelessness. To combat fires, each piece of equipment should be provided and maintained with a fire extinguisher capable of controlling and extinguishing all classes of small fires. In addition, extinguishers of a sufficient size should be provided and maintained at each station and the landfill site operations center.
E1895 vol. 3 rev.

ECO Consult
Municipal SWM & Carbon Finance 120
In addition, large landfill surface fires should be isolated or kept from spreading, if possible, using earth from the soil stockpile for daily cover which should be maintained near the working area for such purposes, either to create a fire break by covering SW which has not caught fire or by using it to smother the SW which is on fire. The GAM manager in agreement with the DBO-LFG site supervisor should have to use his judgment as to what immediate course of action to take. For any fire, however, they should contact the weigh station and report the seriousness of the fire. The site supervisor or manager should then dispatch to the scene of the fire the water truck which should be equipped with suitable equipment to control a fire until the nearest fire department has an opportunity to respond. Additionally, the Civil Defense should be called immediately. Moreover, immediately after dispatching on-site equipment, operating personnel should summon the nearest fire department for help. The PMU’s main office should then be notified of the fire. With the installation of the well and rainwater storage ponds, other means for controlling fires on site are available. Water contained within the rainwater storage ponds could also be utilized in critical situations for fire-fighting purposes. However, under normal operating and weather conditions these basins should be dry. Fires which occur deep within SW deposits can only be brought under control by excavating the area to expose the fire and then extinguishing it. Such fires, however, are rare in a well compacted and covered landfill. If a deep-seated fire is detected within disposed SW, the removal of the overburden of soil and SW and subsequent excavation of the burning materials probably would be too dangerous to handle with dozers, front-end loaders, or similar equipment. A drag line should have to be brought to the site to excavate the burning materials in this situation.
E1895 vol. 3 rev.

ECO Consult
Municipal SWM & Carbon Finance 121
9. INSTITUTIONAL STRENGTHENING & COMPLIANCE;
9.1 Project Management Unit (PMU)
Component 3 of the Project is the provision of technical assistance to a new Project Management Unit (PMU) within GAM, to provide day to say management of the project on behalf of GAM. Roles of the PMU will include supervising and monitoring the construction and operations of the new infrastructure and facilities. It is envisaged that most of the capacity necessary to implement the Environmental Management Plan (EMP) and the Monitoring Requirements set out in this EIS, will be established in this PMU, through the project. The project envisages a part time environment specialist being a part of the PMU, with the responsibility of monitoring the implementation of the EMP.
9.2 Implementing the EMP
Procurement During the procurement process, it should be established that the selected bidder has the experience and capacity to understand the importance of the EMP and its implementation. Contract Monitoring Much of the EMP tasks relate to the monitoring of the private sector contracts to construct and operate the landfill gas and leachate treatment plants. The requirements of the EMP which relate to the contractor or operator should be passed to the contractor through the contract. Implementation of the EMP therefore becomes a contractual requirement. One of the functions of the PMU will be to establish a mechanism for monitoring and supervising the contracts (both during construction and operation of the facilities). This will be through site visits, inspections, review of reports, and meetings with the contractor. The environmental specialist should be involved in the contract monitoring, and should make monthly (minimum) visit to the site(s) to establish that the EMP tasks are being performed adequately. A monthly report detailing performance for the period should be provided, and should include a summary of inspections completed, audits undertaken, complaints and incidents, response measures undertaken to remedy complaints and incidents, and actions underway or to be undertaken to address complaints and incidents together with timing for achieving compliance with the EMP with respect to complaints and incidents. Non-conforming products or processes should be highlighted and communicated to the contractor. The environmental specialist will report findings and concerns to the PMU Director for action. Physical monitoring Certain specific monitoring tasks have been set out in the Monitoring Plan. These include monitoring of air quality, noise and water quality (leachate and groundwater). It is understood
E1895 vol. 3 rev.

ECO Consult
Municipal SWM & Carbon Finance 122
that the monitoring of air quality and noise will be contracted out by GAM to third parties, while water quality monitoring and analysis will be carried out by GAM. It is recommended that these monitoring tasks be defined by the PMU, and contracted out (including a clear internal contract for water quality monitoring) with clear reporting and analysis requirements.
9.3 Required Capacity
A. Environmental Specialist Experience The above PMU tasks could easily be carried out by a part time environmental specialist. Ideally a person should be recruited with technical environmental background which includes some experience in monitoring and analysis. Experience in 3rd party contracting experience – either construction supervision, or monitoring contracts – would be an advantage. Training Training should be allowed for in both i) environmental monitoring and ii) contract supervision. A 1 day training session in each subject could be sufficient, and could be useful for other PMU staff. A number of institutions in Jordan could provide such training. Training Budget A budget cost of 5,000 JOD should cover the preparation and delivery of training to a small group of people. An annual budget of this amount would allow for follow up training, or training of new staff. B. Water Quality Monitoring At this stage, it is assumed that GAM has the ability to sample and analyse groundwater and leachate. No analysis of GAM’s capacity for this has been made, or training needs. However, it may be prudent to allow a budget for training in best practice sampling and analysis techniques. Service providers exist in Jordan who could provide this training. A budget of 5,000 JOD could be allocated, with an option for annual repetition or follow up training.
9.4 Training
As noted above, an annual budget of 10,000 JOD should be set aside to allow for training in; i) Environmental monitoring, ii) Contract supervision iii) Water quality sampling & analysis These institutional recommendations are summarized in Table 9.1 below.
E1895 vol. 3 rev.

ECO Consult
Municipal SWM & Carbon Finance 123
Activities/Tasks Objectives Target Group Cost Estimate Responsibility
Recruitment Actions
Recruit Environmental Specialist for PMU on a part time basis ( 6 monts/year)
build capacity of PMU for monitoring of environmental performance of contract and GAM
PMU $ 100,000 (JD 70,000) GAM
Training Actions
Two training workshops per year in environmental monitoring and contract supervision of environmental performance
Develop capacity for monitoring contractor and GAM performance of EMP measures.
environmental specialist (PMU) , PMU staff, GAM operators in landfills and in transfer stations
$ 35,000 ( JD 25,000) GAM
Training in water quality sampling & analysis
Confirm and strengthen technical capacity to sample and analyze water, to appropriate standards
GAM – water quality labs $ 35,000 (JD 25,000) GAM
Table 9.1: ESMP-Institutional Strengthening Summary
E1895 vol. 3 rev.

ECO Consult
Municipal SWM & Carbon Finance 124
10. ENVIRONMENTAL MITIGATION PLAN
10.1 Institutional Responsibilities of Parties Involved
Effective SWM in Amman requires clear and specific definition of each institution responsible in the process (operation activities, supervision, enforcement, inspection, financing, reporting and staff training, among others). In order to support and ensure the implementation and compliance of the project components and the mitigation and monitoring measures in the most effective and environmental way, it is necessary to define the different entities responsible for SW management and identify the specific role each of them is responsible for. The following is a more detailed description of each of the parties identified, based on the project description documents. Health and Environment Department from GAM (GAM): This Department should be responsible of operating the collection services, transfer stations and landfill activities except for Those related to LFG-Energy operations. Ths department will oversee with the PMU the implementation of the ESMP Design, Build & Operate Contractor – LFG-Energy Plant (DBO-LFG): The design, supply, installation, commissioning and initial operation of the LFG network with flaring, a drainage system for Cells 1, 2 & 3, and the LFG to Energy Plant should be carried out by the private sector This contractor will be responsible to implement the EMP of the LFG in accrodacne woth the DBO contract.
• Project Management Unit (PMU): A PMU will be created as part of this project. The PMU should be responsible for day-to-day management of the project. The PMU should be the counterpart of the WB for all technical, fiduciary and environmental matters. The PMU should be responsible for the overall supervision of the project vis-à-vis the WB; ensuring the necessary compliance with the IBRD loan agreement and the ERPA; supervising technical assistance and coordinating with the various GAM departments the implementation for all SWM activities. The PMU staff will consist of a full-time project director and various SW specialists in institutional, technical, and environment matters. Environmental Specialist in the PMU : A Part Time Environment Specialist will be responsible for the environment aspects of the project. He/she will responsible for monitoring monitor and providing progress on the implementation of the environment and social management plan (EMP) included in the environment impact assessment report of the project.
10.2 Environmental and Social Management Plan (ESMP)
The Environmental Management Plan is a summary of the steps required to implement the recommendations in this ESIA, and includes institutional recommendations, mitigation measures and monitoring requirements. Some measures have been fully discussed in Section 8 (mitigation and monitoring actions), and Section 9 (institutional recommendations). Tables 10.1 and 10.2 correspond to the ESMP. Table 10.3 below is again, the tabulated summary of the recommended actions for institutional strengthening.
E1895 vol. 3 rev.

ECO Consult
Municipal SWM & Carbon Finance 125
The ESMP for this project is therefore in 3 sections, i) mitigation plan, ii) monitoring plan and iii) institutional and capacity building, The mitigation and monitoring measures have been defined specifically for the construction and the operational phases of the project. There are therefore separate Construction EMP and Operations EMP tables.
E1895 vol. 3 rev.

ECO Consult
Municipal SWM & Carbon Finance 126
Mitigation Measures Plan: Construction
A. Mitigation plan during construction and operation
Resource Impact Description Mitigation Actions Costs Responsible
Party Legal Requirements Applying to
Mitigations Environmental Impact Assessment Regulation No.37, 2005
Transfer Stations
-Apply selection criteria for the selection of the sites , and conduct consultation with stakeholders - Conduct a full EIA Study once specific sites have been identified and agreed upon with local community The main impacts to be assessed during the EIA process are similar to the impacts for the construction of El Ghabawi landfill and included below.
US$ 50,000
Will be included
within the project budget
GAM Environment Protection Law No. 52, 2006
Solid Waste Management Regulation No. 27,2005. Municipalities Law No.29,1955. Environment Protection Law No. 52, 2006. Traffic
Increasing traffic loads on approach roads
Control of traffic in collaboration with the Traffic Department and the Municipalities
Will be included in
the civil work contract
GAM, contractor and Traffic Department
Supplies and Works Regulation for Municipalities and Village Councils No. 55, 1989, and Supplies and Works Regulation for the Municipality of Greater Amman, No.12, 1988. Solid Waste Management Regulation No.27 of the year 2005
Dust control measures such as watering and paving ) will be applied where deemed necessary by GAM
Will be included
within the civil work
contract and DBO contract
(LFG)
JS 1140, 2006 Air Quality – Ambient Air Quality Standards
Ghabawi Landfill:
(Construction of Cell 3 Leachate Treatment Plant
Upgrade and LFG)
Air Quality Increase of dust and particle emissions during construction
Contractor
Environment Protection Law No. 52, 2006
E1895 vol. 3 rev.

ECO Consult
Municipal SWM & Carbon Finance 127
Resource Impact Description Mitigation Actions Costs Responsible
Party Legal Requirements Applying to
Mitigations Environment Protection Law No. 52, 2006
Transport vehicles to be covered until reaching the cell under construction. Vehicles to be properly maintained.
Will be included
within the civil work
contract and DBO
contractor (LFG)
Contractor Section 4.10.3 Lifting-Tilting of the Loaded Container, JS 12105/1999, Containers – Mobile Waste Containers-Part 5: Performance Requirements &Methods
Reduction and Prevention of Noise 2003
Noise
Increase of noise levels due to construction activities and traffic
Noise levels should not exceed 75 dBA during the day and 65 dBA during the night.
Will be included in
the civil work contract
Contractor Environment Protection Law No.52, 2006 Labour Law and its amendments No. 8, 1996, Chapter 9.
Health & Safety
General construction –related Health and Safety risks for workers
Provide workers with protection equipment and clothing (eye shields, globes, ear noise suppressors, etc). -Develop Heallh and Safety Plan for workers
Will be included
within the civil work
contract and DBO
contractor (LFG)
Contractor The Protection and Safety from Industrial Tools, Machines and Work Sites Regulation No. 43 1998
Surface water management
Ensure proper drainage of rain water and Minimise the amount of soil and sediment entrained in run-off
-Water courses must be maintained clear of obstructions, debris and siltation -Employ silt traps and barriers to prevent the transfer of soil and sediment into the surface water management system for the Site
Will be included in civil work contract and DBO contractor (LFG)
Contractor Environment Protection law No 52.
E1895 vol. 3 rev.

ECO Consult
Municipal SWM & Carbon Finance 128
Mitigation Measures Plan: Operation
Resource Impact Description Mitigation Actions Costs Respon
sible Party
Legal Requirements Applying to Mitigations
Environment Protection Law No. 52, 2006, article 19,12
Transfer Stations
Operation
An Environment and Social management Plan will be developed as part of the EIA of the two transfer stations . Generic impacts will be similar to those of the El Gabawi mitigations impacts described below Management .
Will be included within the project
budget GAM
Environmental Impact Assessment Regulation No.37, 2005
Increase of LFG and GHG emissions from Cells 2 & 3 operations before LFG to Energy Plant is operational
Proper application of cover material (soil) at the close of each day
Included in GAM operations
costs GAM The Environment Protection Law No. 52, 2006,
article 19.
Increase of dust and emissions from plant and trucks
Dust control measures to be applied where deemed necessary by GAM (could include paving or watering of internal roads)
Included in GAM contract GAM
Odour emissions from SW disposal operations at the operating cell
Proper application of cover material (soil) at the close of each day
Included in GAM operations
costs GAM
JS 1140/2006 Pollutants – Ambient Air Quality Standards.
Air Quality
Odours during handling and treatment of leachate at the Leachate treatment Plant
The collection system and the lining of the treatment ponds should be correctly installed
Will be included within the civil work contract
GAM The Environment Protection Law No. 52, 2006, article 19
The Environment Protection Law No. 52, 2006. Proper leachate pumping should be applied to minimize contamination
Use available staff (No
additional cost) GAM
Soil Protection Regulation No. 25, 2005.
The Groundwater Control Regulation No. 85, 2002, Issued pursuant to articles 6 and 32 for Water Authority Law No.18, 1988.
Operation of Ghabawi
Landfill and Leachate
Treatment Plan and LFG
Soil & Groundwater
Potential contamination of soil, sub-soil & groundwater from leachate leakage
Waste should be removed from the borders of Cell 1 to Cell 2 to reduce the risk of uncontrolled leachate generation
Use available staff (No
additional cost) GAM
The Soil Protection Regulation No. 25, 2005, article 3.
E1895 vol. 3 rev.

ECO Consult
Municipal SWM & Carbon Finance 129
Resource Impact Description Mitigation Actions Costs Respon
sible Party
Legal Requirements Applying to Mitigations
Monitor the head of leachate in the cell - not to exceed 1 ft in accordance with international specifications
Use available staff (No
additional cost) GAM
The Groundwater Control Regulation No. 85, 2002, Issued pursuant to articles 6 and 32 for Water Authority Law No.18, 1988.
The Soil Protection Regulation No. 25, 2005, article 3. Implement groundwater monitoring
program – see below GAM will
assume the costs GAM Solid Waste Management No. 27, 2005
The Groundwater Control Regulation No. 85, 2002, Issued pursuant to articles 6 and 32 for Water Authority Law No.18, 1988.
Contamination of soil & sub-soil from undetected liner leakage
The cells lining and the collection system should be correctly installed in Cell 3 to avoid potential leachate infiltration in the soil and sub-soil layers
Will be included within the civil work contract
Civil work
contract The Soil Protection Regulation No. 25, 2005, article 3.
Surface water pollution from leachate overflow
Definition of a storm water management system for Cells 1, 2 & 3 is required to collect and treat the water run off and specification of the slope for future cells
GAM will assume the costs, included in the
civil work contract of cell #
3
GAM The Environment Protection Law No. 52, 2006, article 11
H&S impacts on landfill workers from direct contact with SW and potential fires
Development of a H&S Plan establishing disposal procedures as well as including requirements of the applicable Labor Law No.8, 1996
Use available staff (No
additional cost) GAM Jordanian Labor Law No. 8, 1996, and its
amendments Health &
Safety Risk of nuisance or disease from vectors (concern raised by stakeholders)
Proper application of cover material (soil) at the close of each day
Already implemented (No additional costs)
GAM
Water Quality
Potential contamination of ground and surface water during operations Discharge of treated leachate
Implement monthly monitoring program of perimeter wells and surface effluents Must meet Jordanian effluent discharge standards of
GAM will assume costs
GAM, MOE
E1895 vol. 3 rev.

ECO Consult
Municipal SWM & Carbon Finance 130
Resource Impact Description Mitigation Actions Costs Respon
sible Party
Legal Requirements Applying to Mitigations
Flaring Gas Monitor the levels of gases and their potential explosiveness
Install gas monitoring wells at conventional spacing and/or in sensitive locations, as dictated by international standards for monitoring the potential migration of landfill gases from the New Facility
Part of the DBO contract ( LFG)
Contractor
Information Dissemination
Community Liaison and Public Information Program
Develop the Community Liaison and Public Information Program
US$ 200,000 for 5 years . Included
as part of the technical
component of the project
GAM
Table 10.1: ESMP-Mitigation Plan during Construction and Operation
E1895 vol. 3 rev.

ECO Consult
Municipal SWM & Carbon Finance 131
B. Monitoring plan during construction and operation
Responsible Party
Mitigation
Actions
Parameter to be
Monitored Location Measurements Frequency of
Measurements Review Reporti
ng
Costs
Legal Requirements Applying to Monitoring
Air Quality
Minimization of dust and particle emissions during construction
Dust (particulate matter)
At and around new transfer station sites
Measurements of dust (PM10) at 4 locations to be selected just outside borders of site
Weekly during excavation or
erection of buildings
GAM PMU $ 18,000 (JD12800)
JS 1140, 2006, Air Quality – Ambient Air Quality standards
New transfer stations
surroundings
Measurements of noise at 3 locations to be selected just outside borders of site
Weekly during excavation or
erection of buildings
$21,000 (JD 14,400)
Cell under construction at
Ghabawi Leachate
Treatment Plant
Construction
Noise
The noise levels during construction should not exceed 75 dBA during the day and 65 dBA at night
Decibels (dB)
LFG to Energy Plant
Measurements of noise at 3 locations at landfill site boundary
Weekly during construction
works.
GAM PMU
$ 31000 (JD 21,600)
The Instruction for the Reduction and Prevention of Noise, 2003
New transfer stations
surroundings
Noise measurements to be made only if complaints received, or if noise levels suspected to be excessive. Locations to be determined.
Cell under construction at
Ghabawi Leachate
Treatment Plant
Operation Noise
The noise levels during operation should not exceed 75 dBA during the day and 65 dBA at night
Decibels (dB)
LFG to Energy Plant
Noise measurements to be made only if complaints received, or if noise levels suspected to be excessive. Locations to be determined depending on source of noise.
Weekly GAM PMU -
The Instruction for the Reduction and Prevention of Noise, 2003
Groundwater Quality
Minimize potential infiltration of uncontrolled
pH Alkalinity Total Chlorides
1 well upstream and 1 well
downstream at the landfill site
Groundwater samples will be collected and parameters will be measured
Monthly GAM PMU GAM will
assume the costs
The Groundwater Control Regulation No.
E1895 vol. 3 rev.

ECO Consult
Municipal SWM & Carbon Finance 132
Responsible Party
Mitigation
Actions
Parameter to be
Monitored Location Measurements Frequency of
Measurements Review Reporti
ng
Costs
Legal Requirements Applying to Monitoring
leachate into the groundwater
BOD COD Metals
85, 2002, Issued Pursuant to articles 6 and 32 for Water Authority Law No. 18 1988.
Treated Leachate effluent Quality
Leachate generated at the cells will be collected and treated
pH Alkalinity BOD COD Temperature Oil and grease Total chlorides Total Suspended Solids Metals
At point of discharge at the
Leachate Treatment Plant
Samples of treated leachate will be collected and parameters will be measured
Weekly GAM PMU GAM will
assume the costs
The Environment Protection Law No. 52, 2006
Community Liaison
Develop the Community Liaison and Public Information Program
Complaint Center GAM Review complaints for waste
management services Semi annually GAM PMU GAM will
assume the costs
Table 10.2: ESMP-Monitoring Plan during Construction and Operation
E1895 vol. 3 rev.

ECO Consult
Municipal SWM & Carbon Finance 133
C. Institutional Strengthening
Activities/Tasks Objectives Target Group Cost Estimate Responsibility
Recruitment Actions
Recruit Environmental Specialist for PMU on a part time basis ( 6 monts/year)
build capacity of PMU for monitoring of environmental performance of contract and GAM
PMU $ 100,000 (JD 70,000) GAM
Training Actions
Two training workshops per year in environmental monitoring and contract supervision of environmental performance
Develop capacity for monitoring contractor and GAM performance of EMP measures.
environmental specialist (PMU) , PMU staff, GAM operators in landfills and in transfer stations
$ 35,000 ( JD 25,000) GAM
Training in water quality sampling & analysis
Confirm and strengthen technical capacity to sample and analyze water, to appropriate standards
GAM – water quality labs $ 35,000 (JD 25,000) GAM
Table 10.1: ESMP-Institutional Strengthening Summary
E1895 vol. 3 rev.

ECO Consult
Municipal SWM & Carbon Finance 134
References: The following reports and documents were referred in the preparation of this ESIS.
• Terms of Reference for Municipal SWM & Carbon Finance in Amman, WB, August 2007. • Final Scoping Report/TOR for Municipal SWM & Carbon Finance in Amman, ECO
Consult, March 2008. • Municipality of Greater Amman, SWM Plan, CM, May 2006.
• Definition and Design of the Priority Project, Feasibility Study, CM, January 2001.
• Municipality of Greater Amman, Ghabawi Landfill For Non – Hazardous SW, CM,
December 2006.
• Feasibility Study of the Municipal SWM and Carbon Finance Project in GAM, CM, 2007-08.
• Clean Development Mechanism Project Design Document Form (CDM-PDD),
Municipality of Greater Amman -WB, July 2006.
• Draft Aide Mémoire, Amman SWM and Carbon Finance Project Preparation Mission, WB, March 2008.
• World Bank Operational Policies OP 4.01.
E1895 vol. 3 rev.

AL GHABAWI LANDFILL
AIR QUALITY MONITORING REPORT
Amman, Jordan
6th – 7st, February 2008
Prepared for Eco Consult, Amman, Jordan
February 24th, 2008
By
Dr. Atallah Z. Rabi
Associate Professor,
(Air Pollution and Industrial Hygiene)
Department of Community Medicine
Faculty of Medicine
Jordan University of Science and Technology
Irbid
JORDAN
E1895 vol. 3 rev.

AL GHABAWI AIR QUALITY MONITORING REPORT
Introduction
Bacterial activity causes the wastes in landfills to decompose over time. As these wastes decompose, gas is produced. The amount of gas created varies and depends on factors such as: the amount and type of waste; moisture content of the landfill; amount of oxygen present; landfill size and characteristics; and temperature. Also, certain chemical reactions and the evaporation of some chemicals produce landfill gas. Most landfill gas is created within a few years after waste is dumped, when the rate of decomposition is highest. Almost all gas is produced within 20 years after waste is dumped.
Gas is created under the landfill surface and generally moves away from the landfill, either by rising up through the landfill surface or migrating underground to surrounding areas. Three factors influence where gas goes:
1. Permeability. Gas flows through areas of least resistance. If one side of the landfill is very permeable, then gas will likely leave the landfill from that area. Artificial channels such as drains and trenches can act as pipelines for gas movement.
2. Diffusion. Gas moves to areas with lower gas concentrations. Gas concentrations are generally lower in areas surrounding the landfill.
3. Pressure. Gas moves to areas of lower pressure. This means that the pressure of the surrounding areas (e. g., changing weather conditions) will affect gas movement from the landfill.
Gas that is released into the air is carried by wind. While wind dilutes the gas with fresh air, it can also move gas into neighboring communities. Wind speed and direction determine how much gas reaches nearby residents, so the degree of the problem varies greatly from day to day. At locations near the landfill, the worst time of the day is often early morning because winds tend to be gentle, providing the least dilution of the gas
Objectives
The general objectives of the air quality monitoring are:
• To assess the ambient air concentrations of selected air pollutants in the immediate vicinity of Al Ghabawi (Amman Municipal Solid Waste Disposal Site).
• To determine if the Jordanian ambient air quality standards (JS 1140/2006) were violated or exceeded at Al Ghabawi site.
• To monitoring gas emissions from Al Ghabawi Landfill Site. • To establish baseline data about the ambient air quality and gas emissions from Al
Ghabawi Landfill Site at the time of emission monitoring.
To accomplish these objectives, the air monitoring focused on the gases known to be emitted from landfill with particular attention to compounds associated with bacterial decomposition,
E1895 vol. 3 rev.

volatilization, and chemical reactions occurring in Al Ghabawi Landfill solid waste disposal site. The ambient air quality indicators were monitored as well. A combination of real-time monitoring, direct reading precalibrated equipment and discrete air sampling equipment was used to quantify the following:
Air Sampling Protocol:
A three-member team with strong prior experience in the environmental situation in Jordan carried out this ambient air sampling and measuring activity. The team was lead by Dr. Atallah Rabi, Air Pollution and Industrial hygiene consultant, Mr. Ibrahim Ababneh and Issa Shawagfeh specialists in Air quality sampling, monitoring and analysis.
Preparation for the air sampling and analysis
The team leader, along with EcoConsult personnel made a preliminary visit to Al Ghabawi Landfill site and met with the site concerned personnel and made a tour of the site. During the site visit, five air sampling sites were identified and Al Ghabawi Landfill authority promised to provide the required logistic support for the sampling procedures.
Air sampling and monitoring period
Based on the results of Al Ghabawi site visit and consultations with Eco consult staff it was decided that the air monitoring and sampling period will last for 2 full days (6 – 7 February, 2008). The air quality survey started at 9:00 am Wednesday, 6 February, 2008 and finished at 9:00 am Friday, 8th February, 2008. Therefore the total period of air sampling lasted for 48 hours.
Quality control
Air monitoring calibration laboratory (AQCL)
The JUST Air Quality Calibration Laboratory (AQCL) has an important goal to verify the performance of all air monitoring equipment, using continuous monitoring, whether they are monitors or samplers for any air monitoring program.
Monitors:
The Air Quality Calibration Laboratory (AQCL) in JUST performed the calibration for the air sampling and monitoring equipment according to standard procedure The calibration of the air monitoring devises was performed by multipoint in the calibration laboratory of the AQCL. .The calibration was carried out for CO, SO2, NOx, NH3, H2S, CH4, and VOCs,
E1895 vol. 3 rev.

monitors by bringing a standard gas and having the monitor record the concentration. The concentration is compared with the known concentration of the gas standard.
Samplers:
The quality control of air samplers consists of:
1. Annual calibration of the flow meters used by the AQCL against a traceable wet gas meter.
2. In case of malfunction of a sampler or a flow meter, the AQCL may perform additional calibration
3. Check of the flow through the samplers. This is performed before and after each air sampling process in the field.
4. Filters used for dust collections are weighed before and after air sapling. 5. Flow rates of air sampling pumps were calibrated against primary standard (Wet Test
Meter). 6. Air sampling duration are recorded for each sampling period and point.
Air monitoring and sampling sites:
It was decided that five sites will be used for Al Ghabawi air monitoring and sampling. The location of these sites was determined onsite after consulting with EcoConsult staff. Location of the sites was dictated by:
• Availability of power sources needed for some of monitoring and sampling equipment. • Wind direction • Security of monitoring and sampling equipment • Monitored sites (Cells 1 and 2, Leachate aerations pond) • The administration building was used as a reference point.
The following table shows the location of the sites, air monitoring and sampling dates and average sampling period.
Site number
Site location Number of days
Frequency of sampling
Average sampling
period
1 West of Administration Office
(Roof of front room) 2 2 3 hours*
2 Cell 1 west (1meter from
leachate collection) 2 4 2 hours
3 Cell 1 Top of dumping
location 2 4 2 hours
E1895 vol. 3 rev.

4 Middle of Cell 2 (under
construction) 2 4 3 hours*
5 East of leachate- treatment
ponds (at the edge of the pond)2 4 2 hours
*For CO, SO2, NO2 and Hydrocarbons and for the whole day (24 hours) for the Lead, TSP and PM10.
The location of the ambient air sampling and monitoring sites is shown on figure 1.
Monitored air quality criteria indicators
a. Ambient air :
Ambient air quality indicators were monitored at the administration building to be used as a reference site being located to the west south of Cell I (main source of landfill gas emissions) and the middle of Cell II which is not used yet and is free from any waste (It is under construction). Cell II is located east of the cell I.
The ambient air qualities indicators monitored at administrative building and middle of Cell II were:
• Carbon Monoxide (CO) • Sulphur Dioxide (SO2) • Nitrogen Dioxide (NO2) and/or NOx (Nitrogen oxides) • Hydrocarbons • Total Suspended Particulate matter (TSP) • Particles smaller than 10 microns in diameter (PM10), • Lead (Pb)
Methods of ambient air sampling and analysis
The Jordanian standard for the ambient air quality (JS 1140/2006) which include very strict and clear guidelines and methods that have to be followed when monitoring for air quality criteria pollutants was followed. The guidelines include specifications for sitting monitors, use of only equipment that has demonstrated the capability, repeatability, and reliability needed to collect accurate data, and operation of the equipment within established methods. A tremendous amount of effort is expended to insure that these guidelines are followed. All monitoring, sampling and analytical procedures used conform to JS 1140/2006.
The detailed methods of monitoring and sampling ambient air pollutants are:
• Carbon Monoxide (CO)
E1895 vol. 3 rev.
Carbon Monoxide is an odorless, colorless, poisonous gas that is produced by the incomplete combustion of carbon containing fuels. Monitoring for carbon monoxide was accomplished by using portable direct reading CO monitor using infrared photometry.
• Sulfur Dioxide (SO2)
Sulfur dioxide is a colorless gas that has a pungent odor at concentrations exceeding 0.5 parts-per-million. Sulfur dioxide is produced by the combustion of sulfur containing fuels, ore smelting, petroleum processing, and the manufacture of sulfuric acid. Measurement of Sulfur dioxide is accomplished by utilizing a precalibrated direct reading instrument (portable gas analyzer) that operates on the ultraviolet fluorescence method.
• Nitrogen Dioxide (NO2)
Nitrogen dioxide is a reddish brown gas that is produced during the high temperature combustion of fossil fuels. The primary sources of nitrogen dioxide are airplanes, motor vehicles, power plants, incinerators, industrial boilers and some chemical processes. Monitoring of Nitrogen dioxide was accomplished by using direct reading instruments that utilize the principle of photometric detection of a chemiluminescence reaction that occurs when nitric oxide is mixed with ozone.
• Hydrocarbons
The air concentration of hydrocarbon compounds were determined by using air sampling pumps, pre-calibrated for air flow rate, to collect sample in air sampling tubes containing sorbent activated charcoal. The activated charcoal was analyzed for Hydrocarbons by using thermal desorption gas chromatography, mass spectrometry. Detailed description of the sampling and analysis method is available in National Institute of Occupational Safety and Health (NIOSH) METHOD 2549, Issue 1 dated 15 May 1996- NIOSH Manual of Analytical Methods 4th ed. (40).
• Particulate Matter
• Total Suspend Particulates (TSP) Total suspended particulates (TSP) were measured by using high volume air samplers. With predetermined air flow rate. An air sample was drawn through a pre-weighted filter that traps the particles .The total duration of sampling time (24 hours) is recorded. The air volume that passed through the filter paper is calculated using flow rate and sampling duration. The filter is weighed before and after the sample run. The gain in filter weight in relation to the volume of air sampled is calculated in micrograms per cubic meter (µg/m3).
E1895 vol. 3 rev.
• Particulate Matter 10 microns in size (PM10)
The same procedure of sampling TSP was followed except that, during sampling, ambient air passes through an inlet designed to pass only particles smaller than 10 microns in diameter. The difference between the current filter weight and the initial or installed weight gives the total mass of the collected particulate. The mass concentration is computed by dividing the total mass by the flow rate.
• Lead
Monitoring was accomplished by using a high volume air sampler that draws air through a pre weighted filter. Particulate samples are ashed to remove organic matter and acid extracted to dissolve the metals. Analysis of the lead content is determined by using atomic absorption spectrophotometer with an air-acetylene burner head and background correction and Lead hollow cathode lamp or electrode dischargeless lamp.
b. Al Ghabawi Landfill Gas emissions
Landfill gas is composed of a mixture of hundreds of different gases. By volume, landfill gas typically contains 45% to 60% methane and 40% to 60% carbon dioxide. Landfill gas also includes small amounts of nitrogen, oxygen, ammonia, sulfides, hydrogen, carbon monoxide, and nonmethane organic compounds (NMOCs) such as trichloroethylene and benzene. Landfill gas is normally produced by three processes which are: bacterial decomposition, volatilization, and chemical reactions. The rate and volume of landfill gas produced at a specific site depend on the characteristics of the waste (e.g., composition and age of the refuse) and a number of environmental factors (e.g., the presence of oxygen in the landfill, moisture content, and temperature). Once gases are produced under the landfill surface, they generally move away from the landfill. Gases tend to expand and fill the available space, so that they move, or "migrate," through the limited pore spaces within the refuse and soils covering of the landfill. The natural tendency of landfill gases that are lighter than air, such as methane, is to move upward, usually through the landfill surface. Upward movement of landfill gas can be inhibited by densely compacted waste or landfill soil cover material. When upward movement is inhibited, the gas tends to migrate horizontally to other areas within the landfill or to areas outside the landfill, where it can resume its upward path. Basically, the gases follow the path of least resistance. Some gases, such as carbon dioxide, are denser than air and will collect in subsurface areas. Three main factors influence the migration of landfill gases: diffusion (concentration), pressure, and permeability. Monitoring of gases that emanate from landfills falls into the following five categories:
1. Soil gas monitoring (measure the concentrations of chemicals in the vapor space of soils. Measurements of soil gas levels are taken at depth with the use of probes or wells.)
E1895 vol. 3 rev.

2. Near surface gas monitoring (Measures the concentrations of gases at a point no higher than 4 inches above the ground surface.)
3. Emissions monitoring (measure the rate at which chemicals are released from a particular source, such as landfill surfaces, or stacks
Landfill gas emissions were monitored at three predetermined sites: (1) west of Cell 1 (1 meter from leachate collection), (2) Cell 1 (Top of dumping location) and (3) east of leachate- treatment ponds (at the edge of the pond). The site selection were determined based on possible maximum gas emissions, accessibility, and power availability.
The gases monitored were:
• Methane (CH4) • Carbon dioxide (CO2) • Ammonia NH3) • Sulfides (Hydrogen sulfide H2S) • Volatile Organic Compounds (VOCs).
Methods of gas emissions sampling and analysis
Based on the existing condition of the landfill, the near surface monitoring system was used to determine the concentration of landfill gases (methane, VOCs, hydrogen sulfide and ammonia). Portable air sampling battery operated pumps (Gillian 513 type) were used to sample emitted gases. The pumps were calibrated in JUST air lab for a known flow rate of 0.5 l/min. Each pump was fitted with a gas solid sorbent (silica gel) tube. The sorbent tube was fixed within 2 to 3 inches of the ground surface. The sorbent tube was changed every 40 minutes. Three sorbent tubes were used in every sampling site. The samples are taken to a laboratory for analysis.
Summery of sampling landfill gases are described bellow:
Methane and Carbon Dioxide: Grab sampling was used for the collection of landfill gas concentrations, thus providing a "snap-shot" of landfill gas composition at a given place and time. Grab sampling was conducted during two regular equal intervals (for 2 hours) at two different times for (See table 1) for evaluating changes in landfill gas composition over the sampling and monitoring term. Samples were collected in air sampling tubes containing sorbent activated charcoal. The activated charcoal was analyzed for Methane and CO2 by using thermal desorption gas chromatography. Volatile Organic Compounds (VOCs)
The air concentration of volatile organic compounds were determined by using air sampling pumps, pre-calibrated for air flow rate, to collect sample in air sampling tubes containing sorbent activated charcoal. The activated charcoal was analyzed for VOCs by using thermal desorption gas chromatography, mass spectrometry. Detailed description of the sampling and analysis method is available in National Institute of Occupational
E1895 vol. 3 rev.

Safety and Health (NIOSH) METHOD 2549, Issue 1 dated 15 May 1996- NIOSH Manual of Analytical Methods 4th ed. (40).
Ammonia
A known volume of air is drawn through a glass midget bubbler containing approximately 10 ml of 0.1 N H2SO4. The bubbler is attached to a personal air sampling pump that has been calibrated for a flow rate of 1 liter per minute. The sampling pump with the bubbler attached is placed within 2 to 3 inches of the ground surface and about 120 liters of air is drawn through the bubbler (2 hour sampling). Concentration of ammonia was determined in the lab by using ammonia ion specific electrode – (Orion model 95-10)
Analysis of samples
Collected samples were labeled and sent to JUST laboratory for analysis. Laboratory analysis generates highly accurate and precise results and measure the concentrations of many different gases emitted (CH4, CO2, NH3, H2S and VOCs). USEPA recommended methods for landfill gas emission measurement were applied. (Code of Federal Regulations, at 40 CFR Part 60 Method 21)
The Landfill Gas Operation and Maintenance Manual of Practice published in 1997 by the Solid Waste Association of North America (SWANA) provides detailed explanation of landfill gas monitoring and instrumentation.
E1895 vol. 3 rev.

RESULTS a. Ambient air Quality Average concentration of ambient air quality criteria pollutants in parts per million by volume (ppmv) for gaseous parameters and mg per cubic meter (mg/m3) for lead and particulate matters in the two monitoring sites are summarized bellow:
Pollutant Concentration (ppm) at monitoring sites
Ambient Air Quality parameters sampled
Sampling day.
Sampling period.
AL Ghabawi Landfill
Administration building
Cell 2 (Under construction)
Carbon Monoxide Day 1 9:00-12:00 0.04 12:00-3:00 0.02 3:30-6:30 0.03 Day 2 8:30-11:30 0.00 11:30-2:30 0.03 3:00-6:00 0.01 Mean Concentration 0.04 0.01 Sulfur dioxide Day 1 9:00-12:00 0.05 12:00-3:00 0.02 3:30-6:30 0.01 Day 2 8:30-11:30 0.01 11:30-2:30 0.06 3:00-6:00 0.01 Mean Concentration 0.05 0.02 Nitrogen oxides Day 1 9:00-12:00 0.01 12:00-3:00 0.00 3:30-6:30 0.00 Day 2 8:30-11:30 0.00 11:30-2:30 0.01 3:00-6:00 0.00 Mean Concentration 0.01 0.00 Hydrocarbons Day 1 9:00-12:00 0.00 12:00-3:00 0.00 3:30-6:30 0.00 Day 2 8:30-11:30 0.00 11:30-2:30 0.00 3:00-6:00 0.00 Mean Concentration 0.00 0.00 Lead (mg/m3) Day 1 0.00 0.00 Day 2 0,01
E1895 vol. 3 rev.

Mean Concentration 0.00 0.00 TSP (mg/m3) Day 1 134.8 112.9 Day 2 129.6 124.7 Mean Concentration 132.2 118,8 PM10 (mg/m3) Day 1 67.2 53.3 Day 2 78.3 62.2 Mean Concentration 72.8 57.8
Notes:
1. CO, SO2, NO2, and Hydrocarbons were monitored for 3 hours for two days during 2 different periods in the administration building.
2. CO, SO2, NO2, and Hydrocarbons were monitored for 3 hours twice a day, during 2 different periods, for two days in “Cell 2 under construction”.
3. TSP, PM10 and Lead concentrations were measured for 24 hour duration starting at 8:30 am and finishing at 8:30 am the next day for location “Administration building”
4. TSP, PM10 and Lead concentrations were measured for 24 hour duration starting at 9:00 am and finishing at 9:00 am the next day for location “Cell 2 under construction”
5. No exceeding to the Jordanian Standards. 6. Since there is no significant variation in the concentrations of ambient air quality
parameters measured at different times for 2 consecutive days at periods where concentrations are expected to be at the peak because of the site activities, it was decided that there is no need for more measurements.
b. Al Ghabawi Landfill Gas Average concentration of Al Ghabawi landfill sampled gases in parts per million by volume (ppmv) in the three monitored sites are summarized bellow: Average concentration of Al Ghabawi landfill sampled gases in parts per million by volume (ppmv) in the three monitored sites are summarized bellow:
Pollutant Concentration (ppm) at monitored sites Al Ghabawi
Landfill sampled Gas
Sampling day.
Sampling period.
Cell 1 west (1 meter from
leachate collection)
East of leachate-
treatment ponds (at the edge of
the pond)
Cell 1 Top of dumping location
Methane (CH4) Day 1 9:30-11:30 49.8 24.2 12:30-14:30 16.1 3:00-5:00 55.0 30.8 6:30-8:30 11.9 Day 2 9:00-11:00 5.7 12:00-14:0 91.2 23.3
E1895 vol. 3 rev.

3:00-5:00 8.3 6:30-8:30 92.8 20.9 Mean Concentration 72.2 24.4 9.8 Carbon dioxide (CO2) Day 1 9:30-11:30 180 224.7 12:30-14:30 131.2 3:00-5:00 176 221.3 6:30-8:30 126.8 Day 2 9:00-11:00 181.0 12:00-14:0 182.6 233.0 3:00-5:00 189.0 6:30-8:30 189.4 243.0 Mean Concentration 182.0 230.5 157.0 Ammonia (NH3) Day 1 9:30-11:30 5.2 0.7 12:30-14:30 0.40 3:00-5:00 6.0 0.7 6:30-8:30 0.42 Day 2 9:00-11:00 0.44 12:00-14:0 7.6 1.1 3:00-5:00 0.42 6:30-8:30 7.2 1.3 Mean Concentration 6.5 0.95 0.42 Hydrogen sulfide (H2S) Day 1 9:30-11:30 4.7 2.1 12:30-14:30 0.2 3:00-5:00 4.3 1.9 6:30-8:30 0.2 Day 2 9:00-11:00 0.10 12:00-14:0 4.6 2.7 3:00-5:00 0.10 9:30-11:30 4.8 2.5 Mean Concentration 4.6 2.3 0.15 Volatile organic compounds (VOCs) Day 1 9:30-11:30 12.0 11.9 12:30-14:30 3.6 3:00-5:00 11.4 12.5 6:30-8:30 3,8 Day 2 9:00-11:00 4.0 12:00-14:0 13.0 8.9 3:00-5:00 4.4 9:30-11:30 13.4 9.1 Mean Concentration 12.5 10.6 4.0
E1895 vol. 3 rev.

Notes: 1. There are no set standards for the gases emitted from the land fill in Jordan. 2. The concentrations reported in the results are far less than the landfill expected ranges of
concentration of these gases because the ranges of concentrations are for gases emitted from landfills completely covered by soil and for soil sampling.
3. Al Ghabawi Cell I is not fully covered by compacted soil, therefore gases are emitted from every where and the dilution is great especially at the prevailing wind speed at the time surface sampling.
4. Gases are not escaping from cracks in the land fill; the land fill is an open dumping place where most of the waste is not fully covered. The emitted gases are released in the open air.
5. Since near surface sampling method for landfill emitted gases were used, high dilution of emitted gases is expected, leading to concentration much lower than expected especially for methane and
6. Gas monitoring will be better in Cell II if the waste disposal is managed in a sanitary way.
Jordan Ambient Air Quality Standards (JAQS JS 1140/2006)
Units
Pollutant Averaging
time Parts per million (ppm)
Microgram/cubic meter (ug/m3)
Carbon Monoxide 8-hour 9 10,000 Carbon Monoxide 3-hour 26 30,000 Sulfur Dioxide 24-hour 0.14 365 Sulfur Dioxide Annual 0.03 80 Sulfur Dioxide 3-hour 0.50 1300 Nitrogen Dioxide Annual 0.05 100 Nitrogen Dioxide 1 hour 0.17 320 Hydrocarbons NA* Lead Calendar Qrt, 1.5 TSP 24-hour 260 PM10 24-hour 120 PM10 Annual 50
E1895 vol. 3 rev.

The following table lists monitored landfill gases, their percent by volume, and their characteristics.
Component Percent by Volume* Characteristics
Methane 45 - 60 Methane is a naturally occurring gas. It is colorless and odorless.
Carbon Dioxide
40 - 60 Carbon dioxide is naturally found at small concentrations in the atmosphere (0.03%). It is colorless, odorless, and slightly acidic
Ammonia 0.1 – 1.0 Ammonia is a colorless gas with a pungent odor.
VOCs 0.01 – 0.6 VOCs are a mixture of organic vapors usually found in landfills includes benzene, toluene, dichloromethane, carbonyl sulfide, ethyl-benzene, hexane, trichloroethylene, and vinyl chloride.
Hydrogen sulfide
0 – 1.0 Hydrogen sulfide is naturally occurring gas that gives the landfill gas mixture its rotten-egg smell. Hydrogen sulfide can cause unpleasant odors even at very low concentrations.
Source:
1. EPA. 1992. U.S. Environmental Protection Agency, Office of Air Quality Planning and Standards, Organic air emissions from waste management facilities. EPA/625/R‐92/003.
2. The Agency for Toxic Substances and Disease Registry (ATSDR), Landfill Gas Primer - An Overview for Environmental Health Professionals, atsdr.cdc.gov/HAC/landfill/html/preface.html
*Percent by volume means the volume in M3 of each gas component in 100 M3 of land fill gas 1 percent by volume = 104ppm.
E1895 vol. 3 rev.

Wind Speed and Direction –wind speed and direction were measured during the air sampling and monitoring period (6 -7 February, 2008).
Meteorological Summary on Sampling Days (6 –7 February, 2008) A meteorological summary, as measured at Al Ghabawi Site of each sampling day is provided below.
Day & Date Time Location W.S. W.D.
09:00 Cell 1 west (1 meter from leachate collection) 4.3 South
Eastern
12:00 East of leachate- treatment ponds (at the edge of the pond) 3.8 South
Western
Wednesday
6/2/2008 14:00 Cell 1 Top of dumping location 7.7 South
western
09:00 AL Ghabawi Landfill Administration building 5.2 South
Eastern
12:00 Cell 2 (Under construction)
9.7 South
western
Thursday
7/2/2008 15:00
Cell 1 Top of dumping location 8.3
South western
W.S.: Wind speed in meter/second W.D.: Wind direction
• Wind Direction: The wind direction indicates the direction in which contaminants will be transported. For example, ambient air quality models use hourly averages of wind direction to determine which location will have specific concentrations. The observed wind directions during ambient air sampling may be used to designate samples as upwind, downwind, or crosswind relative to potential contaminant emissions sources.
• Wind Speed: The wind speed is a major determinant of the travel distance and travel time of the contaminant. For example, in the air quality models, concentration is inversely proportional to the wind speed. Wind speed also affects the volatilization of contaminants from a work zone and thus influences the ambient air concentrations Dr. Atallah Rabi’
E1895 vol. 3 rev.

Recommendations
Al Ghabawi Landfill currently has no air-pollution monitoring system in place. Moreover, there is no baseline for a study of air pollution at the Landfill. There is no system set up so far to study air pollution. Therefore, it is difficult to give good estimate of the environmental impact of the landfill on the landfill area and users of the landfill services as well as the landfill employees. The current practice of municipal solid waste disposal is far from being sanitary, therefore gases are not leaking from cracks in the cover soil but they continuously released from all over the place.
The Ministry of Environment should sponsor a study to determine sources, types and amounts or volumes of air pollutants especially methane generated annually at the landfill. Such study will also show how seriously the landfill is applying the sanitary normal standards of solid waste disposal and affecting the quality of the air we breathe.
The results of the current measurements indicate that the level of pollutants released at present is within permissible limits of ambient air Jordanian standards (JS. 1140/2006). No exceedences were recorded. However, with the future expansion plans, the increase in the landfill capacity from one to four cells or more than doubling the current capacity along with increase of landfill activities, transportation and services. Along with that more awareness of the importance of environment protection, more stringent municipal solid waste disposal sanitary standards are expected to be adopted and implemented.
Al Ghabawi Landfill currently has no air-pollution monitoring system in place. Therefore, a new air quality monitoring program should be designed, and implemented as soon as possible. A summary of air quality is proposed as follows:
Program objectives
There are many reasons for monitoring levels of land fill emitted gas at or near landfills. The main reasons that such monitoring is performed are:
• To meet regulatory requirements. • To characterize off-site fire or explosion hazards. • To quantify off-site migration of chemicals. • To determine if the Jordanian ambient air quality standards (JS 1140/2006) were violated
or exceeded at Al Ghabawi Landfill
Monitoring of Al Ghabawi Landfill Gas:
Gas emission from Al Ghabawi landfill is related to both site conditions and environmental changes, yet no gas emission data are being gathered before to describe this linkage adequately. Al Ghabawi Landfill air quality monitoring program has to be established under the MoE,
E1895 vol. 3 rev.

Amman Greater Municipality or a private contractor such as EcoConsult in order to have a view of the present and future landfill air quality. This program is expected to provide basic information about Al Ghabawi landfill gas—what it is composed of, how it is produced, and the conditions that affect its production. It also provides information about how landfill gas moves and travels away from the landfill site. Data should be collected using up to date gas monitors and sampling equipment. The results of the measurements undertaken during the planning of the program have to be evaluated by air quality control consultant and considered for the use in the program..
The monitoring will focus on the air pollutants known to be emitted by landfill, with particular attention to compounds associated with solid waste disposal operations. The monitored pollutants should include: Methane, carbon dioxide, ammonia, sulfides, and non methane organic compounds. Air pollutants covered by the Jordanian ambient air quality standards (JS 1140/2006) and its future amendments may be monitored as well. The design of the Al Ghabawi air quality monitoring program should be based on the air quality indicators mentioned above and should include:
• Data collectors, samplers, sensors and monitors. • Data transfer systems and data quality assurance/control procedures. • Databases.
Jordan University of Science and Technology or other Jordanian Universities or research centers may be consulted in the design and evaluation of the proposed program.
Al Ghabawi authority should be mainly concerned with the air that people breathe and in complying with air quality and landfill Jordanian standards. Due to these two reasons, the sampling and monitoring sites are to be carefully located, after well designed and implemented studies and according to MoE landfill specifications, if available, otherwise, according to the EPA guidelines of siting of air quality monitoring sites in Landfills. Types of monitoring It is important to remember that monitoring data taken at landfills do not necessarily reflect the levels of contamination to which people may be exposed. However, these data usually offer some insight into general air quality, landfill gas migration, or possible health hazards. In general, monitoring of gases that emanate from landfills falls into the following five categories:
• Soil gas monitoring • Near surface gas monitoring • Emissions monitoring • Ambient air monitoring • Indoor air monitoring
E1895 vol. 3 rev.

Air and gas sampling equipment:
Some gas sampling can be performed with portable monitors, which typically are hand-held instruments that can be easily carried around a landfill. This type of device is useful for conducting an initial screening of landfill gas migration pathways or for identifying the source of methane leaks. Stationary monitors, on the other hand, usually are installed at fixed locations, where they remain for the duration of the intended monitoring. Stationary monitors are typically, though not always, capable of generating higher quality data than portable monitors.
Grab sampling or continuous monitoring may be used in most types of landfill gas monitoring (e.g., soil gas, emissions, ambient air, and indoor air). By definition, grab sampling is a one-time measurement of gas concentrations, thus providing a "snap-shot" of landfill gas composition at a given place and time. This type of sampling is generally not useful for evaluating changes in landfill gas composition over the long term, unless it is conducted at regular intervals according to a detailed plan. In contrast, continuous monitoring devices constantly sample and analyze gas concentrations. Some are capable of documenting fluctuations in concentrations over short intervals, while others can measure only average concentrations. All continuous monitors, however, provide insight into changes in gas composition over the long term.
Monitors and Samplers location Although many different types of landfill gas sampling approaches exist, two important factors in selecting an appropriate landfill gas sampling approach include the sampling location and the sampling methods. The sampling location and sampling methods are usually selected according to the data uses and questions to be answered by the overall sampling program. Landfill gas monitors are typically placed in three types of locations at or near landfills; these are subsurface, surface, or enclosed space. The three types of monitoring locations address different landfill gas concerns and can be used either alone or together in a sampling program.
Analysis
Depending on the data needs, gas samples are usually either collected and sent to a laboratory for analysis or analyzed directly in the field. Laboratory analysis may take days or weeks to perform and can be expensive, but this approach generates highly accurate and precise results and can measure concentrations of many different pollutants. Alternatively, real-time monitoring (or analysis in the field) reports concentrations as soon as they are measured; in some cases, these devices can measure changes in concentration from minute to minute. Most real-time monitors, however, measure concentrations of only one pollutant and are not as sensitive as laboratory analysis.
Monitoring Frequency: Not all above mentioned indicators (Methane, carbon dioxide, ammonia, sulfides, and non methane organic compounds) are to be measured by Al Ghabawi air quality monitoring program at all sites at all times. This depends on site specification and typical dominating sources in the specific area. In some sites Methane, Carbon dioxide, and dust fall are to be measured more or less frequently than other indicators or sites. The frequency of monitoring depends on the type of
E1895 vol. 3 rev.

pollutant, amounts released, current level of concentration. The reported monitoring results should be compared with the standards to establish compliance. New measurements should be compared with previous results to see if there is any increase or decrease of air pollution so that corrective measures are taken whenever necessary. The frequency of monitoring may be reviewed annually.
Parties Responsible
By law, the Ministry of Environment (MoE) is entrusted with implementing all environment protection regulations and standards to ensure the protection of the Jordanian environment and the safety of all those living in Jordan. Therefore, MoE will be required to insure the design and implementing sanitary landfill gas emission control program. The monitoring of gas emission and ambient air quality may be performed, according predetermined accepted procedures and guidelines, by either MoE, Greater Amman Municipality, or by a private agency such as EcoConsult. The procedures and the results of gases and air monitoring should be subject for review and evaluation of independent agency. The MoF should insure that the monitoring procedures are followed and the corrective measures are taken whenever needed. The MoE should also receive copies of the monitoring reports.
Reports
Different kinds of reports should be produced and disseminated to parties concerned and stakeholders by the agency responsible for ambient air and emitted gas monitoring to evaluate and assess the state of air quality in Al Ghabawi and its surrounding area.
These reports are produced periodically with different intervals to meet the purpose of these reports and the objectives of the monitoring program. Daily, Monthly, Quarterly and Annual reports are the kinds of expected reports.
Dr. Atallah Rabi
E1895 vol. 3 rev.

Executive Summary Physical Environment Despite the fact that the groundwater at Al-Ghabawi is not currently used for potable purposes, it meets the Jordanian Drinking Water Standards (DJS 286: 2007, fifth edition) in all tested quality parameters on January 2008. The groundwater table is at a depth that ranges from 182 to 248 meters with a flow direction towards East – South East. The uncontrolled leachate ponds from cell #1 pose the utmost risk of contaminating the underlying soils and the groundwater resources. Assessment of the potential contamination has been performed by adopting three different approaches, namely: the use of the DRASTIC model, rapid assessment Nomograph to solve a one dimensional transport equation that takes into consideration dispersion, diffusion, retardation and decay constants; and the Green-Ampt infiltration model. These approaches were applied to a worst case scenario situation in which; the uncontrolled leachate is assumed to have a steady height of ponding equals two meters above the unlined ground with no top soil, the B3 aquiclude is assumed to have the smallest thickness reported of around 80 meters; and Chloride has been chosen as an indicator contaminant. DRASTIC Index was estimate at 102, which indicates a low potential of contaminating the groundwater. The rapid assessment Nomograph method indicated that for the worst case scenario where a negatively charged ion is to be transported under maximum hydraulic gradient needs about forty years before it reaches the top of the B2/A7 aquifer. Green Ampt infiltration model indicated that if all the uncontrolled leachate in the ponds, it would infiltrate the soils to a distance less than five meters, which is much smaller that the shallowest depth to the B2/A7 aquifer. The mitigation measures incorporated in the design of cell #2 such as the multilayered barrier system of geosynthetics liners and low permeability liners and would reduce if not diminish the potential contamination of the groundwater to an extremely low possibility. Surface water courses at the site are unlikely to be effected by the activities at all the stages of the project.
E1895 vol. 3 rev.

The Vulnerability of the groundwater resources at Al-Ghabawi area has been estimated using two methods, the Aquifer Vulnerability Index (AVI) and the DRASTIC Index.
Aquifer Vulnerability Index (AVI) method
AVI quantifies vulnerability by the hydraulic resistance (c) to the vertical flow of water through the geologic sediments above the aquifer. Hydraulic resistance is calculated from the thickness (d) of each sedimentary layer and the hydraulic conductivity (K) of each of the layers (given below):
Hydraulic resistance, c = �di / Ki, for layers 1 to i (1)
In this study, saturated hydraulic conductivity values (Ksat) were assigned to each layer reported in Al Ghabawi records (Arab Center). The use of Ksat for unsaturated layers above the water table should give conservative hydraulic resistance values (higher vulnerability). Thickness of individual layers was taken directly from the hydrogeologic records. Hydraulic resistance (c) has the dimension of time (e.g. years) and represents the flux–time per unit gradient for water flowing downward through the various sediment layers to the aquifer. The lower the hydraulic resistance (c), the greater the vulnerability. The logarithms of the hydraulic resistances (log c) are used to group the areas into the following vulnerability categories (Table 1)
Hydraulic Resistance, c (years) Log (c) Vulnerability Category
< 10 years < 1 extremely high vulnerability
10 - 100 years 1 to 2 high vulnerability
100 - 1,000 years 2 to 3 moderate vulnerability
1,000 - 10,000 years 3 to 4 low vulnerability
> 10,000 years > 4 extremely low vulnerability
Table 1: AVI Categories
For Al-Ghabawi Area, The worst case scenario has been identified by examining the hydrogeologic conditions of the site and a conservative profile is shown. The profile consists of thin top soil ranging from 0.1 to 0.5 m, B3 aquitard of 80.3 m thickness and then the B2/A7 aquifer with a thickness of 102.1 m above the groundwater table. The hydraulic conductivity for the B3 ranges from 8.37 x 10⁻⁵ to 2.94 x 10 -4 mm/s (0.0072 – 0.025 m/d) While the hydraulic conductivity of the B2/A7 ranges from (0.35 – 70 m/d). Using the upper limits of the hydraulic conductivities in estimating the AVI and ignoring the top soil layer yields:
Hydraulic resistance ( c ) = 80.3 / 0.025 + 102.1 / 70 = 3212 + 1.5 = 3213.5 days = 8 years.
E1895 vol. 3 rev.

From Table (1) the AVI category is extremely high vulnerability.
For a lower estimate, c = 80.3 / 0.0072 + 102.1 / 0.35 = 11152.8 + 291.7 = 11444.5 days = 31.35 years
AVI category is high vulnerability
Assessment of the potential impacts on soils and groundwater environment The potential contamination of the groundwater resources will be evaluated via three different methods. These include DRASTIC index; a rapid assessment nomograph for solving the advection dispersion one dimensional contaminant transport equation with decay term; and the Green - Ampt infiltration models as seen in the following subsection, DRASTIC Index DRASTIC is a groundwater quality model for evaluating the pollution potential of large areas, greater than 100 acre) using the hydrogeologic settings of the region (Aller et al., 1985, Aller et al., 1987, Deichert et al., 1992). This model was developed by US EPA in the 1980's. DRASTIC includes various hydrogeologic settings which influence the pollution potential of a region. A hydrogeologic setting is defined as a mappable unit with common hydrogeologic characteristics. This model employs a numerical ranking system that assigns relative weights to various parameters that help in the evaluation of relative groundwater vulnerability to contamination. The hydrogeologic settings which make up the acronym DRASTIC are: [D] Depth to water table: Shallow water tables pose a greater chance for the contaminant to reach the groundwater surface as opposed to deep water tables. [R] Recharge (Net): Net recharge is the amount of water per unit area of the soil that percolates to the aquifer. This is the principal vehicle that transports the contaminant to the groundwater. The more the recharge, the greater the chances of the contaminant to be transported to the groundwater table. [A] Aquifer Media: The material of the aquifer determines the mobility of the contaminant through it. An increase in the time of travel of the pollutant through the aquifer results in more attenuation of the contaminant. [S] Soil Media: Soil media is the uppermost portion of the unsaturated / vadose zone characterized by significant biological activity. This along with the aquifer media will determine the amount of percolating water that reaches the groundwater surface. Soils with clays and silts have larger water holding capacity and thus increase the travel time of the contaminant through the root zone.
E1895 vol. 3 rev.

[T] Topography (Slope): The higher the slope, the lower the pollution potential due to higher runoff and erosion rates. These include the pollutants that infiltrate into the soil. [I] Impact of Vadose Zone: The unsaturated zone above the water table is referred to as the vadose zone. The texture of the vadose zone determines how long the contaminant will travel through it. The layer that most restricts the flow of water will be used. [C] Conductivity (Hydraulic): Hydraulic conductivity of the soil media determines the amount of water percolating to the groundwater through the aquifer. For highly permeable soils, the pollutant travel time is decreased within the aquifer. DRASTIC evaluates pollution potential based on the above seven hydrogeologic settings. Each factor is assigned a weight based on its relative significance in affecting the pollution potential. Each factor is further assigned a rating for different ranges of the values. The typical ratings ranges are from 1-10 and the weights are from 1-5. The use of DRASTIC index is subject to the following assumptions:
• The contaminant (usually nitrate of a pesticide) is introduced at the ground surface.
• The contaminant in flushed into the ground water by precipitation. • The contaminant has the mobility of water. • The area evaluated by DRASTIC is 100 acres (400, 000 m2) or larger.
The DRASTIC Index, a measure of the pollution potential, is computed by summation of the products of rating and weights for each factor as follows: DRASTIC Index = D r D w + R r R w + A r A w + S r S w + T r T w + I r I w + C r C w Where; Dr = Ratings to the depth to water table Dw = Weights assigned to the depth to water table. Rr = Ratings for ranges of aquifer recharge Rw = Weights for the aquifer recharge Ar = Ratings assigned to aquifer media Aw = Weights assigned to aquifer media Sr = Ratings for the soil media Sw = Weights for soil media Tr = Ratings for topography (slope) Tw = Weights assigned to topography Ir = Ratings assigned to vadose zone Iw = Weights assigned to vadose zone Cr = Ratings for rates of hydraulic conductivity Cw = Weights given to hydraulic conductivity The higher the DRASTIC index, the greater the relative pollution potential. The DRASTIC index can be further divided into four categories: low, moderate, high, and very high. The
E1895 vol. 3 rev.

sites with high and very high categories are more vulnerable to contamination and consequently need to be managed more closely. The DRASTIC Index usually range from a minimum 23 and maximum 230 (with the value below 120 indicating a low vulnerability range of groundwater contamination). The higher of DRASTIC Index means greater the ground water pollution potential. Determine the Rating Number for Each Factor at Al-Ghabawi • Groundwater Depth (weight =5)
The depth to groundwater table in the area ranges from 182 m to 248m. Thus, the rating is 1 (Table 5- 4 ) .
• Groundwater Recharge (weight = 4) Rainfall at the project area is around 157 mm/year. Evaporation is estimated at 1075 mm/year at the same site. Groundwater recharge is much less that 5 cm (2 inches), the ratings is 1 (Table 5-4)
• Topography % (weight =1) The slope is in the project area is estimated at about 1.4 %. Rating is 10 (Table 5- 4)
• Hydraulic Conductivity (weight = 3) The hydraulic conductivity ranges from 0.007 to 0.020 m/d. Rating = 1 (Table 5- 1)
• Aquifer Media (weight = 3)
Aquifer Media (B2/A7) is karst and limestone. Rating = 10 (table 5- 4) • Soil Media (weight = 2)
Top soil thickness from 0.5 to 1.0 meter. Rating = 10 (table 5- 4) • Vadose Zone Material (weight = 5)
Vadose zone material consists of soft, thick bedded chalky marl, marl, and chalky limestone with bedded nodules of microcrystalline limestone and chert. Rating = 6 (table 5-4)
E1895 vol. 3 rev.

DRASTIC Index Calculation
The DRASTIC Index value is 102, (Table 2) which indicates low potential to impact the groundwater resources in the area from this project.
DRASTIC Index Parameters Weighted
Rating Depth to Water Table (W=5)
Range 0 - 5 5 - 10 15 -30 30 - 50 50 -75 75 - 100 100+ Rating 10 9 7 5 3 2 1
182-248m = 5 x 1
Recharge (W = 4) Range
(inches) 0 - 2 2 - 4 4 - 7 7 - 10 10 +
Rating 1 3 6 8 9
1 = 4 x 1
Aquifer Media (W = 3) Massive
Shale Metamorphic
/ Igneous Weathered
Metamorphic/ Igneous
Glacial Till
Bedded Sandstone, Limestone and Shale Sequences
Massive Sandstone
Massive Limestone
Sand and
Gravel
Basalt Karst Limestone
Range 1 2 - 5 3 - 5 4 - 6 5 - 9 4 - 9 4 - 9 4 - 9 2 - 10 9 - 10 Typical Rating
2 3 4 5 6 6 8 8 9 10
here = 3 x 10 Soil Media (W = 2)
Thin or Absent
Gravel Sand Peat Shrinking and /or
Aggregated Clay
Sandy Loam Loam Silty Loam
Clay Loam
Muck Non Shrinking
Non Aggregated
Clay
E1895 vol. 3 rev.

Rating 10 10 9 8 7 6 5 4 3 2 1
Less than 0.5 m
= 2 x 10
Topography (% Slope) Weight = 1 Range 0 - 2 2 - 6 6 - 12 12 – 18 18+ Rating 10 9 5 3 1
1.4% =1 x 10
Vadose Zone Material (Weight = 5) Confining
Layer Silt / Clay Shale Limestone Sandstone Bedded
Limestone, Sandstone,
Shale
Sand and Gravel with
significant Silt and
Clay
Sand and
Gravel
Basalt Karst Limestone
Rating 1 2 - 6 2 - 6 2 - 5 2 - 7 4 - 8 4 - 8 4 - 8 2 - 10 8 - 10 Typical Rating 1 3 3 3 6 6 6 8 9 10
Bedded Chalky Marl
= 5 x 6
Hydraulic Conductivity (GPD/ft2) (Weight = 3) Range 1 - 100 100 - 300 300 - 700 700 - 1000 1000 - 2000 2000 + Rating 1 2 4 6 8 10
0.02 m/d = 3 x 1
DRASTIC Index (DI) Σ = 102 DRASTIC
Index 1- 140 140-180 180-230 230+
Vulnerability
low moderate high Very high low
Table2: The DRASTIC Index value
E1895 vol. 3 rev.

WATER RESOURCES
This chapter presents the assessment of the potential impacts of the different project activities during all the different project phases: construction, operation and closure. It also presents a summary of the recommended mitigation measures and monitoring program. Baseline Findings The site lies at the most southern part of a larger geomorphologic unit consisting of plateau draining northward via a net of sub-parallel wadis towards Zarqa River, i.e. a northward oriented watershed that lead to Zarqa river about 15 km away. The site is mainly gentle in slope (about 1.5 %) towards the north direction and is crossed by shallow and small wadis which are some of the recharge tributaries (sub catchments) for many wadis in the north, like wadi Maduna. The destination of surface water over the site will be towards these wadis. The only natural source of surface water on the project area is rainfall with an annual average of 157mm. There are no dams, reservoirs and no other activities in the vicinity of the site to use this water. The evaporation rate in the area is very high and the top soil has very low permeability. Thus a large portion of the surface water is expected to evaporate. Currently, discharge of significant amounts of leachate of an average maximum amount of about 340m3/d is present in several areas around the existing Cell 1, especially in the western border. In some situations the leachate is uncontrolled and forms small pond on the surface with a maximum depth of 2 meters. Leachate samples collected from these ponds were partially characterized by the RSS and WAJ laboratories as given in table 5.1. Of great interest is the fact that the pH values tested indicate neutral acidity and may not pose any threat of interaction with the subsurface material. At first, the leachate was being pumped from the ground and disposed in emergency ponds. Currently, the pumping system from the treatment plant is already functioning and the leachate is being pumped into lined aeration pond to the west of cell #1. By doing this, the risk of leachate pollution has been reduced. However, there is still a risk of polluting the soil and sub-soil around Cell 1 from continuous uncontrolled leachate generation and accumulation. Since there are no historic records of any flood in the project area, low amounts of rainfall, high evaporation rates, rough terrain made of the excess solid waste piles at cell #1, and the isolated leachate ponds, it is anticipated that there are no significant risks of surface water pollution. The groundwater resources at Al-Ghabawi site exist in the Al-Hisa –Amman and Wadi As Sir formation (B2/A7) aquifer that has an average thickness of 108 meters. The depth of the water table ranges from 182 – 248 meter below ground surface. The groundwater flow direction is East and South-East with a hydraulic gradient of 0.007. This aquifer is bound from the top by the Muwaqqar – chalk marl (B3) aquitard with a thickness that ranges from 80 – 132 meters. Shallow top soil layer that ranges from 0.5 to 1 meter thick also exists.
E1895 vol. 3 rev.

The Muwaqqar –chalk marl formation consists of soft, thick bedded chalky marl, marl and chalky limestone with bedded and nodules of microcrystalline limestone and chert. Some thin lenses (2-5 cm thick) of coarse grain granular phosphate are occasionally present. The hydraulic conductivity of this formation ranges from 10-3 to 10-7 mm/s, low to very low permeability. This renders the Muwaqqar –chalk marl formation as aquiclude. The specific gravity ranges from 2.5 to 2.857 with an average of 2.67. The bulk density was estimated at 2.247 gram /cm3. The moisture content, on a mass basis, ranges from 0.3 to 11.1 % with an average of 4.23 %. The cation exchange capacity ranges from 4.09 to 12.94 meq/100g with an average of 10.2 meq/100g. No major faults or cracks have been identified in the project area and a homogeneous horizontal layering exist up to a depth of 6 meters as deduced from the resistivity contour maps and the cross sections (profiles) prepared by the Arab Center. No public or private wells or piezometers exist within a distance of 1 km from the site. There is, however, one well in the landfill site with a water depth of 250 meters. The water from this well has not been used for drinking purposes because of the high content sulfur and its uses had been limited to irrigation, cleaning and non potable purposes. Recently, on January 8, 2008 a new water sample from this well was tested by the WAJ laboratories and results indicated that the sulfate concentration conforms to the Jordanian Drinking Water Standard (DJS 286:2007) as shown in table 4 However, the list of tested quality parameters is not thorough and further testing is needed before the groundwater is used for potable purposes. Meteorological information about the site has been collected from the Meteorological Department web site for Queen Alia Airport Station, the closest to the site, and used to obtain the information in Table 5
RSS WA Constituent Range (mg/L
except as indicated)a
1 2 3 1 2 3
Aluminum ND - 85 0.549 0.915 0.559
BOD ND – 195000 35000 53250 31938 7488 4341 4736
Calcium 3.0 - 2500 3559 5629 2720
Chloride 2.0 - 11375 7993 8604 8355 13992 8320 9783
COD 6.6 - 99000 67004 101286 68092 84959
>233663 83370
Kjeldahl nitrogen 2.0 - 3320 4109 3899 4456
Magnesium 4 – 780 739 976 684
Molybdenum 0.01 – 1.43 <0.08 <0.008 <0.08
Nitrogen - Total 2438 2458 2531 pH (units ) 3.7 – 8.9 7.35 6.21 7.58 7.76 7.54 7.63
Phosphorous ND – 234 24.0 31.5 32.0 13.23
9.74 5.04
Sodium 12 – 6010 5795 5810 5660
Total Dissolved Solids
584 - 55000 62960 59671 43355
52110 37795
Total Suspended Solids
2 - 140900 3385 2873 4080 1999
3090 4125
E1895 vol. 3 rev.

Total Coliform MPN/100ml
2300
Table 3: Al-Ghabawi Leachate Characteristics (only tested quality parameters are reported)
Source: Bagchi (1994). ND, not detectable
Constituent of Al-Ghabawi
Well WA Laboratories
Value (mg/L except as indicated)
DJS 286 (mg/L
except as indicated)
Comment
Bicarbonate 501.42 Within TDS
Calcium 130.26 Within TH /TDS
Chloride 126.38 500
Hardness 579 as CaCO3
about 191.91 mg/l 500
Magnesium 61.65 Within TH /TDS
Nitrate 2.37 50 pH (units ) 7.41 6.5 – 8.5
Potassium 5.08 Within TDS
Sodium 80.27 400
Sulfate 183.36 500 Total Dissolved Solids 1243 µs/cm (about
833 mg/L) 1000
Total Coliform MPN/100ml Less than 2 Less than 1.1
Table 4: Characteristics of the Groundwater from the well at Al-Ghabawi Landfill contrasted to the
Jordanian Standard (DJS 286: 2007), only tested parameters are reported.
Hardness in mg/L estimated by summing the concentrations of divalent cations. TDS converted from µs/cm to mg/l by multiplying by 0.67 As indicated in the above table, for all measured parameters, there is no violation in any of the measurements.
Jan Feb Mar Apr May June July Aug Sep Oct Nov Dec Yearly
Temperature Mean Max Mean Min
Mean
13.2 1.8 7.5
14.52.38.4
18.14.111.1
24.07.115.6
28.810.419.6
31.512.221.8
33.014.323.6
33.014.123.6
31.512.522
27.510.118.8
20.86.213.5
15.32.99.1
24.3 8.2
16.2 Rainfall
Total Monthly 37.6 33.0 25.9 5.3 2.1 0.0 0.0 0.0 0.1 4.1 16.4 32.1 156.6
E1895 vol. 3 rev.

(mm) Relative
Humidity Mean
monthly (%) 78.4 75.2 69.8 55.9 48.6 49.9 51.8 56.6 58.4 57.9 64.2 75.5
61.8
Relative Wind
Direction a 204.0 239.2 290.8 293.0 298.6 299.0 297.4 299.4 302.1 271.5 132.3 160.4
258.1
Mean Wind Speed
(knots)b 6.4 7.2 7.2 7.0 6.9 7.1 7.7 6.4 5.0 4.8 5.9 5.9 6.5Evaporation
Total monthly
(mm)c
71.8 80.8 121.0 194.6 268.6 314.8 333.8 312.2 243.6 184.8 108.7 79.3 2314
a data from 1992 to 2005; b data from 1977 to 2005; c data from 1980 to 1999 (1 knot is approximately 1.85 km/hr)
Table 5: Meteorological Information from Queen Alia Air Port Station for the period between 1976 –
2005. Source: Jordan Meteorological Department
Assessment of the Potential Groundwater Contamination at Al-Ghabawi Site by Uncontrolled Leachate Using a Rapid Assessment Nomograph
Several sources of groundwater contaminants are expected to take place during the different phases of the project especially during operation and closure of the landfill. The potential contamination by the leachate is considered the most crucial because of the constituents that make up the leachate and the significant amounts that may be generated. The potential leachate contamination sources include: the uncontrolled leachate that seeps out from the excess waste piles at cell #1; leachate that may seep out the several liners beneath cell # 2 and #3; leachate that will seep out in case of the malfunctioning of the leachate collection system; and leachate that will flood from the aeration ponds or other components of the treatment plant. Careful consideration of these contamination routes indicated that the current situation of uncontrolled leachate pose the most threat to the groundwater resource in the project area because of : the large quantities release, estimated at 340m3/day; and the points of release makes small ponds with ponding height of about two meters over unlined ground. In order to develop a worst case scenario (for the most conservative estimate), the following assumptions has been made: 1) The leachate will migrate in one dimensional movement towards the groundwater table, 2) the uncontrolled leachate quantity will be large enough to reach the B2/A7 aquiclude after transporting through the B3 aquiclude; 3) the smallest thickness reported of the B3 aquiclude, 80.3 m, is taken in the analysis; 4) top soil does not exist, and 4) an indicator compound is chosen to provide the fastest transport rate. The transport of chloride ion has been identified to provide the worst case scenario possible because of: 1) it’s negative charge which will not be retarded by the negative charges that may exist on clayey soils 2) will not be subject to biodegradation, and 3)due to its high initial concentration that was measured at 13992 mg/L. Figure (5.1) presents a schematic of the worst case scenario used for performing the most conservative analysis.
Chloride will transport into the subsurface via several mechanisms like advection, dispersion, diffusion. Advection also know as advective transport or convection refers to the contaminant
E1895 vol. 3 rev.

movement by flowing water in response to a hydraulic gradient. Groundwater velocity for one dimensional flow is given by Darcy’s law. The actual velocity, also known as seepage velocity, is calculated by dividing Darcy’s velocity by the effective porosity. Diffusion also known as molecular diffusion refers to the movement of the contaminant under a chemical concentration gradient (from an area of greater concentration towards an area of lower concentration). Diffusion is usually characterized by Fick’s First law of Diffusion. Dispersion refers to the mixing and spreading of flowing water at the microscopic level into the soil pores in such a way that some fluid particles will have velocities greater or smaller than the average velocity due to the pore size, path length and friction in pores. Because of these differences mixing occurs along the flow paths. The mixing is called mechanical dispersion or simply dispersion. Mixing along the direction of the flow path is called longitudinal dispersion. The dispersion in a direction perpendicular to the direction of the flow path is called transverse dispersion. All these mechanisms are combined into the one dimensional advection-dispersion equation for reactive degradable dissolved solutes (contaminants) in homogeneous, isotropic materials under steady uniform flow is given by:
∂C/∂t + V*∂C/∂z - ∂/∂x (D*∂C/∂z) + λ*C = 0.0
Where
C = concentration of contaminant under consideration
t= time elapsed
V = True groundwater velocity given by Darcy’s velocity / volumetric moisture content
V* = the normalized velocity by the Retardation Factor R and is given by V/R
R = Retardation Factor = 1+ ρb Kd / θ
ρb = bulk density of aquifer material
Kd = partition factor of the contaminant and soil material
θ: volumetric water content
D = Hydrodynamic Dispersion Coefficient = α Vave + Deff
A = dispesivity ( L)
Vave = average true velocity
Deff = effective binary diffusion coefficient for the contaminant in water
D* = D / R = Normalized Hydrodynamic dispersion coefficient
λ = decay constant
E1895 vol. 3 rev.

λ* = λ / R = Normalized Decay Constant
z = the vertical coordinate
In order to solve the equation, the following assumptions are made:
1-aquifer properties: homogeneous, isotropic.
2- steady, uniform, flow.
3- uniform mixing through some width.
4- no contamination prior to release.
5- constant source contamination.
6- no dilution of plume due to recharge.
Then the solution of the above transport equation is given by:
C(x, t) / Co = 0.5{exp(A1) erfc(A2) + exp(B1) erfc(B2)}
Where
C(z, t) = concentration as a function of vertical coordinate and time
Co = Initial concentration (i.e., concentration at time equal to zero)
exp = the exponential function
erfc = the complementary error function given by:
erfc(β) = 1- erf(β)
erf (β) = error function which is a mathematical function that range from -1 to 1.
The values of the error function and erfc are provided in Table ( )
A1 = z / 2D* (V*-√V*2+4D*K*)
A2 = (z - t √V*2+4D*K*) / (√4D*t)
B1= z / D*(V*+√V*2+4D*K*)
E1895 vol. 3 rev.

B2 = (z + t √V*2+4D*K*) / (√4D*t)
This solution provides the basis for a worksheet for a Rapid Assessment Nomograph that has been used to provide quantitative estimate of the contaminant’s concentrations, distance traveled and time needed for contaminant transport in subsurface systems. This technique is powerful in a sense that it can be used to study both the saturated and unsaturated regions for a reactive and biodegradable soluble contaminant.
The assessment and calculations for this worst case scenario shown in Figure (5.) is given by the following worksheet:
Characterization of leachate
RSS WA Constituent Range (mg/L
except as indicated
1 2 3 1 2 3
Aluminum ND - 85 0.549 0.915 0.559
Ammonia Nitrogen ND – 1200 Antimony ND – 3.19 Arsenic ND – 70.2 Barium ND – 12.5
Beryllium ND – 0.36 BOD ND – 195000 35000 53250 31938 7488 4341 4736 Boron 0.87 – 13.0
Cadmium ND – 0.4 Calcium 3.0 - 2500 3559 5629 2720
Chloride 2.0 - 11375 7993 8604 8355 13992 8320 9783
Chromium ND – 5.6 COD 6.6 - 99000 67004 101286 68092
84959
>233663
83370
Copper ND – 9.0 Cyanide ND – 6.0 Hardness 0.1 - 225000 Total Iron ND - 4000
Kjeldahl nitrogen 2.0 - 3320 4109 3899 4456
Lead ND – 14.2 Magnesium 4 – 780 739 976 684
Manganese ND - 400 Mercury ND – 3.0
Molybdenum 0.01 – 1.43 <0.08 <0.008 <0.08
Nickel ND – 7.5 Nitrate-Nitrogen ND - 250 Nitrogen - Total 2438 2458 2531
pH (units ) 3.7 – 8.9 7.35 6.21 7.58 7.76 7.54 7.63
Phosphorous ND – 234 24.0 31.5 32.0 13.23 9.74 5.04
Potassium ND – 3200
E1895 vol. 3 rev.

Selenium ND – 1.85 Silver ND – 1.96
Sodium 12 – 6010 5795 5810 5660
Sulfate ND - 1850 Total Alkalinity ND – 15050
Total Organic Carbon ND - 40000 Total Dissolved Solids 584 - 55000 62960 59671 43355 52110 37795
Total Suspended Solids 2 - 140900 3385 2873 4080 1999 3090 4125
Turbidity 40 -50000 Jackson Units
Zinc ND - 731
Table 6: Typical Composition of Leachate from Municipal Waste Source: Bagchi (1994). ND, not detectable
Table 7 below characteristics of the Groundwater in the vicinity of Al-Ghabawi Landfill contrasted to the maximum concentration of constituents in the upper most aquifer at the relevance points of compliance as set by 40 CRF 258.40 and other remediation guidelines. Constituent of Al-Ghabawi Well WA Laboratories
Value (mg/L except as indicated)
40 CRF 258.40
EPA Values (only for those not
covered by CRF)
Comment
Arsenic 0.05 Barium 1.0
Benzene 0.005 Bicarbonate 501.42
Boron Cadmium 0.01
Calcium 130.26
Carbon Tetrachloride 0.005
Chloride 126.38 200
Chromium (hexavalent) 0.05 1, 4-Dichlorobenzene 0.075
1, 2- Dichloroethane 0.005 1, 1-Dichloroethlyene 0.007
2, 4-Dichlorophenooxyacetic acid 0.1 Endrin 0.0002
Fluoride 4 Hardness 579 as CaCO3
Lead 0.05 Lindane 0.004
Magnesium 61.65
Mercury 0.002 Methoxychlor 0.1
Nitrate 2.37 10 Nitrogen - Total
pH (units ) 7.41
E1895 vol. 3 rev.

Phosphorous
Potassium 5.08 Selenium 0.01
Silver 0.05 Sodium 80.27
Sulfate 183.36 400 Toxaphene 0.005
Trichloroethylene 0.005 1,1,1-Trichloromethane 0.2
2,4,5-Trichlorophenoxyacetic acid 0.01
Total Dissolved Solids 1243 µs/cm
Total Coliform MPN/100ml Less than 2
Vinyl Chloride 0.002
Table 7: Characteristics of the Groundwater in the vicinity of Al-Ghabawi Landfill As indicated in the above table, for all measured parameters, there is no violation in any of the measurements.
WORKSHEET FOR RAPID ASSESSMENT NOMOGRPH
ZONE: UNSATURATED --------B3 aquitard of 80.3 m thickness------
SATURATED ------------------
Site: --Al-Ghabawi---------------------- date of incident:-----------------------------------
Location:----------------------------------
On site coordinate:----------------------- agency:---------------------------------------------
Scientific support coordinator:----------------------- agency:-------------------------------
Compound name:-------------- Cl- -------------------------------------------------------------
Compound characteristics:----- soluble, non volatile, non biodegradable-----------------
REQUIRED PARAMETRS: DATA SOURCE/COMMENT
Co= ----------13992 mg/L---------- -MWI Laboratories/ Highest reported
values for tested samples
V= ----------------0.021 m/day ----- Calculated for an extreme case of full
saturation from ground surface till top of B2/A7 aquifer (max Hydraulic gradient of one)
E1895 vol. 3 rev.

D = 0.1 x 0.021 + 1 x 10-9 = 8.64 x 10⁻⁵ m2/d dispersivity = 0.1 m
K(λ) = ------- 0 ------------------------ no decay------------------------------------
R= 1+((ρb/θ)*Kd) = 1 + 2.26/0.066 = 38.67 ----------------------------
Kd = 1 ---------------------------- ------------------------------------------------
ρb = 2.26----------------------------- ------------------------------------------------
θ = 0.066----------------------------- ------------------------------------------------
PRELIMINARY CALCULATION:
1. V* = V/R = 5.4 x 10⁻⁴ m/d ------------ 3. K* = K/R = zero ---------------------------
2. D* = D/R = 5.4 x 10⁻⁵ m2/d----------- 4. √ V*2+4D*K* = 5.4 x 10⁻⁴ m/d ----
NOMOGRAPH WORKSHEET
12 11 10 9 8 7 6 5 From Nomograph From Footnotes
C C/Co M2 M1 B2 B1 A2 A1
√4D*t
z/2D*
t
(day)
z
(m) 6296 0.45 0 0.9 28.3 800 0.076 0 5.65 82136 16400 80.3 4058 0.29 0 0.58 15.9 800 0.42 0 5.58 82136 16000 80.3 979 0.07 0 0.14 16.3 800 1.34 0 5.40 82136 15000 80.3 196 0.014 0 0.03 16.6 800 1.84 0 5.31 82136 14500 80.3
Footnotes:
A1= col.7 x (item 1-item 4) =X/D* (V*-√V*2+4D*K*)
A2=[col.5-col.6 x item 4]/col.8 =(X- t √V*2+4D*K*)/(√4D*t)
B1=col.7x(item 1 x item 4) = X/D*(V*+√V*2+4D*K*)
B2 =[col.5+(col.6 x item4]/col.8 = (X+t √V*2+4D*K*)/(√4D*t)
From this Table, the time required for Cl- to reach the top of the aquifer is 14500 days which is equal to 39.72 year. This indicates that under hypothetical worse case scenario, it will take such a long time to reach the top of the aquifer. However, the probability that this scenario will occur is very low. It is expected that the leachate will form a cake like layer at the bottom of the leachate ponds. This layer will have an extremely low permeability and will help in containing the leachate. Besides, the quantity of leachate will not be enough to reach the water table.
E1895 vol. 3 rev.

E1895 vol. 3 rev.

E1895 vol. 3 rev.
Green – Ampt Infiltration Model
For Al-Ghabawi Landfill, the worst case scenario, as mentioned before, is manifested by the existing conditions of uncontrolled ponding of leachate at specific locations of Cell #1. The well design and construction of Cell #2 and subsequent cells is not anticipated to produce a worse situation. For conservative estimates, it is assumed that the uncontrolled leachate pond depth is 2 meters and it is also assumed that all the quantity will infiltrate into the subsurface. This may not be the case since the high content of suspended solids and organics will tend to form a cake layer with extremely low permeability at the bottom of the pond. Nevertheless this layer is not considered here (Figure 5.1).
The Green-Ampt method of infiltration estimation accounts for many variables that other methods, such as Darcy's law, do not. It is a function of the soil suction head, porosity, hydraulic conductivity and time. The following assumptions are made:
The soil surface is covered by a pool of water whose depth can be negelected
There is a distinctly definable wetting front in th esoil which can be viewed as a plane separating a uniformly wetted infilitrated zone from a totally dry unifiltrated zone,
Once the soil is wetted, the water content in the wetted zone does not change as infiltration continues (hydraulic conductivity in this zone is constant), and,
There is a negative constant pressure just above the wetting front.
In this case capillary suction ( ψ ) plus depth of percolating water add to give the pressure head ( ∆h) for flow in the vertical direction. In terms of the depth of percolating water (H) this equation becomes
f(t) = K (H+ψ /H)
where f(t) = infiltration rate (L/T)
The volume of this water is the product is the difference in the initial soil moisture content and the final soil moisture content times the depth of percolating water.
F(t) = H (θs − θi) = ηΗ
Where
F(t) = cumulative infiltration volume (L)
E1895 vol. 3 rev.

θs = saturated soil water content (fraction of total volume)
θi = initial soil water content (fraction of total volume)
η = the fillable pore space or effective porosity (θs − θi)
Η = depth of percolating water
The above equations may be manipulated and written as:
η dH/dt = K (H+ψ /H)
This equation is integrated to give the final form of Green – Ampt equation.
Kt = F(t) – ηψ ln[ {ηψ + F(t)} / ηψ]
Where
K = hydraulic conductivity of total soil (L/T)
ψ = capillary suction of the soil at the wetting front (L)
F(t) = cumulative infiltration volume (L)
η = the effective porosity (fraction)
t = time (T)
The parameters needed to use the Green-Ampt equation have been estimated and tabulated in table (5.6) below:
Table (5.6)
Soil Type Total Porosity Effective Porosity
Capillary Suction (cm)
Hydraulic Conductivity
(cm/hr) Sand 0.437 0.417 4.95 10.50 Loamy sand 0.437 0.401 6.12 3.06 Sandy loam 0.453 0.412 11.00 1.30 Loam 0.463 0.434 8.89 0.66 Silty Loam 0.501 0.486 16.69 0.34
E1895 vol. 3 rev.
Sandy clay loam
0.398 0.330 21.84 0.22
Clay loam 0.464 0.390 20.88 0.12 Silty clay loam 0.471 0.432 27.30 0.08 Sandy clay 0.430 0.321 23.90 0.06 Silty clay 0.479 0.423 29.21 0.05 Clay 0.475 0.385 31.62 0.03
Table 8: Green –Ampt Parameter Estimates
Source: Rawls and Brakensiek, 1985; Rawls et al., 1983
For Al-Ghabawi,
The maximum depth that the leachate front can reach into the soil is estimate as:
If the pond depth is taken as 2 m. Then the depth of infiltration is into the B3 aquiclude is approximated as follows:
From the above table, the effective porosity for the clay loam layer is 0.39, then the depth of infiltration is 2/0.39 = 5.13 m
This is much lower than the B3 layer thickness of 80.3 meters.
Time needed to infiltrate can be estimated as
(0.22)t = {2.0 – 0.39 (0.2088) ln [ (0.39 (0.2088)+ 2) / (0.39 (0.2088))] }
. t = 789 hrs approximately 32.88 days.
The potential for contaminating the groundwater table is extremely low (unlikely)
For the leachate to reach the top of the B2/A7 aquifer, the leachate pond depth must be equal to:
80.3 (0.39) = 31.32 meters. Which is impossible.
Green-Ampt
The Green-Ampt method of infiltration estimation accounts for many variables that other methods, such as Darcy's law, do not. It is a function of the soil suction head, porosity, hydraulic conductivity and time. The following assumptions are made:
The soil surface is covered by a pool of water whose depth can be negelected
E1895 vol. 3 rev.

There is a distinctly definable wetting front in the soil which can be viewed as a plane separating a uniformly wetted infilitrated zone from a totally dry unifiltrated zone,
Once the soil is wetted, the water content in the wetted zone does not change as infiltration continues (hydraulic conductivity in this zone is constant), and,
There is a negative constant pressure just above the wetting front.
In this case capillary suction (ψ) plus depth of percolating water add to give the pressure head (∆h) for flow in the vertical direction. In terms of the depth of percolating water (H) this equation becomes
f(t) = K (H+ψ /H)
where f(t) = infiltration rate (L/T)
The volume of this water is the product is the difference in the initial soil moisture content and the final soil moisture content times the depth of percolating water.
F(t) = H (θs − θi) = ηΗ
Where
F(t) = cumulative infiltration volume (L)
θs = saturated soil water content (fraction of total volume)
θi = initial soil water content (fraction of total volume)
η = the fillable pore space or effective porosity (θs − θi)
Η = depth of percolating water
The above equations may be manipulated and written as:
η dH/dt = K (H+ψ /H)
This equation is integrated to give the final form of Green – Ampt equation.
E1895 vol. 3 rev.

Kt = F(t) – ηψ ln[ {ηψ + F(t)} / ηψ]
Where
K = hydraulic conductivity of total soil (L/T)
ψ = capillary suction of the soil at the wetting front (L)
F(t) = cumulative infiltration volume (L)
η = the effective porosity (fraction)
t = time (T)
The parameters needed to use the Green-Ampt equation have been estimated and tabulated in the following table
Soil Type Total Porosity Effective Porosity
Capillary Suction (cm)
Hydraulic Conductivity
(cm/hr) Sand 0.437 0.417 4.95 10.50 Loamy sand 0.437 0.401 6.12 3.06 Sandy loam 0.453 0.412 11.00 1.30 Loam 0.463 0.434 8.89 0.66 Silty Loam 0.501 0.486 16.69 0.34 Sandy clay loam 0.398 0.330 21.84 0.22 Clay loam 0.464 0.390 20.88 0.12 Silty clay loam 0.471 0.432 27.30 0.08 Sandy clay 0.430 0.321 23.90 0.06 Silty clay 0.479 0.423 29.21 0.05 Clay 0.475 0.385 31.62 0.03
Table 9: Green –Ampt Parameter Estimates
Source:Rawls and Brakensiek, 1985; Rawls et al., 1983
For Al-Ghabawi Landfill, the worst case scenario is manifested by the existing conditions of uncontrolled ponding of leachate at specific locations of Cell #1. The well design and construction of Cell #2 and subsequent cells is not anticipated to produce a worse situation. For conservative estimates, it is assumed that the uncontrolled leachate pond depth is 2 meters and it is also assumed that all the quantity will infiltrate into the subsurface. This may not be the case since the high content of suspended solids and organics will tend to form a cake layer with extremely low permeability at the bottom of the pond. Nevertheless this layer is not considered here. The maximum depth that the leachate front can reach into the soil is estimate as:
E1895 vol. 3 rev.

If the pond depth is taken as 2 m, then the depth of infiltration is into the B3 aquitard is approximated as follows:
From the above table, the effective porosity for the clay loam layer is 0.39, then the depth of infiltration is 2/0.39 = 5.13 m which much lower than 80.3 meters.
Time needed to infiltrate can be estimated as
(0.22)t = {2.0 – 0.39 (0.2088) ln [ (0.39 (0.2088)+ 2) / (0.39 (0.2088))] }
. t = 789 hrs approximately 32.88 days.
The potential for contaminating the groundwater table is extremely low (unlikely)
For the leachate to reach the top of the B2/A7 aquifer, the leachate pond depth must be equal to 80.3 (0.39) = 31.32 meters, Which is impossible.
E1895 vol. 3 rev.

Data downloaded from Jordan Meteorological Department Mean Maximum Temperature at Queen Alia A/P Station Year Jan Feb Mar Apr May Jun Jul Aug Sep Oct Nov Dec1976 13.2 12.5 17.8 22.1 27.3 30.0 29.9 29.5 29.3 27.8 22.3 17.51977 11.8 19.3 18.1 21.7 28.2 30.6 32.4 33.6 29.8 24.5 21.7 13.61978 14.0 17.1 19.0 24.2 30.4 30.6 34.4 30.5 29.7 29.4 18.2 16.11979 14.5 17.5 19.4 25.5 26.6 30.2 31.1 31.6 31.2 27.4 22.4 12.51980 11.2 12.4 17.0 23.1 29.7 31.9 31.8 31.7 28.9 27.3 22.1 15.11981 11.7 13.1 18.6 23.0 26.3 30.5 31.6 31.9 31.9 28.7 18.2 17.51982 13.8 11.6 15.2 24.9 25.3 29.9 30.1 30.8 29.7 26.1 16.5 12.71983 9.3 11.3 15.8 20.9 27.1 30.5 31.6 31.5 30.1 25.4 21.9 16.51984 13.4 17.4 18.8 22.0 29.2 30.2 31.4 30.1 32.2 27.4 18.9 13.31985 15.8 12.5 18.5 22.6 28.3 30.9 31.6 35.3 31.0 24.7 22.5 15.2
Year Jan Feb Mar Apr May Jun Jul Aug Sep Oct Nov Dec1986 14.0 16.1 19.9 25.5 25.0 30.5 32.5 32.5 32.8 27.2 16.5 13.31987 15.1 17.7 14.9 22.1 29.5 31.3 33.6 33.6 31.6 25.0 22.2 14.51988 12.6 13.6 16.0 23.9 30.1 31.6 34.1 32.9 32.3 25.8 18.6 14.81989 10.4 13.5 18.2 28.7 30.0 31.2 33.1 33.4 31.9 26.6 21.5 16.41990 11.7 12.8 17.8 23.1 28.3 32.1 32.9 33.3 31.4 28.9 24.0 19.11991 13.2 15.3 20.1 25.7 28.2 32.1 31.9 31.9 31.6 27.9 22.3 11.51992 9.2 9.6 15.3 22.1 27.5 31.4 32.5 33.8 31.2 30.2 20.3 11.81993 12.1 12.6 18.2 25.3 27.4 33.2 33.4 34.8 32.5 29.3 20.4 18.61994 14.7 14.4 18.3 27.3 30.5 31.8 32.0 34.0 33.5 29.8 17.8 11.81995 14.8 15.5 19.8 23.9 30.6 33.9 33.0 34.2 33.1 27.8 19.4 14.8
Year Jan Feb Mar Apr May Jun Jul Aug Sep Oct Nov Dec1996 13.8 16.6 16.7 22.8 31.0 32.1 34.8 34.4 32.3 26.2 21.3 17.41997 15.2 12.4 15.2 22.2 30.4 31.9 32.8 30.9 30.4 27.7 21.2 15.51998 12.5 15.0 16.5 25.7 29.4 32.6 34.6 36.5 32.8 29.3 24.9 17.71999 15.9 16.7 20.0 24.7 31.3 31.3 33.4 34.8 31.8 27.8 22.3 18.32000 12.4 15.0 17.7 26.0 28.9 33.0 37.7 33.7 31.4 25.4 20.7 15.32001 15.1 14.8 23.7 25.7 29.3 33.4 34.6 34.1 31.2 27.3 20.5 15.42002 11.3 17.2 20.8 22.8 28.1 31.8 35.0 33.7 32.8 30.0 21.2 14.32003 15.2 12.3 15.0 23.8 31.9 32.0 33.5 34.7 30.8 28.4 21.9 14.42004 13.5 15.7 22.3 24.9 28.8 32.1 35.0 33.1 33.1 29.6 20.3 13.82005 13.9 14.0 19.7 25.0 28.3 31.6 34.4 34.4 31.9 26.9 20.5 19.3
Mean Minimum Temperature at Queen Alia Airport oC Year Jan Feb Mar Apr May Jun Jul Aug Sep Oct Nov Dec
E1895 vol. 3 rev.

1976 -.2 1.1 3.7 7.0 10.2 11.3 13.1 12.0 10.5 9.5 5.6 1.41977 1.0 3.7 3.9 6.3 10.3 11.7 13.8 14.1 10.5 8.5 3.8 1.91978 1.3 1.6 4.6 6.4 10.4 11.5 15.2 10.8 11.5 9.1 2.5 2.21979 2.3 3.4 5.8 9.1 9.6 13.2 13.2 13.4 14.2 10.1 9.0 3.71980 1.1 2.6 3.2 6.2 9.8 11.3 14.4 12.7 10.2 9.0 6.2 4.31981 1.8 3.4 5.4 7.2 10.1 12.4 14.9 14.4 13.5 9.7 3.6 2.21982 2.5 2.2 3.4 8.6 10.0 11.2 13.6 13.4 11.7 9.5 4.8 1.91983 .6 2.2 3.7 6.7 9.9 12.3 14.0 13.8 11.8 9.0 7.1 1.91984 2.3 2.2 6.5 6.7 10.9 11.6 13.1 12.1 12.5 10.9 7.0 1.31985 3.5 2.1 4.5 6.8 11.2 11.8 12.5 16.3 13.1 9.2 7.7 3.4
Year Jan Feb Mar Apr May Jun Jul Aug Sep Oct Nov Dec1986 2.0 3.5 5.0 9.9 8.1 13.1 13.3 14.0 14.9 11.2 5.7 1.91987 2.7 4.1 2.5 5.5 9.3 11.4 14.5 15.0 12.4 8.8 5.6 5.11988 3.1 3.3 4.0 7.5 11.1 12.4 14.8 13.8 11.8 9.2 4.1 3.61989 -.2 .2 3.7 7.7 9.7 10.7 13.3 13.5 12.2 9.2 6.8 1.81990 1.6 2.1 4.1 6.8 9.4 12.1 13.8 13.0 11.8 11.0 8.2 3.81991 .6 2.7 6.9 8.8 10.5 12.5 13.9 13.6 12.1 11.2 6.3 1.91992 -.5 .9 2.1 4.6 8.6 11.5 12.5 13.5 12.1 9.4 6.2 2.11993 -.4 -.4 2.7 5.3 10.2 12.4 13.1 14.3 11.2 11.7 6.0 4.81994 4.1 2.0 3.7 8.6 10.8 12.0 14.1 13.4 14.4 13.8 6.8 1.91995 1.1 2.5 2.9 5.3 10.6 13.4 14.2 13.8 13.4 9.1 4.1 2.2
Year Jan Feb Mar Apr May Jun Jul Aug Sep Oct Nov Dec1996 2.8 3.3 4.3 6.6 11.9 11.9 17.1 14.9 13.1 8.9 8.0 3.51997 2.2 -.2 2.8 5.5 11.2 12.7 14.5 13.6 11.5 10.9 6.1 3.51998 2.3 2.6 3.2 8.0 11.9 12.2 14.7 16.3 14.5 10.0 7.4 3.71999 2.4 2.1 4.2 7.3 12.6 13.2 15.3 16.1 13.9 10.6 5.5 2.72000 1.9 .7 2.7 8.5 9.5 12.7 17.1 15.5 12.9 10.4 6.2 4.22001 2.2 2.3 6.8 8.7 11.0 13.3 15.0 15.9 12.9 10.1 5.5 3.72002 1.7 3.3 5.7 6.8 8.6 12.4 15.6 14.9 13.4 12.6 7.2 4.52003 2.8 3.2 2.6 6.2 13.5 12.4 13.4 14.3 11.8 10.7 6.7 3.52004 1.9 2.8 5.7 7.6 10.0 12.8 15.1 13.7 12.5 12.0 8.2 1.42005 2.4 2.3 3.5 7.9 9.6 12.5 15.1 15.5 12.7 8.8 4.9 4.1
Total Monthly Rainfall mm Year Jan Feb Mar Apr May Jun Jul Aug Sep Oct Nov Dec1976 8.9 28.4 37.0 4.9 5.7 .6 .0 .0 .0 3.7 7.9 6.21977 43.0 9.7 14.0 33.2 .0 .0 .0 .0 .0 1.5 5.7 46.11978 27.8 18.8 38.8 2.3 .0 .4 .0 .0 .0 .4 .4 20.0
E1895 vol. 3 rev.

1979 32.6 12.1 24.8 1.0 4.2 .0 .0 .0 .0 5.1 68.1 67.81980 42.5 38.7 55.0 6.1 .0 .0 .0 .0 .0 .1 .7 123.51981 16.3 18.2 15.3 .4 .0 .0 .0 .0 1.2 .0 10.6 5.11982 64.8 34.5 20.8 9.0 25.6 .0 .0 .0 1.2 2.2 29.1 11.41983 67.4 74.6 40.1 1.6 1.0 .0 .0 .0 .0 .1 9.3 4.91984 31.8 4.8 46.2 2.4 .0 .0 .0 .0 .0 21.5 14.5 20.61985 5.8 89.3 31.2 3.1 3.4 .0 .0 .0 .0 .9 4.1 31.1
Year Jan Feb Mar Apr May Jun Jul Aug Sep Oct Nov Dec1986 11.9 39.5 5.2 3.5 5.0 .0 .0 .0 .0 1.1 57.3 12.91987 36.5 9.1 47.6 .0 .0 .0 .0 .0 .0 11.3 2.0 46.21988 47.9 46.2 44.1 8.0 .7 .0 .0 .0 .0 .8 4.0 80.41989 52.1 19.0 16.9 .0 .0 .0 .0 .0 .0 .0 3.2 7.81990 50.6 37.2 37.4 22.4 .0 .0 .0 .0 .0 2.6 1.5 4.41991 31.1 15.4 34.2 2.0 1.7 .0 .0 .0 .0 2.1 17.8 92.21992 47.6 148.6 16.4 .2 .8 .0 .0 .0 .0 .0 36.2 25.31993 25.9 28.9 19.6 .0 6.2 .0 .0 .0 .0 9.6 6.4 26.51994 58.7 12.7 23.1 1.3 .0 .0 .0 .0 .0 6.6 66.3 55.51995 .6 19.6 3.9 5.8 .5 .0 .0 .0 .0 .0 13.2 13.3
Year Jan Feb Mar Apr May Jun Jul Aug Sep Oct Nov Dec1996 54.3 17.6 49.6 6.1 .0 .0 .0 .0 .0 5.3 13.1 11.71997 56.2 51.7 24.8 .4 1.2 .0 .0 .0 .0 18.2 2.4 37.81998 38.9 21.3 17.3 3.6 1.2 .0 .0 .0 .0 .0 .5 .31999 11.0 34.7 3.5 5.8 .0 .0 .0 .0 .0 .0 1.1 1.42000 49.4 3.9 23.0 .0 .0 .0 .0 .0 .0 24.3 .8 50.22001 23.5 33.3 4.6 11.3 6.4 .0 .0 .0 .0 .0 26.8 32.82002 85.2 17.8 26.4 13.4 .0 .0 .0 .0 .0 2.6 12.8 57.82003 29.6 63.9 24.8 6.7 .2 .0 .0 .0 .0 .0 8.2 25.02004 38.4 18.7 6.4 .5 .2 .0 .0 .0 .0 1.9 58.2 15.52005 36.5 22.6 25.0 3.8 .0 .0 .0 .0 .0 .5 9.5 28.8
Mean Relative Humidity % Year Jan Feb Mar Apr May Jun Jul Aug Sep Oct Nov Dec1977 84.0 71.0 74.0 66.0 55.0 51.0 56.0 57.0 69.0 58.0 56.0 73.01978 64.0 68.0 66.0 48.0 38.0 52.0 49.0 62.0 60.0 48.0 56.0 74.01979 78.0 70.0 67.0 50.0 52.0 50.0 47.0 48.0 54.0 57.0 63.0 86.01980 87.0 85.0 79.0 62.0 44.0 50.0 59.0 56.0 53.0 50.0 57.0 75.01981 70.0 76.0 73.0 58.0 50.0 49.0 52.0 54.0 54.0 52.0 65.0 64.01982 76.0 75.0 70.0 56.0 56.0 45.0 54.0 57.0 58.0 56.0 69.0 75.01983 81.0 79.0 75.0 70.0 55.0 43.0 45.0 48.0 53.0 52.0 61.0 69.01984 79.0 63.0 69.0 61.0 46.0 55.0 56.0 64.0 55.0 54.0 80.0 79.01985 74.0 76.0 55.0 58.0 50.0 51.0 49.0 58.0 58.0 63.0 64.0 73.0
E1895 vol. 3 rev.

1986 75.0 76.0 64.0 52.0 57.0 50.0 51.0 56.0 56.0 63.0 79.0 78.0 Year Jan Feb Mar Apr May Jun Jul Aug Sep Oct Nov Dec1987 71.0 70.0 71.0 56.0 42.0 48.0 51.0 54.0 55.0 63.0 56.0 77.01988 78.0 73.0 73.0 52.0 40.0 46.0 49.0 50.0 50.0 62.0 59.0 73.01989 83.0 67.0 70.0 42.0 43.0 48.0 51.0 51.0 54.0 57.0 67.0 72.01990 77.0 81.0 67.0 57.0 49.0 48.0 50.0 53.0 64.0 55.0 52.0 63.01991 78.0 75.0 72.0 51.0 47.0 48.0 55.0 60.0 59.0 58.0 64.0 84.01992 82.0 88.0 75.0 66.0 46.0 53.0 55.0 57.0 56.0 47.0 65.0 89.01993 83.0 85.0 75.0 61.0 64.0 57.0 65.0 64.0 73.0 72.0 76.0 83.01994 88.0 82.0 83.0 54.0 57.0 59.0 62.0 66.0 72.0 71.0 87.0 89.01995 83.0 83.0 73.0 62.0 57.0 57.0 63.0 63.0 62.0 67.0 62.0 84.01996 84.0 71.0 81.0 58.0 41.0 47.0 43.0 46.0 47.0 51.0 61.0 73.0
Year Jan Feb Mar Apr May Jun Jul Aug Sep Oct Nov Dec1997 72.0 71.0 72.0 54.0 37.0 44.0 47.0 56.0 52.0 54.0 70.0 78.01998 81.4 74.4 67.9 50.6 45.1 48.1 47.6 48.9 50.9 47.1 49.2 59.11999 68.0 68.0 53.0 47.7 44.7 57.3 55.5 56.9 57.5 63.5 57.1 54.12000 78.0 73.0 70.0 53.0 50.0 48.0 46.0 64.0 68.0 70.0 64.0 86.02001 76.7 79.2 59.5 53.2 50.5 42.2 56.0 63.0 72.3 66.0 71.5 83.12002 85.4 65.0 63.2 65.6 56.2 55.1 48.8 56.9 53.8 58.8 62.8 82.92003 77.7 78.6 78.2 56.4 37.0 47.5 47.3 54.2 62.8 60.4 61.9 83.82004 86.5 80.9 61.4 53.5 51.1 53.1 48.6 67.0 61.2 50.9 67.1 71.32005 72.0 75.5 65.6 46.0 47.5 46.2 44.3 50.9 52.3 52.7 59.2 58.5
Relative Wind Direction o Year Jan Feb Mar Apr May Jun Jul Aug Sep Oct Nov Dec1992 202.0 251.0 290.0 298.0 298.0 282.0 285.0 289.0 295.0 333.0 75.0 228.01993 268.0 276.0 287.0 280.0 271.0 281.0 280.0 284.0 289.0 66.0 28.0 74.01994 201.0 275.0 294.0 313.0 297.0 295.0 280.0 304.0 308.0 98.0 257.0 174.01995 97.0 287.0 322.0 303.0 323.0 310.0 314.0 322.0 311.0 308.0 86.0 110.01996 201.0 283.0 274.0 306.0 302.0 306.0 301.0 307.0 301.0 311.0 100.0 205.01997 83.0 274.0 273.0 270.0 300.0 293.0 301.0 300.0 313.0 306.0 126.0 239.01998 233.0 9.0 278.0 266.0 277.0 287.0 280.0 287.0 297.0 263.0 332.0 97.01999 157.0 261.0 295.0 293.0 306.0 297.0 295.0 293.0 302.0 306.0 17.0 92.02000 246.0 283.0 283.0 280.0 298.0 310.0 320.0 322.0 316.0 323.0 125.0 214.02001 202.0 240.0 288.0 292.0 290.0 300.0 297.0 297.0 296.0 289.0 289.0 226.0
Year Jan Feb Mar Apr May Jun Jul Aug Sep Oct Nov Dec2002 233.0 96.0 275.0 291.0 295.0 302.0 296.0 293.0 312.0 295.0 107.0 222.02003 243.0 258.0 281.0 299.0 315.0 302.0 304.0 293.0 302.0 312.0 83.0 134.0
E1895 vol. 3 rev.

2004 252.0 280.0 321.0 305.0 301.0 312.0 313.0 315.0 306.0 308.0 145.0 112.02005 238.0 276.0 310.0 306.0 308.0 309.0 298.0 286.0 282.0 283.0 82.0 119.0
Mean Wind Speed Knots (1 knot is approximately 1.85 km/hr) Year Jan Feb Mar Apr May Jun Jul Aug Sep Oct Nov Dec1977 7.3 6.5 7.3 9.1 5.6 5.5 7.4 6.3 7.41978 4.1 4.6 5.4 4.2 5.2 4.2 4.9 2.2 1.4 2.71979 5.1 6.6 7.4 8.9 6.0 7.1 6.9 5.8 5.2 4.7 7.3 7.41980 6.2 6.1 5.8 7.9 7.1 6.4 9.3 6.3 4.8 3.2 4.4 4.71981 6.9 5.8 6.6 5.5 5.0 5.0 5.2 3.9 2.4 1.2 3.9 3.91982 4.1 6.0 6.8 4.4 5.4 4.9 7.2 6.1 3.2 2.5 4.1 3.41983 6.7 6.6 5.9 6.1 5.8 6.5 6.4 6.3 5.4 5.4 5.1 4.71984 5.1 5.9 7.8 8.1 6.8 7.4 7.5 6.9 4.5 4.9 5.0 5.81985 5.1 10.8 7.7 7.0 6.2 8.2 6.8 6.1 5.7 5.9 4.8 5.41986 7.1 5.9 5.9 7.8 7.1 7.9 8.2 7.3 5.3 5.1 7.0 5.8
Year Jan Feb Mar Apr May Jun Jul Aug Sep Oct Nov Dec1987 5.8 6.5 8.3 6.3 5.8 8.4 8.4 6.3 5.9 5.5 6.7 6.71988 7.6 9.5 9.8 8.4 8.6 8.5 8.4 8.1 5.7 5.9 6.6 8.71989 5.3 7.3 7.7 5.9 7.1 7.9 7.2 6.3 7.2 6.1 8.5 6.21990 9.4 8.0 10.0 7.3 8.4 8.8 8.5 6.5 5.2 5.6 6.6 5.71991 5.8 6.1 6.6 8.6 9.0 8.0 9.8 8.3 5.0 5.3 5.0 7.11992 7.5 10.2 7.0 7.0 7.1 7.6 7.1 5.8 6.5 4.0 8.4 7.51993 7.3 6.3 8.2 7.6 8.1 8.1 9.9 8.4 7.0 7.1 8.6 8.61994 10.5 10.2 7.4 8.0 7.8 10.2 11.7 6.9 4.9 4.8 7.3 6.51995 4.4 7.2 5.8 5.7 6.7 7.8 8.5 7.4 6.4 4.9 7.0 6.61996 7.8 7.5 8.2 8.5 7.1 7.2 8.9 7.9 7.7 7.8 10.3 6.1
Year Jan Feb Mar Apr May Jun Jul Aug Sep Oct Nov Dec1997 7.6 9.0 9.7 9.6 7.9 8.7 11.0 10.0 6.5 4.9 7.8 7.21998 8.2 7.4 10.3 7.3 8.6 7.3 8.2 5.1 5.1 3.4 3.5 5.11999 5.1 5.1 6.4 6.1 5.7 6.4 6.6 4.1 3.7 3.1 3.7 4.02000 6.3 5.4 5.2 5.0 5.9 5.2 5.2 6.8 2.3 5.4 4.4 3.82001 5.0 7.2 6.4 7.3 6.9 5.7 6.1 5.3 4.0 3.4 4.3 3.52002 6.0 6.0 5.8 5.2 4.5 4.7 4.0 3.5 4.3 4.1 8.6 8.52003 6.0 9.5 8.3 6.8 7.5 7.1 8.3 5.6 5.5 5.3 5.5 7.42004 6.5 6.5 6.3 7.9 7.1 6.0 5.0 4.8 2.7 2.1 4.5 5.02005 8.0 8.9 5.6 7.7 8.0 7.3 7.6 7.3 5.1 4.5 5.8 6.1
E1895 vol. 3 rev.

E1895 vol. 3 rev.

BIODIVERSITY MONITORING REPORT
Objective This study has assessed the direct and indirect impacts of the proposed Ghabawi landfill cells 2and 3, in addition to the proposed leachate treatment plant as part of the Municipal Solid Waste Management and Carbon Finance project , on various aspects of Terrestrial biological environment in the project area along the project life. During the three phases of the project; construction, operation and decommissioning, the following parts of the biological environment have been the study targets Bio-geographical zones where the project area exists, Flora of the project area: This includes vegetation coverage, vegetation communities, and rare and endangered vascular plant species. Fauna of the project area: Among this large taxonomic group, there will be certain smaller groups to study. These groups are considered easy to assess bio-indicators for the status of the fauna because of their higher trophic levels. These groups are large mammals, conservation important small mammals, birds especially the conservation important resident species and conservation important reptiles. Sensitive (Critical) Habitats: These are the areas of biological importance, which includes; Protected Areas, National Parks, Range land Reserves, Important Bird Areas, Wetlands under Ramsar Sites, Unique Habitats and Ecosystems and isolated natural sites (Biodiversity Islands).
Scope The study has correlated these target biological environment aspects with their physical environment units. The effects of the predicted impacts that would occur for these physical environment units on the biological environment aspects in the project area were examined.
Methods In order to meet the objectives and scope of this study, different methods were used to assess the existing biological environment aspects at the project area and to evaluate the expected impacts on these aspects. Methods included the following: Literature Survey: In this part, the survey team collected and reviewed the available data about the biological environment in the project area. Data collection was achieved through:
E1895 vol. 3 rev.

• Library search for the available reference on the biodiversity or any related biological aspects;
• References from institutions that are working in this field of specialty such as the Ministry of Environment (MoE), the Royal Society for Conservation of Nature (RSCN) and the University scientists and specialists;
Field Work Survey: This survey was completed and updated the literately collected data. Different techniques were used in the field to assess the biological environment as the following: Line Transects: This technique was used to study most of the biological aspects of environment as the following:
• Flora: Line Transects was commonly used to study changes in vegetation along a physical environmental gradient. Also it was used to estimate overall density of cover values of species in a single type of vegetation, which also can be correlated to various physical environmental factors such as salinity, humidity, soil composition, topography etc.
• Fauna: In this technique, researchers walked the project area in a systematic
way that enabled them to cover the whole area. This technique was applied for different target groups of fauna as follows:
• Birds: line transects were effective method to study birds of extensive open
habitats in both terrestrial and wetland habitats. This method was used to identify counting density along various environmental gradients.
• Mammals: line transects technique was applied for both large and small
mammals, and for large reptiles. It was the easiest and direct method for counting mammals and or recording them through a gradient of various environmental factors. It depends mainly on recording their singes like foot pints, spoors and body remnants.
Interviewing Technique: This technique was used to study the historical record for the flora and fauna of the area; it was used to correlate the environmental changes with the change on the biological environment, then to build up the prediction for the future trend in biological environment with the presence of the expected impacts of the project. The technique depends on designing a questionnaire and distributes it between old locals and residents of the surrounding area or workers in the project area, the questionnaire filled by the locals themselves or with the help of the researchers in the field.
E1895 vol. 3 rev.

Environmental and Conservation Measures: Biodiversity in Jordan has declined sharply in the second half of the last century due to different reasons such as rapid population growth, rapid and unplanned urbanization, lack of land use policies, etc. Recently, the need to preserve and protect what is left from our biodiversity has become the mission of many governmental and non-governmental organizations. On the national level, there are 18 acts and eight regulations that include provisions on environmental protection, these laws and regulations are enforced through different governmental agencies. Some of these acts and regulations that pertain to this project are:
- Crafts and Industries Law no. 16 / 1953 and related regulations. - Organization of Natural Resources Affairs Law no. 12 / 1968. - Quarries Law no. 8 / 1971. - Regulations for protection of birds and wildlife and rules governing their hunting
(Reg. No 113, 1973). - Traffic Law no. 14 of 1984. - Law of Environment Protection, 2003.
On the international level, Jordan has participated in and signed international conventions that protect the environment and biodiversity as well. International agreements that are protecting Jordan’s’ biodiversity related to these projects are as follows:
- Convention on Biological Diversity (Rio de Janeiro, 1992), Ratified 1996. - Convention on the conservation of the migratory species of Wild Animals (Bonn,
1979). - Convention on International Trade in Endangered Species, CITES of wild fauna
and flora (Washington, DC, 1973), Ratified - Convention on Wetlands of International Importance Especially as Waterfowl
Habitats (Ramsar, 1971), Ratified.
Environmental Information
Evaluation of Physical Environment:
Location The project locates at east of Amman at Al Ghabawi area, about 9 km to the east of Amman ring road. The project place is within the operating Ghabawi landfill to the east of cell 1.
Topography The project is located at one of he topographic regions in the country, that the Highlands Topographic Region. The Highlands region extends from Um Qais in the north passing
E1895 vol. 3 rev.

through Ajlun Mountains, the hills of Amman and Moab regions, and the Edom mountains region. Many creeks and wadies drain from these hills from north to south and lead to the Jordan River, Dead Sea and Wadi Araba. The southern highlands are higher than those in the north, while the reverse is true concerning the variety of vegetation types and their density. The project site comprises of flat terrain within the boundaries of Al Ghabawi landfill where very shallow flash flood depression is seasonally formed to the east of the proposed sites for cells 2 and 3.
Soil Type There is a direct correlation between soil type, and the vegetation types. Al-Eisawi (1985) concluded that the soil of Jordan is highly variable and affects the vegetation type. The soil type at the project area is Terra-Rosa and/or Rendzina soil: these soil types are found in the Mediterranean zone, and they are considered the richest types used for cultivation.
Climate According to the analysis made by Al Eisawi (1996), which was based on Emberger quotient (EMBERGER, 1955), the project area includes the following bioclimatic zone: Semi-arid Mediterranean Bioclimatic Zone: this zone characterizes the project area. This zone extends from the fields of Madaba till the borders of Zarqa. The average minimum temperature during the coldest month (January) varies approximately between -1ْْ C and +7ْْ C. The average maximum temperature during the hottest month (August) ranges between 26ْْ C and 33ْْ C.
Evaluation of the Biological Environment:
Flora
Biogeographic Zones Mediterranean Biogeographic Zone The project site exists in this biogeographic zone which is restricted to the highlands of Jordan extending from Irbid in the north to Ras Al-Naqab in the south. The altitude ranges from 700-1750 m above sea level. The rainfall ranges from 300-600 mm. The minimal annual temperature ranges from 5-10°C and the mean maximum annual temperature from 15-25°C. Soil type is dominated by the red Mediterranean soil (Terra Rosa) and the yellow Mediterranean soil (Rendzina). This region comprises the most fertile part of Jordan and presents the best climate for the forest ecosystem.
E1895 vol. 3 rev.

Ecosystems The proposed project area is represented in one major Ecosystem, Scrap and Highland Ecosystem. This ecosystem consists of escarpments and mountains, hills and undulating plateaus, which extend mainly from Irbid in the north to Ras Al Naqab in the south, and, from Rift Valley region in the west to the Badia in the east. The mountains in the southern of this zone are higher on average, and some range between 1200 m and 1600 m high. Mediterranean woodland of pine and oak, with juniper and cypress more locally is believed to have originally covered large tracts of the Jordanian highlands, but the human and climatic factors resulted in high deforestation and replacement of natural vegetation by secondary species. The largest remaining areas of natural woodland occur in the highlands between Amman and North of Jordan, and are dominated by Pinus halepensis above 700 m, whilst mixed evergreen/deciduous oak woodland of Quercus calliprinos and Q. ithaburensis dominate at lower elevations where the original pine-dominated woodland has been degraded. Cultivation of rain fed wheat widespread on the plateau between Madaba and Irbid, and olive groves cover a large part of the northwestern mountains above 700m. More than 80% of Jordan’s cities and villages occur within this zone.
Vegetation Types The project area is characterized by two vegetation types, these types are the following: Steppe Vegetation This vegetation is confined to the Irano – Turanian biogeographic zone and may intrude either into the Mediterranean as in the project area or the Saharo- Arabian zone. The composition of this vegetation varies according to the soil and climatic differences depending on its location with respect to the Mediterranean zone. For example the steppe vegetation in the Northern Ghor which links with the Northern mountains is dominated by Retama raetam, Ziziphus lotus, Z. nummularia, and Ferula communis with almost no Artemizia herba-alba, while the steppe vegetation in the North, East and South Mediterranean borders shows other elements like Pistacia atlantica, Anabasis syriaca and Artemisia herba –alba which are not found in the western steppes. This might be due to the fact that the western steppes are more affected by the tropical conditions and vegetation in the Rift Valley, while the Eastern steppes are more affected by the Sahara conditions and vegetation. Therefore, variation in the vegetation composition are recognized, a fact that led to distinguish distinct sub- divisions of the major type. However, since it is very difficult to
E1895 vol. 3 rev.

make a clear distinction between the different types it would be more advisable not to sub divide this type of vegetation. The common features of this type of vegetation are the presence of shrubs and bushes and the absence of tree vegetation. This vegetation type forms a strip surrounding the Mediterranean region. The common species in this type are: Retama raetam Artemisia herba-alba Pistacia atlantica Noaea mucronata Ziziphus lotus Ziziphus nimmularia Asphodelus aestivus Urgiea maritime Anabasis syriaca Ferula communis Hammada spp. Gypsophila Arabica Salsola spp. Astragalus spinosus Tamarix spp. Crocus moabiticus Family Species Importance Caryophyllaceae Paronychia argentea Used in traditional medicine for
the treatment of kidney stones. / under pressure
Chenopodiaceae Salsola vermiculata Palatable for livestock Achillea fragrantissima Used in traditional medicine for
the treatment of stomach ache and digestive disorders./ under pressure
Artemisia herba alba Used in traditional medicine for the treatment of stomach ache and digestive disorders./ under pressure and palatable for livestock
Compositae
Ifloga spicata Palatable for livestock Cucurbitaceae Citrullus colocynthis Used in traditional medicine for
the treatment of Arthroides. Poa sinaica Palatable for livestock Graminae
Stipa capensis Palatable for livestock Labiatae Teucrium polium Used in traditional medicine for
the treatment of stomach ache./ under pressure
Liliaceae Urginea maritime Used in recent medicines for the treatment of heart disorders.
Table 1: Conservation Important Species
Mediterranean Non-Forest Vegetation The Mediterranean zone, which is not covered by forests, contains some shrubs and bushes. Such zone is often referred to as Garigue and Batha Mediterranean vegetation. The leading species of this vegetation are Rhamnus palaestinus, calycotome villosa, Sarcopoterium spinosum and Cistus spp. in the North and Artemisia herba-alba will be associated with others in the South.
E1895 vol. 3 rev.

The Mediterranean non-forest vegetation is treated as degraded forest. Therefore, some scientists believe that if this vegetation is protected, steps toward forest climax will be observed until the final stage is reached. It is found in the entire Mediterranean zone except the forestlands and the cultivated lands. Common species in this vegetation type are: Rhamnus palaestinus Capparis spinosa Echinops spp. Sarcopoterium spinosum Dactylis glomerata Horedeum bulbosum Teucrium polium Varthemia iphionoides Ononis natrix Artemisia herba-alba Ballota undulata poa bulbosa Eryngium glomeratum Thymus capitatus Noaea mucronata Asphodelus aestivus Calycotome villosa Asparagus aphyllus Family Species Importance Araceae Biarum angustatum Common but start to decrease.
Sensitive to plowing Scorzonera papposa Common/ recently under
pressure as roots collected and edible
Achillea falcate Used in traditional medicine for the treatment of stomach ache./ under pressure
Varthemia iphionoides Used in traditional medicine for different digestive disorders.
Compositae
Phagnalon rupestre Used in traditional medicine (Burning) for all joints pains.
Cruciferae Allysum iranicum Restricted to Ras al Naqab area Graminae Poa bulbosa Palatable for livestock
Ononis natrix Palatable for livestock Leguminosae Onobrychis crista-galli Palatable for livestock Liliaceae Allium truncatum Recently under pressure as
bulbs collected and edible Malvaceae Malva parviflora Leaves collected and edible Rhamnaceae Rhamnus palaestinus Decreasing/ cut for fire wood
Table 2: Conservation Important Species
Fauna:
Mammals The mammals of the project area are almost representing most of the mammals of that found in the two vegetation types represented in the project area. These zoogeographic zones are: Mediterranean Zoogeographic Zone This is a distinct sub region within the Palearctic region (European Origin). It includes mountain areas that extend from the north of Jordan till Al Naqab Mountains in the
E1895 vol. 3 rev.

south. In the project area, mammals that belong to this zone exist in Al Naqab Mountain in the south and in the southern of Amman, to the east and to the west of the Desert highway. Family Scientific Name Common Name Status
Erinaceus concolor Common Hedgehog Insufficient data Erinaceidae Hemiechinus auritus Long-eared Hedgehog Insufficient data
Soricidae Corcidura suaveolens Lesser white-toothed shrew Vulnerable Canis aureus Golden jackal Vulnerable Canidae Canis lupus Grey Wolf Nationally Threatened Felis caracal Caracal Nationally Endangered Felidae Felis silvestris Wild Cat Vulnerable
Herpestidae Hepestes ichneumen Egyptian mongoose Vulnerable Hyaenidae Hyaena hyaena Striped hyena Nationally Threatened
Martes foina Rock Marten Nationally Threatened Meles meles Common Badger Nationally Threatened
Mustelidae
Vormela peregusna Marbled Polecat Vulnerable Procaviidae Procavia capensis Hyrax Nationally Threatened Spalacidae Spalax leucodon Mole Rat Vulnerable Hystricidae Hystrix indica Indian crested porcupine Vulnerable
Table 3: Important Mammals found in this Zoogeographic Zone Saharo – Sindian Zone (also referred to as the Saharo-Arabian and Irano-Turanian phytogeographic region by Zohary 1973). This zone is located to the east of the mountain ranges, extending from south of Jordan to northeast of the country in Mafraq area. It is another sub region within the Palearctic and includes the Sahara Desert, The Arabian Desert. The majority of the project’s mammals are belonging to this zone. Examples of the Sahro-Sindian mammals are: Family Scientific Name Common Name Status
Paraechinus aethiopicus Desert Hedgehog Insufficient data Erinaceidae Hemiechinus auritus Long-eared Hedgehog Insufficient data
Soricidae Corcidura suaveolens Lesser white-toothed shrew Vulnerable Canis aureus Golden jackal Vulnerable Canis lupus Grey Wolf Nationally
Threatened Vulpes cana Blanford’s fox Nationally
Endangered
Canidae
Vulpes rueppelli Sand Fox Nationally Endangered
Felis caracal Caracal Nationally Endangered
Felis silvestris Wild Cat Vulnerable
Felidae
Felis margarita Sand Cat On the verge of Extinction
Hyaenidae Hyaena hyaena Striped hyena Nationally Threatened
Vormela peregusna Marbled Polecat Vulnerable Mustelidae Mellivora capensis Honey Badger Nationally
Threatened
E1895 vol. 3 rev.

Procaviidae Procavia capensis Hyrax Nationally Threatened
Bovidae Capra ibex Nubian Ibex Nationally Endangered
Hystricidae Hystrix indica Indian crested porcupine Vulnerable
Table 4: Important Mammals found in this zoogeographic zone
Birds Jordan has a wide diversity of bird habitat types due to its varied topography and climate and its biogeographical location. More than 425 bird species have been recorded in Jordan, of which more than 141 species are breeding birds and this number might increase with the continuous research. Jordan lies on the main route of bird’s migration between Africa, Asia and Europe. Millions of birds are migrating over Jordan each year, among which the majority of the Jordanian avifauna is belonging. The huge number of migrant birds that visit Jordan twice a year has made the country of a great importance for the global avifauna. The proposed project area for this project is not located at one of the birds migration fly ways but close to the west of the raptors and eastern desert fly way for migratory birds. Family Scientific Name Common Name Status Anatidae Marmaronetta angustirostris Marbled Duck Globally Threatened Falconidae Falco naumanni Lesser Kestrel Globally Threatened Otididae Chamydotis undulata Houbara Bustard Globally Threatened Accipitridae Aegypius monachus Black Vulture Globally Threatened Strigidae Ketupa zeylonensis Brown Fish Owl Globally Threatened Phasianidae Francolinus francolinus Black Francolin Regionally Threatened Accipitridae Gypaetus barbatus Lammergeier Regionally Threatened Accipitridae Torgos tracheliotus Lappet-faced Vulture Regionally Threatened Passeridae Passer moabiticus Dead Sea Sparrow Restricted to Middle
East Fringillidae Serinus syriacus Syrian Serin Restricted to Middle
East Fringillidae Corpodacus synoicus Sinai Rosefinch Nationally Threatened Paridae Parus caeruleus Blue Tit Nationally Threatened
Table 5: Important Breeding Birds Family Scientific Name Common Name Status Ardidae Botaurus stellaris 1 Great Bittern
Globally Threatened
Accipitridae Aquila heliaca Imperial Eagle Globally Threatened Rallidae Crex crex Corn Crake Globally Threatened Accipitridae Buteo buteo Buzzard Significant Proportion of
the World Population Accipitridae Pernis apivorus Honey Buzzard Significant Proportion of
the World Population Accipitridae Aquila nipalensis Steppe Eagle Significant Proportion of
the World Population
E1895 vol. 3 rev.

Accipitridae Accipiter brevipes Levant Sparrowhawk Significant Proportion of the World Population
Table 6: Important Migrant Species
Baseline Results According to the baseline strategy the proposed project’s area was sampled by the study team, the baseline results are presented as the following: Flora The proposed site for the new cells 2 and 3 in addition to the leachate treatment plant have very poor vegetation cover that was due to natural causes where the distribution of the vegetation is restricted to the very shallow depressions. Also due to the past use of the site and the surrounding by the landfill management. However, remnants of the natural vegetation cover were recorded in the proposed site and the surrounding area which of common species and ecologically considered a sign for a high degradation levels in the projects area habitats. Only two species of natural plan found in the proposed site of this project that are representing the two vegetation types found at the project area. These plant species are not of conservation importance since they are common at these vegetation types. Recorded Plant Species: Rhamnus palaestinus: This plant is considered decreasing in the country since it used for making fire in some nomad communities, but at the site it was removed in the past to prepare land for existing landfill management. Anabasis syriaca: common and do not have any conservation value. Fauna Due to the deterioration and the absence of the natural vegetation at the proposed site for the project, the faunal diversity recorded at the site is also very minimal. Only, one species of reptiles, three species of mammals and five species of birds where recorded at the proposed site of the project and the surrounding area within 500 meter from the proposed sites borders. The recorded fauna species and their conservation are the following:
E1895 vol. 3 rev.

Reptiles Acanthodactylus boskianus: It is common at various habitats in Jordan in spite that this species prefer natural vegetation cover but it also found in high numbers at agriculture lands. Mammals Lepus capensis; Cape Hare: This species has been recorded through interviewing locals, who are approved the presence of the cape hare in the area, in spite of the sharp decrease in its numbers due to the human activities and habitats loss. The conservation status of this species in Jordan is not well defined due to the insufficient data about this species, however its is more common in the eastern parts of Jordan where the open desert considered a very suitable habitat for the Cape Hare. Rattus rattus; Common Rat: This species has been recorded during the baseline survey through the borrows records and the scats and foot prints, in addition to the information obtained from landfill staff who are mentioned the presence of this species. This species has no conservation status where in considered common in and near human settlements and its distribution connected to the human activities especially agriculture where in might be considered as a pest in the cases of out spread. Vulpes vulpes; Red Fox: One of the most common large mammals in Jordan, which found in most of the Jordanian habitats and ecosystems. This species recorded at the project proposed site is through foot prints and scats, also interviewing landfill staff has confirmed the presence of this species in the project area. Birds Streptopelia senegalensis; Laughing Dove: This species has been recorded at the proposed site for the project by direct observation. It is one of the most common birds which found at different habitats. It has no important conservation value. Galerida cristata; Crested Lark: One of the most common bird in the northern half of Jordan. It is resident at almost all of the habitats in the country and known to follow the cultivated lands in its distribution. It has been recorded at the proposed site of the project by direct observation. The conservation status of this bird of Jordan is common and is not threatened.
E1895 vol. 3 rev.

Pycnonotus xanthopygos; Yellow-vented Bulbul: A very common and resident bird that found in mainly at the semi urban habitats, and those contain cultivated lands. It has been recorded through direct observation. Oenanthe deserti; Desert Wheatear: It is a widespread desert bird that even found at the transitional zones between the desert habitats and others. The presence of this species at the proposed site of the project is a proof for the Saharan fauna intrusion in the area. This species recorded by direct observation at the project site. Passer domesticus; House Sparrow: A very common resident bird, which clearly attached to human activity and settlements. It was recorded through a direct observation at the proposed site of the project.
E1895 vol. 3 rev.
Minutes of Meeting A Second Public Consultation Session was held at King Hussein Cultural Centre in Amman for the purpose of presenting the main findings and recommendations proposed in the ESIA to the related stakeholders and parties affected by the Municipal Solid Waste Management & Carbon Finance Project. Approximately 40 people attended the Session from different institutions including governmental, non-governmental organizations, civil society and local communities. The session was composed of one presentation carried out by ECO Consult with further clarifications and discussions by members of GAM. The ESIA process, project objectives, project components, baseline, methodology, environmental and socio-economic impacts, alternatives, mitigation and monitoring measures proposed in addition to recommendations for institutional strengthening and compliance, were described during the presentation. The following is a list of the presentations and speeches that took place during the Session: A Welcome Note was given by Eng. Ra’ed Daoud, ECO Consult, greeting all the attendees. Next, an introductory speech was given by Mr. Majid Shafagowg, GAM, where the importance of strategic planning in order to improve the population’s health and safety was emphasized. A brief description of the landfill conditions as well as the main objective of reducing environmental impacts was pointed out. In addition, Mr. Shafagowg highlighted that Jordan has signed the Kyoto Protocol and this project is one of the first projects in the country designed to minimize GHG emissions. Furthermore, he indicated that due to the global increase on fuel prices, it is essential to look for alternative sources of energy. He also called attention to the importance of including comments from the local communities during the project assessment. Eng. Ra’ed Daoud then introduced the ESIA process mentioning that this project is a World Bank financed project, to whom the ESIA has been submitted and currently assessed, and where the World Bank Operational Policies OP 4.01 have to be met. According to OP 4.01, after submission of the draft ESIA report, a Second Public Consultation Session is required. During this session, the main findings and recommendation of the Study, rather than every detail included in the report, need to be presented to project-affected groups and local non-governmental organizations. He also stated that consultations with different sectors, Ministry of Environment, GAM and local communities is essential to ensure that all aspects are addressed. After that, Eng. Ra’ed Daoud presented the main sections of the ESIA including, as mentioned above, project objectives, project components, baseline, methodology, environmental and socio-economic impacts, alternatives, mitigation and monitoring measures proposed in addition to recommendations for institutional strengthening and compliance. Yousef Al-Hamedien ,from Al Beidah Society highlighted that the Ghabawi Landfill site is within close proximity of the Albeidah area and uncertain whether this issue has been addressed in the first scoping session since he was not present.
E1895 vol. 3 rev.

2
He further pointed out that the ESIA study takes into account many different environmental and socio-economical aspects but lack a humanitarian perspective. An example of this is the consideration of labour health and safety but not of those people residing within Albeideh community. The presence of Ghabawi Landfill in the area is a main source of health issues that must be addressed. Also, he noted that it is a known fact that a landfill must be a distance of 60 km of any community which is not the case for Albeideh and Ohod areas. These areas have a promising investment potential and thus impacts on them must be thoroughly assessed. What are the potential impacts on these communities? What are the precautionary methods to prevent detrimental errors from taking place? There are currently 4 million tones of solid waste at Ghabawi, what are the potential impacts of gases emitted from the site on people? He indicated that all four communities, Alkhafashieh, Albayada, Almonadel and Wadi Alkhattar, are prepared to write formal letters expressing their concern with the presence of Ghabawi Landfill site, its endangerment to their health and safety as well as their apprehension to having similar impacts as those witnessed at the Ruseifeh Landfill. The current location of Ghabawi Landfill will have to be reconsidered due to urban expansion, increased economical trading activities witnessed in the area. Eng. Raed Daoud explained that the location has been chosen based on many studies performed before the initial site selection which was not part of this ESIA. The Ruseifeh issues will not be repeated. These studies were carried in order to eliminate all impacts related to the Ghabawi Landfill. He also mentioned that Eng. Majed will explain in further details the siting. The communities located near the landfill are relatively small and impacts on them are minimal based on the air quality studies carried out since all standards were met. He also brought up the fact that the project will improve overall management in particular cell management taking into consideration all anticipated impacts. Eng. Majed, GAM commented that there are many infrastructures and industries in the region of Amman that are creating great environmental impacts without any assessment associated with them. For example, industries in nearby communities are causing far worse impacts on the communities of concern than those linked with Ghabawi Landfill. Based on soil sampling and geophysical testing of the site and based on the current design of the landfill liner and cover, no great impacts on the aquifers were identified and thus the Ghabawi site was chosen. The location is 37 km away from central Amman. In the process of selecting Ruseifeh Landfill, studies of this kind were not carried out. However, he pointed out that currently after site closure in 2003 measures are being implemented to reduce the impacts of that site and its been proposed to set up a garden at the site. Also, the Ghabawi project, being a CDM, and the components within this project will reduce emissions especially in the nearby communities, a positive impact. He agree that winds may carry with it some odour but assured that through wind studies, wind directions is not directed towards the towns during the majority of the year.
E1895 vol. 3 rev.

3
Eng. Thaer Abadi, GAM explained that the public disclosure related with the site selection performed for the Ghabawi landfill was the first of its kind in Jordan, and was even performed in 2000 – 2001 before the EIA law was implemented. During that study the local community and stake holders were contacted through broadcasted messages on the radio in addition to regular letters. The results of these discussions illustrated that the main concerns were those related to traffic and transfer stations. He added that it is known that traffic is not a crucial concern as the trucks will be traveling on the highway. He then added that the implementation of this project in fact reduce environmental impacts since it improves solid waste management and thus is essential to the community. In response to potential increase of health problems in particular those related to vector transmission, he commented that a daily cover is being implemented at the site in order to reduce such impacts and doubts that this is of significance. Yousef Al Hamedien replied that he completely understands that the project is to improve the current situation but is concerned whether the Albeidah population size of 10,000 (and increasing) was taken into consideration. He also argued that the comments collected in 2000-2001 did not taken into account those of the farmers in the area. He then urged everyone to consider human health as the top priority and should be considered prior to any project. Raed Daoud, Eco Consult explained that he has conducted various site visits to the area and there were only two farms present using local ground water wells. Farming has decreased in the area in the past years mainly due to decreased levels of water in the wells in the area. Also, the farms are about 10 km away from the site with a population size equal to 559 (projected to be 981). Yousef Al Hamedien disproved of the reply indicating that these numbers may be incorrect. Dr. Majed, GAM highlighted that GAM has all incentives to protect and improve human and environmental health. All alternatives that provide such support will be considered. Mohammed Dabbas, Ministry of Energy remarked that the project's CER component (waste to energy) has not been fully discussed as that in regards of waste collection alternatives. Did the assessment for waste to energy generation include best economical techniques? How were the different technologies assessed? He inquired why this project has not used innovative alternative techniques such as mixed energy generation technologies, pyrolysis, etc. He also queried the assessment in regards of potential formation of cracks leading to contamination of the groundwater indicating that there closest aquifer is within 200 m. As a recommendation, he stated that GAM should have diversified the usage of technologies for energy generation.
E1895 vol. 3 rev.

4
Raed Daoud described how the overall project has been split into two parts of which ECO Consult carried out the environmental assessment and another company the feasibility study. In the ESIA the project consisted of the fact the cell 1 in 2004 had 4 million tones of solid waste that produced harmful gases and leachate that needed to be mitigated. This project aims to improve the current situation that is endangering the environment. The potential of cracks taking place in the site has been studied in the ESIA and the findings indicated that none are present and since the site is not close to any major fault lines none are anticipated. Furthermore, the water is not potable that is located in the aquifer within close proximity to the site. However, extensive analysis was carried out which illustrated that if water from the landfill was to reach the aquifer it would have 100% no negative impacts. Eng Thaer, GAM added that the decision on energy generation was a strategic choice and is currently out of the hands of GAM. And even though there are alternative technologies available, this was the technology with the least risks. He further explained that technically it is cumbersome to select the best method for energy generation but it is important to utilize one that has been successful worldwide in more than a handful of cases. In response to cracks in the area, there are none discovered thus far, however in the event any become present the different technologies such as lining and treatment will minimize if not completely prevent any contamination from taking place. Mohammed Dabbas, Ministry of Energy argued that pyrlosis has been used in more than 75 countries and has been very successful. And he still insisted that mixed technology should have been the methodology used for energy generation. Raed Daoud mentioned that there must not be any generalizations made, cell 1 has been used beyond its capacity Eyad Batarseh mentioned that even if thermal technologies are used for waste to energy that would not eliminate the need for landfills. Further, the ash produced from water to energy facilities will possibly be more harmful to the environment than regular solid waste. Jordan should perfect sanitary landfilling before it uses more advanced and risky methods. Majed,GAM pointed out that the use of landfill is the best suited methodology for our environment. Mohammed Dabbas, Ministry of Energy highlighted that the objectives of the project are to reduce the environmental impacts and the CDM burning of gas is not achieving that objective. Sultan Mashagbeh, Ministry of Water stated that within the EMP, groundwater whether potable or non-potable has been addressed equally. He wanted to comment that a weakness of the ESIA lies within its lack to fully take into consideration the local communities. For example, the revenue produced from carbon trading could contribute to projects within the local communities to enhance their quality of living. Another draw back of the project is the finiacing is not clear and tearing of the lining is not presented.
E1895 vol. 3 rev.

5
He recommended that the details of the project can be presented to the local communities as a means to include them and further transparency. Also he added that there will be fines given to GAM in the event any contamination takes place from the slaughter house. Raed Daoud replied by pointing out that the socio-economic aspects of the project have been studies thoroughly and included within the ESIA. However, the recommendation of presenting the project to the local communities is an excellent one and will be further looked into. As for groundwater monitoring, this aspect has also been thoroughly studied and is included in the ESIA. Majed,GAM added that the slaughter house is a real issue and that GAM is currently studying and in the process of implementing precautionary measures to prevent further damage.
E1895 vol. 3 rev.

6
List of Invitees
Institution / Organization Invited
1. The Governorate of Zarqa 2. Environmental Protection Directorate /Zarqa 3. Agriculture Directorate/Zarqa 4. Land Directorate/Zarqa 5. Municipal Affairs Directorate/Zarqa 6. Zarqa Water Directorate 7. Zarqa Antiquities Directorate 8. Zarqa Health Department 9. Zarqa Municipality
Governmental Institutions in
Zarqa
10. Governorate of Amman 11. Public Security Directorate 12. Civil Defense Directorate 13. Director of Traffic 14. Director of Environmental Police 15. The Green Party
Governmental Institutions
16. Ministry of Environment/EIA Review Committee 17. Minstry of Environment 18. Ministry of Water & Irrigation 19. Ministry of Energy & Natural Resources Authority 20. Ministry of Tourism and Antiquities 21. Ministry of Agriculture 22. Ministry of Transport 23. Ministry of Health 24. Ministry of Public Works & Housing 25. Ministry of Trade and Industry, Committee for Prevention of Industrial Hazards 26. Minitry of Trade and Industry 27. Ministry of Labour 28. Ministry of Interior 29. Ministry of Municipal Affairs
Ministries
30. University of Jordan 31. University of Al Hashimiyyah
Higher Educational Institutions HEI
32. Jordan Environment Society (JES) 33. Queen Zein AlSharaf Society for Development
Non Governmental Organizations
E1895 vol. 3 rev.

7
Institution / Organization Invited 34. Jordan River Foundation 35. Hashemite Jordanian Fund
NGO's
36. Jordan Engineers Association Associations
37. Albeidah Society - Ohod and Albeidah areas Local Communities
E1895 vol. 3 rev.

8
List of Attendees
Attendee Institution / Organization Izzat Abu Hamra 1. Ministry of Environment Mohammad Al Alam 2. Ministry of Environment Dua'a Majali 3. Ministry of Environment Eng. Abd Al Karim Shalabi 4. Ministry of Environment Sulttan Mashagbeh 5. Ministry of Water and Irrigation Mohammad Al Refai' 6. Water Authority Ziad Abu Mahfouth 7. Ministry of Interior Ziad AL Qatarneh 8. Ministry of Interior Mohammad Dabbas 9. Ministry of Energy Rawan Al Moubarak 10. Ministry of Public works and housing Laila Tashamneh 11. Ministry of Public works and housing Abeer Abu Azzam 12. Ministry of Trade and Commerce Eng. Dalal Al Hanaifeh 13. Ministry of Transportration Eng. Abdullah Al Hamid 14. Ministry of Agriculture Eng. Mohammad Al Habees 15. Ministry of Agriculture Mohammad Radwan Al Zawhreh 16. Zarqa Municipality Dr. Kamel Abusal 17. Zarqa Health Directorate Dr. Jawad Al Bakri 18. University of Jordan Ali Al Raqqad 19. Local Community Council representative / Ohod Area Dr. Salameh Rueidan 20. Al Beidah / Ohod Area Yosef Al Hamedien 21. Al Beidah / Ohod Area Eng. Saliem Al Jamal 22. Environmental Police Representative Dr. Mohammad Khayri Al Abbadi 23. Jordanian Environment Society / Scientific Council Thair Al Qariouti 24. Public Health Department / Zarqa Mohammad Al Shawabkeh 25. Traffic Department Mahmoud Al Hajjaj 26. Civil Defense Department Zaidoon El Qasim 27. GAM Eng. Nedal Al Mousa 28. GAM Eng. Mohammad Al Faouri 29 .GAM Majid Shafagowj 30. GAM Yousra Haddad 31. GAM Lana Al Zu'bi 32. GAM Ammar Abu Drais 33. GAM Thair Al Abbadi 34. GAM Magboleh Abu Hazeem 35. GAM Shohra Haroon 36. GAM Ra’ed Daoud 37. Eco Consult Bann Zahir 38. Eco Consult Elena Tormo 39. Eco consult Sawsan Zaater 40. Eco Consult Eyad Batarseh 41. Eco Consult Khaldoon K. 42.
E1895 vol. 3 rev.

9
Photos
E1895 vol. 3 rev.