E-OCD II Debugger - ABOV Semiconductor
92
Global Top Smart MCU Innovator, ABOV Semiconductor www.abovsemi.com E-OCD II Debugger User’s Manual Version 1.0.2
-
Upload
khangminh22 -
Category
Documents
-
view
4 -
download
0
Transcript of E-OCD II Debugger - ABOV Semiconductor

Global Top Smart MCU Innovator, ABOV Semiconductor www.abovsemi.com
E-OCD II Debugger
User’s Manual Version 1.0.2

Contents E-OCD II User’s Manual
2
Contents
1 Introduction .................................................................................................................................... 4
1.1 E-OCD II The Chip and Onboard Debugging Solution ....................................................... 4
1.1.1 Software Requirements .......................................................................................... 4
1.1.2 Hardware Requirements ......................................................................................... 4
1.2 Software Installation ............................................................................................................ 5
1.3 Hardware Driver Detection ................................................................................................ 11
1.3.1 Human Interface Devices ..................................................................................... 11
2 E-OCD II Interface Hardware ....................................................................................................... 14
2.1 E-OCD II Interface ............................................................................................................. 14
2.1.1 Features of E-OCD II H/W .................................................................................... 14
2.1.2 E-OCD H/W Connection ....................................................................................... 15
2.1.3 Hardware Connection/Disconnection Procedures ............................................... 16
2.1.4 E-OCD II Interface Connection ............................................................................. 16
2.1.5 E-OCD II Interface Disconnection ........................................................................ 17
2.1.6 E-OCD II Power Out to Target System ................................................................. 17
3 Debugger Software (for Microsoft Windows) ............................................................................... 18
3.1 Debugger Software Features ............................................................................................ 18
3.1.1 Common Features ................................................................................................ 19
3.2 Menu Descriptions............................................................................................................. 21
3.2.1 File ........................................................................................................................ 22
3.2.2 View ...................................................................................................................... 23
3.2.3 Emulation .............................................................................................................. 28
3.2.4 Break/Configure .................................................................................................... 33
3.2.5 Power Out (3.3V or 5.0V) ..................................................................................... 42
3.2.6 Test ....................................................................................................................... 44
3.2.7 Window ................................................................................................................. 46
3.2.8 Help ...................................................................................................................... 47
3.2.9 Toolbar .................................................................................................................. 47
3.3 Child Windows ................................................................................................................... 48
3.3.1 Child Window Alignment ....................................................................................... 48
3.3.2 Code Dump View .................................................................................................. 51
3.3.3 Code Disassemble View ....................................................................................... 54
3.3.4 XDATA Dump View ............................................................................................... 56
3.3.5 IDATA (IRAM) Dump View .................................................................................... 59
3.3.6 SFR Dump View ................................................................................................... 61
3.3.7 Registers View ...................................................................................................... 62
3.3.8 Source View .......................................................................................................... 65
3.3.9 Global Variable View............................................................................................. 68
3.3.10 Local Variable View .............................................................................................. 74
4 Keil Plug‐in ................................................................................................................................... 76
4.1 Basic Features .................................................................................................................. 76
4.1.1 Getting Started ..................................................................................................... 77
4.1.2 User Guide ........................................................................................................... 77
4.2 Keil Plug-in Setup .............................................................................................................. 78
4.2.1 Bind PK51 ............................................................................................................. 78
4.2.2 Add Flash Control to Your Project ........................................................................ 79
4.2.3 Add Debugger Control to Your Project ................................................................. 80
5 IAR 8051 GUI (Compiler and Debugger) ..................................................................................... 81

UM_E-OCD II Debugger Manual (201109, 표준 문서 영문화 완료).docx
Contents
3
5.1 Basic Features .................................................................................................................. 81
5.2 USB Kernel Driver Installation ........................................................................................... 81
5.3 ABOV’s SDK DLL Connections ......................................................................................... 82
5.4 IAR Project Settings .......................................................................................................... 83
5.5 Download Hex File ............................................................................................................ 85
5.6 Cautions for Debugging .................................................................................................... 87
5.7 SDK DLL Compatibility According to IAR Versions ........................................................... 89
6 Appendix: E-OCD II Isolator Interface .......................................................................................... 90
Revision history ..................................................................................................................................... 91

Introduction E-OCD II Debugger User’s Manual
4
1 Introduction
1.1 E-OCD II The Chip and Onboard Debugging Solution
E-OCD II is short for ‘Enhanced On-Chip Debugger’. E-OCD II is a debugger tool for ABOV 8bit MCU.
E-OCD II is MCU debugging control via 2pin or 3pin (added RunFlag) OCD interface. E-OCD II is
dedicated to onboard programming and debugging via serial interfaces (DSCL, DSDA). E-OCD II
debugger supports all of ABOV’s M8051 devices.
In particular, the E-OCD II adds protection circuitry to the input and output ports for tough board-level
manufacturing lines for added durability and safety. E-OCD II is advanced function for USB driver,
Power out, low level detection more than OCD II. Power out function only supports 50mA current
consumption environment.
1.1.1 Software Requirements
The following operating systems must be used to install and run the E-OCD II debugger. Both 32-bit
and 64-bit versions are available.
Microsoft Windows Vista
Microsoft Windows 7
Microsoft Windows 8 & 8.1
Microsoft Windows 10
If you wish to carry out a full installation of the software, up to 20MB of hard disk space is required.
1.1.2 Hardware Requirements
The following are the minimum hardware requirements for installing and running the E-OCD II
debugger.
USB port
Performance is based on the following factors:
Processor performance
USB port performance
The E-OCD II debugger is not affected by the USB version (V1.0, V1.1, V2.0, or higher).

E-OCD II Debugger User’s Manual Introduction
5
1.2 Software Installation
The installer program can be downloaded from the ABOV website. It is recommended that the latest
version of the E-OCD II software be used because ABOV constantly adds newer devices and features.
Both 32-bit and 64-bit versions are available. To check the operating system details of the PC, open
the Control Panel and click on the System icon. The OS details can be identified as shown below.
1.2.1 Microsoft Windows 10
Figure 1-1 How to distinguish 32-bit & 64-bit operating systems for Windows 10

Introduction E-OCD II Debugger User’s Manual
6
To install the E-OCD II software, perform the following:
1) Execute the installer.
The 32-bit installer file name starts with ‘Setup32_’ keyword.
The 64-bit installer file name starts with ‘Setup64_’ keyword.
2) [64-bit systems only] Once the warning message below message box, click ‘Yes’.
Figure 1-2 User Account Control Message Box
3) Once the dialog box shown below opens, click ‘Next’.
Figure 1-3 InstallShield Wizard

E-OCD II Debugger User’s Manual Introduction
7
4) Read the license agreement. If agree, select I accept the items of the license agreement on
the license agreement dialog box and click ‘Next’.
Figure 1-4 License Agreement
5) Enter the ‘User Name’ and ‘Company Name’ and click ‘Next’.
Figure 1-5 Enter the User Name and Company Name

Introduction E-OCD II Debugger User’s Manual
8
6) Select ‘Complete’ and click ‘Next’.
Figure 1-6 Select a Setup Type
7) Click ‘Install’.
Figure 1-7 Begin the Installation

E-OCD II Debugger User’s Manual Introduction
9
8) Wait until all the application components are installed.
Figure 1-8 Installing
9) Click Finish to complete the installation.
Figure 1-9 InstallShield Wizard Complete

Introduction E-OCD II Debugger User’s Manual
10
Note the installation folder path. This information is needed when you install the hardware
driver.
32-bit: C:\Program Files\ABOV Semiconductor\OCD II_debugger32
64-bit: C:\Program Files (x86)\ABOV Semiconductor\OCD II_debugger64

E-OCD II Debugger User’s Manual Introduction
11
1.3 Hardware Driver Detection
1.3.1 Human Interface Devices
E-OCD II USB type is HID (Human Interface Devices). Windows of Microsoft support HID USB Driver.
So when E-OCD II debugger is connected to computer, HID USB Driver is installed to the computer
and user can use E-OCD II debugger automatically.
To check E-OCD II connection, follow the procedure:
1) Go to Device Manager to check HID connection.
Figure 1-10 System Information

Introduction E-OCD II Debugger User’s Manual
12
2) Find Human Interface Devices in list.
Figure 1-11 Device Manager : HID
3) Check HID properties to confirm E-OCD II Hardware Vendor ID
Figure 1-12 Device Manager : HID Properties

E-OCD II Debugger User’s Manual Introduction
13
4) Select Hardware Ids in Detail Tap of HID properties.
Figure 1-13 HID-compliant Device Properties
5) E-OCD II Hardware vendor ID is 0x1A29. If VID_1A29 is searched, E-OCD II is connected
properly.
Figure 1-14 HID-compliant Device Properties : Hardware Ids

E-OCD II Interface Hardware E-OCD II Debugger User’s Manual
14
2 E-OCD II Interface Hardware
2.1 E-OCD II Interface
The E-OCD II interface supports ABOV 8-bit MCUs that use either the OCD or OCD II interface logic.
So, the user can perform debugging for both OCD and OCD II-compatible MCU series using this
hardware.
2.1.1 Features of E-OCD II H/W
The E-OCD II interface is the most cost-efficient debugging solution for the MCUs developed by
ABOV
Semiconductor Co., Ltd. The E-OCD II interface is a sophisticated debugging tool. It is s more flexible
and faster than the OCD interface with the following features:
Support Devices for ABOV’s 8bit MCUs
Support MC95/96 and A95/96 series devices
E-OCD II supports Debugging and on-board programming
E-OCD II Serial supports ISP via serial interface (DSCL, DSDA)
10-pin external connector for Debugging and programming
USB HID transmission is applied to Hardware of E-OCD II.
Include two interface lines: SCLK and SDATA, and one option line: RTIME (run time
measuring)
Can measure the exact operating time of the target MCU down to the microsecond range -
In this case, RTIME must be connected.
Cover the full range of the target device’s operating frequency
Supply power to the target MCU available.
Power out current consumption limit 50mA
Target system operating voltage : 3V ~ 6V
Low Level transmission 1.0V ~ 5.5V
E-OCD II can debug full range of the target device’s operating frequency.
Enhanced protection circuitry for external I/O ports
512Byte expanded memory is added
Level Shift IC is added at DSCL, DSDA port for Low Level transmission
Support function for Power Out to Target B/D.
ESD Protection is advanced(2000V Human-Body, 200V Machine, 1000V Charged Device)

E-OCD II Debugger User’s Manual E-OCD II Interface Hardware
15
Two LEDs for ‘Power’ and ‘Debug Run’
Not support hot plugging
Note : The target system must not be powered during insertion or release of the OCD interface
2.1.2 E-OCD H/W Connection
Figure 2-1 Cable Side View
Table 2-1 Pin Assignment
Pin No. Name Function
1 Not Used -
2 VCC Detect Detects the target system’s power and interface voltage level.
3 Not Used -
4 GND System grounding
5 RunFlag Connect RunFlag pin of 94/97series Device.
6 SCLK Serial clock of the OCD interface.
7 Not Used -
8 SDATA
Serial data of the OCD interface.
If the target system’s output is very noisy, it is
recommended to add a small capacitance to this line.
9 Not Used -
10 Not Used -

E-OCD II Interface Hardware E-OCD II Debugger User’s Manual
16
Figure 2-2 E-OCD II Debugger
2.1.3 Hardware Connection/Disconnection Procedures
As mentioned before, the E-OCD II interface does not support hot plugging—which may damage the
interface permanently.
What is hot plugging :
Hot plugging is plugging in or out a hardware device while the target system is powered.
2.1.4 E-OCD II Interface Connection
The E-OCD II interface supports both the OCD and OCD II interfaces. But since the OCD and OCD II
interface protocols are not compatible with one another, the target protocol must be selected first.
Even if the target MCU uses the OCD or OCD II interface, it does not enter debug mode if the
procedure below is not correctly followed:
1) Power off the target system.
2) Connect the E-OCD II interface to the target system.
3) Connect the E-OCD II interface to PC.
4) Launch the debugger software.
5) Select the target Devices series in the debugger software.
6) Wait until initialization of the E-OCD II interface is complete.
7) Power on the target system

E-OCD II Debugger User’s Manual E-OCD II Interface Hardware
17
2.1.5 E-OCD II Interface Disconnection
The target system must be powered off before disconnecting the OCD interface to avoid damage to
the interface module.
2.1.6 E-OCD II Power Out to Target System
E-OCD II can Power out to target system two types of voltages(3.3V, 5.0V). User can select the
output voltage using a switch on E-OCD II. And then push the power button icon on OCD debugger
program.
1) Select power voltage 3.3V or 5.0V on E-OCD II switch
2) Target Power OFF
3) Push the button icon on OCD Debugger program.

Debugger Software (for Microsoft Windows) E-OCD II Debugger User’s Manual
18
3 Debugger Software (for Microsoft Windows)
3.1 Debugger Software Features
The debugger supports both the OCD and OCD II interface. As the OCD and OCD II interface
protocols differ from each other, you must first select the target MCU series. Debugger software
support three kinds of ABOV debugger type(E-OCD II, OCD, OCD II debugger).
Figure 3-1 Debugger Program
1) The ‘power icon’ is black off when the E-OCD II is first connected to the PC
Figure 3-2 Toolbar : Power Icon
2) When the ‘power icon’ is selected, the icon color is changed and the power voltage is output
- The output voltage can be changed with E-OCD II switch (3.3V or 5.0V)
Figure 3-3 Toolbar : Power Icon

E-OCD II Debugger User’s Manual Debugger Software (for Microsoft Windows)
19
3) The dialog window for the warning about current is shown.
Figure 3-4 Warning Message
4) Device is recognized successfully if it has a good connection with target board.
Figure 3-5 Device Recognition
3.2 Common Features
The debugger software supports the MC9x/A9x series developed by ABOV Semiconductor Co., Ltd.
The following features are provided, regardless of whether the OCD or OCD II interface is used:
Detect the target device automatically
Use symbolic debugging
- Source file view
- Global/Local variables view
- Each device’s SFR (special function register) names
Display various target memories
- CODE, XDATA, IDATA, and SFR
- Users can edit these data sets directly in the debugger
Display code data in a disassembled format
Support line assembly
Support break toggling
Calculate code checksum

Debugger Software (for Microsoft Windows) E-OCD II Debugger User’s Manual
20
Support the following emulation methods :
- Real-time emulation
- Step emulation (source line level or code level)
- Emulation abortion
Save and load the most recent debugging environment automatically.
Support all OCD device series
- When connected with an OCD device, the OCD II interface functions in the same manner
as the OCD interface.
Support all OCD II device series—which support a maximum of 12 breaks
- Four of them are fixed as program counter breaks.
- The other eight breaks can be used either as program counter breaks or combined or
individual event breaks:
a. Signed and unsigned supported
b. Big endian and little endian supported
Support displaying run-time data monitoring. The values of a global variable are updated
automatically during emulation.
Support measuring the target device’s operating frequency
Support trimming the device’s internal OSC frequency
Support emulation time measurement
Note : The RTIME pin must be connected to measure the emulation time.

E-OCD II Debugger User’s Manual Debugger Software (for Microsoft Windows)
21
3.3 Menu Descriptions
This section introduces an overview of the menu items.
Figure 3-6 Debugger Program

Debugger Software (for Microsoft Windows) E-OCD II Debugger User’s Manual
22
3.3.1 File
The File menu includes the following items:
Figure 3-7 Menu 'File'
1) Open…
: Open the selected local text file in a child text window. The shortcut key is Ctrl + O.
2) Close
: Closes the top-most child text window.
3) Close All
: Closes all child text windows.
4) Recent File List
: Displays a list of the four most recently opened files.
5) Exit
: Quits the debugger software.

E-OCD II Debugger User’s Manual Debugger Software (for Microsoft Windows)
23
3.3.2 View
The View menu controls the display of the debugger software frame and child windows.
Figure 3-8 Menu : View
1) Dockable Windows
: Shows or hides a variety of child views. Only selected child views are opened.
Figure 3-9 Dockable Windows
2) Dockable Windows / Customize
The Customize dialog box enables modifications to the Command, Toolbar, Keyboard,
Menu, and Options of the debugger software. Using this function, the user can set the
debugger software’s GUI environment according to their preferences.
The Commands tab offers the sub-items to modify each menu.

Debugger Software (for Microsoft Windows) E-OCD II Debugger User’s Manual
24
Figure 3-10 Customize : Commands
3) The Toolbars tab offers a Toolbar style.
Figure 3-11 Customize : Toolbars

E-OCD II Debugger User’s Manual Debugger Software (for Microsoft Windows)
25
4) The Keyboard tab allows the user to define a shortcut key for each command or reset it to
the default setting.
Figure 3-12 Customize : Keyboard
5) In the Menu tab, the user can change the Menu style.
Figure 3-13 Customize : Menu

Debugger Software (for Microsoft Windows) E-OCD II Debugger User’s Manual
26
6) In the Options tab, the user can change toolbar tip display, icon size, and so on.
Figure 3-14 Customize : Options
7) Status Bar
: It turns the status bar on or off. The Status bar displays information on the current state of
debugger.
Figure 3-15 Application Look

E-OCD II Debugger User’s Manual Debugger Software (for Microsoft Windows)
27
8) Caption Bar
: It turns the Caption bar on or off. The Caption bar displays the device name and what
device is connected to the OCD or OCD II interface.
9) Application Look
: This menu item allows the user to change the debugger software’s GUI style.

Debugger Software (for Microsoft Windows) E-OCD II Debugger User’s Manual
28
3.3.3 Emulation
This menu is to control the start and stop of the code.
Figure 3-16 Menu : Emulation
3.3.4 Emulation : Load Hex
It displays a dialog box to enter the hex file name. The target device is programmed with this hex file.
Figure 3-17 Hex File Download Dialog

E-OCD II Debugger User’s Manual Debugger Software (for Microsoft Windows)
29
1) File property
: If the target device size is no bigger than 64 KB, the compiler only generates a single hex
file. If the target device’s code area is larger than 64 KB, the hex file property must be
selected from among :
Single hex file : Single hex file (linear addressing)
Banked hex file: Multiple hex files (banked addressing)
2) Hex
Hex file name to download.
3) Symbol
: Symbol file name to be used by the debugger software. It depends on the hex file name
selected
4) Do verification after download
: With this option checked, the debugger verifies the code memory after downloading the hex
file.
5) Keep device data (FILE data will be ignored following range.)
: With this option checked, the user can keep the device data, not the hex file data, within the
specified address range. To use this option the user needs to input the address range.
6) CJNE/DJNZ/JB/JNB/JBC SFR.bit command detection (message line)
: This is an important notification. The instructions listed in the message are regarding
comparison or branching that are not supported by some old ABOV devices. Although the
debugger detects these instructions while downloading the hex file, it cannot determine
whether they are instructions or data patterns. In this case, you should check if each
detected part is a real instruction.
7) Save message to file
: Saves the displayed message as a file. This information can be used when the source code
is modified.

Debugger Software (for Microsoft Windows) E-OCD II Debugger User’s Manual
30
8) Download
: Downloads the selected hex file to the target device and starts programming its flash
memory.
9) Close
: Closes the dialog box. If the target device has configurations, the Configuration dialog box
below is opened.
10) Configurations
: To activate the device configuration :
a. Write the configuration.
b. Power off the target system.
c. Power on the target system, and the device will catch the configuration data while the
power applied to it is rising to the operating voltage.
Figure 3-18 Configuration Dialog Window

E-OCD II Debugger User’s Manual Debugger Software (for Microsoft Windows)
31
3.3.5 Emulation : Reset and Run
It begins emulation from the address 0000h after resetting the target device. Its action is the same as
that of a real situation. Emulation continues until a break occurs or the developer stops the emulation.
3.3.6 Emulation : Run from
It starts emulation from a user specified address. This helps users debug a specific module of the
software. Selecting this prompts you to enter a 20-bit address to start emulation as shown below:
Figure 3-19 Address Input Dialog Window
3.3.7 Emulation : Run Continue
It starts emulation from the device’s current address. Current address means:
The address where the previous emulation has stopped.
If the target device is reset, it is 0000h.
3.3.8 Emulation : Step
If you want to follow your code’s execution more closely, use this to step through the code. Any
interrupts are ignored during step run, and the emulation pauses either at the next line of source code
or at the next mnemonic code according to the user choice.
When source line-based step run is selected, tens of mnemonic codes are gone through per each run.
Therefore, source line-based step run is slower than assembly language-based step run. You can
switch between these options in Step run option under the Break / Configure menu.

Debugger Software (for Microsoft Windows) E-OCD II Debugger User’s Manual
32
3.3.9 Emulation : Step Over
The emulation pauses at the next line of code or the next mnemonic code.
3.3.10 Emulation : Step Auto
: It executes a step run every 100ms. You can halt it by clicking the Stop button.
3.3.11 Emulation : Stop
It halts the current emulation or step run immediately.
3.3.12 Emulation : Apply Reset
Target OCD devices have a variety of reset options, as given below:
Power-ON reset
External reset pin input
Watch-dog timer reset
OCD debugger’s command reset
The results of these operations are basically the same: They initialize the target device. This menu
acts as the OCD debugger’s command reset.

E-OCD II Debugger User’s Manual Debugger Software (for Microsoft Windows)
33
3.3.13 Break/Configure
This menu is to control the break settings, emulation options, device configurations, and so on. You
can emulate your program with more options by using these controls.
Some items under this menu do not apply to the OCD device series because these functions are not
supported by the OCD interface specifications.
Figure 3-20 for OCD Device Series
Figure 3-21 for OCD II Device Series

Debugger Software (for Microsoft Windows) E-OCD II Debugger User’s Manual
34
3.3.14 Break/Configure : Clear All Break
It clears all program counter breaks and data breaks (OCD II devices only).
3.3.15 Break/Configure : Set Data Break
It is available only to OCD II devices. OCD II devices can be debugged with more powerful and
flexible break functions.
For OCD II devices, a total of 12 break event triggers are supported.
Four of them are program counter breaks.
The other eight breaks can be used as program counter breaks or as combined or
individual event triggers.
- Individual event triggers: Program counter breaks, byte breaks, and bit breaks
- Combined event triggers: 2-byte breaks (int or short type) and 4-byte breaks (long type)
Selecting this menu item pops up the following dialog box displaying current break conditions. You
can add, remove, or change data breaks here.
Figure 3-22 Add / Remove / Change Data Break

E-OCD II Debugger User’s Manual Debugger Software (for Microsoft Windows)
35
Clicking ‘Add break’ opens the following dialog box to help set a data break condition:
On this dialog box, you can set the target memory (CODE, XDATA, IRAM, or SFR) and its address by
using either of the following options:
Use global symbol : Select the symbol that represents your desired target memory and its
address.
Use direct symbol : Select your desired target memory and enter its address directly.
Then, set the break condition in detail either in the Multi-byte break section or in the bit break section.
Figure 3-23 Fill Data Break
1) Multi-byte break section
: This section supports byte count comparison.
Byte count : Choose the number of bytes of the data to compare with.
Use decimal / Use Hexadecimal : Enter the number to compare with either as a decimal or
hexadecimal number.
bit mask (Hexa) : It is used to compare data with the specified bits only. If bit 7 of the bit
mask value is 1, then bit 7 will be ignored during the comparison. By default, the value is
set to 0x00. The bit masking size is in bytes.
Condition: Set the comparing condition:
X : Do not care
!= : Not equal
== : Equal
> : Great than
>= : Great or equal
< : Less than
<= : Less or equal

Debugger Software (for Microsoft Windows) E-OCD II Debugger User’s Manual
36
If you select <= and the input number is 56 (decimal), the following data break condition
will be set.
if (target device’s value <= 56) BREAK occur;
Signed / Unsigned : A signed variable uses the variable’s MSB (most significant bit) as +
or –. An unsigned variable uses the variable’s MSB as a number. The following is an
example for signed/unsigned variables’ value ranges:
Table 3-1 Variable Value Ranges
Byte Count
Signed value Unsigned value
Min. Max. Min. Max.
1 -128 127 0 255
2 -32,768 32,767 0 65,535
4 -2,147,483,648 2,147,483,647 0 4,294,967,295
Big Endian / Little Endian : Endianness determines the sequential order of bytes in the
given number, e.g., in a single 16-, 32-, or 64-bit word.
- Big Endian: Stores the most significant byte first.
- Little Endian: Stores the least significant byte first.
2) bit break section
: Select the use 1bit checkbox and perform settings as follows:
Condition : Set the comparing condition:
X : Do not care
0 : 0
1 : 1
Position : Change the bit position.

E-OCD II Debugger User’s Manual Debugger Software (for Microsoft Windows)
37
3.3.16 Break/Configure : Break BEFORE/AFTER exec
Select this to toggle between the following two modes regarding the timing of break event detection.
3) Break BEFORE exec.
: When the OCD logic detects a break event, the target device is stopped before the
OPCODE of the program counter break is executed.
Figure 3-24 Timing Diagram
4) Break AFTER exec.
: When the OCD logic detects a break event, the target device is stopped after the OPCODE
of the program counter break is executed.
3.3.17 Break/Configure : Emulation Time Measuring
This menu item is enabled only for OCD II devices with RTIME pin connection. It shows and allows to
change the emulation time measuring option.
1) Accumulate emulation time
: It does not clear the last emulation time and execution clock information when emulation
begins.
OCD devices do not support this function.
2) Not accumulate
: It clears the last emulation time and execution clock information whenever emulation begins.

Debugger Software (for Microsoft Windows) E-OCD II Debugger User’s Manual
38
3.3.18 Break/Configure : Clear Emulation Time
This menu item is enabled only for OCD II devices. It clears the last emulation time and execution
clock information.
3.3.19 Break/Configure : Step Run Option
You can select the unit of step runs between the source-line level and OPCODE level.
Figure 3-25 Step Run Option Dialog
3.3.20 Break/Configure : Peripheral Control
Selecting this prompts you to select how the target device’s peripherals work when in idle mode. This
mode selection is usually used in measuring the timing of a timer interrupt.
Figure 3-26 Peripheral Control Dialog
You cannot control each peripheral’s operation individually. This has to be done manually.

E-OCD II Debugger User’s Manual Debugger Software (for Microsoft Windows)
39
3.3.21 Break/Configure : Chip Configuration
This is to configure the target device’s hardware configuration, including code protection, oscillation
control, and I/O port option. Each device series has a different configuration.
Figure 3-27 Configuration Dialog
If you attempt to unlock a locked device, then all data in the device will be erased. This is an important
device specification that protects data from being hacked.
If the target device configuration does not exist, the following dialog box appears:
Figure 3-28 Message Box
3.3.22 Break/Configure : Clock Frequency (Pseudo-Clock)
The OCD interface does not support the measurement of emulation time. The OCD II interface
supports it; however, the RTIME pin must be connected.
As an alternative, this dialog box is given where you can enter a virtual clock frequency to calculate
emulation time from the device’s internal clock counter.

Debugger Software (for Microsoft Windows) E-OCD II Debugger User’s Manual
40
Figure 3-29 Get Xin Frequency Dialog
Note : The value entered here is not of the real emulation clock, but a fake frequency.
If you have connected the OCD II and the RTIME pin, this value is ignored because the debugger can
get real emulation time.
3.3.23 Break/Configure : Change OCD Series
The OCD interface can detect most of its compatible devices automatically. But as some devices
have a slightly different interface algorithm, the OCD interface must be re-configured to interact with
those devices.
To change the target OCD series, perform the following:
1) Select the target device series in the dialog box and click OK.
Figure 3-30 Message Box for OCD Interface

E-OCD II Debugger User’s Manual Debugger Software (for Microsoft Windows)
41
Figure 3-31 Dialog for E-OCD II Interface
Note : No device series will be selected by default. You must select one of the listed series;
else, this dialog box will not close
2) Turn off the target system and click Yes.
Figure 3-32 Message Box
3) Wait for a few seconds until the OCD interface re-configuration is completed.
4) Turn on the target system once the following message pops up.
Figure 3-33 Message Box

Debugger Software (for Microsoft Windows) E-OCD II Debugger User’s Manual
42
3.3.24 Power Out (3.3V or 5.0V)
E-OCD II has two types of voltage output : 3.3V, 5.0V
User can select the power output voltage with a switch on the side of the E-OCD II
When Pressing the power icon in the PC program – as shown below picture, The E-OCD II can be
selected voltage switch out is on and the voltage selected by switch is output.
Figure 3-34 E-OCD Power Supply
1) The ‘power icon’ is black off when the E-OCD II is first connected to the PC
2) When the ‘power icon’ is selected the icon color is changed and the power voltage is output.
The output voltage can be changed from E-OCD II switch (3.3V or 5.0V)
3) The dialog window for the warning about current
4) Device is recognized successfully if it has a good connection with target board.
Precautions for E-OCD II debugger
1) E-OCD II has two power outputs. 3.3V and 5.0V
2) The power voltage is selected with the side switch.
3) When pressing the power icon in the PC program, the power is on.
4) The power output current can only be up to 100mA, but may be lower than that, depending
on the circumstances.

E-OCD II Debugger User’s Manual Debugger Software (for Microsoft Windows)
43
5) When the device is not recognized by the own power of E-OCD II,
the user must use an external power.
6) Connecting target board with the power of E-OCD II is on, it may cause breakage of the
target board.
7) Connecting E-OCD II with the power of target board is on, it may cause breakage of E-OCD
II.
8) User must connect the E-OCD II to target board with both power off.
9) E-OCD II support USB HID so it does not require a dedicated USB driver.
10) The PC program of the E-OCD II is same as current OCD program.

Debugger Software (for Microsoft Windows) E-OCD II Debugger User’s Manual
44
3.3.25 Test
This menu is to examine the interface or device. Some functions under this menu are designed to for
maker test purpose and not for end users.
Figure 3-35 Menu ‘Test’ for OCD Device Series
Figure 3-36 Menu ‘Test’ for OCD-II Device Series
1) Open test dialog box
: This function is not for end users. It is designed to test or repair the OCD or OCD II
interface. A password is required to access this function.
Figure 3-37 Open Test Dialog

E-OCD II Debugger User’s Manual Debugger Software (for Microsoft Windows)
45
2) Chip Trimming
: This function is not for end users. It is designed to change device configurations, including
user configuration and trimming values. A password is required to access this function.
Figure 3-38 nor for End Users
3) Calc checksum
: It reads the target device’s code memory and displays the checksum. If you attempt to read
a protected device, the operation might not be performed correctly.
Figure 3-39 Calc Checksum
4) Check OSC frequency
: This menu item is enabled only for OCD II devices. It shows the target device’s oscillation
frequency.
Figure 3-40 Check OSC Frequency

Debugger Software (for Microsoft Windows) E-OCD II Debugger User’s Manual
46
3.3.26 Window
This menu is to control the text file window’s view.
Figure 3-41 Menu ‘Window’
1) Split
: You can split the text file window’s view as shown in two as shown below. You can move or
remove the splitter by dragging the mouse.
Figure 3-42 Example : Original View / Split View
2) Window number + file name
: The debugger assigns numbers, e.g., 1, 2, or 3, to each text window based on the order
that they are opened. You can select the opened child window using the assigned number.

E-OCD II Debugger User’s Manual Debugger Software (for Microsoft Windows)
47
3) Windows…
: This helps select the desired text window.
Figure 3-43 Windows Dialog
3.3.27 Help
This menu supports to check the debugger version.
Figure 3-44 Menu ‘Help’
Figure 3-45 Program Information
3.3.28 Toolbar
The toolbar provides easy, one-click access to the most-used commands. There are a variety of
buttons that control hex file download, emulation, device configurations, and other actions.
Figure 3-46 Toolbar

Debugger Software (for Microsoft Windows) E-OCD II Debugger User’s Manual
48
3.4 Child Windows
The MCS51 CPU architecture is given below. Each child window provides editing functionality and
displays its data.
Figure 3-47 MCS51 CPU Architecture
The debugger shows the target device’s all internal data and status in a convenient manner. The
debugger provides a dumped format view, disassembled format view, and various information that are
very helpful to debugging your application program code.
3.4.1 Child Window Alignment
You can re-size, move, dock, and hide each child window and perform various other actions for them.
All windows are dockable, except for the text window.
What is docking :
Docking is manipulating a window to align with the edge of another window or to move it into
another window
The figure below shows an example for moving a docked child window. The red-colored boxes may
vary slightly by application look.
1) Place the mouse pointer on the border of the selected window (the mouse pointer will
change to a drag icon when placed over the window border).
2) Hold down the left mouse button while dragging the window to its new location.
3) Release the mouse button.

E-OCD II Debugger User’s Manual Debugger Software (for Microsoft Windows)
49
Figure 3-48 Example : Moving Cocked Child View in the Debugger
All dockable windows can be moved out of the debugger frame as shown below:
Figure 3-49 XDATA Window Out of the Debugger Frame

Debugger Software (for Microsoft Windows) E-OCD II Debugger User’s Manual
50
All dockable windows have Hide and Close buttons. The Hide button moves the child window aside in
the debugger frame, but does not close it. The Close button closes the child window.
Figure 3-50 Hide and Close Buttons

E-OCD II Debugger User’s Manual Debugger Software (for Microsoft Windows)
51
3.4.2 Code Dump View
This view shows the target device’s code memory in the hex dumped format. It displays data page by
page (hexadecimal addresses range from 0xXX00 to 0xXXFF). You can use the Page Up or Page
Down keys to move to the previous or next page. The upper side of this widow displays the address
of the current caret position.
1) Edit
: You can edit data here directly by typing. Note that data changes made in this editor are not
transmitted to the target device until you press Enter.
Figure 3-51 Code View
2) Move button ( )
: Move the display address and caret position by typing. Address range is 0x00000 through
0xFFFFF (1 MB).
Figure 3-52 Address Input Dialog

Debugger Software (for Microsoft Windows) E-OCD II Debugger User’s Manual
52
4) Load pattern ( )
: Fill a code area with a hex file. The only available format is the Intel-Hex format.
Figure 3-53 Pattern Load Dialog
5) Save pattern ( )
: Save a code area as a hex file. The code area is specified by entering its start and end
addresses.
Figure 3-54 Pattern Save Dialog
6) Fill pattern ( )
: Fill a code area with a specified pattern. The code area is specified by entering its start and
end addresses.
Figure 3-55 Pattern Fill Dialog

E-OCD II Debugger User’s Manual Debugger Software (for Microsoft Windows)
53
7) Set data break
: This function is available only to OCD II devices. Double-click on data in the window to set
or remove a data break. Double-clicking on an already set data break will pop up the dialog
box shown below.
Once a data break is set, its address field is colored in blue. Refer to the Set data break
section for details.
Figure 3-56 Access Break Dialog

Debugger Software (for Microsoft Windows) E-OCD II Debugger User’s Manual
54
3.4.3 Code Disassemble View
This view shows the target device’s code memory in the disassembled format.
Figure 3-57 Disassemble View Window
All operands are displayed as hexadecimal numbers.
The current device program counter is colored in dark gray.
Lines having source file information are marked with a red asterisk (*). Double-click on this
mark to open the source file and move to the text line corresponding to that address.
Double-clicking on the Address area of a line toggles between setting and removing a program
counter break at that address. Break-set lines are displayed in blue-colored boxes.
Figure 3-58 Setting and Removing Counter Break

E-OCD II Debugger User’s Manual Debugger Software (for Microsoft Windows)
55
Double-clicking on the Mnemonic area of a line allows you to modify the assembly code. Once you
modify the code, click Modify.
Figure 3-59 Modifying the Assembly Code
1) Move button ( )
: Move the display address and caret position by typing. Address range is 0x00000 through
0xFFFFF (1 MB).
Figure 3-60 Address Input Dialog

Debugger Software (for Microsoft Windows) E-OCD II Debugger User’s Manual
56
3.4.4 XDATA Dump View
This view shows the target device’s XDATA memory in the hex dumped format. It displays data page
by page (hexadecimal addresses range from 0xXX00 to 0xXXFF). You can use the Page Up or Page
Down keys to move to the previous or next page. The upper side of this widow displays the address
of the current caret position.
1) Edit
: You can edit data here directly by typing. Note that data changes made in this editor are not
transmitted to the target device until you press Enter.
Figure 3-61 XDATA View Window
2) Move button ( )
: Move the display address and caret position by typing. Address range is 0x00000 through
0xFFFFF (1 MB).
Figure 3-62 Address Input Dialog

E-OCD II Debugger User’s Manual Debugger Software (for Microsoft Windows)
57
3) Load pattern ( )
: Fill a code area with a hex file. The only available format is the Intel-Hex format.
Figure 3-63 Pattern Load Dialog
4) Save pattern ( )
: Save a code area as a hex file. The code area is specified by entering its start and end
addresses. The only available format is the Intel-Hex format.
Figure 3-64 Pattern Save Dialog
5) Fill pattern ( )
: Fill a code area with a specified pattern. The code area is specified by entering its start and
end addresses.
Figure 3-65 Pattern Fill Dialog

Debugger Software (for Microsoft Windows) E-OCD II Debugger User’s Manual
58
7) Set data break
: This function is available only to OCD II devices. Double-click on data in the window to set
or remove a data break. Double-clicking on an already set data break will pop up the dialog
box shown below.
Once a data break is set, its address field is colored in blue. Refer to the Set data break
section for details.
Figure 3-66 Access Break Dialog

E-OCD II Debugger User’s Manual Debugger Software (for Microsoft Windows)
59
3.4.5 IDATA (IRAM) Dump View
This view shows the target device’s IDATA (IRAM) memory in the hex dumped format. It displays data
page by page (hexadecimal addresses range from 0x0000 to 0x00FF). The upper side of this widow
displays the address of the current caret position.
1) Edit
: You can edit data here directly by typing. Note that data changes made in this editor are not
transmitted to the target device until you press Enter.
Addresses 0x00–0x7F are the direct addressing area (128 bytes). Addresses 0x80–0xFF are
the indirect addressing area (128 bytes).
Figure 3-67 IDATA (IRAM) View Window
2) Refresh button ( )
: Reload data from the target device and re-new the current display.
Debugger Software (for Microsoft Windows) E-OCD II Debugger User’s Manual
60
3) Set data break
: This function is available only to OCD II devices. Double-click on data in the window to set
or remove a data break. Double-clicking on an already set data break will pop up the dialog
box shown below.
Once a data break is set, its address field is colored in blue. Refer to the Set data break
section for details.
Figure 3-68 Access Break Dialog

E-OCD II Debugger User’s Manual Debugger Software (for Microsoft Windows)
61
3.4.6 SFR Dump View
This view shows the target device’s SFRs (special function registers) in the hex dumped format. It
displays 128 bytes (hexadecimal addresses range from 0x0080 to 0x00FF). The upper side of this
widow displays the address and the SFR name of the current caret position.
1) Edit
: You can edit data here directly by typing. Note that data changes made in this editor are not
transmitted to the target device until you press Enter.
Addresses 0x80–0xFF are the direct addressing area.
Figure 3-69 SFR View Window
2) Refresh button ( )
: Reload data from the target device and re-new the current display. The SFRs include a
control register, timer/counter, UART, and I/O ports, meaning that SFR values are not fixed.
Using this button, you can check the timer counting up, I/O port values changing, and other
variable data.
3) Set data break
: This function is available only to OCD II devices. Double-click on data in the window to set
or remove a data break. Double-clicking on an already set data break will pop up the dialog
box shown below.
Once a data break is set, its address field is colored in blue. Refer to the Set data break
section for details.

Debugger Software (for Microsoft Windows) E-OCD II Debugger User’s Manual
62
Figure 3-70 Access Break Dialog
3.4.7 Registers View
This view shows the target device’s registers in the hex dumped format. PSWs (program status words)
use a binary format.
1) Edit
: You can edit data here directly by typing. Note that data changes made in this editor are not
transmitted to the target device until you click the Modify button.
Figure 3-71 Registers View Window

E-OCD II Debugger User’s Manual Debugger Software (for Microsoft Windows)
63
3.4.8 Output View
This view uses a tabbed window. Each window tab shows different information.
1) Status tab
: This tab lists breaks that have occurred.
Figure 3-72 Output Window : Status Tab
The information of each occurrence includes:
When the break occurred
Next program counter
Target device’s clock count
Emulation time
- If you are using an OCD II device and the RTIME pin is connected, it shows real
emulation. It will be displayed as Emulation time.
- If you are using an OCD device or an OCD II device without the RTIME pin connected,
then the emulation time calculation uses the FAKE clock input value. In this case, the
message is shown as ‘If Xin is x.xxMHz, Emulation time =.’

Debugger Software (for Microsoft Windows) E-OCD II Debugger User’s Manual
64
2) Breaks tab
: This tab lists the set breaks. If you are using an OCD II device, refer to Set data break too.
Figure 3-73 Output Window : Breaks Tab

E-OCD II Debugger User’s Manual Debugger Software (for Microsoft Windows)
65
3.4.9 Source View
This view shows a text file or source code file with each line numbered. The data displayed in the view
is not editable, and each tab shown is sized as four spaces.
If the Symbol file has already been loaded, the Source file will display the line numbers and real
addresses combined as shown in the screenshot below.
Figure 3-74 Source View Window
If you double click the left mouse button on an address, the disassemble view is refreshed
to show data in that address.
Lines assigned a program counter break are highlighted in blue.
Right-clicking opens a sub-menu shown below:
Figure 3-75 Sub Menu
The shortcut keys are T, N, and G.

Debugger Software (for Microsoft Windows) E-OCD II Debugger User’s Manual
66
1) Find Text (T)
: This finds your specified text in the file and colors the result.
Figure 3-76 Find
2) The following example shows that all occurrences of the search text are colored in red:
Figure 3-77 Searched Text
3) Find Next… (N)
: This finds the next occurrence of the search text downwards (or upwards). If the debugger
could not find the text, it shows the following message box:
Figure 3-78 Message Box

E-OCD II Debugger User’s Manual Debugger Software (for Microsoft Windows)
67
4) Goto line # (G)
: This takes you to your desired line in the text file. Selecting this will prompt you to type in a
decimal line number.
Figure 3-79 Get Decimal Number Dialog

Debugger Software (for Microsoft Windows) E-OCD II Debugger User’s Manual
68
3.4.10 Global Variable View
This view shows and allows editing global variables of the source code.
Figure 3-80 Global Variable View
1) Add global variable ( )
: Add global symbols to this view. This button is disabled when the symbol information is
empty.
Figure 3-81 Global Variable Add Dialog
You can add a global symbol in one of the following ways:

E-OCD II Debugger User’s Manual Debugger Software (for Microsoft Windows)
69
Double-click on the symbol name you want to add.
Select the variable and click Add.
Type in the symbol name and click Add.

Debugger Software (for Microsoft Windows) E-OCD II Debugger User’s Manual
70
2) Remove global variable ( )
: Remove global symbols from this view. This button is disabled when the symbol information
is empty.
Figure 3-82 Global Variable Remove Dialog
You can remove a global symbol in one of the following ways:
Double-click on the symbol name you want to remove.
Select the variable and click Remove.
Type in the symbol name and click the Remove.
3) Values
: In this view, values are displayed as hexadecimal, decimal, or binary numbers.
Bit variables: 0 or 1
1-byte variables: Hexadecimal, decimal, or binary numbers
2- or 4-byte variables: Hexadecimal or decimal numbers
Arrays/pointers/structures: 2-byte values. These are pointer values and not data.

E-OCD II Debugger User’s Manual Debugger Software (for Microsoft Windows)
71
Note: Array data is not supported: If you want to use array data, you will need to use a Keil
plug-in.

Debugger Software (for Microsoft Windows) E-OCD II Debugger User’s Manual
72
Figure 3-83 Global Variable View
4) Edit
: Double-click on the data area that you wish to edit, and the following dialog box will open.
Figure 3-84 Edit Dialog
Available data formats include:
Binary: Bit variable only. The input value is 0 or 1.
Decimal: Decimal number (ex: 12345)
Hexadecimal: Hexadecimal number (ex: 0x1234)
5) Set break
: This function is available only to OCD II devices. Double-click on data in the window to set
or remove a data break. Double-clicking on an already set data break will pop up the dialog
box shown below.
Once a data break is set, its address field is colored in blue. Refer to the Set data break
section for details.
Figure 3-85 Access Break Dialog

E-OCD II Debugger User’s Manual Debugger Software (for Microsoft Windows)
73
6) Real time monitoring
: This function is available only to OCD II devices. In general, a developer cannot see the
target device’s internal data. But, the OCD II interface supports data monitoring even while
the CPU is operating.
Real-time monitoring of global variables Is possible because global variables occupy fixed
addresses. For the same reason, local variables cannot be monitored in real-time as they
use stack or volatile addresses.

Debugger Software (for Microsoft Windows) E-OCD II Debugger User’s Manual
74
3.4.11 Local Variable View
This view shows and allows editing local variables of the source code.
Figure 3-86 Local Variable View
1) Add/remove local variable
: Adding or removing local variables in this view is processed automatically by the debugger.
If the program counter value is in a local function, the view shows the local function’s name
and its variables.
Figure 3-87 Example : Program counter is located at 0_02A4 of main (void)

E-OCD II Debugger User’s Manual Debugger Software (for Microsoft Windows)
75
The view, in this example, then shows function : MAIN and its local variables as shown
below:
Figure 3-88 Example : Function main
2) Values
: In this view, values are displayed as hexadecimal, decimal, or binary numbers.
Bit variables: 0 or 1
1-byte variables: Hexadecimal, decimal, or binary numbers
2- or 4-byte variables: Hexadecimal or decimal numbers
Arrays/pointers/structures: 2-byte values. These are pointer values and not data.
Note: Array data is not supported: If you want to use array data, you will need to use a Keil
plug-in.
3) Edit
: Double-click on the data area that you wish to edit, and the following dialog box will open.
Figure 3-89 Edit Dialog
Available data formats include:
Binary: Bit variable only. The input value is 0 or 1.
Decimal: Decimal number (ex: 12345)
Hexadecimal: Hexadecimal number (ex: 0x1234)

Keil Plug‐in E-OCD II Debugger User’s Manual
76
4 Keil Plug‐in
4.1 Basic Features
Keil PK51 (Professional Developer kit) includes the μVision debugger.
The μVision Debugger from Keil supports simulation using only the user’s PC or laptop, and
debugging using the target system and a debugger interface. μVision includes traditional features
such as simple and complex breakpoints, watch windows, and execution control as well as
sophisticated features such as trace capture, execution profiler, code coverage, and logic analyzer.
Using the Keil plug-in, you can work with the ABOV E-OCD II interface on the μVision Debugger. The
ABOV E-OCD II interface fully supports the Keil Vision IDE. ABOV’s target driver is seamlessly
integrated with the Keil debugger, allowing Keil C51 users to work in the Vision environment without
switching between the Keil compiler and ABOV’s external OCD software.
Figure 4-1 Example : μVision4 Program

E-OCD II Debugger User’s Manual Keil Plug‐in
77
4.1.1 Getting Started
The μVision Debugger provides two ways to debug your embedded applications:
1) Simulator
: μVision provides everything you need to quickly develop high-fidelity simulations that help
you test, debug, and prove the stability and quality of your software design. Before starting
the μVision Debugger, select Use Simulator from Project Options>Debug Tab to simulate
programs in the debugger.
2) Debugger
: μVision provides several interfaces to target hardware debugging interface (such as ULINK
and a variety of target monitors provided by Keil). Additional hardware drivers are provided
by target debugger hardware providers (emulator companies). Before starting the μVision
Debugger, select the target driver from the Project Options>Debug Tab to specify which
target interface to use.
3) Starting μVision Debugger ( )
: When you click the Start Debug Session button on the toolbar, μVision starts the debugger
using the appropriate simulation or target debug driver.
4.1.2 User Guide
You can download the μVision manual from the Keil website.

Keil Plug‐in E-OCD II Debugger User’s Manual
78
4.2 Keil Plug-in Setup
Setting up the Keil plug-in is easy; however, each step must be followed carefully.
4.2.1 Bind PK51
ABOV provides the Keil plug-in together with its debugging software installer package. The only thing
you need to do is editing the Keil PK51 configuration file.
1) The file is named Tools.ini and located in the Keil folder, for example, C:\Keil.
2) You have to modify it with your editor application.
3) Find the word ‘TDRV’ and add as follows. Add TDRV and its number, file path, etc.
[C51]
PATH="C:\Keil\C51\"
BOOK0=HLP\Release_Notes.htm("Release Notes",GEN)
BOOK1=HLP\C51TOOLS.chm("Complete User's Guide Selection",C)
TDRV0=BIN\MON51.DLL ("Keil Monitor-51 Driver")
TDRV1=BIN\ISD51.DLL ("Keil ISD51 In-System Debugger")
TDRV2=BIN\MON390.DLL ("MON390: Dallas Contiguous Mode")
TDRV3=BIN\LPC2EMP.DLL ("LPC900 EPM Emulator/Programmer")
TDRV4=BIN\UL2UPSD.DLL ("ST-uPSD ULINK Driver")
TDRV5=BIN\UL2XC800.DLL ("Infineon XC800 ULINK Driver")
TDRV6=BIN\MONADI.DLL ("ADI Monitor Driver")
TDRV7="C:\Program Files (x86)\ABOV Semiconductor\OCD II_
,→debugger64\ABOV_OCD.DLL" ("ABOV E-OCD II dongle")
TDRV8="C:\Program Files (x86)\ABOV Semiconductor\OCD II_
,→debugger64\ABOV_OCD_BANK.DLL" ("ABOV E-OCD II banked")
Note :
If you are not using code banking, use DLL ‘ABOV E-OCD II dongle.’
If you are using code banking, use DLL ‘ABOV E-OCD II banked.’

E-OCD II Debugger User’s Manual Keil Plug‐in
79
4.2.2 Add Flash Control to Your Project
Set your project options as shown in the following dialog box. Now, you can erase, read, or write the
code to your target MCU.
If you are not using code banking, use ‘ABOV E-OCD II Dongle.
Figure 4-2 ABOV E-OCD II Dongle
If you are using code banking, use ‘ABOV E-OCD II banked.
Figure 4-3 ABOV E-OCD II Banked

Keil Plug‐in E-OCD II Debugger User’s Manual
80
4.2.3 Add Debugger Control to Your Project
Set your project options as shown in the following dialog box. Now, you can emulate and debug your
target MCU.
If you are not using code banking, use ‘ABOV E-OCD II Dongle.’
Figure 4-4 ABOV E-OCD II Dongle
If you are using code banking, use ‘ABOV E-OCD II Banked.’
Figure 4-5 ABOV E-OCD II Banked

E-OCD II Debugger User’s Manual IAR 8051 GUI (Compiler and Debugger)
81
5 IAR 8051 GUI (Compiler and Debugger)
5.1 Basic Features
This user guide introduces a method to develop ABOV devices in the 8051 debugger of IAR (C-SPY)
environment.
How to connect and detect the OCD/ OCD II/ E-OCD II debugger.
How to detect ABOV’s 8051 device.
How to debug ABOV’s device.
This user guide describes restrictions under the 8051 debugger of IAR (C-SPY) environment.
Compatibility according to IAR version
Restrictions according to the number of Breakpoints that are built in ABOV’s device.
5.2 USB Kernel Driver Installation
E-OCD II Debugger
Since the built-in HID of Windows is used, additional driver doesn’t need to be installed.
Due to the use of the built-in HID, it can be used immediately after connecting to PC.
OCD/ OCD II debugger
It requires an installation of Kernel Driver on a PC.
While operating the OCD Debugger Setup Program that is provided by ABOV, necessary
files are copied.
You can refer to ABOV’s OCD Debugger Manual for the information of the driver
installation.
You can check the HW connection through the Device Manager on your PC.

IAR 8051 GUI (Compiler and Debugger) E-OCD II Debugger User’s Manual
82
5.3 ABOV’s SDK DLL Connections
1) SDK DLL
SDK DLL is a Dynamic Link Library that is used for a development in the IAR Debugger
(C-Spy) environment.
SDK: Software Development Kit
DLL: Dynamic Link Library
IAR selectively provides basic DLL only for some companies such as TI, Infineon, and
Segger.
Products of other companies are connected by using Third Party Drivers.
ABOV developed DLLs to support its debuggers and devices by using SDK sources of IAR.
2) SDK DLL compatibility between IAR versions
It needs to remember that IAR SDK DLL is compatible according to IAR versions.
Causes: Problem of IAR itself, compatibility problem
When the version of IAR Embedded Workbench is 8.0, ABOV_OCD_IAR_1010.DLL must
be used.
When the version of IAR Embedded Workbench is 8.1, ABOV_OCD_IAR_1030.DLL must
be used.
ABOV is under development for DLL that is compatible with current version of IAR.
It is expected that the DLL won’t be compatible with new version of IAR.
SDK DLL and IAR operate only when they are the same version.
You should check whether the DLL operates when the version of the installed IAR
becomes higher (or lower).

E-OCD II Debugger User’s Manual IAR 8051 GUI (Compiler and Debugger)
83
5.4 IAR Project Settings
5.4.1 IAR Project Settings
1) Select ‘Options…’, then select ‘Debugger’.
2) Press ‘OK’ button to connect to ‘the Third-Party Driver.’
Figure 5-1 Debugger / Driver Setting
5.4.2 IAR Third-Party Driver Settings
1) Select ‘Options…’, then select ‘Debugger’. Finally select ‘Third-Party Driver.’
2) Press ‘OK’ button to connect to an SDK DLL file provided by ABOV (Check the IAR version
for the compatibility of SDK DLL).

IAR 8051 GUI (Compiler and Debugger) E-OCD II Debugger User’s Manual
84
Figure 5-2 Third-Party Driver /Setting

E-OCD II Debugger User’s Manual IAR 8051 GUI (Compiler and Debugger)
85
5.5 Download Hex File
By pressing a debugging button ( ), you can proceed operations consecutively.
Detect OCD/ OCD II/ E-OCD II debugger.
For each debugger, select POR (Power-on Reset) for the series to which a target device
belongs.
Figure 5-3 OCD Target Series
If the target is turned off, a message box is displayed as shown below:
Figure 5-4 Message Box
If the target is turned on, but an unregistered product is detected, a message box is displayed as
shown below:
Figure 5-5 Message Box

IAR 8051 GUI (Compiler and Debugger) E-OCD II Debugger User’s Manual
86
When the target is detected normally, a Hex File is downloaded into the Flash of the target.
If a target device has options,
After downloading a Hex file, the corresponding option dialog for the device is displayed.
Example option dialog for MC96F8204 is shown below:
Figure 5-6 Configuration Dialog

E-OCD II Debugger User’s Manual IAR 8051 GUI (Compiler and Debugger)
87
5.6 Cautions for Debugging
Use the functions of IAR debugger without changes.
Remember only that the number of Breakpoints is limited.
Figure 5-7 IAR Debugger
After downloading a Hex file, it displays the number limit of the Breakpoints.
1) ABOV’s devices limit the number of built-in Breakpoints.
The number of Breakpoints for each device is different.
It displays the number of Breakpoints available for developers, except for Breakpoints
used by IAR debugger.
Figure 5-8 Message Box

IAR 8051 GUI (Compiler and Debugger) E-OCD II Debugger User’s Manual
88
2) It displays a warning message if a developer sets a larger number than the number of
available Breakpoints on the device.
Breakpoint settings made after the warning message are ignored.
Only by reducing the set number of Breakpoints, you can set up with new number.
Figure 5-9 Message Box

E-OCD II Debugger User’s Manual IAR 8051 GUI (Compiler and Debugger)
89
5.7 SDK DLL Compatibility According to IAR Versions
Remember that SDK DLL compatibility is decided according to a version of IAR Embedded
Workbench.
1) Some of SDK DLL are not compatible if their Embedded Workbenches have different
versions.
2) As of 2019, ABOV supports the version 8.0 and 8.1 of Embedded Workbench.
3) Check the IAR version by following the procedure below:
Start the IAR.
Select ‘Help’, ‘About’, and ‘Product Info …’ in order from the menu.
You can check the two versions in a Product Info window as shown below:
Figure 5-10 Version Check
Appendix: E-OCD II Isolator Interface E-OCD II Debugger User’s Manual
90
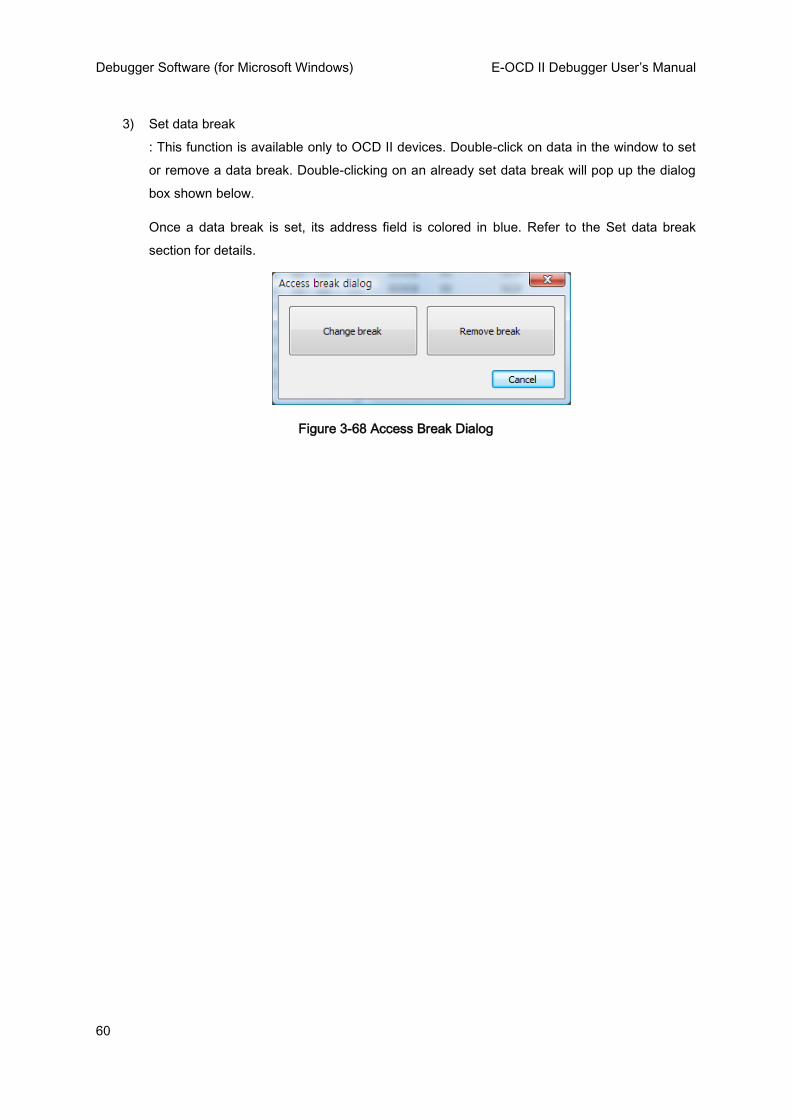
6 Appendix: E-OCD II Isolator Interface
The E-OCD II isolator interface is designed to prevent power collision between the Host PC and target
hardware:
The operating voltage ranges between 2.8–5.5 V. This is slightly higher than the regular
OCD/OCD II interfaces.
The rest are the same as the OCD and OCD II interfaces.
Figure 6-1 E-OCD II Isolator
Caution :
Be cautions when using a transformer-less target power supply

E-OCD II Debugger User’s Manual Revision history
91
Revision history
Version Date Description
1.0.0 Jun. 28, 2019 Document created
1.0.1 Sep. 29, 2020 New Format Document created.
1.0.2 Oct. 20, 2020 Added contents of E-OCD II

Important notice A31G324 Quick Start Guide
92
ABOV Disclaimer IMPORTANT NOTICE – PLEASE READ CAREFULLY ABOV Semiconductor ("ABOV") reserves the right to make changes, corrections, enhancements, modifications, and improvements to ABOV products and/or to this document at any time without notice. ABOV does not give warranties as to the accuracy or completeness of the information included herein. Purchasers should obtain the latest relevant information of ABOV products before placing orders. Purchasers are entirely responsible for the choice, selection, and use of ABOV products and ABOV assumes no liability for application assistance or the design of purchasers’ products. No license, express or implied, to any intellectual property rights is granted by ABOV herein. ABOV disclaims all express and implied warranties and shall not be responsible or liable for any injuries or damages related to use of ABOV products in such unauthorized applications. ABOV and the ABOV logo are trademarks of ABOV. All other product or service names are the property of their respective owners. Information in this document supersedes and replaces the information previously supplied in any former versions of this d o c u m e n t .
© 2020 ABOV Semiconductor – All rights reserved
Korea
Regional Office, Seoul HQ, Ochang
R&D, Marketing & Sales R&D, QA, and Test Center
8th Fl., 330, Yeongdong-daero, Gangnam-gu, Seoul, 06177, Korea
93, Gangni 1-gil, Ochang-eup, Cheongwon-gun, Chungcheongbuk-do, 28126, Korea
Tel: +82-2-2193-2200 Fax: +82-2-508-6903 www.abovsemi.com
Tel: +82-43-219-5200 Fax: +82-43-217-3534 www.abovsemi.com
Domestic Sales Manager Global Sales Manager China Sales Manager Tel: +82-2-2193-2206 Fax: +82-2-508-6903 Email: [email protected]
Tel: +82-2-2193-2281 Fax: +82-2-508-6903 Email: [email protected]
Tel: +86-755-8287-2205 Fax: +86-755-8287-2204 Email: [email protected]