E 507 - World Bank Documents
409
w2i49R-if 9',3 a*l 'w--- E 507 4' UMWVRAT S ORT PROJECT (MUTP t' O OU LIDA ENVIR TAL AS ES A R A ,Ij B \ j 2 ,, A lai ' ' ' -- ' Fta 44 ANU /7~~~~~~~~~~~~~~~~~~~~~~~~~~~~~~~~~~~~~~~~~~~~~~~~~~~~~~~~~~~~~~~~ S f b.'~slY''iia _ _ ,,., Public Disclosure Authorized Public Disclosure Authorized Public Disclosure Authorized Public Disclosure Authorized
-
Upload
khangminh22 -
Category
Documents
-
view
1 -
download
0
Transcript of E 507 - World Bank Documents

w2i49R-if 9',3 a*l 'w--- E 507
4' UMWVRAT S ORT PROJECT (MUTP
t' O OU LIDAENVIR TAL AS ES
A R A ,Ij B \ j 2 ,, A
lai ' ' ' -- ' Fta
44
ANU
/7~~~~~~~~~~~~~~~~~~~~~~~~~~~~~~~~~~~~~~~~~~~~~~~~~~~~~~~~~~~~~~~~~~~~~~~~7
S f b.'~slY''iia _ _ ,,. ,
Pub
lic D
iscl
osur
e A
utho
rized
Pub
lic D
iscl
osur
e A
utho
rized
Pub
lic D
iscl
osur
e A
utho
rized
Pub
lic D
iscl
osur
e A
utho
rized


Mumbai Urban Transport Project Environmental Assessment
TABLE OF CONTENTS
Sr.No. Details PageNumber
Executive SummaryChapter 1 - Introduction
1.1 Background 1-11.2 Transport Sector In Mumbai 1-1
1.3 Comprehensive transport strategy 1-4
1.4 Environmental Assessment 1-5
1.5 Structure Of The Report 1-10
Chapter 2 - Policy, Legal And Administrative Framework2.1 Legal framework 2-1
2.1.1 Central Government And State Government Environmental 2-1Regulations
2.1.2 Central Government Regulations Related To Vehicular Pollution 2-1
2.2 Existing Policies And Trends 2-32.3 World Bank Policies 2-82.4 Existing Administrative Framework 2-8
2.4.1 Apex Organisations 2-92.4.2 Project Implementation Organisations 2-102.4.3 Transportation Service Organizations 2-132.4.4 Enforcement Organizations 2-13
Chapter 3 - ENVIRONMENTAL BASELINE STATUS
3.1 Baseline data 3-13.2 Environmental Status Of MCGM 3-2
3.2.1 Landuse 3-23.2.2 Climate And Meteorology 3-23.2.3 Ambient Air Quality 3-4
3.2.3.1 National Ambient Air Quality Standards 3-43.2.3.2 Primary Baseline Ambient Air Quality Monitoring 3-63.2.3.3 Air Monitoring By Municipal Corporation Of Greater 3-6
Mumbai (MCGM)3.2.3.4 Statistical Study by EMC, Mumbai on MCGM Data 3-113.2.3.5 Ambient Air Monitoring by NEERI 3-133.2.3.6 Salient Features Of URBAIR Study 3-133.2.3.7 Overall Conclusions 3-14
3.2.4 Noise Quality 3-203.2.5 Ecological Status 3-213.2.6 Socio-economic characteristics 3-24
Chapter 4- SECTORAL ENVIRONMENTAL ASSESSMENT4.1 Background 4-14.2 Comprehensive Transport Strategy (CTS) 4-2
i
Mumbai Urban Transport Project Environmental Assessment
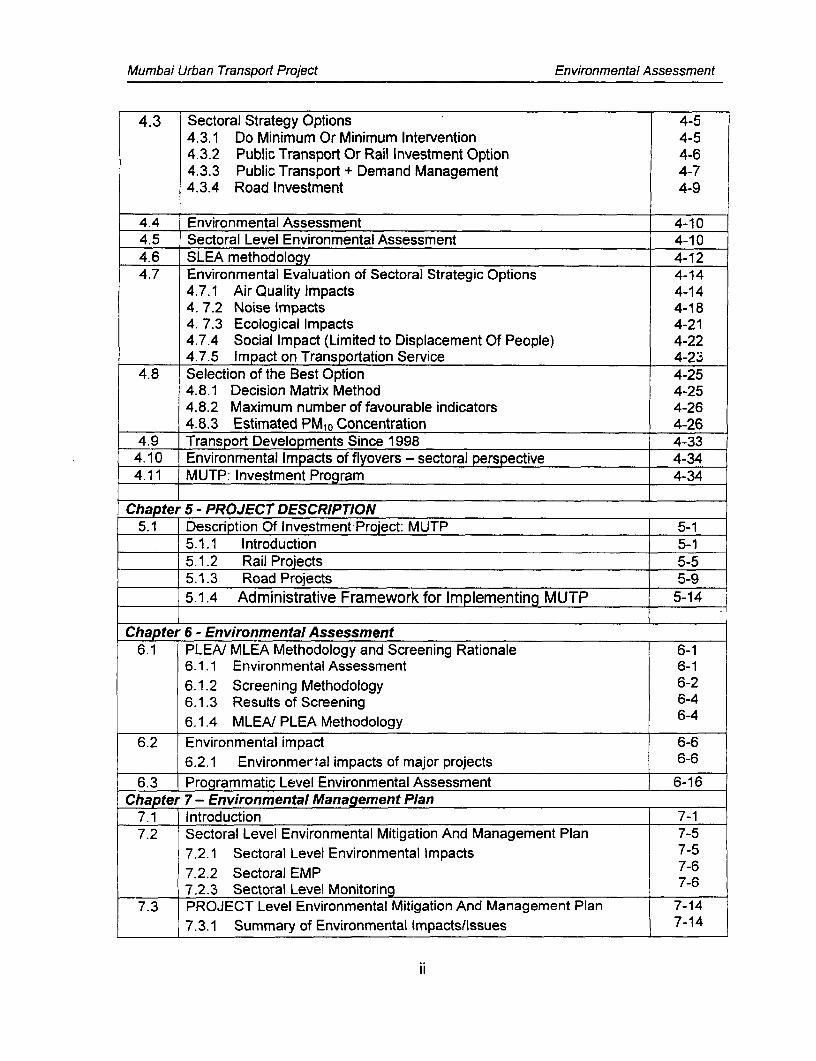
4.3 Sectoral Strategy Options 4-54.3.1 Do Minimum Or Minimum Intervention 4-54.3.2 Public Transport Or Rail Investment Option 4-64.3.3 Public Transport + Demand Management 4-74.3.4 Road Investment 4-9
4.4 Environmental Assessment 4-104.5 Sectoral Level Environmental Assessment 4-104.6 SLEA methodology 4-124.7 Environmental Evaluation of Sectoral Strategic Options 4-14
4.7.1 Air Quality Impacts 4-144. 7.2 Noise Impacts 4-184. 7.3 Ecological Impacts 4-214.7.4 Social Impact (Limited to Displacement Of People) 4-224.7.5 Impact on Transportation Service 4-23
4.8 Selection of the Best Option 4-254.8.1 Decision Matrix Method 4-254.8.2 Maximum number of favourable indicators 4-264.8.3 Estimated _ Concentration 4-26
4.9 Transport Developments Since 1998 4-334.10 Environmental Impacts of flyovers - sectoral perspective 4-344.11 MUTP: Investment Program 4-34
Chapter 5 - PROJECT DESCRIPTION5.1 Description Of Investment Project: MUTP 5-1
5.1.1 Introduction 5-15.1.2 Rail Projects 5-55.1.3 Road Projects 5-9
5.1.4 Administrative Framework for Implementing MUTP 5-14
Chapter 6 - Environmental Assessment6.1 PLEA/ MLEA Methodology and Screening Rationale 6-1
6.1.1 Environmental Assessment 6-1
6.1.2 Screening Methodology 6-26.1.3 Results of Screening 6-46.1.4 MLEA/ PLEA Methodology 6-4
6.2 Environmental impact 6-6
6.2.1 Environmertal impacts of major projects 6-6
6.3 Programmatic Level Environmental Assessment 6-16Chapter 7- Environmental Management Plan
7.1 Introduction 7-17.2 Sectoral Level Environmental Mitigation And Management Plan 7-5
7.2.1 Sectoral Level Environmental Impacts 7-5
7.2.2 Sectoral EMP 7-67.2.3 Sectoral Level Monitoring 7-6
7.3 PROJECT Level Environmental Mitigation And Management Plan 7-147.3.1 Summary of Environmental Impacts/lssues 7-14
ii

Mumbai Urban Transport Project Environmental Assessment
7.3.2 Environmental Mitigation Measures and Management Plans 7-147.3.3 Environmental Monitoring Plan 7-15
7.4 Institutional Setup, Coordination & Strengthening 7-167.4.1 Institutional Set-Up And Coordination 7-167.4.2 Reporting Requirements 7-177.4.3 Institutional Arrangements And Its Strengthening 7-20
7.5 Cost Estimates for Mitigative Measures and Monitoring 7-207.5.1 Cost Estimates for institutional capacity building 7-207.5.2 Cost estimat4esfor project specific EMP implementation 7-21
7.6 Contractual Agreement 7-22
Chapter8 - RESETTLEMENT AND REHABILITATION
8.1 Resettlement Action Plan 8-18.2 The Objectives 8-18.3 Resettlement Policy 8-18.4 Legal Framework 8-28.5 Definition Of Project Affected Households (PAH) 8-38.6 Rehabilitation Entitlements 8-3
8.7 Organizational Responsibilities 8-48.8 Two stage Resettlement Process 8-48.9 Grievance Redressal Mechanism 8-48-10 Site Specific Resettlement Implementation Plans (RIP) 8-4
8-11 Scale of Resettlement Required 8-5
8-12 R & R Implementation Schedule and the Present Status 8-68-13 Lessons Learnt 8-8
8-14 Costs And Budget 8-8
Chapter 9 - PUBLIC INFORMATION AND CONSULTATION
9.1 Consultation During CTS (1994) 9-1
9.2 Consultation During Environmental Assessment (1997) 9-19.3 Consultation During R&R 9-19.4 Consultation On Updated EA 9-29.5 PUBLIC INFORMATION Centres 9-39.6 Proposed Consultation 9-39.7 Public Opinions, Concems And Responses 9-5
iii

Mumbai Urban Transport Project Environmental Assessment
LIST OF TABLES
Table Description PageNumber Number
2.1 Schedule For Implementation Of Vehicles Rules 2-32.2 Deadlines for Phasing out Old Vehicles 2-7
3.1 Analysis of Wind Pattern in Mumbai 3-43.2 National Ambient Air Quality Standards 3-53.3 Sectorwise Air Emission Load Of Greater Mumbai 3-63.4 Ambient Air Quality at Specific locations for last three years (1998 - 3-9
2001)3.5 API for six areas in Greater Mumbai 3-103.6 Air Pollution Index Descriptor 3-103.7 Air Quality At traffic Intersections (1998 -2001) 3-113.8 Yearwise Regional Mean Values of pollutants for Greater Mumbai 3-123.9 Ambient Noise Quality (1997 -99) 3-203.10 Details of Natural Reserves 3-24
4.1 MMR: Population and Employment ('000) 4-14.2 MMR Private Vehicle Ownership 4-24.3 Peak Period Travel Demand 4-34.4 Projects under Do Minimum Option 4-54.5 Projects under Public transport option 4-74.6 Projects under Road Investment Option 4-94.7 Environmental Impact Indicators / Indices used in SEA 4-134.8 Comparison of Options based on absolute values of air pollutants 4-154.9 Comparison of options based on absolute values of traffic noise 4-19
i indicators4.10 Comparison of options based on ecological impacts 4-224.11 Comparison of options based on R & R impacts 4-234.12 Comparison of Options based on Transport Service 4-244.13 Selection of Best Option for Island City through Decision Matrix 4-27
Method4.14 Selection of Best Option for Western Suburb through Decision Matrix 4-28
Method.4.15 Selection of Best Option for Eastern Suburb through Decision Matrix 4-29
Method4.16 Selection of Best Option for Rest of MMR through Decision Matrix 4-30
Method.4.17 Selection of Best Option for Entire MMR through Decision Matrix 4-31
Method4.18 Best Option for the various regions based on the three selection 4-33
methods
5.1 MUTP: Status Of Implementation of Projects 5-13
iv

Mumbai Urban Transport Project Environmental Assessment
6.1 List of Projects Selected for PLEA/ MLEA 6-16.2 Summary of Screening Steps 6-2
7.1 List of Projects Selected for PLEA/ MLEA 7-17.2(a) Sectoral EMP 7-97.2(b) Sectoral EMP Implementation Framework 7-11
7.3 Environmental Quality Monitoring 7-137.4(a) Summary of Impacts for Jogeshwari-Vikhroli Link Road Project 7-24
(JVLR)7.4(b) Summary of Impacts for Borivali - Virar Quadrupling of Rail Lines 7-26
(BVQR) Project7.4(c) Summary of Impacts for ROB AT VIKHROLI 7-277.4(d) Summary of Impacts for PEDESTRIAN SUBWAY AT CST 7-287.4(e) Summary of Impacts for Station Area Improvement Scheme (SATIS) 7-29
at Thane West7.5 Environmental Management Plan for Jogeshwari-Vikhroli Link Road 7-307.6 Environmental Management Plan for Borivali - Virar Quadrupling of 7-37
_Rail Lines (BVQR) Project7.7 Environmental Management Plan for ROB at Vikhroli 7-447.8 Environmental Management Plan for CST PEDESTRIAN SUBWAY 7-51
PROJECT7.9 Environmental Management Plan for Station Area Improvement 7-56
Scheme (SATIS) at Thane West7.10 Project Level Environmental Monitoring Plan - JVLR PROJECT 7-617.11 Project Level Environmental Monitoring Plan - BVQR PROJECT 7-647.12 Project Level Environmental Monitoring Plan - VIKHROLI ROB 7-66
'PROJECT7.13 Project Level Environmental Monitoring Plan - (CST PEDESTRIAN 7-68
SUBWAY PROJECT)7.14 Project Level Environmental Monitoring Plan - (SATIS) 7-707.15 Monitoring And Reporting Process 7-717.16 Roles/Responsibilities And Strengthening Of Institutions 7-737.17 Cost Estimated for Imparting Training (2001) 7-217.18 Cost estimation for EMP implementation for JVLR and BVQR sub- 7-23
projects7.19 Overall cost estimates for MUTP sub-projects 7-24
8.1 Project Affected Households 8-5
9.1 Proposed time table for organizing public information and consultation 9-4workshop for a cross section of the society
9.2 Proposed time table for organizing public information and consultation 9-5workshop for a project affected people
v

Mumbai Urban Transport Project Environmental Assessment
LIST OF FIGURES
Figure Description PageNumber Number1.1 Map of Mumbai Metropolitan Region 1-31.2 Environmental Assessment Process 1-9
2.1 Institutional arrangement for Transport Related Environmental 2-11management
3.1 Landuse Map of MMR 3-33.2(A) Air-monitoring locations before year 1999 in MCGM area 3-73.2 (B) Air monitoring Locations since Jan 2000 in MCGM area 3-83.3 Annual Trends of S02 in MCGM area 3-153.4 Annual Trends of NOx in MCGM area 3-153.5 Annual Trends of SPM in MCGM area 3-163.6 Deviation of SO2 from regional mean 3-163.7 Deviation of NOx from regional mean 3-173.8 Deviation of SPM from regional mean 3-173.9 Trends of Pollutants Over the years 3-183.10 Annual Trends of air pollutants at Kalbadevi 3-183.11 Annual Trends of air pollutants at Parel 3-193.12 Annual Trends of air pollutants at Bandra 3-193.13 Coastal Zone Management Plan for Greater Mumbai 3-223.14 Coastal wetlands, forests and natural reserves ion MMR 3-23
4.1 Methodology Followed For Formulation Of CTS 4-44.2 Air Quality Assessment Methodology 4-164.3 Noise Quality Assessment Methodology 4-21
5.1 Map Of MUTP Rail And Road Sub -projects 5-25.2 Map showing sub-projects in the Island City 5-35.3 Map showing sub-projects in the suburbs of Greater Mumbai 5-45.4 Organizational structure of PMU 5-16
6.1 Location of Borivali - Virar railway tracks 6-106.2 Location of Jogeshwari - Vikhroli Link 6-126.3 Landuse Around ROB at Vikhroli 6-17
7.1 Environmental Assessment Process 7-47.2 Institutional Mechanism For Implementation Of EMP 7-19
vi

Mumbai Urban Transport Project Environmental Assessment
LIST OF APPENDICES
Appendix Description PageNumber Number
1.1 Documents Referred 12.1 (A) Environmental Acts/Rules For Various Parameters 32.1 (B) Process of Obtaining Environmental Clearance 82.1 (C) Recent Supreme Court Directives and other legal issues related 9
too vehicular pollution.3.1 Details of Demographic, Social, Economic and Environmental 10
Characteristics based on the baseline survey of11760 PAHs
4.1 Sectoral Level Environmental Assessment (SLEA) methodology 124.2 Environmental Assessment of Flyovers 354.3 Sectoral Environmental Impacts of Flyovers 419.1 Photographs of Public Consultation 53
vii


Mumbai Urban Transport Project Environmental Assessment
LIST OF ACRONYMS
BARC Bhabha Atomic Research Centre
BEST Brihan Mumbai Electrical Supply and Transportation Undertaking
BMC Brihan Mumbai Municipal Corporation
BOT Build Operate and Transfer
CBD Central Business District
CCF Chief Conservator of Forests
CEMP Community Environmental Management Plan
CIDCO City and Industrial Development Corporation
CNG Compressed Natural Gas
CO Carbon Monoxide
CPCB Central Pollution Control Board
CR Central Railway
CRZ Coastal Regulation Zone
CST Chatrapati Shivaji Terminus
CTS Comprehensive Transportation Strategy
DC Development Control
DCF Deputy Conservator of Forest
DFO Divisional Forest Officer
DM Demand Management
DoE Department of Environment
DPR Development Plan Report
EA Environmental Assessment
EAC Environmental Appraisal Committee
ED Environment Department
EEH Eastern Express Highway
EIA Environment Impact Assessment

Mumbai Urban Transport Project Environmental Assessment
EIRR Economic Internal Rate of Return
EMC Environmental Management Committee
EMP Environmental Management Plan
EMS Environment Management Strategy
EMU Electric Motivative Unit
FHWA Federal Highway Administration
GOI Government of India
GoM Government of Maharashtra
HTL High Tide Line
IBRD International Bank for Reconstruction and Development
IDA International Development Association
lIP Indian Institute of Petroleum
IMP Independent Monitoring Panel
IR Indian Railways
JVLF Jogeshwari Vikhroli Link Road
KMC Kalyan Municipal Corporation
LA Land Acquisition
LBS Lal Bahadur Shastri Marg
LPG Liquified Petroleum Gas
MCGM Municipal Corporation of Greater Mumbai
MEIP Metropolitan Environmental Improvement Programme
MLEA Micro Level Environmental Assessment
MMB Maharashtra Maritime Board
MMR Mumbai Metropolitan Region
MMRDA Mumbai Metropolitan Region Development Authority
MoEF Ministry of Environment and Forests
MPCB Maharashtra Pollution Control Board
MRTDC Mahashtra Road Transport Development Corporation

Mumbai Urban Transport Project Environmental Assessment
MRVC Mumbai Railway Vikas Corporation
MSRDC Maharashtra State Road Development Corporation
MSRTC Maharashtra State Road Transport Corporation
MTP Metropolitan Transport Project
MUTP Mumbai Urban Transport Project
NAAQ National Ambient Air Quality
NCR National Capital Region
NGOs Non Governmental Organisations
NMMC Navi Mumbai Municipal Corporation
NMMT Navi Mumbai Municipal Transport
NMTC Navi Mumbai Transport Corporation
NOC No Objection Certificate
NTDA New Town Development Authority
PAH Project Affected Households
PAPs Project Affected Persons
PCCF Principal Chief Conservator of Forests
PIA Project Implementing Agencies
PLEA Programmatic Level Environmental Assessment
PMU Project Management Unit
PRO Public Relation Officer
PT Public Transport
PUC Pollution Under Control
PWD Public Works Department
R & R Resettlement and Rehabilitation
RAP Resettlement Action Plan
RCI Railway Crowding Index
RI Road Investment
RIP Resettlement Implementation Plan

MIjmbai Urban Transport Project Environmental Assessment
ROB Road Over Bridge
ROW Right of Way
RPM Respirable Particulate Matter
RTO Regional Transport Office
S V Road Swami Vivekananda Road
SATIS Station Area Traffic Improvement Scheme
SCLR Santacruz Chembur Link Road
SEA Sectoral Environmental Ass -sment
SPA Special Planning Authority
SPCBs State Pollution Control Boards
TCl Traffic Congestion Index
TCS Tata Consultancy Services
TDR Transfer of Development Rights
TEI Transport Efficiency Index
TMC Thane Municipal Corporation
TMT Thane Municipal Transport Undertaking
TMU Traffic Management Unit
TNI Traffic Noise Index
TOR Terms of Reference
TPM Total Particulate Matter
UDD Urban Development Department
UMC Ulhasnagar Municipal Corporation
WEH Western Express Highway
WR Western Railway

EXECUTIVE SUMMARY


Mumbai Urban Transport Project Consolidated Environmental Assessment
EXECUTIVE SUMMARY
1.0 INTRODUCTION
Mumbai, over the last few decades has emerged as the financial and commercialcapital of India. Mumbai's population that was around 4 million in 1961 has nowreached 11.9 million in 2001. The urban growth has spread beyond the boundaries ofMunicipal Corporation of Greater Mumbai in the northern, north-eastern and easterndirections to form Mumbai Metropolitan Region (MMR). Mumbai has an area of 438sq. km and a population of 11.9 million. MMR has an area of 4354 sq. km andpopulation of about 18 million. By 2011 MMR is expected to have a population of 22million. MMR generates about 5% of national GDP and contributes to over one third ofIndia's tax revenues. A map showing various sub-regions of MMR is given inMap E-1.
Mumbai has a unique distinction of satisfying 88 % of its peak period travel demandthrough public transport such as suburban trains and buses. Of the remaining 12%peak travel demand, 5 % is met by taxis and 7 % by private vehicles. Although theseproportions are estimated to remain more or less same until 2011 (with public transportsector falling from 88% to 85 %), the number of public transport trips in the peakperiod will rise substantially. In terms of public transport, Mumbai is served by twozonal railways the western railway (WR) and central railway (CR). The suburbanrailway services, which are in fact metropolitan services in view of the frequency andshort distances between stations, carry close to 6 million passengers per day. Busservices are provided by Bombay electric Suburban Transport (BEST), with 3000buses, and undertake 4.5 million journeys per day, of which approximately 60 % areconnected with rail journeys. In the road transport sector, the road network in Mumbaiis predominantly radial along the peninsula and comprises three main corridors -Western Express Highway, Eastern Express Highway, and the Central corridor.Although termed 'expressways', the roads are essentially arterial roads and decline instandard as they approach and pass through the Island City. The number ofregistered vehicles in MMR grew from 521,000 in 1985 to 821,000 in 1991. Privatecars grew from 173,000 to 366,000 in 1991 and the number is expected to double in2011. The travelling conditions, transport infrastructure, road traffic congestion, airquality, resettlement and rehabilitation, and institutional framework are the some ofthe major issues which require urgent attention in order to improve the transport sectormanagement in Mumbai.
MMRDA therefore prepared a "Comprehensive Transport Strategy (CTS)" in 1994,providing a strategic framework for the transport sector of MMR. The four strategictransport options identified under the CTS study were subjected to EnvironmentalAssessment (EA). The environmental assessments are carried out according to World
1

Mumbai Urban Transport Project Consolidated Environmental Assessment
MAP E-1 SUB-REGIONS OF MMR
MUMBAI URBAN TRANSPORT PROJECT ENVIRONMENTAL ASSESSMENT
< {IIWt j \ \ i~~~~~~~~~~~~~~~SA OUAOOA
_; i. < \ WOI>SU U2

Mumbai Urban Transport Project Consolidated Environmental Assessment
Bank Operational Directives and guidelines of the Ministry of Environment & Forests(MOEF), Government of India.
EA consists of Sectoral Level Environmental Analysis (SLEA), Programmatic LevelEnvironmental Assessment (PLEA) and Micro-Level Environmental Assessment(MLEA). SLEA of the four transport options are carried out to determine thetransportation strategy for MMR, which would have minimum adverse environmentalimplications. Based on this strategy sub-projects are selected for MUTP. PLEAs andMLEAs are carried out for these sub-projects included in the recommended strategy.PLEAs are prepared for small generic sub projects, such as, flyovers, ROBs,Pedestrian subways, Station Area Traffic Improvements Schemes. MLEAs providedetailed analysis of the individual projects (identified under the strategic options) thatare expected to have significant environmental impacts.
2.0 TRANSPORT SCENARIO OF MMR
* Population of about 15 million in MMR generated total peak hour passenger trips of21,54,860 in 1993. Out of this 88 % were performed by public transport and 7 % byprivate vehicles and 5 % by taxis.
* In 2011 a population of nearly 22.5 million is projected to generate peak hour tripsof 32,60,431. Out of these 85 % will be by public transport, 9 % by private vehiclesand 6 % by Taxis.
* The last two decades are characterised by significant increase in private vehicleownership. The population growth in MMR in 1981-91 was about 3% p.a. whereasthe vehicular growth was 8.81 %. p.a. Private vehicle registration increased by 3.45times between 1976 and 1991 (from 1,08,146 to 6,35,172 vehicles).
* Private vehicles registration in MMR in 2011 is expected to be more than doublethe 1991 level (1 3,56,498 vehicles). Number of vehicles per 1000 persons in MMRis expected to increase from 44 in 1991 to 61.1 in 2011. Private vehicles are thusexpected to grow at a rate of 4.95 percent per annum as against the populationgrowth rate of 2.19 per cent per annum.
* Road transport is considered to be a major contributor of air pollution and noise inan urban environment. As per the URBAIR' study of 1992, vehicular trafficcontributes to about 54% of NOx emissions and 24% of PM10 emissions in GreaterMumbai. Also ambient air quality, particularly in respect to PM10 and NOx exceedthe National Ambient Air Quality Standards (NAAQS) in some areas. Noise levelsalong the roads have been found to be in the range of 65dB(A) and 85 dB(A). Bothvehicular pollution and noise in Greater Mumbai have become a cause of concern.
' Urban Air Quality Management Strategy in Asia, Greater Mumbai Report, World Bank Technical Paper No. 3813

Mumbai Urban Transport Project Consolidated Environmental Assessment
3.0 NEED FOR COMPREHENSIVE TRANSPORTATION STRATEGY
In order to deal with the increasing travel demand in an effective and financially andenvironmentallY sustainable manner, MMRDA prepared a long-term multi-modalComprehensive Transport Strategy (CTS) 2 for the MMR in 1994.
The objectives of such a strategy are;* To ensure adequate levels of accessibility in the expanding urban areas* To assist economic development of the region* To improve the safety record of transport system
The development of the strategy considered the following factors:* Existing landuse, demographic, economic/employment characteristics of the
region.* Existing transportation infrastructure and its level of adequacy / inadequacy to
meet the current and future transportation requirements.* Prospects of future regional development based on the growth potential of sub
regions as envisaged at that particular time.
In order to meet the projected travel demand the CTS identified the three strategicoptions. To facilitate comparison with the base level a 'Do minimum" option was alsoidentified. (Instead of a commonly used 'Do Nothing " option". These four options asidentified by the CTS are as follows:
Do Minimum: This option contained all the committed railway and roadprojects as envisaged in 1993.
Public Transport (PT): In addition to all the committed projects of 'Do Minimum'option, this option contained many railway projects toincrease the capacity of rail transport.
Public Transportation: The option contained all the projects of 'Public Transport'option with Demand and demand management measures such as, cordonManagement pricing and parking control in the Island City.(PT+DM)
Road Investment (RI): In this option, the emphasis was laid on road projects,which are expected to encourage private vehicle trips.The option also included all the committed projects in "DoMinimum' option.
2~~~~~~~~~~~~~~~
Comprehensive Transport Plan for MMR. Prepared by WS Atkins, July 1994.4

Mumbai Urban Transport Project Consolidated Environmental Assessment
Under each option. a number of investment sub projects were identified forimplementation in MMR.
Based on the techno-economic analysis of the above options, and keeping inperspective the present and future transportation needs of the region, the CTS studyrecommended a transportation strategy which emphasized:
* Service enhancement and capacity optimization of the present railway system toaddress present acute overcrowding and future transportation needs, and
. Moderate investment in improving road network particularly in suburban east -west links and road based public transportation system, and
. Adoption of demand management to promote public transportation and restrictprivate vehicle demand on the road network, particularly in Island City.
Mumbai Urban Transport Project (MUTP) places emphasis on public transportationand relieving traffic congestion through a number of traffic management techniques.Thus, MUTP is in line with the strategic transport option recommended by CTS study.
4. ENVIRONMENTAL ASSESSMENT
4.1 Environmental Assessment Process
CTS included environmental assessment of strategic options in a limited way byconsidering vehicular emission loads associated with each option. It did not includeenvironmental impact assessment of individual projects and the associated EMPs. Itwas therefore necessary to undertake environmental assessment at the sector aswell as project level according to the OP 4.01 of the World Bank. MMRDA undertookand completed such an exercise through consultants in 1998.
As described earlier, the EA consists of:* Sectoral Level Environmental Analysis (SLEA) for the four strategic transport
options for MMR identified as part of CTS.
* Programmatic Level Environmental Assessment (PLEA) of generic sub projects.* Micro-Level Environmental Assessment (MLEA) for sub-projects likely to have
significant adverse environmental impacts.
A flowchart of the entire process starting from developing the CTS to EA is given inFigure E-1.
5

Mumbai Urban Transport Project Consolidated Environmental Assessment
FIGURE E-1 ENVIRONMENTAL ASSESSMENT PROCESS
Comprehensive Transportation Study4 strategic options
1. Do minimum 19942. Public transport option3. Public transport + Demand management4. Road Investment ootion
Sectoral Level Environmental Assessment (SLEA)Evaluation of strategic options with respect to thefollowing environmental criteria 1996- Traffic Analysis- Impact on Air, noise, social, ecological resources a
transportation service quality
Selection of strategic option(PT + DM)
Screening of projects with respect 1997to potential impacts
Programmatic Level Micro-level EnvironmentalEnvironmental Assessment (MLEA)Assessment (PLEA) - Subprojects selected - road
- Sub-projects selected: improvements, suburban railway 1998ROBs, pedestrians subways subprojects
- Analysis of traffic & transport - Impact on traffic, air, noise, water- Impact on air, noise, social and landuse, social and ecological
ecological resources, landuse resources.
Preparation of updated and consolidated 2001FEA Pand project specific EMPs
| Drafl Consolidated EA---, Cosutaio
-6Z 001
6

Mumbai Urban Transport Project Consolidated Environmental Assessment
4.2 Sectoral Level Environmental Assessment (SLEA)
At the sector level, environmental impacts are seen as arising due to sectoralpolicies, programs, operations and regulations. SLEA with reference to MUTPtherefore involves assessment of environmental impacts of the transportation sectoras a whole, i.e. the environmental impacts due to physical transportation activitiesthrough road and rail, government policies and other traffic management measures.
SLEA is carried out for the four strategic transport options for MMR described in theprevious section. For the purpose of environmental analysis, MMR was divided intofour sub regions - Island City, Westem Suburbs, Eastern Suburbs and the Rest ofMMR. The four environmental components used for SLEA were:* Air quality* Noise* Ecological* Social* Transport Service indicators
4.2.1 Existing Environmental StatusThe purpose of compiling the baseline environmental status is to provide a basis forcomparison of the changes in environmental quality which may occur due to theimplementation of individual transportation improvement schemes/projects as well asthe transportation strategy as a whole. The data on baseline status of the aboveenvironmental components were collected and compiled from various existingsources, and was also supplemented by primary data collected at individualproposed sites.
Ambient Air Quality and NoiseBaseline ambient air and noise quality were monitored in detail in 1996 at severallocations in the 4 sub-regions of MMR (Island city, Eastern suburbs, Westemsuburbs and rest of MMR). Separate monitoring was carried out as a part of SectoralLevel Environmental Assessment (SLEA) and Programmatic and Micro-level EAs(PLEA and MLEA). Secondary baseline data for the years 1997 to 2000 wascollected from various sources such as MCGM, NEERI etc. for the purpose ofupdating the earlier 1996 baseline studies.
All above studies point out that S02, NOx are generally well below the NationalAmbient Air Quality Standards (NAAQS) at residential and industrial locations. NOxlevels however exceed the standards at traffic intersections, as shown by monitoringdone by MCGB. Also S02 and NOx levels have not changed significantly since 1996when ambient air quality was monitored for SLEA, MLEA and PLEA purposes.
All studies have shown that PM10 and SPM exceed the NAAQS at almost allresidential and industrial locations and also at traffic int- -sections. For both SPM andPM10, the highest values were observed in 1997 (except Parel). Since 1997 both
7

Mumbai Urban Transport Project Consolidated Environmental Assessment
pollutants show a decreasing trend, although they continue to exceed the standards.It is clear, that a comprehensive strategy is needed to bring levels of SPM and PM1owithin NAAQS levels gradually over the years. Noise levels in Mumbai wereobserved to exceed the noise standards, particularly at traffic intersections and otherpublic places.
Socio-economic Characteristics
Socio-economic profile of Mumbai is diverse. About 50 % of Mumbai's populationhave sought shelter in slums as squatters. A large number of these settlements arelocated along railway tracks, on public lands and lands that are designated for roadsor road widening in the 'Master Plan". No transport project can therefore beimplemented without confronting the problem of Project Affected Households (PAHs).
MMRDA has prepared a Resettlement Action Plan3 (RAP) for the PAHs to alleviatethe adverse social impacts associated with the implementation of MUTP. In the firstphase of MUTP about 19000 families are likely to be affected and will requiresettlement.
EcologY
The Arabian Sea surrounds the Greater Mumbai at the west and east boundaries. Itis separated from the mainland by the Thane Creek and Bombay Harbour, which isopen to the Arabian Sea on its south and is connected at its northern extremity to theUlhas River and Vasai Creek. The Vasai Creek forms the northem boundary of thecity.
The coastal waters are polluted by the discharge of untreated effluent both ofdomestic and industrial origin. 90% of effluent comes from domestic sewage,whereas remaining 10% comes from industries. Several pollutants such as heavymetals and persistent chemicals, which are capable of being accumulated in benthicfauna and flora, are discharged into coastal waters. The present situation not onlyaffects the local ecosystem but also renders the coastal areas unfit for recreationalpurposes.
The coastal belts of MMR have abundant wetlands/ mangroves exhibiting significantecological diversity. Most of these wetlands have been used to create land forconstruction purposes and to site industries around Ghodbunder, Thane and NewMumbai areas. The wetlands are also used as garbage dumping grounds. Thesefactors have led to the degradation of wetlands and mangroves over a period of time.
3 Resettlement Action Plan, MMRDA,, August 20018

Mumbai Urban Transport Project Consolidated Environmental Assessment
None of the MUTP projects except for a part of the alignment of Bhayander-Virarrailway lines passes through areas which have sensitive ecological resources. Thisarea has mangrove vegetation.
Land Use
The first Regional plan for MMR was prepared in 1973. The existing picture of landuse is however, different from what was envisaged in the plan, due to phenomenalgrowth of population and development in the region. The built up areas haveconsiderably increased with massive residential growth in Vasai - Virar belt along thewestern corridor and at various towns along Mumbai -Pune corridor. The agricultureand forest lands have declined at faster rate than anticipated in 1973.
Traffic and Transportation
In Greater Mumbai, traffic movement is mainly along the north-south direction. Themajor transportation modes are railways and road transport.
Railway service along the north-south railway corridors is operated by Western andCentral Railways. The Western Railway provides service from Churchgate to Virarand Central Railway operates trains from Chatrapati Shivaji Terminus (CST) to Karjatin south-east and Kasara in north-east.
MMR has a suburban rail network catering to 6 million passengers per day. Inaddition to Railways, the public bus service is provided by BEST to 4.5 millionpassengers with a fleet of about 3000 buses.
Traffic situation in MMR, particularly in Greater Mumbai is expected to become worseas the vehicle ownership in the area increases at a rapid pace.
9
Mumbai Urban Transport Project Consolidated Environmental Assessment
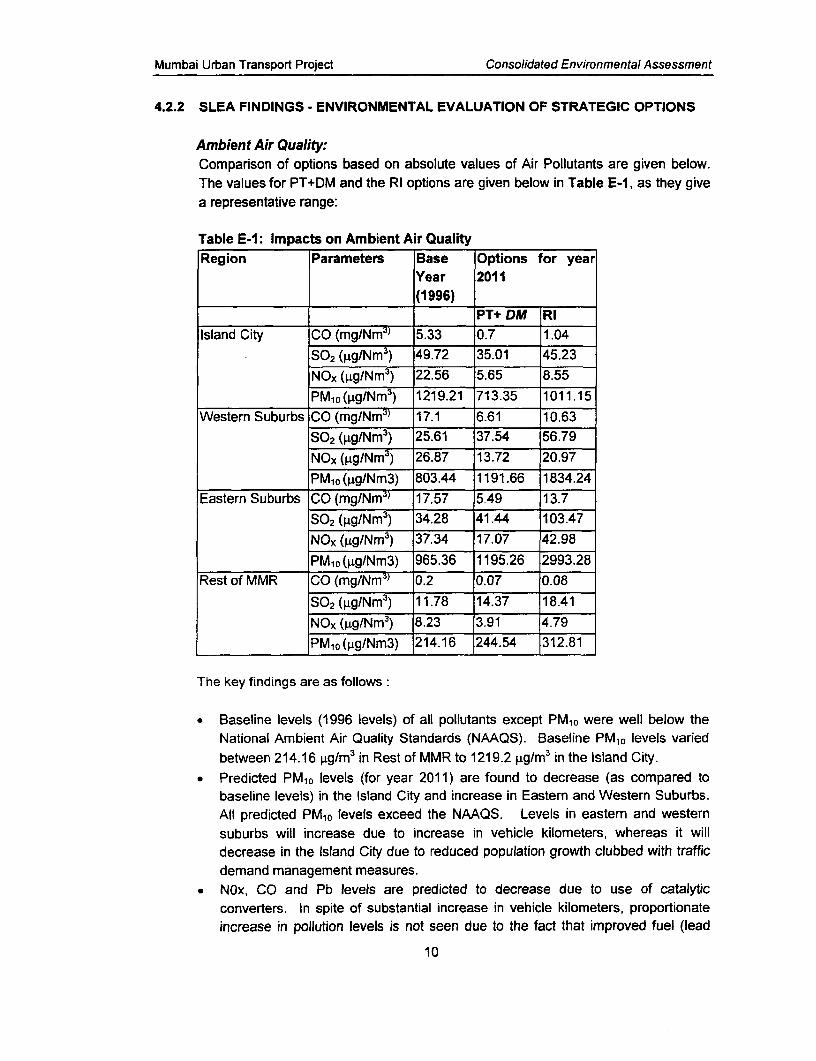
4.2.2 SLEA FINDINGS - ENVIRONMENTAL EVALUATION OF STRATEGIC OPTIONS
Ambient Air Quality:Comparison of options based on absolute values of Air Pollutants are given below.The values for PT+DM and the RI options are given below in Table E-1, as they givea representative range:
Table E-1: Impacts on Ambient Air QualityRegion Parameters Base Options for year
Year 2011(1996)
PT+ DM RIIsland City CO (mg/Nm3 ) 5.33 0.7 1.04
SO2 (,g/Nm3) 49.72 35.01 45.23NOx (pg/Nm3) 22.56 5.65 8.55
PM1o (pig/Nm3) 1219.21 713.35 1011.15
Western Suburbs CO (mg/Nm3) 17.1 6.61 10.63
S02 (pg/Nm3) 25.61 37.54 56.79NOx (jig/Nm3) 26.87 13.72 20.97PM1o (pg/Nm3) 803.44 1191.66 1834.24
Eastern Suburbs CO (mg/Nm3' 17.57 5.49 13.7
S02 (pg/Nm3) 34.28 41.44 103.47NOx (pg/Nm3) 37.34 17.07 42.98PM1o (pg/Nm3) 965.36 1195.26 2993.28
Rest of MMR CO (mg/Nm3) 0.2 0.07 0.08
SO2 (pg/Nm3) 11.78 14.37 18.41NOx (gg/Nm ) 8.23 3.91 4.79
PMiO(gg/Nm3) 214.16 244.54 312.81
The key findings are as follows:
* Baseline levels (1996 levels) of all pollutants except PM10 were well below theNational Ambient Air Quality Standards (NAAQS). Baseline PM10 levels variedbetween 214.16 pug/m3 in Rest of MMR to 1219.2 pg/M3 in the Island City.
* Predicted PM10 levels (for year 2011) are found to decrease (as compared tobaseline levels) in the Island City and increase in Eastern and Western Suburbs.All predicted PM,0 levels exceed the NAAQS. Levels in eastern and westernsuburbs will increase due to increase in vehicle kilometers, whereas it willdecrease in the Island City due to reduced population growth clubbed with trafficdemand management measures.
. NOx, CO and Pb levels are predicted to decrease due to use of catalyticconverters. In spite of substantial increase in vehicle kilometers, proportionateincrease in pollution levels is not seen due to the fact that improved fuel (lead
10

Mumbai Urban Transport Project Consolidated Environmental Assessment
free, low sulphur) and improved engines (with catalytic converters andcompliance with Euro II or Bharat II emission standards) have.been assumed.
* SO2 levels were predicted to increase in the eastem and western suburbs due togrowth in population and traffic. The levels were predicted to decrease in theisland city for the PT+DM option, as island city is already congested with littlepossibility of population and traffic growth.
* It was concluded that the PT+DM option performed better for the Island City andRest of MMR and the PT option performed better in the eastern and westernsuburbs.
Noise levels:Comparison of options based on absolute values of Traffic Noise Indicators4 aregiven below in Table E-2
Table E-2: Traffic Noise ImpactsRegion Parameters Base Options for year
Year 2011(1996)
PT+ DM RI
Island City TNI (Day) 61.4 63.7 70.3TNI (Night) .5 98.7 95.7
Western Suburbs TNI (Day) b i.7 71.1 70.4TNI (Night) 86.4 96.3 93.8
Eastern Suburbs TNI (Day) 79 90.8 88.6TNI (Night) 94.4 68.8 100
Rest of MMR TNI (Day) 30.4 50.1 44.0TNI (Night) 60.3 27.7 80.2
The key findings are as follows:* Day time noise impacts were found to be lower in island city under the PT+DM
option. However, the same option gave rise to higher noise levels at night time.* In western suburbs, all the four options resulted in almost the same level of noise
impacts during the day time.* Night time noise levels were predicted to be higher for the Public Transport
Option. In eastern suburbs, all four options resulted in the same impacts for nighttime.
* Thus in brief, none of the options perfor -a consistently for the four sub-regions.Day time and night time TNI also showea conflict in favouring any single option.
4 Traffic Noise Indicator: TNI (Night) = % length of road links in a sub region exceeding night timestandards, TNI (Day) =% length of road links in a sub region exceeding day time standards
11

Mumbai Urban Transport Project Consolidated Environmental Assessment
Ecology
Quantitative analysis of the ecological impacts captured the following concepts:
* Damage to an ecological area due to a road/rail alignment will be proportional tothe area covered by road/rail segment in the ecologically sensitive zone.
* Damage will be severe if the ecological area or system is of higher quality.
Ecological indicators for natural and man-made systems were used to estimatequantitative ecological impacts for making comparison of various transport optionswith respect to their ecological impacts. The ecological impact on each of thesystems is measured by adding weighted areas of road/rail alignments traversingthrough the system, where weights represent the quality of the system. Thusecological impact indices for the 2 systems can be expressed as follows:
El (Natural) = El-1 = £ WniAjEl (Man-Made) = EI-2 = ZWmjAj
Where:Wni = Weight associated natural ecological system of class iWmj = Weight associated man-made ecological system of class iAi = Total area of road/rail alignment intercepted by natural system of i. categoryAj = Total area of road/rail alignment intercepted by man-made system of i. category
These predicted indices values are given in the Table E-3 given below:
Table E-3 Ecological Impacts
Region Ecological Impact Base Year Options for year 2011Indicator (El) (1996)
PT+ DM RI Do Minimum PublicTransport
Island City El-1 (Natural System) 0 0 0.06 0 0El-2 (Man-Made) 0 0 0 0
Western El-1 (Natural System) 0 0.076 0.047 0 0.076Suburbs EI-2 (Man-Made) 0.03 0 0 0.03Eastern El-1 (Natural System) 0 0.035 0.017 0.005 0.035Suburbs EI-2 (Man-Made) 0 0.003 0 0Rest of El-1 (Natural System) 0 0.186 0.364 0.063 0.186MMR EI-2 (Man-Made) 0.26 0.490 0.2 0.26
In the Island City, ecological impacts are not observed, as new transport projects arenot proposed. Projects such as Borivali-Virar quadrupling of rail lines, under the PTand PT+DM options will have ecological impacts in the Eastern and Western
12

Mumbai Urban Transport Project Consolidated Environmental Assessment
Suburbs of Greater Mumbai. Option RI has the most severe impact on Rest of MMRas many new road projects are proposed in sensitive areas.
Socio-economic impacts (Limited to Displacement Of People):Development of new rail or road links or widening roads in Mumbai invariablyinvolves Projected Affected Households (PAHs). Minimising number of such PAHsshould therefore be one of the objectives of selecting the strategic option.
Comparison of options based on Rehabilitation and Resettlement (R&R) Impacts aregiven in the Table E-4 below:
Table E-4: Displacement of HouseholdsRegion Parameters Base Year Options for year
(1996) 2011
PT+ DM* Rl*Island City Number of Households 0 0 0
displaced
Western Number of Households 0 5631 1752Suburbs displaced
Eastern Number of Households 0 1010 7456Suburbs displacedRest of Number of Households 0 6641 9483MMR displaced I
*The number of households displaced does not include the persons affected by the project onoptimisation of harbour line.
The key findings are:* None of the options required displacement of people/households in the Island
City.
* In Western Suburbs, the number of households required to be displaced (5631households) was highest for the PT and PT+DM options
. In Eastern Suburbs, the RI option required the maximum displacement ofhouseholds (7456 households)
* In rest of MMR, the RI option followed by PT options required the maximumdisplacements. 9483 and 6641 households were estimated to be displaced bythe RI and PT options respectively.
Transportation Service
Three indices used to reflect impact of transportation options on transportationobjectives were Road Traffic Congestion Index (TCI), Railway Crowding Index (RCI)and Road Transport Efficiency Index (TEI).
Road Traffic Congestion Index (TCI): TCI was designed to measure the level ofservice (V/C). Lower value of TCI indicated lower congestion level on roads.
13

Mumbai Urban Transport Project Consolidated Environmental Assessment
Railway Crowding Index (RCI): RCI reflected the extent to which the crowding insidethe trains would reduce under various options. Lower value of the index meant morereduction in crowding and hence a better option.
Transport Efficiency Index (TEI): TEI captured the concept that vehicles operatingclose to their optimum speeds will be fuel efficient and less polluting. TEI value closeto 1 reflected vehicles operating efficiently at or near optimum speeds.
The CTS model outputs were used to determine the above indices. The variousindices calculated for the sub-regions are given below in Table E-5.
TABLE E-5 COMPARISON OF OPTIONS BASED ON TRANSPORT SERVICE
Region Parameters Base Options for year 2011year PT+ DM* RI* Do PT(1996) Minimum
ISLAND Traffic efficiency 0.47 0.54 0.50 0.48 0.48CITY Index
Traffic 13 6.9 7.7 12.5 12.8Congestion IndexRailway crowding 2.186 1.078 2.186 2.186 1.078index
Westem Traffic efficiency 0.482 0.542 0.559 0.566 0.575Suburbs Index I
Traffic 16.9 13.86 9.2 12.33 12.33Congestion Index _Railway crowding 2.278 1.368 2.278 2.278 1.368index _ _ _ _ _ _ _ _ _ _ _ _ _ _ _ _ _ _ _ _ _ _ _ _ _ _
Eastern Traffic efficiency 0.32 0.49 0.52 0.48 0.49Suburbs Index
Traffic 74.3 16.88 13.3 20.66 16.88Congestion IndexRailway crowding 1.736 1.568 1.736 1.736 1.568
_________ indexRest of Traffic efficiency 0.308 0.41 0.44 0.391 0.413MMR Index I
Traffic 81.46 12.86 12.45 14.54 13.83Congestion IndexRailway crowding 1,.442 0.552 1.442 1.442 0.552index | _
The key findings are:
• In Island City, PT+DM option performed better w.r.t TCI and RCI transport serviceindices.
* In Western Suburbs, PT + DM performed better w.r.t TCI and RCI transportservice indices.
* In Eastern Suburbs, PT and PT + DM preformed better w.r.t. RCI transportservice index. .
* In Rest of MMR PT + DM performed better w.r.t. TCI and RCI, transport serviceindices.
14

Mumbai Urban Transport Project Consolidated Environmental Assessment
Selection of the Best Optfon
As seen above, the various impacts associated with each option were evaluatedusing 13 indicators for 5 major impact areas - air, noise, ecology, social andtransport. Since all indicator values were not favourable for any single option, variousmethods such as Decision Matrix Method, Maximum Favourable Parameters andEstimated PM10 concentrations were used to find the most suitable transport optionfor MMR.
A summary of the results of SLEA using the above three selection methods is givenin Table E-6 below. Overall 'Public Transport with Demand Management'emerged as the best option for Island City and MMR as a whole. For Westemand Eastern Suburbs, 'Public Transport' or 'Do Minimum' appeared to be the bestoptions. 'Do Minimum' left much to be desired from the viewpoint of developing thetransport sector. Hence, the choice was narrowed down to 'Public Transport' and'Public Transport with Demand Management'. Both these options had a common setof projects, which laid emphasis on encouraging public transportation. Demandmanagement measures were important to alleviate congestion and pollution levels inIsland City. 'Public Transport with Demand Management' was recommended forimplementation in MMR.
Table E-6 Best Option for the various regions based on the three selection methods
Region Maximum Number of Method of Decision Based on PM10Favorable Indicators Matrix Concentration
Island City Public Transport + Public Transport + Public Transport + DemandDemand Management Demand Management Management.-
Western Public Transport Public Transport Public TransportSuburbsEastern Do Minimum/Public Public Transport Do Minimum / PublicSuburbs Transport TransportRest of Public Transport + Public Transport + Public Transport + DemandMMR Demand Management Demand Management ManagementTotal MMR Public Transport Public Transport + Public Transport + Demand
Demand Management jManagement
4.2.3 Environmental Impacts of Projects not included in MUTP
After the EA study was conducted, MSRDC planned to construct 50 flyovers, out ofwhich 30 have been constructed, and the rest are at various stages of construction.The flyovers have been mainly constructed or planned on highways of MMR -Western Express Highway, Eastern Express Highway, and Panvel Sion Highway.The purpose of the flyovers on Highways seems to facilitate uninterrupted flow oftraffic in and out of MMR. In addition, a number of flyovers are planned or are at
15

Mumbai Urban Transport Project Consolidated Environmental Assessment
different stages of construction in the Island City, to relieve traffic congestion at thecritical intersections.
MMRDA carried out a comprehensive study on flyovers5, which includeenvironmental analysis as well. The study brought forth various environmentalconcerns associated with flyovers, which could have sectoral environmental impacts.
Analysis shows that these flyovers would have short term benefits in terms ofreducing the travel time and improvement of local ambient air quality. However, inthe long run with increasing private vehicle usage and absence of commensurateroad capacity, congestion and related pollution problems may still persist. PT+DMwill hence continue to be the best option.
5.0 PROJECT DESCRIPTION
The Mumbai Urban Transport Project (MUTP) has been formulated by selecting sub-projects that are subsets of the PT+DM options. The strategy followed in designingMUTP is as follows:
i. Placing high priority on investment schemes aimed at promoting public transportparticularly suburban railways.
ii. Developing roads and road over bridges in suburban areas and outlying areas ofMMR to relieve road congestion.
iii. Relieving automobile traffic congestion in the Island City through DemandManagement measures.
MUTP has identified a number of sub-projects to strengthen the suburban railtransport and road transport in Mumbai. These projects are depicted in Map E-2 andare briefly described below:
5.1 Rail Projects
MUTP places considerable emphasis on improving railway capacity in Mumbai.Various sub-projects identified under this component are described below:
i) Provision of Additional Pair of lines between Borivali and Bhavander (9.13kms) & Bhavandar and Virar (16.87 kms)
The scope of the project includes laying of additional two railway lines betweenBorivali -Bhayander and Bhayander - Virar with EMU car shed at Virar. This alsoincludes construction of an important bridge of 2.00 length on Vasai creek. The
5 Traffic, Economic and Environmental Impact Assessment of Flyovers in Mumbai, Tata Consultancy Services, 2000.16

Mumbai Urban Transport Project Consolidated Environmental Assessment
Map E-2 MUTP RAIL & ROAD PROJECTS IN GREATER MUMBAI
MUMBAI URBAN TRANSPORT PROJECT ENVIRONMENTAL ASSESSMENT
't N.__
A
-X,, >'17 -
17

Mumbai Urban Transport Project Consolidated Environmental Assessment
project includes introducing 8 rakes of 9-car equivalent to increase the capacity onthis line.
ii) Provision of 5th And 6th Line between Kurla and Thane
The scope of project includes laying of additional two railway lines between Kurlaand Thane over a length of 16 kms. The project includes introducing 11 rakes of9-car equivalent by addition of this line. This will enhance the capacity of existingsuburban system of Central Railway.
iii) Provision of 5th Line between Santacruz and Borivali
The scope of project includes construction of 5th railway line between Santacruzto Borivali covering about 15 kms. Four addtional 9 car rakes or 12 car rakesservice could be introduced on this line to enhance the capacity of suburbansection of Western Railway.
iv) DC To AC Traction Conversion Proiect (1500 V DC To 25000 V AC)
The project scope includes the conversion of DC to AC Traction so that the sub-urban trains in Mumbai would be converted to a traction of 25000 V AC from thepresent 1500 V DC. The project would involve the provision of 18 DC sub-stations (5 substations on Western Railway and 13 sub-stations on CentralRailway) in place of existing 69 DC sub-stations.
(v) Optimisation of Rail Operations
These works relate to 12 coach rake operations (instead of 9), better powersupply and signalling. This will not have adverse environmental impacts.
5.2 Road Expansion and Traffic Component.
5.2.1 Road Widening and Expansion Proiectsi) Jogeshwari - Vikhroli Link Road (JVLR):
This is one of the East - West Link roads recommended by several studies in thepast to relieve the congestion on north - south corridors by providing efficienteast west connection. At present it is a 2-lane carriageway which is proposed forupgradation to 3-lane dual carriageway with a central median. The total length ofthis link is 10.60 km.
ii) Santacruz - Chembur Link Road (SCLR)
The SCLR has been proposed under phase I of MUTP to correct east - westdeficiencies in the road network, reduce the congestion on the north - south
18

Mumbai Urban Transport Project Consolidated Environmental Assessment
corridors, and to alleviate the problem of traffic congestion around Kurla Stationand surrounding areas. Its total length is 5.48 km connecting WEH to EEH.
5.2.2 Construction of ROB's
Construction of the ROBs is crucial for increasing the frequency of suburban trainsunder the scheme of Optimising of Western and Central Railways.
i) ROB at Jogeshwari (South)The proposed ROB, linking SV Road with the WEH will be new 2x3 lane bridgeover the Westem Railway Lines near the Jogeshwari Railway Station. This ROBwill replace level crossing no. 24 & 25 on the Western Railway.
ii) ROB at Jogeshwari (North)The proposed ROB linking SV road and WEH will be a new 2x2 lane bridge overthe Western Railway line north of the Jogeshwari Railway Station. The ROB willreplace level crossings no. 26 & 27 on the Western Railway.
iii) ROB at VikhroliThe proposed ROB linking LBS Marg and EEH, is a new 2-lane bridge over theCentral Railway Line- This ROB will replace the existing level crossing no. 14near the Vikhroli Railway Station.
5.2.3 Area Traffic Control
In order to reduce the delays and congestion and improve the traffic flows, anadaptive area control system has been designed for the Island City of Mumbai. Thesystem will include state-of-the art computer controlled traffic signal system, vehicledetectors, data communication network and central control room facility. Thecomputer controlled system will be supported by junction improvements.
5.2.4 Pedestrian sub-ways and bridges
To reduce the conflicts between pedestrians and the vehicles, which often result inaccidents, and to improve overall pedestrian safety, a number of pedestrian gradeseparation measures have been proposed on major corridors in the Island City andsuburbs.
5.2.5 Station Area Traffic Improvement Scheme (SATIS)
To improve the pedestrian movements and general traffic circulation, SATIS areproposed at seven stations viz. Ghatkopar, Andheri, Borivali, Kurla, Malad, Chemburand Dadar Stations.
19

Mumbai Urban Transport Project Consolidated Environmental Assessment
5.2.6 Other Proarams
The other programs identified under road components pertain to the institutionalcapacity building, improving efficiency etc. These projects are not likely to impact theenvironment directly, and therefore, are not discussed here.
6.0 Project Level Environmental Assessment
6.1 Background
Apart from the sectoral environmental impacts individual sub-projects would have thelocalised environmental impacts at programmatic and micro levels. For thispurpose, environmental assessment of generic sub projects [Programmatic LevelEnvironmental Assessment (PLEA)] and detailed environmental assessment of majorindividual schemes [Micro Level Environmental Assessment (MLEA)] is carried out.
6.2 Selection of Projects Requiring MLEAIPLEA
Environmental impacts of a project are determined by project activities and thesurrounding environment. Thus, similarity in these features could allow theenvironmental analysis for one project to be replicated for other projects in the samegroup. Thus, environmental assessment (EA) can be conducted for only selectedprojects, which is called Programmatic Level Environmental Assessment (PLEA).However, in case of groups of sub-projects with varying environmental settings,impacts need to be assessed individually at micro level and hence can be titled asMicro Level Environmental Assessment (MLEAs).
For selecting the projects under the above-mentioned two categories of PLEA andMLEA, a screening method is used. For screening purpose, the following parametersare used:
* Sensitive ecological areas* Air and noise pollution* Special physical features which adds to aesthetics* The type of project activities
The screening methodology used six screens to identify a project from a group ofprojects for conducting EA. The first screening, removes the projects with negligibleenvironmental impacts from the selection process and distinguishes the projectswhich are amenable to PLEA or MLEA. The projects amenable to MLEA and PLEAwere passed on to the second screening test. The second screen removed projectsfor which EA was conducted earlier, and the remaining projects were passed on forthe third level screening. From the third level onwards, projects with lesser potentialfor adverse impacts on specified environmental domains were systematicallyremoved. This process of screening led to the selection of projects with higher
20

Mumbai Urban Transport Project Consolidated Environmental Assessment
potential for adverse environmental impacts for conducting environmental analysis.The screening methodology initially subjected the projects to stringent screeningtests, and at the last stage, screening was based on subtler issues, which requiredcloser look at the environmental settings of the project.
6.3 Projects considered for MLEA /PLEA
The above mentioned screening methodology led to the selection of sub-projects forPLEA and MLEA. These sub-projects along with the current status of PLEA/MLEAare given below in Table E-7.
21

Mumbai Urban Transport Project Consolidated Environmental Assessment
Table E-7 List of Projects Selected for PLEA/ MLEA
Sr.No. Name of the Project 1Type of 1Status of EAiEMP EMP |Schedule ofI |EA |Preparation Completion
Rail Component1 5th line between Santacruz and EMP These works are in an advanced
Borivali stage of completion.Environmental audit and EMP 31/1/02
.____________________________ _________ are to be com pleted.5th and 6th lines between Kurla EMP These works are in an advancedand Thane stage of completion.
Environmental audit and EMP 31/1/02are to be completed.
3 Borivali-Virar Quadrupling of MLEA EA & EMP done in 1998. EMP 31/1/02Lines being updated.i) Borivali Bhayander Rail lineii) Bhayander - Virar Rail line
4 Optimization on westem EMP/ PAH have been resettled in 31/1/02Railway (including 12-car rakes CEMP permanent / transiton through lines) accommodation. CEMPs are
being prepared for theseresettlement sites.
5 Optimisation on Central Railway EMP/(including 12-Car rakes on CEMPthrough lines)
6 Optimisation on Harbour line EMP/CEMP
7 DC/AC conversion EMP Being Prepared 31/1/02
8 EMU coach re-manufacturing No EAReq.
9 Track machines No EAReq.
10 Technical Assistance No EA --
Req. _Roads and Traffic Component
1 Jogeshwari-Vikhroli Link Road MLEA EA & EMP done in 1998. EMP 15/12/01being updated.
2 Santacruz-Chembur link road MLEA EA I EMP Being prepared as a 31/12/01part of the engineering feasibilitystudy.I_Independent Review of EMPs 31/1102
3 ROB at Jogeshwari (South) EMP Being done on the basis of 31/1/02PLEA for ROB at Vikhroli.
22

Mumbai Urban Transport Project Consolidated Environmental Assessment
Table E-7 Cont.Sr.No. Name of the Project Type of Status of EAIEMP EMP Schedule of
EA Preparation Completion4 ROB at Jogeshwari (North) EMP Being done on the basis of 31/1102
PLEA for ROB at Vikhroli.5 ROB at Vikhroli PLEA EA & EMP done in 1998. EMP 31/1/02
being updated. _
6 Dadar - Mahim One way system No EA -Req. .
7 Pedestrian subways and bridges EMP EA & EMP for CST (', done in 31/3/021998. EMP for other subwaysbeing done on basis of CST- EA; EMP.Independent Review of EMPs 3014102
8 Station area traffic improvement EMP EA/EMP for Thane done in 31/3/02schemes (SATE,) 1998. EMP for other SATIS
being done on the basis ofThane EA / EMP.Independent Review of EMPs 30/4/02
9 Other traffic management No EAschemes Req.
10 Procurement of Buses No EAReq.
11 Environment-air quality No EA -monitoring Req.
12 Technical Assistance, studies No EAtraining Req.
6.4 MLEAIPLEA Methodology
6.4.1 MLEA
The Micro Level Environmental Analysis (MLEA) is carried out for those projectsunder MUTP, which required detailed environmental analysis. The detailed analysiswas required as these projects have potential to significantly affect the environmentand could influence large areas, since these alignments traverse through a variety ofenvironmental settings. These environmental settings include ecologically sensitiveareas like mangroves, residential and commercial areas. Also, the projects areexpected to change the traffic pattern in the areas near the alignments. Therefore,depending on the environmental setting, the projects could impact air, water, landand ecological resources. There could also be impacts on the residential areas nearthe alignments.
The MLEA of the projects included the following analysis during construction andoperation stages of the projects:* Impact on Traffic* Impact on Land Use
23

Mumbai Urban Transport Project Consolidated Environmental Assessment
* Water Quality Impacts* Air Quality Impacts* Noise Impacts* Impacts on Ecological Resources
As seen in the Table above, MLEAs were done for ROB at Vikhroli, PedestrianSubway at CST and SATIS at Thane.
6.4.2 PLEA
The PLEAs for the projects mentioned above are carried out in three parts, viz.Determination of baseline environmental status, Environmental Impact Assessmentand Developing environmental mitigation measures. Being highly localised projects,the environmental status was determined for an area, which extended up to 150 mfrom the project site. Generic mitigation measures were developed for therepresentative sub projects so that these could be applied to others of the same type.The EA was carried out with respect to various components namely traffic andtransport, landuse, ecology, peoples perceptions, air quality, noise levels andseverance. Depending on the project type, other relevant impact areas were alsoconsidered.
6.4.3 MLEA/PLEA Findings
Separate PLEA and MLEA reports including mitigation measures for the identifiedadverse environmental impacts are prepared for the five projects. The environmentalimpacts of these projects are described in Chapter 6. The environmental impactsidentified during the construction and operation phases of the projects are as follows:
Construction Phase* Displacement of population* Nuisance to nearby residential areas from noise and dust generation due to
construction activity* Sanitation problems from labour camps at site* Cutting of existing plantation* Land degradation at quarry sites* Worker and public safety
Operation Phase* Mild to moderate increase in air pollution and noise levels from road traffic and
increased noise levels due to train movement.* Beneficial impacts on traffic and conveyance.
A summary of significant adverse environmental impacts identified for the individualsub-projects are given in Annex E-1.
24

Mumbai Urban Transport Project Consolidated Environmental Assessment
7.0 ENVIRONMENT ' MANAGEMENT PLAN
Plans are prepared for mitigating and managing potential adverse environmentalimpacts identified in SLEA and project specific PLEA/MLEA studies. These EMPsare accompanied by institutional and reporting framework to ensure EMPimplementation and monitoring programs for individual projects.
7.1 Environmental Management Plan for Sectoral Level
At the sectoral level, a variety of policy, legal and administrative measures will beused ", manage and mitigate adverse environmental impacts. These are described inAnn- .2.
The formulation and implementation of several of the measures indicated in theTable depend upon a variety of parameters such as promulgation of rules andstandards particularly by GOI, techno-economic feasibility of the suggestedmeasures, public pressure, directives of Supreme Court and High Court etc. Asuggestive framework for implementation of the EMPs including institutionalresponsibility, authorities and time frame is given in Annex E-3.
7.1.1 EMP Monitoring at the Sectoral level
Sectoral level monitoring plan is prepared for monitoring of environmental qualitysuch as for monitoring ambient air quality and noise level and conditions atresettlement sites. The monitoring plan includes the responsibility and frequency ofmonitoring.
The monitoring plan has three components - monitoring the implementation ofmitigation measures, monitoring the environmental quality and monitoring trafficparameters.
Monitoring of Environmental Q!.1;ityEnvironmental quality particula with respect to air pollution and noise levels, mustbe monitored on continuous basis, as these environmental components are likely tobe affected most by the transportation strategy.
Envir'-7iental quality monitoring shall be carried out with the objective of assessingthe change in environmental quality due to the transportation strategy, so that thestrategy can be updated in response to the monitored results. Since theenvironmental quality of Greater Mumbai is also affected by factors other thantransportation activities, environmental monitoring programme for the transportationstrategy shall be integrated with the regional environmental monitoring programme.The recommended minimum environmental quality-monitoring programme with thefocus on the transportation strategy is given in Table E-8. The location of monitoringsites shall be decided by MMRDA in consultation with MCGM.
25

Mumbai Urban Transport Project Consolidated Environmental Assessment
Monitoring of Social (R&R) Components
A number of MUTP projects will result in displacement of population. Theresettlement and rehabilitation process of the displaced population will be closelymonitored by MMRDA and IMP. The methodology for such monitoring is given inparagraphs 64 to 68 of Resettlement Action Plan, September 2001, MMRDA.
Monitoring of Traffic Movement
The MUTP project is expected to bring about a substantial improvement in trafficmovement in MMR and Greater Mumbai. Various traffic parameters such asvolume, speed etc. for roads and passenger trips for railway will be monitored totrack changes in traffic movement. As a part of MUTP, a Traffic Management Unit(TMU) is being established in MCGM. The TMU will undertake periodic studies tomonitor the traffic movements and impact of proposed measures in MUTP.
Table E-8 Sectoral Level EMP MonitoringParameters to Recommended Sites Sampling duration and Responsibilitybe monitored FrequencyAmbient AirQuality:CO, HC, Nox, As per recommendation As per recommendation MCGBSPM, PM10, SO2 given in the study " given in the study l
Strengthening the Air Quality Strengthening the AirMonitoring Network Quality Monitoring NetworkOperated by MCGM" Operated by MCGM"
Noise completed in year 2000. completed in year 2000.lNoise:lTo compute Lequ, Same sites as above Same as AboveLl0, L50, and Lgl
Social (R&R)Living Conditions At resettlement site 1 year after resettlement. MMRDAof PAH's.Drinking watersupply, sanitationand otherfacilitiesTrafficMovementTraffic volume, At individual sub-project At least once in a year RTO/ MCGB-speed sites and main arterial routes TMU
26

Mumbai Urban Transport Project Consolidated Environmental Assessment
7.2 Project Level Environmental Mitigation and Management plan
7.2.1 Mitigation Measures during Design, Construction and Operation Stages
As discussed earlier, MUTP consists of several sub-projects under road and raildevelopment. The status of EA/EMP preparation for the MUTP sub-projects aredescribed in Table E-7 earlier. This consolidated EA report discusses the EMPsprepared for the following 5 sub-projects:
* Jogeshwari-Vikhroli Link Road (JVLR)
* Borivali-Virar Quadrupling of Rail Lines (BVQR)
* Road Over Bridge (ROB) at Vikhroli
* Pedestrian Subway at CST
* Station Area Improvement (SATIS) at Thane Station
The EMPs for these sub-projects were prepared in 1988 by AIC Watson ConsultantsLtd. These EMPs are currently being updated to encompass the changes in baselinedata and site conditions that may have changed since the year 1998. Thus, theEMPs presented here may undergo some modifications identified during the updatingprocess. The schedule for updating of EMPs for the above mentioned sub-projectsare given in Table E-7 earlier.
EMPs are developed for the above 5 projects for the design, construction andoperation phases of the projects. EMPs for the Jogeshwari Vikhroli Link Road(JVLR) project is given in Annex E-4. EMPs for the remaining projects are preparedin the similar format. The EMPs include references to the contract documents andresponsibilities for implementation. The EMPs are mainly prepared for the followingsignificant environmental impacts/issues:
• Ambient Air Quality Deterioration
* Increase in Noise Levels
* Adverse Impacts on Ecology (Flora/Fauna)
* Population displacement
* Land degradation
* Surface and groundwater degradation
* Occupational health and safety* Impacts on Traffic and road safety
Site-specific environmental enhancement plans will be specified in the updated EAand EMP reports.
27

Mumbai Urban Transport Project Consolidated Environmental Assessment
7.2.2 Environmental Monitoring Plan
Environmental monitoring plans are developed for the specific MUTP sub-projects,involving monitoring sites, monitoring parameters, time and frequency of monitoringand the reporting of monitored data. The objectives of the monitoring plan are:
. To record the impact of MUTP on.urban environmental quality during theconstruction and operation phases;
* To evaluate the effectiveness of the mitigation measures during the constructionand operation phases.
* To satisfy the legal and community obligations* To respond to the unanticipated environmental issues at an early stage and to
verify the accuracy of environmental impact prediction.
At the project level, the vital parameters or performance indicators that will bemonitored during construction and/or operation stages of the project include:• Ambient air quality - S02, PM10, CO, NOx- Noise levels near sensitive locations- Re-plantation success/ survival rates* Traffic volume and characteristics
Methodology used for sampling and analysis will be as per prevalent requirements ofMinistry of Environment and Forest and Indian Standard (IS) codes. Thesemonitoring plans are for the EMPs prepared in 1998 and are being updated alongwith the respective EMPs.
7.3 Institutional Set-up, Co-ordination & Strengthening
7.3.1 Institutional Set-up and Coordination
The monitoring and evaluation of the EMPs are critical activities in implementation ofthe various projects. Monitoring involves periodic checking to ascertain whetheractivities are going according to the plans. It provides necessary feedback for projectmanagement team to keep the program on schedule.
The monitoring and reporting process for mitigation measures during construction willinitiate from the contractor at the lowest rung who will report to the ProjectImplementation Agency (PIA) through the Project Management Consultant (PMC).The monitoring process and the roles and responsibilities of the various agencies forcoordinating and managing the EMP implementation is described below:
28

Mumbai Urban Transport Project Consolidated Environmental Assessment
Project Implementation Agencies (PIA) and Project ContractorsThe responsibility of implementing the various environmental mitigation measureslies with the PlAs, such as Municipal Corporation of Greater Mumbai, Public WorksDepartment, Maharashtra State Road Development Corporation.
The PIA will get the EMP implemented through the Project Management Consultant(PMC) by incorporating the EMP requirements in the contractual agreement alongwith the provision of penalties to be levied if the contractor fails to comply with theconditions. The contractor shall submit a report on compliance with theenvironmental mitigation measures (Environmental Compliance Reports, ECRs)before start of construction activities and periodically thereafter to the PIA. The PlAswill then submit the ECRs to the JPD (Env), which after review and monitoring will besubmitted to IMP through the Project Director, MUTP for confirmation of theimplementation of the environmental mitigation measures. The Project Director willaccordingly submit the report to the World Bank.
MMRDAMMRDA as an apex organisation shall initiate co-ordination process among theconcerned organisations for EMP implementation. MMRDA shall take lead in:e reviewing the progress of the projects and plans for the subsequent year -
Institution wise* reviewing and discussing the salient features of the reports in the year on
environmental aspects/statistics like emission check and violations.* organising and co-ordinating training programmes for all member organisations.
An Independent Monitoring Panel (IMP) has been constituted by MMRDA with theobjective to ensure that the Bank's policies related to social and environmentalissues are followed. The Chairman of IMP is Ex-Chief Secretary to Government ofMaharashtra. The other members are an eminent Environmental Engineer, a seniorJournalist and a leading Advocate. The IMP will meet periodically to review theperiodical reports, environmental compliance report, etc. submitted by PlAs andPMCs/Contractors.
MMRDA has proposed a co-ordination model (Refer Figure E-2) for promotingeffective implementation of EMPs at sectoral level and at project level duringconstruction and operation phases. The responsibilities of key functionaries for EMPimplementation are:
* The Project Director, MUTP has the overall responsibility of implementation ofEMPs and co-ordination of all the environmental related matters of thetransportation projects.
* The Joint Project Director (Environment) is responsible for both environmentalplanning and management. He will also be responsible for co-ordinating theenvironmental related works and ensuring preparation and implementation ofsectoral and project level EMPs for the transportation projects. In respect of
29

Mumbai Urban Transport Project Consolidated Environmental Assessment
R&R, he is particularly responsible for ensuring preparation and implementationof Community Environmental Management Plans (CEMP).
7.3.2 Reporting Requirements
It is important to identify the key parameters that have to be monitored and establisha reporting system. The rationale for a reporting system is to ensure accountabilityfor implementing the EMPs. A generic reporting system proposed to be followed isgiven in Annex E-5.
30

Mumbai Urban Transport Project Consolidated Environmental Assessment
FIGURE E-2: INSTITUTIONAL MECHANISM FOR IMPLEMENTATION OF EMP
IMP High Power Steering Committee
Project Coordination........... ...........-.. ... C om m ittee
World Bank MMRDAProject Director, MUTP
JPD (Environment), MUTP
I MRVC MSRDCPWI D MCGM BEST
PMC ~~~~PMC PMC PC
Contractor
|Contractor l| Contractr Contractor
31

Mumbai Urban Transport Project Consolidated Environmental Assessment
7.3.3 Institutional Strengthening
The implementation of an environmentally sound transport strategy involves anumber of institutions / organisations at various levels, with each organisation havinga distinct role to play. Introducing environmental dimensions in formulating andimplementing a transportation strategy would require that these institutions shoulderadditional responsibilities for ensuring that the strategy does not result in anysignificant adverse environmental impacts.
In order to examine the existing capacities and identify the additional responsibilitiesthat the concemed Organisations/ institutions shall take up to address environmentalissues, these Organisations are categorised into four groups - Apex Organisations,Project Implementation Agencies, Transport Service Organisations and RegulatoryOrganisations.
The envisaged roles and responsibilities of these organisations and additionalstrengthening requirements to meet the environmental obligations defined in this EAreport are given in Annex E-6.
7.4 Cost Estimates for Institutional Capacity Building
The budget estimates provided in this section mainly focus on the capacitystrengthening measures in terms of training. Training needs for building the capacityof the concerned organisations for environmental planning and management havebeen identified. The total cost for the training programmes is estimated to be Rs.4,80,000/-. (Refer Table 7.17 Chapter 7)
7.5 Cost Estimates for Project Specific EMP Implementation
Cost estimates have been prepared for EMPs related to the following tasks:
* Relocation of Utilities* Compensatory and Road/Track Side Plantation* Pollution control (dust, water pollution) during construction* Noise level reduction* Labour Camp sanitation* Road safety* Environmental Monitoring
A consolidated estimate for EMP implementation for all related sub-projects arepresented in Table E-9. The estimated cost of EMP implementation for MUTP sub-projects is Rs. 19.38 Million.
The above estimates are provisional and the final estimates will be available after theEMPs are updated (EMP updating is in progress). The revised cost estimates for the
32

Mumbai Urban Transport Project Consolidated Environmental Assessment
projects will be presented in detail along with the updated EMP reports. The final listof EMPs and respective cost estimates will be made a part of the bidding andcontract documents.
7.5 Contractual Agreement
In order to facilitate smooth implementation of EMPs, the PIA shall include specificobligations in respect of EMP implementation in all tender and contract documents.The bidding and contract documents shall include the following information:
1. EMP requirements and obligations2. Environmental Monitoring Requirements3. Reporting requirements4. Indicative EMP cost estimates
Table E-9 Overall Cost Estimates for MUTP Sub-Projects
Sr.No. Name of the Project EMP Cost Estimates
Roads and traffic component1 Joehwari-Vikhroli Link Road | 3973600
2 Santacruz-Chembur link road 3973600
3 ROB projects at Vikhroli, Jogeshwari 2477760(South) and Jogeshwari (North)
8 30 Pedestrian subways and bridges 3000000
9 6 Station area traffic improveient 300000schemes (SATIS)_
Rail Projects1 Borivali Virar Quadrupling of Rails 3235800
2 5th line between Santacruz and 500000Borivali
3 5th ~and 6th lines b'etween Kurla and 500000Thane
6 DC/AC conversion 20000
13 ITechnical Assistance, studies training 480000
Sub Total 1 8460760
5%M Contingencies 923038
Grand Total 19383798
33

Mumbai Urban Transport Project Consolidated Environmental Assessment
8 RESETTLEMENT AND REHABILITATION
8.1 Resettlement Action Plan
MMRDA has prepared Resettlement Action Plan6 (RAP) essentially to describe thepolicy and institutional framework for carrying out the Resettlement andRehabilitation (R&R) of the Project Affected Households (PAHs). For every sub-project site specific Resettlement Implementation Plan (RIP) and CommunityEnvironment Management Plan (CEMP) will be separately prepared.
8.2 Rehabilitation Entitlements
8.2.1 Shelter related entitlement
Every eligible household losing a dwelling place shall be allotted a dwelling unit ofminimum of 225 sq.ft. at an alternate site. Similarly every PAH losing a commercialstructure shall be eligible for an alternate place for commercial use of equivalentarea.
8.2.2 Compensation for Economic Losses
Availability of land being the major constraint in the city, it may not always bepossible to provide in the close vicinity of the existing settlement to avoid loss ofaccess to existing employment. In such cases the affected households will beeligible for the compensation for the permanent loss of employment or extra travelcost. Similarly a special package will be worked out for the vulnerable PAHs suchas households below the poverty line, the women headed households, thehandicapped and the aged.
8.2.3 Access to Training, Emplovment. and Credit
There are a number of training programs offered by government for skill upgradingfor promoting self-employment. Similarly there are government programs ofextending financial assistance to the poor for self-employment. During thepreparation of site specific RIP; the communities will be informed of such programs.In addition, local savings and loan associations will also be oromoted throughNGOs.
8.3 Resettlement Implementation Plans (RIP)
In addition to the RAP, for individual sub-projects site specific ResettlementImplementation Plans (RIPs) will be prepared. Community EnvironmentManagement Plan (CEMP) will be prepared along with the RIP. Consultants'
6 Mumbai Urban Transport Project: Resettlement Action Plan, September 2001, MMRDA
34

Mumbai Urban Transport Project Consolidated Environmental Assessment
reports on RIP and CEMP for four sub-projects are already available. MMRDA has
undertaken preparation of final RIPs and CEMPs for these four sub-projects.
Community Environment Manaaement Plan.The objective of preparing CEMP is to provide access to basic urban environmentalinfrastructure services; and through community initiative and participation alleviatethe environmental health risks of the community. The affected communities arelargely of squatters accustomed to a particular way of life. At the resettlement site,they will have to almost invariably adjust to the lifestyle of multi-storied buildings.
The communities will be trained and motivated to follow a discipline that can avoidenvironmental problems. Separate Environmental Management Committees(EMCs) will be formed during RIP/-=MP preparation to take up this responsibilityduring post-resettlement stage. The CEMP provides in simple non-technical locallanguage preventive maintenance schedule for water supply, sanitation, solidwaste etc. The maintenance measures are translated into a simple non-technicalformat in the form of "Do's" and "Don'ts" in local languages for the use of thecommunity at large.
Majority (19000 out of 19228 PAH) are squatters. They do not have secured landtenure, have only shared community facilities like water stand post and commontoilets. Some of the squatter settlements have inadequate water supply, inadequatenumber of well maintained toilets, poor solid waste collections. Some settlementslocated close to the storm water drains have poor drainage and flooded inmonsoon. Settlements located close to railway lines apart from these problemssuffer from noise and risk to life of children who may inadequately move over thetracks. Thus the present quality of life is extremely unsatisfactory in terms of
availability of basic services and environmental hygiene.
8.4 Project Affected HouseholdsThe households likely to be affected by each of the sub-projects are given in theTable E- 10 below:
35

Mumbai Urban Transport Project Consolidated Environmental Assessment
Table E-10 Details of Project Affected Households*
Sr. Sub-project Total PAHsNo
Roads and Traffic Component 46491 ROB at Jogeshwari -South 9012 ROB at Jogeshwari - North 5143 ROB at Vikroli 1734 Jogeshwari-Vikroli Link Road 8905 Santacruz-Chembur Link Road 21716 Station Area Traffic Improvement Schemes 100*7 Pedestrian Subways & Bridges Nil
Rail Component 144791 5th Line between Santacruz and Borivali 5152 5th and 6th Lines between Kurla and Thane 21313 Borivali-Bhayendar -Virar additional pair of lines 5014 Optimization on Western Railway 6225 Optimization on Central Railway 28796 Optimization on Harbour Line 7831
Total PAH 19228Total Project Affected Persons 77660
* Subject to findings of the surveys in progress
8.5 R&R Implementation Schedule
The scale of resettlement involved is unprecedented. However due to concertedefforts of GOM, MMRDA and the concerned NGOs it has been possible to resettle10118 PAHs out of a total of 19228 PAHs by June 2001 (6261 in transitaccommodation and 3857 in permanent dwelling units). In addition, about 80 affectedshopkeepers were allotted alternative shops within the resettlement buildings toenable them to re-start their business activities. Resettlement of over 10000 PAH inone year is unprecedented in Mumbai. The PAHs located in the safety zone ofrailways were seen as a risk to safe operations of suburban services. The entireprocess of resettlement will be completed by April 2004.
8.6 Costs And Budget
The total cost of resettlement is estimated to be around Rs. 4607 million (US $ 98million).
36

Mumbai Urban Transport Project Consolidated Environmental Assessment
9.0 PUBLIC INFORMATION AND CONSULTATION
9.1 Consultations During CTS (1994)
Public consultation has been an important input into the process of planning anddesigning of MUTP so far. The consultation process began by ca ying out a surveyof Public Attitude during the formulation of Comprehensive Transport Strategy(CTS).' As a part of this survey, respondents were asked to select a package ofschemes from amongst a long list of road and rail projects within a budget of Rs.1 000 crores.
The outcome of this consultation was an important input to prepar- ;ion of draft CTS.Proposals of CTS were also presented to various PlAs, Government agencies andNGOs. They generally endorsed the strategy of PT+DM recommended by the CTS.These considerations have also reflected in the MUTP now proposed forimplementation.
9.2 Consultation During Environmental Assessment (1997)
The findings of the Environmental Assessment carried out by the consultants werepresented in a Workshop held on 2nd June 1997.8 The participants included the
representatives of the government departments, local authorities, projectimplementation agencies and the consultants in the transport and environment field.The clarifications and suggestions were then incorporated in the final reports.
9.3 Consultation During R&R
During the formulation of RIP and CEMP more intensive consultation '.kes place to
decide the location of resettlement, design of building, community facilities requiredand the procedure to be followed for maintaining the multi-storied settlement. Thedetails of consultation process are given in the "Mumbai Urban Transport Project:Resettlement Action Plan, September 2001, MMRDA"
9.4 Consultation on Updated EA
With the passage of time and substantial developmenis like construction of flyoversthat had occurred, the EA was updated.9 A consultation workshop involvingacademia, environmental experts, consultants, NGOs and representatives of PlAsand the World Bank was organized on November 20, 2000 for presentation ofupdated EA.
7 CTS Technical Memorandum No. 5 - Analysis of Public Attitude Survey, WS Atkins Intemational8 Environmental Assessment of MUTP-11, Proceedings of Public Consultation Workshop held on
June 2, 1997. AIC Watson Consultants Ltd.MUTP Environmental Assessment Montgomery Watson Consultants Ltd.
37

Mumbai Urban Transport Project Consolidated Environmental Assessment
Public consultation with people affected by construction of sub-proiects was carriedout on December 13, 2000A public consultation workshop was organised predominantly for the projectaffected persons on the 13th December 2000. The response from the participantshighlighted the importance of maintaining local environment - solid wastemanagement, storm water drainage, sewerage and water supply. Respondentsparticularly women, based on their personal experiences emphasised theimportance of community efforts in keeping the buildings and the surroundingsclean by timely removal of garbage.
Based on the above response, it is proposed to pay particular attention to solidwaste disposal in preparing CEMPs as a part of preparing project specificResettlement Implementation Plan (RIP).
Public consultation workshop with general public was carried out on December 14,2000A public consultation workshop organised for a cross section of the Society on the
14th Dec' 2000 was not attended by the general public/NGOs except a few Pressrepresentatives. This perhaps is a reflection of the fact that the concemedstakeholders are aware of the project its environmental components. Some of theNGOs have expressed their concem about the delay in commencement of theproject and not about the environmental impacts.
9.5 Public Information CentresMMRDA has established two Public Information Centres, one at the MMRDA officeand the other at Mankhurd at project site. Documents and information related toMUTP Project summaries, EA reports, R&R Policy and Resettlement Action PlanRIP and CEMPs, etc. are made available at these PICs. Written comments orsuggestions will also be received at the PICs.
9.6 Proposed Consultation
MMRDA has now consolidated and updated the EA work carried out and ispresented in this report. MMRDA therefore now proposes to carry out a freshround of public consultation program based on this report, which is scheduled inOctober, 2001. This will involve two public consultation workshops; viz. one on acity wide basis aimed at a representative cross section of concerned citizensincluding NGOs, academicians, environmental experts, representatives of PlAs,Industries, Taxi/Truck owner's Associations, etc.; the other aimed at the projectaffected persons.
9.7 Public Opinions, Concerns and Responses
The findings of the proposed round of public consultations will be recorded andincorporated in the final EA report.
38

Mumbai Urban Transport Project Consolidated Environmental Assessment
The PICs will also receive grievances from public, in respect of implementation ofmitigating measures from the concerned citizens. These will be referred to theconcerned PIA and reports will be obtained on the corrective actions taken. Thesewill also be kept at the PICs.
39

Mumbai Urban Transport Project Consolidated Environmental Assessment
ANNEX E-1: SUMMARY OF ADVERSE ENVIRONMENTAL IMPACTS OF MUTP SUB-PROJECTS
Summary of Impacts for Jogeshwari-Vikhroli Link Road Project (JVLR)
Environmental Construction Operation Stage ImpactsComponent Stage ImpactsAir Quality Temporary increase in ambient SPM and NOx levels * No significant change in CO levels over the baseline.
due to earthwork, handling construction material Predicted levels for 2011 well below the CO NAAQS.and use of fire wood for cooking by on-site laborers.
* NOx levels were predicted to be within NAAQS for 2011,except at some locations.
* Both the baseline and predicted (for the year 2011) PM10levels exceed the standards at most locations.
Noise Levels Nuisance to nearby residents due to noise from Day and night time predicted noise levels for the year 2011 rangeconstruction activities such as operation of between 70.8 - 80.9 dB(A) and 58.6 - 73 dB(A) respectively. Thecompressors, construction vehicles, concrete plants day and night time noise standard will exceed upto 200 m from theetc. road.
Water Quality and Temporary contamination of Mithi river due to Mithi river contamination possible only due to accidental spillage ofHydrology surface runoff from widening of bridges over the hazardous material from road tankers. No significant operation
river. Runoff could consist of contaminants such as stage impact.soil, sanitary wastes and oil.
Ecological Issues * Cuttinglshifting of trees within 20 m of the road No significant adverse impact.in the western section of JVLR.
* None of the floral species are rare orendangered.
Social In all 890 residential and commercial structures will Nil(Rehabilitation and be affected by the project. These will need to beResettlement) relocated or compensated.Land Degradation High potential for soil erosion, change in Nil
topography, especially at the quarry sites.
40

Mumbai Urban Transport Project Consolidated Environmental Assessment
ANNEX E-1 Cont.Summary of Impacts for Borivali - Virar Quadrupling of Rail Lines (BVQR) Project
Environmental Construction Operation Stage ImpactsComponent Stage ImpactsAir Quality Temporary increase in ambient SPM and NOx levels No adverse impact as electric trains will be operated.
due to earthwork, handling construction materialand use of fire wood for cooking by on-site laborers.
Noise Levels Nuisance to nearby residents due to noise from Baseline noise levels already exceed noise standards. For the yearconstruction activities such as operation of 2011 the maximum increase in noise levels due to railway over thecompressors, construction vehicles, concrete plants baseline noise at sensitive receptors is only 1.7 dB(A). Theetc. sensitive receptors are 2 hospitals and 2 educational institutes. Thus
the impact is insignificant.Water Quality and 15 major and minor bridges at various creek No adverse impact expected.Hydrology locations are planned. No obstruction of existing
water courses is expected. Temporarycontamination of creek water due to runoff fromconstruction site, consisting of contaminants suchas soil, sanitary wastes and oily wastes
Ecological Issues * Trees within 20 m from the outermost track will No significant adverse impact.be lost.
* In addition mangrove vegetation will be lost nearJaffery creek, and Bassein creek. About 8500numbers of Avicennia marina will be lost.
Social In all 250 residential and commercial structures will Nil(Rehabilitation and be affected by the project. These will need to beResettlement) relocated or compensated.Land Degradation High potential for soil erosion, change in topography Nil
especially at the quarry sites from where sand andstone will be sourced.
41

Mumbai Urban Transport Project Consolidated Environmental Assessment
ANNEX E-1 Cont.Summary of Impacts for ROB AT VIKHROLI
Environmental Construction Operation Stage ImpactsComponent Stage ImpactsAir Quality Temporary increase in ambient SPM and NOx /CO * Predicted CO and NOx levels within NAAQS except for
levels due to earthwork, handling construction locations 10 m from the ROB. Baseline CO and NOx levelsmaterial and use of fire wood for cooking by on- well within the standards.site labourers.
0 Both the baseline and predicted (for the year 2011) PM1Olevels exceed the standards.
Noise Levels Nuisance to nearby residents and sensitive Day and night time predicted noise levels for the year 2011 rangedreceptors (2 schools and a church) due to noise between 61.4 - 67.5 dB(A) and 57.3 - 63.4 dB(A) respectively.from construction activities such as operation of Overall noise levels are expected to increase from that of the basecompressors, construction vehicles, concrete year.plants etc.
Ecological Issues * Clearance of minor road side vegetation - No significant adverse impact.About 10 grown trees will be cut.
* none of the floral species are of rare orendangered
Social Dislocation of about 185 (G+1) structures with Nil(Rehabilitation and small business units in the ground floor andResettlement) residential areas in upper floor. These will need to
be relocated or compensated.Land degradation Temporary contamination of soil due to wastes Nil
from construction activities such as debris/oilywastes and sanitary wastes from labour camps, ifany. .v.
42

Mumbai Urban Transport Project Consolidated Environmental Assessment
ANNEX E-1 Cont.Summary of Impacts for PEDESTRIAN SUBWAY AT CST.
Environmental Construction Operation Stage ImpactsComponent Stage ImpactsAir Quality Temporary increase in ambient SPM levels due to * Ambient Air quality in the area is expected to improve, due to
earthwork, handling construction material. significant easing of traffic congestion.
* Both the baseline and predicted (for the year 2011) PM10 levelsexceed the standards.
Noise Levels Nuisance to nearby residents due to noise from Average day and night time predicted noise levels for the year
construction activities such as operation of 2011 are 84.51 dB(A) and 78.49 dB(A) respectively. Noise levels
compressors, drilling work etc. are not expected to change significantly from baseline values.
Land degradation Temporary contamination of soil due to wastes from Nilconstruction activities such as debris/oily wastes andsanitary wastes from labour camps.
Traffic and Disruption of existing traffic and pedestrian Substantial benefits from improved vehicle speeds, reduction in
Transport inconvenience at CST junction. traffic congestion, faster pedestrian movement.
43

Mumbai Urban Transport Project Consolidated Environmental Assessment
ANNEX E-1 Cont.Summary of Impacts for Station Area Improvement Scheme (SATIS) at Thane West
Environmental Construction Operation Stage ImpactsComponent Stage ImpactsAir Quality Insignificant - Minimal construction activity. Baseline CO, PM10 and HC levels exceed NAAQ standards.
No major beneficial impact on AAQ. Existing AAQ mayfurther worsen due to increase in vehicular traffic.
Noise Levels Marginal increase in noise levels due to noise from Average day and night time predicted noise levels for theconstruction activities. year 2001 are 78.5 dB(A) and 72.5 dB(A) respectively.
Noise levels are not expected to change significantly frombaseline values.
Traffic and Disruption of existing traffic and pedestrian inconvenience at Improved vehicle speeds, reduction in traffic congestion,Transport CST junction. faster pedestrian movement.
44

Mumbai Urban Transport Project Consolidated Environmental Assessment
ANNEX E-2: SECTORAL LEVEL EMPs
Environmental Regulatory Measures Policy Measures Administrative MeasuresImpactAmbient Air Quality * Stringent emission Review and Implementation of recommendations * Strict enforcement of airDeterioration standards for vehicles at made by committee for reducing vehicular pollution emission
manufacturing and in Mumbai, constituted under the Mumbai Highoperational level, Court Order dated December 15, 1999. Some of the * Enhancing of the current
* Use of cleaner major recommendations are: monitoring network of MCGMtechnologies, such as, * Reducing sulfur content of diesel initially to mir netorkaof gMcatalytic converters for 0.05% and finally to 0.005% by 15' April 2005. as per recommendaton givenpetrol driven vehicles, * Reduction in Benzene content of petrol from the in the study " Strengthening thefour stroke engines for present level of 3% to less than 1%. ar Quality Monitoring Networktwo and three wheelers, * Refineries are recommended to implement the i erated by MCGM" completed
* Measures to prevent fuel 'Marker' system for detecting adulteration in in year 2000.adulteration, fuels and lubricants.
* Legal support for policy * All the retail outlets in MMR should sell only pre- * To develop PM10 abatementand administratis,- level mixed petrol through dispensers to two and strategy. (Study commenced bymitigation, three wheelers with effect from 1st October MMRDA in Sept. 2001)
* Permitting use of 2000alternate fuels such as * All petrol taxis above the age of 15 years and * VeI1 le Inspection anoaCNG and LPG as diesel taxis above the age of 8 years be Monitoring Program:automobile fuel. (Already converted to CNG or any other clean fuel and all Promote vehicle inspection anddone as per Liquefied diesel taxis above the age of 8 years should be maintenance centres.Petroleum Gas converted to clean fuel3 wheelers above the Commercial vehicles to obtain a(Regulation of Use in age of 10 years to be scrapped or converted on Certificate of Fitness fromMotor Vehicles) Order, CNG or any other clean fuel. All transport appr ' Inspection and2001. vehicles, except 3 wheelers and BEST buses Main ce Centres.
over the age of 15 years to be scrapped unlessconverted to clean fuel. All BEST buses olderthan 20 years to be scrapped or converted toCNG.
* All petrol driven vehicles registered in Mumbaiprior to 1st April 1995 are recommended to befitted with catalytic converters. . (Court is yet todecide)
45

Mumbai Urban Transport Project Consolidated Environmental Assessment
Annex E-2 CONT.Environmental Regulatory Measures Policy Measures Administrative MeasuresImpactNoise Explicit policy for noise reduction from vehicle Monitoring of noise levels at
engines, exhaust, tyre and road surface. sensitive receptors. Identifyingsources of
Reducing traffic noise impact by placing noisebarriers to the extent feasible.
Social Impact Government of Maharashtra Project affected households to be rehabilitated as * PMU - MMRDA is responsibleadopted a policy of R & R in per the Rehabilitation Action Plan (RAP) and for entire R& R. An1997. All reseKtlement to be project specific RIP, CEMP. More details in Chapter independent Monitoring Panelundertaken according to the 8. has been appointed to monitorpolicy. the same.
Ecological Impacts Strict enforcement of The Indian Forest Act and Coastal Regulation Zone * MMR - Regional Plan providesDevelopment regulations to (CRZ) notification of 19/2/91 provide necessary land use zoning andcontain growth in ecologically policy framework to minimise ecological impacts. development control regulationsfragile areas. consistent with these
regulations. GoM has preparedCoastal Zone ManagementPlan (CZMP), which has beenapproved by MoEF.
Traffic Management Implementing recommendations of the committee * Enforcement of road safetyand Road Safety appointed by Mumbai High Court (See above). The rules.
major traffic management policy recommendations * Development of emergencyinclude: plans to deal with road/ rail
accidents involving* Strengthening traffic and transportation hazardous substances.
planning, traffic operation, traffic signals andsigns, and area traffic control.
* Modal integration outside railway station and atferry landings, control of on-street and off-streetparking, management of traffic demand, powerto collect certain parking fees andsupplementary charges on road traffic.
J6

Mumbai UJrban Transport Project Consolidated Environmental Assessment
ANNEX E-3: Sectoral EMP Implementation Framework
Parameter Mitigation Measi,rps Responsibility Time Frame Supervision
AIR POLLUTIONRegulatory Stringent emission standards, Use of Clean Fuel Govt. of India Already in progress. Not Applicable.Measures etc.
Policy Several policy measures have been suggested for GOI / GOM Policies are in various stages of Various agencies asMeasures: use of clean fuel, scrapping of obsolete vehicles being drawn up. e i2 Mumbai High and when policies are
etc. SeverA! of such measures are pending Court decision of October 2001 implemented.clearance from Mumbai High Court. requires vehicles more than 15
years to be scrapped or convert toCNG.
Administrative Strict enforcement of vehicular air emission RTO Already in progress GOMMeasures standards.
Enhancing of the current air quality monitoring MCGM To commence along with MUTP MMRDAnetwork of MCGM as per recommendation given project implementation.in the study' Strengthening the Air QualityMonitoring Network Operated by MCGM"completed in year 2000.
To develop PM10 abatement strategy. Various agencies Study commenced by MMRDA in MMRDAidentified in the Sept. 2001.on-going study.
Vehicle Inspection and Monitoring Program. RTO Plans to be drawn up and MMRDAimplemented during MUTP.
47

Mumbai Urban Transport Project Consolidated Environmental Assessment
Annex E-3 Cont.Parameter Mitigation Measures Responsibility | Suggested Time Frame Supervision
NOISE l l IPolicy Measures Explicit policy for noise reduction from vehicle RTO Fixing of time frame is not MMRDA
engines, exhaust, tyre and road surface. possible at this point.
Reducing traffic noise impact by placing noise RTO MMRDAbarriers to the extent feasible.
Administrative Monitoring of noise levels at sensitive receptors. MCGB & RTO Within 1 year MMRDAMeasures Identifying sources of noise.SOCIAL IMPACT
Policy Measures PIA - MMRDA is responsible for entire R& R. An GOM Already doneindependent Monitoring Panel has been appointedto monitor the same
Administrative Project affected households to be rehabilitated as PIA To be done before MMRDAMeasures per the Rehabilitation Action Plan (RAP) and construction
project specific RIP, CEMP. More details inResettlement Action Plan, September 2001.
ECOLOGICAL IMPACTSAdministrative Strict enforcement of Development regulations to UD Already being done MMRDAMeasures contain growth in ecologically fragile areas.
TRAFFIC MANAGEMENT AND ROAD SAFETYPolicy Strengthening traffic and transportation RTO, MCGM - In Progress - To be MMRDA
planning, traffic operation, traffic signals TMU strengthened in MUTP.and signs, and area traffic control.
Administrative Modal integration outside railway station, control RTO, MCGM- To be established during MMRDAof on-street and off-street parking, management of TMU MUTP.traffic demand, power to collect certain parkingfees and supplementary charges on road traffic.
48

Mumbai Urban Transport Project Consolidated Environmental Assessment
ANNEX E-4 ronment.. .agement Plan for Jogeshwari-Vikhroli Link Road Project (JVLR)
PRE-CONSTRUCTION / DESIGN STAGE
Environmental Mitigation Measures Reference to Time Respon bilityImpact Contract Frame Implementation Supervision
DocumentsEcological Trees to be removed before commencement Legal Before Start Contractor/ PMC PIAimpacts such as of construction, with prior permission from requirement. oftree cutting and MCGM. constructiondestruction ofmangroves Road alignment shall be selected in such a
way that there is minimum destruction oftrees.
Resettlement The acquisition of land and property shall be RAP Requirement Before Start MMRDA MMRDAand rehabilitation carried out in accordance to the RAP and of
entitlement framework of the project. It shall constructionbe ensured that all R&R activities be of relevantreasonably completed as per RAP, before section.the construction activity starts in the relevantsection.
Utility relocation All utilities, such as electrical installations, Project Before Start PIA MMRDAtelephone lines etc. to be shifted after prior requirement ofapproval of agencies. construction
Noise pollution Based on noise monitoring results, noise Project Before Start PIA MMRDAcontrol plans to be prepared. The plans shall requirement ofinclude the installation of noise barriers constructionincluding additional road side plantationwhere practical.
49

Mumbai Urban Transport Project Consolidated Enviironmental Assessment
ANNEX E-4 CONT.CONSTRUCTION STAGE EMP (JVLR PROJECT)Environmental Mitigation Measures Reference to Time Frame ResponsibilityImpactllssue Contract Implementation Supervision
DocumentsGeneration of All vehicles delivering material to the site shall be MOST: 111.9 During Contractor/ PMC PIA, MMRDADust due to covered to avoid material spillage. While unloading constructionconstruction material, fall height shall be kept low to minimizeactivity fugitive dust generation.
Contractor shall take precaution to reduce dust MOST 111.5emissions from the hot mix plants. Emissions shouldmeet emission control legislation.Construction site to be watered periodically tominimize fugitive dust generation.All existing highways and roads used by the vehicles MOST: 111.9of contractor and his team shall be kept clean andclear of all dust, mud and other extraneous materialdropped by such vehicles.All Earthwork and construction material should be Contractprotected in such a manner so as to minimize Documentsgeneration of dust.
Construction Exhaust emissions from all construction vehicles shall Contract During Contractor/ PMC PIA, MMRDAVehicle/equipm- adhere to vehicle emission norms. requirement constructionent exhaustNoise from All vehicle and construction equipment shall be fitted MOST 111.1 Duringvehicles, plants with exhaust silencers. Damaged silencers to be constructionand equipment promptly replaced by contractor.
All construction equipment (particularly DG sets, shall MOST:111.13adhere to noise standards of Ministry of Environmentand Forests.
Contractor shall ensure that noise levels near MOST: 111.13residential areas are within the day time and night timenoise standards under the Environmental (Protection)Rules, 1986 and its amendments.Operation of noise generating equipment such as pile Contractdriving, concrete and drilling etc. shall be limited to day requirementtime hours.
50_ _ _~~~~~~~E

Mumbai Urban Transport Project Consolidated Environmental Assessment
ANNEX E-4 CONT.CONSTRUCTION STAGE EMP (JVLR PROJECT)
Environmental Mitigation Measures Reference to Time Frame ResponsibilityImpactl/ssue Contract Implementation Supervision
Documents INoise from Workers exposed to loud noise (As per Factory Act MOST: 111.6 During Contractor / PMC PIA, MMRDAvehicles, plants requirements) shall wear earplugs/earmuffs constructionand equipmentContamination of Silt fencing shall be provided as the base of the MOST: 306 During Contractor /PMC PIA, MMRDAMithi River and embankment for the entire perimeter of any water body constructionother water (including wells)bodies. Construction material containing fine particles shall be MOST: 306
stored in an enclosure such that sediment laden waterdoes not drain into nearby water courses.Siltation of soil into water bodies shall be prevented as MOST: 305.2.2.2far as possible by adapting soil erosion control MOST: 306.2measures as per MoST guidelinesConstruction work close to streams or water bodies MOST 111.13shall be avoided during monsoon.In sections along water courses and close to crossdrainage channels, earth, stone or any otherconstruction material shall be properly disposed so asnot to block the flow of water.
Ecological All works shall be carried out in such a fashion that Contract During Contractor/ PMC PIA, MMRDAimpacts such as damage to flora is minimum requirement constructiontree cutting and Trees and other flora shall be cut only after receivingdestruction of clearances from appropriate agsIcymangroves Road side plantation shall be done as- per pre-
approved plan.Soil erosion On road embankments, slopes shall be stabilized. The MOST : 306.2 / During Contractor I PMC PIA, MMRDA
work shall consist of measures as per design, or as Design document constructiondirected by the engineer to control soil erosion,sedimentation and water pollution, through use ofberms, dikes, sediment basin, mulches, grasses, slopedrains and other devices. ___
51

Mumbai Urban Transport Project Consolidated Environmental Assessment
ANNEX E-4 CONT.CONSTRUCTION STAGE EMP (JVLR PROJECT)
Environmental Mitigation Measures Reference to Time Frame ResponsibilityImpact/issue Contract Implementation Supervision
Documents _
Debris disposal Debris generated due to dismantling of existing MOST: 112.6 During Contractor/ PMC PIA, MMRDApavement/structures shall be suitably reused in MOST :112.2 constructionproposed construction. Unutilisable debris shall besuitably disposed either as fill material or at pre-designated dump locations, approved by engineer.Care should be taken that the material does not blocknatural drainage or contaminate water bodies.Bentonite slurry or similar debris generated from piledriving or other construction activities shall be disposedsuch that it does not flow into surface water bodies orform mud puddles in the area.
Loss of top soil The top soil from all areas of cutting and all areas to be MOST: 300 During Contractor/ PMC PIA, MMRDApermanently covered shall be stripped to a specified constructiondepth of 150 mm and stored in stock piles.
The top soil from the stock pile shall be used to coverdisturbed areas and cut slopes and also for re-development of borrow areas, landscaping and roadside plantation.
Soil Oil and fuel spills from construction equipment shall be Contract Document During Contractor / PMC PIA, MMRDAcontamination by minimized by good O&M practices. Soils contaminated constructionconstruction by such spills shall be disposed as per MOEFwastes, fuel etc. requirements.Land Sand and stones shall be sourced from only pre- MOST 111.3 During Contractor/ PMC PIA, MMRDAdegradation in approved and licensed quarries. It should be assured constructionquarry that these quarries have a quarry rehabilitation plan.
.52

Mumbai Urban Transport Project Consolidated Environmental Assessment
ANNEX E-4 CONT.CONSTRUCTION STAGE EMP (JVLR PROJECT)
Environmental Mitigation Measures Reference to Time Frame ResonsibilityImpactl/ssue Contract Implementation Supervision
Documents IHealth and Construction labour camps shall be located at least Contract Document During Contractor I PMC PIA, MMRDAhygiene at 200 m away from the nearest habitation to avoid constructionconstruction conflicts and stress over infrastructure facilities.labour camps The contractor will provide, erect and maintain
necessary (temporary) living accommodation andancillary facilities such as toilet blocks, potable watersupply etc. for labour as per the standards set by theBuilding and other construction Workers (Regulation ofEmployment and Conditions of Service) Act, 1996 andshall be approved by the engineer.On completion of the works, all such temporarystructures shall be cleared away along with all wastes.All excreta and other disposal pits should be filled inand effectively sealed. The site should be left cleanand tidy to the satisfaction of the engineer.
Traffic delays Detailed traffic control plan shall be prepared 5 days MOST: 112.1 Before PIA MMRDAand congestion prior to commencement of works on any section of the Construction
road. The control plans shall contain details oftemporary diversions, details of arrangement ofconstruction under traffic.Special consideration shall be given in preparation of MOST: 112.2 PIA MMRDAtraffic control plan to the safety of pedestrians andworkers at night.Temporary traffic detours shall be kept free of dust by MOST: 112.5 Contractor PMC PIAfrequent application of water, if necessary. _
Traffic Control The contractor shall take all necessary measures for MOST: 112.4 Before Contractor/ PMC PIAand Safety the safety of traffic during construction and provide, MOST: 112.1 Construction
erect and maintain such barricades, including signs,markings, flags, lights and flagmen as may be requiredby the engineer for the information and protection oftraffic. All such measures should be as perrequirement of MOST.
53

Mumbai Urban Transpott Project Consolidated Environmental Assessment
ANNEX E-4 CONT.CONSTRUCTION STAGE EMP (JVLR PROJECT)
Environmental Mitigation Measures Reference to Time Frame ResponsibilityImpactlssue Contract Implementation Supervision
DocumentsOccupational The contractor is required to comply with all the Contract During Contractor / PMC PIA, MMRDAHealth and precautions as required for the safety of workmen as Requirement ConstructionSafety per the International Labour Organisation (ILO)
Convention No. 62, as far as those are applicable tothe contract.The contractor shall supply all necessary safetyappliances such as safety goggles, helmets, safetybelts, ear plugs, masks etc. to the worker and staff. Alllaws related to safe scaffolding, ladders, workingplatform, gangway, stairwells, excavations, safety entryand exit etc. shall be complied with.Adequate precautions shall be taken to prevent danger MOST: 106 During Contractor PMC PIA, MMRDAfrom electrical equipment. All machines/equipment Constructionused shall confirm to the relevant Indian Standards (IS)codes and shall be regularly inspected by the engineer.A readily available first aid unit including an adequate Contract During Contractor I PMC PIA, MMRDAsupply of sterilized dressing material and appliances Requirement Constructionshall be provided as per the requirements under theFactory Act.All anti-malarial measures as prescribed by the Contract During Contractor/ PMC PIA, MMRDAengineer shall be complied with, including filling up of Requirement Constructionburrow pits.
54

Mumbai Urban Transport Project Consolidated Environmental Assessment
ANNEX E-4 CONT.OPERATION STAGE EMP (JVLR PROJECT)
Environmental Mitigation Measures Reference to Time Frame ResponsibiliImpacllssue Contract Implementation Supervision
DocumentsAtmospheric Ambient air concentrations of various pollutants shall be Project Starting immediately Pollution monitoring MMRDA, Worldpollution monitored as per the pollution monitoring plan. requirement after completion of agency (MCGM) Bank
Vehicle exhaust standards shall be enforced strictly. constructionRoad side plantation to be maintained
Noise pollution Monitoring of noise levels at sensitive receptors as per Project Starting immediately Pollution monitoring MMRDA, Worldmonitoring plan. requirement after completion of agency. (MCGM) BankPublic awareness campaigns for noise reduction constructionincluding placing adequate 'No Honking" sign boards at RTO, PIAsensitive locations.
Land and water Contingency plans to be in place for spill clean-up Project Starting immediately RTO, PIA MMRDAcontamination Spill prevention and waste fuel/oil treatment and disposal requirement after completion offrom accidental to be made mandatory for utilities such as auto-service constructionspills station, petrol pumps along the entire stretch of the
construction.Storm water and All drains to be maintained and cleaned periodically. Project Starting immediately Municipal authority, MMRDAdrain requirement after completion of PIAmaintenance constructionTraffic and Traffic management plans shall be prepared. Project Through operation PIA, Development MMRDAsafety Road control width to be enforced. Unauthorised requirement stage Authorities
building development to be checked. Slumencroachments to be discouraged.Traffic control measures including speed limits to beenforced strictly.Traffic volume and speed to be monitored to recordbenefits achieved from the project.
55

Mumbai Urban Transport Project Consolidated Environmental Assessment
ANNEX E-5 MONITORING AND REPORTING PROCESSConstruction Reporting Reporting Contractor PMC PIA reporting MMRDA World BankStage Parameter Format Reporting Reporting Frequency to reporting desired
Number Frequency Frequency to MMRDA Frequency to supervisionto PMC PIA World Bank
Trees to be Monthly Monthly Quarterly QuarterlyremovedPAH R&R Monthly Monthly Half-yearly
£L 2 Relocation of utility Monthly Monthly Quarterly Quarterlyc and communityo resources
Fugitive dust Daily Monthly Monthly Quarterly Half-yearlymitigationCondition of Daily Monthly Monthly Quarterly Half-yearlyconstructionequipment w.r.tnoise andemissionsIdentification of soil One time One time One time
.° erosion locationsand measurestaken
c Road -side and Monthly Monthly Quarterly Quarterly Half-yearly0C.) compensatory
plantation schedulePlantation survival Monthly Monthly Quarterly Quarterly Half-yearlyrate reportingPollution Monthly Monthly Monthly Quarterly Half-yearlymonitoringDebris disposal Weekly Monthly Quarterly Quarterly Half-yearlyplan/locations.
56

Mumbai Urban Transport Project Consolidated Environmental Assessment
ANNEX E-5 Cont.Construction Reporting Reporting Contractor PMC PIA MMRDA World Bank desiredStage Parameter Format Reporting Reporting reporting reporting supervision
Number Frequency Frequency to Frequency Frequency toto PIA PIA to MMRDA World Bank
Top soil Monthly Quarterly Quarterly Quarterly _ManagementQuarry Monthly Monthly Quarterly Quarterly Half yearlyIdentification andmanagementOccupational safety Weekly Monthly Monthly Monthly Half yearly0 and healthLabour camp set-up Weekly Monthly Monthly Monthly Half yearlyand hygiene.Road safety Weekly Monthly Monthly Monthly Half yearly0
tU measuresSite enhancement Monthly Quarterly Quarterly Quarterly Half yearlyimplementationplan at waterbodies, roadjunctions etc.Pollution . Quarterly Quarterly Half-yearlymonitoring
0 schedule andei reportsEL0.
57

Mumbai Urban Transport Project Consolidated Environmental Assessment
ANNEX E-6 ROLESIRESPONSIBILITIES AND STRENGTHENING OF INSTITUTIONS
ORGANISATION ROLES & RESPONSIBILITIES STRENGTHING REQUIRED
(MUMBAI METROPOLITAN Review of implementation of Environmental Mitigation Enhance the capabilities of the existingREGION DEVELOPMENT Measures (EMPs) for MUTP projects. 'Environmental Cell' of MMRDA by out sourcingAUTHORITY (MMRDA) Ensure adequate Resettlement and Rehabilitation of PAH whenever required.
Facilitate implementation of policy directives/ emission laws Training needed on:etc. for pollution prevention/mitigation by interacting with * Environmental assessment, socialvarious the government departments like Environment impacts.Department, Urban Development Department, RTO etc. F Appreciation of Environmental impacts
Review the environmental management capabilities of and EMPs identified for related MUTPimplementing agencies, particularly municipal authorities projects. Procedure and responsibilities forand to assist them in developing their capabilities. EMP implementation, monitoring and
Obtain and analyse environmental information generated reporting etc.by organizations like MCGM, MPCB, RTO etc. and factorthem into short term and long term planning process foroverall sustainable development of MMR.
Municipal Corporation of Greater Monitoring of ambient air quality and noise at existing MCGM is operating air quality monitoring networkMumbal (MCGB) locations. Extending monitoring network to MUTP project for last several years and already have trained
locations for post-project monitoring. personnel. Training in relation to QualityAssurance, data analysis and dissemination and
Regular report to MMRDA to enable environmental other issues as suggested in the report "Study forplanning at a regional level. Strengthening Air Quality Monitoring network of
MCGM, Nov. 2000)However the existing staff and monitoringequipment need to be upgraded for theadditional monitoring load due to MUTP project.
58

Mumbai Urban Transport Project Consolidated Environmental Assessment
Annex E-6 Cont..ORGANISATION ROLES & RESPONSIBILITIES STRENGTHING REQUIRED
Public Works Department (PWD), Ensuring implementation of EMPs for related MUTP Environmental appraisal capabilities of existing
Maharashtra State Road projects through PMC/contractors staff to be enhanced through training programs.Short term module type training programs
Development Corporation Carrying out Environmental Assessments of all needed for:
(MSRDC) relatedon-going and future Transport Projects. * Environmental assessment, social impacts.* Appreciation of Environmental impacts and
EMPs identified for related MUTP projects.Procedure and responsibilities for EMPimplementation, monitoring and reporting
etc.
RAILWAYS/MUMBAI RAIL VIKAS Ensuring implementation of EMPs for related MUTP Environmental appraisal capabilities of existingCORPORATION (MRVC) projects through PMClcontractors staff to be enhanced through training programs.
Short term module type training programsCarrying out Environmental Assessments of all related on- needed for:going and future Transport Projects. P Environmental assessment, social impacts.
* Appreciation of Environmental impacts andEMPs identified for related MUTP projects.Procedure and responsibilities for EMPimplementation, monitoring and reporting
________________________________ ~~~~~~~~~~~~~~~~etc.Transportation Service Ensuring regular emission and maintenance checks on the Emission monitoring capabilities of the bus fleet
Organisations (BEST) bus fleet to ensure compliance with regulations. to be strengthened.
Good housekeeping in existing Bus-Depots to minimize Environmental awareness training of keywater and land pollution from oil spills and waste oil personneldisposal.
Enforcement/ Regulatory Enforcement of vehicular emission standards, with more Environmental awareness training for its
Organizations: emphasis on heavy vehicles, taxies and 3 wheelers vigilance staff so that they can appreciate theimportance of their role and carry out the sameRegional Transport Office (RTO) diligently.
Training also needs to include criteria andtechniques for vehicle inspection andcertification.
59


MMR BACKGROUNb ANbSECTORAL PERSPECTIVE


Mumbai Urban Transport Project Consolidated Environmental Assessment
CHAPTER 1INTRODUCTION
1.1 BACKGROUND
Mumbai in the 17' century was a cluster of seven fishing islands, which has nowbecome a single land mass in the form of a narrow peninsula. The colonial powersrecognized the importance of protected harbor offered by this peninsula anddeveloped it as a major port. Municipal Corporation was established in 1888 initiallyfor an area of 72 sq. Kms, comprising the seven islands. The Municipal limits wereextended in 1951 and 1957. These incorporated areas were called suburbs and theentire area as Greater Mumbai (this usage of phrase "Greater" is different fromconventionally understood.). Over the last few decades, Greater Mumbai has grownas the major financial and commercial capital of India. Greater Mumbai's populationthat was around 4 million in 1961 has now reached 11.9 million in 2001. The urbangrowth has spread beyond the boundaries of Municipal Corporation of GreaterMumbai in the northern, north-eastern and eastern directions to form MumbaiMetropolitan Region (MMR). Greater Mumbai has an area of 438 sq. km and apopulation of 11.9 million. MMR has an area of 4354 sq. km and population of about18 million. By 2011 MMR is expected to have a population of 22 million.' MMRgenerates about 5% of national GDP and contribute over one third of India's taxrevenues. Figure 1.1, shows various sub-regions of MMR.
1.2 TRANSPORT SECTOR IN MUMBAI
Mumbai has a unique distinction of satisfying 88 % of its peak period travel demandthrough the public transport such as suburban trains and Buses. Five percent of theremaining twelve percent is met by taxis and seven percent by private vehicles.Although these proportions are estimated to remain more or less same by 2011 ( withpublic sector falling from 88 to 85 %), the number of public transport trips in the peakperiod will rise substantially. In the public transport sector, MMR is served by twozonal railways; the Western Railway (WR) and Central Railway (CR). the suburbanrailway services, which are in fact metropolitan services in view of the frequency andshort distances between stations, carry close to 6 million passengers per day. Busservices in Greater Mumbai are provided by BEST, with 3000 buses, and carry 4.5million journeys per day of which approximately 60 % are connected with railjourneys. In the road transport sector, the road network in Greater Mumbai is
1 Regional Plan for Mumbai Metropolitan Region 1996-2011, MMRDA
1-1

Mumbai Urban Transport Project Consolidated Environmental Assessment
predominantly radial along the peninsula and comprises three main corridors;Western Express Highway, Eastern Express Highway, and the
1-2

Mumbai Urban Transport Project Consolidated Environmental Assessment
FIGURE 1.1 MAP OF Mumbai Metropolitan Region
MUMBAI URBAN TRANSPORT PROJECT ENVIRONMENTAL ASSESSMENT
w ~ ~~~~~~~~~~~~~LE.ENDOBAJOR ROAD -
OTHE. R...
62' \ } \_/\ VIBAR / < WATFR SO- R -. -
_SIR BOU..A.,
LART.R. ..A.U .
\ A 2 \ J / + ~~~~~~~~~~~~~~~~~WESTERN RSUURS CO
3= \ g t { \ / - if j RET OF ...
; 7~~~~~~~~~~~~~~~~~~~~~~~~~~~~~~~~U .. N-- . ....
m~~~~~~~~~~~~~~~~~~~~~~~~.A
W_ \W \\ <4~~~~~~

Mumbai Urban Transport Project Consolidated Environmental Assessment
Central corridor. Although termed 'Expressways' the roads are essentially arterialroads and decline in standard as they approach and pass through the Island City.The number of registered vehicles in MMR grew from 521,000 in 1985 to 821,000 in1991. Private cars grew from 173,000 to 366,000 in 1991 and the number isexpected to double in 2011.
Transport Sector Issues
i) Travelling Conditions
The transport conditions for suburban rail passengers and road transport users areintolerable. Average peak hour loading of trains is in excess of 4000 passengers pertrain as compared to design capacity of about 1800 per train and crush load capacityof 2600 per train. The BEST Buses also tend to be overcrowded during the peakhours. It is therefore an urgent need to improve travelling conditions for publictransport users to avoid encouraging a shift to private transport.

Mumbai Urban Transport Project Consolidated Environmental Assessment
ii) Transport Infrastructure
Transportation infrastructure in the region is overburdened and under considerablestrain. The existence of a number of level crossings on the rail lines constrains theintroduction of more trains during peak hours. The road network is mainly developedin the south-north direction along the western and central corridors respectively fromBandra to Borivali and from Sion to Mulund. However, there are inadequate eastwest link roads. Also the road network capacity is severely reduced due to roadsideparking, slum encroachment and encroachment by street hawkers. Therefore thereis an urgent need to improve the transport infrastructure.
iii) Road Traffic Congestion
Greater Mumbai is suffering from increasing traffic congestion, road traffic delaysand vehicle related emissions and pollution. While there is a need to correctstructural deficiencies in the road infrastructure to cope with increasing privatevehicle ownership, there is a clear need for improved demand management andtraffic management to ensure optimum use of scarce and expensive road spaceparticularly in the Island City.
iv) Air guality
Vehicular emissions is a serious issue. There is an extensive use of diesel poweredvehicles (BEST buses and trucks and increasing proportion of taxis) and vehicleswith two stroke engines (three wheeled motor rickshaws outside the Island City andtwo wheeled motorcycles). There is a need to develop a comprehensive policy forreducing vehicular emissions by improved engine design, better quality or alternatefuels and vehicle inspection and maintenance.
1-5

Mumbai Urban Transport Project Consolidated Environmental Assessment
v) Resettlement and Rehabilitation
The construction or improvement of transport infrastructure in Greater Mumbai hasbeen greatly hampered by the difficulties in securing land and the consequent needto resettle and rehabilitate large number or people. Almost every infrastructuredevelopment "rail or road' involves the rehabilitation of people and businesses. Anequitable and efficient resettlement and rehabilitation policy has already approved byGOM in 1997 and is being implemented to enable the transport system to bedeveloped. In fact over 50% of the 19228 PAHs have been resettled by June 2001.
vi) Institutional Framework
Transport in Mumbai involves a large number of agencies - Regional Planners, TrainOperators, Bus Operators, Municipal Corporations, GoM Public Works Department,GOM corporations, traffic police and others. In order to coordinate the activities ofthese agencies MMRDA has established a Project Management Unit under a ProjectDirector, Mumbai Urban Transport Project.
1.3 COMPREHENSIVE TRANSPORTATION PLAN
With a view to improving the transportation sector in MMR, Mumbai MetropolitanRegion Development Authority (MMRDA) prepared a Comprehensive Transport Plan
(CTS)2 for MMR (Ref 3, Appendix 1.1) in 1994. The main objective was to develop acoherent transport sector strategy for MMR linked with a rational land use plan. The
2 _ Comprehensive Transport Strategy for Mumbai Metropolitan Region by W.S. Atkins International, 1994.
1-6

Mumbai Urban Transport Project Consolidated EnvironmentalAssessment
objectives of the CTS strategy are to: (i) ensure adequate levels of accessibility in theexpanding areas of MMR: (ii) assist in the economic development of MMR: (iii)prioritize public transport over private vehicles: (iv) mange the system to ensure bestuse of facilities, (v) improve the safety record of the transport system: (vi) achieve theobjectives with due regard to environmental and social aspects and availability ofresources. The realization of the strategy was to be achieved through concentrationon the provision and expansion of public transport with the suburban rail system asthe core of the system.
1.4 ENVIRONMENTAL ASSESSMENT (EA)
Transportation sector contributes to about 60 % of air emission load in GreaterMumbai.3 Vehicular noise is also of concern. The network extension subprojectscould give rise to significant social impacts by way of relocation and rehabilitation ofthe project affected households. The extension of transportation network may havesome impact on ecological resources such as hills, wetlands, mangroves and forests.These environmental issues need to be identified and addressed at the sectorallevel. Since, a transportation strategy is implemented through sub projects, the lattercould give rise to environmental impacts which are largely localized in nature.
Sectoral Level Environmental Assessment (SLEA) is used to evaluate environmentalimpacts of strategic options and arrive at the most preferred option. SLEA is alsoused to provide a framework for adopting appropriate legal, policy, and administrativemeasures for mitigating sectoral environmental impacts. Initial assessment wascarried out during 1996 to 1998. SLEA4 (Ref. 1 Appendix 1.1) present theenvironmental analysis of the four options identified for the transportation strategy ofMMR, which would have minimum adverse environmental implications. Therecommended transportation strategy placed thrust on enhancing public transportservice in MMR and improving road network to provide better accessibility andrelieve traffic congestion on the roads in suburbs and rest of MMR. The SLEA ispresented in Chapter 4 of this report.
The recommended strategic option comprised a series of sub-projects. The sub-projects having potentially significant Environmental Impacts were subjected toMicro-Level Environmental Assessment (MLEA) whereas groups of smaller andsimilar subprojects were subjected to Programmatic Level EnvironmentalAssessment (PLEA). MLEAs provided detailed analysis of the individual subprojectsviz. Jogeshwari Vikhroli Link Road, Borivali-Virar Quadrupling Railway Corridor.PLEAs were prepared for small generic sub-projects, such as, Flyovers, Robs,Pedestrian Subways, Station Area Traffic Improvements Schemes (SATIS).
3- ESR of MCGM for the year 1999 -2000.4- Sectoral Level Environmental Assessment of MUTP - II by AIC Watson Consultants Ltd., March 1998
1-7

Mumbai Urban Transport Project Consolidated Environmental Assessment
Mitigation measures in the form of appropriate legal, policy and administrativemechanisms alleviating sectoral environmental impacts are proposed as a part of theEMP at the sector level. Environmental Management Plan (EMP) for implementingmitigation measures, monitoring various traffic parameters and monitoringenvironmental quality parameters was also developed. The plan also presentsinstitutional coordination model required for implementing a long-term transportationinvestment program. In addition to SLEA, Environmental Assessment (EA) ofindividual sub projects of MUTP was carried out to identify mitigation measuresrequired at sub project level.
Development Since 1998
Subsequent to the above studies, the subproject configuration of MUTP has beenrevised, and some new developments have also taken place. Important amongstthese developments are fly over construction program and commencement of Worli -Bandra link.
Need to Update and Consolidate EAs
Since the initial EA was carried out in 1998, it is necessary to update and consolidtaethese EA reports taking into consideration the changes in the environmental baselinedata and changes in environmental regulations. This exercise is separately beingundertaken. The earlier EA reports were presented in the form of series of individualreports. It is therefore now necessary to present an updated and consolidated EAreport comprising SLEA, PLEA, MLEA and related EMPs.
The chronology of Environmental Assessment process is depicted in Fig 1.2
1-8

Mumbai Urban Transport Project Consolidated Environmental Assessment
FIGURE 1.2 ENVIRONMENTAL ASSESSMENT PROCESS
Comprehensive Transportation Study4 strategic options
1. Do minimum 19942. Public transport option3. Public transport + Demand management4. Road Investment ootion
Sectoral Level Environmental Assessment (SLEA)Evaluation of strategic options with respect to thefollowing environmental criteria 1996- Traffic Analysis- Impact on Air, noise, social, ecological resources and
transportation service quality
Selection of strategic option PT + DM
Screening of projects with respect 1997to potential impacts
Programmatic Level Micro-level EnvironmentalEnvironmental Assessment Assessment (MLEA)(PLEA) - Subprojects selected road- Sub-projects selected ROBs, Improvements, Suburban railway 1998
pedestrians subways sub-projects- Analysis of traffic & transport - Impact on traffic, air, noise, water- Impact on air, noise, social and landuse, social and ecological
ecological resources, landuse resources, quality
pI Pulic onsultation
Preparation of updated and consolidated 2001FA ;nri nrnibr.t -,npr.ifir. PMP^,
I Draft Consolidated EA Puli+ ' | ~~~~Consultation
1201
Note: the current project stage is highlighted in the above figure the current project stage ishighlighted in the above figure
1-9


Mumbai Urban Transport Project Consolidated Environmental Assessment
1.5 STRUCTURE OF THE REPORT
The structure of the rest of the report is as follows.
Chapter 2 discusses existing environmental laws relevant to transportation sector,existing environmental policies and trends having implications for transportationsector, and administrative framework dealing with the sectoral development.
Chapter 3 describes baseline environmental data of MMR. The data is summarizedwith respect to climate, air quality, noise, ecology, resettlement and rehabilitation,etc.
Chapter 4 briefly describes the Comprehensive Transport Plan for MMR andevaluation criteria for selecting the preferred option. It also provides SLEAmethodology and selection of the best option.
Chapter 5 describes Mumbai Urban Transport Project.
Chapter 6 presents screening methodology for selection of sub-projects forprogrammatic and micro level environmental assessment. It further describesenvironmental impacts of the sub-projects selected for MLEA and PLEA.
Chapter 7 describes the Environmental Management Plan (EMP) to mitigate adverseenvironmental impacts at sectoral, programmatic and micro level. This chapter alsodescribes the environmental monitoring plan and institutional arrangements foreffective implementation of the EMP.
Chapter 8 presents the Resettlement Action Plan prepared for the Project AffectedHouseholds (PAHs), including Community Environment Management Plan for theresettlement areas.
Chapter 9 presents details of public consultation process carried out during theproject preparation stage of MUTP and outlines an approach to public informationand consultation that will be adopted.
1-11


POLICY, LEGAL ANbA bMINISTRATIVE
FRAMEWORK


Mumbai Urban Transport Project Consolidated EnvironmentalAssessment
CHAPTER 2
POLICY, LEGAL AND ADMINISTRATIVE FRAMEWORK
2.1 LEGAL FRAMEWORK
This chapter provides an overview of the existing environmental legislation, policiesand administrative framework.
2.1.1 Central Government And State Government Environmental Regulations
After the Stockholm Conference on Human Environment in June 1972, it wasconsidered appropriate to have uniform laws across the country for dealing withbroad environmental problems endangering the health and safety of people as wellas the flora and fauna. The concern for environmental protection is amplydemonstrated by the 42nd amendment to the Indian Constitution (Article 51g), whichstates "It should be the duty of every citizen of India to protect and improve thenatural environment including forest, lakes, rivers and wildlife, and to havecompassion for living creatures".
Government of India has enacted a number of environmental laws with an intentionto protect environment, prevent and control air and water pollution and ensure safehandling of hazardous substances. At the Central Government, Ministry ofEnvironment and Forests (MOEF) is the apex authority which formulates policies forenvironmental and forest management in the country. Various Departments and theCentral Pollution Control Board (CPCB) help MOEF, in this regard. At the state level,Maharashtra Pollution Control Board (MPCB) and Environment Department (ED) areresponsible for environmental management.
There are various Acts, Rules and Notifications applicable for different environmentalcomponents such as Air Pollution, Water Pollution, Noise Pollution, Coastal Areas,Hazardous Materials Handling And Transport, Forest and Wildlife, etc. In additionregulatory provisions by way of environmental clearance also exist. Theapplicable regulations are given in Appendix 2.1 (a) and 2.1 (b).
2.1.2 Central Government Regulations Related To Vehicular Pollution
(A) Rule 115 of Central Motor Vehicle Rules, 1989 provides the emission norms.Government of India has taken following steps in order to curb vehicular pollution: -
(i) Emission standards for different categories of vehicles including transportvehicles were introduced in the year 1990 and subsequently modified with
stringent standards effective from 1992, 1996 and 2000. Euro-I norms have
2-1

Mumbai Urban Transport Project Consolidated Environmental Assessment
been brought into force with effect from 01.04.2000 throughout the country forall category of vehicles. However, Bharat Stage-Il norms (equivalent to Euro-II) have been brought into force only in NCT (National Capital Territory), Delhiwith effect from 1.4.2000 and further extended to the city of Mumbai from1.1.2001 and are extended to Chennai and Kolkata from 1.7.2001. It mayalso be mentioned that Bharat Stage-Il norms are not applicable to allcategories of vehicles at present and are applicable for vehicles upto 3500 kgGVW. The relevant Notification Nos. are G.S.R. 493 (E) dated 28th August,1997, G.S.R. No. 77 (E) dated 315t January, 2000 (F) and S.O. No. 779 (E)dated 2 9 th August, 2000. Bharat Stage-Il norms for commercial vehicles havealso been notified in the Gazette of India on 23.02.2001 invitingobjections/suggestions from the public.
(ii) Fitment of Catalytic Convertor is mandatory for all four-wheeled petrol drivenvehicles for registration in four Metro cities including Mumbai and other 45cities of the country.
(iii) Separate set of emission standards for vehicles using Compressed NaturalGas (CNG) have been notified vide G.S.R. No. 99 (E) dated 09.02.2000.
(iv) Government has already amended in August 2001 the Motor Vehicles Act,1988 permitting the use of LPG as an automotive fuel. Rules setting out theemission norms for LPG using vehicles have been notified dated April 24,2001.
(v) The Ministry of Petroleum, Government of India has prescribed sulphurcontent of 0.05 % for diesel and benzene content of 1 % for petrol.
(B) Mass Emission Standards (for vehicles manufactured on and after 1st April2000):
The Ministry of Surface Transport, Government of India, vide notification, G. S. R.No. 493 (E) dated 28-8-97 has published the mass emission standards for petroldriven vehicles and diesel driven vehicles (including two and three wheelers) whichhave come into force from the 1st day of April 2000.
The Bharat Stage II norms to be complied with are:Petrol Vehicles (g/km): CO (2.2), HC+NOx (0.57),Diesel Vehicles (g/km): CO (1.00), HC+NOx (0.70)
Following Table 2.1 gives the implementation schedule of the Government of Indiaorders.
2-2

Mumbai Urban Transport Project Consolidated Environmental Assessment
TABLE 2.1 Schedule for Implementation of Vehicles Rules
Type of vehicles As per G.S.R.No. 493 (E) dt. 28-8-97 i.e. India-(According to fuel 2000 norms
used)
A) Petrol
i) Non commercial vehicles Not to register if does not conform to 1-2000 norms(e.g. motor cars etc.) with effect from 1/4/2000 in Maharashtra
(including Mumbai.)
ii) Non commercial vehicles Not to register if does not conform to(e.g. Two wheelers / three 1-2000 norms with effect from 1/4/2000 in Maharashtrawheelers) (including Mumbai.)
iii) Commercial vehicles (e.g. Not to register if does not conform toair, metered taxi, tourist taxi 1-2000 norms with effect from 1/4/2000 in Maharashtraetc.) (including Mumbai.)
B) Diesel
i) Non commercial vehicles Not to register if does not conform to 1-2000 norms with(e.g. Motors cars etc.) effect from 1/4/2000 in Maharashtra
(including Mumbai.)
ii) Non commercial Not to register if does not conform to 1-2000 norms withvehicles (e.g. Two effect from 1/4/2000 in Maharashtrawheelers / three (including Mumbai.)wheelers)
iii) Commercial vehicles (e.g. Not to register if does not conform to 1-2000 norms withautorikshaw, taxi, truck, bus effect from 1/4/2000 in Maharashtraetc.) (including Mumbai.)
Recent Supreme Court Directives and other legal issues related to vehicular pollutionare provided in Appendix 2.1(C).
2.2 EXISTING POLICIES AND TRENDS
2.2.1 The transportation sector contributes significantly to air pollution. This has attractedattention of policy makers at both state and central level to explore various ways ofreducing vehicular pollution. A number of vehicular pollution control measures havebeen introduced or are being reviewed for introduction at the central level. They arebriefly reviewed in the following paragraphs:
* Use of LPG as Auto Fuel
Ministry of Petroleum and Natural Gas has passed an Order dated 01/08/2001called Liquefied Petroleum Gas (Regulation of Use in Motor Vehicles) Order2001, allowing use of LPG in Motor Vehicles, permanently fitted with Auto LPGtank and a conversion Kit as approved by the Authorities/ testing Agencies asnotified in the Central Motor Vehicle Rules 2001. The Order provides that,
2-3

Mumbai Urban Transport Project Consolidated Environmental Assessment
a. The LPG shall be dispensed only by Dealers licensed by Chief Controller ofExplosives under the Static and Mobile Pressure Vessels (Unfired) Rules1981, as amended from time to time.
b. Auto LPG shall not be filled in excess of 80% of its total volumetric capacity.c. Auto LPG shall not be dispensed unless received from Govt. Oil
Companies/ parallel marketers and conforming to Auto LPG specificationNo. IS 14861 as amended from time to time.
* The Government has made it rnandatory for vehicle owners to get thepermission from the Registration Authority for converting a vehicle from petrol todiesel to avoid "unsafe changes and pollution".
* Owners of more than ten vehicles would not henceforth be allowed to alter theirengines without prior permission from the Registration Authority .
* To make school buses safer, it was decided to withdraw exemption toeducational institutions to run vehicles without any permit, which is mandatoryfor other public vehicles.
* The Supreme Court of India has disallowed the registration of all private non-commercial vehicles in the National Capital Region (NCR) failing to conform toBharat II fuel emissions norms from 1st April 2000. This has already lead todebate as to why such norms shall not be used for other cities.
* The Mumbai High Court on 17th October 2001 has set deadlines for phasing outold vehicles unless converted to (CNG or LPG engines. Table 2.2 shows thedeadlines set by Mumbai High Court for respective vehicles.
2.2.2 At the local level, a Division Bench of the Hon'ble Bombay High Court hadconstituted a Committee (under the chairmanship of Shri. V. M. Lal,' then TransportCommissioner) vide an order dated 15t" December 1999 for examining, consideringand recommending measures to reduce vehicular pollution in Greater Mumbai. Therecommendations of the committee may be categorized as under:
* Supply of cleaner fuel* Encouraging the use of cleaner fuel* Phasing out of old vehicles* Stringent emission standards*n Use of catalytic converters
Suoply of Cleaner Fuel:
The Committee has made recommendations for reducing Sulphur content of dieselinitially to 0.05% and finally to 0.005% by l5t April 2005. It is also recommended that
2-4

Mumbai Urban Transport Project Consolidated Environmental Assessment
Benzene content of petrol supplied in Mumbai City be reduced from the present levelof 3% to less than 1%.All the refineries in the public and private sector are recommended to implement the'Marker' system for detecting adulteration in fuels and lubricants.
All the retail outlets in Mumbai Metropolitan Region should sell only pre-mixed petrolthrough dispensers to two and three wheelers with effect from 1 st October 2000
The oil industry is recommended to set up one more full-fledged lab in Mumbai forperiodic testing of fuel.
Encouragina the Use of Cleaner Fuel:
To encourage the use of CNG fuelled vehicles; the committee has recommendedsetting up of CNG outlets at some of the existing petrol pumps.
The Committee has also recommended that the BEST Undertaking sets up CNGfilling stations for buses and all new BEST buses are operated on CNG or be incompliance with Bharat stage 11 standards. Similar recommendation has been madewith respect to private contract buses registered and operating in the MumbaiMetropolitan Region.
Phasing out of old vehicles
The Committee has recommended that all petrol taxis above the age of 15 years anddiesel taxis above the age of 8 years be converted to CNG or any other clean fueland all diesel taxis above the age of 8 years should be converted to clean fuel. The 3wheelers above the age of 10 years are recommended to be scrapped or convertedon CNG or any other clean fuel. All transport vehicles, except 3 wheelers and BESTbuses over the age of 15 years are recommended to be scrapped unless convertedto clean fuel. All BEST buses older than 20 years are recommended to be scrappedor converted to CNG.
The Committee has recommended that two and three wheeled vehicles with four-stroke engine alone be registered in Mumbai Metropolitan Region. Two and threewheeled vehicles having two stroke engines should be permitted to register as atransitional measure provided such vehicles are fitted with catalytic convertersguaranteed for 30,000 km by the manufacturers.
- Report of the committee constituted by The Orders Of The High Court, Bombay to examineand recommend measures to reduce vehicular pollution in greater Mumbai, April 2000
2-5

Mumbai Urban Transport Project Consolidated Environmental Assessment
Stringent Vehicular Emission Standards
The Committee has made the following recommendations for making emissionstandards stringent.
* The present permissible limit of 4.5% Carbon Monoxide emissions in respect of2 and 3 wheelers to be reduced to 3%.
* The present permissible limit of 65 Hartridge Smoke Units for diesel vehicles tobe reduced to 45 HSU in Mumbai.
*- The Ministry of Surface Transport, Govt. of India to lay down Bharat Stage IImass emission norms (equivalent to EURO II norms) for all categories ofvehicles.
* All heavy commercial vehicles as well as light goods vehicles to be registered inthe Mumbai Metropolitan Region from 1st April 2001 to be Bharat Stage IIcompliant.
Retrofitting of Vehicles with Catalytic Converters
All two stroke two wheelers and three wheelers in use in Mumbai are recommendedto be fitted with catalytic converters.
All petrol driven vehicles registered in Mumbai prior to 1st April 1995 arerecommended to be fitted with catalytic converters.
Financial Incentives
The Government of Maharashtra and Municipal Corporation of Greater Mumbai arerecommended to grant the concessions in sales tax, octroi; and to advise banks /financial institutions to offer lower interest rates on loans to the owners of taxis andauto-rickshaws for replacing their old vehicles with new vehicles running on a cleanfuel. The customs duties, sales tax, excise duty and octroi are recommended to betotally waived on both the CNG conversion kits including cylinders as well as on thecatalytic converters up to some time period.
Traffic Planning and Management
The Committee has recommended strengthening of traffic and transportationplanning, traffic operation, traffic signals and signs, and area traffic control. Therecommendations are also made for modal integration outside railway station, controlof on-street and off-street parking, management of traffic demand, power to collectcertain parking fees and supplementary charges on road traffic.
2-6

Mumbai Urban Transport Project Consolidated Environmental Assessment
The Mumbai High Court on 17 th October 2001 has set the deadlines for phasing out
old vehicles unless converted to CNG or LPG engines. Table 2.2 shows thedeadlines set by Mumbai High Court for respective vehicles.
Table 2.2 Deadlines for Phasing out of Old Vehicles
No. Type of Vehicles Deadline1 All Taxis above 15 years of age 1-3-20022 All Taxis above 8 years of age 1-1-2003
3 Three Wheelers 10 years of age 1-3-2002
4 Three Wheelers 8 years of age 1-1-20035 Public Transport vehicles except BEST Buses 31-12-2002
2.2.3 Institutional strengthening in MCGM and Amendments to BMC Act, 1888.
MCGM's Traffic Management Unit (TMU) is to be strengthened for traffic andtransportation planning, traffic operation, traffic signals and signs, and area trafficcontrol. BMC Act, 1888 is also to be amended to enable MCGM to discharge theresponsibility for provision of facilities for traffic management, modal integrationoutside railway station and at ferry landings, control of on-street and off-streetparking, management of traffic demand, power to collect certain parking fees andsupplementary charges on road traffic. A proposal in this regard has been approvedby the GOM Cabinet and the necessary Bill is expected to be passed by the StateLegislature.
2.2.4 Development Control Regulations of MMR.
The MUTP project area is largely governed by the Development Control Regulationsfor Greater Mumbai, 1991(DCR). Government of Maharashtra has also preparedCoastal Zone Management Plan (CZMP)2 for Greater Mumbai, which has beenapproved by MOEF in January 2001. The provisions of CZMP have precedence overthe DCR, 1991.
2.2.5 Resettlement & Rehabilitation Policy
The Government of Maharashtra has adopted the R & R policy in March 1997 tominimize adverse social impact arising from the need to relocate about 19000families, which will be displaced due to implementation of MUTP. The objectives ofR&R as enunciated in the policy are:
To minimize the resettlement by exploring all viable project designs
2 Coastal Zone Management Plan for Maharashtra by Urban Development Department ofGovt. of Maharashtra, July 1997.
2-7

Mumbai Urban Transport Project Consolidated Environmental Assessment
* Where displacement is unavoidable, to develop and execute resettlement plans
in such a manner that displaced persons are compensated for their losses at
replacement cost prior to actual move.
* To accord formal housing rights to the PAH's at the resettlement site by
establishing cooperative housing societies of the PAH's.
* To make efforts to retain existing community network in the resettlement area
and to minimize the adverse impaci, if any, on the host community.
* To improve environmental health and hygiene of the PAH's at the site ofresettlement and to educate, motivate and organize the community to manage
its environment at the resettlement location.
Resettlement Action Plan (RAP) has been prepared and site specific ResettlementImplementation Plans (RIPs) are being finalised.
2.3 WORLD BANK POLICIES
The World Bank has prepared an umbrella policy called OP 4.01, EnvironmentalAssessment, January 1999. According to this policy the Bank requires EA forprojects proposed for Bank financing to help ensure that they are environmentallysound and sustainable. The policy provides guidelines for EA contents and scope,EA instruments, requirements of public consultations, environmental managementplans, etc.
The Bank classifies proposed projects into one of four categories (A, B, C and Fl),depending on the type, location, sensitivity, and scale of the project and the natureand magnitude of its potential environmental impacts. A project is classified asCategory A if it is likely to have significant adverse environmental impacts that aresensitive, diverse, or unprecedented. For a Category A project, the borrower isresponsible for preparing a report, normally an EIA (or a suitably comprehensiveregional or sectoral EA) etc. The MUTP project is categorised as a Category A
project.
2.4 EXISTING ADMINISTRATIVE FRAMEWORK
The implementation of an environmentally sound transport strategy involves anumber of institutions / organisations at various levels with each organisation havinga distinct role to play. These organisations may be categorised into four groups.The grouping of these organisations has been done according to their existing roles
and these are mentioned in the following paragraphs.
2-8

Mumbai Urban Transport Project Consolidated Environmental Assessment
! Apex Organizations- Environment Department (ED)- Urban Development Department (UDD)- Home Department (Transport)- Mumbai Metropolitan Region Development Authority (MMRDA)
* Project Implementation Organizations- Municipal Corporation of Greater Mumbai (MCGM)- Public Works Department (PWD)- Mumbai Railway Vikas Corporation (MRVC)- Maharashtra State Road Development Corporation (MSRDC)
* Transportation Service Organisations- Brihan Mumbai Electrical Supply and Transportation Undertaking (BEST)- Maharashtra State Road Transport Corporation (MSRTC).- Western and Central Railways (WR and CR)
- Private Bus Operators (PBO)
E Enforcement Organizations- Maharashtra Pollution Control Board (MPCB)
Regional Transport office (RTO)
An overall institutional arrangement showing the functional relationship of the above-mentioned organizations is shown in Fig. 2.1.
2.4.1 Apex Organisations,
Apex organisations which deal with legal and policy framework relevant to transportsector, are Environment Department (ED), Urban Development Department (UDD),Home Department (Transport) and MMRDA.
Environment Department (ED)
Being an apex environmental organization of the state, ED is expected to carry outthe following activities.
* Formulating environmental policies and developing environmental protectionprograms for the state.
Providing direction to and co-ordinating activities of agencies involved in themanagement of the environment at different levels.Delegating responsibilities to other agencies for carrying out variousenvironmental programs and assessing the outcome of these programs.
* Initiating action for introducing appropriate environmental legislation/ rules toaddress environmental problems, if necessary.
2-9

Mumbai Urban Transport Project Consolidated Environmental Assessment
* Enforcement of environmental standards and guidelines through MaharashtraPollution Control Board (MPCB).
Urban Development Department (UDD)
UDD is responsible for developing policies, plans, and programs for Urbandevelopment including urban transport and municipal administration.
Home Deoartment (Transport)
The involvement of Home Department (Transport) is in respect of traffic control andenforcement of emission standards.
Mumbai Metropolitan Region Development Authority (MMRDA)
MMRDA is a planning authority at apex level for entire MMR. MMRDA is responsiblefor providing a single, unified planning and co-ordinating agency for the region toensure that the development takes place in a planned and orderly manner. Theexisting role of MMRDA:
* To review any physical, financial and economical plan;* To formulate and co-ordinate multi agency development projects;* To execute projects or schemes;* To finance infrastructure development* To control development that may adversely affect regional growth.
Presently, MMRDA has a full-fledged set up to deal with urban and regionalplanning, transport planning and statislical and information systems. MMRDA hasgained significant expertise in these areas by undertaking to the above mentionedresponsibilities for over two decades. In the recent past MMRDA has also startedbuilding up capacity in environmental planning.
2.4.2 Project Implementation Organizations
MMRDA is the apex organisation responsible for transport policy, however, theimplementation of transport projects is carried out by various organisations asfollows:
* Municipal Corporation of Greater Mumbai.* Mumbai Rail Vikas Corporation (IVIRVC)* Public Works Department (PWD) / Maharashtra State Road Development
Corporation (MSRDC)
2-10

Mumbai L @ansport Project Figure 2.1@Consolidated Environmental Ass@
Institutional Arrangement for MUTP
Environment Department (ED) Urban Development (Environmental Policies) D
APEXORGANISATIONS
I _________________________________________________
MMRDA Transport Commissionarate(Urban planning and Home (Transport) Dept.
co-ordination) Enforcement of transport regulations l
..............................................................................................................................................................................
Project I MCGM MSRDC/ /PWDImplementing i (Air and noise quality monitoring, MRVC (Road /bridgeOrganisations I Local raod constitution and (Rail development) construction)
maintenance)
IMPLEMENTINGORGANISATIONS
BBE S MSC & RlwPrivate Bus TransportTransport Service [| B T | MRSTC W & C Railway OperatorsOrganisationI Bus Tr port nsport Rail oerationand fleet maintainance I |
....................................................................................................................................................................................
- MPCB ~~~~~~RTOENFORCEMENT ~~~~~~~~~(EnforceCen o(Efrcement of transport regulation
ORGANISATIONS Environmental reaulations) and inspection and certification ofvehicles)
Note: The coloured boxes indicate the institiion playing role in environmental management.Roles played by respective institutions are given in brackets in the same box.
2-11

Mumbai Urban Transport Project Consolidated Environmental Assessment
Municipal Corporation of Greater Mumbai (MCGM)
MCGM is responsible for providing civic services viz. roads, water supply, sanitation,solid waste management, public health services and primary education. Thus, theactivities carried out by the MCGM have a direct bearing on the environment and thequality of life. MCGM monitors ambient air and noise quality at various locations inGreater Mumbai.
Maharashtra State Road Development Corporation (MSRDC)
MSRDC was established by the Government of Maharashtra IN 1996 and is fullyowned by the Government of Maharashtra. It has been constituted to accelerate thedevelopment of transport infrastructure facilities in the State. The main objective ofthe MSRDC is improvement of existing roads and construction of new roads,highways, expressway, etc. MSRDC has been vested with rights to collecttoll/service charges and also to commercially exploit the available land.
MSRDC has completed 33 flvovers in three years in MMR. MSRDC has no separateEnvironmental Cell.
Public Works Denartment (PWDJ
The role of Public Works Department in the transportation sector is limited to theconstruction and maintenance of the state and national highways. The relevantdivision of the Department is well conversant with the road construction standardsand local rules applicable to such projects. As part of the road construction work, theDepartment has significant experience in handling some of the environmentalmanagement measures like CD works, erosion control, arboriculture etc. However,the PWD has no separate Environmental Cell. Hence the department has nospecific expertise in handling air, noise and water pollution problems.
Mumbai Railway Vikas Corporation (MRVC)
Mumbai Railway Vikas Corporation (MRVC), a joint venture of Government ofMaharashtra (GoM) and Indian Railways (IR), has been set up in April 2000, toimplement the rail projects in MUTP as well as other suburban projects of IR. Thefunctions of MRVC include:
1. Development of co-ordinated plans for the rail component of MUTP and otherplanned investments in Mumbai suburban rail services, as also execution of theresulting infrastructure projects,
2. Integration of urban development plans for the MMR with rail capacity plans andproposed investments,
2-12

Mumbai Urban Transport Project Consolidated Environmental Assessment
3. Co-ordination and ensuring improvement of track drainage and the removal ofencroachments as well as trespassers from the Railways right of way and stationapproaches, and
4. Execution of specific projects for the commercial development of railway land
and apportionment of the income in the ratio of 1:1:1 for railway projects inMumbai area, Maharashtra and elsewhere in the country, respectively.
2.4.3 Transportation Service Organizations
The transport service organizations in MMR include:
* Western and Central Railways (WR and CR)
* BES&T Undertaking (BEST)
> Maharashtra State Road Transport Corporation (MSRTC)
* Private Bus Operators (PBO)
Railway services in MMR are provided by two zonal railways- Western Railway andCentral Railway. The railway services are operated on electric power. Hence, theoperation of trains does not give rise to air pollution problem.
The major organisations involved in providing bus services in MMR are BEST,MSRTC, TMT, NMMT and Private Bus Operators. BEST provides service in GreaterMumbai and has the largest fleet of over 3000 buses.
2.4.4 Enforcement Organizations
The organizations responsible for enforcing environmental regulations relevant to thetransportation sector in MMR are:
• Maharashtra Pollution Control Board (MPCB)
* Regional Transport Office (RTO)
MPCB is a statutory body set up under the provisions of Water (Prevention & Controlof Pollution) Act, 1974 and is responsible for implementation of Environmental Actsin the region including Air (Prevention & Control of Pollution) Act, 1981. Its majorfocus is on the control of industrial pollution.
) RTO is responsible for the enforcement of the Central Motor Vehicle (Amendment)Rules, 1993, and hence, the onus of determining violation of vehicular emissionstandards lies with RTO. Automobile owners are supposed to get their vehicles
2-13

Mumbai Urban Transport Project Consolidated Environmental Assessment
monitored for emissions at the designated petrol pumps, which are equipped forcarrying out this task, and obtain a certificate of compliance with the standards. Theemission checks are required to be carried out twice a year, and the certificate isrequired to be displayed on the vehicle. RTO's vigilance staff has powers to imposefine on the offenders of the law.
2-14

3
ENVIRONMENTALBASELINE STATUS


Mumbai Urban Transport Project Consolidated Environmental Assessmet
CHAPTER 3ENVIRONMENTAL BASELINE STATUS
3.1 BASELINE DATA
The data on baseline status of six environmental components was collected andcompiled from various existing sources and was also supplemented by primary datacollected at individual project sites. A comprehensive database of all data collectedis presented in the report 'Environmental Status of MMR, Final Report, May 1997".1The six environmental components are:* Air Quality* Noise Levels* Ecologically Sensitive Areas* Socio-economic characteristics of the affected communities* Health* Land Use
Both the primary and secondary baseline data were compiled and analyzed duringthe years 1996 to 1998. The earlier secondary baseline data has now been updatedfor the years 1998 to 2001 and a comprehensive analysis is presented in this section.The updated data is mainly for Air Quality and Noise as these are the principalenvironmental components that would be affected by transport related projects.Among other sources of secondary data, the important ones used are as follows:
1. Annual Environmental Status Reports by Municipal Corporation of GreaterMumbai.2
2. Ambient air quality data monitored by National Environmental EngineeringInstitute (NEERI).
3. Urban Air Quality Management Strategy in Asia, Greater Mumbai Report,(URBAIR), World Bank Technical Paper No. 381.3
4. Study for Strengthening the Air Quality Network Operated by MCGB, preparedby Environmental Management Centre Mumbai, 2000.4
This chapter describes the prevalent environmental conditions and their trends,mainly for Greater Mumbai, as most of the sub-projects of MUTP are located in thissub-region. Details of the primary data on air quality, noise and traffic collected as a
1 Environmental Status of MMR by AIC Watson Consultants, Mumbai, May 19972 Environmental Status Report of MCGM for the years 1997-98, 98 -99 and 99-2000.3URBAIR - Urban Air Quality Management Strategy in Asia, World Bank Technical Paper No. 381, 1997.4 Final Report on Tasks 1 and 2: study for strengthening the Air Quality Monitoring Network Operated by
BMC prepared by Environmental Management Centre, Mumbai, November 2000.
3-1

Mumbai Urban Transport Project Consolidated Environmental Assessment
part of the sectoral Level and Micro- Level Environmental Assessment (SLEA andMLEA) are described in the relevant sections.
3.2 ENVIRONMENTAL STATUS OF MCGM
3.2.1 Land Use
Geographically, MMR lies in the North Konkan region, which lies between 18°33' and19031' north latitude and between 72°45' and 73028' east longitude. The regionconsists of mainland of North Konkan and two large insular masses of Salsettle -Trombay and Mumbai separated by shallow creeks and tidal marshes.
Map showing the current land use pattern of MMR is given in Figure 3.1. As seen inthe figure, Greater Mumbai consists of the maximum built up area. Built-up andindustrial areas have increased considerably in Vasai - Virar belt along the westerncorridor and at various towns along the Mumbai - Pune corridor. Environmentallysensitive locations in Greater Mumbai are mainly the coastal stretches, some ofwhich have mangroves and the Sanjay Gandhi National Park of 103 sq. km. havingdense forests.
3.2.2 Climate And Meteoroloav
Mumbai has a mean elevation of 11 meters above sea level. The city experiences atropical savanna climate with monthly humidity ranging between 57-87%. The
annual average temperature is 25.3 0C rising to a maximum of 34.50C in June and aminimum of14.30C in January. Average annual precipitation is 2,078 millimeters with34% falling in the month of July.
The di *rsion of air pollution emissions in the region is influenced by windconditions (direction and speed), mixing heights, stability of atmosphere, collectivelytermed as the Meteorology of Mumbai's airshed. Meteorological data is thereforeessential to understand spatial-temporal distribution of pollutants.
Meteorological stations of Indian Meteorological Department (IMD) are located atSantacruz and Colaba. The measurements include measurements of wind speedand direction, humidity and temperature and vertical temperature profile recorded bysending a balloon, two times a day. Table 3.1 provides an Analysis of WindPattern in Mumbai.
3-2

2 g dl, t-S g ahlvk2;:i
a~ c c
_t~~V - .
X *>< r-
~~~~~~*frt~f~IX ,~ '-.... . . . I..

Mumbai Urban Transport Project Consolidated Environmental Assessment
Table 3.1 Analysis of Wind patterns in Mumbai
Summer Monsoon WinterPre-Noon Post-Noon Pre-Noon Post-Noon Pre-Noon Post-NoonNorth-South North-West to South-West Again South- Direction is Starting withchanging to North-South and West West and between North-WestNorth-east are the West are the North and and staying
Constant dominant dominant North-East on with higherConstant direction of directions directions. that moves speeds of 10direction of North-West in during gradually to to 14 kmphNorth-West in May. monsoon. North-EastMay. by noon.
Lowest speed is Wind speeds Wind Wind speeds Speeds lowof 6 kmph and vary typically speeds are are between between 6range is between between 6 to 10 to 12 14 to 16 to 8 kmph6 to 8 kmph 16 kmph kmph. kmph. increasing(fairly narrow fromrange) Peaks at 16 September In June, midnight to
kmph and shows a turn between 12 to noonthen in the 16 hrs, North-decreases direction to West is also
North-West. dominant.
Septembershows a turnin direction toNorth-West. I
(Source: Final Report on Tasks I and 2: study for strengthening the Air Quality Monitoring NetworkOperated by BMC prepared by Environmental Management Centre, Mumbai, November 2000.)
Note: The directions mentioned indicate the direction from where the wind is blowing.
3.2.3 Ambient Air Quality
3.2.3.1 National Ambient Air Quality Standards
Table 3.2 given below shows National Ambient Air Quality Standards (NAAQS) asnotified by the Central Pollution Control Board. Pollutants concerned are sulphurdioxide, nitrogen oxides, carbon monoxide, suspended particulate matter, respirableparticulate matter, for residential, industrial and sensitive area.
3-4

Mumbai Urban Transport Project Consolidated Environmental Assessment
Table 3.2 National Ambient Air Quality Standards
Pollutants Time Concentration in ambient air Method ofWeighted Industrial Residential Sensitive measurementAverage Area Rural & other Area
areasSulphur Annual 80 pg/rn3 60 jlm 3 15 - Improved West andDioxide(SO2) Average* Geake Method
24 hours** 120 jg/mr 80 pg/mr 30 g/r - Ultraviolet FluorescenceOxides of Annual* 80 pg/m3 60 pg/mr 15 pg/mr - Jacob & HochheiserNitrogen as NO2 24 hours" 120 gg/m 80 Lg/M 30 .gfm Modified (Na-Arsenite)
Method- Gas PhaseChemilurninescence
Suspended Annual* 350 ,Lg/mi 140 gg/m3 70 Ag/M3 High Volume Sampling,Particulate 24 hours* 500 Itg/ 200 pg/mr3 1 /m (Average flow rate notMatter (SPM) less than 1.1 m3/minute)Respirable Annual* 120 pg/mr 60 pg/mr 50 gg/m3 Respirable particulateParticulate 24 hours** 150 Lg/m3 100 ug/rn 75 g/r matter samplerMatter (PM10)size less than 10
Pm) ILead (Pb) Annual* 1.0 gg/m 0.75 pg/rn3 0.50 pg/M3 ASS Method after
24 hours** 1.5 gg/m 1.00 pg/m3 0.75 g/r sampling using EPM2000 or equivalent Filterpaper
Carbon Annual* 5.0 mg/m 2.0 mg/ma 1.0 mg/m" Non dispersive infra redMonoxide (CO) 24 hours"* 10.0 mg/ m 4.0 mg/m 2 mg/rn SpectroscopyAmmonia Annual* 100 pg/M3 100 pg/Mr 100 pg/r
24 hours** 400 pg/rn 400 "g/r 3 400 pg/mr
* Annual Arithmetic mean of minimum 104 measurements in a year taken twice a week 24 hourly atuniform interval.
** 24 hourly/ 8 hourly values should be met 98% of the time in a year. However, 2% of the time, itmay exceed but on two consecutive days.
NOTE:1. National Ambient Air Standards: The levels of air quality with an adequate margin of safety, to
protect the public health, vegetation and property.2. Whenever and wherever two consecutive values exceed the limit specified above for the
respective category, it would be considered adequate reason to institute regular/continuousmonitoring and further investigations.
3-5

Mumbai Urban Transport Project Consolidated Environmental Assessment
3.2.3.2 Primary Baseline Ambient Air Quality Monitoring
AIC Watson consultants monitored baseline ambient air quality in 1996 at severallocations in the 4 sub-regions of MMR (Island city, Eastern suburbs, Western suburbsand Rest of MMR), as a part of Sectoral Level (SLEA), Programmatic (PLEA) and
Micro-level (MLEA) Environmental Assessments. The monitoring details arepresented further given in Chapters 4 and 6.
3.2.3.3 Air Monitorinq By Municipal Corporation Of Greater Mumbai (MCGM)
(A) Ambient Air Quality in Residential and Industrial AreasMajor air pollution sources in Greater Mumbai are shown in Table 3.3:
Table 3.3 Sectorwise Emission Load of Greater Mumbai
Sources Percentage Contribution
1998-99 1999-2000
Domestic Sector 1.52 1.5Industrial and commercial 37.15 36.77sectorTransport 61.33 61.73Source: ESR of MCGM for respective years.
With changing economic structure (declining manufacturing activities) and increasingnumber of motorized vehicles, transport sector has emerged as the major contributorof air pollution. This trend is likely to continue.
MCGM monitors ambient air qL-'ity at various residential and industrial areas forS02, NOx, SPM and NH3. MC' used to conduct ambient air monitoring at 18monitoring sites spread all over B.Leater Mumbai till 1999. Figure 3.2(A) shows air-monitoring locations before year 1999. Each location was monitored at least once aweek throughout the year for the above four pollutants. MCGM also publishesEnvironmental Status Reports for each financial year with statistics on variousenvironmental parameters. In January 2000 the ambient air monitoring stations werereduced to 6 locations with sampling frequency of twice a week to meet regulatoryrequirements of national Ambient Air Quality Standards.
Air Quality Trends at Specific Locations
Monitoring results for the years 1998-99, 1999-2000 and 2000-01 were compared todetermine air quality trends in these years.5 As monitoring was done only at 6locations in the year 2000-2001, only these locations are selected for this analysis.These air-monitoring locations are presented in Figure 3.2(B).
5 Environmental Status Report of MCGM for the years 1997-98, 98 -99 and 99-2000.
3-6

AA
~~~~~~~~~~~~~L 0. 9 S// >< / SA A"NW AIR ALT
X2 5CUUA TAM
.~~~~~~~~~~~~~~~~~^ K sU al uE
t ~ ~ ~ ~ ~ ~ ~ ~ ~~~l {! ^ MU
g-t~~~~~~~~~~~~~~~~P C1|L1 uA N
I w M ~~~~~~A14 W
All WION
~~~~~~~~~~TS MAt.lN ED D^ Al TLA #4AmAR
Sz~~~~o n "s wN~~ (UN D~ ~ Alt JOCPM
All ICMAUAL

-~~~~~~~~~~~
rV 0. .>i S ~~~~~~~AVRIENT AIR OUALtITY\ /, ) ~~~M3 Ml/ ONITORING SlA110NS
/ X$ -fi -<A3 WO- L
;t 3 \ / ~~~~~~~~~~~~~~~~~A103 A9NDOF;rRI
gt7 / wN / 3) ~~~~~~~~~~~~~Al 7 TlLAK NAGARg B g j 5 arJ ~~~~~~~~~~~~~~~~~A 1 tWAPAVAI I
t / \ ),' / ~~~~~KERBSIDE AIY O UAIJY MvONITORING
t~~~~~~~~~~~~~~~~~~~~~~V I W! tDADAt A
) \ 9 ~~~~~~~~~~~~~~~~~~M3 NUAHIV
t 9 ~~~~~~~~~~~KL RB3SIDi) AIIR 01~AI [TY M:.(N TORING~~~<av ~~~~~SIAi ONS Of'L RA.LD BY MRCB~
( 9 ~~~~~~~~~~~~~~~~~~~Ml'. Sl(Ni
N~~~~~~~~~~~~~~~~~~~~~~~~~~~~~~~ I I E L M At I % r Al N I;-) 13 IY_ ~~~~~ROAD NLL!Rl (UNDIJI NAAQm)
..... RAII WAY LlNF. G 1 fARf L
- ~~~~~~~~~~~~~~G7 KA1 9ADI VI
O t 2 3 4t km~ G3 BA%LD rA
_ _ _ _ _ _____.____ ____ _

Mumbai Urban Transport Project Consolidated Environmental Assessment
Summarized annual average data for 6 locations is presented in Table 3.4.Histograms of these results are presented in Figures 3.3 to 3.5. The following
conclusions can be drawn from these results:
* Annual average for SO2 varied between 6 to 36 ig/m3 in MCGM area. Highest
SO2 was recorded at Tilaknagar, located north of Industrial belt of Chembur. It isunder the influence of higher level emissions from industries in Chembur and fuelburning in slum area and thus shows highest S02 level. NOx annual averagewas recorded between 13 to 69 pIg/m3 in MCGM area. There was no specific
trend observed for NOx but at Khar and Maravali the annual values cross thelimits. The higher NOx levels at Khar are attributed to heavy traffic while forMaravali it is attributed to industrial emissions in Chembur. During all the threeyears S02 and NOx values at remaining locations are well below the annual
NAAQ standards (60 Rg/m 3 for residential areas).
* Suspended particulate matter values varied between 154 to 388 FIg/m3. Thehighest values were recorded at Maravali that is located in the industrial belt near
Chembur in the eastem suburbs. At all locations the SPM annual values
exceeded the NAAQ annual standards i.e. 140 jig/M3 for all the three years.
• Annual average values for ammonia ranged between 41 and 361 jIg/M3, these
levels are well below the annual NAAQ standards (100 pg/M3) at all stations
except Maravii. The highest level of 361 jig/M3 was observed at Maravali Stationlocated in the industrial belt near Chembur in the eastern suburbs, which may be
due to proximity to Fertilizer Complex.
Table 3.4 Ambient Air Quality at Specific Locations for Last Three YearsLOCATIONS PARAMETERS
( TYPE) 502 (ilm 3/r) NOx (gig/m3) NH3 (99IM:) SPM (Pg/M3)
1998- 1999- 2000- 1998- 1999- 2000- 1998- 1999- 2000- 1998- 1999- 2000-1999 2000 2001 1999 2000 2001 1999 2000 2001 1999 2000 2001
Worli (C)* 23 30.26 22.16 35 34.3 31.25 67 79.67 61.5 270 218 186.1
Khar ( CR) 13 20.87 16.16 48 36.35 69.25 121 78.1 82.58 280 306 290
Andheri 17 26.33 16.16 29 41.48 39.33 67 71.5 67 219 290 230.8
(I/C) I_I
Borivali (R) 6 9.09 6.91 37 22.22 13.91 71 54.43 41.66 252 243 154.8
Tilaknagar - 35.41 22.58 - 46.21 38.75 - 82.45 82.0 - 341 282.2
(C)Maravali (I) 16 27.47 26.33 49 46.21 64.66 330 292.6 361.1 356 424 388
Note: Above yearly averages are taken for financial years (March to April) from ESR of MCGM.C = commercial; I Industrial; R = Residential
3-9
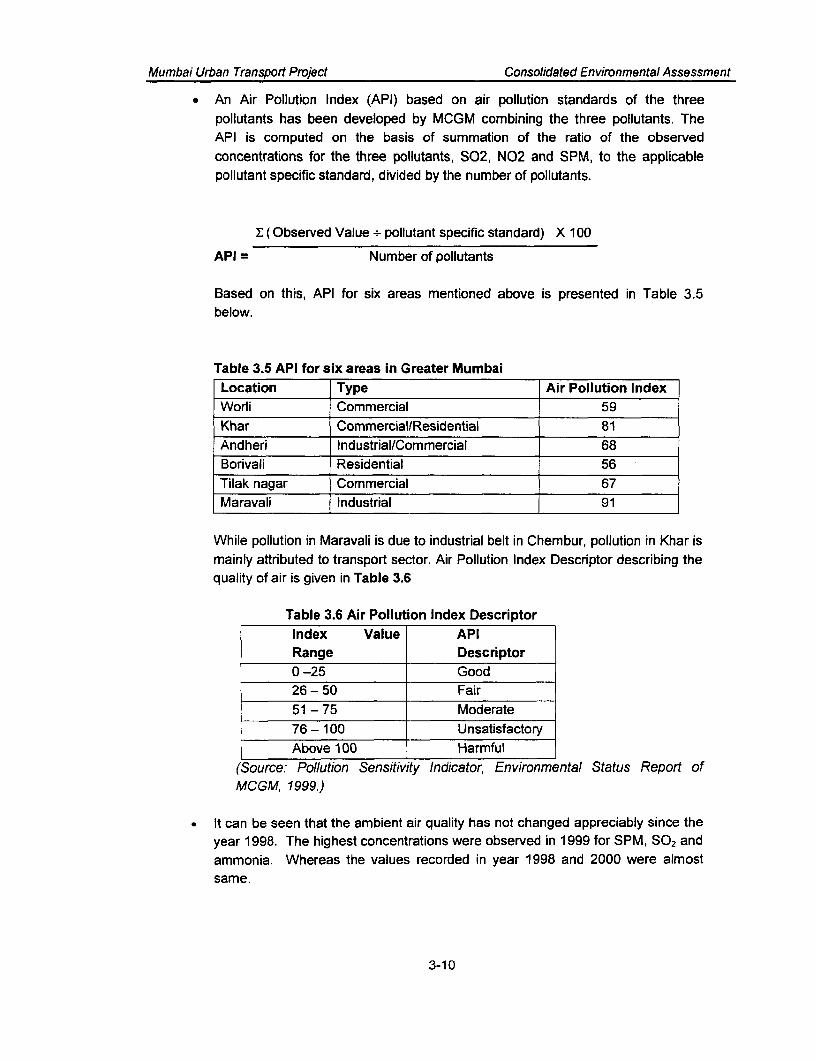
Mumbai Urban Transport Project Consolidated Environmental Assessment
An Air Pollution Index (API) based on air pollution standards of the threepollutants has been developed by MCGM combining the three pollutants. TheAPI is computed on the basis of summation of the ratio of the observedconcentrations for the three pollutants, S02, N02 and SPM, to the applicablepollutant specific standard, divided by the number of pollutants.
E (Observed Value - pollutant specific standard) X 100
API = Number of pollutants
Based on this, API for six areas mentioned above is presented in Table 3.5below.
Table 3.5 API for six areas in Greater MumbaiLocation Type Air Pollution IndexWorli Commercial 59Khar Commercial/Residential 81Andheri Industrial/Commercial 68Borivali Residential 56Tilak nagar Commercial 67Maravali Industrial 91
While pollution in Maravali is due to industrial belt in Chembur, pollution in Khar ismainly attributed to transport sector. Air Pollution Index Descriptor describing thequality of air is given in Table 3.6
Table 3.6 Air Pollution Index DescriptorIndex Value APIRange Descriptor0 -25 Good26 - 50 Fair51 - 75 Moderate76 - 100 UnsatisfactoryAbove 100 Harmful
(Source: Pollution Sensitivity Indicator, Environmental Status Report ofMCGM, 1999.)
It can be seen that the ambient air quality has not changed appreciably since theyear 1998. The highest concentrations were observed in 1999 for SPM, SO2 andammonia. Whereas the values recorded in year 1998 and 2000 were almostsame.
3-10

Mumbai Urban Transport Project Consolidated Environmental Assessment
(B) Air Quality at Traffic Intersections
MCGM also monitors air quality at traffic intersections for SO2, NOx, PM10 and CO onregular basis. Data at three different intersections is given in Table 3.7.
Table 3.7 Air Quality at Traffic Intersections
LOCATIONS PARAMETERS
S0 2 (4g/rM3
) NOx (pg/m ) PM1 o (Pg/m3
) CO (pg/rm3
)
1998- 1999- 2000- 1998- 1999- 2000- 1998- 1999- 2000- 1998- 1999- 2000-1999 2000 2001 1999 2000 2001 1999 2000 2001 1999 2000 2001
Mahim 16 50 40.36 522 419 300.0 451 291 244.0 10.7 9.1 5.91Andheri - 98 100.9 - 520 314.4 - 520 343.0 - 11.9 7.05Wadala 62 35.45 - 446 276.1 - 338 221.0 - 5.4 3.39
Note: Above yearly averages are taken for financial years from ESR of MCGM.
Data Interpretation
* Annual average for PM10 at traffic intersections varied between 221 and 520~Ig/m3. Highest value (533 pg/m3) was recorded in March 2000, at Andheri west.Lowest PM10 value was recorded in August 2000 at Mahim as 116 ,ig/m3. Thesevalues are quite high and well above the PM10 standards for residential andindustrial areas (See Table 3.2 for standards).
* Annual average of Carbon monoxide at traffic intersection is 5.4 to 11.9 4gIm3.Highest (11.9 4g/m3) was recorded at Andheri, which is above the standardsprescribed.
* Annual average for sulfur dioxide at traffic intersections varied between 16 to 100ug/m3. Annual average for nitrogen oxide was between 276 and 522 pg/m3. Thehighest value for NOx was recorded at Andheri in winter.
. At Andheri west traffic intersection all parameters were recorded as highestthrough the year 2000-01 and exceeded the standards.
* The annual average values at traffic intersections for all pollutants were generallyseen to be lower in the year 2000-01 as against 1999-00.
3.2.3.4 Statistical Study by EMC, Mumbai on MCGM Data
The Environmental Management Centre (EMC), Mumbai carried out additionalstatistical analysis, while conducting the study for strengthening Air QualityMonitoring network of MCGM. This analysis, based on the air quality data for 1997 -1999 shows that on an average ambient air quality has not changed appreciablysince the year 1998. However, the variations within the region are quite high as couldbe seen from Fig 3.6, 3.7 and 3.8. These figures present deviation from regionalmeans for S02, NO, and SPM.
3-11

Mumbai Urban Transport Project Consolidated Environmental Assessment
The annual mean values for Greater Mumbai (calculated as average of annualmeans of all monitoring stations in Greater Mumbai) for SO2, NO, and SPM for the
year 1997, 1998 and 1999 are given in Table 3.8.
Table 3.8 Yearwise Reaional Mean Values of Pollutants for Greater Mumbai
Year SO2 |N2 SPM1997 36 24 270
1998 40_ 25 p260<1999 38_ 25 270
Unit: F,g/M3
Air QualitY Trend Analysi
The air quality trend analysis as reported in 'The study for strengthening the airquality monitoring network operated by MCGM, is summarized in the followingparagraphs.
There is a statistically significant downward trend for SPM over the period 1997 to1999 at Mulund, Bhandup, Ghatkopar, Mankhurd, Aniknagar, Sion and Worli.However, almost at all the stations in Mumbai there is a considerable,exceedence over standards for SPM, the average percentage of exceedencebeing 70%.
• In the case of NOx, no station reports a statistically downward trend. Two stationsviz. Supari Tank and Mankhurd show statistically upward trend during 1997-99.Again stations such as Khar, Sion and Maravali show exceedences; which maylbe attributed to increase in vehicular traffic.
- The monitoring stations at Maravali, Supari Tank, Andheri and Jogeshwari showa statistically upward trend for S02, but the exceedences over standards are onlymarginal, being of the order of 5 to 1 0%.
From the time series representation of the trend of regional means (based onannual averages for the three pollutants NO,, S02 and SPM it is seen that thepast trend is more or less continuing, except that the mean values havedecreased marginally in the past 3 years.
Seasonal Levels of S02
The levels of S02 recorded at different sites in Mumbai are high during winter monthsas compared to those in monsoon. The levels are higher in winter by 1.2-8.7 times ascompared to those in monsoon season, maximum increase recorded at Babula Tankwhich is 8.7 times higher and minimum increase found to be 1.2 times higher atJogeshwari.
3-12

Mumbai Urban Transport Project Consolidated Environmental Assessment
Seasonal Variation of NO,The levels are high during winter as compared to those in monsoon. The levels arehigher by 2.3 to 7 times during winter and maximum increase was recorded at
Bhandup and minimum increase was recorded at Sakinaka.
Seasonal PattemSPM levels are high during winter as compared to those in monsoon. The levels arehigher in winter by 1.7-2.6 times. The maximum increase was recorded at SupariTank and minimum at Babula Tank site.
Please refer to Fig 3.9 for the values of SO2, NO2 and SPM over the years.
3.2.3.5 Ambient Air Monitoring by NEERI
National Environmental Engineering and Research Institute (NEERI) a Govt. of Indiaorganization has been conducting ambient air quality monitoring at some locations inMumbai as a part of the National Ambient Air Quality Monitoring Program (NAAQM).The monitoring has been carried out for different parameter such as S02, NO,, SPM,PM10, H2S, NH3 etc. The annual average data is summarized in the form of graphs inFig. 3.10 to 3.12 for Kabladevi, Parel and Bandra locations respectively. Specificcomments are as follows:
* SO2 and NOx are in general well below the air quality standards at all locations* SPM levels exceed the annual average residential area standards of 140 ,ug/m3.
Highest values were observed in 1997 (except Parel). Since 1997 the SPMlevels show a decreasing trend.
. PM10 levels too exceed the annual average residential area standards of 60
gg/Mm3. Here too the highest values were observed in 1997 (except Parel). Since
1997 the PM1O levels show a decreasing trend, although they continue to exceedthe standards.
3.2.3.6 Salient Features of URBAIR Study
The URBAIR study6 for Greater Mumbai was taken up as a part the URBAIRprogram (A World Bank funded project) which aimed at improving air quality of MetroManila, DKI Jakarta, Greater Mumbai and Kathmandu Valley. The URBAIR studylays emphasis on developing Air Quality Management strategy, which takes intoaccount the costs and benefits of proposed actions identified for abating air pollution.The study used the following steps to develop an Air Quality Management strategyfor Greater Mumbai.
- Air quality assessment4 Environmental Damage Assessment* Abatement options assessment* Optimum control strategy
3-13

Mumbai Urban Transport Project Consolidated Environmental Assessment
Assessment were based on monitoring data from MCGM - network of 22 stations,GEMS network operated by NEERI and Maharashtra Pollution Control Board(MPCB) and various other monitoring sites inside and outside Mumbai.
Maior Baseline Findings Were as follows:* The average total suspended particle (TSP) concentration in Mumbai region has
increased considerably since 1980 from 200 p.g/m3 to 250 4g/m3 in 1991.
Maravali and Chembur Naka showed highest TSP levels. Total annual emissionof TSP was estimated to 32,000 tons / year.
* PM10 has not recently been measured in Mumbai. The study by WHO in 1985 on'human exposure to respirable particles' indicated that the concentrations of, andexposure to PM,0 in Mumbai in 1982 were much higher than the WHO air qualityguideline. Total annual emission of PMj0 was estimated to 16,000-tons/ year.
* As per MCGM monitoring (1980 - 87) annual average levels for lead rangedbetween 0.5 to 1.3 Rg/m3 , which exceeded the WHO guidelines. From 1980 to1987, average concentration in the air nearly doubled.
* NOx increased by about 25 % while, sulfur dioxide concentration declined due toincreased use of natural gas and low sulfur coal.
3.2.3.7 Overall Conclusions
All above studies point out that S02, NOx are generally well below the NationalAmbient Air Quality Standards (NAAQS) at residential and industrial locations. NOxlevels however substantially exceed the standards at traffic intersections, as shownby monitoring done by MCGB. Also SO2 and NOx levels have not changedsignificantly since 1996 when ambient air quality was monitored for SLEA, MLEA andPLEA purposes.
All studies have shown that PM1,9 and SPM exceed the NAAQS at almost allresidential and industrial locatio:- and also at traffic intersections. For both SPM andPM10, the highest values were observed in 1997 (except Parel). Since 1997 bothpollutants show a decreasing trend, although they continue to exceed the standards.It is clear, that a comprehensive strategy is needed to bring levels of SPM and PM10
within levels of NAAQ standards gradually over the years.
6 URBAIR - Urban Air Quality Management Strategy in Asia, World Bank Technical Paper No. 381,1997.
3-14

Mumbai Urban Transport Project Consolidated Environmental Assessment
Fig. 3.3 Annual Trends of SO2 in MCGM area
t 70
0 50* 40~30-*~20 -
10 0
~~,O~
0 02 1998 * S02 1999 0 S02 2000 0 S02 Annual Standard
Fig. 3.4 Annual Trends of NOx in MCGM area
-|80
E so6' £,o'5\>g9¢2 &
70
60so
.2 40
tU 30
100
01998 U 1999 02000 0 Annual Standard
3-15

Mumbai Urban Transport Project Consolidated Environmental Assessment
Fig. 3.5 Annual Trends of SPM in MCGM area
500 -
400-
i 300 -.2
200
C) 1000
C.) 0
>o9 0:0t%
,01998 *1999 02000 OAnnual Standard
Fig. 3.6 Deviation of SO2 from RegionalMean
90 Values of Regional Mean = Kharc3 80 *Andheri
E 70 O Borivali
_OMaravali5040
so30
20
01997 1998 1999 2000
Year
3-16

Mumbai Urban Transport Project Consolidated Environmental Assessment
Fig. 3.7 Deviation of NOx from RegionalMean
70 -E
60- Values of Regional Mean
*S 0 50
.240
30
20
010
0
1997 1998 1999 2000
YearO Khar *Andheri OBorivali OMaravali
Fig. 3.8 Deviation of SPM From RegionalMean
|500 Regional MeanEg 400-
C 3000
200
~1 00C.0 0,c I :f
1997 1998 1999 2000
Year
OKhar *Andheri o Borivali OMaravali
3-17

Mumbai Urban Transport Project Consolidated Environmental Assessment
Fig. 3.9 Trend Of Pollutants Over The Years
400
- 350 t_ _
300
*, 250
.° 200
c 150
o 100
50 _ _
so0
1978 1980 1982 1984 1986 1988 1990 1998 2000
-- SPM +-N02 + S02 Years
Fig. 3.1 0 Annual Trends of Air Pollutants at Kalbadevi
E 350
3 00 f_ _ /250
0,19 200
_ 150(D
1000 5Q
0
1992 1993 1994 1995 1996 1997 1998 1999 2000
--S02 --&--NOx -iSPM -- PMI0
3-18

Mumbai Urban Transport Project Consolidated Environmental Assessment
Fig. 3.11 Annual Trends of Air Pollutants at Parel
, 300 -Et- 250-
200-
150
c 100
Ooso -=410 50
1992 1993 1994 1995 1996 1997 1998 1999 2000
A S02 A NOx A SPM + PM10
Fig. 3.12 Annual Trends of Air Pollutants at Bandra
450
400
350
E 300
250
200
.0 150
I 100
O0 0 . __ L _
0
1992 1994 1995 1996 1997 1998 1999 2000
+s--S02 A NOx A SPM +A PM10
3-19

Mumbai Urban Transport Project Consolidated Environmental Assessment
3.2.4 Noise Quality
Increasing population and traffic densities have led to increased levels of noise.Noise is the result of a number of activities such as road traffic, aircraft, railways andindustrial and commercial activities. Noise due to traffic (including hawkers) is thepredominant source of irritation.
Noise on account of public processions, festivals, marriage parties, political meetingsand such other activities is also substantial.
Public places like railway platforms, bus terminals and even airport terminals are alsoexcessively noisy. Auto rickshaws, two wheelers and many diesel vehicles generate
high noise levels.
The range of noise levels observed in Mumbai in the years 1997 -99 are represented
in Table 3.9.
Table 3.9 Ambient Noise Quality
AREA Noise levels(dB) In Mumbai C.P.C.B. Standards
1997 1998 1999 Day dB/A Night dB/A
Residential 55 - 85 57 - 82 46 - 113 55 45
Commercial 62 - 86 72- 80 58 - 113 65 55
Traffic near Industrial Area 70 - 88 72 - 88 70 - 103 75 70
Airport area 92 - 94 78 - 90 86 - 103 65 55Silence zone - 54 - 60 48 - 85 50 40
Source: ESR of MCGM, 1997-98 to 1999-2000
Noise levels in Mumbai were observed to exceed the CPCB ambient noise standards.
3-20

Mumbai Urban Transport Project Environmental Assessment
3.2.5 Ecological Status
Coastal Areas
The environmentally sensitive locations in Greater Mumbai are mainly the coastalstretches, some of which have mangroves and the Sanjay Gandhi National Parkhaving dense forests.
Wetlands and Mangroves
Mumbai's coastline exhibits beautiful natural mangrove vegetation. The flora consistsof Bruguiera, Excoecaria candiria, Sonocia sps. and Sonneratia apetala, Rhizophoramucronata and Avicinia apatala. Avicinia apatala is commonly available aroundThane, Diwa, Mahim Creek and Thane Creek. CRZ Regulations, 1991 provide forprotection of mangroves. As required by the CRZ Regulation, 1991, Coastal ZoneManagement Plan (CZMP) for Greater Mumbai has been prepared by GoM andapproved by MoEF. The Coastal Regulation Zones (I, II and l1l) are shown in Figure3.13.7
Forests and Wildlife
As per the sanctioned Regional Plan for Mumbai Metropolitan Region Area (1996 -2011) the total forest area is 1090.62 sq.km, which is 25.75% of the total land area.The area can be classified as given below:
These forest resources are under pressure due to illicit felling of trees, encroachmentfor agriculture and fuel purposes. The National Parks and Sanctuaries located in theMMR are listed in Table 3.10.
The coastal wet lands, forests and natural reserves in MMR are shown in Figure3.14.
7 CRZ I - a) Areas that are ecologically sensitive and important; b)Area between the Low Tide Line andHigh Tide Line.CRZ II - The areas where buildings and infrastructure have already been developed.CRZ IlIl Areas that are relatively undisturbed and those which do not belong to either category I and 11.
3-21

Mumbai Urban Transport Project Consolidated Environmental Assessment
FIGURE 3.13 COASTAL REGULATION MAP
COASTAL ZONE MANAGEMENT PLAN FOR
GREATER MUMBAI
SCALE:I1: 2500
F D D D _ S RA.S
1r_ ~~~~~~~~~~~~~~~~IETAIDD DAODOP,IOEEOA'AOAEDREOOD. D,D?IRAP
>,.,~~~~~~~~~~~EDAOEIODO.WAEtM.MRROD- RDDIDMMM

Mumbai Urban Transport Project Consolidated Environmental Assessment
FIGURE 3.14 COASTAL WETLANDS, FORESTS & NATURAL
MUMBAI URBAN TRANSPORT PROJECT ENVIRONMENTAL ASSESSMENT
RESERVES
23

Mumbai Urban Transport Project Environmental Assessment
Table 3.10 Details of the Natural ReservesName of the National Area in District Principal WildlifePark/Wildlife/Sanctuary/ sq.kmGame ReserveSanjay Gandhi National 103.09 Greater Nearly 43 mammals belonging to 8 naturalPark, Borivali Mumbai orders and 17 families are reported
andThane Animal species in this park include the following
eight endangered species, viz, Panther, Rustyspotted cat, Jungle cat, Jackal, Small Indiancivet, common Palm civet, four horned Antelopeand Mouse deer.
Park has vegetation types ranging frommangrove forests to semi-evergreen forestswhich contains various economical, medicinalaromatic and ornamental plant species
The Kanheri caves, located within the park are ofhigh archaeological value.
Karnala Bird Sanctuary 4.48 Raigad The Sanctuary has southern tropical deciduousvegetationKnown for 150 different species of birds likespotted dove, black winged kite, tailor birds,white backed Vulture, etc.
Mahim Nature Park 0.15 Greater About 40 varieties of migratory birds visit everyMumbai season.
3.2.6 Socio-Economic Characteristics
The report on Regional Plan for Mumbai Metropolitan Region, 1996- 201 1, based ona multi purpose household survey carried out in 1990, presents the following socioeconomic characteristics of the population of MMR:
Demographic and Socio-Economic Profile of MMR
The average household size in Urban MMR is 5.1 with a sex ratio of about 880females per 1,000 males. About 60% of households have between 4 and 5 memberswhile about 20% are single member households. Navi Mumbai has the lowestaverage household size of 4.3.
Mother tongue of nearly 50% of the households is Marathi followed by Gujarati(15%), Hindi (9%) and Urdu (6%). Western suburbs of Mumbai display a highlycosmopolitan nature.
About 46% of the households are migrants. Of these, about 20% have settled inMumbai during the past 10 years. Migrants with their origins in rural areas constituteabout 65%. About 57% of the migrants are from outside Maharashtra.
3-24

Mumbai Urban Transport Project Environmental Assessment
Unemployment is not a serious problem. Only about 5% of the total work force areon the lookout for employment. The average number of earners per household is1.7. Among all households the average income is Rs.2, 600 per month. Assuming amonthly income of Rs.1, 000 as the poverty level, about 23% of the households arein this category against 7% who have an income of over Rs.5, 000 per month.
Health
The environmental health status of Greater Mumbai is largely affected by the fact thathalf of its population lives in slum colonies or pavements. Slum dwellers suffer fromthe exposure to air pollution in form of smoke, foul smells from municipal garbage &dumping grounds, traffic pollution and noise pollution. It is observed that majority ofthe slum and pavement dwellers are susceptible to diarrhoea, dysentery, typhoid,jaundice, colds and coughs, flu, bronchitis and asthma.
The health status of the general public has also been reported to be affected inindustrial and congested traffic areas of Mumbai. Notable among these is Chemburarea with heavy industries. Malaria is perceived as a major health-related problem.As regards other ailments, Gastro-intestinal disorder, pregnancy related andrespiratory problems are acknowledged as the more common ones. The causes forthe health problems are attributed to open drains mosquito menace and to airpollution. Accumulated garbage is also perceived as an important factor leading topoor health.
Studies in Mumbai have shown that effect of gases and particulate matter fromvehicles and industries is manifested in the respiratory diseases in the people eitherworking in or staying near the source of pollution.
Socio- Economic Characteristics of PAHs
MMRDA has prepared a Resettlement Action Plan (RAP) for the PAHs to alleviatethe adverse social impacts associated with the implementation of MUTP. In MUTPabout 19000 families are likely to be affected and will require settlement.
Out of the total number of 19228 PAHs, baseline survey in case of eight subprojectsinvolving 15267 PAHs has been completed. For the remaining sub projects thesurvey work is in progress. From the available data the principal characteristics ofthe PAHs can be deduced as follows:
* More than 99% of the PAHs are squatters and do not have any tenurial rights ofthe land they occupy. Less than 1% of PAHs are legal owners or tenants of theland or buildings they occupy.
* The monthly mean household income is Rs.2943, which is 1.8 times the officialpoverty line for the urban household, 35% of the households are below thepoverty line.
3-25

Mumbai Urban Transport Project Environmental Assessment
* The average household size is 4.06. Nearly 13% of the households are women-headed. The percentage of workers to total population is 36%. Out of the totalworkers, a third are self-employed and a sixth are engaged as casual labour.
* Most of the squatter settlements have drinking water through stand posts,sanitation facilities are by way of community toilets but inadequate in numbers.The maintenance of these facilities is poor. Lack of storm water drainage subjectssome of these settlements to flooding during monsoon. Collection of solid wasteis not satisfactory. Settlements near railway suffer noise pollution and pose athreat to the lives of the residents and to the safe passage of trains. Generally thestandards of health and hygiene leave much to be desired.
* Less than 2% of the PAH belong to the Sc8hedule Tribes. However, that itself isnot an indication of their being 'indigenous people". Though they might haveoriginally belonged to tribal communities in the distant past, as of now they areintegrated with the city life and do not have their traditional habitat or followtraditional ways of life. The social impact of the project on such people wouldtherefore be similar to other PAH's. In any case there is general reluctance toreveal the caste or tribe during surveys and data on tribal origins of PAH's has notbeen included the baseline socio-economic surveys.
Additional details of demographic, social, economic and environmentalcharacteristics based on the baseline survey of 11760 PAHs (out of which 10493are resident households) carried out so far are given in Appendix 3.1.
3-26

SECTORALENVIRONMENTAL
ASSESSMENT


Mumbai Urban Transport Project Consolidated Environmental Assessment
CHAPTER 4.SECTORAL ENVIRONMENTAL ASSESSMENT
4.1 BACKGROUND
MMRDA during 1993 to 1996 undertook preparation of the Regional Plan for MMR1996-2011. On completion of public consultation GoM has approved this RegionalPlan in 1999.' The Regional Plan after carrying out the necessary analysis of theeconomic and demographic trends has arrived at the forecast of population andemployment for the MMR. These are given in Table 4.1 below.
Table 4.1 MMR: Population and Employment ('000)
Sub Region 1991 2001 2011 Growth Rate %Population 91-01 01-11Island City 3175 3000 2825 -0.57 -0.60Western Suburbs 3948 4930 5910 2.25 1.83Eastern Suburbs 2803 3500 4196 2.25 1.83Greater Mumbai 9926 11430 12931 1.42 1.24Rest of MMR 4608 7056 9510 4.35 3.03MMR - Total 14534 18486 22441 2.43 1.96EmploymentIsland City 1349 1320 1271 -0.21 -0.38Western Suburbs 638 863 1241 3.06 3.71
Eastern Suburbs 438 612 881 3.40 3.71Greater Mumbai 2425 2795 3393 1.43 1.95Rest of MMR 798 1344 2040 5.35 4.26MMR - Total 3223 4139 5433 2.53 2.76
The population of Greater Mumbai according to Census 2001 is 11,914,398. This isindicative of the fact that estimates of the Regional Plan are likely to be reasonablyaccurate.
The Regional Plan also provides the estimates of private vehicle ownership, whichwould in turn define the modal composition of the travel demand. These estimatesare given in Table 4.2.
Regional Plan for Mumbai Metropolitan Region 1996-2011, MMRDA, 1996
4-1

Mumbai Urban Transport Project Consolidated Environmental Assessment
Table 4.2 MMR Private Vehicle Ownership
Sub Region 1991 2011 (Low .2011 (High____________________(Actual) Estimates) Estimates)
No of Private VehiclesGreater Mumbai 506959 943676 1214220Rest of MMR 128213 412822 451115MMR 635172 1356498 1665335Vehicles/1000 populationGreater Mumbai 51.1 67.4 86.7Rest of MMR 28.5 50.3 55.0MMR 44.0 61.1 75.0
Private vehicles are thus expected to grow at a rate of 4.95 percent per annum asagainst the population growth rate of 2.19 per cent per annum.
The Regional Plan provides a growth management framework covering followingsectors.
* Industrial Growth* Office Location* Shelter
* Urban Land* Water Resource Development. Transport* Environment 2
* Land use and Development Control.
4.2 COMPREHENSIVE TRANSPORT STRATEGY (CTS)
Concurrently with the preparation of Regional Plan, MMRDA undertook preparationof Comprehensive Transport Strategy (CTS)3 that formed an important component ofthe Regional Plan. The methodology followed for formulation of CTS is depicted inflow chart given Figure 4.1.
Some of the salient findings of the CTS are described below.
Travel DemandThe peak period travel demand as observed during the surveys carried out for theCTS in 1993 and its forecast for 2011 is given in Table 4.3
2 Based on the outcome of the studies carried out under the World Bank assisted Metropolitan EnvironmentImprovement Program.
3Comprehensive Transport Strategy for Bombay Metropolitan Region, Final Report, WS Atkins International inassociation with Kirloskar Consultants Limited and Operations Research Group, July 1994.
4-2

Mumbai Urban Transport Project Consolidated Environmental Assessment
Table 4.3 Peak Period Travel Demand
1993 Percent 2011 PercentTotal Trips 2154860 3260431
Public Transport 1893751 88% 2770691 85%Private Vehicles 148167 7% 289516 9%Taxi and Auto Rickshaw 112942 5% 200224 6%Average Trip Length (km). Public Transport (Average) 15.06 - 12.36 -
* Bus 4.67 - 4.67. Rail 22.15 - 17.72* Private Vehicles 14.17 - 12.10
* Taxi 5.77 - 3.99
The total peak period travel demand is estimated to grow by 51% over 18 yearsperiod from 1993 to 2011.The share of trips by public transport would decrease from88% to 85 %. Although the share of private trips would marginally increase by 3 %, inabsolute numbers private trips would increase by 87% ( from 2,61,109 in 1993 to4,89,740 in 2011). The average trip lengths are likely to decrease on account ofemerging pattern of dispersed employment distribution. Substantially longer tripsalong with significant share in total trips are a clear indicator of significant role ofsuburban rail transport in meeting the travel demand.
4-3

Mumbai Urban Transport Project Consolidated Environmental Assessment
FIGURE 4.1 METHODOLOGY FOLLOWED FOR FORMULATION OF CTS
P Surveys of Travel oDemand and TravelBehavior f
Validation of aMathematical Model
Population and Prediction of Forecast ofEmployment t Travel Demand for .Income andDistribution for _P 2011 Vehicle Ownership201 1 fromRegional Plan
Identifying altemative strategiesto meet the Travel Demand e.g.Public Transport vs. PrivateTransport
Evaluating the an. natives withreference to. Economic Analysis* Financial Sustainability* Environmental Impact* Social (Resettlement Impact)
Translating the preferredalternative into a medium andlong-term investment program.
4-4

Mumbai Urban Transport Project Consolidated Environmental Assessment
4.3 SECTORAL STRATEGY OPTIONS
In order to meet the projected travel demand the CTS identified the three strategic
options. To facilitate comparison with the base level a "Do minimum" option was alsoidentified. (Instead of a commonly used "Do Nothing " option".These four options as identified by the CTS are as follows:
* Do Minimum: This option contained all the committed railway and road projects
as envisaged in 1993.. Public Transport: In addition to all the committed projects of 'Do Minimum'
option, this option contained many railway projects to increase the capacity ofrail transport.
* Public Transportation with Demand Management: The option contained all theprojects of 'Public Transport ' option and demand management measures suchas, cordon pricing and parking control in the Island City.
* Road Investment: In this option, the emphasis was laid on road projects, which
are expected to encourage private vehicle trips. The option also included all thecommitted projects in "Do Minimum' option.
Mumbai has had a series of transport planning exercises from 1962. Each one ofthese had proposed a number of projects, providing a long list of discrete projects.Many of these have not been implemented mainly on account of paucity ofresources. The CTS has therefore divided and regrouped these projects to representthe above strategies. These are described below in further details.
4.3.1 Do Minimum or Minimum Intervention
This option includes rail and road projects, which were underway, or the committedprojects. (Refer Table 4.4.) The road projects were expected to relieve immediatepressure on highly congested road sections. Amongst rail projects it includesestablishment of the MTP rail line to Belapur and its extension to Panvel in NaviMumbai and new rail lines viz. Belapur to Uran and Vashi to Kalva.
Table 4.4 Projects under Do Minimum Option
Sr. No. Projects Location Geographic_ _ j __ _ _ _ _ __ _ _ _ Zone
ROAD PROJECTS1 ROB at Mahimlconnection to SB Marg Mahim Island City
2 Flyover at Dadar on SB Marg Dadar Island City
3 Jogeshwari - Vikhroli link Jogeshwari & Western/EasternVikhroli Suburbs
4 Juhu Tara Road widening Juhu Western Suburbs
5 Improvements to all roads currently of poorquality
4-5

Mumbai Urban Transport Project Consolidated Environmental Assessment
Sr. No. Projects Location GeographicZone
6 New Mumbai road improvements New Mumbai Rest of MMR
7 Dadar W Gyratory* Dadar Island City
8 ROB at Jogeshwari in lieu of L.C.No. 25* Jogeshwari Western Suburbs
RAILWAY PROJECTS
9 Belapur - Panvel line New Mumbai Rest of MMR
10 Vashi - Turbhe - KaNwa for passenger services New Mumbai/ Rest of MMR
Kalwa
11 Belapur- Uran New Mumbai I Rest of MMR
Note: Projects at Sr.No. 3, 7 and 8 though included in the 'Do Minimum" option in CTS thesehave not yet been completed and are included in the MUTP's investment program.
4.3.2 Public Transport or Rail Investment Option
This option includes the projects of 'Do Minimum' and investment to increase
capacities of both the Western and Central Railways through various service
enhancement measures and by constructing new rail corridors. These measures are
as follows:
* Remodelling of trains from 9 to 12 car rakes to increase passenger carrying
capacity,
* Construction of Road Over Bridges (ROBs) on both Western and Central
Railways to avoid interruptions due to level crossings, and thus to reduce
headway time.
* Enhancement of signaling and power supply,
* Capacity enhancement by adding 5th rail link between Santacruz - Borivali and 2
lines between Borivali - Virar,
* New semi terminus facilities at Bandra to allow reversing of trains to cater to
Bandra Kurla Complex, and construction of high-level terminus at Bandra.
* Bandra-Kurla Railway
* Construction of new rail corridor between Wadala and Fort
* Addition of rail corridors to existing lines between Kurla Bhandup and Andheri -
Goregaon.
* Improvement of stations for the accommodation of longer trains and better
passenger circulation, and
* Re-engineering of cars (for more standing capacity) and increase in rolling stock.
4-6

Mumbai Urban Transport Project Consolidated Environmental Assessment
4.3.3 Public Transport + Demand Management
It would not be possible to commensurately increase the road and parking capacity
particularly in the Island City, with the increasing ownership of private. In addition toinvestment in Public Transport, it would therefore be imperative to manage (restrain)the travel demand by private vehicles in the Island City. The demand managementmeasures for Island City identified in CTS study are briefly presented here.
Parking Control:
Parking fee is proposed to be levied for kerbside parking as well as for parkingthroughout CBD from Colaba in South to Marine Lines and Phule Market in North.Regulatory measures are recommended to eliminate double and triple row parking.
Cordon Pricina:
Daily cordon charges at South Island cordons are expected to reduce traffic to IslandCity.
Enhancement of Bus Service:
Cordon pricing and parking control measures would be successful in reducing private
vehicle trips to Island City, only if acceptable alternative public transportation modesare available. Enhancement of bus service in both quantity and quality was seen ascritical to attract private vehicle owners to use the public transport system. A fleet ofair-conditioned buses at prices competitive to the Cordon is suggested.
The road and rail projects under this option are shown under Table 4.5
TABLE 4.5 PROJECTS UNDER PUBLIC TRANSPORT OPTION
No. I Projects Location Geographic ZoneROAD PROJECTS
1 ROB at Mahim/connection to SB Marg Mahim Island City
2 Flyover at Dadar on SB Marg Dadar Island City
3 Jogeshwari - Vikhroli link road Jogeshwari & Western/EasternVikhroli Suburbsl
4 Juhu Tara Road widening Juhu Westem Suburbs
5 Improvements to all roads currently of poor quality
6 New Mumbai road improvements New Mumbai Rest of MMR
7 Dadar W Gyratory Dadar Island City
8 ROB at Jogeshwari in lieu of L.C.No. 25 Jogeshwari Westem Suburbs
4-7

Mumbai Urban Transport Project Consolidated Environmental Assessment
No. I Projects Location Geographic ZoneRAILWAY PROJECTS
9 Quadrupling Borivali - Virar Borivali - Virar Western Suburbs/Rest of MMR
10- 5 line Santacruz - Borivali Santacruz to Westem SuburbsBorivali
11 ResignallinglPower supply strengthening Andheri - Andheri to Westem SuburbsBorvali Borvali
12 ROB at Vile Parle in lieu of L.C. No. 21 Vile Parle Westem Suburbs
13 ROB at Jogeshwari in lieu of L.C. No. 26 & 27 Jogeshwari Westem Suburbs
14 ROB at Kandivali in lieu of L.C. No. 31 Kandivali Westem Suburbs
15 j ROB at Borivali in lieu of L.C. No. 33 Borvali Westem Suburbs
16 ROB at Dahisar in lieu of L.C. No. 34 Dahisar Westem Suburbs
17 ROB at Mira road - Bhayander in lieu of L.C. No. road to Rest of MMR35 . yander
18 ROB at Naigaon in lieu of L.C. No. 36 Naigaon Rest of MMR
19 ROB at Nalasopara in lieu of L.C. No. 38 Nalasopara Rest of MMR
20 ROB at Virar in lieu of L.C. No. 40 Virar Rest of MMR
21 ROB at Chunabhatti in lieu of L.C. No. 1 Chunabhatti Eastem Suburbs
22 ROB at Kurla Kurla Eastem Suburbs
23 ROB at Vikhroli in lieu of L.C. No. 14 Vikhroli Eastern Suburbs
24 ROB at Netivali Netivali Rest of MMR
25 ROB at Katai Katai Rest of MMR
26 Bandra - Kurla (H.L. Terminus at Bandra) link Bandra to Kurla Westem/EastemSuburbs
27 Quadrupling Mankhurd- Kurla Kurla to Eastern Suburbs/Mankhurd Rest of MMR
28 New semi terminus at Mankhurd/Thane area Mankhurd/Thane Rest of MMR
29 Resignalling / Power supply - strengtheningHarbour - I
30 6th Corridor Wadala - Fort Market Fort - Wadala Island City
31 6th Corridor Kurla - Bhandup Kuria - Bhandup Eastern Suburbs
32 6th Corridor Andheri - Goregaon Andher - Western SuburbsGorec;
33 Grade Separation 6th Corridor/5th lane at Bandra - Bandr. ahim Island City/Mahim Western Suburbs
34 Belapur - Panvel line New Mumbai Rest of MMR
4-8

Mumbai Urban Transport Project Consolidated Environmental Assessment
No. Projects Location Geographic Zone35 Vashi - Turbhe - Katwa for passenger services New Mumbail Rest of MMR
Kalwa
36 Belapur - Uran New Mumbai Rest of MMR
37 Diva Jct. - Vasai road Diva - Vasai Rest of MMR
Note: Projects at Sr. No 2,14, 34 have been completed
4.3.4 Road Investment
The focus in this option is on improving the road carrying capacity of the region bytaking up moderate road investment projects, in addition to the road and rail projectsincluded in the 'Do Minimum' option. The major road projects proposed under thisoption include Bhiwandi - Kalyan, Kalyan - Shil, Thane - Ghodbunder, Anik-Panjarpole, Panvel By-pass, Mahape - Shil, Kalwa - Dighe and Santacruz - Chemburlink, Nalasopara - Bhiwandi link, Panvel - Kalyan link, Vasai - Virar NH8 connector,Eastern Freeway and Western Relief Road Completion. The list of projects to beundertaken under this investment option is given in Table 4.6.
TABLE 4.6 PROJECTS UNDER ROAD INVESTMENT OPTION
No. Projects Location Geographic Zone
ROAD PROJECTS
1 ROB at Mahim/connection to SB Marg Mahim Island City
2 Flyover at Dadar on SB Marg Dadar Island City
3 Jogeshwari - Vikhroli link road Jogeshwari & Westem/EastemVikhroli Suburbs
4 Juhu Tara Road widening Juhu Westem Suburbs
5 Improvements to all roads currently of poorquality
6 New Mumbai road improvements New Mumbai Rest of MMR
7 Dadar W Gyratory Dadar Island City
8 ROB at Jogeshwari in lieu of L.C.No. 25 Jogeshwari Westem Suburbs
9 Bhiwandi - Kalyan Bhiwandi to Kalyan Rest of MMR
10 Kalyan - Shil Kalyan to Shil Rest of MMR
11 Kalwa Bridge doubling Kalwa Rest of MMR
12 Thane -Ghodbunder Thane to Rest of MMRGhodbunder
13 Anik - Panjarpole + Link road Anik to Panjarpole Island City/& Sion to Chembur Eastern Suburbs
14 Panvel By-pass Panvel Rest of MMR
15 Mahape - Shil Mahape to Shil Rest of MMR
4-9

Mumbai Urban Transport Project Consolidated Environmental Assessment
No. Projects Location Geographic Zone
16 Kalwa - Dighe Kalwa to Dighe Rest of MMR
17 West Relief road completion Bandra to Dahisar Westem Suburbs
18 Santacruz - Chembur link Santacruz to Westem/EastemChembur Suburbs
19 Nalasopara - Bhiwandi Nalasopara to Rest of MMRBhiwandi
20 Eastern Freeway Ext. Island City, EastemSuburbs & Rest ofMMR
21 Panvel to Kalyan Panvel to Kalyan Rest of MMR
22 W to NH8 Connector Vasai to Virar Rest of MMR
23 Airoli Bridge Airoli Rest of MMR
24 Bandra-Worli bridge Bandra to Worli lslandMhestemSuburbs
Note: Projects at Sr. No. 11,12 and 23 have been completed and projects at Sr.No. 14 and24 are under construction.
Preferred Option
The CTS evaluated these options on the basis economic analysis. ancialsustainability, environmental and social (resettlement) impacts and reco:m MendedPubic Transport + Demand Management IN THE Island City as the most preferredstrategic option.
4.4 ENVIRONMENTAL ASSESSMENT
CTS included environmental assessment of strategic options in a limited way byconsidering vehicular emission loads associared with each option. It did not includeenvironmental impact assessment of individual projects and the associated EMPs. Itwas therefore necessary to undertake environmental assessment at the sector aswell as project level according to the OP 4.01 of the World Bank. MMRDA undertookand completed such an exercise through consultants in 1998.
4.5 SECTORAL LEVEL ENVIRONMENTAL ASSESSMENT
At sectoral level, environmental impacts are seen as arising due to sectoral policies,programs, operations and regulations. Sectoral Environmental Assessment (SLEA)4
refers to the assessment of environmental impacts due to transportation sector as awhole. Thus, it includes the environmental impacts due to physical transportationactivities (transportation through road and rail), government policies and other traffic
4 Sectoral Level Environmental Assessment of MUTP - II by AIC Watson Consultants Ltd., March1998
4-10

Mumbai Urban Transport Project Consolidated Environmental Assessment
management measures. The impacts are synergetic in the sense, that impacts due to
each of the above factors cannot be seen or estimated in isolation.
SLEA is carried out for the four strategic transport options for MMR described in theprevious section. For the purpose of environmental analysis, MMR was divided intofour sub regions - Island City, Western Suburbs, Eastern Suburbs and the Rest ofMMR -- to assess environmental impacts of transport options with respect to each
sub region.
The Island City
There is practically no land available for future development in the city except for the
Mumbai Port Trust land holdings and areas of wholesale markets and textile mills.The development of these patches of land for commercial and residential uses wouldrequire further improvement of service infrastructure, including that of transportation,which is already under strain. This development is envisaged mainly in the easternpart of Island City and is likely to be biased toward commercial sector due to highland prices. The eastern road corridors being already congested because ofcommercial goods traffic to and from the port, the Central Railways would experiencethe burden of transportation due to further development of the area. The economiccharacteristics of the city are also changing from the manufacturing to service sector,which will manifest into change in the nature of employment from blue collar to whitecollar jobs.
In 1980 -90 decade has shown decline in the population of Island City. Thedevelopments of the port land holding may arrest this decline by making landavailable for the redistribution of residential population in the city or by arresting out -migration as a result of increased employment opportunities due to the economicregeneration of the city.
Suburbs
There is potential for infill in the northem suburbs due to which this sub - area maysee increase in population density. Moreover, MMRDA's plan to develop BandraKurla / Mahim Creek area into a commercial complex is likely to create about150,000 jobs. Apart from other land development benefits, the development of thiscommercial complex is expected to reduce vehicle trips between the Island City andsuburbs.
Rest of MMR
The towns along the northern extension of Western railway viz. Mira, Bhayander,Vasai, Nallasopara, Navghar, Manikpur and Virar have essentially grown due to easyaccess to Mumbai by suburban rail corridor. Industrial development has taken placein North - Eastern extension of Central Railway in the towns of Thane, Kalyan and
4-11

Mumbai Urban Transport Project Consolidated Environmental Assessment
Ulhasnagar. There is possibility of improving rail capacity to these areas. As a result,steady growth is expected in this region.
The constraints restricting the growth of New Mumbai are expected to be overcomewith the completion of the MTP rail line to Belapur and its planned extension toPanvel. Water supply in the area is adequate. The relocation of wholesale market tothe area, which is underway, is likely to generate more economic activity in this are.The area has shown increase in the pace of growth during the past few years.
The land use in the remaining parts of MMR is primarily agriculture. In this subregion, Alibag I Pen and areas along the railway corridor from Neral to Khopoli arelikely to grow. There is already a fertilizer plant in Alibag, which is likely to expand.Some more industries may come to the area, as a result of which employment in theregion may increase.
Apart from the sectoral environmental impacts, the individual sub-projects wouldhave localized environmental impacts. For this purpose detailed Micro-levelEnvironmental Assessment (MLEA) of major individual schemes and for groups ofsimilar projects programmatic level environmental assessment of generic sub-projects (PLEA) was carried out.
The remainder of this chapter describes the following:
* SLEA Methodology
* Environmental Evaluation of Sectoral Strategic Options* Environmental Impacts of Flyovers - Sectoral perspective
4.6 SLEA METHODOLOGY
Brief SLEA methodology of various parameters is given below in the concernedsections. Detailed methodology used for SEA is given in Section 3 of Sectoral LevelEnvironmental Assessment Report of MUTP, March 1998 prepared by MontgomeryWatson Consultants Ltd. and is attached as Appendix 4.1.
The four environmental components used for SLEA were:
* Air quality
* Noise
* Ecological. Social
* In addition Transport Service Indicators are also used.
Air quality and noise are the main environmental components that will be impactedby transportation. Since the implementation of individual investment schemes undereach transport option could give rise to ecological and social impacts (particularly
4-12

Mumbai Urban Transport Project Consolidated Environmental Assessment
those related to relocation and rehabilitation of displaced people), these impacts arealso considered in the assessment to identify mitigation measures to be taken up at
sectoral / policy level. A number of indicators / indices are identified to estimate theimpacts on the above four environmental components. In addition, congestion andovercrowding are also transport-related factors that directly affect the passengers'health. These are also captured through appropriate indicators. Table 4.7 lists theindicators that were used for SLEA.
Table 4.7 Environmental Impact lndicatorsmlndices Used in SEAEnvironmental Index Description
Air QualityCO concentration in mg/NM" Ambient CO conc. due to transport option
S02 concentration in gg/NM3 Ambient S02 conc. due to transport optionNOx concentration in l.igINM3 Ambient NOx conc. due to transport option
Pb concentration in .Lg/NMW Ambient Pb conc. due to transport option. Since unleadedpetrol has been introduced this index is no longer valid.
PM1O concentration in gg/NM3 Ambient PM10 conc. due to transport option
NoiseTraffic Noise Index (Day) - TNI % of length of road links exceeding daytime standard(day) weighted by population with 150 m of the curbTraffic Noise Index (Night) - TNI % of length of road links exceeding nighttime standard(night)EcologyEcological Impact indicator (Natural Weighted total area of road/rail alignment intercepted bysystem) El-1 natural ecological system classified into different categories
according to their importance
Ecological Impact indicator (Man- Weighted total area of road/rail alignment intercepted by man-made system) EI-2 made natural systems classified into different categories
according to their importance
Social - R&R impacts Number of displaced householdsService IndicesTraffic efficiency Index Index reflecting efficiency in terms of speed and fuel
consumptionTraffic congestion Index % of link lengths in the sub-regions exceeding the Volume
/Capacity ratioRailway crowding Index Link length weighted Volume / Capacity Ratio
4-13

Mumbai Urban Transport Project Consolidated Environmental Assessment
4.7 ENVIRONMENTAL EVALUATION OF SECTORAL STRATEGIC OPTIONS
4.7.1 Air Quality ImpactsThe following methodology was used for Air quality impact analysis:
* Determining baseline air quality (reflecting air pollution resulting from the baseyear traffic level) of the sub regions
* Estimating vehicular emissions in each sub-regior for each option/alternative for2011
* Simulating dispersion of the vehicular pollutants to estimate resulting ambientconcentration increments for each sub-region and option for the year 2011
* Assessing impacts of the estimated concentration increments on various
stakeholders or target groups by using value function curves for the abovepollutants. (These curves provide a relationship between ambient pollutantconcentrations and the resulting impacts on human health and the environment).
The methodology is summarized in Figure 4.2
Baseline Air Quality
The baseline or base year air quality of the four sub-regions and MMR as a whole isused to assess change in the air quality due to transportation alternatives for thehorizon year 2011. For determining baseline air quality of the 4 sub regions, the subregions were divided into square grids. Air pollution monitoring was carried out in1995 at various locations in each sub region for 3 or more days. The monitoredpollutant concentration values are used to estimate baseline concentrations at thecentre of each grid by using the inverse square weighted interpolation technique.The estimated pollutant concentration values in a grid were then used to determinequality index for each pollutant (CO, NOx, SO 2 , PM10 and Pb) using value functioncurves to represent its potential air quality impacts. Quality index values vary from 0to 1. The baseline values are given in Table 4.8 below.
4-14

Mumbai Urban Transport Project Consolidated Environmental Assessment
Table 4.8 Comparison of Options based on Absolute Values of Air Pollutants
Region Parameters Base Do Public Public Roadyear Minimum Transport Transport Investment(1996) +
DemandManage-
ment
Island City CO(mg/Nm) 4.33 1.16 1.16 0.7 1.04
S02(pg/NM3) 49.72 53.02 53.38 34.01 44.23X XNOx (~ig/Nrn) 22.56 8.55 8.65 4.65 8.55Lead(.ig/Nm3) 0.53 0.00 0.00 0.00 0.00PM1o(pg/Nm3) 1219.21 1157.86 1123.01 713.35 1011.2
Western CO(mg/Nma) 17.1 6.30 4.73 6.61 10.63Suburbs I
S02gMSO )Nm3 24.61 36.12 34.56 37.54 56.79NOx (gNm) 26.87 13.18 12.48 13.72 20.97
Lead( g/Nm3) 0.35 0.00 0.00 0.00 0.00PM10(4ig/Nm3) 803.44 1146.23 1072.62 1191.66 1834.2
Eastern CO(mg/Nma) 17.57 4.45 4.99 4.49 13.70Suburbs
SO ( /Nm3) 34.28 40.83 44.46 41.44 103.47_NO) (pg/Nm') 37.34 16.72 17.53 17.07 42.98Lead(ig/Nm3) 0.32 0.00 0.00 0.00 0.00PM10(4ig/NNm) 964.36 1134.88 1133.92 1194.26 2993.3
Rest of CO(mg/Nmj) 0.2 0.08 0.07 0.07 0.08MMR
SO2(ig/Nm3) 11.78 17.08 17.17 14.37 18.41__NOx (_g_Nm_3) 8.23 4.75 4.58 3.91 4.79
Lead(g/Nm3) 0.36 0.00 0.00 0.00 0.00PM10(Itg/Nm3) 214.16 509.52 292.95 244.54 312.81
4-15

Mumbai Urban Transport Project Consolidated Environmental Assessment
FIGURE 4.2 AIR QUALITY ASSESSMENT METHODOLOGY
Baseline Air Quality/ Vehicular Vehicular Emission for Year 2011Emission for Base Year
Estimating vehicular emissions inEach sub-region divided into grids. each sub- region for each option forBaseline concentrations monitored 2011 taking into account improveda various locations in the year1995/96. Baseline concentration atthe centre of each grid wascalculated.Quality index (varying from 0 to 1)determined for all pollutants usingvqhj,*P f,iinr-inn c,irvpq
Air dispersion modelling by RollBack Model to derive impact onthe air quality in for sub regions
Evaluation of options for eachsub region and the MMR
Preferred option for sub regionsand MMR
4-16

Mumbai Urban Transport Project Consolidated Environmental Assessment
4-17

Mumbai Urban Transport Project Consolidated Environmental Assessment
Air Dispersion Modelling Analysis
Roll Back Model was used to estimate pollutant concentrations resulting fromvehicular emissions estimated for each transportation option for base and horizonyears. The choice of the Roll Back model instead of the earlier proposed PAL modelis made because of the simplicity of the former. PAL requires detailed input data,which are not justified for a macro level assessment. Also there are severallimitations in using PAL for this study, which are elaborated in Section 3.4.2 of theearlier SLEA Report for MUTP-11, 1998. The Roll Back model can be mathematicallyrepresented by the following equation:
C1/C2 = Q1/Q2
Where,C, = concentration at a given point due to emissions Q1
C2 = concentration to be estimated at the same point due to emissions Q2
C2 = (C1/Ql).Q2
Thus, if C, and Q, are known, C2 can be estimated for different values of Q2.
For the application of the above model, MMR region was divided into various grids.Vehicular emissions for each grid were estimated using the emission factorsrecommended by Indian Institute of Petroleum (IIP) and Ministr f Environment andForests (MoEF), and link wise traffic volume and compositic for each transportoption. Traffic volume and composition (base year and horizon years) for eacht --nsportation option were obtained from the CTS model (WS Atkins study). The linkwise traffic volumes (vehicle kms.) were assigned to each grid based on the linklength being intercepted by the grid. The model was calibrated using air quality datamonitored at various locations. The model estimated pollutant concentrations for thefour sub regions and for each of four transportation options The results arepresented in Table 4.8. This was used to then predict overall quality indices of the
pollutants.
Conclusion
The key findings are as follows
* Baseline levels (1996 levels) of all pollutants except PM10 were well below theNational Ambient Air Quality Standards (NAAQS). Baseline PM10 levels variedbetween 214.16 1Lg/m3 in Rest of MMR to 1219.2 pig/M3 in the Island City.
* Predicted PM10 levels (for year 2011) were found to decrease (as compared tobaseline levels) in the Island City and increase in Eastern and Western Suburbs.All predicted PM10 levels exceed the NAAQS. This is because improved fueland other measures will not affect PM,o emissions substantially. Levels ineastern and western suburbs will increase due to increase in vehicle kilometers,
4-18

Mumbai Urban Transport Project Consolidated Environmental Assessment
whereas it will decrease in the Island City due to reduced population growthclubbed with traffic demand management measures.
i* NOx, CO and Pb. levels were predicted to decrease due to use of catalyticconverters. In spite of substantial increase in vehicle kilometers, proportionateincrease in pollution levels is not seen due to the fact that improved fuel (leadfree, low sulphur) and improved engines (with catalytic converters andcompliance with Euro 11 or Bharat II emission standards) have been assumed.
* SO2 levels were predicted to increase in the eastern and western suburbs dueto growth in population and traffic. The levels were predicted to decrease in theIsland City for the PT+DM option, as Island City is already congested with littlepossibility of population and traffic growth.
*n It was concluded that the PT+DM option performed better for the Island City andRest of MMR and the PT option performed better in the eastem and westernsuburbs.
4. 7.2 Noise Impacts
The following steps were used to determine noise impacts of the transportalternatives in the four sub regions and MMR as a whole. Detailed methodology isgiven in Section 3.6 of the earlier SLEA Report for MUTP, 1998 (Attached inAppendix 4.1).
* Identifying noise indicators and indices
* Estimating traffic composition and volume for road links of each sub region undereach alternative using the Regional Transport Model
* Using an appropriate noise prediction model to estimate traffic related noiselevels for the base year and the planning horizon years under the transportalternatives
* Assessing traffic-related noise impacts on different stakeholders.
Methodology followed for assessment of noise impacts is summarized in Figure4.3.The US Federal Highway Administration (FHWA) model was used for predictingnoise levels at 30 m from the road central line due to each vehicle type (heavy andlight) operating on a road link. The model considered the effect of vehicular volume,speed and noise absorption characteristics of the site on traffic generated noiselevels. Leq for heavy and light vehicles was calculated for each road link by usingthe following mathematical expression.
Leqj (h) = Lei + 10 Log (Ni/S1 . T) + 10 log (15/d) + 8 - 13
where,Leqi (h) = Leq for hours 'h' for the ith vehicle type (heavy or light)L.j; = reference mean sound level for the ith vehicle type
4-19

Mumbai Urban Transport Project Consolidated Environmental Assessment
Ni = number of vehicles of class T passing during time 'T' through a particularroad section
S, = average speed of the ith vehicle class in km/h in the particular road sectionT = duration for which Leq is desired and must correspond to time for which N
is measured.d = perpendicular distance in m from the centerline of the traffic lanes to the
location of the observer.a = factor representing the adsorption characteristics of the ground cover
between the roadway and the observer.5s = Shielding factor provided by noise barriers.
The modelling exercise was repeated for each link of the four sub regions for all thefour transportation alternatives. Traffic Noise Index (TNI) -or day and night as definedin Table 4.9 were used to compare the noise impacts of alternatives.
Table 4.9 Comparison of options based on absolute values of Traffic NoiseIndicators5
Region Parameters Base Year|Options for year 2011(1996) _ _ _ _ _ __ _ _
PT+ DM RI Do PT________ Minimum
Island City TNI (Day) 61.4 63.7 70.3 64.4 64.4TNI (Night) 91.5 98.7 94.7 92.1 95
Western TNI (Day) 51.7 71.1 70.4 69.5 69.5Suburbs I
TNI (Night) 86.4 96.3 93.8 94.2 98.8Eastern TNI (Day) 79 90.8 88.6 74.8 90.1Suburbs
TNI (Night) 94.4 68.8 100 100 63.2Rest of MMR TNI (Day) 30.4 50.1 44 49 49
TNI (Night) 60.3 77.7 80.2 83.4 83
ConclusionsThe key findings are as follows:*. Day time noise impacts were found to be lower in island city under the PT+DM
option. However, the same option gave rise to higher noise levels at night time.
* In western suburbs, all the four options resulted in almost the same level ofnoise impacts during the day tirne.
*. Thus in brief, none of the options performed consistently for the four sub-regions. Day time and night time TNI also showed conflict in vavouring anysingle option.
4-20

Mumbai Urban Transport Project Consolidated Environmental Assessment
Figure 4.3 Methodology for Assessment of Noise Impacts
Identifying noise indicators andindices
Estimating traffic composition and volume
for road links of each sub region under
each alternative using the Regional
Transport Model
To estimate traffic related noise levels for thebase year using USFHWA model and theplanning horizon years under the transportalternatives
Assessing traffic-related noise impacts
on different stakeholders for each
strategic option and for sub regions and
MMR.
Evaluation of strategic options
Preferred option
Traffic Noise Indicator: TNI (Night) = % length of road links in a sub region exceeding night time standards, TNI(Day) =% length of road links in a sub region exceeding day time standards
4-21

Mumbai Urban Transport Project Consolidated Environmental Assessment
4. 7.3 Ecological Impacts
Two types of ecological impacts, direct and development induced were consideredfor the implementation of rail and road projects under each transportation option.Direct impacts resulted from the destruction of flora and fauna due to the constructionof roads or railway lines. Since the introduction of roads and railway lines in a regioncould induce development in hitherto virgin forests and wetlands, such impacts wereassessed qualitatively.
The damage to ecological resources depended on the extent and richness of theseresources at the sites of road or and rail projects. The ecological impacts of thealternatives were assessed at a qualitative level using the following framework.
* Description of location and existing ecological status of the ecologically sensitiveareas through which the relevant road / rail link passes
* Qualitative description of direct and development induced impacts* Mitigation measures to indicate the axtent to which adverse ecological impacts
could be alleviated.
Very few projects identified under the four-transportation options pass throughecologically sensitive areas. Moreover, ecologically sensitive areas like mangroves,wetlands and forests impacted by projects were not unique in features and thetransport projects were not likely to cause any irreversible damage to theecosystems.
Quantitative analysis of the ecological impacts captured the following concepts:
* Damage to an ecological area due to a road or rail alignment will be proportionalto the area covered by road or rail segment in the ecologically sensitive zone.
* Damage will be severe if the ecological area or system is of higher quality.
Ecological indicators for natural and man-made systems were used to estimatequantitative ecological impacts for making comparison of various transport optionswith respect to their ecological impacts. The ecological impact on each of thesystems is measured by adding weighted areas of road/rail alignments traversingthrough the system, where weights represent the quality of the system. Thusecological impact indices for the 2 systems can be expressed as follows:
4-22

Mumbai Urban Transport Project Consolidated Environmental Assessment
El (Natural) = El, = , WniAj
El (Man-Made) = El2 = YWmjAj
Where:Wni = Weight associated natural ecological system of class 1'Wmj = Weight associated man-made ecological system of class 'j'Ai = Total area of road/rail alignment intercepted by natural system of category 'I'Aj = Total area of road/rail alignment intercepted by man-made system of category 'j'.
Detailed methodology including classification of ecosystems with associated weightsis given in Appendix 4.1. Results are given below in Table 4.10.
Table 4.10 Comparison of options based on Ecological Impacts
Region Ecological Impact Indicator Base Year Options for year 2011(El) (1996)
PT+ DM RI Do PublicMinimum Transport
Island El-1 (Natural System) 0 0 0.06 0 0City El-2 (Man-Made) 0 0 0 0Western El-i (Natural System) 0 0.076 0.047 0 0.076Suburbs El-2 (Man-Made) 0.03 0 0 0.03Eastern El-1 (Natural System) 0 0.035 0.017 0.005 0.035Suburbs EI-2 (Man-Made) 0 0.003 0 0Rest of El-1 (Natural System) 0 0.186 0.364 0.063 0.186MMR El-2 (Man-Made) 0.26 0.490 0.2 0.26
ConclusionIn the Island City there are no ecological impacts seen as no new transport projects
are proposed. Projects such as Borivali-Virar quadrupling of rail lines, under the PTand PT+DM options will have ecological impacts in the Eastern and WesternSuburbs of Greater Mumbai. Option RI has the most severe impact on Rest of MMRas many new road projects are proposed in sensitive areas.
4.7.4 Social Impact (Limited to Displacement Of People)
The projects identified under various transport options could give rise to a wide rangeof social impacts as the implementation of some of these projects would requiredisplacement of households and commercial establishments. The number ofdisplaced households and establishments provide a measure of adverse socialimpacts. Hence these are estimated for each proposed project in each sub region.Social impacts for each sub region are organized under three headings i.e. beneficialimpacts, adverse impacts and mitigation measures. These are given in more detailin Appendix 4.1. The number of displacements in each sub region is given in Table4.11.
4-23

Mumbai Urban Transport Project Consolidated Environmental Assessment
Table 4.11 Compariso f options based on R&R Impacts
Region Parameter Base Year Options for year 2011(1996)
PT+ DM* RI* Do Minimum PTIsland City Number of Households c 0 0 0 0
displaced
Western Number of Households 0 5631 1752 1164 5631Suburbs displaced I
Eastern Number of Households 0 1010 7456 0 1010Suburbs displaced _ _
Rest of MMR Number of Households 0 6641 9483 1164 6641displaced
The number of households displaced does not include the persons affected by theproject on optimization of Harbour Line.
Conclusion
The key findings are:* None of the options required displacement of people/households in the Island
City.
* In Western Suburbs, the number of households required to be displaced (5631households) was highest for the PT and PT+DM options.
* In Eastem Suburbs, the RI option required the maximum displacement ofhouseholds (7456 households).
* In rest of MMR, the RI option followed by PT options required the maximumdisplacements. 9483 and 6641 households were estimated to be displaced bythe RI and PT options respectively.
4.7.5 Impact on Transportation Service
Three indices used to reflect impact of transportation options on transportationobjectives were Road Traffic Congestion Index (TCI), Railway Crowding Index (RCI)and Road Transport Efficiency Index (TEI).
Road Traffic Congestion Index (TCI): TCI was designed to measure the level ofservice. Lower value of TCI indicated lower congestion level on roads in terms ofVolume to Capacity Ratio.
Railway Crowding Index (RCI): RCI reflected the extent to which the crowding insidethe trains would reduce under various options. Lower value of the index meant morereduction in crowding and hence a better option.
4-24

Mumbai Urban Transport Project Consolidated Environmental Assessment
Transport Efficiency Index (TE1): TEI captured the concept that vehicles operating
close to their optimum speeds will be fuel efficient and less polluting. TEI value close
to 1 reflected vehicles operating efficiently at or near optimum speeds.
The CTS model outputs were used to determine the above indices. The indices
calculated for the four options are given in detail Appendix 4.1. The various indicescalculated for the sub-regions are given below in Table 4.12
Table 4.12 Comparison of Options based on Transport Service
Region Parameters Base Options for year 2011year PT+ DM* RI* Do PT(1996) Minimum
Island Traffic efficiency 0.47 0.54 0.50 0.48 0.48City Index
Traffic 13 6.9 7.7 12.5 12.8Congestion IndexRailway crowding 2.186 1.078 2.186 2.186 1.078index
Western Traffic efficiency 0.482 0.542 0.559 0.566 0.575Suburbs Index _
Traffic 16.9 13.86 9.2 12.33 12.33Congestion IndexRailway crowding 2.278 1.368 2.278 2.278 1.368index
Eastern Traffic efficiency 0.32 0.49 0.52 0.48 0.49Suburbs Index
Traffic 74.3 16.88 13.3 20.66 16.88Congestion IndexRailway crowding 1.736 1.568 1.736 1.736 1.568index
Rest of Traffic efficiency 0.308 0.41 0.44 0.391 0.413MMR Index
Traffic 81.46 12.86 12.45 14.54 13.83Congestion Index _Railway crowding 1,.442 0.552 1.442 1.442 0.552index
Conclusions* In Island City, PT+DM option performed better w.r.t TCI and RCI transport
service indices.* In Western Suburbs, PT + DM performed better w.r.t TCI and RCI transport
service indices.* In Eastern Suburbs, PT and PT + DM preformed better w.r.t. RCI transport
service index. .* In Rest of MMR PT + DM performed better w.r.t. TCI and RCI, transport service
indices.
4-25

Mumbai Urban Transport Project Consolidated Environmental Assessment
4.8 SELECTION OF THE BEST OPTION
The various impacts associated with each option were evaluated using 13 indicatorsfor 5 major impact areas - air, noise, ecology, social and transport. Since all indicatorvalues were not favourable for any single option, the following three methods wereused to find the most suitable transport option for MMR.
* Decision Matrix Method
* Maximum no. of favorable indicators
* Estimated PM10 concentrations
Individually, each of the above method has limitations for selecting the best option.Therefore, all the three methods were used to narrow down the choice of the bestoption.
4.8.1 Decision Matrix Method
This process involves progressive elimination of options, one by one, in preference toothers, using a set of indicators, one at a time. The set of indicators chosen will beused in the order of their importance. The group related to Transport Service Levelwas given the top priority, as the basic objective was to improve the transport inMMR. This was followed by air quality and noise related indicators. Ecology and R &R were combined together and placed below in the sequence since these impactscould be mitigated through proper mitigation measures. For each group of indicators(decision level) the worst performing option was dropped. The same procedure wasrepeated at all the decision levels leading to the ultimate selection of one option.While proceeding with the decision matrix exercise the following procedure isfollowed:
- Any option eliminated at any decision level in the Decision Matrix will not .be
considered for further scrutiny.- Groups of indicators once used for eliminating an option will not be considered
again unless the decision Matrix process fails to bring out a single best option atth nd of the exercise.
- If itrere is a tie between options at any decision level, all these options arepassed on to the next decision level.
- If at the end of the first exercise, it is not possible to identify a single best option,the entire exercise will be repeated for the un-eliminated options.
Detailed results of the Decision Matrix exercise is given in Section 4.3 of the earlierSLEA Report for MUTP, 1998. Public Transport + Demand Management was thepreferred option in the Island City and Rest of MMR whereas Public Transport wasthe best option in Western and Eastern suburbs.
4-26

Mumbai Urban Transport Project Consolidated Environmental Assessment
Tables 4.13 to 4.17 gives the results for selection of the best options usingDecision Matrix Method for the 4 sub regions. Overall Public Transport +Demand Management is the preferred option for implementation under MUTPProject.
4.8.2 Maximum number of favourable indicators
The Decision Matrix process involves elimination of the options, one by one, on thebasis of their worst performance in respect of indicators, which are arranged in asequence according to their importance. Thus is subjective to some extent.
In the Maximum Favorable Indicator method all the indicators were treated equally inspite of having different importance from environment perspective. An indicator wassaid to be favorable for an option if the value of indicator favored that option most.The option having the maximum number of favorable indicators was treated as thebest option. The analysis was done for all the four sub-regions. Details are given inAppendix 4.1.
In the Island City, Public Transport + Demand Management was the bestoption, since besides promising improvement in all the 3 service levelindicators; it fares well in as many as 9 out of 10 environmental parameters.This option was also the best for rest of MMR and entire MMR.
4.8.3 Estimated PM10 Concentration
The ambient PM,( concentrations in the region, especially Greater Mumbai area, arevery high compared to its ambient air quality standard. Hence PM,0 was consideredas the single most important indicator for evaluating the transport options in the foursub regions.
Conclusions
Table 4.18 summarizes the results of SLEA using the above three selectionmethods. 'Public Transport with Demand Management' emerged as the bestoption for Island City and MMR as a whole. For Western and Eastern Suburbs,'Public Transport' or 'Do Minimum' appeared to be the best options. 'Do Minimum'left much to be desired from the viewpoint of developing the transport sector. Hence,the choice was narrowed down to 'Public Transport' and 'Public Transport withDemand Management'. Both these options had a common set of projects, which laidemphasis on encouraging public transportation. Demand management measureswere important to alleviate congestion and pollution levels in Island City. 'PublicTransport with Demand Management' was recommended for implementation inMMR.
4-27

Munbai Urban Transport Project Consolidated Environmental Assessment
Table 4.13: Selection of Best Option for Island City through Decision Matrix Method.
DECISION SR. ENVIRONMENTAL IMPACT INDICATOR/INDEX BASE YR. DO MIN. PUB. TPT. PUB.TPT+ ROAD INVSTM.LEVEL NO. l l D.MGT.
1 1 Traffic Efficiency ndex __0.7 0.48 054 0.502 Traffic Congestion Index _ ___30 128 69 7.73 Railway Crowding Index ___ 1.078 1.078 2.186
2 4 CO Quality Index _0_46 0.980 0.9755 SO2 Quality Index 0937 _ 0.965 0.9396 NO, Quality Index 076 0.935 0.8997 Pb Quality Index 044_ _ 1.0 I 1.08 PM-10 Quality Index 0_3 0.090 0.055
3 9 Traffic Noise Index (Night) - TNT (night) 914p8_ 983 95.7310 Traffic Noise Index (Day) - TNT (day) 61.40 70.31
4 11 Ecological Impact Indicator (Natural System)-El 1 O ___ 0.0612 Ecological Impact Indicator (Man-made System)-EI 2 O _13 R & R Impacts (Number of house holds displaced) _ O
Result of Decision Level 1 : Do minimum is eliminated
- Result of Decision Level 2 Public Transport is eliminated
|;J 00 00 0;- 7700 Result of Decision Level 3 A tie is observed between Demand Management and Road InvestmentOptions
E| lResult of Decision Level 4 Road is eliminated
Selected Option Public Transport + Demand Management
Note For Indicators/Indices at - Sr.No. 1,4,5,6,7,8 higher values indicate better optionFor Sr. No. 2,3,9,10,11,12, 13 lower values indicate better option
Public Transport + Demand Management is the best option is Island City.
4-28

Mumbai Urban Transport Project Consolidated Environmental Assessment
Table 4.14: Selection of Best Option for Western Suburb through Decision Matrix Method.
DECISION SR. ENVIRONMENTAL IMPACT INDICATOR/INDEX _BASE YR. DO MIN. | PUB. TPT. PUB.TPT+ ROAD INVSTM.LEVEL NO. ___ . D.MGT.
1 1 Traffic Efficiency Index __ 0.482 0.575 0.542 0.5592 - Traffic Congestion Index 16.9 12.33 13.86 9.2
. ___ 3 Railway Crowding Index 2.278 1.368 1.368 2.2782 4 CO Quality Index 0.514 0.954
5 SO2 Quality Index 0.979 0.9666 NOx Quality Index 0.703 0.8467 Pb Quality Index 0.614 1.0
___ 8 PM-10 Quality Index _ 0.066 _ _ 0.0123 9 Traffic Noise Index (Night) - TNT (night) 86.42 _ 96.3
10 Traffic Noise Index (Day) - TNT (day) 51.75 71.134 11 Ecoloqical Impact Indicator (Natural System)-EI 1 0 0.0765
12 Ecological Impact Indicator (Man-made System)-EI 2 0 _ 0.03_______ 13 R & R Impacts (Number of house holds displaced) 0 5631
Repeat 1 Traffic Efficiency Index 0.482 Eliminated 0.575 > Ii Eliminated(2nd round 2 Traffic Congestion Index 16.9 In 15 round 12.33 j .8jj In 1s' round_D.Making) _ 3 Railway Crowding Index 2.278 D. Making 1.368 . t368 D. Making
- Result of Decision Level 1 Do minimum is eliminated
- Result of Decision Level 2 Road Investment option is eliminated
Z Z Z Result of Decision Level 3 Tie is observed between Pub.Tpt & Pub.Tpt + D.Mgt.
I Result of Decision Level 4 Tie is observed between Pub.Tpt & Pub.Tpt + DMgt. Hence Decision Matrix is repeated from DecisionLevel 1
I Result of Decision Level I (repeat): Public Transport + Demand Management option is eliminated.
- Selected Option : Public Transport
Note :1 For Indicators/lndices at - Sr. No. 1,4,5,6,7,8 higher values indicate better optionFor Sr. No. 2,3,9,10,11,12, 13 lower values indicate better option.
Public Transport is selected as the best option at Decision Levell (repeat) in the 2nd round of decision making process.
4-29

Mumbai Urban Transport Project Consolidated Environmental Assessment
Table 4.15: Selection of Best Option for Eastern Suburb through Decision Matrix Method.
DECISION SR. ENVIRONMENTAL IMPACT INDICATOR/INDEX BASE YR. DO MIN. PUB. TPT. PUB.TPT+ ROAD INVSTM.LEVEL NO. _ l D.MGT.
1 Traffic Efficiency Index R__9 0 3 0.49 0.522 Traffic Congestion Index 7? 1688 16.88 13.33 Railway Crowding Index 1.., 1568 1.568 1.736
2 4 CO Qualit Index 0.590 0.956 009465 502 Quality Index _0_397_6 NO, Quality Index 0.703 __0.856 0844_7 Pb Quality Index __b7_ __032 _ IO_8 1PM-10 Quality Index 0.076 0.049 0.053
3 9 Traffic Noise Index (Night) - TNT (night) 94.41 10010 Traffic Noise Index (Day) - TNT (day) 79 90 2
4 11 Ecological Impact Indicator (Natural System)-EI 1 O12 Ecological Impact Indicator (Man-made System)-EI 2 _13 R & R Impacts (Number of house holds displaced) 0____i
- Result of Decision Level I : Do minimum is eliminated
- Result of Decision Level 2 Road Investment Option is eliminated
| I~j WSdl;gql Result of Decision Level 3 Public Transport + Demand Management Option is eliminated
- Selected Option Public Transport
Note: For Indicators/lndices at - Sr. No. 1,4,5,6,7,8 higher values indicate better optionFor Sr. No. 2,3,9,10,11,12, 13 lower values indicate better option.
Public Transport is the best option is Eastern Suburbs.
_L30

Mumbai Urban Transport Project Consolidated Environmental Assessment
Table 4.16: Selection of Best Option for Rest of MMR through Decision Matrix Method.
DEClSION SR. ENVIRONMENTAL IMPACT INDICATOR/INDEX BASE YR. DO MIN. PUB. TPT. PUB.TPT. ROAD INVSTM.LEVEL NO. I_I_D.MGT.
11 Traffic Efficiency Index 0.308 0.413 0.41 0.442 Traffic Congestion Index 81.46 13.83 12.86 12.453 Railway Crowding Index 1.442 0.552 0.552 1.442
2 4 CO Quality Index 0.989_ _
5 SO2 Quality Index 0.989____6 NO4 Quality Index 0.8597 Pb Quaiity Index _ 0.68 PM-10 Quality Index 0.4.13
3 9 Traffic Noise index (Night) - TNT (night) 60.2910 Traffic Noise Index (Day) - TNT (day) 30.41
4 111 Ecological Impact Indicator (Natural System)-E I1 0 018612 Ecological Impact Indicator (Man-made System)-EI 2 0 0.26
_ _ 13 _ R & R Impacts (Number of house holds displaced) 0 0
- Result of Decision Level 1 Do minimum is eliminated
Result of Decision Level 2 Road Investment option is eliminated
L Xj v v v ~1 Result of Decision Level 3 Public Transport Option is eliminated
- Selected Option Public Transport + Demand Management
Note: For Indicators/Indices at - Sr.No. 1,4,5,6,7,8 higher values indicate better optionFor Sr. No. 2,3,9,10,11,12, 13 lower values indicate better option.
Public Transport + Demand Management is the best option is the Rest of MMR.
4-31

Mumbai Urban Transport Project Consolidated Environmental Assessment
Table 4.17: Selection of Best Option for Entire MMR through Decision Matrix Method.
DECISION SR. ENVIRONMENTAL IMPACT INDICATOR/INDEX BASE YR. DO MIN. PUB. TPT. PUB.TPT+ ROAD INVSTM.LEVEL NO. . D.MGT.
1 1 Traffic Efficiency Index _40.395 895 0.4955 0.51472 Traffic Conqestion Index 18.54 13.-_ 12.57 11.5
3 Railway rowding Index 1 9105 1.1,1 5 1.1415 1.91052 4 CO QualityIndex______ 0.784 _ 0.976 0.976
5 SO2 Quality Index 0.957 0.967 0.9776 NO, Quality Index 0_723_0_921 0.9317 Pb Quality Index __0.528 1.0____8 PM-10 Quality Index 0.085 0.039 0.0459 Traffic Noise Index (Night) - TNT (night) _7 3_ _
_10 Traffic Noise lndex Day - TNT (day) 425 - 584 11 Ecological Irnpact Indicator (Natural System)-EI 1
12 Ecological Impact Indicator (Man-made System)-El 2 0. 13 R & R Impacts (Number of house holds displaced) _ O
Result of Decision Level 1 Do minimum is eliminated
Result of Decision Level 2 Road Investment option is eliminated
E Zpg0;0A 0S7- Result of Decision Level 3 Public Transport option is eliminated
Selected Option Public Transport + Demand Management
Note: For Indicators/lndices at - Sr. No. 1,4,5,6,7,8 higher values indicate better optionFor Sr. No. 2,3,9,10,11,12, 13 lower values indicate better option.
Public Transport + Demand Management is selected as the best option for entire MMR.
..A-32

Mumbai Urban Transport Project Consolidated Environmental Assessment
Table 4.18 Best Option for the various regions based on the three selection methods
Region Maximum Number of Method of Decision Based on PM10Favorable Indicators Matrix Concentration
Island City Public Transport + Public Transport + Public Transport + DemandDemand Management Demand Management Management
Western Public Transport Public Transport Public TransportSuburbs
Eastem Do Minimum/Public Public Transport Do Minimum / PublicSuburbs Transport Transport
Rest of Public Transport + Public Transport + Public Transport + DemandMMR Demand Management Demand Management ManagementTotal MMR Public Transport Public Transport + Public Transport + Demand
Demand Management Management
4.9 TRANSPORT DEVELOPMENTS SINCE 1998
After the SLEA study was completed in 1998, some new transport projects havebeen conceived and are in various stages of implementation. Some of these arementioned below:
CONSTRUCTION OF FLYOVERS IN MUMBAI
MSRDC planned to construct about 50 flyovers, out of which 33 have beenconstructed, and the rest are at various stages of planning. The flyovers have beenmainly constructed or planned on highways of MMR - Western Express Highway,Eastern Express Highway, and Panvel Sion Highway. The purpose of the flyovers onHighways is to facilitate uninterrupted flow of traffic in and out of Greater Mumbai. Inaddition, a number of flyovers are planned or are at different stages of construction inthe Island City, to relieve extreme traffic congestion at the intersections.
Except for a few, the flyovers were not part of any of the strategic transport optionsidentified by the CTS study. Yet, MMRDA carried out a comprehensive study onflyovers, which included environmental analysis as well. The study brought forthvarious environmental concerns associated with flyovers, which could have sectoralenvironmental impacts.
4-33

Mumbai Urban Transport Project Consolidated Environmental Assessment
4.10 ENVIRONMENTAL IMPACTS OF FLYOVERS - SECTORAL PERSPECTIVE
The above flyover study provides environmental analysis of the selected flyovers inIsland city. The study does not present the analysis from the sectoral perspective. Asectoral qualitative environmental analysis of flyovers is presented in Appendix 4.2.The sectoral analysis was carried out with a view to identify mitigative measures.
The analysis indicates that the flyovers will marginally change the local air quality andnoise levels due to the redistribution of traffic between flyover corridors and-impeting road links. The shift of passenger trips from public transport to private. hicles due to fl overs will slightly increase air pollution and noise levels, but the
magnitude of shift would reduce with the growth of passenger trips by 2011. Theflyover corridors would lead to more private vehicles and traffic into +ne Island city,thus making demand management for restraining traffic in the Island city imperative.The flyover would be too close to some residential flats in densely populated areas.The people living in these areas would experience visual intrusions, disturbance ofprivacy and exposure to higher pollution and noise levels. The SectoralEnvironmental impacts of the flyovers with respect to air quality, noise and socialimpacts and the mitigation measures identified for flyover impacts are included inAppendix 4.3.
Moreover, although flyovers are likely to encourage use of private vehicles byimproving the intersection capacities, they would not add to the network capacity ofthe roads and parking in congested areas like Opera House, Kalbadevi, Fort, Tardeoetc. "Public transport with demand management" option ther -:)re becomes evenmore critical for encouraging public transportation and restrainiin travel demand inIsland City. In view of these considerations the flyovers would not change thechoice of "public transport with demand management"-as the best strategictransport option for MMR.
4.11 MUTP: INVESTMENT PROGRAM
Since the completion of CTS in 1994 and environmental assessment carried out in1998, as noted below the Tables 4.4 to 4.6 describing the four strategic options,some projects considered to be committed have not yet been taken up forimplementation whereas some projects that were proposed as options have alreadybeen implemented. Nevertheless the investment program proposed under MUTP isessentially a sub-set of the PT+DM Option with some of the projects under "DoMinimum" option also being included. Sub projects of MUTP are described in moredetails in Chapter 5.
4-34

PROJECT bESCRIPTION


Mumbai Urban Transport Project Consolidated Environmental Assessment
CHAPTER 5
PROJECT DESCRIPTION
5.1 DESCRIPTION OF INVESTMENT PROJECT: MUTP
5.1.1 Introduction
The CTS and SLEA described in Chapter 4 have recommended Public Transport +Demand Management (PT + DM in island City) as the most preferred strategic optionfor the MMR.
The strategy followed in designing MUTP is as follows: (Borrower's ProjectImplementation Plan - BPIP, 2001):
1. Placing high priority on investment schemes aimed at promoting public transportparticularly suburban railways.
2. Developing roads and road over bridges in suburban areas and outlying areas ofMMR to relieve road congestion.
3. Relieving congestion in the Island City through Demand Management measures.
However the total investment needs projected by the CTS were Rs. 11298 in 1992prices. This cannot obviously be achieved in a span of 5 years, as the financialcapacity of implementing agencies is limited. The investment program of MUTP istherefore arrived at by considering the economic rate of return on investment ofindividual sub-projects, the level of project preparation and capacity of implementingagencies.
The focus of this section is to present the brief description of the sub-projects to becarried out under MUTP. Since MUTP consists of two main components - rail andRoad, the description of sub-project is also organized in the same manner (sections5.1.2 and 5.1.3). The administrative framework for implementing MUTP is alsoprovided.
A map of MUTP sub-projects (rail and road and traffic components) is presented inFigure 5.1. Also the sub-projects in the Island City and Suburbs of Greater Mumbaiare separately shown in Figures 5.2 and 5.3.
5-1

Mumbai Urban Transport Project Consolidated Environmental Assessment
FIGURE 5.1 MUTP RAIL & ROAD PROJECTS IN GREATER MUMBAI
MUMBAI URBAN TRANSPORT PROJECT ENVIRONMENTAL ASSESSMENT
LUaEND
o TMC
~~IHAN UB
I-
_ @ ROAD & RAIL PROJECTS
2

Mumbai .Urban Transport Project Consolidated Environmental Assessment
FIGURE 5.2 MUTP SUB-PROJECTS IN ISLAND CITY
MUMBAI URBAN TRANSPORT PROJECT ENVIRONMENTAL ASSESSMENT
LEGEND
_ ' s, }. -P , PAO DWA' I
- rX g-,>gg/ -iJ \; fltADe
MUTP- - IS CITY
( ij~~~~~~~~~RA &RALPRJET
. , m; / 'S- I 1ooozerar3

Mumbai Urban Transport Project Consolidated Environmental Assessment
FIGURE 5.3 MAP SHOWING SUB-PROJECTS IN THE SUBURBS OF GREATER
MUMBAI URBAN TRANSPORT PROJECT ENVIRONMENTAL ASSESSMENT
LEGEND
TMC
4 ;/M l
4

Mumbai Urban Transport Project Consolidated Environmental Assessment
MUTP identifies a number of measures and investment schemes to strengthen theroad transportation in Mumbai. These schemes and measures are at various stagesof implementation and can be grouped under the following categories:
> Expanding existing or building new roads* Construction of ROB's* Area Traffic Control* Pedestrian Subways* Station Area Traffic Improvement Schemes* Procurement of Buses
5.1.2 Rail Projects
MUTP places considerable emphasis on improving railway capacity in Mumbai.Various sub-projects identified under this component of the project can be grouped asfollows:
:: Increasing passenger carrying capacity by various railway optimization programs:- Capacity expansion by constructing additional lines
i) Optimization on Western Railway
Running of 12-car rakes on through lines, lengthening of platforms, re-signaling, increased power supply and running of additional services which willrequire induction of 23 rakes of 9-car equivalent.
The proposed optimization will permit 18 trains (9-car) per hour (TPH) on locallines, with all trains running between Churchgate and Borivali and 15 TPH onthrough lines, operated entirely by 12-car rakes, between Churchgate andGoregaon (long distance traffic constrains the service from reaching themaximum feasible of 18 TPH), with 12 TPH continuing to Dahisar and areduced number (probably 9 TPH) continuing to Vasai Road. 6 TPH wouldthen continue to Virar.
Train kilometers would increase by 35%, since the lead of trains is stretchedto cater to demand. New terminals with rationalized layouts are built to relievepressure on existing ones. This sub-project is in progress.
ii) Optimization on Central Railway
5-5

Mumbai Urban Transport Project Consolidated Environmental Assessment
The scope of the project includes reconditioning of track, re-modeling CSTYard and Kalyan yard re-signaling of local corridor, removal of Vikhroli levelcrossing, removal of speed restrictions on turnouts at Dadar, Kurla and Thane,and augmentation of power supply. The re-modeling of CST and Kalyan yardsinvolves the restructuring of the existing tracks to accommodate additionaltrain capacity. Therefore, the sub-project will have no significant impact onthe environment. will have no The proposed package will permit 16 and 12trains per hour on local and through line, respectively, in CST-Kalyan sectionwith the introduction of 19 new rakes, resulting in increase in trains kilometersby 50%.
The proposed package of optimization will permit 16 trains per hour with 9-carrakes on local line and 12 trains per hour with 12-car rakes on through line inCST-Kalyan section. The suburban service pattern includes therationalization of Time Table including removal of trains terminating on runningline (e.g. at Ghatkopar) and withdrawal of slow to fast moves atThane/Dombivii. The rake loading for 9-car equivalent during peak hour wouldbe between 3000-3600 over the section between Vikhroli-Dadar, with theabsolute maximum just north of Kurla. This sub-project is in progress.
iii) Optimization on Harbour Line
The scope of the sub-project mainly includes removal of large number ofhutment, improvement in track and drainage and construction of two ROBs inlieu of level crossings at Seweri and Chunabhatti. This will include inductionof 4 additional rakes and provision of increased power supply.
This package ensures better reliability of operations in the harbor line byremoving the constraints imposed by hutment and level crossing. This sub-project is in progress.
iv) DC/AC Conversion
The scope of the project is to convert existing 1500 v DC traction to 25000 vAC traction for Mumbai suburban railway network. The present DC tractionsystem is unable to cope with the existing services as well as to take up thenew services because of its saturation. Further, there is no space for providingadditional substations although there is additional demand for power due toincrease in number of 12-car rakes, additional services on existing lines andon new lines and other technical necessities. Hence conversion has becomeinescapable. This sub-project is in progress.
5-6

Mumbai Urban Transport Project Consolidated Environmental Assessment
v) Re-manufacturinc of Dual Voltage EMUs
The scope of the project is to remanufacture the existing 50 EMU rakessuitable to run on DC as well as AC traction. This is needed as DC and ACtraction will exist simultaneously till entire suburban section is converted toAC. This sub-project is in progress in the existing railway workshop and hasno significant environmental impact.
Capacitv Expansion by Constructing Additional Lines
i) Provision of Additional Pair of lines between Borivali and Bhavander (9.13 kms)& Bhavandar and Virar (16.87 kms)
There are two corridors (one corridor comprises two rail lines) betweenChurchgate and Borivali: One corridor is exclusively used for suburbanservices whereas the other is used for both suburban and long distanceservices. From Borivali to Virar only one corridor exists servicing bothsuburban and long distance trains. Considering the volume of traffic onBorivali - Virar section, it is proposed to lay on additional corridor betweenBorivali -Bhayander and Bhayander - Virar with EMU car shed at Virar. Thisincludes construction of a bridge of 2.00 Kms length across Vasai creek. Thesub-project includes introducing 8 rakes of 9-car equivalent to increase thecapacity on this line. The alignment of the sub-project is shown in Figure 5.1and 5.3.
The benefits of the projects are:
a. Exclusive corridor for sub urban trains between Borivali and Virar as anextension of Churchgate - Borivali corridor. Providing extra suburbancapacity between Borivali-Virar to cater to increased demand on thissection and allowing existing double line to be used exclusively forsuburban traffic.
b. Improved facilities for long distance passenger and goods trains inconjunction with 5th line between Santacruz and Borivali.
The cost of the sub-project of additional pairs of lines between Borivali -Bhayandar and Bhayandar-Virar are Rs. 1803 million and Rs. 4064 million,respectively. The sub-projects are in progress.
ii) Provision of 5th And 6th Line between Kuria and Thane
5-7

Mumbai Urban Transport Project Consolidated Environmental Assessment
The scope of project includes laying of additional two railway lines betweenKurla and Thane over a length of 16 kms. The pr.. .ct includes introducing 11rakes of 9-car equivalent by addition of this line. This will enhance the capacityof existing suburban system of Central Railway. The alignment of the sub-project is shown in Figure 5.1 and 5.3.
The benefits of this project are:
a. Segregation of suburban and non-suburban traffic between Kurla andThane, thus providing capacity on long distance lines to allow moretrains to a new passenger terminal at Kurla.
b. To bridge the shortfall in capacity of 15000 passengers per hour onthis section in association with optimization on Central Railway andconversion of 9-car rakes to 12-car on local lines.
The cost of the sLu Droject is Rs. 3687 million. Some part of the line iscompleted and R&R have also been carried out. This project is in progress.
iii) Provision of 5th Line between Santacruz and Borivali
The scope of project includes construction of 5 th railway line betweenSantacruz to Borivali covering about 15 kms. Four additional 9 car rakes or 12car rakes service could be introduced on this line to enhance the capacity ofsuburban section of Western Railway. The alignment of the sub-project isshown in Figure 5.1 and 5.3.
The 5 ih line between Santacruz - Borivali is designed to achieve the followingobjectives:
a. Segregation of suburban and non-suburban traffic between Santacruzand Borivali, thus releasing capacity on through lines to allow moresuburban trains and create new route for passenger trains to newpassenger terminus at Bandra.
b. Provision of 5th line will provide additional three suburban 12-car rakepaths from Borivali to Churchgate. The cost of the project is Rs. 1620million. This sub-project is in progress.
5.1.3 Road Proiects
5-8

Mumbai Urban Transport Project Consolidated Environmental Assessment
Road Expansion and New Road Links
i) Joaeshwari - Vikhroli Link Road (JVLR)
This is one of the East - West Link roads recommended by several studies irthe past to relieve the congestion on north - south corridors by providintefficient east west connection. At present it is a 2 lane carriageway which isproposed for upgradation to 3 lane dual carriage way with a central medianThe total length of this link is 10.60 km. The work consists of the threesections described below. The work also includes widening of the severabridges falling in the alignment. The alignment of the sub-project is shown irFigure 5.1 and 5.3.
Section 1: This section between Western Express Highway (WEH) to SakVihar Road (near L&T premises) is of 4.9 kms in length, where the existinc2x1 lane asphalt surfaced road is to be widened to 2x3 lanes.
Section 2: This section between Saki Vihar road to LBS Marg is Of 4.2 Km irlength. This section has already been completed including concretisation of Xx 2 lane width. In this section therefore no further work is proposed.
Section 3: This section between LBS Marg to Eastern Express Highway (EEHwhich is of 1.1 kms in length, is proposed to be widened from the existing 2x1lane concrete surfaced road to 2x3 lanes.
There are also 2 flyovers along the road being implemented by MSRDC. ThEdesigns of the JVLR are prepared incorporating these flyovers to maintain theoverall integrated approach.
The cost of this link road is Rs. 840 million. The detailed designs and tendedocuments have already been prepared for this project.
ii) Santacruz - Chembur Link Road (SCLR)
The SCLR has been proposed as an important east-west road link to reducethe congestion on the north - south corridors, and to alleviate the problem ctraffic congestion around Kurla Station and surrounding areas. Its total lengtlis 5.48 km connecting WEH to EEH. Of the total length, 3.17 km length fronWEH to LBS Marg has been completed. The remaining length of 2.31 kms cSCLR is now proposed to be undertaken of which 570-m long stretch involve!ROB crossing the Central railway tracks north of Kurla. The alignment of th(sub-project is shown in Figure 5.1 and 5.3. The feasibility and detailec
5-9

Mumbai Urban Transport Project Consolidated Environmental Assessment
engineering study has been taken up and the results are expected byNovember 2001. The project is included in MUTP subject to satisfactory EIRR.The cost of this project is estimated as Rs. 830 million. The feasibility studywill include Environmental Assessment.
Construction of ROB's
Construction of the ROBs is crucial for increasing the frequency of suburban trainsunder the scheme of Optimizing of Westem and Central Railways.
i) ROB at Joqeshwari (South)
The proposed ROB, linking SV Road with the WEH will be new 2x3 lanebridge over the Western Railway Lines near the Jogeshwari Railway Station.This ROB will replace level crossing no. 24 & 25 on the Western Railway. Theproposed viaduct structure is 477 m long and the overall length including theapproach ramps and roads is 1,233 m. This ROB will provide a connection tothe Jogeshwari-Vikhroli Link Road on the WEH and will also improveconnectivity between eastern and western suburbs. The cost of the ROB isRs. 405.5 million and EIRR is 12%. The alignment of the sub-project is shownin Figure 5.1 and 5.3.
ii) ROB at Joaeshwari (North)
The proposed ROB linking SV road and WEH will be a new 2x2 lane bridgeover the Westem Railway line north of the Jogeshwari Railway Station. TheROB will replace level crossings no. 26 & 27 on the Western Railway. Theproposed viaduct structure is 482 m long and the overall length including theapproach roads is approx. 1060 m. The cost of the ROB is Rs. 257.8 million.The alignment of the sub-project is shown in Figure 5.1 and 5.3.
iii) ROB at Vikhroli
The proposed ROB linking LBS Marg and EEH, is a new 2 lane bridge overthe Central Railway Lines. This ROB will replace the existing level crossingno. 14 near the Vikhroli Railway Station. The proposed viaduct structure is367 m long and the overall length including the approach ramps and roads is830 m. The cost of the ROB is 260 million. The alignment of the sub-project isshown in Figure 5.1 and 5.3.
Area Traffic Control
5-10

Mumbai Urban Transport Project Consolidated Environmental Assessment
In order to reduce the delays and congestion and improve the traffic flows; an
adaptive area control system has been designed for the Island City ofMumbai. The system will include state-of-the art computer controlled trafficsignal system, vehicle detectors, data communication network and centralcontrol room facility. The computer controlled system will be supported byjunction improvements.
Initially designs will be prepared for 38 junctions covering the CBD and afterreviewing the performance of the first 38 junctions, the system will beextended to other parts of the city. The alignment of the sub-project is shownin Figure 5.1 and 5.2. This sub-project will have no environmental impact.
Pedestrian sub-ways
To reduce the conflicts between pedestrians and the vehicles, which oftenresult in accidents, and to improve overall pedestrian safety, a number ofpedestrian grade separation measures have been proposed on majorcorridors in the Island City and suburbs. The techno-economic feasibilitystudies for these schemes are in progress. The cost of the pedestrian gradeseparation measures is tentatively estimated as Rs. 300 Million. Thealignment of the sub-project is shown in Figure 5.1, 5.2 and 5.3. Thefeasibility study also includes EMP.
Station Area Traffic lmprovement Scheme (SATIS)
The growth of Mumbai has been influenced by the railway system, with largeresidential and commercial areas springing up near the major suburbanrailway stations. Also, the public transport bus and Intermediate PublicTransport (IPT) use the major railway stations as the nodal points in theirroutes. Thus the area near the railway stations are heavily congested withpassengers, pedestrians, shops, parking and a mixed mode of traffic, leadingto major traffic problems. At almost all sub urban Railway Stations there isintensive concentration of inter - modal interchanges between IPT / BESTservices and suburban rail. Therefore for the safe dispersal of commutersSATIS are important.
To improve the pedestrian movements and general traffic circulation, SATISare proposed at 6 stations viz. Ghatkopar, Andheri, Borivali, Dadar, Malad andChembur Stations in MCGM area. The detailed feasibility cum design reportsare being prepared. The cost of the scheme for improvements of the above 6
5-11

Mumbai Urban Transport Project Consolidated Environmental Assessment
stations is estimated as Rs. 300 Million. The alignment of the sub-project isshown in Figure 5.1, 5.2 and 5.3. The feasibility study includes EMP.
Bus Procurement
In order to improve the technological standard of buses and to reduce theemissions, it is proposed to procure 500 buses under the MUTP. The cost ofthe procurement of buses is estimated as Rs.1200 millions.
The BEST has carried out a study with a view to prepare a Business andDevelopment Plan for next 5 years and to define the proposed busprocurement program within the context of this Plan. The Business andDevelopment Plan includes - bus replacement strategy, bus procurementprogram, bus technology, bus specifications, route analysis, operationalimprovement program, comprehensive financial projections includingconsideration of fare policies etc. The Interim Report of the study has beensubmifted to the Bank for comments. Based on the final report of the studyand a decision of the Bank, the bus procurement component under MUTPmay be revised.
This sub-project will not have any direct environmental impact.
Other Programs
The other programs identified under road components pertain to theinstitutional capacity building by way of establishing Traffic Management Unit(TMU) in BMC, improving efficiency etc. These projects are not likely to impactthe environment directly, and therefore, are not discussed here. The programschedule of various projects is provided in Table 5.1.
Environmental impact assessment of the above investment schemes isdiscussed in Chapter 6.
TABLE 5.1 MUTP: STATUS OF IMPLEMENTATION OF PROJECTS
5-12
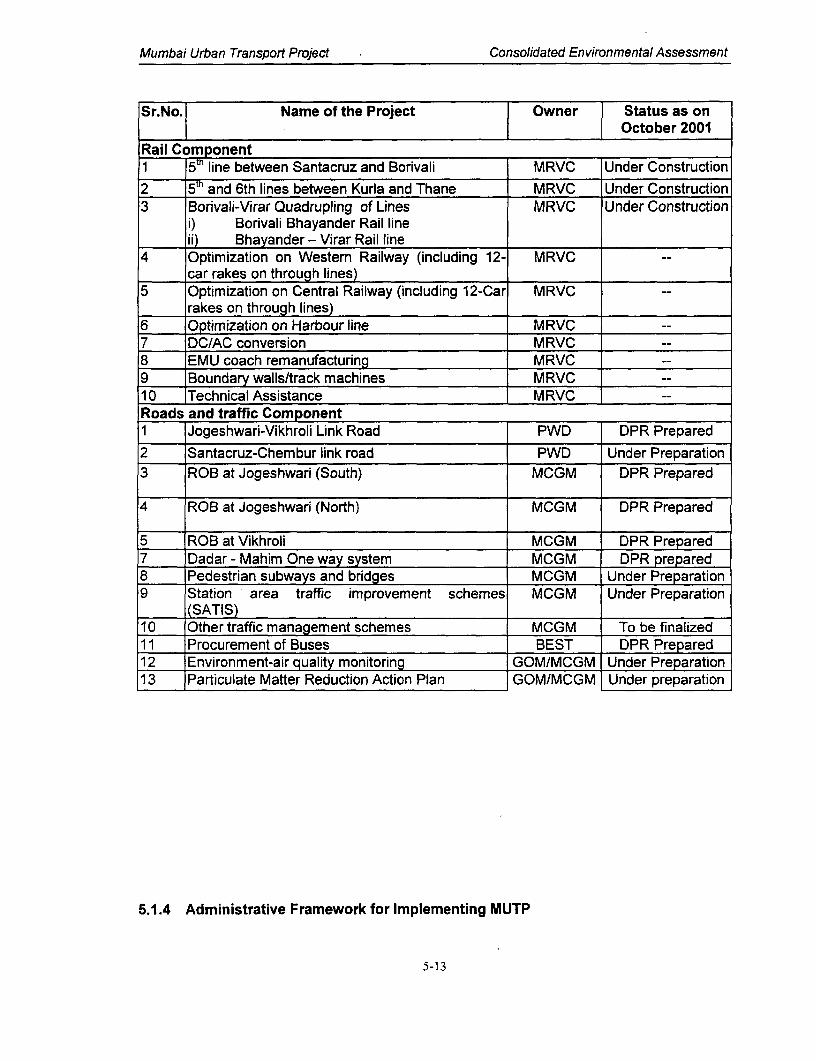
Mumbai Urban Transport Project Consolidated Environmental Assessment
Sr.No.| Name of the Project [ Owner Status as onOctober 2001
Rail Co mponent1 5 th line between Santacruz and Borivali MRVC Under Construction
2 5 't and 6th lines between Kurla and Thane MRVC Under Construction3 Borivaii-Virar Quadrupling of Lines MRVC Under Construction
i) Borivali Bhayander Rail lineii) Bhayander - Virar Rail line
4 Optimization on Westem Railway (including 12- MRVCcar rakes on through lines)
5 Optimization on Central Railway (including 12-Car MRVCrakes on through lines)
6 Optimization on Harbour line MRVC7 DC/AC conversion MRVC8 EMU coach remanufacturing MRVC9 Boundary walls/track machines MRVC10 Technical Assistance MRVCRoads and traffic Component1 Jogeshwari-Vikhroli Link Road PWD DPR Prepared
2 Santacruz-Chembur link road PWD Under Preparation3 ROB at Jogeshwari (South) MCGM DPR Prepared
4 ROB at Jogeshwari (North) MCGM DPR Prepared
5 ROB at Vikhroli MCGM DPR Prepared7 Dadar - Mahim One way system MCGM DPR prepared8 Pedestrian subways and bridges MCGM Under Preparation9 Station area traffic improvement schemes MCGM Under Preparation
(SATIS)10 Other traffic management schemes MCGM To be finalized11 Procurement of Buses BEST DPR Prepared12 Environment-air quality monitoring GOM/MCGM Under Preparation13 Particulate Matter Reduction Action Plan GOM/MCGM Under preparation
5.1.4 Administrative Framework for Implementing MUTP
5-13

Mumbai Urban Transport Project Consolidated Environmental Assessment
MUTP is to be implemented by the Government of Maharashtra (GOM) in associationwith the Indian Railways (IR). The estimated cost of the project is US $ 885.3 millionexcluding price contingencies. About 61 % of the estimated cost is expected to becovered by the World Bank loan to Govt. of India and the remaining is to be financedby GOM, IR and the respective implementing agencies. Mumbai Metropolitan RegionDevelopment Authority (MMRDA) is the planning and coordinating agency forimplementing MUTP.
The administrative set up used for the smooth implementation of MUTP is describedin the following paragraphs. Refer Table 5.2 for the organizational set up forimplementing MUTP.
Table 5.2 Organizational Setup for Implementing MUTP
No. Organization Functions1. MMRDA Implementation of R & R activities for rail
and non-rail components.Co-ordination and monitoring of the overall
_ project.2. Mumbai Railway Vikas Implementation of all rail projects
Corporation (MRVC)3. MCGM Construction of ROBs, traffic management,
environment-air quality monitoring.4. PWD / MSRDC Construction of roads5. BEST Procurement of environment and
passenger friendly buses.6. Traffic Police Department Area Traffic Control System
High Powered Steering Committee
A High Powered Steering CommiKtee has been set up, in October 1999, under thechairmanship of the Chief Secretary, GOM, to provide guidance on various issuespertaining to MUTP. The Committee consists of representatives of the concerneddepartments of GOM, MRVC, IR, MMRDA, BMC, BEST, TMC, Planning Commissionof GOI and Department of Economic Affairs (Ministry of Finance, GOI).
Proiec o-ordination Committee
A Project Co-ordination Committee has been set up, in October 1999, under thechairmanship of the Principal Secretary (1), Urban Development Department, GOM,to review the progress of project preparation and implementation and takemanagement decisions to overcome operational difficulties. The Committee consistsof representatives from MMRDA, MRVC, IR, BMC, PWD, BEST, Traffic Police, TMC,Slum Rehabilitation Authority and NGOs.
5-14

Mumbai Urban Transport Project Consolidated Environmental Assessment
Proiect Management / Monitoring Unit (PMU)
GoM has setup a PMU in MMRDA for overall monitoring, evaluation and co-ordinationof the project. The PMU is the principal implementing and monitoring unit for all theR&R activities, and is responsible for co-ordination and monitoring of the wholeproject. The organizational structure of the PMU, showing the key positions therein, isgiven in Figure 5.4. PMU works in close association with the project implementingagencies. The PMU proposes to appoint Project Management Consultant to assistthe PMU in the preparation of detailed plans, estimates and supervision ofconstruction of houses for PAHs.
PMU will be responsible for keeping overall project accounts for the road and trafficcomponents as well as R&R components, processing disbursement requests,reporting progress and liaisoning with the World Bank. The concerned agencies forthe road and traffic components (i.e. PWD, Traffic Police Department, BMC, BEST)will submit monthly expenditure statements to the PMU to prepare a consolidatedreimbursement claim. Based on these claims, the PMU will advise the GOM torelease the Additional Central Assistance to the concerned agencies, and claimcounterpart funds from MRVC for R&R.
Independent Monitoring Panel (IMP)
The IMP has been established by the GOM and will consist of eminent citizens fromthe Mumbai area in the fields of law, administration, social activity/civil society. Themain responsibility of the IMP would be to ensure that the Bank's policies related tosocial and environmental process are safeguarded. The IMP would operate andinteract at the level of the High Powered Steering Committee.
5-15

Mumbai Urban Transport Project Environmental Assessment
Figure: 5.4 MUTP: Prolect Management / Monitoring Unit
|Independent Monitoring PoneHighPowereTanst M n J. Proc Dctoi I ~~~~~~~~~Chaired by the Chief Secretary l
I| Coordination Committee Chaired by PS, UDD F
| PM U, MM RDAl
- ~~~~~~~~~~It ProJect Dlrectoric
Jt. ProJect DirectorHousing and
Jt. Prolect DirectorJt. Project Director External RelationsSocial Development &Land Acquisition

6ENVIRONMENTAL
ASSESSMENT


Mumbai Urban Transport Project Consolidated Environmental Assessment
CHAPTER 6
ENVIRONMENTAL ASSESSMENT
6.1 MLEA I PLEA METHODOLOGY AND SCREENING RATIONALE
6.1.1 Environmental Assessment
Apart from the sectoral environmental impacts, individual sub-projects would havelocalized environmental impacts. In order to assess such impacts of major individualsub-projects Micro Level Environment Assessment (MLEA) have been carried out.For relatively smaller sub-projects belonging to group of similar sub-projects genericenvironmental assessment has been carried out in the form of Programmatic LevelEnvironmental Assessment (PLEA). Table 6.1 shows the sub-projects and whetherthey are covered by MLEA or PLEA.
Table 6.1 List of Sub-projects Selected for PLEAI MLEA
Sr.No.|Name of the Project Type of EARail Component
1 5th' line between Santacruz and Borivali EMP2 5t and 6th lines between Kurla and Thane EMP3 Borivali-Virar Quadrupling of Lines MLEA
i) Borivali Bhayander Rail lineii) Bhayander - Virar Rail line
4 Optimization on western Railway (including 12-car rakes on through EMPI CEMPlines)
5 Optimisation on Central Railway (including 12-Car rakes on through EMP/ CEMPlines)
6 Optimisation on Harbour line EMP/ CEMP7 DC/AC conversion EMP8 EMU coach re-manufacturing No EA Req.9 Track machines No EA Reg.10 Technical Assistance No EA Req.
Roads and Traffic Comronent1 Jogeshwari-Vikhroli Link Road MLEA2 Santacruz-Chembur link road MLEA3 ROB at Jogeshwari (South) EMP4 ROB at Jogeshwari (North) EMP5 ROB at Vikhroli PLEA6 Dadar - Mahim One way system No EA Req.7 Pedestrian subways and bridges EMP8 Station area traffic improvement schemes (SATIS) EMP9 Other traffic management schemes No EA Req.10 Procurement of Buses No EA Req.
6-1

Mumbai Urban Transport Project Consolidated Environmental Assessment
Sr.No. Name of the Project ITYPe of EA1 1 Environment-air quality monitoring INo EA Req. |12 Technical Assistance, studies training |No EA Req. |
6.1.2 Screening Methodology
For selecting the above sub-projects for MLEA or PLEA, a screening method hasbeen used. For screening, the following parameters were used:
* Sensitive ecological areas* Air and noise pollution* Special physical features which adds to aesthetics* The type of sub-project activities
The screening methodology used six screens based on the above parameters toidentify a sub-project from a group of sub-projects for conducting EA. The summary ofsix screening steps is presented in Table 6.1.
Table 6.1 Summary of Screening StepsScreen Level Screen Function
SCREEN1 . Removes the sub-projects with negligible environmental impacts fromthe selection process and distinguishes the sub-projects which areamenable to PLEA or MLEA
SCREEN 2 . Retains behind the sub-projects for which environmental analysis hasalready been carried out.
SCREEN 3 . Passes on the sub-projects located in ecologically sensitive areas forfurther screening and retains others of the same type. However, ifnone of the sub-projects is located in ecologically sensitive areas, thenall the sub-projects at this level are considered for further screening.
SCREEN 4 . Retains the sub-projects which are not located at sites with major airpollution, noise pollution and health related issues. If none of the sub-projects are associated with these issues, all the sub-projects at thislevel are passed on for next screening.
SCREEN 5 . Examines sub-projects with special features such as visual intrusion,intersection geometry, etc. and allows the sub-projects with specialfeatures to move on for the last screening. Again, if none of the sub-projects at this level has such features, then all the sub-projects aresubjected to SCREEN 6.
SCREEN 6 * Selects the sub-projects for EA after closer examination with respect toconstruction and operational activities
6-2

Mumbai Urban Transport Project Consolidated Environmental Assessment
For the first level screening, the sub-projects were divided into three groups.
The first group comprised those sub-projects, which because of their spread andhence potential for encountering different environmental settings were considered fordetailed or Micro Level Environmental Analysis (MLEA). The sub-projects consideredunder this category were divided into the following -
* Road Widening/Improvements and Upgradations* New Roads* Suburban Railway Transport
The second group had sub projects with similar construction activities and functionand is located in developed urban environmental setting. Therefore, ProgrammaticLevel Environmental Assessment (PLEA) was conducted for one of these sub-projects is adequately indicative of the environmental implications of other sub-projects of the same group. The second group contained the following sub-projects:
* ROBs* Pedestrian subways* Station Area Traffic Improvement Schemes
The third group consists of sub-projects like Area Traffic Control, procurement ofBuses, Optimization of Western, Central and Harbor Railways, 12 Car Rakes whichare not likely to cause any 'direct' adverse environmental impacts. Hence, these sub-projects were not considered for environmental analysis.
Thus, after dividing the sub-projects into three groups, the third group of sub-projectswas straight away eliminated from the selection process at the first screening level.The sub-projects amenable to MLEA and PLEA were passed on to the secondscreening test. The second screen removed sub-projects for which EA wasconducted earlier, and the remaining sub-projects were passed on for the third levelscreening. From the third level onwards, sub-projects with lesser potential for adverseimpacts on specified environmental domains were systematically removed. Thisprocess of screening led to the selection of sub-projects with higher potential foradverse environmental impacts for conducting environmental analysis. The screeningmethodology initially subjected the sub-projects to stringent screening tests, and atthe last stage, screening was based on subtler issues, which required closer look atthe environmental settings of the sub-project.
6-3

Mumbai Urban Transport Project Consolidated Environmental Assessment
6.1.3 Results of Screening
The above mentioned screening methodology led to the selection of the followingsub-projects for MLEA and PLEA.
Table 6.2 List of Sub-projects Selected for PLEA/ MLEASr. No. Selected Sub-project location Type of EA1 Jogeshwari Vikhroli Link Road MLEA
2 Borivali - Virar Quadrupling of Lines MLEA3 ROB at Vikhroli PLEA
4 Pedestrian Subway at CST PLEA5 Thane (W) Station Improvement PLEA
6.1.4 MLEA PLEA Methodology
MLEA
The Micro Level Environmental Analysis (MLEA) was carried out for those sub-projects under MUTP, which required detailed environmental analysis. The detailedanalysis was required as these sub-projects have potential to significantly impact onthe environment and could influence large areas since these alignments traversethrough a variety of environmental settings. These environmental settings includeecologically sensitive areas like forests, mangroves, etc., Also, the sub-projects areexpected to change the traffic pattern in the areas near the alignments. Therefore,depending on the environmental setting, the sub-projects could impact air, water, landand ecological resources. There could also be impacts on the residents living nearthe alignments.
The MLEA of the sub-projects included the following arnlysis.
* Impact on Traffic
* Impact on Land-use* Water Quality Impacts* Air Quality Impacts
* Noise Impacts* Impacts on Ecological Resources* Impacts on the Quality of Life.
Separate MLEA studies were carried out for the Jogeshwari-Vikhroli Link Road andBorivali-Virar Quadrupling of Rail Lines. Additional MLEA for Santacruz-Chembur
6-4

Mumbai Urban Transport Project Consolidated Environmental Assessment
Link Road is being separately prepared. The analysis on each of these sub-projects isbriefly described in this section.
PLEA
The Programmatic Level Environmental Assessment (PLEA) for the above-mentionedsub-projects was carried out in three parts, viz. environmental status, environmentalimpact assessment and mitigation measures. Being highly localized sub-projects, theenvironmental status was determined for an area, which extended up to 150 m fromthe sub-project site. Generic mitigation measures were identified for therepresentative sub-projects so that these could be applied to others of the same type.The PLEA was carried out with respect to various components namely: traffic andtransport, landuse, ecology, peoples perceptions, air quality, noise levels andseverance. Depending on the sub-project type, other relevant impact areas were alsoconsidered. Environmental assessment was also carried out for no-build scenarios inrespect of all the sub-projects.
For predicting air and noise quality, mathematical modeling has been used.
In case of air quality predictions, three models have been used depending on the siteconditions. The models used being:
* CALINE-3, calibrated and suitably adjusted for Mumbai's urban conditions* Box Model* Roll Back Model
The detailed description of these models and calibration details of CALINE-3 is givenin "Report on Air Quality Modeling for PLEA /MLEA, 1996".
The ambient day (6 to 21 Hrs) and night (21 to 6 Hrs) time L.q at different receptordistances from the sub-project site were predicted using the Federal HighwayAdministration (FHWA) model. The model description is presented in "Report on AirQuality Modeling for PLEA /MLEA, 1996". The noise levels during construction phasewere estimated considering the cumulative effect of the individual constructionequipment/activity.
6-5

Mumbai Urban Transport Project Consolidated Environmental Assessment
6.2 MICRO LEVEL ENVIRONMENTAL IMPACT
A) Rail Component
Borivali- Virar Railway Quadrupling of Lines (MLEA)
Introduction
The existing capacity of Borivali - Virar track is highly inadequate to carry the presentpassenger load. Since the potential for growth between Borivali and Virar is high (asno land is available south of Borivali), increasing the line capacity between Borivaliand Virar is expected to at least meet part of the demand. Please refer Fig. 6.3 forlanduse along the tracks. The environmental assessment is presented below. Thissub-project will require environmental clearance under the Coastal Regulation Zone(CRZ) rules.
Existing Environment and Potential Impacts
Land EnvironmentThe proposed alignment passes through level terrain except for a small portion of lowlying and marshy area near Bassein creek. The terrain is underlain by basalt rocks.The area falls under seismic zone no. 1 and is susceptible to minor seismicdisturbances. Soil falls under 'impervious and semi pervious' category and hasmoderate erodibility. The soil is suitable for homogenous embankment.
Potential ImDactsEarth work involving cut and fill will have major impact on the land environment. Theamount of material would be brought from quarries near Dahisar and is estimated tobe equal to 9,08,370 m3. Abandoned borrow pits will create stagnant pools of water.Quarrying will result in loss of top soil and sub soil, and may result in subsidence orcollapse of quarry walls.
Earthwork may further disrupt natural drainage and degrade landscape. The groundclearance for laying the track will result in loss of trees and shrubs.
Water Environment
The proposed track will cross one major water body - Bassein creek-betweenBhayander and Naigaon Stations and two streams - Dahisar River and Jaffery Creek.There are also two small lakes near the proposed alignment near Bhayander andVirar stations.
6-6

Mumbai Urban Transport Project Consolidated Environmental Assessment
The creek near Naigaon railway station has low DO (4.9 mg/I). None of the abovewater sources are used for the purpose of drinking water.
Potential ImDacts
* The proposed construction will not alter the existing water courses.* Construction activities may lead to the siltation of the water bodies. However,
there will be no pollution due to wastewater from the construction labour camps, iflocal labour is made available.
* During the operation phase, wastewater will be generated at platforms whichneeds to be treated suitably before disposal.
Air Quality
The air quality was monitored along the existing Borivali - Virar track at three sitesbetween March 1996 to May 1996. The three monitoring sites were Borivali,Bhayander and Virar. The SO2 and NOx concentrations monitored along the trackwere found to be in the range of 13 - 38 ,ug/m3 and 15 - 52 pg/M3 respectively. Thus
SO2 and NOx standards were not violated.
The SPM concentrations were also found to be in compliance with the standardexcept near Borivali, where the average SPM concentration was found to be 228pg/M3. Thus the area along the track is almost air pollution free.
Potential Impact
Construction activities such as earthwork, rock cutting, transportation of constructionmaterial will increase dust levels in the atmosphere. However, these impacts will beof temporary nature. During the operation stage, there will be no impact on air qualityas electric trains will be operated on the proposed track.
Noise Levels
The noise levels along the track were monitored at the same three sites where the airquality was monitored. Lq values for day time and night time were found to be in therange of 70 -77 dB(A) and 64 - 72 dB(A) respectively. These levels are quite highcompared to the standards for residential areas.
6-7

Mumbai Urban Transport Proect Consolidated Environmental Assessment
Potential lmDacts
The operation of construction equipment, such as, compressors, bulldozers,compactors, cranes, will increase the ambient noise level. These could be the causeof concern for the nearby residents.The increased number of trains will generate more noise along the track once thenew track is opened for traffic. The U.S. FHWA model was used to predict noise dueto train traffic. The maximum increase in noise level over the background levels dueto train traffic near sensitive receptors was estimated to be 1.7 dB(A). Thus, overallincrease in noise due to railway traffic is insignificant.
Ecological Resources
In a detailed ecological survey along the existing track, three types of vegetationfound were: trees planted at or near railway stations; self regenerating weedyvegetation along track between stations; and strips of mangrove plants along thebanks of the creek. The number of plants within the 20 m of the eastem side of theexisting tract was found to be 428. No endangered species were encountered in thearea. However, Avecennia - a mangrove specie in the area - falls under protectedcategory. Some trees along the track are old and are as tall as 15 to 20 m.
Potential ImpactThe trees within 20 m from the track on the eastern side will be lost due to theproposed sub-project. In addition, Zizyphus and mangrove vegetation (degraded aswell as well-grown) will also be lost due to the proposed sub-project. The mangrovevegetation will be lost near Jaffery creek, Bassein creek and the banks of island. Thetotal number of Avicennia marina lost will be 8500.
Land Use
The proposed track passes through a series of settlements, which comprise bothslums and multi-storied apartments. Beyond Dahisar and towards Mira Road, landadjacent to the track is mostly vacant. However, station areas and land away fromthe track are developed. Near creeks, the land is marshy with mangrove growth. Saltpans are also seen along the track between Bhayander and Naigaon. Open landsbelonging to railways is leased for cultivation on a 11 month lease.
Potential ImpactsThe land to be used for the proposed sub-project is already under the possession ofWestern Railways. However, some parts are encroached by slums which will have tobe relocated. Some mangrove patches will have to be cleared. No forest land isinvolved in the sub-project.
6-8
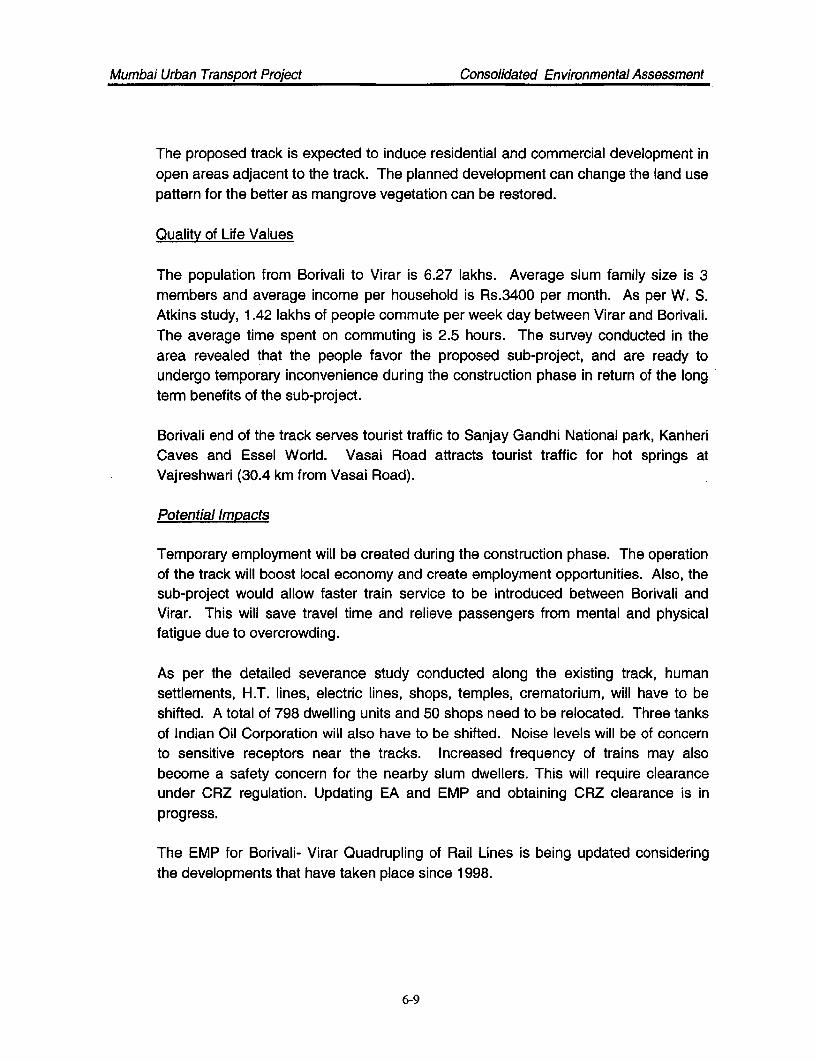
Mumbai Urban Transport Project Consolidated EnvironmentalAssessment
The proposed track is expected to induce residential and commercial development inopen areas adjacent to the track. The planned development can change the land usepattern for the better as mangrove vegetation can be restored.
Quality of Life Values
The population from Borivali to Virar is 6.27 lakhs. Average slum family size is 3members and average income per household is Rs.3400 per month. As per W. S.Atkins study, 1.42 lakhs of people commute per week day between Virar and Borivali.The average time spent on commuting is 2.5 hours. The survey conducted in thearea revealed that the people favor the proposed sub-project, and are ready toundergo temporary inconvenience during the construction phase in return of the longterm benefits of the sub-project.
Borivali end of the track serves tourist traffic to Sanjay Gandhi National park, KanheriCaves and Essel World. Vasai Road attracts tourist traffic for hot springs atVajreshwari (30.4 km from Vasai Road).
Potential Impacts
Temporary employment will be created during the construction phase. The operationof the track will boost local economy and create employment opportunities. Also, thesub-project would allow faster train service to be introduced between Borivali andVirar. This will save travel time and relieve passengers from mental and physicalfatigue due to overcrowding.
As per the detailed severance study conducted along the existing track, humansettlements, H.T. lines, electric lines, shops, temples, crematorium, will have to beshifted. A total of 798 dwelling units and 50 shops need to be relocated. Three tanksof Indian Oil Corporation will also have to be shifted. Noise levels will be of concernto sensitive receptors near the tracks. Increased frequency of trains may alsobecome a safety concern for the nearby slum dwellers. This will require clearanceunder CRZ regulation. Updating EA and EMP and obtaining CRZ clearance is inprogress.
The EMP for Borivali- Virar Quadrupling of Rail Lines is being updated consideringthe developments that have taken place since 1998.
6-9

!|M -
DENSE FOFtST-
SPARSE FOItEST
scwisNm
CMASTAL WITLAND
VASAI CREEK_
HLLOONTOLIR
RAL
RALWAY STATION
LOCA AUTHORWIY BOUNDARY
: EJ4DUE ALONG BORIJL-VIRAR RAILWAY TRACKS
MM: l

Mumbai Urban Transport Project Consolidated Environmental Assessment
B) Road Component
i) Jogeshwari Vikhroli Link Road (MLEA)
Introduction
The Jogeshwari Vikhroli Link Road (JVLR) is an important link between Eastern andWestern suburbs. It connects Western Express Highway (WEH) and EasternExpress Highway (EEH). The road has three sections: (i) WEH to Saki Vihar Road;(ii) Saki Vihar Road to Lal Bahadur Shastri (LBS) Marg; and (iii) LBS Marg to EEH.Please refer Fig. 6.1 for landuse around this road.
The JVLR is proposed to be widened to 3 + 3 lanes having 2 x 11 m carriage waywith 2 m central median and 2 x 2 m wide footpaths. The total ROW will be 30 mexcept for high embankment sections where ROW will be 60 m.
Existing Environment and Potential Impacts
The environmental analysis of the proposed sub-project focused on determiningexisting status and potential impacts of the sub-project on the following environmentalcomponents.
* Land* Water, Air
* Noise
* Ecological Resources* Land Use or Human Use Values* Quality of Life
The main findings of the environmental analysis are presented in the followingparagraphs. The environmental analysis is in the process of being updated to reflectthe changes since the last baseline studies in 1996.
Land Environment
The Western and middle sections of the road pass through slightly rolling terrainexcept the portion beyond lIT, which runs down over a steep slope. The easternsection traverses through almost flat terrain.
6-11

kM.1UP ~~~PLNATIAON OOASU~Lw!T4 :d ;y iY ,,
?aUITRY ~~~~~~~~~WATI W'~O ArTTO 3JUAo I Gtkoli 'o, ,At¶S
R m Op A*|: LANDUSE AROUND JVL

Mumbai Urban Transport Project Consolidated Environmental Assessment
Potential ImpactsThe proposed road widening would involve cutting and filling. The total quantity ofmaterial to be brought from borrow pits (from Dahisar and Turbhe quarries) is3,14,000 m3 and the quantity of cut material to be disposed of is 43,704 m3 Borrowpits at the quarry sites will adversely affect the scenic landscape of the area.
Water Environment
Jogeshwari - Vikhroli Link Road crosses one small river (Mahim River) and 2 Nallahs.A stretch of the middle section of the road is along Powai Lake. The Powai Lakeshowed sewage contamination and high TDS (520 - 640 mg/I). DO levels of the lakeranged from 6.8 to 7.2.
Potential Impacts* Since the bridges on Mithi River and Nallahs are already widened and culverts
provided wherever necessary, the proposed sub-project is not likely to result inwater logging and increase in flood levels. However, there may be siltations ofthe nallah and other small channels due to erosion.
* If the construction takes place in rainy season, the adjoining water bodies wouldbe affected due to surface runoff contaminated with loose soil.
* Occasional accidents or spills of material being transported could cause pollutionof surface waters.
* Overall, the impact on the water quality will be of insignificant nature.
Air Quality
Baseline air quality along the alignment already exceeds the standards for PM10,SPM and HC. SPM and PM10 levels with their values in the range of 650 - 1200 pg/M3
and 130 - 275 pg/M3, respectively, were found to exceed their standards. The SO2and NOx concentrations were observed to lie between 18 - 47 Jg/rM3 and 16 - 66pg/rm3, respectively. These concentration levels were within the NAAQ standards.CO concentrations (1 - 2.4 ppm) were found within NAAQ standards of 3.8 ppm (1hour average). Lead was in the range of 0.09 - 0.89 g/iM3 against the prescribedstandard of 1 pg/M3,
Potential ImpactsDuring the construction phase, earthwork, rock cutting and handling andtransportation of construction material will increase the ambient dust levels.
6-13

Mumbai Urban Transport Project Consolidated Environmental Assessment
The operation of diesel based construction equipment and fuel wood used by theconstruction labor for cooking will degrade the air quality in the immediateneighborhood.
The construction related air quality impacts will, however, be of temporary nature.
Air quality impacts during the operation stage were assessed using CALINE - 3 modelto predict CO and NOx concentrations. For PM1O and lead, the roll back method wasused to estimate the future concentrations. Peak hour emissions for CO and averagedaily emissions for other pollutants to be used as input to the models were calculatedfrom predicted traffic volumes/composition and Indian Institute of Petroleum (IIP)recommended emission standards. Emission factors for SPM, and hence PM1oaccounted for the re-suspension of particulate matter from the road surface.
The modeling analysis showed:
- CO concentrations would meet the National Ambient Air Quality (NAAQ)Standard. NOx concentrations would exceed the standard, and populationexposed to NOx concentration exceeding the standard was estimated to be3700.
* PM10 and Lead values were 'timated for 2001 to be in the range of 222 - 357pg/M3 and 0.16 - 1.06 pg/rn' pectively. 4
* PM1o values were estimateo ;or 2011 to be 736 ,ug/m3.
* The section of the road likely to receive the maximum air quality impacts was theeastern section near Gandhi Nagar Square.
Noise
The noise levels measured along the proposed alignment as Lq were found to liebetween 77 - 86 dB(A) and 70 - 77 dE'A) for day time and night time respectively.These levels are quite high compared tc the day time and night time ambient noisestandards.
Potential Impacts
* The operation of construction equipment, such as, compressors, bulldozers,compactors, concrete plant, etc. will generate noise, which will be the cause ofnuisance to the nearby residents.
• The impact of traffic related noise during operation phase was determined by usingthe U.S. Federal Highway Administration (FHWA) model, and after accounting forbackground levels, were found to exceed the day time and night time standards.
6-14

Mumbai Urban Transport Project Consolidated Environmental Assessment
* The daytime noise levels predicted for the year 2011 ranged between 70.8 - 80.9dB(A), whereas the night time levels were found to lie between 58.6 - 73.8 dB(A).The noise standard was found to be exceeded upto 200 m from the road duringday time as well as night time. The high noise levels would affect two sensitivereceptors - Holy Trinity Church and Central School (Navy).
Ecological Resources
From ecological viewpoint, JVL can be divided into two sections - western sectionbetween WEH and LBS with non-marshy and non-saline land; and eastern sectionbetween LBS Marg and EEH with marshy and saline land. The two ecologicallysensitive areas along the western section of the road alignment are Aarey Farm andPowai Lake. Aarey farm is mainly a grassland. Drying periphery of Powai Lake hasextensive patches of Lpomea carpea Farm and Convolvulaceae (Beshrani). Ruderalplants, which are seasonal in nature, can also be seen along some stretches of theroad.
The eastern section of the road at few locations passes through marshy land, whichare used for dumping liquid wastes, municipal and construction wastes.
Potential Impacts
There are 363 trees, which are within 20 m belt on both sides of the road. Widening ofthe western section will lead to the loss of a part of these trees. The extension of theeastern section to four lanes may need clearance of some mangrove vegetation.However, the latter is already in degraded state. None of the floral species is rare orendangered. Major loss of trees will be from private or enclosed areas, presentlycovered by good number of trees.
Land Use
Certain sections of the road alignment pass through built area with both residentialand commercial establishments along the alignment. These establishments need tobe shifted for widening the road.
Resettlement:
About 890 Projects Affected Household (PAH) will have to be resettled. RehabilitationAction Plan (RAP) describing the R & R Policy and Institutional framework along with
6-15

Mumbai Urban Transport Project Consolidated Environmental Assessment
baseline socio-economic survey has been completed. Site specific RIP (and CEMP)has already been prepared.
The EMPs for JVLR is being updated considering the developments that have takenplace since 1998.
ii) Santacruz Chembur Link Road (MLEA)
Detailed feasibility, engineering and EA of these sub-projects are in progress. About2171 PAH would need resettlement. Baseline socio- economic survey has beencarried out. RIP and CEMP will be undertaken after the completion of engineeringdesign.
6.3 PROGRAMMATIC LEVEL ENVIRONMENTAL IMPACT
i) ROB at Vikhroli (PLEA)
The ROB is proposed to be constructed on LC No. 14 located to the south of Vikhrolistation. It is on Pirojsha Godrej road, which connects Lal Bahadur Shastrl (LBS) Margon the west of Vikhroli station and Eastern Express Highway (EEH) on the east.Please refer Fig. 6.2 for the landuse pattern. LBS road is about 280 m away from theLevel Crossing (LC) and it is 12.5 m higher in elevation compared to LC. The EEH isabout 500 m to the east of the LC and its elevation is 4.3 m lower compared to that ofthe LC. Since there is significant elevation difference between the starting and endingpoints of the sub-project, the approaches are proposed on viaducts.
Land use
Construction of ROB would dislocate about 185 (G + 1) structures with small businessunits in the ground floor and residences above. The sensitive landuses will beimpacted by higher air and noise pollution during construction and operationalphases. The ROB may give rise to induced development, and may lead to illegaloccupancy under the proposed ROB. There could be visual intrusion due to ROB.
Ecoloav
The site has no sensitive ecological features, except sparsely distributed ruderalvegetation. About 10 grown trees will be cut.
6-16
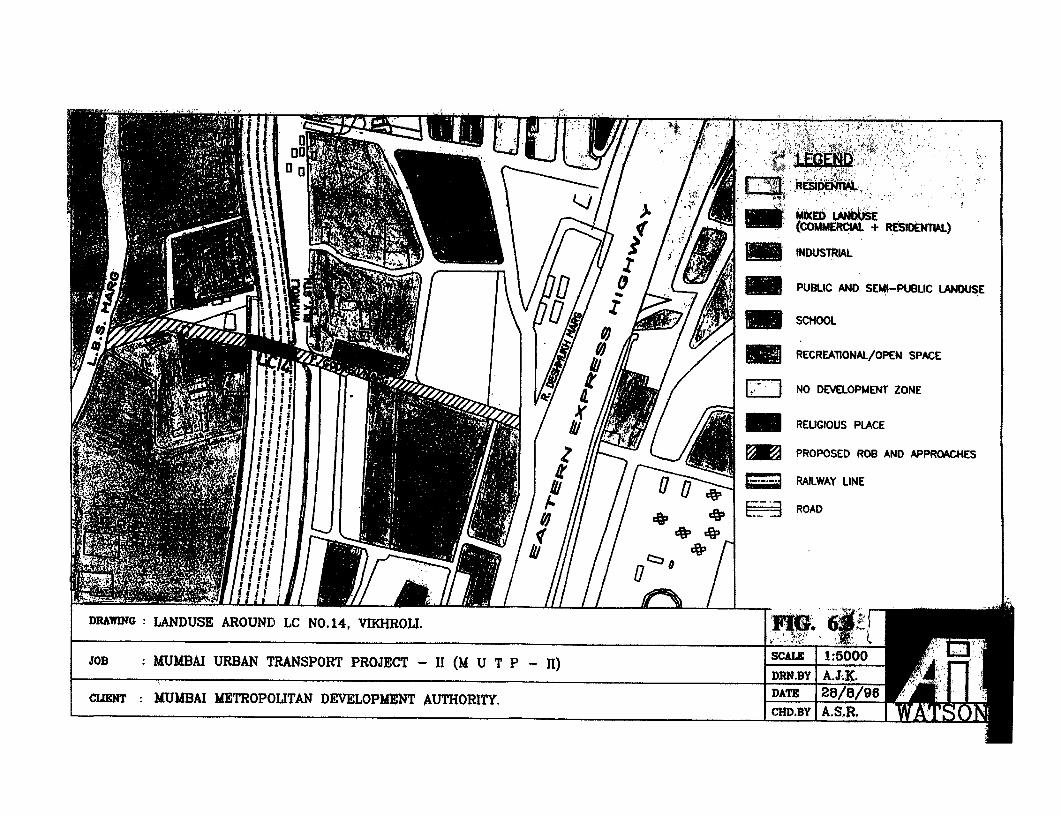
Jo9 MUMBAI URBAN TRANSPORT PROJECT - II (M U T P- II) DBC.LE 1:6000
CLIEN MUMBAI METOPOUTAN DEVLOPMENT AUTHORITY. CfD.3 8/8/96SCHD.BY A.S.R.

Mumbai Urban Transport Project Consolidated Environmental Assessment
Peoples perceptions
Respondents feel that the LC is located in a most convenient place to access railwaystation. Majority of the respondents feels that the congestion is mainly due to informalcommercial activities and frequent closure of LC. 55% of the respondents feel that theROB should be constructed as it would relieve congestion. Over 80% of the people inthe area felt that the air and noise pollution will be immense during constructionphase. Pedestrian inconvenience is perceived as major impact during construction.
Traffic and Transiort
The pedestrian and traffic movement will be adversely affected during constructionphase of ROB. The traffic movement with respect to speed and delays will besubstantially improved due to ROB.
Air
S02, NOx, lead in SPM and CO values are well within the NAAQ Standards forresidential areas. The PM10 and SPM values substantially exceed NAAQ standards.This may be due to re-suspension of dust. There would be fugitive air emissionsduring construction phase. Air quality would be impacted due to emissions fromfirewood burning in labour camps, pollution from construction equipment, andpollution from vehicles during operational phase of the ROB.
Noise
The day and night Leq exceeds commercial and residential area standards. High noiselevels are expected due to construction activities. There would be noise pollution fromincreased vehicular traffic with higher speeds during operational phase.
Significant Beneficial ImDacts
The Traffic movement with respect to speed and delays will be substantially reducedafter construction of ROB. Moreover, this would facilitate reduction of headway oncentral railway line.
Resettlement:
The initial assessment indicated that 173 PAH have to be resettled. However recentchanges in design indicate that this could be substantially reduced. Baseline Socio -economic Survey (BSES) has been completed and preparation of RIP - CEMP will beundertaken soon.
6-18
Mumbai Urban Transport Project Consolidated EnvironmentalAssessment
The EMPs for Vikhroli ROB is being updated considering the developments that havetaken place since 1998. The site specific EMPs for ROBs at Jogeshwari South) and(North) are separately being prepared.
ii) Pedestrian Sub-way at CST
Chhatrapati Shivaji Terminus (CST) is a Central Railway Terminus for suburban andoutstation trains. The proposed sub-way includes three sets of stairs and about 80metres of passageway to serve the pedestrian movements. The passageway variesin width from 7.5 to 12 meters with 5-meter additional depth for flanking shop spaceon each side. The five flights of existing stairs down from CST to D.N. Road would berelocated to inside the terminus.
Land Use
The CST area has public, semi-public, commercial and private land uses. There areno sensitive land use areas. Special land use features influencing the pedestrian andvehicular traffic include informal sector commercial activities location of the majorintra and inter city railway terminus, access to CST, BMC head quarters and otherpublic land uses. These land uses will be temporarily affected during constructionphase.The informal commercial sector land use will be totally removed during constructionphase.
Traffic and Transport
The maximum pedestrian volume occurs during 10.00 to 11.00 hours with pedestrianvolume of 15,275 and at this time, the traffic volume is about 5000 pcus. The areaexperiences longer vehicular delays and higher accident potential due to pedestrianvehicular conflicts. There would be major disruption in traffic and inconvenience topedestrians at CST junction during construction period.
On completion of the sub-projects, substantial improvement in vehicular speeds andreduction in delays would be realized. Pedestrian vehicular conflicts will beeliminated.
Air
The CO, HC (non-methane), PM10 and SPM levels exceed the NAAQ standards. TheNOx, SO2 and the lead in SPM are well within NAAQ standards. The air qualityimpacts during construction phase would be due to fugitive air emissions and
6-19

Mumbal Urban Transport Pmject Consolidated Environmental Assessment
emissions from construction equipment. At operation stage, emissions from operatingvehicles would contribute to air quality impacts.
Noise
The day and night L.q values exceed the commercial area standards by about 18 and21 dB (A) respectively. There would be high noise levels due to constructionactivities. Noise pollution would also be from increased vehicular traffic with higherspeeds during operational phase.
Significant Beneficial Impacts
* Substantial improvement in vehicular speeds and reduction in delays onconstruction of the subway.
* Pedestrian vehicular conflicts will be eliminated on operation of the subwaythereby reducing the accidents.
This was initially identified for inclusion in MUTP. However it has now beenimplemented. Instead a study is in progress to establish feasibility of pedestriansubways at 30 locations in Mumbai and carrying out detailed engineering alongwith EMP, based on the one prepared for CST. !
The EMPs for various Pedestrian Sub-way schemes are being separately prepared.
Iii) Thane (W) Station Area Improvement
The sub-project involves Thane railway station approach area on the western side.Station Area Improvement scheme includes: optimisation of the phasing system ofthe traffic signals for the intersection at the exist point of the station area;rearrangement of bus and auto parking in front of railway station; and channeling ofthe bus stands for smooth vehicular movement.
Land Use
The land uses at Thane station area include residential, commercial, public (busdepot); semi-public (Cinema theatre) and informal commercial activities lined upalong the station road
The special land use features which have direct impact include:
* Movement of state transport buses,* Intermediate transport generated by intra and inter city transport services,
6-20

Mumbai Urban Transport Prqoect Consolidated Environmental Assessment
* Informal commercial activities occupy foot path and part of the road therebycausing congestion, and
* Nearby cinema theatre generating heavy pedestrian volume during peak hourtraffic period thereby increasing congestion.
As the existing land uses are already saturated, there would not be any majornegative or positive impacts on land uses due to the implementation of the proposedimprovement schemes
Traffic and TransDort
The entry and exit roads are operating at capacity and hence experience severedelays and congestion. Seventy percent of the traffic entering into Thane station (W)area is composed of autos. Heavy pedestrian volume of the order of 1.2 lakhs per dayis leading to increasing vehicular pedestrian conflicts. Without the station areaimprovement, the present situation would further deteriorate.
The implementation of the proposed scheme would temporarily disrupt the trafficcirculation and pedestrian movements.
Air
The NOx, SO2 and lead in SPM are well within NAAQ standards. CO, PM10 , SPMand HC (non methane) exceed the NAAQ standards.
The construction phase of the sub-project will generate fugitive emissions. However,these emissions will be marginal in nature as the construction activities are veryminimal.
The day and night Lq values exceed the commercial area standards by 13 and 17dB(A) respectively. Marginal increase in noise levels is expected during constructionphase.
The noise levels would increase on implementation of the sub-project.
Siqnificant Beneficial ImDacts
* Without the station area improvement, the present situation would furtherdeteriorate
* The traffic conditions would marginally improve by implementation of the sub-project.
6-21

Mumbai Urban Transport Prmect Consolidated Environmental Assessment
This sub-project is no more considered for MUTP. Instead a study of SATIS is inprogress for 6 suburban railway stations. This will also include EA and EMP onthe basis of Thane.
The EMPs for various SATIS schemes are being separately prepared.
6-22

ENVIRONMENTALMANAGEMENT PLAN

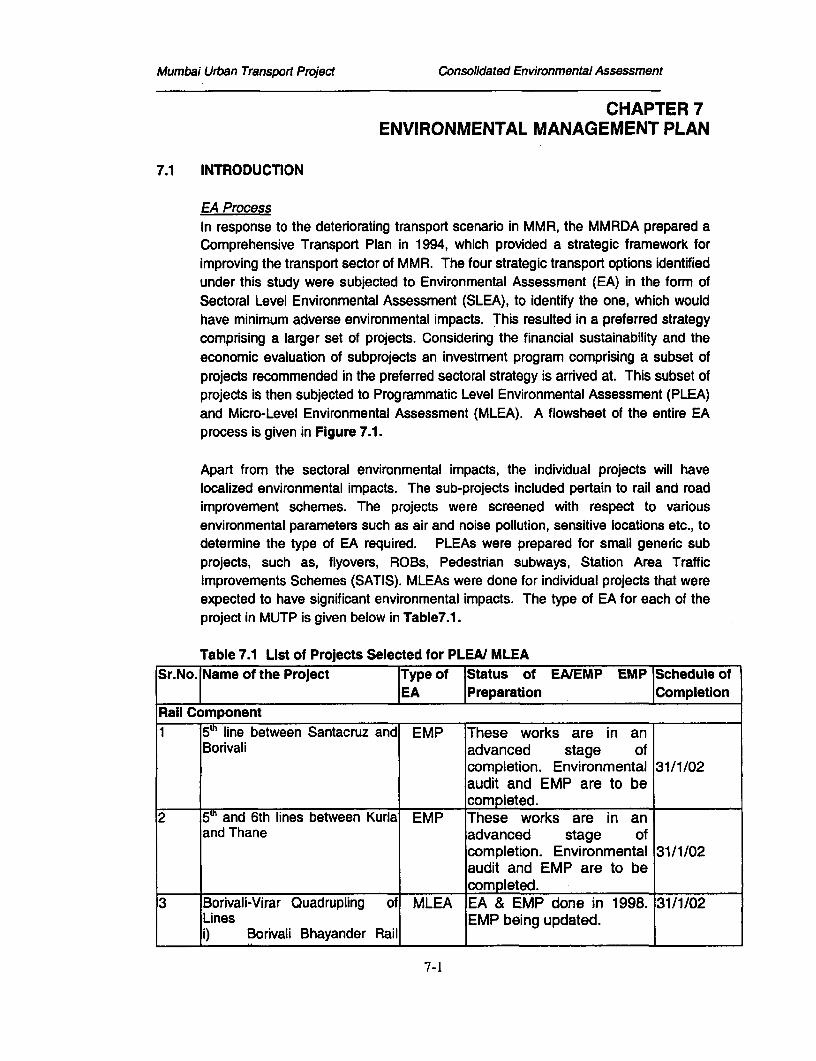
Mumbai Urban Transport Project Consolidated Environmental Assessment
CHAPTER 7ENVIRONMENTAL MANAGEMENT PLAN
7.1 INTRODUCTION
EA ProcessIn response to the deteriorating transport scenario in MMR, the MMRDA prepared aComprehensive Transport Plan in 1994, which provided a strategic framework forimproving the transport sector of MMR. The four strategic transport options identifiedunder this study were subjected to Environmental Assessment (EA) in the form ofSectoral Level Environmental Assessment (SLEA), to identify the one, which wouldhave minimum adverse environmental impacts. This resulted in a preferred strategycomprising a larger set of projects. Considering the financial sustainability and theeconomic evaluation of subprojects an investment program comprising a subset ofprojects recommended in the preferred sectoral strategy is arrived at. This subset ofprojects is then subjected to Programmatic Level Environmental Assessment (PLEA)and Micro-Level Environmental Assessment (MLEA). A flowsheet of the entire EAprocess is given in Figure 7.1.
Apart from the sectoral environmental impacts, the individual projects will havelocalized environmental impacts. The sub-projects included pertain to rail and roadimprovement schemes. The projects were screened with respect to variousenvironmental parameters such as air and noise pollution, sensitive locations etc., todetermine the type of EA required. PLEAs were prepared for small generic subprojects, such as, flyovers, ROBs, Pedestrian subways, Station Area TrafficImprovements Schemes (SATIS). MLEAs were done for individual projects that wereexpected to have significant environmental impacts. The type of EA for each of theproject in MUTP is given below in Table7.1.
Table 7.1 List of Projects Selected for PLEA/ MLEASr.No. Name of the Project Type of Status of EAIEMP EMP Schedule of
I IEA Preparation CompletionRail Component
1 5th line between Santacruz and EMP These works are in anBorivali advanced stage of
completion. Environmental 31/1/02audit and EMP are to becompleted.
2 5 h and 6th lines between Kurla EMP These works are in anand Thane advanced stage of
completion. Environmental 31/1/02audit and EMP are to becompleted.
3 Borivali-Virar Quadrupling of MLEA EA & EMP done in 1998. 31/1/02Lines EMP being updated.i) Borivali Bhayander Rail
7-1

Mumbai Urban Transport Project Consolidated Environmental Assessment
lineii) Bhayander - Virar Rail
line4 Optimization on western EMP/ PAH have been resettled in 31/1/02
Railway (including 12-car rakes CEMP permanent / transiton through lines) accommodation. CEMPs
are being prepared for______ these resettlement sites.
5 Optimisation on Central Railway EMP/(including 12-Car rakes on CEMPthrough lines) _
6 Optimisation on Harbour line EMP/CEMP
7 DC/AC conversion EMP Being Prepared 31/1/02
8 EMU coach re-manufacturing No EA .Req.
9 Track machines No EAReq.
10 Technical Assistance No EA_ _ _ _ = _ _ _ _ _ _ _ _ _ _ _ _ _ _ _ _ _ _ _ _ R eq .
Roads and Traffic Component
1 Jogeshwari-Vikhroli Link Road MLEA EA & EMP done in 1998. 15/12/01I___ ==___________________ _ I EMP being updated.
2 Santacruz-Chembur link road MLEA EA / EMP Being prepared 31/12/01as a part of the engineeringfeasibility study.Independent Review of 31/1/02EMPS
3 ROB at Jogeshwari (South) EMP Being done on the basis of 31/1/02I __ I _l____________________ PLEA for ROB at Vikhroli.4 ROB at Jogeshwari (North) P Being done on the basis of 31/1/01.
.___ ___________________ PLEA for ROB at Vikhroli.5 RC Vikhroli PLEA EA & EMP done in 1998. 31/1/02
EMP being updated.6 Da,. Mahim One way system No EA
Req.7 Pedestrian subways and bridges EMP EA & EMP for CST (VT) 31/3/02
done in 1998. EMP forother subways being doneon basis of CST- EA /EMP. 30/4/02Independent Review of
_____E_ MPs8 Station area traffic improvement EMP EA/EMP for Thane done in 31/3/02
schemes (SATIS) 1998. EMP for otherSATIS being done on thebasis of Thane EA / EMP.Independent Review of 30/4/02
_ _ _ ___ EMPs7-2

Mumbai Urban Transport Project Consolidated Environmental Assessment
9 Other traffic management No EAschemes Req.
10 Procurement of Buses No EAReq.
11 Environment-air quality No EAmonitoring Req.
12 Technical Assistance, studies No EAtraining Req.
Projects at 8 to 10 of Rail do not involve any civil work. EA is thus not required.Progress at 9 to 12 of Road Component are related to traffic and air quality managementand does not involve any Civil work. EA is thus not required.
7-3

Mumbai Urban Transport Project Consolidated Environmental Assessment
FIGURE 7.1 ENVIRONMENTAL ASSESSMENT PROCESS
Comprehensive Transportation Study4 strategic options
1. Do minimum2. Public transport option 19943. Public transport + Demand management4. Road Investment option
Sectoral Level Environmental Assessment (SLEA)Evaluation of strategic options with respect to thefollowing environmental criteria 1996- Traffic Analysis- Impact on Air, noise, social, ecological resources and
transportation service quality
Selection of strategic option(PT + DM)
1
Screening of projects with respect 1997to potential impacts
Programmatic Level Micro-level EnvironmentalEnvironmental Assessment Assessment (MLEA)(PLEA) - Subprojects selected - road- Sub-projects selected: improvements, suburban railway 1998
ROBs, pedestrians subways subprojects- Analysis of traffic & transport - Impact on traffic, air, noise, water- Impact on air, noise, social and landuse, social and ecological
ecological resources, landuse resources.
Preparation of updated and consolidated 2001EA and proiect specific, EMPs
IDraft Consolidate EiA Pulil | ~~~~~Consultation
2101
Note: The Current Project Stage Is Highlighted In The Above Figure
7-4

Mumbai Urban Transport Project Consolidated Environmental Assessment
Environmental impacts of each of the above projects are described in Chapter 6 anda summary of impacts is given in the following Sections.
Environmental Manaaement PlansPlans are prepared for mitigating and managing potential adverse environmentalimpacts identified in SLEA and project specific PLEA/MLEA studies. These EMPsare accompanied by institutional and reporting framework to ensure EMPimplementation and monitoring programs for individual projects.
7.2 SECTORAL LEVEL ENVIRONMENTAL MITIGATION AND MANAGEMENT PLAN
In spite of having a transport strategy with the least environmental implications for theregion, MMR is bound to experience environmental impacts from transportationsector on account of increase in both human and vehicle population. There areseveral environmental issues that need to be addressed at the sectoral level e.g.increase in air and noise pollution, ecological impacts from extension of railways inecologically sensitive areas, rehabilitation of displaced people etc. Mitigationmeasures for addressing the above issues are taken up at sectoral level using theSLEA framework.
Reducing traffic congestion, vehicular emissions and noise could alleviate theimpacts due to the development of the transportation sector as a whole. Themitigation measures are developed at legal, policy and administrative levels forreducing sectoral level environmental impacts.
7.2.1 Sectoral Level Environmental Impacts
The SLEA was carried out for the four suggested transport options with respect to sixmajor parameters viz. Transport and Traffic Efficiency, Ambient Air Quality, Noise,Ecology and Social (R & R). Impacts on these parameters were studied in four majorsub-regions of MMR viz. the Island City, Eastem Suburbs and Western Suburbs ofGreater Mumbai City and the Rest of MMR (See Map in Figure 1.1 In Chapter 1).
In order to assess the impacts, a number of indicators/indices were identified foreach of the above environmental parameters. Baseline monitoring of the parameterswere carried out in the year 1996 and the impacts were predicted for all the transportoptions for the year 2011. These are presented in detail in Chapter 4. The criticalenvironmental issues that need mitigation measures at the sectoral level aresummarised below:
* Ambient air quality (mainly for PM10 ) would deteriorate and noise levels wouldincrease due to project implementation.
* Displacement of project affected households.* Ecological impacts.* Traffic Management and Safety.
7-5

Mumbai Urban Transport Project Consolidated Environmental Assessment
'.2.2 Sectoral EMP
At the sectoral level, a variety of policy, legal and administrative measures could beused to manage environmental impacts. These are described in Table 7.2 (a).
The formulation and implementation of several of the measures indicated dependupon a variety of parameters such as promulgation of rules and standardsparticularly by GOI, techno-economic feasibility of the suggested measures, publicpressure, directives of Supreme Court and High Court etc. Thus the time frame forimplementation of these measures cannot be decided as a part of MUTP by theproject authorities or GOM alone. However, a suggestive framework forimplementation of the EMPs including institutional responsibility, authorities and timeframe is given in Table 7.2 (b).
7.2.3 Sectoral Level Monitoring
Sectoral level monitoring is needed to assess the success of the mitigative measuresin improving the environmental quality and arresting the deterioration of theenvironmental quality and also to update EMP based on the feed back obtained frommonitoring.
The monitoring plan presented here mainly includes monitoring of the environmentalquality, R&R and monitoring traffic parameters. The plan is given in Table 7.3
Monitorina of Environmental QualityEnvironmental quality particularly with respect to air pollution and noise levels, mustbe monitored on continuous basis, as these environmental components are likely tobe affected most by the transportation strategy.
Environmental quality monitoring shall be carried out with the objective of assessingthe change in environmental quality due to the transportation strategy, so that thestrategy can be updated in response to the monitored results. Since theenvironmental quality of Greater Mumbai is also affected by factors other thantransportation activities, environmental monitoring programme for the transportationstrategy shall be integrated with the regional environmental monitoring programme.The recommended minimum environmental quality-monitoring programme with thefocus on the transportation strategy is given in Table 7.3. The location of monitoringsites shall be decided by MMRDA in consultation with MCGM.
Monitorina of Social (R&R) ComDonents
A number of MUTP projects will result in displacement of population. Theresettlement and rehabilitation process of the displaced population will be closely
7-6

Mumbai Urban Transport Project Consolidated Environmental Assessment
monitored by MMRDA and IMP. The methodology for such monitoring is given inparagraphs 64 to 68 of Resettlement Action Plan, September 2001, MMRDA.
Monitorina of Traffic Movement
The MUTP project is expected to bring about a substantial improvement in trafficmovement in MMR and Greater Mumbai. Various traffic parameters such asvolume, speed etc. for roads and passenger trips for railway will be monitored totrack changes in traffic movement. As a part of MUTP, a Traffic Management Unit(TMU) is being established in MCGM. The TMU will undertake periodic studies tomonitor the traffic movements and impact of proposed measures in MUTP.
7-7


Mumbai Urban Transport Project Consolidated Environmental Assessment
Table 7.2 (a) Sectoral EMP
Environmental Regulatory Measures Policy Measures Administrative MeasuresImpactAmbient Air Quality * Stringent emission Review and Implementation of recommendations * Strict enforcement of airDeterioration standards for vehicles at made by committee for reducing vehicular pollution emission
manufacturing and in Mumbai, constituted under the Mumbal Highoperational level, Court Order dated December 15, 1999. Some of the * Enhancing of the current
* Use of cleaner major recommendations are: monitoring network of MCGM astechnologies, such as,pereomnaingvnnthcatalytic converters for * Reducing sulfur content of diesel initially to per recommendation given in thepetrol driven vehicles, 0.05% and finally to 0.005% by 1j April 2005. study M Strengthening the Airfour stroke engines for * Reduction in Benzene content of petrol from the Quality Monitoring Networktwo and three wheelers, present level of 3% to less than 1%. Operated by MCGM" completed
* Measures to prevent fuel * Refineries are recommended to implement the In year 2000.adulteration, 'Marker' system for detecting adulteration in
* Legal support for policy fuels and lubricants. * To develop PMIo abatementand administrative level * All the retail outlets in MMR should sell only pre- strategy. (Study commenced bymitigation, mixed petrol through dispensers to two and MMRDA in Sept. 2001)
* Permitting use of three wheelers with effect from 1 st Octoberalternate fuels such as 2000 * Vehicle Inspection andCNG and LPG as * All petrol taxis above the age of 15 years and Monitoring Program:automobile fuel. (Already diesel taxis above the age of 8 years be Promote vehicle inspection anddone as per Liquefied converted to CNG or any other clean fuel and all maintenance centres.Petroleum Gas diesel taxis above the age of 8 years should be Commercial vehicles to obtain a(Regulation of Use in converted to clean fuel3 wheelers above the Certificate of Fitness fromMotor Vehicles) Order, age of 10 years to be scrapped or converted on approved Inspection and2001. CNG or any other clean fuel. All transport Maintenance Centres.
vehicles, except 3 wheelers and BEST busesover the age of 15 years to be scrapped unlessconverted to clean fuel. All BEST buses olderthan 20 years to be scrapped or converted toCNG.
* All petrol driven vehicles registered in Mumbaiprior to 1st April 1995 are recommended to befitted with catalytic converters. . (Court is yet todecide)
7-9

Mumbai Urban Transport Project Consolidated Environmental Assessment
Table 7.2 (a) Cont..Environmental Regulatory Measures Policy Measures Administrative MeasuresImpact ANoise ExplicH policy for noise reduction from vehicle Montoring of noise levels at
engines, exhaust, tyr qnd road surface. sensitive receptors. Identifyingc, --. II'es of noise.
Reducing traffic noise impact by placing noisebarriers to the extent feasible.
Social Impact Govemment of Maharashtra Project affected households to be rehabilitated as PMU - MMRDA Is responsible foradopted a policy of R & R in per the Rehabilitation Action Plan (RAP) and entire R& R. An Independent1997. All resettlement to be project specffic RIP, CEMP. More details in Chapter Monitoring Panel has beenundertaken according to the 8. appointed to monitor the same.policy.
Ecological Impacts MMR - Regional Plan The Indian Forest Act and Coastal Regulation Zone Strict enforcement of Developmentprovides land use zoning and (CRZ) notification of 19/2/91 >,rovide necessary regulations to contain growth indevelopment control policy framework to minimise ecological impacts. ecologically fragile areas.regulations consistent withthese regulations. GoM hasprepared Coastal ZoneManagement Plan (CZMP),which has been approved by
.__,_ MoEF.
Traffic ManagementW Implementing recommendations of the committee * Enforcement of road safetyand Road Safety appointed by Mumbal High Court (See above). The rules.
major traffic management policy recommendations * Development of emergencyinclude: plans to deal with road/ rail* Strengthening traffic and transportation accidents Involving hazardous
planning, traffic operation, traffic signals and substances.signs, and area traffic control.
* Modal Integration outside railway station and atferry landings, control of on-street and off-streetparking, management of traffic demand, powerto collect certain parking fees and
I supplementary charges on road traffic.
7-10

Mumbai Urban Transport Project Consolidated Environmental Assessment
Table 7.2 (b) Sectoral EMP Implementation Framework
Parameter j Mitigation Measures Responsibility Time Frame Supervision
AIR POLLUTIONRegulatory Stringent emission standards, Use of Clean Fuel Govt. of India Already in progress. Not Applicable.Measures etc.
Policy Several policy measures have been suggested for GOI / GOM Policies are In various stages of Various agencies asMeasures: use of clean fuel, scrapping of obsolete vehicles being drawn up. e.g Mumbai High and when policies are
etc. Several of such measures are pending Court decision of October 2001 implemented.clearance from Mumbai High Court. requires vehicles more than 15
years to be scrapped or convert toCNG.
Administrative Strict enforcement of vehicular air emission RTO Already in progress GOMMeasures standards.
Enhancing of the current air quality monitoring MCGM To commence along with MUTP MMRDAnetwork of MCGM as per recommendation given project implementation.in the study " Strengthening the Air QualityMonitoring Network Operated by MCGM"completed in year 2000.
To develop PM10 abatement strategy. Various Study commenced by MMRDA in MMRDAagencies Sept. 2001.identified In theon-going study.
Vehicle Inspection and Monitoring Program. RTO Plans to be drawn up and MMRDAimplemented during MUTP.
7-11

Mumbai Urban Transport Project Consolidated Environmental Assessment
Table 7.2 (b) ContinuedParameter Mitigation Measures Responsibility Suggested Time Frame Supervision
NOISEPolicy Measures Explicit policy for noise reductio' m vehicle RTO IFkisg of time frame is not MMRDA
engines, exhaust, tyre and roaa L, iace. possible at this point.
Reducing traffic noise impact by placing noise RTO MMRDAbarriers to the extent feasible.
Administrative Monitoring of noise levels at sensitive receptors. MCGB & RTO Within 1 year MMRDAMeasures Identifying sources of noise.SOCIAL IMPACT
Policy Measures PIA - MMRDA is responsible for entire R& R. An GOM Already doneindependent Monitoring Panel has been appointedto monitor the same
Administrative Project affected households to be rehabilitated as PIA To be done before MMRDAMeasures per the Rehabilitation Action Plan (RAP) and I construction
project specific RIP, CEMP. More details in lResettlement Action Plan, September 2001. l
ECOLOGICAL IMPACTSAdministrative Strict enforcement of Development regulations to UD Already being done MMRDAMeasures contain growth in ecologically fragile areas.
TRAFFIC MANAGEMENT AND ROAD SAFETYPolicy Strengthening traffic and transportation planning, RTO, MCGM - In Progress - To be MMRDA
traffic operation, traffic signals and signs, and area TMU strengthened in MUTP.traffic control.
Administrative Modal Integration outside railway station, control RTO, MCGM- To be established during MMRDAof on-street and off-street parking, management of TMU MUTP.traffic demand, power to collect certain parkingfees and supplementary charges on road traffic.
7-12

Mumbai Urban Transport Project Consolidated Environmental Assessment
Table 7.3 Environmental Quality Monitoring
Parameters to Recommended Sites Sampling duration and Responsibilitybe monitored FrequencyAmbient AirQuality:CO, HC, Nox, As per recommendation As per recommendation given MCGB
SPM, PM10, given in the study i in the study i Strengthening
So2 Strengthening the Air the Air Quality MonitoringQuality Monitoring Network Operated by MCGM"Network Operated by completed in year 2000.MCGM" completed inyear 2000.
Noise:To compute Same sites as above Same as Above
L-qu, L10t L50,and Lg_
Social (R&R) _
Living At resettlement site 1 year after resettlement. MMRDA
Conditions ofPAH's. Drinkingwater supply,sanitation andother facilitiesTrafficMovementTraffic volume, At individual sub-project At least once in a year RTO/ MCGB-TMU
speed sites and main arterialroutes
7-13

Mumbai Urban Transport Project Consolidated Environmental Assessment
7.3 PROJECT LEVEL ENVIRONMENTAL MITIGATION AND MANAGEMENT PLAN
As discussed earlier, individual projects would give rise to localised environmentaland social impacts. The environmental impacts were assessed at twolevels - (a) Micro Level (MLEA) for individual projects that were expected to havesignificant environmental impacts and (b) Programmatic level (PLEA) for smallgeneric sub projects, such as, flyovers, ROBs, Pedestrian subways, Station AreaTraffic Improvements Schemes (SATIS). The projects, which have been finallyselected for implementation and for which EMPs have been prepared, are givenearlier in Table 7.1.
7.3.1 Summary of Environmental Impacts/Issues
As seen in Table 7.1 given earlier, EA and EMP for the following projects have beenprepared in the year 1998. The environmental impacts of these projects and relatedaspects considered for mitigation plans are described in Table 7.4 (a) to (e)respectively attached at the end of this Chapter:
ML, A
* Jogeshwari-Vikhroli Link Road (JVLR)
* Borivali-Virar Quadrupling of Rail Lines(BVQR)
PLEA
i Road Over Bridge at Vikhroli
- Pedestrian Subway at CST
* Station Area Improvement at Thane Station
7.3.2 Environmental Mitigation Measures and Management Plans
The status of EAIEMP preparation is described in Table 7.1 earlier. This sectiondetails the environmental management plans or mitigation measures (EMPs)developed for the following 5 sub-projects:
* Jogeshwari-Vikhroli Link Road (JVLR)
* Borivali-Virar Quadrupling of Rail Lines (BVQR)
a Road Over Bridge (ROB) at Vikhroli
* Pedestrian Subway at CST
• Station Area Improvement (SAT-IS) at Thane Station
The EMPs for these sub-projects were prepared in 1988 by AIC Watson ConsultantsLtd. These EMPs are currently being updated to encompass the changes in baselinedata and site conditions that may have changed since the year 1998. Thus, theEMPs presented here may undergo some modifications identified during the updating
7-14

Mumbai Urban Transport Project Consolidated Environmental Assessment
process. The schedule for updating of EMPs for the above mentioned sub-projectsare given in Table 7.1.
As mentioned in Table 7.1, EMPs for the remaining sub-projects will be preparedbased on the related earlier EMPs. The table also gives the schedule for completion.For instance, there are 30 pedestrian subway projects and 6 SATIS projects. TheEMPs presented for the CST pedestrian subway and Thane Station SATIS will beused to prepare EMPs for remaining projects in these categories.
EMP's are developed for the above projects for the design, construction andoperation phases of the projects and are given in Table 7.5 to 7.9 respectivelyattached behind this Chapter. The EMPs give the mitigation measures for theenvironmental impacts of the above projects summarised in Tables 7A (a) to (e).The EMPs include references to the contract documents and responsibilities forimplementation. The EMPs are mainly prepared for the following significantenvironmental impacts/issues:
- Ambient Air Quality Deterioration* Increase in Noise Levels* Adverse Impacts on Ecology (Flora/Fauna)* Population displacement* Land degradation* Surface and groundwater degradation* Occupational health and safety* Impacts on Traffic and road safety
In order to allow the local communities and road/rail users the benefit of a bettercorridor of movement and enhanced environmental setting, various site-specificenvironmental enhancement plans are prepared and are a part of the overall projectdesign. These enhancement measures typically include landscaping, roadsideplantation, public seating at various locations, environmentally compatiblearchitecture etc. These measures will be specified in the updated EA and EMPreports.
7.3.3 Environmental Monitoring Plan
Environmental monitoring plans have been specifically developed for MUTP sub-projects, involving monitoring sites, monitoring parameters, time and frequency,collection, analysis and the report of monitoring data. The objectives of themonitoring plan are:
* To record the impact of MUTP on urban environmental quality during theconstruction and operation phases;
* To evaluate the effectiveness of the mitigation measures during the constructionand operation phases.
7-15

Mumbai Urban Transport Project Consolidated Environmental Assessment
* To satisfy the legal and community obligations* To respond to the unanticipated environmental issues at an early stage and to
verify the accuracy of environmental impact prediction.
At the project level, the vital parameters or performance indicators that will bemonitored during construction and/or operation stages of the project include:
* Ambient air quality - SO2, PM1 ,, CO, NOx
* Noise levels near sensitive locations* Re-plantation success/ survival rates
* Traffic volume and characteristics
The recommended environmental quality-monitoring programme for the projects aregiven in Tables 7.10 to 7.14 attached behind this Chapter. Methodology used forsampling and analysis will be as per prevalent requirements of Ministry ofEnvironment and Forest and Indian Standard (IS) codes. These monitoring plans arefor the EMPs prepared in 1998 and are being updated along with the respectiveEMPs.
7.4 INSTITUTIONAL SETUP, COORDINATION & STRENGTHENING
7.4.1 Institutional Set-up and Coordination
The monitoring and evaluation of the EMPs are critical activities in implementation ofthe various projects. Monitoring involves periodic checking to ascertain whetheractivities are going according to the plans. It provides necessary feedback for projectmanagement team to keep the program on schedule.
The monitoring and reporting process for mitigation measures during construction willinitiate from the contractor at the lowest rung who will report to the ProjectImplementation Agency (PIA) through the Project Manageme-' consultant. Themonitoring process and the roles and responsibilities of the various agencies forcoordinating and managing the EMP implementation is described below:
Project Implementation Agencies (PIA) and Project ContractorsThe responsibility of implementing the various environmental mitigation measureslies with the PlAs, such as Municipal Corporation of Greater Mumbai, Public WorksDepartment, Maharashtra State Road Development Corporation. The responsibilityalso includes various tasks such as notifying various affected parties such as theresidents and commercial establishments, facilitate the relocation of people, notifyother utility departments such as telephone, water supply, sewerage etc. which usethe road for providing public utility services.
The PIA will get the EMP implemented through the Project Management Consultant(PMC) by incorporating the EMP requirements in the contractual agreement along
7-16

Mumbai Urban Transport Project Consolidated Environmental Assessment
with the provision of penalties to be levied if the contractor fails to comply with theconditions. The contractor shall submit a report on compliance with theenvironmental mitigation measures (Environmental Compliance Reports, ECRs)before start of construction activities and periodically thereafter to the PIA. The PlAswill then submit the ECRs to the JPD (Env), which after review and monitoring will besubmitted to IMP through the Project Director, MUTP for confirmation of theimplementation of the environmental mitigation measures. The Project Director willaccordingly submit the report to the World Bank. (Refer Figure 7.2 for the co-ordination model).
MMRDAMMRDA as an apex organisation shall initiate co-ordination process among theconcemed organisations for EMP implementation. MMRDA shall take lead in:* reviewing the progress of the projects and plans for the subsequent year -
Institution wise* reviewing and discussing the salient features of the reports in the year on
environmental aspects/statistics like emission check and violations.* organising and co-ordinating training programmes for all member organisations.
An Independent Monitoring Panel (IMP) has been constituted by MMRDA with theobjective to ensure that the Bank's policies related to social and environmentalissues are followed. The Chairman of IMP is Ex-Chief Secretary to Govemment ofMaharashtra. The other members are an eminent Environmental Engineer, a seniorJournalist and a leading Advocate. The IMP will meet periodically to review theperiodical reports, environmental compliance report, etc. submitted by PlAs andPMCs/Contractors.
MMRDA has proposed a co-ordination model (Refer Fig. 7.2) for promoting effectiveimplementation of EMPs at sectoral level and at project level during construction andoperation phases. The responsibilities of key functionaries for EMP implementationare:* The Project Director, MUTP has the overall responsibility of implementation of
EMPs and co-ordination of all the environmental related matters of thetransportation projects.
* The Joint Project Director (Environment) is responsible for both environmentalplanning and management. He will also be responsible for co-ordinating theenvironmental related works and ensuring preparation and implementation ofsectoral and project level EMPs for the transportation projects. In respect ofR&R, he is particularly responsible for ensuring preparation and implementationof Community Environmental Management Plans (CEMP).
7.4.2 Reporting Requirements
Section 7.4.1 above descrbes institutional framework for EMP monitoring. It is alsoimportant to identify the key parameters that have to be monitored and establish a
7-17

Mumbai Urban Transport Project Consolidated Environmental Assessment
reporting system. The rationale for a reporting system is to ensure accountability forimplementing the EMPs.
A generic reporting system proposed to be followed is given in Table 7.15. However,the monitoring parameters and frequency of reporting are project specific anddepend upon several factors such as:
* Environmental components affected* Construction schedule of the project* Environmental Management Plans sugges!-d
Project specifi- monitoring Schedules as per format are given in Table 7.15 will beprepared ar iade available in the updated PLEA and MLEA reports for theprojects. Sp, .-nc reporting formats will also be included. The reporting sheets andformats will be made available in the project tender documents.
7-18

Mumbai Urban Transport Project Consolidated Environmental Assessment
Figure 7.2 INSTITUTIONAL MECHANISM FOR IMPLEMENTATION OF EMP
|IMP ........ -t High Power Steering Committee
Project Coordination.. ..... .. . . ....... .. Committee
World Bank MMRDAProject Director MUTP
JPD (Environment)
MRVC MSRDC/PWD MCGM BEST
| PMC | | PMC PMC P C
Contractor IF
[-otactor Conrator] Contractor

Mumbal Urban Transport Project Consolidated Environmental Assessment
7.4.3 Institutional Arrangements and Its Strengthening
The implementation of an environmentally sound transport strategy involves anumber of institutions / organisations at various levels, with each organisationhaving a distinct role to play. Introducing environmental dimensions informulating and implementing a transportation strategy would require thatthese institutions shoulder additional responsibilities for ensuring that thestrategy does not result in any significant adverse environmental impacts.
In order to examine the existing capacities and identify the additionalresponsibilities that the concerned Organisations/ institutions shall take up toaddress environmental issues, these Organisations are categorised into fourgroups - Apex Organisations, Project Implementation Agencies, TransportService Organisations and Regulatory Organisations.
MMRDA is the apex organisation and being the regional planning authorityhas regular interactions with various Project Implementing Agencies. Theexisting capacities of these organisations for environmental managementhave been carefully assessed by MMRDA. The envisaged roles andresponsibilities of these organisations and additional strengtheningrequirements to meet the environmental obligations defined in this EA reportare given in Table 7.16 attached at the end of this Chapter.
7.5 COST ESTIMATES FOR MITiGATiVE MEASURES AND MONITORING
The EMP implementation will require two types of financial commitments.Budget required for strengthening the capacity of the concerned organisationsresponsible for implementing the plan; and moneys that will have to be spentfor implementing mitigation measures identified for the individual road/railprojects under the transportation strategy. These cost estimates aredescribed separately below:
7.5.1 Cost Estimates for Institutional Capacity BuildingThe budget estimates provided in this section mainly focus on the capacitystrengthening measures in terms of training. Training needs for building thecapacity of the concemed organisations for environmental planning andmanagement have been identified. Table 7.17 lists these trainingprogrammes and also provides cost estimates for these programmes. Thetotal cost for the training programmes is estimated to be Rs. 4,80,000/-.
7-20

Mumbai Urban Transport Project Consolidated Environmental Assessment
Table 7.17 Cost Estimated for Imparting Training (2001)
Training Modules Target No of Costl TotalOrganisation Batches Batch cost Rs.
Introduction to EIA MMRDA., MSRDC, 2 50,000 1,00,000(Duration - 3days)
Environmental Law MMRDA., MSRDC, 4 30,000 1,20,000Environmental Law MCGM, MRVC(Duration - 3 days)
Air pollution and Noise Monitoring MMRDA., MSRDC, 2 30,000 60,000(Duration - 3days for introductory MCGM, MRVCCourse)
Duration 20 days for intensive MMRDA., MSRDC, 1 1,50,000 1, 50,000course MCGM, MRVC
Environmental Planning and MMRDA, MCGM 2 25,000 50,000Decision Making - I (Duration - 3days)
Total Rs. 4,80,000/-
Note: One Batch may cover 15 to 20 participants. Cost per day of training is assumed atRs. 6000/-
7.5.2 Cost Estimates for Project Specific EMP Implementation
Provisions for these are expected to be made by the project proponent underthe individual project budget. Estimates for EMP implementation for the JVLRroad project and BVQR rail project had been prepared in 1998 in theindividual MLEA studies. These estimates (including price escalations tillthe year 2001) are given in Table 7.18. The estimates have been preparedfor EMPs related to the following tasks:
* Relocation of Utilities* Compensatory and Road/Track Side Plantation* Pollution control (dust, water pollution) during construction* Noise level reduction* Labour Camp sanitation* Road safety* Environmental Monitoring
The estimates for EMP implementation for the remaining projects such asROBs, SATIS and Pedestrian subways have been prepared based on theestimates of the above 2 projects and engineering judgements. A
7-21

Mumbai Urban Transport Project Consolidated Environmental Assessment
consolidated estimate for EMP implementation for all related sub-projects arepresented in Table 7.19. The estimated cost of EMP implementation forMUTP sub-projects is Rs. 19.38 Million.
The above estimates are provisional and the final estimates will be availableafter the EMPs are updated (EMP updating is in progress). The revised costestimates for the projects will be presented in detail along with the updatedEMP reports. The final list of EMPs and respective cost estimates will bemade a part of the bidding and contract documents.
7.6 CONTRACTUAL AGREEMENT
In order to facilitate smooth implementation of EMPs, the PIA shall includespecific obligations in respect of EMP implementation in all tender andcontract documents. The bidding and contract documents shall include tables(as updated for specific projects) given below at 1,2 and 3
1. EMP requirements and obligations for the projects give Tables 7.5 to7.9.
2. Environmental Monitoring R% jirements given in Tables 7.10 to 7.143. Reporting requirements give- In Table 7.154. Indicative EMP cost estimates as given in Table 7.18 and 7.19.
7-22

Mumbai Urban Transport Project Consolidated Environmental Assessment
Table 7.18 Cost Estimates for EMP Implementation for JVLR and BVQR Sub-Projects
COMPONENT EMP COST ESTIMATESJVLR BVQR
Utility Relocation 119600 437000(92000* + 30% Escalation) (437000* + 30% Escalation)
Compensatory and -- 663000Plantation 510000* + 30 % Escalation
Road/Track Side 2028000 280800Plantation 1560000* + 20% Escalation 216000* + 30 % Escalation
Dust Suppression 300000 390000During Construction 30000/km x 10 km. 15000/km x 26 km.
Water Pollution - Silt 10000 150000Fencing Works 10000 per loc. x 1 Loc. 10000 per loc. x 15 Loc.
Noise barriers/raisingboundary walls for 1000000 1000000Noise control
5000/m x 200m 5000/m x 200mLabour Camp 100000 100000Sanitation (10000/toilet x 10 toilets for 200 (10000/toilet x 10 toilets for 200
labourers) labourers)Road Safety 50000 50000(fencing etc.) 2500/meter x 20 m 2500/meter x 20 m
Safety and Noise 20000 20000awareness signage (Lump sum) (Lump sum)
Environmental 346000 145000Monitoring(Construction andOperating Stages)
Total 3973600 3235800* Cost estimates of 1998** Costs of R&R are separately covered in the RAP.
7-23

Mumbai Urban Trarnsport Prolec Consolidated Environmental Assessment
Table 7.19 Overall Cost Estimates for MUTP Sub-Projects
Sr.No.|Name of the Project EMP Cost Estimates
Roads and traffic component | _ _
1 Jogeshwari-Vikhroli Link Road 3973600
2 Santacruz-Chembur link road 3973600
3 ROB projects at Vikhroli, Jogeshwari 2477760(South) and Jogeshwari (North)
8 30 Pedestrian subways and bridges 3000000
9 6 Station area traffic improvement 300000schemes (SATIS)
Rail Projects
1 Borivali Virar Quadrupling of Rails 3235800
2 5h line between Santacruz and 500000Borivali
3 5m and 6th lines between Kurla and 500000Thane
6 DC/AC conversion 20000
13 Technical Assistance, studies training -3000I. (m r Table 7.18)
Sub Total 18460760
5% Contingencies 1923038
Grand Total 19383798
7-24

Mumbai Urban Transport Project Consolidated Environmental Assessment
Table 7.4 (a) Summary of Impacts for Jogeshwari-Vikhroli Llnk Road Project (JVLR)
Environmental Constructlon Operation Stage ImpactsComponent Stage ImpactsAir Quality Temporary increase in ambient SPM and NOx levels 0 No significant change In CO levels over the baseline. Predicted
due to earthwork, handling construction materal levels for 2011 well below the CO NMQS.and use of fire wood for cooking by on-site laborers. Nlevels , well below the CO NAAQS.
* NOx levels were predicted to be within NMQOS for 2011, exceptat some locations.
* Both the baseline and predicted (for the year 2011) PM1o levelsexceed the standards at most locations.
Noise Levels Nuisance to nearby residents due to noise from Day and night time predicted noise levels for the year 2011 rangeconstruction activities such as operation of between 70.8 - 80.9 dB(A) and 58.6 - 73 dB(A) respectively. Thecompressors, construction vehicles, concrete plants day and night time noise standard will exceed upto 200 m from theetc. road.
Water Quality and Temporary contamination of Mithi river due to Mithi river contamination possible only due to accidental spillage ofHydrology surface runoff from widening of bridges over the hazardous material from road tankers. No significant operation
river. Runoff could consist of contaminants such as stage impact.soil, sanitary wastes and oil.
Ecological Issues * Cutting/shifting of trees within 20 m of the road No significant adverse impact.in the westem section of JVLR.
* None of the floral species are rare orendangered.
Social In all 890 residential and commercial structures will Nil(Rehabilitation and be affected by the project. These will need to beResettlement) relocated or compensated.Land Degradation High potential for soil erosion, change in Nil
topography, especially at the quarry sites.
7-25

Mumbai Urban Transport Project Consolidated Environmental Assessment
Table 7.4 (b) Summary of Impacts for Borivali - Virar Quadrupling of Rail Lines (BVQR) Project
Environmental Construction Operation Stage ImpactsComponent taage ImpactsAir Quality Temporary increase in ambient SPM ancr * dOx levels No adverse impact as electric trains will be operated.
due to earthwork, handling construction materialand use of fire wood for cooking by on-site laborers.
Noise Levels Nuisance to nearby residents due to noise from Baseline noise levels already exceed noise standards. For the yearconsiruction activities such as operation of 2011 the maximum increase in noise levels due to railway over thecompressors, construction vehicles, concrete plants baseline noise at sensitive receptors Is only 1.7 dB(A). Theetc. sensitive receptors are 2 hospitals and 2 educational institutes. Thus
the impact is insignificant.Water Quality and 15 major and minor bridges at various creek No adverse impact expected.Hydrology locations are planned. No obstruction of existing
water courses is expected. Temporarycontamination of creek water due to runoff fromconstruction site, consisting of contaminants suchas soil, sanitary wastes and oily wastes
Ecological Issues * Trees within 20 m from the outermost track will No significant adverse impact.be lost.
* In addition mangrove vegetation will be lost nearJaffery creek, and Bassein creek. About 8500numbers of Avicennia marina will be lost.
Social In all 250 residential and commercial structures will Nil(Rehabilitation and be affected by the project. These will need to beResettlement) relocated or compensated.Land Degradation High potential for soil erosion, change in topography Nil
especially at the quarry sites from where sand andstone will be sourced.
7-26

Mumbai Urban Transport Project Consolidated Environmental Assessment
Table 7.4 (c) Summary of Impacts for ROB AT VIKHROLI
Environmental Construction Operation Stage ImpactsComponent Stage ImpactsAir Quality Temporary increase in ambient SPM and NOx /CO 0 Predicted CO and Nox levels within NAAQS except for
levels due to earthwork, handling construction locations 10 m from the ROB. Baseline CO and NOx levels wellmaterial and use of fire wood for cooking by on- within the standards.site labourers.
0 Both the baseline and predicted (for the year 2011) PM1o levelsexceed the standards.
Noise Levels Nuisance to nearby residents and sensitive Day and night time predicted noise levels for the year 2011 rangedreceptors (2 schools and a church) due to noise between 61.4 - 67.5 dB(A) and 57.3 - 63.4 dB(A) respectively.from construction activities such as operation of Overall noise levels are expected to increase from that of the basecompressors, construction vehicles, concrete year.
_________________ plants etc.Ecological Issues * Clearance of minor road side vegetation - No significant adverse impact.
About 10 grown trees will be cut.* none of the floral species are of rare or
endangeredSocial Dislocation of about 185 (G+1) structures with Nil(Rehabilitation and small business units in the ground floor andResettlement) residential areas in upper floor. These will need to
be relocated or compensated.Land degradation Temporary contamination of soil due to wastes Nil
from construction activities such as debris/oilywastes and sanitary wastes from labour camps, ifany.
7-27

Mumbai Urban Transport Project Consolidated Environmental Assessment
Table 7.4 (d) Summary of Impacts - EDESTRIAN SUBWAY AT CST.
Environmental Construction Operation Stage ImpactsComponent Stage ImpactsAir Quality Temporary Increase in ambient SPM levels due to * Ambient Air quality In the area is expected to improve, due to
earthwork, handling construction material. significant easing of traffic congestion.
* Both the baseline and predicted (for the year 2011) PM1o levelsexceed the standards.
Noise Levels Nuisance to nearby residents due to noise from Average day and night time predicted noise levels for the yearconstruction activities such as operation of 2011 are 84.51 dB(A) and 78.49 dB(A) respectively. Noise levels
_ compressors, drilling work etc. are not expected to change significantly from baseline values.Land degradation Temporary contamination of soil due to wastes from Nil
construction activities such as debris/oily wastes andsanitary wastes from labour camps.
Traffic and Disruption of existing traffic and pedestrian Substantial benefits from improved vehicle speeds, reduction InTransport inconvenience at CST junction. traffic congestion, faster pedestrian movement.
7-28

Mumbai Urban Transport Project Consolidated Environmental Assessment
Table 7.4 (e) Summary of Impacts for Station Area Improvement Scheme (SATIS) at Thane West
Environmental Construction Operation Stage ImpactsComponent Stage ImpactsAir Quality Insignificant - Minimal construction activity. Baseline CO, PM10 and HC levels exceed NAAQ standards.
No major beneficial impact on AAQ. Existing AAQ mayfurther worsen due to increase in vehicular traffic.
Noise Levels Marginal increase in noise levels due to noise from Average day and night time predicted noise levels for theconstruction activities. year 2001 are 78.5 dB(A) and 72.5 dB(A) respectively.
Noise levels are not expected to change significantly frombaseline values.
Traffic and Disruption of existing traffic and pedestrian inconvenience at Improved vehicle speeds, reduction in traffic congestion,Transport CST junction. faster pedestrian movement.
7-29

Mumbai Urban Transport Project Consolidated Environmental Assessment
TABLE 7.5 Enviroi,_ ,ntal Management Plan for Jogeshwari-Vikhroli Link Road Project (JVLR)
PRE-CONSTRUCTION / DESIGN STAGE
Environmental Mitigation Measures Reference to Time ResponsibilityImpact Contract Frame Implementatlon Supervislon
DocumentsEcological Trees to be removed before commencement Legal Before Start Contractor / PMC PIAimpacts such as of construction, with prior permission from requirement. oftree cufting and MCGM. constructiondestruction ofmangroves Road alignment shall be selected in such a
way that there is minimum destruction oftrees.
Resettlement The acquisition of land and property shall be RAP Requirement Before Start MMRDA MMRDAand rehabilitation carried out in accordance to the RAP and of
entitlement framework of the project. It shall constructionbe ensured that all R&R activities be of relevantreasonably completed as per RAP, before section.the construction activity starts in the relevantsection.
Utility relocation All utilities, such as electrical installations, Project Before Start PIA MMRDAtelephone lines etc. to be shifted after prior requirement ofapproval of agencies. construction
Noise poilution Based on noise monitoring results, noise Project Before Start PIA MMRDAcontrol plans to be prepared. The plans shall requirement ofinclude the installation of noise barriers constructionincluding additional road side plantationwhere practical.
7-30

Mumbai Urban Transport Project Consolidated Environmental Assessment
TABLE 7.5 CONT..CONSTRUCTION STAGE EMP (JVLR PROJECT)Environmental Mitigation Measures Reference to Time Frame ResponsibilityImpact/lssue Contract Implementation Supervision
DocumentsGeneration of All vehicles delivering material to the site shall be MOST:1 11.9 During Contractor I PMC PIA, MMRDADust due to covered to avoid material spillage. While unloading constructionconstruction material, fall height shall be kept low to minimizeactivity fugitive dust generation.
Contractor shall take precaution to reduce dust MOST 111.5emissions from the hot mix plants. Emissions shouldmeet emission control legislation.Construction site to be watered periodically tominimize fugitive dust generation.All existing highways and roads used by the vehicles MOST: 111.9of contractor and his team shall be kept clean andclear of all dust, mud and other extraneous materialdropped by such vehicles.All Earthwork and construction material should be Contractprotected in such a manner so as to minimize Documentsgeneration of dust.
Construction Exhaust emissions from all construction vehicles shall Contract During Contractor / PMC PIA, MMRDAVehicle/equipm- adhere to vehicle emission norms. requirement constructionent exhaustNoise from All vehicle and construction equipment shall be fitted MOST 111.1 Duringvehicles, plants with exhaust silencers. Damaged silencers to be constructionand equipment promptly replaced by contractor.
All construction equipment (particularly DG sets, shall MOST:11 1.13adhere to noise standards of Ministry of Environmentand Forests.
Contractor shall ensure that noise levels near MOST:1 11.13residential areas are within the day time and night timenoise standards under the Environmental (Protection)Rules, 1986 and its amendments.Operation of noise generating equipment such as pile Contractdriving, concrete and drilling etc. shall be limited to day requirementtime hours.
7-31

Mumbal Urtban Transport Project Consolidated Environmental Assessment
TABLE 7.5 CONT..CONSTRUCTION STAGE EMP (JVLR PROJECT)
Environmental Mitigation Measures Reference to Tlime Frame ResponsibilityImpact/Issue Contract Implementation Supervision
__ _ _ _ _ _ _ _ _ _ _ _ _ _ _ _ _ _ _ _ _ _ _ ___ DocumentsNoise from Workers exposed to loud noise (As per Factory Act MOST: 111.6 During Contractor / PMC PIA, MMRDAvehicles, plants requirements) shall wear earplugs/earmuffs constructionand equipment _.Contamination of Sill .. i icing shall be provided as the base of the MOST: 306 During Contractor /PMC PIA, MMRDAMithi River and embankment for the entire perimeter of any water body constructionother water (including wells)bodies. Construction material containing fine particles shall be MOST: 306
stored in an enclosure such that sediment laden waterdoes not drain into nearby water courses.Siltation of soil into water bodies shall be prevented as MOST: 305.2.2.2far as possible by adapting soil erosion control MOST: 306.2measures as per MoST guidelinesConstruction work close to streams or water bodies MOST 111.13shall be avoided during monsoon.In sections along water courses and close to crossdrainage channels, earth, stone or any otherconstruction material shall be properdy disposed so asnot to block the flow of water.
Ecological All works shall be carried out in such a fashion that Contract During Contractor/ PMC PIA, MMRDAimpacts such as damage to flora is minimum requirement constructiontree cunting and Trees and other flora shall be cut only after receingdestruction of clearances from appropriate agencymangroves Road side plantation shall be done as per pre-
approved plan.Soil erosion On road embankments, slopes shall be stabilized. The MOST: 306.2/ During Contractor/ PMC PIA, MMRDA
work shall consist of measures as per design, or as Design document constructiondirected by the engineer to control soil erosion,sedimentation and water pollution, through use ofberms, dikes, sediment basin, mulches, grasses, slopedrains and other devices. _
7-32

Mumbai Urban Transport Project Consolidated Environmental Assessment
TABLE 7.5 CONT..CONSTRUCTION STAGE EMP (JVLR PROJECT)
Environmental Mitigation Measures Reference to Time Frame Respo sibilityImpactAIssue Contract Implementation Supervislon
DocumentsDebris disposal Debris generated due to dismantling of existing MOST: 112.6 During Contractor/ PMC PIA, MMRDA
pavement/structures shall be suitably reused in MOST :112.2 constructionproposed construction. Unutilisable debris shall besuitably disposed either as fill material or at pre-designated dump locations, approved by engineer.Care should be taken that the material does not blocknatural drainage or contaminate water bodies.Bentonite slurry or similar debris generated from piledriving or other construction activities shall be disposedsuch that it does not flow into surface water bodies orform mud puddles in the area.
Loss of top soil The top soil from all areas of cutting and all areas to be MOST: 300 During Contractor/ PMC PIA, MMRDApermanently covered shall be stripped to a specified constructiondepth of 150 mm and stored in stock piles.
The top soil from the stock pile shall be used to coverdisturbed areas and cut slopes and also for re-development of borrow areas, landscaping and roadside plantation.
Soil Oil and fuel spills from construction equipment shall be Contract Document During Contractor / PMC PIA, MMRDAcontamination by minimized by good O&M practices. Soils contaminated constructionconstruction by such spills shall be disposed as per MOEFwastes, fuel etc. requirements. _
Land Sand and stones shall be sourced from only pre- MOST 111.3 During Contractor/ PMC PIA, MMRDAdegradation in approved and licensed quarries. It should be assured constructionquarry that these quarries have a quarry rehabilitation plan. _
7-33

Mumbai Urtban Transport Project Consolidated Environmental Assessment
TABLE 7.5 CONT..CONSTRUCTION STAGE EMP (JVLR PROJECT)
Environmental Mitigation Measures Reference to Time Frame ResponsibilityImpact/Issue Contract Implementation Supervision
DocumentsHealth and Construction labour camps shall be located at least Contract Document Durng Contractor PMC PIA, MMRDAhygiene at 200 m away from the nearest habitation to avoid constructionconstruction conflicts and stress over infrastructure facilities.labour camps The contractor will provide, erect and maintain
necessary (temporary) living accommodation andancillary facilities such as toilet blocks, potable watersupply etc. for labour as per the standards set by theBuilding and other construction Workers (Regulation ofEmployment and Conditions of Service) Act, 1996 andAhall be approved by the engineer.
On completion of the works, all such temporarystructures shall be cleared away along with all wastes.All excreta and other disposal pits should be filled inand effectively sealed. The site should be left clean
_____________ and tidy to the satisfaction of the engineer.Traffic delays Detailed traffic control plan shall be prepared 5 days MOST: 112.1 Before PIA MMRDAand congestion prior to commencement of works on any section of the Construction
road. The control plans shall contain details oftemporary diversions, details of arrangement ofconstruction under traffic.Special consideration shall be given in preparation of MOST: 112.2 PIA MMRDAtraffic control plan to the safety of pedestrians andworkers at night.Temporary traffic detours shall be kept free of dust by MOST: 112.5 Contractor / PMC PIAfrequent application of water, if necessary.
Traffic Control The contractor shall take all necessary measures for MOST: 112.4 Before Contractor / PMC PIAand Safety the safety of traffic during ctr oistruction and provide, MOST: 112.1 Construction
erect and maintain such barricades, including signs,markings, flags, lights and flagmen as may be requiredby the engineer for the information and protection oftraffic. All such measures should be as perrequirement of MOST.
7-34

Mumbai Urban Transport Project Consolidated Environmental Assessment
TABLE 7.5 CONT..CONSTRUCTION STAGE EMP (JVLR PROJECT)
Environmental Mitigation Measures Reference to Time Frame Respo sibilityImpact/lssue Contract Implementation Supervision
.__ _ _ _ _ __ DocumentsOccupational The contractor is required to comply with all the Contract During Contractor / PMC PIA, MMRDAHealth and precautions as required for the safety of workmen as Requirement ConstructionSafety per the International Labour Organisation (ILO)
Convention No. 62, as far as those are applicable tothe contract.The contractor shall supply all necessary safetyappliances such as safety goggles, helmets, safetybelts, ear plugs, masks etc. to the worker and staff. Alllaws related to safe scaffolding, ladders, workingplatform, gangway, stairwells, excavations, safety entryand exit etc. shall be complied with.Adequate precautions shall be taken to prevent danger MOST: 106 During Contractor / PMC PIA, MMRDAfrom electrical equipment. All machines/equipment Constructionused shall confirm to the relevant Indian Standards (IS)codes and shall be regularly Inspected by the engineer.A readily available first aid unit including an adequate Contract During Contractor / PMC PIA, MMRDAsupply of sterilized dressing material and appliances Requirement Constructionshall be provided as per the requirements under theFactory Act.All anti-malarial measures as prescribed by the Contract During Contractor/ PMC PIA, MMRDAengineer shall be complied with, including filling up of Requirement Constructionburrow pits.
7-35

Mumbai Urban Transport Project Consolidated Environmental Assessment
TABLE 7.5 CONT..OPERATION STAGE EMP (JVLR PROJECT)
Environmental Mitigation Measures Reference to Time Frame ResponsibliltyImpact/Issue Contract Implementation Supervision
DocumentsAtmospheric Ambient air concentrations of various pollutants shall be Project Starting immediately Pollution monitoring MMRDA, Worldpollution monitored as per the pollution monitoring plan. requirement after completion of agency (MCGM) Bank
Vehicle exhaust standards shall be enforced strictly. constructionRoad side plantation to be maintained
Noise pollution Monitoring of noise levels at sensitive receptors as per Project Starting immediately Pollution monitoring MMRDA, Worldmonitoring plan. requirement after completion of agency. (MCGM) BankPublic awareness campaigns for noise reduction constructionincluding placing adequate 'No Honking" sign boards at RTO, PIAsensitive locations.
Land and water Contingency plans to be in place for spill clean-up Project Starting immediately RTO, PIA MMRDAcontaminationreurmn afecoptinffrom accidental Spill prevention and waste fuel/oil treatment and disposal requirement after completion offrom accidental to be made mandatory for utilities such as auto-service constructionspills station, petrol pumps along the entire stretch of the
construction.Storm water and All drains to be maintained and cleaned periodically. Project Starting immediately Municipal authority, MMRDAdrain requirement after completion of PIAmaintenance constructionTraffic and Traffic management plans shall be prepared. Project Through operation PIA, Development MMRDAsafety Road control width to be enforced. Unauthorised requirement stage Authorities
building development to be checked. Slumencroachments to be discouraged.Traffic control measures including speed limits to beenforced strictly.Traffic volume and speed to be monitored to recordbenefits achieved from the project.
7-36

Mumbai Urban Transport Project Consolidated Environmental Assessment
TABLE 7.6 Environmental Management Plan for Borivall - Virar Quadrupling of Rail Lines (BVQR) Project
PRE-CONSTRUCTION I DESIGN STAGE_____Environmental Mitigation Measures Reference to Time Respon__b__t_Impact Contract Frame Implementation Supervision
___ ___ ___ _ _ ___ ___ ___ ___ ___ ___ ___ ___ D ocum ents _ _ _ _ _ _ _ _ _ _
Ecological Trees to be removed before commencement Legal Before Start Contractor/PIVC PIAimpacts such as of construction, with prior permission from requirement. oftree cutting and MCGM / Forest Department.. constructiondestruction Ofmangroves. __ _ _ _ _ _ _ _ _ _ _ _ _ _ _ _ _ _
Resettlement The acquisition of land and property shall be RAP Requirement Before Start MMRDAIPIA MMRDAand rehabilitation carried out in accordance to the RAP and of
entitlement framework of the project. It shall constructionbe ensured that all R&R activities bereasonably completed as per RAP, beforethe construction activity starts ______
Utility relocation All utilities, such as electrical installations, Project Before Start PIA MMRDAtelephone lines etc. to be shifted after prior requirement of
______________ approval of agencies. _________ constructionNoise pollution Noise control plans to be prepared. This shall Project Bef ore Start PIA MMRDA
include installation of noise barriers at requirement Of_______ _____ I sensitive receptors. construction _ _ _ _ _ _ _ _ _ _ _ _ _ _
7-37

Mumbai Urban Transport Project Consolidated Environmental Assessment
TABLE 7.6 CONT..CONSTRUCTION STAGE EMP (BVQR PROJECT)
Environmental Mitigation Measures Reference to Time Frame ResponsibilityImpactAlssue Contract Implementation Supervision
DocumentsGeneration of All vehicles delivering material to the site shall be MOST:1 11.9 During Contractor /PMC PIA, MMRDADust due to covewe1 to avoid material spillage. While unloading constructionconstruction material, fall height shall be kept low to minimize Duringactivity fugitive dust generation. construction
Construction site to be watered periodically tominimize fugitive dust generation.All existing highways and roads used by the vehicles MOST:1 11.9of contractor and his team shall be kept clean andclear of all dust, mud and other extraneous materialdropped by such vehicles.All Earthwork and construction material should Contractprotected in such a manner so as to minimize Documentsgeneration of dust.
Construction Exhaust emissions from all construction vehicles shall Contract During Contractor /PMC PIA, MMRDAVehicle/equipm- adhere to vehicle emission norms. requirement constructionent exhaustNoise from All vehicle and construction equipment shall be fitted MOST 111.1 During Contractor /PMC PIA, MMRDAvehicles, plants with exhaust silencers. Damaged silencers to be constructionand equipment prompty replaced by contractor.
All construction equipment (particularly DG sets, shall MOST:1 11.13adhere to noise standards of Ministry of Environmentand Forests.
Contractor shall ensure that noise levels near MOST:1 11.13residential areas are within the day time and night timenoise standards under the Environmental (Protection)Rules, 1986 and its amendments.Operation of noise generating equipment such as Contractcompacting, drilling, blasting etc. shall be limited to requirementday time hours.
7-38

Mumbai Urban Transport Project Consolidated Environmental Assessment
TABLE 7.6 CONT.CONSTRUCTION STAGE EMP (BVQR PROJECT)Environmental Mitigation Measures Reference to Time Frame Respon sibliltyImpact/lssue Contract Implementation Supervislon
DocumentsNoise from Workers exposed to loud noise (As per Factory Act MOST: 111.6 During Contractor /PMC PIA, MMRDAvehicles, plants requirements) shall wear earplugs/earmuffs constructionand equipmentContamination of Silt fencing shall be provided at the base of the MOST: 306 During Contractor /PMC PIA, MMRDAcreek water at embankment for the entire perimeter of any water body constructionvarious bridge (including wells)locations and Construction material containing fine particles shall be MOST: 306other water stored in an enclosure such that sediment laden waterbodies such as does not drain into nearby water courses.wells and Siltation of soil into water bodies shall be prevented as MOST: 305.2.2.2lakes/ponds. far as possible by adapting soil erosion control MOST: 306.2
measures as per MoST guidelinesConstruction work close to water bodies shall be MOST 111.13avoided during monsoon.In sections along water courses and close to crossdrainage channels, earth, stone or any otherconstruction material shall be properly disposed so as
_not to block the flow of water.Ecological All works shall be carried out in such a fashion that Contract Dunng Contractor/PMC PIA, MMRDAImpacts such as damage to flora is minimum requirement constructiontree cutting and Trees and other flora shall be cut only after receivingdestruction of clearances from appropriate agencymangroves Track - side plantation shall be done as per pre-
approved plan.Soil erosion On road/track embankments, slopes shall be MOST: 306.2 / During Contractor/PMC PIA, MMRDA
stabilized. The work shall consist of measures as per Design document constructiondesign, or as directed by the engineer to control soilerosion, sedimentation and water pollution, throughuse of berms, dikes, sediment basin, mulches,grasses, slope drains and other devices.
7-39

Mumbai Urban Transport Project Consolidated Environmental Assessment
TABLE 7.6 CONT.CONSTRUCTION STAGE EMP (BVQR PROJECT)
Environmental Mitigation Measures Reference to Time Frame ResponsibilityImpact/issue Contract Implementation Supervision
DocumentsDebris disposal Debris generated due to dismantling of existing MOST: 112.6 During Contractor/PMC PIA, MMRDA
pavement/structures shall be suitably reused in MOST :112.2 coi ''ructionproposed construction. Unutilisable debris shall besuitably disposed either as fill material or at pre-designated dump locations, approved by engineer.Care should be taken that the material does not blocknatural drainage or contaminate water bodies.Bentonite slurry or similar debris generated from piledriving or other construction activities shall be disposedsuch that it does not flow into surface water bodies orform mud puddles in the area.
Loss of top soi! The top soil from all areas of cufting and all areas to be MOST: 300 During Contractor/PMC PIA, MMRDApermanently covered shall be stripped to a specified constructiondepth of 150 mm and stored in stock piles.
The top soil from the stock pile shall be used to coverdisturbed areas and cut slopes and also for re-development of borrow areas, landscaping and roadside plantation.
Soil Oil and fuel spills from construction equipment shall be Contract Document During Contractor/PMC PIA, MMRDAcontamination by minimized by good O&M practices. Soils contaminated constructionconstruction by such spills shall be disposed as per MOEFwastes, fuel etc. requirements.Land Sand and stones shall be sourced from only pre- MOST 111.3 During Contractor/PMC PIA, MMRDAdegradation in approved and licensed quarries. It should be assured constructionquarry that these quarries have a quarry rehabilitation plan.
7-40

Mumbai Urban Transport Project Consolidated Environmental Assessment
TABLE 7.6 CONT.CONSTRUCTION STAGE EMP (BVQR PROJECT)
Environmental Mitigation Measures Reference to Time Frame ResponsibilityImpact/lssue Contract Implementation Supervision
DocumentsHealth and Construction labour camps shall be located at least Contract Document During Contractor/PMC PIA, MMRDAhygiene at 200 m away from the nearest habitation to avoid constructionconstruction conflicts and stress over infrastructure facilities.labour camps The contractor will provide, erect and maintain
necessary (temporary) living accommodation andancillary facilities such as toilet blocks, potable watersupply etc. for labour as per the standards set by theBuilding and other construction Workers (Regulation ofEmployment and Conditions of Service) Act, 1996 andshall be approved by the engineer.On completion of the works, all such temporarystructures shall be cleared away along with all wastes.All excreta and other disposal pits should be filled inand effectively sealed. The site should be left cleanand tidy to the satisfaction of the engineer.
Delays and The construction plan shall be discussed in advance MOST: 112.1 Before Contractor/PMC PIAcongestion on with Western Railway Authorities to avoid delays in Constructiontracks existing train schedules.
Special consideration shall be given In preparation of MOST: 112.2traffic control plan to the safety of pedestrians (atrailway crossings) and workers at night.
Traffic Control The contractor shall take all necessary measures for Contract Document During Contractor/PMC PIAand Safety the safety of existing train traffic during construction construction
and provide, erect and maintain such barricades,including signs, markings, flags, lights and flagmen asmay be required by the engineer for the informationand protection of traffic. All such measures should asper requirement of Westem Railway.
7-41

Mumbai Urban Transport Project Consolidated Environmental Assessment
TABLE 7.6 CONT.CONSTRUCTION STAGE EMP (BVQR PROJECT)
Environmental Mitigation Measures Reference to Time Frame Responsibilitylmpactlssue Contract Implementation Supervision
.___________ DocumentsOccupational The contractor is required to comply with all the Contract During Contractor/PMC PIA, MMRDAHealth and precautions as required for the safety of workmen as Requirement ConstnuctionSafety per the International Labour Organisation (ILO)
Convention No. 62, as far as those are applicable tothe contract.The contractor shall supply all necessary safetyappliances such as safety goggles, helmets, safetybelts, ear plugs, masks etc. to the worker and staff. Alllaws related to safe scaffolding, ladders, workingplatformn, gangway, stairwells, excavations, safety entryand exit etc. shall be complied with.Adequate precautions shall be taken to prevent danger MOST: 106 During Contractor/PMC PIA, MMRDAfrom electrical equipment. All machines/equipment Constructionused shall confirm to the relevant Indian Standards (IS)codes and shall be regularly inspected by the engineer.A readily available first aid unit including an adequate Contract During Contractor/PMC PIA, MMRDAsupply of sterilized dressing material and appliances Requirement Constructionshall be provided as per the requirements under theFactory Act.All anti-malarial measures as prescribed by the Contract During Contractor/PMC PIA, MMRDAengineer shall be complied with, including filling up of Requirement Constructionburrow pits.
7-42

Mumbai Urban Transport Project Consolidated Environmental Assessment
TABLE 7.6 CONT.OPERATION STAGE EMP (BVQR PROJECT)
Environmental Mitigation Measures Time Frame Respons lbilityImpact/issue Implementation SupervisionNoise pollution Monitoring of noise levels at sensitive receptors as per Starting Pollution monitoring MMRDA, World
monitoring plan. Immediately after agency - MCGB Bankcompletion of
Maintenance of track-side plantation construction Westem Railway MMRDALand and water Contingency plans to be in place for spill clean-up Starting Westem Railway MMRDAcontamination immediately afterfrom accidental completion ofspills from goods constructiontrains.Rail traffic and Unauthorised building development to be checked. Through operation PIA, Development MMRDAsafety Slum encroachments to be discouraged. stage Authorities,
Western Railway
Loss of Regular maintenance of compensatory plantation Through operation Westem Railway MMRDAmangrove and done. stagetrack-sideplantations
7-43

Mumbai Urban Transport Project Consolidated Environmental Assessment
TABLE 7.7 Environmental Management Plan for ROB at Vikhroll
PRE-CONSTRUCTION I DESIGN STAGE
Environmental Mitigation Measures Reference to Tlme Respons bilityImpact Contract Frame Implementation Supervision
DocumentsEcological Trees to be removed before commencement Legal Before Start Contractor/PMC PIAImpacts such as of construction, with prior permission from requirement. oftree cutting MCGB / Forest Department.. construction
Road alignment shall be selected in such away that there is minimum destruction oftrees.
Resettlement The acquisition of land and property shall be RAP Requirement Before Start MMRDA MMRDAand rehabilitation carried out in accordance to the RAP and of
entitlement framework of the project. It shall constructionbe ensured that all R&R activities bereasonably completed as per RAP, beforethe construction activity starts
Utility relocation All utilities, such as electrical installations, Project Before Start PIA MAMRDAtelephone lines etc. to be shifted after prior requirement ofapproval of agencies. construction
Noise pollution Noise control plans to be prepared. This Legal Before Starl PIA MMRDAshall include the installation of noise barriers requirement. ofincluding additional road side plantation constructionwhere practical (refer PLEA report of March1998 for barrier design details)
7-44

Mumbai Urban Transport Project Consolidated Environmental Assessment
TABLE 7.7 CONT..CONSTRUCTION STAGE EMP (VIKHROLI ROB PROJECT)Environmental Mitigation Measures Reference to Time Frame Respon IbilityImpact/Issue Contract Implementation Supervision
DocumentsGeneration of All vehicles delivering material to the site shall be MOST:1 11.9 During Contractor/PMC PIA, MMRDADust due to covered to avoid material spillage. While unloading constructionconstruction material, fall height shall be kept low to minimizeactivity fugitive dust generation.
Contractor shall take precaution to reduce dust MOST 111.5emissions from the hot mix plants. Emissions shouldmeet emission control legislation.Construction site to be watered periodically tominimize fugitive dust generation.All existing highways and roads used by the vehicles MOST: 111.9of contractor and his team shall be kept clean andclear of all dust, mud and other extraneous materialdropped by such vehicles.All Earthwork and construction material should Contractprotected in such a manner so as to minimize Documentsgeneration of dust.
Construction Exhaust emissions from all construction vehicles shall Contract Dunng Contractor/PMC PIA, MMRDAVehicle/equipm- adhere to vehicle emission norms. requirement constructionent exhaustNoise from All vehicle and construction equipment shall be fitted MOST 111.1 Duringvehicles, plants with exhaust silencers. Damaged silencers to be constructionand equipment promptly replaced by contractor.
All construction equipment (particularly DG sets, shall MOST:1 11.13adhere to noise standards of Ministry of Environmentand Forests.
Contractor shall ensure that noise levels near MOST:1 11.13residential areas are within the day time and night timenoise standards under the Environmental (Protection)Rules, 1986 and its amendments.Operation of noise generating equipment such as pile Contractdriving, concrete and drilling etc. shall be limited to day requirementtime hours.
7-45

Mumbai Urban Transport Project Consolidated Environmental Assessment
TABLE 7.7 CONT..CONSTRUCTION STAGE EMP (VIKHROLI ROB PROJECT)
Environmental Mitigation Measures Reference to Time Frame Responsibilityimpact/issue Contract Implementatlion Supervision
DocumentsNoise from Workers exposed to loud noise (As per Factory Act MOST: 111.6 During Contractor/PMC PIA, MMRDAvehicles, plants requirements) shall wear earplugsJearmuffs constructionand equipment Noise barriers and other noise attenuation measures, During Contractor/PMC PIA, MMRDA
as prescribed in the Noise Control Plan (design stage) constructionto be constructedAinstalled.
Contamination of Silt fencing shall be provided as the base of the MOST: 306 During Contractor/PMC PIA, MMRDAMithi River and embankment for the entire perimeter of any water body constructionother water (including wells) _bodies. Construction material containing fine particles shall be MOST: 306
stored in an enclosure such that sediment laden waterdoes not drain into nearby water courses.Siltation of soil into water bodies shall be prevented as MOST: 305.2.2.2far as possible by adapting soil erosion control MOST: 306.2measures as per MoST guidelinesConstruction work close to streams or water bodies MOST 111.13shall be avoided during monsoon.In sections along water courses and close to crossdrainage channels, earth, stone or any otherconstruction material shall be properly disposed so asnot to block the flow of water.
Ecological All works shall be carried out in such a fashion that Contract During Contractor/PMC PIA, MMRDAimpacts such as damage to flora is minimum requirement constructiontree cutting Trees and other flora shall be cut only after receiving
clearances from appropriate agencyRoad side plantation shall be done as per pre-
I approved plan. I
7-46

Mumbai Urban Transport Project Consolidated Environmental Assessment
TABLE 7.7 Cont..CONSTRUCTION STAGE EMP (VIKHROLI ROB PROJECT)
Environmental Mitigation Measures Reference to Time Frame ResponsibilityImpactlssue Contract Implementation Supervision
DocumentsDebris disposal Debris generated due to dismantling of existing MOST: 112.6 During Contractor/PMC PIA, MMRDA
pavement/structures shall be suitably reused in MOST :112.2 constructionproposed construction. Unutilisable debris shall besuitably disposed either as fill material or at pre-designated dump locations, approved by engineer.Care should be taken that the mateinal does not blocknatura drainage.Bentonite slurry or similar debris generated from piledrving or other construction activities shall be disposedsuch that it does not flow into surface water bodies(wells) ov form mud quddles in the area.
Soil Oil and fuel spills from construction equipment shall be Contract Document During Contractor PIA, MMRDAcontamination by minimized by good O&M practices. Sohis contaminated constructionconstruction by such spills shall be disposed as per MOEFwastes, fuel etc. requirements._Land Sand and stones shall be sourced from only pre- MOST111.3 During Contractor PIA,MMRDAdegradation in approved and licensed quaries. It should be assured constructionquarra that these fuarcies have a tuarre rehabilitation wlan.Health and Construction labour camps shall be located at least Contract Document Duhng Contractor PIA, MMRDAhygiene at 200 m away from the nearest habitation to avoid constructionconstruction conflicts and stress over infrastructure facilities.labour camps The contractor will provide, erect and maintain
necessary (temporary) living accommodation andancillary facilities such as toilet blocks, potable watersupply etc. for labour as per the standards set by theBuilding and other construction Workers (Regulation ofEmployment and Conditions of Service) Act, 1996 andshall be approved by the engineer.
7-47

Mumbai Urban Transport Project Consolidated Environmental Assessment
TABLE 7.7 CONT..CONSTRUCTION STAGE EMP (VIKHROLI ROB PROJECT)
Environmental Mitigation Measures Reference to Time Frame Respon sibilityimpactAissue Contract Implementation Supervision
DocumentsOn completion of the works, all such temporarystructures shall be cleared away along with all wastes.All excreta and other disposal pits should be filled inand effectively sealed. The site should be left cleanand tidy to the satisfaction of the engineer.
Traffic delays Detailed traffic control plan shall be prepared 5 days MOST: 112.1 Before PIA MMRDAand congestion prior to commencement of works on any section of the Construction
road. The control plans shall contain details oftemporary diversions, details of arrangement ofconstruction under traffic.Special consideration shall be given in preparation of MOST: 112.2 PIA MMRDAtraffic control plan to the safety of pedestrians andworkers at night.Temporary traffic detours shall be kept free of dust by MOST: 1 12.5 Contractor/PMC PIAfrequent application of water, if necessary.
Traffic Control The contractor shall take all necessary measures for MOST: 112.4 During Contractor/PMC PIAand Safety the safety of traffic during construction and provide, MOST: 112.1 construction
erect and maintain such barricades, including signs,markings, flags, lights and flagmen as may be requiredby the engineer for the information and protection oftraffic. All such measures should be as perrequirement of MOST.
7-48

Mumbai Urban Transport Project Consolidated Environmental Assessment
TABLE 7.7 Cont..CONSTRUCTION STAGE EMP (VIKHROLI ROB PROJECT)
Environmental Mitigation Measures Reference to Tilme Frame Respo sibilityImpactlssue Contract Implementation Supervision
DocumentsOccupational The contractor is required to comply with all the Contract During Contractor/PMC PIA, MMRDAHealth and precautions as required for the safety of workmen as Requirement ConstructionSafety per the International Labour Organisation (ILO)
Convention No. 62, as tar as those are applicable tothe contract.The contractor shall opf,ljy all necessary safetyappliances such as safety goggles, helmets, safetybelts, ear plugs, masks etc. to the worker and staff. Alllaws related to safe scaffolding, ladders, workingplatform, gangway, stairwells, excavations, safety entryand exit etc. shall be complied with.Adequate precautions shall be taken to prevent danger MOST: 106 During Contractor/PMC PIA, MMRDAfrom electrical equipment. All machines/equipment Constructionused shall confirm to the relevant Indian Standards (IS)codes and shall be regularly inspected by the engineer.A readily available first aid unit including an adequate Contract During Contractor/PMC PIA, MMRDAsupply of sterilized dressing material and appliances Requirement Constructionshall be provided as per thA requirements under theFactory Act.All anti-mal-'ial measures as prescribhrf by the Contract Duri'ig Contractor/PMC PIA, MMRDAengineer shall be complied with, includir,g ,lling up of Requirement Constructionburrow pits. I_I _
749

Mumbai Urban Transport Project Consolidated Environmental Assessment
TABLE 7.7 CONT..OPERATION STAGE EMP (VIKHROLI ROB PROJECT)
Environmental Mitigation Measures Reference to Time Frame ResponsibilityImpactlssue Contract Implementation Supervision
DocumentsAtmospheric Ambient air concentrations of various pollutants shall be Project requirement Starting Pollution monitoring MMRDApollution monitored as per the pollution monitoring plan. immediately after agency - MCGB
Vehicle exhaust standards shall be enforced strictly. completion ofRoad side plantation to be maintained construction
Noise pollution Monitoring of noise levels at sensitive receptors as per Project requirement Starting Pollution monitoring MMRDAmonitoring plan. immediately after agency.Public awareness campaigns for noise reduction completion ofincluding placing adequate "No Honking" sign boards at construction RTO, PIAsensitive locations.Restriction of heavy vehicles during day time only.Spill prevention and waste fuedoil treatment and disposal RTO, PIAto be made mandatory for utilities such as auto-servicestation, petrol pumps along the entire stretch of theconstruction. _
Storm water and All drains to be maintained and cleaned periodically. Project requirement Starting Municipal authority, MMRDAdrain immediately after PIAmaintenance completion of
constructionTraffic and Traffic management plans shall be prepared. Project requirement Through operation PIA, Development MMRDAsafety Traffic control measures including speed limits to be stage Authorities
enforced strictly.Traffic density to be monitored to record benefitsachieved from the project.
7-50

Mumbai Urban Transport Project Consolidated Environmental Assessment
TABLE 7.8 Environmental Management Plan for CST PEDESTRIAN SUBWAY PROJECT
PRE-CONSTRUCTION / DESIGN STAGE
Environmental Mitigation Measures Reference to Time Respons Ibillty|Impact Contract Frame Implementation Supervision
DocumentsTraffic delays Detailed traffic control plan shall be prepared MOST: 112.1 Before PIA MMRDAand congestion prior to commencement of works on any Construction
section of the road. The control plans shallcontain details of temporary diversions,details of arrangement of construction undertraffic.Special consideration shall be given in MOST: 112.2 Before PIA MMRDApreparation of traffic control plan to the safety Constructionof pedestrians.Selection of construction technology that MOST: 112.1 Before PIA MMRDAminimises in situ work that cause disruption Constructionto the traffic.
Utility protection Plans of all underground utilities, such as Project Before Start PIA MMRDAand relocation. sewerage, water pipelines etc. shall be requirement of
obtained and analysed prior to start of work. constructionRelated agencies shall be informed prior tostart of excavation/construction. .
7-51

Mumbai Urban Transport Project Consolidated Environmental Assessment
TABLE 7.8 CONT..CONSTRUCTION STAGE EMP (CST PEDESTRIAN SUBWAY PROJECT)Environmental Mitigation Measures Reference to Time Frame Respon lbilityImpact/lssue Contract Implementation Supervision
DocumentsGeneration of All vehicles carrying excavated material shall be MOST:1 11.9 During Contractor/PMC PIA, MMRDADust due to covered to avoid material spillage. While unloading constructionconstruction material, fall height shall be kept low to minimizeactivity fugitive dust generation.
Water sprinkling to minimize dust from excavated Contractmaterial. DocumentsConstruction site to be suitably enclosed to containfugitive dust emissions.All Earthwork and construction material shouldprotected in such a manner so as to minimizegeneration of dust.
Construction Exhaust emissions from all construction equipment Contract During Contractor/PMC PIA, MMRDAVehicle/equipm- (DG sets, compressors etc.) shall adhere to emission requirement constructionent exhaust norms. _
Noise from All vehicle and construction equipment shall be fitted MOST 111.1 Duringvehicles, plants with exhaust silencers. Damaged silencers to be constructionand equipment promptly replaced by contractor.Noise from All construction equipment (particularly DG sets, shall MOST:111.13vehicles, plants adhere to noise standards of Ministry of Environmentand equipment and Forests.
Operation of noise generating equipment such as pile Contractdriving, concrete and drilling etc. shall be done during requirementnight time as this area is predominantly pubic andcommercial where day time activity is more than nighttime.Workers exposed to loud noise (As per Factory Act MOST: 111.6 During Contractor/PMC PIA, MMRDArequirements) shall wear earplugs/earmuffs construction
7-52

Mumbai Urban Transport Project Consolidated Environmental Assessment
TABLE 7.8 CONT..CONSTRUCTION STAGE EMP (CST PEDESTRIAN. Y PROJECT)
Environmental Mitigation Measures Reference to Time Frame ResponsibilityImpactlIssue Contract Implementation Supervision
DocumentsDebris disposal Debris generated from excavated material and due to MOST: 112.6 n sting Contractor/PMC PIA, MMRDA
-iismantling of existing pavementstructures shall be MOST :112.2 cunstructionsuitably reused in proposed construction. Unutilisabledebris shall be suitably disposed as fill material at anapproved location elsewhere.
Traffic delays Detailed traffic control plan shall be prepared prior to MOST: 112.1 Before PIA MMRDAand congestion commencement of works on any section of the road. Construction
The control plans shall contain details of temporarydiversions, details of arrangement of constructionunder traffic.Special consideration shall be given in preparation of MOST 112.2 PIA MMRDAtraffic control plan to the safety of pedestrians. .
Traffic Control The contractor shall take all necessary measures for MOST: 112.4 During Contractor/PMC PIAand Safety the safety of traffic during construction and provide, MOST: 112.1 construction
erect and maintain such barricades, including signs,markings, flags, lights and flagmen as may be requiredby the engineer for the information and protection oftraffic. All such measures should be as perrequirement of MOST.
Occupational The contractor is required to comply with all the Contract During Contractor/PMC PIA, MMRDAHealth and precautions as required for the safety of workmen as Requirement ConstructionSafety per the Intemational Labour Organisation (ILO)
Convention No. 62, as far as those are applicable tothe contract.
7-53

Mumbai Urban Transport Project Consolidated Environmental Assessment
TABLE 7.8 CONT..CONSTRUCTION STAGE EMP (CST PEDESTRIAN SUBWAY PROJECT)
Environmental Mitigation Measures Reference to Time Frame ResponsibilityImpact/Assue Contract Implementation Supervision
DocumentsThe contractor shall supply all necessary safety Contract During Contractor/PMC PIA, MMRDAappliances such as safety goggles, helmets, safety Requirement Constructionbelts, ear plugs, masks etc. to the worker and staff. Alllaws related to safe scaffolding, ladders, workingplatform, gangway, stairwells, excavations, safety entryand exit etc. shall be complied with.Adequate precautions shall be taken to prevent danger MOST: 106 During Contractor/PMC PIA, MMRDAfrom electrical equipment. All machines/equipment Constructionused shall confirm to the relevant Indian Standards (IS)codes and shall be regularly inspected by the enaineer.A readily available first aid unit including an adequate Contract During Contractor/PMC PIA, MMRDAsupply of sterilized dressing material and appliances Requiremen! Constructionshall be provided as per the requirements under theFactory Act. l
7-54

Mumbai Urban Transport Project Consolidated Environmental Assessment
TABLE 7.8 CONT..OPERATION STAGE EMP (CST PEDESTRIAN SUBWAY PROJECT)
Environmental Mitigation Measures Reference to Time Frame Respon lbilityImpactAlssue Contract Implementation Supervislon
DocumentsAtmospheric Ambient air concentrations of various pollutants shall be Project requirement Starting Pollution monitoring MMRDApollution monitored as per the pollution monitoring plan. immediately after agency - MCGB
Vehicle emission standards shall be enforced strictly. completion ofconstruction
Noise pollution Monitoring of noise levels at various receptors as per Project requirement Starting Pollution monitoring MMRDAmonitoring plan. immediately after agency - MCGBPublic awareness campaigns for noise reduction completion ofincluding placing adequate 'No Honking" sign boards at construction RTOsensitive locations.
Traffic and Traffic management plans shall be prepared - Plans to Project requirement Through operation Development MMRDAsafety restrict commercial vehicles in station area. stage Authorities, RTO
Traffic volume and speed to be monitored to recordbenefits achieved from the project.
7-55

Mumbai Urban Transport Project Consolidated Environmental Assessment
TABLE 7.9 Environmental Management Plan for Station Area Improvement Scheme (SATIS) at Thane West
PRE-CONSTRUCTION / DESIGN STAGE
Environmental Mitigation Measures Reference to Time Respons billtyImpact Contract Frame Implementation Supervision
DocumentsTraffic delays Detailed traffic control plan shall be prepared MOST: 112.1 Before PIA MMRDAand congestion prior to commencement of works on any Construction
section of the road. The control plans shallcontain details of temporary diversions,details of arrangement of construction undertraffic.Special consideration shall be given in MOST: 112.2 PIA MMRDApreparation of traffic control plan to the safetyof pedestrians.
Relocation of Hawker relocation shall be carried out in RAP Requirement Before Start MMRDA MMRDAHawkers accordance to the RAP and entitlement of
framework of the project. It shall be ensured constructionthat all R&R activities be reasonablycompleted as per RAP, before theconstruction activity starts
7-56

Mumbai Urban Transport Project Consolidated Environmental Assessment
TABLE 7.9 CONT..CONSTRUCTION STAGE EMP (SATIS - THANE)Environmental Mitigation Measures Reference to Time Frame Respon IbilityImpact/lssue Contract Implementation Supervision
DocumentsGeneration of All vehicles carrying construction material shall be MOST:1 11.9 During Contractor/PMC PIA, MMRDADust due to covered to avoid material spillage. While unloading constructionconstruction material, fall height shall be kept low to minimizeactivity fugitive dust generation.
Water sprinkling to minimize dust from excavated Contractmaterial. DocumentsConstruction site to be suitably enclosed to containfugitive dust emissions.All Earthwork and construction material shouldprotected in such a manner so as to minimizegeneration of dust.
Construction Ex' ymissions from all construction equipment Contract During Contractor/PMC PIA, MMRDAVehicle/equipm- (L ;-, compressors etc.) shall adhere to emission requirement constructionent exhaust norms.Noise from All vehicle and construction equipment shall be fitted MOST 111.1 Duringvehicles, plants with exhaust silencers. Damaged silencers to be constructionand equipment promptly replaced by contractor.Noise from All construction equipment (particularly DG sets, shall MOST: 111.13vehicles, plants adhere to noise standards of Ministry of Environmentand equipment and Forests.
Operation of noise generating equipment such as pile Contractdriving, concrete and drilling etc. shall be done during requirementnight time as this area is predominantly pubic andcommercial where day time activity is more than nighttime.Workers exposed to loud noise (As per Factory Act MOST: 111.6 During Contractor/PMC PIA, MMRDArequirements) shall wear earplugs/earmuffs construction
7-57

Mumbai Urban Transport Project Consolidated Environmental Assessment
TABLE 7.9 CONT..CONSTRUCTION STAGE EMP (SATIS - THANE)
Environmental Mitigation Measures Reference to Time Frame Respon sibilityImpact/issue Contract Implementation Supervision
DocumentsDebris disposal Debris generated from due to any dismantling of MOST: 112.6 During Contractor/PMC PIA, MMRDA
existing pavement/structures shall be suitably reused MOST :112.2 constructionin proposed construction. Unutilisable debris shall besuitably disposed as fill material at an approvedlocation elsewhere.
Traffic delays Detailed traffic control plan shall be prepared prior to MOST: 112.1 Before PIA MMRDAand congestion commencement of works on any section of the road. Construction
The control plans shall contain details of temporarydiversions, details of arrangement of constructionunder traffic.Special consideration shall be given in preparation of MOST: 112.2 PIA MMRDAtraffic control plan to the safety of pedestrians.
Traffic Control The contractor shall take all necessary measures for MOST: 112.4 During Contractor/PMC PIAand Safety the safety of traffic during construction and provide, MOST: 112.1 construction
erect and maintain such barricades, including signs,markings, flags, lights and flagmen as may be requiredby the engineer for the information and protection oftraffic. All such measures should be as perrequirement of MOST.
Occupational The contractor is required to comply with all the Contract During Contractor/PMC PIA, MMRDAHealth and precautions as required for the safety of workmen as Requirement ConstructionSafety per the Intemational Labour Organisation (ILO)
Convention No. 62, as far as those are applicable tothe contract.
7-58

Mumbai Urban Transport Project Consolidated Environmental Assessment
TABLE 7.9 CONT..CONSTRUCTION STAGE EMP (SATIS - THANE)
Environmental Mitigation Measures Reference to Time Frame RespolsibilityImpact/issue Contract Implementation Supervision
DocumentsThe contractor shall supply all necessary safety Contract During Contractor/PMC PIA, MMRDAappliances such as safety goggles, helmets, safety Requirement Constructionbelts, ear plugs, masks etc. to the worker and staff. Alllaws related to safe scaffolding, ladders, workingplatform, gangway, stairwells, excavations, safety entryand exit etc. shall be complied with.Adequate precautions shall be taken to prevent danger MOST: 106 During Contractor/PMC PIA, MMRDAfrom electrical equipment. All machines/equipment Constructionused shall confirm to the relevant Indian Standards (IS)codes and shall be regularly inspected by the engineer.A readily available first aid unit including an adequate Contract During Contractor/PMC PIA, MMRDAsupply of sterilized dressing material and appliances Requirement Constructionshall be provided as per the requirements under theFactory Act.
7-59

Mumbai Urban Transport Project Consolidated Environmental Assessment
TABLE 7.9 CONT..OPERATION STAGE EMP (SATIS - THANE)
Environmental Mitigation Measures Reference to Time Frame Respon IbilityImpact/ssue Contract Implementation Supervision
DocumentsAtmospheric Ambient air concentrations of various pollutants shall be Project requirement Starting Pollution monitoring MMRDApollution monitored as per the pollution monitoring plan. immediately after agency - MCGB
Vehicle emission standards shall be enforced strictly. completion ofconstruction
Noise pollution Monitoring of noise levels at various receptors as per Project requirement Starting Pollution monitoring MMRDAmonitoring plan. Immediately after agency - ThanePublic awareness campaigns for noise reduction completion of Municipalincluding placing adequate 'No Honking' sign boards at construction Corporation.sensitive locations.
RTO, PIA
Traffic and Traffic management plans shall be prepared - Plans to Project requirement Through operation Development MMRDAsafety restrict commercial vehicles in station area. stage Authorities, RTO
Traffic density to be monitored to record benefitsachieved from the project.Provide pathways and crossings for pedestrians.
7-60

Mumbai Urban Transpo,1 Project Consolidated Environmental Assessment
Table 7.10 Project Level Environmental Monitoring Plan - JVLR PROJECT
Environmental Project Parameters Standard Location Frequency Duration InstitutionalComponent Stage Respon sibility
Implementation SupervisionAir Quality Construction SPM, PM,(, NAAQS -Fantasy Land Once every 24 hr/day for 2 Contractor PIA, MMRDA
SO2, NOx See -L&T season - consecutive through pre-Appendix -lIT Main gate Summer, working days approved7.1 -Gandhi Nagar Winter, post- per week for 2 monitoring agency
Square monsoon weeks.
CO, HC NAAQS -Fantasy Land Once every 8 hr/day for 2 Contractor PIA, MMRDASee -L&T season - consecutive through pre-Appendix -1IT Main gate Summer, working days approved7.1 -Gandhi Nagar Winter, post- per week for 2 monitoring agency
Square monsoon weeks.
Operation SPM, PM,0, NAAQS -Fantasy Land Once every 24 hr/day for 2 MCGM MMRDASO2, NOx See -L&T season - consecutive
Appendix -lIT Main gate Summer, working days7.1 -Gandhi Nagar Winter, post- per week for 2
Square monsoon for weeks.1 year afteroperationstarts.
CO, HC NAAQS -Fantasy Land Once every 8 hr/day MCGM MMRDASee -L&T season - for 2Appendix -lIT Main gate Summer, consecutive7.1 -Gandhi Nagar Winter, post- working days
Square monsoon for per week for 21 year after weeks.operationstarts.
7-61

Mumbai Urban Transport Project Consolidated Environmental Assessment
Table 7.10 Cont. Environmental Monitoring Plan - JVLR PROJECT
Environmental Project Parameters Standards Location Frequency Duration InstitutionalComponent Stage Respons ibility
Implementation SupervisionNoise level Construction Leq, L10, L50, CPCB noise -Fantasy Land At start of Continuous Contractor PIA, MMRDA
L90 dB(A) standards -L&T construction 24 hour through pre--I1T Main gate activity, followed reading with approved-Gandhi Nagar every season a frequency monitoringSquare during of 10 agency
construction minutesAnd at sensitive periodand residentiallocations locatednear construction
_____________ .__________ _ _equipment..Operation Leq, L10, L50, CPCB noise -Fantasy Land Once every Continuous MCGM MMRDA
L90 dB(A) standards -L&T season 24 hour-I1T Main gate (excluding reading with-Gandhi Nagar monsoon) for 1 a frequencySquare year after of 10
operation starts. minutesSoil Quality Construction Heavy metals Contaminant -Fantasy Land At start of One time Contractor PIA, MMRDA
and Oil and threshold -L&T construction sample through pre-grease level given by -Gandhi Nagar activity, followed approved
USEPA Square every season monitoringduring agencyconstructionperiod
Operation Heavy metals Only at accidental - MCGM MMRDAand Oil and spill sites
_______ ________ ______grease
7-62

Mumbai Urban Transport Project Consolidated Environmental Assessment
Environmental Project Parameters Standards Location Frequency Duration InstitutionalComponent Stage ResponsibilityPlantation Pre- Monitoring of As laid out in At ecologically During tree . Contractor PIA, MMRDAincluding Construction tree felling. project detail sensitive locations felling through pre-endangered design. such as mangrove approvedspecies Trees to be areas. monitoring
adequately agencymarked forfelling.
Operation Survival rate Survival rate At locations of Annual For 3 years PIA / Contractor MMRDAof road side to be al-least compensatory afterplantation and 70%. Below plantation operationother which re- :tartscompensatory plantationplantation. should be
done.Traffic Volume Operation Traffic volume - -L&T western 3 day hourly Annual MMRDA MMRDA
,characteristic section countsand speed. -Near IIT on middle
section-Near GandhiNagar Square onEEH.
7-63

Mumbai Urban Transpotl Project Consolidated Environmental Assessment
Table 7.11 Project Level Environmental Monitoring Plan - BVQR PROJECT
Environmental Project Parameters Standards Location Frequency Duration InstitutionalComponent Stage Responsibility
Implementation SupervisionWater Quality Construction PH, BOD, CPCB water Only for affected Once every 6 One time Contractor PIA, MMRDA
COD, TDS, quality creek water months during sample through pre-DO, Oil and standards locations near 15 construction approvedgrease. bddges. Locations period monitoring
to be finalized in agencyupdated project EA.
Noise level Construction Leq, L10, L50, CPCB noise Between Borivali At start of Continuous Contractor PIA, MMRDAL90 dB(A). standards and Dahisar construction 24 hour through pre-(Day and station activity, followed reading (1- approvedNight) * Between Mira every season day only) monitoring
road and during with a agencyBhayandar construction frequency ofstation. period. 30 minutes
* At sensitivelocation - nearAyurvedic collegenear NallaSopara.
Operation Leq, LI 0, L50, CPCB noise Same as above Once every year Continuous PIA / Western MMRDAL90 dB(A) standards after operation 24 hour railway(Day and starts. reading (1-Night) day only)
with afrequency of
_ 30 minutes A-
7-64

Mumbai Urban Transport Project Consolidated Environmental Assessment
Table 7.11 Cont. Environmental Monitorin Plan - BVQR PROJECTEnvironmental ProJect Parameters Standards Location Frequency Duration InstitutionalComponent Stage Responsibility
Implementation SupervisionSoil Quality Construction Heavy metals Contaminant At equipment yards. At start of One time Contractor /PMC MMRDA
and Oil and threshold construction samplegrease level given by activity, followed
USEPA every seasonduringconstructionperiod
Operation Heavy metals Only at accidental Western Railway MMRDAand Oil and spill sitesgrease
Plantation Pre- Monitoring of As laid out in At ecologically During tree Contractor /PMC MMRDAincluding Construction tree felling. project detail sensitive locations fellingendangered design. such as mangrovespecies Trees to be areas.
adequatelymarked forfelling.
Operation Survival rate Survival rate At all track side and Annual For 3 years Western Railway MMRDAof track side to be al-least compensatory afterplantation and 70%. Below plantation locations. operationother which re- startscompensatory plantationplantation. should be
done. .
7-65

Mumbai Urban Transport Project Consolidated Environmental Assessment
Table 7.12 Project Level Environmental Monitoring Plan - VIKHROLI ROB PROJECT
Environmental Project Parameters Standards Location Frequency Duration InstitutionalComponent Stage Respon sibility
Implementation SupervisionAir Quality Construction SPM, PM1o, NAAQS Along ROB Once every 24 hr/day for 2 Contractor PIA, MMRDA
NOx See on Godrej season - consecutive through pre-Appendix Road at 2 Summer, working days per approved7.1 m height Winter, post- week for 1 week. monitoring agency
and 5 m monsoonfrom roadedge.
CO, HC NAAQS Along ROB As above 8 hr/day for 2 Contractor PIA, MMRDASee on Godrej consecutive through pre-Appendix Road at 2 working days per approved7.1 m height week for 1 week. monitoring agency
and 5 mfrom road
____________ ~~~ ~~edge.__ _ _ _ _ _ _ _ _ _ _ _ _ _
Operation SPM, PM1o, NAAQS Along ROB Once every 24 hr/day for 2 PIA MMRDANOx See on Godrej season - consecutive
Appendix Road at 2 Summer, working days per7.1 m height Winter, post- week for 2
and 5 m monsoon for 1 weeks.from road year afteredge. operation
starts.CO, HC NAAQS Along ROB Once every B hr/day PIA MMRDA
See on Godrej season - for 2 consecutiveAppendix Road at 2 Summer, working days per7.1 m height Winter, post- week for 2
and within monsoon for 1 weeks.10 m from year afterroad edge. operation
starts.
7-66

Mumbai Urban Transport Project Consolidated Environmental Assessment
Table 7.12 (ont. Environmental Monitoring Plan - VIKHROLI ROB PROJE
Environmental Project Parameters Standards Location Frequency Duration InstitutionalComponent Stage Responsibility
.__________ ______Implementation SupervisionNoise level Construction Leq, L1O, L50, CPCB noise At sensitive and At start of Continuous Contractor PIA, MMRDA
L90 dB(A) standards residential and construction 24 hour through pre-sensitive receptors activity, followed reading with approved(2 schools and a every season a frequency monitoringchurch), within 100 during of 10 agencym from road edge. construction minutes
period _Operation Leq, Li 0, L50, CPCB noise As above Once every As above PIA MMRDA
L90 dB(A) standards season for 1year afteroperation starts.
Soil Quality Construction Heavy metals Contaminant At equipment yards. At start and One time Contractor PIA, MMRDAand Oil and threshold completion of sample through pre-grease level given by instruction approved
USEPA activity. monitoringagency
Plantation Pre- Monitoring of As laid out in At tree felling Contractor PIA, MMRDAConstruction tree felling. project detail location. through pre-
design. approvedTrees to be monitoringadequately agencymarked forfelling.
Operation Survival rate Survival rate At locations of Annual For 3 years MCGM MMRDAof road side to be al-least compensatory afterplantation and 70%. Below plantation operationother which re- startscompensatory plantationplantation. should be
7-67

Mumbai Urban Transport Project Consolidated Environmental Assessment
TABLE 7.13 PROJECT LEVEL ENVIRONMENTAL MONITORING PLAN - (CST PEDESTRIAN SUBWAY PROJECT)
Environmental Project Parameters Standards LocatIon Frequency Duration InstitutionalComponent Stage Respon ilbility
Implementation SupervisionAir Quality Construction SPM, PM1o, NAAQS At MCGM Once every 24 hr/day for 1 Contractor PIA, MMRDA
NOx See office month of working day. through pre-Appendix opposite construction approved7.1 CST. (excluding monitoring agency
monsoonseason)
Operation SPM, PM10, NAAQS At MCGM Once after 24 hr/day for 1 MCGM MMRDANOx See office operation working day.
Appendix opposite starts, to serve7.1 CST. as
comparativedata
CO, HC NAAQS At MCGM Once after 8 hr/day MCGM MMRDASee office operation for 1 workingAppendix opposite starts, to serve day.7.1 CST. as
comparativedata
7-68

Mumbai Urban Transport Project Consolidated Environmental Assessment
Table 7.13 Cont. Environmental Monitoring Plait - (CST PEDESTRIAN SUBWAY PROJECT)
Environmental Project Parameters Standards Location Frequency Duration InstitutionalComponent Stage Responlibility
Implementation SupervisionNoise level Construction Leq, L10, L50, CPCB noise At same site as Once every Continuous Contractor PIA, MMRDA
L90 dB(A) standards AAQ monitoring month of 24 hour through pre-station. construction reading with approved
a frequency monitoringof 10 agencyminutes
Operation Leq, L10, L50, CPCB noise As above Once after As above MCGM MMRDAL90 dB(A) standards operation starts,
to serve ascomparativedata withbaseline
Traffic Operation Traffic volume, . Near subway Once in six 12- hr (Day RTO MMRDACongestion composition months for the Time)
and speed. 1S year afteroperation starts.
7-69

Mumbai Urban Transport Project Consolidated Environmental Assessment
TABLE 7.14 PROJECT LEVEL ENVIRONMENTAL MONITORING PLAN - (SATIS)
Environmental Project Parameters Standards Location Frequency Duration InstitutionalComponent Stage Respon slbilty
___________ __________ _________ ______Implementation SupervislonAir Quality Operation SPM, PM1O, NAAQS Same as Every three months 24 hr/day for 1 MCGM MMRDA
NOx See baseline for 1 year after working day.Appendix monitoring SATIS is complete.7.1 location at This will serve as
station comparative data tocomplex. baseline values
CO, HC NAAQS Same as Every three months 8 hr/day MCGM MMRDASee baseline for 1 year after for 1 workingAppendix monitoring SATIS is complete. day.7.1 location at This will serve as
station comparative data tocomplex. baseline values
Noise level Operation Leq, L10, L50, CPCB noise At air Every three months As above MCGM MMRDAL90 dB(A) standards monitoring for 1 year after
locations. SATIS is complete.This will serve ascomparative data tobaseline values
Traffic Operation Traffic volume, At the 3 Once in six months 12- hr (Day RTO MMRDACongestion composition baseline for the 1 ' year after Time)
and speed. monitoring SATIS is complete.locations
7-70

Mumbai Urban Transport Project Consolidated Environmental Assessment
TABLE 7.15 MONITORING AND REPORTING PROCESSConstruction Reporting Reporting Contractor PMC PIA reporting MMRDA World BankStage Parameter Format Reporting Reporting Frequency to reporting desired
Number Frequency Frequency to MMRDA Frequency to supervisionto PMC PIA World Bank
Trees to be Monthly Monthly Quarterly Quarterly _O removed
. gE ; PAH R&R Monthly Monthly Half-yearly
Relocation of utility Monthly Monthly Quarterly Quarterlyand community
O resources
Fugitive dust Daily Monthly Monthly Ouarterly Half-yearlymitigationCondition of Daily Monthly Monthly Ouarterly Half-yearlyconstructionequipment w.r.tnoise andemissions
e Identification of soil One time One time One time _erosion locationsand measurestaken
O Road -side and Monthly Monthly Quarterly Quarterly Half-yearly0o compensatory
plantation schedulePlantation survival Monthly Monthly Quarterly Ouarterly Half-yearlyrate reportingPollution Monthly Monthly Monthly Quarterly Half-yearlymonitoringDebris disposal Weekly Monthly Quarterly Quarterly Half-yearlyplannocatlons. .
7-71

Mumbai Urban Transport Project Consolidated Environmental Assessment
TABLE 7.15 Cont.. _ _ _ _ _ _ _ _ _ _ _ _ _ _ _ _ _
Construction Reporting Reporting Contractor PMC PIA MMRDA World Bank desiredStage Parameter Format Reporting Reporting reporting reporting supervision
Number Frequency Frequency to Frequency Frequency toto PIA PIA to MMRDA World Bank
Top soll Monthly Quarterly Quarterly Ouarterly _ManagementQuarry Monthly Monthly Quarterly Quarterly Half yearlyIdentiflcatlon andmanagementOccupational safety Weekly Monthly Monthly Monthly Half yearly
._ and health
Labour camp set-up Weekly Monthly Monthly Monthly Half yearlyand hygiene.
c Road safety Weekly Monthly Monthly Monthly Half yearly0U measures
Site enhancement Monthly Quarterly Quarterly Quarterly Halt yearlyImplementationplan at waterbodles, roadlunctlons etc.Pollution Quarterly Ouarterly Half-yearly
O monitoring. schedule andU
0.
7-72

Mumbai Urban Transport Project Consolidated Environmental Assessment
Table 7.16 ROLES/RESPONSIBILITIES AND STRENGTHENING OF INSTITUTIONS
ORGANISATION ROLES & RESPONSIBILITIES STRENGTHING REQUIRED
(MUMBAI METROPOLITAN Review of implementation of Environmental Mitigation Enhance the capabilities of the existingREGION DEVELOPMENT Measures (EMPs) for MUTP projects. 'Environmental Cell" of MMRDA by out sourcing
AUTHORITY (MMRDA) Ensure adequate Resettlement and Rehabilitation of PAH whenever required.
Facilitate implementation of policy directives/ emission laws Training needed on:etc. for pollution prevention/mitigation by interacting with * Environmental assessment, social impacts.various the government departments like Environment b' Appreciation of Environmental impacts andDepartment, Urban Development Department, RTO etc. EMPs identified for related MUTP projects.
Review the environmental management capabilities of Procedure and responsibilities for EMPimplementing agencies, particularly municipal authorities implementation, monitoring and reportingand to assist them in developing their capabilities. etc.
Obtain and analyse environmental information generatedby organizations like MCGM, MPCB, RTO etc. and factorthem into short term and long term planning process foroverall sustainable development of MMR.
Municipal Corporation of Greater Monitoring of ambient air quality and noise at existing MCGM Is operating air quality monitoring networkMumbal (MCGB) locations. Extending monitoring network to MUTP project for last several years and already have trained
locations for post-project monitoring. personnel. Training in relation to QualityAssurance, data analysis and dissemination and
Regular report to MMRDA to enable environmental other issues as suggested in the report "Study forplanning at a regional level. Strengthening Air Quality Monitoring network of
MCGM, Nov. 2000)However the existing staff and monitoringequipment need to be upgraded for the
._______________ _____________ _____________________________________________ additional monitoring load due to MUTP project.
7-73

Mumbai Urban Transport Project Consolidated Environmental Assessment
Table 7.16 Cont..ORGANISATION ROLES & RESPONSIBILITIES STRENGTHING REQUIRED
Public Works Department (PWD), Ensuring implementation of EMPs for related MUTP Environmental appraisal capabilities of existingMaharashtra State Road projects through PMC/contractors staff to be enhanced through training programs.
Short term module type training programsDevelopment Corporation Carrying out Environmental Assessments of all related on- needed for:
(MSRDC) going and future Transport Projects. > Environmental assessment, social Impacts.l Appreciation of Environmental Impacts and
EMPs identified for related MUTP projects.Procedure and responsibilities for EMPimplementation, monitoring and reportingetc.
RAILWAYS/MUMBAI RAIL VIKAS Ensuring implementation of EMPs for related MUTP Environmental appraisal capabilities of existingCORPORATION (MRVC) projects through PMC/contractors staff to be enhanced through training programs.
Short term module type training programs
Carrying out Environmental Assessments of all related on- needed for:going and future Transport Projects. lo. Environmental assessment, social Impacts.
ga Appreciation of Environmental impacts andEMPs identified for related MUTP projects.Procedure and responsibilities for EMPImplementation, monitoring and reporting
_____________________________________________ etc.Transportation Service Ensuring regular emission and maintenance checks on the Emission monitoring capabilities of the bus fleetOrganisations (BEST) bus fleet to ensure compliance with regulations. to be strengthened.
Good housekeeping in existing Bus-Depots to minimize Environmental awareness training of keywater and land pollution from oil spills and waste oil personneldisposal.
Enforcement/ Regulatory Enforcement of vehicular emission standards, with more Environmental awareness training for itsOrganizations: emphasis on heavy vehicles, taxies and 3 wheelers vigilance staff so that they can appreciate the
importance of their role and carry out the sameRegional Transport Office (RTO) diligently.
Training also needs to include criteria andtechniques for vehicle inspection andcertification.
7-74

Mumbai Urban Transport Project Consolidated Environmental Assessment
7-75


RESETTLEMENT ANDREHABILITATION


Mumbal Urban Transport Project Consolidated Environmental Assessment
CHAPTER 8
RESETTLEMENT AND REHABILITATION
8.1 RESETTLEMENT ACTION PLAN
MMRDA has prepared Resettlement Action Plan1 (RAP) essentially to describe thepolicy and institutional framework for carrying out the Resettlement andRehabilitation (R&R) of the Project Affected Households (PAHs). For every sub-project site specific Resettlement Implementation Plan (RIP) and CommunityEnvironment Management Plan (CEMP) will be separately prepared.
8.2 THE OBJECTIVES
The main objectives of MUTP in respect of the Project Affected Households (PAHs)and the Resettlement Action Plan (RAP) are;
* To prevent adverse social impact associated with implementation of MUTP,* To deliver the entitlements of PAHs for payment of compensation and support
for reestablishing their livelihood; and* To implement an action plan for delivering compensation and assistance in
accordance with the R&R policy adopted for the project.* To maximize involvement of PAH and civil society in all stages of resettlement
and rehabilitation; and* To ensure that the standard of living of PAHs is improved or at least restored.
Significant progress has been made in terms of formulating an R&R Policy andeffectively involving NGOs in making the entire process participatory since 1995.Over 10000 PAHs have also been resettled by June 2001.
8.3 RESETTLEMENT POLICY
Government of Maharashtra (GOM) has already adopted an R & R Policy for MUTP.The objectives of R&R as enunciated in the policy are;* To minimize the resettlement by exploring all viable alternative project designs,
Where displacement is unavoidable, to develop and execute resettlement plansin such a manner that displaced persons are compensated for their losses atreplacement cost prior to the actual move,
lMumbai Urban Transport Project: Resettlement Action Plan, September 2001, MMRDA
8-1

Mumbai Urban Transport Project Consolidated Environmental Assessment
* To accord formal housing rights to the PAHs at the resettlement site byestablishing the cooperative housing societies of the PAHs,
* To develop and implement the details of the resettlement program throughactive community participation,
* To make efforts to retain existing community network in the resettlement areaand to minimize the adverse impact, if any, on the host community; and
* To improve environmental health and hygiene of the PAHs at the site ofresettlement and to educate, motivate and organise the community to manageits environment at the resettlement location.
8.4 LEGAL FRAMEWORK
The R & R Policy and the Resettlement Action Plan (RAP) and the site specificResettlement Implementation Plan (RIP) are developed and executed under thefollowing legal framework;
* Land Acquisition Act 1894: for compulsory acquisition of land for publicpurposes.
* Maharashtra Regional and Town Planning Act, 1966: for preparation ofDevelopment Plans (Master Plans) that designate land for public purposes,which can then be acquired under the Land Acquisition Act; and to formulateDevelopment Control Regulations.
* Development Control Regulations for Greater Mumbai 1991: These regulationsoffer an altemative to acquisition under LA Act 1894 by way of Transfer ofDeveloprrn.- "lt Rights (TDR).
* The amenoed DC Regulations provide incentives for rehabilitation (includingresettlement of slum dwellers)., For landowners prepared to provide 225 sq.ft.dwelling units free of cost to slum dwellers, the incentive is in the form of right tobuild and sell floor space equivalent to that required for slum rehabilitation
* The DC Regulations also set out the standards for building design andconstruction and provision of services like water supply, sewerage, sitedrainage, access roads, elevators, fire fighting etc
* The Maharashtra Co-operative Societies Act 1960: provides for establishing,registering and administering the co-operative societies. The land and buildingis owned by the co-operative and its members have occupanz--* rights ofapartment occupied by them. Sale and purchase of such units can take placeonly with the consent of the society. This is a common form of tenure inMumbai's apartment buildings and is widely understood.
8-2

Mumbai Urban Transport Project Consolidated Environmental Assessment
8.5 DEFINITION OF PROJECT AFFECTED HOUSEHOLDS (PAH)
Project Affected Households includes households, business units including theirworkers and owners of assets like land and buildings affected by MUTP and mayinclude; non-resident land owners (including farmers and horticulturist); non-resident lessees; resident landlord (including farmers and horticulturists); residentlessees, tenants or sub-tenants of buildings; squatters (non-resident structureowners, resident structure owners, tenants); pavement dwellers. Household for thispurpose means all the males/females, their family members and relatives staying ina house/tenement/hut.
8.6 REHABILITATION ENTITLEMENTS
Shelter related entitlement
Every eligible household losing a dwelling place shall be allotted a dwelling unit ofminimum of 225 sq.ft. at an alternate site. Similarly every PAH losing a commercialstructure shall be eligible for an altemate place for commercial use of equivalentarea.
Compensation for economic losses
Availability of land being the major constraint in the city, it may not always bepossible to provide in the close vicinity of the existing settlement to avoid loss ofaccess to existing employment. In such cases the affected households will beeligible for the compensation for the permanent loss of employment or extra travelcost. Similarly a special package will be worked out for the vulnerable PAHs suchas households below the poverty line, the women headed households, thehandicapped and the aged. This would include a ration shop under the PublicDistribution System, ground floor accommodation for the handicapped and theaged and support through the community operated fund for income generatingactivities.
Access to training, employment, and credit
There are a number of training programs offered by government for skill upgradingfor promoting self-employment. Similarly there are government programs ofextending financial assistance to the poor for self-employment. During thepreparation of site specific RIP; the communities will be informed of such programs.In addition, local savings and loan associations will also be promoted throughNGOs.
8-3

Mumbai Urban Transport Project Consolidated Environmental Assessment
8.7 ORGANIZATIONAL RESPONSIBILITIES
A High Power Steerng Committee has been constituted under the chairmanship ofthe Chief Secretary to GOM to oversee the progress of MUTP including R&R andprovide necessary policy directions.
A Project Coordination Committee has been created under the Chairmanship ofPrincipal Secretary Urban Development Department, GOM to supervise timelyimplementation of MUTP including inter-agency coordination, ensuring adequatebudgL tary provisions and timely disbursement of funds.
An Independent Monitoring Panel (IMP) comprising eminent citizens of Mumbaihas been establishec i 7r ensuring compliance with accepted policies in projectimplementation
MMRDA, which is a regional planning and coordinating authority, has beendesignated as the project coordinating agency for MUTP.A Project ManagementUnit (PMU), headed by a Project Director, has been created in MMRDA forplanning and implementing R & R component on behalf of all implementirigagencies. The PMU is also responsible for overall coordination with all theimplementing agencies and monitoring the progress of MUTP.
8.8 TWO STAGE RESETTLEMENT PROCESS
Two-stage resettlement would be resorted to where resettlement is required onurgent basis. The urgency may arise on account of unsafe conditions like in case ofsettlements located too close to the railway track or on account of judicial ruling.The transit accommodation would be in the form dwelling units of 120 sq.ft. withcommon toilet facilities and stand posts for water supply. It is proposed that allthose who have shifted to transit houses will be moved to the permanent houseswithin three years.
8.9 GRIEVANCE REDRESSAL MECHANISM
The PIA will designate a senior officer at the local level to consider any grievanceot PAHs in consultation with the concerned NGO. If the aggrieved PAH is notsatisfied with this decision, final appeal could be made to the Grievance RedressalCommittee appointed by the PMU comprising its officials and the representatives ofNGOs in accordance with the R & R Policy
8.10 SITE SPECIFIC RESETTLEMENT IMPLEMENTATION PLANS (RIP)
In addition to the RAP, for individual sub-projects site specific ResettlementImplementation Plans (RIPs) will be prepared. Community EnvironmentManagement Plan (CEMP) will be prepared along with the RIP. Consultants' 4
8-4

Mumbai Urban Transport Project Consolidated Environmental Assessment
reports on RIP and CEMP for four sub-projects are already available. These arebeing finalized in conformity with RAP. MMRDA has undertaken preparation of finalRIPs and CEMPs for these four sub-projects.
Community Environment Management Plan
The objective of preparing CEMP is thus to provide access to basic urbanenvironmental infrastructure services; and through community initiative andparticipation alleviate the environmental health risks of the community. The affectedcommunities are largely of squatters accustomed to a particular way of life. At theresettlement site, they will have to almost invariably adjust to the lifestyle of multi-storied buildings. The communities will be trained and motivated to follow adiscipline that can avoid environmental problems. Separate EnvironmentalManagement Committees (EMCs) will be formed during RIP/CEMP preparation totake up this responsibility during post-resettlement stage. The CEMP provides insimple non-technical local language preventive maintenance schedule for water
supply, sanitation, solid waste etc. The maintenance measures are translated into asimple non-technical format in the form of "Do's" and "Don'ts" in local languages forthe use of the community at large.
8.11 SCALE OF RESETTLEMENT REQUIRED
The households likely to be affected by each of the sub-projects are given in Table8.1.Table 8.1 Project Affected Households
A-XI A-
Roads and Traffic Component 46491 ROB at Jogeshwari -South 901
2 ROB at Jogeshwari - North 514
3 ROB at Vikroli 173
4 Jogeshwari-Vikroli Link Road 8905 Santacruz-Chembur Link Road 21716 Station Area Traffic Improvement Schemes 100*
7 Pedestrian Subways & Bridges Nil
Rail Component 144791 5th Line between Santacruz and Borivali 5152 5th and 6th Lines between Kurla and Thane 2131
3 Borivali-Bhayendar -Virar additional pair of lines 5014 Optimization on Western Railway 6225 Optimization on Central Railway 28796 Optimization on Harbour Line 7831
19228
Total PAH
Total Project Affected Persons 77660
8-5

Mumbai Urban Transport Project Consolidated Environmental Assessment
* Subject to findings of the surveys in prcrn.ress
Majority (19000 out of 19228 PAH) ar, zuatters. They do not have secured landtenure, have only shared community tacilities like water stand post and commontoilets. Some of the squatter settlements have inadequate water supply, inadequatenumber of well maintained toilets, poor solid waste collections. Some settlementslocated close to the storm water drains have poor drainage and flooded inmonsoon. Settlements located close to railway lines apart from these problemssuffer from noise and risk to life of children who may inadequately move over thetracks. Thus the present quality of lIfe is extremely unsatisfactory in terms ofavailability of basic services and environmental hygiene.
Land Acquisition and PAHs
Total land proposed to be acquired for the transport project is 32.08 ha. out ofwhich 20.79 ha. is for railway projects and 11.29 ha. is for road projects. The totalnumber of PAH is 19228 of which 14429 are affected by railway projects and 4749are affected by road projects. The PAHs include legal occupants of land to beacquired as well as the squatters on the land already owned by the ProjectImplementing Agencies. (PIA). The land required for resettlement of PAHs is 47.1Ha. Most of the PAHs are squatters and the number of landowners whose land isto be acquired is very small.
8.12 R&R IMPLEMENTATION SCHEDULE AND THE PRESENT STAUTUS
The scale of resettlement involved is unprecedented. However due to concertedefforts of GOM, MMRDA and the concerned NGOs it has been possible to resettle10118 PAHs out of a total of 19228 PAHs have by June 2001 (6261 in transitaccommodation and 3857 in permanent dwelling units). In addition, about 80affected shopkeepers were alloyed alternative shops with in the resettlementbuildings to enable them to re-start their business activities. Resettlement of over10000 PAH in one year is urt-recedented in Mumbai. The PAHs located in thesafety zone of railways were seen as a risk to safe operations of suburbanservices. The railway safety authorities had imposed speed restrictions and hadwarned about discontinuing services. There were incidents of stone throwinghurting the train commuters. On this background, an NGO approached the MumbaiHigh Court with a request to direct the railways to remove the encroachment onrailway land. Railways were inclined to act accordingly. At this stage, GOM andMMRDA had to intervene and assure the Court that the squatters will be resettled.Court imposed a strict time limit on such resettlement. This necessitatedresettlement in transit quarters, which were successfully put in place in fourmonths.The entire process of resettlement will be completed by April 2004.
8-6

MiumoL)ai Urban Transport Project Conso.idated Environmentai Assessment
Ir~~~~~~~~~~~~~~~~~~~~~~~
P~ ~ ~ ~ Z-R,,.AN-iV T-Nl ,,,,7_ .
_; ; ;UA TE- RS
,9 ____ -w --
0- e -<

Mumbai Urban Transport Project Consolidated Environmental Assessment
8.13 LESSONS LEARNTFrom the experience of resettlement carried out so far following lessons could belearnt.
* Given the fact that some of the communities to be resettled are so located thattheir continuation at the existing location is either at the risk of their own safetyor causes hindrance to essential public services, it is necessary to adopt a two-stage approach to resettlement. It is also desirable in terms of strengtheningcommunity network, establishing co-operative societies and generally preparingthe communities to live in multistoried permanent housing.
* A swift continuous operation, starting from BSES to resettlement with activeleadership of NGO has a better chance of success.
* Community participation particularly of women in managing the allotment ofdwelling units, relocation and securing essential services is key to thesuccessful resettlement.
8.14 COSTS AND BUDGET
The total cost of resettlement is estimated to be around Rs. 4607 million (US $ 98million).
8-8

9PUBLIC INFORMATIONAND CONSULTATION

I

Mumbai Urban Transport Project Consolidated Environmental Assessment
CHAPTER 9
PUBLIC INFORMATION AND CONSULTATION
9.1 CONSULTAION DURING CTS (1994)
Public consultation has been an important input into the process of planning and
designing of MUTP so far. The consultation process began by carrying out a surveyof Public Attitude during the formulation of Comprehensive Transport Plan (CTS).1
As a part of this survey, respondents were asked to select a package of schemesfrom amongst a long list of road and rail projects within a budget of RS. 1000 crores.
The outcome of this consultation indicated following priorities;
* Putting more buses into the city and providing exclusive busways,
* No priority to tramway or LRT
* No priority to new underground metroHigh priority except by the car and two wheeler riders to increased reliability oftrain services, increased train capacity along with more comfortable trains.
Priority to road investment including Western Freeway by the car and twowheeler riders.
* Priority to improved bus feeder services, flyovers and area traffic control systembe all road users.
- Priority to extra rail line into the Island City (6'h Corridor) by the rail commuter.
The draft CTS proposals were also presented to various PlAs, Governmentagencies and NGOs. They generally endorsed the strategy of PT+DMrecommended by the CTS.
These considerations have also reflected in the MUTP now proposed forimplementation.
9.2 CONSULATION DURING ENVIRONMENTAL ASSESSMENT (1997)
The findings of the Environmental Assessment carried out by the consultants werepresented in a Workshop held on 2nd June 1997.2 The participants included therepresentatives of the government departments, local authorities, projectimplementation agencies and the consultants in the transport and environment field.
Some questions were raised in the workshop about the methodology of SLEA, butthe finding that PT + DM is the most preferred strategy was generally endorsed. In
1 CTS Technical Memorandum No. 5 - Analysis of Public Attitude Survey, WS Atkins Intemational2 Environmental Assessment of MUTP-II, Proceedings of Public Consultation Workshop held on June2,1997. AIC Watson Consultants Ltd.

Mumbai Urban Transport Project Consolidated Environmental Assessment
respect of PLEAs and MLEAs certain methodological clarifications were sought.These clarifications and suggestions were then incorporated in the final reports.
9.3 CONSULTAION DURING R&R
As a part of carrying out the Baseline Socio-Economic Surveys of the PAH, theNGOs explained the project for which the community ahs to be resettled. Durng theformulation of RIP and CEMP more intensive consultation takes place to decide thelocation of resettlement, design of building, community facilities required and theprocedure to be followed for maintaining the multi-storied settlement. The details ofconsultation process are 'en in the "Mumbai Urban Transport Project:Resettlement Action Plan, September 2001, MMRDA"
9.4 CONSULTATION ON UPDATED EA
With the passage of tme and substantial developments like construction of flyoversthat had occurred the EA was updated.3 A consultation workshop involvingacademia, environmental experts, consultants, NGOs and representatives of PlAsand the World Bank was organized on November 20, 2000 for presentation ofupdated EA. The important suggestions that emanated from this workshop are listedbelow;* The impacts of the flyovers that have already come up need to be studied and
suitable mitigation measures should be identified, so that these can beconsidered while designing and constructing the other planned flyovers.M Mitigation measures durng construction phase should include plan for trafficdiversion routes.
* Recommendations s- id cover the measures to be taken at design stage toimprove the visual impacts of the structures/flyovers/ subways.
* Mitigation measures for noise impacts of flyovers / ROBS on the residents offlats, which are in close proximity of these flyovers, must be identified. Newtechnologies for road surfa^es must be explored, so that noise from road- tyrefriction is reduced.
* The project could encourage more development in ecologically sensitive areasof Vasai-Virar. There should be efforts to shift development towards NaviMumbai.
* Co-ordination model for implementation of the recommendations should beclear. Independent monitoring panel should appear in the pr:sosed model.
Most of these suggestions have been incorporated in this consolidated EA.
In addition following two consultation workshops were also organized.
3 MUTP Environmental Assessment Montgomery Watson Consultants Ltd.9-2

Mumbai Urban Transport Project Consolidated Environmental Assessment
Public consultation with people affected by construction of sub-Droiects was carriedout on December 13. 2000
A public consultation workshop was organized predominantly for the project affectedpersons on the 13h December 2000. The photographs, newspaper clippings and thepamphlets are given in the Appendix 9.1. A presentation was made by MMRDAhighlighting the sectoral environmental impacts, MUTP and its resettlement impacts,resettlement policy and the resettlement action plan including its CommunityEnvironmental Management Plan. Copies of non-technical summary of the EAreport were distributed in local language prior to the workshop. The response fromthe participants highlighted the importance of maintaining local environment - solidwaste management, storm water drainage, sewerage and water supply.Respondents particularly women, based on their personal experiences emphasizedthe importance of community efforts in keeping the buildings and the surroundingsclean by timely removal of garbage. However, some of them were not aware of theimplications of throwing the garbage in the nearby storm water drain or nallah.
Based on the above response, it is proposed to pay particular attention to solidwaste disposal in preparing CEMP's as a part of preparing project specificResettlement Implementation Plan (RIP).
Public consultation workshop with aeneral Dublic was carried out on December 14,2000
A public consultation workshop organized for a cross section of the Society on the
14th Dec' 2000 was not attended by the general public/NGOs except a few Pressrepresentatives. This perhaps is a reflection of the fact' that the concernedstakeholders are aware of the project its environmental components. Some of theNGOs have expressed their concern about the delay in commencement of theproject and not about the environmental impacts.
9.5 PUBLIC INFORMATION CENTRES
MMRDA has established two Public Information Centres, one at the MMRDA officeand the other at Mankhurd a project site. Documents and information related toMUTP Project summaries, EA reports, R&R Policy and Resettlement Action PlanRIP and CEMPs, etc are made available to at these PICs Written comments orsuggestions will also be received at the PICs.
9.6 PROPOSED CONSULTATION
MMRDA has now consolidated and updated the EA work carried out so far inrespect of MUTP and presented it in this report. MMRDA therefore now proposes to
9-3

Mumbai Urban Transport Project Consolidated Environmental Assessment
carry out a fresh round of public consultation program based on this report duringOctober, 2001. This will involve two public consultation workshops; viz. one on a citywide basis aimed at a representative cross section of concerned citizens includingNGOs, academicians, environmental experts, representatives of PlAs, Industries,TaxiVTruck owners Associations, etc.; the other aimed at the project affectedpersons. The approach and methodology along with time table for this fresh rouncof public consultation is presented in Tables 9.1 and 9.2.
Table 9.1 Proposed Tlime Table for Organizing Public Information andConsultation Workshop for a Cross Section of the Society.
NO. ACTIVITIES DATE1 Finalization of the Draft Consolidated EA Report. 1/11/012 Approval of the World Bank 7/11/013 The draft Executive Summary of EA report will be translated into 9/11/01
Marathi. The English version will be kept on MMRDA's web-site fordownloading. The draft EA Report will be kept at Public InformationCentre at MMRDA's office.
4 Fix the time, date and venue at South Mumbai that is large enough for 9i;1 /01expected gathering.
5 To send notices to leading English and Marathi newspapers intimating 10/11/01about the public consultation workshop. The notices would indicate thedate (one week after the date of publishing the notices in the newspaper), time and venue of the event, the purpose of public consultationalong with the information about the availability of draft ExecutiveSummary and draft Final Report at Public Information centre atMMRDA's office and on the MMRDA's web site for those interested torefer.
6 The Letters of Invitation to selected NGOs, academicians, researchers, 12/11/01implementing agencies, etc. along with Press will be sent one weekprior to the event (The draft list enclosed as Annex-i ).
7 The notices about public consultation will appear in the news papers. 15/11/018 The pamphlets in English, Hindi and Marathi informing about the date, 18/11/01
time and venue will be circulated (three to five days before) in theproject affected communities. The pamphlets would also indicate theinformation about the availability of draft Executive Summary and draftFinal Report at Public Information Centre at MMRDA office for thoseinterested to refer.
9 The workshops will be held 8 days after the date o' ishing the 23/11/01notices in the news papers.
10 To record and document the consultation workshops based on the 23/11/01checklist provided by the World Bank.
9-4

Mumbai Urban Transport Project Consolidated Environmental Assessment
Table 92 Proposed Time Table for Organizing Public Information andConsultation Workshop for Project Affected People.
NO. ACTIVMES DATE1 Finalization of the Draft Consolidated EA Report. 1/11/20012 Approval of the World Bank 7/11/20012 The draft Executive Summary of EA report will be translated into 9/11/2001
Marathi. The same will be kept on MMRDA's web-ste for downloading.The draft EA Report will be kept at Public Information Centre atMMRDA's office.
3 Fix the time, date and venue for organising a smaller meeting 9/11/2001(workshop) nearby Jogeshwari
4 To send notices to leading English and Marathi newspapers intimating 10/11/2001about the small public consultation workshop at Jogeshwari on thesimilar lines. The brief write up on MUTP incorporating the proposedEMPs related to JVLR and ROBs would be prepared and translated intoMarathi.
5 Selected local NGOs, reputed persons residing nearby, PlAs, etc. will 12/11/2001be invited for Jogeshwari Workshop)
6 The notices about Jogeshwari Workshop will appear in the newspapers 15/11/20017 The pamplets in English Marathi and Hindi informing about time, date 18/11/2001
and venue about Jogeshwari workshop will be circulated in the projectareas. The pamphlets would also indicate the information about theavailability of draft Executive Summary Pnd draft Final Report at PublicInformation Centre at MMRDA office for those interested to refer.
8 T --orkshops will be held 8 days after the date of publishing the 24/11/2001notices in the news papers. .
9 To record and document the consultation workshops based on the 24/11/2001checklist provided by the World Bank.
9.7 PUBLIC OPINIONS, CONCERNS AND RESPONSES
The findings of the proposed round of public consultations will be recorded andincorporated in the final EA report.
The PICs will receive Grievances from public, in respect of implementation ofmitigating measures from the concerned citizens. These will be referred to theconcemed PIA and reports will be obtained on the corrective actions taken. Thesewill also be kept at the PICs.
9-5

APPENDICES


Mumbai Urban Transport Project Consolidated Environmental Assessment
APPENDIX 1.1DOCUMENTS REFERRED
1. Sectoral Level Environmental Assessment of MUTP - II by AIC Watson ConsultantsLtd., March 1998
2. Sectoral Level Environmental Assessment of MUTP - II Addendum to Final ReportJuly 1999
3. Comprehensive Transport Strategy for Mumbai Metropolitan Region by W.S. AtkinsIntemational, 1994
4. Regional Plan for Mumbai Metropolitan Region 1996-2011, MMRDA
5. Environmental Assessment of MUTP - II by AIC Watson Consultants Ltd., March1998
6. MUTP Resettlement Action Plan by MMRDA, July 2001.
7. Programmatic Level Environmental Assessment of the Proposed Flyover atKhodadad Circle, by AIC Watson Consultants Ltd., March 1998
8. Environmental Assessment of the proposed Jogehwari - Vikhroli Link, by AICWatson Consultants Ltd., March 1998
9. Environmental Assessment of Borivali - Virar Railway Tracks by AIC WatsonConsultants Ltd., March 1998
10. Programmatic Level Environmental Assessment of the Proposed ROB at Vikhroli byAIC Watson Consultants Ltd., March 1998
11. Programmatic Level Environmental Assessment of the Proposed Subway atChatrapati Shivaji Terminus by AIC Watson Consultants Ltd., March 1998
12. Programmatc Level Environmental Assessment of the Thane Station AreaImprovement Scheme by AIC Watson Consultants Ltd., March 1998
13. URBAIR - Urban Air Quality Management Strategy in Asia, World Bank TechnicalPaper No. 381, 1997.
14. Coastal Zone Management Plan for Maharashtra by Urban Development Departmentof Govt. of Maharashtra, July 1997

Mumbai Urban Transport Project Consolidated Environmental Assessment
15. Terms Of References Of MUTP For Study On Preparation Of Particulate MatterReduction Action Plan for Greater Mumbai , December 2000
16. Environmental Status Report of MCGM for the years 1997-98, 98 -99 and 99-2000
17. Final Report on Tasks 1 and 2: study for strengthening the Air Quality MonitoringNetwork Operated by BMC prepared by Environmental Management Centre,Mumbai, November 2000.
18. Lal committee report - Report of the committee constituted by The Orders Of TheHigh Court, Bombay to examine and recommend measures to reduce vehicularpollution in greater Mumbai, April 2000 report prepared by Office of the TransportCommissioner, Maharashtra State.
19. Environmental Status of MMR by AIC Watson Consultants, Mumbai, May 1997.
2

Mumbai Urban Transport Project EnvironmentalAssessment
APPENDIX 2.1 ENVIRONMENTAL ACTS/RULES FOR VARIOUS PARAMETERSISSUE / PARAMETER REGULATION PURPOSE
Environmental Environmental (Protection) Act, 1986 An umbrella act for environmental protection. Various rules andProtection Legislatlon notifications are issued from time to time under the provisions of this
Act.Environmental Environmental Protection Rules (1986) These Rules specify standards for emissions or discharge ofStandards and its amendments. Latest environmental pollutants. Standards for ambient air quality is also
amendment in Environmental Protection prescribed under these rules.Amendment Rules (2000)
Environmental The Environmental Impact Assessment Mandatory environmental clearance from MOEF, New Delhi for 29Clearance of Projects Notification, 1994 (as amended in May categories of developmental projects listed in Schedule 1. Procedure
1994) for environmental clearance Is given in Appendix 2.1(b).Mandatory public hearing before environmental clearance for all
Environmental (Protection) Rules, projects listed under the EIA notification of 1994.Notice of Environmental Public Hearing,April 1997.
Certain projects listed in Schedule B of this resolution, which do notEnvironmental Clearance from State fall in the EIA notification of 1994, require State Department ofGovernment of Maharashtra Environment, Govt. of Maharashtra.(Resolution No. Env 1094/SEAC/CR -170/Desk-1), August 1997.
Ambient Noise Control Noise Pollution (Regulation and These rules provide for the ambient noise standards in public places.Control) Rules, 2000
3

Mumbai Urban Transport Project Environmental Assessment
Appendix 2.1 Cont..ISSUE/PARAMETER REGULATION PURPOSE
Water Pollution The Water (Prevention and Control of The Act provides for the prevention and control of waterPollution) Act, 1974 pollution through grant of "Consents to Operate" by
Maharashtra Pollution Control Board (MPCB)The Water ( Prevention and control of Industries / organizations to pay Water Cess (Tax) underPollution ) Cess Act, 1977 the Act to MPCB. The cess is charged with a view to
augment the resources of Central Pollution ControlBoard (CPCB) and MPCB.
Air Pollution The Air (Prevention and control of Pollution ) The Act provides for the prevention and control of airAct, 1981 pollution through grant of "Consents to Operate" by
Maharashtra Pollution Control Board (MPCB)Handling, Storage and Hazardous Waste (Management and The rules require that all persons handling hazardousDisposal of Hazardous Handling) Amendment Rules, 2000 wastes should have Authorisation from the local StateWastes Pollution Control Board. Waste to be handled and
disposed as per the provisions of the Rules,Environmental Liabilities The Public liability Insurance Act, 1991 This Act imposes on the owner liability to providedue to Industrial accidents immediate relief to affected persons in case of an
accident resulting from handling notified hazardouschemicals. The owner all has to take out insurancepolicy, the premium of which goes towards anEnvironmental Relief Fund. The District Collectorimplements this Act.
HandlIng, Transport and Bio-Medical Waste (Management and All Bio-Medical Wastes to be handled (Stored,Disposal of Blo-Medlcal Handling ) Rules, 1998 and (Second transported, Disposed) as per provisions of these rules.Wastes Amendment) Rules 2000 MPCB issues Authorisations to all concerned.
4

Mumbai Urban Transport Project Environmental Assessment
Appendix 2.1 Cont.ISSUE / REGULATION PURPOSEPARAMETERStorage and safe Manufacture, storage and import of This rule aims at reducing risks of damage to the environmenthandling of hazardous chemical (Amendment) Rules, due to accidents involving handling of hazardous material. ItHazardous 2000. gives a list of chemicals categorised as hazardous andmaterials. requires the occupier to prepare safety reports etc. Also it
requires preparation of off-site disaster management plan bythe District Collectors office.
Transport of Motor Vehicle Act 1988. These rules address vehicular air and noise emissions andHazardous Material also requirements during transport of hazardous materials. It
is implemented by the Regional Transport Department.Details of the requirements are given in Appendix 2.1(c)
Forest The Wildlife (Protection) Act, 1972 The Wildlife (Protection) Act, 1972 is a national act, whichConservation and superseded the specific provisions made in this respect in theWildlife protection. Indian Forest Act, 1927. The Wildlife Act enables the
notification and management of areas as national parks,sanctuaries, game reserves and closed areas and theprocedures for allowing or disallowing diverse uses withinthem.
5

Mumbai Urban Transport Project Environmental Assessment
Appendlx 2.1 Cont.ISSUE / REGULATION PURPOSEPARAMETER
The Forest (Conservation) Act, 1980 The Act provides for the conservation of forests, restrictions on the de-reservation of forests or use of forest land for non-forest purposes other thanreforestation and matters related to the same. The important provisions of thisact is for transportation projects are:
i) No state government or other authority may issue orders directing that anyforest land or any portion thereof may be assigned by way of lease orotherwise to any private person or to any authority, corporation, agency orany other organisation not owned, managed or controlled by the governmentwithout prior approval of the central govemment.
ii) No forestland or any portion thereof may be cleared of trees, which havegrown naturally in that land or portion, for the purpose of using it forafforestation without prior approval of the central govemment.
* Maharashtra Felling of Trees This act provides that no person shall fell any tree (Tree as defined in theschedule) or cause such tree to be felled In any land, whether of his ownership(Regulation) Act, 1964 or otherwise except with the previous permission in writing of a Tree Officer dulyempowered by the State Government in that behalf.
* Maharashtra Private Forests(Acquisition) Act, 1975 Some provisions are as follows:
1. All private forests in the State shall stand acquired and vest, free from allencumbrances, in and shall be deemed to be the property of the StateGovernment, and all rights, title and interest of the owner or any personother than the Govemment subsisting in any of the such forest on said dayshall be deemed to be have been extinguished.
2. All private forests vested in the State Govemment under sub-section (1)shall be deemed to be reserved forests within the meaning of the Forest Act.
6

Mumbai Urban Transport Project Environmental Assessment
Apendix 2.1 Cont..ISSUE / REGULATION PURPOSEPARAMETERCoastal Zone Coastal Regulation Zone (CRZ), As per this notification the Central Government has declared the coastalProtection 1991 stretches of seas, bays, estuaries, creeks, rivers and backwaters which are
influenced by tidal action (in the landward side) upto 500 metres from the HighTide Line (HTL) and the land between the Low Tide Level (LTL) and the HTL asCoastal Regulation Zone. The notification imposes restrictions on the setting upand expansion of industries and other development projects in the said CoastalRegulation Zone (CRZ). For the purposes of this Notification, the High Tide Line(HTL) is defined as the line upto which the highest high tide reaches at springtides.
7The distance from the High Tide Line (HTL) to which the proposed regulations will apply in thecase of rivers, creeks and backwaters may be modified on a case by case basis for reasons to berecorded while preparing the Coastal Zone Management Plans, however, this distance shall notbe less than 100 metres or the width of the Creek, river or backwater whichever is less.
7

Appendix 2.1(B)Process of Obtaining Environmental Clearance
Investor Notes:
1 No Objetlion CertificateSubmits Project Questionnaire, EIA 2 Chief Conservator of Forestsand EMP to the concerned SPCBSubmission of the project 3 Department of Environment
Isd EMP to the Environmerntal to the MoEi4 along with 4 Ministry of Environment and, all documents Forests
Review by SPCB 5 Environmental Appraisal, ~~~~~~~Committee
Initial scrutiny bystaff of MoEF
Management PlanxSatisfactory? Review by Environmental * Is the Project site
J No NnAppraisal Commitee of MoEF acceptable?
Can Issues be- R't yAqresolved? 1N Is the information Nn
ys-m provided adequate? EAC5 members Re-I s . Apply also to ccF T i undertake site visits examApply also to CGF~
SPCB issues NOC* in case forestland isinvolved Von
i sst acceptable? | l
Does the Project fall Is se a ale I|under Schedule -1 of I sINn l
| EIA Notification W ; | Prepare Comprehensive || | Apply to Union Min. of | | EIA or any specific study Investor advised to
; Ne | Env. & Forests in l | suggested by the look for alternate1 3 prescribed format ~~~~~~~~~~~Committee st
iApply to State DoEn | | (Schedule - 2) l| Committeel lsi
for Env. Clearancell
Nn Nn XA EniometlClaacRjcCaisusb Is the projeiRecmeddIsdbyth MoEF
l j ~~~~~~resolved? acceptable? by EAC
Yp.

Mumbai Urban Transport Project Environmental Assessment
APPENDIX 2.1(C)
RECENT SUPREME COURT DIRECTIVES AND OTHER LEGAL ISSUESRELATED TO VEHICULAR POLLUTION
(A) Air Pollution In DelhiEPA (29 of 1986) S. 3 - Direction to convert the entire bus fleet in New Delhi tosingle fuel of CNG by 31/3/2001. Also directed that 8 years old buses shall not shallply except on CNG or other clean fuel after 1/4/2001, passed by Supreme Court in1998 AIR 2813. Application for extension of deadline fixed for compliance. Extensionof deadline was refused. However to mitigate sufferings of commuter publicrelaxation given to schools, Delhi Transport Corporation, Contract carriage operators,other bus operators and owners of commercial vehicles including autos by allowingthem to operate vehicles equal to number of vehicles for which steps for conversionhas been taken them by 31/3/2001.
A recent study carried out by Indian Institute of Technology (IIT) and as reported innews papers shows that CNG vehicles are as polluting as conventionally fueledones. The advantage of CNG is that it has less hydrocarbons (HC) and thus HCemissions from vehicles are less that conventionally fuelled vehicles. However, COemissions from CNG is higher and is more than the Euro-Il standards. Also, lack ofinfrastructure for CNG supply and government apathy have led to a lot of chaos inrecent times in New Delhi.
Thus it is clear that before establishing implementation periods for such alternativefuels, the Central Government should ensure that the decision is supported byadequate case studies and adequate infrastructure is place.
(B) In a writ petition filed by the renowned public interest litigant, M.C.Mehta, theSupreme Court has laid down the standards to which vehicles (both commercial andnon-commercial) should conform, in order to be registered in the National CapitalRegion (NCR). In its decision reported in (1999) 6 SCC 9, 12, 14, the report of theBhure Lal Committee was examined in detail and the following directions wereissued:
p All private (non-commercial) vehicles, which conform to Euro I and Euro IInorms, may be registered by the NCR without any restriction.
* All private (non-commercial) vehicles (shall) conform to Euro II norms by1.4.2000.
9

Mumbai Urban Transport Project Consolidated Environmental Assessment
APPENDIX 3.1Details of demographic, soc ', economic and environmentalcharacteristics based on th -aseline survey of 11760 PAHs
PARAMETER | AFFECTED NUMBERSDEMOGRAPHIC DATA_1. Average number of persons per household 4.062. Sex ration: Females per 1000 males 8193. Age distribution
Percent below age of 14 years 33%Percent between 15-59 years 65 %
4. Percent marriedFemale above the age of 18 46%Male above age of 21 46 %
SOCIAL STRUCTURE5. Religion
Hindu 70%Muslim 14 %Buddhist (5 %), Christians (2%) and Others 16 %
6. CasteScheduled Castes 23 %Scheduled Tribes 2%Other backward Classes 15 %Upper Castes 7%Others (including non-respondents) 53 %
7. Language - Mother TongueMarathi 40%Hindi 29 %Telagu 6%Tamil 4%Kannada 2 %Urdu 2 %Others 17 %
8. Literacy - above age of 6 60%
ECONOMIC STATUS9. Average number of earners per PAH 1.3810. Average income of eamer (Rs.) 194911. Average monthly household income (Rs.) 267312. Percent of household below poverty line 35 %13. Number of commercial establishments 111614. Workers in commercial establishments 214215. % of establishments having monthly tumover 84 %
less than Rs. 50000
10

Mumbai Urban Transport Project Consolidated Environmental Assessment
APPENDIX 3.1 Cont..PARAMETER AFFECTED NUMBERS
16. Occupational StructureGovemment service 9%Private service 42 %Self employed 31 %Casual Labour 18 %
HOUSING: MATERIALS AND AREA17. Materials used (% of PAH)
Roof: Asbestos Cement Sheets 50 %Clay Tiles 18%Plastic, Tin sheets etc. 17 %
Walls: Bricks 47%Tin sheets 29 %Plastic and other 16 %
18. Area Residential (% of residential houses)Upto 10 sq.m. 29 %10sq.m.to15sa.m. 38%15 sq.m._to 20 sq.m. 22_%20 sq.m. and above 11 %
19. Commercial EstablishmentsLess than 10 sq.m. 37_%Between 10 and 15 sq.m. 21 %More than 15 sq.m. 43%
ENVIRONMENTAL (% OF PAHS HAVING ENVIRONMENTAL SERVICES)20. Water Supply
Individual Tap Less than 1%Public Stand Posts 93
21. ToiletsIndividual Less than 1%Public 71 %Not available 22 %
22. Solid Waste CollectionRegular 6 %Occasional 55 %Not available 32 %
11

Mumbai Urban Transport Project Consolidated Environmental Assessment
APPENDIX 4.1SECTORAL LEVEL ENVIRONMENTAL ASSESSMENT (SLEA)
METHODOLOGY
1.1 GENERAL
A Sectoral Level EA is an evolving methodology and has been found to be veryuseful to examine the cumulative impacts of multiple projects planned in the samesector. It usually addresses the mixture of projects Droposed for the next few yearswhich may comprise a number of large and small ;--rojects -ne later not warrantincindividual environmental assessments. They shoula result in identification of majorenvironmental issues in the sector and development of database enabling projectsspecific EA to proceed expeditiously.
A variant of this application called a programmatic level EA which addresses anumber of small projects which can be replicated at various locations and for whichthe impacts are more or less the same at any location.
Other purposes of SLEAs are:i) Review of environmental impacts of sector investment alternativesii) Evaluation of the environmental effects of sector policy changesiii) Assessment of:
- Requirements in the sector for environmental review mitigativemeasures and EMP
- Capacities of Sectoral institutions- Need for training, development of guidelines for institutional
Strengthening.
A Sectoral level strategy is formulated to guide the development of an economic orservice sector for the benefit of the public, and aims at achieving the objectives setforth for this purpose. Traditionally, a strategy is developed on the basis of thetechno-economic evaluation of various alternatives or options. Each option isdefined by a set of actions or projects which are expected to translate the underlyingtheme of the option into reality. An option or a mix of options, which is determined tobe cost-effective in achieving the specified objectives is then selected as the strategyto be pursued for the development.
In evaluating these altematives or options, little consideration is given to theirenvironmental or social (other than explicit sectoral objectives) implications. Withincreased significance of interaction among social, environmental and economicsectors, the evaluation of alternatives/options must also consider their impacts on
12

Mumbai Urban Transport Project Consolidated Environmental Assessment
environmental components, society at large and the stake holders. These options oralternatives must be further examined with respect to the institutional feasibility ofimplementing various projects identified under each of these options. Also, measuresto alleviate adverse impacts associated with options or a strategy should be identifiedfor guiding the implementation of the selected transportation strategy.
The sectoral level assessment of MUTP - 11 under this assignment is perhaps the firstof its kind being carried out in India and so is the environmental assessment-methodology evolved for the purpose to analyse the four transportation optionsdescribed in the previous section. This methodology comprises the followingelements.
* Scoping or identifying spatial and temporal boundaries for analysis.
* Identifying various environmental components (areas) and stake holders likely to
be impacted under a transportation option.
* Identifying indicators or indices which can quantify both adverse and
beneficial impacts to the extent possible.
* Identifying impacts, which cannot be quantified, and which should bedescribed qualitatively.
* Developing techniques and / or identifying tools and models to make futureprojections / predictions so that the options could be evaluated with respect todifferent time horizons.
* Identifying or developing an appropriate method for comparing different types ofimpacts across the options so that the selection of an appropriate transportationstrategy can be facilitated.
* Examining the implementation of the options or alternatives from theInstitutional point of view.
* Identifying the mitigation measures for the adverse impacts likely to result fromthe implementation of the options.
It should be noted that the above elements are not sequential steps for carrying outan environmental analysis. Nevertheless, these elements form the basis forconducting SLEA.
13

Mumbai Urban Transport Project Consolidated Environmental Assessment
This section presents the methodology for carrying out SLEA. Accordingly, the rest ofthe section is organised to present scoping i.e. spatial and temporal boundaries forcarrying out the analysis: environmental impact areas or components; andmethodology used for estimating the impacts on each environmental, component.Indicators or indices used for quantifying the impacts are also presented, whereverpossible. In such cases, where impacts can not be easily quantified, qualitativedescription of impacts in a structured manner is emphasized.
1.2 SCOPING
For the purpose of the environmental analysis, MMR is divided into four sub regionsnamely Island City, Western Suburb, Eastern Suburb and the rest of MMR. Thesefour sub regions have been considered because of their distinct land use, economiccharacteristics and transportation characteristics. For example, residential andindustrial land use in Eastern Suburbs generates heavy vehicle movement or trucktraffic in the sub region, whereas traffic in Western Suburbs is dominated by privatevehicles. The land use characteristics of the sub regions are shown in Table 4.1.1.Figure 3.1 in chapter 3 shows the land use characteristics of the entire MMR.
Table 4.1.1 Major Land Uses in the Four Geographic Zones of MMR
Geographic Zones of MMR Characteristics of the Major Land usesIsland city Residential and Commercial
Eastern Suburbs Residential, Industrial and wetlands
Western Suburbs Residential, Industrial, Forests and ecologicallysensitive wetlands
Rest of MMR Residential, Industrial, Forests, Wetlands andAgricultural lands.
Whereas, an environmental analysis is carried out for the above four sub regions tounderstand the implications of various options on each sub region individually, themethodology for carrying out analysis cuts across all these sub regions. Further, theanalysis is done for two p-Lnning time horizon years 2001 and 2011.
1.3 ENVIRONMENTAL IMPACT AREAS
A transport alternative or option comprises various projects and programs,implementation of which is expected to achieve the transportation goals of MMR in
14

Mumbai Urban Transport Project Consolidated Environmental Assessment
consonance with the underlying theme of the option, e.g., emphasis on promotingpublic transportation or discouraging traffic flow in a specific sub region. Eachalternative could influence the composition and volume of traffic to varying degreedepending on the type of projects and programs envisaged under the altemative.However, basic modes of traffic such as cars, taxis, two wheelers, auto rickshaws,buses and trains will continue to exist in MMR under each of the alternatives. Since,the operation of these vehicles results in air pollutant emissions and noise, impactsof each transport alternative on the air quality and noise levels are considered in the'environmental analysis.
The implementation of the transportation projects will involve the construction ofroads and railway lines through or adjacent to ecologically sensitive areas. Hence,ecological impacts of the alternatives are also considered in the analysis. The projectimplementation may further result in direct or indirect social impact. The direct socialimpacts could arise from the displacement of people and commercial establishmentfrom the road and rail alignment areas. The ease of commuting due to a new ormodified road / rail link would, however, be beneficial to the commuters and goodstraffic. The secondary development that may come up due to a rail/road link couldalso have social implications.
Hence, the four impact areas considered for the environmental analysis of thetransportation alternatives are as follows.
. Air Quality Impacts* Noise Impacts* Ecological and Land Use Impacts* Social Impacts (Limited to Displacement of People)
Although each of the transport options will affect the above mentioned fourenvironmental components to varying degree, the level of service it renders will alsovary from option to option. In order to select the option not only from environmentalangle, but also from the service point of view in additional impact areas namelytransport service has also been considered.
Since, air quality and noise impacts of various transport alternatives are determinedby traffic composition, volume and speed, these traffic parameters for differentalternatives and sub regions are estimated by using the Regional Transport Modelfor MMR. In order to appreciate how different development scenarios andtransportation alternatives influence the determination of the above trafficparameters, a brief overview of the Regional Transport Model (developed by WS
15

Mumbai Urban Transport Project Consolidated Environmental Assessment
Atkins for MMR) is given below. This is followed by the methodology used fordetermining the above impacts.
1.4 THE STRATEGIC TRANSPORT MODEL
The Strategic Transport Model for MMR, developed as a part of the WS Atkins study,predicts traffic volumes and speeds for different vehicle modes for eachtransportation link under various transportation alternatives, for the base year (1996)and year 2011.
The model considers three modes of travel i.e. cars and motorcycles: taxis and autorickshaws; and public transport (bus and rail). The MMR is divided into 110 zones (47in Island City, 27 in the suburbs and 36 in the region outside MCBM for developingtransportation networks to be used in the transport model. There are 1200 majorroad links considered in the model. The model generates separate networks forprivate vehicles (cars and motor cycles), taxis and auto rickshaws and publictransport for year 1991. The latter includes 500 bus and rail routes. The twoimportant sub models which allow the transport model to predict future transportscenarios and associated * traffic parameters are:
* trip-end submodel* joint trip distribution / modal split submodel
Trip-end Submodel:
This sub model relates demand for travel - trip generation and trip attraction i.e. foreach zone to zonal planning parameters. Peak and off-peak periods are simulatedseparately. The set of equations used to simulate trip generation and trip attractionfor different transport modes is shown in Table 4.1.2.
The dependence of trip generation and trip attraction on planning parameters suchas House Holds owning Vehicles (HHV), Resident Workers (RW) and Employmentplaces (EMP) makes the transportation model responsive to various plannin;strategies. For using this submodel for predicting generation trips and attraction trip'-for various zones in 2001 and 201 1, appropriate projection tools for estimating HHV,RW and EMP need to be used.
Joint Trip Distribution/modal Split Submodel:
This submodel predicts the pattern of different transport modes in MMR. Theassumption underlying the sub mqdel is that an individual selects a transport modebased on the perceived cost of travel by different traffic modes, which also
16

Mumbai Urban Transport Project Consolidated Environmental Assessment
internalises value of time. Therefore, other factors remaining constant, "the numberof trips between any two zones (i,j) by a particular mode m
* increases as trip generation in i and attraction in j increases* decreases as the cost of travel by mode m between i and j increases, and* decreases as the travel cost by mode m increases relative to other modes.The submodel is represented by the following equation,
Tj= r, Gj.S,.A,.F11Where,Tij = number of trips between zone i and zone jG= total generation trip-ends in zone jAj= total attraction trip-ends in zone jSi, r, = balancing factors.
Table 4.1.2 Trip-End Submodel Equationsi) Private vehicle tripsPeak periodGeneration = 433 + 0.949 HHV (r2 = 0.587, std Error = 1044, t (HHV) = 9.5) Attractions = 25.6+ 0.001 EMP32 (r2 = 0.595. std Error = 4487. t = 4.4)
Off-peak periodGeneration = 1349.38 + 1.0938 HHV (r2 = 0.372, std Error = 1790. t (HHV) 6.33) Attraction =2.35 + 0.0000436 EMP2'5 (r2 = 0.631, std Error= 7388, t = 5)
ii) Taxi tripsPeak periodGeneration / Attraction = 220 + 0.004 EMP25 + 0.378 HHV(r2 = 0.707, std Error = 2136. t (HHV) = 2.7, t(EMP) = 44.2)
Off-peak periodGeneration / Attraction = 28.749 +0.154 EMP215+1.7129 HHV(r2= 0.72, std Error = 9792. t (HHV) = 2.65, t(EMP) = 4.36)
iii) Public transport trips
Peak periodGeneration = 15.7 + 0.566 HHV + .335 RW(r2 = 0.959, Std Error = 2225, t (HH14= 2.6, t(RW) = 36.2)Attractions = 111.9 + 0.0097 EMP(r2= 0.871, std Error = 20070, t= 4.4)
Off-peak periodGeneration = 2260 + 1.329 HHV + 0.242 RW(r2 = 0.87, Std Error= 3060, t (HHV) = 4.5. t(RW) = 17.94)Attraction = 0+0 65078 EMP (r2 =0.73, Std Error = 22494, t = 12.13)(Source: Comprehensive Transportation Study for MMR, Tech. working Paper No. 6)
Where,
17

Mumbai Urban Transport Project Consolidated Environmental Assessment
HHV - HouseHolds owning Vehicles: RW - Resident Workers:EMP - Employment places, andr1. S, = balancing factors (constants)F11 = ke- B6i Cij t = the deterrence function
where,k = cost factor (a constant)Cij, = generalized cost factorB = calibration constant - exponential functiona = calibration constant - power function
These trips are assigned to each road link based on traffic speed curves relatingtraffic flow (PCU) to speed for private or non-public transport vehicles. Bus speedsare modified to account for delays caused during bus stoppages. Traffic speedcurves are developed for the following road types with different carrying capacities.
- Urban - single carriage.way- Urban - dual 2/3 lane carriage way- Urban - dual 4-lane carriage way- Rural all purpose.
Further, centroid of each zone is connected to appropriate nodes of the road networkfor non-public modes and to bus stops and stations for public transport modes.
The Strategic Transport Model provides output in the form of PCUs, vehicle speedand vehicle kms for heavy and light vehicles for each road link. This output has beenprocessed to reassign the vehicle kms to the four identified sub regions for carryingout the environmental analysis. Also, since pollution generation potential of eachvehicle type i.e. heavy vehicles, cars, auto rickshaws and 2 wheelers is different,non-public transport PCUs and Public transport PCUs have been converted back intovarious transport modes for the base year and future planning horizon years. In thepresent case, year 2011 is considered to be the future-planning horizon andaccordingly the assessment is done for this year. The assumption underlying thisconversion is that the traffic composition in future years will remain the same as forthe base year (1996).
The traffic parameters predicted by the Regional Transport Model for differenttransport alternatives are used as inputs for air quality and noise impact analyses.
18

Mumbai Urban Transport Project Consolidated Environmental Assessment
1.5 AIR QUALITY IMPACTS
Air quality impacts of various transportation alternatives on a sub region result fromemissions generated by different types of vehicles constituting traffic in that subregion. The type of a vehicle determines the nature and level of pollutants present inits exhaust. Petrol driven light vehicles (cars, two wheelers, and auto rickshaws)mainly discharge carbon monoxide and hydrocarbons. Two wheelers and autorickshaws give rise to relatively high levels of pollution due to the incompletecombustion of fuel in their two stroke engines. Diesel driven heavy vehiclespredominantly emit particulate matter and nitrogen oxides. Depending on thesulphur content of the fuel minor levels of SO; may also be present in the exhaust.
Since the implementation of each transportation alternative would generate differenttraffic volumes and composition in the four sub regions for year 201 1, the resultingair quality impacts associated with the alternative would be different. Hence, in orderto determine the air quality impacts associated with a given transportation alternativefor the horizon year, dispersion of vehicular emissions need to be simulated toestimate the resulting ambient pollutant concentrations of CO, NOx, PM, Pb and S02for each sub region. The predicted pollutant levels for the year 2011 under eachtransportation alternative when compared to the base year pollution levels provide anassessment of air quality impacts due to the alternative. Also, for the quantificationof impacts, air quality indicators or indices need to be identified or developed. Hence,air quality impact analysis involves the following steps.* Determining baseline air quality (reflecting air pollution resulting from the base
year traffic level) of the sub regions,* Estimating vehicular emissions in each sub region for each option / alternative for
2011,* Simulating dispersion of the vehicular pollutants to estimate resulting ambient
concentration increments for each sub region and option for the year 201 1,* Assessing impacts of the estimated concentration increments on various stake
holders or target groups by using value function curves for the above pollutants.(These curves provide a relationship between ambient pollutant concentrationsand the resulting impacts on human health and the environment).
1.5.1 Baseline Air Quality
The baseline or base year air quality of the four sub regions and MMR as a whole isused to assess change in the air quality due to the transportation alternatives for thehorizon year 2011. For making assessment of the baseline air quality of each subregion, the sub regions were divided into square grids. Air pollution monitoring wascarried out at various locations in each of the four sub regions. The pollutantsmonitored at most of the locations or sites included sulfur dioxide, nitrogen oxides,
19

Mumbai Urban Transport Project Consolidated Environmental Assessment
particulate matter, lead, PM1O, carbon monoxide and hydrocarbons. The sites wereselected to represent predomin' vehicular pollution areas. The monitoring wascarried out for three or more d- . . The monitored pollutant concentration valueswere used to estimate baseline concentrations at the centre of each grid by using theinverse square weighted interpolation technique. The weighted interpolation schemeincorporates the influence of prevailing wind pattern and topographical features. Theestirnated pollutant concentration values in a grid were then used to determinequality index for each pollutant using value function curves to represent its potentialair quality impacts. The value function curves for CO, NO,, C02, PM10 and Pb areprovided in Figure 1.5.1 to Figure 1.5.5. Quality index values vary from 0 to 1,higher values indicating better quality. (Reference: Environmental Impact Analysis -A New Dimension in Decision Making by R.K. Jain and L.V. Urban, 1981).
20

FIG. 3.5.1: VALUE FUNCTION CURVE FOR CARBON MONOXIDE
1 \ 1 0.8
x
,0.4 - l l
0.2
0 10 20 30 40
1-HOUR AVERAGE CONC. (ppm)
FIG. 3.5.2: VALUE FUNCTION CURVE FORSULFUR DIOXIDE
1
0.8 xw
-J 0.4 __ _ _ - ___ __
D
00 0.05 0.1 0.15 0.2 0.25
24 - HOUR ANNUAL AVE CONC. (ppm)
C .- - .- .. _ I . _ _ I

Mumbai Urban Transport Project Consolidated Environmental Assessment
FIG. 4.1.3 VALUE FUNCTION CURVE FOR PM10
22

u.l <- r-- -..-
w
4a (i t -~ -~
0.00) uOO .((] 840 104 I)X .,U ';iOj)
24-HR ANNUAL AVERAGE CONC. (ug/m3)
F:jG. 3.5.4: VALUE FUNCTION CURVE FOR NOx
J \1
10
0.4
0.2
0 .00 0.05 0. I 1.
24-HR ANNUAL AVERAGE CONC. (ppm)

FIG. 3.5.5: VALUE FUNCTION CURVE FOR LEAD (Pb)
0.8x
0 . C_ _ _ _ _ __ _ __ _ _ _ _ _ _ _ _
Z 0.6
-< 0.4
0.2 -_ _ _ ___ ___
0
0 0.2 0.4 0.6 0.8 1
24-HR ANNUAL AVERAGE CONC.(ug/m3)

Mumbai Urban Transport Project Consolidated Environmental Assessment
1.5.2 Air Dispersion Modelling Analysis
An air quality model relates air pollutant emissions to the resulting ambient airpollutant concentrations under different environmental settings includingmeteorological conditions. The output of the modelling analysis is in the form ofpollutant concentrations at the specified receptor locations. The model estimatedpollutant concentrations can be used in determining quality indices from valuefunction curves to reflect the air quality impacts of the transportation alternatives.
The choice of air quality model depends on various factors, which include thefollowing:
- Spatial domain on which the model is to be applied- Time domain on which the model is to be applied- Nature of pollutants- Type of pollutant sources
It is difficult to develop or select a model which takes into account all these factors ina satisfactory manner. An attempt is however made to select a model which meetsmost of the modelling requirements, and at the same time, is simple to use andcalibrate/validate. The choice of the Roll Back model for estimating pollutantconcentrations, instead of the earlier proposed PAL model is made because of thesimplicity of the former. The use of a simple model as against the sophisticated onesis particularly preferred for a sectoral level .analysis as the input requirements for thelatter are-too detailed and not justified for a macrolevel assessment. Moreover,PAL has the following limitations.
* Although PAL can handle six types of sources including special line and curvedsources, it can handle only 99 road links in a single run. There are about 600road links in the entire region, which need to be considered for modellingpurpose. Further, some of these links traverse through more than one subregion (impact analysis is carried out for each sub region separately as indicatedin the scope), which complicates the application of the model to a sub region.
* PAL can be used to estimate pollutant concentrations up to several hundredmeters only. The area under each sub region extends up to several kms.
* PAL inherits all the limitations of the Gaussian equation based models, such asflat terrain assumption, unreasonably high concentration estimates during lightwind conditions, etc.
25

Mumbai Urban Transport Project Consolidated Environmental Assessment
PAL's input data requirements are intensive and collection of data at such adetailed level can not be justified for a sectoral level analysis.
The above limitations of PAL also suggest the use of a simple model like the RollBack model for estimating vehicular pollutant concentrations under differenttransportation alternatives for the year 2011.
Roll Back Model:
Roll Back Model is a simple proportionate reduction model, which is based on theassumption that reduction in pollutant emissions proportionately reduces theresulting ambient air pollutant concentrations. Thus the model can bemathematically represented by the following equation.
Cl/C2 = Q1/02where,C1 = concentration at a given point due to emissions Q1
C2 = concentration to be estimated at the same point due to emissions Q2
C, and C2 may also be called as receptor data, whereas Q1, and Q2 are called assource data. The predicted concentration 02 correspond to the same set ofmeteorological conditions as that for Ci and are of same nature as that of Ci. In thepresent case Ci represents the ambient air pollutant concentrations and therefore sodoes C;.' The model predicts the future ambient air pollutant concentrations in thelight of changes in the traffic related emissions (Q;) assuming the other emissions toremain the same for the future years.
For the application of the Roll Back model in the present study, the model equationsfor the concerned pollutants were developed by using the estimated ambient airpollutant concentrations and estimated vehicular emissions for the base year. Theestimation of the base year pollutant concentrations has been discussed in theprevious sub section. For estimating base year emissions, the road links traversingthrough each grid of the sub region are identified. Vehicular emissions are assignedto the grid based on the length of links intercepted by the grid and vehicle kmscarried by the intercepted road segments. Vehicle kms for each traffic mode areestimated by using the Regional Transport Model. Vehicular emissions for the baseyear in each grid are estimated by segregating the vehicles into old (productionbefore 1991) and new (production after 1991) vehicles and calculating totalemissions using emission factors prescribed for 1991 for old vehicles and thoseprescribed for 1996 for new vehicles. The IIP emission factors, which are prescribedby MOEF for different years, are given in Table 4.1.3. Vehicle statistics in terms ofold and new split is obtained from R.T.O.
26

Mumbai Urban Transport Project Consolidated Environmental Assessment
Table 4.1.3. IIP Emission Factors (gm/km) for various Traffic Modes
Vehicle 1991 1996 2000Type
Co NOx Pb S02 CO NOx Pb S02 CO NOx Pb S02
Two 12.0 1.58 0.00 0.65 4.5 1.58 0.00 0.65 2.0 0.65 0 0.65Wheeler 9 9 8Three 18.0 2.37 0.01 0.65 6.75 2.37 0.01 0.65 4.0 0.65 0 0.65Wheeler 3 3 8Car 14.3 1.57 0.02 1.4 8.68 1.32 0.02 1.4 2.72 0.42 0 1.39
7 7 7 8
Bus 11.2 4.0 0.0 4.3 9.0 1.2 0.0 4.3 1.6 1.78 0 4.295 5
Truck 11.2 4.0 0.0 4.3 9.0 1.2 0.0 4.3 1.6 1.78 0 4.295 5
LCV 9.6 2.5 0.0 1.16 7.7 2.32 0.0 1.16 1.09 1.29 0 1.165
Note: IIP - Indian Institute of Petroleum
Vehicular emissions needed for estimating pollutant concentrations for thetransportation options during 2011 are computed by using the proposed emissionstandards for the year 2000 as emission factors. (Ref: Report on Vehicle Emissionsand Control Perspectives in India prepared by Indian Institute of Petroleum forMinistry of Environment and Forests, Government of India in 1994)
In case of computation of lead emissions it is assumed that petrol cars registered inBrihan Mumbai after 1st April 1995 would have zero lead emission as these carswould be running on unleaded petrol. However, cars registered in the Rest of MMRwould continue to have lead emissions in accordance with the 1996 standarads. Allthe cars manufactured after 2000 are assumed to have catalytic converters, andtherefore, zero lead emissions. The above assumption is made based on the factthat the 2000 AD emission standards are achievable only by using catalyticconverters with unleaded petrol.
Actual emission from vehicles would depend on several factors such as age of thevehicles, vehicle condition, operating speed, etc. Though the operating speed will bemore or less the same for all vehicles in a particular segment of the road, the othertwo factors i.e. age of vehicles and vehicles conditions would vary from vehicle to
27

Mumbai Urban Transport Project Consolidated Environmental Assessment
vehicle. Therefore, these factors have not been considered in the emissionestimation. Further, since it has been proposed to adopt emission standardsprescribed by IIP for the year 2000 it is assumed that irrespective of vehicle conditionand age of the vehicles, all the vehicles will have to conform to these standards. TheRTO will have to ensure that these emission standards are met by all the vehicles,through PUC implementation, which does not envisage different emission standardsrelated to age or condition of the vehicles.
1.5.3 Stake Holders
Various stake holders likely to be affected by vehicular pollution are: (i) population ofthe sub regions exposed to the vehicular pollution, (ii) people living along the majorroad links and (iii) commuters. However, since traffic related pollution is usuallyconfined to the road corridors, exposure to population living along the road corridorsis used to indicate air quality impacts of the transportation altematives.
Air quality impacts on the above group of people are estimated by assuming that onlythe people living within 150 meters on both the sides of the road segment areexposed to the pollution level estimated for the grid in which the road segments lies.The number of people living along the road corridors are estimated by using totalroad length, and population densities for the base year and future years in the foursub regions.
1.5.4 Air Quality Indices
Roll Back Model equations for the concerned pollutants, and their respectiveemissions computed for each grid is used to' estimate pollutant concentrations in allthe grids. The estimated concentrations are used to determine quality index of eachpollutant in each grid for the transportation options in the year 2011 with the help ofappropriate value functions. The overall quality index of each pollutant in asubregion is then computed by using population along the road corridors as theweighting factor for averaging the' quality indices determined for each grid. Theoverall quality index of a pollutant in the subregion is defined as:
I l=
I PiWhere,Q ,0 = Quality Index of ith pollutant corresponding to its concentration Cij for grid jPj= Population along the traffic corridors in grid j.I, = Overall quality index of ith pollutant in the sub-region
28

Mumbal Urban Transport Project Consolidated Environmental Assessment
The value functions of the pollutants are shown in Fig. 4.1.1 to 4.1.5.
1.6 NOISE IMPACTS
The operation of trains, cars, trucks, two wheelers and auto rickshaws also contributeto the generation of noise. The level of noise generated depends on a number offactors including type of vehicle, vehicle speed, number of vehicles (or traffic volume)and road condition. Since, different transportation alternatives would result indifferent vehicle composition in MMR, noise impacts would vary from onetransportation alternative to another. The land use characteristics by virtue ofattenuating noise propagation could also influence noise exposure to population. Fornoise impact quantification and assessment, appropriate noise indicators/indicesneed to be identified.The following steps are used to determine noise impacts of the transportation
alternatives in the four sub regions and MMR as a whole.
* Identifying noise indicators and indices
* Estimating traffic composition and volume for road links of each sub region under
each alternative using the Regional Transport Model
* Using an appropriate noise prediction model to estimate traffic related noiselevels for the base year and the planning horizon years under the transportationalternatives
* Assessing traffic related noise impacts on different stake holders
1.6.1 Noise Level Indicators
Noise is undesired sound which gives rise to fluctuations in atmospheric pressureand causes an eardrum to vibrate. In the middle ear, these vibrations are transmittedthrough a series of three small bones to the liquid filled inner ear. The inner earcontains about 30,000 sensory cells, each with a small hair protruding in the liquid.The liquid movement produces nerve impulses which are carried by the auditorynerve to the brain where they are perceived as sound.
Noise induced hearing damage occurs in the inner ear due to two types of impacts -
acoustic trauma resulting from sharp and very loud sound due to blowing apart ofsensitive hair cells; and prolonged exposure to relatively lower noise levels resultingin the wearing of cell hairs. Noise standards are typically set up for protectingexposed population from the above two types of impacts.
29

Mumbai Urban Transport Project Consolidated Environmental Assessment
Various noise parameters which are of interest from noise generation and exposureview points are Lio, Lso, Lgo and L",q.
L,o is the noise level that is exceeded 1G percent of the time, and generallyrepresents peak noise level. This parameter is useful indicator for situations whereshort duration and high irrv:ulsive noise levels (e.g., 140 dBA) are expected. Hencethis indicator is not of much use to assess traffic related noise levels, which areexpected to be in the range of 60-85 dBA.
Lw is the noise level which is exceeded 50 percent of the time and is close to theaverage noise level.Lgo is the level which is exceeded 90 percent of the time and indicates backgroundnoise level.
Lq, or the equivalent sound level is an energy average of sound level during aspecified period of time. From the noise exposure view point, Leq is a moremeaningful parameter as it correlates well with the effects of noise on people. Hence,this indicator is used for the purpose of noise impact analysis.
The CPCB has established noise standards (Table 4.1.4) for protecting populationlikely to be exposed to different noise sources. These noise standards are providedas Leq for Daytime and Nighttime.
Table 4.1.4 The CPCB Established Ambient Noise StandardsLeq dB(A)
Land UseDay time Night time
(6.00 to 21.00 hrs) (21.00 to 6.00 hrs)Industrial area 75 70Commercial area 65 55Residential area 55 45Silence zone 50 40
Traffic Noise Indicators
Noise generated from the transport activities needs to be assessed separately forday and night time since the intensity of its impacts is different during these times.Hence, noise levels predicted at 30 m from the centre line of the road are furtherprocessed to calculate the percentage length of links in a subregion exceeding theirday and night time standards respectively. The percentage values so obtained arerepresented by Traffic Noise Index (TN I)" for day and night. Day time and night timeTNI values are used to compare the noise impacts of the options or alternatives.
30

Mumbai Urban Transport Project Consolidated Environmental Assessment
TNI (day) = % of length of road links in a subregion exceedingday time standard.
TNI (night) = % of length of road links in a subregion exceedingnight time standard.
1.6.2 Noise Modelling Analysis
Traffic Composition, Volume and Speed:
Traffic composition, volume and speed for each road link under differenttransportation alternatives are required for estimating traffic generated noise levels.These traffic parameters are estimated by using the Strategic Transport Model ofMMR. This model is already discussed earlier in this section.
Noise Prediction Model:
The US Federal Highway Administration (FHWA) model is used for predicting noiselevels at 30 m from the road central line due to each vehicle type (heavy and light)operating on a road link. The composite noise effect of heavy and light vehiclesoperating on the road link is obtained by the logarithmic addition of noise levelspredicted for each vehicle type. The model considers the effect of speed and noiseabsorption characteristics of the site on traffic generated noise levels. Lcq for heavyand light vehicles is calculated by using the following mathematical expression.
Leqi (h) = Loei + 10 Log (Ni/Si .T)+10 log (1 5/d) 1 + a + 8s -13
where,
Leqi (h) = Leq for hours 'h' for the i" vehicle type (heavy or light)Loei = reference mean sound level for the ith vehicle typeNi = number of vehicles of class 'i' passing during time T through a particular
road sectionSi average speed of the i" vehicle class in km/h in the particular road
sectionT = duration for which Leq is desired and must correspond to time for which
NI is measured.d = perpendicular distance in m from the centerline of the t raffic lanes to the
location of the observer.a = factor representing the adsorption characteristics of the ground cover
between the roadway and the observer.s= Shielding factor provided by noise barriers.
31

Mumbai Urban Transport Project Consolidated Environmental Assessment
The reference mean sound levels for heavy and light vehicles are shown in Figure4.1.6. For Island City, the noise absorption characteristics a is taken as 0.5 as theroads pass through high density built-up area. For other sub regions, a is taken aszero as major roads pass through open areas with a few exceptions. Other trafficparameters required to be input to the model are obtained from the RegionalTransport Model.
The above noise prediction model is used to predict traffic noise for heavy and lightvehicles for each road link at a distance of 30 rn from the centre of the road. Thepredicted noise levels for heavy and light vehicles are then added togetherlogarithmically
The modelling exercise is repeated for each link of the four sub regions for all therelevant transportation alternatives, and results are processed to calculate TNIvalues to facilitate the comparison of noise impacts across the sub regions andtransportation alternatives.
Figure 4.1.6 Reference Mean Sound Level for Heavy and Light Vehicles
FIG.NO. 3.6.1 Reference Mt Sound Level for Heavy e nd Light Vehicles
100
e 60
~40z0
e 20
020 30 40 S0 60 70 80 90 100
SPEED (KMPH\
Noise impacts due to traffic in an urban setting with high density of houses are highlylocalized, and mainly concentrated along road corridors. Hence, commuters andpeople living along major traffic corridors are the two population groups likely to beimpacted by traffic noise. Traffic noise from the road / rail sections passing throughgreen zones may also affect wildlife in these areas, but it is not considered in theanalysis for lack of knowledge in this area.
32

Mumbai Urban Transport Project Consolidated Environmental Assessment
The Traffic Noise Indices defined above are used to assess traffic generated noiseimpacts on population living adjacent to major roads.
1.7 ECOLOGICAL IMPACTS
Two types of ecological impacts, namely direct and development induced, areenvisaged as a result of the implementation of rail and road projects under thespecified transportation alternatives. Direct impacts result from the destruction offlora and fauna due to the construction of roads or railway lines. Since theintroduction of roads and railway lines in a region is known to induce development inthe area, hitherto virgin forests and wetlands could experience developmentpressure. The severity of direct or development induced impacts on the ecologicalresources depends on the extent and richness of these resources at the road/railproject sites. In the MMR region, though there are ecologically sensitive areas likemangroves, wetlands and forests, they are not unique in features and the threatsposed by the transport and traffic related projects are not likely to cause anyirreversible damage to the ecosystems. Moreover, the proposed MUTP - IIencounters very few ecologically sensitive areas and adequate mitigative measurescan be provided to almost completely mitigate the adverse impacts. There are nosuch rare and endangered species along the project sites, which once lost, will belost forever, causing irreversible damage to the ecosystem. The degree of reversibleimpact caused by the transport and traffic related projects on the ecosystem wouldhowever vary from option to option. In view of the above, the ecological impacts ofthe alternatives are assessed at a qualitative level using the following framework.
* Description of location and existing ecological status of the ecologically sensitiveareas through which the relevant road / rail link passes
* Qualitative description of direct and development induced impacts
* Mitigation measures to indicate the extent to which adverse ecological impactscould be alleviated.
1.7.1 Quantification of Ecological Impacts
In addition to providing qualitative analysis of ecological impacts, attempt is alsomade to quantify these impacts so that a comparison of these impacts could bemade across the proposed transport alternatives. The rationale used for quantifyingecological impacts is as follows:
33

Mumbai Urban Transport Project Consolidated Environmental Assessment
(i) Damage to an ecological area due to a road/rail alignment will be proportionalto the area covered by road/rail segment in the ecologically sensitivezone.
(ii) Damage will be severe if the ecological area or system is of higher quality.
Further, because of the difference in the degree of importance attached to naturaland man-made ecological systems, the impacts on these two types of systems areconsidered separately. The ecological impact on each of the system is measured byadding weighted areas of road/rail alignments traversing through the system, whereweights represent the quality of the system. Thus ecological impact indices 7or thetwo systems can be expressed as follows:
El (natural) = Eli = I Wn, Ai
El(man-made)= E12 = E W1 j AjWhere,Wni = weight associated with or importance given to a natural ecological
system of class i
Wmj = weight associated with or importance given to a man-made ecologicalsystem of class j
Ai = Total area of road/rail alignments intercepted by natural ecologicalsystems classified into category i.
Aj = Total area of road/rail alignment intercepted by man-made ecologicalsystems classified into j th category.
Classification of ecological systems and weights assigned to these classes orcategories are provided in Tables 4.1.5 and 4.1.6 for natural and man-madesystems, respectively. Higher value of the weight indicates higher quality of theecological area, which is prone to more adverse impacts due to a road/rail project.Thus, higher values of El represent potential for more adverse impacts on ecologicalsystems.
The procedure described above for computing ecological impact indicators (Eli andE12) is used to quantify ecological impacts of the four transport options. The resultsare presented in Section 4.
34

Mumbai Urban Transport Project Consolidated Environmental Assessment
Table 4.1.5 Classification of Natural Ecosystems and Associated Weights
Type of Area WeightNatural vegetation with high or moderate species diversity and tree canopy 4cover greater than 60%
Natural vegetation with high or moderate species diversity and tree canopy 3cover between 30 to 60%
Scattered trees with 60% ground cover of herbs, grasses and bushes 2(Species diversity moderate to low)
Ground cover of natural vegetation less than 60% or the degradation of 1the area is irreversible
Table 4.1.6 Classification for Agricultural Land Plantations and Associated Weights
Type of Area Weight
Agricultural land with 2 crops or plantations with ground cover 3greater than 60%
Agricultural land with crops or plantations and ground cover 2between 30 to 60%
Fallow agricultural land or plantation with ground cover<30% 1
1.8 SOCIAL IMPACT (LIMITED TO DISPLACEMENT OF PEOPLE)
The projects identified under various transport alternatives could give rise to widerange of social impacts as the implementation of some of these projects wouldrequire displacement of households and commercial establishments. The number ofhouseholds and commercial establishments to be displaced provide the measure ofadverse social impacts due to the proposed projects. Hence, for each sub regionand each transportation alternative, number of
35


Appendix 4.2
ENVIRONMENTAL ANALYSIS OF THETRANSPORT ALTERNATIVES
4.1 INTRODUCTION
The focus of this section is to apply the environmental analysis methodology presented in theprevious section to the four transportation options. The analysis is carried out for the four subregions viz. Island city. Western Suburbs, Eastern Suburbs and the Rest of MMR, Impacts on eachsub region are discussed under four categories such as pollution (air quality, noise), ecological, socialand transportation service related areas. The description on environmental impacts is preceded by ashort description on traffic analysis as it provides inputs for predicting air quality and noiselevels. All the impacts are summarised in a table for each sub region at the end of the sub section.
4.2 ISLAND CITY
The city covers an area of 68.71 square kms. The predominant land uses are residential andcommercial, though some area is also under industrial use. The population growth rate has stabilizedover the past two decades in the city. In fact, the last decade (1981 - 1991) registered 2.4 percentdecrease in the population. As per 1991 census, the population in the area was 3.17 million with thegross population density of 46135 per sq. km.
Although population and employment seem to have stabilized in the city, the latter continues to havethe concentration of commercial jobs. The vehicle ownership in Island City is also highest withinMMR. Both these factors contribute to high levels of traffic congestion and low traffic speeds in thissub region. High congestion levels are also caused by the port oriented transport activities. There isconflict between pedestrian and vehicular traffic in the central part of the city, which creates unsafeconditions for the operation of traffic.
There is not much scope for widening" the roads or adding additional street links in Island City.Hence, the basic street network will remain at the existing level. Three programmatic level roadprojects i.e. ROB at Mahim, Flyover at Dadar and Dadar W Gyratory are likely to be implemented inthe city by 2001.
Under some alternatives, the length of Eastern freeway may increase marginally. Under the high railinvestment alternative 6 th corridor will be constructed between Wadala and Port market.
4.2.1 Traffic Analysis
The Regional Transport Model developed by WS Atkins for MMRDA was used to estimate trafficcomposition and speeds under various transport options in Island City. The results are provided inTable 4.2.1. The results indicate that traffic speeds would increase for the road investment option forthe year 2011. The road investment option obviously shows bias toward privately owned vehicles.However, "vehicle kms by cars and two wheelers decrease slightly under the road investment option,which may be due to decline in the growth rate in Island City. Under the demand managementoption, private vehicle kilometers show decline as compared to the road investment option.
37

Table 4.2.1Traffic Composition and Speeds under Various Options in Island City
Parameter Vehicle Type Year year 2011
Base Do Min Public Public ReadCase Transport Transport + Investment
Dem. Mgt _
Road Length (krms) 114.0 120.0 120.0 120.0 128.0
Peak hour Buses 12,088 13,046 13,046 14495 14,793
Veh.Hum Trucks 22,331 34,575 34,575 31118 31,676
Cars 122,331 123,394 122,763 100665 125,069
2 Wheelers 45,000 41,131 40,921 40921 41,690
3 Wheelers Nil Nil Nil Nil Nil
Speed Buses 17.43 17.74 17.73 22.73 20.20
(kuph) Trucks 19.75 19.06 19.28 24.28 24.35
Private Vehicles 19.10 21.07 21.24 26.24 22.25
The road lengths shown in the table represent the length of the road links which significantlycontribute to vehicle kilometers.
The traffic composition and speeds determined by the Regional Transport Model were used as inputsto the air quality and noise models for predicting vehicular pollutant concentrations and traffic noiselevels, respectively, for the transportation alternatives.
Some of the proposed road and rail projects pass through sensitive ecological areas. At some places,households and commercial establishments have to be displaced for the implementation of theproposed projects. Hence, ecological and social impacts of the projects also need to be assessed.
Air quality, noise, ecological and social impacts, and also the transportation service related impactsof the transportation alternatives are discussed in the following paragraphs.
4.2.2 Air Quality Impacts
Baseline Air Quality:
The baseline air quality (which particularly reflects vehicular pollution) for year 1995 wasdetermined using air quality data monitored at 5 locations in Island City. These locations were CSTstation, near Murnbai Port Trust, Haji Ali, Dadar T.T. (Khodadad Circle) and Bhendi Bazaar.Pollutants monitored at these locations were sulfur dioxide, nitrogen oxides, carbon monoxide, totalsuspended particulate matter, PMio, lead and hydrocarbons. Measurements were taken for three ormore consecutive days at each location and 24 hour average values were calculated for sulfurdioxide, nitrogen oxides, suspended particulate matter and PMio to enable the comparison of thesevalues with their respective 24 hour average ambient air quality standards set up byCPCB and todetermine quality indices associated with these concentrattons from the respective value functioncurves. For carbon monoxide, 8 hour and 1 hour averages values were calculated for comparison withthe standards. One hour average values are used for determining the quality indices,
38

The air quality monitoring results are summarised in Table 4.2.2. These results show that the airquality in the city is very poor with respect to suspended particulate matter and PMio. Although,sulfur dioxide levels are in compliance with the air quality standards, the levels are higher atintersections with high traffic volumes. The similar trend is observed in case of nitrogen oxides.except at Dadar, where the NOx levels exceed the standards. CO levels monitored at all the sites arelow except at Dadar and CST Station.
Table 4.2.2Ambient Air Pollutant Concentrations in Island City
Location Sulfur Nitrogen Carbon Hydro- TSPM PM10 LeadDioxide Oxides Monoxide Carbons ug/m3 ug/m3 ug/m3
uglm3 ug/m3 (S h (ppm)8 hr l Hr
______________ _________ A vg A vg _ _ _
CST Station 44.7 50.5 9.8 19.4 2.61 1133.0 379.0 0.17
Near Bombay 19.0 21.6 0.20 2.0 5.64 682.0 234.0 0.32Port
Haji Ali 49.9 55.1 3.7 6.8 1.46 1110.0 272.0 0.31
Bhebdi Bazar 22.0 37.0 3.3 6.1 3.0 739.0 158.0 0.25
pritam Hotel NA NA 16.88 22.8 NA NA NA NA(Dedar T.T.)
Khareghat (Dadar NA NA 10.13 12.1 NA NA NA NAT.T.)
InDadarT.T. 56.3 93.8 NA NA 1.58 1105.0 255.35 0.65Circule
NA Not Available
For the purpose of assessing baseline air quality, Island City was divided into square grids of size 2 x2 sq.kms. each. The monitored data was used to estimate concentrations at the center of each squaregrid by using the weighted inverse square interpolation technique. Value function curves shown inthe previous section were used to determine quality indices corresponding to (he baseline pollutantconcentrations for each grid. Overall quality index for each pollutant in each of the four subregionswas computed using the definition (or expression) provided in the previous section.
Air Dispersion Modelling Analysis:
As per the methodology discussed in the previous section. Roll Back Model was used to predict theconcentrations of different pollutants and their respective quality indices (by using value functions) inall the grids of Island City. Forecasted population in various grids of Island City for the year 2011was then used to predict the overall quality indices of the pollutants.
Figure 4.2.1 shows the overall quality index for various air pollutants in Island City. The figureindicates that quality indices for the air pollutants favor the Public Transport + Demand ManagementOption.
39

ft3. 4-2 !C=lty9 el " ^_ I'L &1T. A--P:ILtf =
rn-id trnddsr UiS-~~Cr 1i 2011 in hZax Ci :HJEwr vakws in6c f't i-? apdofl
-. W i- Ao MnTrturt
OA4 '13 g | | |Pubr iTraP r , , *.De ,WcM_
0.2 . U It Road Imrstneri
CO NOx Pb S02 PM-t0
4.2.3 Impact on Noise Levels
Island City has 143 major road links. Although the six transportation alternatives will notsubstantially alter the number of these road links or the total road length in the sub region, thesealternatives are likely to affect traffic composition and vehicular speed on the roads, whichsubsequently will affect traffic noise levels. The traffic parameters required to be input to the noiseprediction model were estimated by using the Regional Transport Model. The parameters wereestimated for all the transportation options for years 1996, and 2011.
The US Federal Highway Administration (FHWA) model was used to predict noise levels at 30mdistances from the road centerline for each road link in Island City for 1996, and 2011.
Traffic Noise Indicators (TNV for day-time and night-time were calculated to represent noiseimpacts on population living adjacent to road corridors for all the transportation optionsin Island City. The TNI values are shown in Table 4.2.3 and Figure 4.2.2.
Fir 4.2 Trdffc Noi, hdks hr .I'-,d .-;:urnderVarius Om 1e- in Isne c
X :: _ lTR . I
~~~~~~~~~~~i Do _ l utrnbr 4N
Traffic Noise Year 1996Index Base Year Year 2011
Do Min Public Public RoadTransport Transport + Investment
Dem. Mgt.TNI (day) 61.4 65.4 65.4 63.7 70.3
TNI (Night) 91.5 92.1 95 98.7 95.7
40

4.2.4 Impacts on Ecological Status
In Island city, three programmnatic level projects are identified to be implemented under theminimum intervention alternative. Under the Public Transport Option, 6th corridor will beconstructed on the Central Railway between Wadala and Fort market. Since this railway alignmentand programmatic level projects do not pass through any ecologically sensitive area, these projectwill not have any ecological impacts in the sub region.
4.2.5 Social Impacts (Limited to Displacement of People)
Island City has mixed land uses. Commercial activity in the city is very high. Pavements of the majorroads are encroached by hawkers, which forces pedestrians to walk on the roads and compete withvehicular traffic for the road space.
Benefits
The obvious social benefits of the projects are improvement in traffic circulation, and subsequentreduction in traffic congestion and travel time. The three programmatic level road projects identifiedunder the Do Minimum option, i.e. ROB at Mahim, Flyover at Dadar and Dadar W. Gyratory, aim atimproving traffic circulation. The Wadala - Fort Market rail line is expected to partially relieve theeastern road corridors of the port related traffic burden.
Adverse Effects
During the construction phase, the projects will disrupt vehicular traffic. The commuters will have touse traffic diversions and spend more time travelling due to longer diversion routes and trafficcongestion. This effect will however be of temporary nature being limited to construction period.
Visual obstructions due to flyovers and ROBs will impair aesthetics and reduce sea breeze. Theseimpacts, however, will be highly localised.
Typically, approaches to the ROBs and flyovers are encroached by slums and hawkers and theconstruction of these projects lead to the displacement of people and relocation cost. However,displacement of people and their relocation are not involved for the projects identified for IslandCity.
4.2.6 Impact on Transportation
Both the rail and road pro)ects proposed under various alternatives are aimed at achieving varioustraffic objectives. Traffic Efficiency Index (TEV Road Congestion Index (TCI), and RailwayCrowding Index (RCI) are the three indices used to represent transportation service level for overallcomparison of the transport options. The values of these indices for Island City are given in Table4.2.4. As indicated by the figure, the public transport option along with demand managementprovides better level of transportation service measured by TEl, TCI and RCI in Island City.
Table 4.2.5 summarizes the values of various environmental and service level indices in Island city.The favorable values of the indicators/indices are shaded for all the options in the table in an attemptto identify the best option.
41

Table 4.2.4Transport Service Level Indicators for Various Options in Island City
Service Level Year 1996Indicators Base Year Year 2011
Do Min Public Public RoadTransport Transport + Investment
Dem. MgLt.Traffic Efficiency 0.56 0.52 0.52 0.46 0.50Index
Traffic Congstion 10.8 12.5 12.8 6.9 7.7Index
Railway Crowding 2.186 2.186 1.078 1.078 2.186Index
Table 4.2.5Summary of Environmental Impacts for tbe Year 1996 and 2011 in Island City
SR ENVIRONEMNTAL IMPACT BASE DO PUBLIC PUBLIC ROADNO. INCICATOR/INDEX YR. MIN TRANSPORT TRANSPORT INVESTMENT
(1996) +DEM.MGT.1 CO Quality Index 0.946 0.974 0.974 0.980 0.975
2 S02 Quality Index 0.937 0.936 0.922 0.965 0.939
3 NOx Quality Index 0.726 0.899 0.891 0.935 0.899
4 Pb Quality Index 0.404 1.0 1.0 1.0 1.0
5 PM-10 Quality Index 0.063 0.054 0.056 0.090 0.055
6 Traffic Noise Indec (Day)-TNI 61.40 66.41 65.41 63.71 70.31(day)
7 Traffic Noise Indec (Day)-TNI 91.48 92.07 95.03 98.73 95.73(Night)
8 Ecological Impact Indicator 0 0 0 0 0.06(Natural System) - El I
1~~~~~~~~~~~~~~~~~~~~~~~~~~~~~~~~~~~~~~~~~~~~~~~~~~~9 Ecological Impact Indicator 0 0 0 0 0
(Man-made System) - El 2
10 R & R Impacts (Number of house 0 0 0 0 0holds displaced)
=__ SERVICE LEVEL INDICATORStINDICES
11 Traffic Efficiency Index 0.47 0.48 0.48 0.54 0.50
12 Traffic Efficiency Index 13.0 12.5 12.8 6.9 7.7
13 Railway Crowding Index 2.186 2.186 1.078 1.078 2.186
42

Note: (i) For Indicators/Indices at - Sr.No. 1 to 5, and 11 higher values indicate betteroption, Whereas for Sr.No.6 to 10,12 and 13 lower values indicate better option.
(ii) The most favourable index values are shown shaded in the above table.
It is clear from the above that Public Transport and Demand Management is the bestoption for the Island City.
4.3 WESTERN SUBURBS
4.3.1 Introduction
There are residential areas, forests and ecologically sensitive wetlands in this sub region. The subregion is on the west of Mumbai and extends from Mahim in South to Bhayander in North. It coversan area of.210.34 sq.kms. The population growth rates in this sub region during 1971 - 1981 and1981 - 1991 were 60 and 40.5 percent, respectively. The growth rate of the western suburbs has beenvery high compared to that of the eastern suburbs. The gross population density in this area during1991 was 17,600 per square kilometer.
A number of projects have been envisaged to be taken up in this sub region under the transportalternatives. At present, the western suburb is served by two prominent north-south corridors i.e. S.V. Road and Western Express Highway. Even under the minimum intervention alternative (DoMinimum Option), vehicle kms are expected to increase significantly in this sub region. The threeimportant projects to be implemented in the western suburbs under the 'Do Minimum' Option areJogeshwari - Vikhroli link road, Juhu-Tara Road widening and ROB at Jogeshwari. One of theseprojects, Jogeshwari Vikhroli link road, has been partially implemented in 1995. The otherimportant road projects identified for implementation under the road investment alternativeinclude Western Relief road completion, Santacruz Chembur link road and Bandra - Worii bridge.The prominent projects identified under the Public Transport Option include quadrupling Borivali-Virar line, 5th line between Santa-cruz and Borivali, high level terminus at Bandra, quadruplingMankhurd-Kurla, 6th corridor between Wadala and Fort market, 6th corridor Kurla-Bhandup and 6thcorridor Andheri-Goregaon.
4.3.2 Traffic Analysis
The Regional Transport Model developed by WS Atkins for MMRDA has been used to estimatetraffic composition and speeds under various transport alternatives. The results of the application ofthe Regional Transport Model are provided in Table 4.3.1. The traffic composition and speedsdetermined by using the Regional Transport Model have been used as inputs to the air quality andnoise models for predicting vehicular pollutant concentrations and traffic noise levels under differenttransport options.
43

Table 4.3.1Traffic Composition and Speeds under Various Options in western Suburbs
Parameter Vehicle Type Year year 20111996Base Do Min Public Public ReadCase Transport Transport + Investment
Dern MgLRoad Length (kms) 114.0 120.0 120.0 120.0 128.0
Peak hour Buses 12,088 9,266 9266 9840 10477
Veh.Hum Trucks 22,331 28,305 28304 29371 292611
Cars 122.075 64,907 62581 67873 70716
2 Wheelers 45,000 56,319 76186 76186 86090
3 Wheelers 701110 114280 114280 129136
Speed Buses 17.43 19.20 19.50 19.40 20.20
(kmph) Trucks 19.75 25.00 25.40 24.90 26.30
Private Vehicles 19.10 24.00 24 22.0 25.20
4.3.3 Air Quality Impacts
Baseline Air Quality:
The baseline air quality (which particularly reflects vehicular pollution) for year 1996 wasdetermined using air quality data monitored at 5 locations in Western Suburbs. These locations wereMajas Bus Depot, Santacruz, * Goregaon, Borivali and Bhayander,. Except for Bhayander,pollutants monitored at these locations were sulfur dioxide, nitrogen oxides, carbon monoxide, totalsuspended particulate matter, PMio, lead and hydrocarbons. At Bhayander, only sulfur dioxide andnitrogen oxides concentrations were monitored. Mieasurements were taken up for three or moreconsecutive days at each location and 24 hour average values were calculated for all the pollutantsmonitored except for CO. For CO, 8 hourly and 1 hourly average values were determined. Theaveraging period of 24 or 8 hours was considered to allow the comparison of concentration valueswith their respective standards.
The air quality monitoring results are summarized in Table 4.3.2. These results show that thesuspended particulate matter and PMio concentrations exceed the ambient air quality standards by afactor of 2 to 5. Other pollutant concentrations were in compliance with the standards except CO atSantacruz. At monitoring locations with high traff; ls, nitrogen oxide concentrations were foundto be higher than the sites with medium traffic. ( monoxide levels were found low at all themonitoring locations. The concentrations monitoret. .A. the sub region .were used to estimate baselineconcentrations for the square grids overlaying the entire sub region. These baseline pollutantconcentration estimates were used to calculate baseline quality index for each air pollutant in the subregion.
44

Air Dispersion Modelling Analysis:
The Roll Back model developed for the sub region was used for estimating ambient air pollutantconcentrations under different transportation alternatives. The estimated concentrations were used tocalculate quality index for each pollutant and grid under the transportation alternatives for the year2011. Using the procedure specified in Section 3, overall quality index for each pollutant iscomputed. Figure 4.3.1 shows the index values. These values except for 802 favour the PublicTransport option.
Table 4.3.2Ambient Air Pollutant Concentrations in Western Suburbs
Location Sulfur Nitrogen Carbon Hydro- TSPM PM10 LeadDioxide Oxides Monoxide Carbons ug/m3 ug/m3 ug/m3
ug/m3 Ug/m3 (pm) (ppm)8 hr l HrAvg Ave ___ ___
Majas Bus Depot 29.2 30.9 0.81 1.2 1.4 725.0 249.0 0.31
Santa Cruz 30.6 24.3 3.6 9.7 1.85 463.0 155.0 0.1
Goregaon 35.7 46.5 0.8 1.3 1.78 554.0 184.0 0.35
Borivali 31.7 43.7 1.2 3.4 NA 227.6 159.0 0.08
Bhayander 19.2 22.3 1.3 3.1 NA 138.0 NA NA
NA: Not Available
1 -" . Yew '1996) - -__ ----
E3P *,nm: _
0 Pihlc Trupait DmAV.~~~~~~~~~~~OII Tvuwt 'D-s ' _
0.co MGM Pb m P11410
45

4.3.4 Impact on Noise Levels
Western Suburbs has 66 major road links. New road links and widening of the existing roads areproposed under the transportation alternatives. These projects will result in the redistribution oftraffic in the sub region and variation in noise levels under different alternatives. Noise levels for thetransport options are predicted using the US Federal Highway Administration (FHWA) model, forwhich input parameters are obtained from the Regional Transport Model. The model predicted noiselevels are used to Compute Traffic Noise Indices for day time and night time. These indicesvalues for 2011 are shown in Table 4.3.3 and Fi2ure 4.3.2.
FR. W: 1NM4""bN"~ffV1eWW =.'md
.- " .D.~ _____ _V*__
Traffic Noise Year 1996Index Base Year Year 2011
Do Min Public Public RoadTransport Transport + Investinent
Dem. Mgt.TNI (day) 51.7 69.5 69.5 71.1 70.4
TNI (Night) 86.4 94.2 98.8 96.3 93.8
4.3.5 Impacts on Ecological Status
The ecological impacts due to the transport alternatives are assessed on the basis of the impacts eachindividual project would have on ecologically sensitive land use in the sub region. The impacts ofsuch projects are described qualitatively in the following paragraphs. The major projects (which arerelevant from the view point of ecological impacts) envisaged to be taken up in the western suburbsare listed in Table 4.3.4. This table also presents. Ecological Indicators for natural and man-madesystems, which were computed using the procedure described in Section 3.
4.3.5.1 Juhu-Tara Road Widening
Existing Land use and Ecological Status:
The existing road will pass through the coastal area. The coastal area along the road is sandy and atdifferent stages of stability and land use. Pioneer grasses of saline sandy habitat have colonized inpatches of this area. lpomoea biloba creeper, which is a sand binder, is common in the area. Salttolerant or halophilic bushes, such as, Salvadora and Zizyphus are also commonly found in the area.Other plant species in the area include Xanthism, Calotropis (nitrophytes) and Ociumum,
46

Altemanthera =(calciphytes). These species are commonly found in human habitats. None of theseplants are of any economic significance. Old palmyra palms cultivated by local villagers of the pastmay provide edible fruits, but are not of any commercial significance.
Impacts:Since there are no ecologically or commercially valuable species in the area, ecological impacts dueto road construction/widening would be insignificant. However, coastal sand may encroach upon theroad and create traffic hazard by creating slippery conditions.
Mitigation:Greenbelts should be developed along the road sections to prevent sand from spreading on the road.Trees or plants, which are salt tolerant and sand binders, should be planted on the western side (seaside) of the road. Along the eastern side, bushes and trees that can tolerate salt-laden winds should berelied upon.
47

Table 4.3.4List of Projects and their Impact on Ecological System in Western Suburbs
Sr. Project Name Ecological Width In Wtg Length Do Public Public RoadNo Component/Importance meters (km) Min Transport Transport Investment
+Dem.Mgt1. Jogeshwari-vikhroli Link Nil 10 0 0 0 0 0 0
road _ _ _ _ _ _ _ _ _ _ _ _ _
2. Western Relief Road Marshy lands and degraded 18 1 1.5 0 0 0 1.5mangroves
3. Juhu-Tara road widening Nil 0 0 0 0 0 0 04. Santacruz to Chembur Nil 0 0 0 0 0 0 05. Western Freeway Marine Ecology 10 1 2 0 0 0 0.02
6. Borivali-Virar Mangroves and Marshy land 15 3 1 0 0.045 0.045 0____ Quadrupling *1 *2 0 0.03 0.03 07. Bandra-Kurla Link Mangroves creek area 15 1 2.1 0 0.0315 0.0315 0
Total Natural Ecosystem 0 0.0765 0.0765 0.047_ ____________________ Manmade Ecosystem 0.03 0.03 0
Represents man-made systemsNote: The score pf the affected ecological area = (weightage) x (affected area in sq.km)

4.3.5.2 Western Relief Road
Location:
This road is proposed to run along coastal areas of the western suburbs. The road is at different stagesof development and involves the construction of new stretches of the road due to widening of theexisting road .
Existing land use and Ecological status:
The proposed road passes through hutment of old residents and slums of recent origin. Old residentsof the area have planted and maintained utility trees such as Tamarind, Palm, Mango, Bhendi,Drumsticks and Bor. Cultivation of radish and other vegetables is also practiced in the area. Soil inthe area is saline as evidenced by several halophytic species such as Avicennia and Zizyphus. Thesespecies are, however, dying. Nitrophytes like castor, besharmi and ruderal plants are common nearhunnent. Overall, the area has degraded appearance.
Impacts:
The construction of new stretches of the road or widening of the existing road will not result in lossof any important species. The project will involve the displacement of people living in hutment andslums, which is covered under social impacts. However, growth of slums along the newlyconstructed stretches of road could proliferate undesirable plant species in the area.
Mitigation:
Management of slums by concerned authorities should include addressing to sanitation and solidwaste management problem of the slums. Green belts" should be cultivated for the stabilisation ofsand, suppression of vehicular pollution and prevention of salt sprays from the sea to improvethe environmental quality of the area.
4.3.5.3 Quadrupling Borivali - Virar Railway
Location:
The proposed railway link will be laid parallel to the existing Borivali -Virar rail link on its easternflank.
Existing land use and Ecological status:
The rail track will pass through three types of environmental settings - railway stations lined withtrees for shade and fruit; marshland with stagnant water and habitated by halophytes species such assalt tolerant grasses, bushes, scrub and mangroves; and raised ground, bunds and railway vergessupporting growth of grass, nitrophytes (which grow in organically rich waste habitat) andcalciphytes (which grow in rubble).
Mangrove habitats along the proposed track contain some important species. The protected mangroveAvacennia manna appears healthy with its height reaching 3 to 4 meters on the north bank of Ulhascreek. Other protected specie present in the same habitat is Excoecaria agallocha. There are othermarshy areas which show degradation evidenced by stunted growth (im or less height) of Avicenniaor its replacement by a spiny bush - Acanthus.

Impacts:
Loss of some lowland along with its plants and ruderals, and raised ground with nitrophytes will notcause any significant impact as these plant species are of no commercial value. Moreover, thesespecies are found in abundance in the area. However, some trees in mangrove habitats will be lost asa result of the laying down of track and installing stilts for bridge. Since vast areas of coastal landalong the creek are occupied by the same plant community, loss of a few trees will not make anysignificant impact on the ecosystem.
Mitigation:
Minimal destruction of the existing habitat and protection of the remaining plants would ensuresustenance of the ecosystem in productive form.
4.3.5.4 Bandra - Kuria Rail Link
Existing land use and Ecological status:
The proposed rail line will pass through ecologically sensitive areas. Mahim bird sanctuary is verydose to the rail alignment. The alignment also passes through mangrove swamps.
Natural vegetation of mangrove habitat is found to be replaced by castor plants along the stretches ofthe proposed rail link. The emergence of waste loving castor plants is due to human excreta and otherwaste originating from slums in the area. These plants represent degraded mangrove habitat, whichcould be however restored to its natural vegetation by better management of the solid waste andmaking provision for sanitation in the area. Mangrove vegetation near Mahim bird sanctuary area isof ecological significance.
Impacts:
Laying of railway track through mangroves will have adverse effect on mangrove vegetation. Therailway track is likely to attract slums along the rail route as has been the case for other rail routes inBrihan Mumbai. These dwellings without proper sanitation system will further contribute to thegrowth of castor plants, and hence, degradation of mangroves.
Mitigation:
Mitigation measures include rminimal removal of mangroves where necessary and protection ofmangroves at other places: preventing coming up of slums along the rail route, and protecting railtrack verge by greenery on slopes and trees at the base of the slopes. If an elevated rail track isprovided, the impact on ecology will be insignificant.
Table 4.3.4 presents the potential ecological impacts, of the projects identified under various optionsquantitatively.
4.3.6 Social Impacts (Limited to Displacement of People)
The Western Suburbs have mixed land use, residential being predominant. Slums have come intoexistence along railway lines, along highways and in marshy lands. Slums and squatters exist alongthe stretches of Jogeshwari Vikhroli and Juhu - Tara road alignments. There are slums on the easternapproach of the Jogeshwari ROB. Many vendors and hawkers use the pavements of the major roadsfor vending. At places, there is encroachment of slums on roads in this sub region.

Benefits
The construction of ROBs on Western Railway line will eliminate respective level crossings. TheseROBs will facilitate the flow of heavy traffic between the eastern and western suburbs. Also, trafficcongestion on cross roads will be reduced. Less number of interruptions in Western Railway serviceby eliminating level crossings is expected to increase the capacity of Western Railways.
A number of road and rail projects have been identified under the transport alternatives with theobjective of improving traffic flow between the western and eastern suburbs. These road links areexpected to increase the efficiency of transportation between the two sub regions.
The alleviation of traffic congestion will mainly benefit private vehicle owners as the latter are themain users of the western arteries leading to the city.
Adverse Effects
Approaches to Jogeshwari ROB on both sides of the rail line are occupied by people. Therefore, theconstruction of the ROB will involve relocation of some households. Some of the households to bedisplaced have been living in the area for the past 30 years, and are in the possession of permanenthouses. These residents are from middle class families. Others, who are 10 to 15 year old residents,also have invested in housing. They are involved in vending. There are also construction labour andrag picker groups living in the area for 5 years or less. These people live in temporaryaccommodations, Apart from the usual problems associated with the displacement of people, thesethree groups may not accept a uniform compensation package.
Various road and rail projects identified for implementation under the transportation alternatives willrequire displacement of people living along some stretches of the road and rail alignments. Table4.3.5 provides the number of households to be displaced for each project.
Mitigation
- Resettlement should be carried out concurrently with the project construction and completedwithin a specified time frame. This will avoid re-encroachment of the project sites. Also,rehabilitation of the displaced people within a specified time will provide some solace to the affectedpeople, who might otherwise remain unsettled for a long time.
* A regional plan should be developed for Vasai - Virar region to facilitate balanced growth of theregion with provision for adequate infrastructure facilities including water supply and transportation.
* In addition to providing transport linkages between Dahisar and Mira Road region, demandmanagement measures may have to be introduced to reduce congestion in the area.

Table 4.3.5Number of Households Displaced under different Options in Western Suburbs
Road/Rail Projects Do Min Public 1 Public Transport + RoadTransport | Demand Management Investment
Disp# Disp# J Disp# Disp#ROBs
ROB at Vile Parle Nil 1048 1048 NA
ROB at Jogeshwari Nil 835 835 NA
ROB at Kandivali Nil 246 246 NA
ROB at Borivali 781 781 NA
ROB at Dahisar Nil 9 9 NA
Rail Projects
Quadrupling Borivali-Virar Nil 798 798 NA
5tb line Santacruz-Borivali Nil Not Not Available NAAvailable
Bandra-Kurla Link] Nil 750 750
Road Projects
Jpgeshwari-Vikhroli link road 1164 1164 1164 1164
Juhu-Tara road widening Nil Nil Nil NilSantracruz-Chembur Link road Nil NA NA Not AvailableWestern relief road Nil NA NA 588
Total # of displaced H.H. 1164 5631 5631 1752andR & R cost - 5631 5631_____
NA: Not Applicable
4.3.7 Impacts on Transportation
Traffic Efficiency Index (TEI), Road Traffic Congestion Index (TCI) and Railway CrowdingIndex (RCI) are computed for the sub region in accordance with the definitions provided in Section3. The values of these - indices are provided in Table 4.3.6.
Table 4.3.7 summarises values of alt environmental and transport service level indicator/indicesreesenting impacts for year 2011. The favourable values of the indicators/indices are shaded for altthe options in the table in an attempt to identify the desirable or preferred option.

Table 4.3.6Transport Service Level Indicators for Various Options
in Western Suburbs
Service Level Year 1996Indicators Base Year Year 2011
Do Min Public Public RoadTransport Transport + Investment
Dem. MgtTraffic Efficiency 0.39 0.43 0.43 0.46 0.44Index (TEI)
Traffic Congestion 8.4 12.3 12.3 13.9 9.2Index (TCI)
Railway Crowding 2.278 2.278 1.368 1.368 2.278Index (RCI) I I I I
Table 4.3.7Summary of Environmental Impacts for the Year 1996 and 2011 in Western Suburbs
SR ENVIRONEMNTAL IMPACT BASE DO PUBLIC PUBLIC ROADNO. INCICATORIINDEX YR. MIN TRANSPORT TRANSPORT INVESTMENT
(1996) 1 +DEM.MGT.1 CO Quality Index 0.514 0.0956 0.959 0.954 0.890
2 S02 Quality Index 0.979 0.967 0.069 0.966 0.938
3 NOx Quality Index 0.703 0.851 0.859 0.846 0.770
4 Pb Quality Index 0.614 1.0 1.0 1.0 1.0
5 PM-10 Quality Index 0.066 0.008 0.016 0.012 0.002
6 Traffic Noise Indec (Day)-TNI 51.75 69.54 69.54 71.13 70.44(day)
7 Traffic Noise Indec (Day)-TNI 86.42 94.20 98.84 93.2 93.76(Night)
8 Ecological Impact Indicator 0 0 0.0765 0.0765 0.047(Natural System) - El 1
9 Ecological Impact Indicator 0 0 0.03 0.03 0(Man-made System) - EI 2
10 R & R Impacts (Number of 0 1164 5631 5631 1752house holds displaced)
SERVICE LEVEL INDICATORS/INDICES _
11 Traffic Efficiency Index 0.482 0.566 0.575 0.542 0.559
12 Traffic Efficiency Index 16.9 12.33 12.33 13.86 9.2
13 Railway Crowding Index 2.278 2.278 1.368 1.368 2.278

Note: (i) For Indicators/Indices at - Sr.No. 1 to 5, and 11 higher values indicate betteroption, Whereas for Sr.No.6 to 10,12 and 13 lower values indicate better option.
(iii) The most favorable index values are shown shaded in the above table.
It is ckarfrom the above that Public Transport is the bestfor Western Suburbs.
4.4 EASTERN SUBURBS
4.4.1 Introduction
The eastern suburbs of Brihan Mumbai has both residential and industrial land uses. The residentialareas are densely populated. The sub region extends from Sion in South to Mulund in North. Thearea covered by the sub region is 158.66 sq.kms.
At present, this sub region is served by two highway corridors i.e. the LBS Marg and Eastern ExpressHighway. Various road and rail projects are envisaged for this sub region under the transportalternatives. The minimum intervention or 'Do Minimum' option identifies Jogeshwari - Vikhroli linkroad for implementation. Apart from various programmatic level projects, the major projectsproposed under the rail investment option are Bandra - Kuria rail link and the construction of the 6 thrail corridor between Kurla and Bhandup. The major road projects identified under the roadinvestment option are Anik Panjarpole link, Santacruz - Chembur link and the extension of EasternExpressway.
4.4.2 Traffic Analysis
The traffic composition and speed estimates under the six transport alternatives have been obtainedby using the Regional Transport Model. The model results are shown in Table 4.4.1. These resultsindicate improvement in traffic speed for the road Option. It is also apparent from the table thatvehicle kms for private transportation modes are less for the rail investment option as opposed to theroad investment option for the year 2011.
The traffic composition and speeds determined by the Regional Transport Model have been used asinputs to the air quality and noise models for predicting vehicular pollutant concentrations and trafficnoise levels under the transport alternatives.
Some of the proposed road and rail projects will pass through sensitive ecological areas and/orinvolve the displacement of people . For these projects, ecological and/or social impacts areconsidered.

Table 4.4.1:Traffic Composition and Speeds Under Various Options in Eastern Suburbs
Parameter Vehicle Type Year year 20111996Base Do Min Public Public ReadCase Transport Transport + Investment
Dem. Mgt.Road Length (kms) 102.0 108.0 108.0 108 116.0
Peak hour Buses 6566 11572 11516 12437 12269
Veh. kms Trucks 31720 55652 55176 59590 52965
Cars 57820 110301 92930 103152 95537
2 Wheelers 33844 73755 62140 68354 91788
3 Wheelers 30745 54693 46079 50686 61192
Speed Buses 18.0 15.7 16.2 16.0 17.7
(kmph) Trucks 24.1 19.8 20.5 19.7 22.7
Private Vehicles 22.5 17.5 19.0 19.0 20.7
4.4.3 Air Quality Impacts
Baseline Air Quality:
The baseline air quality was determined by using air quality data monitored at 6 locations in EasternSuburbs in 1996. These locations are Larsen and Turbo (Powai), Gandhi Nagar, Vikhroli station,Panjarpole (Chembur), Vashi Naka (near RCF) and MCBM ward (Mulund). Carbon monoxide,hydrocarbons, total suspended particulate matter, PM10 and lead concentrations were monitored atthese locations. At Gandhi Nagar, Vikhroli and Mulund, sulfur dioxide and nitrogen oxide levelswere also monitored. The monitoring was carried out for three or more consecutive days. Themonitoring sites covered road intersections, straight road sections and bus depots representing heavyand moderate traffic conditions.
The air quality monitoring results are summarized in Table 4.4.2. The results indicate that lead levelsin this sub region are higher as compared to other sub regions. In fact, the 24 hour average ambientlead standard set up by the CPCB is violated at Vashi Naka and except at Vikhroli station, the COvalues in all the rest of the locations have crossed the standards. Suspended particulate matterand PMio concentrations exceed the ambient air quality standards at all the monitoring locations.Other pollutant concentrations are in compliance with the standards.
The pollutant concentrations measured at various locations in the sub region were used to estimateconcentrations at the square grids overlaying the sub region. Overall quality index-for eachpollutant is determined using the estimated concentrations for the grids and the respective valuefunction curves.

Table 4.4.2Ambient Air Pollutant Concentrations in Eastern Suburbs
Location Sulfur Nitrogen Carbon Hydro- TSPM PM10 LeadDioxide Oxides Monoxide Carbons ug/m3 ug/m3 ug/m3
ugtm3 ugtm3 (pm) (ppm)8 hr 1 Hr
_________ vg Avg _ _ _ _
Larsen & Turbo N.A N.A 3.3 4.3 1.23 916.4 222.13 0.71
Gandhi Nagar 28.0 19.0 4.1 5.0 2.33 1099.0 249.0 0.31
Vikhroli Station 32.5 47.1 1.0 2.7 1.5 838.0 160.0 0.27
Panjarpole N.A N.A 2.0 5.4 1.17 1305.0 449.0 0.85Chembur
VAshi Naka N.A N.a 5.2 7.5 1.19 1663.0 591.0 1.18(near RCF)
BMC ward 35.2 44.7 0 0 1.6 332.0 63.4 0.14Mulund I_= I_I_I
Air Dispersion Modelling Analysis:
The Roll Back model developed for the sub region was used to estimate pollutant concentrationsunder different transport options. The model estimated pollutant concentrations were used todetermine quality index tor each grid under various options for the year 2011. These quality indicesdetermined for the various grids of the subregion were combined to provide overall quality index toreach pollutant. The values of the indices for the concerned air pollutants favour the Public Transportoption as shown in Figure 4.4.1.
id WMrV4bJep . b " h) 800=
EDoWftmh*
DPW&I Tran_
0PtMTmnupW + Dun.W
IX2 O~~~~~~~~Rad hwmwtm
CO NdOx P 0 U1
4.4.4 Impact on Noise Levels
There .are 27 major road links in Eastem Suburbs. New road links and widening of the existingroads proposed under the transportation options will redistribute traffic in the sub region and hencegive rise to variations in traffic generated noise under the options.

The US Federal Highway Administration (FHWA) model was used to predict noise levels fordifferent options or alternatives for years 1996 and 2011.
The noise values predicted for the transportation links were used to calculate Traffic Noise IndicesTNI (day) and TNI (night).
The values for TNI (day) and TNI (night) are presented in Table 4.4.3 and Figure 4.4.2. TNI nighttime values are found to be the highest for the "Public Transport + Demand Management"Option. 4A. : ft Nsh bdkm f YeM gN
hVsups.. ., ... b bm *Dobs
Insert Fig 4.4.2 g P OFi.poIt
G Pubic Tnmipar.o. .~ .39g W .
Table 4.4.3Traffic Noise Indices for Various Options In Eastern Suburbs
Traffic Noise Year 1996Index Base Year Year 2011
Do Min Public Public RoadTransport Transport + Investment
Dem. Mgt.TNI (day) 79 74.8 90 90.8 88.6
TNI (Night) 94.4 100 63.2 68.8 100
4.4.5 Impacts on Ecological Status
The ecological impacts due to the transport alternatives are assessed on the basis of the impacts thateach individual project would have on ecologically sensitive land use in the sub region. Theseimpacts are discussed qualitatively in the following sub sections. Attempt is also made to quantifythese impacts using the methodology described in Section 3. Table 4.4.4 lists the relevant projectsidentified for implementation under different transport alternatives in the eastern suburbs and alsoprovides values of ecological indicators.
4.4.5.1 Jogeshwari - Vikhroli link road
Location:
This road is of significance as it provides important link between the western and eastern suburbs.The road connects Western Express Highway and Lal" Bahadur Shastri Marg. At present,construction work for widening the road into 4 lane highway is in progress.

Existing land use and Ecological status:
The road passes through various types of land uses, which include industries, hutment, often ofvintage nature, (old villages) and residential complexes. There is some commercial activity also alongthe sections of this road. A stretch of this road, from Powai Naka (L&T) to IIT, is along Powai Lake.The road end joining LB Marg is close to quarries. The area which is critical from ecologicalconsiderations is Powai Lake.
Powai Lake provides serene aesthetic setting to the surrounding area. However, the lake is shrinkingfast due to eutrophication caused by siltation due to construction activities and rapid development ofthe area. Significant measures, ranging from cleaning of weeds and control of pollutants reaching thelake, are required to restore the lake to its normalcy.
Impacts:
Construction for widening the road along the lake could result in further siltation of the lake due torunoff water reaching the lake during construction. This impact could be particularly significant, ifconstruction phase is prolonged. However, this effect will be considerably reduced during theoperation phase of the project.
There are already some motor garages operating along this road. The number of such garages islikely to increase as a result of demand due to increased truck traffic. Wash waters from these garagescontaining oil could also reach the lake if proper care is not taken. Dust generated by heavy vehicletraffic may adversely impact vegetation, which has now remained confined to IIT campus and fewroad side trees, due to its deposition on the leaves. Better communication provided by the road mayinduce further growth around the lake area, and result in more deterioration of the lake.
Mitigation:
Trees should be planted along the road to enhance aesthetics, reduce sediment load on Powai Lake byfiltering surface runoff and suppress vehicular pollution.
4.4.5.2 Anik - Panjarpole Road
Location:
The proposed new road connects Sewri, Anik and l'anjarpole white passing through the MPT estate.
Existing land use and Ecological status:
The road passes through hutment, mudflats, shallow and stagnant saline water bodies, active andabandoned salt pans, grassland and private lands. The latter are at different stages of development.Of these, ecologically critical land uses are mudflats and mangrove vegetation. The section of theroad from Anik to Panjarpole passes through intensively urbanized area of high population and trafficdensity. No semblance of natural environment exists along this stretch of the road.

Table 4.4.4List of Projects and their Impact on Ecological System In Western Suburbs
Sr. Project Name Ecological Width In Wtg Length Do Public Public Road
No Component/lmportance meters (km) Min Transport Transport Investment___________ _+Den. Mgt
1. Jogeshwari-Vikhroli Powar lake 10 I 0.5 km 0.005 0.005 0.005 0.005
Link road2. Anik to Panjarpolie Salt pans, Mangroves, 20 1 0.1 0 0 0 0.002
commercial plantations * 1 0.5 0 0 0 0.013 0.05* 0 0 0 0.003*
3. Santacruz to Chembur Nil 0 0 0 0 0 0 0
4. Bandra-Kurla Link Nil 0 0 0 0 0 0 0
5. Quadrupling Mankhurd- Mangrove swamps 15 1 2 km 0 0.03 0.03 0
KurlaTotal Natural Ecological system 0.005 0.035 0.35 0.017
Manmade Ecological system 0 0 0 0.003
* Manmade Ecological systemsNote: Score are worked out based on (Area Affected in sq.km) x (weightage)

Mangrove species found in the wetlands include Avicennia marina, Salvadora, Persica, Excoecariaagallocha, Suaeda floribund and Sensvium Partulacastrum. Mudflats are bound by two bunds.The broad bund is occupied by grasses. About three to four species of birds were frequently seen inthis area.
Impacts:
The construction of this major road link in the area would result in irreversible loss of mangroves andbird habitat. High noise levels resulting from the increased traffic will further frighten birds awayfrom their habitat. There is enough scope for compensating the loss of mangroves and bird habitat.Hence, ecological impacts of this road can be minimized.
Mitigation:
Adverse effects due to loss of mangroves may be alleviated to a large extent by intensive cultivationof mangroves along both sides of the road up to about 50 meters from the road edges.
4.4.6 Social Impacts (Limited to Displacenent of People)
The eastern suburbs, like its western counterpart, has mixed land use. Slums form a sizeable housingcomponent in the c.-stern suburbs. Slums are especially seen along railway lines; near the approachesto railway stations such as Kurla, Ghatkopar, Vikhroli; on low lands along highway; and on hillslopes. Many vendors and hawkers use the pavements of the major roads for vending. At places,there is encroachment of slums on roads in this sub region.
Benefits
The construction of ROBs on Eastern Railway line will eliminate level crossings and help in bettertraffic circulation. Also, the capacity of Eastern Railway service would increase because of lessinterruptions due to the elimination of level crossings.
A number of road and rail projects have been identified under the transport alternatives with theobjective of improving traffic flow between the western and eastern suburbs. These projects are:Jogeshwari - Vikhroli link road, Santacruz - Chembur link road and Bandra - Kurta rail link. Theseroads and rail links are expected to increase the efficiency of transportation system between thetwo sub regions. Jogeshwari - Vikhroli link road will help in smooth transportation of industrialgoods between the two sub regions. Similarly, new rail links will also smoothen traffic flow andbenefit commuters.
Adverse Effects
Approaches, to Chunabhatti and Vikhroli 'ROBs are occupied by slums. Therefore, the constructionof the ROBs will involve relocation of some households.
Jogeshwari - Vikhroli link road passes through open space (near Vikhroli), which is probably ownedby industr . Due to better road link, the open space may be developed for industrial or residentialuse. This -luced development would lead to traffic load on the sad. Better transport link providedby Mankhurd - Kuria quadrupling may promote residential growth in Mankhurd marshes and Thanecreek area. This development is not desirable, and is in conflict with the regional plan.
Various road and rail projects identified for implementation in this sub region under thetransportation alternatives will require displacement of people living at some stretches of the road andrail alignments. Some commercial establishments will also have to be displaced. Table 4.4.5provides the number of households to be displaced for each project.

Mitigation
* Resettlement should be carried out concurrently with the project construction and completedwithin a specified time frame. This will avoid re-encroachment of the project sites. Also,rehabilitation of the displaced people within a specified time wilt provide some solace to thesepeople.Services of NGOs should be sought for smooth resettlement operations.
* Provisions should be made for the permanent settlement of the displaced commercialestablishments.
Table 4.4.5Number of Households Displaced under Different Options
in Eastern Suburbs
Road/Rail Projects Do Min Public Public Transport + Road InvestmentTransport Demand
ManagementDisp Disp Disp# Disp#
ROBs on Eastern Railway
ROB at Kurla Not Applicable N.A Not Applicable
ROB at Vishroli Not Applicable 184 Not Applicable
ROB at Chunnabhati Not Applicable 76 Not Applicable
Rail Projects
Bandra-Kurla Link Not Applicable 750 Not Applicable
6d1 corridor Kurla-Bhandup Not Applicable N.A Not Applicable
Quadrupling Makhurd- Not Applicable N.A Not ApplicableKurla
Road Projects
Jpgeshwari-Vikhroli link Nil Nil Nil Nilroad
Anik-Panjarpole & Sion- Not Applicable Nil Nil 7456Chembur link road
Santracruz-Chembur Link Not Applicable N.A N.A N.AroadEastern Freeway Extension Not Applicable
Total # of displaced H.H. 0 1010 1010 7456and R & R cost
N.A.: Not Available

4.4.7 Impacts on Transportation
Table 4A.6 show Traffic Efficiency Index (TEI), Traffic Congestion Index (TCI) and RailwayCrowding Index (RCI) computed for the year 2011 in accordance with their definitions given inSection 3.
All indicator/index values for the eastern sub region are summarized in Table 4.4.7. The favorablevalues of the indicators/indices are shaded for all the options in the Table in an attempt to identify thedesired option.
Table 4.4.6Transport Service Level Indicators for Various Options in Eastern Suburbs
Service Level Year 1996Indicators Base Year Year 2011
Do Min Public Public RoadTransport Transport + Investment
Dem. MgtTraffic Efficiency 0.49 0.52 0.51 0.51 0.49Index (TEI)
Traffic Congestion 10.2 20.66 16.88 22.53 13.3Index (TCI)
Railway Crowding 1.736 1.736 1.568 1.568 1.736Index (RCI)
4.5 REST OF MMR
4.5.1 Introduction
Rest of MMR comprises the area outside the Brihan Mumbai. Besides possessing natural featureslike forests and wetlands, the land uses in this sub region cover residential, industrial and agriculturalactivities. This sub region has 38 urban centres dispersed over an area of 3991 sq.km. The regionalso has three municipal corporations. The significant urban areas in the sub region are NaviMumbai, Thane, Kalyan and Bhiwandi. There are other urban centres such as Dombivali,Ulhasnagar and Panvet, which serve as dormitory towns for Brihan Mumbai. As per 1991 census,population in this sub region was 4.6 millions with the population density as low as 3000 per sq." km.
A large number of road and rail projects are envisaged for this sub region under the transportalternatives. The minimum intervention alternative or "Do Minimum" case focuses on theimprovement of existing roads and implementation of three rail projects i.e. Belapur Panvel line,Vashi - Turbhe Kalwa passenger service and Belapur-Uran line. Under the rail investment option,Diva Jet - Vasai rail link and quadrupling of Mankhurd - Kurta link are identified forimplementation. The major road projects identified for implementation under the road investmentalternative are Bhiwandi - Kalyan & Kalyan - Shil road. Thane - Ghodbunder Road, Panvel Bypass,Mahape - Shil road, Kalwa - Dighe Road and Nalasopara-Bhiwandi road. Some of these proposedroad and rail alignments pass through ecologically sensitive areas.

Table 4A.7Summary of Environmental Impacts for the Year 1996 and 2011 in Eastern Suburbs
SR ENVIRONEMNTAL IMPACT BASE DO PUBLIC PUBLIC ROADNO. INCICATOR/INDEX YR. MIN TRANSPORT TRANSPORT INVESTMENT
(1996) +DEM.MGT.1 CO Quality Index 0.590 0.953 0.956 0.946 0.710
2 S02 Quality Index 0.980 0.973 0.972 0.971 0.884
3 NOx Quality Index 0.703 0.852 0.856 0.844 0.645
4 Pb Quality Index 0.732 1.0 1.0 1.0 1.0
5 PM-10 Quality Index 0.078 0.057 0.049 0.053 0.010
6 Traffic Noise Index (Day)-TNI 79.02 90.02 90.02 90.81 88.65(day)
7 Traffic Noise Index (Day)-TNI 94.41 100 100 100 100(Night)
8 Ecological Impact Indicator 0 0.005 0.035 0.035 0.017(Natural System) - El I
9 Ecological Impact Indicator 0 0 0 0 0.003(Man-made System) - El 2
10 R & R Impacts (Number of 0 0 1010 1010 7456house holds displaced)
SERVICE LEVEL INDICATORS/INDICES ____X
11 Traffic Efficiency Index 0.32 | 0.48 0.49 0.49 0.52
12 Traffic Efficiency Index 25.7 20.66 16.88 16.88 13.3
13 Railway Crowding Index 1.736 1.736 1.568 1.568 1.736
Note: (i) For Indicators/Indices at - Sr.No. 1 to 5, and 11 higher values indicate betteroption, Whereas for Sr.No.6 to 10,12 and 13 lower values indicate better option.
(iv) The most favorable index values are shown shaded in the above table.
Do minimum is the best option in Easter Suburbs closely followed by Public Transportoption.
4.5.2 Traffic AnalysisThe Regional Transport Model developed for MMRDA by WS Atkins was used for estimating trafficcomposition and speeds under different transport alternatives . The modelling results are depicted inTable 4.5.1. These results indicate considerable increase in vehicle kms for all the alternatives for theyear 2011.

The traffic composition and speeds obtained from the Regional Transport Model have been used asinputs to the air quality and noise models for predicting vehicular pollutant concentrations and trafficnoise levels under the proposed transport alternatives
Table 4.5.1Traffic Composition and Speeds Under Various Options in Rest of MMR
Parameter Vehicle Type Year year 20111996 _ _ _ _ _ _ _ _ _ _ _
Base Do Min Public Public ReadCase Transport Transport + Investment
Dem. Mgt.Road Length (kuns) 591.o 528 530 530 602
Peak hour Buses 7515 10651 10707 10707 14684
Veh.Hum Trucks 50782 105642 106118 106118 105805
Cars 52803 123102 119007 116627 136192
2 Wheelers 133396 326219 300528 294517 343722
3 Wheelers 88375 160032 147429 147429 168619
Speed Buses 20.8 16.98 17.38 17.38 20.02
(kmph) Trucks 22.8 17.94 18.48 18.48 20.84
Private Vehicles 20.0 14.76 15.58 15.58 18.88
4.5.3 Air Quality Impacts
Baseline Air Quality:
The baseline air quality was determined by using air quality data monitored at 5 locations in the Restof MMR. These locations are Thane Manpada, Owala, Cherina River Bridge, CBD Belapur andVirar. Carbon monoxide, * hydrocarbons, total suspended particulate matter, PM1O and leadconcentrations were monitored at these locations except for Virar. At Virar, sulfur dioxide, nitrogenoxides, and particulate matter levels were monitored. The monitoring was carried out for three ormore consecutive days. Virar was the only site with light traffic. '
The air quality monitoring results are summarised in Table 4.5.2. The results indicate the violation ofsuspended particulate matter and PMio standards at Thane Manpada, Owala and Chenna RiverBridge. CO levels at all the monitoring stations are well within the standard except at ThaneManpada.

Table 4.5.2Ambient Air Pollutant Concentrations in Rest of MMR
Location Sulfur Nitrogen Carbon Hydro- TSPM PM10 LeadDioxide Oxides Monoxide Carbons ug/m3 ug/m3 ug/m3
ug/m3 ug/m3 (P m) (ppm)8 hr lHrAvg Avg
Thane Manpuda 18.3 26.8 3.0 4.8 0.93 1065.0 232.0 0.55
Owala 14 16.3 0.8 3.3 0.75 826.0 171.0 0.59
Chenna River 17 23 1.6 2.5 0.82 970.0 146.0 0.29Bridege
CBD Belapur N.A N.A 0 0 1.27 264.0 83.0 0.07
Virar 19.1 20.5 N.A N.A N.A 150.0 N A N.A
N.A. Not Available
The pollutant concentrations measured at various locations in the sub region were used to estimateconcentrations in square grid by using the weighted inverse square interpolation technique. Qualityindices corresponding to the concentration estimates were found using value function curves. Overallquality index for each pollutant was then computed for the sub region.
Air Dispersion Modelling Analysis:
The Roll Back model was used to predict ambient pollutant concentrations for the transportationalternatives using emissions estimated for the year 2011. The estimated concentrations were used. tocalculate quality indices for each pollutant and for each grid. These values along with the exposedpopulation of the grids were used to compute overall quality index for each pollutant which is shownin Figure 4.5.1.
~.451 rohESAk __ m_ wInsert I __ _wtin _ i
. T.OPiicTport0.4
.. ¢: ; . . S .m = N~PxbIc Tmpout + D4Lh
0 *~~~~~~~~~~~~aRoa.dhwasost0 CO 1 Pb M02 PM-O
4.5.4 Impact on Noise Levels
New road links and widening of the existing roads proposed under the, transportation alternatives inthe rest of MNR will result in redistribution of traffic in the sub region, and therefore, variation in

traffic noise. The traffic parameters required to be input to the noise prediction model were estimatedby using the Regional Transport Model,
The US Federal Highway Administration (FHWA) model was used to predict noise levels for eachroad link in the Rest of MMR. The model estimates noise values are used to estimate TNI - (day)and TNI - (night) indices. These values are presented in Table 4.5.3 and Figure 4.5.2.
PI& 4iA2 Tus NuW bWwfr9 Yew - d NOWmi
Insert Fig4 -Laww YdM Wkd P was
Traffic Noise Year 1396r
T M (day)30.449 495.Ro1 44 __ W ~ ~ ~ ~ ~ ~ ~ _
Table 4.55E3Trafflp Noise Indices for Various Options In Rest of MMR
Trafoic Noise Year 1996Index Base Year i YeSar 2011
Do Min Public Public RoadTransport Transport + Investment
_ ~~~~Denm Mgt.TNI (day) 30.4 49 49 50.1 44
TNI (Night) 60.3 83.4 83 27.7 80.2
4.5.5 Ecological Impacts
Many road and rail projects identified for implementation under the six transport alternatives passthrough ecologically sensitive areas in this sub region. These impacts are described qualitatively inthe following paragraphs. However, an attempt is also made to quantify these impacts in accordancewith the procedure given in Section - 3.
4.5.5.1 Shil - Kalyan Road and Kalyan - Bhivandi Road
Location:
These two roads are actually two parts of the same road. These roads are already in service.
Existing land use and Ecological status:
Land use along the existing roads represents total degradation and negligence of the local ecosystem.Considering that these roads pass through country side, lack of trees along the roads is conspicuous.Pangara, Babbul, Morinda and Zizyphus scrub are the only trees seen in the area adjacent to theroads. Three of these species are without any significant shade. Ruderals like Xauthium, Hyptis,

Besharmis and Castor are common in the area. A better variety of cultivated trees - Mango, Neem,Bor, Banyan. Bhendi and Subabul are seen in Shil.
Impacts:
Development of this road system cannot further degrade the area which is already at its worst. In fact,remedial measures for improving the ecosystem tied to the construction of the roads may improve thesurrounding environment.
Mitigation:
Mitigation measures should focus on intensive cultivation of green belts along roads and theirmaintenance tied up with the road construction contracts.
45.5.2 Thane - Ghodbunder Road
Location:
This is an existing old road which is being developed to enhance its traffic carrying capacity. Thisroad is located at north of MMR connecting Thane and Ghodbunder.
Existing land use and Ecological Status:
The road passes along the coastal areas of Ulhas creek and through mixed deciduous forest.
The coastal and forest ecosystems are fairly well preserved in the areas which are marshy and hilly.Mangrove vegetation in the area is reported to be rich with as many as 9 'protected' species. Thoughnot protected, Pandannus tectorins (which is not commonly found along sea coasts) is also foundalong the road side. Various activities seen along the road include dredging and paddy cultivation.There is also some tourist activity in the area.
Mixed deciduous forest of the region is known for its rich diversity of flowering plants with morethan 300 species reported. Several evergreen species common to deep Western Ghats are alsoreported to be found in this area. Holarrhena antidysenterica, Pogostemon, Argyreia, Tinospora,Gymnema Hemidesmus, Dioscorea are some of the numerous medically important species present inthe forest.
Impacts:
Both wetland and forest ecosystem in the area are prone to degradation due to human activities. Roadwidening is bound to result in the loss of some such trees as Pandanns, Argyreia and Holarrhena.The reclamation of marshy area for road widening will also result in the loss of mangrove vegetation.However, direct loss of vegetation in the forest and marshy areas will be a small portion of the totalvegetation in the area. Hence, the resulting impact will only be marginally significant. Also roadwidening will not result in the loss of threatened or protected species.
It is possible that cutting of trees, leveling of parts of hills and reclamation of coastal marsh land forroad-widening would attract more people to stay along the road as is already happening at Thane endof the road. This induced development could significantly deteriorate both wet land and forestecosystems in the area. Pollution due to increased vehicular traffic may also affect the localvegetation.

Mitigation:
Apart from trees which need to be cut, other vegetation should be protected during the road wideningoperation. The cut edges of hills should be stabilized and protected. Local forest species should beencouraged to grow or even planted along the road side open spaces. Development of industries andhousing should be prevented in areas where it does not exist at present.
4.5.53 Panvel Byepass Road
Location:
This road starts at Kalamboli and passes behind Panvel town to meet Goa road. The road is alreadyin service for the past couple of years and road widening is taking place at present.
Exsting land use and Ecological status:
The road passes through agricultural lands, villages, shallow marsh lands and hills. The hills areheavily degraded and devoid of any forest. Marsh lands are also not in a healthy state.
Impacts:
Cutting of the hills for the road construction is the major irreversible change. Laying of road in marshlands will be of significant consequence from the view point of ecological implications. Thecommissioning of the Bypass three years back has not contributed towards the growth in the area,and in future also, the growth seems to be unlikely.
Mitigation:
Mitigation measures include cultivation of slopes of the elevated road with bushes and small trees:and regeneration of marsh lands that appear dried up at present.
4:5.5.4 Panvel to Shil Road
Location:
This is an old road with heavy vehicular traffic. The project aims at improving the old road bywidening and resurfacfng it.
Existing land use and Ecological status:
The road passes through several agricultural villages in Katamboli area and a large number ofindustrial establishments at new Panvel and Taloja. It also passes through agricultural lands andunproductive marsh lands. There are some stagnant water bodies along the road that support weeds.The pools and puddles along the road side are hardly productive. Some cranes are noticed visitingthe wetland. Agricultural fields are either fallow or have paddy cultivation. Some brick kilns are alsoseen along the road.
Impacts:
Road widening of the existing road will not have any significant ecological impacts. However, themodification of the road may lead to further increase in vehicular traffic and its subsequent effects.

Mitigation:
Development of greenbelts is suggested to improve the road aesthetics and screen villages along roadside from pollution. There is ample space available along the road side for this purpose.
4.5.5.5 Nalasopara - Bhiwandi Road and Virar - Vasai to NHs Connector
Location:
These two road systems are considered together as Virar is connected to Vasai via Nalasopara.Bhivandi is connected to Nalasopara via Kaman. Thus, the proposed road runs from Virar to Vasaivia Nalasopara along the western flank of Western Railway and then from Vasai to NH8 via Navghar- Manikpur - Sativali. The existing road between Virar and Vasai is a narrow road feeding only to thegreen and residential areas. Roads leading to railway stations carry heavy traffic during peak hours.
Existing land use and Ecological status:
The proposed system of roads passes through greenery of banana, coconut, arecanut plantation: tinyhouses and their ornamental gardens. The road passes along Nirmal lake - a rich wetland, salt pans,hills, quarries and brick kilns. Between Chinchoti to Bhivandi, there are numerous large scale brickkilns. At Kalwa, large hill sides have been cut off by quarries.
Mixed deciduous forests, cultivated areas (orchards) and the lake represent rich environmentalresources along the road; whereas salt pans, brick kilns and quarried hills are the sights of degradedto highly degraded areas. The area from Virar to Vasai via Nalasopara is declared as green zone, andas of present is green enough to justify the name. In this area, such plantations as Banana, Coconut,Arecanut gardens, Mango trees and Banyan trees can be seen along the road sides. Residential houseswith surrounding ornamental gardens also contribute to this greenness.
Impacts:
Loss of green zone land to the road is an unavoidable and irreversible impact. Widening of the roadfrom Boling (near Virar) to Bangli (near Vasai) would adversely effect the green zone due tovehicular pollution and high noise levels. The impact of vehicular noise will be particularly felt onNirmal lake wetland as the proposed road runs along one side of the lake.
Loss of bushes and trees from the moist deciduous forest near Sativali will be irrevocable. However,this impact will be marginal as it will not result in the" loss of the species diversity. Species such asteak, arjun and kuda are present in abundance in the forest through which the road passes. Loss ofAustralian Acacia and Eucalyptus planted along road side is easily reversible.
The passage of road along vegetable gardens and paddy fields (which are 0 to 3 year old fallow) andsalt pans (active as well as abandoned) is not likely to cause any significant effect on biota. The roadstretch from Vasai to Bhivandi is not expected to affect the local ecosystem in a harmful way.
Mitigation:
If possible, another alignment of the road for the stretch passing through the green zone may beexplored. Mitigation measures for the road sections from Manikpur to Sativali and from Chinchoti toBhivandi should be aimed at the restoration of road side tree plantation. Agricultural productiveareas along the road may be screened off from vehicular pollution with bush and tree plantations.

4.5.5.6 Belapur - Panvel Railway
Location:
The railway line is already functional up to Khandeshwar, and construction work is in progress forextending it to Panvel. This line runs perpendicular to Panvel Bypass road. Since, Panvel Bypass hasbeen constructed to carry high speed traffic. ROB will have to be'constructed for crossing the railway.
Existing land use and Ecological status:
The railway line passes through agricultural and green areas. Paddy fields are seen at places. Somestretches also pass through marshy areas, which are almost dried up due to new constructions. Theselands are hardly productive. A few salt tolerant species and ruderal are found in the area.
Impacts:
The development of railway line is not likely to cause any adverse effects on the environment as itpasses through already dried up and low productivity marshy area. On the contrary, the railway linewill provide essential communication link for the people of Panvel.
Mitigation:
Aesthetics along the rail route should be improved by planting trees. Slopes along track-sides shouldbe stabilised and planted with grass to reduce erosion. Bushy plants and trees along Jower parts ofthe slope would help improve aesthetics. These greenbelts created along the road are also expectedto suppress vehicular pollution for the benefit of near by residents.
4.5.5.7 Diva Junction - Vasai Road Railway
Location:
The project involves doubling the existing Diva - Vasai single railway line.
Existing land use and Ecological status:
The existing line passes through coastal wetlands occupied by mangroves, agricultural area.degraded forest land, good forest area followed again by agricultural land and coastal areas with sa:.pans.
Coastal wetlands near Diva are spanned by many branches of Ulhas river tributaries, and the zone isoccupied by mangrove vegetation. The plant community is made up ofAvicennia marina,Sonneration apetala, Rhizophora mucronata, Excoecaria agallocha, Den-is scandens, Ceriops tagal,Salvadora persica, Suaeda fruiticosa and Sesuvium portulacastrum. The mangrove vegetation isdense with top canopy closed at many places and reaching a height of 5 to 6 meters. Acanthusilicifolius and Cyperus sp. formn second storey up to a height of 1 to 2 meters. These representdegraded part of the mangrove ecosystem. Animal life, especially molluscans on stilt roots andbetween props (stem branches) are also present in the ecosystem.
Agricultural areas are highly degraded lands. These lands are used for rainfed paddy cultivationresulting in poor yields. There is no rabi cultivation. Many fields are used for brick making duringdry season. A few trees of mango and tamarind are seen in these fields.
Degraded forests represent low statured forest of chopped trees (teak, Mallotus, Terminalia etc.) andbushes (Holarrhena, Wrightea, Calycopteris, Pogostemon, etc.) on hill slopes. Land is generallyeroded and open.

The road passes through one of the well preserved patches of forest in its middle stretch. It is atropical mixed moist deciduous forest. Dominant species are teak, Terminalia and Mallotus. Teakor Tectona grandis, Terminalia tomentosa, Mango or Mangifera indica, Shendri or Mallotusphilippensis, Janum or Sygyium Cumini are the main species forming the top, storey of the forestreaching a height of 20 meters. Sterculia urens, Salmalia malabarica, Butea monosperma, Brideliaretusa are companion species. The second storey of the forest is replete with bushes and small trees ofHolarrhena antidysenterica or Kuda, Wrighter finctoria or Bhura Kuda, Trewia polycarpa or Petari,Macaranga peltata or Chandada and Carrissa conjesta or Karvand. Among climbers, Tinosporacordifolia or Gulvel, Hemidesmns indicus or Anantamool, Dioscorea pentaphylla, Smilax zeylanica,Mucuna pruriens or Khajkuyali are worth mentioning. Herbaceous vegetation generally existsduring monsoon. Shrubs like Holarrhena, Woodfordia, Wrightea and climbers like Tinospora,Hemidesmus, Gloriosa and Dioscorea are of medicinal importance. The last two are particularlyfound in abundance during rains.
Slopes on either side of the elevated track are covered by ruderal vegetation grasses and monsoonannuals such as Hyptis suaveolens. Malachra capitata.
Mtemanthera sessrtis. Xanthium stnimarium. Celosia amentea and others. Invasion of these slopes byforest species from the neighbourhood is visible in forest areas.
Impacts:
Construction of an additional railway track along the existing one would create adverse impacts oncoastal mangroves and well preserved forests. Effects will be significant for ecologically sensitivehabitats of mangroves. The stretches of the track through hills will adversely affect some medicinalplants such as Holarrhena, Woodfordia and Hemidesmus. These impacts will be confined to the trackzone, where ground cutting, tree felling and land filling are unavoidable. However, this impactcould be contained by careful preparation of the ground for laying new track. The impacts would beinsignificant on already degraded areas.
Mitigation:
Minimum possible disturbance to valuable ecosystems (mangroves and forest) during theconstruction phase of the project will lirmit the potential for damage to some extent. Slopes on thetrack shoulders should be made gentle and stabilized by planting local wild plant species especially atthe base of the slopes. Cutting of hills for laying track should be done in a manner that hill faces havegentle slopes. These slopes should be planted with native wild species, particularly climbers.
The ecological impacts described above are quantitatively expressed in Table 4.5.4. Weights usedfor different ecologically sensitive areas are in accordance with the ratios provided in section 3.
4.5.6 Social Impacts (Limited to Displacement of People)
Rest of MMR is mainly characterized by agricultural lands, marshes, creeks, wetlands, forests andhills. The sub region shows ribbon development along road and rail alignments. As mentioned earlier,various urban centres in the sub region include New Mumbai, Thane, Kalyan, Bhiwandi, Dombivali,Ulhasnagar and Panvel. Slums are found within urban limits and peripheries.
Benefits
Both rail and road projects proposed under the transport alternatives are expected to strengthenspatial urban structure of the sub region as envisaged in the Regional Plan. The proposed road /rail projects such as NH8 Connector, Diva jcn to Vasai rail and Nalasopara to Bhiwandi road willlink the eastern and western areas of the sub region, and thus provide an essential communication link

between these two areas. Other road and rail projects i.e. Belapur-Panvel line, Vashi-Turbhe-Kalwaservice and Panvel Bypass are expected to induce further growth in Navi Mumbai in accordancewith the regional plan.
Better transportation infrastructure and prospects of development may increase land prices in 'thesub region. As long as increase in land prices is riot of speculative nature, higher land prices reflect apositive impact.
Adverse effects
Induced development will reduce open space to some extent, and may also affect ecologicallysensitive areas of the region.
Open spaces along road / rail alignments may attract slum development.
The development prospects of the region may lead to speculative land purchases, and thereby,deprive genuine development of this resource.
For at least one project (Thane - Ghodbunder road), hoL .holds may have to be displaced andresettled. The number of households estimate-d to be displaced is 275.
Mitigation
Land and real estate prices should be monitored and suitable administrative measures be taken forarresting speculative purchases.
Other infrastructure such as schools, hospitals, water supply, and adequate sanitation facilities shouldalso be developed in areas where development is desirable, and is likely to take place.

Table 4.5.4
List of Projects and their Impact on Ecological System In Western Suburbs
Sr. Project Name Ecological Width In Wtg Length Do Public Public RoadNo Component/Importance meters (kin) Min Transport Transport Investment
+DenmMgLt1. Kalyan-Bhiwandi * Agricultural Land 10 1 3.1 Nil Nil Nil 0.031
2. Kalyan-shil * Agricultural Land 10 1 3.4 Nil Nil Nil 0.034
3. Mahape-shil * Agricultural Land 10 1 2.6 Nil Nil Nil 0.026
4. Thane Ghodbunder Road Dense forest 11 3 2.8 Nil Nil Nil 8.4
Degraded forest 11 2 2.0 Nil Nil Nil 0.044
Mangroves 11 2 0.8 Nil Nil Nil 0.0176
* Agricultural Land 11 1 3.5 Nil Nil Nil 0.0385
* Pantation 11 1 0.06 Nil Nil Nil 0.06
Waterbodies 11 2 1.00 Nil Nil Nil 0.022
5. Nalasopara to Bhiuwandi Dense forest 10 2 2.00 Nil Nil Nil 0.08
* Agricultural Land 10 4 15.0 Nil Nil Nil 0.15
6. Panvel By pass Degraded forest 10 1 1.5 Nil Nil Nil 0.015
Degraded Mangroves 10 1 2.5 Nil Nil Nil 0.025
* Agricultural Land 10 I 1.0 Nil Nil Nil 0.01
7. Belapur-Panvel line Degraded forest 10 I 1.0 0.01 0.01 0.01 0.01

Degraded Mangroves 10 1 3.8 0.038 0.038 0.038 0.038
*Agricultural Land 10 I 1.0 0 01 I 1 0.01
8. Diva-Vasai Jn Dense forest 10 2 4.0 0 8 8 0
Mangroves 10 2 1.5 0 0.03 3 0
Degraded Mangroves 10 1 0.8 0 0.00 0
*Agricultural (Fallow) Land 10 1 6 0 0.06 0.0 0
9. Belapur-Uran *Agricultural Land (Fallow) 10 1 19 0.19 0.19 0.19 0.19
Degraded forest 10 1 2 0.02 0.02 0.02 0.02
10. Quadrupling of Degraded Mangroves 15 0 0 0 0 0 0Mankhurd-Kulra jTotal Natural Ecosystem Man-made 0.068 0.186 0.186 0.364
Ecosystem 0.2 0.26 0.26 0.42

Provisions should be made for not allowing undesirable development, particularly if thedevelopment is likely to threaten valuable ecological resources.
The road and rail project contracts should be tied up with tree plantation and development ofgreenberts.
4.5.7 Impacts on Transportation
Both rail and road projects proposed Under various alternatives are aimed at improvingtransportation service to commuters.
Three indices were used to reflect the quality of transportation service for the transport optionsconsidered for analysis. These indices are: Traffic Efficiency Index (TEI), Road TrafficCongestion Index (TCI), and Railway Crowding Index (RCI). Table 4.5.5 present the values of theseindices for the Rest of MMR under the transportation option for 2011.
Table 4.5.5:Transport Service Level Indices for Various Options in Rest of MMR
Service level Indicators Year 1996Base Year Year 2011
Do Public Public RoadMin Transport Transport + Investment
__________________ _ _ _ _ _ _ _ _ _ D en . M gt.Traffic Efficiency Index 0.53 0.61 0.59 0.59 0.56(TEl)
Traffic Congestion Index 3.44 14.54 13.83 12.86 12.45(TCI)
Railway Crowding Index 1.042 1.442 0.552 0.552 1.442(R C I) I _ _ _ _ _ _ _ _ _ _ _ _ _ _ _ _ _
Table 4.5.6 presents the summary of all the results for the Rest of MMR.
The objective of this section was to present the results of the environmental analysis for the identifiedtransportation options. The next section aims at interpreting these results in an attempt to select oneof these options to be adopted as the transportations trategy for MMR.
4.6 ENTIRE MMR
The summary of environmental impacts in entire MMR is presented in Table No. 4.6.1. These resultsare obtained by considering all the road links of entire MMR area including Island City, Western andEastern Suburbs and Rest of MMR. The methodology followed for calculating the indicator/indicesvalues is the same as that of the methodologies followed for other regions.
From the Table 4.6.1, it is clearly evident that the Public Transport + Demand Management Option isthe best option for implementation.

Table 4.5.6Summary of Environmental Impacts for the Year 1996 and 2011 in Eastern Suburbs
SR ENVIRONEMNTAL IMPACT BASE DO PUBLIC PUBLIC ROADNO. INCICATORI1NDEX YR. MIN TRANSPORT TRANSPORT INVESTMENT
(1996) _ +DEM.MGT.1 CO Quality Index 0.989 0.994 0.995 0.995 0.995
2 S02 Quality Index 0.989 C -. 4 0.985 0.986 0.984
3 NOx Quality Index 0.859 0.926 0.933 0.936 0.930
4 Pb Quality Index 0.6 1.0 1 1.0 1.0
5 PM-10 Quality Index 0.413 0.330 0.347 0.316 0.232
6 Traffic Noise Index (Day)-TNI 30.41 49.02 49.02 50.14 43.98(day)
7 Traffic Noise Index (Day)-TNI 60.29 83.39 83.05 73.74 80.24(Night)
8 Ecological Impact Indicator 0 0.068 0.186 0.186 0.364(Natural System) - El 1
9 Ecological Impact Indicator 0 0.2 0.26 0.26 0.49(Man-made System) - El 2
10 R & R Impacts (Number of 0 0 0 0 275house holds displaced)
SERVICE LEVEL INDICATORS/INDICES11 Traffic Efficiency Index 0.308 0.391 0.413 0.41 0.44
12 Traffic Efficic.acy Index 18.54 14.54 13.83 12.86 12.45
13 Railway Crowding Index 1.442 1.442 0.552 0.552 1.442
Note: (i) For Indicators/Indices at - Sr.No. I to 5, and 11 higher values indicate betteroption, Whereas for Sr.No.6 to 10,12 and 13 lower values indicate better option.
(v) The mnost favourable index values are shown shaded in the above table.
Public Transport + Demand Manager is the best option in Rest of MMR.

Table 4.6.1Summary of Environmental Impacts for the Year 1996 and 2011 in Eastern Suburbs
SR ENVIRONEMNTAL IMPACT BASE DO PUBLIC PUBLIC ROADNO. INCICATORIINDEX YR. MIN TRANSPORT TRANSPORT INVESTMENT
(1996) +DEM.MGT.I CO Quality Index 0.784 0.975 0.976 0.976 0.930
2 S02 Quality Index 0.957 0.969 0.967 0.977 0.954
3 NOx Quality Index 0.723 0.921 0.921 0.931 0.882
4 Pb Quality Index 0.528 1.0 1.0 1.0 1.0
5 PM-10 Quality Index 0.085 0.038 0.039 0.045 0.025
6 Traffic Noise Index (Day)- 42.355 58.196 58.196 58.985 55.199TNI (day)
7 Traffic Noise Index (Day)- 71.573 87.739 88.591 83.046 85.927TNI (Night)
8 Ecological Impact Indicator 0 0.073 0.986 0.986 0.731(Natural System) - El I
9 Ecological Impact Indicator 0 0.2 0.56 0.56 0.493(Man-made System) - El 2
10 R & R Impacts (Number of 0 1164 6641 6641 9483house holds displaced)
_SERVICE LEVEL INDICATORS/INDICES1I Traffic Efficiency Index 0.395 0.4792 0.4895 0.4955 0.5147
12 Traffic Efficiency Index 18.53 14.55 13.77 12.57 11.49
13 Railway Crowding Index 1.9105 1.9105 1.1415 1.1415 1.9105
Note: (i) For Indicators/Indices at - Sr.No. I to 5, and 11 higher values indicate betteroption, Whereas for Sr.No.6 to 10,12 and 13 lower values indicate better option.
(vi) The most favourable index values are shown shaded in the above table.
- Public Transport + Demand Manager is the best option in Rest of MMR.

Mumbai Urban Transport Project Environmental Assessment
APPENDIX 4.3ENVIRONMENTAL ASSESSMENT JF FLYOVERS
1.1 INTRODUCTION
The Maharashtra State Road Development Corporation (MSRDC) along with PublicWorks Department (PWD) has undertaken the construction of flyovers on all majorarteries and Highways with a view to eliminate the traffic congestion and delays at thebusy intersections. Fifty locations have been selected for flyovers. The environmentalassessment of flyovers was taken up with the objectives of:* Reviewing the current environmental status of the e-ea along the flyover alignments
including identifying sensitive receptors,* Assessing direct, indirect, immediate and long-term environmental impacts of flyover
scheme,* Screening of flyovers to identify those which would improve ait quality,* Undertaking economic evaluation of environmental impacts, and* Preparing comprehensive environmental management plan.
The study focussed on the following six flyovers in Island city:* Dadar-Khodadad circle* S.V, Road - Barfiwala junction* Haji Ali - Wilson College* JJ Hospital-Crawford Market* Senapati Bapat (SB) Marg - Fergusson college Road* SB Marg - Elphinstone
1.2 ENVIRONMENTAL STATUS
Environmental status for the above flyover locations was assessed with respect toambient air quality, noise, water, land, biological and social components.
The concentrations of Sulphur Dioxide (S02), Nitrogen Oxides (Nox), Carbon Monoxide(CO), Respirable Particulate Matter (RPM), Total Particulate Matter (TPM) andHydrocarbons (HC) were monitored at alt the locations. S02 and Nox concentrationswere found in compliance with the standards at all locations. TPM and RPM exceededstandards at all the locations. He highest levels of TPM and ' Traffic, Economic andEnvironment Impact Assesiment of Flyovers in Mumbai - Task 3 Report, TataConsultancy Services, 1994
66

Mumbai Urban Transport Project Environmental Assessment
No land acquisition is required for the construction of flyovers. However, at Haji Ali -Wilson College and JJ Hospital-Bhendi Bazar-Crawford Market location, roads arenarrow and area is densely populated. Barricades at construction sites would causevisual obstruction.
Shifting and rearranging service lines below the road would affect the residents duringshifting period.
Vibrations during piling and other construction activities may affect 15 heritagestructures / precincts. The most susceptible is Gamdevi Precinct along Pandita RambaiMarg.
1.3 OPERATION PHASE IMPACTS
Flyovers will eliminate delay for through pass vehicles at intersections resulting inchange in speed, fuel efficiency and emissions. It was found that CO, Nox and HCemissions would decrease only for one flyover (Dadar Khodadad Circle).
Due to splitting of traffic into two grades, emissions at higher elevations in open areaswould lead to better diffusion. However, at locations where flyovers are close tobuildings, residents will be exposed to higher pollutant levels. This is particularly true forthe sections of proposed flyovers at Pandita Rambai Road, Tardeo Road andMohammed Ali Road.
Predicted concentrations of RPM are much lower than expected, which may be due tothe exclusion of other RPM sources - wave breaking and area sources, etc.
Flyovers would increase traffic noise due to echo and reverberations. Peak hour roadside noise at ground level was estimated to lie between 73 to 81 dB(A) for 1999 and74.8 to 82.6 dB(A) for 2011.
1.4 ENVIRONMENT MANAGEMENT PLAN1.4.1 Construction Phase
* Movement of materials and workers to be restricted to non-peak hours
* DG sets and construction equipment, which generates air pollution and noise, not to belocated near vulnerable receptors.
RPM were observed at Dadar- Khodadad Circle. One hour Co concentrations werefound in compliance with the standards at all the locations, however, 8-hour CO
67

Mumbai Urban Transport Project Environmental Assessment
concentration exceeded the standard at all the locations. Both CO and HCconcentrations peaked around evenings.
High pollutant levels observed at Dadar - Khodadad Circle could be due to ongoingconstruction activities of flyovers at time when air quality was monitored.
Noise levels exceeded the standards at. all the locations. Noise levels monitored at thesix locations are shown in Table 4.2.1.
Land use near flyovers is residential ?nd commercial. There are no terrestrial or aquaticecosystems near these locations.
The above six flyovers are in the densely populated areas, having population density of37033 persons / Km2, indicating high pressure on infrastructure. The heritage structuresnear flyover alignments are given in Table 4.2.2 and other sensitive receptors are givenin Table 4.2.3.
1.4.2 Construction Phase Impacts
Part of the carriage way used for construction activities would reduce the road capacityand result in traffic congestion. The traffic congestion would give rise to higher vehicularemissions of CO, NOx, HC, and RPM.
The construction equipment would generate noise In the range of 108 to 132 dB(A). Thenoise impacts would be significant during night time, particularly, for nearby sensitivereceptors.
The storm water runoff carrying loose soil from the construction site would not besignificant except for monsoon season.The labour force is not expected to reside at the flyover locations, and hence,environmental impacts associated with labour camps are not expected.
No direct change In land use is expected, as the flyovers would be constructed on theexisting road alignments and the excavated material (if any) could be reused forconstruction purposes.
Some trees along flyover alignments need to be cut. The impact-is likely to be significantfor Haji Ali - Wilson College stretch and JJ Hospital - Crawford Market stretch.
Areas with loose and exposed soil to be sprayed with water to avoid fugitive dustemissions
68

Mumbai Urban Transport Project Environmental Assessment
* Trucks carrying material to the construction site to be covered with tarpaulin tpprevent fugitive emissions
* Limiting construction noise to 90 dB(A) for eight hour work shift
* Use of hydraulic piling machines to reduce noise levels near sensitive receptors,such as, nursing homes.
* Workers to be provided with temporary housing with adequate civic facilities.
1.4.3 Operating Phase
* Strict emission norms for all types of vehicles. Restricting growth of private vehicles in Island city through demand
management* Providing efficient mass transportation facilities
Encourage more CNG based vehicles* Use environmental friendly alternative fuels* Encourage road side plantation* Educating vehicle drivers* Plantation of creepers on both sides of flyovers* Periodic monitoring of noise levels of vehicles to assess the compliance with Ministry
of Environment and Forest (MoEF) prescribed standards
69

Mumbai Urban Transport Project Environmental Assessment
Table 4.2.1 Monitored noise levels in commercial and residential areas
Noise Levels in dB(A)-Leg
Location Day NightObserved Standard Observed Standard
Commercial AreasDadar Khodadad Circle 69.5 65 63.3 55JJ Hospital-Bhendi Bazar-Crowford 70.5 65 59.3 55Market _
Hutatma Chowk 70.0 65 62.2 55
Siddhivinayak Temple 67.2 65 62.5 55Byculla Bridge 71.0 65 59.5 55Residential Areas
SB Road-NM Joshi Marg 65.8 55 58.2 45Haji Ali-Chowpatti 69.0 55 62.5 45Barfiwala Junction 69.8 | 55 60.6 45
Table 4.2.2 Heritage structures near flyover locations
| Proposed Flyover Heritage Structure / PrecinctHaji Ali ComplexMahalaxmi PrecinctDhakleshwar TennpleMa Hajjani's Dargah Complex
Haji Ali-Wilson College Old Milestone 2Adenwalla Mansion (Suresh Bhavan)Wilson College Mackinnon HostelAnand Kannan (Villa with Temple & Wadi)Gamdevi Police StationSuhag PalaceJJ Hospital ComplexOld Parsi WardFD Petit BuildingCircleGrant Medical College Building
JJ Hospital - Crawford Market Crawford MarketMarket BuildingFountains in the marketMinara MasjidFakhruddin Building
Dadar Khodadad Khodadad Circle with buildings
70

Mumbai Urban Transport Project Environmental Assessment
Table 4.2.3 Sensitive Receptors near the Proposed FlyoversProposed Flyover Heritage Structure / Precinct
Dadar Khodadad Circle Mistry Maternity and Nursing Home
Shetty Nursing HomeHaji Ali-Wilson College Vistria Memorial School for Blind
Bhatia SchoolBhartiya Vidya BhavanAjinkya HospitalWilson College
EEE Sassoon High SchoolHume High School and Junior CollegeJJ HospitalHaji Kareem Hohammad Suleman Maternity Home
JJ Hospital - Crawford Market Ismail Beg Mohammad High SchoolNoor HospitalSeth Husson Ali Abdul Ali BaseeruddinDholkawala Maternity HomeMumbai Girls High School
SV Road-Barfiwala Junction Sangeeta Maternity and Gynaecology Hospital
71

Mumbai Urban Transport Project Consolidated EnvironmentalAssessment
APPENDIX 4.4SECTORAL ENVIRONMENTAL IMPACTS OF FLYOVERS
1.1 GENERAL
Recently 50 flyovers have been planned in MMR, out of which 30 have beenalready constructed. Table 1 gives a list of all the flyovers.
The flyovers are expected to impact air quality and noise due to possibleredistribution of traffic on various road links, shift of passenger trips from publictransportation to private vehicles, and induced traffic due to facilitation of trafficflow by flyovers. Though, there would be inconvenience to public duringconstruction stage, the flyovers would not disturb any fresh ecologicallysensitive areas or cause major displacement of people. There may be need tocut few trees and temporarily displace few people, which constitute minorimpacts. However, there could be social impacts.due.to visuahntrusion, higher-air pollution and noise exposure to people living in multi-storey.buildings closeto flyovers, Therefore, environmental impacts of flyovers are considered withrespect to air quality, noise ancl social aspects.
1.2 AIR QUALITY AND NOISE IMPACTS
The flyovers may cause change in air quality and noise impacts at sectoral leveldue to the following reasons.
(A) Redistribution of traffic on the road links: Due to perceived or actualincrease in capacity due to flyovers, the flyover corridors may attract traffic fromnearby road links, thereby giving rise to change in air and noise quality in theseareas.
(B) Shift in passenger trips from public transportation to private vehicles: Again,due to perceived or actual increase in road capacity, people using publictransport may start travelling by private cars and taxis. Hence, there could beincrease in number of vehicles on roads resulting in increase of both air andnoise pollution. .
(Conduced Traffic: Flyover corridors, by facilitating the flow of traffic, may giverise to induced traffic, which in turn would result in more noise and vehicularemissions
The air quality and noise impacts of flyovers are analyzed with respect to theabove factors in the following paragraphs.
72

Mumbai Urban Transport Project Consolidated Environmental Assessment
(A) Impacts due to redistribution of traffic:
Flyover may result in change of air quality impacts due to redistribution oftraffic, as air quality impacts are related to traffic volume and trafficcomposition. A flyover corridor would result in redistribution of traffic, if thecorridor is competing with other nearby road links for traffic. The competingroad links would generally be those links, which run parallel to a flyovercorridor, as the destination of some of the commuters on these links will bein the direction of the flow of traffic on the flyover, corridor. Theredistribution of traffic will actually depend on the relative traffic congestionlevel on various competing road links.
Initially, flyovers may also attract traffic due to perceived increase incapacity of a "flyover corridor. However, ultimately traffic will adjust itselfaccording to the real capacity of road links.
Table 4.5.1 List of Flyovers
Sr.No Flyovers StatusWestern Express Highway
1. Worli Bandra done2. Kherwadi deferred3. Kalina Vakola executed4. Santacruz-Airport proposed5. Janata Colony NA6. Jogeshwari-Vikholi Link Road executed7. Aarey Goregaon executed8. Goregaon Mulund Link Road executed9. Rani Sati Marg executed10. Shantaram Ralao NA11. Akurli Road NA12. Dattapada Road executed13. National Park executed14. Shiv Vallabh Road executed15. Sahar Glyover Half built
Eastern Express Highway16. Sion executed17. R.C.F. Junction executed
Sr.No Flyovers Status18. C.S.T NA19. Chheda Nagar NA20. Andheri Ghatkopar Link Road to be started21. Vikholi Junction under construction
73

Mumbai Urban Transport Project Consolidated Environmental Assessment
22. Goregaon Mulund Link Road executed23. Nitin Casting executed24. Cadbury executed25. Golden Dyes executed26. Kapur Bawadi executed
Sion Panvel Highway27. B.A.R.C. executed28. Chembur Mankhurcd Link Road executed29. Vashi executed30. Nerul Bhavan executed31. Uran Road executed32. Konkan Bhavan executed33. Kharghar NA34. Taloje NA35. Kamothe NA
Mumbai City Roads36. Haji Ali37. JJ Hospital Bhendi Bazar under construction38. Crawford Market under construction39. SB Marg: N.M.Joshi under construction40. SB Marg Ephinstorn under construction41. SB Marg: Ferguson under construction42. SB Marg Connect toWEH Not yet commenced43. Adi Shankaracharya Marg LBS under construction44. Worli Naka Not yet started45. Siddhi Vinayak deferred46. Barfiwala Junction NA47. Adi Shankaracharya Marg: JVLR under construction48. Dadar Khodadad Circule Completed49. Juhu Airport Subway Not yet Planned
Appendix 4.3 presents qualitative analysis of flyovers with respect to theirpotential for the redistribution of traffic and resulting environmental impacts.The highlights of the analysis are provided as follows:
The flyovers may marginally increase the vehicle carrying capacity of thehighways by facilitating smooth traffic flow. As a result, environmentalquality on the stretches, which are not competing for traffic with nearby roadlinks, would improve. However, there would be no environmental benefitsfrom flyovers for the stretches competing for traffic with neighboring roadlinks, as traffic redistribution would take place according to relativecongestion levels. Further, with the growth of population and traffic, thismarginal benefit of increased carrying capacity due to flyovers may
74

Mumbai Urban Transport Project Consolidated Environmental Assessment
dissipate over time. Most of the flyovers do not increase physical carryingcapacity of the roads, as these merely lift the central lanes to a higher level.
* The flyovers do allow smooth traffic flow on only one of the intersectionlinks. Therefore, there would be local environmental benefits as the vehicleidling time and resulting pollution at the intersection would reduce. However,if the flyover reduces ground grade capacity of the road for turning traffic,there could be long vehicle queues resulting in even greater pollution atlocal level.
. A number of flyovers, particularly on Western Express Highway, areconstructed on minor cross-link roads. At local level, such flyovers wouldresult in marginal environmental benefits. However, these smallenvironmental benefits may not justify the cost of flyovers. Some of theseflyovers are at the distance of less than 1.5 Kilometres.
i The flyovers located in high population and high road density areas, suchas Island City, may result in redistribution of traffic. However, due to highroad density, the overall traffic related environmental impacts in the areawould remain the same.
* The redistribution of traffic and hence the associated change in air andnoise quality impacts would take place on some stretches of WEH and EEHdue to proximity of the competing traffic roads -the SV Road and the LBSMarg, respectively.
* In the congested areas of Island City and Suburbs, the proximity of flyoversto residential flats at higher storeys would expose the residents to higherlevels of vehicular pollution and noise,, besides disturbing their privacy..
. The flyovers being mainly concentrated on two north-south alignedhighways, would encourage more traffic flow into and out of Island City.
(B) Impacts due to shift from public to private transport
The TCS flyover study (1999) indicates that there would be shift of passengertrips from public transportation to private vehicles due to flyovers in GreaterBombay. The shift during peak hours is estimated to be about 3.2% in 1999and 1.3 % in 2011. The shift would obviously increase cars and taxis onMumbai roads. However, the number of buses or trains are not likely to getreduced due to this shift of passenger trips. At the most crowding in buses andtrains might reduce insignificantly. Therefore, the overall number of vehicles on
75

Mumbai Urban Transport Project Consolidated Environmental Assessment
the roads would increase, resulting in increase in air and noise pollution levels.However, 3.2 % shift of passenger trips in 1999 would marginally increasepollution levels. In 201 1, increase in pollution levels due to shift of passenger
trips (1.3%) would be even smaller.
(C) Impacts due to Induced Traffic
The detailed flyover study also indicates that the flyovers would give rise toinduced traffic, and hence increase in environmental impacts. Flyovers, by
facilitating vehicular flow, might encourage more people to travel, who hithertoavoided travelling because of traffic congestion. In other words, induced trafficwould reflect hidden travel demand. This demand needs to be addressed rather
than suppressed, otherwise the purpose of transportation service would be lost.
The above discussion was based on the qualitative analysis of impacts due to
flyovers. Though from the qualitative discussion, it appears that the air qualityand noise impacts due to flyovers would be marginal, it is desirable to
substantiate this claim quantitatively. Since, it was obvious from the qualitativeanalysis that the change in impacts would be realized near flyover corridors andthe competing road links only, the four corridors considered for analysis were:
Western Express Highway (WEH), Swami Vivekananda Road (SV Road),Eastern Express Highway (EEH) and Lal Bahadur Shastri Marg (LBS). Noestimate has been made for change in environmental quality in Island City dueto flyovers, as the vehicular in-flow to city, and hence resulting environmental
impacts, could be controlled by demand management measures. The changesin air and noise quality due to flyovers on the above four corridors wereestimated by using the following procedures.
i. Air Quality
The most simple representation of an air quality model, which was used to
estimate incremental ambient pollutant concentration (c) due pollutantemissions (0) is as follows:C=K.Q
Where K is a constant depending upon dispersion characteristics of the site.
Using this expression, the change in air quality impacts due to flyovers wasobtained by
Change in air quality impacts = (Q2-01)/Ql
Where Q) and 0; represented emissions without and with flyovers.
76

Mumbai Urban Transport Project Consolidated Environmental Assessment
Further, since emissions depend on vehicle type. Q0 and 02 were estimatedusing the following expressions.
Q, = (-n,.el). Vehicular density without flyover
02 = (-n,, el). Vehicular density with flyover
Where ni represents fraction of vehicle type i. and e, emission factor for thalvehicle type For estimating Q2, shift from public to private vehicles wasaccounted by increasing fraction of cars and taxis by 3.2 % for 1999. Vehiculardensity on roads was estimated using speed data from the TCS study, andspeed curves from WS Atkins study. The change in air quality impacts due toflyovers was estimated with respect to CO, NOx and 50, for four corridorsWEH. SV Road, EEH and LBS Marg for 1999 (Table 2). Except for Kurla-SionStretch of EEH, change in pollutant concentration levels ranged from .1 to 10percent, which may not be considered as significant. However, the Kurla-SionStretch of EEH showed an increase by about 85 percent in pollutantconcentrations due to flyovers.
Table 4.5.2 Estimated percent changes in air quality impacts
Road Link PCU/Km PC U/Km % change % change % changeNFL WFL CO SO2 NO,
Dahisar-Jogeshwari 868 805 -6 -6 -7(W E H)__ _ _ _ __ _ _ _
Jogeshwari-Bandra 616 627 +10 +10 +8(W EH) _ _ _ _ _ _ _ _ _ _ _ _
SV Road 869 847 -1 -1 -2Thane-Vikhroli (EEH) 977 1757 NC NC NCVikhorli-Sion (EEH) 688 654 +84 +85 +84LBS Marg 574 561 -3 -2 -2ii. Noise Quality
The change in noise quality impacts due to flyovers was estimated by using FHWAmodel represented by the following equation.
Leqi (h) =Loei + 10 Log (Ni/Si . T)+10 log (15/d) 1+ a + 8s -13
where,
Leqi (h) = Leq for hours 'h' for the i" vehicle type (heavy or light)Loei = reference mean sound level for the ith vehicle typeNi = number of vehicles of class 'i' passing during time T through a
particular road section
77

Mumbai Urban Transport Project Consolidated Environmental Assessment
Si = average speed of the i" vehicle class in km/h in the particular roadsection
T = duration for which Leq is desired and must correspond to time forwhich NI is measured.
d = perpendicular distance in m from the centerline of the t raffic lanes tothe location of the observer.
a factor representing the adsorption characteristics of the ground coverbetween the roadway and the observer.
6s = Shielding factor provided by noise barriers.
Assuming there was no absorption (a = 0) and using reference sound level for 20 kms/hr speed, the above equation was simplified to estimate Leq for heavy and lightvehicles.
Leq (h) = 67.62 + 10 log [Ni/St.T]
Leq (1) = 47.6 + 10 log (Ni/Si.T]
Using PCU flows and speeds for heavy and light traffic for flyover and without flyovercases, change in noise levels due to flyovers was estimated to be in the range of1dB(A) to 3 db(A).Except for one road link (Vikhroli - Sion), quantitative analysis has shown marginalchange in air quality due to flyovers. Even if noise level by 3 dBA with flyovers could beof concern, particularly if the traffic noise levels are already high. Further, there are anumber of impacts brought forth by qualitative analysis for which mitigation measuresmust be identified. These mitigation measures are discussed in the subsequentsections.
iii. Social Impacts
* Flyover, would be too close to some residential flats in densely populatedareas. The people living in these areas would experience visual intrusionsand higher- noise and pollution levels.
• TCS study has identified many heritage structures and sensitive receptornear the flyovers in Island city. These structures and receptors are listed inAppendix 5.1. Pile driving operations during construction stage may causedamage to heritage structure.
* The property prices will come down near flyovers.* There is one settlement along SB Marg - MM Joshi Marg alignment which
would be disturbed during construction.
1.3 MITIGATION OF AIR QUALITY IMPACTS AND NOISE LEVEL
78

Mumbai Urban Transport Project Consolidated Environmental Assessment
* Traffic congestion due to turning traffic at flyover intersections and resultinghigh pollution levels could be mitigated by widening of ground grade lanes,and thereby, reducing congestion and pollution levels at these intersections.
* To overcome the negative effect of traffic bottlenecks on traffic flow thewidth of flyover corridors (particularly Highways) should be made uniform.
* Perceived or actual increasing traffic carrying capacity of flyover corridorswould attract traffic from the neighbouring competing roads, and thereby,give rise to traffic congestion and higher levels of pollution. It may be notedhere that the redistribution of traffic would depend on the relative congestionlevel of the competing road links. Flyover corridors would attract traffic, onlyif the competing road links do not have sufficient capacity to carry traffic. Infact, this would indicate that there is need for creating new transportationlinks to meet the travel demand.
* In Greater Bombay, flyovers are mainly concentrated on WEH and EEH insuburbs. Both the highways run almost parallel to Western and Centralrailway lines. Therefore, by increasing the passenger carrying capacities ofboth these railways, the congestion and pollution levels on the highwayscould be reduced
* The flyovers are also planned to be on East-West links connecting twohighways The traffic congestion on these links need not to be linked toflyovers, but may be due to the fact there are only few such links to addressthe demand for east west moverne'll Traffic.
* Increasing road and rail capacity to accommodate more traffic and reducecongestion on the flyover corridors.
• Shifting of bus stops to road shoulders to free the left lane.
Traffic management measures:
* Dedicating left lane exclusively for buses.
* Introducing demand management measures to discourage shift from publictransport to private vehicles.
* Encouraging car pooling and telecommuting
Desian level measures:
79

Mumbai Urban Transport Project Consolidated Environmental Assessment
. Developing guidelines fcir the location of flyovers, which would takeenvironmental aspects into consideration.
. Developing guidelines for the design of flyovers based on the aim ofrequirements of turning and through traffic.
Social:
As already discussed above.
1 . Generic mitigation measures identified for the transportation sector asa whole would reduce the environmental impacts of the flyovers as well.With the flyovers in MMR, more thrust needs to be placed onencouraging the use of public transport, modifying travel demand in theisland city by demand management measures and improving trafficcirculation in Island City.
2. Though the flyovers are not part of IVIUTP, the investment schemes ofMUTP are designed to encourage public transport and increase trafficcirculation in congested areas. Thus. MUTP remains the valid transportchoice even with flyovers.
3. Mitigation for alleviating environmental impacts of individual transportprojects are presented in the next section. The section also discussesthe environmental impacts of MUTP investment schemes.
80

Mumbai Urban Transport Project Consolidated Environmental Assessment
ANNEX 9.1Photographs of Public Consultation
A*k~~~~~~~.
81

Mumbai Urban Transport Project Consolidated Environmental Assessment
82

Mumbai Urban Transport Project Consolidated Environmental Assessment
Advertisements published in the Newspapers
MUMBAI URBAN _TRANSPORT PROJECTPUVUC NOTICE t q6rq 50hq7MUMBAI Metropolitan i §-Region Development
Authority has organiseda public consultation todiscuss EnvironmentalAssessment of MUTP onDecember 14, 2000 at3.00 p.m. at Y.B. ChavanCentre (Convention Hall, I ooolq,4th floor), Nariman Point, i : f1lMumbai. All those ll i117 N 1 T t.interested in this subject
-* viuti # s 4fr aftare cordially invited to '4 f z1 14participate.' The l . tExecutive Summary of vkmq I Athe report prepared on 'Ifli* ifelEqW T:17Rthe Environmental
7 NWTR V1fqTwlTIJAssessment of MUTP is www.mmrdpmumbai.orB wavailable on MMRDAwebsite www.mmrdamumbai.org
Sd!-Project Director i
MUTP _________________DGIPR/2000-200112477 618561
I8
83

Mumbai Urban Transport Project Consolidated Environmental Assessment
PamphletsMUMBAI URBAN TRANSPORT PROJECT
PUBLIC NOTICE
Mumbai Metropolitan RegionDevelopment Authority has organised apublic consultation to discussEnvironmental Assessment of MUTP onDecember 13, 20010 at 4.00 p.m. atMankhurd Station Near Office of theDivisional Engineer (Convention Hall )Mumbai. All those interested in thissubject are cor(dially invited toparticipate. The Executive Summary ofthe report prepared on theEnvironmental Assessment of MUTP isavailable on NIMRDA Websitewww.mmrdamumbai.org
Project DirectorMUTP
84

Mumbai Urban Transport Project Consolidated Environmental Assessment
MUMBAI URBAN TRANSPORT PROJECT
PUBLIC NOTICE
Mumbai Metropolitan RegionDevelopment Authority has organised apublic consultation to discussEnvironmental Assessment of MUTP onDecember 14, 2000 at 3.00 p.m. at Y.B.Chavan Center (Convention Hall, 4 th
floor), Nariman Point, Mumbai. All thoseinterested in this subject are cordiallyinvited to participate. The ExecutiveSummary of the report prepared on theEnvironmental Assessment of MUTP isavailable on MMRDA Websitewww.mnrrdarnumbai.org
Project DirectorMUTP
85

Mumbai Urban Transport Project Consolidated Environmental Assessment
w 14~1 '114t MTJ cbI4
TF 111411X fq)II w llqTq M'MllSqqu
ivW4T fqctn icbi u www.mmrdamumbai VT
:ks 910 i t Kt9 a,ao
86

Mumbai Urban Transport Project Consolidated Environmental Assessment
MWW q>ulf,J14I4 Vr- ct*llo *Nf MTq -vqW1 qjSuqj,"j&
.00 42STM ri tfqT "RE ¢qlq(i 1IM TqrmI"TrA M t* to- ;WrMi a1 OII-
w ¢~~~~~1141t MT<f !Aq)q9YIr-Q, N00 f11 gql
4ful;i A, n v 4M, Al* HA1q,c1u Vk f <,<
www.mmrdamumbai.org \ 5M o *.
87