Multistage genesis of the late Cretaceous manganese karst ...
Upload
independentCategory
view
4download
0
research papers
154 # 2003 International Union of Crystallography � Printed in Great Britain ± all rights reserved J. Synchrotron Rad. (2003). 10, 154±167
Dynamics of phase transformations andmicrostructure evolution in carbon±manga-nese steel arc welds using time-resolvedsynchrotron X-ray diffraction
Joe Wong,* Thorsten Ressler² and John W. Elmer
Lawrence Livermore National Laboratory, University ofCalifornia, PO Box 808, Livermore, CA 94551, USA.E-mail: [email protected]
Phase transformations that occur in both the heat-affected zone
(HAZ) and the fusion zone (FZ) of a carbon±manganese steel spot
weld have been investigated using time-resolved X-ray diffraction
(TRXRD) with time resolutions down to 50 ms. It is found that in
both zones the (f.c.c.)! �(b.c.c.) transformation on cooling is twice
as fast as the forward transformation of �! on heating. Pro®le
analysis of the major Bragg re¯ections recorded in the TRXRD
patterns reveals similarities and differences in the microstructural
evolution with time in the HAZ and in the FZ. The latter undergoes
melting and solidi®cation in addition to solid-state transformations.
With increasing temperature, the (110) d-spacing of the � phase prior
to and during the �! transformation and the (111) d-spacing of
the phase just after the same transformation exhibit a decrease. The
observed (and unusual) lattice contraction with temperature rise may
be attributed to chemical effects, such as carbide precipitation in the
� matrix, and/or mechanical effects due to stress relief. In the FZ, the
-Fe that forms has a preferential (200) texture on solidi®cation of
the liquid, whereas, on cooling in the HAZ, the -Fe retains largely a
(111) texture that is induced in the �! transformation on heating.
On cooling in the HAZ, the width of the (111) re¯ection increases
initially, which is indicative of microstrain developing in the f.c.c.
lattice, but decreases as expected, with a reduction of thermal
disorder, on further cooling until the completion of the ! �transformation. In the FZ, however, the microstrain in the phase
increases steadily on solidi®cation and more rapidly for the duration
of the ! � transformation on further cooling. The ®nal
microstructure of the FZ is likely to consist of a single � phase
dispersed in two morphological entities, whereas in the HAZ the
� phase persists in one morphological entity in the ®nal micro-
structure.
Keywords: phase transformation; dynamics; time-resolveddiffraction; fusion welds.
1. Introduction
Real-time studies of dynamical processes under severe temperature
or pressure conditions often pose a challenge to experimentalists.
During fusion welding, high-intensity sources are employed to create
steep thermal gradients that rapidly heat and cool materials to and
from their melting point. This rapid thermal cycling induces solid-
state transformations both on heating and on cooling as well as
melting and solidi®cation in those regions of the weld where the
liquidus temperature has been exceeded. In the heat-affected zone
(HAZ) of fusion welds, microstructural gradients are created by
processes such as grain growth, recrystallization, phase changes,
annealing and tempering (Grong, 1994; Easterling, 1983; Ashby &
Easterling, 1982; Ion et al., 1984). In steels, these transformations
result in the formation of different microstructural subregions that
are referred to as the coarse-grain region, the ®ne-grain region and
the partially transformed region of the HAZ (Grong, 1994; East-
erling, 1983; Ashby & Easterling, 1982; Ion et al., 1984). The presence
of these various microstructural regions is known in a qualitative
sense. However, their exact size, location and temporal development
have not been determined and well understood until recently because
of a lack of appropriate experimental methods for in situ determi-
nation of phase transformations in fusion welds (Wong et al., 1994,
1997; Elmer et al., 1996, 1998, 2000, 2001; Ressler et al., 1998; Palmer
et al., 2001). This lack of information has hindered both our basic
understanding of microstructural evolution in steel welds and efforts
to develop comprehensive models for the prediction of the HAZ
microstructure.
Experimental measurements of phase-transformation dynamics in
welds are dif®cult to perform because of the highly non-isothermal
and transient heating conditions that exist during welding. In the
absence of speci®c kinetic data under true welding conditions,
isothermal time±temperature-transformation (TTT) and continuous-
cooling-transformation (CCT) diagrams have been developed. These
diagrams are available for many ferrous alloys (Vander Voort, 1991;
Harrison & Farrar, 1989) and are often used to approximate the
behavior of phase transformations that occur during cooling of the
HAZ (Easterling, 1983). However, the prediction of weld micro-
structures from CCT diagrams requires many assumptions in order to
deal with the non-isothermal and non-uniform cooling conditions of
welds (Easterling, 1983). Furthermore, these diagrams represent the
cooling but not the heating portions of the HAZ, and there is no
generally accepted method for validating how well these diagrams
predict actual HAZ behavior.
Modeling the phase transformations that occur in the HAZ during
welding requires a good understanding of both the temperature
cycles that occur during welding and the kinetics of the phase
transformations. Numerical modeling of the weld temperatures has
advanced considerably in the past few years and is now being used by
welding metallurgists to calculate the size and shape of the fusion
zone (FZ) in carbon steels (Yang & DebRoy, 1997, 1999; Mundra et
al., 1997) and other alloys such as titanium (Yang et al., 2000). These
models provide semi-quantitative, but very useful, information about
transient three-dimensional temperature distribution around the
weld, thus allowing the spatial distribution of peak temperatures,
heating rates and cooling rates in the HAZ to be determined.
However, without corresponding transformation kinetics and phase
dynamics, microstructural evolution in the weld HAZ cannot be
predicted accurately.
In this work, we have applied a re®ned version of the time-resolved
diffraction technique (Wong et al., 1990; Larson et al., 1993), which
was originally developed for chemical-dynamics studies of fast high-
temperature solid combustion reactions, in order to investigate the
phase-transformation dynamics in both the HAZ and the FZ of a
simple C±Mn steel spot weld. In particular, the �! transformation
on heating and the reverse ! � transformation on cooling have
been examined in detail. We have used quantitative pro®le analysis of
the major Bragg re¯ections recorded in the TRXRD patterns as a
function of time during welding, with time resolutions down to 50 ms.
The results yield new insight into the microstructural evolution in
both the HAZ and the FZ and should provide the much needed
experimental inputs for realistic modeling.² Current address: Fritz-Haber-Institut der MPG, Department of InorganicChemistry, Faradayweg 4-6, D-14195 Berlin, Germany.
2. Experimental
2.1. Carbon±manganese steel (AISI 1005 steel)
The starting C±Mn steel was in the form of 10.8 cm-diameter
forged bar stock. Cylindrical welding samples were machined from
the as-received material into 10.15 cm-diameter bars of length
11.40 cm. The ®nal cylindrical samples had a surface roughness of
1.6 mm r.m.s. and were circular in diameter to within 10 mm. The
composition was assayed using a combination of combustion analysis,
for O, C, N and H, and inductively coupled plasma analysis for the
remaining elements. The results show the following elemental
constitution in weight percent: C 0.05%; Mn 0.31%; Si 0.18%;
Ni 0.11%; Cr 0.10%; P 0.009%; Cu 0.08%; S 0.005%; Al < 0.005%;
Nb < 0.005%; Mo < 0.005%; Ti < 0.005%; and V < 0.005%. The
phases present in the HAZ of a moving fusion weld of this material
under steady-state conditions have recently been mapped in detail
using a spatially resolved diffraction method (Elmer et al., 2001).
2.2. Welding
Gas tungsten arc spot welds were made on the steel bars using a
225 A constant direct-current welding power supply with electrode
negative polarity. The welding electrode was made of tungsten±2%
thorium, measured 4.7 mm in diameter and was straight ground with
a 90� included angle taper. The average power was maintained at
2.1 kW (120 A, 17.5 V) for all of the welds, and current pulsing was
used to help minimize the side-to-side motion of the liquid weld pool.
The pulsing parameters used were 145 A maximum current, 101.5 A
background current and 50% peak current on time at 300 pulses per
second. Welding was performed in an environmentally controlled
chamber in order to optimize the signal-to-noise ratios in the
diffraction data by obviating oxidation of the steel bar during welding
and minimizing air absorption of the X-ray beam.
Prior to welding, the vacuum chamber was evacuated to 60 mtorr
with a mechanical roughing pump and then back-®lled with ultra-
high-purity (99.999%) helium gas. This gas was also ¯owed through
the torch during welding to prevent oxidation in the weld region and
to cool the torch. A second He gas stream was blown across the weld
pool to obviate soot accumulation in the weld region probed by the
X-ray beam. The chamber contained two 50 mm-diameter ports. The
®rst port was sealed with a 0.125 mm-thick mylar window, which
allowed the X-rays to enter the chamber. The second port was sealed
with a KBr crystal and was used to video record the weld with an IR
camera (Inframetrics, Model 600) with a 0.46 m focal length lens and
a 40 � 25 mm ®eld of view. The IR camera provided real-time visual
monitoring of the welding process. The welding-diffraction chamber
has been described elsewhere (Elmer et al., 1998; Ressler et al., 1998).
The welds were made with the torch perpendicular to the surface
of the bar, while the steel bar was held stationary below the ®xed
electrode during welding and X-ray measurement. The total arc-on
time varied between 15 and 25 s, during which X-ray diffraction
patterns were recorded at a predetermined position about the weld as
a function of time, with temporal resolution in the range 50±200 ms.
This con®guration together with a nominal power input of 2.1 kV
yielded a circular spot weld with a �8.5 � 0.5 mm-diameter fusion
zone on the surface of the steel bar.
2.3. Time-resolved X-ray diffraction
TRXRD measurements were performed on the 31-pole wiggler
beamline, BL 10±2 (Karpenko et al., 1989), at Stanford Synchrotron
Radiation Laboratory (SSRL) with SPEAR (Stanford Positron±
Electron Accumulation Ring) operating at an electron energy of
3.0 GeVand an injection current of�100 mA. The synchrotron white
beam emerging from the 31-pole wiggler was ®rst focused by a
toroidal mirror to the source size of �1 mm vertical � 2 mm hori-
zontal and monochromated downstream with a double Si(111)
crystal. The focused monochromatic beam was then passed through a
tungsten pinhole to render a submillimeter beam on the sample at an
incident angle of �25�. Using an ion chamber immediately down-
stream from the pinhole, we determined the beam ¯ux on the sample
to be �1010±1011 photons sÿ1 for pinholes ranging from 260 to
730 mm. A photon energy of 12.0 keV (� = 0.1033 nm) was chosen to
maximize the number of Bragg peaks in a selected 2� window in order
(i) to facilitate phase identi®cation and (ii) to be far enough in energy
above the Fe-edge to minimize the background contribution due to
Fe K-¯uorescence from the sample [Fe K-edge at 7.112 keV
(Bearden & Burr, 1967)]. For higher resolution in 2�, we used a 7 keV
photon beam (� = 0.1771 nm), the energy of which is below the Fe
K-edge.
TRXRD patterns were recorded using a 50 mm-long 2048-element
position-sensitive silicon photodiode array detector. The array was
mounted on a Peltier effect cooler, which in turn was water cooled.
This detector was placed �10 cm behind the weld to cover a 2� range
from 24� to 54�. This range of 2� was optimized at 12 keV to contain a
total of six diffraction peaks: three from the body-centered cubic
(b.c.c.) phases (�-Fe or �-Fe) and three from the face-centered cubic
(f.c.c.) phase ( -Fe). The detector together with the associated ST121
data acquisition system was manufactured by Princeton Instruments
(now Roper Scienti®c) (ST121 Detector and Controller Manual, 1996)
and was used to store and display the X-ray diffraction data in real
time.
The TRXRD procedure consists of ®rst positioning the X-ray
beam at a predetermined location in the FZ or HAZ using the
electrode position as the center of the liquid pool. After an inert
ambient was established with pumping and He back ®ll, an arc was
struck to establish a spot weld. Diffraction patterns were collected
within a few seconds at a preset time interval (resolution), in order to
record the phase transformations in a predetermined heating (arc on)
and cooling (arc off) cycle. Preliminary results indicated that a time
resolution of 100 ms in conjunction with a 260 mm pinhole used for
phase mapping of the same system (Elmer et al., 2001) was adequate
to capture the �! phase transformation on heating and the ! �transformation on cooling in the HAZ. For phase transformations in
the FZ, where (a) the thermal gradients are much higher and (b)
larger grains are present as a result of solidi®cation, a 730 mm pinhole
was used to enhance the time resolution to 50 ms and at the same
time to incorporate more grains into the diffraction beam. The ulti-
mate time resolution of the diode array is 8 ms, which is determined
by a read-out time of 4 ms for each of the 2048 pixels in the array
(ST121 Detector and Controller Manual, 1996).
2.4. Data analysis
The X-ray diffraction data were analyzed using the WinXAS
software package (Ressler, 1997). Conversion from detector pixel
number to 2� angle (in �) was performed using the calibration curve
2� � 23:950� 0:015� pixel number; �1�which was derived using the (110), (200), (211) and (220) diffraction
peaks of a pure niobium foil laid over the surface of the steel-bar
sample at room temperature. The 2� values of the observed hkl peaks
were calculated (with PowderCell 1) from the known cell constant
J. Synchrotron Rad. (2003). 10, 154±167 Wong, Ressler and Elmer � Carbon±manganese steel arc welds 155
research papers
1 Version 1.2. W. Kraus & G. Nolze, Federal Institute for Materials Research &Testing, Rudower Chaussee 5, 12489 Berlin, Germany. A free version may beobtained from [email protected].
research papers
156 Wong, Ressler and Elmer � Carbon±manganese steel arc welds J. Synchrotron Rad. (2003). 10, 154±167
(0.33002 nm; Wychoff, 1963) of b.c.c. Nb at room temperature. Given
a detector resolution of 1.5 diode (pixel) or better (ST121 Detector
and Controller Manual, 1996), the angular resolution of the present
TRXRD setup is 0.0225� in 2� or better. Single or multiple diffraction
peaks in the TRXRD data were ®tted with a sum of one or more
Gaussian pro®le functions and a linear background via a standard
least-squares re®nement procedure. Because of the limited number
of data points in multiple-peak diffraction lines, the FWHMs of the
respective Gaussian functions were re®ned to vary identically.
Multiple-scan data in each TRXRD ®le were analyzed in a serial
procedure employing the macro capabilities of WinXAS.
3. Results
3.1. TRXRD patterns
3.1.1. Phase transformation in the HAZ. Having experimentally
determined the weld-pool diameter to be �8.5 mm with the power
input and welding con®guration described in x2, we positioned the
X-ray beam at spots 5 mm and 3 mm from the electrode in order to
follow crystallographically the phase transformations in the HAZ and
FZ using TRXRD.
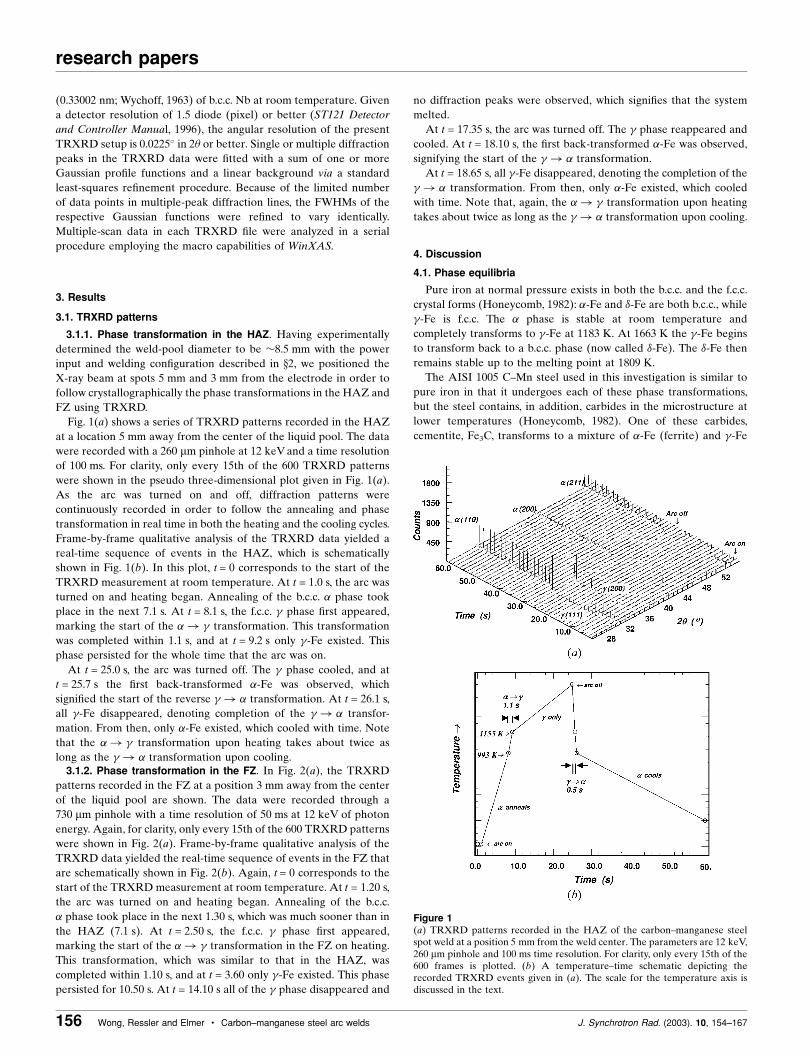
Fig. 1(a) shows a series of TRXRD patterns recorded in the HAZ
at a location 5 mm away from the center of the liquid pool. The data
were recorded with a 260 mm pinhole at 12 keV and a time resolution
of 100 ms. For clarity, only every 15th of the 600 TRXRD patterns
were shown in the pseudo three-dimensional plot given in Fig. 1(a).
As the arc was turned on and off, diffraction patterns were
continuously recorded in order to follow the annealing and phase
transformation in real time in both the heating and the cooling cycles.
Frame-by-frame qualitative analysis of the TRXRD data yielded a
real-time sequence of events in the HAZ, which is schematically
shown in Fig. 1(b). In this plot, t = 0 corresponds to the start of the
TRXRD measurement at room temperature. At t = 1.0 s, the arc was
turned on and heating began. Annealing of the b.c.c. � phase took
place in the next 7.1 s. At t = 8.1 s, the f.c.c. phase ®rst appeared,
marking the start of the �! transformation. This transformation
was completed within 1.1 s, and at t = 9.2 s only -Fe existed. This
phase persisted for the whole time that the arc was on.
At t = 25.0 s, the arc was turned off. The phase cooled, and at
t = 25.7 s the ®rst back-transformed �-Fe was observed, which
signi®ed the start of the reverse ! � transformation. At t = 26.1 s,
all -Fe disappeared, denoting completion of the ! � transfor-
mation. From then, only �-Fe existed, which cooled with time. Note
that the �! transformation upon heating takes about twice as
long as the ! � transformation upon cooling.3.1.2. Phase transformation in the FZ. In Fig. 2(a), the TRXRD
patterns recorded in the FZ at a position 3 mm away from the center
of the liquid pool are shown. The data were recorded through a
730 mm pinhole with a time resolution of 50 ms at 12 keV of photon
energy. Again, for clarity, only every 15th of the 600 TRXRD patterns
were shown in Fig. 2(a). Frame-by-frame qualitative analysis of the
TRXRD data yielded the real-time sequence of events in the FZ that
are schematically shown in Fig. 2(b). Again, t = 0 corresponds to the
start of the TRXRD measurement at room temperature. At t = 1.20 s,
the arc was turned on and heating began. Annealing of the b.c.c.
� phase took place in the next 1.30 s, which was much sooner than in
the HAZ (7.1 s). At t = 2.50 s, the f.c.c. phase ®rst appeared,
marking the start of the �! transformation in the FZ on heating.
This transformation, which was similar to that in the HAZ, was
completed within 1.10 s, and at t = 3.60 only -Fe existed. This phase
persisted for 10.50 s. At t = 14.10 s all of the phase disappeared and
no diffraction peaks were observed, which signi®es that the system
melted.
At t = 17.35 s, the arc was turned off. The phase reappeared and
cooled. At t = 18.10 s, the ®rst back-transformed �-Fe was observed,
signifying the start of the ! � transformation.
At t = 18.65 s, all -Fe disappeared, denoting the completion of the
! � transformation. From then, only �-Fe existed, which cooled
with time. Note that, again, the �! transformation upon heating
takes about twice as long as the ! � transformation upon cooling.
4. Discussion
4.1. Phase equilibria
Pure iron at normal pressure exists in both the b.c.c. and the f.c.c.
crystal forms (Honeycomb, 1982): �-Fe and �-Fe are both b.c.c., while
-Fe is f.c.c. The � phase is stable at room temperature and
completely transforms to -Fe at 1183 K. At 1663 K the -Fe begins
to transform back to a b.c.c. phase (now called �-Fe). The �-Fe then
remains stable up to the melting point at 1809 K.
The AISI 1005 C±Mn steel used in this investigation is similar to
pure iron in that it undergoes each of these phase transformations,
but the steel contains, in addition, carbides in the microstructure at
lower temperatures (Honeycomb, 1982). One of these carbides,
cementite, Fe3C, transforms to a mixture of �-Fe (ferrite) and -Fe
Figure 1(a) TRXRD patterns recorded in the HAZ of the carbon±manganese steelspot weld at a position 5 mm from the weld center. The parameters are 12 keV,260 mm pinhole and 100 ms time resolution. For clarity, only every 15th of the600 frames is plotted. (b) A temperature±time schematic depicting therecorded TRXRD events given in (a). The scale for the temperature axis isdiscussed in the text.
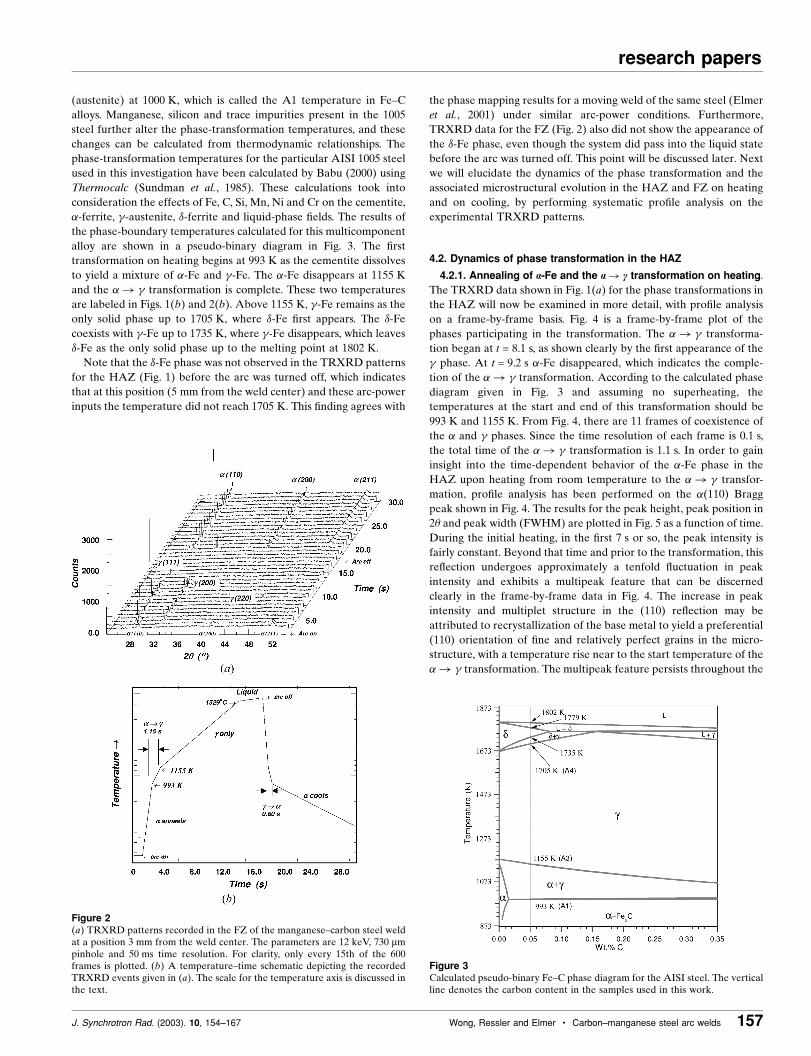
(austenite) at 1000 K, which is called the A1 temperature in Fe±C
alloys. Manganese, silicon and trace impurities present in the 1005
steel further alter the phase-transformation temperatures, and these
changes can be calculated from thermodynamic relationships. The
phase-transformation temperatures for the particular AISI 1005 steel
used in this investigation have been calculated by Babu (2000) using
Thermocalc (Sundman et al., 1985). These calculations took into
consideration the effects of Fe, C, Si, Mn, Ni and Cr on the cementite,
�-ferrite, -austenite, �-ferrite and liquid-phase ®elds. The results of
the phase-boundary temperatures calculated for this multicomponent
alloy are shown in a pseudo-binary diagram in Fig. 3. The ®rst
transformation on heating begins at 993 K as the cementite dissolves
to yield a mixture of �-Fe and -Fe. The �-Fe disappears at 1155 K
and the �! transformation is complete. These two temperatures
are labeled in Figs. 1(b) and 2(b). Above 1155 K, -Fe remains as the
only solid phase up to 1705 K, where �-Fe ®rst appears. The �-Fe
coexists with -Fe up to 1735 K, where -Fe disappears, which leaves
�-Fe as the only solid phase up to the melting point at 1802 K.
Note that the �-Fe phase was not observed in the TRXRD patterns
for the HAZ (Fig. 1) before the arc was turned off, which indicates
that at this position (5 mm from the weld center) and these arc-power
inputs the temperature did not reach 1705 K. This ®nding agrees with
the phase mapping results for a moving weld of the same steel (Elmer
et al., 2001) under similar arc-power conditions. Furthermore,
TRXRD data for the FZ (Fig. 2) also did not show the appearance of
the �-Fe phase, even though the system did pass into the liquid state
before the arc was turned off. This point will be discussed later. Next
we will elucidate the dynamics of the phase transformation and the
associated microstructural evolution in the HAZ and FZ on heating
and on cooling, by performing systematic pro®le analysis on the
experimental TRXRD patterns.
4.2. Dynamics of phase transformation in the HAZ
4.2.1. Annealing of a-Fe and the a! c transformation on heating.
The TRXRD data shown in Fig. 1(a) for the phase transformations in
the HAZ will now be examined in more detail, with pro®le analysis
on a frame-by-frame basis. Fig. 4 is a frame-by-frame plot of the
phases participating in the transformation. The �! transforma-
tion began at t = 8.1 s, as shown clearly by the ®rst appearance of the
phase. At t = 9.2 s �-Fe disappeared, which indicates the comple-
tion of the �! transformation. According to the calculated phase
diagram given in Fig. 3 and assuming no superheating, the
temperatures at the start and end of this transformation should be
993 K and 1155 K. From Fig. 4, there are 11 frames of coexistence of
the � and phases. Since the time resolution of each frame is 0.1 s,
the total time of the �! transformation is 1.1 s. In order to gain
insight into the time-dependent behavior of the �-Fe phase in the
HAZ upon heating from room temperature to the �! transfor-
mation, pro®le analysis has been performed on the �(110) Bragg
peak shown in Fig. 4. The results for the peak height, peak position in
2� and peak width (FWHM) are plotted in Fig. 5 as a function of time.
During the initial heating, in the ®rst 7 s or so, the peak intensity is
fairly constant. Beyond that time and prior to the transformation, this
re¯ection undergoes approximately a tenfold ¯uctuation in peak
intensity and exhibits a multipeak feature that can be discerned
clearly in the frame-by-frame data in Fig. 4. The increase in peak
intensity and multiplet structure in the (110) re¯ection may be
attributed to recrystallization of the base metal to yield a preferential
(110) orientation of ®ne and relatively perfect grains in the micro-
structure, with a temperature rise near to the start temperature of the
�! transformation. The multipeak feature persists throughout the
J. Synchrotron Rad. (2003). 10, 154±167 Wong, Ressler and Elmer � Carbon±manganese steel arc welds 157
research papers
Figure 3Calculated pseudo-binary Fe±C phase diagram for the AISI steel. The verticalline denotes the carbon content in the samples used in this work.
Figure 2(a) TRXRD patterns recorded in the FZ of the manganese±carbon steel weldat a position 3 mm from the weld center. The parameters are 12 keV, 730 mmpinhole and 50 ms time resolution. For clarity, only every 15th of the 600frames is plotted. (b) A temperature±time schematic depicting the recordedTRXRD events given in (a). The scale for the temperature axis is discussed inthe text.

research papers
158 Wong, Ressler and Elmer � Carbon±manganese steel arc welds J. Synchrotron Rad. (2003). 10, 154±167
transformation. On the other hand, the peak position initially
decreases in 2� value along the path PQ in Fig. 5(b), which behavior is
indicative of thermal expansion in accordance to Bragg's law. Further
heating along the path QR shows an unexpected increase in 2�position, which corresponds to an apparent decrease in the (110)
d-spacing of the Fe b.c.c. lattice. This jump in the 2� position of the
�(110) peak is reproducible at the same location in a duplicate
TRXRD experiment using a 540 mm pinhole and a time resolution of
50 ms. From the calibration curve given in (1), the d-spacing
contraction was determined to be ÿ0.000334 nm which in turn yields
a �d/d ratio of ÿ0.00164. The observed contraction with increasing
temperature may arise from chemical effects (carbide precipitation)
and/or mechanical effects (relief of process-induced tensile stress),
each of which can exceed the normal effects of thermal expansion.
Along the path TW, normal thermal expansion of the b.c.c. lattice
occurs during the �! transformation from t = 8.1 to 9.2 s. In
Fig. 5(c), the width of the �(110) re¯ection is shown to decrease
monotonically upon heating until the completion of the transforma-
tion, which indicates thermal annealing and the relief of microstrain
in the base metal in the heating cycle. Finally, note that the �(211)
re¯ection exhibits identical time dependence in both peak position
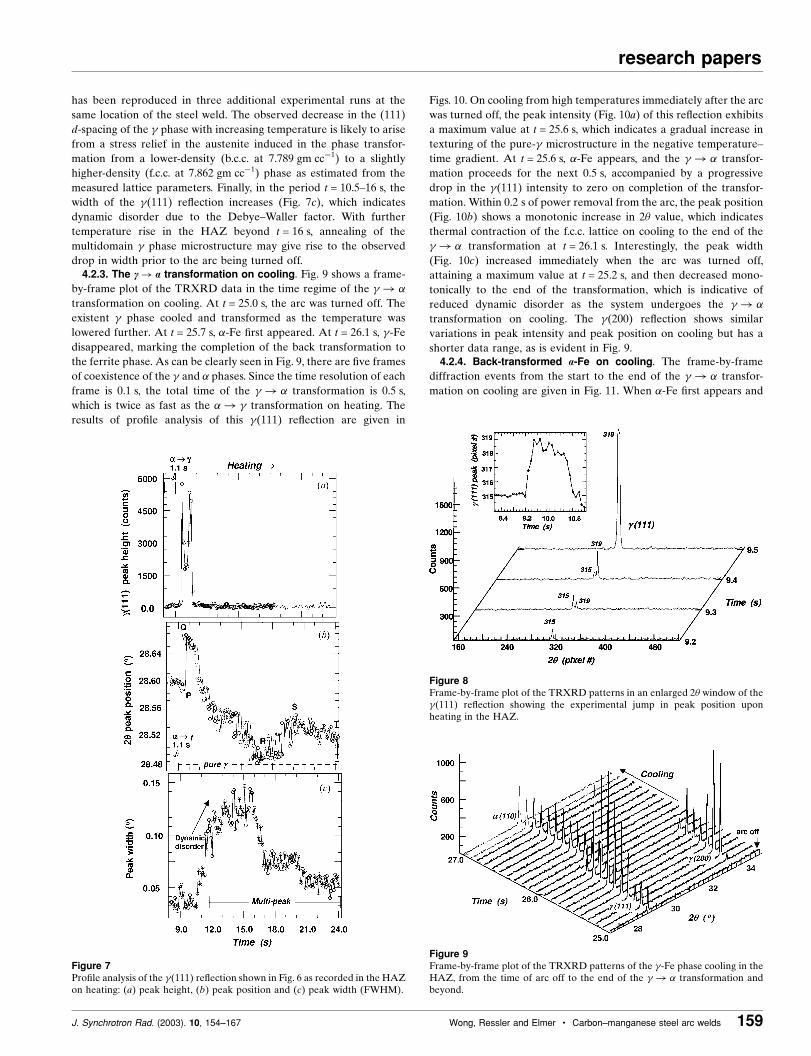
and peak width to that of the �(110) re¯ection.4.2.2. c-Fe during and after transformation on heating. TRXRD
patterns of the phase in the HAZ on heating are shown in detail in
Fig. 6, from t = 8.1 s, when -Fe was ®rst observed, to t = 24 s, at which
time -Fe persisted until the arc was turned off. Pro®le analysis of the
(111) re¯ection is given in Figs. 7. During the transformation, the
peak intensity of (111) is low. Within 0.5 s of completion of the
�! transformation, the (111) re¯ection exhibits a �20-fold
increase in peak intensity; this increase is attributable to texturing
associated with recrystallization and grain growth. This stage lasted
for just over 1 s. On further heating, the peak intensity drops, thus
giving rise to a multipeak feature indicative of multiple domain
production in the pure- microstructure. The peak position of the
(111) re¯ection shows a jump in 2� value along PQ in Fig. 7(b). This
increase coincides with the peak intensity increase that is clearly
discernible in Fig. 8, which gives a frame-by-frame display of the
TRXRD patterns in the time regime in which the newly transformed
phase exhibits a (111) re¯ection at a 2� value corresponding to pixel
315 at t = 9.2 s. In the next frame, at t = 9.3 s, a new re¯ection at pixel
319 emerges, and at t = 9.4 s this re¯ection grows at the expense of
that at pixel 315. At t = 9.5 s the intensity of the new re¯ection
increases approximately tenfold. From the calibration curve given in
(1), a four-pixel increase in 2� value at the (111) re¯ection corre-
sponds to a decrease in cell parameter of 0.0043 AÊ . The jump in 2�
Figure 5Pro®le analysis of the �(110) re¯ection shown in Fig. 4 as recorded in the HAZon heating: (a) peak height, (b) peak position and (c) peak width (FWHM).
Figure 4Frame-by-frame plot of the TRXRD patterns in the 2� region of the �(110)and (111) peaks from the HAZ on heating over the entire period of the�! transformation. Each frame is 100 ms.
Figure 6TRXRD patterns of the -Fe phase in the HAZ on heating, from the start ofthe �! transformation to continued heating. For clarity, only every thirdframe of the 150 frames is plotted.
has been reproduced in three additional experimental runs at the
same location of the steel weld. The observed decrease in the (111)
d-spacing of the phase with increasing temperature is likely to arise
from a stress relief in the austenite induced in the phase transfor-
mation from a lower-density (b.c.c. at 7.789 gm ccÿ1) to a slightly
higher-density (f.c.c. at 7.862 gm ccÿ1) phase as estimated from the
measured lattice parameters. Finally, in the period t = 10.5±16 s, the
width of the (111) re¯ection increases (Fig. 7c), which indicates
dynamic disorder due to the Debye±Waller factor. With further
temperature rise in the HAZ beyond t = 16 s, annealing of the
multidomain phase microstructure may give rise to the observed
drop in width prior to the arc being turned off.4.2.3. The c! a transformation on cooling. Fig. 9 shows a frame-
by-frame plot of the TRXRD data in the time regime of the ! �transformation on cooling. At t = 25.0 s, the arc was turned off. The
existent phase cooled and transformed as the temperature was
lowered further. At t = 25.7 s, �-Fe ®rst appeared. At t = 26.1 s, -Fe
disappeared, marking the completion of the back transformation to
the ferrite phase. As can be clearly seen in Fig. 9, there are ®ve frames
of coexistence of the and � phases. Since the time resolution of each
frame is 0.1 s, the total time of the ! � transformation is 0.5 s,
which is twice as fast as the �! transformation on heating. The
results of pro®le analysis of this (111) re¯ection are given in
Figs. 10. On cooling from high temperatures immediately after the arc
was turned off, the peak intensity (Fig. 10a) of this re¯ection exhibits
a maximum value at t = 25.6 s, which indicates a gradual increase in
texturing of the pure- microstructure in the negative temperature±
time gradient. At t = 25.6 s, �-Fe appears, and the ! � transfor-
mation proceeds for the next 0.5 s, accompanied by a progressive
drop in the (111) intensity to zero on completion of the transfor-
mation. Within 0.2 s of power removal from the arc, the peak position
(Fig. 10b) shows a monotonic increase in 2� value, which indicates
thermal contraction of the f.c.c. lattice on cooling to the end of the
! � transformation at t = 26.1 s. Interestingly, the peak width
(Fig. 10c) increased immediately when the arc was turned off,
attaining a maximum value at t = 25.2 s, and then decreased mono-
tonically to the end of the transformation, which is indicative of
reduced dynamic disorder as the system undergoes the ! �transformation on cooling. The (200) re¯ection shows similar
variations in peak intensity and peak position on cooling but has a
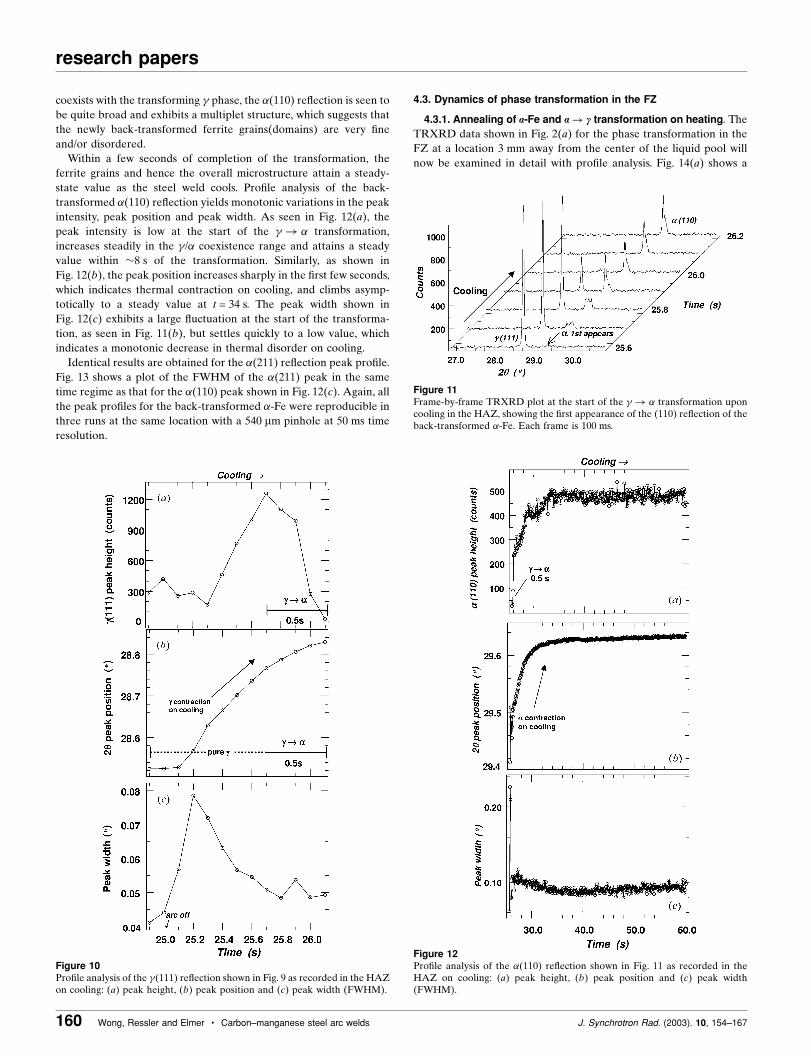
shorter data range, as is evident in Fig. 9.4.2.4. Back-transformed a-Fe on cooling. The frame-by-frame
diffraction events from the start to the end of the ! � transfor-
mation on cooling are given in Fig. 11. When �-Fe ®rst appears and
J. Synchrotron Rad. (2003). 10, 154±167 Wong, Ressler and Elmer � Carbon±manganese steel arc welds 159
research papers
Figure 9Frame-by-frame plot of the TRXRD patterns of the -Fe phase cooling in theHAZ, from the time of arc off to the end of the ! � transformation andbeyond.
Figure 7Pro®le analysis of the (111) re¯ection shown in Fig. 6 as recorded in the HAZon heating: (a) peak height, (b) peak position and (c) peak width (FWHM).
Figure 8Frame-by-frame plot of the TRXRD patterns in an enlarged 2� window of the (111) re¯ection showing the experimental jump in peak position uponheating in the HAZ.
research papers
160 Wong, Ressler and Elmer � Carbon±manganese steel arc welds J. Synchrotron Rad. (2003). 10, 154±167
coexists with the transforming phase, the �(110) re¯ection is seen to
be quite broad and exhibits a multiplet structure, which suggests that
the newly back-transformed ferrite grains(domains) are very ®ne
and/or disordered.
Within a few seconds of completion of the transformation, the
ferrite grains and hence the overall microstructure attain a steady-
state value as the steel weld cools. Pro®le analysis of the back-
transformed �(110) re¯ection yields monotonic variations in the peak
intensity, peak position and peak width. As seen in Fig. 12(a), the
peak intensity is low at the start of the ! � transformation,
increases steadily in the /� coexistence range and attains a steady
value within �8 s of the transformation. Similarly, as shown in
Fig. 12(b), the peak position increases sharply in the ®rst few seconds,
which indicates thermal contraction on cooling, and climbs asymp-
totically to a steady value at t = 34 s. The peak width shown in
Fig. 12(c) exhibits a large ¯uctuation at the start of the transforma-
tion, as seen in Fig. 11(b), but settles quickly to a low value, which
indicates a monotonic decrease in thermal disorder on cooling.
Identical results are obtained for the �(211) re¯ection peak pro®le.
Fig. 13 shows a plot of the FWHM of the �(211) peak in the same
time regime as that for the �(110) peak shown in Fig. 12(c). Again, all
the peak pro®les for the back-transformed �-Fe were reproducible in
three runs at the same location with a 540 mm pinhole at 50 ms time
resolution.
4.3. Dynamics of phase transformation in the FZ
4.3.1. Annealing of a-Fe and a! c transformation on heating. The
TRXRD data shown in Fig. 2(a) for the phase transformation in the
FZ at a location 3 mm away from the center of the liquid pool will
now be examined in detail with pro®le analysis. Fig. 14(a) shows a
Figure 11Frame-by-frame TRXRD plot at the start of the ! � transformation uponcooling in the HAZ, showing the ®rst appearance of the (110) re¯ection of theback-transformed �-Fe. Each frame is 100 ms.
Figure 10Pro®le analysis of the (111) re¯ection shown in Fig. 9 as recorded in the HAZon cooling: (a) peak height, (b) peak position and (c) peak width (FWHM).
Figure 12Pro®le analysis of the �(110) re¯ection shown in Fig. 11 as recorded in theHAZ on cooling: (a) peak height, (b) peak position and (c) peak width(FWHM).
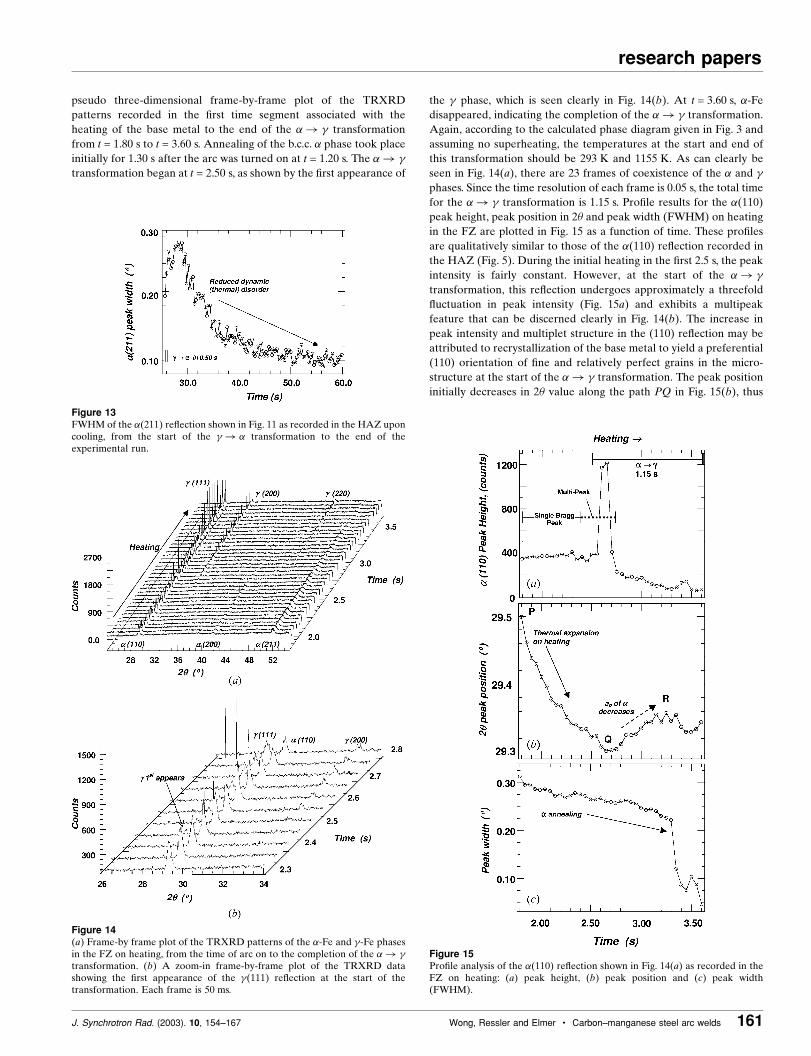
pseudo three-dimensional frame-by-frame plot of the TRXRD
patterns recorded in the ®rst time segment associated with the
heating of the base metal to the end of the �! transformation
from t = 1.80 s to t = 3.60 s. Annealing of the b.c.c. � phase took place
initially for 1.30 s after the arc was turned on at t = 1.20 s. The �! transformation began at t = 2.50 s, as shown by the ®rst appearance of
the phase, which is seen clearly in Fig. 14(b). At t = 3.60 s, �-Fe
disappeared, indicating the completion of the �! transformation.
Again, according to the calculated phase diagram given in Fig. 3 and
assuming no superheating, the temperatures at the start and end of
this transformation should be 293 K and 1155 K. As can clearly be
seen in Fig. 14(a), there are 23 frames of coexistence of the � and phases. Since the time resolution of each frame is 0.05 s, the total time
for the �! transformation is 1.15 s. Pro®le results for the �(110)
peak height, peak position in 2� and peak width (FWHM) on heating
in the FZ are plotted in Fig. 15 as a function of time. These pro®les
are qualitatively similar to those of the �(110) re¯ection recorded in
the HAZ (Fig. 5). During the initial heating in the ®rst 2.5 s, the peak
intensity is fairly constant. However, at the start of the �! transformation, this re¯ection undergoes approximately a threefold
¯uctuation in peak intensity (Fig. 15a) and exhibits a multipeak
feature that can be discerned clearly in Fig. 14(b). The increase in
peak intensity and multiplet structure in the (110) re¯ection may be
attributed to recrystallization of the base metal to yield a preferential
(110) orientation of ®ne and relatively perfect grains in the micro-
structure at the start of the �! transformation. The peak position
initially decreases in 2� value along the path PQ in Fig. 15(b), thus
J. Synchrotron Rad. (2003). 10, 154±167 Wong, Ressler and Elmer � Carbon±manganese steel arc welds 161
research papers
Figure 15Pro®le analysis of the �(110) re¯ection shown in Fig. 14(a) as recorded in theFZ on heating: (a) peak height, (b) peak position and (c) peak width(FWHM).
Figure 13FWHM of the �(211) re¯ection shown in Fig. 11 as recorded in the HAZ uponcooling, from the start of the ! � transformation to the end of theexperimental run.
Figure 14(a) Frame-by frame plot of the TRXRD patterns of the �-Fe and -Fe phasesin the FZ on heating, from the time of arc on to the completion of the �! transformation. (b) A zoom-in frame-by-frame plot of the TRXRD datashowing the ®rst appearance of the (111) re¯ection at the start of thetransformation. Each frame is 50 ms.
research papers
162 Wong, Ressler and Elmer � Carbon±manganese steel arc welds J. Synchrotron Rad. (2003). 10, 154±167
indicating thermal expansion of the ferrite lattice with increasing
temperature, in accordance with Bragg's law. Further heating along
QR shows an increase in 2� position similar to that observed in the
HAZ (Fig. 5b); this increase corresponds to a decrease in (110)-
spacing of the b.c.c. lattice. In contrast to the case in the HAZ, the
decrease in the (110)-spacing of the ferrite base metal with continuing
heating in the FZ occurs during the transformation instead of prior to
it. In Fig. 15(c), the width of the �(110) re¯ection exhibits a mono-
tonic decrease on heating from room temperature to well above the
start of the transformation, which indicates thermal annealing and the
relief of microstrain in the base metal with increasing temperature.
Above t = 3.30 s, the peak width drops steeply before the � phase
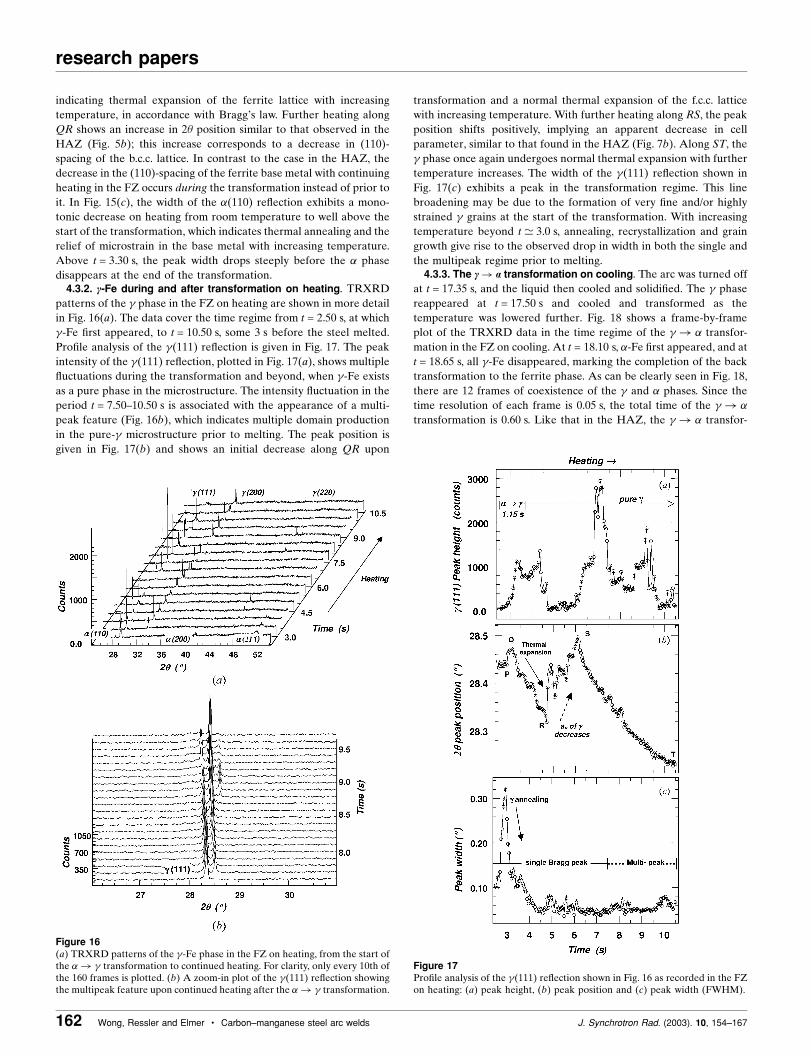
disappears at the end of the transformation.4.3.2. c-Fe during and after transformation on heating. TRXRD
patterns of the phase in the FZ on heating are shown in more detail
in Fig. 16(a). The data cover the time regime from t = 2.50 s, at which
-Fe ®rst appeared, to t = 10.50 s, some 3 s before the steel melted.
Pro®le analysis of the (111) re¯ection is given in Fig. 17. The peak
intensity of the (111) re¯ection, plotted in Fig. 17(a), shows multiple
¯uctuations during the transformation and beyond, when -Fe exists
as a pure phase in the microstructure. The intensity ¯uctuation in the
period t = 7.50±10.50 s is associated with the appearance of a multi-
peak feature (Fig. 16b), which indicates multiple domain production
in the pure- microstructure prior to melting. The peak position is
given in Fig. 17(b) and shows an initial decrease along QR upon
transformation and a normal thermal expansion of the f.c.c. lattice
with increasing temperature. With further heating along RS, the peak
position shifts positively, implying an apparent decrease in cell
parameter, similar to that found in the HAZ (Fig. 7b). Along ST, the
phase once again undergoes normal thermal expansion with further
temperature increases. The width of the (111) re¯ection shown in
Fig. 17(c) exhibits a peak in the transformation regime. This line
broadening may be due to the formation of very ®ne and/or highly
strained grains at the start of the transformation. With increasing
temperature beyond t ' 3.0 s, annealing, recrystallization and grain
growth give rise to the observed drop in width in both the single and
the multipeak regime prior to melting.4.3.3. The c! a transformation on cooling. The arc was turned off
at t = 17.35 s, and the liquid then cooled and solidi®ed. The phase
reappeared at t = 17.50 s and cooled and transformed as the
temperature was lowered further. Fig. 18 shows a frame-by-frame
plot of the TRXRD data in the time regime of the ! � transfor-
mation in the FZ on cooling. At t = 18.10 s, �-Fe ®rst appeared, and at
t = 18.65 s, all -Fe disappeared, marking the completion of the back
transformation to the ferrite phase. As can be clearly seen in Fig. 18,
there are 12 frames of coexistence of the and � phases. Since the
time resolution of each frame is 0.05 s, the total time of the ! �transformation is 0.60 s. Like that in the HAZ, the ! � transfor-
Figure 16(a) TRXRD patterns of the -Fe phase in the FZ on heating, from the start ofthe �! transformation to continued heating. For clarity, only every 10th ofthe 160 frames is plotted. (b) A zoom-in plot of the (111) re¯ection showingthe multipeak feature upon continued heating after the �! transformation.
Figure 17Pro®le analysis of the (111) re¯ection shown in Fig. 16 as recorded in the FZon heating: (a) peak height, (b) peak position and (c) peak width (FWHM).
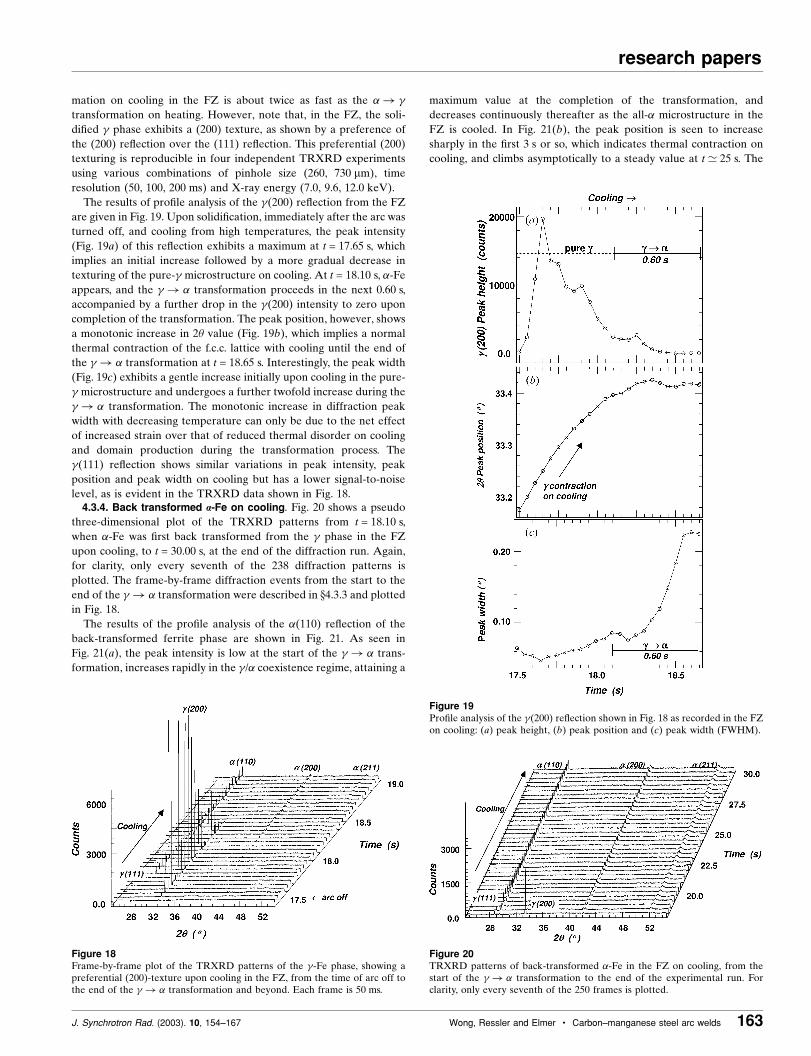
mation on cooling in the FZ is about twice as fast as the �! transformation on heating. However, note that, in the FZ, the soli-
di®ed phase exhibits a (200) texture, as shown by a preference of
the (200) re¯ection over the (111) re¯ection. This preferential (200)
texturing is reproducible in four independent TRXRD experiments
using various combinations of pinhole size (260, 730 mm), time
resolution (50, 100, 200 ms) and X-ray energy (7.0, 9.6, 12.0 keV).
The results of pro®le analysis of the (200) re¯ection from the FZ
are given in Fig. 19. Upon solidi®cation, immediately after the arc was
turned off, and cooling from high temperatures, the peak intensity
(Fig. 19a) of this re¯ection exhibits a maximum at t = 17.65 s, which
implies an initial increase followed by a more gradual decrease in
texturing of the pure- microstructure on cooling. At t = 18.10 s, �-Fe
appears, and the ! � transformation proceeds in the next 0.60 s,
accompanied by a further drop in the (200) intensity to zero upon
completion of the transformation. The peak position, however, shows
a monotonic increase in 2� value (Fig. 19b), which implies a normal
thermal contraction of the f.c.c. lattice with cooling until the end of
the ! � transformation at t = 18.65 s. Interestingly, the peak width
(Fig. 19c) exhibits a gentle increase initially upon cooling in the pure-
microstructure and undergoes a further twofold increase during the
! � transformation. The monotonic increase in diffraction peak
width with decreasing temperature can only be due to the net effect
of increased strain over that of reduced thermal disorder on cooling
and domain production during the transformation process. The
(111) re¯ection shows similar variations in peak intensity, peak
position and peak width on cooling but has a lower signal-to-noise
level, as is evident in the TRXRD data shown in Fig. 18.4.3.4. Back transformed a-Fe on cooling. Fig. 20 shows a pseudo
three-dimensional plot of the TRXRD patterns from t = 18.10 s,
when �-Fe was ®rst back transformed from the phase in the FZ
upon cooling, to t = 30.00 s, at the end of the diffraction run. Again,
for clarity, only every seventh of the 238 diffraction patterns is
plotted. The frame-by-frame diffraction events from the start to the
end of the ! � transformation were described in x4.3.3 and plotted
in Fig. 18.
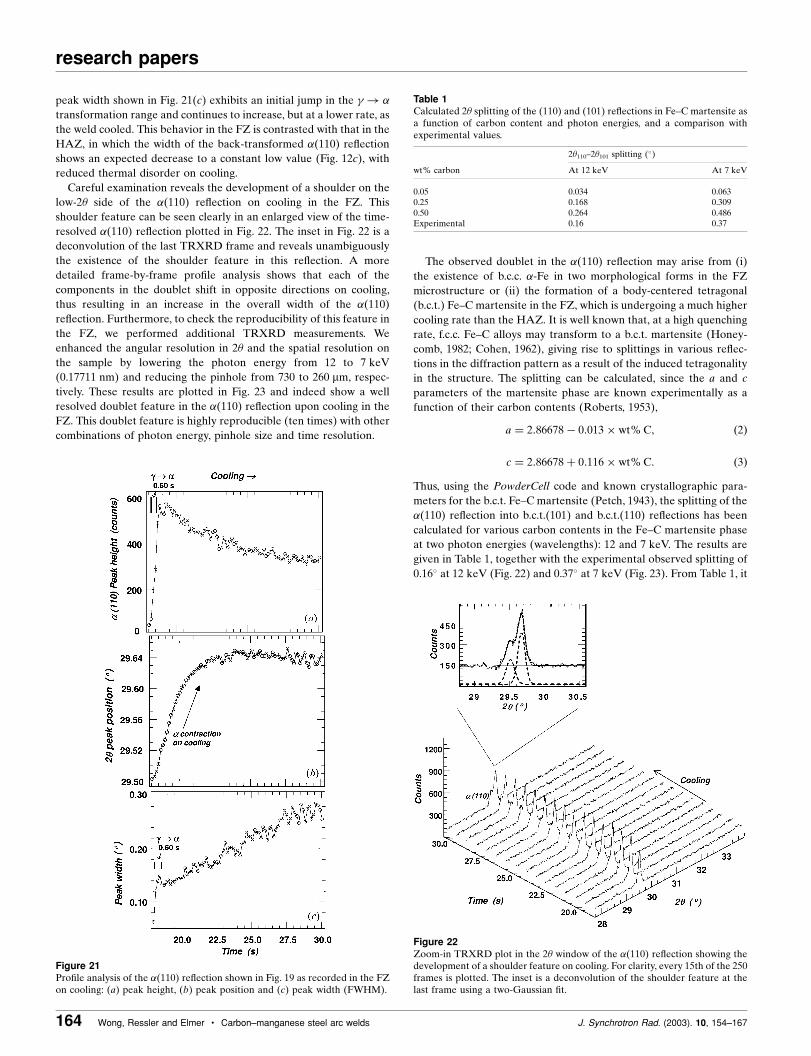
The results of the pro®le analysis of the �(110) re¯ection of the
back-transformed ferrite phase are shown in Fig. 21. As seen in
Fig. 21(a), the peak intensity is low at the start of the ! � trans-
formation, increases rapidly in the /� coexistence regime, attaining a
maximum value at the completion of the transformation, and
decreases continuously thereafter as the all-� microstructure in the
FZ is cooled. In Fig. 21(b), the peak position is seen to increase
sharply in the ®rst 3 s or so, which indicates thermal contraction on
cooling, and climbs asymptotically to a steady value at t ' 25 s. The
J. Synchrotron Rad. (2003). 10, 154±167 Wong, Ressler and Elmer � Carbon±manganese steel arc welds 163
research papers
Figure 18Frame-by-frame plot of the TRXRD patterns of the -Fe phase, showing apreferential (200)-texture upon cooling in the FZ, from the time of arc off tothe end of the ! � transformation and beyond. Each frame is 50 ms.
Figure 19Pro®le analysis of the (200) re¯ection shown in Fig. 18 as recorded in the FZon cooling: (a) peak height, (b) peak position and (c) peak width (FWHM).
Figure 20TRXRD patterns of back-transformed �-Fe in the FZ on cooling, from thestart of the ! � transformation to the end of the experimental run. Forclarity, only every seventh of the 250 frames is plotted.
research papers
164 Wong, Ressler and Elmer � Carbon±manganese steel arc welds J. Synchrotron Rad. (2003). 10, 154±167
peak width shown in Fig. 21(c) exhibits an initial jump in the ! �transformation range and continues to increase, but at a lower rate, as
the weld cooled. This behavior in the FZ is contrasted with that in the
HAZ, in which the width of the back-transformed �(110) re¯ection
shows an expected decrease to a constant low value (Fig. 12c), with
reduced thermal disorder on cooling.
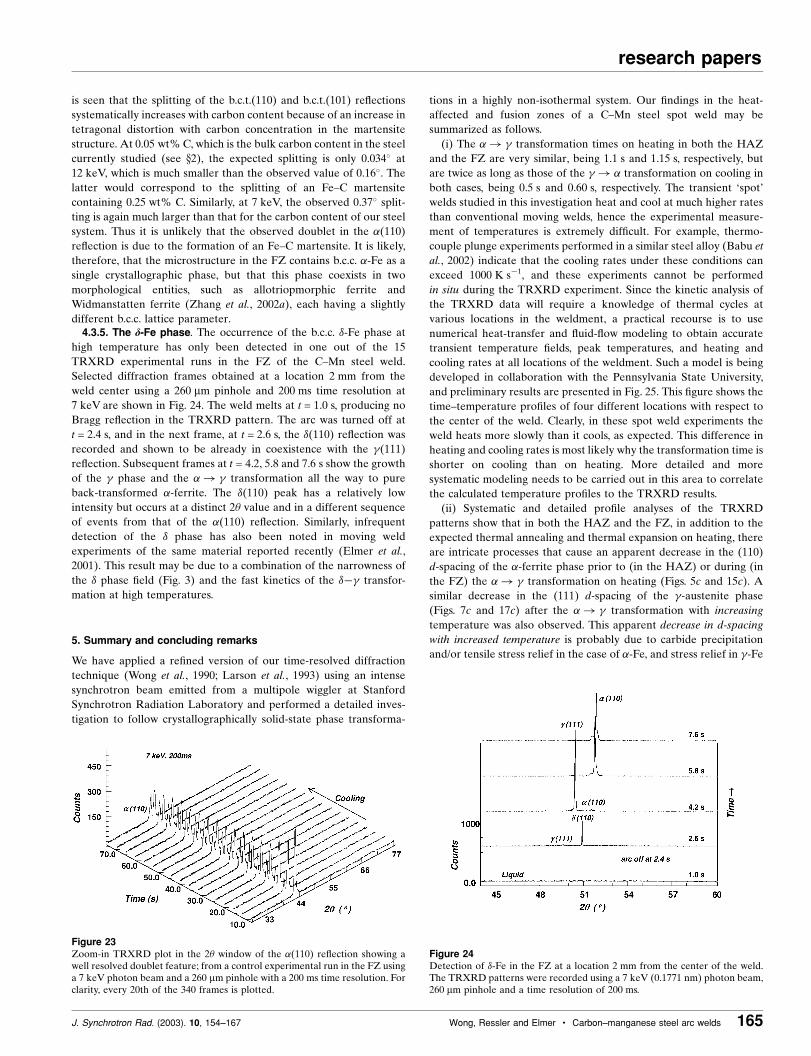
Careful examination reveals the development of a shoulder on the
low-2� side of the �(110) re¯ection on cooling in the FZ. This
shoulder feature can be seen clearly in an enlarged view of the time-
resolved �(110) re¯ection plotted in Fig. 22. The inset in Fig. 22 is a
deconvolution of the last TRXRD frame and reveals unambiguously
the existence of the shoulder feature in this re¯ection. A more
detailed frame-by-frame pro®le analysis shows that each of the
components in the doublet shift in opposite directions on cooling,
thus resulting in an increase in the overall width of the �(110)
re¯ection. Furthermore, to check the reproducibility of this feature in
the FZ, we performed additional TRXRD measurements. We
enhanced the angular resolution in 2� and the spatial resolution on
the sample by lowering the photon energy from 12 to 7 keV
(0.17711 nm) and reducing the pinhole from 730 to 260 mm, respec-
tively. These results are plotted in Fig. 23 and indeed show a well
resolved doublet feature in the �(110) re¯ection upon cooling in the
FZ. This doublet feature is highly reproducible (ten times) with other
combinations of photon energy, pinhole size and time resolution.
The observed doublet in the �(110) re¯ection may arise from (i)
the existence of b.c.c. �-Fe in two morphological forms in the FZ
microstructure or (ii) the formation of a body-centered tetragonal
(b.c.t.) Fe±C martensite in the FZ, which is undergoing a much higher
cooling rate than the HAZ. It is well known that, at a high quenching
rate, f.c.c. Fe±C alloys may transform to a b.c.t. martensite (Honey-
comb, 1982; Cohen, 1962), giving rise to splittings in various re¯ec-
tions in the diffraction pattern as a result of the induced tetragonality
in the structure. The splitting can be calculated, since the a and c
parameters of the martensite phase are known experimentally as a
function of their carbon contents (Roberts, 1953),
a � 2:86678ÿ 0:013� wt% C; �2�
c � 2:86678� 0:116� wt% C: �3�Thus, using the PowderCell code and known crystallographic para-
meters for the b.c.t. Fe±C martensite (Petch, 1943), the splitting of the
�(110) re¯ection into b.c.t.(101) and b.c.t.(110) re¯ections has been
calculated for various carbon contents in the Fe±C martensite phase
at two photon energies (wavelengths): 12 and 7 keV. The results are
given in Table 1, together with the experimental observed splitting of
0.16� at 12 keV (Fig. 22) and 0.37� at 7 keV (Fig. 23). From Table 1, it
Figure 21Pro®le analysis of the �(110) re¯ection shown in Fig. 19 as recorded in the FZon cooling: (a) peak height, (b) peak position and (c) peak width (FWHM).
Figure 22Zoom-in TRXRD plot in the 2� window of the �(110) re¯ection showing thedevelopment of a shoulder feature on cooling. For clarity, every 15th of the 250frames is plotted. The inset is a deconvolution of the shoulder feature at thelast frame using a two-Gaussian ®t.
Table 1Calculated 2� splitting of the (110) and (101) re¯ections in Fe±C martensite asa function of carbon content and photon energies, and a comparison withexperimental values.
2�110±2�101 splitting (�)
wt% carbon At 12 keV At 7 keV
0.05 0.034 0.0630.25 0.168 0.3090.50 0.264 0.486Experimental 0.16 0.37
is seen that the splitting of the b.c.t.(110) and b.c.t.(101) re¯ections
systematically increases with carbon content because of an increase in
tetragonal distortion with carbon concentration in the martensite
structure. At 0.05 wt% C, which is the bulk carbon content in the steel
currently studied (see x2), the expected splitting is only 0.034� at
12 keV, which is much smaller than the observed value of 0.16�. The
latter would correspond to the splitting of an Fe±C martensite
containing 0.25 wt% C. Similarly, at 7 keV, the observed 0.37� split-
ting is again much larger than that for the carbon content of our steel
system. Thus it is unlikely that the observed doublet in the �(110)
re¯ection is due to the formation of an Fe±C martensite. It is likely,
therefore, that the microstructure in the FZ contains b.c.c. �-Fe as a
single crystallographic phase, but that this phase coexists in two
morphological entities, such as allotriopmorphic ferrite and
Widmanstatten ferrite (Zhang et al., 2002a), each having a slightly
different b.c.c. lattice parameter.4.3.5. The d-Fe phase. The occurrence of the b.c.c. �-Fe phase at
high temperature has only been detected in one out of the 15
TRXRD experimental runs in the FZ of the C±Mn steel weld.
Selected diffraction frames obtained at a location 2 mm from the
weld center using a 260 mm pinhole and 200 ms time resolution at
7 keV are shown in Fig. 24. The weld melts at t = 1.0 s, producing no
Bragg re¯ection in the TRXRD pattern. The arc was turned off at
t = 2.4 s, and in the next frame, at t = 2.6 s, the �(110) re¯ection was
recorded and shown to be already in coexistence with the (111)
re¯ection. Subsequent frames at t = 4.2, 5.8 and 7.6 s show the growth
of the phase and the �! transformation all the way to pure
back-transformed �-ferrite. The �(110) peak has a relatively low
intensity but occurs at a distinct 2� value and in a different sequence
of events from that of the �(110) re¯ection. Similarly, infrequent
detection of the � phase has also been noted in moving weld
experiments of the same material reported recently (Elmer et al.,
2001). This result may be due to a combination of the narrowness of
the � phase ®eld (Fig. 3) and the fast kinetics of the �ÿ transfor-
mation at high temperatures.
5. Summary and concluding remarks
We have applied a re®ned version of our time-resolved diffraction
technique (Wong et al., 1990; Larson et al., 1993) using an intense
synchrotron beam emitted from a multipole wiggler at Stanford
Synchrotron Radiation Laboratory and performed a detailed inves-
tigation to follow crystallographically solid-state phase transforma-
tions in a highly non-isothermal system. Our ®ndings in the heat-
affected and fusion zones of a C±Mn steel spot weld may be
summarized as follows.
(i) The �! transformation times on heating in both the HAZ
and the FZ are very similar, being 1.1 s and 1.15 s, respectively, but
are twice as long as those of the ! � transformation on cooling in
both cases, being 0.5 s and 0.60 s, respectively. The transient `spot'
welds studied in this investigation heat and cool at much higher rates
than conventional moving welds, hence the experimental measure-
ment of temperatures is extremely dif®cult. For example, thermo-
couple plunge experiments performed in a similar steel alloy (Babu et
al., 2002) indicate that the cooling rates under these conditions can
exceed 1000 K sÿ1, and these experiments cannot be performed
in situ during the TRXRD experiment. Since the kinetic analysis of
the TRXRD data will require a knowledge of thermal cycles at
various locations in the weldment, a practical recourse is to use
numerical heat-transfer and ¯uid-¯ow modeling to obtain accurate
transient temperature ®elds, peak temperatures, and heating and
cooling rates at all locations of the weldment. Such a model is being
developed in collaboration with the Pennsylvania State University,
and preliminary results are presented in Fig. 25. This ®gure shows the
time±temperature pro®les of four different locations with respect to
the center of the weld. Clearly, in these spot weld experiments the
weld heats more slowly than it cools, as expected. This difference in
heating and cooling rates is most likely why the transformation time is
shorter on cooling than on heating. More detailed and more
systematic modeling needs to be carried out in this area to correlate
the calculated temperature pro®les to the TRXRD results.
(ii) Systematic and detailed pro®le analyses of the TRXRD
patterns show that in both the HAZ and the FZ, in addition to the
expected thermal annealing and thermal expansion on heating, there
are intricate processes that cause an apparent decrease in the (110)
d-spacing of the �-ferrite phase prior to (in the HAZ) or during (in
the FZ) the �! transformation on heating (Figs. 5c and 15c). A
similar decrease in the (111) d-spacing of the -austenite phase
(Figs. 7c and 17c) after the �! transformation with increasing
temperature was also observed. This apparent decrease in d-spacing
with increased temperature is probably due to carbide precipitation
and/or tensile stress relief in the case of �-Fe, and stress relief in -Fe
J. Synchrotron Rad. (2003). 10, 154±167 Wong, Ressler and Elmer � Carbon±manganese steel arc welds 165
research papers
Figure 23Zoom-in TRXRD plot in the 2� window of the �(110) re¯ection showing awell resolved doublet feature; from a control experimental run in the FZ usinga 7 keV photon beam and a 260 mm pinhole with a 200 ms time resolution. Forclarity, every 20th of the 340 frames is plotted.
Figure 24Detection of �-Fe in the FZ at a location 2 mm from the center of the weld.The TRXRD patterns were recorded using a 7 keV (0.1771 nm) photon beam,260 mm pinhole and a time resolution of 200 ms.
research papers
166 Wong, Ressler and Elmer � Carbon±manganese steel arc welds J. Synchrotron Rad. (2003). 10, 154±167
resulted in a phase transformation from a lower-density (b.c.c. at
7.789 gm ccÿ1) to a slightly higher-density (f.c.c. at 7.862 gm ccÿ1)
phase.
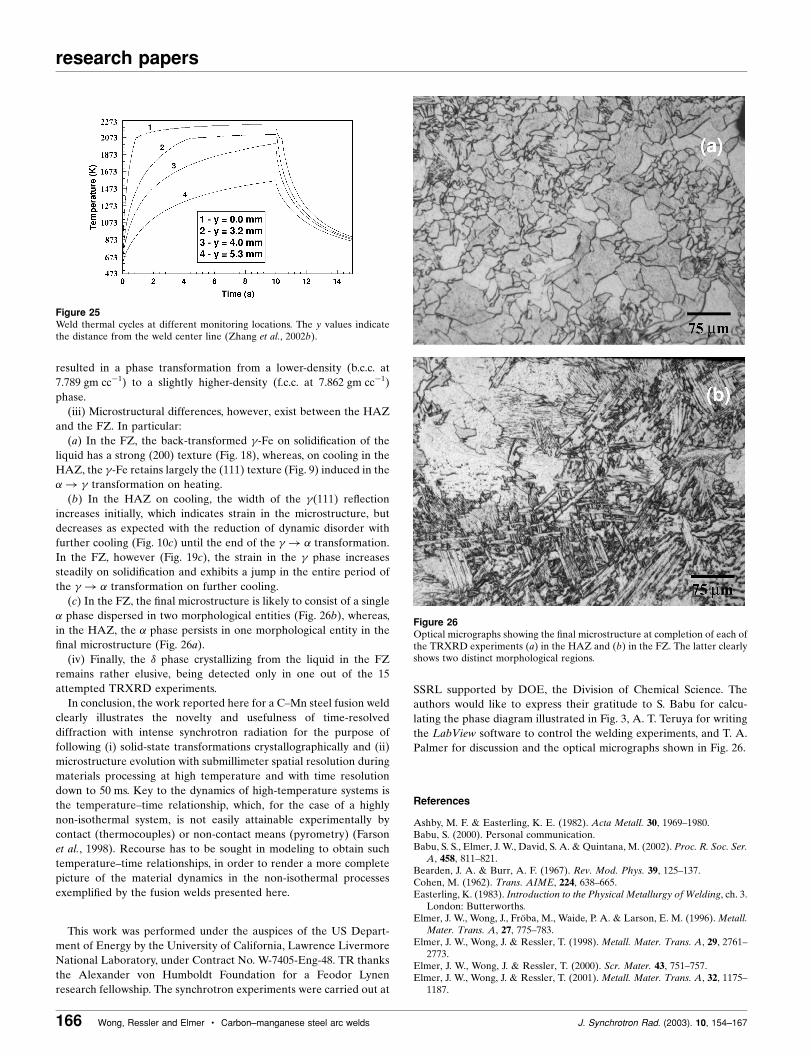
(iii) Microstructural differences, however, exist between the HAZ
and the FZ. In particular:
(a) In the FZ, the back-transformed -Fe on solidi®cation of the
liquid has a strong (200) texture (Fig. 18), whereas, on cooling in the
HAZ, the -Fe retains largely the (111) texture (Fig. 9) induced in the
�! transformation on heating.
(b) In the HAZ on cooling, the width of the (111) re¯ection
increases initially, which indicates strain in the microstructure, but
decreases as expected with the reduction of dynamic disorder with
further cooling (Fig. 10c) until the end of the ! � transformation.
In the FZ, however (Fig. 19c), the strain in the phase increases
steadily on solidi®cation and exhibits a jump in the entire period of
the ! � transformation on further cooling.
(c) In the FZ, the ®nal microstructure is likely to consist of a single
� phase dispersed in two morphological entities (Fig. 26b), whereas,
in the HAZ, the � phase persists in one morphological entity in the
®nal microstructure (Fig. 26a).
(iv) Finally, the � phase crystallizing from the liquid in the FZ
remains rather elusive, being detected only in one out of the 15
attempted TRXRD experiments.
In conclusion, the work reported here for a C±Mn steel fusion weld
clearly illustrates the novelty and usefulness of time-resolved
diffraction with intense synchrotron radiation for the purpose of
following (i) solid-state transformations crystallographically and (ii)
microstructure evolution with submillimeter spatial resolution during
materials processing at high temperature and with time resolution
down to 50 ms. Key to the dynamics of high-temperature systems is
the temperature±time relationship, which, for the case of a highly
non-isothermal system, is not easily attainable experimentally by
contact (thermocouples) or non-contact means (pyrometry) (Farson
et al., 1998). Recourse has to be sought in modeling to obtain such
temperature±time relationships, in order to render a more complete
picture of the material dynamics in the non-isothermal processes
exempli®ed by the fusion welds presented here.
This work was performed under the auspices of the US Depart-
ment of Energy by the University of California, Lawrence Livermore
National Laboratory, under Contract No. W-7405-Eng-48. TR thanks
the Alexander von Humboldt Foundation for a Feodor Lynen
research fellowship. The synchrotron experiments were carried out at
SSRL supported by DOE, the Division of Chemical Science. The
authors would like to express their gratitude to S. Babu for calcu-
lating the phase diagram illustrated in Fig. 3, A. T. Teruya for writing
the LabView software to control the welding experiments, and T. A.
Palmer for discussion and the optical micrographs shown in Fig. 26.
References
Ashby, M. F. & Easterling, K. E. (1982). Acta Metall. 30, 1969±1980.Babu, S. (2000). Personal communication.Babu, S. S., Elmer, J. W., David, S. A. & Quintana, M. (2002). Proc. R. Soc. Ser.
A, 458, 811±821.Bearden, J. A. & Burr, A. F. (1967). Rev. Mod. Phys. 39, 125±137.Cohen, M. (1962). Trans. AIME, 224, 638±665.Easterling, K. (1983). Introduction to the Physical Metallurgy of Welding, ch. 3.
London: Butterworths.Elmer, J. W., Wong, J., FroÈ ba, M., Waide, P. A. & Larson, E. M. (1996). Metall.
Mater. Trans. A, 27, 775±783.Elmer, J. W., Wong, J. & Ressler, T. (1998). Metall. Mater. Trans. A, 29, 2761±
2773.Elmer, J. W., Wong, J. & Ressler, T. (2000). Scr. Mater. 43, 751±757.Elmer, J. W., Wong, J. & Ressler, T. (2001). Metall. Mater. Trans. A, 32, 1175±
1187.
Figure 26Optical micrographs showing the ®nal microstructure at completion of each ofthe TRXRD experiments (a) in the HAZ and (b) in the FZ. The latter clearlyshows two distinct morphological regions.
Figure 25Weld thermal cycles at different monitoring locations. The y values indicatethe distance from the weld center line (Zhang et al., 2002b).

Farson, D., Richardson, R. & Li, X. (1998). Welding J. 77, 396s±401s.Grong, é. (1994). Metallurgical Modelling of Welding, ch. 1. London: Institute
of Materials.Harrison, P. L. & Farrar, R. A. (1989). Int. Mater. Rev. 34, 35.Honeycomb, R. W. K. (1982). Steels, Microstructure and Properties, ch. 1.
Materials Park, OH: ASM.Ion, J. C., Easterling, K. E. & Ashby, M. F. (1984). Acta Metall. 32, 1949.Karpenko, V., Kinney, J. H., Kulkarni, S., Neufeld, K., Poppe, C., Tirsell, K. G.,
Wong, J., Cerino, J., Troxel, T., Yang, J., Hoyer, E., Green, M., Humpries, D.,Marks, S. & Plate, D. (1989). Rev. Sci. Instrum. 60, 1451±1460.
Larson, E. M., Wong, J., Holt, J. B., Waide, P., Rupp, B. & Terminello, L. (1993).J. Mater. Res. 8, 1533±1541.
Mundra, K., DebRoy, T., Babu, S. S. & David, S. A. (1997). Welding J. 76, 163s±172s.
Palmer, T. A., Elmer, J. W. & Wong, J. (2001). Sci. Tech. Welding Joining, 7(3),159±171.
Petch, N. J. (1943). J. Iron Steels Inst. 147, 221.Ressler, T. (1997). J. Phys IV, 7, 269±272.Ressler, T., Wong, J. & Elmer, J. W. (1998). J. Phys. Chem. B102, 10724±10735.
Roberts, C. S. (1953). Trans. AIME, 197, 203±215.ST121 Detector & Controller Manual (1996). Princeton Instruments Reviews B.
3660 Quakerbridge Road, Trenton, NJ 08619, USA.Sundman, B., Jansson, B. & Andersson, J. (1985). Calphad, 9, 153±170.Vander Voort, G. F. (1991). Atlas of Time±Temperature Diagrams for Irons
and Steels. Cleveland, OH: ASM International.Wong, J., Elmer, J., Waide, P. & Larson, E. M. (1994). Adv. X-ray Anal. 37,
479±485.Wong, J., FroÈ ba, M., Elmer, J. W., Waide, P. A. & Larson, E. J. (1997). Mater.
Sci. 32, 1493±1500.Wong, J., Larson, E., Holt, J., Waide, P., Rupp, B. & Frahm, R. (1990). Science,
249, 1906±1909.Wychoff, R. W. G. (1963). Crystal Structure, Vol. 1, p. 16. New York: John
Wiley and Son.Yang, Z. & DebRoy, T. (1997). Sci. Technol. Welding Joining, 2, 1±6.Yang, Z. & DebRoy, T. (1999). Metall. Mater. Trans. B, 30, 483±489.Yang, Z., Elmer, J. W., Wong, J. & DebRoy, T. (2000). Welding J. 79, 97s±112s.Zhang, W., Elmer, J. W. & DebRoy, T. (2002a). Mater. Sci. Eng. 333, 321±335.Zhang, W., Elmer, J. W. & DebRoy, T. (2002b). Personal communication.
J. Synchrotron Rad. (2003). 10, 154±167 Received 2 April 2002 � Accepted 6 November 2002 167
research papers
Copyright © 2022 FDOKUMEN