Dynamics of HIV-1 mRNA expression in patients with long-term nonprogressive HIV-1 infection
11
HIV Gene Expression in Long-term Nonprogressives 893 J. Clin. Invest. © The American Society for Clinical Investigation, Inc. 0021-9738/97/08/0893/11 $2.00 Volume 100, Number 4, August 1997, 893–903 http://www.jci.org Dynamics of HIV-1 mRNA Expression in Patients with Long-term Nonprogressive HIV-1 Infection Manola Comar,* Cecilia Simonelli, ‡ Stefania Zanussi, § Paolo de Paoli, § Emanuela Vaccher, ‡ Umberto Tirelli, ‡ and Mauro Giacca* *Molecular Medicine Unit, International Centre for Genetic Engineering and Biotechnology, 34100 Trieste, Italy; and ‡ Division of Medical Oncology and AIDS, and § Division of Microbiology-Immunology-Virology, Centro di Riferimento Oncologico, 33081 Aviano, Italy Abstract A large number of evidences indicate that progression of HIV disease is driven by an increase in viral burden. It is still unclear, however, to what extent this is contributed by the dysregulation of the molecular mechanisms governing virus gene expression at the transcriptional or posttran- scriptional levels. To address this issue, several quantitative virologic pa- rameters (including provirus transcriptional activity and splicing pattern) were analyzed in individuals with nonpro- gressive HIV infection and compared with those of a matched group of progressor patients. Exact quantification was achieved by a competitive PCR procedure using a mul- ticompetitor template. Nonprogressors were characterized by striking differ- ences in the levels of viremia, provirus copy number, and overall levels of all viral mRNA classes in peripheral blood mononuclear cells. Additionally, the transcriptional activity of the proviral DNA in these patients was mainly engaged in the production of multiprocessed transcripts, with a pattern resembling the early phases of the experimental infection. Taken together, these results show that both viral load and provirus transcription pattern are remarkably different in infected individuals nonprogressing toward overt disease, and further support the notion that disease progression is accompanied by a change in the kinetics of HIV gene ex- pression. (J. Clin. Invest. 1997. 100:893–903.) Key words: provirus • transcription • acquired immunodeficiency syn- drome • competitive polymerase chain reaction • pathogenesis Introduction During the natural history of clinical HIV infection, progres- sion of the disease is paralleled by an increase of the amounts of infectious virus, viral antigens, and virus-specific nucleic ac- ids in the patients. In general agreement with this notion are a number of studies that measured the viral load in serum by quantitative virus culture or quantitative polymerase chain re- action, the number of infected cells in peripheral blood and lymph nodes by PCR or by in situ methods, and the levels of HIV antigenemia by immunologic procedures (1–12). In particular, the study of virus-specific mRNAs in periph- eral blood mononuclear cells (PBMCs) 1 by reverse tran- scriptase-PCR (RT-PCR) led to the conclusion that a strong correlation exists between cellular HIV mRNA levels and the clinical course of the disease (9, 13–15), often independently of CD41 counts and clinical staging (16). Despite the overall agreement on these observations, it is still not clear whether the increased presence of virus-specific mRNAs in lymphoid cells of advanced stage infected patients reflects an increased expression rate of the provirus, as suggested by some observa- tions (2, 9), or merely the expansion of the pool of infected cells (14). In fact, while a number of evidences clearly indicate the existence of a true latency state of viral gene expression in experimental settings (17–19), it is still debatable whether a role for latency exists in controlling the progression of the clin- ical infection (20–22). Similarly, it is still not clear what is the role of the regula- tion of posttranscriptional processing of HIV-1 mRNAs in the progression of the disease. In HIV-1–infected cells, . 20 dif- ferent viral mRNAs are synthesized, deriving from a single full length messenger by multiple alternative splicing events (23, 24). Either during the infection of susceptible cell cultures (25, 26) or in cellular systems in which transcription is inducible (17, 18), a temporal regulation of the synthesis of these tran- scripts is detectable: initially, short transcripts are prevalent, encoding for regulatory proteins; subsequently, intermediate mRNAs (mostly coding for the Env proteins) and unspliced mRNA (Gag/Pol and viral genome) accumulate. These experimental observations suggested that the pat- tern of production of viral transcripts could be linked to the development of infection also in vivo and could represent a marker of disease progression (27). However, controversial re- sults have been obtained by measuring transcript classes in in- fected individuals: the finding that multispliced RNAs could be prevalent at early times of the disease while unspliced RNAs could predominate at later times, similar to the in vitro infection (6, 9, 15, 28, 29), has been questioned by other studies showing instead direct correlation between the two mRNA species during the whole course of the disease (13, 16). Some of the still unresolved issues (and discrepancies) in the results obtained by the above mentioned studies are possibly due to the different methods used for the quantification of HIV nu- cleic acids in infected samples. In fact, these measurements are often possibly hindered by the poor quantitative outcome of conventional PCR amplification. Address correspondence to Dr. Mauro Giacca, Head, Molecular and Cellular Biology, ICGEB, Padriciano, 99, 34012 Trieste, Italy. Phone: 39-40-3757.324; FAX: 39-40-226555; E-mail: [email protected] Received for publication 6 February 1997 and accepted in revised form 19 May 1997. 1. Abbreviations used in this paper: LTNP, long-term nonprogressor; PBMC, peripheral blood mononuclear cell; RT-PCR, reverse tran- scriptase–PCR.
-
Upload
independent -
Category
Documents
-
view
0 -
download
0
Transcript of Dynamics of HIV-1 mRNA expression in patients with long-term nonprogressive HIV-1 infection

HIV Gene Expression in Long-term Nonprogressives
893
J. Clin. Invest.© The American Society for Clinical Investigation, Inc.0021-9738/97/08/0893/11 $2.00Volume 100, Number 4, August 1997, 893–903http://www.jci.org
Dynamics of HIV-1 mRNA Expression in Patients with Long-term Nonprogressive HIV-1 Infection
Manola Comar,* Cecilia Simonelli,
‡
Stefania Zanussi,
§
Paolo de Paoli,
§
Emanuela Vaccher,
‡
Umberto Tirelli,
‡
and Mauro Giacca*
*
Molecular Medicine Unit, International Centre for Genetic Engineering and Biotechnology, 34100 Trieste, Italy; and
‡
Division of Medical Oncology and AIDS, and
§
Division of Microbiology-Immunology-Virology, Centro di Riferimento Oncologico, 33081 Aviano, Italy
Abstract
A large number of evidences indicate that progression ofHIV disease is driven by an increase in viral burden. It isstill unclear, however, to what extent this is contributed bythe dysregulation of the molecular mechanisms governingvirus gene expression at the transcriptional or posttran-scriptional levels.
To address this issue, several quantitative virologic pa-rameters (including provirus transcriptional activity andsplicing pattern) were analyzed in individuals with nonpro-gressive HIV infection and compared with those of amatched group of progressor patients. Exact quantificationwas achieved by a competitive PCR procedure using a mul-ticompetitor template.
Nonprogressors were characterized by striking differ-ences in the levels of viremia, provirus copy number, andoverall levels of all viral mRNA classes in peripheral bloodmononuclear cells. Additionally, the transcriptional activityof the proviral DNA in these patients was mainly engaged inthe production of multiprocessed transcripts, with a patternresembling the early phases of the experimental infection.
Taken together, these results show that both viral loadand provirus transcription pattern are remarkably differentin infected individuals nonprogressing toward overt disease,and further support the notion that disease progression isaccompanied by a change in the kinetics of HIV gene ex-pression. (
J. Clin. Invest.
1997. 100:893–903.) Key words:provirus
•
transcription
•
acquired immunodeficiency syn-drome
•
competitive polymerase chain reaction
•
pathogenesis
Introduction
During the natural history of clinical HIV infection, progres-sion of the disease is paralleled by an increase of the amountsof infectious virus, viral antigens, and virus-specific nucleic ac-ids in the patients. In general agreement with this notion are anumber of studies that measured the viral load in serum byquantitative virus culture or quantitative polymerase chain re-action, the number of infected cells in peripheral blood and
lymph nodes by PCR or by in situ methods, and the levels ofHIV antigenemia by immunologic procedures (1–12).
In particular, the study of virus-specific mRNAs in periph-eral blood mononuclear cells (PBMCs)
1
by reverse tran-scriptase-PCR (RT-PCR) led to the conclusion that a strongcorrelation exists between cellular HIV mRNA levels and theclinical course of the disease (9, 13–15), often independently ofCD4
1
counts and clinical staging (16). Despite the overallagreement on these observations, it is still not clear whetherthe increased presence of virus-specific mRNAs in lymphoidcells of advanced stage infected patients reflects an increasedexpression rate of the provirus, as suggested by some observa-tions (2, 9), or merely the expansion of the pool of infectedcells (14). In fact, while a number of evidences clearly indicatethe existence of a true latency state of viral gene expression inexperimental settings (17–19), it is still debatable whether arole for latency exists in controlling the progression of the clin-ical infection (20–22).
Similarly, it is still not clear what is the role of the regula-tion of posttranscriptional processing of HIV-1 mRNAs in theprogression of the disease. In HIV-1–infected cells,
.
20 dif-ferent viral mRNAs are synthesized, deriving from a single fulllength messenger by multiple alternative splicing events (23,24). Either during the infection of susceptible cell cultures (25,26) or in cellular systems in which transcription is inducible(17, 18), a temporal regulation of the synthesis of these tran-scripts is detectable: initially, short transcripts are prevalent,encoding for regulatory proteins; subsequently, intermediatemRNAs (mostly coding for the
Env
proteins) and unsplicedmRNA (
Gag
/
Pol
and viral genome) accumulate.These experimental observations suggested that the pat-
tern of production of viral transcripts could be linked to thedevelopment of infection also in vivo and could represent amarker of disease progression (27). However, controversial re-sults have been obtained by measuring transcript classes in in-fected individuals: the finding that multispliced RNAs couldbe prevalent at early times of the disease while unsplicedRNAs could predominate at later times, similar to the in vitroinfection (6, 9, 15, 28, 29), has been questioned by other studiesshowing instead direct correlation between the two mRNAspecies during the whole course of the disease (13, 16). Someof the still unresolved issues (and discrepancies) in the resultsobtained by the above mentioned studies are possibly due tothe different methods used for the quantification of HIV nu-cleic acids in infected samples. In fact, these measurements areoften possibly hindered by the poor quantitative outcome ofconventional PCR amplification.
Address correspondence to Dr. Mauro Giacca, Head, Molecular andCellular Biology, ICGEB, Padriciano, 99, 34012 Trieste, Italy. Phone:39-40-3757.324; FAX: 39-40-226555; E-mail: [email protected]
Received for publication 6 February 1997 and accepted in revisedform 19 May 1997.
1.
Abbreviations used in this paper:
LTNP, long-term nonprogressor;PBMC, peripheral blood mononuclear cell; RT-PCR, reverse tran-scriptase–PCR.
894
Comar et al.
In recent years, we have developed and extensively applieda competitive PCR technology for the exact quantitation oflow abundance nucleic acids in clinical samples (30–35), in-cluding HIV DNA and RNA in different clinical settings (36–41). Competitive PCR and RT-PCR (using internal DNA andRNA competitors, respectively) couple the sensitivity of con-ventional PCR to the accuracy that is necessary for the exactquantification of the target molecules, irrespective of samplenucleic acid purity, primer pair efficiency and specificity, oramplification kinetics profile. In particular, we have recentlydeveloped a multicompetitive procedure for the quantificationof several virologic parameters in samples from HIV-infectedpatients, including viremia, levels of provirus DNA, and differ-ent classes of HIV mRNAs in infected cells (37). This proce-dure also allows the exact standardization of the proviral DNAlevels to the copy number of the
b
-globin gene, and those ofthe viral mRNAs to the levels of the ubiquitously expressed
b
-actin gene mRNA. To understand the role of the regulation of virus gene ex-
pression in the progression of the disease, we have now deter-mined the above mentioned quantitative virologic parametersin 11 patients with nonprogressive HIV infection. These pa-tients fit the definition of long term nonprogressors (LTNPs),as they belong to the small subset of HIV-1–infected persons(5–8% of the total) who tolerate infection without immuno-suppression of disease for prolonged periods (42–47). Thestudy of the immunologic features of these individuals and ofthe properties of their viral strains holds great promise for theunderstanding of the cellular and molecular correlates that de-
termine disease progression. In occasional cases, defective vi-ruses have been detected from LTNPs (48, 49); in other stud-ies, these individuals were found to be characterized by thepresence of robust cellular and humoral immune responsesagainst HIV (50–53). In all cases, the most prominent featureof these individuals is the presence of a highly diminished viralload.
At present, the kinetics of replication of HIV-1 in the lym-phoid cells of these individuals, with particular reference to themechanisms controlling virus gene expression at the transcrip-tional and posttranscriptional levels, is still unexplored.
Methods
Patients.
HIV-1–infected individuals were selected among the pa-tients followed at the Division of Medical Oncology and AIDS, Cen-tro di Riferimento Oncologico. LTNP patients were defined as indi-viduals having documented HIV-1 infection for
$
7 yr, CD4
1
cellcounts of
.
500 cells/mm
3
and/or
.
30%, without any decline
.
15%during this time period, and no symptoms related to HIV-1 infection.None of these patients had ever received antiretroviral therapy. Ofthe 11 LTNPs included in this study, 9 had been infected for
$
9 yr(Table I). The LTNP group was contrasted with a matched group ofimmunologic progressors, defined as patients having documentedHIV-1 infection for
$
7 yr, with a CD4
1
cell count
$
500/mm
3
and/or
.
30% at the time of diagnosis and with the occurrence of an AIDS-defining condition not before 7 yr from this time. These patients didnot receive antiretroviral therapy for at least 4 wk before sampling.The disease stage and the CD4
1
cell counts of these patients at thetime of the study are shown in Table I.
Table I. Clinical and Laboratory Characteristics of the Patients Included in the Study
Patient Age (yr) Sex Route of infection No. of CD4 cells/mm
3
No. of years infected HIV disease stage p24 antigen (pg/ml)
N1 37 F IVDU 538 10 A1 NSN2 25 F IVDU 1819 7 A1 NSN3 32 F Hetero 946 9 A1 NSN4 31 M IVDU 838 9 A1 NSN5 35 M IVDU 740 10 A1 NSN6 36 M Homo 673 7 A1 NSN7 29 M IVDU 685 9 A1 NSN8 35 F Hetero 611 10 A1 NSN9 34 M IVDU 858 9 A1 NSN10 31 M IVDU 900 10 A1 NSN11 34 M IVDU 650 9 A1 NSP1 32 F IVDU 216 10 C2 NSP2 35 F Hetero 14 9 C3 NSP4* 42 M Homo 29 9 C3 77.6P5 38 F IVDU 24 10 C3
.
100P6 36 M IVDU 156 10 C3 NSP7 35 F IVDU 88 10 C2 28.8P8 35 M IVDU 17 7 C3
.
100P9 37 M IVDU 37 9 C3 47P10 32 M IVDU 12 8 C3
.
100P10* 28 M IVDU 2 8 C3
.
100P11 32 M IVDU 18 10 C3 NSP12 40 M IVDU 80 7 C3 NS
N1-N11, nonprogressors; P1-P12, progressors. IVDU, IV drug use; homo, homosexual; hetero, heterosexual. HIV disease staging is according to theCenters For Disease Control 1992 classification.

HIV Gene Expression in Long-term Nonprogressives
895
DNA and RNA extraction.
PBMCs were obtained by Ficoll-Hypaque gradient centrifugation from 10 ml of EDTA-collectedblood. DNA was extracted from frozen cellular pellets according tostandard procedures (54). Viral RNA was extracted from the virionpellet obtained after ultracentrifugation (40,000 rpm on an SW41t ro-tor for 60 min; Beckman Instruments, Fullerton, CA) of 5 ml plasma(38, 40), according to the guanidinium thiocyanate procedure (55).Cellular RNA was extracted from frozen cellular pellets by cell lysisin solution D according to the guanidinium thiocyanate procedure(55).
Primers and competitor.
Plasmid pSPLI-II was used as a compet-itor for the competitive PCR determination of the copy number ofHIV-1 proviral DNA and of the reference single-copy
b
-globin genein DNA samples, while the in vitro transcription product from plas-mid pSPLI-II was used for the RT-PCR quantification of HIV-1 ge-nomic RNA in serum, of HIV-1 viral mRNAs, and of the cellular
b
-actin mRNA in cellular RNA samples. The construction (37) andthe use (38, 40) of this multicompetitor plasmid for the quantitationof HIV-1 nucleic acids have already been described; a schematic rep-resentation of the insert of this plasmid is shown in Fig. 1
B
. Briefly,this insert contains four HIV-1 oligonucleotide sequences (primers 1,2II, 3, and 5) arranged to produce amplification products that are dif-ferent in size (and hence recognizable by resolution by polyacryl-amide gel electrophoresis) from those deriving from the viral tem-plates. Primer 1 (nucleotides 246–273 of the
hivlai
; Los AlamosNational Laboratory file, Los Alamos, NM) is localized immediatelydownstream of the 5
9
LTR sequence, primer 2II (nucleotides 463–438) at the 5
9
end of the
gag
gene, and primer 5 (nucleotides 8021–8000) at a 3
9
position with respect to the 3
9
-most splice acceptor siteof the HIV-1 full length mRNA (Fig. 1
A
). Amplification with primerpair 1-2II detects HIV-1 proviral DNA in infected cell DNA samples,unspliced viral mRNAs on cellular mRNA samples, and HIV-1 ge-nomic RNA on virion RNA samples. Amplification with primer pair1–5 detects multispliced HIV-1 mRNAs in cellular RNA samples.
Additionally, plasmid pSPLI-II also contains two competitor seg-ments for cellular
b
-actin mRNA (32) and
b
-globin DNA (31) copynumber determination, using primer pairs PCO3 and PCO4, andBA1 and BA4, respectively. These competitor segments contain aperfect match to the respective target sequences, except for the addi-tion of 20 extra bp in the middle.
For the DNA competition experiments, a preparation of plasmidpSPLI-II was accurately quantified by spectrophotometry, linearizedby digestion at the KpnI site, and an aliquot was diluted and directlyused as a competitive template.
For the competitive RNA experiments, the competitor RNA wasobtained by in vitro run-off transcription from 50 ng of plasmidpSPLI-II after linearization with KpnI. The in vitro transcription re-action was performed using a T7 RNA polymerase-based commercialkit (Promega Corp., Madison, WI), with the addition of 2
m
l [
32
P]UTP(3,000 Ci/mmol, 10 mCi/ml; Amersham International, Little Chalfont,UK) to the reaction mix, corresponding to 2.07
3
10
7
cpm, as experi-mentally evaluated by Cerenkov counting. After completion of thetranscription reaction, the template DNA was removed by DNase Idigestion followed by purification of the newly synthesized RNA bydenaturing polyacrylamide gel electrophoresis and elution from thegel. An aliquot of the purified competitor RNA preparation wasmeasured in a
b
counter and, according to the U content of the tran-script, its concentration was evaluated from the final specific activity,as already described (32, 33).
Competitive PCR and RT-PCR.
Competitive PCR for the quan-tification of HIV-1 and
b
-globin gene copy number was carried outon 1
m
l of sample DNA with the addition of increasing concentrationsof the pSPLI-II competitive template, in 100
m
l of PCR buffer (50mM KCl, 10 mM Tris-HCl, 2 mM MgCl
2
) containing the two primers(100 pmol each), the four dNTPs (200
m
M each), and 2.5 U of
Taq
DNA polymerase (Perkin-Elmer Cetus Instruments, Emeryville,CA). Samples were submitted to 50 cycles of amplification with thefollowing cycle profile: denaturation at 95
8
C for 30 s, annealing at 60
8
C
(for both primer sets 1-2II and
b
-globin) for 30 s, and extension at72
8
C for 30 s. Before PCR analysis, DNA samples and KpnI-digestedlinearized pSPLI-II competitor were heated to 95
8
C for 5 min to en-sure complete denaturation.
For the RNA quantification experiments, the extracted RNA wasreverse transcribed in the presence of the antisense oligonucleotidesspecific for each class of transcripts. Each reaction contained 1
m
l oftest RNA sample and 3
m
l of RNA competitor (the pSPLI-II in vitrotranscription product, opportunely diluted) in 20
m
l of reverse tran-scription mix, composed of 75 mM KCl, 50 mM Tris-HCl, pH 8.3, 3 mMMgCl
2
, 0.4 mM each dNTP (Pharmacia LKB Biotechnology, Upp-sala, Sweden), 2 mM antisense primer, 400 U MMLV-RT (PromegaCorp.), 20 U RNasin (Promega Corp.). RNA was preheated at 65
8
Cfor 5 min and incubated with the reaction mix at 37
8
C. After 1 h, thereaction was stopped by incubation at 95
8
C for 5 min and sampleswere cooled on ice. The 20-
m
l reverse transcription reaction was thendiluted in PCR buffer to a final volume of 100
m
l, containing 100pmol both primers, 200
m
M of the four dNTPs each, and 2.5 U of
Taq
DNA polymerase. Samples were submitted to 50 cycles of amplifica-tion with the following cycle profiles: denaturation at 95
8
C for 30 s,annealing at 60
8
C (primer sets 1-2II, 1-5, and
b
-actin) for 30 s, exten-sion at 72
8
C for 30 s. After amplification, 15
m
l of each PCR product were resolved onan 8% nondenaturing polyacrylamide gel, visualized under ultravio-let light after ethidium bromide staining and photographed. Quantifi-cation of the amplification product was obtained by densitometricscanning of the ethidium bromide–stained gels.
Statistical analyses.
Statistical analyses were done using the Stat-View 4.5 statistical software package for the Macintosh (Abacus Con-cepts, Inc., Berkeley, CA).
Results
11 individuals with long term nonprogressive HIV infection(LTNPs; see Methods for definition) were included in thisstudy. Some of the clinical and immunological features ofthese individuals are reported in Table I, including age (meanage: 32 yr), sex, and probable route of infection. They had anaverage time of documented infection of 9.0 yr (range 7–10 yr),and mean CD4
1
cells count of 841.6 cells/mm
3
(SD 348.6cells). A detailed analysis of the immunological profile and ofthis group of LTNPs has already been presented elsewhere(56). Here, we describe the quantitative virologic features ofHIV infection in these individuals, and contrast
them withthose found in 12 matched patients (Table I) having the sameage and the same period of documented HIV infection (mean8.9 yr, range 7–10 yr) and with clear progression of the disease(CD4
1
cell counts: mean 57.7 cells/mm
3
, SD 66.6 cells). Sev-eral quantitative virologic parameters (including viremia,proviral DNA copy number, and levels of unspliced and multi-spliced mRNAs in peripheral blood mononuclear cells, asschematically shown in Fig. 1
C
) were determined in these pa-tients by a multiple competitive PCR procedure (37). By tak-ing advantage of the use of a single multicompetitor molecule,this procedure permits the exact quantification of the relativeabundance of different DNA and RNA species. The competi-tor for these quantifications is plasmid pSPLI-II (Fig. 1
B
) act-ing as a competitive template for the determination of HIV-1proviral DNA and cellular
b
-globin gene copy numbers inDNA samples, and its in vitro transcription product, allowingthe quantification of HIV-1 unspliced, single-spliced, and un-spliced HIV-1 transcripts and of cellular
b
-actin mRNA in cel-lular mRNA samples. Quantification of multispliced tran-scripts is performed by using the prevalent transcript coding
896
Comar et al.
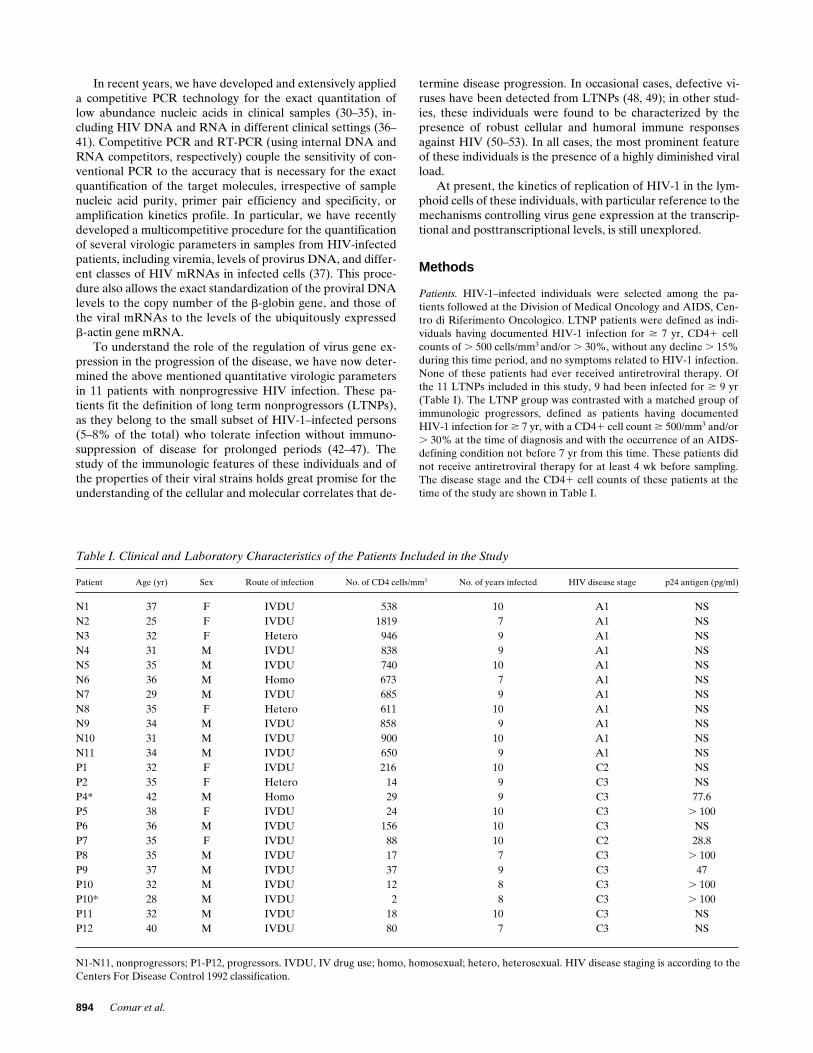
Figure 1. Competitive PCR and RT-PCR for the quantification of HIV-1 nucleic acids. (A) HIV gene organization (top), primary mRNA (middle), and HIV exons (gray-shadowed boxes, bottom). The 59 most splice site at position 743 and the 39 most splice site at position 8377 are indicated by white and black dots, respectively. Numbering is according to file hxb2cg of the LANL data bank of AIDS-related nucleic acid sequences (60). The po-sition of the three HIV-specific oli-gonucleotides used in this study and their orientation are shown. These oligonucleotides were selected on the basis of their high level of se-quence homology with most HIV isolates in the LANL data base. (B) Schematic representation of the in-sert of plasmid pSPLI-II, used as competitor for the competitive PCR experiments. The plasmid contains three DNA fragment inserts, to be used as competitors for the determi-nation of HIV-1, b-actin, andb-globin copy number. The HIV-1 insert contains four HIV-1 primers (1, 5, 2II, and 3, indicated by arrows showing the orientation); amplifica-tion with primers 1 and 2II detects proviral DNA in DNA samples and viral unspliced genomic RNA in RNA samples. The positions of
these primers on the competitor are arranged to produce a 240-bp amplification fragment that can be easily resolved by size from the corre-sponding HIV-1 PCR products. The b-globin fragment contains a segment of the human b-globin gene with 20 extra nucleotides in the middle (31), amplifiable with primers PCO3 and PCO4 to give rise to a product of 130 bp. The RNA competitor for the competitive RT-PCR experi-ments is obtained by in vitro run off transcription of this plasmid by T7 RNA polymerase after linearization at the KpnI site. The transcribed RNA contains a polyA tail, indicated by (A) at its 39 end. (C) Flow chart for the quantification of quantitative virologic parameters in HIV-1–infected individuals. Quantitative PCR was performed on DNA samples extracted from PBMCs with linearized pSPLI-II plasmid DNA com-petitor and primer sets 1-2II (HIV) and PCO3-PCO4 (b-globin). Competitive RT-PCR was performed on RNA samples using the in vitro tran-scription product of pSPLI-II and primer sets 1-2II (viremia in plasma RNA samples and genomic length mRNA in cellular samples), 1–5 (multispliced Rev mRNA in cellular samples), and BA1–BA4 (b-actin in cellular samples). In all cases, a fixed amount of sample DNA or RNA was mixed with increasing amounts of DNA or RNA competitor, respectively, and submitted to PCR or RT-PCR. After amplification, the PCR products were resolved by polyacrylamide gel electrophoresis, stained by ethidium bromide, and the bands corresponding to the PCR products for the competitor and the template were quantified by densitometric scanning. The ratio between competitor and target (shown at the bottom of the gels for the lanes where both the species were detectable) reflects the ratio between the two species at the beginning of the reaction. M, molecular weight marker; molec., molecules. Arrows indicate HIV-specific bands; in the case of multispliced transcripts, several products are de-tectable; the one used for quantification corresponds to a cDNA coding for Rev (see reference 37).
for the Rev protein as an estimate for all the transcripts in thisclass. The use of internal standards for the quantification of to-tal extracted DNA (
b
-globin) and RNA (
b
-actin) appears veryimportant for these quantitative evaluations, since the totalamount of extracted nucleic acids from clinical samples is oftenvery variable. We have already used this procedure to studythe regulation of HIV-1 gene expression in in vitro–infectedexperimental models (37) and to monitor viral load in HIV-1–infected patients (38, 40, 41).
Viral load.
The levels of HIV-1 viremia were determinedby competitive RT-PCR amplification of RNA extracted fromvirion pellets using the in vitro–transcribed RNA product ofplasmid pSPLI-II and primer set 1-2II (Fig. 1
A
). The values
obtained are reported in Table II, where they are expressed asviral RNA molecules per milliliter of plasma. The distributionof these values in the two categories of patients is graphicallyshown in Fig. 2
A
. The threshold for detection by competitiveRT-PCR was of one molecule in 25
m
l of extracted RNA (cor-responding to 40 viral RNA molecules per milliliter). ViralRNA resulted at undetectable levels in four patients with non-progressive infection; these samples are indicated by an arrowpointing down in Fig. 2
A
. For statistical analysis, HIV RNAconcentration in the samples was considered 10
3
less abun-dant than the threshold limit, considering that a
,
10-fold dif-ference between competitor and sample would have been de-tected in the competitive PCR assay (30, 33).

HIV Gene Expression in Long-term Nonprogressives
897
The mean levels of virion-associated RNA in patients withnonprogressive infection was of 5.82
3
10
2
molecules/mlplasma (range, min/max: 4/2.5
3
10
3
; SD 8.85 3 102). Thesevalues were several orders of magnitude lower than those de-tected in the group of patients with progressive HIV infections(mean value, 1.97 3 106 viral RNA molecules/ml; range, 5 3103/2 3 107; SD 5.47 3 106; P , 0.0001 in the Mann-Whitneynonparametric test for unpaired groups).
The amount of HIV-1 proviral DNA copies in PBMCsfrom the two groups of patients was determined by the quanti-fication of viral DNA and of the b-globin cellular DNA copynumbers in extracted DNA samples. Proviral DNA copy num-bers are reported in Table II, where they are expressed as rela-tive to the total number of mononuclear cells (as evaluated byb-globin gene quantification) or by taking into account alsothe number of circulating CD41 cells, considering that thesecells are the targets for HIV infection. The distribution of HIVprovirus DNA in CD41 cells is shown in Fig. 2 B for the twogroups of patients. The mean value of proviral DNA copies inCD41 cells from nonprogressor patients was of 0.012 mole-
cules/CD41 cell, SD 0.019; range 0.001–0.066), correspondingto 1 provirus for every 83 CD41 cells. In progressor patients,the mean value of provirus DNA copies was of 4.00 moleculesper CD41 cell (SD 5.08; range 0.2–15; P , 0.0001). This esti-mate indicates that virtually all the circulating CD41 cells har-bor HIV viral genomes in patients with progressed infection.It should be observed that the quantification of HIV provi-rus by the selected primers detects both integrated and epi-somal DNA.
Taken together, the data obtained by the quantification ofthe levels of viremia and of provirus copy number in PBMCssupport the notion that viral load is highly augmented in pa-tients progressing toward overt HIV disease. Paired compari-son of the levels of viremia and of the provirus copy number inthe total sample population shows that these two measure-ments are very well correlated (nonparametric Spearman rankcorrelation test, P , 0.001). Thus, the combined use of thesetwo variables depicts two distinct patient populations (progres-sor and nonprogressor) clearly distinguishable by different vi-ral load.
Figure 1 (Continued)

898 Comar et al.
Tab
le I
I. H
IV-1
DN
A a
nd R
NA
Lev
els
in N
onpr
ogre
ssor
and
Pro
gres
sor
Indi
vidu
als
Vir
emia
HIV
RN
A/m
l pla
sma
Pro
vira
l DN
ASp
liced
HIV
RN
AU
nspl
iced
HIV
RN
A
Pat
ient
HIV
DN
A/b
-glo
bin
HIV
DN
A/C
D4
HIV
RN
A/b
-act
inH
IV R
NA
/CD
4H
IV R
NA
/pro
viru
sH
IV R
NA
/b-a
ctin
HIV
RN
A/C
D4
HIV
RN
A/p
rovi
rus
Splic
ed/u
nspl
iced
HIV
RN
A
N1
8.3
3 1
013.
0 3
102
26.
6 3
102
22.
0 3
102
44.
4 3
102
46.
7 3
102
32.
0 3
102
44.
4 3
102
46.
7 3
102
31.
0 3
100
N2
8.3
3 1
023.
0 3
102
37.
3 3
102
31.
0 3
102
42.
4 3
102
43.
3 3
102
23.
3 3
102
48.
1 3
102
41.
1 3
102
13.
0 3
102
1
N3
7.5
3 1
022.
4 3
102
35.
3 3
102
31.
0 3
102
32.
2 3
102
34.
2 3
102
11.
0 3
102
22.
2 3
102
24.
2 3
100
1.0
3 1
021
N4
2.0
3 1
021.
0 3
102
32.
2 3
102
31.
7 3
102
53.
7 3
102
51.
7 3
102
26.
0 3
102
51.
3 3
102
46.
0 3
102
22.
8 3
102
1
N5
2.5
3 1
035.
0 3
102
31.
6 3
102
28.
3 3
102
52.
7 3
102
41.
7 3
102
25.
0 3
102
41.
6 3
102
31.
0 3
102
11.
7 3
102
1
N6
1.3
3 1
012.
5 3
102
36.
0 3
102
35.
0 3
102
51.
2 3
102
42.
0 3
102
21.
0 3
102
42.
4 3
102
44.
0 3
102
25.
0 3
102
1
N7
4.0
3 1
001.
0 3
102
32.
7 3
102
31.
0 3
102
42.
7 3
102
41.
0 3
102
14.
0 3
102
31.
1 3
102
24.
0 3
100
2.5
3 1
022
N8
4.0
3 1
001.
2 3
102
32.
8 3
102
32.
5 3
102
45.
8 3
102
42.
1 3
102
12.
5 3
102
55.
8 3
102
52.
1 3
102
21.
0 3
101
N9
5.0
3 1
004.
0 3
102
49.
3 3
102
43.
3 3
102
47.
7 3
102
48.
3 3
102
12.
0 3
102
34.
6 3
102
35.
0 3
100
1.7
3 1
021
N10
2.0
3 1
031.
0 3
102
22.
5 3
102
24.
0 3
102
31.
0 3
102
24.
0 3
102
12.
0 3
102
35.
0 3
102
32.
0 3
102
12.
0 3
100
N11
4.0
3 1
005.
0 3
102
41.
9 3
102
3N
D—
—N
D—
——
P1
1.2
3 1
053.
3 3
102
15.
6 3
100
5.0
3 1
023
8.3
3 1
022
1.5
3 1
022
1.5
3 1
021
2.5
3 1
004.
5 3
102
13.
3 3
102
2
P2
2.0
3 1
073.
3 3
102
11.
2 3
101
1.0
3 1
024
3.7
3 1
023
3.0
3 1
024
2.5
3 1
022
9.3
3 1
021
7.5
3 1
022
4.0
3 1
023
P4*
1.2
3 1
055.
0 3
102
28.
6 3
102
15.
0 3
102
38.
6 3
102
21.
0 3
102
14.
0 3
102
16.
9 3
100
8.0
3 1
001.
3 3
102
2
P5
5.0
3 1
04N
D—
2.5
3 1
023
3.0
3 1
022
•3.
0 3
102
23.
6 3
102
1•
8.3
3 1
021
P6
1.0
3 1
067.
5 3
102
26.
4 3
102
17.
5 3
102
46.
4 3
102
31.
0 3
102
21.
5 3
100
1.3
3 1
012.
0 3
101
5.0
3 1
024
P7
3.0
3 1
052.
8 3
102
11.
6 3
100
2.0
3 1
023
1.1
3 1
022
7.3
3 1
023
1.0
3 1
021
5.7
3 1
021
3.6
3 1
021
2.0
3 1
022
P8
6.0
3 1
053.
0 3
102
11.
9 3
100
6.3
3 1
024
4.0
3 1
023
2.1
3 1
022
1.0
3 1
021
6.4
3 1
021
3.3
3 1
021
6.2
3 1
022
P9
6.0
3 1
055.
0 3
102
24.
7 3
102
15.
0 3
102
44.
7 3
102
31.
0 3
102
25.
0 3
102
14.
7 3
100
1.0
3 1
011.
0 3
102
3
P10
6.7
3 1
041.
0 3
102
14.
0 3
100
3.0
3 1
023
1.2
3 1
021
3.0
3 1
022
ND
——
—P
10*
5.0
3 1
037.
5 3
102
21.
5 3
101
1.0
3 1
023
2.0
3 1
021
1.3
3 1
022
5.0
3 1
022
1.0
3 1
016.
7 3
102
12.
0 3
102
2
P11
2.5
3 1
054.
0 3
102
22.
0 3
102
11.
2 3
102
46.
0 3
102
43.
0 3
102
34.
0 3
102
12.
0 3
100
1.0
3 1
013.
0 3
102
4
P12
5.0
3 1
053.
0 3
102
11.
5 3
100
ND
——
1.3
3 1
022
6.7
3 1
022
4.0
3 1
021
—
HIV
pro
vira
l DN
A c
opy
num
ber
in P
BM
Cs
is e
xpre
ssed
bot
h as
the
num
ber
of H
IV D
NA
mol
ecul
es p
er b
-glo
bin
mol
ecul
e (p
rovi
ral D
NA
cop
ies/
b-g
lobi
n ge
ne c
opie
s) a
nd a
s th
e nu
mbe
r of
HIV
DN
Am
olec
ules
per
CD
4 ce
lls (
prov
iral
DN
A c
opie
s/[b
-glo
bin
DN
A c
opie
s*pe
rcen
tage
CD
4 ce
lls/1
00])
. The
leve
ls o
f HIV
mR
NA
s ar
e ex
pres
sed
as n
umbe
r of
tran
scri
pts
per b
-act
in m
RN
A (
HIV
mR
NA
mol
-ec
ules
/b-a
ctin
mR
NA
mol
ecul
es),
num
ber
of t
rans
crip
ts p
er C
D41
cel
l (H
IV m
RN
A c
opie
s/[b
-act
in m
RN
A m
olec
ules
*per
cent
age
CD
4 ce
lls/1
00])
, and
as
num
ber
of t
rans
crip
ts p
er p
rovi
ral D
NA
mol
e-cu
les
in t
he s
ame
sam
ple
([H
IV m
RN
A m
olec
ules
/b-a
ctin
mR
NA
mol
ecul
es]/
[HIV
pro
vira
l DN
A c
opie
s/b
-glo
bin
DN
A c
opie
s]).
The
last
mea
sure
men
t re
flec
ts t
he t
rans
crip
tion
al a
ctiv
ity
of t
he p
rovi
rus
(i.e
., nu
mbe
r of
tran
scri
pts
prod
uced
per
pro
viru
s). T
he la
st c
olum
n re
port
s th
e ra
tio
betw
een
splic
ed a
nd u
nspl
iced
tran
scri
pts.
HIV Gene Expression in Long-term Nonprogressives 899
Expression of viral mRNAs. The finding that viral load ishighly increased in patients progressing in HIV disease withrespect to nonprogressing individuals (. 3,0003 for viremiaand . 4003 for provirus copy number) predicts an increasedrate of virus replication in the former group of patients. Thisshould be reflected by the presence of an increased number ofvirus-specific transcripts in cellular RNA samples. Therefore,we quantitatively determined the levels of viral mRNAs be-longing to the unspliced and multispliced classes in cellularRNA samples obtained from peripheral blood cells from thetwo groups of patients. The results are presented in Table II,where the measurements of two transcript classes are ex-pressed as relative to b-actin mRNA levels (i.e., viral RNAs inthe total RNA sample), or are expressed as relative to the ex-pected b-actin mRNA levels in CD41 cells only (first two col-umns for each transcript class). The latter measurements aregraphically shown in Fig. 3, A and B, respectively.
The levels of both HIV multispliced and unspliced tran-scripts were clearly higher in progressor patients. The mean
value for short transcripts was 1.5 3 1023 Rev mRNA mole-cules/b-actin molecule in nonprogressors (SD 3.0 3 1023) and5.0 3 1022 molecules in progressor patients (SD 6.5 3 1022;P , 0.001, Mann-Whitney rank test). The difference betweenthe mean values obtained for the two groups of patients formultispliced transcripts (. 30-fold) was even greater for themRNA of genomic length. This transcript was found in periph-eral blood CD41 cells at a frequency of 4.6 3 1023 molecules/b-actin molecule in nonprogressors (SD 7.0 3 1023) and 3.76molecules/b-actin molecule in progressor patients (SD 4.33;P , 0.001, Mann-Whitney rank test; . 8003 difference be-tween the mean value of the two groups). Considering thatb-actin is a highly transcribed gene, these values indicate thattranscription of the provirus is a highly sustained process in pa-tients with HIV disease and that this process takes place also inperipheral blood CD41 cells. According to this observation,when the pattern of virus transcription was correlated to thelevels of viremia, a strict correlation was found between the in-tracellular levels of unspliced transcripts (but not of multi-
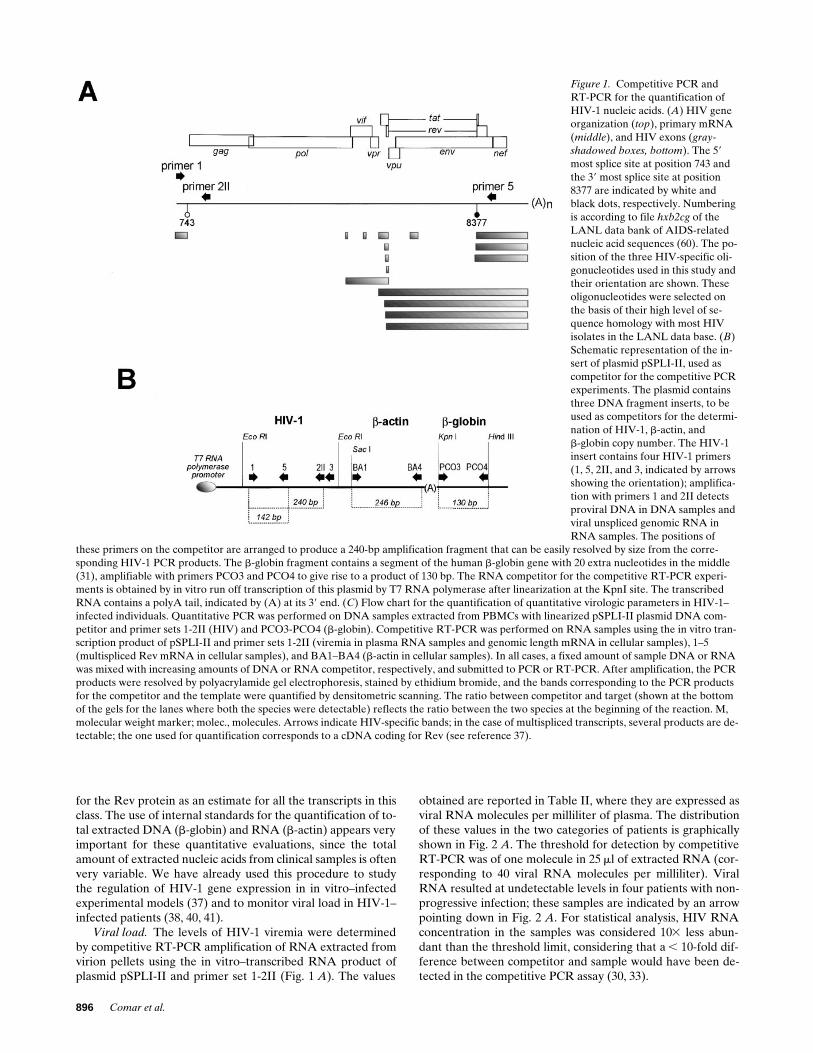
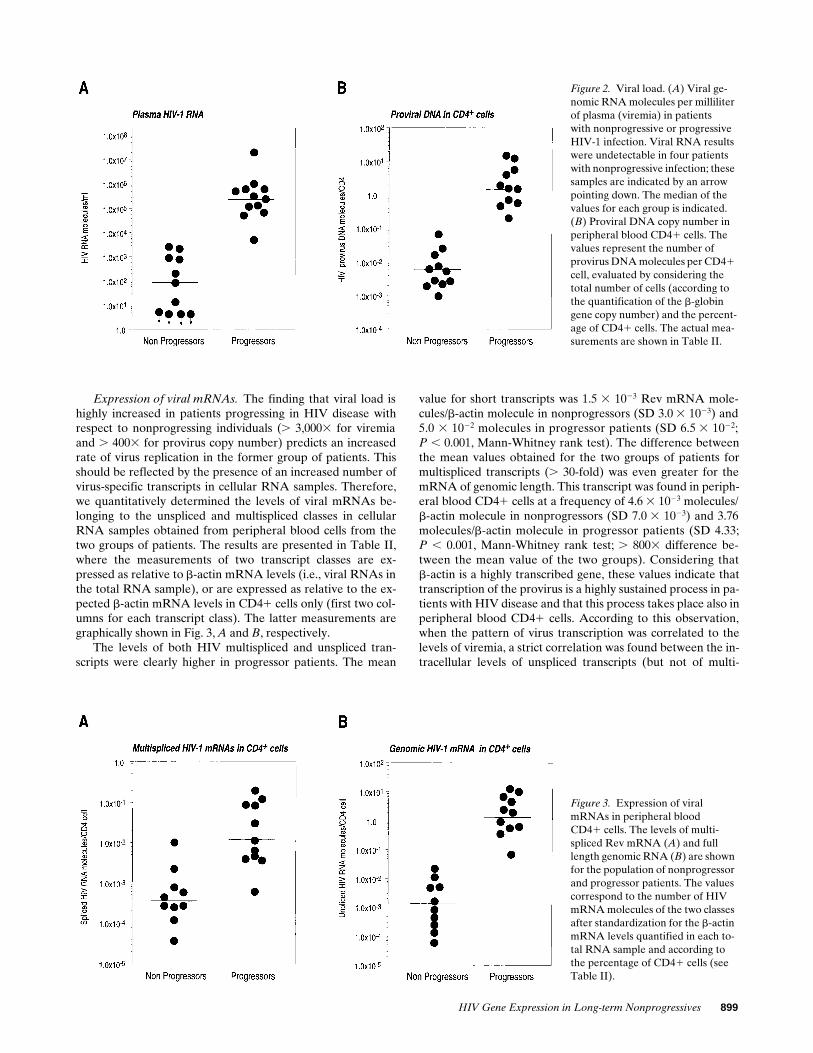
Figure 2. Viral load. (A) Viral ge-nomic RNA molecules per milliliter of plasma (viremia) in patientswith nonprogressive or progressiveHIV-1 infection. Viral RNA results were undetectable in four patients with nonprogressive infection; these samples are indicated by an arrow pointing down. The median of the values for each group is indicated. (B) Proviral DNA copy number in peripheral blood CD41 cells. The values represent the number of provirus DNA molecules per CD41 cell, evaluated by considering the total number of cells (according to the quantification of the b-globin gene copy number) and the percent-age of CD41 cells. The actual mea-surements are shown in Table II.
Figure 3. Expression of viralmRNAs in peripheral bloodCD41 cells. The levels of multi-spliced Rev mRNA (A) and full length genomic RNA (B) are shown for the population of nonprogressor and progressor patients. The values correspond to the number of HIV mRNA molecules of the two classes after standardization for the b-actin mRNA levels quantified in each to-tal RNA sample and according to the percentage of CD41 cells (see Table II).
900 Comar et al.
spliced transcripts) and the amount of virus RNA in plasma(Spearman rank correlation test, P , 0.001). While a potentialcaveat of this observation is that unspliced mRNA levels arealso contributed by binding of virions to CD4 cells, the sim-plest molecular explanation is that the proviral DNA in pro-gressor patients is committed to the production of unsplicedRNAs for the assembly and release of new viral particles.
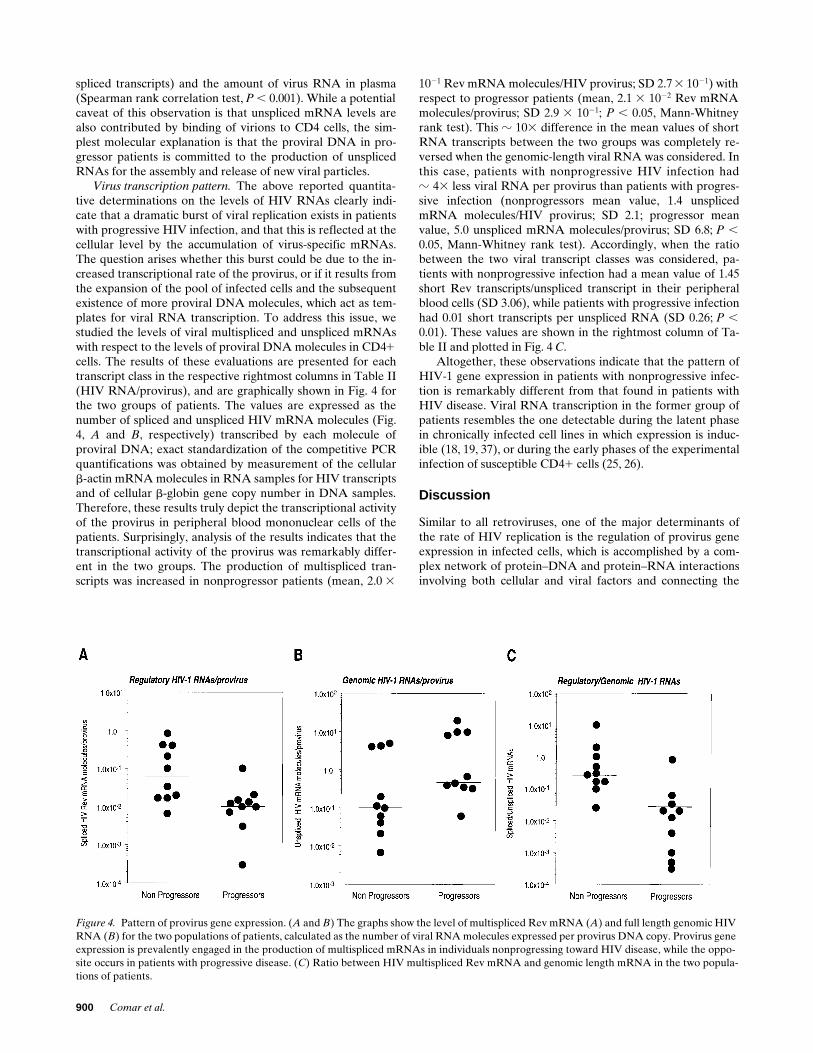
Virus transcription pattern. The above reported quantita-tive determinations on the levels of HIV RNAs clearly indi-cate that a dramatic burst of viral replication exists in patientswith progressive HIV infection, and that this is reflected at thecellular level by the accumulation of virus-specific mRNAs.The question arises whether this burst could be due to the in-creased transcriptional rate of the provirus, or if it results fromthe expansion of the pool of infected cells and the subsequentexistence of more proviral DNA molecules, which act as tem-plates for viral RNA transcription. To address this issue, westudied the levels of viral multispliced and unspliced mRNAswith respect to the levels of proviral DNA molecules in CD41cells. The results of these evaluations are presented for eachtranscript class in the respective rightmost columns in Table II(HIV RNA/provirus), and are graphically shown in Fig. 4 forthe two groups of patients. The values are expressed as thenumber of spliced and unspliced HIV mRNA molecules (Fig.4, A and B, respectively) transcribed by each molecule ofproviral DNA; exact standardization of the competitive PCRquantifications was obtained by measurement of the cellularb-actin mRNA molecules in RNA samples for HIV transcriptsand of cellular b-globin gene copy number in DNA samples.Therefore, these results truly depict the transcriptional activityof the provirus in peripheral blood mononuclear cells of thepatients. Surprisingly, analysis of the results indicates that thetranscriptional activity of the provirus was remarkably differ-ent in the two groups. The production of multispliced tran-scripts was increased in nonprogressor patients (mean, 2.0 3
1021 Rev mRNA molecules/HIV provirus; SD 2.7 3 1021) withrespect to progressor patients (mean, 2.1 3 1022 Rev mRNAmolecules/provirus; SD 2.9 3 1021; P , 0.05, Mann-Whitneyrank test). This z 103 difference in the mean values of shortRNA transcripts between the two groups was completely re-versed when the genomic-length viral RNA was considered. Inthis case, patients with nonprogressive HIV infection hadz 43 less viral RNA per provirus than patients with progres-sive infection (nonprogressors mean value, 1.4 unsplicedmRNA molecules/HIV provirus; SD 2.1; progressor meanvalue, 5.0 unspliced mRNA molecules/provirus; SD 6.8; P ,0.05, Mann-Whitney rank test). Accordingly, when the ratiobetween the two viral transcript classes was considered, pa-tients with nonprogressive infection had a mean value of 1.45short Rev transcripts/unspliced transcript in their peripheralblood cells (SD 3.06), while patients with progressive infectionhad 0.01 short transcripts per unspliced RNA (SD 0.26; P ,0.01). These values are shown in the rightmost column of Ta-ble II and plotted in Fig. 4 C.
Altogether, these observations indicate that the pattern ofHIV-1 gene expression in patients with nonprogressive infec-tion is remarkably different from that found in patients withHIV disease. Viral RNA transcription in the former group ofpatients resembles the one detectable during the latent phasein chronically infected cell lines in which expression is induc-ible (18, 19, 37), or during the early phases of the experimentalinfection of susceptible CD41 cells (25, 26).
Discussion
Similar to all retroviruses, one of the major determinants ofthe rate of HIV replication is the regulation of provirus geneexpression in infected cells, which is accomplished by a com-plex network of protein–DNA and protein–RNA interactionsinvolving both cellular and viral factors and connecting the
Figure 4. Pattern of provirus gene expression. (A and B) The graphs show the level of multispliced Rev mRNA (A) and full length genomic HIV RNA (B) for the two populations of patients, calculated as the number of viral RNA molecules expressed per provirus DNA copy. Provirus gene expression is prevalently engaged in the production of multispliced mRNAs in individuals nonprogressing toward HIV disease, while the oppo-site occurs in patients with progressive disease. (C) Ratio between HIV multispliced Rev mRNA and genomic length mRNA in the two popula-tions of patients.

HIV Gene Expression in Long-term Nonprogressives 901
control of virus gene expression to the regulation of cellularproliferation and metabolism. These mechanisms involve thecontrol of both provirus transcription rate, which generates asingle mRNA of genomic length, and of posttranscriptionalprocessing of this transcript. While it has been relatively easyto study the pattern of HIV gene expression in experimentalsystems, obtaining interesting information about the regula-tion of these processes, these studies in infected patients havebeen hampered by the difficulty of getting truly quantitativedata given the relatively low levels at which HIV transcriptsare found in vivo. Still, several important questions need to beanswered about the natural history of infection that could takeadvantage of the exact understanding of the kinetics of HIVreplication. These include the existence of a true latency phaseat the single cell level and its relationship with the CD41 acti-vation state; the role of transcriptional activation of the provi-rus by inducible cellular factors and by extracellular Tat pro-tein; the function of RNA processing and translationalmechanism in preventing virion protein and genomic RNAproduction. The understanding of some of these issues cantake advantage of truly quantitative competitive PCR studieson biological samples from HIV-infected individuals.
In this work, we have addressed the issue of understandingthe kinetics of HIV-1 replication in the development of HIVdisease by contrasting the quantification of HIV mRNAs insamples from patients with nonprogressive infection with thatfrom patients with the same temporal history of infection butwith clear progression of the disease. Several quantitative dif-ferences were found between these two groups of individuals:(a) the mean levels of viral RNA in plasma were increasedmore than 3,0003 in progressor patients with respect to non-progressor individuals; (b) the mean levels of provirus copiesin peripheral blood CD41 cells were increased more than 400-fold in progressors; (c) the levels of unspliced and multisplicedtranscripts in progressors were more than 800 and 303, respec-tively, higher than those in nonprogressors; (d) short, multi-spliced HIV transcripts produced per provirus DNA copywere 123 more abundant in peripheral blood cells of nonpro-gressors, while long unspliced RNAs were more than 33 asabundant in samples from progressors. These results clearly in-dicate not only that viral load is dramatically divergent in thetwo groups of patients, as suggested by previous studies (50,51), but also that the kinetics of HIV gene expression, includ-ing the pattern of virus mRNA processing, is different.
The quantitative HIV mRNA evaluations were performedin RNA samples from peripheral blood. Interestingly, whenthe levels of viremia (which is expected to reflect viral load inthe lymphoid system; reference 57) and the levels of peripheralblood cells harboring HIV genomes were considered for theoverall sample population, a strict correlation was found be-tween the two variables. This observation, together with thefinding that active proviral DNA transcription occurs in pe-ripheral blood CD41 cells, suggests that these cells activelyparticipate in the highly dynamic turnover occurring duringHIV infection, and supports the notion that their analysis isappropriate to understanding the kinetics of HIV replication.Additionally, it should be also observed that in the majority ofboth progressors and nonprogressors, the viral RNA/DNA ra-tios, representing the provirus transcriptional activity, are # 1;this indicates that in several cells the provirus is in an inactivestate.
The finding that the pattern of provirus transcription is re-
markably different in patients not progressing toward overtdisease deserves further comment. The prevalent productionof regulatory transcript mRNAs, with respect to HIV genomeRNA, is a hallmark of the first phases of the experimental in-fection, when virus production is still not detectable and thereis accumulation of viral regulatory proteins (58). Additionally,this is the same pattern that can be found in chronically in-fected cell lines that produce undetectable amounts of virusand have been taken as a model for the study of viral latency(17, 18, 37). Production of replicative virus in these cells linescan be obtained by cellular stimulation with various agentsthat trigger cellular activation and proliferation. The finding ofa similar “latency” pattern in samples of nonprogressor indi-viduals suggests that viral replication in these individuals is ahighly controlled process, with respect to progressor patientsshowing runaway replication and subsequent production ofmassive amounts of viral genomes.
While the analysis of long term nonprogressor individualsin contrast with progressor patients emphasizes this differentpattern of HIV gene expression, it should be considered that apattern resembling the early phase of infection is likely to bepresent also in patients during the asymptomatic phase of in-fection, regardless whether they will become long term non-progressors or not. Accordingly, the dysregulation of themechanisms controlling these events is likely to occur progres-sively during the course of the infection, as also suggested bothby longitudinal studies (15, 29) and by studies analyzing thefactors that predict the rate of disease progression (14).
Finally, it is of great interest to understand which are themechanisms responsible for the maintenance of the early pat-tern of virus gene expression in nonprogressor individuals.These mechanisms can act on the organism level, by more effi-cient clearance of cells engaged in virus production by cyto-toxic T-lymphocytes in nonprogressors (59). Alternatively,they can act at the posttranscriptional level in each infectedcell by interfering with the export of unspliced mRNA, whichis required for a fully productive infection. In both cases, thedefinition of such mechanisms would represent a very impor-tant goal for the understanding of the molecular correlates ofdisease progression in HIV-1–infected individuals.
Acknowledgments
This work was supported by grants of the AIDS program of the Isti-tuto Superiore di Sanita’ (Rome, Italy) to M. Giacca and U. Tirelli.M. Comar is supported by a fellowship of the Children Hospital“Burlo Garofolo” (Trieste, Italy).
References
1. Ho, D.D., T. Moudgil, and M. Alam. 1989. Quantitation of human immu-nodeficiency virus type 1 in the blood of infected persons. N. Engl. J. Med. 321:1621–1625.
2. Bagnarelli, P., S. Menzo, A. Valenza, A. Manzin, M. Giacca, F. Ancarani,G. Scalise, P.E. Varaldo, and M. Clementi. 1992. Molecular profile of humanimmunodeficiency virus infection in asymptomatic subjects and AIDS patients.J. Virol. 66:7328–7335.
3. Michael, N.L., M. Vahey, D.S. Burke, and R.R. Redfield. 1992. ViralDNA and mRNA expression correlate with the stage of human immunodefi-ciency virus (HIV) type 1 infection in humans: evidence for viral replication inall stages of HIV disease. J. Virol. 66:310–316.
4. Connor, R.I., H. Mohri, Y. Cao, and D.D. Ho. 1993. Increased viral bur-den and cytopathicity correlate temporally with CD41 T-lymphocyte declineand clinical progression in human immunodeficiency virus type 1–infected indi-viduals. J. Virol. 67:1772–1777.
5. Schnittman, S.M., J.J. Greenhouse, M.C. Psallidopoulos, M. Baseler, N.P.

902 Comar et al.
Salzman, A.S. Fauci, and H.C. Lane. 1990. Increasing viral burden in CD41 Tcells from patients with human immunodeficiency virus (HIV) infection reflectsrapidly progressive immunosuppression and clinical disease. Ann. Intern. Med.113:438–443.
6. Schnittman, S.M., J.J. Greenhouse, H.C. Lane, P.F. Pierce, and A.S.Fauci. 1991. Frequent detection of HIV-1–specific mRNAs in infected individu-als suggests ongoing active viral expression in all stages of disease. AIDS Res.Hum. Retroviruses. 7:361–367.
7. Jurriaans, S., J.T. Dekker, and A. de Ronde. 1992. HIV-1 viral DNA loadin peripheral blood mononuclear cells from seroconverters and long-term in-fected individuals. AIDS (Lond.). 6:635–641.
8. Simmonds, P., P. Balfe, J.F. Peutherer, C.A. Ludlam, J.O. Bishop, andA.J. Brown. 1990. Human immunodeficiency virus–infected individuals containprovirus in small numbers of peripheral mononuclear cells and at low copynumbers. J. Virol. 64:864–872.
9. Gupta, P., L. Kingsley, J. Armstrong, M. Ding, M. Cottrill, and C.Rinaldo. 1993. Enhanced expression of human immunodeficiency virus type 1correlates with development of AIDS. Virology. 196:586–595.
10. Piatak, M., Jr., M.S. Saag, L.C. Yang, S.J. Clark, J.C. Kappes, K.-C. Luk,B.H. Hahn, G.M. Shaw, and J.D. Lifson. 1993. High levels of HIV-1 in plasmaduring all stages of infection determined by competitive PCR. Science (Wash.DC). 259:1749–1754.
11. Bagasra, O., S.P. Hauptman, H.W. Lischner, M. Sachs, and R.J. Pomer-antz. 1992. Detection of human immunodeficiency virus type 1 provirus inmononuclear cells by in situ polymerase chain reaction. N. Engl. J. Med. 326:1385–1391.
12. Patterson, B.K., M. Till, P. Otto, C. Goolsby, M.R. Furtado, L.J.McBride, and S.M. Wolinsky. 1993. Detection of HIV-1 DNA and messengerRNA in individual cells by PCR-driven in situ hybridization and flow cytome-try. Science (Wash. DC). 260:976–979.
13. Saksela, K., C. Stevens, P. Rubinstein, and D. Baltimore. 1994. Humanimmunodeficiency virus type 1 mRNA expression in peripheral blood cells pre-dicts disease progression independently of the numbers of CD41 lymphocytes.Proc. Natl. Acad. Sci. USA. 91:1104–1108.
14. Wong, M.T., M.J. Dolan, R.D. Kozlow, G.P. Melcher, D.S. Burke, R.Neal Boswell, and M. Vahey. 1996. Patterns of virus burden and T-cell pheno-type are established early and are correlated with the rate of disease progres-sion in human immunodeficiency virus type 1–infected persons. J. Infect. Dis.173:877–887.
15. Michael, N.L., T. Mo, A. Merzouki, M. O’Shaughnessy, C. Oster, D.S.Burke, R.R. Redfield, D.L. Birx, and S.A. Cassol. 1995. Human immunodefi-ciency virus type 1 cellular RNA load and splicing patterns predict disease pro-gression in a longitudinally studied cohort. J. Virol. 69:1868–1877.
16. Saksela, K., C.E. Stevens, P. Rubinstein, P.E. Taylor, and D. Baltimore.1995. HIV-1 messenger RNA in peripheral blood mononuclear cells as an earlymarker of risk for progression to AIDS. Ann. Intern. Med. 123:641–648.
17. Pomerantz, R.J., D. Trono, M.B. Feinberg, and D. Baltimore. 1990.Cells nonproductively infected with HIV-1 exhibit an aberrant pattern of viralRNA expression: a molecular model for latency. Cell. 61:1271–1276.
18. Michael, N.L., P. Morrow, J. Mosca, M. Vahey, D.S. Burke, and R.R.Redfield. 1991. Induction of human immunodeficiency virus type 1 expressionin chronically infected cells is associated primarily with a shift in RNA splicingpatterns. J. Virol. 65:1291–1303.
19. Demarchi, F., P. D’Agaro, A. Falaschi, and M. Giacca. 1993. In vivofootprinting analysis of constitutive and inducible protein-DNA interactions atthe long terminal repeat of human immunodeficiency virus type 1. J. Virol. 67:7450–7460.
20. Embretson, J., M. Zupancic, J.L. Ribas, A. Burke, P. Racz, K. Tenner-Racz, and A.T. Haase. 1993. Massive covert infection of helper T lymphocytesand macrophages by HIV during the incubation period of AIDS. Nature(Lond.). 362:359–362.
21. Pantaleo, G., C. Graziosi, J.F. Demarest, L. Butini, M. Montroni, C.H.Fox, J.M. Orenstein, D.P. Kotler, and A.S. Fauci. 1993. HIV infection is activeand progressive in lymphoid tissue during the clinically latent stage of disease.Nature (Lond.). 362:355–358.
22. Chun, T.W., D. Finzi, J. Margolick, K. Chadwick, D. Schwartz, and R.F.Siliciano. 1995. In vivo fate of HIV-1–infected T cells: quantitative analysis ofthe transition to stable latency. Nat. Med. 1:1284–1290.
23. Schwartz, S., B.K. Felber, D.M. Benko, E.M. Fenyo, and G.N. Pavlakis.1990. Cloning and functional analysis of multiply spliced mRNA species of hu-man immunodeficiency virus type 1. J. Virol. 64:2519–2529.
24. Schwartz, S., B.K. Felber, E.M. Fenyo, and G.N. Pavlakis. 1990. Envand Vpu proteins of human immunodeficiency virus type 1 are produced frommultiple bicistronic mRNAs. J. Virol. 64:5448–5456.
25. Kim, S., R. Byrn, J. Groopman, and D. Baltimore. 1989. Temporal as-pects of DNA and RNA synthesis during human immunodeficiency virus infec-tion: evidence for differential gene expression. J. Virol. 63:3708–3713.
26. Klotman, M.E., S. Kim, A. Buchbinder, A. DeRossi, D. Baltimore, andF. Wong-Staal. 1991. Kinetics of expression of multiply spliced RNA in earlyhuman immunodeficiency virus type 1 infection of lymphocytes and monocytes.Proc. Natl. Acad. Sci. USA. 88:5011–5015.
27. Pomerantz, R.J., T. Seshamma, and D. Trono. 1992. Efficient replica-
tion of human immunodeficiency virus type 1 requires a threshold level of Rev:potential implications for latency. J. Virol. 66:1809–1813.
28. Seshamma, T., O. Bagasra, T. Trono, D. Baltimore, and R.J. Pomerantz.1992. Blocked early-stage latency in the peripheral blood cells of certain indi-viduals infected with human immunodeficiency virus type 1. Proc. Natl. Acad.Sci. USA. 89:10663–10667.
29. Furtado, M.R., L.A. Kingsley, and S.M. Wolinsky. 1995. Changes in theviral mRNA expression pattern correlate with a rapid rate of CD41 T-cellnumber decline in human immunodeficiency virus type 1-infected individuals.J. Virol. 69:2092–2100.
30. Diviacco, S., P. Norio, L. Zentilin, S. Menzo, M. Clementi, G. Biamonti,S. Riva, A. Falaschi, and M. Giacca. 1992. A novel procedure for quantitativepolymerase chain reaction by coamplification of competitive templates. Gene(Amst.). 122:313–320.
31. Giacca, M., L. Zentilin, P. Norio, S. Diviacco, D. Dimitrova, G. Con-treas, G. Biamonti, G. Perini, F. Weighardt, S. Riva, and A. Falaschi. 1994. Finemapping of a replication origin of human DNA. Proc. Natl. Acad. Sci. USA. 91:7119–7123.
32. Grassi, G., L. Zentilin, S. Tafuro, S. Diviacco, A. Ventura, and M. Gi-acca. 1994. A rapid procedure for the quantitation of low abundance mRNAsby competitive RT-PCR. Nucleic Acids Res. 22:4547–4549.
33. Grassi, G., G. Pozzato, M. Moretti, and M. Giacca. 1995. Quantitativeanalysis of hepatitis C virus RNA in liver biopsies by competitive reverse tran-scription and polymerase chain reaction. J. Hepatol. 23:403–411.
34. Pelizon, C., S. Diviacco, A. Falaschi, and M. Giacca. 1996. High resolu-tion mapping of the origin of DNA replication in the hamster dihydrofolate re-ductase gene domain by competitive polymerase chain reaction. Mol. Cell. Biol.16:5358–5364.
35. Tafuro, S., L. Zentilin, A. Falaschi, and M. Giacca. 1996. Rapid retrovi-rus titration using competitive polymerase chain reaction. Gene Ther. 3:679–684.
36. Bagnarelli, P., A. Valenza, S. Menzo, A. Manzin, G. Salise, P.E.Varaldo, and M. Clementi. 1994. Dynamics of molecular parameters of humanimmunodeficiency virus type 1 activity in vivo. J. Virol. 68:2495–2502.
37. Comar, M., G. Marzio, P. D’Agaro, and M. Giacca. 1996. Quantitativedynamics of HIV-1 expression. AIDS Res. Hum. Retroviruses. 12:117–126.
38. Giacca, M., S. Zanussi, M. Comar, C. Simonelli, E. Vaccher, P. de Paoli,and U. Tirelli. 1996. Treatment of HIV infection with hydroxyurea: virologicaland clinical evaluation. J. Infect. Dis. 174:204–209.
39. Menzo, S., P. Bagnarelli, M. Giacca, A. Manzin, P.E. Varaldo, and M.Clementi. 1992. Absolute quantitation of viremia in HIV-infected asymptom-atic subjects by competitive reverse-transcription and polymerase chain reac-tion. J. Clin. Microbiol. 30:1752–1757.
40. De Rossi, A., S. Masiero, C. Giaquinto, E. Ruga, M. Comar, M. Giacca,and L. Chieco-Bianchi. 1996. Dynamics of viral replication in infants with verti-cally acquired human immunodeficiency virus type 1. J. Clin. Invest. 97:323–330.
41. Zanussi, S., C. Simonelli, M. D’Andrea, M. Comar, E. Bidoli, M. Gi-acca, U. Tirelli, E. Vaccher, and P. De Paoli. 1996. The effects of antineoplasticchemotherapy on HIV disease. AIDS Res. Hum. Retroviruses. 12:1703–1707.
42. Sheppard, H.W., W. Lang, M.S. Asher, E. Vittinghoff, and W. Wilkel-stein. 1993. The characterization of non-progressors: long-term HIV-1 infectionwith stable CD41 T-cell levels. AIDS (Lond.). 7:1159–1166.
43. Buchbinder, S.P., M.H. Katz, N.A. Hessol, P.M. O’Malley, and S.D.Holmberg. 1994. Long-term HIV-1 infection without immunologic progression.AIDS (Lond.). 8:1123–1128.
44. Greenough, T.C., M. Somasundaran, D.B. Brettler, R.M. Hesselton, A.Alimenti, F. Kirchhoff, D. Panicali, and J.L. Sullivan. 1994. Normal immunefunction and inability to isolate virus in culture in an individual with long-termhuman immunodeficiency virus type 1 infection. AIDS Res. Hum. Retroviruses.10:395–403.
45. Easterbrook, P.J. 1994. Non-progression in HIV infection. AIDS(Lond.). 8:1179–1182.
46. Keet, I.P., A. Krol, M.R. Klein, P. Veugelers, J. de Wit, M. Roos, M.Koot, J. Goudsmit, F. Miedema, and R.A. Coutinho. 1994. Characteristics oflong-term asymptomatic infection with human immunodeficiency virus type 1in men with normal and low CD41 cell counts. J. Infect. Dis. 169:1236–1243.
47. Learmont, J., B. Tindall, L. Evans, A. Cunningham, P. Cunningham, J.Wells, R. Penny, J.K. Aldor, and D.A. Cooper. 1992. Long-term symptomlessHIV-1 infection in recipients of blood products from a single donor. Lancet.340:863–867.
48. Michael, N.L., G. Chang, L.A. d’Arcy, P.K. Ehrenberg, R. Mariani,M.P. Busch, D.L. Birx, and D.H. Schwartz. 1995. Defective accessory genes in ahuman immunodeficiency virus type 1–infected long-term survivor lacking re-coverable virus. J. Virol. 69:4228–4236.
49. Kirchhoff, F., T.C. Greenough, D.B. Brettler, J.L. Sullivan, and R.C.Desrosier. 1995. Absence of intact nef sequences in long-term survivor withnonprogressive HIV-1 infection. N. Engl. J. Med. 332:228–232.
50. Cao, Y., L. Qin, L. Zhang, J. Safrit, and D.D. Ho. 1995. Virologic andimmunologic characterization of long-term survivors of human immunodefi-ciency virus type 1 infection. N. Engl. J. Med. 332:201–208.
51. Pantaleo, G., S. Menzo, M. Vaccarezza, C. Graziosi, O.J. Cohen, J.F.

HIV Gene Expression in Long-term Nonprogressives 903
Demarest, D. Montefiori, J.M. Orenstein, C. Fox, L.K. Schrager, et al. 1995.Studies in subjects with long-term nonprogressive human immunodeficiency vi-rus infection. N. Engl. J. Med. 332:209–216.
52. Schwartz, D., U. Sharma, M. Busch, K. Weinhold, T. Matthews, J. Lie-berman, D. Birx, H. Farzedagen, J. Margolick, and T. Quinn. 1994. Absence ofrecoverable infectious virus and unique immune responses in an asymptomaticHIV1 long-term survivor. AIDS Res. Hum. Retroviruses. 10:1703–1711.
53. Montefiori, D.C., G. Pantaleo, L.M. Fink, J.T. Zhou, J.Y. Zhou, M. Bil-ska, G.D. Miralles, and A.S. Fauci. 1996. Neutralizing and infection-enhancingantibody responses to human immunodeficiency virus type 1 in long-term non-progressors. J. Infect. Dis. 173:60–67.
54. Sambrook, J., E.F. Fritsch, and T. Maniatis. 1989. Molecular Cloning. ALaboratory Manual. 2nd ed. Cold Spring Harbor Laboratory, Cold Spring Har-bor, NY. pp. 9.16–9.19.
55. Chomczynski, P., and N. Sacchi. 1987. Single-step method of RNA isola-tion by acid guanidium thiocyanate-phenol-chloroform extraction. Anal. Bio-
chem. 162:156–159.56. Zanussi, S., C. Simonelli, M. D’Andrea, C. Caffau, M. Clerici, U. Tirelli,
and P. DePaoli. 1996. CD81 lymphocyte phenotype and cytokine production inlong-term non-progressor and in progressor patients with HIV-1 infection. Clin.Exp. Immunol. 105:220–224.
57. Dianzani, F., G. Antonelli, E. Riva, S. Uccini, and G. Visco. 1996.Plasma HIV viremia and viral load in lymph nodes - letter. Nat. Med. 2:832–833.
58. Cullen, B.R., and W.C. Greene. 1989. Regulatory pathways governingHIV-1 replication. Cell. 58:423–426.
59. Huynen, M.A., and A.U. Neumann. 1996. Rate of killing of HIV-infectedT cells and disease progression. Science (Wash. DC). 272:1962.
60. Myers, G., S. Wain-Hobson, B. Korber, R.F. Smith, and G.N. Pavlakis.1993. Human retroviruses and AIDS 1993 I-II: a compilation and analysis ofnucleic acid and amino acid sequences. Los Alamos National Laboratory, LosAlamos, NM.