Dynamic responses of wheat to drought and nitrogen stresses during re-watering cycles
10
Agricultural Water Management 146 (2014) 163–172 Contents lists available at ScienceDirect Agricultural Water Management jou rn al hom ep age: www.elsevier.com/locate/agwat Dynamic responses of wheat to drought and nitrogen stresses during re-watering cycles Jianchu Shi a , Hagai Yasuor b , Uri Yermiyahu c , Qiang Zuo a,∗∗ , Alon Ben-Gal c,∗ a Department of Soil and Water Sciences, China Agricultural University; Key Laboratory of Plant-Soil Interactions, Ministry of Education; and Key Laboratory of Arable Land Conservation (North China), Ministry of Agriculture, Beijing 100193, China b Plant Sciences, Agricultural Research Organization, Gilat Research Center, Mobile Post Negev 85280, Israel c Soil, Water and Environmental Sciences, Agricultural Research Organization, Gilat Research Center, Mobile Post Negev 85280, Israel a r t i c l e i n f o Article history: Received 4 April 2014 Accepted 4 August 2014 Keywords: Water use efficiency Nitrogen use efficiency Stress recovery Transpiration Photosynthesis Specific leaf nitrogen a b s t r a c t Temporal responses to drought and nitrogen stresses were studied on wheat (Triticum aestivum) seedlings subjected to drying and re-watering cycles. Growth traits were monitored in a soil column experiment conducted with two water and two nitrogen levels. Leaf area, dry weight, carbon and nitrogen mass, root/shoot ratio, specific leaf nitrogen, photosynthesis, transpiration, and water and nitrogen use effi- ciencies dynamically responded to water and nitrogen stresses as a function of the degree of specific stress over the growing period. Specific leaf nitrogen was critical for improving photosynthetic activ- ity, and influenced water use efficiency positively but nitrogen use efficiency negatively, indicating a distinct trade-off between water and nitrogen use efficiencies. Subsequent to irrigation and the imme- diate alleviation of severity of water and nitrogen stresses, photosynthesis and transpiration recovered gradually over a period of 3–4 days. Extent of recovery was influenced by the degree of stress prior to re-watering and the re-watering cycles. Ignoring the dynamics of recovery from stress led to notable errors in numerical simulations of the dynamics of soil water and plant transpiration. © 2014 Published by Elsevier B.V. 1. Introduction Drought is a major limiting factor for global agriculture and the limitation is greatly aggravated by nitrogen (N) deficiency (Heitholt, 1989; Shangguan et al., 2000; Gonzalez-Dugo et al., 2010). Growers are challenged to optimize plant growth and enhance water and N use efficiencies (WUE and NUE, respectively) under drought and N stresses (Reich et al., 1989; Wu et al., 2008). Abbreviations: DAP, days after planting; DW, dry weight; HN, high nitrogen; HW, high water; LA, leaf area; LN, low nitrogen; LW, low water; LTR, leaf transpira- tion rate; NUE, nitrogen use efficiency; PR, photosynthesis rate; RR/S, ratio of roots to shoots; SLN, specific leaf nitrogen; SNC, soil nitrogen content; SWC, soil water content; WUE, water use efficiency. ∗ Corresponding author at: Agricultural Research Organization, Environmental Physics and Irrigation, Gilat Research Center, Institute of Soil Water and Environ- mental Sciences, 85280 Mobile Post Negev 2, Israel. Tel.: +972 8 9928644: +972 8 9926485. ∗∗ Corresponding author at: Department of Soil and Water Sciences, China Agri- culture University, Beijing 100193, China. Tel.: +86 10 62732504; fax: +89 10 62733596. E-mail addresses: [email protected] (J. Shi), [email protected] (H. Yasuor), [email protected] (U. Yermiyahu), [email protected] (Q. Zuo), [email protected], [email protected] (A. Ben-Gal). Morphological and physiological responses of plants to soil water and/or N availability have received considerable attention in the past decades. Although there are some disagreements (Heitholt, 1989; Ashraf et al., 2001), an enhancement in plant dry weight (DW) ratio of roots to shoots (RR/S) has been widely reported under water and/or N stress conditions (Wilson, 1988; Skinner and Comas, 2010). Both photosynthesis and transpiration are understood to be significantly inhibited by water and/or N stress in a variety of species at both leaf and whole plant scales, as well as in terms of leaf area (LA) and DW (Shimshi, 1970; Hsiao, 1973; Nagarajah, 1981; Borghi, 2000; Wu et al., 2008). Less attention has been paid concerning the effects of the stressers on carbon (C) and N uptake and allocation (Peichl et al., 2012). Regulation of photosynthesis and transpiration is expected to directly influence WUE and NUE, which are, respectively, defined as net C assimilation per transpiration volume and leaf N mass during a given growth period (Reich et al., 1989). Under drought conditions, WUE is widely reported to increase (Shangguan et al., 2000; Liu et al., 2005), but to decrease under N deficiency (Heitholt, 1989; Shangguan et al., 2000; Brueck and Senbayram, 2009). How- ever, this is not universal, as a number of studies demonstrated the opposite case when water (Monclus et al., 2006; Wu et al., 2008; Li et al., 2009; Galle et al., 2011) or N (Hubick, 1990; Wu et al., 2008) is limiting. Comparatively, there is better agreement http://dx.doi.org/10.1016/j.agwat.2014.08.006 0378-3774/© 2014 Published by Elsevier B.V.
-
Upload
independent -
Category
Documents
-
view
3 -
download
0
Transcript of Dynamic responses of wheat to drought and nitrogen stresses during re-watering cycles

Dr
Ja
Lb
c
a
ARA
KWNSTPS
1
t(2eu
Httc
PmT
cT
(b
h0
Agricultural Water Management 146 (2014) 163–172
Contents lists available at ScienceDirect
Agricultural Water Management
jou rn al hom ep age: www.elsev ier .com/ locate /agwat
ynamic responses of wheat to drought and nitrogen stresses duringe-watering cycles
ianchu Shia, Hagai Yasuorb, Uri Yermiyahuc, Qiang Zuoa,∗∗, Alon Ben-Galc,∗
Department of Soil and Water Sciences, China Agricultural University; Key Laboratory of Plant-Soil Interactions, Ministry of Education; and Keyaboratory of Arable Land Conservation (North China), Ministry of Agriculture, Beijing 100193, ChinaPlant Sciences, Agricultural Research Organization, Gilat Research Center, Mobile Post Negev 85280, IsraelSoil, Water and Environmental Sciences, Agricultural Research Organization, Gilat Research Center, Mobile Post Negev 85280, Israel
r t i c l e i n f o
rticle history:eceived 4 April 2014ccepted 4 August 2014
eywords:ater use efficiency
itrogen use efficiencytress recovery
a b s t r a c t
Temporal responses to drought and nitrogen stresses were studied on wheat (Triticum aestivum) seedlingssubjected to drying and re-watering cycles. Growth traits were monitored in a soil column experimentconducted with two water and two nitrogen levels. Leaf area, dry weight, carbon and nitrogen mass,root/shoot ratio, specific leaf nitrogen, photosynthesis, transpiration, and water and nitrogen use effi-ciencies dynamically responded to water and nitrogen stresses as a function of the degree of specificstress over the growing period. Specific leaf nitrogen was critical for improving photosynthetic activ-ity, and influenced water use efficiency positively but nitrogen use efficiency negatively, indicating a
ranspirationhotosynthesispecific leaf nitrogen
distinct trade-off between water and nitrogen use efficiencies. Subsequent to irrigation and the imme-diate alleviation of severity of water and nitrogen stresses, photosynthesis and transpiration recoveredgradually over a period of 3–4 days. Extent of recovery was influenced by the degree of stress prior tore-watering and the re-watering cycles. Ignoring the dynamics of recovery from stress led to notableerrors in numerical simulations of the dynamics of soil water and plant transpiration.
. Introduction
Drought is a major limiting factor for global agriculture andhe limitation is greatly aggravated by nitrogen (N) deficiencyHeitholt, 1989; Shangguan et al., 2000; Gonzalez-Dugo et al.,010). Growers are challenged to optimize plant growth and
nhance water and N use efficiencies (WUE and NUE, respectively)nder drought and N stresses (Reich et al., 1989; Wu et al., 2008).Abbreviations: DAP, days after planting; DW, dry weight; HN, high nitrogen;W, high water; LA, leaf area; LN, low nitrogen; LW, low water; LTR, leaf transpira-
ion rate; NUE, nitrogen use efficiency; PR, photosynthesis rate; RR/S, ratio of rootso shoots; SLN, specific leaf nitrogen; SNC, soil nitrogen content; SWC, soil waterontent; WUE, water use efficiency.∗ Corresponding author at: Agricultural Research Organization, Environmentalhysics and Irrigation, Gilat Research Center, Institute of Soil Water and Environ-ental Sciences, 85280 Mobile Post Negev 2, Israel.
el.: +972 8 9928644: +972 8 9926485.∗∗ Corresponding author at: Department of Soil and Water Sciences, China Agri-ulture University, Beijing 100193, China.el.: +86 10 62732504; fax: +89 10 62733596.
E-mail addresses: [email protected] (J. Shi), [email protected]. Yasuor), [email protected] (U. Yermiyahu), [email protected] (Q. Zuo),[email protected], [email protected] (A. Ben-Gal).
ttp://dx.doi.org/10.1016/j.agwat.2014.08.006378-3774/© 2014 Published by Elsevier B.V.
© 2014 Published by Elsevier B.V.
Morphological and physiological responses of plants to soilwater and/or N availability have received considerable attention inthe past decades. Although there are some disagreements (Heitholt,1989; Ashraf et al., 2001), an enhancement in plant dry weight(DW) ratio of roots to shoots (RR/S) has been widely reported underwater and/or N stress conditions (Wilson, 1988; Skinner and Comas,2010). Both photosynthesis and transpiration are understood tobe significantly inhibited by water and/or N stress in a variety ofspecies at both leaf and whole plant scales, as well as in termsof leaf area (LA) and DW (Shimshi, 1970; Hsiao, 1973; Nagarajah,1981; Borghi, 2000; Wu et al., 2008). Less attention has been paidconcerning the effects of the stressers on carbon (C) and N uptakeand allocation (Peichl et al., 2012).
Regulation of photosynthesis and transpiration is expected todirectly influence WUE and NUE, which are, respectively, definedas net C assimilation per transpiration volume and leaf N massduring a given growth period (Reich et al., 1989). Under droughtconditions, WUE is widely reported to increase (Shangguan et al.,2000; Liu et al., 2005), but to decrease under N deficiency (Heitholt,1989; Shangguan et al., 2000; Brueck and Senbayram, 2009). How-
ever, this is not universal, as a number of studies demonstratedthe opposite case when water (Monclus et al., 2006; Wu et al.,2008; Li et al., 2009; Galle et al., 2011) or N (Hubick, 1990; Wuet al., 2008) is limiting. Comparatively, there is better agreement
1 r Man
cs(1
ricuiFwcAfwtotp
tgup2vdtfl2aDt2
dltr2rpeivnedaiordmtdperwis1fu
64 J. Shi et al. / Agricultural Wate
oncerning NUE: repression is usually found under drought, andtrong enhancement of NUE is universally induced by N deficiencyReich et al., 1989; Fredeen et al., 1991; Van den Boogaard et al.,995).
Besides plant species and varieties (Galle et al., 2011), theeferred discrepancies may be credited to the fact that the stud-es were conducted over diverse growth stages and environmentalonditions (Flexas et al., 2004; Brueck and Senbayram, 2009). Evennder stable water and/or N stress, plant responses might vary dur-
ng different growth stages. For example, in sunflower, Cechin andumis (2004) found that leaf transpiration rate (LTR) under N stressas reduced only at the beginning of leaf growth. Except in limited
ases (Jose et al., 2003; Cechin and Fumis, 2004; Wu et al., 2008;chten et al., 2010), most of the previous studies were subjected to
ew individual samplings, and plant dynamic characteristics underater and/or N stress were seldom examined. Furthermore, due
o the overall interest in grain yield, relatively little effort focusedn plant vegetative development, in spite of the fact that vegeta-ive development is expected to considerably influence grain yieldotential (Wilhelm et al., 1993).
Wheat is the world’s most widely grown crop and its cultiva-ion embraces approximately one sixth of the total arable landlobally (Slafer and Satorre, 2000). While wheat is mainly croppednder rainfed conditions, irrigation has been found enable or raiseroduction, especially in arid or semi-arid areas (Shangguan et al.,000). Wheat development is characterized by three phases: a shortegetative phase in which number of leaves is determined, a repro-uctive stage beginning with spikelet initiation and finishing withhe initiation of the terminal spikelet in which the number of fertileorets is determined, and a grain-filling phase (Miralles and Slafer,000). These developmental changes are accompanied by increasedssimilation and nutrient demands of the vegetative organs.uring the vegetative phase, N undergoes continuous transloca-
ion within plants, back and forth from roots to shoots (Borghi,000).
Many experiments have been conducted on plant growth underrought conditions and as soil water content (SWC) increases fol-
owing re-watering (Boyer, 1971; Heckathorn et al., 1997). Some ofhe studies showed that plant growth measured as LA and DW wasemarkably stimulated by re-watering following drought (Liu et al.,001; Reynolds et al., 2004; Siopongco et al., 2006), while otheresearchers found that plant growth characteristics such as leafhotosynthesis rate (PR) and LTR recovered gradually (Miyashitat al., 2005; Galmés et al., 2007). Furthermore, recovery can bencomplete and its extent is apparently influenced by plant species,ariety, plant or leaf age, severity of stress prior to re-watering, andumber of consecutive drying cycles (Flexas et al., 2004; Miyashitat al., 2005; Galmés et al., 2007; Xu et al., 2009). Plant recovery fromrought after re-watering has not been fully clarified and has beenttributed to various morphological, physiological and biochem-cal mechanisms, including maintenance of membrane stability,smotic adjustment, phytohormone accumulation, delay in leafolling during stress and increased C partitioning and carbohy-rate storage in plant organs (Xu et al., 2009; Hu et al., 2010). Inost wheat growing regions, rainfall and irrigation patterns dic-
ate drought and re-watering cycles that can occur at any of theifferent stages during the plant life cycle (Borghi, 2000). As com-ared to trees, grasses or other crops (Flexas et al., 2004; Miyashitat al., 2005; Siopongco et al., 2006; Xu et al., 2009), less attentionegarding plant recovery from drought has been paid regardingheat (Liu et al., 2001). Furthermore, root-water-uptake models,
ncorporating soil water flow equations, are commonly applied to
imulate soil water flow as well as plant transpiration (Feddes et al.,976; Wu et al., 1999; Shi and Zuo, 2009). However, plant recoveryrom drought is hardly considered in the published root-water-ptake models.agement 146 (2014) 163–172
The main objective of this study was to examine thedynamic responses of plant traits to water and N treatmentson wheat subjected to drought and re-watering cycles, and totest whether the processes could be accurately reflected bysimulation of plant transpiration using a popular root-water-uptake model.
2. Material and methods
2.1. Soil column experiment for winter wheat
Winter wheat (Triticum aestivum L. cv. Jingdong 8) was grownin 53 cm high soil columns in a greenhouse experiment (Shi andZuo, 2009; Shi et al., 2013). The following four treatments wereinitiated at 20:00 on 10 DAP, and subsequently irrigated every6 days: (1) high water high N (HWHN), (2) high water low N(HWLN), (3) low water high N (LWHN), and (4) low water low N(LWLN). The average root zone SWC for high water (HW) treat-ments was designed to be no less than 80% of field water capacity.The irrigation quantity for low water (LW) treatments was designedto be half that of HW treatments. The high nitrogen (HN) treat-ments were irrigated with half-strength Hoagland solution withNO3
−–N = 0.105 mg cm−3, while the low nitrogen (LN) treatmentswere irrigated with modified half-strength Hoagland solution hav-ing NO3
−–N = 0.011 mg cm−3.Sampling was conducted twice every 6 d (0.5 and 5.5 days after
each irrigation event), for a total of 16 samplings between 10 and57.5 DAP under each treatment. Two columns of each treatmentwere selected randomly for shoot removal and were opened tosample soil from surface to rooting depth (2 cm thick layer for thefirst two samplings and 4 cm layer for the later 14 samplings). Aportion of each soil sample was used to determine soil water con-tent and the rest was extracted with 0.01 mmol cm−3 CaCl2 solutionand analyzed with a continuous flow analyzer (TRAACS 2000,Bran + Luebbe, Norderstedt, Germany) to determine soil solutionN concentration (N mass per unit soil solution volume, mg cm−3).The opened soil columns were cut into layers at the same inter-vals as for soil samples, and each layer was washed via a 0.05 cmdiameter sieve to collect roots. The roots from each soil layer weredried to a constant weight at 70 ◦C to determine DW, and tissueC and N concentrations (C or N mass per unit DW, mg g−1) weremeasured with an element analyzer (CHNSO EA 1108, Carlo Erba,Italy). The shoots were scanned (SNAPSCAN 1236, AGFA, Germany)and analyzed for LA, and then DW, tissue C and N concentrationswere measured.
Two soil columns for each treatment were chosen to measurenet canopy PR from 8:00 to 10:00 in the morning every day, witha stirred canopy chamber operated as a closed system (Held et al.,1990; Steduto and Hsiao, 1998). The chamber was made of a Per-spex cuvette (50 cm high, 0.6 cm thick and 30 cm in diameter;internal volume = 0.04 m3), and was sealed with a Perspex coverat the top. A fan was located under the cover to mix the air in thechamber. A small hole at the top of the chamber was used to con-nect a gas-exchange system (Li-6400; Li-Cor, Lincoln, NE, USA). Atthe bottom of the chamber, a Perspex cover with a 16 cm diameterhole was affixed with rubber sealing where it could be joined to theupper soil boundary in the soil column. The decrease of CO2 con-centration during a period was monitored as soon as the chamberwas placed over the soil column. In order to mitigate the effectof the increase of humidity and the decrease of CO2 concentra-tion on plant photosynthesis in the chamber, a short period was
set as 30 s. The measurements were repeated four times for eachsoil column, with the chamber removed from the soil column andaired for at least 60 s between successive measurements. Addition-ally, two soil columns from each treatment without plants were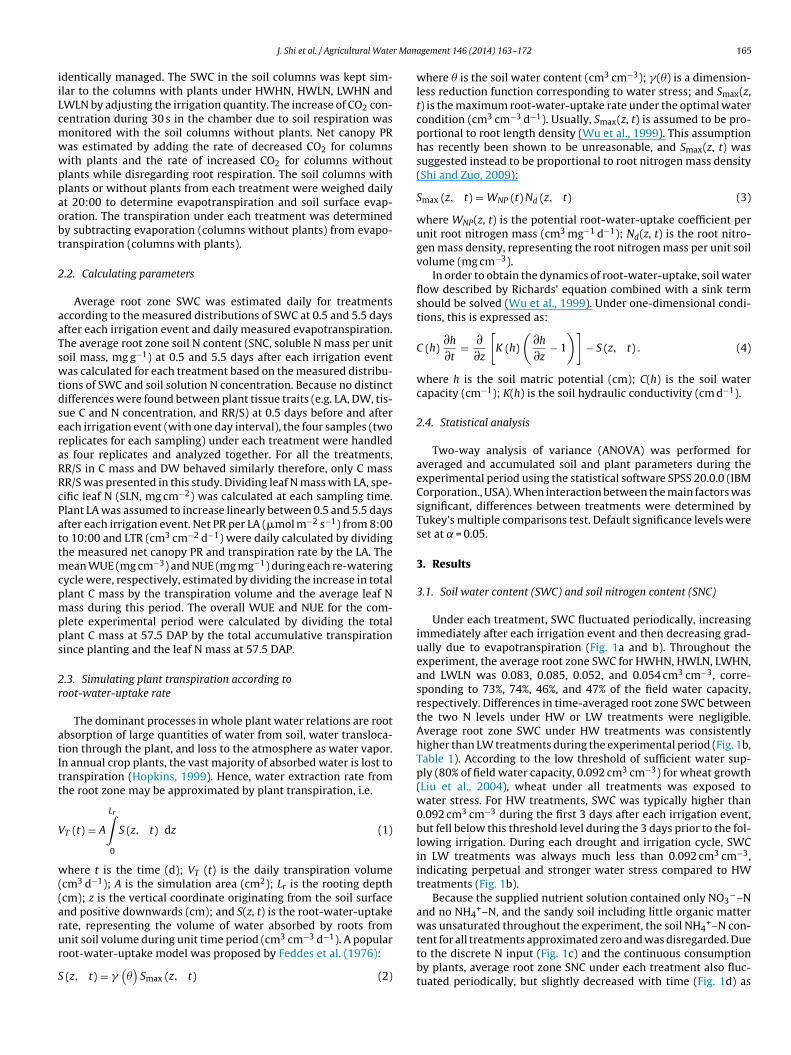
r Man
iiLcmwwppaobt
2
aaTswtdseraRRcPattmcpmpps
2r
atItt
V
w((arur
S
J. Shi et al. / Agricultural Wate
dentically managed. The SWC in the soil columns was kept sim-lar to the columns with plants under HWHN, HWLN, LWHN andWLN by adjusting the irrigation quantity. The increase of CO2 con-entration during 30 s in the chamber due to soil respiration wasonitored with the soil columns without plants. Net canopy PRas estimated by adding the rate of decreased CO2 for columnsith plants and the rate of increased CO2 for columns withoutlants while disregarding root respiration. The soil columns withlants or without plants from each treatment were weighed dailyt 20:00 to determine evapotranspiration and soil surface evap-ration. The transpiration under each treatment was determinedy subtracting evaporation (columns without plants) from evapo-ranspiration (columns with plants).
.2. Calculating parameters
Average root zone SWC was estimated daily for treatmentsccording to the measured distributions of SWC at 0.5 and 5.5 daysfter each irrigation event and daily measured evapotranspiration.he average root zone soil N content (SNC, soluble N mass per unitoil mass, mg g−1) at 0.5 and 5.5 days after each irrigation eventas calculated for each treatment based on the measured distribu-
ions of SWC and soil solution N concentration. Because no distinctifferences were found between plant tissue traits (e.g. LA, DW, tis-ue C and N concentration, and RR/S) at 0.5 days before and afterach irrigation event (with one day interval), the four samples (twoeplicates for each sampling) under each treatment were handleds four replicates and analyzed together. For all the treatments,R/S in C mass and DW behaved similarly therefore, only C massR/S was presented in this study. Dividing leaf N mass with LA, spe-ific leaf N (SLN, mg cm−2) was calculated at each sampling time.lant LA was assumed to increase linearly between 0.5 and 5.5 daysfter each irrigation event. Net PR per LA (�mol m−2 s−1) from 8:00o 10:00 and LTR (cm3 cm−2 d−1) were daily calculated by dividinghe measured net canopy PR and transpiration rate by the LA. The
ean WUE (mg cm−3) and NUE (mg mg−1) during each re-wateringycle were, respectively, estimated by dividing the increase in totallant C mass by the transpiration volume and the average leaf Nass during this period. The overall WUE and NUE for the com-
lete experimental period were calculated by dividing the totallant C mass at 57.5 DAP by the total accumulative transpirationince planting and the leaf N mass at 57.5 DAP.
.3. Simulating plant transpiration according tooot-water-uptake rate
The dominant processes in whole plant water relations are rootbsorption of large quantities of water from soil, water transloca-ion through the plant, and loss to the atmosphere as water vapor.n annual crop plants, the vast majority of absorbed water is lost toranspiration (Hopkins, 1999). Hence, water extraction rate fromhe root zone may be approximated by plant transpiration, i.e.
T (t) = A
Lr∫0
S (z, t) dz (1)
here t is the time (d); VT (t) is the daily transpiration volumecm3 d−1); A is the simulation area (cm2); Lr is the rooting depthcm); z is the vertical coordinate originating from the soil surfacend positive downwards (cm); and S(z, t) is the root-water-uptakeate, representing the volume of water absorbed by roots from
nit soil volume during unit time period (cm3 cm−3 d−1). A popularoot-water-uptake model was proposed by Feddes et al. (1976):(z, t) = �(
�)
Smax (z, t) (2)
agement 146 (2014) 163–172 165
where � is the soil water content (cm3 cm−3); �(�) is a dimension-less reduction function corresponding to water stress; and Smax(z,t) is the maximum root-water-uptake rate under the optimal watercondition (cm3 cm−3 d−1). Usually, Smax(z, t) is assumed to be pro-portional to root length density (Wu et al., 1999). This assumptionhas recently been shown to be unreasonable, and Smax(z, t) wassuggested instead to be proportional to root nitrogen mass density(Shi and Zuo, 2009):
Smax (z, t) = WNP (t) Nd (z, t) (3)
where WNP(z, t) is the potential root-water-uptake coefficient perunit root nitrogen mass (cm3 mg−1 d−1); Nd(z, t) is the root nitro-gen mass density, representing the root nitrogen mass per unit soilvolume (mg cm−3).
In order to obtain the dynamics of root-water-uptake, soil waterflow described by Richards’ equation combined with a sink termshould be solved (Wu et al., 1999). Under one-dimensional condi-tions, this is expressed as:
C (h)∂h
∂t= ∂
∂z
[K (h)
(∂h
∂z− 1
)]− S (z, t) . (4)
where h is the soil matric potential (cm); C(h) is the soil watercapacity (cm−1); K(h) is the soil hydraulic conductivity (cm d−1).
2.4. Statistical analysis
Two-way analysis of variance (ANOVA) was performed foraveraged and accumulated soil and plant parameters during theexperimental period using the statistical software SPSS 20.0.0 (IBMCorporation., USA). When interaction between the main factors wassignificant, differences between treatments were determined byTukey’s multiple comparisons test. Default significance levels wereset at = 0.05.
3. Results
3.1. Soil water content (SWC) and soil nitrogen content (SNC)
Under each treatment, SWC fluctuated periodically, increasingimmediately after each irrigation event and then decreasing grad-ually due to evapotranspiration (Fig. 1a and b). Throughout theexperiment, the average root zone SWC for HWHN, HWLN, LWHN,and LWLN was 0.083, 0.085, 0.052, and 0.054 cm3 cm−3, corre-sponding to 73%, 74%, 46%, and 47% of the field water capacity,respectively. Differences in time-averaged root zone SWC betweenthe two N levels under HW or LW treatments were negligible.Average root zone SWC under HW treatments was consistentlyhigher than LW treatments during the experimental period (Fig. 1b,Table 1). According to the low threshold of sufficient water sup-ply (80% of field water capacity, 0.092 cm3 cm−3) for wheat growth(Liu et al., 2004), wheat under all treatments was exposed towater stress. For HW treatments, SWC was typically higher than0.092 cm3 cm−3 during the first 3 days after each irrigation event,but fell below this threshold level during the 3 days prior to the fol-lowing irrigation. During each drought and irrigation cycle, SWCin LW treatments was always much less than 0.092 cm3 cm−3,indicating perpetual and stronger water stress compared to HWtreatments (Fig. 1b).
Because the supplied nutrient solution contained only NO3−–N
and no NH4+–N, and the sandy soil including little organic matter
was unsaturated throughout the experiment, the soil NH4+–N con-
tent for all treatments approximated zero and was disregarded. Dueto the discrete N input (Fig. 1c) and the continuous consumptionby plants, average root zone SNC under each treatment also fluc-tuated periodically, but slightly decreased with time (Fig. 1d) as

166 J. Shi et al. / Agricultural Water Management 146 (2014) 163–172
0
10
20
30
40
50
5846342210
Irri
gat
ed n
itro
gen
(m
g)
DAP
HWHN
HWLN
LWHN
LWLN
0
100
200
300
400
500
Irri
gat
ed w
ater
(cm
3 )
0.02
0.04
0.06
0.08
0.1
0.12
So
il w
ater
co
nte
nt
(cm
3cm
-3)
0
0.002
0.004
0.006
0.008
0.01
5846342210
Soil
nit
rogen
conte
nt
(mg g
)-1
DAP
HWHN
HWLN
LWHN
LWLN
ba
d c
F waters nitroa in Ta
cact
3
wtwt
TTcs
ig. 1. The dynamics of (a) irrigated water volume per soil column, (b) average soil
oil nitrogen content over root zone under high water (HW), low water (LW), highnalysis of time averaged soil water content and soil nitrogen content data is found
onsumption exceeded input. During the experimental period,lthough SNC under HN or HW treatments was generally higherompared to LN or LN treatments, respectively (Fig. 1d), the statis-ical difference was not significant (Table 1).
.2. Plant development and resource allocation
Plant LA, DW, C and N mass per soil column increased with
heat growth under all treatments (Fig. 2). Compared to HWreatments, time-averaged growth traits under LW treatmentsere significantly restricted. Nitrogen deficiency also inhibited
hese traits, especially under HW treatments. Furthermore,
able 1wo-way ANOVA for time-averaged soil water content, soil nitrogen content, leaf area,
olumn under high (H) water, low (L) water, H nitrogen and L nitrogen conditions. Treaignificance levels were set at = 0.05.
Treatments Soil water content(cm3 cm−3)
Soil nitrogencontent (mg g−1)
Water Nitrogen
H H 0.083 A 0.0061 A
H L 0.085 A 0.0037 B
L H 0.052 B 0.0050 C
L L 0.054 B 0.0031 B
WaterH 0.084 A 0.0049 A
L 0.053 B 0.0041 A
NitrogenH 0.068 A 0.0056 A
L 0.070 A 0.0034 A
Water × nitrogen No No
content over root zone, (c) irrigated nitrogen mass per soil column, and (d) averagegen (HN), and low nitrogen (LN) treatments. DAP = days after planting. Statistical
ble 1.
significant interaction between the effects of drought and N stresseswas found (Table 1). Unlike the patterns of the other three traits(Fig. 2a–c), plant N mass under HWLN was close to or less thanthat under LWHN (Fig. 2d). For nearly all the experimental period,SLN decreased in order of LWHN, HWHN, LWLN and HWLN (Fig. 3).This suggests that SLN was consistently enhanced by drought butinhibited by N deficiency (Table 2). In general, SLN decreased until34 DAP under all water and N treatments, then kept stable under
LN treatments but increased gradually with plant age under HNtreatments (Fig. 3).Both C and N mass RR/S increased during the early growth period(before 28 DAP), while in the latter developmental stages a gradual
plant dry weight, plant carbon mass, and plant nitrogen mass for wheat in a soiltments accompanied with the same letter are not significantly different. Default
Leaf area(cm2)
Plant dryweight (g)
Plant carbonmass (mg)
Plant nitrogenmass (mg)
430.9 A 3.50 A 1499.5 A 81.9 A317.6 B 2.82 B 1172.9 B 43.5 B196.8 C 1.84 C 794.7 C 46.7 B180.5 C 1.69 C 698.2 C 29.5 C
374.3 A 3.16 A 1336.2 A 62.7 A188.7 B 1.77 B 746.5 B 38.1 B
313.9 A 2.67 A 1147.1 A 64.3 A249.1 B 2.26 B 935.6 B 36.5 B
Yes Yes Yes Yes

J. Shi et al. / Agricultural Water Management 146 (2014) 163–172 167
0
4
8
12
Dry
wei
ght
(g)
0
1000
2000
3000
4000
5000
5846342210
Car
bo
n m
ass
(mg
)
DAP
0
400
800
1200
Lea
f ar
ea (
cm2)
HWHN
HWLN
LWHN
LWLN
0
50
100
150
200
250
5846342210
Nit
rog
en m
ass
(mg
)
DAP
ba
dc
F n ma( s indic
dgdNFucatlLwe
TT8t
ig. 2. The dynamics of (a) leaf area, (b) dry weight, (c) carbon mass, and (d) nitrogeHN), and low nitrogen (LN) treatments. DAP = days after planting. Vertical error bar
ecrease was observed (Fig. 4). Carbon mass RR/S was consistentlyreater than that of N mass under all the treatments, becauseifferences in C concentrations of roots and shoots were small but
concentrations of roots were much lower compared to shoots.or example, the C concentrations of roots and shoots at 57.5 DAPnder LWLN were 411.1 and 414.1 mg g−1, the corresponding Noncentrations were 7.2 and 16.7 mg g−1, and their DWs were 1.5nd 2.7 g, resulting in C and N mass RR/S of 0.55 and 0.24, respec-ively. The C mass RR/S over time was greatest under LWLN and
owest under HWHN, and had similar, intermediate values underWHN and HWLN (Fig. 4a). The N mass RR/S under LN treatmentsas higher compared to HN treatments, while no significant differ-nce was found due to different water levels (Fig. 4b). Significant
able 2wo-way ANOVA for time-averaged specific leaf nitrogen, carbon mass ratio of roots to s:00 and 10:00, and daily transpiration for wheat in a soil column under high (H) water, lhe same letter are not significantly different. Default significance levels were set at = 0
Treatments Specific leafnitrogen (mg cm−2)
Carbon mass ratioof roots to shoots
Water Nitrogen
H H 0.18 A 0.41 A
H L 0.13 B 0.49 B
L H 0.21 C 0.55 B
L L 0.15 D 0.59 C
WaterH 0.16 A 0.45 A
L 0.18 B 0.55 B
NitrogenH 0.20 A 0.46 A
L 0.14 B 0.54 B
Water × nitrogen No No
ss of wheat in a soil column under high water (HW), low water (LW), high nitrogenate ±1 standard error. Statistical analysis of time averaged data is found in Table 1.
interaction between the effects of drought and N stresses on C or Nmass RR/S was not found (Table 2).
3.3. Photosynthesis and transpiration
The measured increment of chamber CO2 concentration wasnegligible for the soil column without plants under each treat-ment, therefore the decreased rate of chamber CO2 concentrationfor the column with plants, disregarding possible effects of root
respiration, was assumed to represent net canopy PR. Net canopyPR measured from 8:00 to 10:00 and daily transpiration gener-ally increased with plant age under each treatment (Fig. 5a andb). During each irrigation and drought cycle, both whole planthoots, nitrogen mass ratio of roots to shoots, canopy photosynthesis rate betweenow (L) water, H nitrogen and L nitrogen conditions. Treatments accompanied with.05.
Nitrogen mass ratioof roots to shoots
Canopy photosynthesisrate (�mol s−1)
Daily transpiration(cm3 d−1)
0.21 A 0.102 A 30.39 A0.27 B 0.068 B 24.93 B0.22 A 0.043 C 13.40 C0.29 B 0.037 C 12.40 C
0.24 A 0.085 A 27.66 A0.26 A 0.040 B 12.90 B
0.22 A 0.073 A 21.90 A0.28 B 0.053 B 18.67 B
No Yes No

168 J. Shi et al. / Agricultural Water Man
0
0.1
0.2
0.3
5846342210
Spec
ific
lea
f nit
rogen
(m
g c
m-2
)
DAP
HWHN
HWLN
LWHN
LWLN
Fig. 3. The dynamics of specific leaf nitrogen of wheat in a soil column under highwmi
pLatpNif
F(nef
ater (HW), low water (LW), high nitrogen (HN), and low nitrogen (LN) treat-ents. DAP = days after planting. Statistical analysis of time averaged data is found
n Table 2.
hotosynthesis and transpiration increased over the first 3 (forW treatments) or 4 (for HW treatments) days following irrigationnd then decreased until the next irrigation. Furthermore, PR andranspiration were significantly higher under HW treatments com-ared to LW treatments, and were further increased with increased
supply, especially when plants were well irrigated. Significantnteraction between the effects of drought and N stresses was foundor net canopy PR but not for daily transpiration (Table 2). Leaf scale
0.2
0.3
0.4
0.5
0.6
0.7
Car
bo
n m
ass
RR
/S
HWHN
HWLN
LWHN
LWLN
0.1
0.2
0.3
0.4
5846342210
Nit
rogen
mas
s R
R/S
DAP
a
b
ig. 4. The dynamics of (a) carbon and (b) nitrogen mass ratio of roots to shootsRR/S) of wheat in a soil column under high water (HW), low water (LW), highitrogen (HN), and low nitrogen (LN) treatments. DAP = days after planting. Verticalrror bars indicate ±1 standard error. Statistical analysis of time averaged data isound in Table 2.
agement 146 (2014) 163–172
PR and transpiration rate (normalized to LA) largely decreased dur-ing plant development, particularly until 40 DAP (Fig. 5c and d).Similar to whole plant photosynthesis and transpiration (Fig. 5aand b), both PR per LA and LTR increased during the first 3 or 4 daysafter irrigation and subsequently decreased during the remainderof each re-watering cycle. The difference in leaf scale PR or tran-spiration rate among the water and N treatments was not clear inFig. 5c or d.
3.4. Water use efficiency (WUE) and nitrogen use efficiency (NUE)
The mean WUE over a re-watering cycle decreased until 34 DAP(46 DAP for HWLN), and subsequently increased with time as plantsdeveloped (Fig. 6a). Contrary to WUE, NUE first increased until 22DAP (28 DAP for HWLN), and then decreased gradually with plantdevelopment (Fig. 6b). Significant differences were found for bothWUE and NUE among water and nitrogen treatments. During theentire experimental period, WUE was consistently highest underLWHN and lowest under HWLN, and was intermediate for HWHNand LWLN. For HWLN, LWLN, HWHN and LWHN treatments, NUEdecreased in turn.
4. Discussion
4.1. Recovery of photosynthesis and transpiration from stress
During each drought and irrigation cycle, the severities ofdrought and N deficiency were immediately alleviated under alltreatments following irrigation events (Fig. 1). Photosynthesis andtranspiration only gradually recovered from drought after re-watering even under HW treatments (Fig. 5). This is likely the resultof stress-induced inhibition of photosynthetic processes, includ-ing (1) inhibition of all enzymes involved in the regeneration ofribulose-1,5-bisphosphate in the Calvin cycle; (2) water stress-induced oxidative stress and protective responses; (3) effect onphotophosphorylation; and (4) involvement of CO2 diffusion insideleaves (Flexas et al., 2004). Other processes such as ribulose-1,5-bisphosphate carboxylase/oxygenase (Rubisco) activity may alsoaffect photosynthesis recovery after severe water stress (Flexaset al., 2004, 2006).
The coincidence between the termination of recovery and thereturn of indicators of drought stress (3 days after re-watering)even under HW treatments indicated that maximum recovery lev-els might be less than potential, especially for LW treatments.Boyer (1971) reported that after desiccation to leaf water potentialbelow −1.2 MPa, the recovery of photosynthesis and transpirationin sunflower was incomplete. The highest net PR per LA and LTRunder HWHN among the four treatments indicated recovery wasgreatly restricted by the severity of stress prior to re-wetting, whichagreed with findings from Miyashita et al. (2005) for kidney bean.Recovery levels reached were higher during early drought andirrigation cycles compared to the subsequent cycles (Fig. 5c andd), similar to results from Flexas et al. (1999) for grapevines. Thenet PR per LA and LTR under HWLN recovered 1.60 �mol m−2 s−1
(from 2.33 to 3.93 �mol m−2 s−1) and 0.06 cm3 cm−2 d−1 (from0.06 to 0.12 cm3 cm−2 d−1) during 22–25 DAP, respectively, butonly 0.78 �mol m−2 s−1 (from 1.37 to 2.15 �mol m−2 s−1) and0.04 cm3 cm−2 d−1 (from 0.05 to 0.09 cm3 cm−2 d−1) during 52–55DAP. Furthermore, about 40–50% recovery of net PR per LA andLTR for all the treatments occurred during the first day after re-watering, similar to that found by Marron et al. (2002) for poplars.
The dynamics of soil water flow and root-water-uptake for thefour treatments conducted in this study, from 0.5 to 5.5 days aftereach irrigation event, have been simulated in Shi and Zuo (2009) bysolving Eq. (4). The simulated distributions of SWC at 5.5 days after

J. Shi et al. / Agricultural Water Management 146 (2014) 163–172 169
0
20
40
60
80
Dai
ly t
ran
spir
atio
n (
cm3
d-1
)
0
0.04
0.08
0.12
0.16
0.2
5846342210
Lea
f tr
ansp
irat
ion
rat
e (c
m3
cm-2
d-1
)
DAP
0
0.1
0.2
0.3
Net
can
op
y P
R (
μm
ol
s-1)
HWHN
HWLN
LWHN
LWLN
0
2
4
6
8
5846342210
Net
PR
per
LA
(μ
mo
l m
-2s-1
)
DAP
b a
c d
Fig. 5. The dynamics of (a) net canopy photosynthesis rate (PR) from 8:00 to 10:00, (b) daily transpiration, (c) net PR per leaf area (LA) from 8:00 to 10:00, and (d) leaft LW),
S cumul
eZpEps(aaeustsdtmvaicrCafsn
4
o
ranspiration rate of wheat in a soil column under high water (HW), low water (tatistical analysis of time averaged PR and transpiration is found in Table 2 and ac
ach irrigation event compared well to the measured data (Shi anduo, 2009). Based on the simulated dynamics of root-water-uptake,lant daily transpiration under each treatment was calculated withq. (1), providing the total transpiration during each simulationeriod. Although the relative errors between simulated and mea-ured total transpiration were less than 10% under all treatmentsShi and Zuo, 2009), the simulated daily transpiration (Fig. 7) did notccurately reflect the waveform change over time (gradual increasend subsequent decrease, seen in Fig. 5b) with a root mean squaredrror of 11.3 cm3 d−1, 5.2 cm3 d−1, 6.4 cm3 d−1, and 4.6 cm3 d−1
nder HWHN, HWLN, LWHN, and LWLN, respectively. Due to theource-sink relationship between soil water and plant transpira-ion, it could be concluded that there was also difference betweenimulated and actual soil water dynamics during the intermediateays within a drought and rewetting cycle. The difference betweenhe actual and simulated dynamics of soil water and transpiration
ight primarily result from the adopted root-water-uptake model,iz. Eqs. (2) and (3), which considers only the instantaneous effect oftmospheric condition, soil water content, and root quantity, whilegnoring the hysteretic effect of stress. A possible, albeit techni-ally challenging, solution for this problem would be to modify theoot-water-uptake model by including a stress recovery coefficient.olaizzi et al. (2003) introduced such a stress recovery coefficient toccount for reduced actual evapotranspiration as plants recoveredrom drought based on reference evapotranspiration. However, thetress degree prior to re-watering and the recovery dynamics wereot directly considered in their solution.
.2. Dynamic responses of wheat growth to water and N stresses
The accumulated carbon fixation and transpiration per leaf areaver time indicated that leaf scale PR was significantly restricted
high nitrogen (HN), and low nitrogen (LN) treatments. DAP = days after planting.ative PR per leaf area and transpiration per leaf area is found in Table 3.
by both water and nitrogen deficiencies while LTR was only signif-icantly limited by water deficiency (Fig. 8, Table 3). Moreover, nosignificant interaction was found between the effects of droughtand N stresses. The enhanced leaf photosynthesis under HN treat-ments compared to LN treatments may be attributed to the higherSLN (Fig. 3) (Walters and Reich, 1989; Connor et al., 1993; Gonzalez-Dugo et al., 2010). Elevated SLN indicates higher content of Rubisco,occupying a high proportion of N in leaf tissue and playing a cen-tral role in photosynthesis (Jones, 1998; Stitt and Krapp, 1999).However, the greater SLN under LW treatments (Fig. 3) did notresult in higher accumulative C fixation per LA in comparison tothe HW treatments (Fig. 8, Table 3). This might be attributed to thedecreased Rubisco activity under drought conditions (Boyer, 1976;Lawlor, 1995; Parry et al., 2002; Flexas et al., 2006).
At the whole plant level, wheat growth was consistentlyrestricted by water and/or N stress throughout the experimentalperiod (Figs. 2 and 5a and b). These results support previous stud-ies for other wheat varieties (Frederick and Camberato, 1995), longleaf pine (Jose et al., 2003), sunflower (Cechin and Fumis, 2004),and shrub (Wu et al., 2008). The constraint of N stress on plantgrowth was particularly apparent when water was less limiting,suggesting that the contribution of sufficient N supply may onlyreach its potential when wheat is well watered. Under water and/orN stress conditions, even though DW, C and N mass of both roots andshoots were repressed as compared to HWHN treatment, RR/S wasconsistently enhanced (Fig. 4). This shows that relatively greaterresources were allocated into roots, suggesting a possible mech-anism for coping with water and N stresses (Achten et al., 2010).
The results support others where increased RR/S under water andN stressful conditions was explained primarily by inhibited aboveground plant growth rather than the increased relative root growth(Chapin et al., 1987; Wilson, 1988; Chapin, 1991; Skinner and
170 J. Shi et al. / Agricultural Water Management 146 (2014) 163–172
Table 3Two-way ANOVA for the accumulative carbon fixation per leaf area measured daily between 8:00 and 10:00, the accumulative transpiration per leaf area at the end ofexperiment, the overall water use efficiency and nitrogen use efficiency during the complete experimental period for wheat in a soil column under high (H) water, low (L)water, H nitrogen and L nitrogen conditions. Treatments accompanied with the same letter are not significantly different. Default significance levels were set at = 0.05.
Treatments Accumulative carbon fixationper leaf area (�mol cm−2)
Accumulative transpiration perleaf area (cm3 cm−2)
Overall water useefficiency (mg cm−3)
Overall nitrogen useefficiency (mg mg−1)
Water Nitrogen
H H 110.25 4.09 2.94 23.70H L 98.29 4.30 2.50 45.87L H 101.62 3.59 3.07 21.33L L 89.15 3.63 2.84 38.55
WaterH 104.27A 4.19A 2.72A 34.78AL 95.39B 3.61B 2.95B 29.94B
Nitrogen4A
7A
Cst6rd
4
i
FchS
H 105.93A 3.8L 99.17B 3.8Water × nitrogen No No
omas, 2010). In the present study, for example, the C mass peroil column at the end of experiment in roots and shoots, respec-ively, was 934.5 and 3346.2 mg for HWHN (RR/S = 0.28), and was16.2 and 1109.8 mg for LWLN (RR/S = 0.56). Compared to HWHN,oot C mass under LWLN decreased 34.06%, while shoot C massecreased 66.84%.
.3. Dynamic responses of WUE and NUE to water and N stresses
Similar to the present results (Fig. 6a, Table 3), previous stud-es have found that WUE of a variety of crops including soybean
2
2.5
3
3.5
4
Wat
er u
se e
ffic
iency
(m
g c
m-3
)
HWHN
HWLN
LWHN
LWLN
4
8
12
16
5846342210
Nit
rogen
use
eff
icie
ncy
(m
g m
g-1
)
DAP
a
b
ig. 6. The dynamics of (a) water use efficiency (WUE) and (b) nitrogen use effi-iency (NUE) of wheat in a soil column under high water (HW), low water (LW),igh nitrogen (HN), and low nitrogen (LN) treatments. DAP = days after planting.tatistical analysis of overall WUE and NUE is found in Table 3.
3.00A 22.52A2.87B 32.49B
No No
(Liu et al., 2005), tobacco (Brueck and Senbayram, 2009) and wheat(Heitholt, 1989; Shangguan et al., 2000) was significantly improvedby drought but inhibited by N deficiency. The NUE repressed bydrought but enhanced by N deficiency (Fig. 6b, Table 3) was alsosupported previously by results for elm trees (Reich et al., 1989)and sunflower (Fredeen et al., 1991) regardless of field-grown orcontrolled environmental conditions. The greater decrease of tran-spiration in comparison to C fixation per LA (Fig. 8) under LWtreatments brought about a higher WUE compared to HW treat-ments, which associated well with a lower NUE (dividing lower Cfixation per LA by larger SLN shown in Fig. 3) (Fig. 6). Additionally,the greater decrease of SLN (Fig. 3) in comparison to C fixation perLA (Fig. 8) under LN treatments led to a higher NUE compared to HNtreatments, which also coincided well with a lower WUE (dividinglower C fixation per LA by almost equivalent LTR) (Fig. 6).
Consequently, SLN was demonstrated to be a successful indica-tor of the responses of WUE and NUE to drought and N stresses.Morgan (1984) and Heitholt (1989) denoted that optimal leaf Nconcentration promoted higher WUE in wheat. Reich et al. (1989)found that, for any level of leaf water status, WUE was alwaysgreater in American elm with higher leaf N mass, and that NUE was
affected in an opposite manner. In the present study (Fig. 9), regard-less of water or N treatments, WUE during various re-wateringcycles increased linearly with SLN (R2 = 0.74) while NUE decreased0
20
40
60
80
5846342210
Dai
ly t
ransp
irat
ion (
cm3
d-1
)
DAP
HWHN
HWLN
LWHN
LWLN
Fig. 7. Simulated dynamics of daily transpiration of wheat in a soil column underhigh water (HW), low water (LW), high nitrogen (HN), and low nitrogen (LN)treatments using Shi and Zuo’s (2009) root-water-uptake model. DAP = days afterplanting.

J. Shi et al. / Agricultural Water Man
0
40
80
120A
ccum
ula
tive
carb
on f
ixat
ion
per
LA
(μ
mol
cm-2
)
HWHN
HWLN
LWHN
LWLN
0
1
2
3
4
5
5846342210
Acc
um
ula
tive
tran
spir
atio
n
per
LA
(cm
3cm
-2)
DAP
a
b
Fig. 8. The dynamics of (a) accumulative carbon fixation per leaf area (LA) from8:00 to 10:00 and (b) accumulative transpiration per LA of wheat in a soil columnunder high water (HW), low water (LW), high nitrogen (HN), and low nitrogen (LN)treatments. DAP = days after planting. Statistical analysis of final accumulated datais found in Table 3.
WUE = 6.52SLN + 1.93
R² = 0.74
2
3
4
WU
E (
mg c
m-3
)
HWHN
HWLN
LWHN
LWLN
NUE = -27.64SLN + 13.41
R² = 0.42
4
8
12
0.250.150.05
NU
E (
mg
mg
-1)
SLN (mg cm-2)
b
a
Fig. 9. The (a) positive relationship between specific leaf nitrogen (SLN) and wateruse efficiency (WUE) and (b) negative relationship between SLN and nitrogen useefficiency (NUE) of wheat during whole experimental period under high water (HW),low water (LW), high nitrogen (HN), and low nitrogen (LN) treatments.
agement 146 (2014) 163–172 171
linearly with SLN (R2 = 0.42), agreeing well with results for elm trees(Reich et al., 1989) and sunflower (Fredeen et al., 1991).
An apparent trade-off between WUE and NUE was found,reflecting the correlations with SLN (Fig. 9), the patterns of timedependence, and the responses to water or N stress (Fig. 6). Thissupports an explanatory mechanism for plants where the con-sumption of non-limiting resources is maintained or increasedin order to increase the efficiency of a limiting resource (Chapinet al., 1987; Chapin, 1991). However, the underlying mechanism oftrade-off between WUE and NUE is still unclear, although it mightpartially result from dynamic compensatory regulations betweenRubisco content and activity (Stitt and Krapp, 1999; Bota et al.,2004; Flexas et al., 2006). Contrary to the present results, Van denBoogaard et al. (1995) did not find association between WUE andNUE when comparing wheat cultivars at low irradiance and highwater and N supplies.
A connection between plant developmental processes and thedynamic responses of growth parameters is evident in the changesin SLN (Fig. 3), C and N mass RR/S (Fig. 4), and WUE and NUE (Fig. 6)observed around 30 DAP. These changes were probably related tothe initiation of passage of the wheat plants from vegetative toreproductive growth stages (Borghi, 2000). This transition is char-acterized by a higher demand for nutrients and assimilates andtheir reallocation between plant organs, and by stem elongation(Miralles and Slafer, 2000).
5. Conclusions
In conclusion, during re-wetting cycles, growth parameters andphysiological traits of wheat dynamically responded to water and Ntreatments as a function of plant development stage and the degreeof specific stress. As compared to the consistent increase of plantLA and biomass, other parameters such as RR/S, SLN, WUE and NUEwere more phenology-dependent. Photosynthesis and transpira-tion recovered gradually from drought after re-watering, and thesimulation of actual transpiration with a root-water-uptake modelwas unsuccessful in predicting the dynamic process. Therefore,consideration of plant recovery from stress is necessary to improvethe simulation of soil water and plant transpiration dynamics. Plantbiomass, LA, transpiration, and photosynthesis were limited bydrought and N deficiency. The relatively great limitation on devel-opment of shoots resulted in higher RR/S under stress. The WUEwas significantly enhanced by drought but restricted by nitrogendeficiency, and positively correlated to SLN during the entire exper-imental period. An apparent trade-off between WUE and NUE wasfound, as NUE was restricted by drought and enhanced by nitrogendeficiency, and negatively correlated to SLN. However, the under-lying mechanism regarding the trade-off between WUE and NUE isstill unclear and should be studied further.
Acknowledgements
This research was supported partly by the National Natural Sci-ence Foundation of China (51321001, 50809071) and the Programon Innovative Research Talent and Team, China Ministry of Agri-culture (2012). The study was partially completed while JianchuShi was visiting the Gilat Research Center of Israel’s AgriculturalResearch Organization. We thank the Agricultural Research Orga-nization/China Scholarship Council Joint Scholarship Scheme forthis opportunity.
References
Achten, W.M.J., Maes, W.H., Reubens, B., Mathijs, E., Singh, V.P., Verchot, L.V., Muys,B., 2010. Biomass production and allocation in Jatropha curcas L. seedlings underdifferent levels of drought stress. Biomass Bioenergy 34, 667–676.

1 r Man
A
B
B
B
B
B
C
C
CC
C
F
F
F
F
F
F
G
G
G
H
H
H
H
H
H
H
JJ
L
72 J. Shi et al. / Agricultural Wate
shraf, M., Shabaz, M., Ashraf, M.Y., 2001. Influence of nitrogen supply and waterstress on growth and nitrogen, phosphorus, potassium and calcium contents inpearl millet. Biol. Plant. 44, 459–462.
orghi, B., 2000. Nitrogen as determinant of wheat growth and yield. In: Satorre,E.H., Slafer, G.A. (Eds.), Wheat Ecology and Physiology of Yield Determination.Food Products Press, New York, NY, pp. 67–84.
ota, J., Medrano, H., Flexas, J., 2004. Is photosynthesis limited by decreased Rubiscoactivity and RuBP content under progressive water stress? New Phytol. 162,671–681.
oyer, J.S., 1971. Recovery of photosynthesis in sunflower after a period of low leafwater potential. Plant Physiol. 47, 816–820.
oyer, J.S., 1976. Photosynthesis at low water potentials. Philos. Trans. R. Soc. Lon-don, Ser. B 273, 501–512.
rueck, H., Senbayram, M., 2009. Low nitrogen supply decreases water-use efficiencyof oriental tobacco. J. Plant Nutr. Soil Sci. 172, 216–223.
echin, I., Fumis, T.F., 2004. Effect of nitrogen supply on growth and photosynthesisof sunflower plants grown in the greenhouse. Plant Sci. 166, 1379–1385.
hapin III, F.S., Bloom, A.J., Field, C.B., Waring, R.H., 1987. Plant responses to multipleenvironmental factors. BioScience 37, 49–57.
hapin III, F.S., 1991. Integrated responses of plants to stress. BioScience 41, 29–36.olaizzi, P.D., Barnes, E.M., Clarke, T.R., Choi, C.Y., Waller, P.M., 2003. Estimating soil
moisture under low frequency surface irrigation using crop water stress index.J. Irrig. Drain. Eng. 129, 27–35.
onnor, D.J., Hall, A.J., Sadras, V.O., 1993. Effect of nitrogen content on the photosyn-thetic characteristics of sunflower leaves. Aust. J. Plant Physiol. 20, 251–263.
eddes, R.A., Kowalik, P.J., Malinka, K.K., Zaradny, H., 1976. Simulation of field wateruptake by plants using a soil water dependant root extraction function. J. Hydrol.31, 13–26.
lexas, J., Escalona, J.M., Medrano, H., 1999. Water stress induces different levels ofphotosynthesis and electron transport rate regulations in grapevines. Plant CellEnviron. 22, 39–48.
lexas, J., Bota, J., Cifre, J., Escalona, J.M., Galmés, J., Gulías, J., Lefi, E., Martetínez-Canellas, S.F., Moreno, M.T., Ribas-Carbó, M., Riera, D., Sampol, B., Medrano, H.,2004. Understanding down-regulation of photosynthesis under water stress:future prospects and searching for physiological tools for irrigation manage-ment. Ann. Appl. Biol. 144, 273–283.
lexas, J., Ribas-Carbó, M., Bota, J., Galmés, J., Henkle, M., Martínez-Canellas, S.,Medrano, H., 2006. Decreased Rubisco activity during water stress is not inducedby decreased relative water content but related to conditions of low stomatalconductance and chloroplast CO2 concentration. New Phytol. 172, 73–82.
rederick, J.R., Camberato, J.J., 1995. Water and nitrogen effects on winter wheat inthe southeastern coastal plain: II. Physiological responses. Agron. J. 87, 527–533.
redeen, A.L., Gamom, J.A., Field, C.B., 1991. Responses of photosynthesis andcarbohydrate-partitioning to limitations in nitrogen and water availability infield-grown sunflower. Plant Cell Environ. 14, 963–970.
alle, A., Florez-Sarasa, I., Aououad, H.E., Flexas, J., 2011. The Mediterranean ever-green Quercus ilex and the semi-deciduous Cistus albidus differ in their leafgas exchange regulation and acclimation to repeated drought and re-wateringcycles. J. Exp. Bot. 62, 5207–5216.
almés, J., Medrano, H., Flexas, J., 2007. Photosynthetic limitations in response towater stress and recovery in Mediterranean plants with different growth forms.New Phytol. 175, 81–93.
onzalez-Dugo, V., Durand, J.L., Gastal, F., 2010. Water deficit and nitrogen nutritionof crops, a review. Agron. Sustainable Dev. 30, 529–544.
eckathorn, S.A., DeLucia, E.H., Zielinski, R.E., 1997. The contribution of drought-related decreases in foliar nitrogen concentration to decreases in photosyntheticcapacity during and after drought in prairie grasses. Physiol. Plant. 101, 173–182.
eitholt, J.J., 1989. Water use efficiency and dry matter distribution in nitrogen- andwater-stressed winter wheat. Agron. J. 81, 464–469.
eld, A.A., Steduto, P., Orgaz, F., Matista, A., Hsiao, T.C., 1990. Bowen ratio/energybalance technique for estimating crop net CO2 assimilation, and comparisonwith a canopy chamber. Theor. Appl. Climatol. 42, 203–213.
opkins, W.G., 1999. Water relations of the whole plant. In: Hopkins, W.G. (Ed.),Introduction to Plant Physiology. John Wiley and Sons, Inc., New York, NY, pp.37–59.
siao, T.C., 1973. Plant responses to water stress. Annu. Rev. Plant Physiol. 24,519–570.
u, L., Wang, Z., Huang, B., 2010. Diffusion limitations and metabolic factors associ-ated with inhibition and recovery of photosynthesis from drought stress in C3
perennial grass species. Physiol. Plant. 139, 93–106.ubick, K.T., 1990. Effects of nitrogen source and water limitation on growth, tran-
spiration efficiency and carbon-isotope discrimination in peanut cultivars. Aust.J. Plant Physiol. 17, 413–430.
ones Jr., J.B., 1998. Plant Nutrition Manual. CRC press, Boca Raton, FL, pp. 1–54.ose, S., Merritt, S., Ramsey, C.L., 2003. Growth, nutrition, photosynthesis and tran-
spiration responses of longleaf pine seedlings to light, water and nitrogen. For.Ecol. Manage. 180, 335–344.
awlor, D.W., 1995. The effects of water deficit on photosynthesis. In: Smirnoff,N. (Ed.), Environment and Plant Metabolism: Flexibility and Acclimation. BIOSScientific Publisher, Oxford, pp. 129–160.
agement 146 (2014) 163–172
Li, F.L., Bao, W.K., Wu, N., 2009. Effects of water stress on growth, dry matter alloca-tion and water-use efficiency of a leguminous species, Sophora davidii. Agrofor.Syst. 77, 193–201.
Liu, F., Andersen, M.N., Jacobsen, S.E., Jensen, C.R., 2005. Stomatal control and wateruse efficiency of soybean (Glycine max L. Merr.) during progressive soil drying.Environ. Exp. Bot. 54, 33–40.
Liu, X.Y., Luo, Y.P., Shi, Y.C., 2001. The stimulating effects of rewatering in subjectingto water stress on leaf area of winter wheat. Sci. Agric. Sin. 34, 422–428.
Liu, Z., Zhu, S., Yuan, H., 2004. Encyclopedia of Water Science in China, Irrigation andDrainage Div (in Chinese). China Water Power Press, Beijing, pp. 87–88.
Marron, N., Delay, D., Petit, J.M., Dreyer, E., Kahlem, G., Delmotte, F.M., Brigmolas,F., 2002. Physiological traits of two Populus × euramericana clones, Luisa Avanzoand Dorskamp, during a water stress and re-watering cycle. Tree Physiol. 22,849–858.
Miralles, D.J., Slafer, G.A., 2000. Wheat development. In: Satorre, E.H., Slafer, G.A.(Eds.), Wheat Ecology and Physiology of Yield Determination. Food ProductsPress, New York, NY, pp. 13–43.
Miyashita, K., Tanakamaru, S., Maitani, T., Kimura, K., 2005. Recovery responses ofphotosynthesis, transpiration, and stomatal conductance in kidney bean follow-ing drought stress. Environ. Exp. Bot. 53, 205–214.
Morgan, J.A., 1984. Interaction of water supply and N in wheat. Plant Physiol. 76,112–117.
Monclus, R., Dreyer, E., Villar, M., Delmotte, F.M., Delay, D., Petit, J.M., Barbaroux, C.,Thiec, L., Bréchet, C., Brignolas, F., 2006. Impact of drought on productivity andwater use efficiency in 29 genotypes of Populus deltoids × Populus nigra. NewPhytol. 169, 765–777.
Nagarajah, S., 1981. The effect of nitrogen on plant water relation in tea (Camelliasinensis). Physiol. Plant. 51, 304–308.
Parry, M.A.J., Andralojc, P.J., Khan, S., Lea, P.J., Keys, A.J., 2002. Rubisco activity: effectsof drought stress. Ann. Bot. 89, 833–839.
Peichl, M., Leava, N.A., Kiely, G., 2012. Above- and belowground ecosystem biomass,carbon and nitrogen allocation in recently afforested grassland and adjacentintensively managed grassland. Plant Soil 350, 281–296.
Reich, P.B., Walters, M.B., Tabone, T.J., 1989. Response of Ulmus americana seedlingsto varying nitrogen and water status. 2. Water and nitrogen use efficiency inphotosynthesis. Tree Physiol. 5, 173–184.
Reynolds, J.F., Kemp, P.R., Ogle, K., Fernández, R.J., 2004. Modifying the ‘pulse-reserve’ paradigm for deserts of North America: precipitation pulses, soil water,and plant responses. Oecologia 141, 194–210.
Shangguan, Z., Shao, M., Dyckmans, J., 2000. Nitrogen nutrition and water stresseffects on leaf photosynthetic gas exchange and water use efficiency in winterwheat. Environ. Exp. Bot. 44, 141–149.
Shi, J., Ben-Gal, A., Yermiyahu, U., Wang, L., Zuo, Q., 2013. Characterizing root nitro-gen uptake of wheat to simulate soil nitrogen dynamics. Plant Soil 363, 139–155.
Shi, J., Zuo, Q., 2009. Root water uptake and root nitrogen mass of winter wheat andtheir simulations. Soil Sci. Soc. Am. J. 73, 1764–1774.
Shimshi, D., 1970. The effect of nitrogen supply on transpiration and stomatal behav-ior of beans (Phaseolus vulgaris L.). New Phytol. 69, 405–412.
Siopongco, J.DL.C., Yamauchi, A., Salekdeh, H., Bennett, J., Wade, L.J., 2006. Growthand water use response of doubled-haploid rice lines to drought and rewateringduring the vegetative stage. Plant Prod. Sci. 9, 141–151.
Skinner, R.H., Comas, L.H., 2010. Root distribution of temperate forage species sub-jected to water and nitrogen stress. Crop Sci. 50, 2178–2185.
Slafer, G.A., Satorre, E.H., 2000. An introduction to the physiological-ecological anal-ysis of wheat yield. In: Satorre, E.H., Slafer, G.A. (Eds.), Wheat Ecology andPhysiology of Yield Determination. Food Products Press, New York, NY, pp. 3–12.
Steduto, P., Hsiao, T.C., 1998. Maize canopies under two soil water regimes. II. Sea-sonal trends of evapotranspiration, carbon dioxide assimilation and canopyconductance, and as related to leaf area index. Agric. For. Meteorol. 89, 185–200.
Stitt, M., Krapp, A., 1999. The interaction between elevated carbon dioxide and nitro-gen nutrition: the physiological and molecular background. Plant Cell Environ.22, 583–621.
Van den Boogaard, R., Kostadinova, R.S., Veneklaas, E., Lambers, H., 1995. Associ-ation of water use efficiency and nitrogen use efficiency with photosyntheticcharacteristics of two wheat cultivars. J. Exp. Bot. 46, 1429–1438.
Walters, M.B., Reich, P.B., 1989. Response of Ulmus americana seedlings to vary-ing nitrogen and water status. 1. Photosynthesis and growth. Tree Physiol. 5,159–172.
Wilhelm, W.W., McMaster, G.S., Rickman, R.W., Klepper, B., 1993. Above-groundvegetative development and growth of winter wheat as influenced by nitrogenand water availability. Ecol. Modell. 68, 183–203.
Wilson, J.B., 1988. A review of evidence on the control of shoot:root ratio, in relationto models. Ann. Bot. 61, 433–449.
Wu, F.Z., Bao, W.K., Li, F.L., Wu, N., 2008. Effects of drought stress and N supply onthe growth, biomass partitioning and water-use efficiency of Sophora davidii
seedlings. Environ. Exp. Bot. 63, 248–255.Wu, J., Zhang, R., Gui, S., 1999. Modeling soil water movement with water uptake byroots. Plant Soil 215, 7–17.
Xu, Z., Zhou, G., Shimizu, H., 2009. Are plant growth and photosynthesis limited bypre-drought following rewatering in grass? J. Exp. Bot. 60, 3737–3749.