Dynamic localization of G proteins in Dictyostelium discoideum
7
2597 Short Report Introduction G-protein-mediated signal-transduction pathways play an essential role during chemotaxis in the simple eukaryote Dictyostelium discoideum. Genetic analysis and database searches have revealed 11 Gα subunits and a single Gβ and Gγ subunit in this organism (van Es and Devreotes, 1999; Zhang et al., 2001). The Gα2 subunit couples to the cyclic adenosine 3,5 monophosphate (cAMP) receptor cAR1 and is essential for development and chemotaxis during aggregation (Janetopoulos et al., 2001; Kumagai et al., 1991). Activated receptors catalyze the exchange of guanosine triphosphate (GTP) for guanosine diphosphate (GDP) and allow both the GTP- bound α-subunit and free βγ complexes to signal to downstream effectors (Gilman, 1987). Over the years, biochemical evidence has accumulated that suggests that membrane-associated Gα and Gβγ subunits dissociate from one another and that this dissociation is necessary for the activation or inhibition of effectors (Northup et al., 1983; Sternweis et al., 1981). However, interpreting earlier in vitro experiments has proven difficult because the use of detergents might have artificially promoted subunit dissociation and because magnesium concentrations in these studies were often much higher than normal physiological levels (Lambert, 2008). Another limitation of in vitro experiments might be the lack of physical influence that normally occurs as G proteins couple to their respective receptor(s) and interact with the plasma membrane. Although it is accepted that the mechanisms underlying the G- protein cycle are well established (Gilman, 1987; Hamm, 1998), there is very little evidence derived from intact cells describing the membrane dynamics of the heterotrimer prior to and after stimulation. The first successful in vivo attempt to look at G-protein dynamics in response to a stimulus was performed in D. discoideum (Janetopoulos et al., 2001). Fluorescence (or Förster) resonance energy transfer (FRET) between the α2 and β-subunits was used to visualize the conformational change of the heterotrimer. A large loss of FRET in response to chemoattractant suggested dissociation of the subunits. Since then, other groups have examined FRET between the α- and β-subunits in live yeast and mammalian cells, showing decreases and increases in the signal in response to stimulus, respectively (Bunemann et al., 2003; Yi et al., 2003). Studies performed more recently have reported similar findings using bioluminescent resonance energy transfer (BRET) or FRET, and have seen both increases and decreases in the fluorescent signal in response to stimulus (Azpiazu and Gautam, 2004; Frank et al., 2005; Gales et al., 2006; Gibson and Gilman, 2006). These bioluminescent reporters have provided significant clues about the conformational changes that take place in a variety of heterotrimers from various systems. The heterotrimeric G-proteins play a crucial role during chemoattractant-gradient sensing in eukaryotic organisms (Bagorda and Parent, 2008; Devreotes and Janetopoulos, 2003; Schneider and Haugh, 2006). Cells have a remarkable ability to sense very shallow chemoattractant gradients and respond with sharply localized responses at the leading edge of a cell. Evidence gleaned from many studies suggests that this localization occurs upstream of PI3-kinase activity and downstream of G-protein activation (Charest and Firtel, 2006; Janetopoulos et al., 2001). Single- molecule experiments performed in D. discoideum that examine the interactions between the chemoattractant (cAMP) and the receptor (cAR1) demonstrated that the off-rate of the chemoattractant varied significantly between the front and rear of a cell and also was dependent on the presence of functional G proteins (Ueda et al., 2001). This work suggested that some factor or modification that was linked to the polarized morphology of the cell controlled the binding affinity of chemoattractant to the Extracellular stimuli exert their effects on eukaryotic cells via serpentine G-protein-coupled receptors and mediate a vast number of physiological responses. Activated receptors stimulate heterotrimeric G-proteins, consisting of three subunits, α, β and γ. In Dictyostelium discoideum, cAMP binds to the cAMP receptor cAR1, which is coupled to the heterotrimer containing the Gα2 subunit. These studies provide in vivo evidence as to how receptors influence the localization of the G-protein complex prior to and after ligand binding. Previous work has shown that the state of the heterotrimer could be monitored by changes in fluorescence (or Förster) resonance energy transfer (FRET) between the α2- and β-subunits of D. discoideum. We now report the kinetics of G-protein activation as a loss of FRET prior to and after cAMP addition by using total internal reflection fluorescence microscopy (TIRFM). We also performed photobleaching experiments to measure G- protein recovery times. Our data show that inactive and active G-proteins cycle between the cytosol and plasma membrane. These data suggest that cAR1 activation slows the membrane dissociation (‘off’) rate of the α2 subunit, while simultaneously promoting βγ-subunit dissociation. Supplementary material available online at http://jcs.biologists.org/cgi/content/full/122/15/2597/DC1 Key words: FRET, G proteins, Chemotaxis Summary Dynamic localization of G proteins in Dictyostelium discoideum Carrie A. Elzie, Jennifer Colby, Morgan A. Sammons and Chris Janetopoulos* Department of Biological Sciences, Vanderbilt University, Nashville, TN 37235, USA *Author for correspondence (e-mail: [email protected]) Accepted 14 May 2009 Journal of Cell Science 122, 2597-2603 Published by The Company of Biologists 2009 doi:10.1242/jcs.046300 Journal of Cell Science
Transcript of Dynamic localization of G proteins in Dictyostelium discoideum
2597Short Report
IntroductionG-protein-mediated signal-transduction pathways play an essential
role during chemotaxis in the simple eukaryote Dictyosteliumdiscoideum. Genetic analysis and database searches have revealed
11 Gα subunits and a single Gβ and Gγ subunit in this organism
(van Es and Devreotes, 1999; Zhang et al., 2001). The Gα2 subunit
couples to the cyclic adenosine 3�,5� monophosphate (cAMP)
receptor cAR1 and is essential for development and chemotaxis
during aggregation (Janetopoulos et al., 2001; Kumagai et al., 1991).
Activated receptors catalyze the exchange of guanosine triphosphate
(GTP) for guanosine diphosphate (GDP) and allow both the GTP-
bound α-subunit and free βγ complexes to signal to downstream
effectors (Gilman, 1987). Over the years, biochemical evidence has
accumulated that suggests that membrane-associated Gα and Gβγsubunits dissociate from one another and that this dissociation is
necessary for the activation or inhibition of effectors (Northup et
al., 1983; Sternweis et al., 1981). However, interpreting earlier in
vitro experiments has proven difficult because the use of detergents
might have artificially promoted subunit dissociation and because
magnesium concentrations in these studies were often much higher
than normal physiological levels (Lambert, 2008). Another
limitation of in vitro experiments might be the lack of physical
influence that normally occurs as G proteins couple to their
respective receptor(s) and interact with the plasma membrane.
Although it is accepted that the mechanisms underlying the G-
protein cycle are well established (Gilman, 1987; Hamm, 1998),
there is very little evidence derived from intact cells describing the
membrane dynamics of the heterotrimer prior to and after
stimulation.
The first successful in vivo attempt to look at G-protein dynamics
in response to a stimulus was performed in D. discoideum(Janetopoulos et al., 2001). Fluorescence (or Förster) resonance
energy transfer (FRET) between the α2 and β-subunits was used
to visualize the conformational change of the heterotrimer. A large
loss of FRET in response to chemoattractant suggested dissociation
of the subunits. Since then, other groups have examined FRET
between the α- and β-subunits in live yeast and mammalian cells,
showing decreases and increases in the signal in response to
stimulus, respectively (Bunemann et al., 2003; Yi et al., 2003).
Studies performed more recently have reported similar findings
using bioluminescent resonance energy transfer (BRET) or FRET,
and have seen both increases and decreases in the fluorescent signal
in response to stimulus (Azpiazu and Gautam, 2004; Frank et al.,
2005; Gales et al., 2006; Gibson and Gilman, 2006). These
bioluminescent reporters have provided significant clues about the
conformational changes that take place in a variety of heterotrimers
from various systems.
The heterotrimeric G-proteins play a crucial role during
chemoattractant-gradient sensing in eukaryotic organisms (Bagorda
and Parent, 2008; Devreotes and Janetopoulos, 2003; Schneider and
Haugh, 2006). Cells have a remarkable ability to sense very
shallow chemoattractant gradients and respond with sharply
localized responses at the leading edge of a cell. Evidence gleaned
from many studies suggests that this localization occurs upstream
of PI3-kinase activity and downstream of G-protein activation
(Charest and Firtel, 2006; Janetopoulos et al., 2001). Single-
molecule experiments performed in D. discoideum that examine
the interactions between the chemoattractant (cAMP) and the
receptor (cAR1) demonstrated that the off-rate of the
chemoattractant varied significantly between the front and rear of
a cell and also was dependent on the presence of functional G
proteins (Ueda et al., 2001). This work suggested that some factor
or modification that was linked to the polarized morphology of the
cell controlled the binding affinity of chemoattractant to the
Extracellular stimuli exert their effects on eukaryotic cells via
serpentine G-protein-coupled receptors and mediate a vast
number of physiological responses. Activated receptors
stimulate heterotrimeric G-proteins, consisting of three
subunits, α, β and γ. In Dictyostelium discoideum, cAMP binds
to the cAMP receptor cAR1, which is coupled to the
heterotrimer containing the Gα2 subunit. These studies provide
in vivo evidence as to how receptors influence the localization
of the G-protein complex prior to and after ligand binding.
Previous work has shown that the state of the heterotrimer could
be monitored by changes in fluorescence (or Förster) resonance
energy transfer (FRET) between the α2- and β-subunits of D.discoideum. We now report the kinetics of G-protein activation
as a loss of FRET prior to and after cAMP addition by using
total internal reflection fluorescence microscopy (TIRFM). We
also performed photobleaching experiments to measure G-
protein recovery times. Our data show that inactive and active
G-proteins cycle between the cytosol and plasma membrane.
These data suggest that cAR1 activation slows the membrane
dissociation (‘off’) rate of the α2 subunit, while simultaneously
promoting βγ-subunit dissociation.
Supplementary material available online at
http://jcs.biologists.org/cgi/content/full/122/15/2597/DC1
Key words: FRET, G proteins, Chemotaxis
Summary
Dynamic localization of G proteins in DictyosteliumdiscoideumCarrie A. Elzie, Jennifer Colby, Morgan A. Sammons and Chris Janetopoulos*Department of Biological Sciences, Vanderbilt University, Nashville, TN 37235, USA*Author for correspondence (e-mail: [email protected])
Accepted 14 May 2009Journal of Cell Science 122, 2597-2603 Published by The Company of Biologists 2009doi:10.1242/jcs.046300
Jour
nal o
f Cel
l Sci
ence

2598
receptors. This, in turn, might have played a role in amplifying the
responses at the leading edge of a cell. It would seem likely that
these differences in binding affinities at the front and rear of a cell
should influence or might be controlled by the activity of the G
proteins. In order to obtain a better understanding of in vivo G-
protein activation, total internal reflection microscopy (TIRFM) was
combined with a G-protein FRET-based assay while cells were
exposed to a variety of conditions. G proteins were monitored
directly at the plasma membrane before and after receptor
stimulation. We further investigated the interactions of the G proteins
with the plasma membrane by performing photobleaching studies.
These studies have revealed the dynamic nature of the interactions
of the G proteins with the plasma membrane and have helped further
elucidate the role that G-protein activation might play in amplifying
the response of cells during gradient sensing.
Results and DiscussionDuring TIRFM, energy, in the form of an evanescent wave,
propagates 100-150 nm into the cell and excites fluorescent
molecules at the cell-coverslip interface. This technique provides
a very high signal-to-noise ratio and permits the investigation of
molecular dynamics at the plasma membrane (Axelrod, 2001).
Previously, we monitored G-protein FRET between the α2- and β-
subunits in D. discoideum by analyzing the emission profile of large
populations of cells in a fluorimeter. We demonstrated that there
were rapid changes in the conformation of the G proteins in response
to cAMP (Janetopoulos et al., 2001). In this prior study, the FRET
fluorescence decreased by approximately 70% upon cAMP
application. This large change suggested subunit dissociation
between the Gα2 and Gβ subunits. However, it was possible that
this loss of FRET was the result of large changes in the conformation
of the heterotrimer. In order to analyze only those G proteins that
were present at the plasma membrane, cells expressing the same
FRET pair were stimulated with a uniform concentration of cAMP
and imaged with TIRFM. There was an increase in the Gα2-CFP
fluorescence and a simultaneous decrease in the β-YFP FRET
fluorescence (Fig. 1A). During continuous stimulation, the
membrane G-protein activation did not decline, even though most
physiological responses such as PI3K activity or actin
polymerization would have subsided. To control for any cell
movement and feedback mechanisms from the actin cytoskeleton,
which have been shown to play a significant role in signaling
cascades, we treated the cells with latrunculin A, an inhibitor of
the actin cytoskeleton (Charest and Firtel, 2006). Cells responded
with similar kinetics, suggesting no influence of the actin
cytoskeleton on G-protein activation (Fig. 1B). Treated and
untreated cells both showed a corresponding gain in CFP signal
and loss in FRET fluorescence, suggesting activation of the
heterotrimer. Control cells exposed to buffer showed no significant
changes in fluorescence (supplementary material Fig. S1). The
relative changes in membrane FRET fluorescence when compared
with the total membrane fluorescent signal were about twofold
higher (15-20% vs 7-10%) than those changes seen when comparing
signals during whole-cell analysis (Janetopoulos et al., 2001). This
is probably due to the high signal-to-noise ratio gained by imaging
FRET at the plasma membrane and the avoidance of fluorescent
contributions from cytosolic G proteins. There were no changes in
the FRET signal in the cytosol when measured using epifluorescence
microscopy (not shown). These data suggest that G-protein
activation, as measured by loss of G-protein FRET, was local and
occurred at or near the plasma membrane. These results also confirm
and extend our previous studies on whole cells using fluorimetric
analysis that demonstrated that G-protein activation was continuous
during prolonged stimulation in spite of most cellular responses
having subsided (Janetopoulos et al., 2001). This suggests that
adaptation of the response must be downstream or independent of
the conformational changes of the heterotrimer.
Dictyostelium cells undergo a number of morphological changes,
including a cringe response, a rounding-up phase and a return to
random movement when exposed to a uniform stimulus of cAMP
(Futrelle et al., 1982). To control for any changes in cell shape that
might contribute to fluorescent artifacts owing to cell spreading or
flattening, cell lines expressing either cAR1-YFP, Gβ-CFP or Gα2-
CFP were stimulated with cAMP and imaged with TIRFM. Cells
Journal of Cell Science 122 (15)
Fig. 1. cAMP induces actin-independentheterotrimer disassociation at the plasmamembrane. (A) Gα2-null cells expressing theFRET pair (Gα2-CFP and Gβ-YFP) were exposedcontinuously to ~1 μM cAMP after 10 seconds ofmonitoring while CFP and YFP emission at theplasma membrane were simultaneously recordedusing TIRF microscopy. As shown in the graph,cells showed a rapid increase in CFP fluorescenceand a corresponding decrease in YFP-FRETfluorescence at the plasma membrane after cAMPstimulation. This loss of FRET was maintained inthe presence of cAMP. (B) The same experimentwas repeated using cells that were treated withlatrunculin A, an inhibitor of actin. These cellsshowed a similar loss in FRET fluorescence,suggesting that cAMP-induced heterotrimerdissociation is actin-independent. Changes inrelative cell intensity were normalized to changesin background fluorescence. Graphs are the meanaverage intensity ± s.e.m. All experiments weredone in triplicate with at least 15 cells quantifiedper day. Representative CFP and FRET imageswith time stamps (seconds) are shown. Cells werepseudocolored on equal scales to allow for bettervisualization of changes. Scale bar: 5 μm.
Jour
nal o
f Cel
l Sci
ence

2599G-protein activation live
expressing Gβ-CFP or cAR1-YFP alone showed no increase in
fluorescence at the membrane surface (supplementary material Fig.
S2). Surprisingly, cells expressing Gα2-CFP alone showed a rapid
increase in fluorescence at the plasma membrane upon stimulation
with cAMP (Fig. 2A; supplementary material Movie 1). Gα2-CFP
fluorescence increased rapidly and reached a steady-state maximum
within 10 seconds that was about 15% higher than basal levels. This
increase in fluorescence mirrored the time course of G-protein
activation when G-protein FRET was monitored. As shown above
for G-protein activation, the rise in membrane Gα2-CFP signal in
response to cAMP stimulation occurred in cells treated with
latrunculin A, demonstrating that feedback from the cytoskeleton
was also not needed for this response (Fig. 2B, top). This increase
in Gα2-CFP fluorescence was also visualized with standard
epifluorescence microscopy (Fig. 2C,D, bottom) and confocal
microscopy (supplementary material Fig. S3). Using TIRFM, it was
found that Gα2-CFP levels returned to basal levels upon removal
of cAMP (Fig. 2E; supplementary material Movie 2). To determine
whether Gα2-CFP membrane levels remained high after longer
periods of exposure to cAMP, cells were stimulated continuously
for 5 minutes and then re-examined (Fig. 2F). It has previously been
shown that most cellular responses to cAMP would have subsided
in cells treated with cAMP for extended periods of time. In addition,
cAR1 would be fully phosphorylated (Caterina et al., 1995). After
removal of cAMP, there was a decrease in Gα2 signal on the
membrane; the loss of Gα2 signal on the membrane had a half-time
(approximately 15 seconds) that was similar to that seen when cells
were stimulated for only 30 seconds. This showed that the membrane
levels of Gα2 remained elevated over the course of minutes and
demonstrates that cAR1 phosphorylation had little or no effect on
the affinity of Gα2 for the plasma membrane. The recruitment of
Gα2-CFP to the plasma membrane is reminiscent of other responses
seen during chemotactic stimulation; PI3-kinase and pleckstrin
homology (PH) domains are rapidly recruited to the plasma
membrane from the cytosol when cells are given a uniform stimulus
of cAMP. However, whereas those responses are transient, Gα2-
CFP recruitment reflected the presence of cAMP. In a gradient, PI3-
kinase and PH domains localize to the leading edge of the cell (Huang
Fig. 2. Gα2-CFP is recruited to the plasmamembrane upon cAMP stimulation.(A) Gα2-null cells expressing Gα2-CFPwere stimulated with a continual dose of~1 μM cAMP or control buffer after 10seconds of monitoring. (A-D) Cells wereimaged with TIRFM (pseudocolor; A,B) orepifluorescence (grayscale; C,D) prior to andafter uniform stimulation. After the additionof cAMP, Gα2 was quickly recruited to theplasma membrane. (B) The same experimentas in A was performed in cells treated with5 μM latrunculin A, an actin inhibitor.Similar results were obtained, suggesting thatthe recruitment of Gα2 to the plasmamembrane does not require F-actin. (E) Cellsexpressing Gα2-CFP were stimulated with acontinual dose of cAMP at 10 seconds andimaged using TIRFM. The cAMP was thenwithdrawn at 35 seconds. There was a rapiddecline in the membrane Gα2-CFPfluorescence after cAMP removal. Imageswere taken every 1.5 seconds for 67.5seconds. (F) Cells were stimulated with~1 μM cAMP for 5 minutes prior torecording. cAMP was withdrawn at frame 5.There was a rapid decline in the membraneGα2-CFP fluorescence. Cells were re-stimulated with cAMP after 1 minute and theGα2-CFP signal on the membrane increasedagain, demonstrating that the on-rate wasalso unaffected by prolonged stimulation.Changes in relative cell intensity werenormalized to changes in backgroundfluorescence. Graphs are the mean averageintensity ± s.e.m. All experiments were donein triplicate with at least 15 cells quantifiedper day. Representative images with timestamps (seconds) are shown. Cells werepseudocolored on equal scales to allow forbetter visualization of changes. Scale bar:5 μm.
Jour
nal o
f Cel
l Sci
ence
2600
et al., 2003). The Gα2-subunit data suggested that the localization
of Gα2-CFP should mirror the local concentrations of cAMP, as has
been previously suggested for G-protein activation (Janetopoulos et
al., 2001; Xu et al., 2005). However, cells imaged in a stable cAMP
gradient showed no significant differences between the front and
rear when chemotaxing, as assayed by TIRFM. A similar result was
found for latrunculin-A-treated cells imaged with epifluorescence
(data not shown). Given the small changes in Gα2-CFP localization
at the membrane when receptors are saturated, it may not be
surprising that small changes in receptor occupancy across the cell
were below the level of signal detection. It should be noted that Xu
et al. (Xu et al., 2005) showed that G-protein activation mirrored
the cAMP gradient by measuring G-protein activation (in cells
expressing the same FRET pair: Gα2-CFP and Gβ-YFP) as a ratio
of the Gα2-CFP signal in response to an acute stimulus of cAMP
(Xu et al., 2005). These data support our hypothesis that changes in
both G-protein activation and Gα2-CFP affinity should mirror the
cAMP gradient. This result might have significant implications for
investigators modeling the gradient-sensing mechanism. A recent
model has implicated Gβγ subunits in helping specify the rear of a
cell and will be discussed in the section below (Levine et al., 2006).
Taken together with the G-protein FRET data, these experiments
strongly suggest that the Gα2 subunit, once bound by GTP, is no
longer associated with the Gβγ subunit. The Gβγ subunit must diffuse
Journal of Cell Science 122 (15)
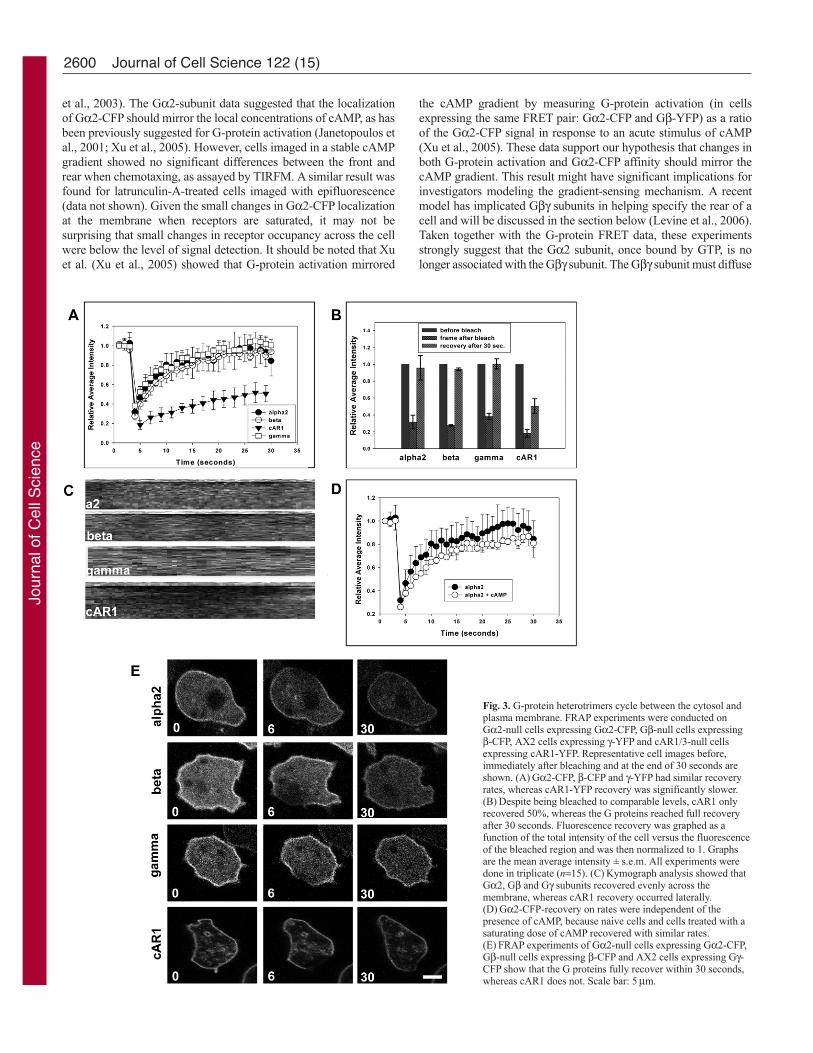
Fig. 3. G-protein heterotrimers cycle between the cytosol andplasma membrane. FRAP experiments were conducted onGα2-null cells expressing Gα2-CFP, Gβ-null cells expressingβ-CFP, AX2 cells expressing γ-YFP and cAR1/3-null cellsexpressing cAR1-YFP. Representative cell images before,immediately after bleaching and at the end of 30 seconds areshown. (A) Gα2-CFP, β-CFP and γ-YFP had similar recoveryrates, whereas cAR1-YFP recovery was significantly slower.(B) Despite being bleached to comparable levels, cAR1 onlyrecovered 50%, whereas the G proteins reached full recoveryafter 30 seconds. Fluorescence recovery was graphed as afunction of the total intensity of the cell versus the fluorescenceof the bleached region and was then normalized to 1. Graphsare the mean average intensity ± s.e.m. All experiments weredone in triplicate (n=15). (C) Kymograph analysis showed thatGα2, Gβ and Gγ subunits recovered evenly across themembrane, whereas cAR1 recovery occurred laterally.(D) Gα2-CFP-recovery on rates were independent of thepresence of cAMP, because naive cells and cells treated with asaturating dose of cAMP recovered with similar rates.(E) FRAP experiments of Gα2-null cells expressing Gα2-CFP,Gβ-null cells expressing β-CFP and AX2 cells expressing Gγ-CFP show that the G proteins fully recover within 30 seconds,whereas cAR1 does not. Scale bar: 5 μm.
Jour
nal o
f Cel
l Sci
ence

2601G-protein activation live
away from the plasma membrane because the membrane β-YFP
signal shows no corresponding increase.
We speculated that the G proteins were cycling between a
cytosolic pool and the plasma membrane, with the heterotrimer
residing at the plasma membrane for some short time. In the
presence of cAMP, activated Gα2 might then be retained at the
membrane, while Gβγ would be released via dissociation. Roughly
30% of the heterotrimeric G proteins are in the cytosol and the
analysis of cytosolic G-protein FRET has suggested that these G
proteins are in the GDP-bound heterotrimeric state (Janetopoulos
et al., 2001; Zhang et al., 2001). To investigate this hypothesis, we
performed fluorescence recovery after photobleaching (FRAP)
experiments using confocal microscopy (Fig. 3E). Interestingly,
Gα2-CFP, Gβ-CFP and Gγ-CFP recovered uniformly across the
plasma membrane, with a half-time of approximately 5 seconds
(Fig. 3A,B; supplementary material Movie 3). cAR1 recovery took
much longer and was dependent on the size of the bleached spot,
as expected for a transmembrane protein. The recovery rate for the
G proteins was independent of the amount of bleached area, further
suggesting that the G proteins are cycling between the cytosol and
membrane (supplementary material Fig. S4). Kymograph analysis
showed that cAR1 diffuses in laterally, whereas the G proteins
recovered evenly across the membrane (Fig. 3C). To investigate
the Gα2 recovery time when receptors were occupied by
chemoattractant, cells expressing Gα2 were continuously stimulated
with cAMP and photobleached (Fig. 3D). The recovery times were
similar to unstimulated cells. These data show that G-protein
heterotrimers are continuously cycling between the cytosol and
plasma membrane. Furthermore, the photobleaching data presented
here support the argument that there was complete subunit
disassociation upon receptor activation. Future experiments should
determine the half-time of free cytosolic Gβγ subunits and the roles
that locally activated Gα2 subunits play in amplifying the response
during chemotaxis. Future studies also need to address whether the
Gα2 subunit is in a GDP-bound, empty pocket or GTP-bound state
when associated with the plasma membrane. Furthermore, it should
be determined whether stably bound Gα2 subunit is interacting with
cAR1 or directly with the plasma membrane and/or possibly
downstream effector molecules. Interestingly, when Gα2-CFP was
expressed in cells lacking cAR1 and cAR3, it still interacted with
the plasma membrane, and when FRAP was performed, the Gα2
recovered with kinetics that were similar to those seen in other cell
lines examined (supplementary material Fig. S5).
How might these dynamic movements of the G proteins influence
gradient sensing? A recent model, proposed by Levine et al.,
suggests that the G proteins themselves make good candidates for
the activator and inhibitor molecules that they propose underlie the
large gain seen in the responses at the leading edge during gradient
sensing (Levine et al., 2006). They suggested that the Gα-subunit
might locally activate downstream effectors, whereas diffusible Gβγsubunits could potentially act as inhibitory molecules. This model
might be on target because the data presented here suggest that the
Gα subunit remains local and the Gβγ subunits diffuse away. Further
support for this idea comes from single-molecule analysis of cAR1-
YFP, which was shown to have two different receptor populations
in the absence of signaling. Some were immobile and some were
mobile, suggesting, similar to the finding presented here, that not
all of cAR1 is precoupled to the G protein (de Keijzer et al., 2008).
The authors further found that the immobile fraction was almost
identical in chemotaxing cells at the leading edge to that of cells
lacking the Gα2 subunit. They interpreted this to mean that there
was uncoupling of the receptor from the G proteins in response to
cAMP. Taken together with the data presented here, the single-
molecule results suggest that the Gα2 subunits might be binding
the membrane or proteins on the membrane (and not the receptor
directly) after receptor activation. This local increase of Gα2
subunits at the front of a cell may in turn provide the molecular
component for the initial linear amplification that occurs during
gradient sensing.
These results show that the receptors and G proteins do not form
stable complexes in the absence of signaling. We propose that intact
heterotrimers interact transiently with the receptors before receptor
activation and are activated by a mechanism similar to that proposed
for the classical collision-coupling model (Bourne, 1997; Gilman,
1987) (Fig. 4). However, whereas it is typically thought that the
heterotrimeric G proteins move about only within the plasma
membrane, our results suggest that they are shuttling back and forth
from cytosolic pools. Studies using D. discoideum still must
determine whether the shuttling of the G proteins back and forth
in the absence of activated receptor occurs between the membrane
or receptor, or possibly both. It is also possible that cAMP interacts
with receptors that are not ‘precoupled’. Support for this comes
from single-molecule studies imaging the binding of cAMP to the
Fig. 4. Model for G-protein cycling in Dictyostelium discoideum. Inactiveheterotrimers continuously cycle between the cytosol and cAR1 or the innerleaflet of the plasma membrane. It is likely that the lipid modifications of bothGα2 (palmitoylation and myristoylation) and Gγ (isoprenylation) play asignificant role in the heterotrimer interacting with the plasma membrane.Upon binding of cAMP to the receptor, there is a change in receptorconformation that might increase the affinity of the receptor for the Gα2subunit. The conformational change in cAR1 simultaneously triggers theexchange of GDP for GTP on the Gα2 subunit and the heterotrimerdissociates. Because the Gβγ subunit does not apparently change its residencytime on the plasma membrane, time spent in the empty-pocket conformation isprobably extremely fast and the Gα2 subunit might remain coupled to thereceptor in the GTP-bound state. It is also possible that both GDP- and GTP-bound Gα2 subunits interact with both receptor and the plasma membrane, oreffector molecules (E) in the latter case, when activated. This is supported bydata showing that the Gα2 subunits still interact with the plasma membrane incells lacking cAR1 and cAR3. In either situation, this dissociation is complete,and the active Gβγ subunit diffuses away from the membrane. The intrinsicGTPase activity of the Gα2 subunit hydrolyzes the bound GTP and thereceptor, membrane or effector molecule and Gα2 subunits dissociate.Because we have been unable to measure changes in FRET in the cytosol,liberated Gβγ subunits probably find free Gα2 subunits and reform theheterotrimer. This model can explain both the loss of G-protein FRET and thelack of a change in membrane Gβ-subunit intensity upon receptor activation.
Jour
nal o
f Cel
l Sci
ence

2602
receptors, which demonstrated that cells lacking the Gα and Gβsubunits had an on and off-rate that was faster than wild-type cells
(Ueda et al., 2001). The finding that the off-rate of the Gα2 subunit
is affected by receptor activation could be consistent with the idea
that, once the Gα subunits release GDP, there is a high-affinity state
between the receptor and G protein (Oldham and Hamm, 2008).
Earlier studies in D. discoideum have also suggested that receptors
remain coupled to G proteins during prolonged stimulation (Snaar-
Jagalska et al., 1991). Similar findings were found in neurons
through a variety of elegant experiments in which the G-protein-
coupled receptors (GPCRs) were immobilized and shown to affect
the mobility of the Gα subunits (Digby et al., 2006).
These experiments showing transient interactions between the
heterotrimer and plasma membrane are interesting given the
predicted electrostatic interactions of the G proteins with the
membrane phospholipids (Murray et al., 2001). However, other
studies in mammalian cell lines have shown that γ-subunits are
capable of translocating from the plasma membrane to the
endomembrane in response to receptor activation (Saini et al.,
2007). Short-lived interactions have also been shown for the small
GTPase Ras in mammalian systems and will probably be found
with other lipid-modified signaling enzymes that work at the
cytosolic–plasma-membrane interface (Goodwin and Kenworthy,
2005). A recent report using single-molecule imaging suggests that
Gαi2 is recruited to CD59 clusters and interacts transiently with
the membrane in T24 epithelial cells (Suzuki et al., 2007). Other
photobleaching studies have reported similar findings and it is
becoming increasingly evident that different heterotrimers probably
interact with the receptors and plasma membrane in unique and
various ways (Digby et al., 2006; Digby et al., 2008; Lambert,
2008). We speculate that heterotrimers containing other α-subunits
in D. discoideum might also show differential dissociation. Such
a finding might indicate that different heterotrimeric conformations
are capable of activating unique Gβγ effectors or the same Gβγeffectors with different efficiency. Interestingly, the photobleaching
data presented in this study suggest that Gβγ subunits coupled to
other α-subunits are also transiently interacting with the plasma
membrane, because some of these subunits presumably are
interacting with receptors other than cAR1. This would further
indicate that other heterotrimers have a similar half-time because
they interact with very different seven-transmembrane receptors.
By contrast, it might be argued that the similar half-times suggest
that they are interacting with the plasma membrane and it is the
Gβγ subunits that control these transient interactions in the absence
of activated receptors. This seems to be the case for some γ-subunits
in mammalian cells (Saini et al., 2007). It will be interesting to
determine how many different receptors are actually expressed in
chemotaxing cells, given that we know from sequence data that
there are at least 50 GPCRs, and probably more than 100 (Eichinger
et al., 2005).
Materials and MethodsCell cultureAll cell lines were cultured axenically in HL5 medium at 22°C. For development,
cells were washed twice with DB buffer (5 mM Na2HPO4, 5 mM KH2PO4, 1 mM
CaCl2, 2 mM MgCl2) then starved in DB buffer for 6 hours with continuous shaking.
Cells were pulsed with 50 nM cAMP every 6 minutes for the last 5 hours of starvation.
All transformants were maintained in G418 (20 μg/ml for single transformants, 30
μg/ml for double).
Cell linesCells expressing Gα2-CFP in Gα2-null cells, Gα2-CFP and β-YFP in Gα2-null cells
and Gβ-YFP in Gβ-null cells were previously described (Janetopoulos et al., 2001).
cAR1- and cAR3-nulls and β-null cells were transformed by electroporation with5.0 μg of plasmid (Insall et al., 1994). G418-resistant clones were selected in 2-3weeks. The gene encoding the full-length eCFP was fused to the N terminal of Gβ,similar to the Gβ-YFP fusion previously reported. The cloning of the cAR1-YFP wasperformed as described for cAR1-GFP (Xiao et al., 1997).
ReagentsLatrunculin A and cAMP were obtained from Sigma-Aldrich (St Louis, MO).
MicroscopyCells were imaged in DB buffer in two-well LabTek chambers (total volume of DBis 1 ml). A micropipette (Eppendorf) was back-loaded with either DB (control) orcAMP (100 μM) and attached to a micropump (Eppendorf Femtojet). The micropipettewas attached to a micromanipulator (Eppendorf). Cells were stimulated with cAMPby rapidly bringing in the micropipette to a pre-set position in close proximity to thecells. To remove the cAMP, the micropipette was quickly brought up to a pre-setposition approximately 1000 μm above the cells. A 40� PlanNeofluar 1.3 NA wide-field lens for epifluorescence and a 100� PlanFluar 1.45 NA TIRFM lens were used.Images were acquired on a Zeiss Axiovert Marianas Workstation from IntelligentImaging and Innovations. CFP was imaged using a 40 mW 445-nm laser and a 75mW 523-nm laser was used for exciting YFP. FRET fluorescence was imaged usinga Multispec (Dual View) CFP/YFP Dual EX/EM.
FRAP and confocal-imaging experimentsCells expressing either Gα2-CFP, Gβ-CFP, Gγ-CFP or cAR1-YFP were imagedon an Olympus FV1000 LSM equipped with an Olympus PlanApoN 60� objectiveand HeNe lasers at 458 nm (CFP excitation and bleaching) and 515 nm (YFPexcitation and bleaching). Regions within CFP-expressing cells were bleached withthe 458-nm laser for 100 iterations at 100% laser power. YFP-expressing cellswere bleached with the 515-nm laser for eight iterations at 50% laser power. Timelapses were taken every 1 second for the Gα2-CFP, Gβ-CFP and Gγ-CFP cellsand every 2 seconds for the cAR1-YFP cells. The resulting bleach spot was between20-40% of the original intensity. For stimulation experiments with cAMP, cellswere given a saturating dose (1 μM) of cAMP and then bleached. Fluorescencerecovery was graphed as a function of the total intensity of the cell versus thefluorescence of the bleached region and was then normalized to 1 as previouslydescribed (Goodwin and Kenworthy, 2005). Kymograph analyses were performedusing the kymograph plug-in from ImageJ, which is available to download forfree from the NIH.
Data analysis and statisticsImages were analyzed using Slidebook from 3I. CFP and YFP intensities werecalculated by first subtracting any changes in background fluorescence and thennormalizing to the first frame of the movie. FRET fluorescence was furthernormalized by subtracting the bleed-through of the CFP fluorescence from the YFPchannel. CFP bleed-through into the YFP channel was calculated by reading the CFPand YFP emission of CFP-expressing cells. Based on those numbers, the bleed-throughpercentage was determined to be 26%. Bleed-through of YFP into the CFP wasdetermined to be insignificant (0.07%). After subtracting any changes in backgroundfluorescence, the FRET YFP channel was further normalized by subtracting thechanges in CFP emission multiplied by 0.26. This corrected for any changes in bleed-through from the CFP channel. All data shown represent the average of threeindependent experiments plus the standard error of the mean.
We thank the Devreotes lab for providing the cAR1 and cAR3 nulls.This research was supported in part by the Vanderbilt Institute forIntegrative Biosystems Research and Education. Support for J.C. wasprovided by the Systems Biology Bioengineering UndergraduateResearch Experience. Program support for C.A.E. was provided by theVanderbilt Biomedical Research and Education Training Office, anInstitutional Research and Academic Career Developmental Awardfrom the NIGMS/NIH 5K12 GM068543-04, and NIHGM080370 toC.J. Deposited in PMC for release after 12 months.
ReferencesAxelrod, D. (2001). Total internal reflection fluorescence microscopy in cell biology. Traffic
2, 764-774.
Azpiazu, I. and Gautam, N. (2004). A fluorescence resonance energy transfer-based sensor
indicates that receptor access to a G protein is unrestricted in a living mammalian cell.
J. Biol. Chem. 279, 27709-27718.
Bagorda, A. and Parent, C. A. (2008). Eukaryotic chemotaxis at a glance. J. Cell Sci.121, 2621-2624.
Bourne, H. R. (1997). How receptors talk to trimeric G proteins. Curr. Opin. Cell Biol. 9,
134-142.
Bunemann, M., Frank, M. and Lohse, M. J. (2003). Gi protein activation in intact cells
involves subunit rearrangement rather than dissociation. Proc. Natl. Acad. Sci. USA 100,
16077-16082.
Journal of Cell Science 122 (15)
Jour
nal o
f Cel
l Sci
ence

2603G-protein activation live
Caterina, M. J., Hereld, D. and Devreotes, P. N. (1995). Occupancy of the Dictyostelium
cAMP receptor, cAR1, induces a reduction in affinity which depends upon COOH-
terminal serine residues. J. Biol. Chem. 270, 4418-4423.
Charest, P. G. and Firtel, R. A. (2006). Feedback signaling controls leading-edge formation
during chemotaxis. Curr. Opin. Genet. Dev. 16, 339-347.
de Keijzer, S., Serge, A., van Hemert, F., Lommerse, P. H., Lamers, G. E., Spaink, H.
P., Schmidt, T. and Snaar-Jagalska, B. E. (2008). A spatially restricted increase in
receptor mobility is involved in directional sensing during Dictyostelium discoideum
chemotaxis. J. Cell Sci. 121, 1750-1757.
Devreotes, P. and Janetopoulos, C. (2003). Eukaryotic chemotaxis: distinctions between
directional sensing and polarization. J. Biol. Chem. 278, 20445-20448.
Digby, G. J., Lober, R. M., Sethi, P. R. and Lambert, N. A. (2006). Some G protein
heterotrimers physically dissociate in living cells. Proc. Natl. Acad. Sci. USA 103, 17789-
17794.
Digby, G. J., Sethi, P. R. and Lambert, N. A. (2008). Differential dissociation of G protein
heterotrimers. J. Physiol. 586, 3325-3335.
Eichinger, L., Pachebat, J. A., Glockner, G., Rajandream, M. A., Sucgang, R.,
Berriman, M., Song, J., Olsen, R., Szafranski, K., Xu, Q. et al. (2005). The genome
of the social amoeba Dictyostelium discoideum. Nature 435, 43-57.
Frank, M., Thumer, L., Lohse, M. J. and Bunemann, M. (2005). G Protein activation
without subunit dissociation depends on a G{alpha}(i)-specific region. J. Biol. Chem.280, 24584-24590.
Futrelle, R. P., Traut, J. and McKee, W. G. (1982). Cell behavior in Dictyostelium
discoideum: preaggregation response to localized cyclic AMP pulses. J. Cell Biol. 92,
807-821.
Gales, C., Van Durm, J. J., Schaak, S., Pontier, S., Percherancier, Y., Audet, M.,
Paris, H. and Bouvier, M. (2006). Probing the activation-promoted structural
rearrangements in preassembled receptor-G protein complexes. Nat. Struct. Mol. Biol.13, 778-786.
Gibson, S. K. and Gilman, A. G. (2006). Gialpha and Gbeta subunits both define selectivity
of G protein activation by alpha2-adrenergic receptors. Proc. Natl. Acad. Sci. USA 103,
212-217.
Gilman, A. G. (1987). G proteins: transducers of receptor-generated signals. Annu. Rev.Biochem. 56, 615-649.
Goodwin, J. S. and Kenworthy, A. K. (2005). Photobleaching approaches to investigate
diffusional mobility and trafficking of Ras in living cells. Methods 37, 154-164.
Hamm, H. E. (1998). The many faces of G protein signaling. J. Biol. Chem. 273, 669-
672.
Huang, Y. E., Iijima, M., Parent, C. A., Funamoto, S., Firtel, R. A. and Devreotes, P.
(2003). Receptor-mediated regulation of PI3Ks confines PI(3,4,5)P3 to the leading edge
of chemotaxing cells. Mol. Biol. Cell 14, 1913-1922.
Insall, R. H., Soede, R. D., Schaap, P. and Devreotes, P. N. (1994). Two cAMP receptors
activate common signaling pathways in Dictyostelium. Mol. Biol. Cell 5, 703-711.
Janetopoulos, C., Jin, T. and Devreotes, P. (2001). Receptor-mediated activation of
heterotrimeric G-proteins in living cells. Science 291, 2408-2411.
Kumagai, A., Hadwiger, J. A., Pupillo, M. and Firtel, R. A. (1991). Molecular genetic
analysis of two G alpha protein subunits in Dictyostelium. J. Biol. Chem. 266, 1220-
1228.
Lambert, N. A. (2008). Dissociation of heterotrimeric g proteins in cells. Sci. Signal. 1, re5.
Levine, H., Kessler, D. A. and Rappel, W. J. (2006). Directional sensing in eukaryotic
chemotaxis: a balanced inactivation model. Proc. Natl. Acad. Sci. USA 103, 9761-9766.
Murray, D., McLaughlin, S. and Honig, B. (2001). The role of electrostatic interactions
in the regulation of the membrane association of G protein beta gamma heterodimers.
J. Biol. Chem. 276, 45153-45159.
Northup, J. K., Smigel, M. D., Sternweis, P. C. and Gilman, A. G. (1983). The subunits
of the stimulatory regulatory component of adenylate cyclase. Resolution of the
activated 45,000-dalton (alpha) subunit. J. Biol. Chem. 258, 11369-11376.
Oldham, W. M. and Hamm, H. E. (2008). Heterotrimeric G protein activation by G-
protein-coupled receptors. Nat. Rev. Mol. Cell Biol. 9, 60-71.
Saini, D. K., Kalyanaraman, V., Chisari, M. and Gautam, N. (2007). A family of G
protein betagamma subunits translocate reversibly from the plasma membrane to
endomembranes on receptor activation. J. Biol. Chem. 282, 24099-24108.
Schneider, I. C. and Haugh, J. M. (2006). Mechanisms of gradient sensing and
chemotaxis: conserved pathways, diverse regulation. Cell Cycle 5, 1130-1134.
Snaar-Jagalska, B. E., Van Es, S., Kesbeke, F. and Van Haastert, P. J. (1991). Activation
of a pertussis-toxin-sensitive guanine-nucleotide-binding regulatory protein during
desensitization of Dictyostelium discoideum cells to chemotactic signals. Eur. J.Biochem. 195, 715-721.
Sternweis, P. C., Northup, J. K., Smigel, M. D. and Gilman, A. G. (1981). The regulatory
component of adenylate cyclase: purification and properties. J. Biol. Chem. 256, 11517-
11526.
Suzuki, K. G., Fujiwara, T. K., Sanematsu, F., Iino, R., Edidin, M. and Kusumi, A.
(2007). GPI-anchored receptor clusters transiently recruit Lyn and G alpha for temporary
cluster immobilization and Lyn activation: single-molecule tracking study 1. J. Cell Biol.177, 717-730.
Ueda, M., Sako, Y., Tanaka, T., Devreotes, P. and Yanagida, T. (2001). Single-molecule
analysis of chemotactic signaling in Dictyostelium cells. Science 294, 864-867.
van Es, S. and Devreotes, P. N. (1999). Molecular basis of localized responses during
chemotaxis in amoebae and leukocytes. Cell Mol. Life Sci. 55, 1341-1351.
Xiao, Z., Zhang, N., Murphy, D. B. and Devreotes, P. N. (1997). Dynamic distribution
of chemoattractant receptors in living cells during chemotaxis and persistent stimulation.
J. Cell Biol. 139, 365-374.
Xu, X., Meier-Schellersheim, M., Jiao, X., Nelson, L. E. and Jin, T. (2005). Quantitative
imaging of single live cells reveals spatiotemporal dynamics of multistep signaling events
of chemoattractant gradient sensing in Dictyostelium. Mol. Biol. Cell 16, 676-688.
Yi, T. M., Kitano, H. and Simon, M. I. (2003). A quantitative characterization of the
yeast heterotrimeric G protein cycle. Proc. Natl. Acad. Sci. USA 100, 10764-10769.
Zhang, N., Long, Y. and Devreotes, P. N. (2001). Ggamma in dictyostelium: its role in
localization of gbetagamma to the membrane is required for chemotaxis in shallow
gradients. Mol. Biol. Cell 12, 3204-3213.
Jour
nal o
f Cel
l Sci
ence