•DSD AR 2011.indb - Department of Social Development
256
social development Department: Social Development REPUBLIC OF SOUTH AFRICA 11 Building a Caring Society. Together. Annual Report for the year ended 31 March 2011
-
Upload
khangminh22 -
Category
Documents
-
view
2 -
download
0
Transcript of •DSD AR 2011.indb - Department of Social Development

social development
Department:Social DevelopmentREPUBLIC OF SOUTH AFRICA
11
Building a Caring Society. Together.
Annual Reportfor the year ended 31 March 2011

Why are we called the Department
of Social Development?
In July 2000, the Department of Welfare was renamed The Department of Social Development.
We are called the Department of Social Development:
Because of our commitment to social transformation
We are committed to the agenda of social transformation embodied in the principle of social justice and
the Bill of Rights contained in our Constitution. We endeavour to create a better life for the poor, vulnerable,
and excluded people in our society.
Because our task is to reduce poverty and promote social integration
Our task is to develop and monitor the implementation of social policy that both creates an enabling
environment for and leads to a reduction in poverty. We ensure the provision of social protection and social
welfare services to all people who live in our land. We conduct research that develops the social indicators
necessary for programme implementation and public accountability.
Because our work is based on partnerships and the Batho Pele principles of service
delivery
All our work requires extensive and ongoing consultation with all sectors of our society. Our programmes
are integrated with those of other government departments and all spheres of government. We work in
partnership with NGOs, faith-based communities, the business sector, organised labour, and other role
players. We are committed to the Batho Pele (People First) principles, and use them to improve service
delivery to our clients and the public.
Because our actions are based upon solidarity and engender self-reliance
As social service professionals, we act on the basis of solidarity with all of humanity. We seek to empower
communities and engender self-reliance by creating conditions for sustainable livelihoods. This involves
expanding the range of choices available to communities.
Because of the range of our human services
Our development, social protection and social welfare services span the entire life cycle of human life and
encompass advocacy, promotion, prevention, care, mitigation and palliation.

1
Dir
ecto
rate
: In
tern
al A
ud
itIn
dep
end
ent
Trib
un
al fo
r S
oci
al A
ssis
tan
ce A
pp
eals
Bra
nch
: C
om
pre
hen
sive
So
cia
l S
ecu
rity
Bra
nch
: W
elfa
re S
ervi
ces
Bra
nch
: C
hie
f O
per
ati
on
s O
ffice
Bra
nch
: Fi
na
nce
Bra
nch
: C
orp
ora
te S
ervi
ces
Bra
nch
: S
oci
al P
olicy
Min
istr
yO
ffice
of
the
Min
iste
rC
hief
-of-
Sta
ffD
: Sta
ekho
lder
Man
agem
ent
and
Don
or C
o-or
dina
tion
D: S
uppo
rt S
ervi
ces
Offi
ce o
f th
e D
epu
ty M
inis
ter
Hea
d of
Offi
ce
Min
iste
r fo
r S
oci
al D
evel
op
men
t
Dir
ecto
r-G
ener
al
Chi
ef D
irec
tora
te: I
nter
gove
rnm
enta
l Rel
atio
ns
and
Exec
utiv
e su
ppor
t
Dir
ecto
rate
: Exe
cutiv
e S
uppo
rtD
irec
tor:
Inte
rnat
iona
l Rel
atio
ns
CD
: Fin
anci
al
Pla
nnin
g an
d M
onito
ring
CD
: Fin
anci
al
Man
agem
ent
and
Adm
inis
trat
ion
D: B
udge
t P
lann
ing
and
Mon
itori
ngD
: Cos
ting,
Fi
nanc
ial
Fore
cast
ing
and
Mod
ellin
gD
: Fin
anci
al
Mon
itori
ng o
f P
ublic
Ent
ities
D: I
nter
nal C
ontr
olD
: Fin
anci
al
Adm
inis
trat
ion
D: S
uppl
y C
hain
M
anag
emen
t
CD
: C
hief
In
form
atio
n O
ffice
rD
: Inf
orm
atio
n M
anag
emen
tD
: Inf
orm
atio
n Te
chno
logy
D: S
yste
ms
Dev
elop
men
t P
rogr
amm
e M
anag
er O
ffice
CD
: Leg
al S
ervi
ces
D: L
egis
lativ
e D
raft
ing
and
Rev
iew
D: L
itiga
tion
and
Con
trac
ts
Man
agem
ent
CD
: Hum
an C
apita
l M
anag
emen
tD
: Hum
an R
esou
rce
Man
agem
ent
D: E
mpl
oyee
R
elat
ions
D: S
ecto
r Ed
ucat
ion
and
Trai
ning
D: H
R O
rgan
isat
iona
l D
evel
opm
ent,
Str
ateg
y an
d P
lann
ing
CD
: Com
mun
icat
ions
D: M
edia
Rel
atio
ns
and
Con
tent
D
evel
opm
ent
D: C
orpo
rate
C
omm
unic
atio
nD
: Pub
lic L
iais
on
and
Even
ts
Man
agem
ent
D: S
ecur
ity
Man
agem
ent
CD
: Eco
nom
ics
of S
ocia
l P
rote
ctio
n (C
ontr
act)
CD
: Chi
ldre
n
CD
: Soc
ial C
rim
e P
reve
ntio
n an
d S
ubst
ance
A
buse
CD
: Wel
fare
S
ervi
ces
Tran
sfor
mat
ion
D: S
ervi
ce
Sta
ndar
dsD
: Soc
ial S
ervi
ce
Pro
vide
r M
anag
emen
t an
d S
uppo
rtD
: Car
e an
d S
ervi
ce
to O
lder
Per
sons
D: S
ervi
ce t
o Pe
ople
w
ith D
isab
ility
D: F
amili
es
D: C
hild
Pro
tect
ion
D: A
dopt
ions
and
In
tern
atio
nal
Soc
ial S
ervi
ces
D: O
rpha
ns a
nd
Vuln
erab
le
Chi
ldre
n
D: S
ubst
ance
Abu
se
and
Cen
tral
Dru
g A
utho
rity
D: V
ictim
Em
pow
erm
ent
Pro
gram
me
D: S
ocia
l Cri
me
Pre
vent
ion
CD
: Com
mun
ity
Dev
elop
men
t D
: Com
mun
ity
Dev
elop
men
t Po
licy
and
Ser
vice
S
tand
ards
D: Y
outh
Dev
elop
men
tD
: Sus
tain
able
Li
velih
oods
CD
: Soc
ial A
ssis
tanc
e
D: C
hild
ren
and
Fam
ilies
D
: Dis
abili
ty a
nd O
ld A
ge
D: S
ocia
l Rel
ief
D: P
olic
y Im
plem
enta
tion
Sup
port
CD
: Soc
ial I
nsur
ance
D: R
etir
emen
t R
efor
m
D: E
mpl
oym
ent A
ssis
tanc
e D
: Soc
ial I
nsur
ance
S
chem
esD
: Eco
nom
ics
of S
ocia
l P
rote
ctio
n: S
ocia
l S
ecur
ity
CD
: Spe
cial
Pro
ject
sD
: Str
ateg
y C
o-or
dina
tion
D: I
nstit
utio
nal
Co-
ordi
natio
n an
d C
apac
ity B
uild
ing
CD
: Mon
itori
ng a
nd
Eval
uatio
nD
: Ser
vice
Del
iver
y M
onito
ring
D: S
trat
egic
Info
rmat
ion
Ana
lysi
s an
d M
onito
ring
D: I
mpa
ct A
sses
smen
t C
o-or
dina
tion
D: E
cono
mic
s of
Soc
ial
Pro
tect
ion:
Inte
grat
ed
Dev
elop
men
tD
: Soc
ial P
olic
y P
lann
ing
and
Co-
ordi
natio
n (C
ontr
act)
D: S
ocia
l Pol
icy
Res
earc
h an
d Ev
alua
tion
(Con
trac
t)
CD
: Ent
ity a
nd
Ove
rsig
ht
Man
agem
ent
D: E
ntity
Sup
port
and
C
apac
ity B
uild
ing
D: E
ntity
Per
form
ance
CD
: Pop
ulat
ion
and
Dev
elop
men
tD
: Pop
ulat
ion
and
Dev
elop
men
t P
rogr
amm
esD
: Pop
ulat
ion
and
Dev
elop
men
t R
esea
rch
D: P
opul
atio
n an
d D
evel
opm
ent
Str
ateg
y
CD
: Str
ateg
y,
Pla
nnin
g,
Dev
elop
men
t an
d R
isk
Man
agem
ent
D: S
trat
egic
Pla
nnin
g
and
Man
agem
ent
D: B
usin
ess
Pro
cess
es,
Ris
k M
anag
emen
t an
d Im
mov
able
Ass
ets
D: G
ende
r Fo
cal P
oint
D: C
usto
mer
Car
e
NA
TIO
NA
L D
EPA
RTM
EN
T O
F S
OC
IAL
DE
VE
LOP
ME
NT
CD
: HIV
/AID
S
CD
: Non
-pro
fit
Org
anis
atio
ns
and
Part
ners
hips
D: P
reve
ntio
n P
rogr
amm
esD
: Car
e an
d S
uppo
rt
D: R
egis
trat
ion
and
Com
plia
nce
Faci
lity
D: D
atab
ase
Man
agem
ent
and
Sta
keho
lder
s Li
aiso
nD
: Ins
titut
iona
l C
apac
ity B
uild
ing
Bra
nch
: In
teg
rate
d D
evel
op
men
t

2 Annual Report 2010/2011 | Department of Social Development
Contents
Preface
Foreword by the Minister 3
Foreword by the Deputy Minister 4
Part A: General Information
1.1 Submission of the annual report to the Executive Authority 6
1.2 Overview by the Director-General 7
1.3 Ministry of Social Development 10
1.4 Mission statement 10
Vision 10
Mission 10
Values 10
Strategic priorities 10
1.5 Legislative mandate 11
Public entities and statutory bodies 11
National Development Agency 11
Central Drug Authority 12
Advisory Board on Social Development 12
Relief Fund Board 12
Part B: Programme Performance
2.1 Voted funds 14
2.2 Aim of vote 14
2.3 Key measurable objectives, programmes and achievements 14
Programmes 14
Overview of the service delivery environment for 2010/11 14
The organisational environment 17
Strategic overview and key policy developments 18
2.4 Departmental revenue, expenditure and other specific topics 19
Collection of departmental revenue 19
Departmental expenditure 19
Transfer payments 20
Capital investment, maintenance and asset management plan 23
Executive management 24
2.5 Programme performance 25
Programme 1: Administration 26
Programme 2: Comprehensive Social Security 53
Programme 3: Policy Development, Review and Implementation Support for Welfare Services 61
Programme 4: Integrated Community Development 79
Programme 5: Strategy and Governance 95
Part: C: Audit Committee Report 119
Part: D: Annual Financial Statements 122
Part: E: Human Resources Oversight 212
Part: F: Abbreviations 249

PREFACE
Foreword by the Ministerfor the year ended 31 March 2011
Department of Social Development | Annual Report 2010/2011 3
The Department achieved much during the past financial
year, and I take great pride in writing this introduction to its
Annual Report for this period.
These achievements reflect our enduring commitment to the
creation of an inclusive and caring South Africa. As growing
numbers of South Africans respond to the promise of a better life
for all, our commitment to achieving these goals has intensified.
During the reporting period, the social assistance programme
was expanded yet again. The child support grant was extended
to children aged 16 and 17, which significantly increased the
number of beneficiaries, and older men began to access grants
for older persons from the age of 60 years. These constitute
notable milestones towards creating a broader social safety net
that will effectively address the security of children and older
people. Research has widely confirmed the positive impact of
social security interventions on the lives of poor children and their
families. Among others, a study conducted by the United Nations
Children’s Fund (UNICEF) has shown that investing in children
by means of social grants increases their access to health care,
balanced nutrition, and active early learning, all of which improve
their overall wellbeing.
The Inter-Ministerial Committee on Social Security and Retirement
Reform, on which I serve, made significant progress towards
creating a more inclusive contributory social security system.
This system is aimed at preventing working people from falling
into poverty as a result to retirement, illness, disability, or job loss
due to economic upheavals by making contributions compulsory.
It also seeks to promote higher savings levels among working
people as part of a strategy for strengthening household economic
security.
Our investment in early childhood development services
underpins our commitment to the creation of a brighter future
for the country. As such, the reporting period saw a phenomenal
growth in the number of children benefiting from these services.
The number of registered ECD centres increased significantly.
Moreover, the Children’s Amendment Act and Older Person’s Act
came into effect, thus providing us with additional means to give
our children and the elderly the best possible care and protection.
On the international front, we participated in the activities of the
Southern African Development Community (SADC), the African
Union (AU), the United Nations, (UN), International Social Security
Association (ISSA), and the Organisation of Economic Cooperation
and Development (OECD). These interactions served as platforms
for sharing experiences of social development, and provided us with
an opportunity to help achieve South Africa’s foreign relations goals.
A highlight of the year was the hosting by the Department of a
successful international conference on behalf of ISSA. This was
the first time South Africa had hosted this event in ISSA’s 87-year
history. It was attended by more than 1 000 policy-makers, heads
and administrators of social security institutions, and representatives
of international organisations from more than 100 countries.
Civil society is an important partner in creating a caring and
more equitable society, and we continued to take further steps
to strengthen our partnerships with civil society organisations
(CSOs) during the reporting period. These growing partnerships
are effectively reflected in our motto: Building a Caring Society,
Together!
In conclusion, I wish to thank the staff of the Department,
its agencies, our provincial counterparts, and the Deputy
Minister, whose efforts continue to make me proud to serve
alongside them in creating a caring and equitable society.
Ms B O Dlamini, MP
Minister of Social Development

4 Annual Report 2010/2011 | Department of Social Development
PREFACE
Foreword by the Deputy Ministerfor the year ended 31 March 2011
During the past financial year, the Department developed
and implemented a number of policies aimed at stepping
up the fight against poverty, and improving the lives of
ordinary South Africans.
Creating vibrant communities free of substance abuse is a major
step towards promoting social cohesion and creating functional
and healthy families. In this context, the Department, together
with our social partners, hosted a successful Biennial Summit
on Substance Abuse which culminated in the adoption of several
resolutions and a plan of action for fighting this scourge. This
campaign, and our continued support for the fight against HIV
and AIDS, contributed significantly to our efforts to help all South
Africans live long and healthy lives.
The Department supported the establishment of food banks in
four provinces, and, with the help of donations from the private
sector, distributed more than 16 million food parcels to needy
families. In this regard, our partnership with Food Bank SA, the
private sector, and civil society is helping us to step up our fight
against food insecurity.
We also increased our participation in the War on Poverty, led
by the Office of the Deputy President. Among other things we
developed a strategy for taking the Department to the poorest
communities identified in the course of the campaign.
Institutionalising and professionalising the training of community
development practitioners (CDPs) remained a priority. The
Department succeeded in finalising a Community Development
Policy and Strategy which constitute major milestones towards
standardising the training of CDPs. The policy and strategy will
culminate in the creation of a bachelor’s degree in community
development.
The continued implementation of the Masupatsela Youth Pioneer
Programme gathered momentum when several youth pioneers
were linked to economic opportunities, while others obtained
scholarships to study towards a qualification in social work.
In order to promote public awareness of South Africa’s population
policy, the Department continued to support municipalities in
their efforts to include population issues in their Integrated
Development Plans (IDPs). In the coming year, the Department
will launch public awareness campaigns on gender equity, youth
development, HIV and AIDS, and environmental issues.
Given our limited resources, Non-Profit Organisations (NPOs) play
a vital role in helping us to provide services to people who would
otherwise be beyond our reach. We have significantly improved
our ability to register and monitor NPOs, and all provinces received
support on structures to facilitate an improved registration process
for these institutions. I also want to acknowledge the contribution
of the numerous civil society organisations that support us in our
efforts to improve South African society. The practical results of
these partnerships will be a litmus test of our commitment to our
lofty ideals.
Ms B M Ntuli, MP
Deputy Minister of Social Development

Part
AGeneral Information

6 Annual Report 2010/2011 | Department of Social Development
PART A: GENERAL INFORMATION
1.1 Submission of the Annual Report to the Executive Authority
social development
Department:Social DevelopmentREPUBLIC OF SOUTH AFRICA
The Hon Ms B O Dlamini
Minister of Social Development
Private Bag X 855
PRETORIA
0001
Honourable Minister
Annual report for the year ending 31 March 2011
I have the pleasure of presenting the Annual Report of the Department of Social Development for the year
1 April 2010 to 31 March 2011.
The Annual Report has been prepared as required by section 40 (1) (d) of the Public Finance Management
Act, 1999 (Act No 1 of 1999), and Part III J3 of the Public Service Regulations, 2001.
Mr Vusi Madonsela
Director-General

PART A: GENERAL INFORMATION
Department of Social Development | Annual Report 2010/2011 7
1.2 Overview by the Director-General (DG)
The Department has once again achieved a great deal
during the past financial year. Conscious of the fact that
we are one of the main government institutions tasked with
improving the lives of the bulk of our population, we worked hard
to develop new or expanded policies for providing services in the
vital areas of social security, care, protection, and sustainable
livelihoods. The shift in government focus from measuring
outputs to outcomes during the reporting period gave us a rare
opportunity to examine the contribution of the social sector to the
achievement of key government goals.
In the period under review, the social safety net was expanded to
14,7 million people, including more than 10,3 million children. In
a major step towards universalising the grant for older persons,
the National Treasury approved the gradual removal of the means
test up to the lowest tax threshold. Our commitment to human
solidarity lies at the heart of our efforts to ensure that our social
assistance programme is comprehensive enough to protect
individuals against all forms of vulnerability.
The Department, as a member of the Interdepartmental Task
Team on Social Security Reform, made extensive proposals for the
introduction of new social insurance benefits and the overhaul of
the institutional framework within which social security is provided.
Taken to their logical conclusion, the proposals will lead to the
consolidation of the policy function of social security under one
Department, in order to achieve greater efficiency and economies
of scale. The recommendations will be published in a Consolidated
Government Document due for release in the next financial year.
Early Childhood Development is a vital link in the continuum
of services through which we seek to achieve positive social
outcomes. In the period under review the number of registered
ECD centres increased to about 19 000. The number of children
in these centres increased to almost 970 000, with subsidies
provided to more than 720 000 by end March 2011. The growing
number of children accessing ECD services demonstrates our
determination to build human capital by providing as many
children as possible with expanded early learning opportunities.
This, together with investments in education and health, will
ensure that fewer people depend on safety nets in the long run.
Investments in education are also inspired by, or dovetail with,
our determination to contribute to a vital government outcome,
namely to improve the quality of basic education. The Children’s
Amendment Act came into force during the reporting period and
will give further impetus to efforts to improve the quality of early
childhood development services. We believe children can only
grow to become better citizens if they are brought up in stable,
cohesive families. To this end, the Department developed a Green
Paper on the Family which seeks to enhance the ability of families
to love, nurture, and support their members, thus enabling them
to increase their contribution to the development of the country.
The ongoing shortage of social workers is hampering the
provision of social welfare services, including vital services such
as foster care. The situation has been worsened by the fact that
large numbers of social workers have left the profession, while
others have emigrated, thereby increasing the burden on those
who remain behind. Given this, addressing the shortage of social
service professionals remains a major priority.
Following an additional allocation from the National Treasury,
and the promotion of social work as a profession among
suitable school-leavers, students benefiting from our social work
scholarship scheme increased from 4 200 to 5 574 in the year
under review, and 1 177 social work graduates were placed in jobs
in the various provinces. Moreover, 75 Departmental officials were
provided with financial aid for further study at tertiary institutions.
Given our limited resources, Government on its own is not always
equal to the task of dealing effectively with our social challenges.
As such, we continue to value the support of civil society in

8 Annual Report 2010/2011 | Department of Social Development
PART A: GENERAL INFORMATION
Overview by the Director-General (DG)
delivering services to areas we would otherwise not be able
to reach. We particularly value the continued contribution of
community development practitioners and young patriots such as
the Masupatsela Youth Pioneers to providing services we would not
be able to deliver on our own. They are helping to ensure that social
services are provided proactively to those in dire need.
Civil society organisations (CSOs) play a vital role in building
strong, cohesive communities. In this context, the department
heightened its efforts to register and monitor Non Profit
Organisations (NPOs) in accordance with the Non Profit
Organisations Act. A total of 10 230 NPOs were registered,
bringing the total of registered NPOs to almost 76 000. National
Treasury made an additional allocation for personnel in the unit
responsible for registering NPOs. Eighteen more positions were
created, which will help the Department to address the backlog in
registering and monitoring NPOs.
As part of its ongoing effort to improve its statutory oversight
over NPOs, the Department began a review of the Non Profi t
Organisations Act, aimed at identifying gaps in the Act and
amending it accordingly. The Department also made commendable
progress in building the capacity of Community Based
Organisations (CBOs) to strengthen responses to the scourge of
HIV and AIDS. In this regard, the Department, together with the
Nelson Mandela Foundation, introduced a strategy for mobilising
and capacitating communities, and World AIDS Day 2010 was
utilised to test its effectiveness. The Department, through the
National Development Agency, continued to fund CSOs which help
communities to become more economically active.
Our mandate goes beyond providing social assistance and social
welfare services. Together with other government departments, we
are also working on job creation strategies targeted at the poor,
and the Expanded Public Works Programme (EPWP) is a vital
component of our combined efforts to create decent employment
opportunities. During the reporting period, more than 110 000
EPWP job opportunities were created, exceeding the annual target
of 96 000, and more than 61 000 of these jobs were Full Time
Equivalents (FTE).
Results-based management flowing from the government’s
outcomes-based approach has further strengthened the need
for evidence-based policy-making. During the reporting period
the Department, together with Rhodes University in Grahamstown
and Oxford University in the United Kingdom, offered an intensive
training course on Social Policy Analysis for offi cials responsible
for policy development in the national and provincial social
protection and community development cluster. Besides this, an
intensive three-day Social Policy course was offered in Namibia to
offi cials responsible for policy-making in southern African.
In addition to reviewing its planning processes, the Department
also conducted rigorous quarterly programme performance reviews
in which its performance is assessed against the predetermined
targets contained in the Strategic Plan, and obstacles to service
delivery and other vital issues requiring timely intervention are
identifi ed. The Minister and Deputy Minister were informed of
programme performance by means of quarterly reports presented
to them by the Accounting Offi cer. All these efforts are aimed at
improving the services rendered by the Department.
The Department faces the perennial challenge of addressing
major socioeconomic challenges with limited human and fi nancial
resources. This challenge has become more acute in the wake
of the global fi nancial crisis, which has resulted in widespread
budget cuts. Among other things, this has resulted in reduced
funding for some NGOs which provide services on behalf of the
Department. Given this, there is a need to maintain a realistic
balance between expectations of service delivery on the one hand,
and the Department’s capacity for delivery in the context of its
limited resources on the other.
Despite these considerations, the Department received a major
vote of confi dence in the range of services it provides, and how it
provides them, in the form of the Public Sector Award bestowed
by the Brand Leadership Academy. This award – won for the
second consecutive year – attests to our commitment to service
excellence, and adds to my pride in forming part of the social
development family.
Vusi Madonsela
Director-General

PART A: GENERAL INFORMATION
Department of Social Development | Annual Report 2010/2011 9
1.3 Ministry of Social Development
OverviewThe Ministry is responsible for:
Managing policy advice processes;
Administering Cabinet affairs;
Administering parliamentary affairs;
Managing international liaison, donor co-ordination,
and media and public liaison;
Administering and co-ordinating stakeholders;
Providing secretariat services to governance structures
chaired by the Minister, namely MINMEC and Inter-
Ministerial Committees; and
Providing administrative services to the Minister.
Institutions reporting to the Executive
AuthorityThe following entities report to the Minister of Social
Development:
The National Development Agency (NDA);
Relief boards;
The Central Drug Authority;
The South African Council of Social Service
Professionals;
The Advisory Board on Social Development; and
The South African Social Security Agency (SASSA).
Bills submitted to the legislature
during the financial yearDuring the year under review, no Bills were submitted for
discussion by parliamentary committees.
International engagementsDuring the period under review the Minister and Deputy Minister
undertook several official international visits in order to fulfil the
social development mandate and to promote the African agenda
and fostering international solidarity.
DATE OF VISIT
COUNTRY/
PLACE VISITED PURPOSE OF VISIT
Minister
13 – 17 April 2010 Tunis, Tunisia Working visit by Deputy
President Motlantlhe
28 September –
03 October 2010
Addis Ababa, Ethiopia 4th Session of the African
Union Conference of Ministers
on Drug Control and Crime
Prevention
04 – 06 October 2010 New York, United
States
Pledging Conference of
Global Fund Third Voluntary
Replenishment 2011 – 2013
19 – 26 November
2010
Khartoum, Sudan 2nd Session of the AU
Conference of Ministers in
Charge of Social Development:
Strengthening Social Policy
Action towards Social Inclusion
20 February –
05 March 2011
New York, United
States
55th Session of the United
Nations Commission on the
Status of Women (UNCSW)
Deputy Minister
21 – 31 August 2010 Brasilia, Brazil Ministerial visit, signing
agreement
25 – 29 October 2010 New York, United
States
Invitation to UN Security
Council Resolution 1325 on
Women, Peace and Security
19 – 22 January 2011 Geneva, Switzerland Member of South African
Delegation to present the
National Periodic Report to the
Committee on the Elimination
of all Forms of Discrimination
against Woman (CEDAW)

10 Annual Report 2010/2011 | Department of Social Development
PART A: GENERAL INFORMATION
1.4 Mission Statement
VisionA caring and integrated system of social development services that
facilitates human development and improves the quality of life.
MissionTo ensure the provision of comprehensive social protection
services against vulnerability and poverty within the constitutional
and legislative framework, and create an enabling environment for
sustainable development. The Department further aims to deliver
integrated, sustainable and quality services, in partnership with all
those committed to building a caring society.
ValuesThe Department of Social Development is committed to the
following values:
PeopleUpholding the Constitution, ensuring accountability to the Minister
and parliament, and serving the people of South Africa.
ExcellenceMaintaining high standards of performance in our quest for
excellence, including equity, professionalism and fairness in the
delivery of our services.
PartnershipsWorking together with organs of state (civil society, business and
academia) and the international community.
Strategic prioritiesThe Department has formulated and committed itself to the
following key priorities:
Caring for and protecting vulnerable groups, especially
children, women and people with disabilities.
Strengthening families and communities.
Transforming social relations, with a specific focus on gender
and victim empowerment.
Providing comprehensive social security, including income
support, and a safety net for the destitute.
Strengthening institutional capacity to deliver quality services.
Reinforcing participation in key bilateral and multilateral
initiatives that contribute to poverty eradication.
In addition, the Department contributes to the realisation of some
of the following 12 government outcomes:
1. Improved quality of basic education.
2. A long and healthy life for all South Africans.
3. All people in South Africa are and feel safe.
4. Decent employment through inclusive economic growth.
5. A skilled and capable workforce to support an inclusive
growth path.
6. An efficient, competitive and responsive economic
infrastructure network.
7. Vibrant, equitable and sustainable rural communities with
food security for all.
8. Sustainable human settlements and improved quality of
household life.
9. A responsive, accountable, effective and efficient local
government system.
10. Environmental assets and natural resources that are well
protected and continually enhanced.
11. Create a better South Africa and contribute to a better and
safer Africa and world.
12. An efficient, effective and development-oriented public
service and an empowered, fair and inclusive citizenship.

PART A: GENERAL INFORMATION
Department of Social Development | Annual Report 2010/2011 11
1.5 Legislative Mandates
The ConstitutionThe Department of Social Development derives its core mandate
from the Constitution of the Republic of South Africa, 1996 (Act
No. 108 of 1996). Section 27 (1) (c) of the Constitution provides
for the right of access to appropriate social assistance to those
unable to support themselves and their dependants. In addition,
Section 28 (1) of the Constitution sets out the rights of children
with regard to appropriate care, basic nutrition, shelter, healthcare
and social services, and detention.
Schedule 4 of the Constitution further identifies welfare services,
population development, and disaster management as functional
areas of concurrent national and provincial legislative competence.
The following existing laws constitute the legal framework for the
Department of Social Development in South Africa:
Acts of Parliament
Aged Persons Act, 1967 (Act No. 81 of 1967/Older Persons
Act, 2006 (Act No. 13 of 2006)
Advisory Board on Social Development Act, 2001
(Act No. 3 of 2001)
Child Care Act, 1983 (Act No. 74 of 1983)
Children’s Act, 2005 (Act No. 38 of 2005)
Children’s Amendment Act 2007 (Act No. 41 of 2007)
Fund-raising Act, 1978 (Act No. 107 of 1978)
Non-profit Organisations Act, 1997 (Act No. 71 of 1997)
National Development Agency Act, 1998 (Act No. 108 of 1998)
Social Service Professions Act, 1978 (Act No. 110 of 1978)
Social Assistance Act, 2004 (Act No. 13 of 2004)
Social Assistance Amendment Act, 2010 (Act No. 5 of 2010)
Prevention and Treatment of Drug Dependency Act, 1992
(Act No. 20 of 1992)
Probation Services Act, 1991 (Act No. 116 of 1991)
White Paper on Population Policy (1998)
The South African Social Security Agency Act, 2004
(Act No. 9 of 2004)
The National Welfare Act, 1978 (Act No. 100 of 1978)
Public entities and statutory bodies
South African Social Security AgencyThe South African Social Security Agency (SASSA) is listed
as a Schedule 3A public entity in terms of the Public Finance
Management Act, 1999 (Act No. 1 of 1999). The agency was
established in terms of the South African Social Security Agency
Act of 2004 (Act No. 9 of 2004).
The key functions of this agency include the effective
management, administration and payment of social assistance,
as well as:
The processing of applications for social assistance, namely
Grants for Older Persons, War Veterans Grants, Child Support
Grants, Care Dependency Grants, Foster Child Grants, Disability
Grants, Grants-in-Aid, and Social Relief of Distress;
The verification and timely approval of applications;
The management and reconciliation of the payment of grants
to eligible beneficiaries by contractors;
Market social assistance; and
Quality service assurance, by ensuring compliance with norms
and standards as well as fraud prevention and detection.
National Development AgencyThe National Development Agency (NDA) is a listed Schedule 3A
public entity in terms of the Public Finance Management Act, and
is accountable to the Minister of Social Development. The NDA
was established in terms of the National Development Agency
Act, 1998 (Act No. 108 of 1998), which replaced the Transitional
National Development Trust (TNDT).
The key strategic objectives of the NDA, as prescribed in the
legislation, are to:
Grant funds to civil society organisations for the purpose of
meeting the developmental needs of poor communities;
Strengthen the institutional capacity of organisations for long-
term sustainability;

12 Annual Report 2010/2011 | Department of Social Development
PART A: GENERAL INFORMATION
Legislative Mandate
Central Drug Authority
Advisory Board on Social Development
Relief Fund Boards
Board of the Disaster Relief Fund:
Board of the Refugee Relief Fund:
Board of the State President’s Fund:
Board of the Social Relief Fund:

Programme Performance
Part
B

14 Annual Report 2010/2011 | Department of Social Development
PART B: PROGRAMME PERFORMANCE
2. Programme Performance
2.2 Aim of VoteThe aim of the Department of Social Development is to ensure
protection against vulnerability by creating an enabling
environment for the provision of comprehensive, integrated, and
sustainable social development services.
2.3 Key measurable objectives, programmes and achievements
2.3.1 Programmes
Programme 1: AdministrationProvide overall administrative and key support services to the
Department and the Ministry.
Programme 2: Comprehensive Social SecurityDevelop comprehensive social security policies and provide
income support to vulnerable groups.
Programme 3: Policy Development, Review and Implementation Support for Welfare ServicesCreate an enabling environment for the delivery of equitable
developmental welfare services through the formulation of policies,
standards, best practice and support to social service providers.
Programme 4: Community DevelopmentCreate an enabling environment for the empowerment of the
poor and vulnerable through the promotion and support of
community development work, the strengthening of institutional
arrangements, and dialogue with civil society.
Programme 5: Strategy and GovernanceProvide sector-wide strategy, leadership, oversight, alignment and
co-ordination of mandates, strategies, and social and population
policies.
2.3.2 Overview of the service delivery environment
The social sector delivers its services in the context of major
challenges presented by poverty, unemployment and inequality. In
order to respond adequately to these challenges, the Department
has committed itself to implementing a number of interventions,
including comprehensive social security, welfare services, and
community development services. The shift in government focus
from outputs to outcomes has given the Department a unique
opportunity to help achieve these outcomes.
Social securityThe provision of comprehensive social security, including income
support and a safety net for the destitute, remains the cornerstone
of the fight against poverty affecting children and older persons.
In this regard, the Department, through the South African Social
Security Agency (SASSA), expanded the social safety net to more
than 14 million individuals. The Child Support Grant was extended
to children aged 16 and 17, which increased the number of
children benefiting from the grant to more than 10,3 million. Age
equalisation between male and female recipients of the Grant for
Older Persons entered its third and final phase when men aged
2.1 Voted funds
Main Adjusted Actual Over/under-appropriation appropriation amount spent expenditure
Appropriation R’000 R’000 R’000 R’000
Department of Social Development 95 929 061 95 941 061 94 031 030 1 910 031
Responsible Minister Minister of Social Development
Administering Department Department of Social Development
Accounting Officer Director-General of the Department of Social Development

PART B: PROGRAMME PERFORMANCE
Department of Social Development | Annual Report 2010/2011 15
60 started accessing the grant, thus increasing the number of
elderly people receiving the grant to 2, 6 million. This augmented
the incomes of grant recipients, and enabled the Department to
contribute directly to Outcome 7: Vibrant, equitable and sustainable
rural communities with food security for all and Outcome 2: A long
and healthy life for all South Africans.
Social security reform: The Department continued to contribute
to the work of the Interdepartmental Task Team on Social
Security Reform by making concrete proposals for introducing a
social insurance system, as well as overhauling the institutional
framework for social security. It proposed that the policy-making
function for social security be consolidated under one department.
It also proposed the establishment of a national social security
fund to provide retirement, disability, and survivor benefits to all
formally employed contributors eligible to contribute. Moreover,
it proposed that the social security agencies currently providing
similar benefits should be streamlined to achieve efficiencies and
economies of scale, while enhancing the quality of the services
offered to the population. The Department’s recommendations
will be published in a Consolidated Government Document
meant to serve as the basis for countrywide consultation with
stakeholders in the next financial year.
Early childhood Development: The provision of comprehensive
ECD services is inspired by our goal of investing in the
development of children as one of the primary means of
improving human capital and reducing intergenerational poverty.
As a result, the number of registered ECD sites increased to
just under 19 000, and the number of children benefiting from
ECD services to almost 790 000. Improving ECD services is a
key step towards a number of positive social outcomes, and
will enable the Department to contribute towards improving the
quality of basic education (Outcome 1).
HIV and AIDS: HIV and AIDS are devastating the lives of many
South Africans, and remain a major obstacle to achieving a long
and healthy life for all South Africans (Outcome 2). In view of
this the Department continued to contribute to HIV prevention
through social behaviour change initiatives, especially care and
support strategies for vulnerable groups affected by HIV and
living with AIDS. The Department also played an active role in
the HIV counselling and testing campaign announced by the
President on World AIDS day in 2009.
As part of its contribution to the National Strategic Plan for HIV, AIDS
and Sexually Transmitted Infections 2007–2011, the Department
continued to provide funding to the National Association for People
Living with HIV and AIDS (NAPWA). NAPWA provides care and
support for people living with HIV and AIDS through counselling
and support groups focusing on the promotion of positive living,
treatment and nutrition support.
Substance abuse: A major outcome of the second Biennial
Summit on Substance Abuse hosted by the Department was
the adoption of resolutions guiding the development of a
National Drug Master Plan and an integrated Plan of Action
for combating substance abuse. In this way, the Department
contributed directly to the key goal of achieving a long and
healthy life for all South Africans (Outcome 2).
Social cohesion: Significant progress was made in supporting
and strengthening family and community interventions which
foster social cohesion. A particular milestone in this respect was
the finalisation of a Green Paper on the Family. The eventual
White Paper will provide strategic guidance on providing
services to families in an integrated way. Through these efforts,
the Department is contributing to the national goal of building
sustainable human settlements and improving the quality of
household life (Outcome 8).
Victim empowerment: A successful international conference
on victim empowerment was held under the theme
‘Accelerating Action towards integrated Service Delivery for
Victims of Crime’. A major outcome of the conference was
the adoption of several resolutions which culminated in the
development of a draft Programme of Action. Preventing and
reducing incidents of social crime will help to create a society in
which all South Africans are and feel safe (Outcome 3)
Youth development: As part of the government’s multipronged
strategy to reduce youth unemployment, the Department linked
791 Masupatsela Youth Pioneers to economic opportunities
by facilitating their employment as Assistant Community
Development Practitioners. This will also contribute to the
creation of decent employment among the youth.
The Expanded Public Works Programme: The Department leads
the co-ordination of the Expanded Public Works Programme in

16 Annual Report 2010/2011 | Department of Social Development
PART B: PROGRAMME PERFORMANCE
Programme Performance
the social sector, with the Department of Public Works as overall
co-ordinator. In the year under review the social sector created
more than 110 000 job opportunities – significantly more than
its annual target of 96 000. More than 61 300 were full-time
equivalents. This, along with other initiatives to link young people
with economic opportunities, makes the Department a key player
in creating decent employment through inclusive economic
growth (Outcome 4).
Civil society support: The registration of non-profit organisations
was also prioritised. A total of 15 232 applications were received.
Of these, 10 238 were registered, but 4 723 failed to meet
the requirements. The Department has markedly improved its
oversight role over NPOs. As a result, it was able to serve notices
to more than 12 600 NPOs which failed to comply with the
legislation. Effectively run NPOs are key partners in promoting
vibrant, equitable and sustainable communities (Outcome 7).
Shortage of social workers: Following additional financial
allocations by the National Treasury, the Department continued
to implement its financial aid scheme for students who intend to
pursue a career in social work. A total of 5 574 students funded
by the Department are registered for social work courses at a
number of tertiary institutions for higher learning. This is part of
the Department’s efforts to recruit and retain sufficient number
of skilled social services professionals to improve the reach
and quality of services to the public and will contribute to the
realisation of Outcome 12.
Governance and institutional developmentMaintaining sound organisational and business practice is an
integral part of promoting accountability and efficiency within
the Department. As such audits were carried out in accordance
with the standards and requirements of the Institute of Internal
Auditors (IIA) and the Department’s Audit Charter. A formal report
detailing audit findings and recommendations was issued to all
relevant managers, who ensured in turn that corrective action
was taken to address identified deficiencies. Risk plans were also
developed for all business units, and a risk assessment report
was compiled and approved by the Director-General. In addition,
quarterly performance reviews of predetermined objectives served
to promote a culture of results-based management throughout
the institution. The Department also continued to implement
sound financial management systems aimed at promoting the
efficient utilisation of resources. These include the monitoring of
funds transferred to other organisations.
Overall performance targets achieved
Deviation Status Total targets
■ 0–25% Achieved 202
■ 26–75% In progress 27
■ 76–100% Not achieved 18
27
18
202
0
14 000
28 000
42 000
56 000
70 000
84 000
98 000
AuditedActual
Final Appropraition
Budgeted and actual expenditure
R94 031 030R95 941 061

PART B: PROGRAMME PERFORMANCE
Department of Social Development | Annual Report 2010/2011 17
Regional and international solidarityThe Department helps to promote South Africa’s foreign policy
goals, especially with respect to contributing to the creation of a
better South Africa and contribute to a better and saferAfrica and
World (Outcome 11). It is a leading player in the social dimensions
of the New Partnership for Africa’s Development (NEPAD) on
behalf of the Africa Group and the G77 in the UN Commission for
Social Development, and participated in a number of international
initiatives. It also participated in the SADC Labour Affairs Sector,
the SADC Population and Development Commission, the African
Union, and several United Nations commissions.
The Department works with other institutions within and outside
government to implement its mandate in this sector, and the
consultative and interdepartmental nature of some of the work
has at times delayed or threatened to derail some of its initiatives.
BudgetThe initial budget allocation to the Department for the 2010/11
financial year was R95 929 billion. This included major transfers
for Social Assistance, SASSA, and the National Development
Agency (NDA). As part of the 2010 Adjusted Estimates of National
Expenditure, an additional amount of R12 million was allocated to
the Department. This comprised:
R5,6 million in roll-over funds from the 2009/10 financial year
for the Emergency Social Relief Fund; and
R6,4 million for general salary and housing allowance increases.
The final budget allocation for the 2010/11 financial year
amounted to R95 941 061 billion.
VirementsAt the close of the 2010/11 financial year, the following virements
were effected:
Per main division
Programme 3: Policy Development, Review and
Implementation Support for Welfare Services – R4,5 million
of the unspent funds under this programme was shifted to partly
fund the approved funding of the Disaster Relief account under
Programme 2: Comprehensive Social Security.
Programme 4: Community Development – R4,5 million of
the unspent funds under this programme was shifted to partly
fund the approved funding of the Disaster Relief account under
Programme 2: Comprehensive Social Security.
Programme 5: Strategy and Governance – R1 million was
shifted from the unspent funds under this programme to partly
fund the approved funding of the Disaster Relief account under
Programme 2: Comprehensive Social Security.
Per economic classification
Goods and services: R20 524 million was shifted from Goods and
Services to fund the approved transfer to the Disaster Relief Fund
and other transfers at the end of the 2010/11 financial year.
Transfers and subsidies: Approval was obtained from the National
Treasury to increase the transfer allocation by the Department.
2.3.3 Overview of the organisational
environmentThe Department did not experience any disruption such as strike
action by staff. However, a number of challenges conspired to
delay meeting some of the targets set for the reporting period.
Similarly, given the collaborative and interdependent nature
of some of the work done by the Department, it can only fully
meet some of its targets if the other institutions deliver on their
commitments as well.
Human resources limitationsAccording to the Non Profit Organisations Act, 1997, (Act No.71
of 1997), registration of Non Profit Organisations (NPOs) is the
responsibility of the national Department. While the volume of
applications for NPO registration is growing, this has not been
matched by increases in the personnel needed to handle this task.
As a result, the National Treasury agreed to provide additional
funds for 18 more staff members to address the backlog in
registering and monitoring NPOs.
The shortage of social workers threatened to derail the execution
of the HIV Counselling and Testing Campaign (HCT) announced
by the President in December 2009. However, in response to this

18 Annual Report 2010/2011 | Department of Social Development
PART B: PROGRAMME PERFORMANCE
Programme Performance
challenge, the Department compiled a database of retired social
workers and trained them together with social workers in the
Department in HIV and AIDS counselling, thus enabling them to
support the HCT campaign in schools.
In response to other human resource challenges arising from
resignations, the Department appointed 32 individuals on
temporary contracts. Similarly, the Department advertised
positions as soon as they became vacant, reducing the vacancy
rate from 10 to 8 percent. In order to broaden its skills base, the
Department provided financial support to 75 of its personnel in
order to enable them to further their studies.
Lack of financial resourcesLimited financial resources have also impeded the Department’s
attempts to extend the national audit of early childhood
development facilities beyond four provinces.
2.3.4 Strategic overview and key policy
development
Policy developmentThe most significant policy achievement was the approval by
the National Treasury of the universalisation of the old age grant,
to be phased in by raising the means test ceiling and ultimately
eliminating it. This will bolster the government’s attempts to address
poverty among older people. Other policy initiatives include the
approval by MinMEC of a consolidated policy on social relief and a
Social Relief Bill; the finalisation of the Green Paper on the Family;
the development of a transformation strategy for child and youth
care centres, and norms and standards for cluster foster care for
the care and protection of children in alternative care.
Policies were also made or refined in respect of finance, children,
victim empowerment, non-profit organisations, HIV/AIDS, and
community development. The details are contained in programme-
specific parts of the report.
Legislative changesThe Social Assistance Amendment Bill was drafted and tabled in
Parliament. Following various amendments, the Bill was passed in
September 2010 as the Social Assistance Amendment Act 2010
(Act No. 5 of 2010).
Proclamations relating to the implementation of the Children’s Act,
2005, the Older Persons Act, 2006 and the Children’s Act, 2007
were approved by the President and published in the Government
Gazette of 1 April 2010. The legislation came into force during the
reporting period.

PART B: PROGRAMME PERFORMANCE
Department of Social Development | Annual Report 2010/2011 19
2.4 Departmental revenue, expenditure and other specific topics
Collection of Departmental revenueThe Department is a policy-making institution and is therefore not involved in income generation. The major revenue item relates to interest
earned on social assistance transfer funds which are transferred to SASSA as well as recoveries of funds from dormant beneficiary bank
accounts.
2007/08 2008/09 2009/10 2010/11 2010/11 % deviation
Actual Actual Actual Target Actual from target
R’000 R’000 R’000 R’000 R’000 %
Tax revenue
Non-tax revenue 9 905 16 055 30 509 10 062 4 911 51,2
Interest 9 821 15 881 17 591 10 032 4 083 59,3
Parking 47 25 23 30 59 96,6
Bursaries 5 42 80 — 23 100
Commission 3 67 79 — 89 100
Recoveries previous year 29 40 12 528 — 657 100
Sales of capital assets
(Capital Revenue) — — 105 — —
Financial transactions
(Recovery of loans and advances) 227 052 429 211 500 111 5 597 98,9
Total Departmental Receipts 236 957 16 484 30 617 510 173 10 508 97,9
Departmental expenditure
Roll-overs
Voted and
2010/11 adjustments Virements Final voted Expenditure Variance
Programmes R’000 R’000 R’000 R’000 R’000 R’000
Programme.1:
Administration 180 766 20 911 — 201 677 194 159 7 518
Programme 2:
Comprehensive Social Security 95 136 497 3 659 10 000 95 150 156 93 260 988 1 889 168
Programme 3:
Policy Development, Review
and Implementation Support
for Welfare Services 346 047 (256) (4 500) 341 291 337 060 4 231
Programme 4:
Community Development 194 390 (7 856) (4 500) 182 034 177 376 4 658
Programme 5:
Strategy and Governance 71 361 (4 458) (1 000) 65 903 61 447 4 456
Total 95 929 061 12 000 — 95 941 061 94 031 030 1 910 031

20 Annual Report 2010/2011 | Department of Social Development
PART B: PROGRAMME PERFORMANCE
Programme Performance
Programme 1: Administration reflects an under-expenditure of
R7,518 million. The underexpenditure is mainly due to the turn-
over of staff, delays in the filling of vacant posts and efficiency
savings realised on operational costs.
Programme 2: Comprehensive Social Security reflects an
underexpenditure of R1 889 168 million. The underexpenditure
mainly relates to the Social Assistance Grants due to the lower
than expected beneficiary uptake rates and delays in the
finalisation of planned projects before the end of the financial year.
Programme 3: Policy Development, Review and
Implementation Support for Welfare Services reflects an
under-expenditure of R4,231 million. The underexpenditure is
mainly due to the turnover of staff, delays in the filling of vacant
posts and savings realised on operational costs.
Programme 4: Community Development reflects an under-
expenditure of R4,658 million. The underexpenditure mainly
relate to the turn-over of staff, delays in the filling of vacant posts,
efficiency savings realised on operational costs and delays in the
transfer of funds to NGOs due to outstanding compliance aspects.
Programme 5: Strategy and Governance reflects an under-
expenditure of R4,456 million. The underexpenditure mainly relate
to the turnover of staff, delays in the filling of vacant posts and
efficiency savings realised on operational costs.
2.3.5 Transfer paymentsTransfers to be listed and reported on include:
Transfers to households
Amount transferred
Institution R’000
Programme 2:
Comprehensive Social Security
Disaster Relief Fund 20 000
Social Relief Fund 4 787
Social Assistance Transfer Funds 87 492 902
Services funded
Programme 2: Comprehensive Social Security
Relief Fund Boards (Disaster Relief/Social
Relief/Refugee Relief/President’s Relief)
A Social Relief Bill has been drafted with the view to consolidating all Social Relief
Funds under one Act and repealing the Fund-Raising Act, 1978 (Act No. 107 of 1978).
Social Relief of Distress In terms of the Bill, Social Relief Funds will no longer by managed by the Relief
Funds Board or disbursed by SASSA. Instead, in order to fast-track interventions
and streamline disbursements, these funds will be managed and disbursed by the
provinces.
During the period under review, R143 million was allocated for Social Relief of
Distress, and these funds were depleted. In December 2010, an additional sum of
R36 million was allocated for flood relief, and disbursed by SASSA. No funds were
disbursed by the Disaster Relief Fund Board.

PART B: PROGRAMME PERFORMANCE
Department of Social Development | Annual Report 2010/2011 21
Transfers to public entitiesAn amount of R5 940 856 million was transferred to public entities during the 2010/11 financial year.
Amount transferred
Name of institution R’000
Programme 2: Comprehensive Social Security
South African Social Security Agency (SASSA), including the SASSA Management Information System 5 631 387
Programme 3: Policy Development, Review and Implementation Support For Welfare Services
National Student Financial Aid Scheme 226 000
Programme 4: Community Development
National Development Agency (NDA) 83 469
Compliance with section 38(1)(j) of the PFMAMeasures introduced by the Department to ensure that SASSA and the NDA comply with section 38(1)(j) of the PFMA are as follows:
Programme 2: Comprehensive Social Security
South African Social Security Agency (SASSA) The Minister appoints SASSA’s CEO.
Besides the Performance Agreement between the Minister and
CEO, the Minister signed an Agency Agreement that defines the
relationship between the Department and SASSA.
The Minister also approves SASSA’s annual strategic plans and
budgets, and requires quarterly progress reports.
Programme 4: Community Development
National Development Agency (NDA) The Minister appoints the NDA Board and CEO.
The Minister signed an Agency Agreement that defines the
relationship between the Department and the NDA.
The Minister approves the annual strategic plans and budgets,
and requires quarterly progress reports.

22 Annual Report 2010/2011 | Department of Social Development
PART B: PROGRAMME PERFORMANCE
Programme Performance
Transfers to NGOs, other entities and civil societyAn amount of 65 289 million was transferred to NGOs and other entities during the 2010/11 financial year. There was no significant
increase or decrease in these payments compared to the 2010/11 financial year.
Amount transferred
Name of institution R000
Programme 2: Comprehensive Social Security
Other transfers
International Social Security Association 811
International Organisation of PE 46
Programme 3: Policy Development, Review and Implementation Support For Welfare Services
National bodies:
Die Ondersteuningsraad 516
Deaf Federation of South Africa (DEAFSA) 627
South African National Council on Alcoholism and Drug Dependence (SANCA) 1 353
Suid-Afrikaanse Vrouefederasie (SAVF) 601
South African Council for Social Service Profession (SACSSP) 1 100
Child Welfare 1 723
Apostolic Faith Mission (AFM) 573
Badisa Christian Compassion 481
Afrikaanse Christelike Vrouevereniging (ACVV) 1 001
National Council for Persons with Physical Disabilities (NCPPDSA) 703
Family and Marriage Society of South Africa (FAMSA) 1 002
National Institute for Crime Prevention and the Integration of Offenders (NICRO) 971
Epilepsy South Africa 909
Lifeline Southern Africa 972
Khulisa Crime Prevention Initiate 1 191
South African Older Persons 591
Child Line South Africa 770
SA Depression and Anxiety Group 859
Alzheimer South Africa 700
Action on Elder Abuse SA 534
SA Federation for Mental Health 636
National Association of Scholarship 275
Other transfers
International Social Service 71
Commission for Narcotic Drugs 25
Walvis Bay 141
Programme 4: Community Development
NAPWA 482
NABSSA 273
Khanya-AICDD 286
Soul City 1 000
Love Life 43 460
Programme 5: Strategy and Governance
United Nations Population Fund (UNFPA) (Membership) 191
Partners in Population Development 315
UNRISD 100

PART B: PROGRAMME PERFORMANCE
Department of Social Development | Annual Report 2010/2011 23
Conditional grants and earmarked fundsThe Department of Social Development did not administer any
conditional grant programmes during the 2010/11 financial year.
2.3.6 Capital investment, maintenance and
asset management plan
Capital investmentThe Department’s movable capital assets consist mainly of:
Office furniture;
Vehicles;
IT infrastructure and equipment; and
Kitchen and office equipment.
The Department does not own any immovable capital assets. At
the beginning of the financial year it owned movable assets worth
R56,4 million. During the financial year the Department acquired
276 individual assets worth R3,9 million. No assets were disposed
of during the period under review. The loss of ten assets worth
R62 413,56 is being investigated.
Asset managementThe Department adheres to the asset management implementation
plan developed by the National Treasury. The Department’s
asset register complies with the minimum information required
in terms of the Asset Management Guideline issued by the
National Treasury. During the period under review the Department
conducted one stock-take of all assets instead of the two required
by Departmental Asset Management Policy. This was due to a lack
of capacity in the Directorate Supply Chain Management. Although
two asset management clerks were appointed in the third quarter
of the previous financial year, one post became vacant in the
first quarter and the other in the third quarter of the 2010/2011
financial year. On a monthly basis, all newly acquired assets are
reconciled against the accounting records. The Department’s Asset
Management Policy and Strategy has been implemented. An Asset
Management Committee ensures that requests for assets comply
with departmental policies, norms and standards before they are
procured. There is a moratorium on the procurement of assets in
large. The only assets procured are computer equipment, office
equipment for newly established functions, and where no existing
furniture is available.
MaintenanceSince the Department has no immovable assets, maintenance
costs in respect of fixed assets were very low. Most assets are
also fairly new, and all IT assets come with a vendor warranty
ranging between one and three years. When the warranties
expire, the Department enters into a maintenance agreement with
the relevant vendor.

24 Annual Report 2010/2011 | Department of Social Development
PART B: PROGRAMME PERFORMANCE
Executive Management
Mr WK MagaselaProgramme Manager:
Social Policy
Vacant
Chief Operating Officer:
Strategy and Governance
Mr S JehomaDeputy Director-General:
Comprehensive Social Security
Ms V PetersenProgramme Manager:
Independent Tribunal for Social
Assistance Appeals
Mr P NetshipaleActing Deputy Director-General:
Community Development
Mrs D SnymanActing Chief Financial Officer
Dr M MabetoaDeputy Director-General:
Welfare Services
Mr V MadonselaDirector-General

Administration
Programme 1

26 Annual Report 2010/2011 | Department of Social Development
PART B: PROGRAMME PERFORMANCE
Programme 1: Administration
PurposeThis programme comprises policy formulation, corporate
governance, support services (including human resource
management, financial and risk management, information
technology and management, legal services, security services,
internal audit and communication services), and executive
management services (including ministerial services,
deputy ministerial services, and services to the Offi ce of the
Director-General).
Highlights of the 2010/11 fi nancial year
Recent outputs
Human capital management
The Department developed a generic organisational structure for
provincial departments of social development. The structure, and
its phased development, was approved by MINMEC on 31 March
2011. Substantial progress was made with regard to occupations
in the Population and Development and Monitoring and Evaluation
functional areas, in order to remedy inconsistencies and to ensure
uniformity in the grading of similar jobs in the social development
sector. Benchmarked job descriptions for both functional areas
were fi nalised, and the project teams went on to evaluate the job
descriptions in order to determine grading levels.
A Human Resources Plan for the Department was developed
and approved by the Minister, and good progress was made
with the implementation thereof. The plan will be reviewed in
mid-2011. Part of the plan involves realigning the Department’s
organisational structure with the government’s new outcomes
approach as well as the Minister’s priorities. The realignment will
be completed in the next fi nancial year.
The vacancy rate was reduced from 9 to 8 percent. A total of 135
appointments were made, while 74 offi cials left the Department.
A three year wellness strategy was developed and approved.
Twenty-fi ve percent of the programme was implemented, which
included the following:
The fi rst Sports Day in the history of the Department;
Two Wellness Days during which health workers measured the
blood pressure, glucose levels, and cholesterol levels of 328
offi cials, thus encouraging them to adopt healthier lifestyles;
The commemoration of World AIDS Day, which helped to create
a greater awareness of HIV among offi cials;
Gender dialogues for offi cials on topics of interest that affect
them on a daily basis; and
Routine counselling to officials experiencing challenges
affecting their productivity and wellbeing.
The Department developed and implemented a workplace skills
plan as required by the Skills Development Act. A total of 121
courses were co-ordinated, and attended by 449 offi cials
within the Department. An amount of R4 360 506 was
spent on training, more than the minimum of 1 per cent
of the personnel budget required by the Skills Development
Act.
In order to enhance the formal skills base of the
Department, 105 offi cials received bursaries to further
their studies in various fi elds. The Department continued
its internship programme, and 45 interns were placed in
various positions. We continued to provide technical support
to line managers for implementing various capacity-
building programmes. A total of 61 learners completed the
Child and Youth Care Learnership in partnership with the
Gauteng provincial government and the Health and Welfare
Sector Education and Training Authority (HWSETA). All the
graduates secured permanent employment.

PART B: PROGRAMME PERFORMANCE
Department of Social Development | Annual Report 2010/2011 27
As part of its recruitment and retention strategy, the Department,
in partnership with the HWSETA and the South African Council for
Social Service Professions (SACSSP), implemented the first ever
Social Work Exchange Programme. It was launched by the Minister
in February 2011, and the first phase of the programme was
completed when eight local social workers and eight social workers
in the United Kingdom were exchanged.
Performance agreements, work plans, mid-term review reports,
and annual performance appraisals were completed as required
by the Department’s Performance Management and Development
Scheme (PMDS).
With regard to labour relations, the social dialogue with trade
unions as our social partners is entrenched in the Department
and the sector. Both the Bargaining Council and National Chamber
are operating effectively, and the Council concluded at least three
collective agreements. This was facilitated by a number of initiatives,
including building the capacity of participants. Sound labour
relations continued within the Department as well. Ninety five per
cent of misconduct cases were finalised within three months, and
grievances were finalised within 30 days except in cases with
phased mediation processes. As an enabler of service delivery,
the Department intends to consolidate and further improve social
dialogue in the sector in the next financial year.
Financial management
The Department continued to improve its financial management.
This included the introduction of a register for managing outstanding
orders and invoices, the reconciliation and clearing of commitments,
information sessions with identified functional areas to create
improved awareness of Departmental policy requirements, and
the analysis and monitoring of funds transferred to organisations.
The audit steering committee continued to monitor the agreed
management strategy for addressing external audit findings.
The Department continued to oversee the management and
administration of social grants by SASSA, and remained
accountable for the R89 billion voted for this function in the
financial year under review.
Executive support
This unit concretised efforts to improve the Departments decision
making processes. The Department’s FOSAD Cluster and
Implementation Forum Co-ordination Strategy was reviewed in
order to align it with the FOSAD Cluster system. The Department
is represented in all FOSAD clusters and implementation forums
and is making a significant contribution to achieving some of
the key government outcomes. It continues to chair the Social
Protection and Community Development (SP&CD) Cluster, which
involves the following functions:
Convening cluster meetings;
Providing secretariat services to the cluster;
Coordinating the cluster task teams;
Convening workshops with provincial clusters; and
Helping to prepare cluster media briefings.
The Unit Executive Support continued to provide the DG with
professional executive and administrative support. We developed
terms of reference for management forums as well as written
communication guidelines and also maintained existing
administrative systems in the Department (including systems
for processing submissions, answering parliamentary questions,
decision-making processes, etc).
International relations
The Department continued to play an active role in advancing and
promoting the social development agenda internationally. It has
bilateral agreements with Mali, Brazil, Cuba, China, the Democratic
Republic of Congo, Angola and Mexico, focusing on information
exchange, good practice models for poverty eradication, the
training of social services professionals, social security reforms,
the management of NPOs, and support at international meetings.
It hosted benchmarking delegations from Tanzania, China, and
Kenya which visited South Africa to study its successful social
security systems, youth and children programmes, and community
development initiatives. It continued to develop agreements with
Zimbabwe and other neighbouring countries which are due to
be finalised soon. The Department is an important member of
various SADC, AU and UN institutions, and uses this platform
to advance social development issues, build a regional and
continental consensus, and advocate a strong African voice
in social development. It participates in the SADC Labour and

28 Annual Report 2010/2011 | Department of Social Development
PART B: PROGRAMME PERFORMANCE
Programme 1: Administration
Social Affairs Sector and the SADC Population and Development
Commission; the AU Ministers of Social Development and African
Population Commission; and the UN commissions on social
development, population and development, the status of women,
and narcotics. Each year the Department leads consultations
on the Social Dimensions of NEPAD at the UN Commission for
Social Development on behalf of the Africa Group and the G77.
Participation in these meetings has also contributed to capacity-
building in the Department.
A number of specialised international organisations are providing
social development support services, and the Department plays
a leading role in some of them. The DDG: Welfare Services
serves on the Board of International Social Services while the
DG and three senior officials serve in the highest structure of the
International Social Security Association (ISSA). This has enhanced
the stature of the Department and the country.
The Department successfully hosted the World Social Security
Forum in Cape Town in December 2010. It also participated in
Organisation for Economic Cooperation and Development (OECD)
and European Union (EU) activities focusing on social policy and
employment and social issues. It has been extremely encouraging
to see how many people, countries, and institutions from all over
the world interact with the Department, and value their relations
with it, in pursuit of a better Africa and a better world.
Communications
This Chief Directorate continued to provide strategic and executive
communication support, which has heightened the profile and
image of the Department. For the second year running, the
Department won five annual Brand Leadership Academy Public
Sector Excellence Awards. Other highlights include the International
Victim Empowerment Conference which received wide and
positive media coverage, the anti-substance abuse campaign, the
2nd Biennial Substance Abuse Summit, and co-ordination of the
communication activities of the Social Protection and Community
Development Cluster as well as the Inter-Ministerial Committee on
Anti-Substance Abuse.
Public liaison and engagement is becoming increasingly important
for government. In this regard, the Chief Directorate also provided
communication support for the public participation programmes
of the Minister and Deputy Minister, which was highly rated by
the Government Communication and Information System (GCIS).
The Chief Directorate also embarked on an extensive public
participation programme for disadvantaged rural communities. As
a result, the DSD became one of the first government departments
to exceed the requisite number of public participation programmes.
Attention was also paid to improving the Department’s corporate
image. Major activities in this regard included corporate
publications, attending to external signage, updating the department
website, publishing the internal newsletter online, and co-ordinating
staff interactions with the DG and political principals.
Information Management System and Technology
(IMST)
This chief directorate continued to build the necessary systems and
capacity. The integration of silo systems with the Social Development
Information Management System (SDIMS) got off to a good start
with the current systems being reverse-engineered and code-
converted to run on SDIMS. However, this effort was not completed
due to reduced capacity within the Eastern Cape State Information
Technology Agency.
New functionality and services were developed to complete Child
Protection Register (CPR) and Child and Youth Care Administration
(CYCA) compliance with the Children’s Act and Child Justice Act.
The knowledge management strategy developed previously was
incrementally implemented, focusing on communicating the
strategy and conducting a readiness assessment. A pilot data
warehouse solution based on open source software (Pentaho)
was developed. Ad hoc reports were generated for business units
(such as social crime prevention and children services), which
derived value from these reports.
New functionality to support the management of the War on
Poverty Programme was added to the National Integrated Social
Information System (NISIS). A Geographic Information System
(GIS) was implemented using Google Earth, which can map down
to household levels.
Internal audit
All audits complied with the standards of the Institute of Internal
Auditors (IIA) and those laid down in the Department’s audit
charter. The audit reviews were aimed at assessing the efficacy
of key controls which ensure that units within the Department are
effectively managed and operate in accordance with its policies
and procedures. System and control weaknesses identified in the

PART B: PROGRAMME PERFORMANCE
Department of Social Development | Annual Report 2010/2011 29
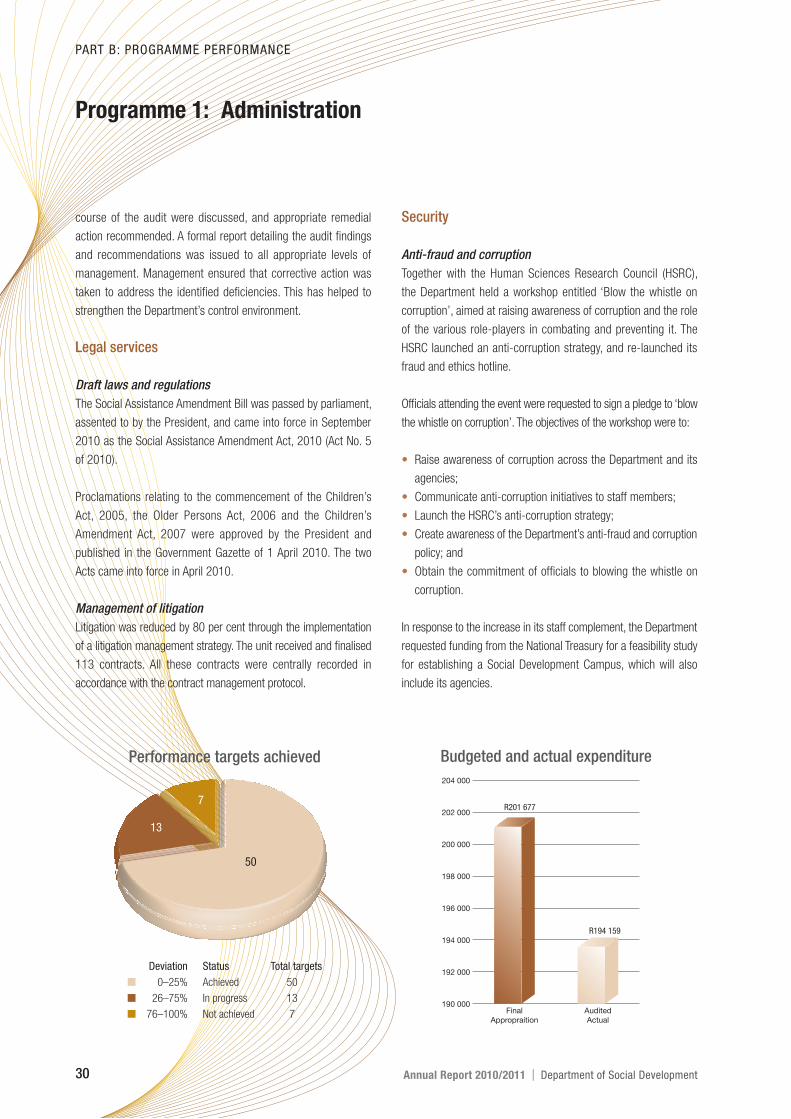
30 Annual Report 2010/2011 | Department of Social Development
PART B: PROGRAMME PERFORMANCE
Programme 1: Administration
course of the audit were discussed, and appropriate remedial
action recommended. A formal report detailing the audit findings
and recommendations was issued to all appropriate levels of
management. Management ensured that corrective action was
taken to address the identified deficiencies. This has helped to
strengthen the Department’s control environment.
Legal services
Draft laws and regulations
The Social Assistance Amendment Bill was passed by parliament,
assented to by the President, and came into force in September
2010 as the Social Assistance Amendment Act, 2010 (Act No. 5
of 2010).
Proclamations relating to the commencement of the Children’s
Act, 2005, the Older Persons Act, 2006 and the Children’s
Amendment Act, 2007 were approved by the President and
published in the Government Gazette of 1 April 2010. The two
Acts came into force in April 2010.
Management of litigation
Litigation was reduced by 80 per cent through the implementation
of a litigation management strategy. The unit received and finalised
113 contracts. All these contracts were centrally recorded in
accordance with the contract management protocol.
Security
Anti-fraud and corruption
Together with the Human Sciences Research Council (HSRC),
the Department held a workshop entitled ‘Blow the whistle on
corruption’, aimed at raising awareness of corruption and the role
of the various role-players in combating and preventing it. The
HSRC launched an anti-corruption strategy, and re-launched its
fraud and ethics hotline.
Officials attending the event were requested to sign a pledge to ‘blow
the whistle on corruption’. The objectives of the workshop were to:
Raise awareness of corruption across the Department and its
agencies;
Communicate anti-corruption initiatives to staff members;
Launch the HSRC’s anti-corruption strategy;
Create awareness of the Department’s anti-fraud and corruption
policy; and
Obtain the commitment of officials to blowing the whistle on
corruption.
In response to the increase in its staff complement, the Department
requested funding from the National Treasury for a feasibility study
for establishing a Social Development Campus, which will also
include its agencies.
Performance targets achieved
Deviation Status Total targets
■ 0–25% Achieved 50
■ 26–75% In progress 13
■ 76–100% Not achieved 7
7
13
50
Budgeted and actual expenditure
R194 159
190 000
192 000
194 000
196 000
198 000
200 000
202 000
204 000
AuditedActual
FinalAppropraition
R201 677

Department of Social Development | Annual Report 2010/2011 31
Pro
gra
mm
e 1:
Ad
min
istr
ati
on
Key
ou
tpu
ts a
nd
ser
vice
del
iver
y in
dic
ator
s
Mea
sura
ble
ob
ject
ives
: To
deve
lop
com
preh
ensi
ve s
ocia
l sec
urity
pol
icie
s, a
nd p
rovi
de in
com
e su
ppor
t to
vul
nera
ble
grou
ps.
Goa
lTo
red
uce
inco
me
pove
rty
amon
g po
or a
nd v
ulne
rabl
e Sou
th A
fric
ans
Ou
tcom
eIm
prov
ed s
ocio
-eco
nom
ic s
tatu
s of
hou
seho
lds
Fun
ctio
nal
are
asS
trat
egic
ob
ject
ive
Bas
elin
eP
erfo
rman
ce in
dic
ator
Targ
etA
ctu
al o
utp
uts
% d
evia
tion
from
tar
get
Hum
an c
apita
l
man
agem
ent
Ade
quat
ely
reso
urce
the
DS
D10%
vac
ancy
rat
eVa
canc
y ra
te; a
ttriti
on r
ate
of p
rofe
ssio
nals
in th
e
Dep
artm
ent
Red
uce
vaca
ncy
rate
to
8%
Vaca
ncy
rate
red
uced
to
8%
0%
Cre
ate
an e
nabl
ing/
cond
uciv
e
wor
king
env
ironm
ent
Empl
oyee
Hea
lth a
nd
Wel
lnes
s (E
HW
) rep
ort
Impl
emen
tatio
n of
EH
W
prog
ram
me;
num
ber
of
empl
oyee
s co
vere
d by
EH
W
prog
ram
me
Dev
elop
EH
W p
rogr
amm
e;
impl
emen
t 25%
of
prog
ram
me
Pro
gram
me
deve
lope
d an
d ap
prov
ed, a
nd 2
5%
impl
emen
ted
0%
Faci
litat
e an
d m
onito
r
the
impl
emen
tatio
n of
the
hum
an c
apita
l str
ateg
y in
the
soci
al s
ecto
r
DSD
wor
kpla
ce s
kills
pla
nN
umbe
r of
offi
cial
s be
nefit
ing
from
wor
k pl
ace
skill
s pl
an
per
cate
gory
Impl
emen
t w
ork
plac
e
skill
s pl
an
12
1 t
rain
ing
initi
ativ
es w
ere
atte
nded
by
44
9 o
ffici
als,
incl
udin
g
inte
rns
(som
e at
tend
ed m
ore
than
one
initi
ativ
e).
R4
360
506
was
spe
nt o
n tr
aini
ng, i
nclu
ding
the
paym
ent o
f
burs
arie
s. T
his
amou
nt e
xcee
ded
the
requ
ired
min
imum
of 1
% o
f
the
pers
onne
l bud
get (
R2
4513
80) t
o be
spe
nt o
n tr
aini
ng.
64
car
ry-t
hrou
gh b
ursa
rs a
nd 4
1 n
ew b
ursa
rs w
ere
regi
ster
ed
for
the
20
11
aca
dem
ic y
ear.
13
stu
dent
s co
mpl
eted
the
ir
stud
ies.
45
inte
rns
wer
e pl
aced
in t
he D
SD
. 18
res
igne
d an
d
secu
red
perm
anen
t em
ploy
men
t. Ei
ght
of t
hese
wer
e ab
sorb
ed
with
in t
he D
SD
.
0%
Rin
g-fe
nce
at le
ast
1%
of t
he b
udge
t fo
r tr
aini
ng
prog
ram
mes
in t
erm
s of
the
Ski
lls D
evel
opm
ent A
ct
Coo
rdin
atio
n of
cap
acity
-
build
ing
prog
ram
mes
for
soci
al s
ervi
ce p
rofe
ssio
ns
and
rela
ted
occu
patio
ns in
the
soci
al s
ecto
r
Coo
rdin
ate
capa
city
-bui
ldin
g
prog
ram
mes
for
soc
ial
serv
ice
prof
essi
ons
and
rela
ted
occu
patio
ns in
the
soci
al s
ecto
r
The
DSD
sig
ned
a m
emor
andu
m o
f agr
eem
ent w
ith th
e H
WSE
TA
to tr
ain
com
mun
ity d
evel
opm
ent p
ract
ition
ers
and
pres
ent a
n
HIV
/AID
S an
d in
tegr
ated
dev
elop
men
t cou
rse
for
gove
rnm
ent
man
ager
s an
d pl
anne
rs.
61 le
arne
rs c
ompl
eted
chi
ld a
nd y
outh
car
e le
arne
rshi
ps.
38 o
ffici
als
atte
nded
soc
ial p
olic
y an
d so
cial
ana
lysi
s tr
aini
ng.
Eigh
t soc
ial w
orke
rs w
ere
sele
cted
for
and
succ
essf
ully
com
plet
ed
the
soci
al w
ork
exch
ange
pro
gram
me
betw
een
the
HW
SETA
and
UK
Skill
s fo
r C
are.
0%

32 Annual Report 2010/2011 | Department of Social Development
Pro
gra
mm
e 1:
Ad
min
istr
ati
on
Goa
lTo
red
uce
inco
me
pove
rty
amon
g po
or a
nd v
ulne
rabl
e Sou
th A
fric
ans
Ou
tcom
eIm
prov
ed s
ocio
-eco
nom
ic s
tatu
s of
hou
seho
lds
Fun
ctio
nal
are
asS
trat
egic
ob
ject
ive
Bas
elin
eP
erfo
rman
ce in
dic
ator
Targ
etA
ctu
al o
utp
uts
% d
evia
tion
from
tar
get
Hum
an c
apita
l
man
agem
ent
Hig
h-le
vel g
ener
ic
orga
nisa
tiona
l str
uctu
re
for
prov
ince
s
Gen
eric
org
anis
atio
nal
stru
ctur
es im
plem
ente
d in
all
prov
ince
s
Impl
emen
t ap
prov
ed h
igh-
leve
l nat
iona
l and
pro
vinc
ial
orga
nisa
tiona
l str
uctu
res
A D
SD
tas
k te
am v
isite
d 8
pro
vinc
ial d
epar
tmen
ts (e
xclu
ding
Gau
teng
) to
help
the
m r
ealig
n th
eir
high
-lev
el o
rgan
isat
iona
l
stru
ctur
es.
On
7 an
d 8
Sept
embe
r 20
10, t
he H
eads
of S
ocia
l Dev
elop
men
t
Serv
ices
hel
d a
wor
ksho
p w
ith 9
pro
vinc
ial d
epar
tmen
ts o
n
real
igni
ng th
eir
high
-lev
el o
rgan
isat
iona
l str
uctu
res.
The
DS
D a
nd D
PS
A c
onso
lidat
ed a
ll th
e in
puts
and
dis
trib
uted
the
cons
olid
ated
fun
ctio
nal m
odel
to
head
s of
HR
M. I
nput
s/co
mm
ents
from
the
pro
vinc
ial d
epar
tmen
ts a
s w
ell a
s ge
neric
inpu
ts/c
omm
ents
wer
e co
nsid
ered
and
incl
uded
.
Dra
ft g
ener
ic f
unct
iona
l str
uctu
res
for
prov
inci
al d
epar
tmen
ts
wer
e pr
esen
ted
to t
he H
SD
S o
n 2
4 F
ebru
ary
20
11
.
A d
raft
gen
eric
fun
ctio
nal s
truc
ture
was
pre
sent
ed t
o M
INM
EC o
n
31
Mar
ch 2
01
1.
10
%1
DSD
HR
Pla
nIm
plem
enta
tion
of t
he D
SD
HR
Pla
n
Impl
emen
t th
e D
SD
HR
Pla
n O
rgan
isat
ion
al D
evel
opm
ent
a.
Clim
ate
Sur
vey
(Mas
ungu
lo):
Ensu
re t
he c
ompl
etio
n of
the
follo
win
g ac
tiviti
es b
y w
ork
stre
am le
ader
s an
d re
port
prog
ress
to
MA
NC
O o
n a
mon
thly
bas
is:
Offi
ce a
ccom
mod
atio
n
A
n ap
prov
ed c
ontr
acto
r w
as a
ppoi
nted
to
pain
t of
fices
on
the
4th
floo
r –
66
offi
ces
wer
e re
ady
for
occu
patio
n.
Park
ing
Th
e co
stin
g of
60
par
king
bay
s at
Inte
rpar
k w
as fi
nalis
ed.
Rec
eptio
n re
furb
ishm
ent
A
con
trac
tor
was
app
oint
ed t
o re
furb
ish
the
rece
ptio
n ar
ea.
b.
A c
oord
inat
ing
com
mitt
ee w
as e
stab
lishe
d to
mon
itor
proj
ects
allo
cate
d to
the
Mas
ungu
lo p
roje
ct, p
rese
nt th
e
cost
impl
icat
ions
of t
he p
roje
ct to
the
budg
et c
omm
ittee
and
EXC
O, w
ork
clos
ely
with
the
DG
, and
gar
ner
supp
ort f
rom
the
DG
bef
ore
refe
rrin
g is
sues
to th
e re
leva
nt s
truc
ture
s
and
mai
nstr
eam
ing
proj
ects
into
line
func
tions
as
wel
l as
stra
tegi
c pl
anni
ng.
0%

Department of Social Development | Annual Report 2010/2011 33
Goa
lTo
red
uce
inco
me
pove
rty
amon
g po
or a
nd v
ulne
rabl
e Sou
th A
fric
ans
Ou
tcom
eIm
prov
ed s
ocio
-eco
nom
ic s
tatu
s of
hou
seho
lds
Fun
ctio
nal
are
asS
trat
egic
ob
ject
ive
Bas
elin
eP
erfo
rman
ce in
dic
ator
Targ
etA
ctu
al o
utp
uts
% d
evia
tion
from
tar
get
Hum
an c
apita
l
man
agem
ent
c.
Coo
rdin
atio
n pr
oces
s of
Pop
ulat
ion
and
Dev
elop
men
t an
d
Mon
itori
ng a
nd E
valu
atio
n.
Popu
latio
n an
d D
evel
opm
ent
coor
dina
tion
proc
ess
Jo
b de
scrip
tions
for
iden
tified
four
wor
k st
ream
s w
ere
deve
lope
d
and
cons
ulte
d w
ith p
rovi
ncia
l dep
artm
ents
. Job
ana
lysi
s of
Popu
latio
n R
esea
rch
wor
k st
ream
was
fina
lised
.
Mon
itorin
g an
d Ev
alua
tion
coor
dina
tion
proc
ess
Jo
b de
scrip
tions
for
iden
tified
two
wor
k st
ream
s w
ere
deve
lope
d
and
cons
ulte
d w
ith p
rovi
ncia
l dep
artm
ents
.
d.
Dev
elop
men
t of
the
org
anis
atio
nal s
truc
ture
and
pos
t
esta
blis
hmen
t of
the
Inde
pend
ent T
ribu
nal f
or S
ocia
l
Ass
ista
nce
Fina
lised
the
des
ign
of o
rgan
isat
iona
l str
uctu
re.
Dev
elop
ed jo
b de
scrip
tions
for
90
pos
ts.
Fina
lised
the
job
eval
uatio
n.
Fina
lised
the
cos
ting.
Fina
lised
sub
mis
sion
to
the
Min
iste
r to
obt
ain
appr
oval
for
the
stru
ctur
e.
e.
App
eals
wer
e fin
alis
ed a
nd r
efer
red
to t
he M
inis
ter
for
appr
oval
on
24
Mar
ch 2
01
1.
Man
age
and
impl
emen
t
an e
ffec
tive
and
effic
ient
perf
orm
ance
man
agem
ent
and
deve
lopm
ent
syst
em
PM
DS p
olic
y, D
PSA
dire
ctiv
e
and
guid
elin
es
Num
ber
of s
taff
qual
ifyin
g pe
r
cate
gory
of p
erfo
rman
ce/r
ank
Ass
essm
ent
of q
ualif
ying
staf
f m
embe
rs in
ter
ms
of
the
PM
DS p
olic
y
Ass
ess
qual
ifyin
g st
aff
mem
bers
in t
erm
s of
the
PM
DS p
olic
y
All
qual
ifyin
g st
aff
mem
bers
in t
erm
s of
the
PM
DS
pol
icy
wer
e
asse
ssed
.
0%

34 Annual Report 2010/2011 | Department of Social Development
Pro
gra
mm
e 1:
Ad
min
istr
ati
on
Goa
lTo
red
uce
inco
me
pove
rty
amon
g po
or a
nd v
ulne
rabl
e Sou
th A
fric
ans
Ou
tcom
eIm
prov
ed s
ocio
-eco
nom
ic s
tatu
s of
hou
seho
lds
Fun
ctio
nal
are
asS
trat
egic
ob
ject
ive
Bas
elin
eP
erfo
rman
ce in
dic
ator
Targ
etA
ctu
al o
utp
uts
% d
evia
tion
from
tar
get
Hum
an c
apita
l
man
agem
ent
Pro
vide
a la
bour
rel
atio
ns
serv
ice
Effe
ctiv
e m
anag
emen
t of
colle
ctiv
e ba
rgai
ning
pro
cess
Pro
mot
e co
nstr
uctiv
e so
cial
dial
ogue
in t
he s
ecto
r
Con
clud
e at
leas
t tw
o
colle
ctiv
e ag
reem
ents
Thre
e co
llect
ive
agre
emen
ts w
ere
conc
lude
d.0
%
Fina
lise
mis
cond
uct
case
s
with
in t
hree
mon
ths.
Com
plai
nts,
grie
vanc
es a
nd
disc
iplin
ary
case
s fin
alis
ed
with
in t
hree
mon
ths
Ave
rage
tim
e ta
ken
to fi
nalis
e
case
s an
d co
mpl
aint
s
Fina
lise
com
plai
nts,
grie
vanc
es a
nd d
isci
plin
ary
case
s w
ithin
thr
ee m
onth
s
95
% o
f gr
ieva
nces
and
com
plai
nts
wer
e fin
alis
ed w
ithin
30
day
s 5
%2
Rea
son
s fo
r d
evia
tion
1 C
onsu
lting
pro
vinc
ial s
truc
ture
s to
ok lo
nger
tha
n ex
pect
ed, a
nd t
he fi
rst
MIN
MEC
mee
ting
afte
r D
ecem
ber
2010 t
ook
plac
e on
31 M
arch
2011.
2 T
he d
evia
tion
on g
rieva
nces
and
com
plai
nts.
One
rem
aini
ng c
ase
was
del
ayed
by
strik
e ac
tion,
and
the
tra
de u
nion
s re
ques
ted
that
the
mat
ter
be p
lace
d in
abe
yanc
e un
til t
he s
trik
e w
as o
ver.
Sub
sequ
ently
, the
em
ploy
ee w
as o
n si
ck le
ave
for
abou
t
thre
e m
onth
s. T
he o
ther
cas
e w
as a
n ex
tend
ed c
onci
liatio
n an
d co
uld
not
be fi
nalis
ed w
ithin
thr
ee m
onth
s. D
evia
tion
on m
isco
nduc
t ca
ses
caus
ed b
y th
e un
avai
labi
lity
of w
itnes
ses.
Goa
lTo
fac
ilita
te fi
nanc
ial d
ecis
ion-
mak
ing
and
adeq
uate
fina
ncia
l res
ourc
es f
or e
ffec
tive
serv
ice
deliv
ery
Ou
tcom
eA
ppro
pria
te f
undi
ng le
vels
Fun
ctio
nal
are
asS
trat
egic
ob
ject
ive
Bas
elin
eP
erfo
rman
ce in
dic
ator
Targ
etA
ctu
al o
utp
uts
% d
evia
tion
from
tar
get
Fina
ncia
l pla
nnin
g
mon
itorin
g
Impr
oved
cos
ting,
fina
ncia
l
fore
cast
ing
and
mod
ellin
g
Mai
n fo
cus
on s
ocia
l
assi
stan
ce g
rant
s
Ad
hoc
cost
ing
of o
ther
soc
ial
deve
lopm
ent f
unct
ions
Dra
ft in
tegr
ated
pol
icy
and
proc
edur
es m
anua
l
Cos
ting
100%
of
DSD
serv
ices
ove
r fiv
e ye
ars
Cos
t 10%
of
soci
al
deve
lopm
ent
polic
ies,
legi
slat
ion
and
prog
ram
mes
The
follo
win
g S
D p
olic
ies
and
stra
tegi
es w
ere
cost
ed:
–
empl
oyee
wel
lnes
s st
rate
gy
–
orph
ans
and
vuln
erab
le c
hild
ren
(OVC
) Str
ateg
y
A s
tart
was
mad
e w
ith c
ostin
g th
e im
plem
enta
tion
plan
for
the
stra
tegy
on
care
for
abus
ed, n
egle
cted
and
exp
loite
d ch
ildre
n (C
AN
E).
The
cost
ing
of t
he f
ollo
win
g de
part
men
tal f
unct
ions
wer
e st
arte
d:
–
info
rmat
ion
tech
nolo
gy
–
supp
ly c
hain
man
agem
ent
–
soci
al c
rime
prev
entio
n
The
cost
ing
of o
ther
ope
ratio
nal a
nd s
taff
cos
ts w
ere
done
as
inpu
ts f
or d
ecis
ion-
mak
ing.
30
%1
New
and
rev
ised
mod
els
for
impr
oved
for
ecas
ting
and
anal
ysis
Rev
iew
exi
stin
g fo
reca
stin
g
mod
els,
and
dev
elop
new
mod
els
for
impr
oved
fore
cast
ing
and
anal
ysis
The
soci
al a
ssis
tanc
e gr
ants
pro
ject
ion
mod
el w
as r
evie
wed
and
reco
mm
enda
tions
mad
e fo
r m
odfif
ying
the
exis
ting
mod
el
The
activ
ity-b
ased
cos
ting
(AB
C) m
odel
was
pilo
ted
in t
he s
uppl
y
chai
n m
anag
emen
t, in
form
atio
n te
chno
logy
and
soc
ial c
rime
prev
entio
n un
its a
nd is
at
diff
eren
t st
ages
of
final
isat
ion.
20
%2

Department of Social Development | Annual Report 2010/2011 35
Goa
lTo
fac
ilita
te fi
nanc
ial d
ecis
ion-
mak
ing
and
adeq
uate
fina
ncia
l res
ourc
es f
or e
ffec
tive
serv
ice
deliv
ery
Ou
tcom
eA
ppro
pria
te f
undi
ng le
vels
Fun
ctio
nal
are
asS
trat
egic
ob
ject
ive
Bas
elin
eP
erfo
rman
ce in
dic
ator
Targ
etA
ctu
al o
utp
uts
% d
evia
tion
from
tar
get
Fina
ncia
l pla
nnin
g
mon
itorin
g
Impr
oved
bud
get
plan
ning
Fund
ing
dict
ates
ser
vice
s
Mis
alig
nmen
t be
twee
n
allo
catio
n an
d st
rate
gy
Dra
ft in
tegr
ated
pol
icy
and
proc
edur
es m
anua
l
Aut
omat
ed fi
nanc
ial
proc
esse
s
Aut
omat
e fin
anci
al p
lann
ing
proc
esse
s
Dra
ft a
utom
ated
exp
endi
ture
mon
itorin
g pr
oces
s co
mpl
eted
10
%3
Impr
oved
exp
endi
ture
mon
itorin
g an
d re
port
ing
Mon
thly
ana
lysi
s, m
onito
ring
and
repo
rtin
g
A c
ompr
ehen
sive
fina
ncia
l
man
agem
ent
data
base
Dev
elop
and
mai
ntai
n a
com
preh
ensi
ve fi
nanc
ial
man
agem
ent
info
rmat
ion
data
base
Dat
abas
e re
view
ed, i
mpr
oved
and
mai
ntai
ned
0%
Lim
ited
man
agem
ent
info
rmat
ion
in s
uppo
rt o
f
expe
nditu
re t
rend
s
Expe
nditu
re n
orm
s ap
prov
ed
for
key
depa
rtm
enta
l ser
vice
s
Agr
eed
expe
nditu
re n
orm
s
for
the
DSD
.
Dra
ft e
xpen
ditu
re n
orm
s w
ere
deve
lope
d fo
r ke
y ex
pend
iture
item
s.
50
%4
Rea
son
s fo
r d
evia
tion
1 S
ome
polic
ies
and
legi
slat
ion
coul
d no
t be
cos
ted
or fi
nalis
ed d
ue t
o de
pend
enci
es o
n ro
le-p
laye
rs.
2 T
he r
evie
w o
f th
e ex
istin
g so
cial
ass
ista
nce
gran
t pr
ojec
tion
mod
el t
ook
long
er t
han
antic
ipat
ed d
ue t
o its
com
plex
ity. T
he p
ilotin
g of
the
AB
C m
odel
cou
ld n
ot b
e fin
alis
ed in
all
the
iden
tified
uni
ts d
ue t
o de
pend
enci
es o
n di
ffer
ent
role
-pla
yers
and
the
avai
labi
lity
of d
ata.
3 D
elay
s w
ere
expe
rienc
ed in
fina
lisin
g th
e au
tom
atio
n of
the
fina
ncia
l pla
nnin
g pr
oces
s du
e to
dep
ende
ncie
s on
oth
er r
ole-
play
ers
and
rela
ted
capa
city
con
stra
ints
. The
aut
omat
ion
of t
he e
xpen
ditu
re m
onito
ring
proc
ess
was
prio
ritis
ed b
ut w
ill o
nly
be
final
ised
in t
he 2
01
1/1
2 fi
nanc
ial y
ear,
whe
re a
fter
the
aut
omat
ion
of t
he fi
nanc
ial p
lann
ing
proc
esse
s w
ill t
ake
plac
e.4 D
elay
s w
ere
expe
rienc
ed in
fina
lisin
g th
e ex
pend
iture
nor
ms
due
to li
mite
d op
erat
iona
l and
tec
hnic
al c
apac
ity.

36 Annual Report 2010/2011 | Department of Social Development
Pro
gra
mm
e 1:
Ad
min
istr
ati
on
Goa
lTo
impr
ove
inte
rnal
con
trol
s an
d fin
anci
al m
anag
emen
t
Ou
tcom
eS
ound
fina
ncia
l adm
inis
trat
ion
Fun
ctio
nal
are
asS
trat
egic
ob
ject
ive
Bas
elin
eP
erfo
rman
ce in
dic
ator
Targ
etA
ctu
al o
utp
uts
% d
evia
tion
from
tar
get
Fina
ncia
l
adm
inis
trat
ion
and
man
agem
ent
Impr
oved
fina
ncia
l
man
agem
ent
Inco
nsis
tent
ver
ifica
tion
of
expe
nditu
re c
lass
ifica
tions
App
rove
d fin
anci
al
man
agem
ent
stra
tegy
Impr
ove
finan
cial
man
agem
ent
by 2
0%
bas
ed
on a
udit
findi
ngs
in t
he
prev
ious
yea
r
Aud
it fin
ding
s de
crea
sed
by 2
1%
bas
ed o
n th
e au
dit
outc
ome
for
the
20
09
/10
fina
ncia
l yea
r
0%
Frag
men
ted
man
agem
ent
and
repo
rtin
g on
don
or
fund
ing
Com
preh
ensi
ve m
anag
emen
t
syst
em f
or d
onor
fun
ding
App
rove
fina
ncia
l
man
agem
ent
stra
tegy
A fi
nanc
ial m
anag
emen
t st
rate
gy w
as d
raft
ed a
nd s
ubm
itted
to
cons
ulta
tion
30
%1
Impr
oved
sup
ply
chai
n
man
agem
ent
(SC
M)
Frag
men
ted
SC
M p
roce
ssD
epar
tmen
tal s
uppl
y ch
ain
man
agem
ent
polic
y al
igne
d
with
the
bro
ad b
ased
BEE
stra
tegy
Alig
n D
epar
tmen
tal s
uppl
y
chai
n m
anag
emen
t po
licy
with
bro
ad b
ased
BEE
stra
tegy
A d
raft
Dep
artm
enta
l SC
M P
olic
y w
as d
evel
oped
and
alig
ned
with
the
bro
ad-b
ased
BEE
str
ateg
y
30
%2
Frag
men
ted
dem
and
and
acqu
isiti
on m
anag
emen
t
Str
eam
lined
SC
M p
roce
sses
Str
eam
lined
dem
and
and
acqu
isiti
on m
anag
emen
t
proc
esse
s
Cap
acita
te D
epar
tmen
tal r
ole
play
ers
in r
espe
ct o
f S
CM
requ
irem
ents
and
pro
cess
es
New
dep
artm
enta
l em
ploy
ees
and
all S
CM
Offi
cial
s w
ere
orie
nted
on
curr
ent
SC
M p
roce
sses
and
pro
cedu
res.
Oth
er
depa
rtm
enta
l rol
e pl
ayer
s w
ere
capa
cita
ted
on a
n ad
hoc
and
one
to o
ne b
asis
as
far
as p
ossi
ble.
Impr
ove
inte
rnal
con
trol
s In
adeq
uate
and
inef
fect
ive
inte
rnal
con
trol
s
Rev
iew
of
the
inte
rnal
con
trol
envi
ronm
ent
Rev
iew
the
inte
rnal
con
trol
envi
ronm
ent
Rep
orts
on
key
aspe
cts
of t
he in
tern
al c
ontr
ol e
nviro
nmen
t w
ere
draf
ted
and
wer
e av
aila
ble
for
furt
her
cons
ulta
tion
20
%3
Inte
rnal
con
trol
mec
hani
sms
asse
ssed
and
mai
ntai
ned
Ass
ess
and
mai
ntai
n in
tern
al
cont
rol m
echa
nism
s
Exis
ting
finan
cial
pol
icie
s an
d de
lega
tions
wer
e re
view
ed
A n
eed
for
new
fina
ncia
l pol
icie
s w
as id
entifi
ed, a
nd t
hese
wer
e
in t
he p
roce
ss o
f be
ing
deve
lope
d
Sev
eral
ses
sion
s w
ere
cond
ucte
d on
pol
icy
gaps
and
att
empt
s
mad
e to
str
engt
hen
inte
rnal
con
trol
s an
d im
prov
e co
mpl
ianc
e le
vels
20
%4
Rea
son
s fo
r d
evia
tion
1 D
elay
s w
ere
expe
rienc
ed in
fina
lisin
g th
e fin
anci
al m
anag
emen
t st
rate
gy d
ue t
o th
e ex
tend
ed c
onsu
ltatio
n pr
oces
s as
wel
l as
rela
ted
adm
inis
trat
ive
dela
ys.
2 T
he r
evis
ed S
CM
pol
icy
coul
d no
t be
fina
lised
and
str
uctu
red
awar
enes
s/tr
aini
ng s
essi
ons
on S
CM
pro
cess
es c
ould
not
be
cond
ucte
d du
e to
cap
acity
con
stra
ints
as
a re
sult
of a
hig
h tu
rnov
er o
f st
aff
at t
he o
pera
tiona
l lev
el.
3 T
he a
naly
sis
of t
he in
tern
al c
ontr
ol e
nviro
nmen
t, th
e re
visi
on a
nd/o
r de
velo
pmen
t of
new
fina
ncia
l pol
icie
s, in
vest
igat
ions
of
poss
ible
are
as o
f fin
anci
al m
isco
nduc
t (e
.g. f
ruitl
ess,
was
tefu
l and
irre
gula
r ex
pend
iture
) and
rel
ated
act
ions
to
stre
ngth
en
inte
rnal
con
trol
s co
uld
not
be fi
nalis
ed d
ue t
o op
erat
iona
l cap
acity
con
stra
ints
and
a h
igh
turn
over
of
staf
f4 T
he a
naly
sis
of t
he in
tern
al c
ontr
ol e
nviro
nmen
t, th
e re
visi
on a
nd/o
r de
velo
pmen
t of
new
fina
ncia
l pol
icie
s, in
vest
igat
ions
of
poss
ible
are
as o
f fin
anci
al m
isco
nduc
t (e
.g. f
ruitl
ess,
was
tefu
l and
irre
gula
r ex
pend
iture
) and
rel
ated
act
ions
to
stre
ngth
en
inte
rnal
con
trol
s co
uld
not
be fi
nalis
ed d
ue t
o op
erat
iona
l cap
acity
con
stra
ints
and
a h
igh
turn
over
of
staf
f

Department of Social Development | Annual Report 2010/2011 37
Goa
lTo
pro
vide
the
Dep
artm
ent
with
exe
cutiv
e su
ppor
t, ov
eral
l man
agem
ent
supp
ort,
and
supp
ort
for
the
co-o
rdin
atio
n of
sta
keho
lder
and
don
or r
elat
ions
Ou
tcom
eA
n ef
ficie
nt, e
ffec
tive
and
deve
lopm
ent-
orie
nted
pub
lic s
ervi
ce a
nd a
n em
pow
ered
, fai
r an
d in
clus
ive
citiz
ensh
ip
Fun
ctio
nal
are
asS
trat
egic
ob
ject
ive
Bas
elin
eP
erfo
rman
ce in
dic
ator
Targ
etA
ctu
al o
utp
uts
% d
evia
tion
from
tar
get
Exec
utiv
e su
ppor
t
serv
ices
Pro
vide
clu
ster
co-
ordi
natio
n
and
exec
utiv
e su
ppor
t
FOSA
D c
lust
er p
artic
ipat
ion
stra
tegy
Pro
visi
on o
f cl
uste
r
co-o
rdin
atio
n an
d
exec
utiv
e su
ppor
t
Rev
iew
and
impl
emen
t
the
DSD
’s F
OSA
D c
lust
er
part
icip
atio
n st
rate
gy (i
n
line
with
the
FO
SA
D c
lust
er
confi
gura
tion)
The
clus
ter
coor
dina
tion
stra
tegy
was
rev
iew
ed a
nd a
ppro
ved
on 8
Nov
embe
r 2
01
0. T
he r
evie
w w
as b
ased
on
the
clus
ter
confi
gura
tion.
The
str
ateg
y is
bei
ng im
plem
ente
d on
an
ongo
ing
basi
s.
We
appo
inte
d of
ficia
ls to
rep
rese
nt th
e D
G in
the
FOSA
D c
lust
ers
and
impl
emen
tatio
n fo
rum
s. T
hese
offi
cial
s at
tend
ed c
lust
er a
nd
impl
emen
tatio
n fo
rum
mee
tings
and
rep
orte
d to
the
Dep
artm
ent
thro
ugh
the
Dire
ctor
ate:
Exe
cutiv
e Su
ppor
t in
the
Offi
ce o
f the
DG
.
The
Dire
ctor
ate
cont
inue
d to
rep
ort
on im
plem
enta
tion
foru
ms
and
clus
ter
issu
es t
o EX
CO
and
to
follo
w u
p on
dec
isio
ns t
aken
by E
XCO
. Ten
rep
orts
wer
e pr
esen
ted
to E
XCO
dur
ing
the
perio
d
unde
r re
view
.
The
unit
wor
ked
with
the
Chi
ef D
irect
orat
e: M
&E
in c
oord
inat
ing
prog
ress
rep
orts
on
the
impl
emen
tatio
n of
the
key
outc
omes
of
gove
rnm
ent w
here
DSD
is m
akin
g a
cont
ribut
ion.
The
Dire
ctor
ate
also
fac
ilita
ted
the
deve
lopm
ent
of r
epor
ts t
o
parli
amen
tary
com
mitt
ees.
A t
otal
of
39
rep
orts
wer
e su
bmitt
ed
to v
ario
us p
arlia
men
tary
com
mitt
ees
in t
he c
ours
e of
the
yea
r.
0%
Full
supp
ort p
rovi
ded
to th
e D
G
as c
hairp
erso
n of
the
Soci
al
Prot
ectio
n an
d C
omm
unity
Dev
elop
men
t (SP
&C
D) C
lust
er,
and
part
icip
atio
n in
oth
er
clus
ters
Ensu
re 1
00%
sup
port
of
the
DG
as
chai
rper
son
of
the
SP&
CD
Clu
ster
, and
part
icip
atio
n in
oth
er c
lust
ers
The
unit
intr
oduc
ed a
tem
plat
e fo
r th
e su
bmis
sion
of
FOS
AD
clus
ter
and
impl
emen
tatio
n fo
rum
rep
orts
to
the
Dire
ctor
ate:
Exec
utiv
e S
uppo
rt. T
he D
irect
orat
e co
nsol
idat
ed t
hese
rep
orts
and
repo
rted
to
the
Dep
artm
ent
thro
ugh
EXC
O.
Ten
clus
ter
mee
tings
and
one
spe
cial
clu
ster
mee
ting
wer
e
conv
ened
.
The
Dire
ctor
ate
faci
litat
ed t
he p
rese
ntat
ion
of f
our
issu
es o
f th
e
Dep
artm
ent
at t
he S
P&
CD
Clu
ster
and
the
Hum
an D
evel
opm
ent
Clu
ster
.
0%

38 Annual Report 2010/2011 | Department of Social Development
Pro
gra
mm
e 1:
Ad
min
istr
ati
on
Goa
lTo
pro
vide
the
Dep
artm
ent
with
exe
cutiv
e su
ppor
t, ov
eral
l man
agem
ent
supp
ort,
and
supp
ort
for
the
co-o
rdin
atio
n of
sta
keho
lder
and
don
or r
elat
ions
Ou
tcom
eA
n ef
ficie
nt, e
ffec
tive
and
deve
lopm
ent-
orie
nted
pub
lic s
ervi
ce a
nd a
n em
pow
ered
, fai
r an
d in
clus
ive
citiz
ensh
ip
Fun
ctio
nal
are
asS
trat
egic
ob
ject
ive
Bas
elin
eP
erfo
rman
ce in
dic
ator
Targ
etA
ctu
al o
utp
uts
% d
evia
tion
from
tar
get
Exec
utiv
e su
ppor
t
serv
ices
Exec
utiv
e Su
ppor
t con
tinue
d to
per
form
the
follo
win
g fu
nctio
ns to
supp
ort t
he D
G a
s ch
airp
erso
n of
the
SP&
CD
Clu
ster
:
–
Secr
etar
iat f
unct
ions
, inc
ludi
ng s
ettin
g ag
enda
s, ta
king
min
utes
,
and
follo
win
g up
on
clus
ter
deci
sion
s
–
Con
veni
ng S
P&C
D C
lust
er w
orks
hops
with
the
prov
inci
al c
lust
ers
Hel
p to
pre
pare
clu
ster
med
ia b
riefin
gs T
he U
nit
coor
dina
ted
polic
y is
sues
em
anat
ing
from
the
impl
emen
tatio
n fo
rum
s fo
r
cons
ider
atio
n by
the
SP
&C
D C
lust
er. T
he U
nit
wor
ked
with
the
HS
RC
to
coor
dina
te t
he jo
int
clus
ter
polic
y se
min
ars.
The
Uni
t rec
eive
d an
d an
alys
ed th
ree
cabi
net m
emor
anda
. It a
lso
faci
litat
ed th
e de
velo
pmen
t of t
he D
epar
tmen
t’s p
ositi
on p
aper
on
10
Cab
inet
mem
oran
da re
ceiv
ed fr
om o
ther
gov
ernm
ent d
epar
tmen
ts,
in o
rder
to p
repa
re th
e m
inis
ter f
or c
abin
et m
eetin
gs. T
he U
nit a
lso
desi
gned
a te
mpl
ate
for d
evel
opin
g th
ese
posi
tion
pape
rs.
The
Uni
t al
so d
evel
oped
and
circ
ulat
ed a
que
stio
nnai
re a
imed
at
impr
ovin
g th
e w
orki
ng r
elat
ions
hip
betw
een
the
Offi
ce o
f th
e D
G
and
line
func
tions
.
Impl
emen
t te
rms
of r
efer
ence
(ToR
s) f
or e
xecu
tive
mee
tings
DSD
ToR
for
man
agem
ent
mee
tings
TOR
for
exe
cutiv
e m
eetin
gs
revi
sed
and
impl
emen
ted
Rev
iew
the
ToR
for
man
agem
ent
mee
tings
The
TOR
s fo
r ex
ecut
ive
foru
ms
wer
e re
vise
d an
d ap
prov
ed b
y
MA
NC
O in
Aug
ust
20
10
, and
pre
sent
ed t
o th
e M
asun
gulo
Tas
k
Team
. The
TO
Rs
wer
e al
so w
orks
hopp
ed in
the
Dep
artm
ent,
and
nine
wor
ksho
ps w
ere
held
.
The
TOR
s fo
r m
anag
emen
t for
um m
eetin
gs w
ere
impl
emen
ted
on
an o
ngoi
ng b
asis
.
The
Uni
t co
ntin
ued
to p
rovi
de c
oach
ing
and
guid
ance
on
exis
ting
DS
D f
orum
s.
The
Uni
t al
so in
trod
uced
a t
empl
ate
for
the
subm
issi
on o
f
disc
ussi
on d
ocum
ents
for
mee
tings
.
The
Uni
t als
o de
velo
ped
a st
atis
tical
rep
ort o
n th
e at
tend
ance
of
mee
tings
and
the
impl
emen
tatio
n of
dec
isio
ns.
The
Uni
t als
o pr
ovid
ed s
ecre
taria
t ser
vice
s to
the
stra
tegi
c re
view
sess
ion
held
on
25 –
26
Oct
ober
201
0 an
d th
e st
rate
gic
plan
ning
sess
ion
held
on
17 –
19
Nov
embe
r 20
10.
0%

Department of Social Development | Annual Report 2010/2011 39
Goa
lTo
pro
vide
the
Dep
artm
ent
with
exe
cutiv
e su
ppor
t, ov
eral
l man
agem
ent
supp
ort,
and
supp
ort
for
the
co-o
rdin
atio
n of
sta
keho
lder
and
don
or r
elat
ions
Ou
tcom
eA
n ef
ficie
nt, e
ffec
tive
and
deve
lopm
ent-
orie
nted
pub
lic s
ervi
ce a
nd a
n em
pow
ered
, fai
r an
d in
clus
ive
citiz
ensh
ip
Fun
ctio
nal
are
asS
trat
egic
ob
ject
ive
Bas
elin
eP
erfo
rman
ce in
dic
ator
Targ
etA
ctu
al o
utp
uts
% d
evia
tion
from
tar
get
Exec
utiv
e su
ppor
t
serv
ices
Rev
iew
rep
ort
of t
he
com
mun
icat
ion
and
impl
emen
tatio
n of
dec
isio
ns
take
n at
mee
tings
Ensu
re t
he c
omm
unic
atio
n
and
impl
emen
tatio
n of
deci
sion
s ta
ken
at m
eetin
gs
The
min
utes
of
all D
SD
and
clu
ster
mee
tings
wer
e fin
alis
ed
and
circ
ulat
ed t
o m
embe
rs o
n tim
e to
ens
ure
the
imm
edia
te
impl
emen
tatio
n of
dec
isio
ns.
The
Dire
ctor
ate
also
com
pile
d de
cisi
on m
atric
es f
or t
he
imm
edia
te im
plem
enta
tion
of d
ecis
ions
.
The
Dire
ctor
ate
follo
wed
up
on t
he im
plem
enta
tion
of a
ll th
e
deci
sion
s ta
ken
at m
anag
emen
t m
eetin
gs a
nd t
able
d a
repo
rt a
t
the
next
mee
ting.
Abo
ut 9
0%
of
deci
sion
s w
ere
impl
emen
ted.
The
dec
isio
n re
gist
er
was
reg
ular
ly u
pdat
ed.
0%
Pro
vide
pro
fess
iona
l
exec
utiv
e an
d ad
min
istr
ativ
e
supp
ort
to t
he D
G a
nd
Min
iste
r
Dra
ft c
omm
unic
atio
n an
d
adm
inis
trat
ion
guid
elin
es
Adm
inis
trat
ive
supp
ort
to t
he
DG
as
adm
inis
trat
ive
head
of
the
Dep
artm
ent
Pro
vide
100%
sup
port
to
the
DG
as
adm
inis
trat
ive
head
of
the
Dep
artm
ent
The
Dire
ctor
ate
cont
inue
d to
pro
vide
the
DG
with
pro
fess
iona
l
exec
utiv
e an
d ad
min
istr
ativ
e su
ppor
t.
The
Chi
ef D
irect
orat
e pe
rfor
med
the
fol
low
ing
func
tions
to
supp
ort
the
DG
as
acco
untin
g of
ficer
:
–
Ass
ist
the
DG
in s
uppo
rtin
g th
e po
litic
al p
rinci
pals
in f
ulfil
ling
thei
r pa
rliam
enta
ry o
blig
atio
ns.
–
Sup
port
the
DG
as
the
chai
rper
son
of D
SD
man
agem
ent
mee
tings
.
–
Man
age
and
mon
itor
the
flow
of
docu
men
ts t
o an
d fr
om t
he
Offi
ce o
f th
e D
G.
–
Man
age
the
regi
stry
ser
vice
s.
–
Qua
lity
chec
k do
cum
ents
dire
cted
to
the
DG
.
–
Man
age
the
budg
et a
nd p
rocu
rem
ent
of g
oods
and
ser
vice
s
for
the
Offi
ce o
f th
e D
G.
–
Man
age
the
asse
ts in
the
Offi
ce o
f th
e D
G.
The
Dire
ctor
ate
proc
esse
d 1
127
subm
issi
ons
and
120
parli
amen
tary
que
stio
ns. I
t als
o re
ceiv
ed a
nd d
ealt
with
528
pie
ces
of c
orre
spon
denc
e fr
om m
embe
rs o
f the
pub
lic. S
ome
of th
ese
wer
e re
ferr
ed a
s D
G ta
sks
to r
elev
ant l
ine
func
tions
.

40 Annual Report 2010/2011 | Department of Social Development
Pro
gra
mm
e 1:
Ad
min
istr
ati
on
Goa
lTo
pro
vide
the
Dep
artm
ent
with
exe
cutiv
e su
ppor
t, ov
eral
l man
agem
ent
supp
ort,
and
supp
ort
for
the
co-o
rdin
atio
n of
sta
keho
lder
and
don
or r
elat
ions
Ou
tcom
eA
n ef
ficie
nt, e
ffec
tive
and
deve
lopm
ent-
orie
nted
pub
lic s
ervi
ce a
nd a
n em
pow
ered
, fai
r an
d in
clus
ive
citiz
ensh
ip
Fun
ctio
nal
are
asS
trat
egic
ob
ject
ive
Bas
elin
eP
erfo
rman
ce in
dic
ator
Targ
etA
ctu
al o
utp
uts
% d
evia
tion
from
tar
get
Exec
utiv
e su
ppor
t
serv
ices
The
turn
arou
nd t
ime
for
subm
issi
ons
to t
he O
ffice
of
the
DG
was
five
days
. 80
% o
f su
bmis
sion
s re
ceiv
ed w
ere
proc
esse
d w
ithin
five
days
. The
tur
naro
und
time
for
parli
amen
tary
que
stio
ns w
as
two
days
, and
90
% o
f pa
rliam
enta
ry q
uest
ions
rec
eive
d w
ere
proc
esse
d w
ithin
tw
o da
ys.
The
Dire
ctor
ate
deve
lope
d w
ritte
n co
mm
unic
atio
n gu
idel
ines
to
prov
ide
guid
ance
on
how
spe
cific
doc
umen
ts s
houl
d be
writ
ten,
tem
plat
es b
e us
ed, e
tc (m
ost l
ine
func
tions
wer
e us
ing
the
wro
ng
tem
plat
es w
hen
writ
ing
docu
men
ts to
the
DG
).
The
Dire
ctor
ate
wor
ked
with
the
IMST
Uni
t to
desi
gn a
n
e-su
bmis
sion
sys
tem
, whi
ch w
as im
plem
ente
d.
The
Uni
t arr
ange
d si
x tr
aini
ng c
ours
es fo
r its
offi
cial
s.
0%
Adm
inis
trat
ive
supp
ort
to t
he
Min
iste
r as
pol
itica
l hea
d of
the
Dep
artm
ent
Pro
vide
100%
sup
port
to
the
Min
iste
r as
the
pol
itica
l hea
d
of t
he D
epar
tmen
t
The
unit
prov
ided
ong
oing
sup
port
to
the
exec
utiv
e, in
clud
ing
the
outg
oing
Min
iste
r an
d in
com
ing
Dep
uty
Min
iste
r.
It pr
ovid
ed 1
00%
sup
port
to th
e M
inis
ter
for
dutie
s pe
rtai
ning
to
cabi
net m
eetin
gs, s
uppo
rted
by
com
men
ts o
n ca
bine
t mem
oran
da.
It ho
sted
the
fol
low
ing
MIN
MEC
mee
tings
:
–
3 –
4 J
une
20
10
: NW
–
29
Jun
e 2
01
0: S
peci
al M
INM
EC o
n co
mpr
ehen
sive
soc
ial
secu
rity
–
2 –
3 S
ept
20
10
: NC
–
Dec
20
10
: Gau
teng
, lau
nch
of S
oul C
ity c
ampa
ign
–
31
Mar
ch –
1 A
pril
20
11
: Pol
okw
ane.
All
MIN
MEC
mee
tings
wer
e co
mpl
emen
ted
with
tar
gete
d
com
mun
ity o
utre
ach
prog
ram
mes
.
Dec
20
10
: Lau
nche
d th
e IM
C o
n S
ubst
ance
Abu
se, w
ith f
urth
er
mee
tings
in F
eb 2
01
1. T
he IM
C M
inis
ters
als
o at
tend
ed t
he 2
nd
Bie
nnia
l Sum
mit
on t
he P
reve
ntio
n of
Sub
stan
ce A
buse
.
The
Uni
t en
sure
d 1
00
% p
artic
ipat
ion
in p
arlia
men
tary
mat
ters
and
resp
onde
d to
12
7 p
arlia
men
tary
que
stio
ns. A
ll pa
rliam
enta
ry
ques
tions
wer
e re
spon
ded
to.
0%

Department of Social Development | Annual Report 2010/2011 41
Goa
lTo
pro
vide
the
Dep
artm
ent
with
exe
cutiv
e su
ppor
t, ov
eral
l man
agem
ent
supp
ort,
and
supp
ort
for
the
co-o
rdin
atio
n of
sta
keho
lder
and
don
or r
elat
ions
Ou
tcom
eA
n ef
ficie
nt, e
ffec
tive
and
deve
lopm
ent-
orie
nted
pub
lic s
ervi
ce a
nd a
n em
pow
ered
, fai
r an
d in
clus
ive
citiz
ensh
ip
Fun
ctio
nal
are
asS
trat
egic
ob
ject
ive
Bas
elin
eP
erfo
rman
ce in
dic
ator
Targ
etA
ctu
al o
utp
uts
% d
evia
tion
from
tar
get
Exec
utiv
e su
ppor
t
serv
ices
Pro
vide
eff
ectiv
e an
d ef
ficie
nt
stak
ehol
der
man
agem
ent
and
dono
r co
-ord
inat
ion
The
Dep
artm
ent
is c
urre
ntly
reac
tive
in d
ealin
g w
ith
stak
ehol
ders
Dev
elop
men
t of
com
preh
ensi
ve s
take
hold
er
man
agem
ent
and
dono
r
so-o
rdin
atio
n da
taba
ses
Dev
elop
com
preh
ensi
ve
stak
ehol
der
man
agem
ent
and
dono
r co
-ord
inat
ion
data
base
s
Com
preh
ensi
ve s
take
hold
er a
nd d
onor
dat
abas
es w
ere
deve
lope
d an
d im
plem
ente
d.
0%
Sta
keho
lder
ana
lysi
s in
line
with
Dep
artm
enta
l str
ateg
ic
prio
ritie
s
Con
duct
a f
ull s
take
hold
er
anal
ysis
in li
ne w
ith
Dep
artm
enta
l str
ateg
ic
prio
ritie
s
Sta
keho
lder
ana
lyse
s in
line
with
Dep
artm
enta
l str
ateg
ic
prio
ritie
s w
ere
com
plet
ed.
0%
Sta
keho
lder
eng
agem
ent
stra
tegy
in li
ne w
ith
Dep
artm
enta
l str
ateg
ic
prio
ritie
s
Dev
elop
sta
keho
lder
enga
gem
ent
stra
tegy
in li
ne
with
Dep
artm
enta
l str
ateg
ic
prio
ritie
s
A s
take
hold
er e
ngag
emen
t st
rate
gy w
as d
evel
oped
.0
%
Sta
keho
lder
impl
emen
tatio
n
plan
for
2010/1
1
Dev
elop
Sta
keho
lder
Impl
emen
tatio
n Pla
n fo
r
2010/1
1
A s
take
hold
er im
plem
enta
tion
plan
was
dev
elop
ed a
nd
impl
emen
ted.
0%
Don
or s
trat
egy
Don
or s
trat
egy
deve
lope
d
and
cons
ulte
d
A d
onor
/cor
pora
te s
ocia
l inv
estm
ent
stra
tegy
, don
or p
olic
y, a
nd
stak
ehol
der
stra
tegy
wer
e de
velo
ped.
0%
New
par
tner
ship
with
Dep
artm
ent’s
sta
keho
lder
s
Num
ber
of s
take
hold
ers
in
part
ners
hip
with
Dep
artm
ent
Cre
ate
and
mai
ntai
n
part
ners
hip
with
the
Dep
artm
ent’s
sta
keho
lder
s
Par
tner
ship
s w
ith N
GO
s, f
aith
-bas
ed o
rgan
isat
ions
and
the
busi
ness
sec
tor
wer
e fo
rged
and
str
engt
hene
d.
0%

42 Annual Report 2010/2011 | Department of Social Development
Pro
gra
mm
e 1:
Ad
min
istr
ati
on
Goa
lTo
pro
mot
e an
d su
ppor
t pa
rtic
ipat
ion
in k
ey b
ilate
ral a
nd m
ultil
ater
al in
itiat
ives
tha
t m
ake
the
mos
t ef
fect
ive
cont
ribut
ion
to a
llevi
atin
g po
vert
y
Ou
tcom
eC
reat
e a
bett
er S
outh
Afr
ica,
a b
ette
r A
fric
a an
d a
bett
er w
orld
Fun
ctio
nal
are
asS
trat
egic
ob
ject
ive
Bas
elin
eP
erfo
rman
ce in
dic
ator
Targ
etA
ctu
al o
utp
uts
% d
evia
tion
from
tar
get
Inte
rnat
iona
l rel
atio
nsP
rovi
de h
igh-
qual
ity s
trat
egic
supp
ort
and
advi
ce in
res
pect
of in
tern
atio
nal p
rogr
amm
es
Thre
e si
gned
agr
eem
ents
Impl
emen
tatio
n of
tec
hnic
al
exch
ange
s w
ith C
uba,
Chi
na,
Mex
ico,
and
Chi
le, f
ocus
ing
on s
ocia
l sec
urity
, you
th,
ECD
, and
pov
erty
alle
viat
ion
Sup
port
impl
emen
tatio
n of
tech
nica
l exc
hang
es
The
Dire
ctor
ate
coor
dina
ted
the
Mas
upat
sela
You
th P
ione
er
Pro
ject
und
er w
hich
the
pro
vinc
es h
oste
d si
x C
uban
Pro
fess
ors.
They
tra
ined
mor
e th
an 2
00
you
ths
in e
ach
prov
ince
, and
the
proj
ect
was
a s
ucce
ss.
Col
labo
ratio
n co
ntin
ued
with
bot
h M
exic
o an
d C
hile
with
an
exch
ange
of
docu
men
tatio
n on
soc
ial s
ecur
ity a
nd p
over
ty
alle
viat
ion.
Mee
tings
wer
e he
ld w
ith th
e C
hile
an E
mba
ssy
whe
re a
n ag
reem
ent
was
fina
lised
on
early
chi
ld d
evel
opm
ent.
The
Dire
ctor
ate
held
cons
ulta
tions
with
UN
ICEF
, whi
ch m
ay p
rovi
de s
uppo
rt.
The
DS
D h
oste
d tw
o de
lega
tions
fro
m C
hina
whi
ch s
tudi
ed it
s
NP
O a
ctiv
ities
.
The
impl
emen
tatio
n pl
an w
ith C
hina
was
fina
lised
.
0%
Thre
e si
gned
agr
eem
ents
Pro
visi
on o
f de
velo
pmen
t
assi
stan
ce t
o th
e D
RC
,
Zim
babw
e, M
ali,
Mau
ritiu
s,
Nei
ghbo
urin
g Sta
tes
and
Ang
ola
on c
apac
ity-b
uild
ing;
polic
y de
velo
pmen
t;
prog
ram
mes
for
dis
able
d
peop
le, e
lder
ly p
eopl
e,
child
ren,
and
sub
stan
ce
abus
ers;
and
pov
erty
alle
viat
ion
Sup
port
dev
elop
men
t
assi
stan
ce t
o th
e D
RC
,
Zim
babw
e, M
ali,
Mau
ritiu
s,
Nei
ghbo
ring
Sta
tes
and
Ang
ola,
foc
usin
g on
cap
acity
-
build
ing;
pol
icy
deve
lopm
ent;
prog
ram
mes
for
dis
able
d
peop
le, e
lder
ly p
eopl
e,
child
ren,
and
sub
stan
ce
abus
ers;
and
pov
erty
alle
viat
ion
The
fund
ing
prop
osal
in r
espe
ct o
f th
e D
RC
was
fina
lised
, but
fund
ing
was
a c
halle
nge.
Col
labo
ratio
n w
ith Z
imba
bwe
cont
inue
d, fo
cusi
ng o
n un
acco
mpa
nied
min
ors.
The
agr
eem
ent
was
rev
ised
and
will
due
to
be s
ent
to
the
Pre
side
ncy
for
auth
oris
atio
n.
An
impl
emen
tatio
n pl
an w
ith M
ali w
as fi
nalis
ed.
A p
roje
ct p
ropo
sal o
n M
aurit
ius
was
fina
lised
and
was
due
to
be
subm
itted
to
deve
lopm
ent
part
ners
.
Agr
eem
ents
with
nei
ghbo
urin
g co
untr
ies
wer
e fin
alis
ed a
nd w
ere
in d
iffer
ent
stag
es o
f de
velo
pmen
t.
A d
eleg
atio
n fr
om A
ngol
a co
uld
not v
isit
as p
er a
rran
gem
ent.
0%
UN
Res
olut
ion
on t
he S
ocia
l
Dim
ensi
ons
of N
EPA
D
Sup
port
for
the
inte
grat
ion
and
harm
onis
atio
n of
pol
icie
s
thro
ugh
part
icip
atio
n in
SA
DC
and
AU
soc
ial d
evel
opm
ent
and
popu
latio
n st
ruct
ures
Sup
port
the
inte
grat
ion
and
harm
onis
atio
n of
pol
icie
s
thro
ugh
part
icip
atio
n in
SA
DC
and
AU
Soc
ial D
evel
opm
ent
and
Pop
ulat
ion
stru
ctur
es
The
Dep
artm
ent
succ
essf
ully
par
ticip
ated
in t
wo
AU
mee
tings
at t
he o
ffici
al a
nd M
inis
teria
l lev
el. A
fol
low
-up
mat
rix w
as
deve
lope
d.
The
Dep
artm
ent p
artic
ipat
ed in
cap
acity
-bui
ldin
g w
orks
hops
orga
nise
d by
SA
DC
. Offi
cial
s en
sure
d th
at s
ocia
l dev
elop
men
t
head
ed th
e ag
enda
s at
thes
e m
eetin
gs.
0%

Department of Social Development | Annual Report 2010/2011 43
Goa
lTo
pro
mot
e an
d su
ppor
t pa
rtic
ipat
ion
in k
ey b
ilate
ral a
nd m
ultil
ater
al in
itiat
ives
tha
t m
ake
the
mos
t ef
fect
ive
cont
ribut
ion
to a
llevi
atin
g po
vert
y
Ou
tcom
eC
reat
e a
bett
er S
outh
Afr
ica,
a b
ette
r A
fric
a an
d a
bett
er w
orld
Fun
ctio
nal
are
asS
trat
egic
ob
ject
ive
Bas
elin
eP
erfo
rman
ce in
dic
ator
Targ
etA
ctu
al o
utp
uts
% d
evia
tion
from
tar
get
Inte
rnat
iona
l rel
atio
nsU
N r
esol
utio
n on
the
Soc
ial
Dim
ensi
on o
f N
EPA
D
Sup
port
for
the
inte
grat
ion
of
the
regi
onal
and
con
tinen
tal
soci
al d
evel
opm
ent
agen
da
at t
he C
omm
issi
on f
or S
ocia
l
Dev
elop
men
t, th
e Pop
ulat
ion
Com
mis
sion
, the
Com
mis
sion
on t
he S
tatu
s of
Wom
en, t
he
Com
mis
sion
on
HIV
/AID
S a
nd
Gov
erna
nce
in A
fric
a, a
nd
the
Com
mis
sion
on
Crim
e
Pre
vent
ion
and
Crim
inal
Just
ice
Sup
port
the
inte
grat
ion
of
the
regi
onal
and
con
tinen
tal
soci
al d
evel
opm
ent
agen
da
at U
N c
omm
issi
ons
The
Dep
artm
ent
succ
essf
ully
par
ticip
ated
in t
hese
UN
Com
mis
sion
s, h
elpi
ng t
o be
nchm
ark
prog
ress
, neg
otia
te
reso
lutio
ns, a
nd e
nsur
e fo
llow
-up.
The
Dep
artm
ent
was
als
o re
spon
sibl
e fo
r ne
gotia
ting
the
Soc
ial D
imen
sion
s of
NEP
AD
at
the
UN
Com
mis
sion
for
Soc
ial
Dev
elop
men
t on
beh
alf
of t
he A
fric
a G
roup
, the
G7
7, a
nd C
hina
.
0%
IBSA
Wor
king
Gro
up o
n
Soc
ial D
evel
opm
ent
Sup
port
for
impl
emen
tatio
n
of p
rogr
amm
es in
itiat
ed b
y
the
IBSA
Wor
king
Gro
up o
n
Soc
ial D
evel
opm
ent
Sup
port
the
impl
emen
tatio
n
of p
rogr
amm
es in
itiat
ed b
y
the
IBSA
Wor
king
Gro
up o
n
Soc
ial D
evel
opm
ent
The
Dep
artm
ent
play
ed a
lead
ing
role
in fi
nalis
ing
the
IBS
A
Soc
ial D
evel
opm
ent
Str
ateg
y w
hich
was
ado
pted
by
Hea
ds o
f
Sta
te.
It dr
afte
d an
impl
emen
tatio
n pl
an w
hich
was
sen
t to
the
tw
o
othe
r co
untr
ies
for
furt
her
inpu
ts.
0%
Rel
atio
ns w
ith s
ocia
l
deve
lopm
ent
orga
nisa
tions
Sup
port
for
tec
hnic
al
exch
ange
s in
the
EU
, OEC
D,
ISSA
and
ISS
Sup
port
tec
hnic
al e
xcha
nges
in t
he E
U, O
ECD
, ISS
A, a
nd
ISS
The
agre
emen
t w
ith t
he E
U w
as fi
nalis
ed a
fter
inte
ract
ions
with
the
Dep
artm
ent
of L
abou
r, an
d w
as r
eady
for
sig
natu
re.
A v
ideo
con
fere
nce
was
hel
d w
ith B
russ
els
to a
gree
on
area
s of
colla
bora
tion.
The
Dep
artm
ent
host
ed t
he IS
SA
Sum
mit,
att
ende
d by
mor
e
than
50
0 p
eopl
e. F
our
offic
ials
beg
an t
o se
rve
in v
ario
us IS
SA
com
mitt
ees.
0%

44 Annual Report 2010/2011 | Department of Social Development
Pro
gra
mm
e 1:
Ad
min
istr
ati
on
Goa
lTo
pro
mot
e an
d su
ppor
t pa
rtic
ipat
ion
in k
ey b
ilate
ral a
nd m
ultil
ater
al in
itiat
ives
tha
t m
ake
the
mos
t ef
fect
ive
cont
ribut
ion
to a
llevi
atin
g po
vert
y
Ou
tcom
eC
reat
e a
bett
er S
outh
Afr
ica,
a b
ette
r A
fric
a an
d a
bett
er w
orld
Fun
ctio
nal
are
asS
trat
egic
ob
ject
ive
Bas
elin
eP
erfo
rman
ce in
dic
ator
Targ
etA
ctu
al o
utp
uts
% d
evia
tion
from
tar
get
Com
mun
icat
ion
Pro
mot
e th
e D
epar
tmen
t’s
corp
orat
e im
age,
and
prov
ide
exec
utiv
e su
ppor
t to
Dep
artm
enta
l pro
gram
mes
Dra
ft c
orpo
rate
aff
airs
guid
elin
es a
nd p
rodu
ctio
n
guid
elin
es
Incr
ease
d aw
aren
ess
of
the
Dep
artm
ent’s
cor
pora
te
iden
tity,
pro
gram
mes
and
serv
ices
Impr
oved
dis
sem
inat
ion
of in
form
atio
n w
ithin
the
Dep
artm
ent
Impr
oved
org
anis
atio
nal
cultu
re o
f te
chno
logy
Impr
ove
the
Dep
artm
ent’s
corp
orat
e id
entit
y
The
Dire
ctor
ate
intr
oduc
ed a
n on
line
new
slet
ter
(DS
D N
ews)
whi
ch p
rovi
des
valu
able
info
rmat
ion
to t
he D
epar
tmen
t an
d th
e
gove
rnm
ent
as w
hole
.
It pr
omot
ed t
he u
se o
f el
ectr
onic
med
ia b
y re
gula
rly p
ublis
hing
the
inte
rnal
new
slet
ter
(Itire
leng
).
It de
velo
ped
apex
pic
ture
s of
the
new
ly a
ppoi
nted
pol
itica
l
prin
cipa
ls in
line
with
the
rec
ent
chan
ges
in t
he C
abin
et.
It m
aint
aine
d a
web
site
tha
t is
rel
evan
t, cu
rren
t, an
d pr
ovid
es
fron
tline
info
rmat
ion
to t
he p
ublic
and
the
med
ia.
It in
trod
uced
the
inno
vativ
e an
d cr
eativ
e us
e of
sna
pper
fra
mes
on s
trat
egic
poi
nts
to in
form
sta
ff o
f ne
w d
evel
opm
ents
.
It pr
oduc
ed c
orpo
rate
com
mun
icat
ion
docu
men
ts t
o m
eet
Gov
ernm
ent
Info
rmat
ion
and
Com
mun
icat
ion
Sys
tem
(GC
IS)
bran
d gu
idel
ines
.
It pr
ovid
ed o
ngoi
ng e
xecu
tive
com
mun
icat
ion
supp
ort
to k
ey
Dep
artm
enta
l eve
nts
and
prog
ram
mes
.
0%
Cre
ate
grea
ter
awar
enes
s of
the
Dep
artm
ent
and
ensu
re
that
com
mun
ities
are
wel
l
info
rmed
of
prog
ram
mes
and
serv
ices
Dra
ft p
ublic
par
ticip
atio
n
and
even
ts m
anag
emen
t
guid
elin
es
Bet
ter
info
rmed
pub
lic a
bout
Dep
artm
ent’s
pro
gram
mes
and
serv
ices
Bol
ster
pub
lic a
war
enes
s of
Dep
artm
enta
l pro
gram
mes
This
uni
t co
ordi
nate
d an
d m
anag
ed m
ore
than
30
pub
lic
part
icip
atio
n pr
ogra
mm
es f
or t
he M
inis
ter
and
the
Dep
uty
Min
iste
r in
all
nine
pro
vinc
es. T
he n
umbe
r st
ipul
ated
by
GC
IS is
10
per
pol
itica
l hea
d.
It re
spon
ded
timeo
usly
to p
ublic
enq
uirie
s th
roug
h th
e sw
itchb
oard
.
It su
cces
sful
ly m
anag
ed k
ey d
epar
tmen
tal e
vent
s in
clud
ing
the
Bud
get V
ote,
Chi
ld P
rote
ctio
n W
eek,
Inte
rnat
iona
l Day
for
Fam
ilies
,
and
Min
iste
rial O
utre
ach
Prog
ram
mes
.
It co
ordi
nate
d ke
y in
tera
ctio
ns b
etw
een
the
Min
iste
r an
d st
aff.
It co
ntin
ued
to p
rovi
de c
redi
ble
com
mun
icat
ion
supp
ort
durin
g
key
Dep
artm
enta
l eve
nts.
0%

Department of Social Development | Annual Report 2010/2011 45
Goa
lTo
pro
mot
e an
d su
ppor
t pa
rtic
ipat
ion
in k
ey b
ilate
ral a
nd m
ultil
ater
al in
itiat
ives
tha
t m
ake
the
mos
t ef
fect
ive
cont
ribut
ion
to a
llevi
atin
g po
vert
y
Ou
tcom
eC
reat
e a
bett
er S
outh
Afr
ica,
a b
ette
r A
fric
a an
d a
bett
er w
orld
Fun
ctio
nal
are
asS
trat
egic
ob
ject
ive
Bas
elin
eP
erfo
rman
ce in
dic
ator
Targ
etA
ctu
al o
utp
uts
% d
evia
tion
from
tar
get
Com
mun
icat
ion
Mai
ntai
n a
posi
tive
publ
ic
and
med
ia p
rofil
e th
roug
h
cred
ible
and
pro
activ
e m
edia
enga
gem
ent
Dra
ft m
edia
and
mar
ketin
g
stra
tegy
Pos
itive
med
ia c
over
age
of t
he D
epar
tmen
t’s
prog
ram
mes
and
ser
vice
s
Wel
l-re
sear
ched
and
info
rmat
ive
spee
ches
Dev
elop
med
ia a
nd
mar
ketin
g st
rate
gy
This
uni
t m
aint
aine
d a
posi
tive
and
broa
d m
edia
pre
senc
e by
prov
idin
g cr
edib
le m
edia
rel
atio
ns s
ervi
ces
to t
he M
inis
ter,
Dep
uty
Min
iste
r, D
G a
nd li
ne f
unct
ions
.
It pr
ovid
ed e
ffect
ive
med
ia li
aiso
n an
d m
anag
emen
t ser
vice
s w
hich
incr
ease
d th
e D
epar
tmen
t’s v
isib
ility
and
cov
erag
e in
the
med
ia.
It co
ntin
ued
to p
rovi
de t
he M
inis
ter
and
key
staf
f w
ith d
aily
repo
rts
colla
ting
and
anal
ysin
g re
leva
nt m
edia
cov
erag
e.
It fa
cilit
ated
the
exc
hang
e of
info
rmat
ion
to e
nsur
e th
at p
roac
tive
med
ia o
ppor
tuni
ties
wer
e cr
eate
d. In
thi
s re
gard
the
Dire
ctor
ate
rece
ived
and
res
pond
ed t
imeo
usly
to
58
med
ia e
nqui
ries.
It ar
rang
ed 6
4 r
adio
, 34
tel
evis
ion
and
18
prin
t m
edia
inte
rvie
ws
whi
ch p
rovi
ded
sust
aine
d an
d po
sitiv
e m
edia
exp
osur
e of
key
DS
D p
rogr
amm
es a
nd in
itiat
ives
.
It de
velo
ped
a da
taba
se o
f m
edia
con
tact
s an
d re
gula
rly p
rovi
ded
bulle
tins
on p
rogr
amm
es a
nd in
itiat
ives
.
It pr
ovid
ed o
ngoi
ng c
omm
unic
atio
n an
d co
nten
t de
velo
pmen
t
supp
ort
to t
he M
inis
ter,
Dep
uty
Min
iste
r, D
G, a
nd li
ne f
unct
ions
.
0%

46 Annual Report 2010/2011 | Department of Social Development
Pro
gra
mm
e 1:
Ad
min
istr
ati
on
Goa
lTo
bui
ld IM
ST
capa
bilit
y an
d ca
paci
ty in
ord
er t
o en
able
the
DSD
to
deliv
er o
n its
man
date
Ou
tcom
eEn
hanc
ed S
ocia
l Dev
elop
men
t se
rvic
e de
liver
y th
roug
h th
e IM
ST
serv
ices
Fun
ctio
nal
are
asS
trat
egic
ob
ject
ive
Bas
elin
eP
erfo
rman
ce in
dic
ator
Targ
etA
ctu
al o
utp
uts
% d
evia
tion
from
tar
get
Info
rmat
ion
man
agem
ent
syst
em
and
tech
nolo
gy
(IMST)
Des
ign,
dev
elop
and
impl
emen
t so
lutio
ns f
or
capt
urin
g, s
torin
g an
d
proc
essi
ng in
form
atio
n
arou
nd b
usin
ess
proc
esse
s
SD
MS, C
PR
, CYC
A, a
dopt
ions
and
NPO
in s
ilos.
No
onlin
e
NPO
, and
cur
rent
ado
ptio
ns
syst
em n
ot a
ligne
d w
ith
Cha
pter
15 o
f th
e C
hild
ren’
s
Act
, 2005
Silo
sys
tem
s in
tegr
ated
into
SD
IMS
Onl
ine
NPO
rol
led
out
to
prov
ince
s
Inte
grat
e si
lo s
yste
ms
(CYC
A,
CPR
), de
velo
p ad
optio
ns
syst
em, a
nd r
oll o
ut o
nlin
e
NPO
to n
ine
prov
ince
s.
The
final
pha
ses
of C
PR
wer
e co
mpl
eted
and
sig
ned
off.
The
prob
atio
n ca
se m
anag
emen
t sy
stem
and
acc
redi
tatio
n of
serv
ices
pro
vide
r fo
r di
vers
ions
ser
vice
s w
ere
deve
lope
d an
d
trai
ning
pro
vide
d. T
hese
sys
tem
s w
ere
to b
e ro
lled
out
in t
he n
ext
finan
cial
yea
r.
The
Ado
ptio
n S
yste
m w
as d
evel
oped
. Int
egra
tion
of C
PR
and
CYC
A in
to S
DIM
S w
as d
elay
ed.
The
NPO
sys
tem
was
dev
elop
ed a
nd w
as d
ue to
be
rolle
d ou
t.
35
%1
Cre
ate
inst
itutio
nal
know
ledg
e an
d en
able
effe
ctiv
e st
rate
gic
deci
sion
-mak
ing
Kno
wle
dge
man
agem
ent
stra
tegy
(KM
S)
Impl
emen
tatio
n of
KM
SIm
plem
ent
KM
S.
A K
M r
eadi
ness
ass
essm
ent
of b
usin
ess
units
was
con
duct
ed,
and
info
rmat
ion
abou
t K
M d
isse
min
ated
acr
oss
the
Dep
artm
ent.
10
%2
Libr
ary,
Inte
rnet
, Yel
low
Pag
esStr
ateg
y im
plem
ente
dD
evel
op a
bus
ines
s pl
an f
or
know
ledg
e m
anag
emen
t.
Enha
nce
a cu
lture
of
know
ledg
e-sh
arin
g
A d
raft
bus
ines
s pl
an w
as d
evel
oped
3
0%
3
Dra
ft fi
le p
lan
in p
hysi
cal
regi
stry
Num
ber
of u
nits
/CD
tha
t
keep
and
mai
ntai
n re
cord
s
File
pla
n im
plem
ente
d
Impl
emen
t fil
e pl
an.
Enha
nce
the
reco
rds
man
agem
ent
cultu
re
Nat
iona
l Arc
hive
s co
mm
ente
d on
the
File
Pla
n, a
nd a
noth
er v
ersi
on
was
sen
t to
Nat
iona
l Arc
hive
s an
d is
aw
aitin
g ap
prov
al
20
%4
Dat
a w
areh
ouse
str
ateg
y in
plac
e bu
t rep
ortin
g is
prim
arily
in s
ilos
and
in s
ome
case
s
usin
g an
ele
ctro
nic
M&
E da
ta
colle
ctio
n to
ol
Dev
elop
men
t of
dat
a
man
agem
ent
busi
ness
proc
esse
s an
d da
ta
war
ehou
se s
yste
m
Dev
elop
bus
ines
s pr
oces
ses
in r
espe
ct o
f da
ta
man
agem
ent.
Dev
elop
dat
a w
areh
ouse
syst
em
Info
rmat
ion
for
repo
rtin
g re
quire
men
ts w
as g
athe
red
from
busi
ness
on
an o
ngoi
ng b
asis
.
Sam
ple
repo
rts
wer
e dr
awn
from
the
tes
t en
viro
nmen
t da
ta
war
ehou
se s
yste
m f
or v
ario
us b
usin
ess
units
60
%5
GIS
dat
aA
n up
date
d G
IS
Num
ber
of G
IS u
sers
Col
lect
and
upd
ate
data
and
roll
out
GIS
to
user
s
Info
rmat
ion
for
repo
rtin
g re
quire
men
ts w
as g
athe
red
from
busi
ness
on
an o
ngoi
ng b
asis
. Sam
ple
repo
rts
wer
e dr
awn
from
the
test
env
ironm
ent d
ata
war
ehou
se s
yste
m fo
r va
rious
bus
ines
s
units
. The
sys
tem
was
rea
dy b
ut c
ould
not
be
acce
ssed
due
to
cont
ract
ual i
ssue
s w
ith S
ITA
.
Dat
a w
as c
olle
cted
fro
m t
he S
DIM
S a
nd c
onso
lidat
ed in
to a
sing
le d
ata
stor
e
0%

Department of Social Development | Annual Report 2010/2011 47
Goa
lTo
bui
ld IM
ST
capa
bilit
y an
d ca
paci
ty in
ord
er t
o en
able
the
DSD
to
deliv
er o
n its
man
date
Ou
tcom
eEn
hanc
ed S
ocia
l Dev
elop
men
t se
rvic
e de
liver
y th
roug
h th
e IM
ST
serv
ices
Fun
ctio
nal
are
asS
trat
egic
ob
ject
ive
Bas
elin
eP
erfo
rman
ce in
dic
ator
Targ
etA
ctu
al o
utp
uts
% d
evia
tion
from
tar
get
Info
rmat
ion
man
agem
ent
syst
em
and
tech
nolo
gy
(IMST)
Profi
ling
(incl
udin
g m
obile
)
and
refe
rral
mod
ules
in
plac
e. In
tegr
ated
dat
abas
e
enco
mpa
ssin
g SO
CPE
N,
Hom
e A
ffairs
, Hou
sing
and
UIF.
Serv
ice
Del
iver
y m
anag
emen
t
mod
ule
not i
n pl
ace
NIS
IS in
fras
truc
ture
esta
blis
hed
Esta
blis
h N
ISIS
infr
astr
uctu
reN
ISIS
Infr
astr
uctu
re e
stab
lishe
d an
d im
plem
ente
d0
%
Cre
ate
an in
form
atio
n
netw
ork
that
ens
ures
inte
grat
ed s
ervi
ce d
eliv
ery
Glo
bal,
shar
ed, u
nsec
ured
and
unm
anag
ed 3
G in
tern
et
serv
ice
Impl
emen
tatio
n of
Acc
ess
Poi
nt N
etw
ork
(APN
)
Impl
emen
t D
epar
tmen
tal
APN
.
ToR
wer
e de
velo
ped
and
wer
e aw
aitin
g S
CM
app
rova
l5
0%
6
Ensu
re c
ompl
ianc
e w
ith IM
ST
gove
rnan
ce
Cur
rent
sof
twar
e de
velo
pmen
t
life
cycl
e (S
DLC
) lac
ks v
ital
elem
ents
, e.g
. cha
nge
man
agem
ent.
Unp
rove
n IT
pol
icy
(sec
urity
e-m
ail,
note
book
, ass
ets,
supp
ort).
Cob
it go
vern
ance
mod
el
adop
ted
but n
ot im
plem
ente
d.
MIS
P a
nd E
A (M
aste
r
Info
rmat
ion
Sys
tem
Pla
n
and
Ente
rpris
e A
rchi
tect
ure)
deve
lope
d bu
t no
t
mai
ntai
ned.
Rev
ised
and
app
rove
d SD
LC
fram
ewor
k.
Rev
ised
MSP a
nd E
A s
trat
egy
(IMST
stra
tegy
)
Rev
ise
and
appr
ove
SD
LC
fram
ewor
k.
Rev
iew
MSP a
nd E
A s
trat
egy
(IMST
stra
tegy
)
SD
LC w
as r
evis
ed a
nd a
ppro
ved
0%
Rea
son
s fo
r d
evia
tion
1 T
echn
ical
pro
blem
s w
hich
(SIT
A) S
tate
Info
rmat
ion
Tech
nolo
gy A
genc
y co
uld
not
reso
lve.
2 A
pre
sent
atio
n on
impl
emen
ting
the
KM
S t
o EX
CO
was
pos
tpon
ed t
hree
tim
es.
3 D
elay
s w
ere
expe
rienc
ed in
gai
ning
app
rova
l of
the
file
plan
.4 D
ata
Man
agem
ent
busi
ness
not
yet
dev
elop
ed.
5 C
ontr
actu
al d
ispu
tes
betw
een
SIT
A a
nd t
he D
SD
del
ayed
the
Impl
emen
tatio
n of
the
pro
ject
.6 U
pon
eval
uatio
n it
was
fou
nd t
hat
the
resp
onse
s di
d no
t co
nfor
m w
ith t
he T
oR, a
nd it
was
dec
ided
to
reis
sue
the
tend
er.

48 Annual Report 2010/2011 | Department of Social Development
Pro
gra
mm
e 1:
Ad
min
istr
ati
on
Goa
lTo
pro
vide
the
Dep
artm
ent
with
inde
pend
ent,
obje
ctiv
e as
sura
nce
and
cons
ultin
g se
rvic
es in
res
pect
of
the
adeq
uacy
and
eff
ectiv
enes
s of
ris
k m
anag
emen
t, in
tern
al c
ontr
ol a
nd g
over
nanc
e sy
stem
s an
d pr
oces
ses
Ou
tcom
eS
ound
con
trol
env
ironm
ent
Fun
ctio
nal
are
asS
trat
egic
ob
ject
ive
Bas
elin
eP
erfo
rman
ce in
dic
ator
Targ
etA
ctu
al o
utp
uts
% d
evia
tion
from
tar
get
Inte
rnal
aud
itR
evie
w fi
nanc
ial a
nd
oper
atin
g ac
tiviti
es a
nd r
epor
t
on t
he e
ffec
tiven
ess
of t
he
cont
rol e
nviro
nmen
t
Inte
rnal
aud
it th
ree-
year
rolli
ng p
lan
and
annu
al a
udit
cove
rage
pla
n
Rev
iew
of
repo
rt o
n ris
k
man
agem
ent,
gove
rnan
ce,
and
inte
rnal
con
trol
sys
tem
s
Inde
pend
ent
and
obje
ctiv
e ap
prai
sal o
f ris
k
man
agem
ent,
gove
rnan
ce,
and
inte
rnal
con
trol
sys
tem
s.
17
of
32
pla
nned
pro
ject
s co
mpl
eted
.4
7%
1
Dep
artm
ent’s
str
ateg
ic p
lan
and
annu
al p
lan
Num
ber
of p
rogr
amm
es
asse
ssed
to a
scer
tain
thei
r
cons
iste
ncy
with
est
ablis
hed
goal
s, o
bjec
tives
and
prio
ritie
s
Inde
pend
ent
and
obje
ctiv
e
revi
ew o
f pr
ogra
mm
es t
o
asce
rtai
n th
eir
cons
iste
ncy
with
est
ablis
hed
goal
s,
obje
ctiv
es a
nd p
riorit
ies.
The
follo
win
g 5
of
7 p
rogr
amm
es w
ere
cove
red.
Wel
fare
Ser
vice
s:
Orp
hans
and
Vul
nera
ble
Chi
ldre
n
Chi
ld P
rote
ctio
n
Ado
ptio
ns a
nd In
tern
atio
nal S
ocia
l Ser
vice
s
Ser
vice
sta
ndar
ds
Com
preh
ensi
ve S
ocia
l Sec
urity
:
Dis
abili
ty a
nd O
ld A
ge
Pol
icy
Impl
emen
tatio
n
Cor
pora
te S
ervi
ces:
Sec
urity
Man
agem
ent
Info
rmat
ion
man
agem
ent
Org
anis
atio
nal d
evel
opm
ent
Fina
nce:
Fina
ncia
l Adm
inis
trat
ion
Inte
rnal
Con
trol
Chi
ef O
pera
tions
Offi
ce:
Str
ateg
ic P
lann
ing
Bus
ines
s P
roce
sses
and
Ris
k M
anag
emen
t
Pop
ulat
ion
Dev
elop
men
t an
d R
esea
rch
Lega
l Ser
vice
s
Sub
stan
ce A
buse
Entit
y S
uppo
rt a
nd C
apac
ity B
uild
ing
29
%2

Department of Social Development | Annual Report 2010/2011 49
Goa
lTo
pla
n in
tern
al a
udits
and
inte
grat
e in
tern
al a
udit
activ
ities
in li
ne w
ith D
SD
ent
erpr
ise-
wid
e ris
k m
anag
emen
t.
Ou
tcom
eEf
fect
ive
com
bine
d as
sura
nce.
Fun
ctio
nal
are
asS
trat
egic
ob
ject
ive
Bas
elin
eP
erfo
rman
ce in
dic
ator
Targ
etA
ctu
al o
utp
uts
% d
evia
tion
from
tar
get
Inte
rnal
aud
itD
evel
op r
isk-
base
d pl
ans
cons
iste
nt w
ith t
he in
tern
al
audi
t ch
arte
r an
d th
e
goal
s an
d ob
ject
ives
of
the
Dep
artm
ent
Ente
rpris
e-w
ide
risk
man
agem
ent
repo
rt
Impl
emen
tatio
n of
inte
rnal
audi
t th
ree-
year
rol
ling
plan
Impl
emen
t in
tern
al a
udit
thre
e-ye
ar r
ollin
g pl
an a
nd
annu
al a
udit
cove
rage
pla
n
Thre
e-ye
ar r
ollin
g pl
an a
nd a
nnua
l aud
it co
vera
ge p
lan
deve
lope
d an
d im
plem
ente
d
0%
Har
mon
ise
inte
rnal
aud
its
with
oth
er a
ppra
isal
func
tions
with
in th
e D
SD, p
rovi
ncia
l
depa
rtm
ents
, SA
SSA
and
THE
ND
A
DO
RA
, PFM
A, n
atio
nal s
ocia
l
polic
ies
Num
ber
of p
rogr
amm
es
asse
ssed
to
asce
rtai
n th
eir
cons
iste
ncy
with
est
ablis
hed
polic
ies
and
othe
r ap
prai
sal
func
tions
Non
e Th
is s
trat
egic
obj
ectiv
e w
ill o
nly
be a
pplic
able
in t
he 2
01
2/1
3
finan
cial
yea
r
10
0%
3
Goa
lTo
impr
ove
the
serv
ices
pro
vide
d to
the
Dep
artm
ent
thro
ugh
capa
city
-bui
ldin
g, p
roce
ss im
prov
emen
t, an
d st
akeh
olde
r lia
ison
.
Ou
tcom
eA
sou
nd c
ontr
ol e
nviro
nmen
t.
Fun
ctio
nal
are
asS
trat
egic
ob
ject
ive
Bas
elin
eP
erfo
rman
ce in
dic
ator
Targ
etA
ctu
al o
utp
uts
% d
evia
tion
from
tar
get
Inte
rnal
aud
itD
evel
op a
nd m
aint
ain
an in
tern
al a
udit
qual
ity
assu
ranc
e an
d im
prov
emen
t
prog
ram
me
Pub
lic F
inan
ce M
anag
emen
t
Act
(PFM
A),
all s
tand
ards
,
and
Trea
sury
reg
ulat
ions
Impl
emen
tatio
n of
inte
rnal
audi
t qu
ality
ass
uran
ce a
nd
impr
ovem
ent
prog
ram
me
Impl
emen
t th
e in
tern
al
audi
t qu
ality
ass
uran
ce a
nd
impr
ovem
ent
prog
ram
me.
The
prog
ram
me
was
dev
elop
ed.
30
%4
Rea
son
s fo
r d
evia
tion
1 T
he D
irect
orat
e pr
iorit
ised
pro
ject
s fr
om t
he 2
00
9/2
01
0 fi
nanc
ial y
ear,
whi
ch r
esul
ted
in p
roje
cts
for
the
curr
ent
finan
cial
yea
r st
artin
g la
te.
2 T
he D
irect
orat
e pr
iorit
ised
pro
ject
s fr
om t
he 2
00
9/2
01
0 fi
nanc
ial y
ear,
whi
ch r
esul
ted
in p
roje
cts
for
the
curr
ent
finan
cial
yea
r st
artin
g la
te.
3 T
his
stra
tegi
c ob
ject
ive
was
not
app
licab
le in
the
cur
rent
rep
ortin
g pe
riod.
4 T
he p
rogr
amm
e w
as fi
nalis
ed in
the
fou
rth
quar
ter
of 2
01
0/2
011.

50 Annual Report 2010/2011 | Department of Social Development
Pro
gra
mm
e 1:
Ad
min
istr
ati
on
Goa
lTo
dra
ft a
nd r
evie
w e
ffec
tive
legi
slat
ion.
Ou
tcom
eEf
fect
ive
legi
slat
ion
and
regu
latio
ns in
the
soc
ial s
ecto
r.
Fun
ctio
nal
are
asS
trat
egic
ob
ject
ive
Bas
elin
eP
erfo
rman
ce in
dic
ator
Targ
etA
ctu
al o
utp
uts
% d
evia
tion
from
tar
get
Lega
l ser
vice
Dra
ft la
ws
and
regu
latio
nsLe
gisl
ativ
e dr
aftin
g pr
otoc
olA
men
dmen
ts t
o th
e Soc
ial
Ass
ista
nce
Act
, 2004
Dra
ft S
ocia
l Ass
ista
nce
Am
endm
ent
Bill
The
Bill
was
dra
fted
, pas
sed
by p
arlia
men
t an
d ga
zett
ed o
n 1
6
Sep
tem
ber
20
10
as
the
Soc
ial A
ssis
tanc
e A
men
dmen
t Act
, 20
10
(Act
No.
5 o
f 2
01
0).
Reg
ulat
ions
und
er t
he A
ct w
ere
draf
ted
and
publ
ishe
d fo
r pu
blic
com
men
ts o
n 2
9 D
ecem
ber
20
10
.
0%
Rev
iew
of
polic
y on
soc
ial
serv
ice
prof
essi
ons
Rev
iew
pol
icy
on s
ocia
l
serv
ice
prof
essi
ons.
Non
e.1
00
%1
Reg
ulat
ions
und
er t
he
Chi
ldre
n’ A
ct, 2
005
Fina
lise
and
oper
atio
nalis
e
regu
latio
ns u
nder
the
Chi
ldre
n’s
Act
, 2005
Reg
ulat
ions
wer
e fin
alis
ed a
nd o
pera
tiona
lised
by
way
of
a
Pre
side
ntia
l Pro
clam
atio
n on
1 A
pril
20
10
.
0%
Reg
ulat
ions
und
er t
he O
lder
Per
sons
Act
, 2006
Fina
lise
and
oper
atio
nalis
e
regu
latio
ns u
nder
the
Old
er
Per
sons
Act
, 2006
Reg
ulat
ions
wer
e fin
alis
ed a
nd o
pera
tiona
lised
by
way
of
a
Pre
side
ntia
l Pro
clam
atio
n on
1 A
pril
20
10
.
0%
Rev
iew
of
polic
y on
man
dato
ry r
etire
men
t
syst
ems
Rev
iew
pol
icy
on m
anda
tory
retir
emen
t sy
stem
s.
Non
e1
00
%2
Am
ende
d re
gula
tions
und
er
the
Pro
batio
n Ser
vice
s A
ct,
1991
Dra
ft a
men
ded
regu
latio
ns
unde
r th
e Pro
batio
n S
ervi
ces
Act
, 1991.
Non
e5
0%
3
Legi
slat
ive
Dra
ftin
g Pro
toco
lPol
icy
and
Bill
on
soci
al r
elie
fR
evie
w p
olic
y on
soc
ial r
elie
f,
and
draf
t Soc
ial R
elie
f B
ill
Pol
icy
on s
ocia
l rel
ief
was
fina
lised
and
was
aw
aitin
g fu
rthe
r
cons
ulta
tion
and
refin
emen
t. S
ocia
l Rel
ief
Bill
was
dra
fted
and
was
aw
aitin
g fu
rthe
r co
nsul
tatio
n an
d re
finem
ent.
0%
Reg
ulat
ions
und
er t
he
Pre
vent
ion
of a
nd T
reat
men
t
for
Sub
stan
ce A
buse
Act
,
2008
Dra
ft r
egul
atio
ns u
nder
the
Pre
vent
ion
of a
nd T
reat
men
t
for
Sub
stan
ce A
buse
Act
,
2008.
Reg
ulat
ions
wer
e dr
afte
d. A
ll th
e pr
ovin
ces
wer
e co
nsul
ted
and
thei
r co
mm
ents
wer
e in
corp
orat
ed. C
onsu
ltatio
n w
ith o
ther
gove
rnm
ent
depa
rtm
ents
and
com
men
ts f
rom
the
m w
ere
still
outs
tand
ing.
30
%4
Rev
iew
of
polic
y on
vic
tim
supp
ort
serv
ices
Rev
iew
pol
icy
on v
ictim
supp
ort
serv
ices
.
Non
e1
00
%5
Nat
iona
l Dev
elop
men
t
Age
ncy
Am
endm
ent
Bill
Dra
ft N
atio
nal D
evel
opm
ent
Age
ncy
Am
endm
ent
Bill
.
Non
e1
00
%6

Department of Social Development | Annual Report 2010/2011 51
Goa
lTo
dra
ft a
nd r
evie
w e
ffec
tive
legi
slat
ion.
Ou
tcom
eEf
fect
ive
legi
slat
ion
and
regu
latio
ns in
the
soc
ial s
ecto
r.
Fun
ctio
nal
are
asS
trat
egic
ob
ject
ive
Bas
elin
eP
erfo
rman
ce in
dic
ator
Targ
etA
ctu
al o
utp
uts
% d
evia
tion
from
tar
get
Lega
l ser
vice
Legi
slat
ive
Dra
ftin
g Pro
toco
lSou
th A
fric
an S
ocia
l Sec
urity
Age
ncy
Am
endm
ent
Bill
Dra
ft S
outh
Afr
ican
Soc
ial
Sec
urity
Age
ncy
Am
endm
ent
Bill
.
Non
e1
00
%7
Rev
iew
of
polic
y on
Non
-pro
fit O
rgan
isat
ions
Act
,
1997
Rev
iew
pol
icy
on N
on-p
rofit
Org
anis
atio
ns A
ct, 1
99
7.
Non
e1
00
%8
Rea
son
s fo
r d
evia
tion
1 T
he r
elev
ant
line
func
tion
did
not
subm
it th
e po
licy
for
revi
ew.
2 T
he r
elev
ant
line
func
tion
did
not
subm
it th
e po
licy
for
revi
ew.
3 D
raft
am
ende
d re
gula
tions
wer
e re
ceiv
ed f
rom
the
rel
evan
t lin
e fu
nctio
n, b
ut n
eede
d to
be
redr
afte
d by
Leg
al S
ervi
ces.
4 C
onsu
ltatio
n w
ith p
rovi
nces
too
k lo
nger
tha
n ex
pect
ed d
ue t
o th
e FI
FA W
orld
Cup
Sou
th A
fric
a, t
he s
ubst
ance
abu
se c
ampa
ign,
the
end
of
the
year
hol
iday
whe
re o
ffici
als
left
in m
id-D
ecem
ber
and
retu
rned
in m
id-J
anua
ry.
5 T
he r
elev
ant
line
func
tion
did
not
subm
it th
e po
licy
for
revi
ew.
6 T
he r
elev
ant
line
func
tion
did
not
subm
it th
e in
form
atio
n to
be
used
for
am
endm
ents
.7 T
he r
elev
ant
line
func
tion
did
not
subm
it th
e in
form
atio
n to
be
used
for
am
endm
ents
.8 T
he r
elev
ant
line
func
tion
did
not
subm
it th
e po
licy
for
revi
ew.
Goa
lTo
dev
elop
and
impl
emen
t st
rate
gies
on
litig
atio
n an
d co
ntra
ct m
anag
emen
t
Ou
tcom
eEf
fect
ive
man
agem
ent
of le
gal p
roce
edin
gs b
y an
d ag
ains
t th
e D
epar
tmen
t, an
d ef
fect
ive
filin
g an
d m
onito
ring
of c
ontr
acts
.
Fun
ctio
nal
are
asS
trat
egic
ob
ject
ive
Bas
elin
eP
erfo
rman
ce in
dic
ator
Targ
etA
ctu
al o
utp
uts
% d
evia
tion
from
tar
get
Lega
l ser
vice
M
anag
e lit
igat
ion
and
the
draf
ting
of c
ontr
acts
Litig
atio
n st
rate
gy p
roto
col
and
cont
ract
man
agem
ent
prot
ocol
Num
ber
of li
tigat
ions
agai
nst
DSD
Num
ber
of c
ontr
acts
atte
nded
to
Red
uce
litig
atio
n, a
nd
cent
ralis
e D
epar
tmen
tal
cont
ract
s.
Litig
atio
n re
duce
d by
50
% t
hrou
gh im
plem
enta
tion
of li
tigat
ion
man
agem
ent
stra
tegy
. 3 4
00
app
eals
wer
e fin
alis
ed. A
ll
cont
ract
s fo
r th
e D
epar
tmen
t w
ere
cent
rally
vet
ted,
file
d an
d
man
aged
.
0%

52 Annual Report 2010/2011 | Department of Social Development
Pro
gra
mm
e 1:
Ad
min
istr
ati
on
Goa
lTo
pro
vide
a s
afe
and
heal
thy
wor
king
env
ironm
ent
for
all e
mpl
oyee
s an
d vi
sito
rs t
o th
e D
epar
tmen
t.
Ou
tcom
eA
saf
e an
d se
cure
env
ironm
ent.
Fun
ctio
nal
are
asS
trat
egic
ob
ject
ive
Bas
elin
eP
erfo
rman
ce in
dic
ator
Targ
etA
ctu
al o
utp
uts
% d
evia
tion
from
tar
get
Sec
urity
Dev
elop
com
preh
ensi
ve
secu
rity
polic
y an
d
com
plia
nce
proc
edur
es
SA
PS a
udit
repo
rt.
Dev
elop
men
t of
a
com
preh
ensi
ve s
ecur
ity
polic
y an
d co
mpl
ianc
e
proc
edur
es
Dev
elop
a c
ompr
ehen
sive
secu
rity
polic
y an
d
com
plia
nce
proc
edur
es.
The
polic
y w
as d
evel
oped
.1
0%
1
Ant
i-fr
aud
and
corr
uptio
n
stra
tegy
Dev
elop
men
t of a
nti-
frau
d an
d
corr
uptio
n im
plem
enta
tion
plan
.
Impl
emen
tatio
n of
par
t of
the
anti-
frau
d an
d co
rrup
tion
impl
emen
tatio
n pl
an.
Dev
elop
an
anti-
frau
d an
d
corr
uptio
n im
plem
enta
tion
plan
, and
impl
emen
t 5
0%
of p
lan.
A p
lan
was
dev
elop
ed, a
nd 5
0%
was
impl
emen
ted.
The
HSR
C, i
n pa
rtne
rshi
p w
ith th
e D
SD, S
ASS
A a
nd th
e N
DA
,
held
an
Ant
i-co
rrup
tion
day
on 9
Dec
embe
r, ai
med
at e
duca
ting
empl
oyee
s ab
out a
nd r
aisi
ng th
eir
awar
enes
s of
cor
rupt
ion.
0%
Rea
son
s fo
r d
evia
tion
1 T
he p
olic
y w
as d
ue t
o be
sub
mitt
ed t
o S
AS
SA
for
rev
iew
and
com
men
ts b
efor
e be
ing
subm
itted
to
the
HoD
for
fina
l app
rova
l.
Goa
lTo
pro
vide
eff
ectiv
e pr
oper
ty m
anag
emen
t su
ppor
t se
rvic
es.
Ou
tcom
eS
uffic
ient
offi
ce a
ccom
mod
atio
n fo
r th
e D
epar
tmen
t ac
cord
ing
to P
ublic
Wor
ks n
orm
s an
d st
anda
rds.
Fun
ctio
nal
are
asS
trat
egic
ob
ject
ive
Bas
elin
eP
erfo
rman
ce in
dic
ator
Targ
etA
ctu
al o
utp
uts
% d
evia
tion
from
tar
get
Sec
urity
Sec
ure
shar
ed o
ffice
acco
mm
odat
ion
for
the
DS
D,
SA
SS
A a
nd t
he N
DA
DSD
, SA
SSA
and
the
ND
A
are
in s
epar
ate
build
ings
.
Feas
ibili
ty s
tudy
for
sha
red
acco
mm
odat
ion
cond
ucte
d.
Dev
elop
a n
atio
nal
acco
mm
odat
ion
prop
osal
,
and
secu
re in
itial
fun
ding
for
leas
ing.
The
DSD
, in
cons
ulta
tion
with
SA
SSA
, the
ND
A a
nd th
e A
ppea
ls
Trib
unal
with
a v
iew
to c
lust
erin
g th
eir
offic
e ac
com
mod
atio
n
requ
irem
ents
in o
rder
for
all p
artie
s ac
quiri
ng a
new
Soc
ial
Dev
elop
men
t Cam
pus
(faci
lity)
.
The
DSD
req
uest
ed a
nd r
ecei
ved
fund
s fr
om th
e N
atio
nal
Trea
sury
to c
ondu
ct a
feas
ibili
ty s
tudy
on
clus
terin
g th
eir
offic
e
acco
mm
odat
ion
requ
irem
ents
with
a v
iew
to a
ll pa
rtie
s as
sem
blin
g
at a
new
soc
ial d
evel
opm
ent c
ampu
s an
d th
e ac
quis
ition
of
suita
bly
desi
gned
acc
omm
odat
ion
that
will
com
ply
with
the
serv
ice
deliv
ery
requ
irem
ents
of t
he D
epar
tmen
t is
fully
inve
stig
ated
.
0%

Comprehensive Social Security
Programme 2

54 Annual Report 2010/2011 | Department of Social Development
PART B: PROGRAMME PERFORMANCE
Programme 2: Comprehensive Social Security
Strategic goalTo ensure the provision of a basic package of social security
measures and interventions, focusing on income support.
Measurable objectiveTo develop comprehensive social security policies, and provide
income support to vulnerable groups.
Service delivery objectives and indicators
Recent outputs
Social assistance
There has been a sustained increase in the number of
beneficiaries of the social assistance programme. This trend
continued in the year under review, with beneficiaries increasing
by 782 119 from 14 012 143 in March 2010 to 14 782 190
in March 2011 – an overall increase of 5,2%. During 2010/11,
access to social assistance improved further for children and
older persons.
Child support grant: The child support grant was extended to
children aged 16 and 17 years, and beneficiaries increased by
8,06%, from 9 539 516 to 10 308 239. An agreement was
reached with the Department of Basic Education on working with
DSD to ensure that children of school going age who receive their
CSG attend school.
Foster child grant: FCGs were lapsed with a view to review them
and hence the decline in the number for foster care. As a result,
recipients decreased by 5,38%, from 506 284 to 479 058.
Care dependency grant: Recipients of the care dependency
grant decreased by 2,92%, from 119 532 to 116 039.
Older persons grant: Recipients of the older persons grant
increased by 4,67% to 2,65 million. In the final phase of age
equalisation, which began in the 2008/9 financial year, males
aged 60 years started accessing old age grants. The National
Treasury approved the universalisation (removal of the means test)
of the older person’s grant, to be phased in by gradually by raising
the means test ceiling up to the tax threshold.
Disability grant: Recipients of the disability grant declined by
5,60%, from 1 291 264 to 1 218 916. The decline largely involves
recipients of the temporary disability grant.
War veterans grant: As a result of natural attrition, recipients of
the war veterans grant declined by 20,44%, from 1 218 to 969.
The Social Assistance Amendment Act
The Social Assistance Amendment Act (Act No. 5 of 2010) was
assented to by the President in September 2010. However,
the definition of disability was excluded from the Bill after the
Department of Health (DoH) had informed the Social Development
Portfolio Committee that it was not ready to implement the
harmonised assessment tool (HAT) because it had no trained
health professionals capable of conducting disability assessments.
It also stated that its primary health care facilities would not
be able to meet the nutritional needs of people with chronic
conditions. This was necessitated by the realisation that the HAT
would exclude people with chronic conditions from receiving
disability grants.
The assessment tool for the care dependency grant (CDG) could
not be presented to Cabinet for approval because it had policy
implications. A policy for the CDG will be developed and costed
and presented to Cabinet in the next financial year.
A consolidated policy on social relief and a Social Relief Bill were
approved by MINMEC. The policy still has to be costed and taken
through further processes before bring presented to Cabinet.
Social insurance
The Department is playing a leading role in creating new knowledge
of social insurance. During 2010, the Branch completed a report
detailing the pension systems of all member countries of the
Southern African Development Community (SADC), which provided
a fresh perspective on mandatory social security contributions in
the context of fiscal and economic constraints. It also produced a
short report on the current South African social security system,
to enable our local and international guests who attended the
World Social Security Forum in Cape Town to better understand our
context while deliberating on future trends and pressing challenges
facing social security systems around the world. It also completed
a report on the history of the South African social security system

PART B: PROGRAMME PERFORMANCE
Department of Social Development | Annual Report 2010/2011 55
which provides a rich insight into how the country arrived where it
is today, thus enabling it to chart a successful route forward which
avoids the mistakes of the past.
In collaboration with the International Social Security Association
(ISSA), the Branch completed a report on the South African pension
system, focusing on its performance in respect of the adequacy of
pensions provided in the public and private sectors, as well as its
ability to deal with economic shocks and longevity risks.
Social security reform
The Department continued to contribute to the work of the
Interdepartmental Task Team on Social Security Reform, and
made extensive proposals for the introduction of new social
insurance benefits and the overhaul of the institutional framework
for providing social security. Specifically, the Department
proposed that the policy-making function for social security
should be consolidated under one Department, and that a new
social insurance fund (the National Social Security Fund) should
be created to provide retirement, disability and survivor benefits
to all formally employed contributors who will be mandated by
government to contribute. Furthermore, it proposed that the
different social security agencies currently providing similar
benefits should be streamlined in order to achieve efficiencies
and economies of scale.
These recommendations will be published in the next financial
year in a Consolidated Government Document (CGD) which
will serve as a basis for countrywide consultation with all
stakeholders. The CGD will be published under the auspices of the
Inter-Ministerial Committee on Social Security Reform, on which
the Minister of Social Development serves. The establishment of
the IMC in 2007 amounted to a recognition by Cabinet of the
intergovernmental nature of social insurance provision in South
Africa, with five different government departments having policy
and legislative responsibility. Although the CGD was completed in
early 2010, various challenges conspired to delay its publication.
This included the complexity of the issues and the cross-cutting
nature of the proposals, which will have extensive implications
for the work of five different government departments, and affect
every citizen. The Cabinet reshuffle of 2010 also resulted in the
introduction of new Ministers who needed to be briefed on these
issues, leading to a loss of momentum.
In November 2010, the Department hosted a successful five-day
international conference, the World Social Security Forum (WSSF),
on behalf of the International Social Security Association (ISSA).
This was the first time in ISSA’s 87 year history that South Africa
had hosted this event, which occurs once every three years. It
was attended by more than 1 000 leaders and administrators
of social security institutions, policy-makers, representatives of
international organisations, social policy experts from more than
100 countries, and cabinet ministers from eight countries. The
Forum gave participants an opportunity to analyse and debate
issues facing social security throughout the world, including the
impact of demographic changes on social security and strategies
for extending social security coverage.
Besides this global event, the Branch continued to engage with
and contribute to social security developments closer to home
through its ongoing role as host of the ISSA Liaison Office for
Southern Africa. It hosted a regional seminar in Mauritius in which
all the member countries in the region participated. The theme,
‘Technical and Operational Efficiency in Social Security Provision’,
was particularly well received by participants, as many countries
are battling with these issues in the wake of the global recession.
Appeals Tribunal
During the period under review, the Appeals Tribunal achieved the
following:
Policies: A social assistance appeals adjudication strategy
was finalised, resulting in a need for a comprehensive social
security adjudication policy. Service providers were appointed,
and the project was due to be finalised in the next financial
year.
Legislation: Regulations under the Social Assistance
Amendment Act were published for public comment on
29 December 2010. The regulations were due to be finalised
and promulgated in the next financial year.
Appeals: The Tribunal revised its business model and
implemented three projects for dealing with backlog appeals,
new appeals, and litigious appeals. As a result, by end March
2011 the Tribunal had processed 41 162 appeals, more than
the annual target of 40 000 set in the Estimate of National
Expenditure (ENE). The turnaround strategy for dealing with
appeals, which included hiring personnel via the Expanded

56 Annual Report 2010/2011 | Department of Social Development
PART B: PROGRAMME PERFORMANCE
Programme 2: Comprehensive Social Security
Public Works Programme, increased the number of appeals
adjudicated from 400 to 4 000 a month. Outstanding cases
(about 20 000) were due to be dealt with within the first six
months of the next financial year.
New appeals: All new appeals relating to SASSA decisions
after 1 April 2010 were dealt with within 90 days. In terms
of the ENE Target, 15 000 new appeals should have been
considered. However, the Social Assistance Amendment Act,
2010 (Act 5 of 2010) stipulates that all appeals have to be
reconsidered by SASSA before being adjudicated. As a result,
all new appeals received after the 16 September 2010 were
referred back to SASSA for reconsideration prior to being
adjudicated upon as appeals. This process has since resulted
in reduced intake of new appeals for adjudication.
Litigious appeals: Contract staff were appointed in the office
of the State Attorney: KwaZulu-Natal to assist with litigious
appeals. The number of litigious matters relating to appeals
received nationally was 14 514 during the reporting period.
Personnel: The organisational structure of the Appeals
Tribunal was finalised, and it was envisaged that after the
existing staff had been migrated to the new structure, vacant
posts will be advertised and filled from September 2011. The
Tribunal also established provincial offices in all nine provinces,
thereby ensuring public access to appeal services. Provincial
coordinators and support staff were appointed in Gauteng,
the Free State, North West, Northern Cape and Mpumalanga,
complementing the offices that had already been established in
KwaZulu-Natal, the Eastern Cape, Limpopo and Western Cape.
Performance targets achieved
Deviation Status Total targets
■ 0–25% Achieved 19
■ 26–75% In progress 1
■ 76–100% Not achieved
1
19
0
14 000
28 000
42 000
56 000
70 000
84 000
98 000
AuditedActual
Final Appropraition
Budgeted and actual expenditure
R93 260 988
R95 150 156

Department of Social Development | Annual Report 2010/2011 57
Key
ou
tpu
ts a
nd
ser
vice
del
iver
y in
dic
ator
s
Mea
sura
ble
ob
ject
ives
: To
deve
lop
com
preh
ensi
ve s
ocia
l sec
urity
pol
icie
s, a
nd p
rovi
de in
com
e su
ppor
t to
vul
nera
ble
grou
ps.
Goa
lTo
red
uce
inco
me
pove
rty
amon
g po
or a
nd v
ulne
rabl
e Sou
th A
fric
ans
Ou
tcom
eIm
prov
ed s
ocio
-eco
nom
ic s
tatu
s of
hou
seho
lds
Fun
ctio
nal
are
asS
trat
egic
ob
ject
ive
Bas
elin
eP
erfo
rman
ce in
dic
ator
Targ
etA
ctu
al o
utp
uts
% d
evia
tion
from
tar
get
Soc
ial a
ssis
tanc
eIn
crea
se a
cces
s to
chi
ld s
uppo
rt
gran
t (C
SG
) and
old
er p
erso
n’s
gran
t (O
PG
)
9 5
69 6
02 c
hild
ren
aged
0 t
o 16 b
enefi
ting
from
CSG
in M
arch
2010
Exte
nsio
n of
CSG
to
child
ren
aged
16 –
17
Exte
nd C
SG
to
child
ren
aged
16 –
17
At
end
Mar
ch 2
01
1, 3
23
81
3 c
hild
ren
aged
16
-17
wer
e
bene
fitin
g fr
om t
he C
SG
, inc
reas
ing
the
tota
l num
ber
of
bene
ficia
ries
to 1
0 3
08
23
9.
0%
200 0
24 m
ales
age
d 61
to 6
4 r
ecei
ving
the
OPG
in
Mar
ch 2
010
Exte
nsio
n of
OPG
to
mal
es
aged
60
Exte
nd O
PG
to
mal
es
aged
60
At
end
Mar
ch 2
01
1, 5
3 7
87
mal
es a
ged
60
to
64
wer
e
rece
ivin
g th
e O
PG
, inc
reas
ing
the
tota
l num
ber
of m
ales
rece
ivin
g th
e O
PG
to
28
3 7
65
.
0%
Goa
lTo
red
uce
inco
me
pove
rty
amon
g po
or a
nd v
ulne
rabl
e Sou
th A
fric
ans
Ou
tcom
eTh
e rig
hts
of d
isab
led
peop
le a
re p
rom
oted
and
pro
tect
ed
Fun
ctio
nal
are
asS
trat
egic
ob
ject
ive
Bas
elin
eP
erfo
rman
ce in
dic
ator
Targ
etA
ctu
al o
utp
uts
% d
evia
tion
from
tar
get
Soc
ial a
ssis
tanc
eIn
trod
uce
a co
mm
on t
ool f
or
asse
ssin
g di
sabi
lity
1 2
64 4
77 p
eopl
e re
ceiv
ing
perm
anen
t di
sabi
lity
gran
ts in
Mar
ch 2
010
Am
endm
ent
to S
ocia
l
Ass
ista
nce
Act
Dra
ft S
ocia
l Ass
ista
nce
Am
endm
ent
Bill
The
Soc
ial A
ssis
tanc
e A
men
dmen
t B
ill w
as in
trod
uced
in
Par
liam
ent.
Par
liam
ent
refe
rred
the
dis
abili
ty d
efini
tion
in
the
Bill
bac
k to
Cab
inet
for
rec
onsi
dera
tion.
A le
gal o
pini
on
on im
plem
entin
g th
e H
arm
onis
ed A
sses
smen
t Too
l (H
AT)
with
out
the
defin
ition
was
obt
aine
d. A
con
sulta
tive
proc
ess
on r
egul
atin
g th
e H
AT w
as d
ue t
o be
con
clud
ed in
the
nex
t
finan
cial
yea
r.
0%
119 4
31 c
hild
ren
bene
fitin
g
from
car
e de
pend
ency
gra
nt
by M
arch
2010
Ass
essm
ent
tool
for
chi
ldre
n
with
dis
abili
ties
and
heal
th
care
nee
ds
Dev
elop
an
asse
ssm
ent
tool
for
child
ren
with
dis
abili
ties
and
heal
th c
are
need
s
Cab
inet
mem
o re
turn
ed f
or p
olic
y ch
ange
s be
fore
app
rova
l
of t
ool.
A d
raft
pol
icy
on c
hild
ren
with
dis
abili
ties
was
com
plet
ed, a
nd w
as d
ue t
o be
rel
ease
d fo
r co
nsul
tatio
n an
d
cost
ed in
the
nex
t fin
anci
al y
ear.
0%
Pro
gra
mm
e 2:
Com
pre
hen
sive
Soci
al
Sec
uri
ty

58 Annual Report 2010/2011 | Department of Social Development
Pro
gra
mm
e 2:
Com
pre
hen
sive
Soci
al
Sec
uri
ty
Goa
lTo
dev
elop
a c
oher
ent
polic
y on
the
soc
ial r
elie
f of
dis
tres
s
Ou
tcom
eVi
bran
t, eq
uita
ble
and
sust
aina
ble
rura
l com
mun
ities
with
foo
d se
curit
y fo
r al
l
Fun
ctio
nal
are
asS
trat
egic
ob
ject
ive
Bas
elin
eP
erfo
rman
ce in
dic
ator
Targ
etA
ctu
al o
utp
uts
% d
evia
tion
from
tar
get
Soc
ial a
ssis
tanc
eP
rovi
de s
ocia
l rel
ief
to in
dige
nt
pers
ons
affe
cted
by
disa
ster
s
Non
-sta
ndar
dise
d
disb
urse
men
t of
soc
ial r
elie
f
Con
solid
atio
n of
pol
icy
and
legi
slat
ion
on s
ocia
l rel
ief
Con
solid
ate
polic
y an
d
legi
slat
ion
on s
ocia
l rel
ief
The
polic
y an
d B
ill w
ere
appr
oved
by
MIN
MEC
and
the
Soc
ial P
rote
ctio
n C
lust
er f
or s
ubm
issi
on t
o C
abin
et,
and
wer
e du
e to
be
subm
itted
to
Cab
inet
and
tab
led
in
Par
liam
ent
in t
he n
ext
finan
cial
yea
r.
25
%1
Rea
son
s fo
r d
evia
tion
1 T
his
proc
ess
was
del
ayed
by
leng
thy
cons
ulta
tions
abo
ut d
iffer
ent
mod
els
for
alig
ning
the
Bill
and
pol
icy.
Goa
lTo
cre
ate
a co
mpr
ehen
sive
soc
ial i
nsur
ance
sys
tem
Ou
tcom
eC
ontr
ibut
e to
a h
ealth
y w
orkf
orce
, eco
nom
ic g
row
th, a
nd s
usta
inab
le li
velih
oods
Fun
ctio
nal
are
asS
trat
egic
ob
ject
ive
Bas
elin
eP
erfo
rman
ce in
dic
ator
Targ
etA
ctu
al o
utp
uts
% d
evia
tion
from
tar
get
Soc
ial i
nsur
ance
Man
dato
ry r
etire
men
t pr
ovis
ioni
ngLa
ck o
f m
anda
tory
Sub
mis
sion
of
polic
y on
man
dato
ry r
etire
men
t
prov
isio
ns t
o ca
bine
t
App
rove
pol
icy
on m
anda
tory
retir
emen
t pr
ovis
ions
App
rove
d po
licy
on
man
dato
ry r
etire
men
t
The
polic
y on
man
dato
ry r
etire
men
t w
as d
raft
ed a
nd
appr
oved
by
the
Inte
r-M
inis
teria
l Com
mitt
ee o
n S
ocia
l
Sec
urity
on
8 F
ebru
ary
20
11
0%
Dev
elop
a c
oher
ent
over
arch
ing
inst
itutio
nal a
rran
gem
ent
for
prov
idin
g so
cial
sec
urity
Frag
men
tatio
n of
soc
ial
secu
rity
inst
itutio
ns
Blu
eprin
t fo
r N
atio
nal S
ocia
l
Sec
urity
Fun
d (N
SSF)
Dra
ft b
luep
rint
for
NS
SF
The
draf
t bl
uepr
int
was
com
plet
ed a
nd p
rese
nted
to
MA
NC
O a
nd E
XCO
0%
Blu
eprin
t fo
r re
vise
d
soci
al s
ecur
ity in
stitu
tiona
l
fram
ewor
k
Dra
ft b
luep
rint
for
revi
sed
soci
al s
ecur
ity in
stitu
tiona
l
fram
ewor
k
The
draf
t bl
uepr
int
was
com
plet
ed a
nd p
rese
nted
to
MA
NC
O a
nd t
he In
ter-
depa
rtm
enta
l Tas
k Te
am o
n S
ocia
l
Sec
urity
Ref
orm
0%

Department of Social Development | Annual Report 2010/2011 59
Soc
ial a
ssis
tan
ce
tran
sfer
s
Fun
din
g o
f so
cial
gra
nts
Nu
mb
er o
f b
enefi
ciar
ies
Est
imat
ed b
enefi
ciar
ies
by M
arch
20
11
Act
ual
ou
tpu
t: 1
4 7
82
19
0%
dev
iati
on
from
tar
get
Soc
ial i
nsur
ance
Old
er p
erso
n’s
gran
t: 2 5
40 2
57
Old
er p
erso
n’s
gran
t: 2
65
8 9
69
0%
War
vet
eran
’s g
rant
: 1 2
18
War
vet
eran
’s g
rant
: 9
69
0%
Dis
abili
ty g
rant
: 1 2
91 2
64
Dis
abili
ty g
rant
: 1
21
8 9
16
0%
Fost
er c
hild
gra
nt: 5
06 2
84
Fost
er c
hild
gra
nt:
47
9 0
58
0%
Car
e de
pend
ency
gra
nt: 1
19 5
32
Car
e de
pend
ency
gra
nt: 1
16
03
90
%
Chi
ld s
uppo
rt g
rant
: 9 5
39 5
16
Chi
ld s
uppo
rt g
rant
: 10
30
8 2
39
0%
Goa
lTo
est
ablis
h a
syst
em f
or a
djud
icat
ing
soci
al a
ssis
tanc
e ap
peal
s
Ou
tcom
eVi
bran
t, eq
uita
ble
and
sust
aina
ble
rura
l com
mun
ities
with
foo
d se
curit
y fo
r al
l
Fun
ctio
nal
are
asS
trat
egic
ob
ject
ive
Bas
elin
eP
erfo
rman
ce in
dic
ator
Targ
etA
ctu
al o
utp
uts
% d
evia
tion
from
tar
get
App
eals
trib
unal
Dev
elop
a s
ocia
l ass
ista
nce
appe
als
adju
dica
tion
polic
y an
d
legi
slat
ive
fram
ewor
k
Dra
ft p
olic
y on
soc
ial
assi
stan
ce a
ppea
ls
Legi
slat
ive
fram
ewor
k fo
r
soci
al a
ssis
tanc
e ap
peal
s
as s
tipul
ated
in t
he S
ocia
l
Ass
ista
nce
Act
(SSA
), 2004
Ser
vice
del
iver
y m
odel
for
soci
al a
ppea
ls
Dra
ftin
g of
soc
ial a
ssis
tanc
e
appe
als
adju
dica
tion
polic
y
Dra
ft a
soc
ial a
ssis
tanc
e
appe
als
adju
dica
tion
polic
y
Dra
ft m
atric
es f
or s
ocia
l sec
urity
adj
udic
atio
n pr
oced
ures
50
%1
Pub
licat
ion
of r
egul
atio
ns
unde
r th
e SSA
Pub
lish
regu
latio
ns u
nder
the
SSA
Dra
ft r
egul
atio
ns w
ere
publ
ishe
d fo
r pu
blic
com
men
t, an
d
the
com
men
ts r
ecei
ved
wer
e co
nsid
ered
. A p
ublic
out
reac
h
prog
ram
me
was
due
to
be h
eld
in t
he n
ext
finan
cial
yea
r,
and
regu
latio
ns fi
nalis
ed t
here
afte
r.
0%
Adj
udic
atio
n of
soc
ial a
ssis
tanc
e
appe
als
in o
rder
to
prom
ote
fair,
just
and
equ
itabl
e ad
min
istr
ativ
e
actio
n
No
base
line
Num
ber
of a
ppea
ls lo
dged
Adj
udic
ate
lodg
ed a
ppea
ls,
prio
ritis
ed a
ccor
ding
to
the
FIFO
(firs
t in
firs
t ou
t)
prin
cipl
e
41
16
2 b
ackl
og a
ppea
ls w
ere
adju
dica
ted
and
final
ised
.0
%
Rea
son
s fo
r d
evia
tion
1 T
he p
roje
ct s
tart
ed la
te. I
t w
as d
ue t
o be
com
plet
ed b
y th
e en
d of
the
nex
t fin
anci
al y
ear.
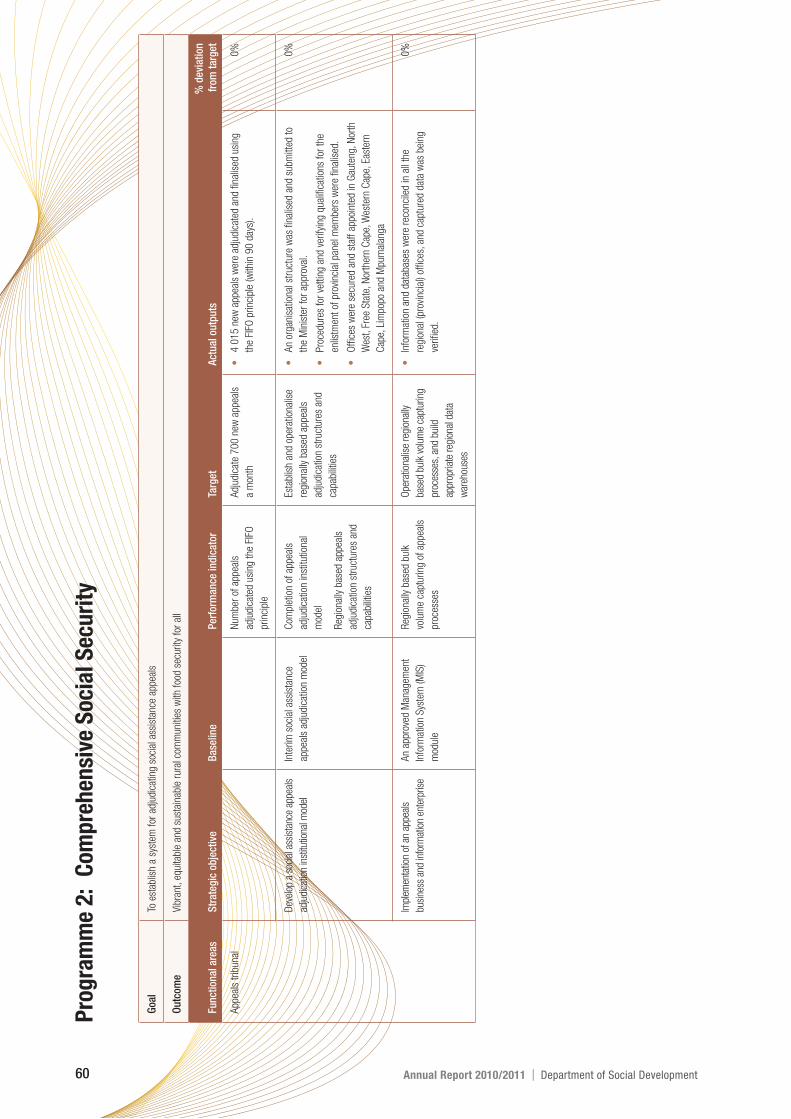
60 Annual Report 2010/2011 | Department of Social Development
Pro
gra
mm
e 2:
Com
pre
hen
sive
Soci
al
Sec
uri
ty
Goa
lTo
est
ablis
h a
syst
em f
or a
djud
icat
ing
soci
al a
ssis
tanc
e ap
peal
s
Ou
tcom
eVi
bran
t, eq
uita
ble
and
sust
aina
ble
rura
l com
mun
ities
with
foo
d se
curit
y fo
r al
l
Fun
ctio
nal
are
asS
trat
egic
ob
ject
ive
Bas
elin
eP
erfo
rman
ce in
dic
ator
Targ
etA
ctu
al o
utp
uts
% d
evia
tion
from
tar
get
App
eals
trib
unal
Num
ber
of a
ppea
ls
adju
dica
ted
usin
g th
e FI
FO
prin
cipl
e
Adj
udic
ate
700 n
ew a
ppea
ls
a m
onth
4 0
15
new
app
eals
wer
e ad
judi
cate
d an
d fin
alis
ed u
sing
the
FIFO
prin
cipl
e (w
ithin
90
day
s).
0%
Dev
elop
a s
ocia
l ass
ista
nce
appe
als
adju
dica
tion
inst
itutio
nal m
odel
Inte
rim s
ocia
l ass
ista
nce
appe
als
adju
dica
tion
mod
el
Com
plet
ion
of a
ppea
ls
adju
dica
tion
inst
itutio
nal
mod
el
Reg
iona
lly b
ased
app
eals
adju
dica
tion
stru
ctur
es a
nd
capa
bilit
ies
Esta
blis
h an
d op
erat
iona
lise
regi
onal
ly b
ased
app
eals
adju
dica
tion
stru
ctur
es a
nd
capa
bilit
ies
An
orga
nisa
tiona
l str
uctu
re w
as fi
nalis
ed a
nd s
ubm
itted
to
the
Min
iste
r fo
r ap
prov
al.
Pro
cedu
res
for
vett
ing
and
verif
ying
qua
lifica
tions
for
the
enlis
tmen
t of
pro
vinc
ial p
anel
mem
bers
wer
e fin
alis
ed.
Offi
ces
wer
e se
cure
d an
d st
aff
appo
inte
d in
Gau
teng
, Nor
th
Wes
t, Fr
ee S
tate
, Nor
ther
n C
ape,
Wes
tern
Cap
e, E
aste
rn
Cap
e, L
impo
po a
nd M
pum
alan
ga
0%
Impl
emen
tatio
n of
an
appe
als
busi
ness
and
info
rmat
ion
ente
rpris
e
An
appr
oved
Man
agem
ent
Info
rmat
ion
Sys
tem
(MIS
)
mod
ule
Reg
iona
lly b
ased
bul
k
volu
me
capt
urin
g of
app
eals
proc
esse
s
Ope
ratio
nalis
e re
gion
ally
base
d bu
lk v
olum
e ca
ptur
ing
proc
esse
s, a
nd b
uild
appr
opria
te r
egio
nal d
ata
war
ehou
ses
Info
rmat
ion
and
data
base
s w
ere
reco
ncile
d in
all
the
regi
onal
(pro
vinc
ial)
offic
es, a
nd c
aptu
red
data
was
bei
ng
verifi
ed.
0%

Policy Development, Review and
Implementation Support for Welfare Services
Programme 3

62 Annual Report 2010/2011 | Department of Social Development
PART B: PROGRAMME PERFORMANCE
Programme 3: Policy Development, Review and Implementation Support for Welfare Services
PurposeThe purpose of this programme is to create an enabling
environment for delivering social welfare services and deal with
the social impact of HIV and AIDS, in partnership with state-
funded agencies and non-governmental organisations (NGOs),
including community-based organisations (CBOs) and faith-based
organisations (FBOs).
Measurable objectiveTo create an enabling environment for delivering equitable
developmental welfare services by formulating effective policies,
setting appropriate standards, recording and pursuing best
practice, and supporting social service providers.
Service delivery objectives and indicators
Recent outputs
Service standardsThe Department developed generic norms and standards for social
welfare services. The social welfare sector was broadly consulted
on the norms and standards, which are meant to guide the delivery
of social welfare services in different settings. About 1 000
stakeholders were trained to apply the norms and standards, and
utilise the business processes for delivering social welfare services.
In support of the norms and standards, a human resources
model for delivering social welfare services and an architectural
framework for social welfare services were developed.
Service provider support managementNPOs assist the government to deliver social welfare services in
both urban and rural settings and therefore receive significant
government funding. In the year under review, the Department
allocated funds to 22 national NGOs. In order to address
disparities in the funding of NGOs, both on a national and
provincial level, MINMEC reviewed and approved a policy on
financial awards to service providers (PFA) in March 2011.
The South African Council for Social Service Professions
(SACSSP) and Professional Board for Social Workers (PBSW)
were established and inaugurated in December 2010. An Interim
Structure for Child and Youth Care was established, to help
prepare for the establishment of a Professional Board on Child &
Youth Care Work (PBCYC) and the registration of child and youth
care workers.
A policy on social services and occupations was drafted in
consultation with all relevant stakeholders, including the SACSSP.
This will serve as the basis for developing new legislation to
replace the Social Service Professions Act, 1978 (as amended).
Social service professionals are expected to deliver services to
clients in an ethical way, and respect their rights and dignity. To
ensure such professional conduct, the Department finalised a
framework for managing and promoting human rights, and 1 891
social service professionals were trained on human rights and
ethics in all nine provinces.
Older personsThe Older Persons Act (No. 13 of 2006) came into force on
1 April 2010. In order to ensure compliance with its provisions
on community-based care, a situational analysis of these services
was completed in Western Cape, Eastern Cape, Free State and
Gauteng, and research was conducted on community-based frail
care services in all nine provinces.
In March 2011, Human Rights Month, the Minister of Social
Development and the Older Persons Forum launched a Charter on
the Rights of Older Persons in Freedom Park in Tshwane.
In line with the second priority of the Madrid International Plan of
Action on Ageing (MIPAA), which is supported by the South African
Policy on Older Persons of 2005 and the Older Persons Act (No
13 of 2006), the Department helped to coordinate Golden Games
in all nine provinces.
In recognition of the need for an integrated approach to service
delivery, programmes for promoting intergenerational solidarity
and cohesion were piloted and audited in Northern Cape and
KwaZulu-Natal.
People with disabilitiesThe Department finalised the amalgamation of all policies on
people with disabilities, in line with the UN Convention on the

PART B: PROGRAMME PERFORMANCE
Department of Social Development | Annual Report 2010/2011 63
Rights of People with Disabilities. The draft policy is available to
stakeholders and other interested parties.
Social crime prevention
The blueprint for minimum norms and standards on secure care
were fi nalised and approved by the Heads of Social Development
(HSD) in August 2010. These norms and standards complement
the requirements of the Child Justice Act. The policy framework
for accrediting diversion services under the Act was approved and
tabled in Parliament. A notice was published in the Government
Gazette requesting diversion service providers to apply for
accreditation as organisations as well as for their programmes.
Three structures (accreditation, quality assurance, and site
verifi cation) were appointed in all provinces, and personnel were
trained to implement the accreditation framework and facilitate
accreditation.
A strategy on social crime prevention was developed and
was approved by the HSD in February 2011. The strategy was
also presented to the Development Committee which is the
subcommittee of the Justice, Crime Prevention and Security
Cluster (JCPS). It is aimed at enabling the sector to contribute to
crime prevention, and ensuring coordination and partnerships with
key stakeholders.
The following fi ve social crime prevention therapeutic programmes
were developed to ensure the stimulation of children awaiting trial
in communities and in secure care facilities.
Sexual offences
Substance abuse
Personal development/life skills
After care and reintegration
Restorative justice
Personnel in all nine provinces were trained to implement these
programmes.
A total of 420 practitioners in all provinces were trained on
implementing the probation practice guidelines.

64 Annual Report 2010/2011 | Department of Social Development
PART B: PROGRAMME PERFORMANCE
Programme 3: Policy Development, Review and Implementation Support for Welfare Services
Policy guidelines on remunerative after-hour, standby and weekend
probation services were finalised, and policy guidelines on
reintegration/aftercare strategy were drafted. Regulations under the
Probation Services Act (No 35 of 2002) were fi nalised and submitted
for consultation.
Substance abuse
Regulations under the Prevention of and Treatment for Substance
Abuse Act (No 70 of 2008) were drafted and submitted for
consultation with stakeholders in all nine provinces. Inputs were
consolidated and incorporated in the draft.
A community-based model for dealing with substance abuse
was implemented on a trial basis in Limpopo and North West,
while an aftercare and reintegration model was implemented in
Mpumalanga and Western Cape. A substance abuse prevention
model for adults was approved, and development of the treatment
model continued.
International Day against Drug Abuse and Illicit Trafficking
was observed in the Eastern Cape in June 2010. All relevant
stakeholders, including the community of Mdantsane, participated
in the event, which was led by the Minister of Social Development.
A community mobilisation programme was launched in Upington in
the Northern Cape in October 2010. Door to door visits coupled with
surveys were conducted in all nine provinces, aimed at creating
awareness of substance abuse and related challenges. The survey
was aimed at assessing community awareness of substance abuse,
and identifying ways of addressing this scourge. The door to door
campaign was followed by provincial substance abuse summits in
all provinces excluding KwaZulu-Natal and Mpumalanga.
Two youth dialogues were held in Gauteng and the Free State.
These were aimed at creating greater awareness of the dangers of
drug abuse among young people, and soliciting their participation
in substance abuse campaigns. An interdenominational women’s

PART B: PROGRAMME PERFORMANCE
Department of Social Development | Annual Report 2010/2011 65
prayer group was held in Free State province (Jacobsdal) in
October 2010 to help CBOs identify drug abuse, and play a part
in combating it.
The second Biennial Summit on Substance Abuse was held in
KwaZulu-Natal (Durban) in March 2011. It produced resolutions
guiding the development of a national drug master plan and the
Programme of Action for combating substance abuse.
FamiliesThe families programme contributes to government Outcome 8,
namely sustainable human settlements and improved quality of
household life, and also contributes towards achieving the sectoral
goal of supporting and strengthening family and community
interventions that foster social cohesion.
The Department drafted a Green Paper on Families which was
presented to departmental structures for approval. The Green
Paper provides strategic guidance on the integrated provision of
services to families. The Department also developed an integrated
plan for services to families, an integrated parenting framework,
and a monitoring and evaluation framework for services to families.
Service providers in all nine provinces were capacitated to
implement a manual on families in crises, a framework of positive
values, Strategy on Families, a manual of marriage preparation
and marriage enrichment, and family preservation services.
Victim empowermentA final report on developing legislation for victim support services
was completed. A costing model for a victim empowerment
programme was developed, aimed at standardising victim
empowerment services and funding. Costing models were also
developed for programmes involving older persons, children, people
with disabilities, social crime, substance abuse, and families. It is
aimed at promoting standardisation across the provinces.
Generic indicator sets (GIS) were piloted at 18 sites in three
provinces. The First phase pilot was conducted in Gauteng,
Limpopo and North West. The second phase is currently piloted in
Western Cape, Free State and KZN. These are aimed at developing
a culture of cluster reporting and standardising data collection tools
in the social sector. The preliminary findings were presented to the
Victim Empowerment Programme (VEP) International Conference
held in September to October 2010. A detailed pilot site analysis
was compiled.
Victim satisfaction survey instruments and data collection tools were
designed and tested in various facilities Provincial Field workers
were recruited and trained to conduct the survey such as One Stop
Centres, Thuthuzela hospitals and SAPS Victim Friendly Facilities.
A training needs assessment was conducted to determine
the sector’s capacity-building needs. Trauma counselling was
identified as a priority need, and the Department responded by
facilitating trauma counselling training in various government
departments and CSOs. A set target number was 1 800 officials
to be trained, significantly exceeding the target of 1 400. A
draft mentoring and coaching model was also developed. Four
provinces were nominated to test the model, and 78 government
officials and CSO’s were capacitated on the model.
The strategy for engaging men and boys in preventing gender-
based violence was implemented in all nine provinces. Three
clustering workshops were held, where 270 social workers
were trained to implement the strategy. Upon request, additional
workshops were held for service providers in KwaZulu-Natal,
Mpumalanga and North West. The strategy is aimed at involving
men and boys in achieving gender equality, with a special focus
on the prevention of gender-based violence.
A shelter strategy was implemented in all nine provinces. Three
clustering workshops were held where 270 social workers were
trained to implement the strategy. The Strategy aimed at guiding
service providers on how to render services to abused women in
shelters, and ensuring that their services adhere to the minimum
standards set out in the victim’s charter.
A Human Trafficking Rehabilitation Programme was developed
and rolled out to 13 identified shelters in all nine provinces.
Twenty-six staff members were trained to implement the
programme. The Programme was evaluated in November 2010
and found to be effective, as 76 victims could be registered
by March 2011. Draft regulations and minimum norms and
standards for accredited service providers to victims of human
trafficking were also developed. An awareness-raising event was
held in October 2010, aimed at increasing awareness of issues
surrounding human trafficking.

66 Annual Report 2010/2011 | Department of Social Development
PART B: PROGRAMME PERFORMANCE
Programme 3: Policy Development, Review and Implementation Support for Welfare Services
A Victims Charter week was observed in September 2010, aimed
at raising community awareness on the rights of victims of crime
and violence. The Department also supported the observance of
Victim Charter week in the Western Cape, Limpopo and North
West. A total of 110 service providers participated in these
community events.
The National campaign on 16 Days of Activism of No Violence
against Women and Children was commemorated in Khayelitsha,
in the Western Cape and Durban, in the KZN. Besides participating
in the national opening and closing events, the Department
formed a partnership with the Gauteng Department of Health and
Social Development to also commemorate the campaign in the
semi-rural area of Meyerton in the Sedibeng district in December
2010. The purpose of this campaign was to raise awareness on
the VEP services to disadvantaged areas.
A successful International VEP Conference was held in Limpopo
in October 2010. Its theme was ‘Accelerating Action towards
Integrated Service Delivery for Victims of Crime’. The conference
ended with resolutions adopted by 500 delegates, and a draft
programme of action was developed for implementation by the
cluster departments and civil society organisations.
A Business Requirement System for the victims register was
developed. A prototype framework system was developed for
capturing information on victims of crime and violence. Training
was planned and implemented for all departments in the JCPS
cluster. Not all departments participated, which delayed the
introduction of the register to the next financial year.
Guidelines for services to victims of domestic violence,
transnational and serious crime, and sexual offences were rolled
out and implemented in all nine provinces. Guidelines on services
to victims of human trafficking were awaiting the passing of the
Prevention and Combating of Trafficking in Persons Bill.
Children
The Children’s Act
The Children’s Act came into force on 1 April 2010, and was
launched by President Jacob Zuma at a child protection week
event in Atteridgeville in Gauteng on 21 May 2010. Norms,
standards and practice guidelines aimed at guiding the uniform
implementation of the Act were finalised. Practice Note 1 of 2010
was developed to assist with the implementation of the Act. The
biggest challenge is to ensure that the provincial Departments of
Social Development and other national departments responsible
for implementing the Act comply with the relevant norms and
standards.
Child Protection and Alternative Care
Parts A and B of the Child Protection Register (CPR) were introduced
as specified by the Children’s Act. Cases of abuse, neglect and
exploitation were entered in the register, and heard by Children’s
Courts. Enquiries were received from individuals and employees.
The research on 20 prevention and early intervention programmes
for benchmarking best practice models were completed. A
conceptual framework and methodology report for implementing a
national surveillance study of child abuse, exploitation and neglect
were developed.
A transformation strategy for child and youth care centres was
developed to ensure that they conform with the Children’s Act.
Norms and standards for cluster foster care were developed.
The Department experienced numerous challenges in respect
of implementing the new provisions of the Children’s Act,
which were compounded by the lack of social work service
professionals. Serious transition challenges arose in respect of the
new responsibility of the Department of Justice and Constitutional
Development for foster care and alternative care, where court
orders have to be extended by the Children’s Courts. The Chief
Directorate Children worked with the Department of Justice
Constitutional Development, South African Social Security Agency,
and the provincial departments to address these challenges.
Adoptions and International Social Services
The Register of Adoptable children and Prospective Adoptive
Parents (RACAP) was operationalised, and 740 parents and
936 children appeared on the Register. A total of 2 236 national
adoptions and 200 inter-country adoptions were registered. The
Department accredited 23 child protection organisations for
adoption services.
The Department continued its affiliation to International Social
Services (ISS) and gave effect to the affiliation contract of January
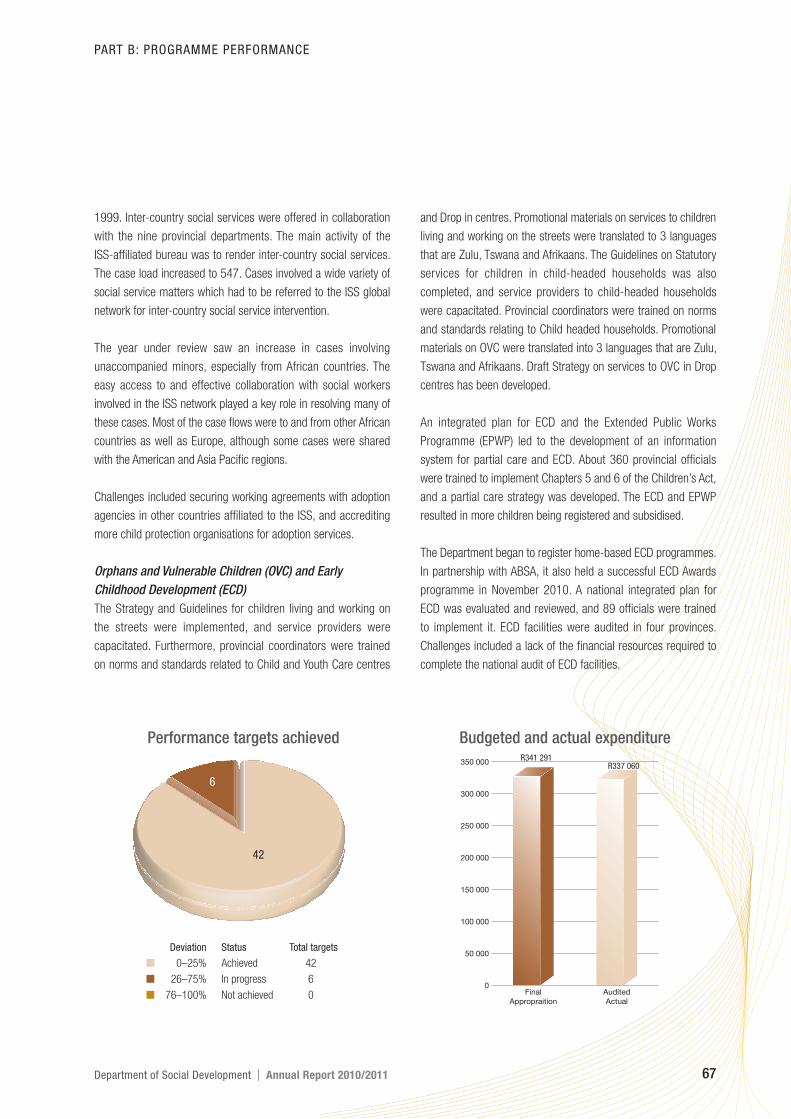
PART B: PROGRAMME PERFORMANCE
Department of Social Development | Annual Report 2010/2011 67
1999. Inter-country social services were offered in collaboration
with the nine provincial departments. The main activity of the
ISS-affiliated bureau was to render inter-country social services.
The case load increased to 547. Cases involved a wide variety of
social service matters which had to be referred to the ISS global
network for inter-country social service intervention.
The year under review saw an increase in cases involving
unaccompanied minors, especially from African countries. The
easy access to and effective collaboration with social workers
involved in the ISS network played a key role in resolving many of
these cases. Most of the case flows were to and from other African
countries as well as Europe, although some cases were shared
with the American and Asia Pacific regions.
Challenges included securing working agreements with adoption
agencies in other countries affiliated to the ISS, and accrediting
more child protection organisations for adoption services.
Orphans and Vulnerable Children (OVC) and Early
Childhood Development (ECD)
The Strategy and Guidelines for children living and working on
the streets were implemented, and service providers were
capacitated. Furthermore, provincial coordinators were trained
on norms and standards related to Child and Youth Care centres
and Drop in centres. Promotional materials on services to children
living and working on the streets were translated to 3 languages
that are Zulu, Tswana and Afrikaans. The Guidelines on Statutory
services for children in child-headed households was also
completed, and service providers to child-headed households
were capacitated. Provincial coordinators were trained on norms
and standards relating to Child headed households. Promotional
materials on OVC were translated into 3 languages that are Zulu,
Tswana and Afrikaans. Draft Strategy on services to OVC in Drop
centres has been developed.
An integrated plan for ECD and the Extended Public Works
Programme (EPWP) led to the development of an information
system for partial care and ECD. About 360 provincial officials
were trained to implement Chapters 5 and 6 of the Children’s Act,
and a partial care strategy was developed. The ECD and EPWP
resulted in more children being registered and subsidised.
The Department began to register home-based ECD programmes.
In partnership with ABSA, it also held a successful ECD Awards
programme in November 2010. A national integrated plan for
ECD was evaluated and reviewed, and 89 officials were trained
to implement it. ECD facilities were audited in four provinces.
Challenges included a lack of the financial resources required to
complete the national audit of ECD facilities.
Performance targets achieved
Deviation Status Total targets
■ 0–25% Achieved 42
■ 26–75% In progress 6
■ 76–100% Not achieved 0
6
42
0
50 000
100 000
150 000
200 000
250 000
300 000
350 000
AuditedActual
FinalAppropraition
Budgeted and actual expenditure
R337 060R341 291

68 Annual Report 2010/2011 | Department of Social Development
Pro
gra
mm
e 3: P
oli
cy D
evel
op
men
t, R
evie
w a
nd
Im
ple
men
tati
on
Su
pp
ort
fo
r W
elfa
re S
ervi
ces
Key
ou
tpu
ts a
nd
ser
vice
del
iver
y in
dic
ator
s
Mea
sura
ble
ob
ject
ives
: To
crea
te a
n en
ablin
g en
viro
nmen
t fo
r th
e de
liver
y of
equ
itabl
e de
velo
pmen
tal w
elfa
re s
ervi
ces
thro
ugh
the
form
ulat
ion
of p
olic
ies,
sta
ndar
ds, b
est
prac
tice,
and
sup
port
to
soci
al
serv
ice
prov
ider
s.
Goa
lTo
sup
port
and
str
engt
hen
fam
ily a
nd c
omm
unity
inte
rven
tions
tha
t fo
ster
soc
ial c
ohes
ion
Ou
tcom
eA
n ef
ficie
nt, e
ffec
tive
and
deve
lopm
ent-
orie
nted
pub
lic s
ervi
ce, a
nd a
n em
pow
ered
, fai
r an
d in
clus
ive
citiz
ensh
ip
Fun
ctio
nal
are
asS
trat
egic
ob
ject
ive
Bas
elin
eP
erfo
rman
ce in
dic
ator
Targ
etA
ctu
al o
utp
uts
% d
evia
tion
from
tar
get
Wel
fare
ser
vice
tran
sfor
mat
ion
Ret
ain
and
recr
uit
soci
al s
ervi
ce
prof
essi
onal
s at
app
ropr
iate
leve
ls, a
nd e
nhan
ce t
heir
abili
ty
to s
uppo
rt h
ouse
hold
s an
d
com
mun
ities
Rec
ruitm
ent
and
rete
ntio
n
stra
tegy
Pol
icy
on s
chol
arsh
ip
In 2
010 s
chol
arsh
ips
wer
e pr
ovid
ed t
o 6 0
26
bene
ficia
ries
Num
ber
of s
tude
nts
awar
ded
scho
lars
hips
Att
ritio
n ra
te f
or s
ocia
l
serv
ice
prof
essi
onal
s
Refi
ned
supe
rvis
ion
fram
ewor
k
for
soci
al w
ork
prof
essi
on
Impl
emen
t st
rate
gyTh
e sc
hola
rshi
p pr
ogra
mm
e fo
rmin
g pa
rt o
f th
e re
tent
ion
and
recr
uitm
ent
stra
tegy
was
impl
emen
ted
as f
ollo
ws:
–
5 5
74
soc
ial w
ork
stud
ents
wer
e gi
ven
burs
arie
s.
–
1 1
77
stu
dent
s gr
adua
ted
and
wer
e ab
sorb
ed in
to
empl
oym
ent.
–
A s
uper
visi
on f
ram
ewor
k w
as d
evel
oped
and
dis
cuss
ed
with
nat
iona
l sta
keho
lder
s.
0%
Goa
lTo
impr
ove
soci
al w
elfa
re s
ervi
ces
to o
lder
peo
ple,
incl
udin
g th
ose
in n
eed
of c
are
and
prot
ectio
n
Ou
tcom
eS
usta
inab
le h
uman
set
tlem
ents
, and
impr
oved
qua
lity
of h
ouse
hold
life
Fun
ctio
nal
are
asS
trat
egic
ob
ject
ive
Bas
elin
eP
erfo
rman
ce in
dic
ator
Targ
etA
ctu
al o
utp
uts
% d
evia
tion
from
tar
get
Wel
fare
ser
vice
tran
sfor
mat
ion
Tran
sfor
m lu
nche
on c
lubs
/ser
vice
cent
res
into
com
mun
ity-b
ased
care
and
sup
port
ser
vice
s
Old
er P
erso
ns A
ct, N
o 13
of 2
006
Nor
ms
and
stan
dard
s fo
r
com
mun
ity-b
ased
car
e
Mad
rid In
tern
atio
nal P
lan
of
Act
ion
on A
gein
g
Num
ber
of lu
nche
on c
lubs
/
serv
ice
cent
res
tran
sfor
med
into
com
mun
ity-b
ased
car
e
and
supp
ort
serv
ices
Com
plet
ion
of a
situ
atio
nal
anal
ysis
rep
ort
Com
plet
e si
tuat
iona
l ana
lysi
s
of c
omm
unity
-bas
ed c
are
serv
ices
Pilo
t im
plem
enta
tion
of
norm
s an
d st
anda
rds
in t
wo
com
mun
ities
in K
ZN
Situ
atio
nal a
naly
ses
wer
e co
nclu
ded
in f
our
prov
ince
s,
nam
ely
the
Free
Sta
te, N
orth
ern
Cap
e, W
este
rn C
ape
and
KZN
Age
in A
ctio
n w
as a
ppoi
nted
to
unde
rtak
e th
e pi
lot
proj
ect
40
%1

Department of Social Development | Annual Report 2010/2011 69
Wel
fare
ser
vice
tran
sfor
mat
ion
Dev
elop
inte
rgen
erat
iona
l
prog
ram
mes
Nor
ms
and
stan
dard
s fo
r
com
mun
ity-b
ased
car
e
Com
plet
ion
of a
n au
dit
repo
rt o
n in
terg
ener
atio
nal
prog
ram
mes
.
Num
ber
of in
terg
ener
atio
nal
prog
ram
mes
dev
elop
ed.
Num
ber
of c
lient
s pa
rtic
ipat
ing
in th
e in
terg
ener
atio
nal
prog
ram
mes
Aud
it in
terg
ener
atio
nal
prog
ram
mes
Two
inte
rgen
erat
iona
l pro
gram
mes
dev
elop
ed in
KZN
, and
70
clie
nts
part
icip
ated
in t
he p
rogr
amm
e.
0%
Dev
elop
Sou
th A
fric
an P
lan
of
Act
ion
on A
gein
g
Mad
rid In
tern
atio
nal P
lan
of
Act
ion
on A
gein
g
Sou
th A
fric
an P
lan
of A
ctio
n
on A
gein
g
Dev
elop
Sou
th A
fric
an
Plan
of A
ctio
n, g
uide
lines
for
impl
emen
tatio
n, a
nd
mon
itorin
g to
ol
Gui
delin
es f
or im
plem
entin
g th
e S
outh
Afr
ican
Pla
n of
Act
ion
on A
gein
g w
ere
com
plet
ed
0%
Rea
son
s fo
r d
evia
tion
1D
ue t
o a
lack
of
capa
city
, the
nor
ms
and
stan
dard
s co
uld
not
be p
ilote
d in
all
prov
ince
s. T
his
proc
ess
was
due
to
be f
unde
d vi
a th
e N
GO
Age
in A
ctio
n in
the
nex
t fin
anci
al y
ear.
Goa
lTo
pro
tect
and
pro
mot
e th
e rig
hts
of p
eopl
e w
ith d
isab
ilitie
s
Ou
tcom
eS
usta
inab
le h
uman
set
tlem
ents
, and
impr
oved
qua
lity
of h
ouse
hold
life
Fun
ctio
nal
are
asS
trat
egic
ob
ject
ive
Bas
elin
eP
erfo
rman
ce in
dic
ator
Targ
etA
ctu
al o
utp
uts
% d
evia
tion
from
tar
get
Wel
fare
ser
vice
tran
sfor
mat
ion
Dev
elop
pol
icie
s an
d le
gisl
atio
n on
serv
ices
to
peop
le w
ith d
isab
ilitie
s
UN
Con
vent
ion
on t
he R
ight
s
of P
erso
ns w
ith D
isab
ilitie
s
Alig
nmen
t of
pol
icy
on
disa
bilit
y w
ith t
he U
N
Con
vent
ion
Am
alga
mat
e an
d al
ign
polic
y
on d
isab
ility
with
the
UN
Con
vent
ion
The
polic
y w
as d
evel
oped
and
fina
lised
0%
DSD
pol
icie
s, p
rogr
amm
es,
and
serv
ices
aud
it re
port
Com
plet
ion
of r
epor
t on
the
alig
nmen
t of
DSD
pol
icie
s
and
prog
ram
mes
with
the
UN
Con
vent
ion
Com
plet
e re
port
on
alig
nmen
t
of D
SD
pol
icie
s, p
rogr
amm
es
and
serv
ices
with
the
UN
Con
vent
ion
A q
uest
ionn
aire
was
dev
elop
ed, c
onsu
lted,
and
fina
lised
50
%1
DSD
pol
icy
on d
isab
ility
Inte
rnat
iona
l dis
abili
ty
mai
nstr
eam
boo
klet
Com
plet
ion
of d
isab
ility
mai
nstr
eam
ing
stra
tegy
Dev
elop
DSD
-spe
cific
disa
bilit
y m
ains
trea
min
g
stra
tegy
A fu
ndin
g pr
opos
al fo
r de
velo
ping
a s
trat
egy
and
trai
ning
offic
ials
was
sub
mitt
ed to
USA
ID a
nd J
ICA
.
Sen
ior
man
ager
s w
ere
fam
iliar
ised
with
the
UN
Con
vent
ion
prio
r to
dev
elop
ing
a st
rate
gy
50
%2
Rea
son
s fo
r d
evia
tion
1 T
his
proc
ess
was
del
ayed
by
the
need
to
deve
lop
a da
ta c
olle
ctio
n to
ol.
2 T
his
proc
ess
was
del
ayed
by
the
need
to
cons
ult
and
build
the
cap
acity
of
seni
or m
anag
ers
befo
re t
he s
trat
egy
coul
d be
dev
elop
ed.

70 Annual Report 2010/2011 | Department of Social Development
Pro
gra
mm
e 3: P
oli
cy D
evel
op
men
t, R
evie
w a
nd
Im
ple
men
tati
on
Su
pp
ort
fo
r W
elfa
re S
ervi
ces
Goa
lTo
impr
ove
sect
or p
erfo
rman
ce t
hrou
gh r
igor
ous
rese
arch
, pla
nnin
g an
d bu
sine
ss p
roce
ss im
prov
emen
t
Ou
tcom
eA
n ef
ficie
nt, e
ffec
tive
and
deve
lopm
ent-
orie
nted
wor
kfor
ce in
the
sec
tor
Fun
ctio
nal
are
asS
trat
egic
ob
ject
ive
Bas
elin
eP
erfo
rman
ce in
dic
ator
Targ
etA
ctu
al o
utp
uts
% d
evia
tion
from
tar
get
Wel
fare
ser
vice
tran
sfor
mat
ion
Impr
ove
soci
al d
evel
opm
ent
busi
ness
pro
cess
es
Bas
elin
e st
udy
of e
xist
ing
polic
y an
d le
gisl
ativ
e
fram
ewor
k
Gap
ana
lysi
s of
bus
ines
s
map
ping
for
soc
ial w
elfa
re
serv
ices
Red
esig
n of
bus
ines
s
proc
ess
map
ping
for
soc
ial
wel
fare
ser
vice
s
Red
esig
n bu
sine
ss p
roce
ss
map
ping
for
soc
ial w
elfa
re
serv
ices
Bus
ines
s pr
oces
ses
for
prov
idin
g so
cial
wel
fare
ser
vice
s
wer
e fin
alis
ed a
nd d
ocum
ente
d
A d
raft
hum
an r
esou
rces
mod
el f
or d
eliv
erin
g so
cial
wel
fare
serv
ices
was
dev
elop
ed a
nd d
iscu
ssed
with
the
sec
tor
An
arch
itect
ural
fra
mew
ork
for
soci
al w
elfa
re s
ervi
ces
was
deve
lope
d
Gen
eric
nor
ms
and
stan
dard
s fo
r so
cial
wel
fare
ser
vice
s
wer
e de
velo
ped
and
cost
ed
1 0
00
sta
keho
lder
s w
ere
trai
ned
to im
plem
ent
busi
ness
proc
esse
s an
d no
rms
and
stan
dard
s fo
r so
cial
wel
fare
serv
ices
0%
Dep
artm
enta
l pol
icie
s an
d
legi
slat
ive
fram
ewor
k
Bat
ho P
ele
prin
cipl
es
Thre
e hu
man
rig
hts
acts
Refi
ned
fram
ewor
k fo
r
man
agin
g an
d pr
omot
ing
hum
an r
ight
s
Refi
ne d
raft
fra
mew
ork
for
man
agin
g an
d pr
omot
ing
hum
an r
ight
s
The
draf
t fr
amew
ork
was
refi
ned
at in
tern
al a
nd e
xter
nal
wor
ksho
ps w
ith k
ey s
take
hold
ers
0%
Num
ber
of s
ocia
l ser
vice
prof
essi
onal
s tr
aine
d to
impl
emen
t th
e le
gisl
ativ
e
fram
ewor
k fo
r hu
man
rig
hts
Reo
rient
and
tra
in s
ocia
l
serv
ice
prof
essi
onal
s on
the
legi
slat
ive
fram
ewor
k fo
r
hum
an r
ight
s
62
8 o
ffici
als
wer
e tr
aine
d on
the
Pro
mot
ion
of A
cces
s to
Just
ice
Act
(PA
JA),
and
1 8
91
soc
ial s
ervi
ce p
rofe
ssio
nals
wer
e tr
aine
d on
eth
ics
and
hum
an r
ight
s
0%
Soc
ial S
ervi
ces
Pro
fess
iona
ls
Act
, 1978
Com
plet
ion
of d
raft
pol
icy
on
soci
al s
ervi
ces
prof
essi
ons
and
occu
patio
ns
Dev
elop
pol
icy
on s
ocia
l
serv
ices
pro
fess
ions
and
occu
patio
ns
A d
raft
pol
icy
was
dev
elop
ed a
nd p
repa
red
for
final
cons
ulta
tions
0%
Pol
icy
on fi
nanc
ial a
war
ds t
o
serv
ice
prov
ider
s
Com
plet
ion
of r
evis
ed p
olic
y
on fi
nanc
ial a
war
ds to
ser
vice
prov
ider
s (P
FA)
Con
sult
on a
nd r
evie
w p
olic
y
on P
FA
The
polic
y w
as r
evie
wed
and
app
rove
d by
MIN
MEC
for
impl
emen
tatio
n in
20
11
/12
0%
Dra
ft p
olic
y on
the
pro
visi
on
of s
ocia
l wel
fare
ser
vice
s
Com
plet
ion
of p
olic
y on
the
prov
isio
n of
soc
ial w
elfa
re
serv
ices
Refi
ne d
raft
pol
icy
The
polic
y w
as r
evie
wed
and
con
solid
ated
with
the
PFA
0%

Department of Social Development | Annual Report 2010/2011 71
Goa
lTo
inve
st in
and
ens
ure
the
prov
isio
n of
hig
h-qu
ality
soc
ial w
elfa
re s
ervi
ces
to c
hild
ren,
incl
udin
g th
ose
in n
eed
of c
are
and
prot
ectio
n
Ou
tcom
eA
ll pe
ople
in S
outh
Afr
ica
are
and
feel
saf
e
Fun
ctio
nal
are
asS
trat
egic
ob
ject
ive
Bas
elin
eP
erfo
rman
ce in
dic
ator
Targ
etA
ctu
al o
utp
uts
% d
evia
tion
from
tar
get
Chi
ldre
nP
rom
ote
and
stre
ngth
en c
hild
prot
ectio
n se
rvic
es
500 c
hild
abu
se c
ases
ente
red
in P
art A
of
the
Chi
ld
Pro
tect
ion
Reg
iste
r (C
PR
)
Num
ber
of c
hild
abu
se,
negl
ect
and
expl
oita
tion
case
s on
the
CPR
Num
ber
of p
erso
ns u
nsui
tabl
e
to w
ork
with
chi
ldre
n sc
reen
ed
and
plac
ed o
n th
e C
PR.
Impl
emen
t C
PR
Part
A o
f C
PR
:
1 1
73
cas
es o
f ab
use
repo
rted
83
7 e
nqui
ries
rece
ived
fro
m in
divi
dual
s
64
con
vict
ions
ent
ered
Nin
e ch
ildre
n’s
cour
t fin
ding
s
Nin
e pr
ovin
ces
visi
ted
and
mon
itore
d
Part
B o
f C
PR
:
One
cas
e of
uns
uita
bilit
y
85
enq
uirie
s re
ceiv
ed f
rom
indi
vidu
als
71
0 e
nqui
ries
rece
ived
fro
m e
mpl
oyer
s
Nin
e di
scip
linar
y fo
rum
s w
ere
iden
tified
and
ent
ered
ont
o
the
data
base
.
0%
No
conc
eptu
al f
ram
ewor
k fo
r
prog
ram
mes
for
pre
vent
ing
child
abu
se, n
egle
ct a
nd
expl
oita
tion
Num
ber
of s
tand
ardi
sed
prog
ram
mes
for
the
prev
entio
n an
d ea
rly
inte
rven
tion
on c
hild
abu
se
and
negl
ect
Dev
elop
pro
gram
mes
for
prev
entin
g ch
ild a
buse
,
negl
ect
and
expl
oita
tion
20
pre
vent
ion
and
early
inte
rven
tion
prog
ram
mes
wer
e
asse
ssed
.
A r
epor
t w
as c
ompl
eted
on
the
conc
eptu
al f
ram
ewor
k,
prac
tical
gui
delin
es, a
nd r
ecom
men
datio
ns f
or s
tand
ardi
sing
and
scal
ing
up p
reve
ntio
n an
d ea
rly in
terv
entio
n
prog
ram
mes
.
50
%1
Con
cept
pap
er f
or n
atio
nal
surv
eilla
nce
stud
y of
chi
ld
abus
e, e
xplo
itatio
n an
d
negl
ect
Com
plet
ion
of p
ilot
for
natio
nal s
urve
illan
ce s
tudy
of c
hild
abu
se, e
xplo
itatio
n
and
negl
ect
Com
plet
e pi
lot
for
natio
nal
surv
eilla
nce
stud
y of
chi
ld
abus
e, e
xplo
itatio
n an
d
negl
ect
This
is a
five
-yea
r pr
ojec
t. Th
e fir
st p
hase
was
com
plet
ed.
0%
Rea
son
s fo
r d
evia
tion
1 R
esea
rch
on t
he p
reve
ntio
n an
d ea
rly in
terv
entio
n pr
ogra
mm
es w
as c
ompl
eted
, and
the
res
ults
info
rmed
the
dev
elop
men
t of
a g
ood
prac
tice
mod
el. T
he b
ench
mar
king
and
sta
ndar
disa
tion
proc
ess
was
stil
l und
er w
ay.

72 Annual Report 2010/2011 | Department of Social Development
Pro
gra
mm
e 3: P
oli
cy D
evel
op
men
t, R
evie
w a
nd
Im
ple
men
tati
on
Su
pp
ort
fo
r W
elfa
re S
ervi
ces
Goa
lTo
inve
st in
and
ens
ure
the
prov
isio
n of
hig
h-qu
ality
soc
ial w
elfa
re s
ervi
ces
to c
hild
ren,
incl
udin
g th
ose
in n
eed
of c
are
and
prot
ectio
n
Ou
tcom
eS
usta
inab
le h
uman
set
tlem
ents
, and
impr
oved
qua
lity
of li
fe
Fun
ctio
nal
are
asS
trat
egic
ob
ject
ive
Bas
elin
eP
erfo
rman
ce in
dic
ator
Targ
etA
ctu
al o
utp
uts
% d
evia
tion
from
tar
get
Chi
ldre
nP
rom
ote
and
stre
ngth
en c
hild
prot
ectio
n se
rvic
es
Str
ateg
y do
cum
ent
Com
plet
ion
of a
tran
sfor
mat
ion
stra
tegy
for
Chi
ld a
nd Y
outh
Car
e C
entr
es
(CYC
C’s
)
Dev
elop
tra
nsfo
rmat
ion
stra
tegy
for
CYC
C’s
A t
rans
form
atio
n st
rate
gy f
or C
YCC
’s w
as d
evel
oped
.0
%
510 7
13 c
hild
ren
in f
oste
r
care
Com
plet
ion
of p
ilot
repo
rt o
n
clus
ter
fost
er c
are
mod
els
Com
plet
e pi
lot
repo
rt o
n
clus
ter
fost
er c
are
mod
els
Nor
ms
and
stan
dard
s an
d gu
idel
ines
wer
e de
velo
ped
for
clus
ter
fost
er c
are.
Four
pro
vinc
es w
ere
iden
tified
as
site
s fo
r pi
lotin
g th
e
clus
ter
fost
er c
are
mod
els.
A c
lust
er f
oste
r ca
re c
once
pt d
ocum
ent
was
com
plet
ed. A
deci
sion
was
tak
en t
o pi
lot
the
mod
el in
fou
r pr
ovin
ces.
Thi
s
proc
ess
is s
till u
nder
way
.
50
%1
Impl
emen
t th
e C
hild
ren’
s A
ct43 s
ectio
ns o
f th
e
Chi
ldre
n’sA
ct
Impl
emen
tatio
n of
315
sect
ions
of
the
Chi
ldre
n’s
Act
Impl
emen
t th
e C
hild
ren’
s A
ctTh
e C
hild
ren’
s A
ct c
ame
into
ope
ratio
n on
1 A
pril
20
10
.
Num
erou
s st
eps
wer
e ta
ken
to im
plem
ent
the
Act
incl
udin
g
the
deve
lopm
ent
of a
n im
plem
enta
tion
plan
with
indi
cato
rs.
Cap
acity
bui
ldin
g w
orks
hops
wer
e he
ld a
nd t
he n
ine
prov
ince
s w
ere
visi
ted
to a
ssis
t an
d su
ppor
t th
em w
ith t
he
impl
emen
tatio
n.
0%
Nor
ms
and
stan
dard
s fo
r
impl
emen
ting
Chi
ldre
n’s
Act
Com
plia
nce
with
nor
ms
and
stan
dard
s by
pro
vinc
es a
nd
serv
ice
prov
ider
s
Sec
ure
com
plia
nce
with
norm
s an
d st
anda
rds,
stra
tegi
es, a
nd t
he
tran
sfor
mat
ion
of s
ervi
ces
and
prog
ram
mes
Nor
ms,
sta
ndar
ds a
nd p
ract
ice
guid
elin
es w
ere
final
ised
and
dist
ribut
ed t
o al
l pro
vinc
es.
We
deve
lope
d an
d di
strib
uted
fram
ewor
ks fo
r th
e de
velo
pmen
t
of p
olic
ies,
str
ateg
ies,
pra
ctic
e gu
idel
ines
, pro
vinc
ial p
rofil
es
and
capa
city
-bui
ldin
g pa
ckag
e to
ens
ure
the
unifo
rm
impl
emen
tatio
n of
the
norm
s an
d st
anda
rds
0%
Trai
ning
gui
delin
esN
umbe
r of
pro
vinc
es a
nd
serv
ice
prov
ider
s tr
aine
d to
impl
emen
t th
e C
hild
ren’
s A
ct
Bui
ld c
apac
ity t
o
impl
emen
t th
e C
hild
ren’
s
Act
, reg
ulat
ions
, nor
ms
and
stan
dard
s, p
ract
ice
guid
elin
es, a
nd in
dica
tors
40
sta
ff m
embe
rs w
ere
trai
ned
to im
plem
ent
the
norm
s an
d
stan
dard
s.
Nin
e pr
ovin
cial
vis
its w
ere
cond
ucte
d, a
nd 8
47
peo
ple,
incl
udin
g se
rvic
e pr
ovid
ers,
wer
e ca
paci
tate
d.
0%

Department of Social Development | Annual Report 2010/2011 73
Chi
ldre
nD
evel
op w
elfa
re p
olic
ies
and
stra
tegi
es f
or o
rpha
ns a
nd
vuln
erab
le c
hild
ren,
incl
udin
g
thos
e w
orki
ng a
nd li
ving
on
the
stre
ets
(CLW
S)
Str
ateg
y fo
r pr
ovid
ing
serv
ices
to
Chi
ldre
n Li
ving
and
Wor
king
on
the
Str
eets
(CLW
S)
Num
ber
of t
rain
ing
sess
ions
on im
plem
entin
g C
LWS
stra
tegy
Str
ateg
y an
d gu
idel
ines
tran
slat
ed in
to t
hree
offi
cial
lang
uage
s
Ass
essm
ent o
f im
plem
enta
tion
in n
ine
prov
ince
s
Impl
emen
t st
rate
gyN
ine
trai
ning
ses
sion
s w
ere
held
one
in e
ach
prov
ince
.
The
prom
otio
nal m
ater
ials
on
CLW
S t
rans
late
d in
to t
hree
lang
uage
s th
at a
re Z
ulu,
Tsw
ana
and
Afr
ikaa
ns a
nd h
ave
been
dis
trib
uted
to
the
prov
ince
s.
Pre
sent
atio
n do
ne o
n th
e as
sess
men
t of
the
impl
emen
tatio
n
of t
he s
trat
egy
durin
g th
e C
CP
F m
eetin
gs.
All
prov
ince
s w
ere
trai
ned
on t
he N
atio
nal T
rans
form
atio
n
plan
s of
she
lters
into
CYC
C.
0%
Pol
icy
fram
ewor
k an
d
guid
elin
es f
or p
rovi
ding
stat
utor
y se
rvic
es t
o ch
ild-
head
ed h
ouse
hold
s
Com
plet
ion
of a
ppro
ved
polic
y fr
amew
ork
and
guid
elin
es
App
rove
pol
icy
fram
ewor
k
and
guid
elin
es
Gui
delin
es w
ere
appr
oved
, prin
ted,
and
mad
e av
aila
ble.
Pro
mot
iona
l mat
eria
ls o
n O
VC t
rans
late
d in
to t
hree
lang
uage
s th
at a
re Z
ulu,
Afr
ikaa
ns a
nd T
swan
a an
d
dist
ribut
ed t
o th
e pr
ovin
ces.
Trai
ning
ses
sion
s on
the
Gui
delin
es w
ere
held
in a
ll ni
ne
prov
ince
s.
0%
Chi
ldre
n’s
Act
Com
plet
ion
of s
trat
egy
prov
idin
g se
rvic
es t
o O
rpha
ns
and
Vuln
erab
le C
hild
ren
(OVC
) at
drop
-in
cent
res
Dev
elop
str
ateg
y fo
r pr
ovid
ing
serv
ices
to O
VC a
t dro
p-in
cent
res
A d
raft
Str
ateg
y w
as d
evel
oped
and
is a
wai
ting
for
appr
oval
durin
g th
e ne
xt fi
nanc
ial y
ear.
0%
Dev
elop
and
impl
emen
t st
rate
gy
for
expa
ndin
g ad
optio
n se
rvic
es
2 5
00 a
dopt
ions
reg
iste
red
a ye
ar
Ado
ptio
n st
rate
gy
Res
earc
h re
port
Num
ber
of n
atio
nal a
dopt
ions
Num
ber
of in
ter-
coun
try
adop
tions
Num
ber
of s
taff
tra
ined
and
capa
cita
ted
to im
plem
ent
prac
tice
guid
elin
es f
or in
ter-
coun
try
adop
tions
Num
ber
of c
hild
pro
tect
ion
orga
nisa
tions
acc
redi
ted
to
prov
ide
adop
tion
serv
ices
Impl
emen
t ad
optio
n st
rate
gy2
23
6 n
atio
nal a
dopt
ions
wer
e re
gist
ered
.
20
0 in
ter-
coun
try
adop
tions
wer
e re
gist
ered
.
50
0 o
ffici
als
in e
ight
pro
vinc
es w
ere
capa
cita
ted
on t
he
prac
tice
guid
elin
es o
n in
ter-
coun
try
adop
tions
.
23
ado
ptio
n se
rvic
e pr
ovid
ers
wer
e ev
alua
ted
and
reco
mm
ende
d fo
r ac
cred
itatio
n fo
r na
tiona
l and
/or
inte
r-
coun
try
adop
tions
.
0%
Inte
rnat
iona
l Soc
ial S
ervi
ces
(ISS) p
ract
ice
guid
elin
es
Num
ber
of s
taff
tra
ined
and
capa
cita
ted
on IS
S g
uide
lines
Impl
emen
t IS
S p
rogr
amm
e
and
guid
elin
es o
n IS
S
50
0 o
ffici
als
in n
ine
prov
ince
s w
ere
capa
cita
ted
to
impl
emen
t th
e IS
S g
uide
lines
.
0%
Gui
delin
es f
or m
anag
ing
unac
com
pani
ed m
inor
child
ren
Num
ber
of s
taff
tra
ined
on
Gui
delin
es f
or m
anag
ing
unac
com
pani
ed m
inor
child
ren
Impl
emen
t gu
idel
ines
50
0 o
ffici
als
wer
e ca
paci
tate
d on
una
ccom
pani
ed m
inor
s
in n
ine
prov
ince
s.
0%
Rea
son
s fo
r d
evia
tion
1 A
clu
ster
fos
ter
care
con
cept
doc
umen
t w
as c
ompl
eted
. A d
ecis
ion
was
tak
en t
o pi
lot
the
mod
el in
fou
r pr
ovin
ces.
Thi
s pr
oces
s is
stil
l und
er w
ay.

74 Annual Report 2010/2011 | Department of Social Development
Pro
gra
mm
e 3: P
oli
cy D
evel
op
men
t, R
evie
w a
nd
Im
ple
men
tati
on
Su
pp
ort
fo
r W
elfa
re S
ervi
ces
Goa
lTo
inve
st in
and
ens
ure
the
prov
isio
n of
hig
h-qu
ality
soc
ial w
elfa
re s
ervi
ces
to c
hild
ren,
incl
udin
g th
ose
in n
eed
of c
are
and
prot
ectio
n
Ou
tcom
eQ
ualit
y ba
sic
educ
atio
n
Fun
ctio
nal
are
asS
trat
egic
ob
ject
ive
Bas
elin
eP
erfo
rman
ce in
dic
ator
Targ
etA
ctu
al o
utp
uts
% d
evia
tion
from
tar
get
Chi
ldre
nD
evel
op E
arly
Chi
ldho
od
Dev
elop
men
t (E
CD
) pro
gram
me
Chi
ldre
n’s
Act
Com
plet
ion
of p
artia
l car
e
stra
tegy
for
chi
ldre
n
Dev
elop
par
tial c
are
stra
tegy
for
child
ren
Dra
ft P
artia
l Car
e S
trat
egy
deve
lope
d.
Dev
elop
ed n
orm
s an
d st
anda
rds
for
Par
tial C
are
and
ECD
serv
ices
in A
pril
20
10
.
0%
Exis
ting
mod
els
for
hom
e-
base
d EC
D
Num
ber
of c
hild
ren
bene
fitin
g
from
hom
e-ba
sed
ECD
Impl
emen
t ho
me-
base
d EC
D
stra
tegy
11
47
0 c
hild
ren
wer
e re
gist
ered
as
part
of
the
hom
e-ba
sed
ECD
pro
gram
me.
The
Dep
artm
ent
visi
ted
four
org
anis
atio
ns w
hich
impl
emen
t
hom
e-ba
sed
care
man
agem
ent
(HB
CM
) in
orde
r to
ass
ess
whe
ther
the
ir m
odel
s ar
e su
ited
to r
eplic
atio
n in
oth
er a
reas
.
A r
epor
t w
as p
repa
red
and
a dr
aft
stra
tegy
for
hom
e-ba
sed
ECD
was
dev
elop
ed.
89
offi
cial
s w
ere
trai
ned
as p
aren
ting
trai
ners
as
part
of
the
hom
e-ba
sed
ECD
Pro
gram
me.
0%
Aud
it fr
amew
ork
Com
plet
ion
of a
udit
repo
rt
on p
artia
l car
e an
d EC
D
prog
ram
mes
Aud
it of
par
tial c
are
and
ECD
prog
ram
mes
Aud
its o
f pa
rtia
l car
e an
d EC
D p
rogr
amm
es w
ere
com
plet
ed
in f
our
prov
ince
s.
The
Dep
artm
ent
aske
d U
NIC
EF a
nd U
SA
ID t
o fu
nd t
he
com
plet
ion
of t
he a
udit
in t
he o
ther
five
pro
vinc
es.
50
%1
Rea
son
s fo
r d
evia
tion
1 T
he a
udit
coul
d no
t be
com
plet
ed in
the
oth
er fi
ve p
rovi
nces
due
to
a la
ck o
f fu
nds.

Department of Social Development | Annual Report 2010/2011 75
Goa
lTo
red
uce
subs
tanc
e ab
use
Ou
tcom
eIm
prov
ed s
ubst
ance
abu
se s
ervi
ces
and
prog
ram
mes
Fun
ctio
nal
are
asS
trat
egic
ob
ject
ive
Bas
elin
eP
erfo
rman
ce in
dic
ator
Targ
etA
ctu
al o
utp
uts
% d
evia
tion
from
tar
get
Sub
stan
ce a
buse
Inte
nsify
the
figh
t ag
ains
t cr
ime
and
corr
uptio
n
Ant
i-dr
ugs
and
alco
hol
prog
ram
me
Num
ber
of s
ervi
ce p
rovi
ders
impl
emen
ting
anti-
drug
and
alco
hol p
rogr
amm
es
Rol
l out
pro
gram
me
in
prov
ince
s
Inte
rnat
iona
l Day
aga
inst
Dru
g A
buse
and
Illic
it Tr
affic
king
was
com
mem
orat
ed o
n th
e 2
6 J
une
20
10
in t
he E
aste
rn
Cap
e.
Foet
al A
lcoh
ol S
yndr
ome
Inda
ba h
eld
in G
aute
ng o
n th
e 1
8
– 1
9 N
ovem
ber
20
10
.
Cap
acity
bui
ldin
g w
orks
hop
cond
ucte
d in
KZN
and
Eas
tern
Cap
e in
Nov
embe
r 2
01
0.
A c
omm
unity
mob
ilisa
tion
prog
ram
me
was
laun
ched
in t
he
Nor
ther
n C
ape
on 2
6 J
une
20
10
.
A d
oor
to d
oor
cam
paig
n w
as s
tage
d in
all
prov
ince
s ex
cept
KZN
and
Mpu
mal
anga
.
Yout
h di
alog
ues
wer
e he
ld in
Gau
teng
and
the
Fre
e S
tate
.
An
inte
rden
omin
atio
nal w
omen
’s p
raye
r gr
oup
conf
eren
ce
was
hel
d in
the
Fre
e S
tate
.
Lead
ersh
ip a
nd s
uppo
rt w
as p
rovi
ded
for
the
seco
nd
Sub
stan
ce A
buse
Sum
mit,
hel
d in
KZN
on
14
– 1
6 M
arch
20
11
.
Wor
ksho
ps w
ere
held
at
scho
ols
in L
impo
po a
nd N
orth
Wes
t
as p
art
of t
he c
ampa
ign
rollo
ut.
0%
The
Pre
vent
ion
and
Trea
tmen
t of
Sub
stan
ce
Abu
se A
ct, 2
008
Com
plet
ion
of r
egul
atio
ns
unde
r th
e Pre
vent
ion
of a
nd
Trea
tmen
t fo
r Sub
stan
ce
Abu
se A
ct
Dra
ft r
egul
atio
ns u
nder
the
Pre
vent
ion
of a
nd T
reat
men
t
for
Sub
stan
ce A
buse
Act
The
regu
latio
ns w
ere
draf
ted
and
disc
usse
d w
ith p
rovi
ncia
l
Dep
artm
ents
of
Soc
ial D
evel
opm
ent
and
othe
r st
akeh
olde
rs
in a
ll ni
ne p
rovi
nces
.
0%

76 Annual Report 2010/2011 | Department of Social Development
Pro
gra
mm
e 3: P
oli
cy D
evel
op
men
t, R
evie
w a
nd
Im
ple
men
tati
on
Su
pp
ort
fo
r W
elfa
re S
ervi
ces
Goa
lTo
red
uce
subs
tanc
e ab
use
Ou
tcom
eIm
prov
ed s
ubst
ance
abu
se s
ervi
ces
and
prog
ram
mes
Fun
ctio
nal
are
asS
trat
egic
ob
ject
ive
Bas
elin
eP
erfo
rman
ce in
dic
ator
Targ
etA
ctu
al o
utp
uts
% d
evia
tion
from
tar
get
Sub
stan
ce a
buse
Rei
nteg
ratio
n an
d af
terc
are
mod
els
Com
mun
ity b
ased
mod
el
Dra
ft a
dult
prev
entio
n m
odel
Yout
h m
odel
Num
ber
of c
lient
s re
ceiv
ing
afte
rcar
e se
rvic
es
Num
ber
of c
lient
s re
ceiv
ing
com
mun
ity b
ased
-car
e
Num
ber
of s
ervi
ce p
rovi
ders
trai
ned
to im
plem
ent
the
afte
rcar
e m
odel
Num
ber
of s
ervi
ce p
rovi
ders
trai
ned
to im
plem
ent
the
com
mun
ity-b
ased
mod
el
Dev
elop
and
impl
emen
t
best
pra
ctic
e m
odel
s fo
r
com
batin
g su
bsta
nce
abus
e
The
afte
rcar
e an
d re
inte
grat
ion
mod
els
wer
e im
plem
ente
d
in t
he W
este
rn C
ape
and
Mpu
mal
anga
.
The
com
mun
ity-b
ased
mod
el w
as im
plem
ente
d in
Lim
popo
and
Nor
th W
est
due
to li
mite
d tr
eatm
ent
serv
ices
and
serv
ice
prov
ider
s.
The
subs
tanc
e ab
use
prev
entio
n m
odel
for
adu
lts w
as
appr
oved
.
Dra
ft t
reat
men
t m
odel
was
dev
elop
ed.
0%
Nat
iona
l Dru
g M
aste
r Pla
n
(ND
MP)
Rev
isio
n of
ND
MP
Rev
ise
ND
MP
The
ND
MP
was
rev
ised
, and
a d
raft
mad
e av
aila
ble.
0%
Com
plet
ion
of a
sup
port
and
need
s as
sess
men
t fo
r
impl
emen
ting
the
ND
MP
Com
plet
ion
of a
n ac
tion
plan
for
str
engt
heni
ng t
he
inst
itutio
nal m
echa
nism
s
need
ed t
o fo
r im
plem
ent
the
ND
MP.
Num
ber
of f
unct
iona
l loc
al
actio
n dr
ug c
omm
ittee
s
Str
engt
hen
and
supp
ort
inst
itutio
nal m
echa
nism
s fo
r
impl
emen
ting
ND
MP
Form
atio
n of
pro
vinc
ial
subs
tanc
e ab
use
foru
ms
A q
uest
ionn
aire
for
asse
ssin
g th
e ne
eds
of s
uppo
rt s
truc
ture
s
was
adm
inis
tere
d, a
nd a
nee
ds a
sses
smen
t rep
ort w
as
com
pile
d.
An
actio
n pl
an f
or c
omm
unity
mob
ilisa
tion
was
dev
elop
ed
and
impl
emen
ted.
23
8 lo
cal d
rug
actio
n co
mm
ittee
s w
ere
esta
blis
hed
and
mai
ntai
ned.
Nin
e pr
ovin
cial
sub
stan
ce a
buse
for
ums
wer
e st
reng
then
ed
and
mai
ntai
ned.
All
the
rele
vant
str
uctu
res
part
icip
ated
in t
he B
ienn
ial A
nti
Sub
stan
ce A
buse
Cam
paig
n an
d S
umm
it he
ld in
Kw
azul
u-
Nat
al (
ICC
-Dur
ban)
fro
m t
he
15
– 1
7 M
arch
20
11
.
0%

Department of Social Development | Annual Report 2010/2011 77
Goa
lTo
sig
nific
antly
red
uce
soci
al c
rime
Ou
tcom
eIm
prov
ed s
ubst
ance
abu
se s
ervi
ces
and
prog
ram
mes
Fun
ctio
nal
are
asS
trat
egic
ob
ject
ive
Bas
elin
eP
erfo
rman
ce in
dic
ator
Targ
etA
ctu
al o
utp
uts
% d
evia
tion
from
tar
get
Soc
ial c
rime
prev
entio
n
Inte
nsify
the
figh
t ag
ains
t cr
ime
and
corr
uptio
n
Dra
ft s
ocia
l crim
e pr
even
tion
stra
tegy
Com
plet
ion
of a
ppro
ved
soci
al c
rime
prev
entio
n
stra
tegy
Com
plet
e an
d ap
prov
e
stra
tegy
The
HS
D a
ppro
ved
the
stra
tegy
on
24
Feb
ruar
y 2
01
1.
0%
Soc
ial C
rime
Pre
vent
ion
prog
ram
mes
Num
ber
of s
ocia
l crim
e
prev
entio
n pr
ogra
mm
es
deve
lope
d
Dev
elop
five
soc
ial c
rime
prev
entio
n pr
ogra
mm
es
Five
soc
ial c
rime
prev
entio
n pr
ogra
mm
es w
ere
deve
lope
d
and
mad
e av
aila
ble.
0%
Dra
ft n
orm
s an
d st
anda
rds
for
secu
re c
are
App
rove
d no
rms
and
stan
dard
s fo
r se
cure
car
e
App
rove
nor
ms
and
stan
dard
s
The
HS
D a
ppro
ved
the
norm
s an
d st
anda
rds
on 5
Aug
ust
20
10
.
0%
Dra
ft p
olic
y fr
amew
ork
and
syst
em o
f ac
cred
itatio
n fo
r
dive
rsio
n pr
ogra
mm
es
App
rove
d na
tiona
l pol
icy
fram
ewor
k an
d ac
cred
itatio
n
syst
em
App
rove
pol
icy
fram
ewor
k
and
accr
edita
tion
syst
em
The
polic
y fr
amew
ork
and
accr
edita
tion
syst
em f
or D
iver
sion
prog
ram
mes
and
ser
vice
pro
vide
rs w
ere
appr
oved
and
tabl
ed in
Par
liam
ent
on 3
1 M
ay 2
01
0.
0%
Reg
ulat
ions
und
er t
he
Pro
batio
n Ser
vice
s A
ct, 2
002
Reg
ulat
ions
und
er t
he
Pro
batio
n Ser
vice
s A
ct, 2
002
Reg
ulat
ions
und
er t
he
Pro
batio
n Ser
vice
s A
ct
draf
ted
The
regu
latio
ns w
ere
draf
ted.
0%

78 Annual Report 2010/2011 | Department of Social Development
Pro
gra
mm
e 3: P
oli
cy D
evel
op
men
t, R
evie
w a
nd
Im
ple
men
tati
on
Su
pp
ort
fo
r W
elfa
re S
ervi
ces
Goa
lTo
red
uce
the
risk
of s
exua
l and
phy
sica
l vio
lenc
e ag
ains
t w
omen
(gen
der-
base
d vi
olen
ce)
Ou
tcom
eIm
prov
ed v
ictim
sup
port
ser
vice
s
Fun
ctio
nal
are
asS
trat
egic
ob
ject
ive
Bas
elin
eP
erfo
rman
ce in
dic
ator
Targ
etA
ctu
al o
utp
uts
% d
evia
tion
from
tar
get
Vict
im e
mpo
wer
men
tB
uild
coh
esiv
e, c
arin
g an
d
sust
aina
ble
com
mun
ities
Men
and
boy
s st
rate
gy f
or
prev
entin
g ge
nder
-bas
ed
viol
ence
Num
ber
of m
en a
nd b
oys
part
icip
atin
g in
gen
der-
base
d vi
olen
ce p
reve
ntio
n
prog
ram
me
Impl
emen
t st
rate
gy f
or
orev
entin
g ge
nder
-bas
ed
viol
ence
27
0 s
ocia
l wor
kers
in a
ll ni
ne p
rovi
nces
wer
e tr
aine
d to
impl
emen
t th
e st
rate
gy.
0%
She
lter
stra
tegy
Impl
emen
tatio
n of
VEP
shel
ter
stra
tegy
Impl
emen
t sh
elte
r st
rate
gy2
70
soc
ial w
orke
rs in
all
nine
pro
vinc
es w
ere
trai
ned
to
impl
emen
t th
e st
rate
gy.
0%
Hum
an t
raffi
ckin
g
reha
bilit
atio
n pr
ogra
mm
e
Num
ber
of p
rovi
nces
impl
emen
ting
the
hum
an
traf
ficki
ng r
ehab
ilita
tion
prog
ram
me
Dev
elop
and
rol
l out
prog
ram
me
in t
he p
rovi
nces
The
hum
an t
raffi
ckin
g re
habi
litat
ion
prog
ram
me
was
deve
lope
d an
d im
plem
ente
d at
13
iden
tified
she
lters
in a
ll
nine
pro
vinc
es.
0%
Com
plet
ion
of a
rese
arch
rep
ort
on v
ictim
empo
wer
men
t le
gisl
atio
n
Com
pile
rep
ort
on v
ictim
empo
wer
men
t le
gisl
atio
n
A r
esea
rch
repo
rt o
n th
e fe
asib
ility
of
deve
lopi
ng v
ictim
supp
ort
serv
ices
legi
slat
ion
was
com
plet
ed, a
nd p
rovi
ded
a
basi
s fo
r de
velo
ping
vic
tim e
mpo
wer
men
t le
gisl
atio
n.
0%
Bui
ld c
ohes
ive,
car
ing
and
sust
aina
ble
com
mun
ities
Com
plet
ion
of a
cos
ting
mod
el f
or t
he V
EP
Dev
elop
a c
ostin
g m
odel
for
the
VEP
Cos
ting
mod
els
wer
e de
velo
ped
for
the
VEP,
soc
ial c
rime,
subs
tanc
e ab
use,
old
er p
erso
ns, f
amili
es, d
isab
ility
, and
child
ren.
0%
The
num
ber
of p
ilot
site
s fo
r
a G
ener
ic In
dica
tor
Set
(GIS
)
Pilo
t G
IS a
t th
e si
te le
vel i
n
thre
e pr
ovin
ces
GIS
wer
e su
cces
sful
ly p
ilote
d in
Lim
popo
, Gau
teng
and
Nor
th W
est.
The
prel
imin
ary
findi
ngs
wer
e pr
esen
ted
to a
VEP
conf
eren
ce h
eld
in O
ctob
er 2
01
0.
A d
etai
led
repo
rt o
n th
e pi
lot
site
s w
as c
ompi
led.
0%
Bas
elin
e do
cum
ents
(GIS
and
tool
s)
Dev
elop
men
t of
reg
iste
r/
data
base
for
vic
tims
of c
rime
and
viol
ence
Des
ign
regi
ster
/ d
atab
ase
for
vict
ims
of c
rime
and
viol
ence
A p
roto
type
fra
mew
ork
was
dev
elop
ed f
or c
aptu
ring
data
on
vict
ims
of c
rime
and
viol
ence
, and
clu
ster
dep
artm
ents
wer
e
trai
ned
to c
aptu
re t
he d
ata.
0%
Dev
elop
men
t of
a v
ictim
surv
ey m
echa
nism
Des
ign
and
test
an
inde
pend
ent
vict
im
satis
fact
ion
surv
ey
The
surv
ey in
stru
men
t was
des
igne
d an
d te
sted
at f
our
site
s:
the
Thut
huze
la C
entr
e, th
e Sh
elte
r fo
r ab
used
wom
en, S
APS
Vict
im S
uppo
rt C
entr
es, a
nd p
arol
e bo
ard
stru
ctur
es. T
he
final
inst
rum
ent w
as w
ill b
e ro
lled
out i
n al
l nin
e pr
ovin
ces.
0%

Community Development
Programme 4

80 Annual Report 2010/2011 | Department of Social Development
PART B: PROGRAMME PERFORMANCE
Programme 4: Community Development
Strategic goalThe purpose of this programme is to create an enabling
environment for empowering poor, vulnerable, and previously
marginalised groups, including youths, women, and people with
disabilities, to achieve sustainable livelihoods.
Measurable objectivesTo create an enabling environment for empowering poor and
vulnerable people by promoting and supporting community
development work, strengthening institutional arrangements, and
engaging with civil society.
Service delivery objectives and indicators
Recent outputs
HIV/AIDS
Several care and support strategies and programmes for
vulnerable groups affected by HIV and AIDS and other diseases
were developed and implemented. These programmes fall under
Home and Community Based Care and Support (HCBC), which
involves the provision of comprehensive social services in the
context of communities, families and individuals.
HCBC is one of the programmes selected to contribute to the social
sector plan for the Extended Public Works Programme (EPWP).
Community caregivers in HCBC organisations provide services to
individuals, families and communities. A total of 19 895 community
caregivers were trained on issues such as succession planning,
child care forums, the Children’s Act, psychosocial support, and
monitoring and evaluation. This helped to give them career paths
and to create jobs. Besides this, more than 1 000 community
caregivers were trained in psychosocial wellbeing.
A monitoring and evaluation system for HCBC (manual and
computerised) was developed and implemented in 341 districts.
A computerised HCBC data capturing system was developed and
rolled out in North West, KwaZulu-Natal, Limpopo and Northern
Cape. This project was implemented in collaboration with the
Department of Health, which acted as the lead department.
Guidelines for support groups and psychosocial support for children
and adults with HIV and other chronic conditions were developed.

PART B: PROGRAMME PERFORMANCE
Department of Social Development | Annual Report 2010/2011 81
An audit of HCBC organisations was completed, and the existence
of 2 000 organisations was verified. The audit report provided
information on the number of HCBC organisations, their location,
whether they were active in nodal areas under the Integrated
Sustainable Rural Development Programme (ISRDP) and Urban
Renewal Programme (URP), their registration status (registered or
unregistered), staffing and management, the nature of services
provided, categories of beneficiaries, data capturing processes,
sources of funding, sustainability, infrastructure, resources, and
needs. An online database was developed, and the provinces
were trained to use and update it.
The Department was actively involved in the HIV counselling
and testing campaign (HCT) announced by the President on
World AIDS Day in 2009. Given the shortage of social workers
needed to implement the campaign, a database of retired social
workers was built in order to enable the Department to seek their
assistance. Departmental social workers were trained on HIV and
AIDS counselling.
The National Association of People Living with HIV and AIDS
(NAPWA) plays a vital role in achieving the government’s priority
objective of mitigating the impact of HIV and AIDS as outlined in
the National Strategic Plan (HIV & AIDS and STI) for 2007-2011.
The Department awarded funding to NAPWA in the past three
financial years (2008/9, 2009/10, and 2010/11). This enabled
the organisation to provide care and support to people living
with HIV and AIDS (PLHIV) by counselling them on positive living,
including treatment and nutrition support; and involving them in
economic and business development initiatives. The Department
assisted NAPWA with project implementation.
The Department also facilitated and monitored implementation of a
national action plan for orphans and other children made vulnerable
by HIV and AIDS. The plan was implemented by four reference
teams. Memoranda of understanding were concluded with 24
key strategic partners in order to enhance their accountability and
promote reporting on the NAP core indicators.
A draft framework on psychosocial support to orphans and other
children made vulnerable by HIV and AIDS was developed and
was due to be aligned with the SADC Framework.
A separate agreement on the child and youth-headed households
project funded by the German Development Bank (KfW) was signed
by the Director-General in December 2010. This project is aimed
at renovating, extending, equipping, and building community
care centres where children and youths will receive material and
psychosocial support, and developing and implementing a skills
development programme for youths, especially those who have to
have to assume the role of head of household.
A Report on Surveillance System for Maternal Orphans was
launched by the Minister for Social Development during the World
AIDS Day event in KwaZulu-Natal. This system will enable the
Department to update information on orphanhood, and review and
plan relevant interventions.
As regards prevention, the Department formed a partnership with
USAID for training 50 national, provincial and NGO coordinators
on social behaviour change. A service provider was appointed to
undertake the training. The service provider will also help develop an
HIV prevention strategy. The Department developed and approved
terms of reference for appointing a service provider to train and
orientate NGOs and departmental officials on gender advocacy.
A management plan to monitor LoveLife programmes in all
provinces was approved and presented to the cluster committee.
The plan was due to be presented to the HSD forum.
Building the capacity of HCBC organisationsMeetings aimed at resuscitating HCBC management capacity
were held with the Mpumalanga Department of Social
Development and the StarFish Foundation. Seven potential local
mentoring organisations submitted proposals to the project
management unit. They were screened, and an organisation was
selected and appointed. The organisation and district officials
responsible for managing HCBC organisations were oriented,
which included preliminary training on gender mainstreaming
conducted by the Department’s gender unit. This process pointed
to a need to review the available material and mentoring tools to
ensure that gender issues are reflected in HCBC.
To ensure the quality and credibility of the information provided to
participating organisations, the Department agreed with the HWSETA

82 Annual Report 2010/2011 | Department of Social Development
PART B: PROGRAMME PERFORMANCE
Programme 4: Community Development
to explore the possibility of registering the HCBC management
capacity modules as a skills development programme. Five of
the seven modules were unit standard aligned and submitted to
HWSETA for evaluation and registration.
A service provider was appointed to standardise three more
modules, which will complete the programme. Two unit standard
were aligned and due to be submitted to HWSETA for approval.
The modules are accompanied by a governance manual for board
members of HCBC organisations.
The Department, in partnership with the Nelson Mandela
Foundation, has introduced a strategy for mobilising and
capacitating communities to respond to HIV and AIDS which was
tested on World AIDS Day 2010. This was preceded by community
dialogues which led to a decision to roll out the strategy in seven
provinces in the next financial year.
An audit of HCBC organisations identified gaps in their services
to communities, and a strategic plan was due to be developed
to cover these gaps. A monitoring and evaluation system will
be utilised to validate all data received. Community caregivers
must be trained appropriately to ensure that they provide
quality services. Community capacity will be built to ensure that
community members play a central role in the strategy.
Community development and service standards
A draft community development policy framework was presented
to the HSS for approval. A draft community development strategy
was also developed.
The Department also developed a skills plan for community
development practitioners that enable them to address the
sector skills gaps in accordance with the recommendations of
the national skills audit report. The skills plan was approved
and implemented by all the provinces. Community development
practitioners and Masupa-Tsela youth pioneers were trained to
provide social cooperatives with technical support and mentorship.
The Department also finalised a memorandum of understanding
with HWSETA on training community development practitioners on
integrated development plans (IDPs), community-based planning
(CBP), the sustainable livelihoods approach (SLA), and a toolkit for
sustainable livelihoods.
A process was finalised for developing and registering community
development qualifications at NQF Levels 5 and 8, which
had been delayed because of changes to the South African
qualifications framework. This was a significant step towards
professionalising community development practice. A successful
community development indaba was held and provided a platform
for practitioners and CSOs to engage on issues surrounding
community development practice, with a specific focus on the
scope of practice, norms and standards, implementation model,
and funding protocol for establishing community development
forums. Guidelines for community-based organisations were
also developed which are meant to guide them on how to involve
communities in their development processes. The guidelines were
discussed with various stakeholders.
Youth development
Youth work was successfully handed over to the National Youth
Development Agency (NYDA) in February 2011. Fifty youth NPOs
were profiled from the DSD NPO database and 110 organisations
in seven provinces were audited to determine their strengths and
weaknesses.
Two intergenerational dialogues were held in KwaZulu-Natal
and Gauteng in order to solicit inputs on developing a business
plan for the intergenerational programme. A total of 120 youths
participated, 40 in KwaZulu-Natal and 80 in Gauteng.
Two manuals for training NYS programme implementers
were reproduced for NYS training workshops, including the
development of business plans for the youth service programme.
More than 270 officials in eight provinces were trained to develop
eight business plans each. Gauteng recruited and trained 140
youths on landscaping and irrigation. Some 51 graduated and
were assisted to register their own cooperatives, and 69 were
employed by private companies. In the Free State, 500 youths
were recruited and trained on child and youth care. A total of 222
youths were recruited in Mpumalanga and were due to be trained
in the next financial year.
Three quarterly youth development forums were held successfully.
The Department was assisted by the National Youth Development
Forum to coordinate and synergise youth programmes and
projects.

PART B: PROGRAMME PERFORMANCE
Department of Social Development | Annual Report 2010/2011 83
The norms and standards for implementing the Masupa-
tsela Youth Pioneer Programme (MYPP) were developed,
and a booklet produced. The Department also continued
to facilitate the accreditation of MYPP and successfully
solicited the assistance of the Education, Training and
Development Practices Sector Education and Training
Authority (ETDPSETA). The MYPP curriculum was assessed
and a service provider was appointed to develop the
learning material needed to bridge the identifi ed gaps,
and submit the amended curriculum for accreditation to
EDTPSETA by June 2011. A draft MYPP exit strategy was
developed.
Sustainable livelihoods
The Department trained 354 community development
practitioners and supervisors on the use of the sustainable
livelihoods concept and the toolkit for facilitating
community development. This exceeded the target of 350
set for the year. It also exceeded the target for completing
guidelines for establishing social cooperatives. In addition,
workshops were held to build the capacity of CDPs, CDP
managers, and Masupa-tsela Youth Pioneers on the concept of
social cooperatives and the implementation guidelines.
The Department helped four provinces to establish food banks,
and helped to launch the City of Tshwane FoodBank. A delegation
from North West and the City of Tshwane FoodBank Task Team
undertook a two-day visit to Gauteng to learn on how to operate
a FoodBank, and offi cials from Gauteng, Free State and North
West met in Rustenburg to exchange ideas on how to successfully
operate a food bank.
The Department, in partnership with faith-based organisations,
NGOs, the private sector, and institutions of higher learning,
successfully organised events to celebrate Social Development
Month at MEDUNSA and at Mathibestad in North West. This
created a solid platform for an integrated approach to poverty
alleviation. The Department secured sponsorships and donations
from the private sector in the form of clothing and food parcels
which were distributed to poor, marginalised and vulnerable
households, including poor households at Hermanstad in Pretoria
West and Vaalbank in Mpumalanga.
The Department continued to support the War on Poverty
championed by the Deputy President. It organised a two-day sector
planning session, attended by the M&E Unit in the Presidency and
the DG of the War on Poverty. Participants reviewed the Department’s
contribution to the campaign, and developed mechanisms for
strengthening its support for the campaign. A report was compiled
an distributed to all the provinces.
The unit continued to develop a ‘Strategy for taking the DSD to
communities’, which will target the poorest wards identifi ed in the
course of the War on Poverty.
Non-profi t organisations and partnerships
The Department undertook four major projects, namely developing
an NPO policy, developing and implementing an NPO capacity-
building framework, and developing NPO management guidelines,
norms and standards for NPO governance, and NPO funding
guidelines.
An NPO policy discussion document was developed as the fi rst step
towards amending the NPO Act. All stakeholders, including all nine
provinces, were consulted, and the discussion document received
the support of all stakeholder and provinces. An intergovernmental

84 Annual Report 2010/2011 | Department of Social Development
PART B: PROGRAMME PERFORMANCE
Programme 4: Community Development
committee on NPOs established in the previous financial year was
revitalised, and approved its own terms of reference.
The Department helped to strengthen the capacity of all provinces
to register NGOS and monitor their compliance with legislation.
This initiative improved working conditions in the provinces as well
as meaningful communication in respect of NPO enquiries and the
meeting of urgent demands.
NPO funding guidelines were developed. The guidelines were
discussed with all stakeholders, including the provinces, and
approved as an implementation tool for the policy on financial
awards. The guidelines were presented to different forums and
provinces, and were approved for implementation in the next financial
year. Management guidelines for funded NPOs were also developed,
to be used by the provinces for managing all funded NPOs.
The Department continued its efforts to improve NPO registration
with a specific focus on the turnaround time for registration. We
processed 75% of applications weekly, and registered and issued
an average of 210 certificates a week.
The contracts of six people contracted in the previous financial
year to help deal with the backed up applications were extended
for another 12 months. As a result, the registration period was
reduced from five months to four weeks.
The unit received 15 232 new applications for registration. A total
of 10 238 organisations were registered, and 4 723 failed to meet
the requirements set out in the NPO Act. This translates into 69%
registration compliance by organisations.
Monitoring the ongoing compliance of registered NPOs with the
NPO Act is a key function of this unit. A total of 12 625 notices
were issued to non-compliant organisations (which failed to submit
annual reports) as opposed to 6 987 in the previous year – an
increase of 45%. A total of 11 172 annual reports were submitted.
The Department held information-sharing sessions with six
provinces: Gauteng, Limpopo, Mpumalanga, Northern Cape, the
Free State and the Eastern Cape. Phase one of the NPO capacity-
building framework was implemented in these six provinces, and
1 532 NPOs were trained.
Performance targets achieved
Deviation Status Total targets
■ 0–25% Achieved 34
■ 26–75% In progress 1
■ 76–100% Not achieved 10
10
1
34
Budgeted and actual expenditure
R177 376
175 000
176 000
177 000
178 000
179 000
180 000
181 000
182 000
183 000
AuditedActual
Final Appropraition
R182 034

Department of Social Development | Annual Report 2010/2011 85
Pro
gra
mm
e 4:
Com
mu
nit
y D
evel
op
men
t
Key
ou
tpu
ts a
nd
ser
vice
del
iver
y in
dic
ator
s
Mea
sura
ble
obje
ctiv
es: T
o cr
eate
an
enab
ling
envi
ronm
ent f
or e
mpo
wer
ing
poor
and
vul
nera
ble
peop
le b
y pr
omot
ing
and
supp
ortin
g co
mm
unity
dev
elop
men
t wor
k, s
tren
gthe
ning
inst
itutio
nal a
rran
gem
ents
, and
enga
ging
with
civ
il so
ciet
y.
Goa
lTo
red
uce
the
inci
denc
e an
d m
inim
ise
the
psyc
hoso
cial
impa
ct o
f H
IV/A
IDS in
ord
er t
o ac
hiev
e th
e go
als
and
targ
ets
of t
he N
atio
nal S
trat
egic
Pla
n fo
r H
IV/A
IDS
, TB
and
Mal
aria
, and
to
expa
nd t
he H
IV a
nd A
IDS
pro
gram
mes
and
M&
E us
ing
rele
vant
indi
cato
rs
Ou
tcom
eH
IV a
nd A
IDS
-com
pete
nt c
omm
uniti
es a
nd s
take
hold
ers
that
dea
l eff
ectiv
ely
with
the
pre
vent
ion
and
psyc
hoso
cial
impa
ct o
f H
IV a
nd A
IDS
Fun
ctio
nal
are
asS
trat
egic
ob
ject
ive
Bas
elin
eP
erfo
rman
ce in
dic
ator
Targ
etA
ctu
al o
utp
uts
% d
evia
tion
from
tar
get
HIV
and
AID
SD
evel
op H
IV a
nd A
IDS
prev
entio
n pr
ogra
mm
es o
n
soci
al b
ehav
iour
cha
nge
Situ
atio
nal a
naly
sis
of
prev
entio
n pr
ogra
mm
es
HIV
Pre
vent
ion
Str
ateg
y
Num
ber
of
fund
ed N
PO
s
trai
ned
on s
ocia
l beh
avio
ur
chan
ge p
rogr
amm
es
Trai
n st
aff
in a
ll pr
ovin
ces
to
impl
emen
t so
cial
beh
avio
ur
chan
ge p
rogr
amm
es
Term
s of
ref
eren
ce f
or a
ppoi
ntin
g a
serv
ice
prov
ider
to
cond
uct
the
trai
ning
was
app
rove
d.
A s
ervi
ce p
rovi
der
(CA
DR
E) w
as a
ppoi
nted
to
trai
n pr
ovin
cial
offi
cial
s.
Trai
ning
was
due
to
star
t in
the
nex
t fin
anci
al y
ear.
Thre
e co
nsul
tativ
e w
orks
hops
for
you
ths
wer
e he
ld in
thr
ee p
rovi
nces
.
Dia
logu
es w
ere
held
with
tw
o co
mm
uniti
es.
Wor
ld A
ids
Day
was
suc
cess
fully
hos
ted.
80
%1
Effe
ctiv
e pa
rtne
rshi
p w
ith
stak
ehol
ders
Com
plet
ion
of im
pact
asse
ssm
ent
repo
rt o
n
Love
Life
pro
gram
mes
Ass
ess
impa
ct o
f Lo
veLi
fe
prog
ram
mes
App
rove
inte
rdep
artm
enta
l
com
mitt
ee f
or m
anag
ing
Love
Life
pro
gram
mes
Term
s of
ref
eren
ce f
or a
n im
pact
ass
essm
ent
wer
e de
velo
ped
and
pres
ente
d to
the
sec
tor
mee
ting.
A m
anag
emen
t pl
an f
or t
he p
rovi
ncia
l mon
itorin
g of
Lov
eLife
prog
ram
mes
was
app
rove
d.
80
%2
Impl
emen
t N
atio
nal A
ctio
n
Pla
n (N
AP
) for
orp
hans
and
othe
r ch
ildre
n m
ade
vuln
erab
le b
y H
IV a
nd A
IDS
Impl
emen
tatio
n of
NA
PN
umbe
r of
nat
iona
l and
prov
inci
al N
GO
s re
port
ing
in t
erm
s of
indi
cato
rs u
nder
the
NA
P
Num
ber
of o
rpha
ns a
nd
othe
r ch
ildre
n be
nefit
ing
from
the
NA
P
Impl
emen
t N
AP
A w
eb-b
ased
tool
for
asse
ssin
g th
e M
&E
capa
city
of n
atio
nal a
nd
prov
inci
al N
GO
s w
as d
evel
oped
and
sen
t to
NA
CC
A m
embe
r
orga
nisa
tions
for
popu
latio
n.
A d
raft
repo
rt o
n th
e as
sess
men
t of t
he M
&E
capa
city
of n
atio
nal N
GO
s
was
com
pile
d an
d pr
esen
ted
to N
AC
CA
.
Chi
ld c
are
foru
m g
uide
lines
wer
e dr
afte
d.
A d
raft
NA
CC
A c
omm
unic
atio
n st
rate
gy w
as d
evel
oped
.
Dra
ft g
uide
lines
on
coor
dina
tion
wer
e de
velo
ped.
A d
raft
conc
eptu
al fr
amew
ork
on p
sych
osoc
ial s
uppo
rt fo
r or
phan
s an
d
othe
r ch
ildre
n m
ade
vuln
erab
le b
y H
IV a
nd A
IDS
was
dev
elop
ed.
The
mon
itorin
g an
d ev
alua
tion
fram
ewor
k fo
r th
e N
AP
was
rev
ised
.
NA
P in
dica
tors
wer
e re
fined
and
fina
lised
.
A n
atio
nal s
teer
ing
com
mitt
ee w
as e
stab
lishe
d fo
r th
e C
hild
Hea
ded
Hou
seho
ld/K
fW p
roje
ct in
KZN
and
Lim
popo
.
0%

86 Annual Report 2010/2011 | Department of Social Development
Pro
gra
mm
e 4:
Com
mu
nit
y D
evel
op
men
t
Goa
lTo
red
uce
the
inci
denc
e an
d m
inim
ise
the
psyc
hoso
cial
impa
ct o
f H
IV/A
IDS in
ord
er t
o ac
hiev
e th
e go
als
and
targ
ets
of t
he N
atio
nal S
trat
egic
Pla
n fo
r H
IV/A
IDS
, TB
and
Mal
aria
, and
to
expa
nd t
he H
IV a
nd A
IDS
pro
gram
mes
and
M&
E us
ing
rele
vant
indi
cato
rs
Ou
tcom
eH
IV a
nd A
IDS
-com
pete
nt c
omm
uniti
es a
nd s
take
hold
ers
that
dea
l eff
ectiv
ely
with
the
pre
vent
ion
and
psyc
hoso
cial
impa
ct o
f H
IV a
nd A
IDS
Fun
ctio
nal
are
asS
trat
egic
ob
ject
ive
Bas
elin
eP
erfo
rman
ce in
dic
ator
Targ
etA
ctu
al o
utp
uts
% d
evia
tion
from
tar
get
HIV
and
AID
SC
hild
ren
serv
ices
dire
ctor
ies
for
the
East
ern
Cap
e, G
aute
ng,
Mpu
mal
anga
, Nor
ther
n C
ape,
Nor
th W
est
and
Wes
tern
Cap
e w
ere
appr
oved
for
prin
ting
Num
ber
of m
emor
anda
of
unde
rsta
ndin
g si
gned
with
part
ners
Str
engt
hen
co-o
rdin
atio
n w
ith
deve
lopm
ent
part
ners
, NG
Os
and
gove
rnan
ce s
truc
ture
s
A m
emor
andu
m o
f un
ders
tand
ing
indi
catin
g th
e ar
ea o
f co
mm
itmen
t
unde
r th
e N
AP
of
each
NA
CC
A m
embe
r or
gani
satio
n w
as d
raft
ed.
0%
Per
cent
age
of m
unic
ipal
ities
utili
sing
the
mat
erna
l orp
han
data
base
10%
of
mun
icip
aliti
es t
o
utili
se m
ater
nal o
rpha
n
data
base
36
of
28
0 lo
cal m
unic
ipal
ities
(12
,7%
) util
isin
g th
e m
ater
nal o
rpha
ns
data
base
0%
Dev
elop
men
t of
evi
denc
e-
base
d po
licie
s an
d
prog
ram
mes
Num
ber
of p
rovi
nce-
spec
ific
plan
s re
spon
ding
to
rese
arch
findi
ngs
Ana
lyse
res
earc
h fin
ding
s
and
data
on
child
ren
affe
cted
by H
IV/A
IDS
An
HC
BC
aud
it re
port
was
fina
lised
, prin
ted
as a
boo
klet
and
CD
, and
dist
ribut
ed t
o al
l pro
vinc
es.
The
HC
BC
aud
it re
port
was
dis
sem
inat
ed t
o th
e P
olic
y Fo
rum
,
NA
CC
A, a
nd p
rovi
ncia
l coo
rdin
ator
s w
orks
hop,
all
prov
ince
s ta
rget
ing
DS
D, D
OH
and
oth
er r
elev
ant
stak
ehol
ders
.
Orie
ntat
ion
wor
ksho
ps o
n th
e ut
ilisa
tion
and
upda
ting
of a
web
-bas
ed
data
base
wer
e he
ld fo
r of
ficia
ls in
the
natio
nal a
nd a
ll pr
ovin
cial
depa
rtm
ents
of S
ocia
l Dev
elop
men
t and
Hea
lth.
Stra
tegi
es fo
r ad
dres
sing
gap
s an
d ch
alle
nges
iden
tified
in th
e au
dit
wer
e de
velo
ped
in a
ll pr
ovin
ces.
Org
anis
atio
ns fu
nded
dur
ing
the
2010
/11
finan
cial
yea
r w
ere
upda
ted
on th
e w
eb-b
ased
dat
abas
e.
0%
Mon
itor
and
eval
uate
the
syst
em f
or H
CB
C
Dev
elop
men
t an
d ex
pans
ion
of m
onito
ring
and
eval
uatio
n
syst
em f
or H
CB
C
Num
ber
of d
istr
icts
impl
emen
ting
the
HC
BC
M&
E sy
stem
35 d
istr
icts
to
impl
emen
t
mon
itorin
g an
d ev
alua
tion
syst
em
The
HC
BC
M&
E sy
stem
was
impl
emen
ted
in 3
1 di
stric
ts.
Thre
e pr
ovin
ces
– N
orth
Wes
t, N
orth
ern
Cap
e an
d Li
mpo
po –
sta
rted
the
data
cap
turin
g pr
oces
s.
An
HC
BC
M&
E Tr
aini
ng D
VD w
as d
evel
oped
and
dis
trib
uted
to
Nor
th
Wes
t, G
aute
ng, L
impo
po, N
orth
ern
Cap
e an
d K
ZN.
Pro
vinc
ial t
ask
team
s co
mpr
isin
g D
SD
and
DoH
offi
cial
s w
ere
esta
blis
hed
in M
pum
alan
ga a
nd t
he E
aste
rn C
ape
10
%3
Rea
son
s fo
r d
evia
tion
1 T
he t
ende
r fo
r ap
poin
ting
a se
rvic
e pr
ovid
er w
as n
ot a
ppro
ved.
2 T
his
proc
ess
was
del
ayed
bec
ause
the
ass
essm
ent
invo
lved
thr
ee o
ther
dep
artm
ent
(Hea
lth, E
duca
tion,
and
Spo
rts
and
Rec
reat
ion)
.3 T
here
was
a d
evia
tion
of f
our
dist
ricts
as
the
prov
ince
s w
ere
not
read
y fo
r im
plem
enta
tion.

Department of Social Development | Annual Report 2010/2011 87
Goa
lTo
red
uce
the
inci
denc
e an
d m
inim
ise
the
psyc
hoso
cial
impa
ct o
f H
IV/A
IDS in
ord
er t
o ac
hiev
e th
e go
als
and
targ
ets
of t
he N
atio
nal S
trat
egic
Pla
n fo
r H
IV/A
IDS
, TB
and
Mal
aria
, and
to
expa
nd t
he H
IV &
AID
S p
rogr
amm
es a
nd
M&
E us
ing
rele
vant
indi
cato
rs
Ou
tcom
eH
IV a
nd A
IDS
-com
pete
nt c
omm
uniti
es a
nd s
take
hold
ers
that
dea
l eff
ectiv
ely
with
the
pre
vent
ion
and
psyc
hoso
cial
impa
ct o
f H
IV a
nd A
IDS
Fun
ctio
nal
are
asS
trat
egic
ob
ject
ive
Bas
elin
eP
erfo
rman
ce in
dic
ator
Targ
etA
ctu
al o
utp
uts
% d
evia
tion
from
tar
get
HIV
and
AID
SIT
orie
ntat
ion
wor
ksho
ps w
ere
held
in L
impo
po a
nd N
orth
ern
Cap
e.
HC
BC
M&
E IT
mod
ule
trai
ning
was
con
duct
ed in
KZN
.
Ref
resh
er tr
aini
ng o
n th
e H
CB
C M
&E
syst
em w
as c
ondu
cted
in G
aute
ng.
A n
atio
nal d
ata
anal
ysis
trai
ning
wor
ksho
p w
as h
eld
and
atte
nded
by 4
0 of
ficia
ls o
f the
nat
iona
l and
pro
vinc
ial d
epar
tmen
ts o
f Soc
ial
Dev
elop
men
t and
Hea
lth.
Trai
n th
e tr
aine
r se
ssio
ns w
ere
held
in th
e Ea
ster
n C
ape
and
Mpu
mal
anga
, atte
nded
by
103
dist
rict D
SD a
nd D
oH o
ffici
als.
30
00
tra
inin
g m
anua
ls w
ere
dist
ribut
ed t
o al
l im
plem
entin
g pr
ovin
ces.
Str
engt
hen
the
capa
city
of
HC
BC
org
anis
atio
ns
Per
cent
age
of c
omm
unity
care
give
rs (C
CG
s) r
ecei
ving
accr
edite
d tr
aini
ng
Num
ber
of C
CG
s tr
aine
d Tr
ain
15 0
00 C
CG
s 1
9 8
95
CC
Gs
wer
e tr
aine
d.
1 0
00
CC
Gs
wer
e tr
aine
d to
impl
emen
t th
e ps
ycho
soci
al w
ellb
eing
skill
s de
velo
pmen
t pr
ogra
mm
e.
A c
urric
ulum
for
the
child
pro
tect
ion
skill
s pr
ogra
mm
e fo
r co
mm
unity
care
give
rs w
as d
evel
oped
and
eva
luat
ed.
The
psyc
hoso
cial
wel
lbei
ng s
kills
dev
elop
men
t pr
ogra
mm
e w
as
regi
ster
ed w
ith H
WS
ETA
.
12
ser
vice
pro
vide
rs w
ere
accr
edite
d to
impl
emen
t th
e ps
ycho
soci
al
supp
ort
wel
lbei
ng s
kills
dev
elop
men
t pr
ogra
mm
e.
A c
ostin
g m
odel
for
tra
inin
g se
rvic
e pr
ovid
ers
was
dev
elop
ed a
nd
impl
emen
ted
in t
he p
rovi
nces
.
A p
sych
osoc
ial s
uppo
rt c
urric
ulum
for
sup
ervi
sors
was
dev
elop
ed
and
eval
uate
d.
A r
epor
t on
the
curr
ent s
uper
visi
on o
f HC
BC
was
com
plet
ed.
A d
eskt
op r
evie
w o
f ser
vice
s, s
tand
ards
, and
trai
ning
ser
vice
pro
vide
rs
on p
sych
osoc
ial s
uppo
rt w
as c
ompl
eted
.
0%
Per
cent
age
of H
CB
C
orga
nisa
tions
rec
eivi
ng
trai
ning
on
HC
BC
man
agem
ent
Per
cent
age
of f
unde
d H
CB
C
orga
nisa
tions
com
plia
nt w
ith
norm
s an
d st
anda
rds
30%
of
HC
BC
org
anis
atio
ns
to c
ompl
y w
ith n
orm
s an
d
stan
dard
s
65
0 o
f 1
40
0 f
unde
d or
gani
satio
ns (4
7%
) com
plie
d w
ith n
orm
s an
d
stan
dard
s, e
xcee
ding
the
tar
get
of 3
0%
.
0%
Num
ber
of p
rovi
nces
impl
emen
ting
stra
tegy
for
impr
ovin
g H
CB
C
man
agem
ent
capa
city
Thre
e pr
ovin
ces
to im
plem
ent
stra
tegy
for
impr
ovin
g H
CB
C
man
agem
ent
capa
city
Mpu
mal
anga
beg
an t
o im
plem
ent
the
stra
tegy
.
Rep
rese
ntat
ives
of
men
torin
g or
gani
satio
ns, d
istr
ict
offic
ials
, and
proj
ect
man
ager
s w
ere
trai
ned
to m
ains
trea
m g
ende
r is
sues
.
70
%1
Rea
son
s fo
r d
evia
tion
1 T
wo
prov
ince
s w
ere
not
read
y to
impl
emen
t th
is s
trat
egy.

88 Annual Report 2010/2011 | Department of Social Development
Pro
gra
mm
e 4:
Com
mu
nit
y D
evel
op
men
t
Goa
lTo
sup
port
and
str
engt
hen
fam
ily a
nd c
omm
unity
inte
rven
tions
tha
t fo
ster
soc
ial c
ohes
ion
Ou
tcom
eA
dequ
ate
and
wel
l-sk
illed
hum
an r
esou
rces
to
stre
ngth
en f
amily
and
com
mun
ity in
terv
entio
ns t
hat
fost
er s
ocia
l coh
esio
n
Fun
ctio
nal
are
asS
trat
egic
ob
ject
ive
Bas
elin
eP
erfo
rman
ce in
dic
ator
Targ
etA
ctu
al o
utp
uts
% d
evia
tion
from
tar
get
Com
mun
ity p
olic
y
and
serv
ice
stan
dard
s
Dev
elop
sec
tor
skill
s
and
capa
city
to
supp
ort
com
mun
ity d
evel
opm
ent
Lim
ited
skill
s fo
r ef
fect
ive
prac
tice
reve
aled
in s
kills
audi
t of
915 C
DPs
Num
ber
of C
DPs
trai
ned
to im
plem
ent
com
mun
ity-
base
d pl
anni
ng, i
nteg
rate
d
deve
lopm
ent
plan
ning
, the
CD
P t
oolk
it, a
nd t
he S
LA
tool
kit.
Dev
elop
ski
lls d
evel
opm
ent
plan
for
com
mun
ity
deve
lopm
ent
prac
titio
ners
A s
kills
dev
elop
men
t pla
n w
as d
rafte
d an
d ap
prov
ed.
75 C
DPs
, inc
ludi
ng 2
5 M
asup
a Ts
ela
Yout
h Pi
onee
rs, w
ere
trai
ned
for
six
wee
ks a
s va
lue
add
soci
al c
oope
rativ
es m
ento
rs a
nd fa
cilit
ator
s.
Bes
ides
thi
s, 3
54
CD
Ps
wer
e tr
aine
d to
use
the
SLA
Too
lkit.
0%
Nee
d to
pro
fess
iona
lise
com
mun
ity d
evel
opm
ent
Num
ber
of c
onsu
ltatio
ns w
ith
stak
ehol
ders
Dev
elop
occ
upat
iona
l
fram
ewor
k fo
r so
cial
ser
vice
s
TOR
for
app
oint
ing
a se
rvic
e pr
ovid
er w
as s
ubm
itted
to
the
bid
adju
dica
tion
com
mitt
ee, w
hich
rec
omm
ende
d th
at t
he p
roce
ss b
e
pres
ente
d to
MA
NC
O b
efor
e ad
vert
isin
g fo
r te
nder
s. T
his
proc
ess
was
due
to
cont
inue
in t
he n
ext
finan
cial
yea
r.
80
%1
Dev
elop
pol
icie
s,
prog
ram
mes
and
gui
delin
es
for
empo
wer
ing
com
mun
ities
Lack
of
natio
nal f
ram
ewor
k
for
faci
litat
ing
com
mun
ity
deve
lopm
ent
Com
plet
ion
of a
n ap
prov
ed
com
mun
ity d
evel
opm
ent
polic
y fr
amew
ork
Dra
ft a
nd a
ppro
ve c
omm
unity
deve
lopm
ent
polic
y
fram
ewor
k
A c
omm
unity
dev
elop
men
t po
licy
fram
ewor
k w
as a
ppro
ved
by
MA
NC
O a
nd H
SS
for
pre
sent
atio
n to
the
Soc
ial P
rote
ctio
n, H
uman
and
Com
mun
ity D
evel
opm
ent
Clu
ster
10
%2
Com
plet
ion
of a
com
mun
ity
deve
lopm
ent
stra
tegy
Dev
elop
Com
mun
ity
Dev
elop
men
t Str
ateg
y.
A d
raft
com
mun
ity d
evel
opm
ent
stra
tegy
was
dev
elop
ed5
%3

Department of Social Development | Annual Report 2010/2011 89
Goa
lTo
sup
port
and
str
engt
hen
fam
ily a
nd c
omm
unity
inte
rven
tions
tha
t fo
ster
soc
ial c
ohes
ion
Ou
tcom
eA
dequ
ate
and
wel
l-sk
illed
hum
an r
esou
rces
to
stre
ngth
en f
amily
and
com
mun
ity in
terv
entio
ns t
hat
fost
er s
ocia
l coh
esio
n
Fun
ctio
nal
are
asS
trat
egic
ob
ject
ive
Bas
elin
eP
erfo
rman
ce in
dic
ator
Targ
etA
ctu
al o
utp
uts
% d
evia
tion
from
tar
get
Com
mun
ity p
olic
y
and
serv
ice
stan
dard
s
Unr
egul
ated
com
mun
ity
deve
lopm
ent
prac
tice
Num
ber
of c
onsu
ltativ
e
mee
tings
hos
ted
Com
plet
ion
of n
orm
s an
d
stan
dard
s fo
r co
mm
unity
deve
lopm
ent
prac
tice
Dra
ft d
iscu
ssio
n do
cum
ent
on n
orm
s an
d st
anda
rds
A c
omm
unity
dev
elop
men
t Ind
aba
was
hel
d to
con
sult
with
stak
ehol
ders
on
com
mun
ity d
evel
opm
ent n
orm
s an
d st
anda
rds.
A s
ervi
ce p
rovi
der
was
app
oint
ed t
o de
velo
p a
disc
ussi
on d
ocum
ent
on c
omm
unity
dev
elop
men
t no
rms
and
stan
dard
s as
a b
asis
for
deve
lopi
ng a
n oc
cupa
tion
fram
ewor
k fo
r so
cial
ser
vice
s.
The
TOR
for
appo
intin
g a
serv
ice
prov
ider
sw
ere
subm
itted
to th
e B
id
Adj
udic
atio
n C
omm
ittee
whi
ch r
ecom
men
ded
that
the
proc
ess
be
pres
ente
d to
MA
NC
O b
efor
e ad
vert
isin
g fo
r te
nder
s.
90
%4
Dev
elop
the
cap
acity
of
com
mun
ity d
evel
opm
ent
foru
ms
(CD
Fs) t
o st
imul
ate
and
supp
ort
com
mun
ity-
driv
en d
evel
opm
ent
initi
ativ
es
Lim
ited
capa
city
of
com
mun
ity-d
riven
deve
lopm
ent
Com
plet
e a
mod
el f
or C
DFs
to d
esig
n, c
oord
inat
e an
d
man
age
the
impl
emen
tatio
n
of in
tegr
ated
com
mun
ity
deve
lopm
ent
prog
ram
mes
Dev
elop
a p
rogr
amm
e
impl
emen
tatio
n an
d fu
ndin
g
prot
ocol
A d
raft
mod
el w
as d
evel
oped
and
dis
cuss
ed w
ith s
take
hold
ers
durin
g th
e na
tiona
l com
mun
ity d
evel
opm
ent
inda
ba
0%
Rea
son
s fo
r d
evia
tion
1 T
his
proj
ect
had
polic
y im
plic
atio
ns w
hich
nee
ded
to b
e di
scus
sed.
2 T
here
wer
e de
lays
in a
ppro
ving
the
pol
icy
and
disc
ussi
ng d
iffer
ent
appr
oach
es p
ropo
sed
by t
he D
epar
tmen
t.3 T
he s
trat
egy
coul
d no
t be
pre
sent
ed b
efor
e th
e po
licy
had
been
app
rove
d.4 T
here
wer
e de
lays
in t
he a
ppro
val o
f T0
R b
y th
e bi
d ev
alua
tion
com
mitt
ee a
nd b
id a
djud
icat
ion
com
mitt
ee a
s w
ell a
s th
e re
ferr
al o
f ap
prov
ed p
roje
cts
to M
AN
CO
bef
ore
adve
rtis
ing
for
tend
ers.
Del
ays
in fi
nalis
ing
serv
ice
leve
l agr
eem
ents
als
o ha
d an
impa
ct.

90 Annual Report 2010/2011 | Department of Social Development
Pro
gra
mm
e 4:
Com
mu
nit
y D
evel
op
men
t
Goa
lTo
impl
emen
t yo
uth
prog
ram
mes
tha
t as
sist
you
ths
to a
cces
s de
cent
wor
k an
d pa
rtic
ipat
e in
the
mai
nstr
eam
eco
nom
y
Ou
tcom
eR
educ
ed y
outh
pov
erty
Fun
ctio
nal
are
asS
trat
egic
ob
ject
ive
Bas
elin
eP
erfo
rman
ce in
dic
ator
Targ
etA
ctu
al o
utp
uts
% d
evia
tion
from
tar
get
Yout
h D
evel
opm
ent
Pol
icie
s an
d gu
idel
ines
for
impl
emen
ting
the
Mas
upa-
Tsel
a Yo
uth
Pio
neer
Pro
gram
me
(MYP
P)
2 4
10 y
outh
s re
crui
ted
and
part
icip
atin
g
Num
ber
of M
YPP m
ento
rs
trai
ned
Trai
n 100 M
YPP m
ento
rsTh
e te
nder
was
app
rove
d an
d a
brie
fing
sess
ion
cond
ucte
d.1
00
%1
Com
plet
ion
of a
n M
YPP e
xit
stra
tegy
Dev
elop
exi
t st
rate
gy f
or
MYP
P
An
exit
stra
tegy
was
dev
elop
ed.
0%
Dev
elop
pro
gram
mes
to r
enew
and
res
tore
inte
rgen
erat
iona
l sol
idar
ity
Num
ber
of
prov
ince
s
impl
emen
ting
inte
rgen
erat
iona
l act
iviti
es
Co-
ordi
nate
the
dev
elop
men
t
of b
usin
ess
plan
s in
cons
ulta
tion
with
the
Old
er
Per
sons
Dire
ctor
ate
Inte
rgen
erat
iona
l dia
logu
es w
ere
held
in K
ZN a
nd G
aute
ng to
sol
icit
inpu
ts o
n de
velo
ping
a b
usin
ess
plan
for
inte
rgen
erat
iona
l pro
gram
mes
in p
artn
ersh
ip w
ith th
e Fa
mili
es a
nd O
lder
Per
sons
sub
-pro
gram
mes
.
Bus
ines
s pl
ans
wer
e de
velo
ped
in c
olla
bora
tion
with
the
Old
er
Per
sons
Dire
ctor
ate.
0%
Num
ber
of y
outh
s pa
rtic
ipat
ing
in i
nter
gene
ratio
nal
prog
ram
mes
100 y
outh
s to
par
ticip
ate
in in
terg
ener
atio
nal
prog
ram
mes
12
0 y
outh
s pa
rtic
ipat
ed in
the
inte
rgen
erat
iona
l pro
gram
me
– 4
0 in
KZN
and
80
in G
aute
ng.
0%
Link
you
ths
with
eco
nom
ic
oppo
rtun
ities
In 2
005 y
outh
s ac
coun
ted
for
73%
of
the
7,8
mill
ion
unem
ploy
ed in
the
cou
ntry
Num
ber
of y
outh
s lin
ked
to
econ
omic
opp
ortu
nitie
s
Link
you
ths
to e
cono
mic
oppo
rtun
ities
79
1 y
outh
s lin
ked
to e
cono
mic
opp
ortu
nitie
s th
roug
h th
eir
part
icip
atio
n in
the
Mas
upa
Tsel
a Yo
uth
Pio
neer
Pro
gram
me
0%
Dev
elop
NP
Os
deliv
erin
g
serv
ices
to
yout
hs
Num
ber
of N
PO
s de
liver
ing
serv
ices
to
yout
hs
Aud
it an
d pr
ofile
NPO
s
deliv
erin
g se
rvic
es t
o yo
uths
11
0 y
outh
NP
Os
wer
e au
dite
d an
d pr
ofile
d in
eig
ht p
rovi
nces
.0
%
Rea
son
for
dev
iati
on1 T
here
wer
e de
lays
in t
he p
rocu
rem
ent
proc
esse
s fo
r ap
poin
ting
a se
rvic
e pr
ovid
er.

Department of Social Development | Annual Report 2010/2011 91
Goa
lTo
impr
ove
the
inco
me,
ass
ets,
and
cap
abili
ties
of p
oor
fam
ilies
and
com
mun
ities
to
enha
nce
thei
r liv
elih
oods
Ou
tcom
eR
educ
ed h
ouse
hold
pov
erty
Fun
ctio
nal
are
asS
trat
egic
ob
ject
ive
Bas
elin
eP
erfo
rman
ce in
dic
ator
Targ
etA
ctu
al o
utp
uts
% d
evia
tion
from
tar
get
Sus
tain
able
livel
ihoo
ds
Link
poo
r, vu
lner
able
and
mar
gina
lised
peo
ple
to
sust
aina
ble
livel
ihoo
ds a
nd
econ
omic
dev
elop
men
t
oppo
rtun
ities
8 m
illio
n ab
le-b
odie
d pe
ople
rece
ivin
g ch
ild s
uppo
rt g
rant
s
Num
ber
of b
enefi
ciar
ies
linke
d to
exi
stin
g an
d ne
w
deve
lopm
ent
proj
ects
/
prog
ram
mes
Link
4 5
00 b
enefi
ciar
ies
to e
xist
ing
and
new
deve
lopm
ent
proj
ects
/
prog
ram
mes
21
13
4 b
enefi
ciar
ies
wer
e lin
ked
to e
xist
ing
and
new
dev
elop
men
t
proj
ects
/pro
gram
mes
.
0%
Inte
grat
ed a
nd s
usta
inab
le
com
mun
ity d
evel
opm
ent
prog
ram
mes
and
ser
vice
s
desi
gned
Tool
kit
for
com
mun
ity
deve
lop m
ent
prac
titio
ners
(CD
Ps)
Com
plet
ion
of a
ctio
n pl
an f
or
impl
emen
ting
the
tool
kit
Dev
elop
act
ion
plan
for
impl
emen
ting
the
tool
kit
An
actio
n pl
an w
as d
evel
oped
and
impl
emen
ted.
0%
Num
ber
of C
DPs
trai
ned
to f
acili
tate
com
mun
ity
deve
lopm
ent
Trai
n 50 C
DPs
to f
acili
tate
com
mun
ity d
evel
opm
ent
35
4 C
DP
s an
d m
anag
ers
from
eig
ht p
rovi
nces
wer
e tr
aine
d
and
capa
cita
ted
on t
he S
ervi
ce L
evel
Agr
eem
ents
(SLA
) con
cept
and
tool
kit
0%
Num
ber
of in
tegr
ated
com
mun
ity d
evel
opm
ent
plan
s (IC
DPs)
impl
emen
ted
Dev
elop
ICD
Ps
Func
tion
is p
erfo
rmed
by
loca
l gov
ernm
ent
10
0%
1
Esta
blis
h so
cial
co-
oper
ativ
es
as a
cor
e el
emen
t of
soc
ial
serv
ice
deliv
ery
No
guid
elin
es o
n th
e
esta
blis
hmen
t of
soc
ial
coop
erat
ives
Com
plet
ion
of g
uide
lines
for
esta
blis
hing
soc
ial
coop
erat
ives
Dev
elop
gui
delin
es
for
esta
blis
hing
soc
ial
co-o
pera
tives
Dra
ft g
uide
lines
wer
e de
velo
ped.
0
%
Esta
blis
h ru
ral c
omm
unity
food
ban
ks
Urb
an c
omm
unity
foo
d ba
nks
in G
aute
ng, D
urba
n, P
ort
Eliz
abet
h an
d C
ape
Tow
n
Num
ber
of r
ural
com
mun
ity
food
ban
ks e
stab
lishe
d
Hel
p fo
ur p
rovi
nces
to
esta
blis
h fo
od b
anks
Five
pro
vinc
es w
ere
help
ed t
o es
tabl
ish
food
ban
ks, n
amel
y
Mpu
mal
anga
, Wes
tern
Cap
e, N
orth
Wes
t, Ea
ster
n C
ape
and
KZN
.
0%
Hel
p C
BO
s to
link
with
the
food
ban
k ne
twor
k
1 2
50
foo
d di
strib
utio
n ag
enci
es w
ere
linke
d w
ith t
he f
ood
bank
s,
and
prov
ided
16
89
2 7
95
mea
ls.
0%
Sus
tain
able
livel
ihoo
ds
Effe
ctiv
e m
anag
emen
t an
d
mon
itorin
g of
par
tner
CB
Os/
NG
Os
Lim
ited
capa
city
to
mon
itor
fund
ed C
BO
s/N
PO
s
Site
vis
its t
o al
l fun
ded
CB
Os
Com
plet
ion
of a
gree
men
ts/
cont
ract
s
Dev
elop
con
trac
ts/
agre
emen
ts a
nd u
nder
take
site
vis
its t
o al
l fun
ded
CB
Os
Con
trac
ts/a
gree
men
ts w
ere
deve
lope
d fo
r th
e H
emp
Pro
ject
, KH
AN
Y-
AIC
DD
-DS
D, a
nd U
jima
Bak
wen
a sh
oe-m
akin
g pr
ojec
t.
5%
2
Food
Ban
k SA
was
vis
ited
to a
sses
s th
e us
e of
R3,
3m in
DSD
fund
ing
0%
Rep
ort
on le
sson
s le
arnt
fro
m
the
man
agem
ent
of p
artn
er
orga
nisa
tions
Con
solid
ate
less
ons
lear
nt
from
man
agin
g pa
rtne
r
orga
nisa
tions
A r
epor
t w
as d
raft
ed o
n le
sson
s le
arnt
fro
m m
anag
ing
part
ner
orga
nisa
tions
0%
Rea
son
s fo
r d
evia
tion
1 T
his
is a
loca
l gov
ernm
ent
func
tion.
2 T
he a
ppro
val o
f su
bmis
sion
s w
ere
dela
yed.

92 Annual Report 2010/2011 | Department of Social Development
Pro
gra
mm
e 4:
Com
mu
nit
y D
evel
op
men
t
Goa
lTo
cre
ate
a su
stai
nabl
e en
viro
nmen
t fo
r se
rvic
e de
liver
y pa
rtne
rs (N
PO
s) t
hrou
gh c
apac
ity-b
uild
ing,
par
tner
ship
s, c
olla
bora
tion,
and
age
ncy
Ou
tcom
eA
n en
ablin
g en
viro
nmen
t in
whi
ch n
on-p
rofit
org
anis
atio
ns c
an b
e st
reng
then
ed a
nd s
usta
ined
Fun
ctio
nal
are
asS
trat
egic
ob
ject
ive
Bas
elin
eP
erfo
rman
ce in
dic
ator
Targ
etA
ctu
al o
utp
uts
% d
evia
tion
from
tar
get
Non
-pro
fit
orga
nisa
tions
and
part
ners
hips
Dev
elop
an
NP
O c
o-or
dina
tion
and
wor
k m
anag
emen
t m
odel
and
guid
elin
es
The
NPO
Act
C
ompl
etio
n of
NPO
coo
rdin
atio
n
and
man
agem
ent
guid
elin
es
Dev
elop
NPO
man
agem
ent
guid
elin
es
NP
O m
anag
emen
t gu
idel
ines
wer
e de
velo
ped.
The
y w
ill b
e
used
to
guid
e pr
ovin
ces
on m
anag
ing
all f
unde
d N
PO
s.
A f
ram
ewor
k fo
r st
reng
then
ing
NP
O r
egis
trat
ion
supp
ort
and
com
plia
nce
mon
itorin
g in
the
pro
vinc
es w
as
deve
lope
d an
d di
scus
sed.
All
prov
ince
s ac
cept
ed t
he
fram
ewor
k an
d be
gan
with
impl
emen
tatio
n.
0%
Str
engt
hene
d in
stitu
tiona
l
capa
city
of
prov
ince
s
MO
U s
igne
d by
all
prov
ince
s
Str
engt
hen
inst
itutio
nal c
apac
ity
of p
rovi
nces
All
prov
ince
s to
sig
n M
oU
Non
e of
the
pro
vinc
es s
igne
d th
e M
oU. T
he M
oU
appr
oach
was
red
irect
ed a
nd in
corp
orat
ed in
to t
he
plan
ned
NP
O p
olic
y.
An
NP
O p
olic
y do
cum
ent
was
dra
fted
whi
ch s
et o
ut t
he
prop
osed
rev
italis
atio
n of
NP
O r
egis
trat
ion
and
com
plia
nce
mon
itorin
g sy
stem
s in
the
pro
vinc
es.
All
issu
es m
eant
to
be a
ddre
ssed
in t
he M
oU w
ere
inco
rpor
ated
in t
he p
olic
y do
cum
ent.
0%

Department of Social Development | Annual Report 2010/2011 93
Goa
lTo
cre
ate
a su
stai
nabl
e en
viro
nmen
t fo
r se
rvic
e de
liver
y pa
rtne
rs (N
PO
s) t
hrou
gh c
apac
ity-b
uild
ing,
par
tner
ship
s, c
olla
bora
tion,
and
age
ncy
Ou
tcom
eA
n en
ablin
g en
viro
nmen
t in
whi
ch n
on-p
rofit
org
anis
atio
ns c
an b
e st
reng
then
ed a
nd s
usta
ined
Fun
ctio
nal
are
asS
trat
egic
ob
ject
ive
Bas
elin
eP
erfo
rman
ce in
dic
ator
Targ
etA
ctu
al o
utp
uts
% d
evia
tion
from
tar
get
Non
-pro
fit
orga
nisa
tions
and
part
ners
hips
Reg
istr
atio
n gu
idel
ines
Com
plet
ion
of N
PO
reg
istr
atio
n
and
com
plia
nce
syst
em a
nd
wor
k m
odel
doc
umen
t
Dev
elop
NP
O w
ork
man
agem
ent
mod
el.
NP
O r
egis
trat
ion
and
com
plia
nce
syst
em a
nd w
ork
mod
el d
ocum
ents
wer
e de
velo
ped
and
final
ised
.
Sta
ndar
d O
pera
ting
proc
edur
es f
or N
PO
reg
istr
atio
ns
and
Mon
itorin
g C
ompl
ianc
e de
velo
ped
and
final
ised
.
All
prov
ince
s es
tabl
ishe
d a
stru
ctur
e fo
r N
PO
regi
stra
tion
and
com
plia
nce
mon
itorin
g su
ppor
t.
0%
Dev
elop
nor
ms
and
stan
dard
s
for
NP
O g
over
nanc
e
Cod
e of
goo
d pr
actic
eC
ompl
etio
n of
nor
ms
and
stan
dard
s
Dev
elop
and
fina
lise
norm
s an
d
stan
dard
s
Nor
ms
and
stan
dard
s w
ere
deve
lope
d an
d fin
alis
ed.
0%
Impr
ove
NP
O f
undi
ng a
nd
subs
idie
s
Pol
icy
on fi
nanc
ial a
war
dsC
ompl
etio
n of
NPO
fun
ding
polic
y an
d gu
idel
ines
Dev
elop
NPO
fun
ding
pol
icy
and
guid
elin
es
NP
O f
undi
ng g
uide
lines
wer
e de
velo
ped
and
pres
ente
d
to t
he c
ross
-sec
tora
l tas
k te
am o
n N
PO
s. T
hey
wer
e
also
pre
sent
ed t
o an
d ac
cept
ed b
y al
l nin
e pr
ovin
ces
The
guid
elin
e w
ere
due
to b
e im
plem
ente
d by
all
prov
ince
s in
the
nex
t fin
anci
al y
ear.
0%
NPO
Act
An
appr
oved
NPO
pol
icy
Dev
elop
and
fina
lise
an N
PO
polic
y
A d
iscu
ssio
n do
cum
ent
on N
PO
pol
icy
was
dev
elop
ed,
disc
usse
d w
ith v
ario
us s
take
hold
ers,
and
pre
sent
ed t
o
MA
NC
O.
10
%1
Impr
ove
NP
O r
egis
trat
ion
proc
ess
and
com
plia
nce
syst
ems
Inef
ficie
nt r
egis
trat
ion
and
com
plia
nce
mon
itorin
g sy
stem
Onl
ine
NPO
reg
istr
atio
n an
d
com
plia
nce
syst
em
Dev
elop
an
onlin
e N
PO
regi
stra
tion
and
com
plia
nce
mon
itorin
g sy
stem
The
syst
em w
as d
evel
oped
and
te
sted
. The
dat
abas
e
was
bei
ng m
appe
d in
ord
er t
o al
low
dat
a m
igra
tion.
Pro
blem
s ar
ose
in r
espe
ct o
f da
ta m
igra
tion,
and
the
proj
ect
was
dis
cont
inue
d.
10
0%
2
Slo
w r
egis
trat
ion
proc
ess
% o
f N
PO
s re
gist
ered
with
in
two
mon
ths
of a
pplic
atio
n
Reg
iste
r 90%
of
NP
Os
with
in
two
mon
ths
of a
pplic
atio
n
All
appl
icat
ions
wer
e pr
oces
sed
with
in t
wo
mon
ths.
The
DSD
rec
eive
d 15
232
app
licat
ions
for
regi
stra
tion
– a
bout
60
a da
y. 1
0 23
8 (6
9%) w
ere
regi
ster
ed, a
nd
4 72
3 (3
6%) d
id n
ot m
eet t
he r
egis
trat
ion
requ
irem
ents
.
App
licat
ions
incr
ease
d by
6%
ove
r th
e pr
evio
us
finan
cial
yea
r, an
d th
e N
PO
reg
iste
r gr
ew b
y 1
4%
.
0%

94 Annual Report 2010/2011 | Department of Social Development
Pro
gra
mm
e 4:
Com
mu
nit
y D
evel
op
men
t
Goa
lTo
cre
ate
a su
stai
nabl
e en
viro
nmen
t fo
r se
rvic
e de
liver
y pa
rtne
rs (N
PO
s) t
hrou
gh c
apac
ity-b
uild
ing,
par
tner
ship
s, c
olla
bora
tion,
and
age
ncy
Ou
tcom
eA
n en
ablin
g en
viro
nmen
t in
whi
ch n
on-p
rofit
org
anis
atio
ns c
an b
e st
reng
then
ed a
nd s
usta
ined
Fun
ctio
nal
are
asS
trat
egic
ob
ject
ive
Bas
elin
eP
erfo
rman
ce in
dic
ator
Targ
etA
ctu
al o
utp
uts
% d
evia
tion
from
tar
get
Non
-pro
fit
orga
nisa
tions
and
part
ners
hips
10%
NPO
com
plia
nce
% o
f N
PO
s co
mpl
iant
with
the
NPO
Act
25%
of
NPO
s to
com
ply
with
the
NPO
Act
16
39
2 o
f 5
4 4
98
reg
iste
red
NP
Os
subm
itted
the
ir
annu
al r
epor
ts o
n tim
e. T
his
mea
ns t
hat
30
% o
f
regi
ster
ed N
PO
s co
mpl
ied
with
the
Act
.
From
the
tar
get
of 9
52
6 n
otic
es t
o no
n-co
mpl
ying
NP
Os
that
mus
t be
sen
t on
ly 1
2 6
25
(33
%) n
otic
es
wer
e se
nt.
0%
Inef
ficie
nt N
PO
reg
istr
atio
n an
d
com
plia
nce
mon
itorin
g sy
stem
Effe
ctiv
e an
d ef
ficie
nt N
PO
regi
stra
tion
and
com
plia
nce
mon
itorin
g sy
stem
Thre
e pr
ovin
ces
to u
tilis
e
onlin
e N
PO
reg
istr
atio
n an
d
com
plia
nce
mon
itorin
g sy
stem
This
did
not
occ
ur a
s th
e on
line
syst
em w
as n
ot
oper
atio
nalis
ed.
10
0%
3
Non
e (n
o ex
istin
g sy
stem
)%
of
NPO
s us
ing
onlin
e
regi
stra
tion
and
com
plia
nce
syst
em
5%
of
NPO
s to
use
the
onl
ine
regi
stra
tion
and
com
plia
nce
syst
em
No
NP
Os
used
the
sys
tem
, as
it w
as n
ot
oper
atio
nalis
ed.
10
0%
4
Impl
emen
tatio
n of
pha
se o
ne
of C
BF
NPO
cap
acity
-bui
ldin
g
fram
ewor
k
Dev
elop
and
app
rove
an
NP
O
capa
city
-bui
ldin
g fr
amew
ork
The
fram
ewor
k w
as d
evel
oped
and
dis
cuss
ed w
ith
rele
vant
sta
keho
lder
s, in
clud
ing
prov
inci
al d
epar
tmen
ts.
All
the
prov
inci
al d
epar
tmen
ts a
ppro
ved
the
fram
ewor
k
and
it w
as in
corp
orat
ed in
to t
he d
raft
NP
O p
olic
y
docu
men
t.
0%
Rea
son
s fo
r d
evia
tion
1 T
his
docu
men
t w
as d
iscu
ssed
but
not
app
rove
d as
MA
NC
O d
ecid
ed t
hat
mor
e in
form
atio
n w
as n
eede
d.2 T
his
proj
ect
was
dis
cont
inue
d af
ter
the
with
draw
al o
f th
e de
velo
per.
3 T
he o
nlin
e sy
stem
was
not
intr
oduc
ed b
ecau
se In
form
atio
n Te
chno
logy
and
SIT
A w
ithdr
ew f
rom
the
pro
ject
.4 T
he o
nlin
e sy
stem
was
not
intr
oduc
ed b
ecau
se In
form
atio
n Te
chno
logy
and
SIT
A w
ithdr
ew f
rom
the
pro
ject
.

Strategy and Governance
Programme 5
96 Annual Report 2010/2011 | Department of Social Development
PART B: PROGRAMME PERFORMANCE
Programme 5: Strategy and Governance
Strategic goalTo lead the strategic planning process across the national and
provincial Departments of Social Development; ensure that the
national Department’s core strategic functions are integrated
with its strategic, oversight, monitoring, and evaluation capacity;
improve social policy planning; and strengthen the implementation
of policies as well as performance management in respect of all
entities reporting to the Department.
Measurable objectivesTo provide sector-wide strategy, leadership, oversight, alignment,
and coordination of mandates, strategies, and social and
population policies.
Service delivery objectives and indicators
Recent outputs
Strategy, planning, development
and risk management
The Minister participated in the 55th session of the UN
Commission on the Status of Women, held in New York from 24
February to 5 March 2011. Its theme was ‘Access of women and
girls to education, training, science and technology, including
the promotion of equal access of women to full employment and
decent work’. The Department also formed part of the delegation
that presented the South African CEDAW Ten Year Review to the
CEDAW Committee in Geneva. However, the DSD Strategy for
Women could not be implemented due to a lack of funding.
A Strategic Plan (2011–2014) was tabled in Parliament and
shared with the broader sector through various intergovernmental
forums. The strategy unit also developed an Annual Performance
Plan which restructures the Strategic Plan into manageable
targets. Both documents are supported by an Operational
Plan that spells out annual and quarterly targets. The planning
environment articulated in these frameworks demonstrated a
shift away from a traditional focus on outputs to results-based
management, which is conducive to improved service delivery.
Vital to this process was the engagement of management at
various levels during the development of the planning documents,
which improved officials’ understanding of the Department’s
responsibilities as well as their accountability.
The Department developed a coordinated response to the
President’s State of the Nation Address in February 2011, and
shared this with the Portfolio Committee on Social Development,
Heads of Provincial Department, and MinMec for the purpose of
alignment planning at the sector level and the implementation of
government priorities.
Risk plans were developed for all business units in the Department,
and were analysed and consolidated in a risk assessment report
for 2010/11 which was approved by the Director-General. The
risk profile was monitored, and progress reports were compiled
and presented to various internal structures. Managers were
trained in risk management, and a sector risk forum involving the
nine provinces, SASSA, and the NDA was established. The top ten
risks for the provinces and entities were analysed, and a sector
risk profile was developed. The audit findings for all nine provinces
were analysed, and a report compiled.
Supply chain processes were re-engineered in order to improve
operational efficiency. Two system specifications for improving
stores and travel processes were developed and communicated to
the IT unit, which then developed the systems. A report on process
improvements in organisational effectiveness was compiled, and
support was provided when required on the norms and standards
project.
A sectoral infrastructure policy was developed and discussed
with national and provincial stakeholders, including the provincial
departments and SASSA. Flowing from this, an infrastructure
toolkit was developed that included design guidelines for 15
different types of facilities as well as planning guidelines. An MTEF
infrastructure plan was also developed for the sector.
The customer care unit sought to implement the service
culture reform programme as part of the implementation of the
customer care strategy. The service culture reform programme

PART B: PROGRAMME PERFORMANCE
Department of Social Development | Annual Report 2010/2011 97
is a multifaceted programme aimed at fostering a customer-
centred service culture in the Department. It comprises a range
of interrelated interventions aimed at improving the Department’s
look and feel, making it more accessible to people using its
services, and creating a customer-centred ethos.
To this end, the Department developed a model for sharing local
offi ces with SASSA. These facilities will be disability-friendly;
child care and old age friendly, and will have dedicated sick
bays; reception facilities, and queue management systems.
Implementation of the model started in the Western Cape, the
Eastern Cape, KwaZulu-Natal and the Northern Cape. Other
provinces committed themselves to developing and implementing
the model.
As part of the service culture reorientation programme, the unit
began to develop a training programme for fostering a customer-
centred ethos among offi cials. Terms of reference were developed
for a train-the-trainer programme due to be rolled out in the
provinces in the next fi nancial year.
Monitoring and evaluation
The Department embarked on a major exercise to align its
monitoring and evaluation systems with the government’s new
outcomes-based approach. A catalogue of indicators for the social
sector was reviewed, and specifi c outcome statements, social
sector indicators, and tools for measurement were developed and
linked to the 12 government outcomes. This was done by way of
a consultative and participatory process.
The monitoring and evaluation framework was reviewed and will
be used to guide monitoring and evaluation practice in the social
sector. The Department developed indicators for its Strategic Plan
to ensure that it conforms with the outcomes-based model, and
that planning and monitoring are accurately aligned.
The Department continued its efforts to build M&E capacity among
social sector practitioners. Seventy-four offi cials were trained in
M&E, and 38 attended an intensive fi ve-day course known as
the International Programme for Development Evaluation Training
(IPDET), managed by the World Bank and Carleton University

98 Annual Report 2010/2011 | Department of Social Development
PART B: PROGRAMME PERFORMANCE
Programme 5: Strategy and Governance
(Canada). Officials were also trained on ensuring data quality, and
using a monitoring tool for ECD.
The unit helped to develop South Africa’s Millennium Development
Goals Report, and co-ordinated the Department’s contribution
towards achieving goal one, namely eradicating extreme poverty
and hunger. It helped to compile the second African Peer Review
Mechanism Report. It also produced a key statistics report,
quarterly facts and figures, a surveillance report on maternal
orphans. The report on maternal orphans was launched by the
Minister in December in KwaZulu-Natal.
The unit designed and initiated the implementation of a
beneficiary satisfaction survey for the social development sector.
Substantial progress has been made with the implementation of
an impact evaluation of the child support grant.
Population and development
The unit produced a research report entitled Population Trends
Analysis on HIV and AIDS and Health Issues with Demographic
Implications (March 2011), encapsulating evidence from two
research reports dealing with aspects of HIV and AIDS and
other health concerns with demographic consequences. It also
produced HIV & AIDS Case Study Volume 3 and disseminated it
to provincial population units (PPUs) and municipal districts which
participated in the research. A database of community- and faith-
based organisations was established to help the unit assess local
capacity-building needs in respect of issues with populations
implications, especially HIV & AIDS and gender issues. CSOs were
profiled in three provinces, focusing on rural nodes, to assess
their capacity needs with regard to integrating HIV & AIDS into
planning processes. The HWSETA agreed to fund the training of
380 stakeholders on integrating HIV & AIDS into development
planning through the Public Administration Leadership and
Management Academy (PALAMA).
A paper on discovering and developing the untapped economic
and social potential of young people was prepared and presented
to a stakeholder meeting in May 2010. After the HSRC had
granted ethical clearance for a study of factors associated with
teenage pregnancies, the project was piloted in Limpopo. Funding
was secured to roll out the research in the Eastern Cape and
Mpumalanga as well. The research proposal for a gap analysis
of youth services was revised to accommodate the social sector
infrastructure demand model (SSIDM). A gap analysis concept
paper on the delivery of services to youths was completed as part of
the project. A content analysis of population education concepts in
school curricula was completed. This evidence was meant to inform
the introduction of relevant population content into school curricula.
An overview of the state of gender equality, equity, and the
empowerment of women in South Africa was prepared and
presented to a two-day stakeholder meeting in May 2010. One
national and five provincial workshops were conducted to enhance
technical capacity for mainstreaming gender and population factors
in social research and planning processes, in order to increase the
gender responsiveness of plans and of social research in general.
PALAMA trained 24 key stakeholders on gender mainstreaming in
a population context, and they were involved in developing a roll-out
strategy for rural and urban nodes.
Eleven South African delegates attended a regional population,
environment and development (PED) nexus training course held
in Dakar, Senegal, in May 2010. Also in May, the chairpersons
of the Social Development and Environment Portfolio Committees
attended PED nexus and societies in transition training courses
in Malawi. Forty delegates, including three councillors from the
Nelson Mandela Bay Metropolitan Municipality, also attended the
Societies in Transition training course.
In July 2010, the University of the Free State presented a PED
nexus training course for 41 participants. Fifty-three South
African participants completed the two qualifying training courses
and qualified to attend the International LEAD Session (ILS) in
Nelson Mandela Bay. All ILS trainees, including more than 150
international participants, qualified as LEAD Fellows. Following
May 2010, six seminars forming part of the Local Footprint
Programme were held at the Nelson Mandela Bay Municipality,
involving more than 120 stakeholders from CSOs, government
departments, and academia. The seminars dealt with human
settlements in fragile ecosystems; biodiversity and conservation;
industrial development; food security: agriculture and fisheries;
culture, heritage and indigenous knowledge systems; and
population, climate change and development. A publication on
PED case studies was produced and used as training material at
the PED training courses.

PART B: PROGRAMME PERFORMANCE
Department of Social Development | Annual Report 2010/2011 99
A booklet with information on all population capacity-building
initiatives was compiled in order to market the PED training courses
offered by the National Population Unit. The ultimate aim was to
develop a climate change strategy for the Nelson Mandela Bay
Metropolitan Municipality. Promotional and educational material
was disseminated at exhibitions during the ILS to strengthen
population advocacy and IEC on PED among local stakeholders.
Existing partnerships in the population and development field were
strengthened and new ones developed, in support of population
policy implementation. The findings and recommendations of a ten-
year review of population policy implementation were extensively
discussed with stakeholders across the country, also at a two-
day consultative workshop involving more than 200 stakeholders
from all spheres of government and civil society. The discussions
helped the unit to finalise a five-year population strategy with four
strategic focus areas. In addition, a range of population research
projects, as well as capacity-building and information, education
and communication projects were implemented throughout the
year in support of population policy implementation, also at the
local government level.
Intergovernmental population capacity-building and
training: In this area the unit focused on promoting inter governmental
population and development projects involving local and district
municipalities. Capacity-building and training workshops were held
as part of the initiative to introduce population issues into local
development plans. A strategy was approved to help municipalities
roll out a guide on integrating population information into IDPs,
and four local workshops were held on applying the guidelines for
mainstreaming gender into IDPs.
Some 200 government officials, two MPs, and 156 international
participants were reached during eight different capacity-building
courses, including APSTAR, PED nexus training, societies in
transition, a LEAD international session (on population, climate
change and development), gender mainstreaming, integrating
population into development, and research, monitoring and
evaluation. During these workshops, relevant information
was disseminated to participants to promote an awareness
and understanding of the relevance of population trends and
dynamics for planning purposes. Existing partnerships with local
stakeholders, including universities and training institutions,
were maintained and strengthened to support intergovernmental
projects in the context of population policy implementation.
The Department, as custodian of the population policy, is also
responsible for coordinating, monitoring and evaluating projects
and activities related to the Third United Nations Population Fund
(UNFPA) Country Support Programme (CSP) for South Africa. Periodic
coordination forum meetings were held, attended by representatives
of the UNFPA, key government departments and PPUs, to assess
progress with and align the planning and implementation of CSP
projects and activities in the four priority provinces (Eastern Cape,
KwaZulu Natal, the Free State and Limpopo). The CSP Master
Plan, developed in February 2011, reflects details of national and
provincial sub-programme and component projects, along with
UNFPA budget allocations for the period January to December
2011. The partnerships between the Department, UNFPA, other key
government departments, and CSOs in support of population policy
implementation were due to continue.
Population research: Population research projects centred
on key research questions relating to HIV & AIDS as well as
health concerns with demographic implications; youth services
and teenage pregnancies; gender equity and equality; and the
empowerment of women. Research reports completed include an
appraisal of the national intergovernmental HIV & AIDS research
collaboration portfolio, in conjunction with Joint Economics Aids
and Poverty Programme (JEAPP); a concept paper on international
research collaboration in the context of PPD, submitted to the
EU; and a concept paper on migration research in line with EU
prescripts, with technical assistance from DIRCO and the EU, and
submitted to the EU as a funding proposal. It was followed by an
SA-EU video conference on the Migration Dialogue, and a concept
document on international research collaboration presented to the
PPD meeting in Indonesia in October 2010.
Population and development information and knowledge
service: The Population and Development Information and
Knowledge Centre (PDI&KC) was improved, which included
updating the population website. More people visited the website
and registered greater satisfaction with its contents as well as
the PDI&KC’s electronic information services. The Population
Resource Centre was also upgraded and updated, with relevant
publications and new sources on population and related topics

100 Annual Report 2010/2011 | Department of Social Development
PART B: PROGRAMME PERFORMANCE
Programme 5: Strategy and Governance
added on a regular basis. A population database was established,
containing details of national and international stakeholders and
partners.
International population affairs: The Department plays a
leading and progressive role in international population affairs, as
refl ected in its international population strategy and agenda. This
includes participation in various UN bodies and activities, notably
the annual conference of the UN Commission on Population
and Development (UNCPD). In April 2010, the Department led a
government delegation to the 42nd session of the UNCPD in New
York, which explored how the UNCPD could contribute to achieving
the Millennium Development Goals. South Africa continued to
participate in Partners in Population and Development (PPD),
an alliance of 25 developing countries that promote population,
development, and sexual and reproductive health and rights.
A country strategy and progress report were submitted to the
PPD Board in 2010, and the South African Government will host
the annual PPD board meeting and conference in the 2011/12
fi nancial year.
Population advocacy and information, education and
communication (IEC): The UNFPA’s State of the World Population
Report 2010 was released in Cape Town on World Population Day
2010. World Population Day was observed in the provinces in July
and August.
Promotional and educational material was disseminated to
stakeholders in all three spheres of government. This included
HIV and AIDS Volume 3; Guidelines for Mainstreaming Gender into
Social Research; a concept paper on social cohesion; the ten-
year review of Population Policy implementation; a booklet on
population capacity-building initiatives, aimed at marketing PED
training courses offered by the National Population Unit; pamphlets

PART B: PROGRAMME PERFORMANCE
Department of Social Development | Annual Report 2010/2011 101
for the PED Nexus training and LEAD International Session; PED
quarterly newsletters; and population research reports and
publications. The National Population Unit also conducted five
workshops aimed at building capacity for mainstreaming gender
in social research; and five urban and six rural node workshops,
aimed at disseminating research findings on building sustainable
livelihoods and integrating gender issues into IDPs.
Social policy
The unit made further progress in institutionalising evidence-
based policy-making in the country by ensuring that all new
policies were based on research evidence. In the process,
it worked with directorates reviewing existing policies and
formulating new policies. Members of the unit participated in
government-wide platforms aimed at addressing poverty, thereby
ensuring that the Department continued to play a major role in
discussing and implementing initiatives employed in the fight
against poverty.
As part of its ongoing efforts to build capacity in social policy
analysis and formulation, the unit presented another training
course with social policy experts from Oxford University and
Rhodes University under the SACED (Strengthening Analytical
Capacity in Evidence-Based Decision Making) Programme,
funded by DfID. Participants included officials of the national and
provincial departments involved in policy formulation and policy
implementation. Since the start of the project, all DSD officials
at director level have received training in social policy and social
policy analysis.
In October 2010, the unit presented a Southern Africa Social
Policy and Social Policy Analysis course for high-level civil
servants in southern Africa in Swakopmund, Namibia. This formed
part of a strategy for building social policy analysis in support of
the African Agenda. In November 2010 the unit presented a social
policy training course for members of the Social Development
Portfolio Committee to ensure the deepening of social policy
discourse and the promotion of evidence-based policy-making in
the country.
Entity oversight and management
The Minister and the NDA Board signed a memorandum of
agreement (MoA) aimed at strengthening the NDA’s accountability in
respect of performance and reporting. Powers related to the PFMA
and powers under Treasury regulations were delegated to the NDA.
Terms of reference for public entity interface meetings were
developed and implemented. These are aimed at guiding the
interactions between the Minister and public entities about policy
implementation and service delivery targets, as well as strategic
decisions by various departmental forums impacting on the work
of public entities.
Special projects
The Department, through the Special Projects Office, continued
to play a vital role in coordinating Expanded Public Works
Programme (EPWP) initiatives for the social sector. This will
enable the Department to contribute to the creation of decent
employment through inclusive growth. In this respect, the
Department reached the following milestones:
It successfully convened the annual social sector conference
where the Action Plan for the previous year was reviewed
and project plans for the following financial year were
conceptualised.
It successfully convened national steering committee meetings
aimed at reviewing provincial performances.
It presented monthly reports to the Social Protection and
Community Development and Human Development Clusters.
Among the most notable achievements in the reporting period was
the expansion of EPWP beyond the pilot programmes of HCBC
and ECD to include the mass literacy campaign Kha Ri Gude,
the National School Nutrition Programme, the Mass Participation
Programme in Sport, and the Community Safety Programme.
The Social Sector created 110 653 jobs, exceeding the
annual target of 96 000. Some 61 322 of these were full-time
equivalents. This achievement will contribute significantly to the
sector target of creating 750 000 jobs by 2014.
Regulatory mechanisms: The revised Ministerial Determination
and Code of Good Practice were completed and submitted to
NEDLAC. These instruments are meant to protect EPWP workers
against exploitation as they prescribe minimum conditions of work.
The two documents were approved by the Minister of Labour and

102 Annual Report 2010/2011 | Department of Social Development
PART B: PROGRAMME PERFORMANCE
Programme 5: Strategy and Governance
Performance targets achieved
Deviation Status Total targets
■ 0–25% Achieved 57
■ 26–75% In progress 6
■ 76–100% Not achieved 1
61
57
0
10 000
20 000
30 000
40 000
50 000
60 000
70 000
AuditedActual
FinalAppropraition
Budgeted and actual expenditure
R61 447
R65 903
came into effect in November 2010. Among other things, they
regulate the minimum daily pay for EPWP workers.
Comprehensive EPWP incentive grant: National Treasury
approved a R5,3 billion EPWP incentive grant across all sectors for
creating more jobs and expanding service delivery. The social sector
received R243 million for this purpose in the year under review.
Support for military veterans: The Department worked on
providing services to destitute war veterans and their dependents,
including reviewing the Social Assistance Act; supporting the
South African Military Veterans Association (SANMVA); providing
psychosocial support and trauma counselling; assisting with the
profiling of veterans; and providing Social relief of distress grants to
those requiring such support.
Kwanda social mobilisation programme: This programme – run
in partnership with Soul City – was extended beyond the original
communities to Galeshewe in the Northern Cape and Meyerton
in Gauteng, and Phuza Wize, an anti-alcohol abuse initiative,
was rolled out. The 257 participants in Galeshewe built a crèche,
renovated an old age home, established a two-acre garden as well
as recycling and catering enterprises, and participated in the HIV
and STI prevention programme One Love.
The Department also undertook an impact evaluation of the
Kwanda programme, focusing on the role of TV in development,
the role of community support, and the role of partnerships in
general and partnerships with local government in particular.
In recognition of the success of Kwanda, Oxfam Novib in the
Netherlands invited the Department’s Special Project Office to
make a presentation on the programme. In addition, a Kwanda
learning convocation was held in February 2011 to reflect on
the programme and distil lessons from it relevant to the broader
development discourse. Sessions were held on social mobilisation,
social cohesion, community leadership, community coaching,
citizen organisation, and government delivery and developmental
TV. Plans to present 10 one-hour talk shows on SABC 1 focusing
on community development are far advanced. These shows will be
broadcast live and will involve members of the audience engaging
with development specialists.
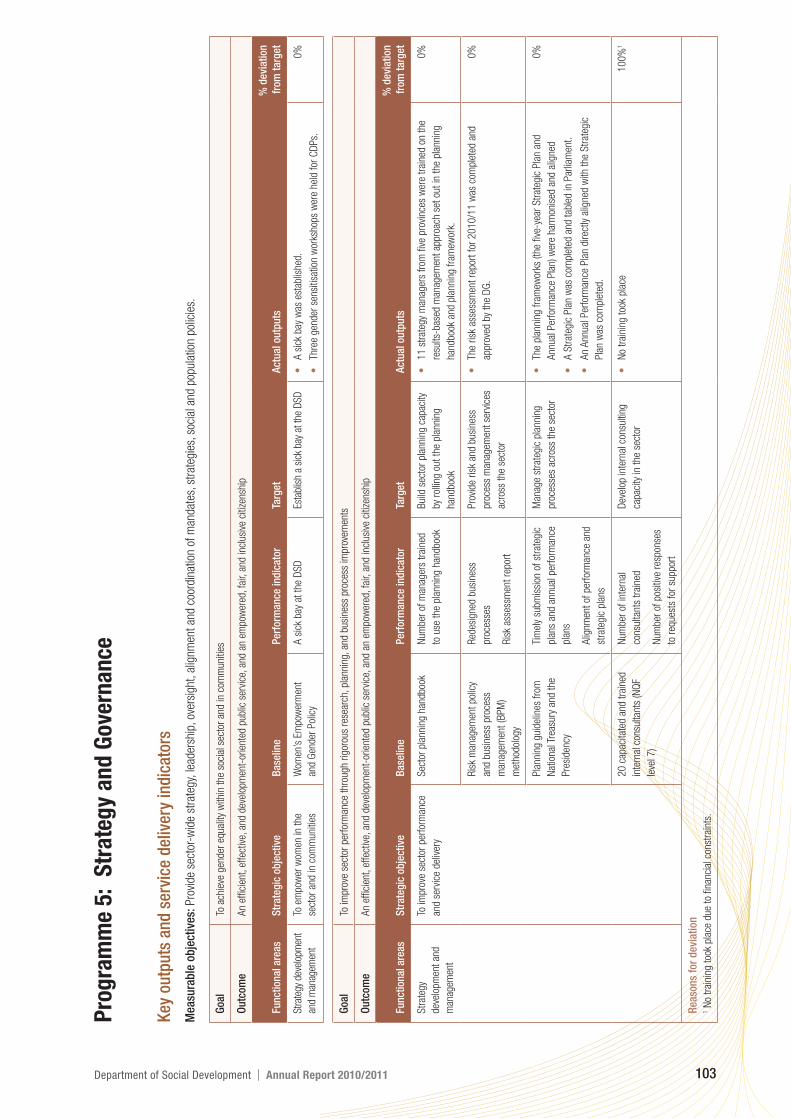
Department of Social Development | Annual Report 2010/2011 103
Pro
gra
mm
e 5:
Str
ate
gy
an
d G
ove
rna
nce
Key
ou
tpu
ts a
nd
ser
vice
del
iver
y in
dic
ator
s
Mea
sura
ble
ob
ject
ives
: P
rovi
de s
ecto
r-w
ide
stra
tegy
, lea
ders
hip,
ove
rsig
ht, a
lignm
ent
and
coor
dina
tion
of m
anda
tes,
str
ateg
ies,
soc
ial a
nd p
opul
atio
n po
licie
s.
Goa
lTo
ach
ieve
gen
der
equa
lity
with
in t
he s
ocia
l sec
tor
and
in c
omm
uniti
es
Ou
tcom
eA
n ef
ficie
nt, e
ffec
tive,
and
dev
elop
men
t-or
ient
ed p
ublic
ser
vice
, and
an
empo
wer
ed, f
air,
and
incl
usiv
e ci
tizen
ship
Fun
ctio
nal
are
asS
trat
egic
ob
ject
ive
Bas
elin
eP
erfo
rman
ce in
dic
ator
Targ
etA
ctu
al o
utp
uts
% d
evia
tion
from
tar
get
Stra
tegy
dev
elop
men
t
and
man
agem
ent
To e
mpo
wer
wom
en in
the
sect
or a
nd in
com
mun
ities
Wom
en’s
Em
pow
erm
ent
and
Gen
der
Pol
icy
A s
ick
bay
at t
he D
SD
Es
tabl
ish
a si
ck b
ay a
t the
DSD
A s
ick
bay
was
est
ablis
hed.
Thre
e ge
nder
sen
sitis
atio
n w
orks
hops
wer
e he
ld f
or C
DP
s.
0%
Goa
lTo
impr
ove
sect
or p
erfo
rman
ce t
hrou
gh r
igor
ous
rese
arch
, pla
nnin
g, a
nd b
usin
ess
proc
ess
impr
ovem
ents
Ou
tcom
eA
n ef
ficie
nt, e
ffec
tive,
and
dev
elop
men
t-or
ient
ed p
ublic
ser
vice
, and
an
empo
wer
ed, f
air,
and
incl
usiv
e ci
tizen
ship
Fun
ctio
nal
are
asS
trat
egic
ob
ject
ive
Bas
elin
eP
erfo
rman
ce in
dic
ator
Targ
etA
ctu
al o
utp
uts
% d
evia
tion
from
tar
get
Str
ateg
y
deve
lopm
ent
and
man
agem
ent
To im
prov
e se
ctor
per
form
ance
and
serv
ice
deliv
ery
Sec
tor
plan
ning
han
dboo
kN
umbe
r of
man
ager
s tr
aine
d
to u
se t
he p
lann
ing
hand
book
Bui
ld s
ecto
r pl
anni
ng c
apac
ity
by r
ollin
g ou
t th
e pl
anni
ng
hand
book
11
str
ateg
y m
anag
ers
from
five
pro
vinc
es w
ere
trai
ned
on t
he
resu
lts-b
ased
man
agem
ent
appr
oach
set
out
in t
he p
lann
ing
hand
book
and
pla
nnin
g fr
amew
ork.
0%
Ris
k m
anag
emen
t po
licy
and
busi
ness
pro
cess
man
agem
ent
(BPM
)
met
hodo
logy
Red
esig
ned
busi
ness
proc
esse
s
Ris
k as
sess
men
t re
port
Pro
vide
ris
k an
d bu
sine
ss
proc
ess
man
agem
ent
serv
ices
acro
ss t
he s
ecto
r
The
risk
asse
ssm
ent
repo
rt f
or 2
01
0/1
1 w
as c
ompl
eted
and
appr
oved
by
the
DG
.
0%
Pla
nnin
g gu
idel
ines
fro
m
Nat
iona
l Tre
asur
y an
d th
e
Pre
side
ncy
Tim
ely
subm
issi
on o
f st
rate
gic
plan
s an
d an
nual
per
form
ance
plan
s
Alig
nmen
t of
per
form
ance
and
stra
tegi
c pl
ans
Man
age
stra
tegi
c pl
anni
ng
proc
esse
s ac
ross
the
sec
tor
The
plan
ning
fra
mew
orks
(the
five
-yea
r S
trat
egic
Pla
n an
d
Ann
ual P
erfo
rman
ce P
lan)
wer
e ha
rmon
ised
and
alig
ned
A S
trat
egic
Pla
n w
as c
ompl
eted
and
tab
led
in P
arlia
men
t.
An
Ann
ual P
erfo
rman
ce P
lan
dire
ctly
alig
ned
with
the
Str
ateg
ic
Pla
n w
as c
ompl
eted
.
0%
20 c
apac
itate
d an
d tr
aine
d
inte
rnal
con
sulta
nts
(NQ
F
leve
l 7)
Num
ber
of in
tern
al
cons
ulta
nts
trai
ned
Num
ber
of p
ositi
ve r
espo
nses
to r
eque
sts
for
supp
ort
Dev
elop
inte
rnal
con
sulti
ng
capa
city
in t
he s
ecto
r
No
trai
ning
too
k pl
ace
10
0%
1
Rea
son
s fo
r d
evia
tion
1 N
o tr
aini
ng t
ook
plac
e du
e to
fina
ncia
l con
stra
ints
.

104 Annual Report 2010/2011 | Department of Social Development
Pro
gra
mm
e 5:
Str
ate
gy
an
d G
ove
rna
nce
Goa
lTo
est
ablis
h an
inte
grat
ed a
nd c
usto
mer
-cen
tred
soc
ial i
nfra
stru
ctur
e an
d or
gani
satio
nal c
ultu
re
Ou
tcom
eA
n ef
ficie
nt, e
ffec
tive,
and
dev
elop
men
t-or
ient
ed p
ublic
ser
vice
, and
an
empo
wer
ed, f
air,
and
incl
usiv
e ci
tizen
ship
Fun
ctio
nal
are
asS
trat
egic
ob
ject
ive
Bas
elin
eP
erfo
rman
ce in
dic
ator
Targ
etA
ctu
al o
utp
uts
% d
evia
tion
from
tar
get
Str
ateg
y
deve
lopm
ent
and
man
agem
ent
To b
uild
cus
tom
er c
are
capa
city
and
soci
al in
fras
truc
ture
in t
he
soci
al s
ecto
r
Cus
tom
er c
are
mod
el a
nd
stra
tegy
Num
ber
of s
ites
whe
re th
e
cust
omer
car
e cu
lture
ref
orm
prog
ram
me
is r
olle
d ou
t
Rol
l out
cus
tom
er c
are
cultu
re
refo
rm p
rogr
amm
e ac
ross
nine
des
igna
ted
site
s
Pro
vinc
ial p
lans
wer
e de
velo
ped
for
impl
emen
ting
the
cust
omer
car
e st
rate
gy, a
nd t
he u
nit
supp
orte
d th
e pr
ovin
ces
in
impl
emen
ting
the
stra
tegy
.
Des
igns
wer
e de
velo
ped
for
the
loca
l fro
nt o
ffice
ref
orm
prog
ram
me.
A r
epor
t w
as c
ompl
eted
on
the
co-l
ocat
ion
vers
us c
o-sh
arin
g
loca
l fro
nt o
ffice
mod
els.
93
% o
f co
mpl
aint
s w
ere
reso
lved
.
Term
s of
ref
eren
ce f
or a
tra
in-a
-tra
iner
pro
gram
me
wer
e
final
ised
and
sub
mitt
ed t
o su
pply
cha
in f
or b
id e
valu
atio
n.
0%
Sec
tor
anal
ysis
Infr
astr
uctu
re
repo
rt
A s
ecto
ral i
nfra
stru
ctur
e po
licy
and
plan
Dev
elop
sec
tora
l inf
rast
ruct
ure
polic
y an
d pl
an
The
polic
y an
d pl
an w
ere
com
plet
ed.
0%
Goa
lTo
impr
ove
sect
or p
erfo
rman
ce t
hrou
gh r
igor
ous
rese
arch
, pla
nnin
g, a
nd b
usin
ess
proc
ess
impr
ovem
ents
con
sist
ent
with
the
dem
and
for
soci
al d
evel
opm
ent
serv
ices
and
pro
duct
s
Ou
tcom
eA
n ef
ficie
nt, e
ffec
tive,
and
dev
elop
men
t-or
ient
ed p
ublic
ser
vice
, and
an
empo
wer
ed, f
air,
and
incl
usiv
e ci
tizen
ship
Fun
ctio
nal
are
asS
trat
egic
ob
ject
ive
Bas
elin
eP
erfo
rman
ce in
dic
ator
Targ
etA
ctu
al o
utp
uts
% d
evia
tion
from
tar
get
Mon
itorin
g an
d
eval
uatio
n
To d
evel
op f
unct
iona
l
mon
itorin
g sy
stem
s fo
r th
e
soci
al s
ecto
r
Soc
ial s
ecto
r m
onito
ring
fram
ewor
k, in
dica
tors
and
syst
em
Com
plet
ion
of r
evis
ed
and
upda
ted
mon
itorin
g
fram
ewor
ks, i
ndic
ator
s an
d
tool
s
Rev
ise
and
final
ise
soci
al
sect
or m
onito
ring
fram
ewor
k,
indi
cato
rs a
nd s
yste
ms
An
indi
cato
r ca
talo
gue
was
com
plet
ed f
or t
he N
atio
nal S
trat
egic
and
Ann
ual P
erfo
rman
ce P
lans
.
An
outc
omes
-bas
ed c
atal
ogue
of
indi
cato
rs, d
escr
iptio
n
man
uals
, and
rep
ortin
g to
ols
wer
e fin
alis
ed.
The
mon
itorin
g an
d ev
alua
tion
fram
ewor
k fo
r the
sec
tor w
as re
vise
d.
0%
Dra
ft N
PO
mon
itorin
g sy
stem
Dev
elop
men
t of
an
NPO
mon
itorin
g fr
amew
ork,
indi
cato
rs a
nd t
ools
Dev
elop
NPO
mon
itorin
g
fram
ewor
k, in
dica
tors
and
syst
ems
An
NP
O m
onito
ring
fram
ewor
k, in
dica
tors
and
too
ls w
ere
com
plet
ed.
0%
Com
plet
ion
of m
onito
ring
fram
ewor
ks f
or t
hree
prov
inci
al d
epar
tmen
ts
Dev
elop
mon
itorin
g
fram
ewor
ks f
or t
hree
prov
inci
al d
epar
tmen
ts
Gui
delin
es f
or t
he d
evel
opm
ent
of p
rovi
ncia
l M&
E fr
amew
orks
wer
e co
mpl
eted
.
An
anal
ysis
of
prov
inci
al A
PP
s w
as c
ompl
eted
.
Initi
al c
onsu
ltatio
ns w
ere
com
plet
ed.
35
%1

Department of Social Development | Annual Report 2010/2011 105
Mon
itorin
g an
d
eval
uatio
n
To im
prov
e pr
ogra
mm
e
perf
orm
ance
rep
ortin
g an
d th
e
utili
satio
n of
M&
E in
form
atio
n
270 o
ffici
als
trai
ned
to
impl
emen
t M
&E
prin
cipl
es
Dra
ft d
ata
qual
ity a
sses
smen
t
tool
s
Num
ber
of d
istr
ict
man
ager
s
trai
ned
on M
&E
prin
cipl
es a
nd
proc
edur
es
Com
plet
ion
of a
dat
a qu
ality
asse
ssm
ent
repo
rt
Pro
vinc
ial p
erfo
rman
ce d
ata
qual
ity a
sses
smen
t
Trai
n di
stric
t m
anag
ers
to
impl
emen
t M
&E
prin
cipl
es
Con
duct
pro
vinc
ial
perf
orm
ance
dat
a qu
ality
asse
ssm
ents
38
offi
cial
s w
ere
trai
ned
thro
ugh
IPD
ET o
n M
&E
prin
cipl
es.
36
pro
vinc
ial o
ffici
als
wer
e tr
aine
d to
impl
emen
t th
e EC
D
mon
itorin
g to
ol.
Adv
ocac
y se
ssio
ns o
n da
ta q
ualit
y w
ere
cond
ucte
d w
ith t
wo
prov
ince
s.
Fiel
d w
ork
for
the
data
qua
lity
audi
t w
as c
ompl
eted
and
cle
an
data
set
s w
ere
avai
labl
e.
A d
ata
qual
ity a
udit
repo
rt w
as c
ompl
eted
.
0%
Inst
itutio
nal p
erfo
rman
ce
repo
rts
Ann
ual R
epor
t fo
r th
e
2009/1
0 fi
nanc
ial y
ear
Qua
rter
ly p
erfo
rman
ce r
epor
ts
Mid
-ter
m p
erfo
rman
ce r
epor
t
Pro
duce
inst
itutio
nal
perf
orm
ance
rep
orts
The
Ann
ual R
epor
t w
as c
ompl
eted
and
tab
led
in p
arlia
men
t.
Qua
rter
ly p
erfo
rman
ce r
epor
ts w
ere
com
plet
ed a
nd p
rese
nted
to E
XCO
.
0%
Sur
veill
ance
sys
tem
for
orph
ans
Sur
veill
ance
rep
ort
on
vuln
erab
le c
hild
ren
(orp
hans
)
Pro
duce
an
annu
al r
epor
t an
d
quar
terly
rep
orts
on
mat
erna
l
orph
ans
An
annu
al r
epor
t (2
00
9/1
0) o
n m
ater
nal o
rpha
ns w
as
com
plet
ed.
Thre
e qu
arte
rly r
epor
ts o
n th
e su
rvei
llanc
e of
mat
erna
l orp
hans
wer
e c
ompl
eted
.
0%
Dra
ft s
tatis
tical
rep
orts
Com
plet
ion
of a
n an
nual
key
stat
istic
s re
port
Pro
duce
qua
rter
ly f
acts
and
figur
es r
epor
ts
Pro
duce
ann
ual k
ey s
tatis
tics
repo
rt
A Q
uart
erly
rep
orts
on
fact
s an
d fig
ures
was
pro
duce
d.
An
annu
al k
ey s
tatis
tics
repo
rt w
as c
ompl
eted
.
0%
Con
duct
pro
gram
me
eval
uatio
ns
CSG
qua
ntita
tive
and
qual
itativ
e ev
alua
tion
Com
plet
ion
and
diss
emin
atio
n
of e
valu
atio
n re
port
s
Con
duct
CSG
qua
litat
ive
eval
uatio
n
A q
ualit
ativ
e ev
alua
tion
stud
y w
as c
ompl
eted
and
the
rep
ort
was
pre
sent
ed t
o st
akeh
olde
rs.
Pro
gres
s w
as m
ade
with
the
des
ign
and
impl
emen
tatio
n of
the
quan
titat
ive
com
pone
nt o
f th
is s
tudy
.
0%
Par
tially
com
plet
ed
bene
ficia
ry s
atis
fact
ion
surv
ey
Dev
elop
men
t of
too
ls f
or
impl
emen
ting
bene
ficia
ry
satis
fact
ion
surv
ey
Con
duct
ben
efici
ary
satis
fact
ion
surv
ey
Pha
se o
ne o
f th
e su
rvey
was
com
plet
ed in
line
with
the
rene
gotia
ted
cont
ract
with
the
ser
vice
pro
vide
r.
15
%2
Rea
son
s fo
r d
evia
tion
1 D
onor
fun
ding
ple
dged
for
thi
s pr
ojec
t w
as n
ot r
ecei
ved.
2 T
his
proj
ect
was
del
ayed
due
to
finan
cial
con
stra
ints
.

106 Annual Report 2010/2011 | Department of Social Development
Pro
gra
mm
e 5:
Str
ate
gy
an
d G
ove
rna
nce
Goa
lTo
enh
ance
soc
ial c
ohes
ion
and
prot
ectio
n
Ou
tcom
eA
long
and
hea
lthy
life
for
all S
outh
Afr
ican
s
Fun
ctio
nal
are
asS
trat
egic
ob
ject
ive
Bas
elin
eP
erfo
rman
ce in
dic
ator
Targ
etA
ctu
al o
utp
uts
% d
evia
tion
from
tar
get
Pop
ulat
ion
and
deve
lopm
ent
To p
rovi
de e
vide
nce
and
build
capa
city
for
inte
grat
ing
HIV
and
AID
S a
nd o
ther
hea
lth c
once
rns
into
dev
elop
men
t pl
anni
ng a
nd
serv
ice
deliv
ery
Pol
icy
+10 c
hapt
er o
n
HIV
and
AID
S S
AD
HS,
HIV
res
earc
h da
taba
se,
eval
uatio
n of
NI,
HC
BC
appr
aisa
ls a
nd d
atab
ase,
prim
ary
HIV
and
AID
S
capa
city
dev
elop
men
t co
urse
Gen
der-
base
d vi
olen
ce a
nd
sexu
al a
nd r
epro
duct
ive
heal
th a
nd r
ight
s
Reg
iona
l col
labo
ratio
n on
HIV
and
AID
S t
rain
ing
Cap
acity
-bui
ldin
g th
roug
h
info
rmat
ion,
edu
catio
n an
d
com
mun
icat
ion
to in
tegr
ate
HIV
and
AID
S a
nd k
ey h
ealth
conc
erns
into
dev
elop
men
t
plan
ning
and
ser
vice
del
iver
y
Bui
ld c
apac
ity t
hrou
gh
educ
atio
n an
d in
form
atio
n to
inte
grat
e H
IV a
nd A
IDS
and
key
heal
th c
once
rns
with
deve
lopm
ent
plan
ning
and
serv
ice
deliv
ery
A s
take
hold
er d
atab
ase
of C
SOs
and
FBO
s w
as e
stab
lishe
d to
dete
rmin
e ca
paci
ty-b
uild
ing
need
s on
pop
ulat
ion
conc
erns
, with
spec
ial r
efer
ence
to H
IV a
nd A
IDS
and
Gen
der.
Fund
ing
was
sec
ured
fro
m H
WS
ETA
for
tra
inin
g 3
80
key
stak
ehol
ders
on
inte
grat
ing
HIV
and
AID
S in
to d
evel
opm
ent
plan
ning
, with
ass
ista
nce
from
PA
LAM
A.
A m
arke
ting
stra
tegy
was
dev
elop
ed t
o pu
blic
ise
a tr
aini
ng
cour
se.
Civ
il so
ciet
y pr
ofilin
g w
as u
nder
take
n in
rur
al n
odes
in
thre
e pr
ovin
ces,
to
asse
ss c
apac
ity n
eeds
on
HIV
and
AID
S
inte
grat
ion.
25
%1
Com
plet
ion
of p
opul
atio
n
tren
ds a
naly
sis
of h
ealth
fact
ors
with
dem
ogra
phic
cons
eque
nces
Com
plet
e po
pula
tion
tren
ds
anal
ysis
of
heal
th f
acto
rs w
ith
dem
ogra
phic
con
sequ
ence
s
Two
repo
rts,
an
over
view
rep
ort
on H
IV a
nd A
IDS
and
oth
er
heal
th is
sues
with
dem
ogra
phic
con
sequ
ence
s, a
nd a
rep
ort
on t
he s
tatu
s of
hea
lth, m
orbi
dity
, mor
talit
y an
d de
velo
pmen
t in
Sou
th A
fric
a (A
pril
20
10
) wer
e up
date
d an
d co
nsol
idat
ed in
to
a si
ngle
rep
ort
entit
led
Pop
ulat
ion
Tren
ds A
naly
sis
on H
IV a
nd
AID
S a
nd H
ealth
Issu
es w
ith D
emog
raph
ic Im
plic
atio
ns (M
arch
20
11
).
0%
Rep
orts
on
popu
latio
n H
IV a
nd
AID
S r
esea
rch
Pro
duce
rep
orts
on
popu
latio
n
HIV
& A
IDS r
esea
rch
An
over
view
pap
er o
n H
IV a
nd A
IDS
and
oth
er h
ealth
issu
es
with
dem
ogra
phic
con
sequ
ence
s w
as u
pdat
ed a
nd fi
nalis
ed in
Mar
ch 2
01
1.
0%
Rea
son
s fo
r d
evia
tion
1 T
he im
plem
enta
tion
of t
he c
ours
e w
as d
elay
ed u
ntil
Apr
il 2
011 d
ue t
o th
e ad
min
istr
ativ
e pr
oces
ses
requ
ired
to c
oncl
ude
an M
oA b
etw
een
the
DSD
and
the
HW
SET
A.

Department of Social Development | Annual Report 2010/2011 107
Goa
lTo
dev
elop
Sou
th A
fric
a’s
yout
h
Ou
tcom
eA
ski
lled
and
capa
ble
wor
kfor
ce, a
nd a
n in
clus
ive
grow
th p
ath
Fun
ctio
nal
are
asS
trat
egic
ob
ject
ive
Bas
elin
eP
erfo
rman
ce in
dic
ator
Targ
etA
ctu
al o
utp
uts
% d
evia
tion
from
tar
get
Pop
ulat
ion
and
deve
lopm
ent
To p
rom
ote
yout
h de
velo
pmen
t
as a
str
ateg
y fo
r be
nefit
ing
from
the
dem
ogra
phic
div
iden
d
Ten-
year
rev
iew
of
popu
latio
n
polic
y
15-y
ear
revi
ew o
f IC
PD
Pro
gram
me
of A
ctio
n
Com
plet
ion
of r
epor
t on
fact
ors
asso
ciat
ed w
ith
teen
age
preg
nanc
y in
SA
Res
earc
h an
d co
mpi
le r
epor
t
on t
eena
ge p
regn
ancy
in S
A
In F
ebru
ary
20
11
, eth
ical
cle
aran
ce w
as g
rant
ed b
y th
e H
SR
C
to c
ontin
ue t
he s
tudy
on
fact
ors
asso
ciat
ed w
ith t
eena
ge
preg
nanc
ies
in p
rovi
nces
. Sin
ce t
hen,
fiel
d w
orke
rs w
ere
trai
ned,
a p
ilot
stud
y w
as c
ondu
cted
in L
impo
po, a
nd a
rep
ort
com
pile
d. F
undi
ng w
as s
ecur
ed in
the
Eas
tern
Cap
e (R
29
3 0
00
)
and
Mpu
mal
anga
(R1
50
00
0) f
or r
ollin
g ou
t th
e re
sear
ch.
20
%1
HSR
C y
outh
pol
icy
Initi
ativ
es
on t
he d
emog
raph
ic d
ivid
end
Com
plet
ion
of a
rep
ort
on t
he
stat
us o
f po
pula
tion
educ
atio
n
in s
choo
l cur
ricul
a
Com
pile
rep
ort
on t
he s
tatu
s
of p
opul
atio
n ed
ucat
ion
in
scho
ol c
urric
ula
A d
raft
pap
er o
n di
scov
erin
g an
d de
velo
ping
the
unt
appe
d
econ
omic
and
soc
ial p
oten
tial o
f th
e yo
uth
was
pre
pare
d (M
ay
20
10
).
0%
Adv
ocac
y an
d IE
C a
ctiv
ities
to c
ount
ryw
ide
post
er
com
petit
ion
for
child
ren
Com
plet
e ga
p an
alys
is o
f
yout
h se
rvic
es
Com
plet
e ga
p an
alys
is o
f
yout
h se
rvic
es.
The
rese
arch
pro
ject
aim
ed a
t pr
oduc
ing
a ga
p an
alys
is o
f yo
uth
serv
ices
was
rev
ised
to
acco
mm
odat
e th
e ap
plic
atio
n of
the
Soc
ial S
ecto
r In
fras
truc
ture
Dem
and
Mod
el (S
SID
M).
A li
tera
ture
revi
ew f
or t
he g
ap a
naly
sis
was
in p
rogr
ess.
A g
ap a
naly
sis
conc
ept
pape
r on
del
iver
ing
serv
ices
to
yout
hs
was
com
plet
ed in
Mar
ch 2
01
1.
0%
Rea
son
s fo
r d
evia
tion
1 It
too
k si
x m
onth
s to
obt
ain
ethi
cal c
lear
ance
fro
m t
he H
SR
C.

108 Annual Report 2010/2011 | Department of Social Development
Pro
gra
mm
e 5:
Str
ate
gy
an
d G
ove
rna
nce
Goa
lTo
adv
ance
soc
ial c
ohes
ion
and
prot
ectio
n
Ou
tcom
eA
n ef
ficie
nt, e
ffec
tive
and
deve
lopm
ent-
orie
nted
pub
lic s
ervi
ce, a
nd a
n em
pow
ered
, fai
r an
d in
clus
ive
citiz
ensh
ip
Fun
ctio
nal
are
asS
trat
egic
ob
ject
ive
Bas
elin
eP
erfo
rman
ce in
dic
ator
Targ
etA
ctu
al o
utp
uts
% d
evia
tion
from
tar
get
Pop
ulat
ion
and
deve
lopm
ent
To p
rom
ote
gend
er e
qual
ity,
equi
ty, a
nd t
he e
mpo
wer
men
t
of w
omen
by
mai
nstr
eam
ing
gend
er a
s a
maj
or p
opul
atio
n
fact
or in
dev
elop
men
t pl
anni
ng
Cha
pter
on
gend
er in
Pol
icy+
10 r
epor
t
Com
plet
ion
of p
opul
atio
n
repo
rt o
n th
e st
ate
of g
ende
r
equi
ty, e
qual
ity, a
nd t
he
empo
wer
men
t of
wom
en
in S
A
Com
pile
pop
ulat
ion
repo
rt o
n
the
stat
e of
gen
der
in S
A
An
over
view
pap
er o
n th
e st
ate
of g
ende
r eq
ualit
y, e
quity
and
the
empo
wer
men
t of
wom
en in
SA
was
com
pile
d an
d pr
esen
ted
in M
ay 2
01
0.
0%
Nod
e re
sear
ch fi
ndin
gs o
n
gend
er
Num
ber
of p
eopl
e tr
aine
d
in r
ural
nod
es t
o im
plem
ent
popu
latio
n po
licy
and
gend
er
mai
nstr
eam
ing,
and
num
ber
of n
odes
cov
ered
by
trai
ning
Trai
n pe
ople
in r
ural
nod
es t
o
impl
emen
t po
pula
tion
polic
y
and
gend
er m
ains
trea
min
g
A p
opul
atio
n po
licy
and
gend
er m
ains
trea
min
g op
erat
iona
l pla
n
was
dra
fted
and
sub
mitt
ed t
o PA
LAM
A.
24
key
sta
keho
lder
s in
thr
ee s
pher
es o
f go
vern
men
t w
ere
trai
ned
on p
opul
atio
n an
d ge
nder
mai
nstr
eam
ing.
Sta
keho
lder
s w
ere
trai
ned
to h
old
wor
ksho
ps in
rur
al n
odes
.
Eigh
t w
orks
hops
wer
e fa
cilit
ated
in r
ural
nod
es, f
ocus
ing
on
rese
arch
find
ings
and
on
mai
nstr
eam
ing
gend
er a
nd p
opul
atio
n
polic
y fa
ctor
s in
to p
lann
ing
proc
esse
s.
0%
Gen
der
mai
nstr
eam
ing
in
soci
al r
esea
rch
guid
elin
es
Num
ber
of n
atio
nal
depa
rtm
ents
and
pop
ulat
ion
units
with
add
ed c
apac
ity t
o
mai
nstr
eam
gen
der
in s
ocia
l
rese
arch
Bui
ld c
apac
ity o
f na
tiona
l
depa
rtm
ents
and
pop
ulat
ion
units
to
mai
nstr
eam
gen
der
in
soci
al r
esea
rch
A r
epor
t w
as c
ompl
eted
with
evi
denc
e of
pro
gres
s m
ade
in
mai
nstr
eam
ing
gend
er in
soc
ial r
esea
rch.
One
nat
iona
l and
fou
r pr
ovin
cial
wor
ksho
ps w
ere
cond
ucte
d.
0%

Department of Social Development | Annual Report 2010/2011 109
Goa
lTo
add
ress
and
red
uce
pove
rty
Ou
tcom
e
Vibr
ant,
equi
tabl
e an
d su
stai
nabl
e ru
ral c
omm
uniti
es c
ontr
ibut
ing
to f
ood
secu
rity
for
all;
a re
spon
sive
, acc
ount
able
, eff
ectiv
e an
d ef
ficie
nt lo
cal g
over
nmen
t sy
stem
; su
stai
nabl
e hu
man
set
tlem
ents
, and
impr
oved
qua
lity
of
hous
ehol
d lif
e; a
nd p
rote
cted
and
enh
ance
d en
viro
nmen
tal a
sset
s an
d na
tura
l res
ourc
es
Fun
ctio
nal
are
asS
trat
egic
ob
ject
ive
Bas
elin
eP
erfo
rman
ce in
dic
ator
Targ
etA
ctu
al o
utp
uts
% d
evia
tion
from
tar
get
Pop
ulat
ion
and
deve
lopm
ent
To e
nhan
ce s
usta
inab
le h
uman
deve
lopm
ent
by p
rom
otin
g
equi
libriu
m b
etw
een
popu
latio
n
tren
ds, t
he e
nviro
nmen
t, an
d
deve
lopm
ent
in lo
cal a
reas
Exis
ting
popu
latio
n,
envi
ronm
ent
and
deve
lopm
ent
(PED
) cou
rses
Enha
nced
PED
cap
acity
Pre
sent
cap
acity
-bui
ldin
g
cour
ses
on P
ED in
IDP,
inte
grat
ing
popu
latio
n in
to
deve
lopm
ent
Pre
sent
an
inte
rnat
iona
l
sess
ion
on p
opul
atio
n, c
limat
e
chan
ge a
nd d
evel
opm
ent
The
UFS
pre
sent
ed o
ne P
ED N
exus
tra
inin
g co
urse
, att
ende
d by
41
par
ticip
ants
.
11
SA
del
egat
es p
artic
ipat
ed in
a r
egio
nal P
ED N
exus
tra
inin
g
cour
se in
Dak
ar, S
eneg
al.
Cha
irper
sons
of
the
Soc
ial D
evel
opm
ent
and
Envi
ronm
ent
Por
tfol
io C
omm
ittee
s pa
rtic
ipat
ed in
PED
Nex
us a
nd S
ocie
ties
in
Tran
sitio
n tr
aini
ng c
ours
es h
eld
in M
ay.
0%
Nod
al r
esea
rch
, PED
cas
e
stud
ies,
PED
new
slet
ters
and
web
site
Num
ber
of o
ffici
als
atte
ndin
g
capa
city
-bui
ldin
g co
urse
s on
PED
in ID
P, a
nd in
tegr
atin
g
popu
latio
n in
to d
evel
opm
ent
2 0
00
PED
nex
us a
nd L
EAD
Inte
rnat
iona
l Ses
sion
pam
phle
ts
wer
e pr
oduc
ed a
nd d
isse
min
ated
to
natio
nal a
nd p
rovi
ncia
l
depa
rtm
ents
and
mun
icip
aliti
es.
A p
amph
let
was
pro
duce
d to
mar
ket
the
PED
in ID
P t
rain
ing
cour
se.
0%
Pop
ulat
ion
polic
y in
loca
l ID
F
Gui
delin
es
Num
ber
of o
ffici
als
atte
ndin
g
capa
city
-bui
ldin
g co
urse
s on
popu
latio
n, c
limat
e ch
ange
and
deve
lopm
ent
40
del
egat
es, i
nclu
ding
thr
ee c
ounc
illor
s fr
om t
he N
elso
n
Man
dela
Bay
Met
ropo
litan
Mun
icip
ality
, att
ende
d a
Soc
ietie
s in
Tran
sitio
n tr
aini
ng c
ours
e in
May
20
10
.
53
SA
par
ticip
ants
com
plet
ed t
he t
wo
qual
ifyin
g tr
aini
ng
cour
ses
and
assi
gnm
ents
, and
att
ende
d th
e In
tern
atio
nal L
EAD
sess
ion
in N
elso
n M
ande
la B
ay o
n 3
1 O
ct t
o 6
Nov
20
10
,
atte
nded
by
mor
e th
an 1
50
inte
rnat
iona
l par
ticip
ants
. All
qual
ified
as
LEA
D F
ello
ws.
Five
sem
inar
s, a
ttend
ed b
y m
ore
than
250
sta
keho
lder
s, w
ere
held
in N
elso
n M
ande
la B
ay o
n as
pect
s of
PED
, inc
ludi
ng c
limat
e
chan
ge, i
n pr
epar
atio
n fo
r th
e In
tern
atio
nal L
EAD
Tra
inin
g Se
ssio
n
and
prep
arin
g a
clim
ate
chan
ge s
trat
egy
for
the
Met
ro. D
urin
g
thes
e ev
ents
, pro
mot
iona
l and
edu
catio
nal m
ater
ial (
a br
ochu
re
and
post
ers)
wer
e di
ssem
inat
ed a
nd e
xhib
ited.
0%

110 Annual Report 2010/2011 | Department of Social Development
Pro
gra
mm
e 5:
Str
ate
gy
an
d G
ove
rna
nce
Goa
lTo
add
ress
and
red
uce
pove
rty
Ou
tcom
e
Vibr
ant,
equi
tabl
e an
d su
stai
nabl
e ru
ral c
omm
uniti
es c
ontr
ibut
ing
to f
ood
secu
rity
for
all;
a re
spon
sive
, acc
ount
able
, eff
ectiv
e an
d ef
ficie
nt lo
cal g
over
nmen
t sy
stem
; su
stai
nabl
e hu
man
set
tlem
ents
, and
impr
oved
qua
lity
of
hous
ehol
d lif
e; a
nd p
rote
cted
and
enh
ance
d en
viro
nmen
tal a
sset
s an
d na
tura
l res
ourc
es
Fun
ctio
nal
are
asS
trat
egic
ob
ject
ive
Bas
elin
eP
erfo
rman
ce in
dic
ator
Targ
etA
ctu
al o
utp
uts
% d
evia
tion
from
tar
get
Pop
ulat
ion
and
deve
lopm
ent
Cha
pter
in P
olic
y+10
rep
ort
on m
igra
tion
and
urba
nisa
tion,
and
chap
ter
on P
ED
Num
ber
of s
take
hold
ers
rece
ivin
g ad
voca
cy a
nd IE
C
on P
ED
Pop
ulat
ion
advo
cacy
and
IEC
to lo
cal s
take
hold
ers
The
first
sem
inar
on
Hum
an S
ettle
men
ts in
Fra
gile
Eco
syst
ems
was
hel
d in
May
20
10
, and
att
ende
d by
50
par
ticip
ants
.
Late
r in
the
yea
r, th
ree
mor
e Fo
otpr
int
Pro
gram
me
sem
inar
s
wer
e he
ld, a
tten
ded
by 1
20
sta
keho
lder
s, w
here
var
ious
aspe
cts
of P
ED, i
nclu
ding
clim
ate
chan
ge, w
ere
disc
usse
d.
0%
Rep
ort
on in
tegr
atin
g
popu
latio
n po
licy
with
IDPs
Com
pile
rep
ort
on in
tegr
atin
g
popu
latio
n po
licy
with
IDP
s
CO
GTA
and
PP
Us
appr
oved
a s
trat
egy
for
mun
icip
aliti
es t
o ro
ll
out
the
Gui
de t
o In
tegr
ate
Pop
ulat
ion
Info
rmat
ion
into
IDP
s.
Eigh
t lo
cal w
orks
hops
wer
e he
ld o
n ap
plyi
ng t
he g
uide
lines
on
the
mai
nstr
eam
ing
of g
ende
r in
to ID
Ps.
0%
Rep
ort
on m
igra
tion
rese
arch
,
and
PED
cas
e st
udy
pape
rs
Com
pile
mig
ratio
n re
sear
ch
repo
rt a
nd P
ED c
ase
stud
y
pape
rs
The
PED
cas
e st
udy
pape
rs w
ere
com
plet
ed.
A c
once
pt p
aper
on
mig
ratio
n w
as c
ompl
eted
and
sub
mitt
ed t
o
the
EU f
or f
undi
ng. T
he p
ropo
sal w
as a
ligne
d w
ith E
U p
resc
ripts
,
in c
onsu
ltatio
n w
ith t
he D
IRC
O/E
U c
onsu
ltant
.
The
unit
part
icip
ated
in a
SA
-EU
vid
eo c
onfe
renc
e on
the
Mig
ratio
n D
ialo
gue.
It w
as a
wai
ting
a re
spon
se f
rom
the
EU
on
its r
eque
st f
or
fund
ing
rese
arch
on
mig
ratio
n.
0%

Department of Social Development | Annual Report 2010/2011 111
Goa
lTo
enh
ance
sec
tor
capa
city
and
per
form
ance
Ou
tcom
eA
n ef
ficie
nt, e
ffec
tive,
and
dev
elop
men
t-or
ient
ed p
ublic
ser
vice
, and
an
empo
wer
ed, f
air,
and
incl
usiv
e ci
tizen
ship
Fun
ctio
nal
are
asS
trat
egic
ob
ject
ive
Bas
elin
eP
erfo
rman
ce in
dic
ator
Targ
etA
ctu
al o
utp
uts
% d
evia
tion
from
tar
get
Pop
ulat
ion
and
deve
lopm
ent
To p
rom
ote
the
popu
latio
n
polic
y th
roug
h ca
paci
ty-
build
ing
and
rese
arch
Pop
ulat
ion
Pol
icy+
10/
ICPD
+15 r
epor
t
ICPD
+15 A
ddis
Aba
ba
com
mitm
ent
Pop
ulat
ion
and
deve
lopm
ent
web
site
and
dat
abas
e
Adv
ocac
y ev
ents
Sup
port
for
inte
rgov
ernm
enta
l
popu
latio
n pr
ogra
mm
es
Sup
port
inte
rgov
ernm
enta
l
popu
latio
n pr
ogra
mm
es
A r
epor
t on
the
nat
iona
l int
ergo
vern
men
tal H
IV a
nd A
IDS
rese
arch
col
labo
ratio
n po
rtfo
lio w
as c
ompl
eted
in c
olla
bora
tion
with
JEA
PP.
0%
Num
ber
of g
over
nmen
t
depa
rtm
ents
ben
efitin
g fr
om
tech
nica
l sup
port
and
adv
ice
on p
opul
atio
n re
sear
ch
Bui
ld c
apac
ity f
or p
opul
atio
n
rese
arch
, and
pro
vide
gove
rnm
ent
depa
rtm
ents
and
othe
r st
akeh
olde
rs w
ith
tech
nica
l sup
port
and
adv
ice
Tech
nica
l adv
ice
and
assi
stan
ce w
ere
prov
ided
to
the
Gau
teng
PP
U o
n de
velo
ping
an
M&
E pl
an f
or s
trat
egic
and
ope
ratio
nal
plan
ning
, as
wel
l as
plan
ning
res
earc
h on
mig
ratio
n an
d
advo
cacy
issu
es.
Tech
nica
l ass
ista
nce
was
pro
vide
d to
Sta
ts S
A, t
he D
SD
, and
othe
r de
part
men
ts o
n po
pula
ting
MD
G in
dica
tors
on
pove
rty
and
hung
er f
or t
he M
DG
Cou
ntry
Rep
ort
20
10
.
0%
Num
ber
of o
ffici
als
bene
fitin
g
from
pop
ulat
ion
capa
city
-
build
ing
and
trai
ning
cou
rses
Con
duct
pop
ulat
ion
capa
city
-
build
ing
and
trai
ning
cou
rses
Alm
ost
20
0 g
over
nmen
t of
ficia
ls, t
wo
MP
s, a
nd 1
56
inte
rnat
iona
l par
ticip
ants
wer
e re
ache
d w
ith s
ix c
apac
ity-
build
ing
cour
ses,
incl
udin
g A
PS
TAR
, PED
Nex
us t
rain
ing,
Soc
ietie
s in
Tra
nsiti
on, t
he L
EAD
Inte
rnat
iona
l Ses
sion
on P
opul
atio
n, C
limat
e C
hang
e &
Dev
elop
men
t, ge
nder
mai
nstr
eam
ing,
and
inte
grat
ing
popu
latio
n is
sues
into
deve
lopm
ent
plan
s.
0%
Dev
elop
men
t of
Pop
ulat
ion
and
Dev
elop
men
t In
form
atio
n
and
Kno
wle
dge
Ser
vice
(PD
I&KS)
Dev
elop
PD
I&KS
The
PD
I&K
S w
as r
egul
arly
upd
ated
, am
ong
othe
rs w
ith
info
rmat
ion
Wor
ld P
opul
atio
n D
ay (1
1 J
uly)
, the
laun
ch o
f th
e
Sta
te o
f Wor
ld P
opul
atio
n R
epor
t (O
ctob
er 2
01
0),
and
capa
city
-
build
ing
initi
ativ
es.
Res
earc
h re
port
s, p
rom
otio
nal a
nd e
duca
tiona
l mat
eria
l,
and
othe
r po
pula
tion
info
rmat
ion
wer
e di
ssem
inat
ed v
ia t
he
popu
latio
n w
ebsi
te.
Them
atic
dis
play
s w
ere
plac
ed in
the
Pop
ulat
ion
Res
ourc
e
Cen
tre.
0%
Dev
elop
men
t of
an
inte
rnat
iona
l pop
ulat
ion
stra
tegy
Dev
elop
an
inte
rnat
iona
l
popu
latio
n st
rate
gy
An
Inte
rnat
iona
l pop
ulat
ion
stra
tegy
was
dev
elop
ed a
nd
impl
emen
ted.
0%

112 Annual Report 2010/2011 | Department of Social Development
Pro
gra
mm
e 5:
Str
ate
gy
an
d G
ove
rna
nce
Goa
lTo
enh
ance
sec
tor
capa
city
and
per
form
ance
Ou
tcom
eA
n ef
ficie
nt, e
ffec
tive,
and
dev
elop
men
t-or
ient
ed p
ublic
ser
vice
, and
an
empo
wer
ed, f
air,
and
incl
usiv
e ci
tizen
ship
Fun
ctio
nal
are
asS
trat
egic
ob
ject
ive
Bas
elin
eP
erfo
rman
ce in
dic
ator
Targ
etA
ctu
al o
utp
uts
% d
evia
tion
from
tar
get
Pop
ulat
ion
and
deve
lopm
ent
Com
plet
ion
of a
mon
itorin
g
repo
rt o
n bu
sine
ss p
lann
ing,
stra
tegy
and
pol
icy
Mon
itor
busi
ness
pla
nnin
g,
stra
tegy
and
pol
icy
Thre
e qu
arte
rly m
onito
ring
repo
rts
on t
he P
&D
ope
ratio
nal p
lan
20
10
/11
wer
e co
mpi
led
and
subm
itted
in J
uly
and
Oct
ober
20
10
and
Jan
uary
20
11
. The
fou
rth
(end
-of-
year
) rep
ort
was
due
in A
pril
20
11
.
0%
Pop
ulat
ion
advo
cacy
and
IEC
Impl
emen
t po
pula
tion
advo
cacy
and
IEC
Wor
ld P
opul
atio
n D
ay (W
PD
) was
obs
erve
d in
sev
en p
rovi
nces
on d
iffer
ent
days
in J
uly
– S
epte
mbe
r 2
01
0.
A n
atio
nal W
PD
eve
nt t
ook
plac
e at
Par
liam
ent
on 2
0 O
ctob
er
20
10
, coi
ncid
ing
with
the
laun
ch o
f th
e S
tate
of
the
Wor
ld
Pop
ulat
ion
Rep
ort
20
10
.
11 w
orks
hops
(five
in u
rban
are
as a
nd s
ix in
rur
al n
odes
) on
build
ing
sust
aina
ble
livel
ihoo
ds w
ere
cond
ucte
d to
dis
sem
inat
e
noda
l res
earc
h fin
ding
s an
d m
ains
trea
m g
ende
r in
to ID
P. T
hey
wer
e he
ld in
the
East
ern
Cap
e, L
impo
po, M
pum
alan
ga, G
aute
ng,
the
Free
Sta
te, N
orth
ern
Cap
e, K
waZ
ulu-
Nat
al a
nd W
este
rn C
ape.
Prom
otio
nal a
nd e
duca
tiona
l (IE
C) m
ater
ial w
as d
isse
min
ated
to
stak
ehol
ders
in a
ll ni
ne p
rovi
nces
. Thi
s in
clud
ed c
opie
s of
HIV
and
AID
S Vo
lum
e 3
– C
ase
Stud
ies;
Gui
delin
es fo
r m
ains
trea
min
g
gend
er in
to r
esea
rch;
con
cept
pap
er o
n so
cial
coh
esio
n; a
nd th
e
Ten-
year
Rev
iew
of P
opul
atio
n Po
licy
Impl
emen
tatio
n.
Med
ia a
dvis
orie
s w
ere
prod
uced
for
the
laun
ch o
f th
e S
tate
of W
orld
Pop
ulat
ion
Rep
ort
20
10
and
the
Lea
d In
tern
atio
nal
Trai
ning
Ses
sion
(Oct
ober
/Nov
embe
r 2
01
0).
1 0
00
cop
ies
of t
he C
once
pt P
aper
on
Soc
ial C
ohes
ion
in L
ocal
Inte
grat
ed D
evel
opm
ent
Pla
ns w
ere
prin
ted
for
diss
emin
atio
n.
HIV
and
AID
S an
d ot
her
popu
latio
n pr
omot
iona
l and
edu
catio
nal
mat
eria
l was
dis
sem
inat
ed to
var
ious
targ
et a
udie
nces
at d
iffer
ent
even
ts, w
orks
hops
, sem
inar
s, tr
aini
ng s
essi
ons
and
conf
eren
ces.
30
%1
Rea
son
s fo
r d
evia
tion
1 M
pum
alan
ga a
nd t
he E
aste
rn C
ape
wer
e un
able
to
arra
nge
WPD
eve
nts
due
to fi
nanc
ial c
onst
rain
ts.

Department of Social Development | Annual Report 2010/2011 113
Goa
lTo
inst
itutio
nalis
e ev
iden
ce-b
ased
pol
icy-
mak
ing
in t
he D
SD
and
soc
ial s
ecto
r
Ou
tcom
eA
n ef
ficie
nt, e
ffec
tive,
and
dev
elop
men
t-or
ient
ed p
ublic
ser
vice
, and
an
empo
wer
ed, f
air,
and
incl
usiv
e ci
tizen
ship
Fun
ctio
nal
are
asS
trat
egic
ob
ject
ive
Bas
elin
eP
erfo
rman
ce in
dic
ator
Targ
etA
ctu
al o
utp
uts
% d
evia
tion
from
tar
get
Soc
ial p
olic
yTo
wor
k w
ith D
SD
dire
ctor
ates
on d
evel
opin
g an
d re
view
ing
Dep
artm
enta
l pol
icie
s
DSD
pol
icie
s or
pol
icy
fram
ewor
ks
Form
atio
n of
DSD
pol
icy
actio
n te
ams
for
deve
lopi
ng
and
revi
ewin
g po
licie
s
prem
ised
on
evid
ence
-bas
ed
polic
y-m
akin
g.
Dev
elop
men
t an
d/or
rev
iew
of p
olic
ies
prem
ised
on
evid
ence
-bas
ed p
olic
y
mak
ing.
Esta
blis
h D
SD
pol
icy
actio
n
team
s fo
r po
licy
deve
lopm
ent
and
polic
y re
view
pre
mis
ed o
n
evid
ence
-bas
ed p
olic
y-m
akin
g
The
unit
assi
sted
in t
he d
evel
opm
ent
of a
pol
icy
on t
he s
ocia
l
serv
ice
prof
essi
ons.
The
unit
cont
ribut
ed t
owar
ds t
he d
evel
opm
ent
of p
olic
y on
mili
tary
vet
eran
s an
d th
e D
SD
’s c
ontr
ibut
ions
of
a ba
sket
of
soci
al s
ervi
ces
.
0%
To c
ontr
ibut
e to
and
pla
y a
lead
ing
role
in d
eliv
ery
foru
ms
on s
ocia
l pol
icy
and
the
fight
agai
nst p
over
ty, h
elp
to d
evel
op
lead
ersh
ip o
n po
vert
y an
d
deve
lopm
ent i
ssue
s, a
nd e
nsur
e
the
deep
enin
g of
the
soci
al
polic
y di
scou
rse
and
evid
ence
-
base
d po
licy-
mak
ing
Ant
i-po
vert
y st
rate
gyPar
ticip
atio
n in
inte
rdep
artm
enta
l and
gove
rnm
ent-
wid
e re
sear
ch
and
polic
y in
itiat
ives
Num
ber
of p
olic
y in
itiat
ives
unde
rtak
en
Par
ticip
ate
in
inte
rdep
artm
enta
l and
gove
rnm
ent-
wid
e re
sear
ch
and
polic
y in
itiat
ives
The
unit
help
ed t
o de
velo
p th
e an
ti-po
vert
y st
rate
gy w
ith
part
ners
(org
anis
ed b
usin
ess,
gov
ernm
ent,
labo
ur a
nd
com
mun
ity) a
t N
EDLA
C
The
unit
part
icip
ated
in a
Sta
ts S
A in
itiat
ive
on a
pov
erty
line
for
SA
.
0%
To in
itiat
e an
d m
anag
e
rese
arch
and
cap
acity
-bui
ldin
g
colla
bora
tions
and
par
tner
ship
s
with
nat
iona
l and
inte
rnat
iona
l
rese
arch
and
soc
ial p
olic
y
inst
itutio
ns
250 s
enio
r of
ficia
ls f
rom
the
DSD
, the
Pre
side
ncy,
and
the
soci
al s
ecto
r t
rain
ed s
ince
2005
Com
plet
e a
repo
rt o
n
capa
city
-bui
ldin
g ne
eds
for
the
DSD
and
the
soc
ial s
ecto
r
Iden
tify
key
rese
arch
and
capa
city
-bui
ldin
g ne
eds
for
the
DSD
and
the
soc
ial s
ecto
r
Two
soci
al p
olic
y an
d so
cial
pol
icy
anal
ysis
tra
inin
g se
ssio
ns
wer
e he
ld f
or 5
0 s
enio
r ci
vil s
erva
nts
wor
king
in p
olic
y
deve
lopm
ent.
0%
Prov
ide
guid
ance
on
the
utili
satio
n of
res
earc
h
in a
sys
tem
atic
and
co-o
rdin
ated
man
ner,
and
the
inst
itutio
nalis
atio
n of
evi
denc
e-
base
d po
licy-
mak
ing
and
the
soci
al p
olic
y ap
proa
ch
Res
earc
h pl
an f
or t
he D
SD
and
publ
ic e
ntiti
es
Dev
elop
men
t of
a D
SD
rese
arch
str
ateg
y
Dev
elop
DSD
res
earc
h
stra
tegy
Par
t of
the
res
earc
h st
rate
gy w
as d
evel
oped
.2
0%
1
Rea
son
s fo
r d
evia
tion
1 C
olle
ctin
g in
form
atio
n on
how
oth
er g
over
nmen
t de
part
men
ts m
anag
e an
d co
ordi
nate
res
earc
h to
ok lo
nger
tha
n pl
anne
d.

114 Annual Report 2010/2011 | Department of Social Development
Pro
gra
mm
e 5:
Str
ate
gy
an
d G
ove
rna
nce
Goa
lTo
pro
mot
e ev
iden
ce-b
ased
pol
icy-
mak
ing
in d
epar
tmen
ts o
f so
cial
dev
elop
men
t an
d so
cial
aff
airs
in t
he r
egio
n
Ou
tcom
eA
bet
ter
Sou
th A
fric
a, a
bet
ter
Afr
ica
and
a be
tter
wor
ld
Fun
ctio
nal
are
asS
trat
egic
ob
ject
ive
Bas
elin
eP
erfo
rman
ce in
dic
ator
Targ
etA
ctu
al o
utp
uts
% d
evia
tion
from
tar
get
Soc
ial p
olic
yTo
driv
e th
e D
SD
’s s
ocia
l pol
icy
anal
ysis
thr
ust
in s
uppo
rt o
f th
e
Afr
ican
Age
nda
Reg
iona
l Rou
nd T
able
Mee
ting
in L
ivin
gsto
ne,
Zam
bia,
on
23 –
25
Nov
embe
r 2009
Num
ber
of r
egio
nal t
rain
ing
prog
ram
mes
and
Rou
nd T
able
mee
tings
Org
anis
e re
gion
al t
rain
ing
prog
ram
me
and
Rou
nd T
able
mee
tings
A S
outh
ern
Afr
ica
soci
al p
olic
y an
d so
cial
pol
icy
anal
ysis
cou
rse
for
high
-lev
el c
ivil
serv
ants
in t
he s
outh
ern
Afr
ica
regi
on w
as
held
in S
wak
opm
und,
Nam
ibia
, in
Oct
ober
20
10
. Par
ticip
ants
cam
e fr
om B
otsw
ana,
Les
otho
, Nam
ibia
, Sou
th A
fric
a,
Sw
azila
nd, Z
ambi
a an
d Zi
mba
bwe.
0%
Goa
lTo
cre
ate
a su
stai
nabl
e en
viro
nmen
t fo
r se
rvic
e de
liver
y pa
rtne
rs (i
.e. p
ublic
ent
ities
) thr
ough
cap
acity
-bui
ldin
g, p
artn
ersh
ips,
col
labo
ratio
n, a
nd a
genc
y ag
reem
ents
Ou
tcom
eA
n ef
ficie
nt, e
ffec
tive,
and
dev
elop
men
t-or
ient
ed p
ublic
ser
vice
, and
em
pow
ered
, fai
r, an
d in
clus
ive
citiz
ensh
ip
Fun
ctio
nal
are
asS
trat
egic
ob
ject
ive
Bas
elin
eP
erfo
rman
ce in
dic
ator
Targ
etA
ctu
al o
utp
uts
% d
evia
tion
from
tar
get
Entit
y ov
ersi
ght
man
agem
ent
To im
plem
ent
a co
rpor
ate
gove
rnan
ce f
ram
ewor
k fo
r
publ
ic e
ntiti
es, b
odie
s an
d
boar
ds
Cor
pora
te g
over
nanc
e
fram
ewor
k fo
r pu
blic
ent
ities
,
bodi
es a
nd b
oard
s
Impl
emen
tatio
n of
cor
pora
te
gove
rnan
ce f
ram
ewor
k fo
r
publ
ic e
ntiti
es, b
odie
s an
d
boar
ds
Impl
emen
t co
rpor
ate
gove
rnan
ce f
ram
ewor
k fo
r
publ
ic e
ntiti
es, b
odie
s an
d
boar
ds
The
new
ND
A B
oard
was
app
oint
ed in
acc
orda
nce
with
the
prop
osed
cor
pora
te g
over
nanc
e fr
amew
ork.
A t
wo-
day
indu
ctio
n w
orks
hop
on B
oard
gov
erna
nce,
in
clud
ing
Kin
g III
, was
hel
d fo
r th
e ne
w N
DA
Boa
rd.
Wor
ksho
ps w
ere
held
for
offi
cial
s fr
om p
ublic
ent
ities
and
stat
utor
y bo
dies
.
An
indu
ctio
n w
orks
hop
on t
he f
ram
ewor
k w
as h
eld
for
the
new
Cou
ncil
and
Boa
rd o
f th
e S
A C
ounc
il of
Soc
ial S
ervi
ce
Pro
fess
ions
.
Com
plia
nce
issu
es r
elat
ed t
o th
e st
rate
gic
plan
, ope
ratio
nal
plan
s, a
nd q
uart
erly
rep
orts
wer
e al
so a
ddre
ssed
.
50
%1
To d
evel
op a
n en
titie
s ov
ersi
ght
man
agem
ent
stra
tegy
Pub
lic s
ecto
r fr
amew
orks
rela
ted
to p
ublic
ent
ities
(PFM
A)
Com
plet
ion
of a
n en
titie
s
over
sigh
t an
d m
anag
emen
t
stra
tegy
Dev
elop
an
entit
ies
over
sigh
t
and
man
agem
ent
stra
tegy
A s
trat
egy
was
dra
fted
.2
0%
2
To d
evel
op a
per
form
ance
man
agem
ent
fram
ewor
k fo
r
publ
ic e
ntiti
es, b
odie
s an
d
boar
ds
Per
form
ance
man
agem
ent
guid
elin
es
Dev
elop
men
t of
a
perf
orm
ance
man
agem
ent
fram
ewor
k fo
r pu
blic
ent
ities
,
bodi
es a
nd b
oard
s
Dev
elop
a p
erfo
rman
ce
man
agem
ent
fram
ewor
k fo
r
publ
ic e
ntiti
es, b
odie
s an
d
boar
ds
Per
mis
sion
was
gra
nted
to
adop
t th
e S
AR
S P
erfo
rman
ce
Man
agem
ent
Fram
ewor
k. H
owev
er, a
ste
erin
g co
mm
ittee
was
also
est
ablis
hed.
70
%3

Department of Social Development | Annual Report 2010/2011 115
Goa
lTo
cre
ate
a su
stai
nabl
e en
viro
nmen
t fo
r se
rvic
e de
liver
y pa
rtne
rs (i
.e. p
ublic
ent
ities
) thr
ough
cap
acity
-bui
ldin
g, p
artn
ersh
ips,
col
labo
ratio
n, a
nd a
genc
y ag
reem
ents
Ou
tcom
eA
n ef
ficie
nt, e
ffec
tive,
and
dev
elop
men
t-or
ient
ed p
ublic
ser
vice
, and
em
pow
ered
, fai
r, an
d in
clus
ive
citiz
ensh
ip
Fun
ctio
nal
are
asS
trat
egic
ob
ject
ive
Bas
elin
eP
erfo
rman
ce in
dic
ator
Targ
etA
ctu
al o
utp
uts
% d
evia
tion
from
tar
get
Entit
y ov
ersi
ght
man
agem
ent
To d
evel
op a
per
form
ance
man
agem
ent
syst
em f
or p
ublic
entit
ies,
bod
ies
and
boar
ds
Per
form
ance
man
agem
ent
fram
ewor
k
Reg
ular
rep
orts
on
the
perf
orm
ance
of
publ
ic e
ntiti
es,
bodi
es a
nd b
oard
s
Com
pile
reg
ular
rep
orts
on
the
perf
orm
ance
of
publ
ic e
ntiti
es,
bodi
es a
nd b
oard
s
Qua
rter
ly p
erfo
rman
ce a
sses
smen
t re
port
s w
ere
com
plet
ed.
An
annu
al p
erfo
rman
ce a
sses
smen
t re
port
on
SA
SS
A w
as
com
plet
ed.
0%
Inst
itutio
nal p
erfo
rman
ce
revi
ews
of a
ccou
ntin
g
auth
oriti
es
Con
duct
inst
itutio
nal
perf
orm
ance
rev
iew
s of
acco
untin
g au
thor
ities
No
revi
ews
wer
e co
nduc
ted.
40
%4
Fram
ewor
k fo
r m
onito
ring
the
perf
orm
ance
of
publ
ic
entit
ies,
bod
ies
and
boar
ds
Fina
l del
iver
y ag
reem
ents
with
publ
ic e
ntiti
es, b
odie
s an
d
boar
ds
Con
clud
e an
nual
del
iver
y
agre
emen
ts w
ith p
ublic
entit
ies,
bod
ies
and
boar
ds
A D
raft
ND
A M
emor
andu
m o
f Agr
eem
ent
for
the
20
10
/11
finan
cial
yea
r w
as c
ompl
eted
.
A d
raft
SA
SS
A M
emor
andu
m o
f Agr
eem
ent
for
the
20
10
/11
finan
cial
yea
r w
as c
ompl
eted
.
20
%5
Rev
iew
fou
ndin
g le
gisl
atio
n of
publ
ic e
ntiti
es, s
tatu
tory
bod
ies
and
boar
ds
Foun
ding
legi
slat
ion
of p
ublic
entit
ies,
sta
tuto
ry b
odie
s an
d
boar
ds
Rev
isio
n of
gov
erna
nce
aspe
cts
of t
he f
ound
ing
legi
slat
ion
Rev
iew
gov
erna
nce
aspe
cts
of
the
foun
ding
legi
slat
ion
The
ND
A A
ct w
as r
evie
wed
and
the
Am
endm
ent
Bill
was
due
to
be s
ubm
itted
to
Cab
inet
.
The
SA
SS
A A
ct w
as r
evie
wed
, and
am
endm
ents
pro
pose
d.
50
%6
Rea
son
s fo
r d
evia
tion
1 T
he s
ervi
ce p
rovi
der
with
drew
bef
ore
the
corp
orat
e go
vern
ance
fra
mew
ork
was
fina
lised
and
app
rove
d. It
sho
uld
be n
oted
tha
t th
e fr
amew
ork
is m
eant
to
be im
plem
ente
d in
pha
ses.
2 T
he b
ench
mar
king
exe
rcis
e to
ok lo
nger
tha
n an
ticip
ated
.3 T
he c
hang
ing
soci
al s
ecur
ity la
ndsc
ape
had
to b
e ta
ken
into
acc
ount
in d
evel
opin
g th
e pe
rfor
man
ce m
anag
emen
t fr
amew
ork.
4 T
he in
stitu
tiona
l per
form
ance
rev
iew
s of
the
acc
ount
ing
auth
oriti
es w
ere
not
com
plet
ed a
s th
e pe
rfor
man
ce y
ear
had
just
end
ed. Q
uart
erly
per
form
ance
rev
iew
s w
ere
com
plet
ed in
stea
d.5 T
his
was
due
to
chan
ges
in le
ader
ship
at
both
SA
SS
A a
nd t
he N
DA
.6 T
his
dela
y re
sulte
d fr
om t
he c
hang
ing
soci
al s
ecur
ity la
ndsc
ape
to e
nsur
e co
mpr
ehen
sive
ness
, inc
ludi
ng t
he le
gisl
ativ
e fr
amew
ork,
as
this
had
to
be t
aken
into
acc
ount
in t
he a
men
dmen
t pr
oces
s.

116 Annual Report 2010/2011 | Department of Social Development
Pro
gra
mm
e 5:
Str
ate
gy
an
d G
ove
rna
nce
Goa
lTo
hel
p cr
eate
dec
ent
wor
k th
roug
h th
e EP
WP in
the
soc
ial s
ecto
r
Ou
tcom
eIn
crea
sed
wor
k op
port
uniti
es, s
kills
, and
inco
me
leve
ls
Fun
ctio
nal
are
asS
trat
egic
ob
ject
ive
Bas
elin
eP
erfo
rman
ce in
dic
ator
Targ
etA
ctu
al o
utp
uts
% d
evia
tion
from
tar
get
Spe
cial
pro
ject
s
offic
e
Mai
nstr
eam
the
EP
WP
into
mor
e so
cial
sec
tor
sub-
prog
ram
mes
Targ
et o
f 80 0
00 jo
bs in
the
2009/1
0 fi
nanc
ial y
ear
Num
ber
of jo
b op
port
uniti
es
crea
ted
thro
ugh
curr
ent
and
new
ly in
tegr
ated
soc
ial s
ecto
r
prog
ram
mes
Cre
ate
96 0
00 jo
b
oppo
rtun
ities
thr
ough
cur
rent
and
new
ly in
tegr
ated
soc
ial
sect
or p
rogr
amm
es
By
31
Mar
ch 2
01
1 a
tot
al o
f 1
10
65
3 w
ork
oppo
rtun
ities
had
been
cre
ated
in t
he s
ecto
r. Th
is t
rans
late
s in
to a
figu
re o
f 6
1
32
2 F
TE o
ppor
tuni
ties.
0%
ECD
and
HC
BC
are
con
firm
ed
prog
ram
mes
; Kha
Ri G
ude,
Nat
iona
l Sch
ool N
utrit
ion
Pro
gram
me
and
Mas
s
Spo
rts
Par
ticip
atio
n w
ere
cons
olid
ated
in 2
010/1
1
Inte
grat
ion
of E
PW
P in
dica
tors
and
repo
rtin
g re
quire
men
ts
into
edu
catio
n (K
ha R
i
Gud
e-M
ass
Lite
racy
, Nat
iona
l
Sch
ool N
utrit
ion)
and
Spo
rts
and
Rec
reat
ion
(Mas
s Spo
rts
Par
ticip
atio
n) p
rogr
amm
es
Inte
grat
e EP
WP in
dica
tors
and
repo
rtin
g re
quire
men
ts in
to
educ
atio
n (K
ha R
i Gud
e-M
ass
Lite
racy
, Nat
iona
l Sch
ool
Nut
ritio
n) a
nd S
port
s an
d
Rec
reat
ion
(Mas
s S
port
s
Par
ticip
atio
n) p
rogr
amm
es
All
the
iden
tified
sub
-pro
gram
mes
wer
e m
ains
trea
med
into
the
EPW
P r
epor
ting
syst
em. T
his
boos
ted
sect
or p
erfo
rman
ce a
nd
ensu
red
the
crea
tion
of m
ore
wor
k op
port
uniti
es b
eyon
d th
e
trad
ition
al p
ilot
prog
ram
mes
.
0%
Cre
ate
enab
ling
envi
ronm
ent
for
impr
ovin
g th
e em
ploy
abili
ty
of E
PW
P w
orke
rs
Pilo
t so
cial
sec
tor
ince
ntiv
e
gran
t
Dev
elop
men
t of
a
com
preh
ensi
ve in
cent
ive
gran
t m
odel
for
fun
ding
soc
ial
sect
or s
ub-p
rogr
amm
es
part
icip
atin
g in
the
EPW
P
Dev
elop
a c
ompr
ehen
sive
ince
ntiv
e gr
ant
mod
el f
or
fund
ing
soci
al s
ecto
r su
b-
prog
ram
mes
par
ticip
atin
g in
the
EPW
P
The
Nat
iona
l Tre
asur
y al
loca
ted
R2
43
mill
ion
to t
he s
ocia
l
sect
or E
PW
P f
or 2
01
1/1
2, w
hich
tes
tifies
to
the
effo
rt m
ade
to m
obili
se a
dditi
onal
res
ourc
e fo
r so
cial
sec
tor
prog
ram
mes
part
icip
atin
g in
the
EP
WP.
0%
Rev
ised
con
ditio
ns o
f
empl
oym
ent
and
code
of
good
pra
ctic
e fo
r th
e EP
WP
Com
plet
ion
of a
reg
ulat
ory
fram
ewor
k fo
r co
nditi
ons
of
serv
ice
for
EPW
P w
orke
rs
Fina
lise
regu
lato
ry f
ram
ewor
k
for
cond
ition
s of
ser
vice
for
EPW
P w
orke
rs
The
Min
iste
rial D
eter
min
atio
n an
d C
ode
of G
ood
Pra
ctic
e fo
r
EPW
P w
ere
appr
oved
and
sig
ned
off
by t
he M
inis
ter
of L
abou
r.
All
prog
ram
mes
par
ticip
atin
g in
the
EP
WP
are
reg
ulat
ed b
y
thes
e in
stru
men
ts.
0%
Com
plet
ion
of a
pro
posa
l for
an a
ppro
pria
te e
mpl
oym
ent
disp
ensa
tion
for
EPW
P
wor
kers
Com
plet
e pr
opos
al f
or a
n
appr
opria
te e
mpl
oym
ent
disp
ensa
tion
for
EPW
P
wor
kers
A c
ostin
g an
d m
odel
ling
repo
rt w
as d
raft
ed a
nd p
rese
nted
to
the
proj
ect
man
agem
ent
team
. Key
opt
ions
in r
espe
ct o
f EP
WP
exte
nsio
n w
orke
rs w
ere
outli
ned.
10
%1

Department of Social Development | Annual Report 2010/2011 117
Goa
lTo
hel
p cr
eate
dec
ent
wor
k th
roug
h th
e EP
WP in
the
soc
ial s
ecto
r
Ou
tcom
eIn
crea
sed
wor
k op
port
uniti
es, s
kills
, and
inco
me
leve
ls
Fun
ctio
nal
are
asS
trat
egic
ob
ject
ive
Bas
elin
eP
erfo
rman
ce in
dic
ator
Targ
etA
ctu
al o
utp
uts
% d
evia
tion
from
tar
get
Spe
cial
pro
ject
s
offic
e
To p
ursu
e in
nova
tion
in s
ervi
ce
deliv
ery
and
in t
he in
cuba
tion
of n
ew p
roje
cts
A r
evie
w is
und
er w
ay t
o
asse
ss t
he im
pact
of
the
first
pha
se o
f th
e Kw
anda
prog
ram
me
Com
plet
ion
of g
uide
lines
for
faci
litat
ing
and
adop
ting
Kw
anda
as
a m
ass
orga
nisa
tiona
l cap
acity
-
build
ing
met
hod
in t
he s
ecto
r
Dev
elop
gui
delin
es f
or
faci
litat
ing
and
adop
ting
Kw
anda
as
a m
ass
orga
nisa
tiona
l, ca
paci
ty-
build
ing
and
deve
lopm
enta
l
com
mun
icat
ion
met
hod
in t
he
sect
or
A L
earn
ing
Con
voca
tion
was
hel
d on
1-3
Feb
ruar
y 2
01
1, a
nd
gene
rate
d le
sson
s fo
r gu
idin
g th
e fu
ture
impl
emen
tatio
n of
Kw
anda
.
0%
Kw
anda
com
mun
ities
in fi
ve
prov
ince
s
Expa
nsio
n of
Kw
anda
to
the
othe
r fo
ur p
rovi
nces
Mob
ilise
res
ourc
es f
or
expa
ndin
g Kw
anda
to
the
othe
r fo
ur p
rovi
nces
Kw
anda
was
exp
ande
d to
Gal
eshe
we
in t
he N
orth
ern
Cap
e, a
nd
stre
ngth
ened
in t
he fi
rst
five
prov
ince
s.
25
%2
DSD
fra
mew
ork
of b
enefi
ts
for
non-
stat
utor
y m
ilita
ry
vete
rans
Coo
rdin
atio
n of
DSD
cont
ribut
ion
to f
ram
ewor
k
of b
enefi
ts f
or n
on-s
tatu
tory
mili
tary
vet
eran
s
Co-
ordi
nate
DSD
con
trib
utio
n
to t
he f
ram
ewor
k of
ben
efits
for
non-
stat
utor
y m
ilita
ry
vete
rans
A w
orks
hop
to id
entif
y th
e D
SD
bas
ket
of s
ervi
ces
to m
ilita
ry
vete
rans
was
hel
d w
ith S
AS
SA
, ND
A a
nd t
he p
rovi
nces
on
4-5
Nov
embe
r 2
01
1. A
rep
ort
was
sig
ned
and
endo
rsed
by
the
Min
iste
r.
0%
Initi
al r
elat
ions
with
the
Cen
tre
for
Pub
lic S
ervi
ces
Inno
vatio
n
Rep
ositi
onin
g of
the
SPO
as
an in
nova
tion
and
incu
batio
n
hub
Rep
ositi
on t
he S
PO
as
an
inno
vatio
n an
d in
cuba
tion
hub
A p
ropo
sal w
as c
ompl
eted
and
was
due
to
be p
rese
nted
to
EXC
O.
0%
Num
ber
of s
ervi
ce d
eliv
ery
Inno
vatio
n pa
rtne
rshi
ps
esta
blis
hed
and
mai
ntai
ned
Esta
blis
h an
d m
aint
ain
serv
ice
deliv
ery
Inno
vatio
n
part
ners
hips
A w
orki
ng r
elat
ions
hip
was
est
ablis
hed
with
the
Cen
tre
for
Pub
lic S
ervi
ce In
nova
tion.
A d
raft
DS
D f
ram
ewor
k on
inno
vatio
n w
as d
evel
oped
.
0%
To s
tren
gthe
n pr
ogra
mm
e
man
agem
ent
syst
ems
Soc
ial s
ecto
r co
mm
unic
atio
n
stra
tegy
Coh
eren
t an
d in
tegr
ated
soci
al s
ecto
r co
mm
unic
atio
n
cam
paig
n
Impl
emen
t co
here
nt a
nd
inte
grat
ed s
ocia
l sec
tor
com
mun
icat
ion
cam
paig
n
The
vario
us E
PW
P p
artn
ers
impl
emen
ted
diff
eren
t el
emen
ts o
f th
e
com
mun
icat
ion
cam
paig
n:
The
EPW
P w
as p
rofil
ed d
urin
g in
duct
ion
and
grad
uatio
n
cere
mon
ies.
Art
icle
s on
EP
WP
wer
e w
ritte
n in
Itire
leng
, the
Nor
th W
est
Dep
artm
ent
of H
ealth
and
Soc
ial D
evel
opm
ent
mag
azin
e, t
he
NYD
A m
agaz
ine,
the
IDT
mag
azin
e, a
nd D
PW
pub
licat
ions
An
Ope
n D
ay w
as h
eld
at t
he D
epar
tmen
t of
Hea
lth.
The
SP
O s
uppo
rted
pub
lic e
vent
s or
gani
sed
by t
he D
DG
: EP
WP
in t
he D
PW
in t
he F
ree
Sta
te a
nd N
orth
ern
Cap
e.
The
SPO
par
ticip
ated
in th
e m
unic
ipal
eng
agem
ent s
umm
it he
ld
in D
urba
n by
the
Min
iste
r of
Pub
lic W
orks
.
0%

118 Annual Report 2010/2011 | Department of Social Development
Pro
gra
mm
e 5:
Str
ate
gy
an
d G
ove
rna
nce
Goa
lTo
hel
p cr
eate
dec
ent
wor
k th
roug
h th
e EP
WP in
the
soc
ial s
ecto
r
Ou
tcom
eIn
crea
sed
wor
k op
port
uniti
es, s
kills
, and
inco
me
leve
ls
Fun
ctio
nal
are
asS
trat
egic
ob
ject
ive
Bas
elin
eP
erfo
rman
ce in
dic
ator
Targ
etA
ctu
al o
utp
uts
% d
evia
tion
from
tar
get
Spe
cial
pro
ject
s
offic
e
Lack
of
alig
nmen
t of
sub-
prog
ram
mes
to
the
web
-
base
d EP
WP M
&E
syst
em
Alig
nmen
t of
sub
-pro
gram
mes
with
web
-bas
ed E
PW
P M
&E
repo
rtin
g sy
stem
Alig
n pa
rtic
ipat
ing
sub-
prog
ram
mes
with
web
-bas
ed
EPW
P M
&E
repo
rtin
g sy
stem
All
part
icip
atin
g su
b-pr
ogra
mm
es w
ere
inte
grat
ed in
to t
he
web
-bas
ed s
yste
m, w
hich
impr
oved
rep
ortin
g ou
tcom
es f
or t
he
soci
al s
ecto
r.
0%
Pro
vide
coo
rdin
atio
n an
d
impl
emen
tatio
n su
ppor
t to
EPW
P s
ub-p
rogr
amm
es,
prov
ince
s an
d en
titie
s
Ade
quat
e su
ppor
t fo
r na
tiona
l
stee
ring
com
mitt
ee;
need
to s
tren
gthe
n pr
ovin
cial
co-o
rdin
atio
n
Effe
ctiv
e an
d ef
ficie
nt
man
agem
ent
of E
PW
P
inst
itutio
nal m
echa
nism
s
Mai
ntai
n ef
fect
ive
and
effic
ient
man
agem
ent
of E
PW
P
inst
itutio
nal m
echa
nism
s
All
the
inst
itutio
nal s
truc
ture
s of
the
soc
ial s
ecto
r EP
WP
wer
e
oper
atin
g ef
fect
ivel
y. T
he a
nnua
l sec
tor
conf
eren
ce w
as
succ
essf
ully
hos
ted
in M
gung
undl
ovu,
and
reg
ular
ste
erin
g an
d
exte
nded
ste
erin
g co
mm
ittee
mee
tings
wer
e he
ld. T
hese
hav
e
ensu
red
that
the
ann
ual a
ctio
n pl
an is
eff
ectiv
ely
impl
emen
ted
and
mon
itore
d.
0%
Ade
quat
e su
ppor
t fo
r
prog
ram
mes
at
the
natio
nal
leve
l, bu
t pr
ovin
cial
sup
port
ham
pere
d by
cap
acity
cons
trai
nts
Impl
emen
tatio
n su
ppor
t to
EPW
P s
ub-p
rogr
amm
es,
prov
ince
s an
d en
titie
s
Pro
vide
impl
emen
tatio
n
supp
ort
to E
PW
P s
ub-
prog
ram
mes
, pro
vinc
es a
nd
entit
ies
Reg
ular
tro
uble
-sho
otin
g vi
sits
to
prov
ince
s an
d bi
late
ral
prog
ram
mes
wer
e un
dert
aken
to
ensu
re t
he a
chie
vem
ent
of t
he
targ
ets
set
out
in t
he S
ecto
r P
lan
and
annu
al A
ctio
n P
lan.
0%
Rea
son
s fo
r d
evia
tion
1 T
he p
roje
ct w
as d
elay
ed b
ecau
se t
he o
rigin
al s
ervi
ce p
rovi
der
coul
d no
t de
velo
p co
stin
g op
tions
. A n
ew s
ervi
ce p
rovi
der
was
app
oint
ed.
2 D
ue t
o in
suffi
cien
t re
sour
ces,
thi
s pr
ogra
mm
e co
uld
only
be
expa
nded
to
one
mor
e pr
ovin
ce.

Audit Committee Report

120 Annual Report 2010/2011 | Department of Social Development
DEPARTMENT OF SOCIAL DEVELOPMENT
Report of the Audit Committee
We are pleased to present our report for the Financial Year ended
31 March 2011.
Audit Committee members and attendanceThe Audit Committee’s function is primarily to assist the
Accounting Officer in discharging his responsibilities relative to
the Public Finance Management Act, 1999, (Act No 1 of 1999) as
amended. Its terms of reference are stated in the Audit Committee
Charter. The Committee has been so constituted as to ensure
its independence, with four external members. The Committee
consists of the members listed hereunder and has met six times
during the Financial Year, as per its approved terms of reference.
During the fiscal year under review, the following were members
of the Committee:
Name Position
Number of
meetings
attended
Date of
appointment
D P v/d Nest Chairperson 6 20 April 2010
B Potgieter Member 6 20 April 2010
JE v Heerden Member 6 20 April 2010
S Hari Member 4 20 April 2010
Audit Committee ResponsibilityWe report that we have adopted appropriate formal terms of
reference in our charter in line with the requirements of Section
38(1)(a) of the Public Finance Management Act, No. 1 of 1999
and Treasury Regulation 3.1. We further report that we conducted
our affairs in compliance with this charter.
The effectiveness of internal controlThe system of internal control applied by the Department of Social
Development over financial and risk management is effective,
efficient and transparent.
In line with the PFMA and the Treasury Regulation requirements,
Internal Audit provides the Audit Committee and management with
assurance that the internal controls are appropriate and effective.
This is achieved by means of the risk management process, as
well as the identification of corrective actions and suggested
enhancements to the controls and processes. From the various
Internal Audit reports, the Audit Report on the Annual Financial
Statements and the Management Report of the Auditor-General
South Africa, some deficiencies in the system of internal control
were identified. The Audit Committee will monitor the action plans
of the Department to correct these deficiencies. The deficiencies
in the internal control systems in SASSA again resulted in a
modified audit opinion for the Department.
The quality of in-year management and monthly/quarterly reports submitted in terms of the PFMA and the Division of Revenue ActWe are satisfied with the content and quality of monthly and
quarterly reports prepared and issued by the Accounting Officer
of the Department during the year under review. However, the
Committee recommends that the Department should improve
on the management of the reporting against pre-determined
objectives.
Evaluation of financial statements
We have:
Reviewed and discussed the audited annual financial
statements to be included in the annual report, with the
Auditor-General South Africa and the Accounting Officer.
Reviewed the Auditor-General South Africa’s Management
Report and management response thereto.
Reviewed changes in accounting policies and practices.
Reviewed the Department’s compliance with legal and
regulatory provisions.
Reviewed significant adjustments resulting from the audit.

DEPARTMENT OF SOCIAL DEVELOPMENT
Department of Social Development | Annual Report 2010/2011 121
Because of the accountability arrangement for the Social
Assistance Grants funds that are transferred from the Department
to the South African Social Security Agency (SASSA), the
department has again received a modified audit opinion. The
Department’s Financial Statements were again qualified in
respect of the Social Assistance Grants administered by SASSA,
an administration over which the Department has up to now,
had limited or/ineffective control. However, processes have now
been put in place that would enable the Department to monitor
the implementation of the improvement plans by SASSA. In this
regard acceptable progress has been made by SASSA in the
improvement of the deficiencies identified by the Auditor General
South Africa.
Internal auditWe are satisfied that the internal audit function is operating
effectively and that it has addressed the risks pertinent to the
Department in its audits.
Auditor-General South AfricaThe Audit Committee concurs and accepts the Auditor-General
South Africa’s conclusions on the annual financial statements,
and is of the opinion that the Audited Annual Financial Statements
should be read together with the Auditor General South Africa’s
Report.
We have also met with the Auditor- General South Africa to ensure
that there are no unresolved issues.
ConclusionThe Audit Committee wishes to congratulate the Director-General,
Adv. Madonsela, with the sustained good financial management
and control environment within the Department. Our gratitude is
also extended to the Acting CFO, her team and all managers and
staff of the Department. Their commitment and hard work has
resulted in the Department again improving on its control systems
and environment for the 2010/2011 financial year.
Dr DP van der Nest
Chairperson of the Audit Committee
31 July 2011


Annual Financial Statements
Part
D

124 Annual Report 2010/2011 | Department of Social Development
DEPARTMENT OF SOCIAL DEVELOPMENT VOTE 18
Annual Financial Statementsfor the year ended 31 March 2011
Contents Page
Report by the Accounting Officer to the Executive Authority and Parliament
of the Republic of South Africa 125
Report of the Auditor-General 142
Appropriation Statement 146
Notes to the Appropriation Statement 155
Statement of Financial Performance 157
Statement of Financial Position 158
Cash Flow Statement 159
Accounting Policies 160
Notes to the Annual Financial Statements 165
Disclosure Notes to the Annual Financial Statements 175
Annexures 181
Annual Financial Statements of the Disaster Relief Fund 187
Annual Financial Statements of the Refugee Relief Fund 192
Annual Financial Statements of the Social Relief Fund 197
Annual Financial Statements of the State President Fund 202
Annual Financial Statements of the High School Vorentoe Disaster Fund 207

DEPARTMENT OF SOCIAL DEVELOPMENT VOTE 18
Department of Social Development | Annual Report 2010/2011 125
Report by the Accounting Officer to the Executive Authority and Parliament of the Republic of South Africafor the year ended 31 March 2011
1. General review of the state of financial
affairs
1.1 Important policy decisions and strategic
issues facing the DepartmentIn line with its mission and strategic objectives, the Department has
been instrumental in providing a safety net for the poor, marginalised,
and vulnerable members of our society. To this end, the Department
has formulated a range of policies in areas such as social assistance
and integrated developmental social welfare services. These efforts
seek to expand and improve the services available to poor South
Africans to enable them to support themselves and participate
productively in the economy. The following are some of the key
achievements during the reporting period.
Social safety net
Social assistance: The Department, through the South African
Social Security Agency (SASSA), continued to administer and
disburse social assistance cash transfers to beneficiaries. Recipients
of social grants increased from 14 012 143 in April 2010 to
14 782 190 in March 2011. Men aged 60 years began to access
older person’s grants (OPGs) in the final phase of age equalisation,
which started in the 2008/9 financial year. The National Treasury
approved the universalisation (removal of the means test) of the OPG,
to be phased in by gradually raising the means test threshold to the
lowest tax threshold. Treasury also approved an increase in the age
limit for the child support grant (CSG).
The Social Assistance Amendment Act (No. 5 of 2010) came into
force in September 2010. A Social Relief Policy and Social Relief
Bill were approved by MINMEC.
Social insurance: The Department continued to contribute to
the work of the Interdepartmental Task Team on Social Security
Reform, and made extensive proposals for introducing new social
insurance benefits and overhauling the institutional framework
for providing social security. More specifically, the Department
proposed that the policy-making function for social security
be consolidated under one Department, and that a new social
insurance fund (the National Social Security Fund) be created to
provide retirement, disability, and survivor benefits to all formally
employed contributors mandated by government to contribute.
Appeals Tribunal: A social assistance appeals adjudication
strategy was finalised, resulting in the need to develop a
comprehensive social security adjudication policy. The Appeals
Tribunal adjudicated 41 000 appeals, which significantly reduced
the backlog. The Tribunal also launched a new appeals project
aimed at ensuring that all appeals against SASSA decisions on
or after 1 April 2010 are dealt with within 90 days. The Appeals
Tribunal also moved to new premises in Pretoria.
Welfare Services
Regulations under the Older Persons Act (No. 13 of 2006) were
approved by the Minister, published in the Government Gazette,
and brought into force by way of a Presidential Proclamation in
April 2010.
Regulations under the Children’s Act, 2005 (No. 31 of 2005 as
amended) were approved for implementation with effect from
April 2010.
Regulations under the Probation Services Act, 2002 (No. 35 of
2002) were finalised and discussed with relevant stakeholders.
Draft Regulations under the Prevention and Treatment of
Substance Abuse Act (No. 70 of 2008) were discussed with
stakeholders in all nine provinces.
The Department finalised and approved minimum norms and
standards for secure care and as well as a strategy on social
crime prevention for the social sector. The strategy was presented
to the Development Committee and the JCPS Cluster as a cluster
strategy. It will enhance the Department’s contribution to crime
prevention, and improve coordination with partners and key
stakeholders. In addition, the policy framework for accrediting
diversion services under the Child Justice Act (No. 75 of 2008)
was approved and tabled in Parliament.

126 Annual Report 2010/2011 | Department of Social Development
DEPARTMENT OF SOCIAL DEVELOPMENT VOTE 18
Report by the Accounting Officer to the Executive Authority and Parliament of the Republic of South Africafor the year ended 31 March 2011
The Department drafted a Green Paper on Families which was
presented to departmental structures for approval. The Green
Paper provides strategic guidance on the integrated provision of
services to families. The Department also developed and finalised
an integrated plan for services to families, an integrated parenting
framework, and a monitoring and evaluation framework for services
to families.
A transformation strategy for child and youth care centres was
developed in order to align them more closely with the provisions
of the Children’s Act. Norms and standards for cluster foster care
were developed for the care and protection of children under the
child protection programme and alternative care programme.
The register of adoptable children and prospective adoptive parents
(RACAP) was established, and 740 parents and 936 children were
registered. A total of 2 236 national adoptions and 200 inter-
country adoptions were registered. The Department accredited 23
organisations to manage national and/or inter-country adoptions.
Community Development
The Department developed a skills plan for helping Community
Development Practitioners (CDPs) to address sector skills gaps
in line with the recommendations of the National Skills Audit
Report. The skills plan was approved and implemented by all nine
provinces. While the skills plan was being developed, CDPs and
Masupa-Tsela Youth Pioneers were trained to provide value-add
technical support and mentorship to social cooperatives.
A community development policy framework was formulated and
presented to relevant management structures in the social sector.
The Department also helped four provinces to establish food
banks, including the City of Tshwane Food Bank.
The Department continued to support the War on Poverty
championed by the Office of the Deputy President. It also
developed a strategy for taking the DSD to communities in wards
identified as the poorest in the course of the campaign.
The home and community-based care and support programme
(HCBC) was among those selected to contribute to the social
sector plan for EPWP. Community caregivers in HCBC organisations
provide services to individuals, families and communities, and need
training in order to do so effectively. As a result, 19 895 community
caregivers were trained in respect of succession planning, child
care forums, the Children’s Act, psychosocial support, and
monitoring and evaluation. This helped to create jobs and career
paths for community caregivers. More than 1 000 Community
caregivers were also trained on psychosocial wellbeing.
The Department, in partnership with the Nelson Mandela
Foundation, introduced a strategy of mobilising and capacitating
communities to respond to HIV and AIDS. Following successful
community dialogues, it was decided to roll out the strategy in
seven provinces in the next financial year.
1.2 Significant events and developments
Social security
Social assistance: There has been a continued and a sustained
increase in the number of beneficiaries of the social assistance
programme. In the year under review, the number of beneficiaries
increased from 14 012 143 to 14 782 190.
Social insurance: The Department added to its body of knowledge
by completing a report on the pension systems of all members
of the Southern African Development Community (SADC), which
provided a fresh perspective on social security contributions in the
context of fiscal and economic constraints. It also produced a short
report on the current South African social security system to enable
our local and international guests at the World Social Security
Forum (WSSF) in Cape Town to better understand our context while
deliberating on future trends and pressing challenges facing social
security systems throughout the world.

DEPARTMENT OF SOCIAL DEVELOPMENT VOTE 18
Department of Social Development | Annual Report 2010/2011 127
The Department hosted this five-day conference of the
International Social Security Association (ISSA) in December
2010. This was the first time in ISSA’s 87-year history that South
Africa hosted the event, which is only held once every three years.
It was attended by more than 1 000 heads and administrators
of social security institutions, policy-makers, representatives of
international organisations, and social policy experts from more
than 100 countries. It enabled participants to analyse and debate
a range of issues facing social security throughout the world,
including the impact of demographic changes on social security,
and strategies for extending social security coverage.
Appeals Tribunal: The Appeals Tribunal previously reviewed its
business processes in order to address the appeals backlog. As
a result of these improvements, the Tribunal adjudicated 41 162
appeals during the reporting period.
Welfare Services
Business processes for providing social welfare services and
generic norms and standards for delivering social welfare services
were developed and prepared for implementation.
The Department allocated funds to 22 national NGOs. In order to
address disparities in the funding of NGOs, both nationally and
provincially, the policy on financial awards to service providers
(PFA) was reviewed and approved by MINMEC in March 2011.
The new Council for Social Service and Professions and
Professional Board for Social Work were established and
inaugurated in December 2010.
The Older Persons Act (No. 13 of 2006) came into force on 1 April
2010. The Minister of Social Development and the Older Persons
Forum launched the Charter on the Rights of Older Persons at a
Human Rights Month event at Freedom Park in Tshwane on 28
March 2011.
The Department finalised the amalgamation of all policies on
people with disabilities in line with the international Convention on
the Rights of Persons with Disabilities.
Minimum norms and standards for secure care were finalised
and approved. The policy framework for accrediting diversion
services under the Child Justice Act was approved and tabled in
Parliament. A strategy for social crime prevention was developed
and approved by the Heads of Social Development (HSD) in
February 2011.
The Children’s Act came into force on 1 April 2010, and was
launched by President Zuma at an event in Atteridgeville during
child protection week in May 2010.
The Department hosted a successful 2nd Biennial Summit on
Substance Abuse. It adopted resolutions guiding the development
of a national drug master plan and an integrated plan of action for
combating substance abuse.
Community Development
The Department hosted a successful community development
indaba which enabled practitioners and CSOs to engage on
issues surrounding and opportunities for community development
practice. Specific attention was paid to scope of practice, norms
and standards, an implementation model, and a funding protocol
for establishing community development forums.
Together with faith-based organisations, NGOs, and the private
sector, the Department organised events celebrating social
development month in North West. This created a solid platform
for an integrated approach to poverty alleviation. The Department
also procured clothing and food parcels from the private sector
which were distributed to poor, marginalised and vulnerable
households, including poor white households in Hermanstad in
Pretoria West and Vaalbank in Mpumalanga.
HIV and AIDS: The Minister launched a surveillance system
and report on maternal orphans in KwaZulu-Natal in December
2010. This system will help the Department to update information
on orphanhood in the country, and review and plan relevant
interventions.

128 Annual Report 2010/2011 | Department of Social Development
DEPARTMENT OF SOCIAL DEVELOPMENT VOTE 18
Report by the Accounting Officer to the Executive Authority and Parliament of the Republic of South Africafor the year ended 31 March 2011
Non-profit organisations: The Department received 15 232
new applications for registration from NPOs. A total of 10 238
were registered, while 4 723 did not meet the registration
requirements. A total of 12 625 notices were sent to non-
compliant NPOs, 45% more than the 6 987 notices issued during
the previous financial year.
Strategy and governance
The Minister of Social Development participated in the
55th Session of the UN Commission on the Status of Women, held
at UN headquarters in New York from 22 February to 4 March
2011. The session focused on the access of women and girls to
education, training, and science and technology, and the promotion
of equal access to full employment and decent work.
The Department, through the Special Projects Office, continued
to play a vital role in coordinating EPWP initiatives in the social
development sector. As a result, the sector created 110 653 work
opportunities, significantly more than the annual target of 96 000.
Some 61 322 of these jobs were full-time equivalents.
The Department, through the Population and Development Chief
Directorate, observed World Population Day (WPD) in July 2010 in
seven different provinces, and a national WPD event was held in
Parliament in October. This coincided with the launch of the State
of the World Population Report for 2010.
1.3 Major projects undertaken or completed
during the yearThe Department developed new capabilities and services to
ensure the compliance of the Child Protection Register and
Child and Youth Care Application (CYCA) with the Children’s Act
and Child Justice Act. The knowledge management strategy
was incrementally implemented, focusing on communicating
the strategy and conducting a readiness assessment. A new
functionality to support the War on Poverty was added to the
National Integrated Social Development System (NISIS). A
Geographic Information System (GIS) capable of mapping down to
household level was implemented using Google Earth.
The restructuring of the Appeals Tribunal was completed, and
provincial offices were opened in all nine provinces. Provincial
coordinators and support staff were appointed in Gauteng,
the Free State, North West, Northern Cape and Mpumalanga,
complementing the provincial offices established previously in the
other four provinces.
The Department continued to provide scholarships to social work
students, and 5 574 students were given scholarships during
the reporting period. Similarly, in order to broaden its skills base,
the Department provided financial aid to 75 staff members who
registered for courses at tertiary institutions.

DEPARTMENT OF SOCIAL DEVELOPMENT VOTE 18
Department of Social Development | Annual Report 2010/2011 129
1.4 Spending trends
Expenditure per programme and economic classification
The following table summarises expenditure per programme and economic classification during the 2010/11 financial year, compared with
expenditure during the 2009/10 financial year.
2010/11 2009/10
Expenditure
Final Actual as % of final Final Actual
appropriation expenditure Variance appropriation appropriation expenditure
R’000 R’000 R’000 % R’000 R’000
Appropriation per programme
1. Administration 201 677 194 159 7 518 96,3 178 035 177 820
2. Comprehensive Social Security 95 150 156 93 260 988 1 889 168 98,0 85 700 323 84 513 501
3. Policy Development, Review
and Implementation Support
for Welfare Services 341 291 337 060 4 231 98,8 316 345 315 890
4. Community Development 182 034 177 376 4 658 97,4 241 473 238 954
5. Strategy and Governance 65 903 61 447 4 456 93,2 72 011* 71 995*
Total 95 941 061 94 031 030 1 910 031 98,0 86 508 187 85 318 160
Appropriation per economic classification
Current payments
Compensation of employees 254 939 246 980 7 959 96,9 220 212 220 123
Goods and services 273 638 253 508 20 130 92,6 245 660 244 685
Interest on rent and land — 45 (45) 0,0 — 100
Transfers and subsidies
Departmental agencies and
accounts 5 940 856 5 940 856 — 100,0 5 523 678 5 523 678
Foreign governments and
international organisations 2 045 1 509 536 73,8 1 916 1 860
Non-profit institutions 65 399 63 780 1 619 97,5 63 573 61 106
Households 89 394 037 87 517 993 1 876 044 97,9 80 449 267 79 262 797
Gifts and donations — — — 0,0 — —
Payment for capital assets
Machinery and equipment 9 602 5 881 3 721 61,2 3 881 3 811
Software and other intangible
assets 545 292 253 53,6 — —
Payment for financial assets — 186 (186) 0,0 — —
Total 95 941 061 94 031 030 1 910 031 98,0 86 508 187 85 318 160
* The comparative amount of R47 774 appropriated for the Appeals Tribunal 2009/10 financial year has been shifted from Programme 5 to Programme 2 following the
movement of the Appeals Tribunal subprogramme to Comprehensive Social Security during the year under review (Actual expenditure: R47 772).

130 Annual Report 2010/2011 | Department of Social Development
DEPARTMENT OF SOCIAL DEVELOPMENT VOTE 18
Report by the Accounting Officer to the Executive Authority and Parliament of the Republic of South Africafor the year ended 31 March 2011
The Department spent 98,0% of voted funds in the 2010/11
financial year, against 98,6% in the 2009/10 financial year.
The initial budget allocation to the Department amounted to
R95,929 billion. As part of the 2010/11 Adjusted Estimates of
National Expenditure, additional amounts totalling R12 million
were allocated to the Department, as follows:
R5,6 million was approved as roll-over funds from the 2009/10
financial year for the Emergency Social Relief Fund; and
R6,4 million was approved for salary and housing allowance
adjustments.
Reasons for underspending
Programme 1: Administration reflects an under-expenditure of
R7,518 million. The underexpenditure is mainly due to the turn-
over of staff, delays in the filling of vacant posts and efficiency
savings realised on operational costs.
Programme 2: Comprehensive Social Security reflects under-
expenditure of R1,889 billion. The main reason was the lower than
expected uptake of social assistance and underexpenditure by the
Appeals Tribunal unit on projects which were not finalised before the
end of the financial year.
Programme 3: Policy Development, Review and
Implementation Support for Welfare Services reflects an
underexpenditure of R4,231 million due to the turnover of staff,
delays in the filling of vacant posts and efficiency savings realised
on operational costs.
Programme 4: Community Development reflects an under-
expenditure of R4,658 million which mainly relates to the delays
in the transfer of funds to NGOs due to outstanding compliance
aspects as well as the turnover of staff, delays in the filling of
vacant posts and savings realised on operational costs.
Programme 5: Strategy and Governance reflects an under-
expenditure of R4,456 million, mainly due to turnover of staff,
delays in the filling of vacant posts and savings realised on
operational costs.
Impact on programmes and service delivery
As reflected above, the Department spent 99,1% of its operational
budget for the 2010/11 financial year. It has asked for permission
to roll over R14,8 million of the unspent funds to the 2011/12
financial year. These funds will be used to finalise the projects
started by the Appeals Tribunal in the 2010/11 financial year.
Actions taken or planned to avoid recurrence
The Department continued to monitor its spending trends on a
monthly basis, and continued to implement cost-saving measures
introduced in the 2009/10 financial year.
It continued to reduce staff vacancies, from more than 20% at the
start of the 2008/09 financial year to about 8% by the end of the
2010/11 financial year. Posts vital to service delivery were filled.
Growth in the uptake of social grants is estimated in collaboration
with SASSA.
VirementsThe following virements were effected:
Per main division
Programme 2: Comprehensive Social Security – R10 million
was shifted from Programme 3: Policy Development, Review
and Implementation Support for Welfare Services, Programme
4: Community Development and Programme 5: Strategy and
Governance to the Disaster Relief Fund under Programme 2:
Comprehensive Social Security. Approval was also obtained to
transfer R20 million in March 2011.
Programme 3: Policy Development, Review and
Implementation Support for Welfare Services – R4,5 million
of the unspent funds under Programme 3: Policy Development,
Review and Implementation Support for Welfare Services
was shifted to the Disaster Relief Fund under Programme 2:
Comprehensive Social Security.
Programme 4: Community Development – R4,5 million of the
unspent funds under Programme 4: Community Development
was shifted to the Disaster Relief Fund under Programme 2:
Comprehensive Social Security.

DEPARTMENT OF SOCIAL DEVELOPMENT VOTE 18
Department of Social Development | Annual Report 2010/2011 131
Programme 5: Strategy and Governance – R1,0 million of the
unspent funds under Programme 5: Strategy and Governance
was shifted to the Disaster Relief Fund under Programme 2:
Comprehensive Social Security..
Per economic classification
Goods and Services: R20,524 million was shifted from Goods
and Services mainly to the Disaster Relief Fund.
Transfers and subsidies: Approval was obtained from the National
Treasury to transfer R20 million to the Disaster Relief Fund.
1.6 Services rendered by the DepartmentThe Department of Social Development is responsible for:
Developing policies and strategies in the areas of
comprehensive social security, social welfare, and community
development;
Developing and coordinating social policy within government
and other sectors of society;
Conducting and integrating population and development
research across government departments;
Leading strategic planning processes for the social
development sector;
Monitoring and evaluating social development programmes;
and
Supporting policy implementation.
1.7 InventoriesThe only inventories kept by the Department were inventories
of stationery to the book value of R754 640,64 as at 31 March
2011. The stationery is stored centrally at the Department’s
offices in the Human Sciences Research Council (HSRC) Building,
134 Pretorius Street, Pretoria.
1.8 Capacity constraintsA generic organisational structure for provincial Departments of
Social Development was developed as part of the human capital
sector strategy, and its phased implementation was approved by
MINMEC on 31 March 2011.
Progress was also made with co-ordinating the regrading of
occupations in the Population and Development and Monitoring
and Evaluation functional areas in order to remedy inconsistencies
and ensure uniformity in the grading of similar jobs in the social
development sector. Benchmarked job descriptions for both
functional areas were finalised, and the project teams were in the
process of evaluating them in order to determine grading levels.
A Human Resources Plan for the national Department was
developed and approved by the Minister, and good progress was
made with implementing it. Part of the plan involves reorganising
the Department’s organisational structure to ensure that its
functions are aligned with the government’s new outcomes
approach as well as the Minister’s priorities. The realignment is
due to be completed in the 2011/2012 financial year.
A three-year wellness strategy was developed and approved.
About 25% of the strategy was implemented, which included the
following:
The first Sports Day in the history of the Department;
Two Wellness Days during which 328 officials had their blood
pressure, glucose levels and cholesterol levels checked, thus
encouraging them to adopt healthier lifestyles;
The observance of World AIDS Day, aimed at creating greater
awareness of HIV and AIDS among officials;
Gender dialogues during which officials discussed relevant
issues affecting them on a daily basis; and
Routine counselling to officials experiencing challenges
impacting on their productivity and wellbeing.
The Department developed and implemented a Work Place Skills
Plan as required by the Skills Development Act (No. 97 of 1998).
The unit sucessfully coordinated 121 courses, attended by 428
officials. A total of R4 512 097,24 was spent on training, which
was more than the 1% of the personnel budget (amounting to
R2 451 380) required by the Act.
The Department continued to enhance its skills base by providing
study bursaries to staff members. A total of 75 staff members
received bursaries for various fields of study. The Department also
continued its internship programme. A total of 45 interns were
placed in the Department, and many secured permanent jobs, not
only in the Department but elsewhere in the government sector
as well.

132 Annual Report 2010/2011 | Department of Social Development
DEPARTMENT OF SOCIAL DEVELOPMENT VOTE 18
Report by the Accounting Officer to the Executive Authority and Parliament of the Republic of South Africafor the year ended 31 March 2011
The Directorate continued to provide technical support to
line managers for implementing various capacity-building
programmes. A total of 61 learners completed child and youth
care learnerships in partnership with Gauteng and the HWSETA.
All the graduates secured permanent jobs.
As part of its recruitment and retention strategy, the Department,
in partnership with the HWSETA and SACSSP, introduced the first
ever social work exchange programme, which was launched by
the Minister in February 2011. The first phase of the programme
was completed when eight officials from the United Kingdom and
eight local social workers changed places.
Staff members signed performance agreements and completed
work plans, mid-term review reports, and annual performance
appraisals as stipulated in the Department’s PMDS policy.
Social dialogue with trade unions was entrenched in the
Department and sector. Both the Bargaining Council and National
Chamber operated effectively, and the Council concluded four
collective agreements. This resulted from a number of initiatives,
including building the capacity of participants. The Department
also maintained sound internal labour relations. Some 95%
of misconduct cases were finalised within three months, and
all grievances were finalised within 30 days except when they
involved phased mediation processes.
2. Utilisation of donor funds
2.1 Department for International
Development (DfID) Strengthening Analytical Capacity for Evidence Based
Decision Making (SACED)
Support: £3,8 million
The Department continued to implement this programme in
partnership with the University of Oxford and University of
KwaZulu-Natal. It is aimed at training officials involved in policy
development in national and provincial departments in social
policy analysis and evidence-based policy-making. This enables
the Department to play a leading role in pro-poor, evidence-based
policy development, working in partnership with other government
departments and the broader research community.
The Department continued to pursue the following outcomes
under the SACED Programme:
Establishing a pro-poor research and policy agenda;
Developing a research programme for informing policy
develop ment and decision-making within government;
Developing a research evidence base for pro-poor social policy;
Translating research into policy implementation; and
Disseminating analysis and research findings in order to
promote policy discourse.
A total of R2,073 million was spent on this programme during the
2010/11 financial year.
2.2 United Nations Children’s Fund (UNICEF) Training provincial officials on standards and operating
procedures for child care and protection during the 2010
FIFA World Cup South Africa
Donation in kind
UNICEF committed R500 000 to training officials in all nine
provinces and staging a one-day national indaba in Pretoria. A
total of R300 000 was spent on training, and R200 000 on
developing child exploitation guidelines.
UNICEF also committed R500 000 to training social workers in the
provinces. Of this, R200 000 was spent on training.
UNICEF committed a further R900 000 to research on 20 prevention
and early intervention programmes. R900 000 was paid to the
service provider.
2.3 USAID Development of an implementation plan for combating
child abuse, neglect and exploitation
Donation in kind
USAID donated R3 594 397 for the development of an
implementation plan for combating child abuse, neglect and
exploitation; a costing tool; and training 160 national and
provincial officials as master trainers on the costing tool. The
service provider was paid R528 616 in January 2010, and
R1 732 340 in the 2010/11 financial year.

DEPARTMENT OF SOCIAL DEVELOPMENT VOTE 18
Department of Social Development | Annual Report 2010/2011 133
2.4 World Health Organisation (WHO) Providing promotional material on child care and protection
Donation in kind
The WHO donated R100 000 for the printing and distribution of
promotional material in respect of child care and protection during
the 2010 FIFA World Cup. This sum was paid to the service provider.
2.5 European Commission (EC) Support for the Victim Empowerment Programme (VEP)
Donation in kind
The EC committed €18,6 million over three years to a programme
of assistance to the Victim Empowerment Programme (VEP).
The programme is aimed at building capacity in the national
and provincial Departments of Social Development to manage,
coordinate and lead the VEP. It is also aimed at strengthening
relationships between the government and civil society, thereby
ensuring that the VEP policy and minimum standards are
implemented and effectively improve services to victims of crime,
especially women and children.
The United Nations Office on Drugs and Crime (UNODC) agreed
to act as the implementing agency. The first tranche of €5 million
(about R64,3 million as per the exchange rate on 31 March
2008) was received towards the end of the 2007/08 financial
year to kick-start the programme, and it is still progressing well.
An additional amount of €4,574 (about R 54,8 million as per the
exchange rate on 31 March 2010) was made available in the
2010/11 financial year. The main achievements during the year
under review were as follows:
Victim empowerment one-stop centre model
A one stop centre model was finalised and adopted by the
sector for implementation.
Two provincial task teams were formed to roll out the
establishment of one stop centres in Limpopo and the Eastern
Cape.
A national cluster department team was established to oversee
the development of one stop centres.
Accreditation of VEP training
Facilitating learning, funding proposal writing, finance for non-
finance managers, human trafficking rehabilitation, and trauma
counselling training courses were mapped against existing
SAQA unit standards.
A workshop was held to familiarise units in the Department
with the VEP, and an internal task team was established to
align VEP material with SAQA frameworks.
A concept paper on victim empowerment leadership
qualification was developed, and a curriculum was being
finalised.
Mentoring and coaching model
A mentoring and coaching model was developed, and four
provinces were selected and consulted on the piloting the
model.
A mentoring curriculum was developed and approved.
Four provincial and NGO officials were trained in mentoring and
coaching.
Three NGOs were appointed to mentor 12 emerging NGOs in
Limpopo and Mpumalanga.
Training government officials and CSOs in
integrated trauma counselling
A total of 1 s700 officials were trained, exceeding the target of
1 400.
Integrated generic set of indicators (GIS)
Generic indicator tools were successfully piloted in three
provinces.
The preliminary findings were presented to the VEP conference
in October 2010. A detailed analysis of the pilot sites was
conducted.
Victim satisfaction survey
A service provider was appointed to conduct the survey, which
was divided into phases.
Phase 1 of the survey has been completed and the following
has been achieved;

134 Annual Report 2010/2011 | Department of Social Development
DEPARTMENT OF SOCIAL DEVELOPMENT VOTE 18
Report by the Accounting Officer to the Executive Authority and Parliament of the Republic of South Africafor the year ended 31 March 2011
The research instruments have been designed and adopted by
the cluster
Pilot on the instruments and tools were conducted at service
site level.
Comic cartoons for raising awareness of victim
empowerment
Six comic cartoons were developed on the themes of domestic
violence, human trafficking, sexual assault, child sexual assault,
abuse of the elderly, and abuse of people with disabilities to be
utilised as an awareness strategy
The Everyday Heroes brand was developed to market VEP
services.
A distribution framework was developed.
Promotional material such as posters, a logo, radio clips, and
TV animation was developed.
A website was developed and brought on line.
2.6 Canadian International Development
Agency (CIDA)Improved response to child abuse, neglect and
exploitation (CANE)
Support: CAN$5 million
Intermediate outcomes under this project include:
Improved intersectoral coordination and communication
between identified child protection stakeholders in terms of
CANE data.
Improved management of CANE data by selected DSD child
protection workers.
Enhanced evidence-based gender-responsive programming
and planning for boys and girls.
Achievements during the year included the development of
a concept paper on child protection dialogues, a conceptual
framework, a methodological framework, a data collection
instrument, terms of reference for appointing a national research
team, terms of reference for the GIS Mapping of DSD service
points and funded NGOs, terms of reference for a literature
review, and a research proposal for CIA.
Focus group discussions (FGDs) for CIA were held in eight
provinces, and a service provider was appointed to transcribe
FGD for CIA.
A total of R3,617 million was spent on this programme during the
2010/11 financial year.
2.7 Health and Welfare SETADiscretionary funding for training staff working in
protective workshops
Funding utilised: R1 238 104
A total of 600 provincial officials were trained at a cost of
R670 320. The programme was completed in the 2010/11
financial year.
The Department also successfully implemented a public
administration learnership programme for 13 members of staff,
which was finalised in the 2010/11 financial year.
This initiative provided staff with access to a university, and a
number of learners were awarded bursaries to further their studies.
The Department, in partnership with the Gauteng Department of
Health and Social Development, piloted learnerships in child and
youth care. Sixty-five learners participated in the initiative and
graduated in June 2011. A total of R670 320 was spent during the
2010/11 financial year.
2.8 JICA/Japanese Technical Cooperation
SchemeEstablishment of integrated HCBC M&E system
Donation in kind for technical support: R141 816
The establishment of the integrated HCBC M&E system by the
departments of Social Development and Health, with support from
the Japan International Cooperation Agency (JICA), was successfully
completed in March 2010. The project began in 2006, and the first
phase was implemented in one district in North West and two in
KwaZulu Natal. The success of the first phase was confirmed by
a mid-term evaluation conducted in November 2008. The project
was then rolled out in two districts in North West, 11 districts in
KwaZulu-Natal, and five in the Northern Cape.

DEPARTMENT OF SOCIAL DEVELOPMENT VOTE 18
Department of Social Development | Annual Report 2010/2011 135
In order to ensure the sustainability of the system, the Department
established a national task team (NTT) comprising senior
managers and members of the implementing task teams of both
departments. Its main function was to oversee the implementation
process, and advise and intervene at the senior management level.
Provincial and district coordinators were trained on the paper-
based data collection system, and the training was then
cascaded to local officials and HCBC organisations. The training
of organisations was completed in December 2009 in the
three implementing provinces: North West, Northern Cape, and
KwaZulu-Natal. IT training was completed in April 2010, following
which data collected at the district level was fed into a central
computerised database.
The final project evaluation was conducted jointly by the DSD,
DoH and JICA. It confirmed that the project had been successfully
implemented. The HCBC M&E provided a good platform for
enhancing the reporting of community-based services to the DSD.
Despite the project’s success, the evaluation pointed to a number
of aspects requiring attention, notably that the NTT should develop
an ongoing evaluation capacity besides its monitoring capacity.
As a result, a consulting firm was appointed to train the NTT in
the use of improved analytical methods and the planning of an
evaluation survey utilising the monitoring and evaluation system
established by the project.
An amount of R141 816 was spent on the project in the 2010/11
financial year.
3. Trading entities and public entities
3.1 The National Development Agency (NDA)Despite a budget shortfall, the NDA continued an intensive
grant funding process. Funds were made available to a variety
of community projects, including projects promoting food
security, early childhood development, income generation, and
capacity-building.
Building civil society capacity remained the NDA’s most important
objective, and it implemented an extensive capacity-building
programme in partnership with its stakeholders.
The NDA Board approved grants to 43 CBOs, NGOs and
co-operatives amounting to R42,4 million. These grants directly
benefited 142 204 women, 84 050 men, 66 885 youths and 5
436 people with disabilities.
The initial budget for project funding was R67 million. This was
reduced to R33 million due to budget cuts implemented by
National Treasury in the 2010/11 financial year. The allocation for
grant funding was increased by a nominal amount which came
from discontinued projects.
Despite these challenges, the NDA will continue to play a key
role in promoting the government’s objectives of improving
rural livelihoods, the quality of education, social cohesion, and
the delivery of services to the poor. It will continue to leverage
resources through strategic partnerships with both public and
private sector entities in order to optimise impact on poverty
eradication.
3.2 The South African Social Security Agency
(SASSA)SASSA was established in terms of the South African Social
Security Agency Act (No. 9 of 2004), and classified as a
schedule 3A national public entity in terms of the Public Finance
Management Act (No. 1 of 1999 as amended). Its mandate is to
ensure the provision of comprehensive social security services
against vulnerability and poverty within the constitutional and
legislative framework.
SASSA’s priorities for the 2010/11 financial year were to introduce
a customer-centred benefits administration and management
system; improve systems integrity; and increase access to social
security.

136 Annual Report 2010/2011 | Department of Social Development
DEPARTMENT OF SOCIAL DEVELOPMENT VOTE 18
Report by the Accounting Officer to the Executive Authority and Parliament of the Republic of South Africafor the year ended 31 March 2011
Introducing a customer-centred benefits
administration and management system
This involved improving the grant application process, payment
system, and grant review system.
Social grants increased from 14 057 365 at the end of the
previous financial year to 14 935 832 at the end of the year under
review, an increase of 6,2%. The implementation of Regulation
11(1) resulted in 2 077 social grants being paid out.
All grants increased except for war veteran’s grants, which
decreased by 21,2%, and disability grants, which decreased by
5.0%. Grants-in-aid increased by 9,7%, child support grants by
8,4%, care dependency grants by 1,3%, and foster child grants
by 0,4%.
A total of 282 104 men aged 60 to 64 received grants for older
persons, a 29% increase over the previous financial year. The
highest rate of growth was recorded in Limpopo, Gauteng and
Mpumalanga, and the lowest in the Northern Cape.
A total of 876 543 children aged 15 to 18 benefited from CSGs.
The uptake of CSGs increased by 510% over the previous
financial year. Growth in all regions averaged more than 400%.
Improving the grant application process (IGAP)
SASSA dealt with new grant applications within nine days on
average, against 21 days in the previous financial year.
Improving the payment system
Significant progress was made with migrating the payment of
beneficiaries from cash payments to ACB. In November 2010 a
total of 47% of grants were paid via ACB or banks, compared with
32% in the same month in the previous financial year.
During the reporting period, 44,89% of beneficiaries (1 331 983)
received their grants through the banks and post office.
The cost of administering a single cash payment was reduced
from R33,52 to R30,53, a saving of almost 9%.
Improving the grant review system
The Agency reviewed 112 363 medical assessments. A total of
555 433 reviews were conducted, 328 167 life certificates were
issued, and 1,18 million social grants lapsed.
Improving systems integrity
This involved implementing an integrity model, an integrated risk
management framework, and a legal services model.
Integrity model
A total of 132 603 beneficiaries were verified for eligibility and
existence, and 7 133 were found to be fraudulent.
The Agency, through the Special Investigations Unit (SIU),
continued to investigate and prosecute people found to have
defrauded the system. A total of 2 828 persons were brought
before the courts in the year under review, bringing the total to
17 477 since the inception of the project in June 2006.
A total of 6 368 people signed Acknowledgments of Debt (AODs)
valued at R56,7 million to repay the fraudulently obtained grants.
Integrated risk management framework
The information communication and technology as well as
disaster recovery and business continuity plans were developed
and approved
Legal services model
Litigation dropped from 61 498 cases in 2006/07 to 1 944 cases
in 2010/11 – a reduction of 96,8%. Most occurred in KwaZulu-
Natal, followed by the Eastern Cape.
Increased access to social security
To increase access to and ensure the equity of social assistance
services, especially in rural and semi-rural areas, SASSA
embarked on an Improved Community Registration Outreach
Programme (ICROP).
A total of 675 subprogrammes were conducted in 120
municipalities across the country. As a result, 72 425 new
beneficiaries were registered.

DEPARTMENT OF SOCIAL DEVELOPMENT VOTE 18
Department of Social Development | Annual Report 2010/2011 137
An estimated 3 766 households that experienced undue
hardships were given temporary relief in the form of vouchers or
food parcels as well as assistance with other material needs.
Deviations from the Strategic Plan for 2010/11
Modules not implemented due to financial constraints
IGAP was not implemented due to incomplete negotiations with
organised labour as well as budgetary constraints.
The climate culture survey was not conducted due to budgetary
constraints.
Case management guidelines were not implemented. It was
decided that, due to resource constraints, case management
would be undertaken by the DSD and that SASSA would
support it by providing data.
4. Relief Fund Boards
4.1 Relief fundsThe Department manages the following four funds established
under the Fund-Raising Act (No. 107 of 1978) as amended:
Disaster Relief Fund: The purpose of this fund is to assist persons,
organisations and bodies who or which have suffered damage or
loss as a result of a disaster. The Minister reappointed the Disaster
Relief Fund Board, and mandated it to deal with all outstanding
issues relating to the funding of disaster and other relief.
Refugee Relief Fund: The purpose of this fund is to render
assistance to refugees, as deemed fair and reasonable by the
Refugee Relief Fund Board.
Social Relief Fund: The purpose of this fund is to render
assistance to persons with psychosocial problems as well as
victims of violence, as deemed fair and reasonable by the Social
Relief Fund Board.
State President’s Fund: The purpose of this fund is to assist
the victims of any act of terrorism with medical treatment and
rehabilitation, and relieve financial hardship or financial distress
caused directly or indirectly by any act of terrorism, in ways deemed
fair and reasonable by the State President’s Fund Board.
A Social Relief Bill was drafted in order to consolidate all the
Social Relief Funds and repeal the Fund Raising Act (No. 107 of
1978). A Social Relief Policy was developed, and a process begun
to align it with the Social Relief Bill. The Bill was submitted to the
Cabinet during the 2010/11 financial year.
The repeal of the Fund Raising Act and consolidation of Social
Relief Funds will remove the management of the funds by the
Relief Funds Board, with a view to cascading the management
and disbursement functions to the provinces.
It is envisaged that the disbursement function of Social Relief
of Distress will be removed from SASSA, in order to streamline
all disbursement of Social Relief of Distress, and fast-track
interventions.
4.2 Other humanitarian assistance
Hoërskool Vorentoe Disaster Fund
This fund was established following a bus disaster involving high
school pupils in 1985, and donations were collected from various
organisations and members of the public. During the period under
review the Disaster Relief Fund Board decided that the fund
should be wound up and all monies deposited into the Disaster
Relief Fund account. This was done on 26 August 2010, and
R149 949,07 was deposited in the Disaster Relief Fund account.
Poverty Relief Funds under the Independent
Development Trust (IDT)
Funds were allocated to the Hemp Farming Project in the Eastern
Cape, the Itsoseng Women’s Empowerment Project, and the
administrative management of these funds by the IDT. The closing
balance as at 31 March 2011 was R15 091 945,08. This amount,
including interest accrued, will be used as follows:
R4,9 million for municipal projects in the Free State;
R4,5 million for the community development projects in the
Eastern Cape;

138 Annual Report 2010/2011 | Department of Social Development
DEPARTMENT OF SOCIAL DEVELOPMENT VOTE 18
Report by the Accounting Officer to the Executive Authority and Parliament of the Republic of South Africafor the year ended 31 March 2011
R5,6 million for the design and implementation of integrated
development programmes with the potential to create
sustainable jobs, generate income, and promote the
participation of cooperatives, ECDs, military veterans, women,
and youths; and
management and administration by the IDT.
Poverty relief bank balances as at 31/03/2011
in all bank accounts
Account holder
name:
Independent
development trust
Bank: ABSA
Account number: R6 842 067,16 407 059 8118
R1 473 554,72 406 844 7597
R6 776 323,20 A407 262 1012
Branch name: Volskas Centre, Pretoria
Branch number: 632 005
5. Utilisation of the Criminal Assets
Recovery Account (CARA) fundsIn the year under review the following projects and related
activities were undertaken:
5.1 Strengthening victim support service
centres and shelters
Project 1: Victim Support Services
Projects under this outcome were successfully finalised.
Project 2: Strengthening Shelters
The purpose of this project was to improve shelter infrastructure
by means of renovations. Funds were transferred to nine shelters
for this purpose.
Shelters are expected to comply with the norms and standards for
VEP services. Funding made it possible for shelters to meet these
standards and promote the rights of victims.
Sinethemba Shelter received the second last tranche of its grant. It
continued to render the service as indicated on its business plan.
Gamagata Shelter was threatened with closure due to the death of
its director. The organisation was caught up in succession battles
and its board was failing to give direction. The Department wrote a
number of letters to the organisation as well as the relevant provincial
office, asking it to intervene. The organisation was not committed to
attending meetings held to resolve its governance issues.
Project 3: New Shelters
Funding was provided to Sinethemba Shelter, but it experienced a
budget shortfall. The provincial Department of Human Settlement
was asked to assist the shelter and fund the shortfall. The
shelter was advised to apply for extra funding. It was awaiting an
assessment by local government and the Department of Human
Settlement before approval could be granted.
Tirisano Shelter in Mpumalanga also did not have enough
funding to complete its building started with CARA funds. This
problem arose because the team that initially assisted Tirisano
underestimated the building costs.
The national Department asked the provincial Department to
secure additional funds for financing the shortfall This was
approved, and the shelter was launched during the 16 Days
of Activism for No Violence Against Women and Children in
November 2010.
Project 4: Prevention Programme
The purpose of this project was to strengthen three programmes
for engaging men and boys in campaigns of no violence against
women and children in North West, Northern Cape and Gauteng.
The programmes were aimed at breaking the cycle of violence by
addressing potential perpetrators.
Due to a leadership struggle, the National Violence Against
Women (NVAW) organisation failed to account for funds received.
The Department continued to pursue the matter.

DEPARTMENT OF SOCIAL DEVELOPMENT VOTE 18
Department of Social Development | Annual Report 2010/2011 139
SAMEC prevention programme were challenged with governance
issues which began to affect service delivery. The national
Department asked the provincial department to intervene and
facilitate a solution.
6. Organisations to which transfer
payments were madeTransfers to provinces: No transfer payments were made to
provinces during the 2010/11 financial year.
Transfers to local government: No transfer payments were
made to local governments during the 2010/11 financial year.
Transfers to households: A total of R87,517 billion was
transferred to households during the 2010/11 financial year.
Transfers to Departmental agencies and accounts: A total
of R5,940 billion was transferred to public entities during the
2010/11 financial year.
Transfers to NGOs, other entities and civil society: A total
of R63,780 million was transferred to NGOs and other entities
during the 2010/11 financial year.
Transfers to universities and technikons: No transfers
were made to universities or technikons during the 2010/11
financial year.
Transfers to foreign governments and international organisations:
A total of R1,509 million was transferred to international
organisations during the 2010/11 financial year.
7. Corporate governanceThe Director-General exercises overall authority over the affairs of
the Department. Senior managers helped him to administer the
Department. Management established a network of processes
for controlling the operations of the Department in a way which
provides a reasonable assurance that:
Data and information published either internally or externally is
accurate, relevant, reliable, credible and timely.
The actions of managers and employees comply with the
Department’s policies, standards, plans and procedures, as
well as relevant laws and regulations.
Resources are acquired economically and employed effectively
and efficiently, and quality business processes and continuous
improvement are emphasised.
The fraud prevention strategy was developed and the focus is
on the implementation.
The Department’s plans, programmes, goals, and objectives
are achieved.
The risk management policy, framework and strategy are
effectively implemented, annual risk assessments are
completed for all units, and the risk register is regularly
monitored and progress reports submitted to the executive and
audit committees of the Department.
7.1 Efficacy of governance structuresNumerous governance structures have been established in the
Department to ensure that it complies with relevant policy and
legislation. While other forums and structures are in place within
specific programmes, the following are the main governance
structures that have been effective in ensuring that the
Department complies with its mandate and achieves its strategic
objectives:
Executive Committee (EXCO)
Bid Committees
Management Committee (MANCO)
Budget Committee
Risk Management Committee
Loss Control Committee
Audit Steering Committee
Audit Committee
The function of the Risk Management Committee is to assist the
accounting officer with discharging his responsibilities in respect of
enterprise risk management and all matters associated with this.

140 Annual Report 2010/2011 | Department of Social Development
DEPARTMENT OF SOCIAL DEVELOPMENT VOTE 18
Report by the Accounting Officer to the Executive Authority and Parliament of the Republic of South Africafor the year ended 31 March 2011
In terms of Section 38(1) (a) (ii) of the Public Finance Management
Act (No.1 of 1999) as amended, the Accounting Officer has
established and maintained an internal audit system under the
control and direction of the Audit Committee. This is in line with
Treasury Regulations 27.1.1 which provide for the establishment
of an Audit Committee which complies with and operates in
accordance with regulations and instructions prescribed in terms
of sections 76 and 77 of the Act.
The Audit Committee met four times during the year under
review to consider the internal audit plans and activities of the
Department, and management’s plans and processes with regard
to risk management, control, and good governance.
Audit Planning
An audit plan detailing the audits to be conducted during the
2010/11 financial year was drawn up. The plan reflected the
perceived risks associated with each activity undertaken by
the Department. All audits complied with recognised auditing
standards and the Audit Charter. The plan was submitted to the
Audit Committee for review and approval.
Reporting
Following the completion of each audit, formal reports were
prepared to record the findings, recommendations and conclusions.
The reports were then submitted to the relevant managers to
confirm their accuracy and respond formally to issues raised.
8. Transitional financial arrangements for
shifting the social assistance function from
the provinces to national governmentThe social assistance grant debtors were accounted for in terms
of the directive issued by the National Treasury in May 2007. The
project to reconcile these debtors was progressing well.
An amount of R89,368 billion for the payment of social grants
in the 2010/11 financial year was voted to the Department of
Social Development as transfers to households. SASSA remained
responsible for administering and disbursing these grants through
various channels, including cash payment contractors, the South
African Post Office, and commercial banks.
In terms of the present flow of funds arrangement, any
shortcomings and/or failures in SASSA’s internal control systems
may result in the Department receiving either a qualified opinion
or an emphasis of matter from the Auditor-General.
9. Asset management
9.1 Progress made with regard to capturing
assets in the registerThe Asset Management System meets the minimum requirements
of the National Treasury, and its functioning well. It produces
management reports which assist in detecting discrepancies.
Departmental assets were verified by using hand-held scanners.
The recording of asset movements improved.
9.2 Establishment of an asset management
unit and asset management teamsThe asset management function of the Department had limited
capacity due to staff turnover. All newly acquired assets were
reconciled with the General Ledger on a monthly basis. The
Department has established an Asset Management Committee
to oversee the procurement of assets in line with the asset
management policy. The terms of reference for the committee
provides for the appointment of a disposal committee to dispose of
assets as and when the need arises.
9.3 Compliance with the minimum
requirementsThe Department complied with the minimum requirements for
asset management prescribed by the National Treasury. The
approved asset management policy and asset management
strategy were fully implemented.
10. Events after the reporting dateThere were no significant events after the reporting date.

DEPARTMENT OF SOCIAL DEVELOPMENT VOTE 18
Department of Social Development | Annual Report 2010/2011 141
11. Performance informationThe Department sought to develop performance information on
two levels: institutional performance, and individual performance.
Institutional performance seeks to develop data on the overall
performance of the Department and its implementing partners
as measured against its mandate and its stated development
objectives. This level of performance information seeks to improve
service delivery, and provide evidence of the impacts of policy and
services on the Department’s clients. Management of this level
of performance reporting and information resides with the Chief
Directorate Monitoring and Evaluation. The key tools used are
quarterly performance reports, quarterly reviews, and evaluation
reports which impact on elements of the Department’s strategies.
Programme performance reviews are presided over by the
Accounting Offi cer during Executive Committee meetings, and
serve as a means for assessing performance against predetermined
targets as set out in the Strategic Plan. The reviews also serve to
identify vital areas that need timely interventions, and ways of
addressing potential obstacles to service delivery. The Department
continued its efforts to fi nd new ways of informing and improving
institutional performance, which will be scaled up over the MTEF.
Performance assessments remain the main instruments for
assessing individual performance. The Department’s Strategic
Plan informs the Director-General’s performance agreement,
which is cascaded down to the Deputy Directors-General and
other management levels down to the lowest staffi ng level.
This link is also outlined in the Department’s Performance
Management and Development Policy. Senior management and
other levels of staff are required to report on progress made with
implementing their performance agreements and work plans on
a quarterly basis. This ensures that progress is tracked to ensure
implementation of the Department’s Operational Plan, which
supports the Strategic Plan.
Annual performance appraisals are conducted from May each
year for all members of staff. This process includes a moderation
process before fi nal approval of individual performance outcomes
by delegated authorities. Performance results for senior managers
are approved by the Minister.
While these individual assessments are important in their own
right, they are also important adjuncts to broader institutional
assessments, thus ensuring that individual performance helps
to improve the Department’s institutional performance. Given the
introduction of new measures, it is envisaged that institutional
performance data will be an important benchmark against which
individual performance will be assessed.
12. SCOPA resolutionsNo new resolutions relating to the 2009/10 audit were made by
SCOPA during the year under review.
13. OtherThere are no other material facts or circumstances which may
have an effect on the understanding of the fi nancial state of
affairs of the Department which are not addressed elsewhere in
this report.
14. ApprovalThe Annual Financial Statements set out on pages 160 to 186
have been approved by the Accounting Offi cer.
Mr Vusi Madonsela
Director-General
31 May 2011
142 Annual Report 2010/2011 | Department of Social Development
DEPARTMENT OF SOCIAL DEVELOPMENT VOTE 18
Report of the Auditor-General to Parliament on Vote No. 18: Department of Social Development
REPORT ON THE FINANCIAL STATEMENTS
Introduction1. I have audited the accompanying financial statements of
the Department of Social Development, which comprise the
appropriation statement, the statement of financial position
as at 31 March 2011, and the statement of financial
performance, statement of changes in net assets and cash
flow statement for the year then ended, and a summary
of significant accounting policies and other explanatory
information, as set out on pages 146 to 180.
Accounting officer’s responsibility for the
financial statements2. The accounting officer is responsible for the preparation
of these financial statements in accordance with the
Departmental Financial Reporting Framework prescribed
by the National Treasury and the requirements of the Public
Finance Management Act of South Africa, 1999 (Act No. 1 of
1999) (PFMA), and for such internal control as management
determines necessary to enable the preparation of financial
statements that are free from material misstatement, whether
due to fraud or error.
Auditor-General’s responsibility3. As required by section 188 of the Constitution of the
Republic of South Africa, 1996 (Act No. 108 of 1996) and,
section 4 of the Public Audit Act of South Africa, 2004 (Act
No. 25 of 2004) (PAA), my responsibility is to express an
opinion on these financial statements based on my audit.
4. I conducted my audit in accordance with International
Standards on Auditing and General Notice 1111 of 2010
issued in Government Gazette 33872 of 15 December
2010. Those standards require that I comply with ethical
requirements and plan and perform the audit to obtain
reasonable assurance about whether the financial statements
are free from material misstatement.
5. An audit involves performing procedures to obtain audit
evidence about the amounts and disclosures in the financial
statements. The procedures selected depend on the auditor’s
judgement, including the assessment of the risks of material
misstatement of the financial statements, whether due
to fraud or error. In making those risk assessments, the
auditor considers internal control relevant to the entity’s
preparation and fair presentation of the financial statements
in order to design audit procedures that are appropriate in
the circumstances, but not for the purpose of expressing an
opinion on the effectiveness of the entity’s internal control.
An audit also includes evaluating the appropriateness
of accounting policies used and the reasonableness of
accounting estimates made by management, as well as
evaluating the overall presentation of the financial statements.
6. I believe that the audit evidence I have obtained is sufficient
and appropriate to provide a basis for my qualified audit
opinion.
Basis for qualified opinion
Transfers and subsidies7. I was unable to satisfy myself as to the occurrence of social
assistance grant expenditure with an approximate value of
R891 million (2009/10: R10.5 billion) as disclosed in note
8 to the financial statements due to limitations placed on
the scope of my work by the South African Social Security
Agency (SASSA) who acts as an agent for the Department.
A number of grant beneficiary files requested from SASSA
were not presented for audit purposes. Furthermore,
numerous files presented by SASSA did not contain the
necessary information that is required to form the basis for
a valid grant payment. The agent’s records did not permit
the application of alternative audit procedures regarding
the social assistance grant expenditure. Consequently, I did
not obtain all the information and explanations I considered
necessary to satisfy myself as to the occurrence of social
assistance grant expenditure.

DEPARTMENT OF SOCIAL DEVELOPMENT VOTE 18
Department of Social Development | Annual Report 2010/2011 143
Qualified opinion8. In my opinion, except for the possible effects of the matter
described in the Basis for qualified opinion paragraph,
the financial statements present fairly, in all material
respects, the financial position of the Department of
Social Development as at 31 March 2011 and its financial
performance and cash flows for the year then ended,
in accordance with Departmental Financial Reporting
Framework prescribed by the National Treasury and the
requirements of the Public Finance Management Act of
South Africa, 1999 (Act No. 1 of 1999) (PFMA).
Emphasis of matterI draw attention to the matter below. My opinion is not modified in
respect of this matter:
Flow of funds9. As indicated in the report of the Accounting Officer, despite
the social assistance grant expenditure being reported
in the annual financial statements of the Department of
Social Development, a dual accountability relationship
exists between the Department and SASSA over the social
assistance grants. The status of the current relationship
therefore results in actions of SASSA having an impact
on the audit report of the Department regarding matters
concerning social assistance grant expenditure.
Additional mattersI draw attention to the matters below. My opinion is not modified
in respect of these matters:
Unaudited supplementary schedules10. The supplementary annexures set out on pages 181 to 186
do not form part of the financial statements and are presented
as additional information. I have not audited these schedules
and accordingly I do not express an opinion thereon.
Financial reporting framework11. The financial reporting framework prescribed by the National
Treasury and applied by the department is a compliance
framework. Thus my opinion would have reflected that the
financial statements had been properly prepared instead
of fairly presented as required by section 20(2)(a) of the
PAA, which requires me to express an opinion on the fair
presentation of the financial statements of the department.
REPORT ON OTHER LEGAL AND
REGULATORY REQUIREMENTS12. In accordance with the PAA and in terms of General notice
1111 of 2010, issued in Government Gazette 33872 of
15 December 2010, I include below my findings on the
annual performance report as set out on pages 144 to 145
and material non-compliance with laws and regulations
applicable to the department.
Predetermined objectives
Presentation of information13. The following criteria were used to assess the presentation of
information:
The reported information is simple, accessible and
useful;
Reasons for major variances between planned and
actual reported targets were explained; and
Reasons for major variances between planned and
actual reported targets were supported by adequate
and reliable corroborating evidence.
14. The following findings relate to the above criteria:
The reported information is not simple, accessible and
useful;
Reasons for major variances between planned and
actual reported targets were not explained;
Reasons for major variances between planned and
actual reported targets were not supported by adequate
and reliable corroborating evidence.
144 Annual Report 2010/2011 | Department of Social Development
DEPARTMENT OF SOCIAL DEVELOPMENT VOTE 18
Report of the Auditor-General to Parliament on Vote No. 18: Department of Social Development
Usefulness of information15. The following criteria were used to assess the usefulness of
information:
Measureable: Planned and reported indicators/
measures are well defined and is verifiable. The planned
and performance targets are specific and measurable.
16. The following findings relate to the above criteria:
Planned and reported indicators/measures are not well
defined and verifiable. The planned and performance
targets are not specific and measurable.
Reliability of information17. The following criteria were used to assess the reliability of
information:
Relevance: A logical link exists between reported
objectives, indicators and targets.
18. The following findings relate to the above criteria:
A logical link does not exist between reported
objectives, indicators and targets.
Compliance with laws and regulations
Public Finance Management Act - Virement19. The Virement amounts as submitted with the annual financial
statements on 31 May 2011, has not been approved by the
accounting officer as required by section 43(3) of the PFMA.
Treasury Regulations – Financial misconduct20. The accounting officer did not always institute an investigation
within thirty days from the date of discovery of alleged
financial misconduct relating to irregular and fruitless and
wasteful expenditure as per the requirements of Treasury
Regulation 4.1.2. This relates to prior year fruitless and
wasteful expenditure of R67 000 and irregular expenditure of
R1 322 000 only finalised and reported on in the 2010/11
financial year. Treasury Regulation 9.1.2 was not adhered to
as only R25 368,19 of the R1 322 000 identified irregular
expenditure was reported to National Treasury.
Public Finance Management Act – Accounting
officers reporting responsibilities21. The accounting officer submitted financial statements for
auditing that were not supported by full and proper records
as required by section 40(1)(a) of the PFMA. Material
misstatements identified by the AGSA occurred within the
functions of SASSA and were not subsequently corrected
adequately which resulted in the financial statements
receiving a qualified audit opinion in contravention of section
40(3)(a).
Regulations to the Social Assistance Act22. Regulations 2, 3, 11, 18 and 19 of the regulations to
the Social Assistance Act 2004, (Act No. 13 of 2004),
regarding the eligibility of a beneficiary and the necessary
documentation to be submitted with the beneficiary
application was not complied with. The non-compliance
finding originated from SASSA where the findings were
identified relating to social assistance.
INTERNAL CONTROL
23. In accordance with the PAA and in terms of General notice
1111 of 2010, issued in Government Gazette 33872 of
15 December 2010, I considered internal control relevant to
my audit, but not for the purpose of expressing an opinion
on the effectiveness of internal control. The matters reported
below are limited to the significant deficiencies that resulted
in the basis for qualified opinion, the findings on the annual
performance report and the findings on compliance with
laws and regulations included in this report.
Leadership24. Due to the legislative reporting lines, the oversight
responsibility fulfilled by the Department does not focus
on the detail of the operational function performed by its
agency; SASSA, which cascades down to the management
of SASSA and its operational staff.

DEPARTMENT OF SOCIAL DEVELOPMENT VOTE 18
Department of Social Development | Annual Report 2010/2011 145
Aud i t i ng to bu i ld pub l i c confidence
25. Management did not ensure proper guidance to ensure that
there’s a logical link between reported objectives, indicators
and targets to ensure that reported performance targets are
specific and measurable.
Financial and performance management26. Management did not ensure that there was sufficient oversight
over the tabled strategic plan to ensure that it complied to
Treasury Regulation 5.2.2(d) and Framework for managing
programme performance information (FMPPI) 5.2.7.
OTHER REPORTS
Performance audit on the readiness of
government to report on its performance27. A performance audit is being conducted on the Readiness
of Government to report on its performance. The focus of
the audit is on how government institutions are guided
and assisted to report on their performance, as well as the
systems and processes that they have put in place. The
findings will be reported on in a separate report.
Pretoria
31 July 2011

146 Annual Report 2010/2011 | Department of Social Development
DEPARTMENT OF SOCIAL DEVELOPMENT VOTE 18
Appropriation Statementfor the year ended 31 March 2011
Appropriation per programme
2010/11 2009/10
Expenditure
Adjusted Final Actual as % of final Final Actual
Appropriation Virement Appropriation Expenditure Variance appropriation Appropriation Expenditure
Detail per programme R’000 R’000 R’000 R’000 R’000 % R’000 R’000
1. Administration
Current payment 196 986 (41) 196 945 191 124 5 821 97,0 174 155 173 999
Transfers and subsidies — 41 41 41 — 100,0 1 434 1 434
Payment for capital assets 4 691 — 4 691 2 833 1 858 60,4 2 446 2 387
Payment for financial assets — — — 161 (161) — —
201 677 — 201 677 194 159 7 518 178 035 177 820
2. Comprehensive Social Security
Current payment 131 524 (10 047) 121 477 108 746 12 731 89,5 82 090 81 791
Transfers and subsidies 95 006 138 20 047 95 026 185 93 149 958 1 876 227 98,0 85 618 060 84 431 537
Payment for capital assets 2 494 — 2 494 2 272 222 91,1 173 173
Payment for financial assets — — — 12 (12) — —
95 140 156 10 000 95 150 156 93 260 988 1 889 168 85 700 323 84 513 501
3. Policy Development, Review
and Implementation Support
for Welfare Services
Current payment 100 127 (4,500) 95 627 92 431 3 196 96,7 88 057 87 624
Transfers and subsidies 244 485 — 244 485 244 298 187 99,9 227 574 227 555
Payment for capital assets 1 179 — 1 179 330 849 28,0 714 711
Payment for financial assets — — — 1 (1) — —
345 791 (4,500) 341 291 337 060 4 231 316 345 315 890
4. Community Development
Current payment 56 274 (4,670) 51 604 48 857 2 747 94,7 51 437 51 382
Transfers and subsidies 129 589 170 129 759 128 139 1 620 98,8 189 791 187 327
Payment for capital assets 671 — 671 380 291 56,6 245 245
186 534 (4,500) 182 034 177 376 4 658 241 473 238 954
5. Strategy and Governance
Current payment 64 190 (1,100) 63 090 59 374 3 716 94,1 70 109 70 110
Transfers and subsidies 1 601 100 1 701 1 701 — 100,0 1 594 1 588
Payment for capital assets 1 112 — 1 112 360 752 32,4 308 297
Payment for financial assets — — — 12 (12) — —
66 903 (1 000) 65 903 61 447 4 456 72 011 71 995
Total 95 941 061 — 95 941 061 94 031 030 1 910 031 98,0 86 508 187 85 318 160
Reconciliation with Statement of Financial Performance
Add: Departmental receipts 10 508 30 617
Aid assistance 6 473 9 972
Actual amounts per Statement of Financial Performance
(total revenue) 95 958 042 86 548 776
Add: Aid assistance 6 391 11 008
Actual amounts per Statement of Financial Performance
(total expenditure) 94 037 421 85 329 168

DEPARTMENT OF SOCIAL DEVELOPMENT VOTE 18
Department of Social Development | Annual Report 2010/2011 147
Appropriation per Economic classification
2010/11 2009/10
Expenditure
Adjusted Final Actual as % of final Final Actual
Appropriation Virement Appropriation Expenditure Variance appropriation Appropriation Expenditure
R’000 R’000 R’000 R’000 R’000 % R’000 R’000
Current payments
Compensation of employees 254 939 — 254 939 246 980 7 959 96,9 220 212 220 123
Goods and services 294 162 (20 524) 273 638 253 508 20 130 92,6 245 660 244 685
Interest and rent on land — — — 45 (45) — 100
Transfers and subsidies
Departmental agencies
and accounts 5 940 856 — 5 940 856 5 940 856 — 100,0 5 523 678 5 523 678
Foreign governments and
international organisations 1 998 47 2 045 1 509 536 73,8 1 916 1 860
Non-profit institutions 65 208 191 65 399 63 780 1 619 97,5 63 573 61 106
Households 89 373 751 20 286 89 394 037 87 517 993 1 876 044 97,9 80 449 267 79 262 797
Payments for capital assets
Machinery and equipment 9 602 — 9 602 5 881 3 721 61,2 3 881 3 811
Software and other intangible assets 545 — 545 292 253 53,6 — —
Payments for financial assets — — — 186 (186) — —
Total 95 941 061 — 95 941 061 94 031 030 1 910 031 98,0 86 508 187 85 318 160

148 Annual Report 2010/2011 | Department of Social Development
DEPARTMENT OF SOCIAL DEVELOPMENT VOTE 18
Appropriation Statementfor the year ended 31 March 2011
Details per programme 1 – Administration
2010/11 2009/10
Expenditure
Adjusted Final Actual as % of final Final Actual
Appropriation Virement Appropriation Expenditure Variance Appropriation Appropriation Expenditure
Detail per programme R’000 R’000 R’000 R’000 R’000 % R’000 R’000
1.1 Minister
Current payment 1 816 120 1 936 1 927 9 99,5 2 165 2 165
Transfers and subsidies — — — — — 721 722
1.2 Deputy Minister
Current payment 1 496 (60) 1 436 1 382 54 96,2 1 420 1 408
Transfers and subsidies — — — — — 689 689
1.3 Management
Current payment 6 244 (60) 6 184 4 871 1 313 78,8 4 573 4 493
Payment for capital assets 68 — 68 30 38 44,1 20 20
1.4 Corporate Services
Current payment 164 113 (41) 164 072 160 566 3 506 97,9 149 535 149 471
Transfers and subsidies — 41 41 41 — 100,0 24 23
Payment for capital assets 2 575 — 2 575 1 126 1 449 43,7 2 426 2 367
Payment for financial assets — — — 161 (161) — —
1.5 Office accommodation
Current payment 23 317 — 23 317 22 378 939 96,0 16 462 16 462
1.6 Government Motor Transport
Payment for capital assets 2 048 — 2 048 1 677 371 81,9 — —
Total 201 677 — 201 677 194 159 7 518 96,3 178 035 177 820
Programme 1 per Economic
classification
Current payments
Compensation of employees 91 032 — 91 032 88 810 2 222 97,6 79 720 79 679
Goods and services 105 954 (41) 105 913 102 270 3 643 96,6 94 436 94 227
Interest and rent on land — — — 45 (45) — 94
Transfers and subsidies
Households — 41 41 41 — 100,0 1 433 1 433
Payments for capital assets
Machinery and equipment 4 341 — 4 341 2 540 1 801 58,5 2 446 2 387
Software and other intangible
assets 350 — 350 292 58 83,4 — —
Payments for financial assets — — — 161 (161) — —
Total 201 677 — 201 677 194 159 7 518 96,3 178 035 177 820

DEPARTMENT OF SOCIAL DEVELOPMENT VOTE 18
Department of Social Development | Annual Report 2010/2011 149
Details per programme 2 – Comprehensive Social Security
2010/11 2009/10
Expenditure
Adjusted Final Actual as % of final Final Actual
Appropriation Virement Appropriation Expenditure Variance Appropriation Appropriation Expenditure
Detail per programme R’000 R’000 R’000 R’000 R’000 % R’000 R’000
2.1 Social Assistance
Current payment 16 386 (2 000) 14 386 11 814 2 572 82,1 11 309 11 232
Transfers and subsidies 5 600 20 000 25 600 24 805 795 96,9 15 000 1 497
Payment for capital assets 244 (100) 144 77 67 53,5 74 74
2.2 Social Insurance
Current payment 34 917 (547) 34 370 33 561 809 97,6 13 479 13 407
Transfers and subsidies — 47 47 47 — 100,0 — —
Payment for capital assets 202 (100) 102 43 59 42,2 51 51
2.3 Appeals Tribunal
Current payment 70 802 (7 500) 63 302 53 995 9 347 85,2 47 759 47 757
Payment for capital assets 1 901 200 2 101 2 100 1 100,0 15 15
2.4 Social Assistance Transfers
Transfers and subsidies 89 368 151 — 89 368 151 87 492 902 1 875 249 97,9 80 432 718 79 259 748
Payment for financial assets — — — 4 (4) — —
2.5 SASSA
Transfers and subsidies 5 611 387 — 5 611 387 5 611 387 — 100,0 5 148 896 5 148 896
2.6 SASSA MIS
Transfers and subsidies 20 000 — 20 000 20 000 — 100,0 20 000 20 000
2.7 International Social Security
Transfers and subsidies 1 000 — 1 000 817 183 81,7 946 896
2.8 Social Security Administration
Current payment 9 419 — 9 419 9 416 3 100,0 7 153 7 071
Transfers and subsidies — — — — — 500 500
Payment for capital assets 147 — 147 52 95 35,4 33 33
Payment for financial assets — — — 8 (8) — —
Total 95 140 156 10 000 95 150 156 93 260 988 1 889 168 98,0 85 700 323 84 513 501
Programme 2 per Economic
classification
Current payments
Compensation of employees 33 236 — 33 236 32 988 248 99,3 25 335 25 329
Goods and services 98 288 (10 047) 88 241 75 758 12 483 85,9 56 755 56 462
Transfers and subsidies
Departmental agencies
and accounts 5 631 387 — 5 631 387 5 631 387 — 100,0 5 168 896 5 168 896
Foreign governments and
international organisations 1 000 47 1 047 864 183 82,5 946 896
Non-profit institutions — — — — — — 500 500
Households 89 373 751 20 000 89 393 751 87 517 707 1 876 044 97,9 80 447 718 79 261 245
Payments for capital assets
Machinery and equipment 2 473 — 2 473 2 272 201 91,9 173 173
Software and other intangible
assets 21 — 21 — 21 — —
Payments for financial assets — — — 12 (12) — —
Total 95 140 156 10 000 95 150 156 93 260 988 1 889 168 98,0 85 700 323 84 513 501

150 Annual Report 2010/2011 | Department of Social Development
DEPARTMENT OF SOCIAL DEVELOPMENT VOTE 18
Appropriation Statementfor the year ended 31 March 2011
Details per programme 3 – Policy Development, Review and Implementation Support for Welfare Services
2010/11 2009/10
Expenditure
Adjusted Final Actual as % of final Final Actual
Appropriation Virement Appropriation Expenditure Variance Appropriation Appropriation Expenditure
Detail per programme R’000 R’000 R’000 R’000 R’000 % R’000 R’000
3.1 Service Standards
Current payment 14 204 (800) 13 404 13 358 46 99,7 11 833 11 826
Transfers and subsidies 226 000 — 226 000 226 000 — 100,0 210 000 210 000
Payment for capital assets 1 — 1 — 1 89 89
3.2 Substance Abuse and Central
Drug Authority
Current payment 11 527 1 900 13 427 13 411 16 99,9 8 902 8 894
Transfers and subsidies — — — (25) 25 — 25
Payment for capital assets 100 — 100 13 87 13,0 115 115
3.3 Older Persons
Current payment 6 620 (300) 6 320 6 221 99 98,4 8 847 8 831
Transfers and subsidies — — — — — 23 23
3.4 People with disabilities
Current payment 5 179 (300) 4 879 4 795 84 98,3 5 996 5 993
Payment for capital assets — — — — — 8 8
3.5 Children
Current payment 26 215 (1 300) 24 915 23 918 997 96,0 23 378 23 101
Payment for capital assets 624 — 624 162 462 26,0 140 140
Payment for financial assets — — — 1 (1) — —
3.6 Families
Current payment 5 567 (500) 5 067 4 833 234 95,4 4 866 4 847
Payment for capital assets 50 — 50 17 33 34,0 165 165
3.7 Victim Empowerment
Current payment 6 626 (300) 6 326 5 923 403 93,6 4 909 4 882
Payment for capital assets 66 — 66 57 9 86,4 40 40
3.8 Social Crime Prevention
Current payment 7 070 (1 200) 5 870 5 504 366 93,8 7 204 7 186
Payment for capital assets 129 — 129 31 98 24,0 13 13
3.9 Service Provider Support
and Management
Current payment 4 664 310 4 974 4 965 9 99,8 4 269 4 263
Transfers and subsidies 18 289 — 18 289 18 229 60 99,7 17 244 17 243
3.10 Contributions and Affiliations
to other Bodies
Transfers and subsidies 196 — 196 96 100 49,0 191 148
3.11 Welfare Administration
Current payment 12 455 (2 010) 10 445 9 503 942 91,0 7 853 7 801
Transfers and subsidies — — — (2) 2 116 116
Payment for capital assets 209 — 209 50 159 23,9 144 141
Total 345 791 (4 500) 341 291 337 060 4 231 98,8 316 345 315 890

DEPARTMENT OF SOCIAL DEVELOPMENT VOTE 18
Department of Social Development | Annual Report 2010/2011 151
2010/11 2009/10
Expenditure
Adjusted Final Actual as % of final Final Actual
Appropriation Virement Appropriation Expenditure Variance Appropriation Appropriation Expenditure
Detail per subprogramme R’000 R’000 R’000 R’000 R’000 % R’000 R’000
Programme 3 per Economic
classification
Current payments
Compensation of employees 57 443 — 57 443 55 778 1 665 97,1 49 824 49 824
Goods and services 42 684 (4 500) 38 184 36 652 1 532 96,0 38 255 37 794
Interest and rent on land — — — — — — 6
Transfers and subsidies
Departmental agencies
and accounts 226 000 — 226 000 226 000 — 100,0 210 000 210 000
Foreign governments and
international organisations 397 — 397 210 187 52,9 376 376
Non-profit institutions 18 088 — 18 088 18 088 — 100,0 17 064 17 064
Households — — — — — 116 116
Payments for capital assets
Machinery and equipment 1 107 — 1 107 331 776 29,9 710 710
Software and other intangible assets 72 — 72 — — — —
Payments for financial assets — — — 1 (1) — —
Total 345 791 ( 4 500) 341 291 337 060 4 231 98,8 316 345 315 890

152 Annual Report 2010/2011 | Department of Social Development
DEPARTMENT OF SOCIAL DEVELOPMENT VOTE 18
Appropriation Statementfor the year ended 31 March 2011
Details per programme 4 – Community Development
2010/11 2009/10
Expenditure
Adjusted Final Actual as % of final Final Actual
Appropriation Virement Appropriation Expenditure Variance Appropriation Appropriation Expenditure
Detail per programme R’000 R’000 R’000 R’000 R’000 % R’000 R’000
4.1 Sustainable Livelihood
Current payment 6 006 100 6 106 5 903 203 96,7 5 917 5 910
Transfers and subsidies 1 860 170 2 030 910 1 120 44,8 2 755 1 192
Payment for capital assets 39 — 39 34 5 87,2 20 20
4.2 Community Development Policy
Service Standards
Current payment 6 676 (700) 5 976 5 717 259 95,7 7 721 7 705
Payment for capital assets 29 — 29 29 — 100,0 39 39
4.3 Registration and Institutional
Capacity Building of NPOs
Current payment 13 599 (570) 13 029 12 224 805 93,8 10 940 10 935
Transfers and subsidies — — — — — 409 3
Payment for capital assets 272 — 272 235 37 86,4 85 85
4.4 Youth
Current payment 4 991 (200) 4 791 4 598 193 96,0 5 148 5 138
Payment for capital assets 51 — 51 33 18 64,7 — —
4.5 HIV and AIDS
Current payment 17 968 (3 000) 14 968 14 094 874 94,2 14 163 14 159
Transfers and subsidies 44 260 — 44 260 43 760 500 98,9 41 845 41 350
Payment for capital assets 154 — 154 — 154 63 63
4.6 National Development Agency
Transfers and subsidies 83 469 — 83 469 83 469 — 100,0 144 782 144 782
4.8 Community Development
Administration
Current payment 7 034 (300) 6 734 6 321 413 93,9 7 548 7 535
Payment for capital assets 126 — 126 49 77 38,9 38 38
Total 186 534 (4 500) 182 034 177 376 4 658 97,4 241 473 238 954
Programme 4 per Economic
classification
Current payments
Compensation of employees 34 556 — 34 556 32 723 1 833 94,7 30 278 30 235
Goods and services 21 718 (4 670) 17 048 16 134 914 94,6 21 159 21 147
Transfers and subsidies
Departmental agencies
and accounts 83 469 — 83 469 83 469 — 100,0 144 782 144 782
Non-profit institutions 46 120 — 46 120 44 501 1 619 96,5 45 009 42 542
Households — 170 170 170 — 100,0 — 3
Payments for capital assets
Machinery and equipment 671 — 671 379 292 56,5 245 245
Total 186 534 (4 500) 182 034 177 376 4 658 97,4 241 473 238 954

DEPARTMENT OF SOCIAL DEVELOPMENT VOTE 18
Department of Social Development | Annual Report 2010/2011 153
Details per programme 5 – Strategy and Governance
2010/11 2009/10
Expenditure
Adjusted Final Actual as % of final Final Actual
Appropriation Virement Appropriation Expenditure Variance Appropriation Appropriation Expenditure
Detail per programme R’000 R’000 R’000 R’000 R’000 % R’000 R’000
5.1 Strategy Management
and Development
Current payment 12 948 (300) 12 648 10 817 1 831 85,5 22 680 22 679
Payment for capital assets 73 — 73 59 14 80,8 145 145
5.2 Monitoring and Evaluation
Current payment 13 649 2 600 16 249 15 888 361 97,8 10 154 10 153
Payment for capital assets 187 — 187 94 93 50,3 64 64
5.3 Entity Oversight
Current payment 6 322 (1 900) 4 422 4 307 115 97,4 4 477 4 485
Payment for capital assets 148 — 148 29 119 19,6 —
5.4 Social Policy Coordination
Current payment 2 817 (1 025) 1 792 1 456 336 81,3 3 380 3 380
Transfers and subsidies 100 25 125 125 — 100,0 100 100
Payment for capital assets 67 — 67 — 67 — —
5.5 Special Projects Coordination
Current payment 6 105 — 6 105 5 638 467 92,4 5 364 5 360
Transfers and subsidies 1 000 — 1 000 1 000 — 100,0 1 000 1 000
Payment for capital assets 224 — 224 33 191 14,7 31 31
Payment for financial assets — — — 10 (10) — —
5.6 Population Research
Current payment 19 143 (475) 18 668 18 427 241 98,7 19 870 19 869
Transfers and subsidies — 75 75 75 — 100,0 — —
Payment for capital assets 242 — 242 110 132 45,5 57 57
Payment for financial assets — — — 2 (2) — —
5.7 Contributions and Affiliations
to other Bodies
Transfers and subsidies 501 — 501 501 — 100,0 494 488
5.8 Strategy Administration
Current payment 3 206 — 3 206 2 841 365 88,6 4 184 4 184
Payment for capital assets 171 — 171 35 136 20,5 11 —
Total 66 903 (1 000) 65 903 61 447 4 456 93,2 72 011 71 995

154 Annual Report 2010/2011 | Department of Social Development
DEPARTMENT OF SOCIAL DEVELOPMENT VOTE 18
Appropriation Statementfor the year ended 31 March 2011
2010/11 2009/10
Expenditure
Adjusted Final Actual as % of final Final Actual
Appropriation Virement Appropriation Expenditure Variance Appropriation Appropriation Expenditure
Detail per subprogramme R’000 R’000 R’000 R’000 R’000 % R’000 R’000
Programme 5
per Economic classification
Current payments
Compensation of employees 38 672 — 38 672 36 681 1 991 94,9 35 055 35 056
Goods and services 25 518 (1 266) 24 252 22 694 1 558 93,6 35 055 35 055
Transfers and subsidies
Foreign governments and
international organisations 601 — 601 435 166 72,4 594 588
Non-profit institutions 1 000 191 1 191 1 191 — 100,0 1 000 1 000
Households — 75 75 75 — 100,0 — —
Payments for capital assets
Machinery and equipment 1 010 — 1 010 359 651 35,5 307 296
Software and other intangible assets 102 — 102 — 102 — —
Payments for financial assets — — — 12 (12) — —
Total 66 903 (1 000) 65 903 61 447 4 456 93,2 72 011 71 995

DEPARTMENT OF SOCIAL DEVELOPMENT VOTE 18
Department of Social Development | Annual Report 2010/2011 155
Notes to the Appropriation Statementfor the year ended 31 March 2011
1. Detail of transfers and subsidies as per Appropriation Act (after Virement)
Detail of these transactions can be viewed in the note on Transfers and subsidies, disclosure notes and Annexure 1 (A-F) to the Annual
Financial Statements.
2. Detail of specifically and exclusively appropriated amounts voted (after Virement)
Detail of these transactions can be viewed in note 1 (Annual Appropriation) to the Annual Financial Statements.
3. Detail on financial transactions in assets and liabilities
Detail of these transactions per programme can be viewed in the note on Payments for financial assets to the Annual Financial
Statements.
4. Explanations of material variances from Amounts Voted (after Virement)
Variance as
Final Actual a % of Final
Appropriation Expenditure Variance Appropriation
R’000 R’000 R’000 %
4.1 Per programme
Administration 201 677 194 159 7 518 96
Current payment 196 945 191 124 5 821 97
Transfers and subsidies 41 41 — 100
Payment for capital assets 4 691 2 833 1 858 60
Payment for financial assets — 161 (161)
The underexpenditure mainly relates to turnover of staff and efficiency savings on travelling, accommodation and venues and facilities
expenditure.
Comprehensive Social Security 95 150 156 93 260 988 1 889 168 98
Current payment 121 477 108 746 12 731 90
Transfers and subsidies 95 026 185 93 149 958 1 876 227 98
Payment for capital assets 2 494 2 272 222 91
Payment for financial assets — 12 (12)
The underexpenditure mainly relates to the Social Assistance Grants due to the lower than expected beneficiary uptake rates.
Policy Development, Review and Implementation
Support for Welfare Services 341 291 337 060 4 231 99
Current payment 95 627 92 431 3 196 97
Transfers and subsidies 244 485 244 298 187 100
Payment for capital assets 1 179 330 849 28
Payment for financial assets — 1 (1)
The underexpenditure is mainly due to savings realised on operational costs as a result of the cost savings measures implemented at
the travelling, accommodation and consultancy services.
Community Development 182 034 177 376 4 658 97
Current payment 51 604 48 857 2 747 95
Transfers and subsidies 129 759 128 139 1 620 99
Payment for capital assets 671 380 291 57
The underexpenditure mainly relate to savings on travelling and accommodation as well as transfers and subsidies, which relates to the
transfer payment scheduled to the National Association of Burial Societies of South Africa (NABSSA) and National Association of People
Living with HIV and Aids (NAPWA).

156 Annual Report 2010/2011 | Department of Social Development
DEPARTMENT OF SOCIAL DEVELOPMENT VOTE 18
Notes to the Appropriation Statementfor the year ended 31 March 2011
Variance as
Final Actual a % of Final
Appropriation Expenditure Variance Appropriation
R’000 R’000 R’000 %
4.1 Per programme (continued)
Strategy and Governance 65 903 61 447 4 456 93
Current payment 63 090 59 374 3 716 94
Transfers and subsidies 1 701 1 701 — 100
Payment for capital assets 1 112 360 752 32
Payment for financial assets — 12 (12)
The under-expenditure is mainly due to savings realised on operational costs as a result of the cost savings measures implemented at
the travelling and accommodation.
4.2 Per economic classification
Current expenditure
Compensation of employees 254 939 246 980 7 959 97
Goods and services 273 638 253 508 20 130 93
Interest and rent on land — 45 (45)
Transfers and subsidies
Departmental agencies and accounts 5 940 856 5 940 856 — 100
Foreign governments and international organisations 2 045 1 509 536 74
Non-profit institutions 65 399 63 780 1 619 98
Households 89 394 037 87 517 993 1 876 044 98
Payments for capital assets
Machinery and equipment 9 602 5 881 3 721 61
Software and other intangible assets 545 292 253 54
Payments for financial assets — 186 (186)
The major under-expenditure on Goods and Services as well as Payments for Capital Assets mainly relate to efficiency savings
implemented in the financial year as well as delays in the finalisation of planned projects.
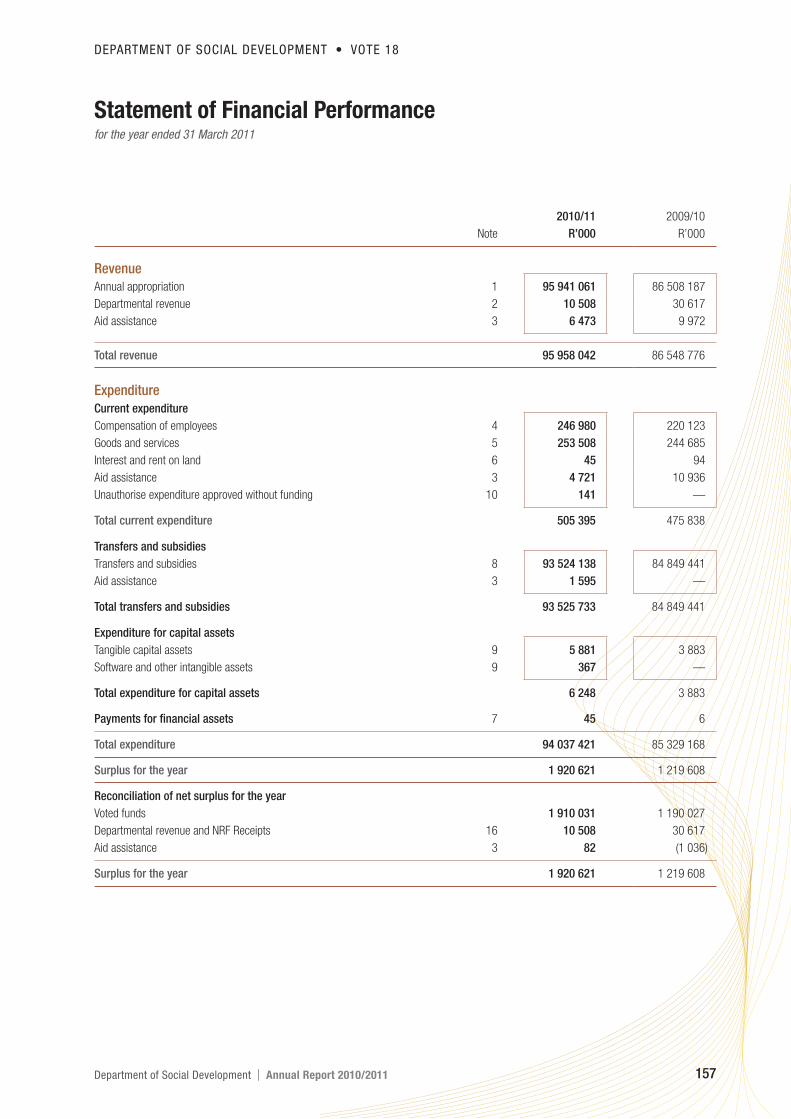
DEPARTMENT OF SOCIAL DEVELOPMENT VOTE 18
Department of Social Development | Annual Report 2010/2011 157
Statement of Financial Performancefor the year ended 31 March 2011
2010/11 2009/10
Note R’000 R’000
Revenue
Annual appropriation 1 95 941 061 86 508 187
Departmental revenue 2 10 508 30 617
Aid assistance 3 6 473 9 972
Total revenue 95 958 042 86 548 776
Expenditure
Current expenditure
Compensation of employees 4 246 980 220 123
Goods and services 5 253 508 244 685
Interest and rent on land 6 45 94
Aid assistance 3 4 721 10 936
Unauthorise expenditure approved without funding 10 141 —
Total current expenditure 505 395 475 838
Transfers and subsidies
Transfers and subsidies 8 93 524 138 84 849 441
Aid assistance 3 1 595 —
Total transfers and subsidies 93 525 733 84 849 441
Expenditure for capital assets
Tangible capital assets 9 5 881 3 883
Software and other intangible assets 9 367 —
Total expenditure for capital assets 6 248 3 883
Payments for financial assets 7 45 6
Total expenditure 94 037 421 85 329 168
Surplus for the year 1 920 621 1 219 608
Reconciliation of net surplus for the year
Voted funds 1 910 031 1 190 027
Departmental revenue and NRF Receipts 16 10 508 30 617
Aid assistance 3 82 (1 036)
Surplus for the year 1 920 621 1 219 608
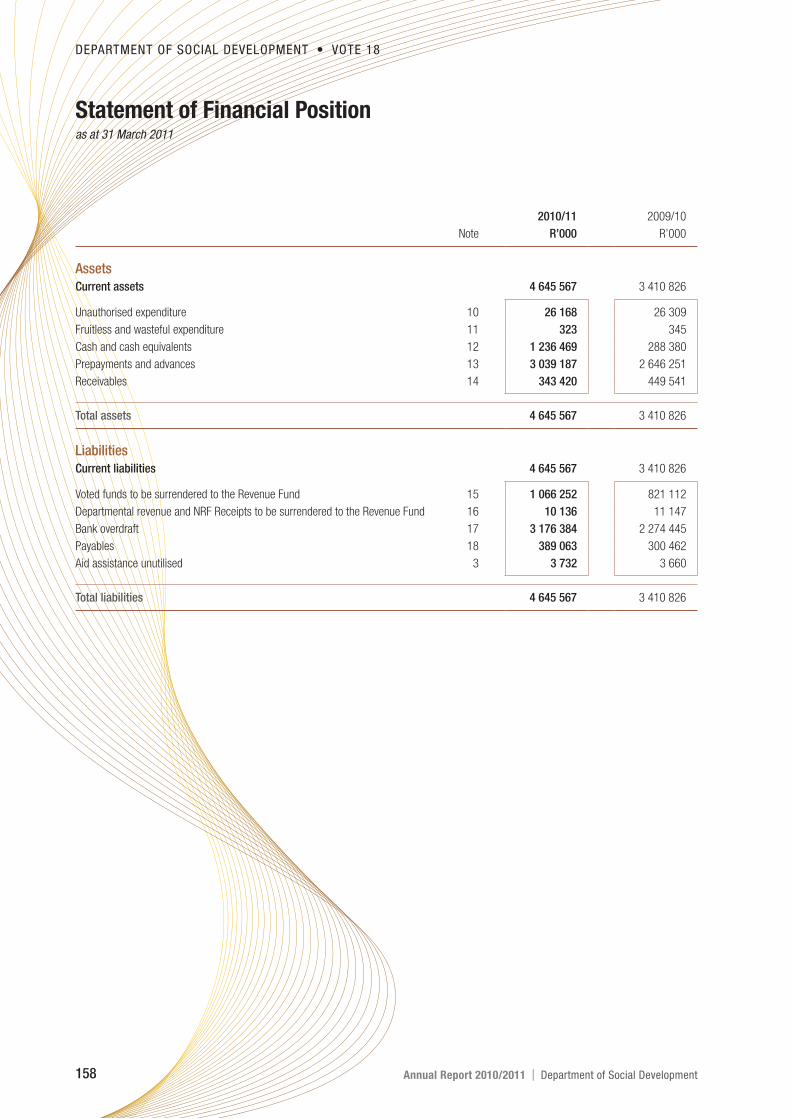
158 Annual Report 2010/2011 | Department of Social Development
DEPARTMENT OF SOCIAL DEVELOPMENT VOTE 18
Statement of Financial Positionas at 31 March 2011
2010/11 2009/10
Note R’000 R’000
Assets
Current assets 4 645 567 3 410 826
Unauthorised expenditure 10 26 168 26 309
Fruitless and wasteful expenditure 11 323 345
Cash and cash equivalents 12 1 236 469 288 380
Prepayments and advances 13 3 039 187 2 646 251
Receivables 14 343 420 449 541
Total assets 4 645 567 3 410 826
Liabilities
Current liabilities 4 645 567 3 410 826
Voted funds to be surrendered to the Revenue Fund 15 1 066 252 821 112
Departmental revenue and NRF Receipts to be surrendered to the Revenue Fund 16 10 136 11 147
Bank overdraft 17 3 176 384 2 274 445
Payables 18 389 063 300 462
Aid assistance unutilised 3 3 732 3 660
Total liabilities 4 645 567 3 410 826

DEPARTMENT OF SOCIAL DEVELOPMENT VOTE 18
Department of Social Development | Annual Report 2010/2011 159
Cash Flow Statementfor the year ended 31 March 2011
2010/11 2009/10
Note R’000 R’000
Cash flows from operating activities
Receipts 95 114 253 86 150 111
Annual appropriated funds received 1.1 95 097 282 86 109 627
Departmental revenue received 2 10 508 30 512
Aid assistance received 3 6 463 9 972
Net (increase)/decrease in working capital (198 051) (1 587 570)
Surrendered to Revenue Fund (832 631) (464 383)
Surrendered to RDP Fund/Donor — 10
Current payments (505 395) (475 838)
Payments for financial assets (45) (6)
Transfers and subsidies paid (93 525 733) (84 849 440)
Net cash flow available from operating activities 19 52 398 (1 227 116)
Cash flows from investing activities
Payments for capital assets 9 (6 248) (3 883)
Proceeds from sale of capital assets 2 — 105
Net cash flows from investing activities (6 248) (3 778)
Net increase/(decrease) in cash and cash equivalents 46 150 (1 230 894)
Cash and cash equivalents at beginning of period (1 986 065) (755 171)
Cash and cash equivalents at end of period 20 (1 939 915) (1 986 065)

160 Annual Report 2010/2011 | Department of Social Development
DEPARTMENT OF SOCIAL DEVELOPMENT VOTE 18
Accounting Policiesfor the year ended 31 March 2011
The Financial Statements have been prepared in accordance with the following policies, which have been applied consistently in all material
aspects, unless otherwise indicated. However, where appropriate and meaningful, additional information has been disclosed to enhance the
usefulness of the Financial Statements and to comply with the statutory requirements of the Public Finance Management Act, Act 1 of 1999 (as
amended by Act 29 of 1999), and the Treasury Regulations issued in terms of the Act and the Division of Revenue Act, Act 1 of 2010.
1. Presentation of the Financial Statements
1.1 Basis of preparation
The Financial Statements have been prepared on a modified cash basis of accounting, except where stated otherwise. The modified
cash basis constitutes the cash basis of accounting supplemented with additional disclosure items. Under the cash basis of accounting
transactions and other events are recognised when cash is received or paid.
1.2 Presentation currency
All amounts have been presented in the currency of the South African Rand (R) which is also the functional currency of the department.
1.3 Rounding
Unless otherwise stated all financial figures have been rounded to the nearest one thousand Rand (R’000).
1.4 Comparative figures
Prior period comparative information has been presented in the current year’s financial statements. Where necessary figures included in
the prior period financial statements have been reclassified to ensure that the format in which the information is presented is consistent
with the format of the current year’s financial statements.
1.5 Comparative figures – Appropriation Statement
A comparison between actual amounts and final appropriation per major classification of expenditure is included in the Appropriation
Statement.
2. Revenue
2.1 Appropriated funds
Appropriated funds comprises of departmental allocations as well as direct charges against revenue fund (i.e. statutory appropriation).
Appropriated funds are recognised in the financial records on the date the appropriation becomes effective. Adjustments made in terms of
the adjustments budget process are recognised in the financial records on the date the adjustments become effective.
Unexpended appropriated funds are surrendered to the National Revenue Fund. Any amounts owing to the National Revenue Fund at the
end of the financial year are recognised as payable in the statement of financial position.
Any amount due from the National Revenue Fund at the end of the financial year is recognised as a receivable in the statement of financial
position.
2.2 Departmental revenue
All departmental revenue is recognised in the statement of financial performance when received and is subsequently paid into the National
Revenue Fund, unless stated otherwise.
Any amount owing to the National Revenue Fund is recognised as a payable in the statement of financial position.
No accrual is made for amounts receivable from the last receipt date to the end of the reporting period. These amounts are however
disclosed in the disclosure note to the annual financial statements.
2.3 Direct Exchequer receipts
All direct exchequer receipts are recognised in the statement of financial performance when the cash is received and is subsequently paid
into the National Revenue Fund, unless stated otherwise.
Any amount owing to the National Revenue Funds at the end of the financial year is recognised as a payable in the statement of financial
position.
2.4 Direct Exchequer payments
All direct exchequer payments are recognised in the statement of financial performance when final authorisation for payment is effected
on the system (by no later than 31 March of each year).

DEPARTMENT OF SOCIAL DEVELOPMENT VOTE 18
Department of Social Development | Annual Report 2010/2011 161
2.5 Aid assistance
Aids assistance is recognised as revenue when received.
All in-kind aid assistance is disclosed at fair value on the date of receipt in the annexures to the Annual Financial Statements
The cash payments made during the year relating to aid assistance projects are recognised as expenditure in the statement of financial
performance when final authorisation for payments is effected on the system (by no later than 31 March of each year)
The value of the assistance expensed prior to the receipt of funds is recognised as a receivable in the statement of financial position.
Inappropriately expensed amounts using aid assistance and any unutilised amounts are recognised as payables in the statement of
financial position.
All CARA funds received must be recorded as revenue when funds are received. The cash payments made during the year relating to CARA
earmarked projects are recognised as expenditure in the statement of financial performance when final authorisation for payments effected
on the system (by no later then 31 March of each year)
Inappropriately expensed amounts using CARA funds are recognised as payables in the statement of financial position. Any unutilised
amounts are transferred to retained funds as they are not surrendered to the revenue fund.
3. Expenditure
3.1 Compensation of employees
3.1.1 Salaries and wages
Salaries and wages are expensed in the statement of financial performance when the final authorisation for payment is effected on the
system (by no later than 31 March of each year).
Other employee benefits that give rise to a present legal or constructive obligation are disclosed in the disclosure notes to the financial
statements at its face value and are not recognised in the statement of financial performance or position.
Employee costs are capitalised to the cost of a capital project when an employee spends more than 50% of his/her time on the project.
These payments form part of expenditure for capital assets in the statement of financial performance.
3.1.2 Social contributions
Employer contributions to post employment benefit plans in respect of current employees are expensed in the statement of financial
performance when the final authorisation for payment is effected on the system (by no later than 31 March of each year).
No provision is made for retirement benefits in the financial statements of the department. Any potential liabilities are disclosed in the
financial statements of the National Revenue Fund and not in the financial statements of the employer department.
Employer contributions made by the department for certain of its ex-employees (such as medical benefits) are classified as transfers to
households in the statement of financial performance.
3.2 Goods and services
Payments made during the year for goods and/or services are recognised as an expense in the statement of financial performance when
the final authorisation for payment is effected on the system (by no later than 31 March of each year).
The expense is classified as capital if the goods and/or services were acquired for a capital project or if the total purchase price exceeds the
capitalisation threshold (currently R5 000). All other expenditures are classified as current.
Rental paid for the use of buildings or other fixed structures is classified as goods and services and not as rent on land.
3.3 Interest and rent on land
Interest and rental payments are recognised as an expense in the statement of financial performance when the final authorisation for
payment is effected on the system (by no later than 31 March of each year). This item excludes rental for the use of buildings or other fixed
structures. If it is not possible to distinguish between payment for the use of land and the fixed structures on it, the whole amount should
be recorded under goods and services.
3.4 Payments for financial assets
Debts are written off when identified as irrecoverable. Debts written-off are limited to the amount of savings and/or under spending of
appropriated funds. The write off occurs at year-end or when funds are available. No provision is made for irrecoverable amounts but an
estimate is included in the disclosure notes to the financial statements amounts.
All other losses are recognised when authorisation has been granted for the recognition thereof.

162 Annual Report 2010/2011 | Department of Social Development
DEPARTMENT OF SOCIAL DEVELOPMENT VOTE 18
Accounting Policiesfor the year ended 31 March 2011
3.5 Transfers and subsidies
Transfers and subsidies are recognised as an expense when the final authorisation for payment is effected on the system (by no later than
31 March of each year).
3.6 Unauthorised expenditure
When confirmed unauthorised expenditure is recognised as an asset in the statement of financial position until such time as the
expenditure is either approved by the relevant authority, recovered from the responsible person or written off as irrecoverable in the
statement of financial performance.
Unauthorised expenditure approved with funding is derecognised from the statement of financial position when the unauthorised
expenditure is approved and the related funds are received.
Where the amount is approved without funding it is recognised as expenditure in the statement of financial performance on the date of
approval.
3.7 Fruitless and wasteful expenditure
Fruitless and wasteful expenditure is recognised as expenditure in the statement of financial performance according to the nature of the
payment and not as a separate line item on the face of the statement. If the expenditure is recoverable it is treated as an asset until it is
recovered from the responsible person or written off as irrecoverable in the statement of financial performance.
3.8 Irregular expenditure
Irregular expenditure is recognised as expenditure in the statement of financial performance. If the expenditure is not condoned by the
relevant authority it is treated as an asset until it is recovered or written off as irrecoverable.
4. Assets
4.1 Cash and cash equivalents
Cash and cash equivalents are carried in the statement of financial position at cost.
Bank overdrafts are shown separately on the face of the statement of financial position.
For the purposes of the cash flow statement, cash and cash equivalents comprise cash on hand, deposits held, other short-term highly
liquid investments and bank overdrafts.
4.2 Other financial assets
Other financial assets are carried in the statement of financial position at cost.
4.3 Prepayments and advances
Amounts prepaid or advanced are recognised in the statement of financial position when the payments are made and are derecognised as
and when the goods/services are received or the funds are utilised.
Prepayments and advances outstanding at the end of the year are carried in the statement of financial position at cost.
4.4 Receivables
Receivables included in the statement of financial position arise from cash payments made that are recoverable from another party
(including departmental employees) and are derecognised upon recovery or write-off.
Receivables outstanding at year-end are carried in the statement of financial position at cost plus any accrued interest. Amounts that are
potential irrecoverables are included in the disclosure notes.
4.5 Investments
Capitalised investments are shown at cost in the statement of financial position.
Investments are tested for an impairment loss whenever events or changes in circumstances indicate that the investment may be impaired.
Any impairment loss is included in the disclosure notes.
4.6 Loans
Loans are recognised in the statement of financial position when the cash is paid to the beneficiary. Loans that are outstanding at year-end
are carried in the statement of financial position at cost plus accrued interest.
Amounts that are potentially irrecoverable are included in the disclosure notes.

DEPARTMENT OF SOCIAL DEVELOPMENT VOTE 18
Department of Social Development | Annual Report 2010/2011 163
4.7 Inventory
Inventories that qualify for recognition must be initially reflected at cost. Where inventories are acquired at no cost, or for nominal
consideration, their cost shall be their fair value at the date of acquisition.
All inventory items at year-end are reflected using the weighted average cost or FIFO cost formula.
4.8 Capital assets
4.8.1 Movable assets
Initial recognition
A capital asset is recorded in the asset register on receipt of the item at cost. Cost of an asset is defined as the total cost of acquisition.
Where the cost cannot be determined accurately, the movable capital asset is stated at fair value. Where fair value cannot be determined,
the capital asset is included in the asset register at R1.
All assets acquired prior to 1 April 2002 are included in the register at R1.
Subsequent recognition
Subsequent expenditure of a capital nature is recorded in the statement of financial performance as “expenditure for capital assets” and is
capitalised in the asset register of the department on completion of the project.
Repairs and maintenance is expensed as current “goods and services” in the statement of financial performance.
4.8.2 Immovable assets
Initial recognition
A capital asset is recorded on receipt of the item at cost. Cost of an asset is defined as the total cost of acquisition. Where the cost cannot
be determined accurately, the immovable capital asset is stated at R1 unless the fair value for the asset has been reliably estimated.
Subsequent recognition
Work-in-progress of a capital nature is recorded in the statement of financial performance as “expenditure for capital assets”. On
completion, the total cost of the project is included in the asset register of the department that is accountable for the asset.
Repairs and maintenance is expensed as current “goods and services” in the statement of financial performance.
5. Liabilities
5.1 Payables
Recognised payables mainly comprise of amounts owing to other governmental entities. These payables are carried at cost in the statement
of financial position.
5.2 Contingent liabilities
Contingent liabilities are included in the disclosure notes to the financial statements when it is possible that economic benefits will flow
from the department, or when an outflow of economic benefits or service potential is probable but cannot be measured reliably.
5.3 Contingent assets
Contingent assets are included in the disclosure notes to the financial statements when it is probable that an inflow of economic benefits
will flow to the entity.
5.4 Commitments
Commitments are not recognised in the statement of financial position as a liability or as expenditure in the statement of financial
performance but are included in the disclosure notes.
5.5 Accruals
Accruals are not recognised in the statement of financial position as a liability or as expenditure in the statement of financial performance
but are included in the disclosure notes.
5.6 Employee benefits
Short-term employee benefits that give rise to a present legal or constructive obligation are disclosed in the disclosure notes to the
financial statements. These amounts are not recognised in the statement of financial performance or the statement of financial position.

164 Annual Report 2010/2011 | Department of Social Development
DEPARTMENT OF SOCIAL DEVELOPMENT VOTE 18
Accounting Policiesfor the year ended 31 March 2011
5.7 Lease commitments
Finance lease
Finance leases are not recognised as assets and liabilities in the statement of financial position. Finance lease payments are recognised
as an expense in the statement of financial performance and are apportioned between the capital and interest portions. The finance lease
liability is disclosed in the disclosure notes to the financial statements.
Operating lease
Operating lease payments are recognised as an expense in the statement of financial performance. The operating lease commitments are
disclosed in the disclosure notes to the financial statement.
5.8 Impairment and other provisions
The department tests for impairment where there is an indication that a receivable, loan or investment may be impaired. An assessment
of whether there is an indication of possible impairment is done at each reporting date. An estimate is made for doubtful loans and
receivables based on a review of all outstanding amounts at year-end. Impairments on investments are calculated as being the difference
between the carrying amount and the present value of the expected future cash flows/service potential flowing from the instrument.
Provisions are disclosed when there is a present legal or constructive obligation to forfeit economic benefits as a result of events in the
past and it is probable that an outflow of resources embodying economic benefits will be required to settle the obligation and a reliable
estimate of the obligation can be made.
6. Receivables for departmental revenue
Receivables for departmental revenue are disclosed in the disclosure notes to the annual financial statements.
7. Net assets
7.1 Capitalisation reserve
The capitalisation reserve comprises of financial assets and/or liabilities originating in a prior reporting period but which are recognised in
the statement of financial position for the first time in the current reporting period. Amounts are recognised in the capitalisation reserves
when identified in the current period and are transferred to the National/Provincial Revenue Fund when the underlining asset is disposed
and the related funds are received.
7.2 Recoverable revenue
Amounts are recognised as recoverable revenue when a payment made in a previous financial year becomes recoverable from a debtor in
the current financial year. Amounts are either transferred to the National/Provincial Revenue Fund when recovered or are transferred to the
statement of financial performance when written-off.
8. Related party transactions
Specific information with regards to related party transactions is included in the disclosure notes.
9. Key management personnel
Compensation paid to key management personnel including their family members where relevant, is included in the disclosure notes.
10. Public private partnerships
A description of the PPP arrangement, the contract fees and current and capital expenditure relating to the PPP arrangement is included
in the disclosure notes.

DEPARTMENT OF SOCIAL DEVELOPMENT VOTE 18
Department of Social Development | Annual Report 2010/2011 165
Notes to the Annual Financial Statementsfor the year ended 31 March 2011
1. Annual Appropriation1.1 Annual Appropriation
Included are funds appropriated in terms of the Appropriation Act (and the Adjustments Appropriation Act) for National Departments
(Voted funds) and Provincial Departments:
2010/11 2009/10
Funds not
Final Actual Funds requested/ Appropriation
Appropriation received not received received
R’000 R’000 R’000 R’000
Administration 201 677 200 842 835 178 305
Comprehensive Social Security 95 150 156 94 310 918 839 238 85 253 989
Policy Development, Review and Implementation
Support for Welfare Services 341 291 340 056 1 235 316 075
Community Development 182 034 180 799 1 235 241 473
Strategy and Governance 65 903 64 667 1 236 119 785
Total 95 941 061 95 097 282 843 779 86 109 627
The reason for not requesting R6 177 in respect of the Department’s budget is due to projected efficiency savings implemented during
the year.
The amount not requested from National Treasury in respect of the Social Grant budget for the 2010/11 financial year is R837 603 due
to a projected saving of R1 billion by South African Social Security Agency.
An amount of R44,8 million of the savings on the 2010/11 financial year has been requested as roll over funds to the 2011/12 financial
year.
2010/11 2009/10
Note R’000 R’000
2. Departmental revenueInterest, dividends and rent on land 2.1 4 083 17 591
Sales of capital assets 2.2 — 105
Transactions in financial assets and liabilities 2.3 6 425 12 921
Departmental revenue collected 10 508 30 617
Decrease in revenue collected is due to the decrease in interest collected by SASSA
in the nine bank accounts as well as a decrease collection of funds from the dormant
social grant beneficiaries accounts.
2.1 Interest, dividends and rent on land 2
Interest 4 083 17 591
4 083 17 591
2.2 Sale of capital assets 2
Tangible assets
Machinery and equipment 29.1 — 105
Total — 105
2.3 Transactions in financial assets and liabilities 2
Receivables 6 275 12 819
Other receipts including recoverable revenue 150 102
Total 6 425 12 921

166 Annual Report 2010/2011 | Department of Social Development
DEPARTMENT OF SOCIAL DEVELOPMENT VOTE 18
Notes to the Annual Financial Statementsfor the year ended 31 March 2011
2010/11 2009/10
R’000 R’000
3. Aid assistance3.1 Aid assistance received in cash from RDP
Foreign
Opening balance 30 3 361
Revenue 5 664 6 285
Expenditure (5 690) (9 616)
Current (4 087) (9 544)
Capital (75) (72)
Transfers (1 528) —
Closing balance 4 30
3.2 Aid assistance received in cash from other sources
Local
Opening balance 3 194 775
Revenue 809 3 687
Expenditure (634) (1 268)
Current (634) (1 268)
Closing balance 3 369 3 194
3.3 Aid assistance received in cash from CARA Fund
Opening balance 426 550
Revenue — —
Expenditure (67) (124)
Current — (124)
Transfers (67) —
Closing balance 359 426
3.4 Total assistance
Opening balance 3 650 4 686
Revenue 6 473 9 972
Expenditure (6 391) (11 008)
Current (4 721) (10 936)
Capital (75) (72)
Transfers (1 595) —
Surrendered/Transferred to retained funds — 10
Closing balance 3 732 3 660
3.5 Analysis of balance
Aid assistance unutilised
RDP 4 —
Other sources 3 369 3 234
CARA Fund 359 426
Closing balance 3 732 3 660

DEPARTMENT OF SOCIAL DEVELOPMENT VOTE 18
Department of Social Development | Annual Report 2010/2011 167
2010/11 2009/10
R’000 R’000
4. Compensation of employees4.1 Salaries and wages
Basic salary 163 363 146 451
Performance award 3 326 2 401
Service based 453 378
Compensative/circumstantial 1 847 1 946
Periodic payments 338 1 026
Other non-pensionable allowances 49 172 43 327
Total 218 499 195 529
4.2 Social contributions
Employer contributions
Pension 20 991 18 338
Medical 7 469 6 236
Bargaining council 21 20
Total 28 481 24 594
Total compensation of employees 246 980 220 123
Average number of employees 720 685
The increase in the expenditure for compensation is due to the increase in funded posts
and the establishment of the Appeals Tribunal and vacancy rate dropped by 1%. Increase
was also due to the annual cost of living adjustment agreed to at the PSCBC.
5. Goods and services Note
Administrative fees 1 951 527
Advertising 6 228 8 317
Assets less then R5 000 5.1 692 548
Bursaries (employees) 1 136 678
Catering 3 813 2 528
Communication 11 232 10 468
Computer services 5.2 23 387 9 583
Consultants, contractors and agency/outsourced services 5.3 68 277 87 332
Entertainment 398 765
Audit cost – external 5.4 9 768 11 603
Inventory 5.5 10 578 13 752
Operating leases 23 115 17 308
Owned and leasehold property expenditure 5.6 5 662 3 340
Travel and subsistence 5.7 56 360 56 140
Venues and facilities 24 172 14 646
Training and staff development 3 310 4 738
Other operating expenditure 5.8 3 429 2 412
Total 253 508 244 685
Increase in venues and facilities is due to two major events hosted by the Department during 2010/11 i.e. the World Social Security
Forum hosted in Cape Town and the Substance Abuse and Drug Summit in Durban.

168 Annual Report 2010/2011 | Department of Social Development
DEPARTMENT OF SOCIAL DEVELOPMENT VOTE 18
Notes to the Annual Financial Statementsfor the year ended 31 March 2011
2010/11 2009/10
Note R’000 R’000
5. Goods and services (continued)
5.1 Assets less than R5 000 5
Tangible assets
Machinery and equipment 692 548
Total 692 548
5.2 Computer services 5
SITA computer services 21 292 5 201
External computer service providers 2 095 4 382
Total 23 387 9 583
The increase in SITA computer services expenditure relates to the clearing of
prior year invoices that were in dispute following an extensive reconciliation.
5.3 Consultants, contractors and agency/outsourced services 5
Business and advisory services 51 278 61 740
Legal costs 11 457 5 089
Contractors 5 126 4 756
Agency and support/outsourced services 416 15 747
Total 68 277 87 332
Increase in Legal costs relates to the payment of Litigation costs in respect
of Social Grants Appeals cases.
5.4 Audit cost – External 5
Regularity audits 9 768 11 603
Total 9 768 11 603
Decrease in the payment of Audit fees relates to the decrease in Audit hours.
5.5 Inventory 5
Fuel, oil and gas 15 75
Other consumable materials 460 294
Maintenance material 8 11
Stationery and printing 10 095 13 372
Total 10 578 13 752
5.6 Property payments 5
Municipal services 2 312 917
Other 3 350 2 423
Total 5 662 3 340
5.7 Travel and subsistence 5
Local 49 293 43 349
Foreign 7 067 12 791
Total 56 360 56 140

DEPARTMENT OF SOCIAL DEVELOPMENT VOTE 18
Department of Social Development | Annual Report 2010/2011 169
2010/11 2009/10
Note R’000 R’000
5. Goods and services (continued)
5.8 Other operating expenditure 5
Learnerships 802 —
Professional bodies, membership and subscription fees 91 —
Resettlement costs 534 466
Other 2 002 1 946
Total 3 429 2 412
6. Interest and rent on landInterest paid 45 94
Total 45 94
7. Payments for financial assetsOther material losses written off 7.1 45 6
Total 45 6
7.1 Other material losses written off 7
Nature of losses
Bad debts written off 45 6
Total 45 6
Approval was obtained to write-off debt cases less that R500 which will not be cost
effective to recover.
8. Transfers and subsidiesDepartmental agencies and accounts Annex 1A 5 940 856 5 523 678
Foreign governments and international organisations Annex 1B 1 509 1 860
Non-profit institutions Annex 1C 63 780 61 106
Households Annex 1D 87 517 993 79 262 797
Total 93 524 138 84 849 441
Increase in Transfer to Households relates to Social Grants increases due to extension of Child Support Grant and increased income
threshold for the means test.

170 Annual Report 2010/2011 | Department of Social Development
DEPARTMENT OF SOCIAL DEVELOPMENT VOTE 18
Notes to the Annual Financial Statementsfor the year ended 31 March 2011
2010/11 2009/10
Note R’000 R’000
9. Expenditure for capital assetsTangible assets 5 881 3 883
Machinery and equipment 9.1 5 881 3 883
Software and other intangible assets 367 —
Computer software 9.1 367 —
Total 6 248 3 883
Voted funds Aid assistance TotalR’000 R’000 R’000
9.1 Analysis of funds utilised to acquire capital assets – 2010/11Tangible assets 5 881 — 5 881
Machinery and equipment 5 881 — 5 881
Software and other intangible assets 292 75 367
Computer software 292 75 367
Total 6 173 75 6 248
9.2 Analysis of funds utilised to acquire capital assets – 2009/10Tangible assets 3 811 72 3 883
Machinery and equipment 3 811 72 3 883
Total 3 811 72 3 883
2010/11 2009/10
Note R’000 R’000
10. Unauthorised expenditure10.1 Reconciliation of unauthorised expenditure
Opening balance 10 26 309 26 309Less: Amounts approved by Parliament without funding written off in the
statement of financial performance (141) —
Unauthorised expenditure awaiting authorisation/written off 26 168 26 309
Analysis of awaiting authorisation per economic classificationCurrent 26 168 26 309
Total 26 168 26 309
10.2 Analysis of unauthorised expenditure awaiting authorisation per typeCurrent 26 168 26 309
Total 26 168 26 309
The unauthorised expenditure of R26 168 million relates to over expenditure of social assistance in the 2008/09 financial year. The
amount will be cleared once SCOPA has recommended approval with or without funds.

DEPARTMENT OF SOCIAL DEVELOPMENT VOTE 18
Department of Social Development | Annual Report 2010/2011 171
2010/11 2009/10
R’000 R’000
11. Fruitless and wasteful expenditure11.1 Reconciliation of fruitless and wasteful expenditure
Opening balance 345 345
Less: Amounts condoned (22) —
Current (22) —
Fruitless and wasteful expenditure awaiting condonement 323 345
Analysis of awaiting condonement per economic classification
Current 323 345
Total 323 345
12. Cash and cash equivalentsConsolidated Paymaster General Account 1 235 152 288 269
Cash receipts 1 309 103
Cash on hand 8 8
Total 1 236 469 288 380
The increase in PMG Account relates to unspent funds by SASSA due to savings on Social
Assistance grants during the 2010/11 financial year.
13. Prepayments and advancesStaff advances 27 —
Travel and subsistence 116 135
Advances paid to other entities 3 880 2 110
SOCPEN advances 3 035 164 2 644 006
Total 3 039 187 2 646 251
The increase relates to advances paid to SASSA in respect of Social Grants for 1 April as well as advance payment to GCIS in respect
of media advertising for the Substance Abuse and Drug Summit in Durban during March 2011.
14. Receivables2010/11 2009/10
Less than One to Older than
one year three years three years Total Total
Note R’000 R’000 R’000 R’000 R’000
Claims recoverable 14.1, Annex 3 9 712 28 082 55 37 849 152 107
Staff debt 14.2 84 — — 84 273
Other debtors 14.3 64 095 133 474 107 918 305 487 297 161
Total 73 891 161 556 107 973 343 420 449 541
14.1 Claims recoverable 14
National departments 7 331 4 833
Provincial departments 23 687 138 449
Public entities 6 831 8 825
Total 37 849 152 107
The decrease in claims recoverable relates to the recovery of the Provincial PMG II account which relates to the 2006/07 surrendering.

172 Annual Report 2010/2011 | Department of Social Development
DEPARTMENT OF SOCIAL DEVELOPMENT VOTE 18
Notes to the Annual Financial Statementsfor the year ended 31 March 2011
2010/11 2009/10
Note R’000 R’000
14. Receivables14.2 Staff debt 14
Current Staff Debt 84 273
Total 84 273
14.3 Other debtors 14
General suspense 5 268 4 910
Government Employers Pension Fund — 7
Fin Institute Study loan — 1
Medical — 2
Salary reversal account 7 22
Tax debt 13 —
Ex Departmental official debt 428 —
SASSA debtors 299 771 292 219
Total 305 487 297 161
An amount of about R6 million is of irrecoverable Social Grant debtors and will be written-
off during 2011/12 financial year. The Department is in the process to reconcile all monies
received in respect of Social Grant debtors which could not be allocated to a debt case.
These amounts is currently allocated to unallocated receipts.
15. Voted funds to be surrendered to the Revenue FundOpening balance 821 112 455 926
Transfer from statement of financial performance 1 910 031 1 190 027
Voted funds not requested/not received 1.1 (843 779) (398 560)
Paid during the year (821 112) (426 281)
Closing balance 1 066 252 821 112
Increase in funds to be surrendered is due to the increase in the saving of the
payment of Social Grants.
16. Departmental revenue and NRF Receipts to be surrendered
to the Revenue FundOpening balance 11 147 18 632
Transfer from Statement of Financial Performance 10 508 30 617
Paid during the year (11 519) (38 102)
Closing balance 10 136 11 147
17. Bank overdraftConsolidated Paymaster General Account 3 176 384 2 274 445
Total 3 176 384 2 274 445
The overdraft of the Bank Account relates to the advance payments made to SASSA at the
end of March 2011 in respect of Social Grants paid on 1 April 2011.

DEPARTMENT OF SOCIAL DEVELOPMENT VOTE 18
Department of Social Development | Annual Report 2010/2011 173
2010/11 2009/10
Note R’000 R’000
18. Payables – currentAdvances received 18.1 1 900 —
Clearing accounts 18.2 100 794 52 361
Other payables 18.3 286 369 248 101
Total 389 063 300 462
18.1 Advances received 18
NISIS 1 900 —
Total 1 900 —
The advance payments were received from Provincial Departments for their contribution to
the NISIS project that is co-ordinated by the National Department of Social Development.
18.2 Clearing accounts 18
Debt interest and income analysis 2 570 37 039
Income tax 83 220
Unallocated receipts 97 238 15 064
Pension fund 10 —
General ledger 7 38
Exchequer grant account 886 —
Total 100 794 52 361
The Special Investigation Unit is responsible to administer social grant debtors on behalf
of the Department and SASSA.
National Department of Social Development will reconcile all debt cases created by
Provincial Departments against claims received.
18.3 Other payables 18
SASSA claims receivable 1 937 2 484
Deferred revenue 284 379 245 418
Salary tax debt — 2
Advance Limpopo 50 145
Debt suspense — 52
Private telephone 3 —
Total 286 369 248 101
SASSA claims receivable relates to claims in respect of the officials seconded and will be settled in April 2011.
Deferred revenue relates to Social Grant debtors.

174 Annual Report 2010/2011 | Department of Social Development
DEPARTMENT OF SOCIAL DEVELOPMENT VOTE 18
Notes to the Annual Financial Statementsfor the year ended 31 March 2011
2010/11 2009/10
Note R’000 R’000
19. Net cash flow available from operating activitiesNet surplus/(deficit) as per Statement of Financial Performance 1 920 621 1 219 608
Add back non cash/cash movements not deemed operating activities (1 868 223) (2 446 724)
(Increase)/decrease in receivables – current 106 121 (12 067)
(Increase)/decrease in prepayments and advances (392 936) (1 648 744)
(Increase)/decrease in other current assets 163 —
Increase/(decrease) in payables – current 88 601 73 241
Proceeds from sale of capital assets (105)
Expenditure on capital assets 6 248 3 883
Surrenders to Revenue Fund (832 631) (464 383)
Voted funds not requested/not received (843 779) (398 560)
Other non-cash items (10) 11
Net cash flow generated by operating activities 52 398 (1 227 116)
20. Reconciliation of cash and cash equivalents for cash flow purposesConsolidated Paymaster General account (1 941 232) (1 986 176)
Cash receipts 1 309 103
Cash on hand 8 8
Total (1 939 915) (1 986 065)

DEPARTMENT OF SOCIAL DEVELOPMENT VOTE 18
Department of Social Development | Annual Report 2010/2011 175
Disclosure Notes to the Annual Financial Statementsfor the year ended 31 March 2011
2010/11 2009/10
Note R’000 R’000
21. Contingent liabilities and contingent assets21.1 Contingent liabilities
Liable to Nature
Motor vehicle guarantees Employees Annex 2A — 97
Housing loan guarantees Employees Annex 2A 249 231
Other departments (interdepartmental unconfirmed balances) Annex 4 21 665 7 351
Total 21 914 7 679
22. CommitmentsCurrent expenditure
Approved and contracted 53 230 66 875
Approved but not yet contracted 11 70
53 241 66 945
Capital expenditure
Approved and contracted 513 920
Approved but not yet contracted 271 —
784 920
Total commitments 54 025 67 865
30 days 30+ days Total Total
23. AccrualsListed by economic classification
Goods and services 2 431 294 2725 8 946
Capital assets — 65 65 72
Total 2 431 359 2 790 9 018
Listed by programme level
Administration 792 4 137
Comprehensive Social Security — 1 184
Social Security Policy and Administration 1 005 —
Welfare Services Policy Development and Implementation 638 895
Social Policy and Integrated Service Delivery 331 348
CIDA Funding 24 2 454
Total 2 790 9 018
Note
Confirmed balances with other departments Annex 4 11 129 1 131
Total 11 129 1 131

176 Annual Report 2010/2011 | Department of Social Development
DEPARTMENT OF SOCIAL DEVELOPMENT VOTE 18
Disclosure Notes to the Annual Financial Statementsfor the year ended 31 March 2011
2010/11 2009/10
R’000 R’000
24. Employee benefitsLeave entitlement 4 007 3 869
Service bonus (Thirteenth cheque) 6 326 5 765
Performance awards 196 —
Capped leave commitments 8 122 8 356
Total 18 651 17 990
Buildings and Machinery
other fixed and
structures equipment Total
25. Lease commitments25.1 Operating leases expenditure
2010/11
Not later than 1 year 23 982 112 24 094
Later than 1 year and not later than 5 years 38 925 39 38 964
Total lease commitments 62 907 151 63 058
2009/10
Not later than 1 year 19 862 485 20 347
Later than 1 year and not later than 5 years 56 099 — 56 099
Total lease commitments 75 961 485 76 446
25.2 Finance leases expenditure
2009/10
Not later than 1 year 546 546
Later than 1 year and not later than 5 years 11 11
Total lease commitments 557 557
Less: finance costs (11) (11)
Total present value of lease liabilities 546 546

DEPARTMENT OF SOCIAL DEVELOPMENT VOTE 18
Department of Social Development | Annual Report 2010/2011 177
2010/11 2009/10
R’000 R’000
26. Irregular expenditure26.1 Reconciliation of irregular expenditure
Opening balance 6 909 6 909
Add: Irregular expenditure – relating to current year 1 322 —
Irregular expenditure awaiting condonation 8 231 6 909
Analysis of awaiting condonation per age classification
Current year 1 322 —
Prior years 6 909 6 909
Total 8 231 6 909
26.2 Details of irregular expenditure – current year
Incident
Proper procurement procedures
not followed 1 322 —
Total 1 322 —
27. Fruitless and wasteful expenditure27.1 Reconciliation of fruitless and wasteful expenditure
Opening balance 345 345
Fruitless and wasteful expenditure – relating to current year 67 —
Less: Amounts condoned (22) —
Fruitless and wasteful expenditure awaiting condonement 390 345
27.2 Analysis of awaiting condonement per economic classification
Current 390 —
Total 390 —
27.3 Analysis of Current year’s fruitless and wasteful expenditure
Incident Disciplinary steps taken/criminal proceedings
Hotel No Shows Amounts to be recovered from relevant officials 4
Car Damage Amounts to be written – off 13
Hotel No Shows Amounts to be written – off, motivation submitted 10
Interest on overdue accounts Outcome of investigation to be finalised 40
Total 67

178 Annual Report 2010/2011 | Department of Social Development
DEPARTMENT OF SOCIAL DEVELOPMENT VOTE 18
Disclosure Notes to the Annual Financial Statementsfor the year ended 31 March 2011
2010/11 2009/10
R’000 R’000
28. Key management personnelNo. of Individuals
Political office bearers 2 3 253 2 998
Officials:
Level 15 to 16 7 8 207 7 135
Level 14 (including CFO if at a lower level) 20 17 682 15 974
Total 29 142 26 107
29. Movable tangible capital assetsMovement in movable tangible capital assets per asset register for the year ended 31 March 2011
Opening Closing
balance Additions Balance
R’000 R’000 R’000
Machinery and equipment 51 699 5 946 57 645
Transport assets 798 1 677 2 475
Computer equipment 31 314 2 565 33 879
Furniture and office equipment 15 227 1 326 16 553
Other machinery and equipment 4 360 378 4 738
Total movable tangible capital assets 51 699 5 946 57 645
29.1 Additions
Additions to movable tangible capital assets per asset register for the year ended 31 March 2011
Received
current, not paid
(Paid current
year, received
Cash prior year) Total
R’000 R’000 R’000
Machinery and equipment 5 881 65 5 946
Transport assets 1 677 — 1 677
Computer equipment 2 516 49 2 565
Furniture and office equipment 1 326 — 1 326
Other machinery and equipment 362 16 378
Total additions to movable tangible capital assets 5 881 65 5 946
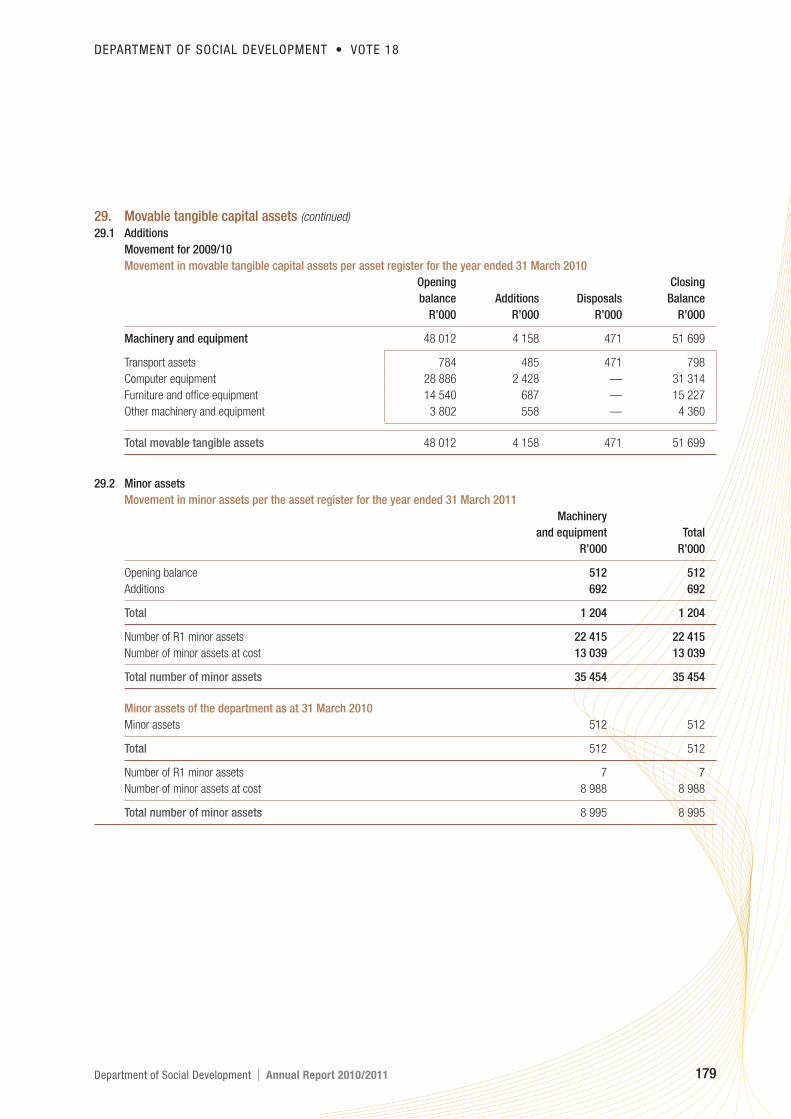
DEPARTMENT OF SOCIAL DEVELOPMENT VOTE 18
Department of Social Development | Annual Report 2010/2011 179
29. Movable tangible capital assets (continued)
29.1 Additions
Movement for 2009/10
Movement in movable tangible capital assets per asset register for the year ended 31 March 2010
Opening Closing
balance Additions Disposals Balance
R’000 R’000 R’000 R’000
Machinery and equipment 48 012 4 158 471 51 699
Transport assets 784 485 471 798
Computer equipment 28 886 2 428 — 31 314
Furniture and office equipment 14 540 687 — 15 227
Other machinery and equipment 3 802 558 — 4 360
Total movable tangible assets 48 012 4 158 471 51 699
29.2 Minor assets
Movement in minor assets per the asset register for the year ended 31 March 2011
Machinery
and equipment Total
R’000 R’000
Opening balance 512 512
Additions 692 692
Total 1 204 1 204
Number of R1 minor assets 22 415 22 415
Number of minor assets at cost 13 039 13 039
Total number of minor assets 35 454 35 454
Minor assets of the department as at 31 March 2010
Minor assets 512 512
Total 512 512
Number of R1 minor assets 7 7
Number of minor assets at cost 8 988 8 988
Total number of minor assets 8 995 8 995

180 Annual Report 2010/2011 | Department of Social Development
DEPARTMENT OF SOCIAL DEVELOPMENT VOTE 18
Disclosure Notes to the Annual Financial Statementsfor the year ended 31 March 2011
30. Intangible capital assetsMovement in intangible capital assets per asset register for the year ended 31 March 2011
Opening Closing
balance Additions Balance
R’000 R’000 R’000
Computer software 20 513 367 20 880
Total intangible capital assets 20 513 367 20 880
30.1 Additions
Additions to intangible capital assets per asset register for the year ended 31 March 2011
Cash Total
R’000 R’000
Computer software 367 367
Total additions to intangible capital assets 367 367
30.2 Movement for 2009/10
Movement in intangible capital assets per asset register for the year ended 31 March 2010
Opening Closing
balance balance
R’000 R’000
Computer software 20 513 20 513
Total intangible capital assets 20 513 20 513
31. World Cup expenditure2010/11 2009/10
R’000 R’000
Purchase of world cup apparel Quantity
Bench jackets 22 11 —
Total 22 11 —
Total world cup expenditure 11 —

DEPARTMENT OF SOCIAL DEVELOPMENT VOTE 18
Department of Social Development | Annual Report 2010/2011 181
Annexures to the Annual Financial Statementsfor the year ended 31 March 2011
Annexure 1AStatement of transfers to departmental agencies and accounts
Transfer allocation Transfer 2009/10
% of available
Adjusted Total Actual funds Appropriation
Appropriation available Transfer transferred Act
Department/ agency/ account R’000 R’000 R’000 % R’000
National Development Agency 83 469 83 469 83 469 100 144 782
South African Social Security Agency 5 631 387 5 631 387 5 631 387 100 5 168 896
National Student Financial Aid Scheme 226 000 226 000 226 000 100 210 000
5 940 856 5 940 856 5 940 856 5 523 678
Annexure 1BStatement of transfers to foreign government and international organisations
Transfer allocation Transfer 2009/10
% of available
Adjusted Total Actual funds Appropriation
Foreign government/ international Appropriation available Transfer transferred Act
organisation R’000 R’000 R’000 % R’000
Transfers
International Social Security Association 1 000 1 000 811 81 897
International Federation for the Aged 35 35 — — 23
International Social Services 136 136 71 52 148
Walvis Bay 141 141 141 100 179
UNDP Representatives — — — — 180
Partners in Population and Development 308 308 315 102 308
UNRISD 100 100 100 100 100
Commission for Narcotic Drug 25 25 25 100 25
International Organisation of PE 46 46 46 100 —
1 791 1 791 1 509 1 860

182 Annual Report 2010/2011 | Department of Social Development
DEPARTMENT OF SOCIAL DEVELOPMENT VOTE 18
Annexures to the Annual Financial Statementsfor the year ended 31 March 2011
Annexure 1CStatement of transfers to non-profit institutions
Transfer allocation Transfer 2009/10
% of available
Adjusted Total Actual funds Appropriation
Appropriation available Transfer transferred Act
Non-profit institutions R’000 R’000 R’000 % R’000
Transfers
Love Life 43 460 43 460 43 460 100 41 000
Soul City 1 000 1 000 1 000 100 1 000
UNFPA 191 191 191 100 —
NABSSA 910 910 273 30 192
Khanya-AICDD 500 500 286 57 1 000
NAPWA 750 750 482 64 250
Foundation for Professional Development — — — 100
Finmark Trust — — — 500
National Religious Leaders Forum 500 500 — —
47 311 47 311 45 692 44 042
Subsidies
Suid Afrikaanse Vroue Federasie 601 601 601 100 552
Ondersteuningsraad 516 516 516 100 473
National Council for Persons with Physical
Disabilities 703 703 703 100 627
Deaf Federation of SA (DEAFSA) 627 627 627 100 575
SA Federation for Mental Health 636 636 636 100 441
SA Council on Alcoholism and Drug Abuse 1 353 1 353 1 353 100 1 353
Child Welfare 1 723 1 723 1 723 100 1 581
Apostolic Faith Mission (AFM) 573 573 573 100 516
Family and Marriage Society of South Africa 1 002 1 002 1 002 100 1 238
Epilepsy South Africa 909 909 909 100 1 233
National Institute for Crime Prevention 971 971 971 100 1 093
Afrikaanse Christelike Vroue Federasie 1 001 1 001 1 001 100 1 275
Alzheimer SA 700 700 700 100 560
Badisha Christian Compassion 481 481 481 100 442
South African Council for Social Services 1 100 1 100 1 100 100 1 035
Khulisa Crime Prevention Initiate 1 191 1 191 1 191 100 1 092
South Africa Older Persons 591 591 591 100 542
Child Line South Africa 770 770 770 100 706
SA Depression and Anxiety Group 859 859 859 100 616
Action on Elder Abuse 534 534 534 100 490
Lifeline South Africa 972 972 972 100 624
National Association of Scholarship 275 275 275 100 —
18 088 18 088 18 088 17 064
Total 65 399 65 399 63 780 61 106

DEPARTMENT OF SOCIAL DEVELOPMENT VOTE 18
Department of Social Development | Annual Report 2010/2011 183
Annexure 1DStatement of transfers to households
Transfer allocation Expenditure 2009/10
Adjusted % of
available
Appropriation Total Actual funds Appropriation
Act Roll overs Adjustments available Transfer transferred Act
Households R’000 R’000 R’000 R’000 R’000 % R’000
Transfers
Disaster Relief — — 20 000 20 000 20 000 100 —
Social Grants 89 368 151 1 600 — 89 369 751 87 492 902 98 79 259 748
Social Relief 5 000 — — 5 000 4 787 96 1 497
Social Benefit ex-officials — — — — 131 1 552
Department of Labour (Injury
on duty) — — — — 3 —
Donations — — — — 170 —
Total 89 373 151 1 600 20 000 89 394 751 87 517 993 79 262 797
Annexure 1EStatement of aid assistance received
Opening Closing
balance Revenue Expenditure balance
Name of donor Purpose R’000 R’000 R’000 R’000
Received in cash
DFID SACED Programme 22 2 055 2 073 4
CIDA Child Protection Register — 3 617 3 617 —
HW Seta Various Training Programmes 3 193 809 634 3 368
Subtotal 3 215 6 481 6 324 3 372
Received in kind
JICA Conduct a workshop on Data
analysis impact evaluation — 142 142 —
Food Bank Pre-Christmas Event — 525 525 —
Horizon Education Trust Pre-Christmas Event — 120 120 —
Coca-Cola Pre-Christmas Event — 5 5 —
Subtotal — 792 792 —
Total 3 215 7 273 7 116 3 372

184 Annual Report 2010/2011 | Department of Social Development
DEPARTMENT OF SOCIAL DEVELOPMENT VOTE 18
Annexures to the Annual Financial Statementsfor the year ended 31 March 2011
An
nex
ure
1F
Sta
tem
ent
of a
ctu
al m
onth
ly e
xpen
dit
ure
per
gra
nt
A
pr
May
Jun
Jul
Au
gS
ept
Oct
Nov
Dec
Jan
Feb
Mar
2
01
02
01
02
010
2010
2010
2010
2010
2010
2010
20
11
20
11
20
11
Tota
l
Gra
nt
Typ
eR
’00
0R
’00
0R
’00
0R
’000
R’0
00
R’0
00
R’0
00
R’0
00
R’0
00
R’0
00
R’0
00
R’0
00
R’0
00
Old
age
2 7
48
59
0
2 6
55
98
6
2 9
04
098
2 8
15 6
85
2 8
34 3
51
2 8
14 2
13
2 8
22 1
12
2 8
47 5
10
2 7
61 2
55
2
81
9 7
74
2
83
9 4
74
2
88
7 5
52
3
3 7
50
60
0
War
Vet
eran
s 1
31
7
1 3
10
1
28
1
1 2
28
1 2
21
1 1
66
1 1
17
1 1
21
95
6
1 0
68
1
14
8
1 0
43
1
3 9
76
Dis
abili
ty 1
45
7 2
49
1
35
3 4
32
1
49
9 6
86
1 4
26 4
74
1 4
16 5
97
1 4
08 3
07
1 3
80 3
46
1 3
92 7
68
1 3
73 4
55
1
38
3 2
57
1
35
1 7
79
1
39
6 8
32
1
6 8
40
18
2
Gra
nt in
Aid
—
—
—
—
—
—
—
—
105 0
47
3
5 3
68
1
4 2
66
1
5 3
71
1
70
05
2
Fost
er C
are
38
4 5
32
3
63
08
7
39
7 3
60
378 7
57
386 7
92
399 3
73
393 0
88
400 9
38
411 7
28
3
66
70
2
35
6 0
15
3
78
07
0
4 6
16
44
2
Car
e D
epen
denc
y 1
31
84
7
12
7 6
29
1
33
116
131 0
44
132 6
24
132 3
60
131 4
59
132 5
83
133 3
46
1
33
49
9
13
1 1
84
1
35
76
1
1 5
86
45
2
Chi
ld S
uppo
rt G
rant
2 4
29
37
0
2 3
45
78
5
2 5
64
203
2 5
04 0
58
2 5
23 6
47
2 5
33 6
75
2 5
32 5
14
2 5
62 1
17
2 5
80 3
55
2
57
5 7
18
2
55
0 4
00
2
63
9 6
23
3
0 3
41
46
5
Oth
er 1
24
5
1 8
10
4
406
6 2
88
8 4
57
13 1
62
20 4
72
18 0
48
24 5
27
1
7 9
87
1
7 3
40
3
9 9
95
1
73
73
7
Tota
l 7
15
4 1
50
6
84
9 0
39
7
50
4 1
50
7 2
63 5
34
7 3
03 6
89
7 3
02 2
56
7 2
81 1
08
7 3
55 0
85
7 3
90 6
69
7
33
3 3
73
7
26
1 6
06
7
49
4 2
47
8
7 4
92
90
6
An
nex
ure
2A
Sta
tem
ent
of fi
nan
cial
gu
aran
tees
issu
ed a
s at
31
Mar
ch 2
01
1 –
loca
l
Gu
aran
tees
rep
aym
ents
/
Ori
gin
alG
uar
ante
esca
nce
lled
/
gu
aran
teed
Op
enin
g b
alan
ced
raw
dow
ns
red
uce
d/
rele
ased
Clo
sin
g b
alan
ce
cap
ital
am
oun
t1 A
pri
l 2010
du
rin
g t
he
year
du
rin
g t
he
year
31
Mar
ch 2
01
1
Gu
aran
tor
inst
itu
tion
Gu
aran
tee
in r
esp
ect
ofR
’000
R’0
00
R’0
00
R’0
00
R’0
00
Sta
ndar
d B
ank
Mot
or v
ehic
les
306
97
—9
7—
Su
bto
tal
306
97
—9
7—
Hou
sing
AB
SA
134
92
42
24
11
0
FNB
11
11
——
11
Firs
t R
and
101
101
——
10
1
Old
Mut
ual
27
12
——
12
Sta
ndar
d B
ank
15
15
——
15
Su
bto
tal
288
231
42
24
24
9
Tota
l594
328
42
12
12
49

DEPARTMENT OF SOCIAL DEVELOPMENT VOTE 18
Department of Social Development | Annual Report 2010/2011 185
Annexure 3Claims recoverable
Confirmed balance Unconfirmed balance
outstanding outstanding Total
31/03/2011 31/03/2010 31/03/2011 31/03/2010 31/03/2011 31/03/2010
Government entity R’000 R’000 R’000 R’000 R’000 R’000
Department
Social Development KZN — 21 515 — — — 21 515
Department of Health and Welfare Limpopo 20 817 20 817 — — 20 817 20 817
Department of Social Development Gauteng 2 870 2 870 — — 2 870 2 870
Department of Social Development Free State — 2 846 — — — 2 846
Department of Welfare Eastern Cape — 90 141 — 200 — 90 341
South African Social Security Agency — — 3 975 5 285 3 975 5 285
Department of International Relations — — — 75 — 75
Department of Trade and Industry — — 27 — 27 —
Presidency — — 431 275 431 275
Government Communication — 24 — — — 24
Department of Justice and Constitutional
Development — — 366 31 366 31
Gauteng Health — — — 5 — 5
National Treasury ( Free State) — — 2 423 — 2 423 —
Integrated Justice System — — 2 021 1 395 2 021 1 395
Department of Defence — — 13 13 13 13
Department of Home Affairs — — 8 8 8 8
Department of Sport and Recreation — — — 31 — 31
Department of Rural Development (NSIS) — — 1 984 2 980 1 984 2 980
Unknown conversion — — 56 56 56 56
South African Social Security Agency — — — 3 540 — 3 540
South African Social Security Agency
(PMG Admin Account) 2 858 — — — 2 858 —
Total 26 545 138 213 11 304 13 894 37 849 152 107

186 Annual Report 2010/2011 | Department of Social Development
DEPARTMENT OF SOCIAL DEVELOPMENT VOTE 18
Annexures to the Annual Financial Statementsfor the year ended 31 March 2011
Annexure 4Inter-government payables
Confirmed balance Unconfirmed balance
outstanding outstanding Total
31/03/2011 31/03/2010 31/03/2011 31/03/2010 31/03/2011 31/03/2010
Government entity R’000 R’000 R’000 R’000 R’000 R’000
Departments
Current
Department of International Relation — 1 129 — — — 1 129
Parliament of South Africa 1 — — — 1 —
Department of Justice and Constitutional
Development 11 116 — 1 064 3 426 12 180 3 426
Department of Transport — — — 3 — 3
Gauteng G-fleet — — 3 080 2 143 3 080 2 143
Department of Science and Technology 12 — — — 12 —
Department of Public Works Free State — 1 — — — 1
PALAMA — — — 1 600 — 1 600
Department of Transport and Public Work
(Western Cape) — — — 170 — 170
Gauteng: Department of Health and Social
Development — 1 — — — 1
National Department of Health — — — 9 — 9
Department of Social Development
(KwaZulu-Natal) — — 17 521 — 17 521 —
Total 11 129 1 131 21 665 7 351 32 794 8 482
Annexure 5Inventory
2010/11 2009/10
Quantity R’000 Quantity R’000
Opening balance 13 290 755 9 152 690
Add/(Less): Adjustments to prior year balance (222) (12) — (3)
Add: Additions/Purchases – Cash 53 648 12 851 58 364 13 751
Add: Additions – Non-cash 35 5 2 764 —
(Less): Disposals — — — —
(Less): Issues — — (47 938) (13 094)
Add/(Less): Adjustments — — — (30)
Closing balance 66 751 13 599 22 342 1 314
Department of Social Development | Annual Report 2010/2011 187
REPORT OF THE AUDITOR-GENERAL TO PARLIAMENT ON THE DISASTER RELIEF FUND
REPORT ON THE FINANCIAL STATEMENTS
IntroductionI have audited the accompanying financial statements of the
Disaster Relief Fund, which comprise the statement of financial
position as at 31 March 2011 and the statement of financial
performance, statement of changes in net assets and cash flow
statement for the year then ended, a summary of significant
accounting policies and other explanatory information as set out
on pages 188 to 191.
Accounting Authority’s responsibility for the
financial statementsThe accounting authority is responsible for the preparation and
fair presentation of these financial statements in accordance
with South African Statements of Generally Accepted Accounting
Practice and in the manner required by the Auditor-General’s
Directive (General Notice 1111 of 2010 issued in Government
Gazette 33872 of 15 December 2010), the Fund Raising Act
of South Africa, and for such internal control as management
determines necessary to enable the preparation of financial
statements that are free from material misstatement, whether due
to fraud or error.
Auditor-General’s responsibilityAs required by section 188 of the Constitution of the Republic
of South Africa, 1996 (Act No. 108 of 1996) and section 4 of
the Public Audit Act of South Africa, 2004 (Act No. 25 of 2004)
(PAA), my responsibility is to express an opinion on these financial
statements based on my audit.
I conducted my audit in accordance with International Standards
on Auditing and General Notice 1111 of 2010 issued in
Government Gazette 33872 of 15 December 2010. Those
standards require that I comply with ethical requirements and
plan and perform the audit to obtain reasonable assurance
about whether the financial statements are free from material
misstatement.
An audit involves performing procedures to obtain audit evidence
about the amounts and disclosures in the financial statements.
The procedures selected depend on the auditor’s judgement,
including the assessment of the risks of material misstatement
of the financial statements, whether due to fraud or error. In
making those risk assessments, the auditor considers internal
control relevant to the entity’s preparation and fair presentation of
the financial statements in order to design audit procedures that
are appropriate in the circumstances, but not for the purpose of
expressing an opinion on the effectiveness of the entity’s internal
control. An audit also includes evaluating the appropriateness of
accounting policies used and the reasonableness of accounting
estimates made by management, as well as evaluating the overall
presentation of the financial statements.
I believe that the audit evidence I have obtained is sufficient and
appropriate to provide a basis for my audit opinion.
OpinionIn my opinion, the financial statements present fairly, in all material
respects, the financial position of the Disaster Relief Fund as at 31
March 2011, and its financial performance and cash flows for the
year then ended, in accordance with the South African Statements
of Generally Accepted Accounting Practice and the requirements
of section 22(7) of the Fund Raising Act of South Africa.
Pretoria
31 July 2011
Aud i t i ng to bu i ld pub l i c confidence

188 Annual Report 2010/2011 | Department of Social Development
DISASTER RELIEF FUND
Statement of Financial Performancefor the year ended 31 March 2011
Statement of Financial Positionas at 31 March 2011
2010/11 2009/10
Notes R’000 R’000
RevenueOther income 2 42 408 3 187
Total revenue 42 408 3 187
ExpenditureAdministrative expenses 3 (155) (42)
Audit fees 4 (8) (10)
Other operating expenses 5 (91) (12)
Total expenditure (254) (64)
Surplus/(deficit) from operations 42 154 3 123
Surplus/(deficit) for the year 42 154 3 123
2010/11 2009/10
Notes R’000 R’000
AssetsNon-current assets
Financial assets available-for-sale 6 48 584 45 754
Current assets
Cash and cash equivalents 7 36 096 1 198
Total assets 84 680 46 952
LiabilitiesCurrent liabilities
Trade and other payables 8 — 4 426
Total liabilities — 4 426
Net assetsCapital and reserves
Accumulated surplus 84 680 42 526
Total net assets 84 680 42 526
Total net assets and liabilities 84 680 46 952

DISASTER RELIEF FUND
Department of Social Development | Annual Report 2010/2011 189
Statement of Changes in Net Assetsas at 31 March 2011
Cash Flow Statementfor the year ended 31 March 2011
Accumulated
funds
R’000
Balance as at 1 April 2009 39 403
Surplus for the year 3 123
Balance as at 31 March 2010 42 526
Surplus for the year 42 154
Balance as at 31 March 2011 84 680
2010/11 2009/10
Notes R’000 R’000
Cash flows from operating activitiesCash paid to suppliers and employees 9 (254) (66)
Cash generated from/(utilised in) operations (254) (66)
Interest received 2 2 833 3 187
Other operating revenue 39 575 —
Net cash inflow/(outflow) from operating activities 42 154 3 121
Cash flow from investing activitiesTrading investments 2 (2 832) (3 187)
Net cash flows from investing activities (2 832) (3 187)
Cash flow from financing activitiesWrite off of unpaid beneficiaries (4 424) —
Net cash flows from financing activities (4 424) —
Net (decrease) / increase in cash and cash equivalents 9 34 898 (66)
Cash and cash equivalent at beginning of the year 1 198 1 264
Cash and cash equivalent at end of the year 7 36 096 1 198

190 Annual Report 2010/2011 | Department of Social Development
DISASTER RELIEF FUND
Notes to the Annual Financial Statements of the Disaster Relief Fundfor the year ended 31 March 2011
1. Summary of significant accounting policies
The annual financial statements have been prepared in accordance with the Statements of Generally Accepted Accounting Practice.
The following are the principal accounting policies of the Fund which are, in all material respects, consistent with those applied in the
previous year, except as otherwise indicated.
1.1 Basis of preparation
The financial statements have been prepared on the historical cost basis.
1.2 Currency
These financial statements are presented in South African Rands.
1.3 Revenue recognition
Revenue is recognised when it is probable that future economic benefits will flow to the fund and these benefits can be measured reliably.
Interest income is accrued on a time proportion basis, taking into account the principal outstanding and the effective interest rate over
the period to maturity.
1.4 Irregular and fruitless and wasteful expenditure
Irregular expenditure means expenditure incurred in contravention of, or not in accordance with, a requirement of any applicable legislation.
Fruitless and wasteful expenditure means expenditure that was made in vain and would have been avoided had reasonable care been
exercised.
All irregular and fruitless and wasteful expenditure is charged against income in the period in which they are incurred.
1.5 Investments
Investments are shown at cost including interest capitalised.
1.6 Comparative figures
Where necessary, comparative figures have been adjusted to conform to changes in presentation in the current year.
1.7 Financial instruments
Recognition
Financial assets and liabilities are recognised in the balance sheet when the Fund becomes a party to the contractual provisions of the
instrument.
Measurement
Financial instruments are initially measured at cost, which includes transaction cost. Subsequent to initial recognition these instruments
are measured as set out below.
Financial assets
The Fund’s principle financial assets are investments.
Investments
The investments are measured at subsequent reporting dates at amortised cost by using the effective interest rate method if they have a
fixed maturity, or at cost if there is no fixed maturity.
Trade and other receivables
Trade and other receivables are stated at their normal value as reduced by appropriate allowances for estimated irrecoverable amounts.
Cash and cash equivalents
Cash and cash equivalents are measured at fair value.
Financial liabilities
The Fund’s principle financial liabilities are accounts payable.
All financial liabilities are measured at amortised cost, comprising original debt less principle payments and amortisations.

DISASTER RELIEF FUND
Department of Social Development | Annual Report 2010/2011 191
2010/11 2009/10
R’000 R’000
2. RevenueInterest received 2 833 3 187
National Lottery Board 35 000 —
High School Vorentoe (Disaster Fund – Account closed 26 August 2010) 150 —
Stale cheques 4 425 —
Total 42 408 3 187
3. Administrative expenditureInvestment levy 4 4
Fees for services
– Board members 136 29
Entertainment 14 7
Bank charges 1 2
155 42
4. Audit fees 8 10
5. Other operating expensesTravel and subsistence 26 10
Maintenance — 2
Printing and stationery 21 —
Training 40 —
Computer services 4 —
Total 91 12
6. Financial assetsCost 45 754 42 567
Additions during the year 2 830 3 187
Closing balance 48 584 45 754
7. Cash and cash equivalentsCash and balances with banks 36 096 1 198
Total 36 096 1 198
8. Trade and other payablesTrade creditors — 4 426
Total — 4 426
9. Cash generated from/(utilised in) operationsSurplus/(deficit) before tax 42 154 3 123
(Interest received) (2 832) (3 187)
Non-cash movements/working capital changes (4 424) (2)
Increase/(decrease) in payables (4 424) 3
(Increase)/decrease in investment due to revaluation — (5)
Net cash flow from operating activities 34 898 (66)

192 Annual Report 2010/2011 | Department of Social Development
REPORT OF THE AUDITOR-GENERAL TO PARLIAMENT ON THE REFUGEE RELIEF FUND
Aud i t i ng to bu i ld pub l i c confidence
REPORT ON THE FINANCIAL STATEMENTS
IntroductionI have audited the accompanying financial statements of the
Refugee Relief Fund, which comprise the statement of financial
position as at 31 March 2011 and the statement of financial
performance, statement of changes in net assets and cash flow
statement for the year then ended, a summary of significant
accounting policies and other explanatory information as set out
on pages 193 to 196.
Accounting Officer’s responsibility for the
financial statementsThe accounting officer is responsible for the preparation and
fair presentation of these financial statements in accordance
with South African Statements of Generally Accepted Accounting
Practice and in the manner required by the Auditor-General’s
Directive (General Notice 1111 of 2010 issued in Government
Gazette 33872 of 15 December 2010), the Fund Raising Act
of South Africa, and for such internal control as management
determines necessary to enable the preparation of financial
statements that are free from material misstatement, whether due
to fraud or error.
Auditor-General’s responsibilityAs required by section 188 of the Constitution of the Republic
of South Africa, 1996 (Act No. 108 of 1996) and section 4 of
the Public Audit Act of South Africa, 2004 (Act No. 25 of 2004)
(PAA), my responsibility is to express an opinion on these financial
statements based on my audit.
I conducted my audit in accordance with International Standards
on Auditing and General Notice 1111 of 2010 issued in
Government Gazette 33872 of 15 December 2010. Those
standards require that I comply with ethical requirements and
plan and perform the audit to obtain reasonable assurance
about whether the financial statements are free from material
misstatement.
An audit involves performing procedures to obtain audit evidence
about the amounts and disclosures in the financial statements.
The procedures selected depend on the auditor’s judgement,
including the assessment of the risks of material misstatement
of the financial statements, whether due to fraud or error. In
making those risk assessments, the auditor considers internal
control relevant to the entity’s preparation and fair presentation of
the financial statements in order to design audit procedures that
are appropriate in the circumstances, but not for the purpose of
expressing an opinion on the effectiveness of the entity’s internal
control. An audit also includes evaluating the appropriateness of
accounting policies used and the reasonableness of accounting
estimates made by management, as well as evaluating the overall
presentation of the financial statements.
I believe that the audit evidence I have obtained is sufficient and
appropriate to provide a basis for my audit opinion.
OpinionIn my opinion, the financial statements present fairly, in all
material respects, the financial position of the Refugee Relief
Fund as at 31 March 2011, and its financial performance and
cash flows for the year then ended, in accordance with the South
African Statements of Generally Accepted Accounting Practice
and the requirements of section 22(7) of the Fund Raising Act of
South Africa.
Pretoria
31 July 2011
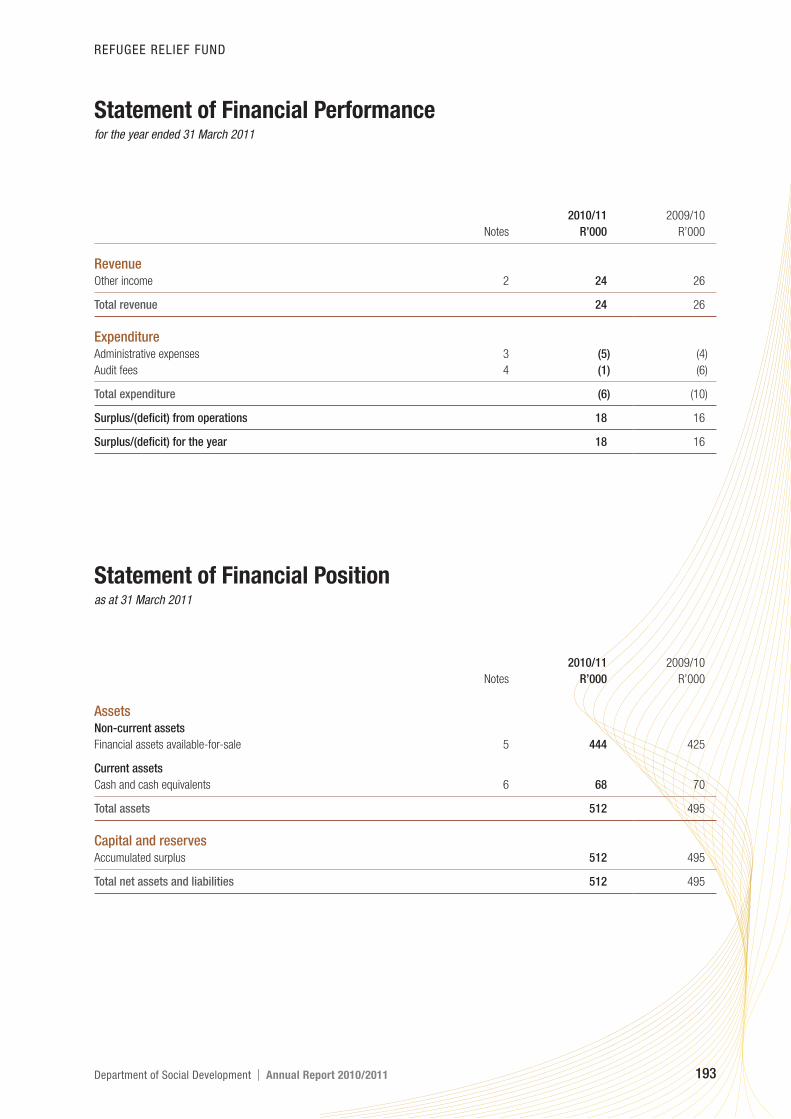
REFUGEE RELIEF FUND
Department of Social Development | Annual Report 2010/2011 193
Statement of Financial Performancefor the year ended 31 March 2011
Statement of Financial Positionas at 31 March 2011
2010/11 2009/10
Notes R’000 R’000
RevenueOther income 2 24 26
Total revenue 24 26
ExpenditureAdministrative expenses 3 (5) (4)
Audit fees 4 (1) (6)
Total expenditure (6) (10)
Surplus/(deficit) from operations 18 16
Surplus/(deficit) for the year 18 16
2010/11 2009/10
Notes R’000 R’000
AssetsNon-current assets
Financial assets available-for-sale 5 444 425
Current assets
Cash and cash equivalents 6 68 70
Total assets 512 495
Capital and reservesAccumulated surplus 512 495
Total net assets and liabilities 512 495

194 Annual Report 2010/2011 | Department of Social Development
REFUGEE RELIEF FUND
Statement of Changes in Net Assetsas at 31 March 2011
Cash Flow Statementfor the year ended 31 March 2011
Accumulated
funds
R’000
Balance as at 1 April 2009 479
Surplus for the year 16
Balance as at 31 March 2010 495
Surplus for the year 18
Interest rounding off (1)
Balance as at 31 March 2011 512
2010/11 2009/10
Notes R’000 R’000
Cash flows from operating activitiesCash paid to suppliers and employees 7 (6) (10)
Cash generated from/(utilised in) operations (6) (10)
Interest received 24 26
Net cash inflow/(outflow) from operating activities 18 16
Cash flow from investing activitiesTrading investments (20) (24)
Net cash flows from investing activities (20) (24)
Net (decrease)/increase in cash and cash equivalents (2) (8)
Cash and cash equivalent at beginning of the year 70 78
Cash and cash equivalent at end of the year 6 68 70

REFUGEE RELIEF FUND
Department of Social Development | Annual Report 2010/2011 195
Notes to the Annual Financial Statements of the Refugee Relief Fundfor the year ended 31 March 2011
1. Summary of significant accounting policiesThe annual financial statements have been prepared in accordance with the Statements of Generally Accepted Accounting Practice.
The following are the principal accounting policies of the Fund which are, in all material respects, consistent with those applied in the
previous year, except as otherwise indicated.
1.1 Basis of preparation
The financial statements have been prepared on the historical cost basis.
1.2 Currency
These financial statements are presented in South African Rands.
1.3 Revenue recognition
Revenue is recognised when it is probable that future economic benefits will flow to the fund and these benefits can be measured reliably.
Interest income is accrued on a time proportion basis, taking into account the principal outstanding and the effective interest rate over
the period to maturity.
1.4 Irregular and fruitless and wasteful expenditure
Irregular expenditure means expenditure incurred in contravention of, or not in accordance with, a requirement of any applicable
legislation.
Fruitless and wasteful expenditure means expenditure that was made in vain and would have been avoided had reasonable care been
exercised.
All irregular and fruitless and wasteful expenditure is charged against income in the period in which they are incurred.
1.5 Investments
Investments are shown at cost including interest capitalised.
1.6 Comparative figures
Where necessary, comparative figures have been adjusted to conform to changes in presentation in the current year.
1.7 Financial instruments
Recognition
Financial assets and liabilities are recognised in the balance sheet when the Fund becomes a party to the contractual provisions of the
instrument.
Measurement
Financial instruments are initially measured at cost, which includes transaction cost. Subsequent to initial recognition these instruments
are measured as set out below.
Financial assets
The Fund’s principle financial assets are investments.
Investments
The investments are measured at subsequent reporting dates at amortised cost by using the effective interest rate method if they have a
fixed maturity or at cost if there is no fixed maturity.
Trade and other receivables
Trade and other receivables are stated at their normal value as reduced by appropriate allowances for estimated irrecoverable amounts.
Cash and cash equivalents
Cash and cash equivalents are measured at fair value.
Financial Liabilities
The Fund’s principle financial liabilities are accounts payable.
All financial liabilities are measured at amortised cost, comprising original debt less principle payments and amortisations.

196 Annual Report 2010/2011 | Department of Social Development
REFUGEE RELIEF FUND
Notes to the Annual Financial Statements of the Refugee Relief Fundfor the year ended 31 March 2011
2010/11 2009/10
R’000 R’000
2. RevenueInterest received 24 26
Total 24 26
3. Administrative expenditureBank charges 1 1
Management 4 3
Total 5 4
4. Audit fees 1 6
5. Financial assetsCost 424 402
Additions/disposals for the year 20 23
Closing balance 444 425
6. Cash and cash equivalentsCash and balances with banks 68 70
Total 68 70
7. Cash generated from/(utilised in) operationsSurplus/(deficit) before tax 18 16
(Interest received) (24) (26)
Net cash flow from operating activities (6) (10)

Department of Social Development | Annual Report 2010/2011 197
Aud i t i ng to bu i ld pub l i c confidence
REPORT OF THE AUDITOR-GENERAL TO PARLIAMENT ON THE SOCIAL RELIEF FUND
REPORT ON THE FINANCIAL STATEMENTS
IntroductionI have audited the accompanying financial statements of the
Social Relief Fund, which comprise the statement of financial
position as at 31 March 2011 and the statement of financial
performance, statement of changes in net assets and cash flow
statement for the year then ended, a summary of significant
accounting policies and other explanatory information as set out
on pages 198 to 201.
Accounting Officer’s responsibility for the
financial statementsThe accounting officer is responsible for the preparation and
fair presentation of these financial statements in accordance
with South African Statements of Generally Accepted Accounting
Practice and in the manner required by the Auditor-General’s
Directive (General Notice 1111 of 2010 issued in Government
Gazette 33872 of 15 December 2010), the Fund Raising Act
of South Africa, and for such internal control as management
determines necessary to enable the preparation of financial
statements that are free from material misstatement, whether due
to fraud or error.
Auditor-General’s responsibilityAs required by section 188 of the Constitution of the Republic
of South Africa, 1996 (Act No. 108 of 1996) and section 4 of
the Public Audit Act of South Africa, 2004 (Act No. 25 of 2004)
(PAA), my responsibility is to express an opinion on these financial
statements based on my audit.
I conducted my audit in accordance with International Standards
on Auditing and General Notice 1111 of 2010 issued in
Government Gazette 33872 of 15 December 2010. Those
standards require that I comply with ethical requirements and
plan and perform the audit to obtain reasonable assurance
about whether the financial statements are free from material
misstatement.
An audit involves performing procedures to obtain audit evidence
about the amounts and disclosures in the financial statements.
The procedures selected depend on the auditor’s judgement,
including the assessment of the risks of material misstatement
of the financial statements, whether due to fraud or error. In
making those risk assessments, the auditor considers internal
control relevant to the entity’s preparation and fair presentation of
the financial statements in order to design audit procedures that
are appropriate in the circumstances, but not for the purpose of
expressing an opinion on the effectiveness of the entity’s internal
control. An audit also includes evaluating the appropriateness of
accounting policies used and the reasonableness of accounting
estimates made by management, as well as evaluating the overall
presentation of the financial statements.
I believe that the audit evidence I have obtained is sufficient and
appropriate to provide a basis for my audit opinion.
OpinionIn my opinion, the financial statements present fairly, in all material
respects, the financial position of the Social Relief Fund as at 31
March 2011, and its financial performance and cash flows for the
year then ended, in accordance with the South African Statements
of Generally Accepted Accounting Practice and the requirements
of section 22(7) of the Fund Raising Act of South Africa.
Pretoria
31 July 2011

198 Annual Report 2010/2011 | Department of Social Development
SOCIAL RELIEF FUND
Statement of Financial Performancefor the year ended 31 March 2011
Statement of Financial Positionas at 31 March 2011
2010/11 2009/10
Notes R’000 R’000
RevenueOther income 2 1 389 1 567
Total revenue 1 389 1 567
ExpenditureAdministrative expenses 3 (1) —
Audit fees 4 (1) (6)
Total expenditure (2) (6)
Surplus/(deficit) from operations 1 387 1 561
Surplus/(deficit) for the year 1 387 1 561
2010/11 2009/10
Notes R’000 R’000
AssetsNon-current assets
Financial assets available-for-sale 5 23 782 22 393
Current assets
Cash and cash equivalents 6 8 10
Total assets 23 790 22 403
Capital and reservesAccumulated surplus 23 790 22 403
Total net assets
Total net assets and liabilities 23 790 22 403

SOCIAL RELIEF FUND
Department of Social Development | Annual Report 2010/2011 199
Statement of Changes in Net Assetsas at 31 March 2011
Cash Flow Statementfor the year ended 31 March 2011
Accumulated
funds
R’000
Balance as at 1 April 2009 20 842
Surplus for the year 1 561
Balance as at 31 March 2010 22 403
Surplus for the year 1 387
Balance as at 31 March 2011 23 790
2010/11 2009/10
Notes R’000 R’000
Cash flows from operating activitiesCash paid to suppliers and employees 7 (2) (6)
Cash generated from/(utilised in) operations (2) (6)
Interest received 1 389 1 567
Net cash inflow/(outflow) from operating activities 1 387 1 561
Cash flow from investing activitiesTrading investments (1 389) (1 557)
Net cash flows from investing activities (1 389) (1 557)
Net (decrease)/increase in cash and cash equivalents (2) 4
Cash and cash equivalent at beginning of the year 10 6
Cash and cash equivalent at end of the year 8 10

200 Annual Report 2010/2011 | Department of Social Development
SOCIAL RELIEF FUND
Notes to the Annual Financial Statements of the Social Relief Fundfor the year ended 31 March 2011
1. Summary of significant accounting policiesThe annual financial statements have been prepared in accordance with the Statements of Generally Accepted Accounting Practice.
The following are the principal accounting policies of the Fund which are, in all material respects, consistent with those applied in the
previous year, except as otherwise indicated.
1.1 Basis of preparation
The financial statements have been prepared on the historical cost basis.
1.2 Currency
These financial statements are presented in South African Rands.
1.3 Revenue recognition
Revenue is recognised when it is probable that future economic benefits will flow to the fund and these benefits can be measured reliably.
Interest income is accrued on a time proportion basis, taking into account the principal outstanding and the effective interest rate over
the period to maturity.
1.4 Irregular and fruitless and wasteful expenditure
Irregular expenditure means expenditure incurred in contravention of, or not in accordance with, a requirement of any applicable
legislation.
Fruitless and wasteful expenditure means expenditure that was made in vain and would have been avoided had reasonable care been
exercised.
All irregular and fruitless and wasteful expenditure is charged against income in the period in which they are incurred.
1.5 Investments
Investments are shown at cost including interest capitalised.
1.6 Comparative figures
Where necessary, comparative figures have been adjusted to conform to changes in presentation in the current year.
1.7 Financial instruments
Recognition
Financial assets and liabilities are recognised in the balance sheet when the Fund becomes a party to the contractual provisions of the
instrument.
Measurement
Financial instruments are initially measured at cost, which includes transaction cost. Subsequent to initial recognition these instruments
are measured as set out below.
Financial assets
The Fund’s principle financial assets are investments.
Investments
The investments are measured at subsequent reporting dates at amortised cost by using the effective interest rate method if they have a
fixed maturity or at cost if there is no fixed maturity.
Trade and other receivables
Trade and other receivables are stated at their normal value as reduced by appropriate allowances for estimated irrecoverable amounts.
Cash and cash equivalents
Cash and cash equivalents are measured at fair value.
Financial liabilities
The Fund’s principle financial liabilities are accounts payable.
All financial liabilities are measured at amortised cost, comprising original debt less principle payments and amortisations.

SOCIAL RELIEF FUND
Department of Social Development | Annual Report 2010/2011 201
2010/11 2009/10
R’000 R’000
2. RevenueInterest received 1 389 1 567
Total 1 389 1 567
3. Administrative expenditureBank charges 1 —
Total 1 —
4. Audit fees 1 6
5. Financial assetsOpening balance
Cost 22 393 20 837
Additions during the year 1 389 1 566
Transfer from assets held for training (10)
Closing balance 23 782 22 393
6. Cash and cash equivalentsCash and balances with banks 8 10
Total 8 10
7. Cash generated from/(utilised in) operationsSurplus/(deficit) before tax 1 387 1 561
(Interest received) (1 389) (1 567)
Net cash flow from operating activities (2) (6)
8. Net cash inflows/outflows from operating activitiesCash payments to suppliers and employees — (6)
Cash generated from/(utilised in) operations — (6)
Interest received 1 387 1 567
Net cash inflows/outflows from operating activities 1 387 1 561

202 Annual Report 2010/2011 | Department of Social Development
REPORT OF THE AUDITOR-GENERAL TO PARLIAMENT ON THE STATE PRESIDENT FUND
Aud i t i ng to bu i ld pub l i c confidence
REPORT ON THE FINANCIAL STATEMENTS
IntroductionI have audited the accompanying financial statements of the State
President Fund, which comprise the statement of financial position
as at 31 March 2011 and the statement of financial performance,
statement of changes in net assets and cash flow statement for
the year then ended, a summary of significant accounting policies
and other explanatory information as set out on pages 203 to 206.
Accounting Officer’s responsibility for the
financial statementsThe accounting officer is responsible for the preparation and
fair presentation of these financial statements in accordance
with South African Statements of Generally Accepted Accounting
Practice and in the manner required by the Auditor-General’s
Directive (General Notice 1111 of 2010 issued in Government
Gazette 33872 of 15 December 2010), the Fund Raising Act
of South Africa, and for such internal control as management
determines necessary to enable the preparation of financial
statements that are free from material misstatement, whether due
to fraud or error.
Auditor-General’s responsibilityAs required by section 188 of the Constitution of the Republic
of South Africa, 1996 (Act No. 108 of 1996) and section 4 of
the Public Audit Act of South Africa, 2004 (Act No. 25 of 2004)
(PAA), my responsibility is to express an opinion on these financial
statements based on my audit.
I conducted my audit in accordance with International Standards
on Auditing and General Notice 1111 of 2010 issued in
Government Gazette 33872 of 15 December 2010. Those
standards require that I comply with ethical requirements and
plan and perform the audit to obtain reasonable assurance
about whether the financial statements are free from material
misstatement.
An audit involves performing procedures to obtain audit evidence
about the amounts and disclosures in the financial statements.
The procedures selected depend on the auditor’s judgement,
including the assessment of the risks of material misstatement
of the financial statements, whether due to fraud or error. In
making those risk assessments, the auditor considers internal
control relevant to the entity’s preparation and fair presentation of
the financial statements in order to design audit procedures that
are appropriate in the circumstances, but not for the purpose of
expressing an opinion on the effectiveness of the entity’s internal
control. An audit also includes evaluating the appropriateness of
accounting policies used and the reasonableness of accounting
estimates made by management, as well as evaluating the overall
presentation of the financial statements.
I believe that the audit evidence I have obtained is sufficient and
appropriate to provide a basis for my audit opinion.
OpinionIn my opinion, the financial statements present fairly, in all
material respects, the financial position of the State President
Fund as at 31 March 2011, and its financial performance and
cash flows for the year then ended, in accordance with the South
African Statements of Generally Accepted Accounting Practice
and the requirements of section 22(7) of the Fund Raising Act of
South Africa.
Pretoria
31 July 2011

STATE PRESIDENT FUND
Department of Social Development | Annual Report 2010/2011 203
Statement of Financial Performancefor the year ended 31 March 2011
Statement of Financial Positionas at 31 March 2011
2010/11 2009/10
Notes R’000 R’000
RevenueOther income 2 1 453 1 641
Total revenue 1 453 1 641
ExpenditureAdministrative expenses 3 (1) (2)
Audit fees 4 (2) (6)
Local and assistance paid 3 (23) (30)
Total expenditure (26) (38)
Surplus/(deficit) from operations 1 427 1 603
Surplus/(deficit) for the year 1 427 1 603
2010/11 2009/10
Notes R’000 R’000
AssetsNon-current assets
Financial assets available-for-sale 5 24 860 23 439
Current assets
Cash and cash equivalents 6 9 3
Total assets 24 869 23 442
Capital and reservesAccumulated surplus 24 869 23 442
Total net assets and liabilities 24 869 23 442

204 Annual Report 2010/2011 | Department of Social Development
STATE PRESIDENT FUND
Statement of Changes in Net Assetsas at 31 March 2011
Cash Flow Statementfor the year ended 31 March 2011
Accumulated
funds
R’000
Balance as at 1 April 2009 21 839
Surplus for the year 1 603
Balance as at 31 March 2010 23 442
Surplus for the year 1 427
Balance as at 31 March 2011 24 869
2010/11 2009/10
Notes R’000 R’000
Cash flows from operating activitiesCash paid to suppliers and employees 7 (26) (38)
Cash generated from/(utilised in) operations (26) (38)
Interest received 1 453 1 641
Net cash inflow/(outflow) from operating activities 1 427 1 603
Cash flow from investing activitiesTrading investments (1 453) (1 604)
Transfer to ABSA bank 32
Net cash flows from investing activities (1 421) (1 604)
Net (decrease)/increase in cash and cash equivalents 6 (1)
Cash and cash equivalent at beginning of the year 3 4
Cash and cash equivalent at end of the year 7 9 3

STATE PRESIDENT FUND
Department of Social Development | Annual Report 2010/2011 205
Notes to the Annual Financial Statements of the State President Fundfor the year ended 31 March 2011
1. Summary of significant accounting policiesThe annual financial statements have been prepared in accordance with the Statements of Generally Accepted Accounting Practice.
The following are the principal accounting policies of the Fund which are, in all material respects, consistent with those applied in the
previous year, except as otherwise indicated.
1.1 Basis of preparation
The financial statements have been prepared on the historical cost basis.
1.2 Currency
These financial statements are presented in South African Rands.
1.3 Revenue recognition
Revenue is recognised when it is probable that future economic benefits will flow to the fund and these benefits can be measured reliably.
Interest income is accrued on a time proportion basis, taking into account the principal outstanding and the effective interest rate over
the period to maturity.
1.4 Irregular and fruitless and wasteful expenditure
Irregular expenditure means expenditure incurred in contravention of, or not in accordance with, a requirement of any applicable
legislation.
Fruitless and wasteful expenditure means expenditure that was made in vain and would have been avoided had reasonable care been
exercised.
All irregular and fruitless and wasteful expenditure is charged against income in the period in which they are incurred.
1.5 Investments
Investments are shown at cost including interest capitalised.
1.6 Comparative figures
Where necessary, comparative figures have been adjusted to conform to changes in presentation in the current year.
1.7 Financial instruments
Recognition
Financial assets and liabilities are recognised in the balance sheet when the Fund becomes a party to the contractual provisions of the
instrument.
Measurement
Financial instruments are initially measured at cost, which includes transaction cost. Subsequent to initial recognition these instruments
are measured as set out below.
Financial assets
The Fund’s principle financial assets are investments.
Investments
The investments are measured at subsequent reporting dates at amortised cost by using the effective interest rate method if they have a
fixed maturity, or at cost if there is no fixed maturity.
Trade and other receivables
Trade and other receivables are stated at their normal value as reduced by appropriate allowances for estimated irrecoverable amounts.
Cash and cash equivalents
Cash and cash equivalents are measured at fair value.
Financial liabilities
The Fund’s principle financial liabilities are accounts payable.
All financial liabilities are measured at amortised cost, comprising original debt less principle payments and amortisations.

206 Annual Report 2010/2011 | Department of Social Development
STATE PRESIDENT FUND
Notes to the Annual Financial Statements of the State President Fundfor the year ended 31 March 2011
2010/11 2009/10
R’000 R’000
2. RevenueInterest received 1 453 1 641
Total 1 453 1 641
3. Administrative expenditureBank charges 1 2
Financial assistance 23 30
Total 24 32
4. Audit fees 2 6
5. Financial assetsOpening balance
Cost 23 439 21 835
Additions during the year 1 453 1 641
Financial assets available-for-sale (32) (37)
Closing balance 24 860 23 439
6. Cash and cash equivalentsCash and balances with banks 9 3
Total 9 3
7. Cash generated from/(utilised in) operationsSurplus/(deficit) before tax 1 427 1 603
(Interest received) (1 453) (1 641)
Net cash flow from operating activities (26) (38)

Department of Social Development | Annual Report 2010/2011 207
risk assessments, the auditor considers internal control relevant
to the entity’s preparation and fair presentation of the financial
statements in order to design audit procedures that are appropriate
in the circumstances, but not for the purpose of expressing an
opinion on the effectiveness of the entity’s internal control. An audit
also includes evaluating the appropriateness of accounting policies
used and the reasonableness of accounting estimates made by
management, as well as evaluating the overall presentation of the
financial statements.
I believe that the audit evidence I have obtained is sufficient and
appropriate to provide a basis for my audit opinion.
OpinionIn my opinion, the financial statements present fairly, in all
material respects, the financial position of the High School
Vorentoe Disaster Fund as at 26 August 2010, and its financial
performance and cash flows for the period then ended, in
accordance with the South African Statements of Generally
Accepted Accounting Practice and the requirements of section
22(7) of the Fund Raising Act of South Africa.
Emphasis of matterI draw attention to the matter below. My opinion is not modified in
respect of this matter.
Closing of the fundThe fund was closed on 26 August 2010 and all the funds were
subsequently transferred to the Disaster Relief Fund.
Pretoria
31 July 2011
Aud i t i ng to bu i ld pub l i c confidence
REPORT OF THE AUDITOR-GENERAL TO PARLIAMENT ON THE HIGH SCHOOL VORENTOE DISASTER FUND
REPORT ON THE FINANCIAL STATEMENTS
IntroductionI have audited the accompanying financial statements of the High
School Vorentoe Disaster Fund, which comprise the statement
of financial position as at 26 August 2010 and the statement of
financial performance, statement of changes in net assets and
cash flow statement for the period then ended, a summary of
significant accounting policies and other explanatory information
as set out on pages 208 to 211.
Accounting authority’s responsibility for the
financial statementsThe accounting authority is responsible for the preparation and
fair presentation of these financial statements in accordance
with South African Statements of Generally Accepted Accounting
Practice and in the manner required by the Auditor-General’s
Directive (General Notice 1111 of 2010 issued in Government
Gazette 33872 of 15 December 2010), the Fund Raising Act
of South Africa, and for such internal control as management
determines necessary to enable the preparation of financial
statements that are free from material misstatement, whether due
to fraud or error.
Auditor-General’s responsibilityAs required by section 188 of the Constitution of the Republic
of South Africa, 1996 (Act No. 108 of 1996) and section 4 of
the Public Audit Act of South Africa, 2004 (Act No. 25 of 2004)
(PAA), my responsibility is to express an opinion on these financial
statements based on my audit.
I conducted my audit in accordance with International Standards on
Auditing and General Notice 1111 of 2010 issued in Government
Gazette 33872 of 15 December 2010. Those standards require
that I comply with ethical requirements and plan and perform the
audit to obtain reasonable assurance about whether the financial
statements are free from material misstatement.
An audit involves performing procedures to obtain audit evidence
about the amounts and disclosures in the financial statements. The
procedures selected depend on the auditor’s judgement, including
the assessment of the risks of material misstatement of the
financial statements, whether due to fraud or error. In making those

208 Annual Report 2010/2011 | Department of Social Development
HIGH SCHOOL VORENTOE DISASTER FUND
Statement of Financial Performancefor the period ended 26 August 2010
Statement of Financial Positionas at 26 August 2010
2010/11 2009/10
Notes R’000 R’000
RevenueOther income 2 1 3
Total revenue 1 3
ExpenditureAdministrative expenditure 3 — (1)
Audit fees 3 — (3)
Total expenditure — (4)
Surplus/(deficit) from operations 1 (1)
Surplus/(deficit) for the year 1 (1)
2010/11 2009/10
Notes R’000 R’000
AssetsNon-current assets
Financial assets available-for-sale 5 — 149
Total assets — 149
Capital and reservesAccumulated surplus — 149
Total net assets and liabilities — 149

HIGH SCHOOL VORENTOE DISASTER FUND
Department of Social Development | Annual Report 2010/2011 209
Statement of Changes in Net Assetsas at 26 August 2010
Cash Flow Statementfor the period ended 26 August 2010
Accumulated
funds
R’000
Balance as at 1 April 2009 149
Surplus/(deficit) for the year (1)
Net gains/(losses) not recognised in the statement of financial performance 1
Balance as at 31 March 2010 149
Surplus for the year 1
Transfer to Disaster Relief Fund (150)
Balance as at 26 August 2010 0
2010/11 2009/10
Notes R’000 R’000
Cash flows from operating activitiesCash paid to suppliers and employees 6 — (3)
Interest paid/(received) 1 3
Cash generated from/(utilised in) operations 1 —
Interest received (1) (3)
Net cash inflow/(outflow) from operating activities — (3)
Net (decrease)/increase in cash and cash equivalents — (3)
Cash and cash equivalent at beginning of the year 3
Cash and cash equivalent at end of the year — —

210 Annual Report 2010/2011 | Department of Social Development
HIGH SCHOOL VORENTOE DISASTER FUND
Notes to the Annual Financial Statements of the High School Vorentoe Disaster Fundfor the year ended 31 March 2011
1. Summary of significant accounting policiesThe annual financial statements have been prepared in accordance with the Statements of Generally Accepted Accounting Practice.
The following are the principal accounting policies of the Fund which are, in all material respects, consistent with those applied in the
previous year, except as otherwise indicated.
1.1 Basis of preparation
The financial statements have been prepared on the historical cost basis.
1.2 Currency
These financial statements are presented in South African Rands.
1.3 Revenue recognition
Revenue is recognised when it is probable that future economic benefits will flow to the fund and these benefits can be measured reliably.
Interest income is accrued on a time proportion basis, taking into account the principal outstanding and the effective interest rate over
the period to maturity.
1.4 Irregular and fruitless and wasteful expenditure
Irregular expenditure means expenditure incurred in contravention of, or not in accordance with, a requirement of any applicable
legislation.
Fruitless and wasteful expenditure means expenditure that was made in vain and would have been avoided had reasonable care been
exercised.
All irregular and fruitless and wasteful expenditure is charged against income in the period in which they are incurred.
1.5 Investments
Investments are shown at cost including interest capitalised.
1.6 Comparative figures
Where necessary, comparative figures have been adjusted to conform to changes in presentation in the current year.
1.7 Financial instruments
Recognition
Financial assets and liabilities are recognised in the balance sheet when the Fund becomes a party to the contractual provisions of the
instrument.
Measurement
Financial instruments are initially measured at cost, which includes transaction cost. Subsequent to initial recognition these instruments
are measured as set out below.
Financial assets
The Fund’s principle financial assets are investments.
Investments
The investments are measured at subsequent reporting dates at amortised cost by using the effective interest rate method if they have a
fixed maturity, or at cost if there is no fixed maturity.
Trade and other receivables
Trade and other receivables are stated at their normal value as reduced by appropriate allowances for estimated irrecoverable amounts.
Cash and cash equivalents
Cash and cash equivalents are measured at fair value.
Financial liabilities
The Fund’s principle financial liabilities are accounts payable.
All financial liabilities are measured at amortised cost, comprising original debt less principle payments and amortisations.
1.8 Going concern
The annual financial statements have been prepared on the going concern basis as the fund was closed on 26 August 2010 and the funds
(R149 949) available were transferred to the Disaster Relief Fund.

HIGH SCHOOL VORENTOE DISASTER FUND
Department of Social Development | Annual Report 2010/2011 211
2010/11 2009/10
R’000 R’000
2. RevenueInterest received 1 3
Total 1 3
3. Administrative expenditureBank charges — 1
Total — 1
4. Audit fees — 3
5. Financial assetsOpening balance
Cost 149 146
Additions during the year 1 3
Transfer to Disaster Relief (150)
Closing balance — 149
6. Cash generated from/(utilised in) operationsSurplus/(deficit) before tax 1 (1)
(Interest received) (3)
Net cash flow from operating activities 1 (4)


Human Resources Oversight
Part
E

214 Annual Report 2010/2011 | Department of Social Development
DEPARTMENT OF SOCIAL DEVELOPMENT VOTE 18
Chief Directorate: Financial Planning and Monitoring
Service delivery progress, April 2010 to March 2011
Table 1.1: Main service delivery improvement and standardså
Main services Actual customers
Potential
customers Standards of service Actual achievement against standards
Identification of social
development sectoral
MTEF priorities
Provincial Departments
of Social Development
Quantity Once a year MTEF priorities for 2011/12 were identified.
Costing of revised
and/or new
policies, legislation,
programmes and
projects
National and provincial
Departments of Social
Development
Quantity Ongoing, but summarised
detailed financial
implication for each of the
MTEF years once a year
for each service area
Costing assistance was provided in respect
of the following:
gender policy
disability policy
cluster foster care
staff and operational costs for Information
technology and the Ministry
departmental communication strategy
international trips
hosting HSS meetings
MTEF inputs
Monitoring of social
development sector
financial performance
National and provincial
Departments of Social
Development
Quantity Monthly and quarterly Provincial expenditure trends were analysed
on a monthly and quarterly basis, and
reported as and when required.
The financial performance of entities was
monitored on a monthly basis and reported
on.
The spending trends on social assistance
transfer funds was monitored on a monthly
basis and reported on.
Table 1.2: Consultation arrangements for customers
Type of
arrangement Actual customers
Potential
customers Standards of service Actual achievement against standards
Identification of social
development sectoral
MTEF priorities
Provincial Departments
of Social Development
Consultations (on administrative and
political level) with key stakeholders (Heads
of Departments of Social Development
and National DDGs, Minister, and MECs)
to agree on Social Development MTEF
priorities in line with government plan of
action and mandate for the sector
2011/12 MTEF priorities for Social
Development were discussed with key
stakeholders.
Costing of revised
and/or new
policies, legislation,
programmes and
projects
National and provincial
Departments of Social
Development
Consultations (on administrative and
political level) with key stakeholders
(Heads of Departments of Social
Development, other government
fepartments, local government, national
and international Institutions, ministers,
MECs, and Cabinet) on cost implications
Meetings and workshops were held with
relevant stakeholders on costing the financial
implications of social assistance and disability
policy.
Monitoring of social
development sector
financial performance
National and provincial
Departments of Social
Development
Consultations (on administrative and
political level) with key stakeholders (Heads
of Departments of Social Development
and national DDGs, Minister, and MECs)
on the financial performance of the social
development sector
The financial performance of the social
sector was monitored on a monthly basis
and discussed at regular meetings with
the chief financial officers of the provincial
Departments of Social Development as well
as Entities.
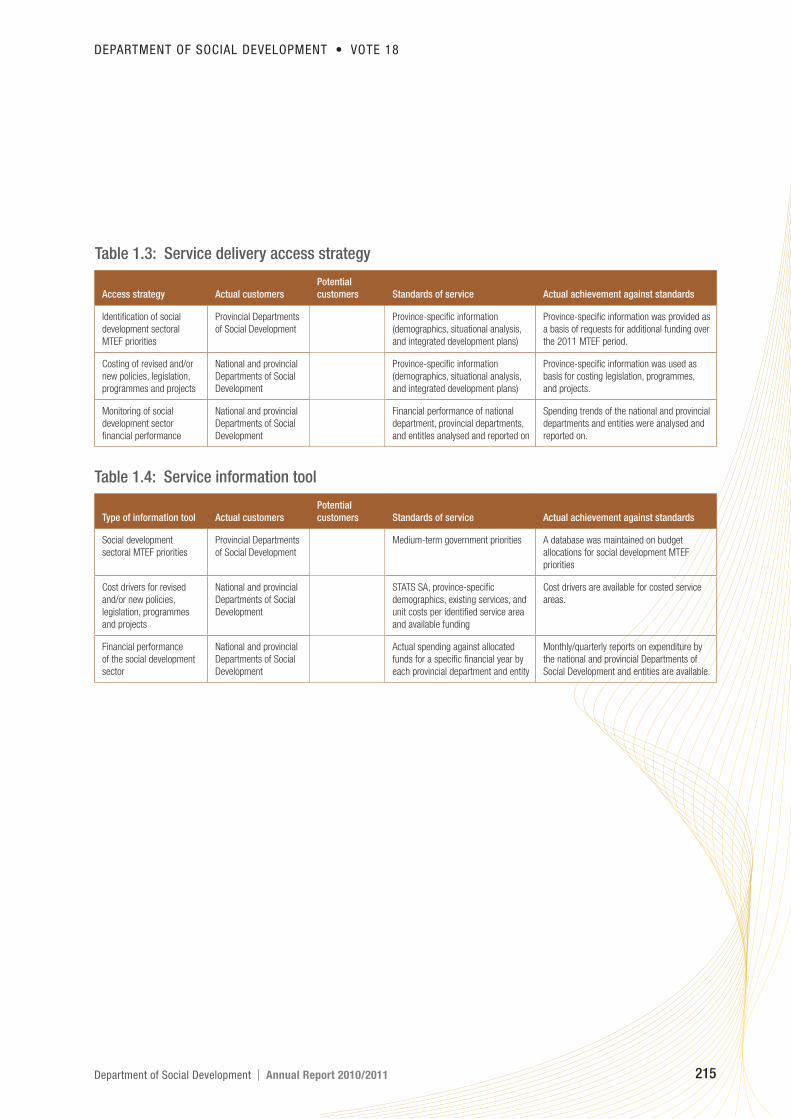
DEPARTMENT OF SOCIAL DEVELOPMENT VOTE 18
Department of Social Development | Annual Report 2010/2011 215
Table 1.3: Service delivery access strategy
Access strategy Actual customers
Potential
customers Standards of service Actual achievement against standards
Identification of social
development sectoral
MTEF priorities
Provincial Departments
of Social Development
Province-specific information
(demographics, situational analysis,
and integrated development plans)
Province-specific information was provided as
a basis of requests for additional funding over
the 2011 MTEF period.
Costing of revised and/or
new policies, legislation,
programmes and projects
National and provincial
Departments of Social
Development
Province-specific information
(demographics, situational analysis,
and integrated development plans)
Province-specific information was used as
basis for costing legislation, programmes,
and projects.
Monitoring of social
development sector
financial performance
National and provincial
Departments of Social
Development
Financial performance of national
department, provincial departments,
and entitles analysed and reported on
Spending trends of the national and provincial
departments and entities were analysed and
reported on.
Table 1.4: Service information tool
Type of information tool Actual customers
Potential
customers Standards of service Actual achievement against standards
Social development
sectoral MTEF priorities
Provincial Departments
of Social Development
Medium-term government priorities A database was maintained on budget
allocations for social development MTEF
priorities
Cost drivers for revised
and/or new policies,
legislation, programmes
and projects
National and provincial
Departments of Social
Development
STATS SA, province-specific
demographics, existing services, and
unit costs per identified service area
and available funding
Cost drivers are available for costed service
areas.
Financial performance
of the social development
sector
National and provincial
Departments of Social
Development
Actual spending against allocated
funds for a specific financial year by
each provincial department and entity
Monthly/quarterly reports on expenditure by
the national and provincial Departments of
Social Development and entities are available.

216 Annual Report 2010/2011 | Department of Social Development
DEPARTMENT OF SOCIAL DEVELOPMENT VOTE 18
Chief Directorate: Financial Administration
Service delivery progress, April 2010 to March 2011
Table 1.1: Main service delivery improvement and standards
Main services Actual customers Potential customers Standards of service Actual achievement against standards
Provide financial policies
and procedures to
Departmental officials
Departmental officials Other Departmental
stakeholders, service
providers and partners
Financial policies and
procedures updated and
distributed to Departmental
officials every two years, or
as and when updated
All the necessary financial policies and procedures
were updated and issued to staff members via
the Departmental intranet. Prioritised policies were
developed and submitted to the finance review
committee for approval.
Turnaround time in
processing payments
Service providers,
Departmental officials
and partners
Other government
departments and clients
Number of invoices paid
within 30 days of receipt
Service providers were paid more rapidly.
Outstanding invoices from service providers were
regularly followed up. The introduction of an invoice
register allowed suppliers to be paid within 30 days.
Table 1.2: Consultation arrangements for customers
Type of arrangement Actual customers Potential customers Standards of service Actual achievement against standards
Provide financial policies
and procedures to
Departmental officials
Departmental officials Other departmental
stakeholders and clients
Financial policies and
procedures updated and
distributed to Departmental
officials every two years or
as and when updated
All the necessary financial policies and procedures
were updated and issued to staff members via the
Departmental intranet. Prioritised policies were
developed and submitted for approval to the finance
review committee.
Turnaround time to
process payment
Service providers Other government
departments and clients
Invoices paid within
30 days of receipt
Service providers were paid more rapidly.
Oustanding invoices were regularly followed up.
The introduction of an invoice register helped to
allow suppliers to be paid within 30 days.
Table 1.3: Service delivery access strategy
Access strategy Actual customers Potential customers Standards of service Actual achievement against standards
Provide financial policies
and procedures to
Departmental officials
Departmental officials Other government
departments and clients
Full access All the necessary financial policies and procedures
were updated and issued to staff members via the
Departmental intranet. Prioritised policies were
developed and submitted to the finance review
committee for approval.
Time taken to process
payments
Departmental officials
and service providers
Other government
departments and clients
Access Servicie providers were paid more rapidly.
Outstanding invoices were regularly followed up.
The introduction of an invoice register allowed
suppliers to be paid within 30 days.
Table 1.4: Service information tool
Type of information tool Actual customers Potential customers Standards of service Actual achievement against standards
Provide financial policies
and procedures to
Departmental officials
Departmental officials
and service providers
Other government
departments and clients
All policies and procedures
loaded on the intranet
All necessary financial policies and procedures
were updated and issued to staff members via
the Departmental intranet. Prioritised policies
were developed and referred to the finance
review committee for approval.
Time taken to process
payments
Departmental officials
and service providers
Other government
departments and clients
Invoices paid within 30 days
of receipt
Service providers were paid more rapidly.
Outstanding invoices were regularly followed
up. The introduction of an invoiced register
allowed suppliers to be paid within 30 days.

DEPARTMENT OF SOCIAL DEVELOPMENT VOTE 18
Department of Social Development | Annual Report 2010/2011 217
Directorate: Service Standards
Service delivery progress, April 2010 to March 2011
Table 1.1: Main service delivery improvement and standards
Main services Actual customers Potential customers Standard of service Actual achievement against standards
Improve welfare
service delivery by
developing, piloting
and implementing
norms and standards
for social welfare
services
National Department of
Social Development
Provincial Departments of
Social Development
NGOs
Other departments
providing social welfare
services
Institutions of higher
learning
Document the redesigned
generic processes for social
welfare services
Generic processes for social welfare
services were finalised, verified and
documented in eight provinces.
Develop norms and standards
for social welfare services
Norms and standards for social welfare
services were developed and costed.
A human resources model for social
welfare services ws developed.
An architectural framework for delivering
social welfare services was developed.
Capacitate 500 stakeholders on
generic norms and standards
1 000 social service professionals were
capacitated on the generic norms and
standards and business processes for
social welfare services.
Facilitate the approval of social
welfare services framework
The draft social welfare services
framework was presented to the DDG
Forum, Welfare Services Forum, and
MANCO.
Ensure effective
management of
the social work
scholarship
programme
Needy students
from disadvantaged
communities
Institutions of higher
learning
Communities
Develop a national plan of action
for managing the scholarship
programme
A national plan of action for managing the
scholarship programme was developed
and approved by the HSS. Provincial plans
were developed in all nine provinces, and
the provinces were requested to align
recruitment with their staff establishments
and staffing needs.
Establish a joint management
forum for managing the
scholarship programme
A joint management forum comprising
human resources, welfare services forum
managers, and the Association of South
African Social Work Education Institutions
(ASASWEI) was established.
Marketing the social
work profession
Unemployed youths Institutions of higher
learning
Communities
Conduct careers fairs in three
provinces
Careers fairs were conducted in the Free
State, Mpumalanga and Gauteng.
Effective management
of the social auxiliary
work programme
Social auxiliary work
service providers
Social auxiliary workers Conduct a study on the roles
and responsibilities of social
auxiliary work in integrated
service delivery
A study on the roles and responsibilities of
social auxiliary workers was conducted
Management of
the scholarship
programme
Provincial departments Institutions of higher
learning
Establish a programme
management office
A joint management forum was
established to ensure the effective
management of the scholarship
programme. It comprises representatvies
of human resources, welfare services, and
ASASWEI. Several meetings were held
to discuss issues such as the capacity of
social work departments and social work
degree fees at universities.

218 Annual Report 2010/2011 | Department of Social Development
DEPARTMENT OF SOCIAL DEVELOPMENT VOTE 18
Directorate: Service Standards
Service delivery progress, April 2010 to March 2011
Table 1.2: Consultation arrangements for customers
Main services Actual customers Potential customers Standards of service Actual achievement against standards
Consultative sessions
on the norms and
standards for social
welfare services
National and provincial
Departments of Social
Development, NGOs
Social service practitioners Consultation with the social
welfare sector on norms and
standards for social welfare
services
Consultative sessions were held with
Departmental directorates, the internal
task team, and the provinces
National and provincial personnel were
trained on implementing the norms and
standards
Working team on
Human Resources
model for social
welfare services
Same as above Same as above Establish and coordinate a
working team to develop a
human resources model for
social welfare services
A working team for developing a human
resources model for social welfare
services was established
Consultative workshop and working
sessions on the Human Resources model
were held with stakeholders within social
welfare sector and HR unit within the
department
Establish a task
team to develop
a supervision
framework for the
social work profession
National and provincial
Departments of Social
Development and the
South African Council
for Social Service
Professionals
Social workers, social
work students, and social
auxiliary workers
Establish a task team to develop
a supervision framework
Working sessions were held with relevant
stakeholders to develop a supervision
framework.
A draft supervision framework was
discusssed with stakeholders at a national
level
Generic processes
for social welfare
services
Provincial departments,
NGOs
Social service practitioners Confirm the practicality,
effectiveness and efficiency of
the generic processes for social
welfare services
The redesigned generic processes were
verified in eight provinces in order to
confirm their practicality, effectiveness
and efficiency

DEPARTMENT OF SOCIAL DEVELOPMENT VOTE 18
Department of Social Development | Annual Report 2010/2011 219
Table 1.3: Service delivery access strategy
Main services Actual customers Potential customers Standards of service Actual achievement against standards
Norms and standards
for social welfare
services
National and provincial
Departments of Social
Development; other
national departments
rendering social welfare
services; NGOs; Institutions
of higher learning; SACSSP
Social service practitioners Develop norms and standards
for social welfare services
Norms and standards for social welfare
services were developed.
Architectural
framework for social
welfare services
Social service practitioners National and provincial
departments, NGOs
Develop an architectural
framework for social welfare
services
An architectural framework for social
welfare services was developed.
Human resources
for delivering social
welfare services
Social welfare service
users
National and provincial
departments, NGOs
Develop a national plan of action
for managing the scholarship
programme
A human resources model for social
welfare services was developed
Documenting of
redesigned generic
processes
Same as above Same as above Document the redesigned
generic processes
The redesigned generic processes were
verified and documented in eight provinces
Marketing of the
social work profession
National and provincial
Departments of Social
Development, NGOs
Students (Grade 11 and
12)
Implementation of marketing
strategy
Careers fairs were held in the Free State,
Mpumalanga and Gauteng.
Supervision
framework
Social service practitioners National and provincial
Departments of Social
Development, NGOs
Refined supervision framework The supervision framework was refined.
A national consultative workshop was held
on the supervision framework.
Effective management
of the social auxiliary
work programme
National and provincial
Departments of Social
Development, NGOs
Social service practitioners Conduct a study on the roles
and responsibilities of social
auxiliary workers
A study was conducted on the roles and
responsibilities of social auxiliary work in
integrated service delivery .

220 Annual Report 2010/2011 | Department of Social Development
DEPARTMENT OF SOCIAL DEVELOPMENT VOTE 18
Directorate: Families
Service delivery progress, April 2010 to March 2011
Table 1.1 - Main service delivery improvement and standards
Main services Actual customers Potential customers Standards of service Actual achievement against standards
White Paper on the
Family
Stakeholders delivering
services to families
(government and civil
society)
Families and communities Present Green Paper to Cabinet The Green Paper is available.
Integrated Parenting
Framework
Stakeholders delivering
services to families
(government and civil
society)
Families and communities Hold national workshop to
finalise the draft integrated
parenting framework
The draft integrated parenting framework
was finalised and is available.
Integrated plan for
services to families
Stakeholders delivering
services to families
(government and civil
society)
Families and communities Finalise and approve integrated
plan for services to families
The integrated plan for services to families
was finalised and is available.
Manual on families
in crises
Stakeholders delivering
services to families
(government and civil
society)
Families and communities Capacitate service providers
in provinces on the manual of
families in crises
Service providers were capacitated to use
the manual.
Framework of positive
values
Stakeholders delivering
services to families
(government and civil
society)
Families and communities Capacitate service providers in
the provinces on the Framework
of Positive Values
Service providers were capacitated to
implement the framework.
Monitoring and
evaluation strategy for
families
Stakeholders delivering
services to families
(government and civil
society)
Families and communities Finalise and approve monitoring
and evaluation strategy for
families
The strategy was finalised but has not yet
been approved.
DSD strategy for
families
Stakeholders delivering
services to families
(government and civil
society)
Families and communities Hold provincial workshops to
facilitate the implementation of
the DSD Strategy for Families
The workshops were held.
Manual on marriage
preparation and
marriage enrichment
Stakeholders delivering
services to families
(government and civil
society)
Families and communities Conduct capacity-building
workshops in provinces on the
Manual on Marriage Preparation
and Marriage Enrichment
The workshops were held.

DEPARTMENT OF SOCIAL DEVELOPMENT VOTE 18
Department of Social Development | Annual Report 2010/2011 221
Directorate: Social Relief
Service delivery progress, April 2010 to March 2011
Table 1.1: Main service delivery improvement and standards
Main services Actual customers Potential customers Standards of service
Actual achievement against
standards
Coordinate and
facilitate the repeal
of the Fund-Raising
Act, and draft a
new Social Relief of
Distress Bill
Individuals and
households who
suffer economic and
psychosocial distress
People affected
by disasters and
suffering from undue
hardship
Quantity All destitute people have
access to Social Relief of
Distress
The Social Relief of Distress Bill was
drafted, and MINMEC recommended
that the process be taken forward.
Make new institutional
arrangements for
social relief of distress
services
Individuals and
households who
suffer economic and
psychosocial distress
People affected
by disasters and
suffering from undue
hardship
Quality: All activities are coordinated
effectively
All nine provinces disburse
social relief of distress
The proposed organisational structure
was received from the service provider
and submitted for costing.
Quantity Provinces disburse social
relief through supporting
regulations and guidelines,
and have a standard
approach to relief services
The procedures manual was updated
in line with the amended regulations,
and printed
Develop policies to
address gaps in the
provision of relief
Individuals and
households who
suffer economic and
psychosocial distress
People affected
by disasters and
suffering from undue
hardship
Quantity Consolidate all inputs from
various stakeholders
A policy on the social relief of distress
was formulated, and was due to be
aligned with the Social Relief of Distress
Bill.
Ensure the sound
management of Social
Relief of Distress and
Emergency Relief
services to comply
with PFMA
Individuals and
households who
suffer economic and
psychosocial distress
and who are affected by
disasters
People affected
by disasters and
suffering from undue
hardship
Quantity Financial resources allocated
for relief are managed within
the ambit of PFMA
No funds were disbursed from the
Disaster Relief Fund, but R4,5 million
from the Emergency Relief Fund was
allocated to an organisation to assist the
victims of floods in KZN.

222 Annual Report 2010/2011 | Department of Social Development
DEPARTMENT OF SOCIAL DEVELOPMENT VOTE 18
Human Resources Oversight
April 2010 to March 2011
Table 2.1: Personnel costs by programme
Compensation Average
Compensation Professional of employees compensation of
Total voted of employees Training and special as % of total employees cost
expenditure expenditure expenditure services expenditure per employee Employment
Programme (R’000) (R’000) (R’000) (R’000) (R’000)
P1: Administration 194 159 88 810 2 268 — 45,7 301,05 295
P2: Comprehensive Social Security 5 768 086 32 988 149 — 0,1 147,93 223
P3: Policy Development, Review
and Implementation Support
for Welfare Services 337 060 55 778 479 — 16,5 357,55 156
P4: Community Development 177 376 32 723 161 — 18,4 300,21 109
P5: Strategy and Governance 61 447 36 681 254 — 59,7 366,81 100
Z = Total as on Financial Systems
(BAS) 6 538 128 246 980 3 310 — 0,3 279,71 883
Employment includes permanent, contract and periodical employees (Interns and appeals tribunal members).
Table 2.2: Personnel costs by salary band
Total
Percentage of Average personnel cost
total personnel compensation for department
Compensation of cost for cost per including goods Number of
employees cost department employee and transfers employees
Salary bands (R’000) (R) (R’000)
Lower skilled (Levels 1 – 2) 779 0,3 389 500 266 602 2
Skilled (Levels 3 – 5) 8 847 3,3 210 643 266 602 42
Highly skilled production (Levels 6 – 8) 39 608 14,9 187 716 266 602 211
Highly skilled supervision (Levels 9 – 12) 102 355 38,4 386 245 266 602 265
Senior management (Levels 13 – 16) 74 112 27,8 756 245 266 602 98
Contract (Levels 3 – 5) 2 608 1 434 667 266 602 6
Contract (Levels 6 – 8) 7 606 2,9 126 767 266 602 60
Contract (Levels 9 – 12) 4 717 1,8 262 057 266 602 18
Contract (Levels 13 – 16) 8 729 3,3 623 500 266 602 14
Periodical remuneration 14 372 5,4 59 144 266 602 243
Abnormal appointment 128 — 128 000 266 602 1
Total 263 861 99 274 855 266 602 960
Number of employees includes permanent, contract and periodical appointments (Interns and appeals tribunal members).

DEPARTMENT OF SOCIAL DEVELOPMENT VOTE 18
Department of Social Development | Annual Report 2010/2011 223
Table 2.3: Salaries, overtime, home owners allowance and medical aid by programme
Medical
Salaries Overtime HOA association Total
as % of as % of as % of as % of personnel
personnel personnel personnel Medical personnel cost per
Salaries cost Overtime cost HOA cost association cost programme
Programme (R’000) (R’000) (R’000) (R’000) (R’000)
P1: Administration 58 479 65,8 33 — 2 129 2,4 3 191 3,6 88 810
P2: Comprehensive Social Security 21 107 64,0 — — 517 1,7 585 1,8 32 988
P3: Policy Development, Review
and Implementation Support
for Welfare Services 37 090 66,5 — — 1 027 1,8 1 637 2,9 55 778
P4: Community Development 22 330 68,3 — — 477 1,5 1 274 3,9 32 723
P5: Strategy and Governance 24 358 66,4 — — 685 1,9 783 2,1 36 681
Total 163 364 66,1 33 — 4 889 2,0 7 469 3,0 246 980
Table 2.4: Salaries, overtime, home owners allowance and medical aid by salary band
Medical
Salaries Overtime HOA association Total
as % of as % of as % of as % of personnel
personnel personnel personnel Medical personnel cost per
Salaries cost Overtime cost HOA cost association cost programme
Programme (R’000) (R’000) (R’000) (R’000) (R’000)
Lower skilled (Levels 1 – 2) 510 65,5 — — 49 6,3 98 12,6 779
Skilled (Levels 3 – 5) 6 212 70,0 — — 441 5,0 681 7,7 8 871
Highly skilled production
(Levels 6 – 8) 28 883 72,7 — — 1 347 3,4 2 390 6,0 39 732
Highly skilled supervision
(Levels 9 – 12) 80 261 78,0 33 — 1 241 1,2 3 207 3,1 102 952
Senior management
(Levels 13 – 16) 61 265 81,0 — — 1 802 2,4 1 011 1,3 75 681
Contract (Levels 3 – 5) 2 532 96,0 — — — — — — 2 638
Contract (Levels 6 – 8) 7 492 97,9 — — — — 17 0,2 7 653
Contract (Levels 9 – 12) 4 283 90,3 — — 14 0,3 39 0,8 4 742
Contract (Level 13 – 16) 7 767 87,3 — — 135 1,5 39 0,4 8 900
Periodical remuneration 2 030 14,0 — — — — — — 14 526
Abnormal appointment — — — — — — — — 128
Total 201 235 75,5 33 — 5 029 1,9 7 482 2,8 266 602
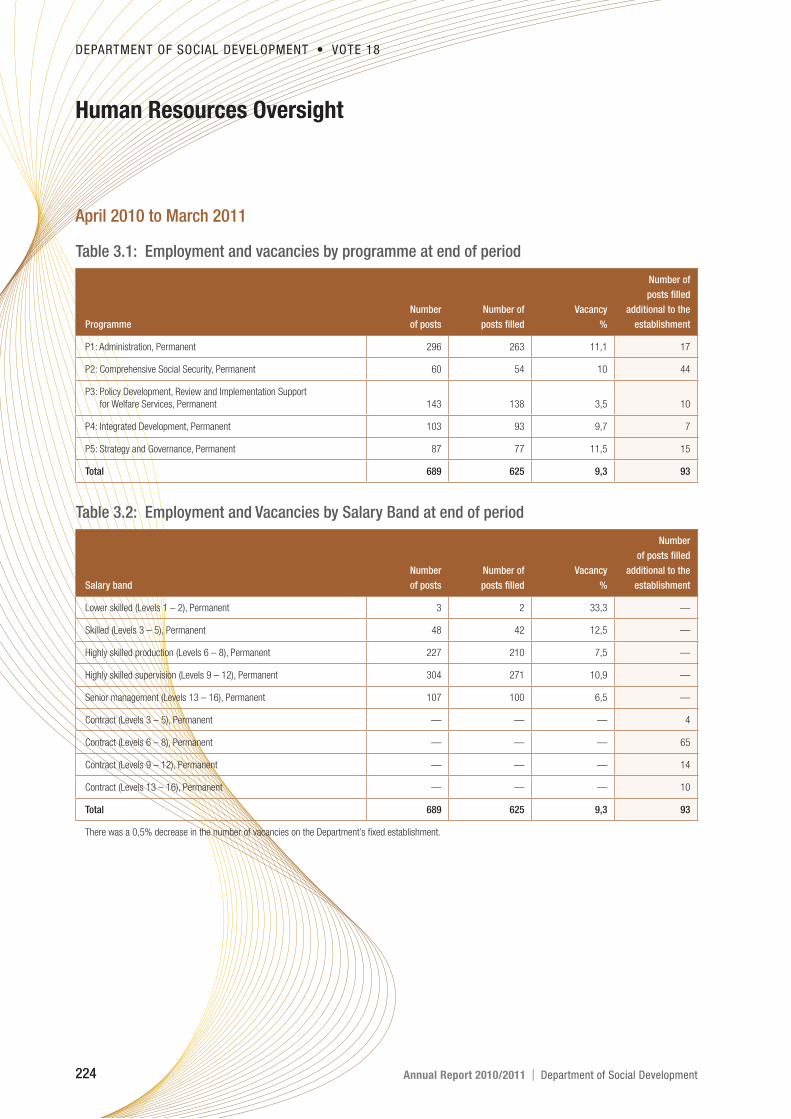
224 Annual Report 2010/2011 | Department of Social Development
DEPARTMENT OF SOCIAL DEVELOPMENT VOTE 18
Human Resources Oversight
April 2010 to March 2011
Table 3.1: Employment and vacancies by programme at end of period
Number of
posts filled
Number Number of Vacancy additional to the
Programme of posts posts filled % establishment
P1: Administration, Permanent 296 263 11,1 17
P2: Comprehensive Social Security, Permanent 60 54 10 44
P3: Policy Development, Review and Implementation Support
for Welfare Services, Permanent 143 138 3,5 10
P4: Integrated Development, Permanent 103 93 9,7 7
P5: Strategy and Governance, Permanent 87 77 11,5 15
Total 689 625 9,3 93
Table 3.2: Employment and Vacancies by Salary Band at end of period
Number
of posts filled
Number Number of Vacancy additional to the
Salary band of posts posts filled % establishment
Lower skilled (Levels 1 – 2), Permanent 3 2 33,3 —
Skilled (Levels 3 – 5), Permanent 48 42 12,5 —
Highly skilled production (Levels 6 – 8), Permanent 227 210 7,5 —
Highly skilled supervision (Levels 9 – 12), Permanent 304 271 10,9 —
Senior management (Levels 13 – 16), Permanent 107 100 6,5 —
Contract (Levels 3 – 5), Permanent — — — 4
Contract (Levels 6 – 8), Permanent — — — 65
Contract (Levels 9 – 12), Permanent — — — 14
Contract (Levels 13 – 16), Permanent — — — 10
Total 689 625 9,3 93
There was a 0,5% decrease in the number of vacancies on the Department’s fixed establishment.

DEPARTMENT OF SOCIAL DEVELOPMENT VOTE 18
Department of Social Development | Annual Report 2010/2011 225
Table 3.3: Employment and vacancies by critical occupation at end of period
Number
of posts filled
Number Number of Vacancy additional to the
Critical occupations of posts posts filled % establishment
Communication and information-related, Permanent 8 7 12,5 —
Community development workers, Permanent 21 18 14,3 —
Computer programmers, Permanent — — — —
Financial and related professionals, Permanent 32 24 25 —
General legal administration and related professionals, Permanent 5 4 20 —
Human resources and organisational development and
related professions, Permanent 18 18 — —
Logistical support personnel, Permanent 12 11 8,3 2
Senior managers, Permanent 107 99 7,5 10
Social work and related professionals, Permanent 82 56 31,7 —
Total 285 237 16,8 12
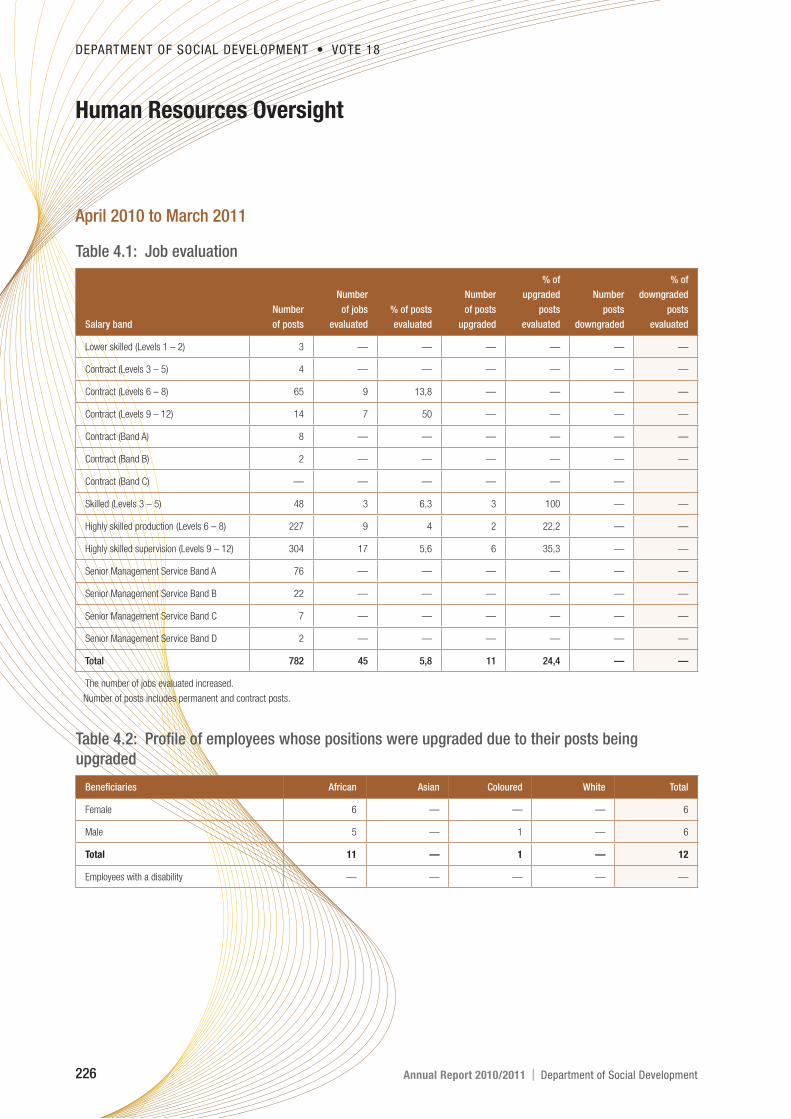
226 Annual Report 2010/2011 | Department of Social Development
DEPARTMENT OF SOCIAL DEVELOPMENT VOTE 18
Human Resources Oversight
April 2010 to March 2011
Table 4.1: Job evaluation
% of % of
Number Number upgraded Number downgraded
Number of jobs % of posts of posts posts posts posts
Salary band of posts evaluated evaluated upgraded evaluated downgraded evaluated
Lower skilled (Levels 1 – 2) 3 — — — — — —
Contract (Levels 3 – 5) 4 — — — — — —
Contract (Levels 6 – 8) 65 9 13,8 — — — —
Contract (Levels 9 – 12) 14 7 50 — — — —
Contract (Band A) 8 — — — — — —
Contract (Band B) 2 — — — — — —
Contract (Band C) — — — — — —
Skilled (Levels 3 – 5) 48 3 6,3 3 100 — —
Highly skilled production (Levels 6 – 8) 227 9 4 2 22,2 — —
Highly skilled supervision (Levels 9 – 12) 304 17 5,6 6 35,3 — —
Senior Management Service Band A 76 — — — — — —
Senior Management Service Band B 22 — — — — — —
Senior Management Service Band C 7 — — — — — —
Senior Management Service Band D 2 — — — — — —
Total 782 45 5,8 11 24,4 — —
The number of jobs evaluated increased.
Number of posts includes permanent and contract posts.
Table 4.2: Profile of employees whose positions were upgraded due to their posts being
upgraded
Beneficiaries African Asian Coloured White Total
Female 6 — — — 6
Male 5 — 1 — 6
Total 11 — 1 — 12
Employees with a disability — — — — —

DEPARTMENT OF SOCIAL DEVELOPMENT VOTE 18
Department of Social Development | Annual Report 2010/2011 227
Table 4.3: Employees whose salary level exceed the grade determined by job evaluation
Number of
Number of Job evaluation Remuneration Reason for employees
Occupation employees level level deviation in department
Secretaries and other keyboard operating clerks 3 6 7 Retention of services 718
Material-recording and transport clerks 1 4 5 Retention of services 718
Administrative related 1 9 11 Retention of services 718
Administrative related 1 11 9 Retention of services 718
Social sciences related 2 11 12 Retention of services 718
Total 8 718
Table 4.4: Profile of employees whose salary level exceeded the grade determined by job
evaluation
Beneficiaries African Asian Coloured White Total
Female 5 — — 1 6
Male 2 — — — 2
Total 7 — — 1 8
Employees with a disability — — — — —
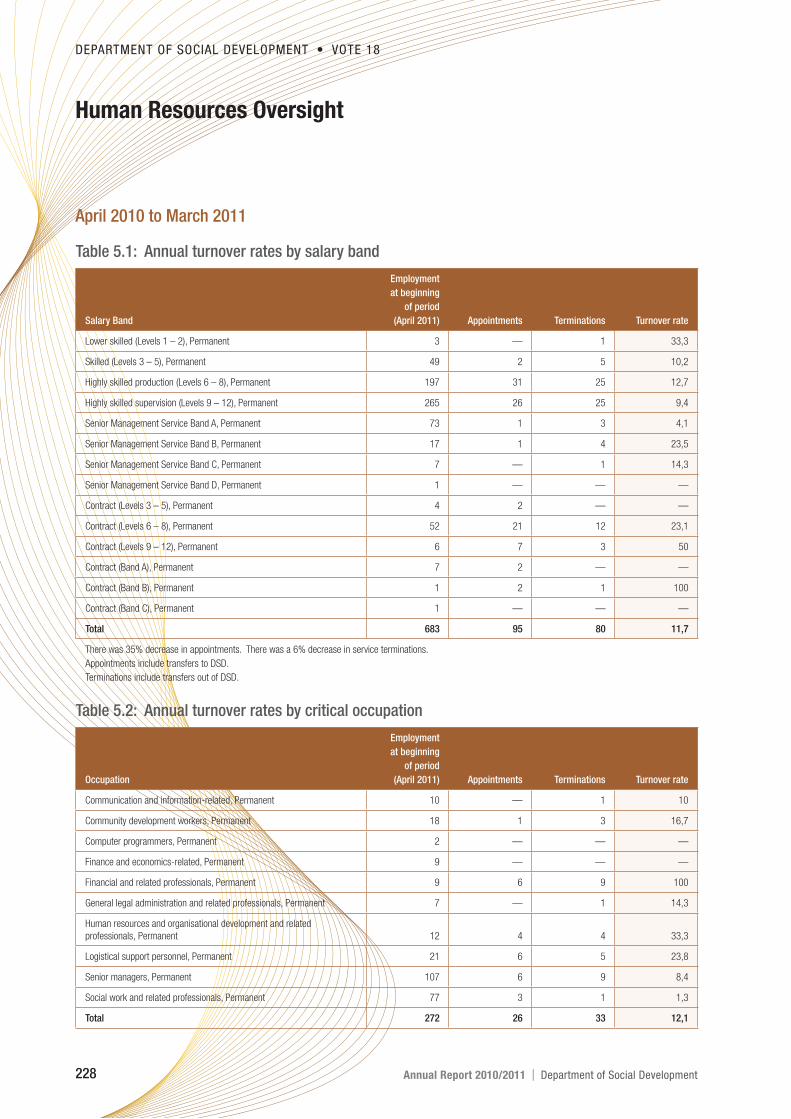
228 Annual Report 2010/2011 | Department of Social Development
DEPARTMENT OF SOCIAL DEVELOPMENT VOTE 18
Human Resources Oversight
April 2010 to March 2011
Table 5.1: Annual turnover rates by salary band
Employment
at beginning
of period
Salary Band (April 2011) Appointments Terminations Turnover rate
Lower skilled (Levels 1 – 2), Permanent 3 — 1 33,3
Skilled (Levels 3 – 5), Permanent 49 2 5 10,2
Highly skilled production (Levels 6 – 8), Permanent 197 31 25 12,7
Highly skilled supervision (Levels 9 – 12), Permanent 265 26 25 9,4
Senior Management Service Band A, Permanent 73 1 3 4,1
Senior Management Service Band B, Permanent 17 1 4 23,5
Senior Management Service Band C, Permanent 7 — 1 14,3
Senior Management Service Band D, Permanent 1 — — —
Contract (Levels 3 – 5), Permanent 4 2 — —
Contract (Levels 6 – 8), Permanent 52 21 12 23,1
Contract (Levels 9 – 12), Permanent 6 7 3 50
Contract (Band A), Permanent 7 2 — —
Contract (Band B), Permanent 1 2 1 100
Contract (Band C), Permanent 1 — — —
Total 683 95 80 11,7
There was 35% decrease in appointments. There was a 6% decrease in service terminations.
Appointments include transfers to DSD.
Terminations include transfers out of DSD.
Table 5.2: Annual turnover rates by critical occupation
Employment
at beginning
of period
Occupation (April 2011) Appointments Terminations Turnover rate
Communication and information-related, Permanent 10 — 1 10
Community development workers, Permanent 18 1 3 16,7
Computer programmers, Permanent 2 — — —
Finance and economics-related, Permanent 9 — — —
Financial and related professionals, Permanent 9 6 9 100
General legal administration and related professionals, Permanent 7 — 1 14,3
Human resources and organisational development and related
professionals, Permanent 12 4 4 33,3
Logistical support personnel, Permanent 21 6 5 23,8
Senior managers, Permanent 107 6 9 8,4
Social work and related professionals, Permanent 77 3 1 1,3
Total 272 26 33 12,1

DEPARTMENT OF SOCIAL DEVELOPMENT VOTE 18
Department of Social Development | Annual Report 2010/2011 229
Table 5.3: Reasons why staff are leaving the department
% of total % of total TotalTermination type Number resignations employment Total employment
Death, Permanent 1 1,3 0,1 80 718
Resignation, Permanent 66 82,5 9,2 80 718
Expiry of contract, Permanent 8 10 1,1 80 718
Retirement, Permanent 5 6,3 0,7 80 718
Total 80 100 11,1 80 718
The number of resignations decreased by 5% (70 in previous year)Resignation includes transfers and resignations.Total employment includes permanent and contract employees.
Resignations as % of employment
9,2
Table 5.4: Promotions by critical occupation
Employment Salary level Progressions Notchat beginning Promotions promotions to another progressions
of period to another as a % of notch within as a % ofOccupation (April 2011) salary level employment salary level employment
Communication and information-related 10 1 10 4 40
Community development workers 18 — — 8 44,4
Computer programmers 2 — — — —
Finance and economics-related 9 — — — —
Financial and related professionals 9 6 66,7 11 122,2
General legal administration and related professionals 7 — — 4 57,1
Human resources and organisational development
and related professionals 12 1 8,3 10 83,3
Logistical support personnel 21 3 14,3 5 23,8
Senior managers 107 4 3,7 48 44,9
Social work and related professionals 77 — — 30 39
Total 272 15 5,5 120 44,1
Table 5.5: Promotions by salary band
Employment Salary level Progressions Notchat beginning Promotions promotions to another progressions
of period to another as a % of notch within as a % ofSalary band (April 2011) salary level employment salary level employment
Lower skilled (Levels 1 – 2), Permanent 3 — — — —
Skilled (Levels 3 – 5), Permanent 49 — — 24 49
Highly skilled production (Levels 6 – 8), Permanent 197 8 4,1 95 48,2
Highly skilled supervision (Levels 9 – 12), Permanent 265 13 4,9 113 42,6
Senior management (Levels 13 – 16), Permanent 98 2 2 44 44,9
Contract (Levels 3 – 5), Permanent 4 — — — —
Contract (Levels 6 – 8), Permanent 52 9 17,3 3 5,8
Contract (Levels 9 – 12), Permanent 6 4 66,7 — —
Contract (Levels 13 – 16), Permanent 9 2 22,2 4 44,4
Total 683 38 5,6 283 41,4
The number of internal promotions increased by 5% (36 in previous year).

230 Annual Report 2010/2011 | Department of Social Development
DEPARTMENT OF SOCIAL DEVELOPMENT VOTE 18
Human Resources Oversight
April 2010 to March 2011
Table 6.1: Total number of employees (including employees with disabilities) per occupational category
Male Female
Occupational categories African Coloured Indian
Total
Blacks White African Coloured Indian
Total
Blacks White Total
Legislators, senior officials
and managers, Permanent 44 4 3 51 7 37 4 3 44 8 110
Professionals, Permanent 41 3 3 47 5 89 6 3 98 12 162
Technicians and associate
professionals, Permanent 62 1 — 63 6 102 5 1 108 14 191
Clerks, Permanent 66 — 2 68 2 162 2 3 167 16 253
Elementary occupations, Permanent 1 — — 1 — 1 — — 1 — 2
Total 214 8 8 230 20 391 17 10 418 50 718
Total includes permanent and contract employees.
Employees with disabilities 4 — 1 5 3 5 — — 5 2 15
The number of employees with disabilities increased with 20% (12 in previous year).
Table 6.2: Total number of employees (including employees with disabilities) per occupational bands
Male Female
Occupational categories African Coloured Indian
Total
Blacks White African Coloured Indian
Total
Blacks White Total
Top management, Permanent 3 2 — 5 — 2 1 — 3 — 8
Senior management, Permanent 36 2 3 41 7 31 2 3 36 8 92
Professionally qualified and
experienced specialists and
mid-management, Permanent 52 3 3 58 8 114 6 3 123 18 207
Skilled technical and academically
qualified workers, junior management,
supervisors, foremen, Permanent 76 — — 76 5 160 6 4 170 23 274
Semi-skilled and discretionary
decision-making, Permanent 19 — — 19 — 22 — — 22 1 42
Unskilled and defined
decision-making, Permanent 1 — — 1 — 1 — — 1 — 2
Contract (Top Management), Permanent — — — — — — — — — — —
Contract (Senior Management),
Permanent 5 — — 5 — 4 1 — 5 — 10
Contract (Professionally qualified),
Permanent 1 1 — 2 — — 1 — 1 — 3
Contract (Skilled technical), Permanent 21 — 2 23 — 53 — — 53 — 76
Contract (Semi-skilled), Permanent — — — — — 4 — — 4 — 4
Total 214 8 8 230 20 391 17 10 418 50 718
Total includes permanent and contract employees.

DEPARTMENT OF SOCIAL DEVELOPMENT VOTE 18
Department of Social Development | Annual Report 2010/2011 231
Table 6.3: Recruitment
Male Female
Occupational bands African Coloured Indian
Total
Blacks White African Coloured Indian
Total
Blacks White Total
Senior Management, Permanent 0 — — — — 1 — 1 2 — 2
Professionally qualified and
experienced specialists and
mid-management, Permanent 4 — — 4 1 5 — — 5 — 10
Skilled technical and academically
qualified workers, junior management,
supervisors, foremen, Permanent 16 — — 16 — 28 1 — 29 2 47
Semi-skilled and discretionary
decision-making, Permanent 1 — — 1 — 1 — — 1 — 2
Contract (Senior Management),
Permanent — — — — — 3 1 — 4 — 4
Contract (Professionally qualified),
Permanent — — — — — — — — — — —
Contract (Skilled technical),
Permanent 7 — 1 8 — 20 — — 20 — 28
Contract (Semi-skilled), Permanent — — — — — 2 — — 2 — 2
Total 28 — 1 29 1 60 2 1 63 2 95
Employees with disabilities 1 — — 1 — — — — — — 1
Table 6.4: Promotions
Male Female
Occupational bands African Coloured Indian
Total
Blacks White African Coloured Indian
Total
Blacks White Total
Top Management, Permanent — 1 — 1 — — — — — — —
Senior Management, Permanent 1 — — 1 — — — — — — —
Professionally qualified and
experienced specialists and
mid-management, Permanent 3 — — 3 2 7 — — 7 1 13
Skilled technical and academically
qualified workers, junior management,
supervisors, foremen, Permanent 3 — — 3 — 5 — — 5 — 8
Semi-skilled and discretionary
decision-making, Permanent — — — — — — — — — — —
Contract (Top Management),
Permanent — — — — — — — — — — —
Contract (Senior Management),
Permanent — — — — — 2 — — 2 — 2
Contract (Professionally qualified),
Permanent 2 — — 2 — 2 — — 2 — 4
Contract (Skilled technical), Permanent 5 — — 5 — 4 — — 4 — 9
Contract (Semi-skilled), Permanent — — — — — — — — — — —
Total 14 1 — 15 2 20 — — 20 — 38
Employees with disabilities 1 — — 1 — — — — — — 1

232 Annual Report 2010/2011 | Department of Social Development
DEPARTMENT OF SOCIAL DEVELOPMENT VOTE 18
Human Resources Oversight
April 2010 to March 2011
Table 6.5: Terminations
Male Female
Occupational bands African Coloured Indian
Total
Blacks White African Coloured Indian
Total
Blacks White Total
Top Management, Permanent — — — — — 1 — — 1 — 1
Senior Management, Permanent 4 — 1 5 1 2 — — 1 — 7
Professionally qualified and
experienced specialists and
mid-management, Permanent 6 1 — 7 — — — 1 8 — 16
Skilled technical and academically
qualified workers, junior management,
supervisors, foremen, Permanent 6 1 — 7 — 24 — — 24 3 34
Semi-skilled and discretionary
decision-making, Permanent 1 — — 1 — 4 — — 4 — 5
Unskilled and defined decision making,
Permanent 1 — — 1 — — — — — — 1
Contract (Senior Management),
Permanent — — — — — 1 — — 1 — 1
Contract (Professionally qualified),
Permanent — — — — — — — — — — —
Contract (Skilled technical), Permanent 4 — — 4 — 10 — 1 11 — 15
Contract (Semi-skilled), Permanent — — — — — — — — — — —
Total 22 2 1 25 1 49 — — 51 3 80
Employees with disabilities — — — — — — — — — — —
Table 6.6: Disciplinary action
Disciplimary action
Male Female
African Coloured Indian
Total
Blacks White African Coloured Indian
Total
Blacks White Total
Total 9 1 — 10 2 10 1 — 11 2 25
Table 6.7: Skills development
Occupational categories
Male Female
African Coloured Indian
Total
Blacks White African Coloured Indian
Total
Blacks White Total
Legislators, Senior Officials and
Managers 19 2 2 23 3 21 1 2 24 3 53
Professionals 27 1 3 31 2 45 2 1 48 6 87
Technicians and Associate
Professionals 22 1 — 23 4 42 3 1 46 8 81
Clerks 24 — — 24 1 85 1 — 86 4 115
Elementary Occupations 1 — — 1 — — — — — — 1
Total 93 4 5 102 10 193 7 4 204 21 337
Employees with disabilities 2 — 1 3 — — — — — 2 5

DEPARTMENT OF SOCIAL DEVELOPMENT VOTE 18
Department of Social Development | Annual Report 2010/2011 233
Table 7.1: Performance rewards by race, gender and disability
Number of Total Percentage of Average cost
Demographics beneficiaries employment total employment Cost per beneficiary
(R’000) (R)
African, Female 127 386 32,9 1 501 1 182
African, Male 56 210 26,7 765 1 366
Asian, Female 3 10 30 54 1 800
Asian, Male — 7 — — —
Coloured, Female 7 17 41,2 94 1 343
Coloured, Male 2 8 25 41 2 050
Total Blacks, Female 137 413 33,2 1 649 1 204
Total Blacks, Male 58 225 25,8 806 1 390
White, Female 21 48 43,8 280 1 333
White, Male 6 17 35,3 87 1 450
Employees with a disability 3 15 20 42 1 400
Total 225 718 31,3 2 864 14 518
Table 7.2: Performance rewards by salary band for personnel below senior management
service
Number of Total Percentage of Average cost
Salary band beneficiaries employment total employment Cost per beneficiary
(R’000) (R)
Lower skilled (Levels 1 – 2) 1 2 50 3 3 000
Skilled (Levels 3 – 5) 24 42 57,1 99 4 125
Highly skilled production (Levels 6 – 8) 98 210 46,7 711 7 255
Highly skilled supervision (Levels 9 – 12) 81 271 29,9 1 444 17 827
Contract (Levels 3 – 5) — 4 — — —
Contract (Levels 6 – 8) 1 65 1,5 6 6 000
Contract (Levels 9 – 12) 3 14 21,4 49 16 333
Periodical remuneration — — — — —
Total 208 608 34,2 2 312 11 115
Total employement includes permanent and contract employees.

234 Annual Report 2010/2011 | Department of Social Development
DEPARTMENT OF SOCIAL DEVELOPMENT VOTE 18
Human Resources Oversight
April 2010 to March 2011
Table 7.3: Performance rewards by critical occupation
Number of Total Percentage of Average cost
Critical occupations beneficiaries employment total employment Cost per beneficiary
(R’000) (R)
Communication and information-related 2 8 25 19 9 500
Community development workers 6 21 28,6 98 16 333
Computer programmers — — — — —
Financial and related professionals, Permanent 9 32 28,1 141 15 667
General legal administration and related
professionals — 5 — — —
Human resources and organisational development
and related professional 5 18 27,8 50 10 000
Logistical support personnel 6 12 50 44 7 333
Senior managers 17 107 15,9 552 32 471
Social work and related professionals 26 82 31,7 559 21 500
Total 71 285 24,9 1 463 20 606
Table 7.4: Performance-related rewards (cash bonus) by salary band for senior management
service
Number of Total Percentage of Average cost % of SMS Personnel
SMS band beneficiaries employment total employment Cost per beneficiary wage Bill sost SMS
(R’000) (R) (R’000)
Band A 11 82 13,4 329 2 991 0,6 57 673
Band B 3 21 14,3 129 4 300 0,7 17 987
Band C 2 5 40 34 1 700 0,6 5 365
Band D 1 2 50 60 6 000 2,2 2 761
Total 17 110 15,5 552 3 247 0,7 83 786
Total employment includes permanent and contract employment

DEPARTMENT OF SOCIAL DEVELOPMENT VOTE 18
Department of Social Development | Annual Report 2010/2011 235
Table 8.1: Foreign workers by salary band
Total Total
Employment Employment employment employment Total
at beginning Percentage at end Percentage Change in Percentage at beginning at end change in
Salary band of period of total of period of total employment of total of period of period employment
Highly skilled supervision
(Levels 9 – 12) 1 100 1 100 — — 1 1 —
Contract
(Levels 9 – 12) 2 100 — — 2 100 2 — 2
Contract
(Levels 13 – 16) 1 100 1 100 — — 1 1 1
Total 4 100 2 100 2 100 4 2 2
Table 8.2: Foreign workers by major occupation
Total Total
Employment Employment employment employment Total
at beginning Percentage at end Percentage Change in Percentage at beginning at end change in
Major occupation of period of total of period of total employment of total of period of period employment
Professionals
and managers 3 100 1 100 2 100 3 1 2
Senior managers 1 100 1 100 — — 1 1 —
Total 4 100 2 100 2 100 4 2 2
The number of foreign workers decreased by 50%.

236 Annual Report 2010/2011 | Department of Social Development
DEPARTMENT OF SOCIAL DEVELOPMENT VOTE 18
Human Resources Oversight
April 2010 to March 2011
Table 9.1: Sick leave for January 2010 to December 2011
Total Total
Number of % of total number of number of
% days with employees employees Average employees days with
medical using using days per Estimated using medical
Salary band Total days certification sick leave sick leave employee cost sick leave certification
(R’000)
Lower skilled (Levels 1 – 2) 8 225 2 0,4 4 2 555 18
Skilled (Levels 3 – 5) 174 81,6 26 4,7 7 52 555 142
Highly skilled production
(Levels 6 – 8) 1 159 81,2 179 32,3 6 610 555 941
Highly skilled supervision
(Levels 9 – 12) 1 591 78 227 40,9 7 1 700 555 1 241
Senior management
(Levels 13 – 16) 495 66,3 67 12,1 7 804 555 328
Contract (Levels 3 – 5) 1 — 1 0,2 1 — 555 —
Contract (Levels 6 – 8) 150 73,3 36 6,5 4 66 555 110
Contract (Levels 9 – 12) 35 62,9 11 2 3 37 555 22
Contract (Levels 13 – 16) 20 80 6 1,1 3 34 555 16
Total 3 633 77,6 555 100 7 3 305 555 2 818
Table 9.2: Disability leave (temporary and permanent) for January 2010 to December 2011
Total Total
Number of % of total number of number of
% days with employees employees Average days with employees
medical using using days per Estimated medical using
Salary band Total days certification disability disability employee cost certification disability
leave leave (R’000) leave
Highly skilled supervision
(Levels 9 – 12) 347 100 4 80 87 381 347 5
Contract (Levels 9 – 12) 29 100 1 20 29 36 29 5
Total 376 100 5 100 75 417 376 5

DEPARTMENT OF SOCIAL DEVELOPMENT VOTE 18
Department of Social Development | Annual Report 2010/2011 237
Table 9.3: Annual leave for January 2010 to December 2011
Number of
Total Average days employees who
Salary band days taken per employee took leave
Lower skilled (Levels 1 – 2) 47 24 2
Skilled (Levels 3 – 5) 805 20 40
Highly skilled production (Levels 6 – 8) 4 250 21 201
Highly skilled supervision (Levels 9 – 12) 6 023 22 271
Senior management (Levels 13 – 16) 2 191 23 94
Contract (Levels 3 – 5) 67 11 6
Contract (Levels 6 – 8) 788 15 54
Contract (Levels 9 – 12) 193 13 15
Contract (Levels 13 – 16) 195 15 13
Total 14 559 21 696
Table 9.4: Capped leave for January 2010 to December 2011
Average capped Total number
Average leave per Number of of capped leave Number of
Total days number of employee as at employees available at employees as at
of capped days taken 31 December who took 31 December 31 December
Salary band leave taken per employee 2010 capped leave 2010 2010
Skilled (Levels 3 – 5) 3 3 16 1 693 43
Highly skilled production (Levels 6 – 8) 48 10 6 5 1 227 208
Highly skilled supervision (Levels 9 – 12) 95 9 10 11 2 552 268
Senior management (Levels 13 – 16) 63 13 27 5 2 558 94
Total 209 10 11 22 7 030 613
Table 9.5: Leave payouts
Number of Average payment
Total amount employees per employee
Reason (R’000) (R)
Capped leave payouts on termination of service for 2010/11 26 5 5 200
Current leave payout on termination of service for 2010/10 311 22 14 136
Total 337 27 12 481

238 Annual Report 2010/2011 | Department of Social Development
DEPARTMENT OF SOCIAL DEVELOPMENT VOTE 18
Human Resources Oversight
April 2010 to March 2011
Table 10.1: Details of Health Promotion and HIV/AIDS Programmes
Question Yes No Details, if yes
1. Has the department designated a member of the SMS to implement
the provisions contained in Part VI E of Chapter 1 of the Public Service
Regulations, 2001? If so, provide her/his name and position.
√
Mr D Chinappan
2. Does the department have a dedicated unit or have you designated specific staff
members to promote health and well being of your employees? If so, indicate the
number of employees who are involved in this task and the annual budget that is
available for this purpose.
√
Two (2) – R100 000
3. Has the department introduced an Employee Assistance or Health Promotion
Programme for your employees? If so, indicate the key elements/services of
the programme.
√
Health Risk Assessment, Reactive Services,
Pro-active Services
4. Has the department established (a) committee(s) as contemplated in Part VI
E.5 (e) of Chapter 1 of the Public Service Regulations, 2001? If so, please
provide the names of the members of the committee and the stakeholder(s)
that they represent. √
Mr T van der Merwe, Directorate: Security Management
Ms S Shongwe, Directorate: Gender Focal Point
Ms L Bam, Directorate: Services to People with Disabilities
Ms T Mnyandeni, Directorate: Corporate Communication
5. Has the department reviewed the employment policies and practices of
your department to ensure that these do not unfairly discriminate against
employees on the basis of their HIV status? If so, list the employment policies/
practices so reviewed.
√
Employee Health and Wellness Policy
Recruitment and selection
Relocation
6. Has the department introduced measures to protect HIV-positive employees
or those perceived to be HIV-positive from discrimination? If so, list the key
elements of these measures.
√
Employee Health and Wellness Policy
Employee Health and Wellness Strategy
7. Does the department encourage its employees to undergo Voluntary
Counselling and Testing? If so, list the results that you have achieved. √
112 Employees tested (HCT)
8. Has the department developed measures/indicators to monitor & evaluate
the impact of your health promotion programme? If so, list these measures/
indicators.
√
Evaluation Report from Service Provider
Statistics Report

DEPARTMENT OF SOCIAL DEVELOPMENT VOTE 18
Department of Social Development | Annual Report 2010/2011 239
Table 11.1: Collective agreements
Subject matter Date
OSD for Medical Officers, Medical Specialists, Dentists, Dental Specialists, Pharmacologists,
Pharmacists and Emergency Care Practitioners 3 August 2010
OSD for Therapeutic, Diagnostic and related allied Health Practitioners 5 November 2010
Repeal of PHSDSBC Resolution 1 of 2004 (Agreement on scarce skills allowance) 18 February 2011
Table 11.2: Misconduct and discipline hearings finalised
Subject matter Number Percentage of total Total
Correctional counselling 1 4 25
Written warning 20 80 25
Final written warning 1 4 25
Dismissal 2 8 25
Case withdrawn 1 4 25
Total 25 100 25
Table 11.3: Types of misconduct addressed and disciplinary hearings
Type of misconduct Number Percentage of total Total
Fraud and failure to declare (misrepresentation) 1 33,3 3
Assault 1 33,3 3
Bribery 1 33,3 3
Total 3 100 3
Table 11.4: Grievances lodged
Number of grievances addressed Number Percentage of total Total
Number of grievances resolved 2 66,7 3
Number of grievances not resolved 1 33,3 3
Total 3 100 3
Table 11.5: Disputes lodged
Number of disputes addressed Number Percentage of total
Upheld 1 50
Dismissed 1 50
Total 2 100
Table 11.6: Strike actions
Strike actions
Total number of person working days lost 87 days
Total cost (R’000) of working days lost R93 287,39
Amount (R”000) recovered as a result of no work no pay R93 287,39

240 Annual Report 2010/2011 | Department of Social Development
DEPARTMENT OF SOCIAL DEVELOPMENT VOTE 18
Human Resources Oversight
April 2010 to March 2011
Table 12.1: Training needs identified
Skills
programmes
and other Other forms
Occupational categories Gender Employment Learnerships short courses of training Total
Legislators, senior officials and managersFemale 52 — 4 — 4
Male 58 — 8 — 8
ProfessionalsFemale 110 — 47 — 47
Male 52 — 26 — 26
Technicians and associate professionalsFemale 122 — 24 — 24
Male 69 — 12 — 12
ClerksFemale 183 — 43 — 43
Male 70 — 11 — 11
Elementary occupationsFemale 1 — — — —
Male 1 — — — —
Gender sub-totalsFemale 468 — 118 — 118
Male 250 — 57 — 57
Total 718 — 175 — 175
Table 12.2: Training provided
Skills
programmes Other
and other forms of
Occupational categories Gender Employment Learnerships short courses training Total
Legislators, senior officials and managers Female 52 — 27 — 27
Male 58 — 26 — 26
Professionals Female 110 — 54 — 54
Male 52 — 33 — 33
Technicians and associate professionals Female 122 — 54 — 54
Male 69 — 27 — 27
Clerks Female 183 — 90 — 90
Male 70 — 25 — 25
Elementary occupations Female 1 — — — —
Male 1 — 1 — 1
Gender sub-totals Female 468 — 225 — 225
Male 250 — 112 — 112
Total 718 — 337 — 337
Although some officials attended training more than once an official was only counted once.
Training was also provided to Interns (9 females and 17 males) – not included in the Table 12.2.

DEPARTMENT OF SOCIAL DEVELOPMENT VOTE 18
Department of Social Development | Annual Report 2010/2011 241
Table 13.1: Injury on duty
Percentage
Nature of injury on duty Number of total
Required basic medical attention only 5 62,5
Temporary total disablement 3 37,5
Permanent disablement — —
Fatal — —
Total 8 100

242 Annual Report 2010/2011 | Department of Social Development
Rep
ort
ing
on
su
pp
ly c
ha
in m
an
ag
emen
t i
nfo
rma
tion
Per
cen
tag
eP
erce
nta
ge
Per
cen
tag
eO
uts
ourc
ed/
equ
ity
equ
ity
equ
ity
sub
con
trac
ted
Per
cen
tag
eLo
wes
tS
pec
ified
Per
cen
tag
e
RQ
nu
mb
er/
own
ersh
ipow
ner
ship
by
own
ersh
ip b
yb
usi
nes
s to
loca
lC
ontr
act
acce
pta
ble
goa
lsp
rem
ium
Ord
er n
um
ber
sD
irec
tora
teD
escr
ipti
onN
ame
of c
ontr
acto
rC
ontr
act
dat
eby
HD
Ib
lack
wom
enw
hit
e w
omen
SM
ME
’sco
nte
nt
pri
cep
rice
pre
miu
mp
aid
29138
PO
PU
LATI
ON
AN
D
DEV
ELO
PM
ENT
Prin
ting
SH
EREN
O P
RIN
TER
S1
6.0
4.2
01
01
00
,00
0,0
00,0
00,0
0,0
R183 8
82,0
0R
183 8
82,0
0R
0,0
00,0
0
29177
PO
PU
LATI
ON
AN
D
DEV
ELO
PM
ENT
Prin
ting
of s
ynth
esis
repo
rt
BLA
CK
XCC
19
.04
.20
10
10
0,0
00
,00
0,0
00,0
0,0
R104 9
88,3
0R
104 9
88,3
0R
0,0
00,0
0
20768
AP
PEA
LSS
ecre
taria
lK
ELLY
27
.05
.20
10
31
,00
8,0
00,0
00,0
0,0
R103 1
22,7
0R
103 1
22,7
00,0
00,0
0
MA
NU
AL
OR
DER
INTE
RG
RAT
ED D
EVEL
OPM
ENT
Faci
litat
orB
AR
LED
A 1
68
04
.06
.20
10
10
0,0
00
,00
0,0
00,0
00,0
0R
182 0
00,0
0R
182 0
00,0
00,0
00,0
0
020874/0
29418
SER
VIC
E D
EL M
ON
ITO
REd
iting
and
prin
ting
AC
UM
EN P
UB
LIS
HIN
G0
8.0
6.2
01
02
0,0
04
0,0
00,0
00,0
00,0
0R
309 5
86,3
8R
309 5
86,3
80,0
00,0
0
020907/0
29561
OLD
ER P
ERS
ON
SP
rintin
g bo
okle
tM
INTI
RO
TR
AD
ING
ENTE
RP
RIS
E
08
.06
.20
10
10
0,0
03
5,0
00,0
00,0
00,0
0R
298 6
80,0
0R
298 6
80,0
00,0
00,0
0
020874/0
29418
SER
VIC
E D
EL M
ON
ITO
REd
iting
and
prin
ting
AC
UM
EN P
UB
LIS
HIN
G0
8.0
6.2
01
00
,00
0,0
00,0
00,0
00,0
0R
309 5
86,3
8R
309 5
86,3
80,0
00,0
0
020854/0
29562
OLD
ER P
ERS
ON
SP
rint
Z-fo
ld in
Eng
lish
for
laun
ch
LUN
DIM
TR
AD
ING
EN
TER
PR
ISE
08
.06
.20
10
0,0
00
,00
0,0
00,0
00,0
0R
140 1
00,0
0R
140 1
00,0
00,0
00,0
0
020853/0
29563
OLD
ER P
ERS
ON
SP
rint
Z-fo
ld in
Zul
uR
AP
HA
SW
A P
RIN
TIN
G
AN
D P
RO
JEC
TS
08
.06
.20
10
10
0,0
03
,33
0,0
00,0
00,0
0R
102 0
00,0
0R
102 0
00,0
00,0
00,0
0
020895/0
29507
INFO
RM
ATIO
N T
ECH
NO
LOG
YA
ntiv
irus
inst
alla
tion
DIT
HA
KO
TEC
HN
OLO
GIE
S1
8.0
6.2
01
00
,00
0,0
00,0
00,0
00,0
0R
243 0
43,1
8R
243 0
43,1
80,0
00,0
0
021026/0
29807
SER
VIC
E S
TAN
DA
RD
Venu
eB
IRC
HW
OO
D H
OTE
L1
5.0
7.2
01
00
,00
0,0
00,0
00,0
00,0
0R
199 2
80,0
0R
199 2
80,0
00,0
00,0
0
021038/0
29718
HIV
/AID
SP
rintin
g of
hcb
c au
dit
repo
rt
LD M
ULT
IPLE
X1
9.0
7.2
01
01
00
,00
10
0,0
00,0
00,0
00,0
0R
151 9
80,0
0R
151 9
80,0
00,0
00,0
0
021005/0
29797
INFO
RM
ATIO
N T
ECH
NO
LOG
YD
ell n
oteb
ook
and
mem
ory
stic
k
UB
UN
TU T
ECH
NO
LOG
IES
19
.07
.20
10
55
,00
10
,00
0,0
00,0
00,0
0R
102 9
42,0
0R
102 9
42,0
00,0
00,0
0
21111
AP
PEA
LSS
ecur
ity s
ervi
ceB
OR
N T
O P
RO
TEC
T0
2.0
8.2
01
01
00
,00
0,0
00,0
00,0
00,0
0R
170 2
14,0
0R
170 2
14,0
00,0
00,0
0
021095/0
29931
PO
PU
LATI
ON
AN
D
DEV
ELO
PM
ENT
Adv
isor
y co
nsul
tant
SA
NG
E0
2.0
8.2
01
00
,00
0,0
00,0
00,0
00,0
0R
99 3
16,0
0R
99 3
16,0
00,0
00,0
0
021116/0
29968
SO
CIA
L IN
SU
RA
NC
EP
rintin
g of
man
uals
LIH
LAB
ILE
EMA
HLA
BAT
HIN
I
SU
PP
LIES
05
.08
.20
10
10
0,0
00
,00
0,0
00,0
00,0
0R
355 0
00,0
0R
355 0
00,0
00,0
00,0
0

Department of Social Development | Annual Report 2010/2011 243
Per
cen
tag
eP
erce
nta
ge
Per
cen
tag
eO
uts
ourc
ed/
equ
ity
equ
ity
equ
ity
sub
con
trac
ted
Per
cen
tag
eLo
wes
tS
pec
ified
Per
cen
tag
e
RQ
nu
mb
er/
own
ersh
ipow
ner
ship
by
own
ersh
ip b
yb
usi
nes
s to
loca
lC
ontr
act
acce
pta
ble
goa
lsp
rem
ium
Ord
er n
um
ber
sD
irec
tora
teD
escr
ipti
onN
ame
of c
ontr
acto
rC
ontr
act
dat
eby
HD
Ib
lack
wom
enw
hit
e w
omen
SM
ME
’sco
nte
nt
pri
cep
rice
pre
miu
mp
aid
30206
HIV
/AID
SP
rintin
g tr
aini
ng
man
uals
EL-E
L IN
VES
TMEN
T0
2.0
9.2
01
01
00
,00
0,0
00,0
00,0
00,0
0R
420 0
00,0
0R
420 0
00,0
00,0
00,0
0
30276
SC
MTr
aini
ngA
FRIC
A IN
TER
NAT
ION
AL
AD
VOS
OR
S
08
.09
.20
10
10
0,0
00
,00
0,0
00,0
00,0
0R
50 1
25,8
0R
50 1
25,8
00,0
00,0
0
H
UM
AN
CA
PIT
AL
MA
N.
Hire
PA
sys
tem
NG
ALA
VA M
EDIA
13
.09
.20
10
0,0
00
,00
0,0
00,0
00,0
0R
120 0
00,0
0R
120 0
00,0
00,0
00,0
0
30037
CH
ILD
REN
AN
D O
LD A
GE
Trai
ning
ECO
NO
MIC
PO
LIC
Y R
ESEA
RC
H
INS
TIU
TE
16
.09
.20
10
10
0,0
00
,00
0,0
00,0
00,0
0R
43 1
50,5
0R
43 1
50,5
00,0
00,0
0
30326
CO
MM
UN
ITY
DEV
ELO
PM
ENT
SER
VIC
E S
TAN
DA
RD
Adv
isor
y co
nsul
tant
BA
RLE
DA
16
.09
.20
10
10
0,0
00
,00
0,0
00,0
00,0
0R
460 5
60,0
0R
460 5
60,0
00,0
00,0
0
30342
CH
ILD
REN
AN
D F
AM
ILY
BEN
EFIT
S
Des
ign,
layo
ut,
prin
ting
KA
RA
BA
MED
IA1
6.0
9.2
01
01
00
,00
10
0,0
00,0
00,0
00,0
0R
433 2
00,0
0R
433 2
00,0
00,0
00,0
0
30295
CO
MP
REH
ENS
IVE
SEC
UR
ITY
SER
VIC
ES
Pro
mot
iona
l ite
ms
(bag
s)
ESS
AY G
IFT
20
.09
.20
10
30
,00
35
,00
0,0
00,0
00,0
0R
484 9
40,0
4R
484 9
40,0
40,0
00,0
0
30273
AP
PEA
LS S
ERVI
CE
CEN
TRE
Ren
tal o
f ph
otoc
opie
rB
YTES
21
.09
.20
10
27
,00
6,4
90,0
00,0
00,0
0R
106 8
80,4
0R
106 8
80,4
00,0
00,0
0
30274
AP
PEA
LS S
ERVI
CE
CEN
TRE
Ren
tal o
f ph
otoc
opie
rB
YTES
21
.09
.20
10
27
,00
6,4
90,0
00,0
00,0
0R
106 8
80,4
0R
106 8
80,4
00,0
00,0
0
30395
HU
MA
N C
AP
ITA
L
MA
NA
GEM
ENT
Adv
ert
KO
NE
SO
LUTI
ON
22
.09
.20
10
0,0
00
,00
0,0
00,0
00,0
0R
135 1
58,4
0R
135 1
58,4
00,0
00,0
0
30376
CO
MM
UN
ITY
DEV
ELO
PM
ENT
SER
VIC
E S
TAN
DA
RD
Con
sltin
g se
rvic
esK
IKA
DEV
ELO
PM
ENT
23
.09
.20
10
0,0
00
,00
0,0
00,0
00,0
0R
485 1
63,0
0R
485 1
63,0
00,0
00,0
0
OR
21456
CO
MP
REH
ENS
IVE
SEC
UR
ITY
SER
VIC
ES
Sto
rage
and
tran
spor
tatio
n
THA
ND
EKA
MR
T
MA
RK
ETIN
G S
OLU
TIO
NS
01
.10
.20
10
10
0,0
01
00
,00
0,0
00,0
00,0
0R
450 0
00,0
0R
450 0
00,0
00,0
00,0
0
OR
21443
AD
OP
TIO
N A
ND
ISS
Venu
eM
AN
HAT
TAN
HO
TEL
05
.10
.20
10
0,0
00
,00
0,0
00,0
00,0
0R
120 1
76,0
0R
120 1
76,0
00,0
00,0
0
OR
21465
YOU
THVe
nue
PREM
IER
HO
TEL
AN
D R
ESO
RT0
7.1
0.2
01
00
,00
0,0
00,0
00,0
00,0
0R
100 2
00,0
0R
100 2
00,0
00,0
00,0
0
OR
-021652
CH
ILD
PR
OTE
CTI
ON
Venu
eK
OPA
NO
NG
HO
TEL
11
.10
.20
10
0,0
00
,00
0,0
00,0
00,0
0R
100 2
40,0
0R
100 2
40,0
00,0
00,0
0
OR
21508
PO
PU
LATI
ON
AN
D
DEV
ELO
PM
ENT
Prin
ting
new
sD
ITO
RO
TR
AD
ING
12
.10
.20
10
10
0,0
00
,00
0,0
00,0
00,0
0R
106 8
80,4
0R
106 8
80,4
00,0
00,0
0
OR
021516
SC
MS
tatio
nery
RA
CC
OLT
A T
EMP
O2
2.1
0.2
01
01
00
,00
10
0,0
00,0
00,0
00,0
0R
146 1
53,7
0R
146 1
53,7
00,0
00,0
0
OR
021560
OLD
ER P
ERS
ON
SO
utsi
de v
enue
MQ
AP
HEL
I SU
PP
LIER
25
.10
.20
10
0,0
00
,00
0,0
00,0
00,0
0R
169 0
62,0
0R
169 0
62,0
00,0
00,0
0
OR
021562
VIC
TIM
EM
PO
WER
MEN
TVe
nue
OR
ION
25
.10
.20
10
0,0
00
,00
0,0
00,0
00,0
0R
136 1
67,0
0R
136 1
67,0
00,0
00,0
0

244 Annual Report 2010/2011 | Department of Social Development
Per
cen
tag
eP
erce
nta
ge
Per
cen
tag
eO
uts
ourc
ed/
equ
ity
equ
ity
equ
ity
sub
con
trac
ted
Per
cen
tag
eLo
wes
tS
pec
ified
Per
cen
tag
e
RQ
nu
mb
er/
own
ersh
ipow
ner
ship
by
own
ersh
ip b
yb
usi
nes
s to
loca
lC
ontr
act
acce
pta
ble
goa
lsp
rem
ium
Ord
er n
um
ber
sD
irec
tora
teD
escr
ipti
onN
ame
of c
ontr
acto
rC
ontr
act
dat
eby
HD
Ib
lack
wom
enw
hit
e w
omen
SM
ME
’sco
nte
nt
pri
cep
rice
pre
miu
mp
aid
OR
021578
SU
BS
TAN
CE
AB
US
ETr
aini
ng o
f ke
moj
a
volu
ntee
rs
MA
ND
R B
AD
IRI C
ON
SU
LTA
NTS
26
.10
.20
10
10
0,0
01
00
,00
0,0
00,0
00,0
0R
397 5
18,0
0R
397 5
18,0
00,0
00,0
0
OR
021591
BU
SIN
ESS
PR
OC
ESS
AN
D
RIS
K M
AN
AG
EMEN
T
Prin
ting
CR
UB
AR
28
.10
.20
10
0,0
00
,00
0,0
00,0
00,0
0R
162 7
77,0
0R
162 7
77,0
00,0
00,0
0
OR
021601
CO
MM
UN
ITY
DEV
ELO
PM
ENT
SER
VIC
E S
TAN
DA
RD
Venu
eP
REM
IER
HO
TEL
AN
D R
ESO
RT
29
.10
.20
10
0,0
00
,00
0,0
00,0
00,0
0R
198 7
50,0
0R
198 7
50,0
00,0
00,0
0
OR
-021610
SU
BS
TAN
CE
AB
US
ED
evel
opm
ent
of
trea
tmen
t m
odel
SA
NC
A0
1.1
1.2
01
00
,00
0,0
00,0
00,0
00,0
0R
499 1
34,5
0R
499 1
34,5
00,0
00,0
0
OR
-021629
AP
PEA
LSC
ompu
ter
euip
men
tU
BU
NTU
TEC
HN
OLO
GIE
S0
2.1
1.2
01
05
5,0
01
0,0
00,0
00,0
00,0
0R
254 9
45,4
4R
254 9
45,4
40,0
00,0
0
OR
-021467
VIC
TIM
EM
PO
WER
MEN
TC
onsu
ltatio
n fo
r
sust
aina
bilit
y pl
an
4 C
HA
KR
AS
04
.11
.20
10
0,0
00
,00
0,0
00,0
00,0
0R
349 4
67,0
0R
349 4
67,0
00,0
00,0
0
OR
-021656
EMP
LOYM
ENT
AS
SIS
TAN
CE
Des
ign,
layo
ut a
nd
prin
ting
bann
ers
GR
EYS
TON
E P
RO
JEC
TS C
C0
4.1
1.2
01
05
0,0
05
1,0
00,0
00,0
00,0
0R
195 1
02,5
4R
195 1
02,5
40,0
00,0
0
OR
-02178
STR
ATEG
Y P
LAN
NIN
G
AN
D M
AN
AG
EMEN
T
Venu
eK
IEW
IETS
10
.11
.20
10
10
0,0
00
,00
0,0
00,0
00,0
0R
155 5
50,0
0R
155 5
50,0
00,0
00,0
0
OR
-021683
OLD
ER P
ERS
ON
SVe
nue
EMP
ERO
RS
PA
LAC
E1
6.1
1.2
01
00
,00
0,0
00,0
00,0
00,0
0R
221 5
50,0
0R
221 5
50,0
00,0
00,0
0
OR
-021725
EMP
LOYM
ENT
AS
SIS
TAN
CE
Ente
rtai
nmen
tA
FRIC
AN
FR
ENZY
17
.11
.20
10
0,0
00
,00
0,0
00,0
00,0
0R
160 0
00,0
0R
160 0
00,0
00,0
00,0
0
OR
-021521
AP
PEA
LSP
hoto
copy
mac
hine
BYT
ES2
2.1
1.2
01
02
7,0
06
,49
0,0
00,0
00,0
0R
141 5
43,0
0R
141 5
43,0
00,0
00,0
0
OR
-021709
AP
PEA
LSP
hoto
copy
mac
hine
BYT
ES2
2.1
1.2
01
02
7,0
06
,49
0,0
00,0
00,0
0R
141 5
43,0
0R
141 5
43,0
00,0
00,0
0
OR
-021708
AP
PEA
LSP
hoto
copy
mac
hine
BYT
ES2
2.1
1.2
01
02
7,0
06
,49
0,0
00,0
0,0
R141 5
43,0
0R
141 5
43,0
00,0
00,0
0
OR
-021742
AP
PEA
LSP
hoto
copy
mac
hine
BYT
ES2
2.1
1.2
01
02
7,0
06
,49
0,0
00,0
0,0
R141 5
43,0
0R
141 5
43,0
00,0
00,0
0
OR
-021747
AP
PEA
LSP
hoto
copy
mac
hine
BYT
ES2
2.1
1.2
01
02
7,0
06
,49
0,0
00,0
0,0
R141 5
43,0
0R
141 5
43,0
00,0
00,0
0
OR
-021706
AP
PEA
LSP
hoto
copy
mac
hine
BYT
ES2
2.1
1.2
01
02
7,0
06
,49
0,0
00,0
0,0
R141 5
43,0
0R
141 5
43,0
00,0
00,0
0
OR
-021745
AP
PEA
LSP
hoto
copy
mac
hine
BYT
ES2
2.1
1.2
01
02
7,0
06
,49
0,0
00,0
0,0
R141 5
43,0
0R
141 5
43,0
00,0
00,0
0
OR
-021743
AP
PEA
LSP
hoto
copy
mac
hine
BYT
ES2
2.1
1.2
01
02
7,0
06
,49
0,0
00,0
0,0
R141 5
43,0
0R
141 5
43,0
00,0
00,0
0
Rep
ort
ing
on
su
pp
ly c
ha
in m
an
ag
emen
t i
nfo
rma
tion

Department of Social Development | Annual Report 2010/2011 245
Per
cen
tag
eP
erce
nta
ge
Per
cen
tag
eO
uts
ourc
ed/
equ
ity
equ
ity
equ
ity
sub
con
trac
ted
Per
cen
tag
eLo
wes
tS
pec
ified
Per
cen
tag
e
RQ
nu
mb
er/
own
ersh
ipow
ner
ship
by
own
ersh
ip b
yb
usi
nes
s to
loca
lC
ontr
act
acce
pta
ble
goa
lsp
rem
ium
Ord
er n
um
ber
sD
irec
tora
teD
escr
ipti
onN
ame
of c
ontr
acto
rC
ontr
act
dat
eby
HD
Ib
lack
wom
enw
hit
e w
omen
SM
ME
’sco
nte
nt
pri
cep
rice
pre
miu
mp
aid
OR
-021748
AP
PEA
LSP
hoto
copy
mac
hine
BYT
ES2
2.1
1.2
01
02
7,0
06
,49
0,0
00,0
0,0
R141 5
43,0
0R
141 5
43,0
00,0
00,0
0
OR
-021754
CO
MM
UN
ICAT
ION
SVe
nue
GA
LLA
GH
ER C
ON
VEN
TIO
N
CEN
TRE
29
.11
.20
10
0,0
00
,00
0,0
00,0
00,0
0R
309 0
25,4
5R
309 0
25,4
50,0
00,0
0
OR
-021880
RET
IREM
ENT
REF
OR
MA
ppoi
ntm
ent
for
spec
ialis
t re
gula
tor
HYM
CO
NS
ULT
ING
01
.01
.20
11
10
0,0
00
,00
0,0
00,0
00,0
0R
500 0
00,0
0R
500 0
00,0
00,0
00,0
0
OR
-022026
RET
IREM
ENT
Prin
ting
NTE
FU D
ESIG
NS
02
.02
.20
11
10
0,0
07
0,0
00,0
00,0
00,0
0R
165 5
50,0
0R
165 5
50,0
00,0
00,0
0
OR
-021952
ECD
Venu
eB
IRC
HW
OO
D H
OTE
L0
7.0
2.2
01
10
,00
0,0
00,0
00,0
00,0
0R
156 0
70,0
0R
156 0
70,0
00,0
00,0
0
OR
-021978
SU
BS
TAN
CE
AB
US
EP
rintin
g C
DA
rep
ort
BLU
E R
OC
K0
9.0
2.2
01
11
00
,00
50
,00
0,0
00,0
00,0
0R
174 0
75,0
0R
174 0
75,0
00,0
00,0
0
RQ
-031292
SU
BS
TAN
CE
AB
US
EP
rom
otio
nal i
tem
sN
ATH
Y TR
AD
ING
11
.02
.20
11
10
0,0
00
,00
0,0
00,0
00,0
0R
307 2
30,0
0R
307 2
30,0
00,0
00,0
0
OR
-021993
SU
BS
TAN
CE
AB
US
EB
anne
rsM
JULU
KO
TR
AD
ING
SU
PP
LIES
11
.02
.20
11
10
0,0
00
,00
0,0
00,0
00,0
0R
174 0
00,0
0R
174 0
00,0
00,0
00,0
0
OR
-021971
INS
TITU
TIO
NA
L
CO
-0R
DIN
ATIO
N
Out
side
ven
ueP
RO
TEA
IMP
ERIA
L1
1.0
2.2
01
10
,00
0,0
00,0
00,0
00,0
0R
152 1
40,0
0R
152 1
40,0
00,0
00,0
0
OR
-021992
SU
BS
TAN
CE
AB
US
EZ-
card
sN
BS
PR
INTI
NG
11
.02
.20
11
10
0,0
05
0,0
00,0
00,0
00,0
0R
130 0
00,0
0R
130 0
00,0
00,0
00,0
0
OR
-021998
SU
BS
TAN
CE
AB
US
EP
rintin
g bo
okle
tsB
EVU
BEM
AS
WAT
I SER
VIC
ES1
1.0
2.2
01
11
00
,00
50
,00
0,0
00,0
00,0
0R
101 7
00,0
0R
101 7
00,0
00,0
00,0
0
OR
-022003
FAM
ILIE
SP
rintin
g se
rvic
esN
ATH
Y TR
AD
ING
14
.02
.20
11
10
0,0
00
,00
0,0
00,0
00,0
0R
153 8
50,0
0R
153 8
50,0
00,0
00,0
0
OR
-021985
SU
BS
TAN
CE
AB
US
ES
crib
er s
ervi
ces
QU
ICK
TIM
E1
4.0
2.2
01
11
00
,00
50
,00
0,0
00,0
00,0
0R
130 9
50,0
0R
130 9
50,0
00,0
00,0
0
OR
-022021
HU
MA
N C
AP
ITA
L
MA
NA
GEM
ENT
Venu
eTH
E FA
RM
INN
17
.02
.20
11
0,0
00
,00
0,0
00,0
00,0
0R
107 5
28,0
0R
107 5
28,0
00,0
00,0
0
OR
-022017
FIN
AN
CIA
L M
AN
AG
EMEN
TC
ompu
ters
CH
M V
UW
AN
I1
8.0
2.2
01
17
6,0
02
8,0
00,0
00,0
00,0
0R
114 0
54,8
1R
114 0
54,8
10,0
00,0
0
OR
-022043
CO
MM
UN
ITY
DEV
ELO
PM
ENT
SER
VIC
E S
TAN
DA
RD
Venu
eK
OPA
NO
NG
HO
TEL
18
.02
.20
11
0,0
00
,00
0,0
00,0
00,0
0R
127 2
50,0
0R
127 2
50,0
00,0
00,0
0
OR
-022069
AP
PEA
LSA
udio
vis
ual
MET
RO
HO
ME
23
.02
.20
11
0,0
00
,00
0,0
00,0
0,0
R206 9
77,0
0R
206 9
77,0
00,0
00,0
0
OR
-022112
SO
CIA
L IN
SU
RA
NC
E C
onsu
ltant
to
deve
lop
polic
y fr
amew
ork
ICT
WO
RK
S2
4.0
2.2
01
10
,00
0,0
00,0
00,0
00,0
0R
497 6
67,0
0R
497 6
67,0
00,0
00,0
0
OR
-021586
INTE
RN
ATIO
NA
L S
OC
IAL
SEC
UR
ITY
AG
ENC
Y
Pho
toco
py m
achi
neB
YTES
24
.02
.20
11
0,0
00
,00
0,0
00,0
00,0
0R
212 3
60,4
0R
212 3
60,4
00,0
00,0
0
OR
-022055
INS
TITU
TIO
NA
L
CO
-0R
DIN
ATIO
N
Venu
eP
RO
TEA
HO
TEL
24
.02
.20
11
0,0
00
,00
0,0
00,0
00,0
0R
193 5
40,0
0R
193 5
40,0
00,0
00,0
0

246 Annual Report 2010/2011 | Department of Social Development
Per
cen
tag
eP
erce
nta
ge
Per
cen
tag
eO
uts
ourc
ed/
equ
ity
equ
ity
equ
ity
sub
con
trac
ted
Per
cen
tag
eLo
wes
tS
pec
ified
Per
cen
tag
e
RQ
nu
mb
er/
own
ersh
ipow
ner
ship
by
own
ersh
ip b
yb
usi
nes
s to
loca
lC
ontr
act
acce
pta
ble
goa
lsp
rem
ium
Ord
er n
um
ber
sD
irec
tora
teD
escr
ipti
onN
ame
of c
ontr
acto
rC
ontr
act
dat
eby
HD
Ib
lack
wom
enw
hit
e w
omen
SM
ME
’sco
nte
nt
pri
cep
rice
pre
miu
mp
aid
OR
-022083
OLD
ER P
ERS
ON
PA s
yste
mB
LUE
RO
CK
EN
TER
PR
ISE
01
.03
.20
11
10
0,0
05
0,0
00,0
00,0
00,0
0R
200 0
00,0
0R
200 0
00,0
00,0
00,0
0
OR
-022201
CU
STO
MER
CA
RE
Ref
urbi
sh o
ffice
DIT
LHA
LOG
AN
YO
04
.03
.20
11
10
0,0
00
,00
0,0
00,0
00,0
0R
107 4
50,0
0R
107 4
50,0
00,0
00,0
0
OR
-022119
SC
MS
tatio
nery
GO
VER
NM
ENT
PR
INTI
NG
07
.03
.20
11
0,0
00
,00
0,0
00,0
00,0
0R
175 4
17,2
2R
175 4
17,2
20,0
00,0
0
OR
-0221731
INFO
RM
ATIO
N
TEC
HN
OLO
GIE
S
Cel
lpho
nes
PIN
NA
CLE
AFR
ICA
08
.03
.20
11
29
,40
13
,32
0,0
00,0
00,0
0R
316 2
62,7
5R
316 2
62,7
50,0
00,0
0
OR
-022230
AP
PEA
LSA
udio
vis
ual
equi
pmen
t
SH
IMB
ALI
TR
AD
ING
29
.03
.20
11
10
0,0
01
00
,00
0,0
00,0
00,0
0R
212 1
50,0
0R
212 1
50,0
00,0
00,0
0
OR
021592
CH
ILD
REN
Prin
ting
of
prom
otio
nal i
tem
s
MIN
TIR
O T
RA
DIN
G2
0.1
0.2
02
01
00
,00
0,0
00,0
00,0
00,0
0R
499 0
00
R499 0
00
0,0
00,0
0
OR
-021760
CO
MM
UN
ICAT
ION
SP
rom
otio
nal i
tem
sB
OTT
OM
LIN
E2
6.1
0.3
02
00
,00
10
0,0
00,0
00,0
00,0
0R
193 0
00,0
0R
193 0
00,0
00,0
00,0
0
R16 7
16 5
87,6
9R
16 7
16 5
87,6
90,0
00,0
0
Rep
ort
ing
on
su
pp
ly c
ha
in m
an
ag
emen
t i
nfo
rma
tion

Department of Social Development | Annual Report 2010/2011 247
Con
trac
ts m
ore
than
R5
00
00
0
Per
cen
tag
eP
erce
nta
ge
Per
cen
tag
eO
uts
ourc
ed/
equ
ity
equ
ity
equ
ity
sub
con
trac
ted
Per
cen
tag
eLo
wes
tS
pec
ified
Per
cen
tag
e
RQ
nu
mb
er/
own
ersh
ipow
ner
ship
by
own
ersh
ip b
yb
usi
nes
s to
loca
lC
ontr
act
acce
pta
ble
goa
lsp
rem
ium
Ord
er n
um
ber
sD
irec
tora
teD
escr
ipti
onN
ame
of c
ontr
acto
rC
ontr
act
dat
eby
HD
Ib
lack
wom
enw
hit
e w
omen
SM
ME
’sco
nte
nt
pri
cep
rice
pre
miu
mp
aid
SD
18/2
010
SO
CIA
L IN
SU
RA
NC
EH
iring
of
a do
me
stru
ctur
e an
d
serv
ices
at
the
Wor
ld S
ocia
l
Sec
urity
For
um in
Cap
e To
wn
26
Nov
embe
r to
06
Dec
embe
GEA
R S
OU
TH A
FRIC
A
(PTY
) LI
MIT
ED
01
.11
.20
10
00
00
100
R3 1
61 1
04,4
8R
3161104,4
80
0
SD
14/2
010
SO
CIA
L IN
SU
RA
NC
EC
ater
ing
for
gala
din
ner
at
the
WS
SF
conf
eren
ce in
Cap
e
Tow
n
EXTR
EME
KW
IZEE
N0
2.1
2.2
01
02
6,2
00
00
100
R1 0
54 0
82,1
9R
1 0
54 0
82,1
90
0
SD
15/2
010
SO
CIA
L IN
SU
RA
NC
ER
ende
ring
of s
hutt
le a
t th
e
wss
f co
nfer
ence
in c
ape
tow
n
21
Nov
embe
r to
05
Dec
XILO
NG
AN
I HO
LDIN
G
(PTY
) LIM
ITED
21
.11
.20
10
10
00
00
100
R1 6
62 8
00,0
0R
1 6
01 2
00,0
0R
61 6
00,0
03,8
4
SD
16/2
010
SO
CIA
L IN
SU
RA
NC
EH
iring
of
déco
r fo
r tw
o ev
ents
at t
he w
ssf
in c
ape
tow
n on
29
Nov
to
02
Dec
embe
r
PET
AL
GR
OU
P2
9.1
1.2
01
00
0100
0100
R630 0
34,6
8R
630 0
34,6
80
0
SD
06/2
010
NO
N-P
RO
FIT
OR
GA
NIS
ATIO
N
Elec
tron
ic s
cann
ing
and
data
capt
urin
g on
NP
O a
pplic
atio
n
form
s an
d fin
anci
al s
tate
men
t
DAT
A C
ENTR
IX
(PTY
) LIM
ITED
01
.01
.20
11
00
00
100
R848 9
33,6
5R
848 9
33,6
50
0
SD
07/2
010
ITR
enew
al o
f en
terp
rise
agre
emen
t w
ith m
icro
soft
SIT
A (P
TY) L
IMIT
ED0
1.0
1.2
01
10
00
0100
R1 4
67 4
16,3
2R
1 4
67 4
16,3
2R
0,0
00
SD
08/2
010
SYS
TEM
DEV
ELO
PM
ENT
Dev
elop
men
t of c
hild
reg
iste
r
for
adop
tabl
e ch
ildre
n an
d
pros
pect
ive
adop
tive
pare
nts
SIT
A (P
TY) L
IMIT
ED0
1.0
9.2
01
00
00
0100
R663 2
62,9
4R
663 2
62,9
40
0
SD
09/2
010
ITP
rocu
rem
ent
of d
ata
line
and
rout
ers
for
two
offic
es o
f th
e
App
eals
Trib
unal
in P
reto
ria
and
Dur
ban
SIT
A (P
TY) L
IMIT
ED0
1.0
9.2
01
00
00
0100
R512 3
09,9
9R
512 3
09,9
90
0
SD
10/2
010
ITEs
tabl
ishm
ent
of a
com
pute
r
room
at
the
App
eals
Trib
unal
in P
reto
ria
SIZ
WE
BU
SIN
ESS
NET
WO
RK
29
.10
.20
10
20
00
0100
R550 4
31,4
0R
550 4
31,4
00
0
SD
05/2
010
ITEs
tabl
ishm
ent
of IC
T ne
twor
k
infr
astr
uctu
re a
t th
e of
fice
of
the
App
eals
Trib
unal
in P
reto
ria
and
Dur
ban
TSS
MA
NA
GED
SER
VIC
ES
01
.10
.20
10
10
04
00
0100
R2 3
92 9
42,1
1R
1 9
64 9
67,8
3R
427 9
74,2
821,7
8

248 Annual Report 2010/2011 | Department of Social Development
Per
cen
tag
eP
erce
nta
ge
Per
cen
tag
eO
uts
ourc
ed/
equ
ity
equ
ity
equ
ity
sub
con
trac
ted
Per
cen
tag
eLo
wes
tS
pec
ified
Per
cen
tag
e
RQ
nu
mb
er/
own
ersh
ipow
ner
ship
by
own
ersh
ip b
yb
usi
nes
s to
loca
lC
ontr
act
acce
pta
ble
goa
lsp
rem
ium
Ord
er n
um
ber
sD
irec
tora
teD
escr
ipti
onN
ame
of c
ontr
acto
rC
ontr
act
dat
eby
HD
Ib
lack
wom
enw
hit
e w
omen
SM
ME
’sco
nte
nt
pri
cep
rice
pre
miu
mp
aid
DS02/2
010
ITR
enew
al o
f de
part
men
tal
stor
age
area
net
wor
k su
ppor
t
and
mai
nten
ance
for
a p
erio
d
of 1
2 m
onth
s
SIT
HA
BIL
E S
TOR
AG
E
INTE
GR
ATIO
N (P
TY)
LIM
ITED
01
.06
.20
10
10
04
00
0100
R1 8
59 8
96,2
6R
1 8
59 8
96,2
60
0
SD
17/2
010
VEP
AN
D F
AM
ILIE
SD
evel
op a
nd c
ondu
ct a
n
Ann
ual V
ictim
Sat
isfa
ctio
n
Sur
vey
TALE
NTN
ET
CO
NS
ULT
ING
(PTY
)
LIM
ITED
01
.01
.20
11
10
01
00
00
100
R3 7
76 3
75,0
0R
3 7
76 3
75,0
00
0
SD
03/2
010
CIO
Pur
chas
ing
of c
ompu
ter
hard
war
e fo
r th
e ho
stin
g of
the
natio
nal i
nteg
rate
d in
form
atio
n
syst
em
UB
UN
TU T
ECH
NO
LOG
Y0
1.0
6.2
01
05
51
00
0100
R957 8
24,0
3R
957 8
24,0
30
0
SD
03/2
009
SEC
UR
ITY
MA
NA
GEM
ENT
Ren
derin
g of
cle
anin
g se
rvic
es
at t
he h
src
build
ing
LETA
GO
IND
US
TRIA
L
CLE
AN
ING
01
.03
.20
10
10
01
00
00
100
R1 3
30 0
26,7
2R
971 8
57,0
0R
358 1
69,7
236
SD
13/2
009
SEC
UR
ITY
MA
NA
GEM
ENT
Ren
derin
g of
a 2
4-h
our
secu
rity
guar
d se
rvic
e at
the
HS
RC
bui
ldin
g
BO
RN
TO
PR
OTE
CT
SEC
UR
ITY
SER
VIC
ES
01
.07
.20
10
10
00
00
100
R2 2
37 1
57,1
2R
1989792
R247365,1
212,4
3
SD
23/2
008
SO
CIA
L A
SS
ISTA
NC
ED
evel
opm
ent
of a
nat
iona
l
soci
al b
udge
t fo
r th
e
depa
rtm
ent
of s
ocia
l
deve
lopm
ent
OXF
OR
D P
OLI
CY
MA
NA
GEM
ENT
01
.07
.20
10
00
00
0R
5 5
39 8
70,0
0R
4745205,0
0R
794 6
65,0
016,7
4
SD
18/2
010
SO
CIA
L IN
SU
RA
NC
EEn
tert
ainm
ent
RIC
HA
RD
CO
CK
01
.12
.20
10
00
00
100
R530 7
61,2
0R
530 7
61,2
00
0
R29 1
75 2
28,0
9R
26 2
85 4
53,9
7R
2 8
89 7
74,1
2
Rep
ort
ing
on
su
pp
ly c
ha
in m
an
ag
emen
t i
nfo
rma
tion

Abbreviations and Acronyms
Part
F

250 Annual Report 2010/2011 | Department of Social Development
Abbreviations and acronyms
Statutory bodiesCDA Central Drug Authority SA
DRFB Disaster Relief Fund Board
RFB Refugee Relief Fund Board
SACSSP South African Council of Social Services Professions
SPFB State President Fund Board
SRFB Social Relief Fund Board
Entities NDA National Development Agency
SASSA South African Social Services Agency
Department of Social DevelopmentADRA Adventist Development and Relief Agency
AIDS Acquired Immune Deficiency Syndrome
AFM Apostolic Faith Mission
AICDD Africa Institute for Community Driven Development
APS Anti Poverty Strategy
APSTAR Applied Population Science in Training and Research
APP Annual Performance Plan
APO Assistant Probation Officer
ASGI-SA Accelerated and Shared Growth Initiative of South Africa
ARV Anti-retroviral Treatment
AU African Union (Formerly OAU)
BAS Basic Accounting System
CBO Community Based Organization
CBP Community Based Planning
CCF Child Care Forums
CCG Community Care Givers
CD Community Development
CDA Central Drug Authority
CDF Community Development Forum
CDG Care Dependency Grant
CDP Community Development Policy
CDW Community Development Worker
CEO Chief Executive Officer
CFO Chief Financial Officer
CHH Child Headed Households
CIDA Canadian International Development Agency
CLWS Children Living and Working on the Streets
COGTA Cooperative Governance and Traditional Affairs
CORN Community Organization Regional Network
CP Country Programme
CSG Child Support Grant
CSO Civil Society Organization
CPR Computer Peripheral Repairs
CWLC Child Welfare League of Canada
CYCC Child and Youth Care Centre
DCS Department of Correctional Services
DG Director General
DDG Deputy Director General
DEAFSA Death Federation of South Africa
DFID Department for International Development
DPLG Department of Provincial and Local Government
DPSA Department of Public Service and Administration
DRC Democratic Republic of Congo
DSD Department of Social Development
DWAF Department of Water Affairs and Forestry
EC Eastern Cape
EU- PDPHC European Union-Partnership for Delivery of Primary
Health Care
ECD Early Childhood Development
ENE Estimates of National Expenditure
EPWP Extended Public Works Programme
ETDSETA Education, Training and Development Practices Sector
Education and Training Authority
EXCO Executive Committee
FAMSA Family and Marriage Association of South Africa
FBO Faith Based Organizations
FCD Foster Child Grant
FOSAD Forum of South Africa’s Director-Generals
GAAP General Accepted Accounting Principles
GDS Growth and Development Summit
GFN Global Food Banking Network
GSSC Government Sector Security Council
GIS Geographical Information Systems
GIS Generic Indicator Sets
GCIS Government Communication and Information System
HAT Harmonised Assessment Tool

Department of Social Development | Annual Report 2010/2011 251
MINMEC Minister and Members of the Executive Committee’s
Council
MIS Management Information System
MISP Management Information System Plan
MIPAA Madrid International Plan of Action on Ageing
MOST Management of Social Transformation
MOU Memorandum of Understanding
MTEF Medium-Term Expenditure Framework
MYPP Masupatsela Youth Pioneer Programme
NACCA National Action Committee for Children Affected
NABSSA National Association of Burial Society of South Africa
NAP National Action Plan
NAPWA National Association of People Living with HIV and Aids
NC Northern Cape
NCOP National Council of Provinces
NICRO National Institute for Crime Prevention and Rehabilitation
of Offenders
NIPECD National Integrated Plan for Early Childhood Development
NISIS National Integrated Social Information System
NDA National Development Agency
NDMP National Drug Master Plan
NEDLAC National Economic Development and Labour Council
NEPAD New Partnership for Africa’s Development
NFES National Food Energy Scheme
NGO Non-Governmental Organization
NIA National Intelligence Agency
NPO Non-Profit Organization
NSSF National Social Security Fund
NTT National Task Team
NQF National Qualifications Framework
NYS National Youth Service
ODA Official Development Assistance
OSD Occupation Specific Dispensation
OPG Older Persons Grant
OVC Orphans and Vulnerable Children
PAIA Promotion of Access to Information Act
PAJA Promotion of Access to Justice Act
PALAMA Public Administration Leadership and Management
Academy
PASA Population Association for South Africa
HCBC Home/Community Based Care
HCT HIV Counselling and Testing
HDI Historically Disadvantaged Individuals
HIV Human Immunodeficiency Virus
HR Human Resources
HRD Human Resources Development
HSD Heads of Social Development
HSRC Human Science Research Council
HWSETA Health and Welfare Sector Education and Training
Authority
IBSA India, Brazil, South Africa
ICC International Convention Centre
ICDP Integrated Conference of Population and Development
ICT Information and Communication Technology
IDP Integrated Development Planning
IDT Independent Development Trust
IGR Inter-Governmental Relations
IPDET Integrated Programme for Development Education
Training
IIA Institute of Internal Auditors
ILS International LEAD Session
IM Information Management
IMST Information Management System and Technology
IT Information Technology
IPGLGS Integrated Population and Development Local
Government Strategy
ISRDP Integrated Sustainable Rural Development Programme
ISDM Integrated Service Delivery Model
ISS International Social Service
ISSA International Social Security Association
JCPS Justice, Crime Prevention Security
JEAPP Joint Economics Aids and Poverty Programme
KZN KwaZulu-Natal
LOC Local Organising Committee
MANCO Management Committee
M&E Monitoring and Evaluation
MDG Millennium Development Strategy
ME&R Monitoring, Evaluation and Reporting
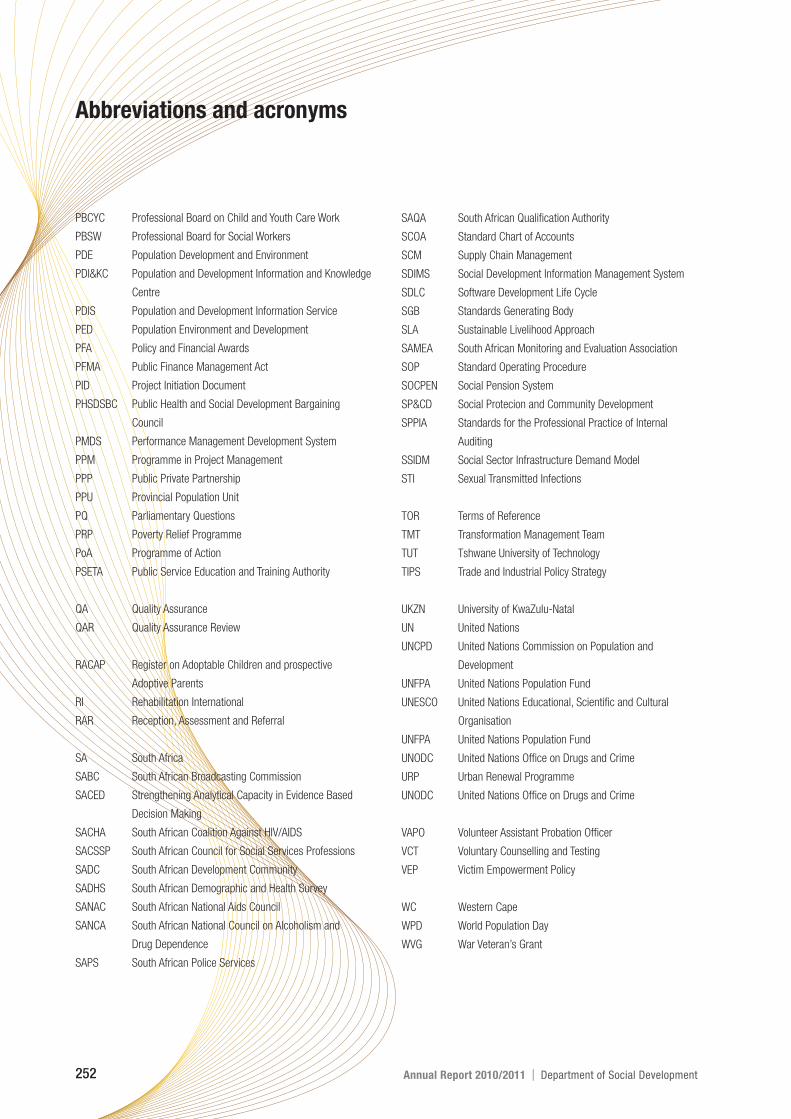
252 Annual Report 2010/2011 | Department of Social Development
Abbreviations and acronyms
PBCYC Professional Board on Child and Youth Care Work
PBSW Professional Board for Social Workers
PDE Population Development and Environment
PDI&KC Population and Development Information and Knowledge
Centre
PDIS Population and Development Information Service
PED Population Environment and Development
PFA Policy and Financial Awards
PFMA Public Finance Management Act
PID Project Initiation Document
PHSDSBC Public Health and Social Development Bargaining
Council
PMDS Performance Management Development System
PPM Programme in Project Management
PPP Public Private Partnership
PPU Provincial Population Unit
PQ Parliamentary Questions
PRP Poverty Relief Programme
PoA Programme of Action
PSETA Public Service Education and Training Authority
QA Quality Assurance
QAR Quality Assurance Review
RACAP Register on Adoptable Children and prospective
Adoptive Parents
RI Rehabilitation International
RAR Reception, Assessment and Referral
SA South Africa
SABC South African Broadcasting Commission
SACED Strengthening Analytical Capacity in Evidence Based
Decision Making
SACHA South African Coalition Against HIV/AIDS
SACSSP South African Council for Social Services Professions
SADC South African Development Community
SADHS South African Demographic and Health Survey
SANAC South African National Aids Council
SANCA South African National Council on Alcoholism and
Drug Dependence
SAPS South African Police Services
SAQA South African Qualification Authority
SCOA Standard Chart of Accounts
SCM Supply Chain Management
SDIMS Social Development Information Management System
SDLC Software Development Life Cycle
SGB Standards Generating Body
SLA Sustainable Livelihood Approach
SAMEA South African Monitoring and Evaluation Association
SOP Standard Operating Procedure
SOCPEN Social Pension System
SP&CD Social Protecion and Community Development
SPPIA Standards for the Professional Practice of Internal
Auditing
SSIDM Social Sector Infrastructure Demand Model
STI Sexual Transmitted Infections
TOR Terms of Reference
TMT Transformation Management Team
TUT Tshwane University of Technology
TIPS Trade and Industrial Policy Strategy
UKZN University of KwaZulu-Natal
UN United Nations
UNCPD United Nations Commission on Population and
Development
UNFPA United Nations Population Fund
UNESCO United Nations Educational, Scientific and Cultural
Organisation
UNFPA United Nations Population Fund
UNODC United Nations Office on Drugs and Crime
URP Urban Renewal Programme
UNODC United Nations Office on Drugs and Crime
VAPO Volunteer Assistant Probation Officer
VCT Voluntary Counselling and Testing
VEP Victim Empowerment Policy
WC Western Cape
WPD World Population Day
WVG War Veteran’s Grant

Produced by Acumen Publishing Solutions
Images: Department of Social Development, iStockphoto,
Picturenet, Riaan de Villiers

Enquiries: Chief Directorate Communications
Department of Social Development
Private Bag X901, Pretoria
Republic of South Africa
Tel: +27 12 312 7500/7653/7654
Fax: +27 12 312 7949 or +27 (0) 86 716 7482
Website: www.dsd.gov.za
RP242/2011 ISBN: 978-0-621-40389-3
www.dsd.gov.za