Book 14-2.indb - WHO | World Health Organization
255
-
Upload
khangminh22 -
Category
Documents
-
view
3 -
download
0
Transcript of Book 14-2.indb - WHO | World Health Organization


Eastern La Revue de SantéMediterranean de la MéditerranéeHealth Journal orientale
Vol. 14 No. 2 March/Mars April/Avril
2008 نيسان/أبريلاملجلد الرابع عشر، العدد ٢ آذار/مارس
ContentsLetter from the Editor .....................................................................................................................................................250Research articles
Role of some environmental factors on the breeding activity of Anopheles arabiensis in New Halfa town, eastern Sudan
Y.E. Himeidan and E.El-A. Rayah .........................................................................................................................252
Laboratory evaluation of 3 repellents against Anopheles stephensi in the Islamic Republic of Iran H. Vatandoost and A.A. Hanafi-Bojd .....................................................................................................................260
Primary isolation and detection of Helicobacter pylori from dyspeptic patients: a simple, rapid method
A. Al-Sulami, H.S. Al-Kiat, L.K. Bakker and H. Hunoon .......................................................................................268
Meningococcal carrier rate before and after hajj pilgrimage: effect of single dose ciprofloxacin on carriage
A. Alborzi, S. Oskoee, B. Pourabbas, S. Alborzi, B. Astaneh, M.M. Gooya and MJ. Kaviani ...............................277
Clinical and laboratory profile of patients with tuberculosis/HIV coinfection at a national referral centre: a case series
P. Tabarsi, S.M. Mirsaeidi, M. Amiri, S.D. Mansouri, M.R. Masjedi and A.A. Velayati .......................................283
Knowledge and attitude about HIV/AIDS of schoolteachers in Yazd, Islamic Republic of Iran S.S. Mazloomy and M.H. Baghianimoghadam ......................................................................................................292
Knowledge, attitudes and beliefs about tuberculosis in urban MoroccoS. Ottmani, Z. Obermeyer, N. Bencheikh and J. Mahjour ....................................................................................298
Effects of omega-3 fatty acid supplements on serum lipids, apolipoproteins and malondialdehyde in type 2 diabetes patients
F. Shidfar, A. Keshavarz, S. Hosseyni, A. Ameri and S. Yarahmadi .......................................................................305
Patterns of lipid changes among type 2 diabetes patients in SudanH.A. Elnasri and A.M. Ahmed ...............................................................................................................................314
Thyroid autoantibodies in women with and without thyroid disorders in an iodine-replete area A. Aminorroaya, M. Momenzadeh, S. Hovsepian, S. Haghighi and M. Amini ......................................................325
Body mass index of Kuwaiti adolescents aged 10–14 years: reference percentiles and curvesA.N. Al-Isa and L. Thalib ......................................................................................................................................333

Self-reported knowledge and pattern of physical activity among school students in Al Khobar, Saudi Arabia
A.Z.A. Taha .............................................................................................................................................................344
Facial cleft and associated anomalies: incidence among infants at a Jordanian medical centreH.E. Aqrabawi........................................................................................................................................................356
Comparison of oral ibuprofen and indomethacin on closure of patent ductus arteriosus in preterm infants
Sh. Pourarian, N. Pishva, A. Madani and M. Rastegari ........................................................................................360
Profile of paediatric emergency cases in Yemen: the need for evidence-based guidelinesA.A. Ishak, N.H. Al-Jayefy and Y.A. Raja’a ...........................................................................................................366
Nocturnal enuresis and its treatment among primary-school children in Oromieh, Islamic Republic of Iran
N. Pashapour, S. Golmahammadlou and H. Mahmoodzadeh................................................................................376
Knowledge of Iraqi primary health care physicians about breastfeedingE.J. Al-Zwaini, S.J. Al-Haili and T.M. Al-Alousi ...................................................................................................381
Attitudes and beliefs about cervical smear testing in ever-married Jordanian womenZ.O. Amarin, L.F. Badria and B.R. Obeidat ..........................................................................................................389
Community-based study of unintentional injuries among preschool children in DamascusH. Bashour and M. Kharouf .................................................................................................................................398
Flying bullets and speeding cars: analysis of child injury deaths in the Palestinian TerritoryA. Shaheen and P. Edwards ....................................................................................................................................406
Perspectives on domestic violence: case study from Karachi, PakistanF. Rabbani, F. Qureshi and N. Rizvi ......................................................................................................................415
Development of the International Consortium for Blood Safety (ICBS) HCV panelsS. Diaz, P. Liu, W.L. Kuhnert, M. Healy, A.M. Prince and M.M. El-Nageh ..........................................................427
Frequency of and barriers to utilization of mental health services in an Iranian populationA. Ghanizadeh, N. Arkan, M.R. Mohammadi , M.A. Ghanizadeh-Zarchi and J. Ahmadi .....................................438
Using SERVQUAL for assessing and improving patient satisfaction at a rural health facility in Pakistan
B.T. Shaikh, N. Mobeen, S.I. Azam and F. Rabbani ...............................................................................................447
..............................................................................................................................................470Review
Caesarean section in countries of the Eastern Mediterranean RegionM.H. Baldo .............................................................................................................................................................470
Guidelines for authors ................................................................................................................................................490
WHO sales and discount policy ................................................................................................................................496

Dr J.A. Hashmi DTM&H, FRCP. PakistanProfessor J. Jervell MD, PhD. NorwayProfessor G.J. Johnson MA, MD, BChir, FRCS (C),
FRCOphth, DCEH. United KingdomDr M. Kassas. Emeritus Professor of Plant Ecology.
EgyptProfessor M.M. Legnain MBBS, MRCOG, FRCOG.
Libyan Arab JamahiriyaProfessor El-Sheikh Mahgoub DipBact, PhD, MD,
FRCPath. SudanProfessor A.M.A. Mandil MSc (Paediatr), MPH, DrPH.
EgyptProfessor A.B. Miller MB, FRCP. CanadaProfessor S.S. Najjar MD. LebanonDr Abubaker A. Qirbi BSc, MD (Edin), FRCPC (Can),
FRCP FRCPath (UK). Republic of YemenProfessor O.S.E. Rasslan MD, PhD. EgyptProfessor W.A. Reinké MBA, PhD. United States of
AmericaProfessor I.A. Sallam, MD, Dip High Surgery Cairo,
Honorary FRCS, PhD (Glasgow), LRCP, MRCS, FRCS (London), ECFMG. Egypt
Dr C.Th.S. Sibinga FRCP (Edin), FRCPath. The Netherlands
Mr Taoufik Zeribi Eng BSc, MSc. Tunisia
International Advisory Panel
Dr S. Aboulazm. Professor of Orthodontics. EgyptDr Abdul Rahman Al-Awadi BSc, MD, MPH, Honorary
FRCM, Ireland, Honorary Dr. Law, Korea, Honorary FRCS & P, Glasgow, FRCP, Edinbugh. Kuwait
Dr Fariba Al-Darazi RN, MSc, PhD. BahrainDr M. Al-Nozha, MD, FRCP, FACC, FESC. Professor of
Medicine and Consultant Cardiologist. Saudi ArabiaDr Ala’din Alwan MD, FRCP, FFPHM. IraqDr F. Azizi. Professor of Internal Medicine and
Endocrinology. Islamic Republic of IranDr K. Bagchi BSc, MD, PhD. IndiaProfessor K. Dawson BA, MD, PhD, FRCP, FRACP,
FRCPCH, DObst, RCOG. New ZealandProfessor Kaussay Dellagi MD. TunisiaDr R. Dybkaer MD. DenmarkDr M. Aziz El-Matri. Professor of Medicine. TunisiaProfessor F. El-Sabban BSc, MS, PhD. United States of
AmericaDr A.H. El-Shaarawi MSc (Stat), PhD (Stat). CanadaProfessor N. Fikri-Benbrahim PhD (Pub health)
(SocSci). MoroccoProfessor A.T. Florence BSc (Pharm), PhD, DSc, FRSC,
FRPharmS, FRSE. United KingdomProfessor Cheherezade M.K. Ghazi BS (Nursing), MS
(Nursing), DPH, MPA. EgyptProfessor M.A. Ghoneim MD, MD (Hons). Egypt
M. Haytham Khayat MD, FRSH, Editor-in-chief
Ahmed Ezzat Abdou BSc, DPH, PhD, Executive Editor
Editorial Board
Ibrahim M. Abdel Rahim MBBS, MPH&TM, MRCPHoussain Abouzaid MS (Chem Eng), MS (Sanit Eng), DrS Zuhair Hallaj MD, DPH, DrPHMohamed Hussein M. Khalil MD, MPH, PhD (Biostat)Haifa Madi MD, MPHBelgacem Sabri MD, MPA, MA (Econ)Abdel Aziz Saleh Dip (Hosp Pharm), Dip (Indus Pharm), PhDKassem Sara MD, MAMAnna Verster MBBS, Dip NutrM. Helmy Wahdan MD, DPH, PhD
Eastern Mediterranean Health Journal
Editorial: Fiona Curlet, Marie-France Roux, Alison Bichard, Eva Abdin
250 La Revue de Santé de la Méditerranée orientale, Vol. 14, No 2, 2008
املجلة الصحية لشرق املتوسط، منظمة الصحة العاملية، املجلد الرابع عشر، العدد ٢، ٢٠٠٨
Letter from the Editor“Protecting health from climate change” is the theme for World Health Day, 2008. In October last year, when this theme was announced, World Health Organization (WHO) Director-General Dr Margaret Chan said, “Health professionals are on the front line in dealing with the impacts of climate change. The most vulnerable populations are those who live in countries where the health sector already struggles to prevent, detect, control and treat diseases and health conditions, including malaria, malnu-trition and diarrhoea.” These three conditions are particularly relevant in the countries of the WHO Eastern Mediterranean Region (EMR). All are endemic here, and, in addition, much of the population lives in relatively poor socioeconomic circumstances.
Global warming, one of the expected consequences of climate change, will have a significant impact on the prevalence and distribution of climate-sensitive, insect-borne diseases such as malaria and dengue/dengue haemorrhagic fever. The effects are likely to be synergistic. To give one illustration, a very small increase in temperature results in a huge increase in mosquito abundance; it also shortens the development time of the malaria parasite within the body of the mosquito.
Almost every issue of the EMHJ contains research papers on insect vectors or insect vector-borne diseases. In this issue we have a paper from Sudan on the breeding activity of Anopheles arabiensis and from the Islamic Republic of Iran an evaluation of insect repellents against Anopheles stephensi.
Not all effects on health will be immediate or so direct: shifts in the major ocean currents will cause unbalanced weather patterns that will affect crops; a rise in sea level, another expected consequence of climate change, will lead to loss of land and consequently migration of populations and changes in land use. All these will affect food supply, nutrition and the availability of clean water; as a result the health and stability of the world population will deteriorate.
In the EMR, World Health Day will be celebrated through a number of activities commemorating the theme. An art competition for schoolchil-dren has been organized in collaboration with the Ministry of Education in each member country. A booklet will be published in which 10 people from diverse walks of life in each country have been invited to express just what “Protecting health from climate change” means to them personally.

Eastern Mediterranean Health Journal, Vol. 14, No. 2, 2008 251
املجلة الصحية لشرق املتوسط، منظمة الصحة العاملية، املجلد الرابع عشر، العدد ٢، ٢٠٠٨
2008
252 La Revue de Santé de la Méditerranée orientale, Vol. 14, No 2, 2008
املجلة الصحية لشرق املتوسط، منظمة الصحة العاملية، املجلد الرابع عشر، العدد ٢، ٢٠٠٨
Role of some environmental factors on the breeding activity of Anopheles arabiensis in New Halfa town, eastern SudanY.E. Himeidan1 and E.El-A. Rayah2
1Entomology Unit, Faculty of Agriculture and Natural Resources, University of Kassala, New Halfa, Sudan (Correspondence to Y.El-S. Himeidan: [email protected]).2Department of Zoology, Faculty of Science, University of Khartoum, Khartoum, Sudan.Received: 29/08/05; accepted: 04/01/06
ABSTRACT Anopheles arabiensis breeding was studied during March 1999–June 2000 in New Halfa town. Of 3642 anopheline larvae collected, 3633 (99.75%) were A. arabiensis: 82.49%, 11.56%, 3.08% and 2.88% of the larvae were collected from shallow sunlit pools resulting from pipes leakages, rain pools, irrigation canals and man-made pools respectively. The overall mean density was 24.34 lar-vae/10 dips: 40.73 during the rainy season, 30.45 during irrigation and 13.10 in the dry season. Water for crop cultivation increased the relative humidity (P = 0.013) and both factors enhanced A. arabiensis breeding (P < 0.005). There was no significant difference between the rainy and irrigation seasons. A. arabiensis breeding in this area has become perennial as a result of crop irrigation.
Rôle de certains facteurs environnementaux sur l’activité de reproduction d’Anopheles arabiensis à New Halfa (Soudan oriental)RÉSUMÉ La reproduction d’Anopheles arabiensis a été étudiée entre mars 1999 et juin 2000 à New Halfa. Sur 3642 larves d’anophèle récoltées, 3633 (99,75 %) étaient des A. arabiensis : 82,49 %, 11,56 %, 3,08 % et 2,88 % des larves ont été prélevées dans des points d’eau peu profonds et ensoleillés résultant respectivement de fuites de canalisations, de pluies, de canaux d’irrigation et de plans d’eau artificiels. La densité moyenne globale était de 24,34 larves/10 prélèvements : 40,73 pendant la saison des pluies, 30,45 pendant la saison d’irrigation et 13,10 pendant la saison sèche. L’eau destinée aux cultures augmentait l’humidité relative (p = 0,013) et ces deux facteurs favorisaient la reproduction d’A. arabiensis (p < 0,005). Il n’existait pas de différence significative entre la saison des pluies et la saison d’irrigation. La reproduction d’A. arabiensis dans cette région dure désormais toute l’année du fait de l’irrigation des cultures.
199920003642363399.75
82.492.8811.563.082.88
24.341040.7330.4513.100.013P
0.005P<

Eastern Mediterranean Health Journal, Vol. 14, No. 2, 2008 253
املجلة الصحية لشرق املتوسط، منظمة الصحة العاملية، املجلد الرابع عشر، العدد ٢، ٢٠٠٨
Introduction
Malaria is a major public health problem and more than 1 million people die every year from the direct causes of the disease with almost 90% currently concentrated in sub-Saharan Africa [1]. The control of malaria through chemotherapy has been confronted by the spread of Plasmodium falciparum resistance to antimalarial drugs [2,3]. So, efforts to reduce vector abundance are ur-gently needed to supplement the drug-based curative approach in the malaria control interventions. Approximately 90% of the malaria burden is related to environmental factors [4]. The establishment and operation of water resource development projects is an important aspect of such environmental factors, since changes in the transmission pattern of the disease following irrigation development have been reported [5]. A major study has documented increases in malaria transmission as a result of irrigation and agricultural development [6]. This is more obvious in areas with unstable malaria transmission than in areas with stable trans-mission where the introduction of irrigation schemes has no or little influence on disease prevalence [5–9]. However, the reasons for this protection are attributed partially to good access to effective antimalarial drugs and personal protection, e.g. sleeping un-der insecticide-treated bed nets [5]. Thus, malaria intervention methods should be adapted to local environmental conditions as there is no single approach that is appli-cable to all situations.
In areas with high levels of antimalar-ial drug resistance, vector control is the most practical method for reducing malaria transmission [10]. A detailed knowledge of the ecology of the local malaria vector is essential in the design of effective methods for controlling the disease by vector con-trol measures. In Sudan, very few data are available about the ecology of the principal
vector, Anopheles arabiensis, particularly in agricultural areas where irrigation has significantly increased the vector density [11–13]. The present study was conducted to elucidate the factors affecting the breed-ing activity of the vector A. arabiensis in New Halfa town, the site of the second largest irrigation scheme in Sudan.
Methods
Study areaThe study was carried out in New Halfa town (altitude 450 m, 15o 19´N & 35o 36´E), which was previously described by Himei-dan et al. [12]. It is located in the middle of the irrigated area with a climate char-acterized by a short rainy season (July–October) followed by a cool dry season with extensive irrigation activity (Novem-ber–February) and then a hot dry season (March–June). Monthly mean maximum and minimum temperature, relative humid-ity and the total annual rainfall during the study period were 38.7 oC, 22.1 oC, 41.7% and 411.4 mm respectively. The hottest months of the year are April (22.8–42 oC) and May (27.2–42.8 oC) immediately prior to the rainy season. The topography of the area is nearly flat (slope is less than 2%) with many bit holds formed as a result of high content of montmoillonitic type of clay (50%–60%). This type of soil shrinks when it dries up and expands when it becomes wet [14]. This seasonal movement of soil results in a considerable leakage of the drinking water pipes every year.
P. falciparum is the predominant ma-laria parasite species in the area with a high level of resistance to antimalarial drugs [3]; A. arabiensis is the principal malaria vector [12]. Mosquito control measures are limited to indoor residual spraying during the rainy season.
254 La Revue de Santé de la Méditerranée orientale, Vol. 14, No 2, 2008
املجلة الصحية لشرق املتوسط، منظمة الصحة العاملية، املجلد الرابع عشر، العدد ٢، ٢٠٠٨
SamplingImmature stages of A. arabiensis were sam-pled monthly at New Halfa town from March 1999 to June 2000. The sampling was carried out from 13:00 to15:00 using a standard dipper at all positive breed-ing sites that had been found in the area. The number of different larval instars was counted separately in 10 dippers. All col-lected anopheline larvae were transferred to the laboratory and their numbers in different instars were recorded following the standard method [15]. All samples were reared until adulthood to facilitate species identification by morphological characteristics [16].
Data on climate variables and water intended for crop irrigation (m
3/month)
during the study period were obtained from the meteorological and irrigation stations at New Halfa town. Irrigation water was measured as the monthly amount of water available for crop irrigation in the New Hal-fa agriculture scheme. The amount of water fluctuates depending on the yearly amount of water available in Khashm El Girba dam and on the actual monthly amount of water released from the dam to irrigate the crops cultivated in a specific time and area.
Statistical analysisData were analysed using SPSS, version 12. ANOVA (one-way analysis of variance) was used to compare the differences in the mean density of larvae at different seasons. Linear regression analysis was carried out to correlate the density of immature stages with monthly climatic variables and water intended for crop irrigation.
Results
Out of 3894 anopheline larvae collected, 3642 (93.53%) were successfully reared to adulthood. A. arabiensis was the pre-dominant species in the area and accounted
for 99.75% (3633/3642) of the adults that emerged, while A. pharoensis constituted only 0.25%. A number of Culex species were occasionally collected from the same pools.
The majority (82.49%) of the larvae were collected from the shallow sunlit pools resulting from the broken water pipes. Other breeding sites included: rain pools (11.56%), puddles of irrigation canals (stretches of water extending about 500 m from leakages of irrigation canals) (3.08%) and man-made pools (2.88%). The irrigation pools were seen occasionally during March and were limited to the edge of the town, so the few larvae collected do not reflect the ecological importance of this habitat in the area. The proportions of all A. arabiensis first instar larvae recorded in these breeding habitats were 89.2%, 4.7%, 1.2% and 4.9% respec-tively. Figure 1 shows the distribution of A. arabiensis by season and breeding habitat.
Breeding activity of A. arabiensis was found throughout the study period, even during the 2 dry seasons. The mean number of immature larvae/10 dips collected during the study period was 24.34 (95% confi-dence interval: 13.5–35.1) larvae/10 dips. There was a significant difference in the densities of immature stages between the dry and rainy seasons (P = 0.022). The highest number of immature stages (mean = 40.73 larvae/10 dips) were collected during the rainy season; the peak of density lag was approximately 1 month after the peak in rainfall. During the cool dry (irrigation) season (November–February) immature stages of A. arabiensis were present in relatively high densities (mean = 30.45 larvae/10 dips). For the 2 dry seasons mean larvae density was low (13.10 larvae/10 dips) (Table 1 and Figure 1).
The abundance of immature stages of A. arabiensis showed a statistically significant positive relationship with water intended

Eastern Mediterranean Health Journal, Vol. 14, No. 2, 2008 255
املجلة الصحية لشرق املتوسط، منظمة الصحة العاملية، املجلد الرابع عشر، العدد ٢، ٢٠٠٨
for crop irrigation (m3/month) (correlation coefficient ρ = 0.70, P = 0.002) and the rise in the relative humidity (correlation coefficient ρ = 0.65, P = 0.005) (Figures 2 and 3). A significant negative correlation
was found with maximum temperature (cor-relation coefficient ρ = –0.571, P = 0.013) (Figure 4). Increase in water intended for crop irrigation was significantly associated with an increase in relative humidity (cor-relation coefficient ρ = 0.573, P = 0.013). These were the 2 climatic variables that enhanced the larval density.
Discussion
The present ecological surveys were con-ducted on malaria vectors in New Halfa town an irrigated area in the eastern Sudan. The study confirmed that A. arabiensis is the predominant malaria vector in the area. This is in accordance with previous obser-vations in the same area and different parts of northern Sudan [11,12,17]. The breeding
Figure 1 Seasonal distribution of immature stages of Anopheles arabiensis and their breeding habitats in New Halfa town, March 1999–June 2000
Table 1 Seasonal density of immature stages of Anopheles arabiensis in New Halfa town, March 1999–June 2000
Season Larvae Mean (SD) collected (per 10 dips)
Rainy (July–October) 1629 40.73 (29.41)a
Cool dry – irrigation (November–February) 1218 30.45 (4.45)
Hot dry (March–June) 1047 13.10 (13.36)
Total 3894 24.34 (20.23)aP = 0.022.SD = standard deviation.

256 La Revue de Santé de la Méditerranée orientale, Vol. 14, No 2, 2008
املجلة الصحية لشرق املتوسط، منظمة الصحة العاملية، املجلد الرابع عشر، العدد ٢، ٢٠٠٨
Figure 2 Relationship between immature stages of Anopheles arabiensis and water intended for irrigation, March 1999–June 2000
Figure 3 Relationship between immature stages of Anopheles arabiensis and relative humidity, March1999–June 2000

Eastern Mediterranean Health Journal, Vol. 14, No. 2, 2008 257
املجلة الصحية لشرق املتوسط، منظمة الصحة العاملية، املجلد الرابع عشر، العدد ٢، ٢٠٠٨
of mosquitoes was reported throughout the year, even during the hottest months (April and May) (during the 2 dry seasons) (Ta-ble 1 and Figure 1). Similar observations have been reported in irrigated areas in the Nile valley in central and northern Sudan [13,18]. This differs from the situation in the nearby area in Gadaref state where A. arabiensis disappears in the hot dry season (March–May) [11]. In contrast, in a desert area about 20 km south-east of Omdurman, it has been reported that adult A. arabiensis females survive the long hot dry season, probably in a state of lowered physiological activity described as incomplete aestiva-tion to adapt to the harsh summer condi-tions [19]. In an alternative environment, in dry savannah, the breeding activity of A. arabiensis is entirely limited to watery microenvironments and, after a sharp con-traction in effective population size during the dry season, local populations might
rebound each year [20]. Even under the highest temperature conditions, a low level of vector breeding continued in our study area (Figure 4).
We found that the introduction of a per-manent irrigation system in the study area enhanced the 2 essential ecological factors for larval development: relative humidity and breeding habitats. It is well known that temperature and humidity affect adult and immature stages of A. arabiensis adversely [21]. The impact of irrigation was more pro-nounced during the cool dry season when the main crops cotton and wheat are culti-vated. During this period, a minor peak in the population density was observed but the difference was not statistically significant in comparison with the main peak in the rainy season (P = 0.417). Water intended for crop irrigation was significantly associated with an increase in the density of immature stages. Hence, the second peak of immature
Figure 4 Relationship between immature stages of Anopheles arabiensis and maximum temperature, March 1999–June 2000

258 La Revue de Santé de la Méditerranée orientale, Vol. 14, No 2, 2008
املجلة الصحية لشرق املتوسط، منظمة الصحة العاملية، املجلد الرابع عشر، العدد ٢، ٢٠٠٨
stages could be attributed to the period of growing crops. However, the lack of proper maintenance of the irrigation canals led to water logging and creation of ideal breeding sites for the principal vector A. arabiensis, a species that prefers to breed in open sunlit pools [8,22,23]. This was actually observed during March 1999 (Figure 1). Therefore, the breeding activity of the vector appears to be becoming perennial instead of sea-sonal as a result of irrigation of crops.
During the dry season, the continuous breeding activity of the vector A. arabiensis was reported mainly in the shallow sunlit pools resulting from leakages of water pipes (Figure 1). These breaks were found to be the most important attractive breeding habitats for the vector to lay its eggs. Ac-cording to the water supplies corporation of the town, the seasonal movement of soil could explain these breaks of pipes, which is associated with climatic conditions, i.e. temperature affects the clay soil expansion and contraction and may cause pipes to leak [14]. However, in the rainy season, larvae were observed to increase rapidly after the onset of rain in a similar way to other African countries that are characterized by dry savannah [11,20,21]. The densities during this season rose 1 month after the peak in rainfall. Hamad et al. attributed this phenomenon in eastern Sudan to the char-
acteristics of the rainfall, where breeding was possible in small pools [11]. However, frequent heavy rainfall may kill or flush away the immature stages, although, Robert et al. [24] have reported that the shocks due to raindrops are not noticeable mortal-ity factors for anopheline larvae. Evidently mosquitoes do breed during the short rainy season, but they may be subject to death as a result of natural or physical factors. Nonetheless, in our study area the mosquito population increased rapidly until the end of the rainy season, when the shortage of breeding sites and the change in climatic conditions led to a decrease in population densities.
Clearly, the breeding activity of A. ara-biensis in this area is governed by both rain-fall and periods of crop irrigation, and has now become perennial rather than seasonal as a result of the latter, and at no time during the year did the temperature go above or fall below the optimum range of the mosquito [25].
Acknowledgements
The authors wish to thank Dr Dia Eldeen Elnaem, Dr Ishag Adam and Dr Mustafa Idris Elbashir for their valuable comments on the manuscript.
References
1. The World Health Report 2004 – Chang-ing history. Geneva, World Health Organi-zation, 2004.
2. Marsh K. Malaria disaster in Africa. Lan-cet, 1998, 352:924.
3. Adam I et al. Efficacies of chloroquine, sulfadoxine–pyrimethamine and quinine in the treatment of uncomplicated, Plas-modium falciparum malaria in eastern Sudan. Annals tropical medicine and par-asitololgy, 2004, 98:661–6.
4. Health and environment in sustainable development. Five years after the Earth Summit. Geneva, World Health Organiza-tion, 1997.
5. Ijumba JN, Lindsay SW. Impact of irriga-tion on malaria in Africa: paddies paradox. Medical and veterinary entomology, 2001, 15:1–11.
6. Ghebreyesus TA et al. Incidence of ma-laria among children living near dams in northern Ethiopia: community based
Eastern Mediterranean Health Journal, Vol. 14, No. 2, 2008 259
املجلة الصحية لشرق املتوسط، منظمة الصحة العاملية، املجلد الرابع عشر، العدد ٢، ٢٠٠٨
incidence survey. British medical journal, 1999, 319:663–6.
7. Boudin C et al. Epidemiology of Plasmodi-um falciparum in a rice field and a savan-nah area in Borkina Faso. Comparative study on the acquired immunoprotection in native populations. Acta tropica, 1992, 51:103–11.
8. Mutero CM et al. Water management for controlling the breeding of Anopheles mosquitoes in rice irrigation schemes in Kenya. Acta tropica, 2000, 76:253–63.
9. Klinkenberg E et al. The phenology of malaria mosquitoes in irrigated rice fields in Mali. Acta tropica, 2003, 85:71–82.
10. Global malaria control. WHO Malaria Unit. Bulletin of the World Health Organization, 1993, 71:281–4.
11. Hamad AA et al. Marked seasonality of malaria transmission in two rural sites in eastern Sudan. Acta tropica, 2002, 83:71–82.
12. Himiedan YE et al. Anopheles arabiensis: abundance and insecticide resistance in an irrigated area of eastern Sudan. East-ern Mediterranean health journal, 2004, 10(1/2):167–74.
13. El Gaddal AA et al. Malaria control in the Gezira-Managil Irrigated Scheme of the Sudan. Journal of tropical medicine and hygiene, 1985, 88:153–9.
14. Ochtman LHJ. Soil survey report of Khashm El-Girba Scheme. Wad Medani, Soil Survey Division, Gezira Research Station, 1964.
15. Service MW. Mosquito ecology. Field sampling methods. London, Applied Sci-ence Publisher, 1976.
16. Gillies MT, DeMeillon B. The Anopheline of Africa south of the Sahara (Ethiopian Zoogeographical Region), 2nd ed. Johan-nesburg, South Africa Institute Medical Research, 1968 (No. 54).
17. Petrarca V et al. Cytogenetics of the Anopheles gambiae complex in Sudan, with special reference to An. arabiensis: relationships with East and West Africa populations. Medical and veterinary ento-mology, 2000, 14:149–64.
18. Dukeen MY, Omer SM. Ecology of the malaria vector Anopheles arabiensis Patton (Diptera:Culicidae) by the Nile in northern Sudan. Bulletin of entomological research, 1986, 76:451–67.
19. Omer SM, Cloudsely-Thompson JL. Sur-vival of female Giles through the 9 month dry season in Sudan. Bulletin of the World Health Organization, 1970, 42:319–30.
20. Taylor CE et al. Effective population size and persistence of Anopheles arabien-sis during the dry season in West Africa. Medical and veterinary entomology, 1993, 7:351–7.
21. Molineaux L et al. The epidemiology of malaria and its measurement. In: Wernsdorfer WH, McGregor I, eds. Ma-laria: principles and practice of malariol-ogy. Edinburgh, Churchill Livingstone, 1988:999–1090.
22. Mwangi RW, Mukiama TK. Irrigation scheme or mosquito hazard: a case study in Mwea Irrigated Scheme. Hydrobiologia, 1992, 232:19–22.
23. White GB. The Anopheles gambiae com-plex and malaria transmission around Kisumu, Kenya. Transactions of the Royal Society of Tropical Medicine and Hygiene, 1972, 66:572–81.
24. Robert V et al. Rainfall is not a direct mortality factor for Anopheline larvae. Parasite, 1999, 6:195–6.
25. MacDonald G. The epidemiology and control of malaria. London, Oxford Univer-sity Press, 1957.
260 La Revue de Santé de la Méditerranée orientale, Vol. 14, No 2, 2008
املجلة الصحية لشرق املتوسط، منظمة الصحة العاملية، املجلد الرابع عشر، العدد ٢، ٢٠٠٨
Laboratory evaluation of 3 repellents against Anopheles stephensi in the Islamic Republic of Iran H. Vatandoost1 and A.A. Hanafi-Bojd1
1Department of Medical Entomology and Vector Control, School of Public Health and Institute of Health Research, Tehran University of Medical Sciences, Tehran, Islamic Republic of Iran (Correspondence to H. Vatandoost: [email protected]). Received: 31/03/05; accepted: 08/02/06
ABSTRACT This study evaluated the repellency effect of 3 topical repellents (permethrin, DEET and neem tree extract) against 3–5 day old females of laboratory and field strains of Anopheles stephensi. Probing/biting rates on the shaved belly of white rabbits were counted. Effective dose (ED) 50 and ED95 values were calculated by probit statistic software. The results revealed ED50 values of 0.007, 0.005 and 0.191 mg/cm2 for permethrin, DEET and neem, respectively, against the field strain. The figures for the laboratory strain were 0.006, 0.007, 0.156 mg/cm2. Major heterogeneity of response was observed using DEET. Although neem was the least effective agent, extracts of locally produced neem oil offer a promising repellent against mosquito biting.
Évaluation en laboratoire de trois répulsifs contre Anopheles stephensi en République islamique d’Iran RÉSUMÉ Cette étude a évalué les effets de trois répulsifs topiques (perméthrine, DEET et extrait de margousier) contre des femelles de souches de laboratoire et de terrain d’Anopheles stephensi âgées de 3 à 5 jours. Les taux de piqûres/probing (pénétration des pièces buccales du moustique) sur le ventre rasé de lapins blancs ont été comptés. Les valeurs ED50 et ED95 (ED pour effective dose : dose efficace) ont été calculées à partir d’un logiciel statistique fondé sur le modèle probit. On a ainsi obtenu des valeurs ED50 de 0,007, 0,005 et 0,191 mg/cm2, respectivement, pour la perméthrine, le DEET et le margousier, par rapport à la souche de terrain. Pour la souche de laboratoire, ces chiffres étaient de 0,006, 0,007 et 0,156 mg/cm2. Une hétérogénéité de réponse très importante a été observée avec le DEET. Bien que le margousier ait été l’agent le moins efficace, les extraits d’huile de margousier produits sur place constituaient un répulsif prometteur contre les piqûres de moustiques.
DEET
ED50ED95ED500.0070.1912
0.0060.0070.1562DEET
Eastern Mediterranean Health Journal, Vol. 14, No. 2, 2008 261
املجلة الصحية لشرق املتوسط، منظمة الصحة العاملية، املجلد الرابع عشر، العدد ٢، ٢٠٠٨
Introduction
Over 2 billion people, primarily in tropical countries, are at risk from mosquito-borne diseases, such as dengue haemorrhagic fever, malaria and filariasis [1]. In the Is-lamic Republic of Iran arthropod-borne diseases such as malaria and leishmaniasis are the main public health problems. The key weapons against these are insecticides. However, the widespread use and toxico-logical profile of insecticides, as well as increasing insecticide resistance, is often problematic.
The use of topical repellents to prevent arthropod bites is an effective personal protection measure to reduce or prevent transmission of these diseases. Insect re-pellents may be as economical as vector control operations and are an alternative to chemical vector control [2].
This study tested the effectiveness of 3 repellants: • N,N-diethyl-3-methylbenzamide (DEET)
is an effective broad-spectrum repellent, and is the main ingredient in many topi-cal repellents currently available for use against insects and other arthropods af-fecting humans [3].
• The neem tree, Azadirachta indica A. Juss (Meliaceae), is known for its insec-ticidal properties [4] and the alkaloids of the neem tree have been investigated as insect antifeedants [5]. Indian scientists evaluated the efficacy of this compound as a repellent against mosquitoes and sandflies [6,7].
• Permethrin [(3-phenoxyphenyl)methyl(±)-cis,trans-3-(2,2-dichloroethenyl)-2,2-dimethyl cyclopropane carboxylate] is a synthetic pyrethroid. It is used in commercial creams and is applied to fabrics for personal protection against mosquitoes [8–12].
Field and laboratory tests with anophe-line mosquitoes have shown a wide range of sensitivity to repellents in different species as well as different areas. A comparison of 3 repellent products against Aedes aegypti and Anopheles stephensi showed that An. stephensi were equally sensitivity to the tested repellents while Ae. aegypti showed tolerance to 1 compound. This provided evidence that the repellent receptor systems of the species are physically different [13]. It suggests that different species of arthro-pods, strains within species, and individuals within strains, can vary in their susceptibil-ity to repellent compounds. This premise is supported by Rutledge et al. [14], who ob-served that 18 mosquito species and strains displayed significantly different levels of susceptibility to the repellent effects of DEET [10,15–17]. Therefore, it is neces-sary to establish the sensitivity of individual species in every malarious area.
An. stephensi Liston is the main malaria vector in southern Islamic Republic of Iran. It is resistant to dichloro-diphenyl-trichloro-ethane (DDT), dieldrin and malathion in this area [18,19]. This study was designed to evaluate 3 repellents against laboratory- and field-collected strains of An. stephensi under laboratory conditions.
Methods
Mosquitoes An. stephensi strains used in the tests were obtained from the laboratory as well as collected from the field. The colonies were maintained in Bandar Abbas Training and Public Health Research Centre. They were reared under insectary conditions at 25–29 ºC, 12:12 (light:dark) hour photo-period and 50%–70% relative humidity, and were fed with 10% aqueous sucrose solution. The field strain was reared for 5
262 La Revue de Santé de la Méditerranée orientale, Vol. 14, No 2, 2008
املجلة الصحية لشرق املتوسط، منظمة الصحة العاملية، املجلد الرابع عشر، العدد ٢، ٢٠٠٨
generations before testing, while the insec-tary strain was kept for more than 4 years. Starved 3–5-day-old females were used for the tests. The sucrose solution was with-drawn from the cage 14 hours prior to the tests.
RepellentsThe following technical-grade chemicals were tested: DEET was purchased from Merck, Germany (8.17033.1000 diethyltol-uamide USP, batch S36954, assay 98.8%, density 0.998 g/L). Neem extract was pro-vided from fruit extraction of local plants (grown in different parts of Bandar Abbas) by the Faculty of Pharmacology, Tehran University of Medical Sciences. The fruits were kept in ethanol for 1 week, filtered and concentrated under vacuum. Six phyto-chemical specific tests used on the extracts. Gas chromatography/mass spectrometry analysis showed the presence of alkaloids, acetogenin, tannins and triterpenoids and unsaturated oils. Permethrin was provided by Bayer, Germany.
Test methodWhite rabbits were used to determine the effective doses (EDs) of repellents. The test used a modification of the Klun and Debboun module [20]. A modified ASTM [American Society for Testing and Materials] standard plastic cage (1983) was employed [3]. The internal walls of the apparatus were re-moved to create a single cell with the lower surface lined with cotton net. The ED tests were conducted by applying each repellent directly to the shaved belly of the rabbit. For each dose only 1 rabbit was used. To prevent interference only 1 dose of repellent was applied in each test. For the control ex-periment only ethanol solvent was applied. The treated areas were allowed to dry and then the test chamber containing mosqui-toes was fixed onto the treated shaved belly.
Then 10–15 mosquitoes were released into the test apparatus. Probing/biting counts were recorded at 1 minute intervals up to 5 minutes. Each test cage was used only once for a given dose. After every test, mosqui-toes were removed from the test chamber using an aspirator and then transferred into a sleeved-screened cage.
Tests were repeated on different day intervals in order to obtain an estimate of ED50 and ED95. The concentrations used depended on the repellent type; the lowest and highest concentrations of repellents used were 0.0005 mg/cm2 and 1.2 mg/cm2 respectively.
Statistical analysisThe cumulative results were subjected to statistical analysis. Dosage–biting regres-sion lines were determined by probit analy-sis using a special computer programme. Goodness-of-fit of the points to a straight line were tested by the chi-squared test. Data were computer analysed by the probit plane procedure using MicroProbit, ver-sion 3.0 software. The analysis for each test yielded ED50, ED95, confidence interval (CI) and slope values. Significant differ-ences were determined by comparing the ED50s and 95% CI. The heterogeneity of the population was determined by the chi-squared test. The regression line was plotted using Microsoft Excel.
Results
The ED50 value (median effective dose) for permethrin against the laboratory strain of An. stephensi was 0.006 mg/cm2 (Table 1). The figures for DEET and neem were 0.007 and 0.156 mg/cm2 respectively. The probit regression line is plotted in Figure 1 and the slope values for each repellent are presented in Tables 1 and 2. These values

Eastern Mediterranean Health Journal, Vol. 14, No. 2, 2008 263
املجلة الصحية لشرق املتوسط، منظمة الصحة العاملية، املجلد الرابع عشر، العدد ٢، ٢٠٠٨
for the laboratory strain were –0.73, –1.19 and –1.52 for permethrin, DEET and neem respectively. Similar values were obtained with the field strain: –0.75, –1.20 and –1.32 for permethrin, DEET and neem respec-tively.
The results of tests against the field-collected strain of An. stephensi are shown in Table 2 and the probit regression line in Figure 2. The order of repellency effect of the 3 repellents against field strains of An. stephensi was DEET (strongest), permeth-rin and neem (weakest).
In the control tests almost all the starved mosquitoes fed during the test period. Al-though data from repellent studies using different test methods are not directly com-parable as different workers have shown [21], the relative sensitivity of different strains of An. stephensi to a particular repel-lent can be compared. At the ED50 level, different repellents showed no significantly different effect on laboratory and field strains, but the amount of neem required was much higher than the other 2 repellents to cause the same response in both strains of mosquito (P < 0.001).
Discussion
In a comparative study of 4 Anopheles strains to 5 repellents, the effectiveness of permethrin was second to DEET [10]. The researchers found probit log-dose slopes
were consistently the lowest for permeth-rin, but our results showed a slope of –0.73 for permethrin and –1.19 for DEET in the laboratory strain. In their study, the ED50 value for permethrin was 0.0026 (95% CI: 0.002–0.0033) and ED95 was 0.0156 (95% CI: 0.0097–0.0303) mg/cm2. Studies on the repellent effect of DEET on An. stephensi showed an ED50 of 0.0012 mg/cm2 (95% CI: 0.0003–0.0029) by Robert et al. on rabbits [10], 0.00056 mg/cm2 (95% CI: 0.00041–0.00072) by Coleman et al. [21] and 0.00013 mg/cm2 (95% CI: 0.000003–0.00059) by Klun and Debboun on humans [20].
Regarding relationship between dose and biting/probing on repellent-treated rab-bits against the laboratory strain of An. stephenis, the dose–response regression line showed significant heterogeneity for DEET. This indicates a wider range of tolerance of mosquitoes exposed to DEET.
Cosmetic acceptability is the most im-portant criterion in the widescale use of topical insect repellents. DEET has gained wide acceptance and is used in many coun-tries throughout the world. It is the most effective and best studied insect repellent currently on the market. This substance has a remarkable safety profile after 40 years of worldwide use, but toxic reactions can occur, usually when the product is misused [22]. However, a comparison of the mosquito repellant efficacy of methyl
Table 1 Repellency effect of permethrin, DEET and neem against a laboratory strain of Anopheles stephensi
Repellent ED50 95% CI ED95 95% CI Slope χ2 - (mg/cm2) of ED50 (mg/cm2) of ED95 value
Permethrin 0.006 0.005–0.007 1.035 0.706–1.628 –0.73 4.71
DEET 0.007 0.004–0.009 0.164 0.093–0.399 –1.19 34.60
Neem 0.156 0.133–0.188 1.87 1.125–4.058 –1.52 4.40ED = effective dose; CI = confidence interval.

264 La Revue de Santé de la Méditerranée orientale, Vol. 14, No 2, 2008
املجلة الصحية لشرق املتوسط، منظمة الصحة العاملية، املجلد الرابع عشر، العدد ٢، ٢٠٠٨
neodecanamide (MNDA) to that of DEET on 3 species including An. stephensi indi-cated that topical application of 1% MNDA provided significantly better protection and a broader spectrum of repellency than 1% DEET [23].
The effectiveness of permethrin as a clothing impregnation or pressurized spray
for personal protection against mosquitoes has been demonstrated [24,25]. This com-ponent has low toxicity in mammals, is poorly absorbed by the skin and is rapidly inactivated by ester hydrolysis [22].
Synthetic repellents are routinely used for prevention of arthropod bites in the Islamic Republic of Iran. Our results indi-
Table 2 Repellency effect of permethrin, DEET and neem against a field strain of Anopheles stephensi
Repellent ED50 95% CI ED95 95% CI Slope χ2 - (mg/cm2) of ED50 (mg/cm2) of ED95 value
Permethrin 0.007 0.005–0.009 1.116 0.680–2.094 –0.75 4.84
DEET 0.005 0.003–0.007 0.118 0.069–0.270 –1.20 0.19
Neem 0.191 0.156–0.249 3.380 1.701–10.347 –1.32 17.80ED = effective dose; CI = confidence interval.
Figure 1 Probit regression line of permethrin, DEET and neem against a laboratory strain of Anopheles stephensi

Eastern Mediterranean Health Journal, Vol. 14, No. 2, 2008 265
املجلة الصحية لشرق املتوسط، منظمة الصحة العاملية، املجلد الرابع عشر، العدد ٢، ٢٠٠٨
cated that DEET is a more effective repel-lent against both laboratory and field strains of An. stephensi than neem or permethrin. DEET-based repellents applied on the skin in combination with permethrin-treated clothing could provide more protection against mosquito bites [26]. Ongoing field trails on human volunteers will provide valuable information and insights into the role of particular repellents in preventing mosquito biting, especially for travellers coming into malarious areas.
Natural plant extracts have been used for centuries by local people to prevent arthro-pod bites. Our results showed that the plant-based repellent was generally less effective
than the synthetic repellents. Although it was the least effective agent, extracts of locally produced neem oil offer a promising repellent against biting. Our previous study on larvicidal activity of neem against dif-ferent species of mosquitoes showed good results in the Islamic Republic of Iran [27]. The main implications of this study are that in malarious area where An. stephensi plays an important role in malaria transmission, the local plant can be used in combination with other synthetic chemicals for reducing of malaria vector density and human–mos-quito contact, resulting in reduction of the vectorial capacity of the mosquito.
Figure 2 Probit regression line of permethrin, DEET and neem against a field strain of Anopheles stephensi

266 La Revue de Santé de la Méditerranée orientale, Vol. 14, No 2, 2008
املجلة الصحية لشرق املتوسط، منظمة الصحة العاملية، املجلد الرابع عشر، العدد ٢، ٢٠٠٨
Acknowledgements
We are grateful to Mr A. Pakari, Mr H. Shabkhiz, Mr H. Javdan and other person-nel of Bandar Abbas Research Centre for their kind assistance in the current study. Our greatest thanks are due to Dr Hajia-
khondi from the Faculty of Pharmacology for providing the neem extract. This project has received financial support from the In-stitute of Public Health Research, School of Public Health as an academic pivot, Tehran University of Medical Sciences, Project No. 241774.
References1. Service MW. Mosquitoes (Culicidae). In:
Lane RP, Crosskey RW, eds. Medical insects and arachnids. London, Chapman and Hall, 1993:723.
2. Gupta RK, Rutledge LC. Role of repellents in vector control and disease prevention. American journal of tropical medicine and hygiene, 1994, 50:82–6.
3. Gupta RK, Rutledge LC. Laboratory evaluation of controlled-release repellent formulations on human volunteers under three climatic regimens. Journal of the American Mosquito Control Association, 1989, 5:52–5.
4. Schmutterer H. Properties and potential of natural pesticides from neem tree, Aza-dirachta indica. Annual review of entomol-ogy, 1990, 35:271–97.
5. Ladd TL, Jacobson M, Buriff CR. Japa-nese beetles: extracts from neem tree seeds as feeding deterrents. Journal of economic entomology, 1978, 77:810–3.
6. Sharma VP, Dhiman RC. Neem oil as a sand fly (Diptera: Psychodidae) repellent. Journal of the American Mosquito Control Association, 1993, 9(3):364–6.
7. Sharma VP, Ansari MA, Razdan RK. Mosquito repellent action of neem (Aza-dirachta indica) oil. Journal of the Ameri-can Mosquito Control Association, 1993, 9:359–60.
8. Yap HH. Effective of soap formula-tions containing deet and permethrin as personal protection against outdoor mosquitoes in Malaysia. Journal of the
American Mosquito Control Association, 1986, 2(1):63–7.
9. Gupta RK et al. Effects of weathering on fabrics treated with permethrin for protec-tion against mosquitoes. Journal of the American Mosquito Control Association, 1989, 5(2):176–9.
10. Robert LL et al. Comparative sensitivity of four Anopheles (Diptera: Culicidae) to five repellents. Journal of medical entomol-ogy, 1991, 28(30):417–20.
11. Kroeger A et al. The contribution of repel-lent soap to malaria control. American journal of tropical medicine and hygiene, 1997, 56(5):580–4.
12. Cockroft A, Cosgrove JB, Wood RJ. Com-parative repellency of commercial formu-lations of deet, permethrin and citronellal against the mosquito Aedes aegypti, us-ing a collagen membrane technique com-pared with human arm tests. Medical and veterinary entomology, 1998, 12(3):289–94.
13. Klun JA et al. Synthesis and repellent ef-ficacy of a new chiral piperidine analog: comparison with Deet and Bayrepel activ-ity in human-volunteer laboratory assays against Aedes aegypti and Anopheles stephensi. Journal of medical entomol-ogy, 2003, 40(3):293–9.
14. Rutledge LC et al. Comparative sensitiv-ity of mosquito species and strains to the repellent diethyl toluamide. Journal of medical entomology, 1978, 14:536–41.

Eastern Mediterranean Health Journal, Vol. 14, No. 2, 2008 267
املجلة الصحية لشرق املتوسط، منظمة الصحة العاملية، املجلد الرابع عشر، العدد ٢، ٢٠٠٨
15. Reifenrath WG, Akers WA. Field testing of repellents against anopheline mosqui-toes. Mosquito news, 1981, 41:276–80.
16. Rutledge LC et al. Comparative sensitiv-ity of representative mosquitoes (Diptera: Culicidae) to repellents. Journal of medi-cal entomology, 1983, 20:506–10.
17. Thavara U et al. Laboratory and field evaluations of the insect repellent 3535 (ethyl butylacetylaminopropionate) and deet against mosquito vectors in Thai-land. Journal of the American Mosquito Control Association, 2001, 17(3):190–5.
18. Manouchehri AV, Djanbakhsh E, Rouhani F. Studies on the resistance of Anopheles stephensi to malathion in Bandar Abbas, Iran. Mosquito news, 1976, 36:320–2.
19. Vector resistance to pesticides. Fifteenth report of the WHO Expert Committee on Vector Biology and Control. Geneva, World Health Organization, 1992 (WHO Technical Report Series No. 818).
20. Klun JA, Debboun M. A new module for quantitative evaluation of repellent ef-ficacy using human subjects. Journal of medical entomology, 2000, 37:177–81.
21. Coleman RE et al. Laboratory evalua-tion of repellents against four anopheline mosquitoes (Diptera: Culicidae) and two phlebotomine sandflies (Diptera: Psy-chodidae). Journal of medical entomol-ogy, 1993, 30:499–502.
22. Mark S, Fradin MD. Mosquitoes and mos-quito repellents: a clinician’s guide. Annals of internal medicine, 1998, 128:931–40.
23. Polefka TG, Liang LJ, Ananthakrishnan TN. Comparison of the mosquito–repel-ling efficacy of methyl neodecanamide (MNDA) to that of Deet. Journal of cos-metic science, 2003, 54(3):283–8.
24. Lindsay LS, McAndless JM. Permethrin-treated jackets versus repellent-treated jackets and hoods for personal protection against blackflies and mosquitoes. Mos-quito news, 1978, 38:350–6.
25. Schreck CE, Haile DG, Kline DL. The ef-fectiveness of permethrin and deet, alone or in combination, for protection against Aedes taeniorhynchus. American journal of tropical medicine and hygiene, 1984, 33:725–30.
26. Deparis X et al. Efficacy of permeth-rin-treated uniforms in combination with DEET topical repellent for protection of French military troops in Cote d’Ivoire. Journal of medical entomology, 2004, 41(5):914–21.
27. Vatandoost H, Vaziri VM. Larvicidal ac-tivity of a neem tree extract (Neemarin) against mosquito larvae in the Islamic Republic of Iran. Eastern Mediterranean health journal, 2004, 10(4/5):573–81.

268 La Revue de Santé de la Méditerranée orientale, Vol. 14, No 2, 2008
املجلة الصحية لشرق املتوسط، منظمة الصحة العاملية، املجلد الرابع عشر، العدد ٢، ٢٠٠٨
Primary isolation and detection of Helicobacter pylori from dyspeptic patients: a simple, rapid methodA. Al-Sulami,1 H.S. Al-Kiat,2 L.K. Bakker1 and H. Hunoon3
1Department of Biology, College of Education, University of Basra, Basra, Iraq (Correspondence to A. Al-Sulami: [email protected]).2Department of Surgery; 3Department of Laboratories, Basra General Hospital, Basra, Iraq Received: 03/10/05; accepted: 12/02/06
ABSTRACT The study aimed to develop a rapid and simple method for the primary isolation and de-tection of Helicobacter pylori from dyspeptic patients. Mucosal antral biopsy specimens were obtained from 136 consecutive dyspeptic patients diagnosed with peptic ulcer by endoscopy at Basra General Hospital, Iraq. From histopathological examination of biopsies, H. pylori was detected in 81 (59.6%) peptic ulcer patients. For bacterial culture, specimens were cultured in parallel on 2 media: the non-selective classic Columbia agar and the selective modified Columbia urea agar (MCUA). MCUA showed a higher isolation rate than classic Columbia agar (67.6% versus 44.1% of patients), and the results were obtained faster (24 hours versus 5–7 days) with more clear-cut identification.
Méthode rapide et simple d’isolement primaire et de détection de Helicobacter pylori chez des patients dyspeptiquesRÉSUMÉ L’objectif de cette étude était de mettre au point une méthode rapide et simple permettant d’isoler et de détecter Helicobacter pylori chez des patients dyspeptiques. Des échantillons de muqueuse ont été prélevés grâce à une biopsie antrale sur 136 patients dyspeptiques consécutifs pour lesquels un diagnostic d’ulcère gastro-duodénal avait été établi par endoscopie à l’hôpital général de Bassora (Basra) en Iraq. L’examen histopathologique des biopsies a permis de détecter H. pylori chez 81 (59,6 %) patients atteints d’un ulcère gastro-duodénal. Concernant la culture bactérienne, les échantillons ont été mis en culture en parallèle dans deux milieux : la gélose Columbia classique non sélective et la gélose Columbia sélective modifiée à l’urée. Cette dernière a présenté un taux d’isolement plus élevé que la gélose Columbia classique (67,6 % des patients contre 44,1 %) et les résultats ont été obtenus plus rapidement (24 heures contre 5 à 7 jours), avec une identification plus nette.
Helicobacter pylori:
Helicobacter pylori136
8159.6
67.644.124

Eastern Mediterranean Health Journal, Vol. 14, No. 2, 2008 269
املجلة الصحية لشرق املتوسط، منظمة الصحة العاملية، املجلد الرابع عشر، العدد ٢، ٢٠٠٨
Introduction
Peptic ulcer disease is a common problem encountered by physicians in everyday practice. Since the isolation of Helicobacter pylori by Marshall and Warren in 1983 [1], tremendous progress in the understanding of the etiology, pathogenesis and manage-ment of this disease has occurred.
It is now widely agreed that H. pylori is the cause of most peptic ulcer disease [2,3] and that this microorganism is endemic in some developing countries, affecting as much as half of the population [4]. The strongest evidence for the pathogenic role of H. pylori in peptic ulcer disease comes from treatment trials. Eradication of the or-ganism results in ulcer healing and reduces the risk of ulcer recurrence and complica-tions [5,6].
Infection by H. pylori has been diag-nosed by a variety of invasive and non-invasive tests [7]. However, the “gold stand-ard” for H. pylori detection, as suggested by the Maastricht consensus report [8] is positive culture or both a positive histologic examination and a positive rapid urease test. The sensitivity of histology is generally high; however, because H. pylori coloniza-tion is focal, negative biopsy results do not exclude the possibility of infection in areas not sampled [9].
A variety of culture media have been used for isolation of H. pylori. Both selec-tive and non-selective media have been used [10,11] . The most commonly used are Columbia, Brucella, brain–heart infu-sion, trypticase soy or blood agar media, each supplemented with 5%–10% blood. Supplementation of culture media with serum, albumin or activated charcoal in-stead of blood has been used to support the growth of H. pylori [12]. These materials are assumed to play a role of detoxifying the toxic substances in the media [13]. Bacte-
rial growth usually appears as translucent, small, pinpoint colonies [1,14].
We aimed to develop a rapid and simple method for the primary isolation and detec-tion of H. pylori from dyspeptic patients.
Methods
SampleBetween October 2002 and August 2004, 136 patients with symptoms suggestive of peptic ulcer were diagnosed as having peptic ulcer (gastric and duodenal) using endoscopic examination at the endoscopic unit, Basra General Hospital, Iraq, by a spe-cialized surgeon. There were 72 males and 64 females. The ages of the patients ranged from 18 years to 69 years. Cases with nega-tive endoscopic results for peptic ulcer were excluded from the study.
Data collectionTwo gastric tissue specimens were taken from the antral region of the stomach of each patient during the endoscopic exami-nation. Presence of the bacterium H. pylori in the tissue specimens was detected using 2 methods: histopathological examination and bacterial culture growth.
Laboratory methodsFor histopathological detection, surgical specimens were fixed in paraffin wax and stained with haematoxylin and eosin (H&E) and Giemsa stains. The sections were ex-amined for the presence of H. pylori and any inflammatory changes that might be present in the gastric antral sections using the ordinary light microscope. The Sydney system was used to assess the histological changes. In this system the topography of the gastritis as seen on endoscopy is in-cluded (antral, body, pangastritis), together with the macroscopic appearances (oedema,

270 La Revue de Santé de la Méditerranée orientale, Vol. 14, No 2, 2008
املجلة الصحية لشرق املتوسط، منظمة الصحة العاملية، املجلد الرابع عشر، العدد ٢، ٢٠٠٨
haemorrhagic, flat, raised, etc.). In addition, some of the histological and microscopic features may be graded in terms of severity as mild, moderate or severe.
For bacterial culture detection, antral biopsy specimens were transported to the microbiology department within 1 hour in 5 mL tryptic soy broth as a transport medium. In the laboratory, specimens were first ground in a sterile mortar with the aid of a sterile fine glass rod until the formation of a homogenate. Two kinds of culture media—the classic Columbia agar and the modified Columbia urea agar (MCUA)—were used. MCUA contains per litre: 41 g Columbia agar base, 10 mL of haemin solution, 20 g of urea, 0.0012 mg of phenol red and 0.04 mg of vancomycin. Slants of this medium were prepared in 14 ×16 mm test tubes. Each slant tube was made up to contain 5 mL of MCUA.
Haemin solution was prepared by dis-solving 50 mg of haemin in 1 mL of 1.0 mol NaOH. Distilled water was then added to make 100 mL solution which was then sterilized by autoclave at 121 ºC for 15 minutes. The solution was stored at 4 ºC and used as stock solution.
From the homogenate, 1 mL was taken and placed at the bottom of the MCUA slant tube so that the transport medium itself is the liquid phase. The tube was tilted a few times to allow the added broth homogenate to moisten the upper slanted portion of the tube before its settlement into the bot-tom of the slant. The resulting system is a simple monophasic–diphasic culture setup (MDCS); a diphasic solid liquid environ-ment at the bottom of the test tube and a monophasic solid one above it [15]. At the same time some part of the homogenized biopsy specimen from each patient was spread and plated on standard Columbia agar medium.
With MCUA medium, the inoculated tubes were incubated microaerophilically at 37 ºC for 24 hours, after which the colour changes from orange to pink in the solid phase, indicating urease activity, and the appearance of isolated H. pylori colonies was observed. With classic Columbia agar medium, the incubation time was extended from 5 to 7 days. After that time H. py-lori growth was observed as a few, tiny transparent colonies. The isolated H. pylori colonies were then subcultured on plates of the same MCUA medium for purification, identification, and performing antibiotic susceptibility tests.
Identification of isolated H. pylori was confirmed by a negative reaction to Gram staining and by positive results of each of the following biochemical tests: oxidase test, catalase test and urease test, as indi-cated by colour change of the medium from orange to pink [16].
Results
Of the total 136 patients with positive endo-scopic diagnosis of peptic ulcer, 92 patients (67.6%) showed positive evidence of H. py-lori infection using bacterial culture and 81 patients (59.6%) histopathologically. They were referred to as H. pylori ulcer patients. In the remaining 44 patients (32.4%), called non-H. pylori ulcer patients, H. pylori were not detected.
Patient characteristicsAmong H. pylori ulcer patients, the highest detection rates of the bacterium (79.2%) was recorded in the age group 41–50 years, while no single case was recorded in the age group ≤ 20 years (Table 1). These findings were statistically nonsignificant (χ2 = 0.733, P > 0.05, df = 4).

Eastern Mediterranean Health Journal, Vol. 14, No. 2, 2008 271
املجلة الصحية لشرق املتوسط، منظمة الصحة العاملية، املجلد الرابع عشر، العدد ٢، ٢٠٠٨
Of the 72 males with peptic ulcer, 49 (68.1%) showed positive tests for H. pylori, while 43 (67.2%) out of 64 females in this study showed positive tests for H. pylori (Table 1).
The highest occurrence of H. pylori was recorded in patients of low educational sta-tus. The bacterium was detected in 74.1% (40 out of 54) of these peptic ulcer patients with low educational level compared with 58.3% (21 out of 36) with high educational level but this was not statistically significant (χ2 =2.447, P > 0.05, df = 2).
A higher rate of H. pylori was recorded in patients from rural areas. In 68.5% (50 out of 73) of patients living in rural areas H. pylori was detected compared with 66.7% (42 of 63 ulcer patients) in urban areas; again these results were statistically not significant (χ2 = 0.04, P > 0.05, df = 1).
The habit of cigarette smoking was re-ported by 55.1% of all ulcer cases. Among cigarette smokers 55 out of 75 (73.3%) had H. pylori infection compared with only 60.7% (37 out of 61) of nonsmoker peptic ulcer patients, a statistically non-significant finding.
Histopathology findings For histopathological detection of H. pylori, the distribution of H. pylori was examined in both H&E-stained and Giemsa-stained sections. The changes in background mu-cosa included inflammation, atrophy and intestinal metaplasia. The degree of inflam-matory changes in the gastric biopsy speci-mens were evaluated in every H. pylori ulcer patient. Table 2 shows that the most frequent pattern of inflammatory changes of antral biopsy specimens from patients with H. pylori ulcers was severe gastritis, recorded in 41 patients (44.6%), followed by mild gastritis in 31 patients (33.7%) and chronic gastritis in 20 patients (21.7%).
Culture findingsThe total isolation rate of H. pylori was about 44.1% by the classic Columbia agar, as it identified 60 positive infections out of 136 patients tested. The growth of H. pylori on this medium was scanty, the colonies were few in number, transparent and tiny in size. Bacterial contamination of the medium was frequent. The contaminant bacteria were Pseudomonas spp., Proteus spp. and Klebsiella spp. The growth rate of H. pylori on classic Columbia agar was slow; in most cases 5 to 7 days were needed for the colo-nies to appear.
The MCUA using MDCS showed a greater isolation rate of H. pylori. Posi-
Table 1 Distribution of patients with Helicobacter pylori and non-H. pylori ulcer by age group and sex
Variable No. of H. pylori Non-H. pylori patients ulcer ulcer No. % No. %
Age (years) ≤ 20 2 0 0 2 4.5 21–30 27 17 63.0 10 37.0 31–40 31 23 74.2 8 18.2 41–50 24 19 79.2 5 20.8 51–60 27 18 66.7 9 33.3 61–69 25 15 60.0 10 40.0
Sex Male 72 49 68.1 23 31.9 Female 64 43 67.2 21 32.8
Total 136 92 67.6 44 32.4
Table 2 Histopathological grading of inflammatory changes in Helicobacter pylori patients
Degree of inflammation H. pylori ulcer No. %
Mild gastritis 31 33.7
Severe gastritis 41 44.6
Chronic gastritis 20 21.7
Total 92 100.0

272 La Revue de Santé de la Méditerranée orientale, Vol. 14, No 2, 2008
املجلة الصحية لشرق املتوسط، منظمة الصحة العاملية، املجلد الرابع عشر، العدد ٢، ٢٠٠٨
tive results were found in 92 out of 136 ulcer patients (67.6%). The colonies of the isolated bacteria were abundant in number, creamy in colour and larger in size, about the size of a pinhead, when compared with the colonies on the classic Columbia agar. There was no contamination at all. The isolation was very rapid; only 24 hours were needed for the growth to be identified. The change in colour of the slanted medium from orange to pink caused by urease action occurred at the same time, giving additional evidence for the presence of H .pylori in the tissue specimens.
All H. pylori isolates were subjected to Gram staining. The characteristics of this bacterium were observed as Gram-negative, spiral shaped rods.
The 3 additional biochemical tests (oxi-dase, catalase and urease) performed to con-firm the identity of H. pylori were positive for all 92 isolates.
Discussion
The discovery of H. pylori by Warren and Marshall in 1983 has changed the con-ventional concept of gastroduodenal ulcer disease [1]. Studies over the years sug-gest a high correlation between H. pylori infection and peptic ulceration [17]. The prevalence of H. pylori infection shows a wide geographical variation [18,19]. It is reported that 60% to 70% of patients with gastric ulcer, and 90% to 95% of patients with duodenal ulcer, have marked gastric colonization of H. pylori [20].
Although it cannot be said that H. pylori causes ulceration, as half of the healthy population also harbours this organism, it has been shown that infection certainly makes the occurrence of ulcers more likely [20,21]. Also, eliminating this bacterium reduces the rate of ulcer recurrence to less than 25% [5].
In Iraq, several studies have been con-ducted to evaluate the prevalence of H. pylori infection in peptic ulcer disease indi-cating a range of 60%–70 % [22–24].
The major anatomical focus of this Gram-negative microaerophilic bacterium is the gastric antrum, the narrower lower part of the stomach, and also the duodenum when the normal type of duodenal epithe-lium is replaced with antral type mucosa. Helicobacter will infect this antral type of mucosa [20,25]. The results of our study also support this concept, since all positive cases for H. pylori were identified in antral biopsy specimens.
Inflammatory changes in antral biopsy specimens were found in all H. pylori ulcer patients in this study. These changes were mild gastritis in 33.7%, severe gastritis in 44.6%, and chronic gastritis in 21.7% of H. pylori ulcer patients. Identification of H. py-lori as Gram-negative spiral-shaped organ-isms in stained antral biopsy specimens was possible in only 81 out of 92 H. pylori ulcer patients. The possible explanation for the remaining 11 cases (false-negative results) may be due to the patchy distribution of the organism in the antral part of stomach in peptic ulcer disease [9].
The gold standard for the presence of most infectious disease is successful cul-ture of the microorganism [8]. At present, culture of H. pylori from gastric antral biopsy specimens is a reference technique in bacteriology and is essential for drug susceptibility testing and analysis of puta-tive virulence factors [12,26]. Although it is usually considered a tedious, time-consum-ing and expensive procedure, culturing on solid medium is the standard technique used in most laboratories for the isolation of H. pylori from gastric biopsy specimens [11].
Primary isolation of H. pylori from a biopsy specimen is a difficult process, the typical success rates in culturing the organ-

Eastern Mediterranean Health Journal, Vol. 14, No. 2, 2008 273
املجلة الصحية لشرق املتوسط، منظمة الصحة العاملية، املجلد الرابع عشر، العدد ٢، ٢٠٠٨
ism are reported to be in the range of 70% to 80% with 90% to 95% sensitivity and 100% specificity [20]. Several factors, which are difficult to control, cause difficulty with the culturing of the organism: patchy distribu-tion of the organism on the gastric mucosa, contamination of biopsy forceps, presence of oropharangyeal flora, loss of viability of the organism during transportation, etc. All these may be responsible for a poor nega-tive predictive value associated with culture of H. pylori [4,27].
In the present study the isolation rate of H. pylori by bacterial culture method in 136 peptic ulcer patients was 67.6%. This rate is comparable to the above mentioned international results.
A variety of media, selective and non-selective, or a combination of both, have been proposed for use in the primary isola-tion of H. pylori, but the optimal method of recovery still remains to be established [28]. Columbia blood agar is a non-selective medium used for many years alone or in combination with other non-selective and selective media for culturing H. pylori from antral biopsy specimens taken from peptic ulcer patients during upper gastroin-testinal endoscopy [11,29]. The isolation rate of H. pylori using this medium alone is very variable. Results as low as only 28.5% total isolation rate were reported by some authors [30]. The isolation rate of H. pylori using Columbia blood agar in the present study was 44.1%; the colonies were few in number and tiny in size. Bacterial contami-nation of the medium was frequent. The contaminant bacteria were Pseudomonas spp., Proteus spp. and Klebsiella spp ., the source of which could be contaminated biopsy forceps and contamination during obtaining, transporting and preparing of the defibrinated sheep blood added to the classic Columbia agar. The growth rate of H. pylori on this medium was slow, as 5
to 7 days were needed for the colonies to appear.
Efforts have been invested to improve the reliability of Columbia agar and change it to become selective for H. pylori. Westb-lom et al. in 1991 described egg yolk emul-sion agar (EYE) [10]. When this medium was compared with other media, the colony count for EYE agar was significantly high-er. However, the results of using EYE agar alone as a selective medium for culturing H. pylori in gastric biopsy specimens in peptic ulcer are controversial. While the maximum isolation rate was less than 51% in one study, another study stated that adding egg yolk emulsion to the culture medium was significantly worse than the use of whole blood [31].
Our efforts to establish an optimal meth-od for the recovery of H. pylori from antral biopsy specimens in peptic ulcer patients is based on a modification of the Columbia agar medium to make it selective for cultur-ing H. pylori. Many reports also mentioned that the use of selective and non-selective media in parallel is superior to the use of one medium alone [10,11,30,31]. By com-paring these results of H. pylori isolation rates with our results, it is clearly evident that the 67.6% H. pylori isolation rate ob-tained in the present study is reasonably high. Using MCUA is much superior to us-ing a combination of different selective and non-selective media in parallel to culture H. pylori. The high H. pylori isolation rate with MCUA may be attributed to the use of haemin as a sole iron source, which proved to be superior to other iron sources such as whole blood or serum. Also the clean procedure of preparing and adding haemin solution to the modified medium resulted in a total absence of bacterial contamination, thus removing the antagonistic effect of co-plated contaminants.

274 La Revue de Santé de la Méditerranée orientale, Vol. 14, No 2, 2008
املجلة الصحية لشرق املتوسط، منظمة الصحة العاملية، املجلد الرابع عشر، العدد ٢، ٢٠٠٨
Conclusions
The results obtained with this slanted MCUA medium were encouraging as they showed great advantages over many selec-tive media used alone or in combination for isolating H. pylori. The advantages of such modifications over Columbia agar medium may be summarized as follows: 1. High isolation rate of H. pylori, 67.6 %. 2. Rapid culturing of H. pylori as growth
of H. pylori is very clear within 24 hours of incubation instead of 5–7 days needed with classic Columbia agar. This could be ascribed to the better accessibility of iron from haemin as compared to whole blood or erythrocytes. Also, the lack of contaminant microbes may enhance faster growth by eliminating the effect of competition.
3. Colony count is significantly higher, and colonies are very clear and relatively large in size.
4. Microbial contamination of the medium is totally absent.
5. Incorporation of urease test in the me-dium provides clear evidence for the presence of H. pylori in the tissue speci-men. It is indicated by colour change in the medium, from orange to pink, due to the splitting effect of urease enzyme on the urea component of the modified medium.
6. Using MDCS provides several advan-tages over other culture techniques, exemplified by the fast appearance of results, elimination of transport medium and establishment of simultaneous but separate environments for both the iso-lation and identification of H. pylori. It also provides flexibility in the kinds of media used in the liquid and solid phases. Consequently, the method is inexpensive, and less time-consuming.We conclude that preparing this single
selective medium (MCUA) is clearly sim-pler, less time-consuming, and much more economic than preparing and working with multiple culture media in parallel.
References
1. Warren JR, Marshall BJ. Unidentified curved bacillus on the gastric epithelium in active chronic gastritis. Lancet, 1983, 1:1273–5.
2. Joytheeswaran S et al. Prevalence of Helicobacter pylori in peptic ulcer patients in greater Rochester, NY: is empirical tri-ple therapy triple therapy justified? Ameri-can journal of gastroenterology, 1998, 93:574–8.
3. Labenz J, Borsch G. Evidence for the es-sential role of Helicobacter pylori in gas-tric ulcer disease. Gut, 1994, 35:19–22.
4. Pounder RE. The prevalence of Helico-bacter pylori infection in different coun-tries. Alimentary pharmacology and thera-peutics, 1995, 9(Suppl. 2):33–9.
5. Unge P. Review of Helicobacter pylori eradication regimens. Scandinavian jour-nal of gastroenterology. Supplement, 1996, 215:74–81.
6. Ohkusa T et al. Improvement in atrophic gastritis and intestinal metaplasia in pa-tients in whom Helicobacter pylori was eradicated. Annals of international medi-cine, 2001, 134:380–6
7. Cutler AF et al. Accuracy of invasive and noninvasive tests to diagnose Helico-bacter pylori. Gastroenterology, 1995, 109:136–41.
8. Technical annex: tests used to assess Helicobacter pylori infection. Working Party of the European Helicobacter pylori

Eastern Mediterranean Health Journal, Vol. 14, No. 2, 2008 275
املجلة الصحية لشرق املتوسط، منظمة الصحة العاملية، املجلد الرابع عشر، العدد ٢، ٢٠٠٨
Study Group. Gut, 1997, 41(Suppl. 2):S10–8.
9. Dubois A. Spiral bacteria in the human stomach: the gastric helicobacters. Emerg-ing infectious diseases, 1995, 1(3):8–15.
10. Westblom TU, Madan E, Midkiff BR. Egg yolk emulsion agar: a new medium for cultivation of Helicobacter pylori. Journal of clinical microbiology, 1991, 29(4):819–21.
11. Fresnadillo MMJ et al. Comparative evalu-ation of selective and nonselective media for primary isolation of Helicobacter pylori from gastric biopsies. Helicobacter, 1997, 2(1):36–9.
12. Buck GE, Smith JC. Medium supple-mentation for growth of Campylobacter pyloridis. Journal of clinical microbiology, 1987, 25:597–9.
13. Rhee KH et al. Bacteriological charac-teristics of Campylobacter pylori. Journal of the Korean Society for Microbiology, 1988, 23:17–26.
14. Eaton KA et al. Helicobacter pylori: clini-cal, histological and ultrastructural finding. Gut, 1991, 32:137–40.
15. Al-Sulami AA et al. A single step method for rapid isolation and identification of Mycoplasma pneumoniae from clinical specimens. Eastern Mediterranean health journal, 2002, 8(1):157–63.
16. Cowan ST. Manual for the identification of medical bacteria, 2nd ed. Cambridge, Cambridge University Press, 1975:238.
17. Blecker U. Helicobacter pylori infection in childhood [PhD thesis]. South Dakota, USA, Trinity College and University. Dis-sertation.com, 1999 (www.dissertation.com/library/1120737a.htm, accessed 2 July 2007).
18. EUROGAST Study Group. Epidemiol-ogy and risk factors for Helicobacter py-lori infection among 3194 asymptomatic subjects in 17 populations. Gut, 1993, 34:1672–6.
19. Rodrigues MN et al. Prevalence of Heli-cobacter pylori infection in children from an urban community in north-east Brazil. European journal of gastroenterology and hepatology, 2004, 16:201–5.
20. National Digestive Diseases Information Clearinghouse. H. pylori and peptic ulcer. Bethesda, Maryland, National Institutes of Health, 1997, updated July 2001 (NIH Publication No. 01-4225).
21. Dooley CP et al. Prevalence of Heli-cobacter pylori infection and histologic gastritis in asymptomatic persons. New England journal of medicine, 1989, 321:1562.
22. Al-Ajeel AMD et al. Helicobacter pylori in common upper gastrointestinal disorders in Al-Anbar governorate. Al-Anbar Univer-sity journal, 1996, 1:10–4.
23. Fatah HT, Al-Janabi AH. Prevalence of Helicobacter pylori in patients with peptic ulcer in Najaf. Al-Kufa University journal, 1998, 2:88–92.
24. Al-Sari ZWA. Extraction and purification of urease from a local isolate of Helicobacter pylori as a specific antigen and using it in enzyme linked immunosorbent assay (ELISA) [Msc thesis]. Basra, Iraq, College of Science, Basrah University, 2003.
25. Veldhyzen van Zanten SJO et al. In-creasing prevalence of Helicobacter py-lori infection with age: continuous risk of infection in adults rather than a cohort ef-fect. Journal of infectious diseases, 1994, 169:434–7.
26. Maqraud F. A growing demand for Heli-cobacter pylori culture in the near future. Italian journal of gastroenterology and hepatology, 1997, 29(6):574–6.
27. Meunier O et al. Isolation of Helicobacter pylori: necessity of control of transport conditions. Pathologie-biologie, 1997, 45(1):82–5.
28. Karari EM et al. Endoscopic finding and the prevalence of Helicobacter pylori in

276 La Revue de Santé de la Méditerranée orientale, Vol. 14, No 2, 2008
املجلة الصحية لشرق املتوسط، منظمة الصحة العاملية، املجلد الرابع عشر، العدد ٢، ٢٠٠٨
chronic renal failure patients. East African medical journal, 2000, 77(8):406–9.
29. Hartzen SH et al. Antimicrobial suscep-tibility testing of 230 Helicobacter pylori strains: importance of medium, inoculum, and incubation time. Antimicrobial agents and chemotherapy, 1997, 41(12):2634–9.
30. Piccolomini R et al. Optimal combination of media for primary isolation of Helico-
bacter pylori from gastric biopsy speci-mens. Journal of clinical microbiology, 1997, 35(6):1541–4.
31. Henriksen TH et al. Rapid growth of Heli-cobacter pylori. European journal of clini-cal microbiology and infectious diseases, 1995, 14(11):1008–11.
Piloting health and climate adaptation: GEF project WHO is partnering with the United Nations Development Programme (UNDP) in a new project to pilot approaches to protect health under a changing and more variable climate, funded by the Global Environ-ment Facility (GEF). The goal of the project is to implement a range of strategies, policies, and measures that will decrease health vulnerabil-ity to current climate variability and future climate change in a range of countries with different health risks. This is the first global project that works directly with developing countries to design and imple-ment practical measures to protect health under a rapidly changing climate. The project is working in seven countries distributed throughout the world showing a wide variety of health vulnerabilities to climatic condi-tions. These include Jordan, a water-stressed area, from the Eastern Mediterranean Region. More details on the GEF project can be found at: http://www.who.int/globalchange/climate/gefproject/en/index.html.

Eastern Mediterranean Health Journal, Vol. 14, No. 2, 2008 277
املجلة الصحية لشرق املتوسط، منظمة الصحة العاملية، املجلد الرابع عشر، العدد ٢، ٢٠٠٨
Meningococcal carrier rate before and after hajj pilgrimage: effect of single dose ciprofloxacin on carriageA. Alborzi,1 S. Oskoee,1 B. Pourabbas,1 S. Alborzi,1 B. Astaneh,1 M.M. Gooya2 and MJ. Kaviani 3
1Professor Alborzi Clinical Microbiology Research Centre, Shiraz University of Medical Sciences, Shiraz, Islamic Republic of Iran (Correspondence to A. Alborzi: [email protected]).2Centre for Disease Control, Tehran, Islamic Republic of Iran.3Deparment of Internal Medicine, School of Medicine, Shiraz University of Medical Sciences, Shiraz, Islamic Republic of Iran.Received: 12/06/05; accepted: 04/01/06
ABSTRACT We determined the carriage rate of Neisseria meningitidis before and after hajj pilgrimage among a group (1) of 674 randomly selected Iranian pilgrims, and the effect of 500 mg of ciprofloxacin given 24 hours before return on the reduction of meningococcal carriers among another group (2) of 123 randomly selected Iranian pilgrims. Throat specimens taken 1 hour before departure on the hajj and immediately on return were cultured. Carriage rates of N. meningitidis in group 1 were 5.2% before and 4.6% after pilgrimage (P = 0.65); 3 new serogroups (Z, Z’ and A) were identified on return. In group 2, the carriage rate decreased from 8.1% to zero before and after pilgrimage.
Taux de portage du méningocoque avant et après le Hadj (pèlerinage à La Mecque) et effets d’une dose unique de ciprofloxacine sur le portageRÉSUMÉ Nous avons déterminé le taux de portage de Neisseria meningitidis avant et après le Hadj dans un groupe (1) de 674 pèlerins iraniens sélectionnés au hasard, et les effets d’une administration de 500 mg de ciprofloxacine 24 heures avant le retour sur la diminution du nombre de porteurs du méningocoque dans un autre groupe (2) de 123 pèlerins iraniens sélectionnés au hasard. Les prélèvements de gorge effectués une heure avant le départ au Hadj et dès le retour ont été mis en culture. Les taux de portage de N. meningitidis dans le groupe 1 étaient de 5,2 % avant et de 4,6 % après le pèlerinage (p = 0,65) ; 3 nouveaux sérogroupes (Z, Z’ et A) ont été identifiés au retour. Dans le groupe 2, le taux de portage est passé de 8,1 % avant le pèlerinage à zéro après.
67450024123
5.24.60.65=PZ’ZK8.1
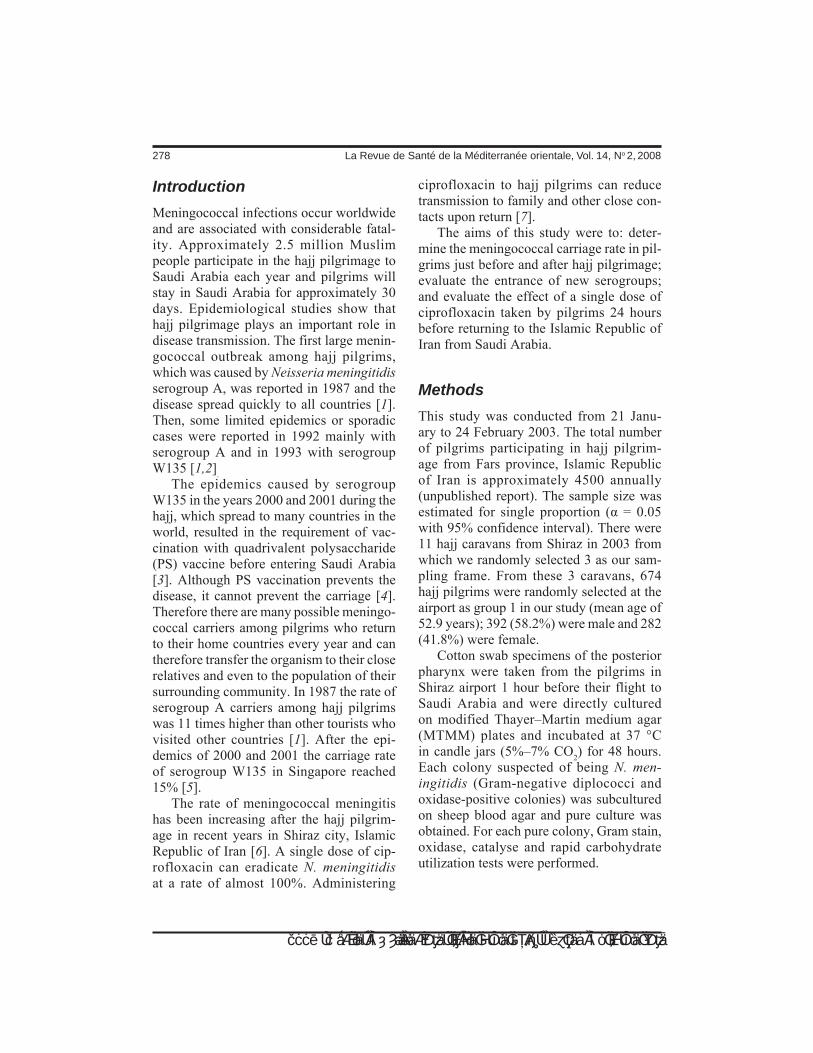
278 La Revue de Santé de la Méditerranée orientale, Vol. 14, No 2, 2008
املجلة الصحية لشرق املتوسط، منظمة الصحة العاملية، املجلد الرابع عشر، العدد ٢، ٢٠٠٨
Introduction
Meningococcal infections occur worldwide and are associated with considerable fatal-ity. Approximately 2.5 million Muslim people participate in the hajj pilgrimage to Saudi Arabia each year and pilgrims will stay in Saudi Arabia for approximately 30 days. Epidemiological studies show that hajj pilgrimage plays an important role in disease transmission. The first large menin-gococcal outbreak among hajj pilgrims, which was caused by Neisseria meningitidis serogroup A, was reported in 1987 and the disease spread quickly to all countries [1]. Then, some limited epidemics or sporadic cases were reported in 1992 mainly with serogroup A and in 1993 with serogroup W135 [1,2].
The epidemics caused by serogroup W135 in the years 2000 and 2001 during the hajj, which spread to many countries in the world, resulted in the requirement of vac-cination with quadrivalent polysaccharide (PS) vaccine before entering Saudi Arabia [3]. Although PS vaccination prevents the disease, it cannot prevent the carriage [4]. Therefore there are many possible meningo-coccal carriers among pilgrims who return to their home countries every year and can therefore transfer the organism to their close relatives and even to the population of their surrounding community. In 1987 the rate of serogroup A carriers among hajj pilgrims was 11 times higher than other tourists who visited other countries [1]. After the epi-demics of 2000 and 2001 the carriage rate of serogroup W135 in Singapore reached 15% [5].
The rate of meningococcal meningitis has been increasing after the hajj pilgrim-age in recent years in Shiraz city, Islamic Republic of Iran [6]. A single dose of cip-rofloxacin can eradicate N. meningitidis at a rate of almost 100%. Administering
ciprofloxacin to hajj pilgrims can reduce transmission to family and other close con-tacts upon return [7].
The aims of this study were to: deter-mine the meningococcal carriage rate in pil-grims just before and after hajj pilgrimage; evaluate the entrance of new serogroups; and evaluate the effect of a single dose of ciprofloxacin taken by pilgrims 24 hours before returning to the Islamic Republic of Iran from Saudi Arabia.
Methods
This study was conducted from 21 Janu-ary to 24 February 2003. The total number of pilgrims participating in hajj pilgrim-age from Fars province, Islamic Republic of Iran is approximately 4500 annually (unpublished report). The sample size was estimated for single proportion (α = 0.05 with 95% confidence interval). There were 11 hajj caravans from Shiraz in 2003 from which we randomly selected 3 as our sam-pling frame. From these 3 caravans, 674 hajj pilgrims were randomly selected at the airport as group 1 in our study (mean age of 52.9 years); 392 (58.2%) were male and 282 (41.8%) were female.
Cotton swab specimens of the posterior pharynx were taken from the pilgrims in Shiraz airport 1 hour before their flight to Saudi Arabia and were directly cultured on modified Thayer–Martin medium agar (MTMM) plates and incubated at 37 °C in candle jars (5%–7% CO2) for 48 hours. Each colony suspected of being N. men-ingitidis (Gram-negative diplococci and oxidase-positive colonies) was subcultured on sheep blood agar and pure culture was obtained. For each pure colony, Gram stain, oxidase, catalyse and rapid carbohydrate utilization tests were performed.
Eastern Mediterranean Health Journal, Vol. 14, No. 2, 2008 279
املجلة الصحية لشرق املتوسط، منظمة الصحة العاملية، املجلد الرابع عشر، العدد ٢، ٢٠٠٨
Biochemically positive colonies of N. meningitidis were evaluated for serogroups by specific polyvalent and monovalent an-tisera (Difco).
Pilgrims travel in “caravans” with an assigned serial number, a leader and date of return. Thus we were able to know when in-dividuals in group 1 returned to the Islamic Republic of Iran. On arrival, therefore, an-other throat sample was taken at the airport and the same process was repeated. The pilgrims also filled in a questionnaire about any antibiotic use during the hajj.
To study the usefulness of ciprofloxacin prescription to eradicate meningococcal carriage, another group of 123 pilgrims was selected as group 2 and throat cultures before departure from the Islamic Republic of Iran and after return were taken in the same way as group 1. This group, however, was treated with a single dose of 500 mg ciprofloxacin 24 hours before they returned to the Islamic Republic of Iran. This was dispensed by the authors who also observed the pilgrims taking the dose.
All individuals in both groups had re-ceived the quadrivalent PS meningococcal vaccine before departure from the country (according to their required vaccination card signed by health centres).
The results were statistically analysed using the chi-squared, Fischer exact and McNemar tests.
Results
Out of 674 pilgrims in the first group, 35 (23 males and 12 females) were infected by different strains of meningococci before departure from the Islamic Republic of Iran. No correlation was found between sex and carriage rate (χ2 = 1.18, P = 0.45). Sero-grouping showed that 10 strains (28.6%) were non-serogroupable [8], 9 (25.7%) were serogroup B, 5 (14.3%) were serogroup C, 5
(14.3%) were serogroup D, 5 (14.3%) were serogroup Y and 1 (2.8%) was serogroup W13 (Table 1).
When the individuals in group 1 returned to the Islamic Republic of Iran, we were able to retest all of them (100% retesting).
The results show that 31 pilgrims were infected with different strains of N. men-ingitidis; 21 strains (67.7%) were non-serogroupable, 2 (6.4%) were serogroup B, 1 (3.2%) was serogroup W135, 3 (9.7%) were serogroups Z,Z’, 1 (3.2%) was sero-group A, 1 (3.2%) was serogroup C and 2 (6.4%) were serogroup Y. Although none of the pilgrims in group 1 had a history of recent antibiotic use before leaving the Islamic Republic of Iran, 392 (58.2%) had received antibiotics because of respira-tory infections during the hajj pilgrimage (based on the questionnaires), 222 (32.9%) pilgrims had not received any antibiotics and 60 (8.9%) had no reliable history of antibiotic use (they had taken some medica-tion but did not know what type). Out of the 31 infected returning pilgrims in group 1, 15
Table 1 Distribution of Neisseria meningitidis serogroups in Iranian hajj pilgrims (group 1) before departure for Saudi Arabia
Serogroup No. infected % before departure (n = 674)
A 0 0.0
B 9 1.3
C 5 0.7
D 5 0.7
Y 5 0.7
W135 1 0.1
Non-serogroupable 10 1.5
Z 0 0.0
Z′ 0 0.0
Total 35 5.2

280 La Revue de Santé de la Méditerranée orientale, Vol. 14, No 2, 2008
املجلة الصحية لشرق املتوسط، منظمة الصحة العاملية، املجلد الرابع عشر، العدد ٢، ٢٠٠٨
had received antibiotics, another 15 had not so the carrier rate was the same (P = 0.14) and 1 pilgrim had no reliable history.
Carriage rates of N. meningitidis in group 1 were 5.2% and 4.6% before leaving and after arriving in the country, respectively, a non-significant difference (P = 0.65) but entrance of new serogroups (A, Z and Z’) was epidemiologically significant as they have the capability to cause outbreaks (Ta-ble 2) [9]. Group 2 had a 8.1% carriage rate before leaving the Islamic Republic of Iran (with serogroups B,C,D,X and Y), which reduced to zero when they arrived back in the country having taken 500 mg ciprofloxacin 24 hours before they returned (P = 0.002) (Table 3).
Discussion
We evaluated the carriage rate of N. men-ingitidis among Iranian pilgrims before and after the hajj pilgrimage. Meningococcal carriers are asymptomatic and are a reser-
voir for the organism. Pilgrims are com-monly in contact with many people after returning to the Islamic Republic of Iran because of the custom of visiting relatives post hajj.
According to our data, the carriage rate of N. meningitidis in group 1 reduced from 35 cases (5.2%) to 31 cases (4.6%) after the pilgrimage, but this was not statistically significant. This finding is contrary to our first hypothesis that the carriage rate would increase after the hajj pilgrimage, but con-curs with other studies [5,10]. However, in our study 3 new serogroups, Z, Z’ and A, were found among the returning pilgrims. A study from Ghana reported the occurrence of a serogroup X N. meningitidis outbreak in northern Ghana [11] which highlights the potential of unusual serotypes of N. meningitidis to cause outbreaks.
There are several reasons that could explain the lack of significant changes in the carriage rate of N. meningitidis in group 1 pilgrims after the hajj. First, the use of
Table 2 Distribution of Neisseria meningitidis serogroups in 674 Iranian hajj pilgrims after returning from Saudi Arabia by use of antibiotics while on hajj
Serogroup No antibiotic Received Unknown (n = 222) antibiotic (n = 60) (n = 392) No. % No. % No. %
A 1 0.45 0 0.0 0 0.0
B 2 0.9 0 0.0 0 0.0
C 0 0.0 1 0.25 0 0.0
D 0 0.0 0 0.0 0 0.0
Y 1 0.45 1 0.25 0 0.0
W135 0 0.0 1 0.25 0 0.0
Non-serogroupable 8 3.6 12 3.06 1 1.7
Z 1 0.45 0 0.0 0 0.0
Z′ 2 0.9 0 0.0 0 0.0
Total 15 6.8 15 3.8 1 1.7

Eastern Mediterranean Health Journal, Vol. 14, No. 2, 2008 281
املجلة الصحية لشرق املتوسط، منظمة الصحة العاملية، املجلد الرابع عشر، العدد ٢، ٢٠٠٨
antibiotics could play a role as 58.2% of the pilgrims had taken antibiotics during their stay in Saudi Arabia but none had done so before leaving. Most of the pilgrim who had taken antibiotics had done so without a pre-scription from a physician as it is customary among pilgrims to start self-therapy when they develop a cough or fever. Secondly, it is possible that the absence of outbreaks in other countries might have led to a decrease in the carrier rate on arrival in Saudi Arabia. Finally, vaccination may play a role; vac-cination decreases meningococcal disease in the pilgrims and thus vaccinated pilgrims will have less active disease and will be less likely to infect others.
In a study in 1978 on African people who were in contact with patients with meningococcal infection, the effect of rif-ampin, ciprofloxacin and ceftriaxone on eradication of carriage was 96.5%, 97.6% and 88% respectively [12], while it was
100% in our study. Thus ciprofloxacin appears to be effective in eliminating the chance of carriage.
The cost of admission of patients with uncomplicated meningitis in teaching hos-pitals in the Islamic Republic of Iran is approximately US$ 500 for 10 days for each patient (based on the approved fees of the Iranian Ministry of Health and Medi-cal Education), while each tablet of cipro-floxacin is about 10 US cents. Considering that about 92 000 pilgrims go for hajj from the Islamic Republic of Iran each year, US$ 9200 would be needed for meningococcal prophylaxis for all Iranian pilgrims. This is equal to the cost of admission of about 18 patients with uncomplicated meningitis in hospitals.
As meningococcal disease has high fa-tality rate and the cost of hospitalization of such infected patients is very expensive, and disease outbreaks are very likely after hajj pilgrimage in some years, it would appear to be cost-effective to prescribe 500 mg of ciprofloxacin as single dose to all pilgrims to be taken 24 hours before arrival in their home country. This would serve to prevent the transfer of new serogroups, decrease carriage rate and finally prevent possible outbreaks in their countries.
Acknowledgements
A part of this project was supported finan-cially by the Centre for Disease Control (Islamic Republic of Iran).
We would like to thank Dr B. Oboodi, Dr M. Ziyaeyan, Mr M. Kalani, Mr J. Nasiri and Mr M. Hayati for the contribution to this study. We would also like to thank Dr Christofer Nelson for basic revision of the paper, Dr Peiravi for his support and all Shiraz airport personnel for their collabora-tion.
Table 3 Distribution of Neisseria meningitidis serogroups in Iranian hajj pilgrims (group 2 – ciprofloxacin group) before departure for Saudi Arabia
Serogroup No. (n = 123) %
A 0 0.0
B 2 1.6
C 1 0.8
D 2 1.6
X 1 0.8
Y 2 1.6
W135 0 0.0
Non-serogroupable 2 1.6
Z 0 0.0
Z′ 0 0.0
Total 10 8.1After returning to the Islamic Republic of Iran having taken 500 mg ciprofloxacin 24 hours before, the carriage rate was zero (P = 0.002).
282 La Revue de Santé de la Méditerranée orientale, Vol. 14, No 2, 2008
املجلة الصحية لشرق املتوسط، منظمة الصحة العاملية، املجلد الرابع عشر، العدد ٢، ٢٠٠٨
References
1. More PS et al. Group A meningococcal carriage in travelers returning from Saudi Arabia. Journal of the American Medical Association, 1988, 260(18):2686–9.
2. Al-Gahtani YM et al. Epidemiological investigation of an outbreak of meningo-coccal meningitis in Makkah, Saudi Ara-bia. Epidemiology and infection, 1995, 115:399–409.
3. Memish ZA. Meningococcal disease and travel. Clinical infectious diseases, 2002, 34:84–90.
4. Rosenstein NE et al. Meningococcal dis-eases. New England journal of medicine, 2001, 344:1378–88.
5. Wilder-Smith A, Barkham I, Chew SK. Absence of Neisseria meningitidis W135 electrophoretic Type 37 during Hajj, 2002. Emerging infectious diseases, 2003, 9(6):734–7.
6. Alborzi A et al. Bacterial etiology of ac-tive childhood meningitis in Shiraz, Iran: Incidence, clinical pictures, complica-tions and antibiotic sensitivity pattern. Infectious diseases and tropical medicine, 2002, 7(18):26–31.
7. Pickering LK, ed. Red Book®: 2006 Report of the Committee on Infectious Diseases,
27th ed. Elk Grove Village, American Academy of Pediatrics, 2006:456.
8. Murray PR et al., eds. Manual of clinical microbiology, 8th ed. Washington DC, American Society for Microbiology, 2003: 601.
9. Nazer L, Rytel MW. Neisseria meningi-tidis serogroup Z as a cause of menin-gitis. Wisconsin medical journal, 1985, 84(8):16–7.
10. Wilder-Smith A et al. Acquisition of menin-gococcal carriage in Hajj pilgrims and transmission to their household contacts: prospective study. British medical journal, 2002, 325:365–6.
11. Gagneux SP et al. Prospective study of a serogroup X Neisseria meningitidis outbreak in northern Ghana. Journal of infectious diseases, 2002, 185:618–26.
12. Cuevas LE et al. Eradication of naso-pharyngeal carrier of Neisseria menin-gitidis in children and adults in rural Af-rica: a comparison of ciprofloxacin and rifampin. Journal of infectious diseases, 1995, 171(3):728–31.

Eastern Mediterranean Health Journal, Vol. 14, No. 2, 2008 283
املجلة الصحية لشرق املتوسط، منظمة الصحة العاملية، املجلد الرابع عشر، العدد ٢، ٢٠٠٨
Clinical and laboratory profile of patients with tuberculosis/HIV coinfection at a national referral centre: a case seriesP. Tabarsi,1 S.M. Mirsaeidi,1 M. Amiri,1 S.D. Mansouri,1 M.R. Masjedi1 and A.A. Velayati1
1National Research Institute of Tuberculosis and Lung Disease, Tehran, Islamic Republic of Iran (Correspondence to P. Tabarsi: [email protected]).Received: 05/04/05; accepted: 05/01/06
ABSTRACT This case series describes the clinical and laboratory profile of 15 patients with tuberculosis (TB) HIV coinfection admitted to a referral centre in the Islamic Republic of Iran. Most of the patients (13) were male; the mean age was 36.9 years. Intravenous drug use was the route of transmission for all males and heterosexual intercourse for the 2 females; 12 patients had a history of imprisonment. All patients had pulmonary TB; 13 were smear-positive and all except 1 had atypical radiological presen-tation. Drug-induced hepatitis occurred in 3 patients and 12 had hepatitis C coinfection. Five patients died. The mean CD4 count was 229.2 (SD 199.5) cells/mm3 and 78.6% had CD4 count < 350. TB may be an AIDS-defining illness in this country.
Profil clinique et biologique de patients présentant une co-infection par la tuberculose et le VIH dans un centre national spécialisé : série de casRÉSUMÉ Cette série de cas décrit le profil clinique et biologique de 15 patients atteints simultanément de tuberculose et d’infection à VIH qui avaient été admis dans un centre spécialisé de la République islamique d’Iran. La plupart des patients (13) étaient des hommes ; la moyenne d’âge s’élevait à 36,9 ans. La toxicomanie par voie intraveineuse était le mode de transmission pour tous les hommes et les relations hétérosexuelles pour les deux femmes ; 12 patients avaient connu la prison. Tous les patients étaient atteints de tuberculose pulmonaire ; 13 avaient un frottis positif et tous, à l’exception d’un, présentaient une image radiologique atypique. Trois patients avaient eu une hépatite médicamenteuse et 12 étaient contaminés par le virus de l'hépatite C (VHC). Cinq patients sont décédés. Le nombre moyen de CD4 était de 229,2 (écart type 199,5) cellules/mm3 et 78,6 % avaient moins de 350 CD4. La tuberculose peut être une pathologie indicatrice du sida dans ce pays.
1336.9
13
12
CD43229.2199.5
CD4378.6350

284 La Revue de Santé de la Méditerranée orientale, Vol. 14, No 2, 2008
املجلة الصحية لشرق املتوسط، منظمة الصحة العاملية، املجلد الرابع عشر، العدد ٢، ٢٠٠٨
Introduction
Tuberculosis (TB) remains one of the most important causes of mortality and morbid-ity in the world [1]. According to World Health Organization (WHO) estimates the total number of new TB cases in the year 2000 was 8.3 million, of which 9% were as-sociated with human immunodeficiency vi-rus/acquired immune deficiency syndrome (HIV/AIDS) [1,2]. In the same year, a total of 1.8 million people died because of TB, with 12% (226 000) of them suffering from both TB and HIV [3]. As the counterpart to this, HIV has resulted in a significant rise in TB cases in different regions of the world [4] and HIV/AIDS is thought to be associ-ated with a high risk of transformation of TB infection to TB disease; in other words, the rate of TB reactivation is 5%–15% per year [1]. These patients are at high risk of acquiring new disease, probably due to the unbalanced secretion of cytokines from their lymphocytes [5,6].
During the process of HIV infection, multiple opportunistic infections occur, with TB being the most important. Also, in contrast to other diseases, TB can occur throughout the course of HIV infection [7]. Meanwhile, during the course of TB disease, both the virus burden and viral heterogene-ity increases [7]. The close relation between HIV and TB and associated poverty leads to a complex situation that makes the imple-mentation of TB control programmes very difficult [8]. The evidence suggests that cooperation is needed between national TB and HIV control programmes worldwide. Recognition of this fact has led WHO to adopt the motto of “2 diseases, 1 patient” and to renew efforts to fight TB [9].
In this article we describe the clinical and laboratory evaluations from a case series of patients with TB/HIV coinfection, in order to obtain a better picture of the clinical profile of these patients.
Methods
SettingMasih Daneshvari hospital, Tehran, acts as the reference unit for the national tubercu-losis programme (NTP) and is the only terti-ary centre for the treatment of TB patients in the Islamic Republic of Iran. It is a WHO collaborative centre in the Eastern Mediter-ranean Region (EMR). This hospital has various diagnostic and therapeutic facilities, such as the mycobacteriology reference laboratory and bronchoscopy, pathology, radiology and thoracic surgery departments. Annually 600 patients with TB are admitted to the hospital, of whom approximately 3% are HIV positive.
SampleAll patients registered in the TB/HIV reg-istry at Masih Daneshvari hospital during 2002–03 were enrolled in the study. The inclusion criteria were: standard serological confirmation of HIV infection [2 positive samples by enzyme-linked immunosorbent assay (ELISA) test and a single positive sample of Western blot test] and clinically and radiologically confirmed TB disease (more than 3 weeks coughing and other pulmonary symptoms compatible with TB) with further pathological and/or standard microbiological confirmation.
Data collectionA special questionnaire was designed to collect the necessary clinical and paraclini-cal data.
Sputum smear by Ziehl–Nielsen stain-ing method was performed in our labora-tory, which is a referral laboratory for the country. Meanwhile sputum culture was performed in Lowenstein–Jensen medium and the sensitivity test was conducted by the proportion method [10].
Flow cytometry was carried out with 2 cm3 of peripheral blood and conjugated
Eastern Mediterranean Health Journal, Vol. 14, No. 2, 2008 285
املجلة الصحية لشرق املتوسط، منظمة الصحة العاملية، املجلد الرابع عشر، العدد ٢، ٢٠٠٨
dual colour antibody panel with fluorescein isothiocyanate and phycoerythrin colour (PE) (Becton Dickinson). The cluster of differentiation (CD) antibodies used were: CD3/CD4, CD3/CD19 and CD3/CD16+56. Using simulation software and fluorescence activated cell sorting, cellular counts were analysed by the flow cytometry technique. Based on CD4+ counts the patients were divided into< 200, 200– < 350, 350– < 500 and ≥ 500 cells/mm3.
The white blood cell (WBC) counts of the patients were classified into 2 groups: < 4000 and 4000–8000 cells/mm3. The erythrocyte sedimentation rate (ESR) was classified into: < 30, 30–60, 60–100 and > 100 mm/h. The normal haematocrit levels of the female and male patients were 36.1–44.3 and 40.7–50.3 mg/dL respectively.
Serological tests for hepatitis B (Diag-nostic Automation) and C (Dia-Pro) were performed in our laboratory using the ELI-SA method. Positive cases of anti-hepatitis C virus (HCV) were further confirmed by polymerase chain reaction in the blood transfusion organization (the reference laboratory for HIV diagnosis).
The chest X-rays of the patients were reported by the radiologist of our centre and were divided into typical and atypical groups. Typical manifestations were when the lesions with postprimary or reactivation characteristics consisted of infiltrative or fibrocavitary opacities occurring in the superior lobe of the lung (apical or posterior segments). Atypical manifestation included: opacities in the middle and inferior lobes of the lung, opacity in the anterior segment of superior lobe, hilar adenopathy, mediastinal adenopathy, pleural effusion and diffuse interstitial nodular opacities. Sometimes normal chest X-ray was seen.
AnalysisThe findings were analysed using SPSS for Windows, version 11. Means and standard
deviation (SD) were calculated. Central indices for quantitative variables were cal-culated. Nominal variables were measured by the chi-squared test and when needed Fisher’s exact test was applied. For vari-ables with an abnormal distribution pattern, the Mann–Whitney U test was performed.
P < 0.05 was considered statistically significant.
Results
A total of 15 patients were enrolled in the study: 13 males (87%) and 2 females (13%). All were Iranian and resided in urban areas of the Islamic Republic of Iran. The mean age was 36.9 (SD 5.87) years, range 24–46 years. With regard to marital status, 11 were married, while 4 were unmarried. The route of transmission of HIV was intravenous drug use in 13 (87%, all the male patients) and heterosexual intercourse in 2 (all of the female patients).
Regarding their past history: 12 (80%) had a history of imprisonment, 13 (87%) had a history of smoking, 13 (87%) had dependence on intravenous heroin and 8 (53%) were alcohol dependent. None of the patients reported any previous illnesses. All of them suffered from pulmonary TB. In 2 patients (14%) extrapulmonary TB occurred simultaneously with pulmonary TB; 1 had tuberculous empyema and 1 had tuberculous pericarditis.
Sputum smear and culture were positive for acid-fast bacilli in 13 (87%) and 9 (60%) patients respectively. In 4 of the cases, the sputum culture was unknown. Antiobiotic sensitivity tests were performed for 9 of them; in 8 patients there was sensitivity to 4 drugs while 1 patient had isolated resistance to rifampicin.
The laboratory findings are summarized in Table 1. Anaemia was detected in 73% of patients, while white blood cell counts were

286 La Revue de Santé de la Méditerranée orientale, Vol. 14, No 2, 2008
املجلة الصحية لشرق املتوسط، منظمة الصحة العاملية، املجلد الرابع عشر، العدد ٢، ٢٠٠٨
in the normal range in 75% (4000–8000 cells/mm3). In 75% of the cases ESR was > 30 mm/h. The mean total CD4+ T-cell count was 229.15 (SD 199.45) cells/mm3 with a range of 8–627 cells/mm3.
Table 2 shows the distribution of CD4 counts among patients. In 50% of the cases the CD4 count was < 200 cells/mm3, while in 79% it was < 350 cells/mm3.
HCV was detected in 12 patients (80%) and the serology of HCV was unclear in 3. In all of the 10 patients with known serological evidence of hepatitis, there was no report of active hepatitis B. However, all were positive for anti-HBc [antibody to hepatitis B core antigen].
The following features were seen on ra-diology: 53% patients had adenopathy, 27% suffered from pleurisy and in only 1 patient cavitary lesions were observed. Upper and
middle lower lobe involvement was seen in 47% and 73% of patients respectively. Reticular patterns and consolidation were observed in 47% and 27% of the patients respectively. Bronchiectasis (13% of cases) and pleural thickening (20%) were also noted.
Only 1 patient had a normal chest X-ray. In 40% of the cases there was bilateral involvement of the lungs. Regarding the radiological pattern, 1 case had typical man-ifestations of TB and the rest (14 patients) demonstrated atypical manifestations. In the 1 case with typical manifestations, the CD4 count was 240 cells/mm3.
There were 3 patients (20%) who devel-oped drug-induced hepatitis. The prevalence of opportunistic infections were: oral and pharyngeal candidiasis (60% of patients), toxoplasmosis encephalitis (1 patient), dif-fuse cytomegalovirus infection (1), crypto-sporidiosis diarrhoea (1) and cryptococcal meningitis (1). One of the female patients suffered from moderate cervical neoplasia (stage CIN2).
Of the patients 13 received the standard 6 months therapy: 2 months isoniazid (IHN) + rifampicin (RIF) + ethambuthol (BMB) + pyrazinamide (PZA) and 4 months IHN + RIF. One patient with drug-induced hepa-titis received INH and ETB for 18 months.
Table 1 Laboratory findings for 15 HIV/AIDS patients with tuberculosis
Parameter Mean SD Range
Leukocyte count (cells/mm3) 5 797.3 2 657.1 3 000–10 600
Haemoglobin (mg/dL) 10.5 1.7 7.8–13.6
Haematocrit (%) 32.5 5.5 26–41
Platelet count (/mm3) 161 600 88 620 2 100–280 000
ESR (mm/h) 69.9 33.6 19–126
CD4 count (cells/mm3) 229.1 199.5 8–627SD = standard deviation.ESR = erythrocyte sedimentation rate.
Table 2 Frequency of CD4 counts for 14 HIV/AIDS patients with tuberculosis (1 patient had no CD4 count)
CD4 count (cells/mm3) No. of patients %
< 200 7 50
200–< 350 4 29
350–< 500 1 7
≥ 500 2 14

Eastern Mediterranean Health Journal, Vol. 14, No. 2, 2008 287
املجلة الصحية لشرق املتوسط، منظمة الصحة العاملية، املجلد الرابع عشر، العدد ٢، ٢٠٠٨
Another patient with resistance to RIF re-ceived treatment with PZA, ETB and INH for 12 month, and 3 patients (20%) had anti-retroviral treatment.
Improvement was seen in 10 (67%) while 5 (33%) patients died, including 1 who was receiving antiretroviral therapy. The causes of deaths were: unknown (2 patients), cryptococcal meningitis (1), cy-tomegalovirus diffuse infection (1) and myocardial infarction (1). There were no relapsing cases during follow-up; the mean length of follow-up was 6.5 months, mini-mum 4 months, maximum 1 year.
Comparing the patients with CD4+ counts < 200 and ≥ 200 cells/mm3, statisti-cal analysis showed significantly more men in the ≥ 200 CD4+ group (P < 0.05). No significant statistical differences were ob-served between the 2 groups with regard to the following variables: age, marital status, education, anaemia, opportunistic infec-tions, haematological variables, ESR, se-rum adenosine deaminase, positive sputum smear and sputum culture. There was also no significant difference in the mortality rate of TB/HIV patients with CD4 counts < 200 and ≥ 200 cells/mm3.
Discussion
After the detection and recognition of HIV in 1983, the declining curve of TB infection started to show a sudden rise during the 1990s [11,12]. At present, diagnosis and treatment of TB/HIV coinfection requires specialist and well-equipped dialogistic facilitates [12,13]. Anticipating the rising incidence of TB in the next 2 decades [8,14] diagnosis and treatment of this disease re-quires special attention. Unless and until HIV is controlled, and the poverty that is associated with TB is overcome, TB control and management will be impractical and unattainable [8,13].
From the epidemiological point of view our TB/HIV patients differed in some re-spects from those present in other parts of the world. Similar to other studies, we found that the majority of the patients were males and that all of the cases lived in urban areas [14,15]. In our country the major route of transmission of HIV is intravenous drug use, while in many countries the route is heterosexual intercourse [15,16–18].
Similar to other research the mean age of our patients was the third decade of life. Most of the patients did not report any previous known disease [14,16]. However, it is important to note that a past history of intravenous drug use and imprisonment was observed in nearly all of the male TB/HIV patients, a much higher rate than in other similar research [14,15]. Overall this dif-ference could be explained by the pattern of HIV transmission in our country. It is notable that there is no significant dissimi-larity between TB/HIV patients and HIV cases [19]. TB is the most important oppor-tunistic infection occurring in HIV patients worldwide [12,16,20–22], with pulmonary TB being the most common form. However, extrapulmonary TB is much more com-monly observed in HIV-positive patients. In our research 14% of the patients suffered from extrapulmonary TB, which is a slightly lower rate compared with other investiga-tions [23,24], but is similar to another study [20]. None of our HIV patients showed atypical mycobacteria (nontuberculous my-cobacteria) which agrees with reports of a low incidence of atypical mycobacteria from other developing countries [18].
From the diagnostic point of view, 87% of the patients had smear-positive TB. De-spite the presence of a large number of pa-tients with CD4 counts < 200 cells/mm3, the above-mentioned rate was high compared with other research [25–27]. Also, sputum culture was positive in 60% of the cases. In

288 La Revue de Santé de la Méditerranée orientale, Vol. 14, No 2, 2008
املجلة الصحية لشرق املتوسط، منظمة الصحة العاملية، املجلد الرابع عشر، العدد ٢، ٢٠٠٨
the remaining patients, reports of sputum culture were not available.
Out of 9 antibiogram reports, only 1 case of isolated resistance to RIF was reported. As seen in our results and other documents, HIV per se could not act as a predisposing factor for drug resistance [28–32]. Although there are reports showing a higher incidence of multi-drug resistant TB in HIV patients [12], no cases of multi-drug resistance were detected in our research. It is noteworthy that isolated RIF resistance is seen more of-ten in HIV-positive patients; the mechanism of this is unclear [31,32].
In laboratory investigations, anaemia was detected in 73% of patients, while white blood cell counts were in the normal range in a majority of the patients. Three-quarters of patients had ESR > 30 mm/h. Similar to other areas of the world in which the major route of HCV transmission is intravenous drug use, our study also showed a high incidence of HCV infection (80%) [14]. In 3 of the patients the HCV serology was not clear. Regarding CD4 counts, 50% of patients had counts < 200 cells/mm3, which agrees with other studies [16,20,27]. The incidence of drug-induced hepatitis was 20%, which could be expected because of the common occurrence of HIV and HCV coinfection [33].
Taking into account the radiological features, most of the patients had atypi-cal TB presentation. Although adenopathy and pleurisy were observed in half of the patients, cavities were detected in only 1 case. Meanwhile, no major difference in radiological manifestations was detected between patients with CD4 counts < 200 and ≥ 200 cells/mm3, suggesting that there is no direct relationship between cavity formation and fibrotic changes with CD4 counts. The factors which are responsible for the appearance of radiological mani-festations have not been fully established
[26]. However, our study conflicts with the evidence that there are differences in the radiological manifestations of patients with CD4 counts < 200 and ≥ 200 cells/mm3
[34,35]. Further work with larger sample sizes is needed to confirm the findings.
The mortality and morbidity rates in our study were 6 times higher than that of HIV-negative TB cases in our institute. This confirms other studies showing the higher mortality and morbidity rates of TB/HIV-positive patients as compared to HIV-nega-tive patients [26,27,36]. Various studies have shown that TB is the commonest cause of death in HIV patients [19,37]. In this investigation, 60% of the deaths were due to non-TB causes, while in 2 it was unknown. It has been pointed out in different articles that although early deaths of TB/HIV-posi-tive patients are often due to TB, mortality occurring later is usually the result of non-TB opportunistic infections [27,33,36,39]; thus opportunistic infections must be kept in mind [26,27]. For this reason, TB with its various types is regarded as an “AIDS-defining illness” [26,38]. It has been shown that with anti-TB treatment, the viral load and CD4 count in TB patients do not change significantly [40]. Only chemoprophylaxis with cotrimoxazole can decrease mortal-ity and morbidity of these patients by 48% [37].
Conclusion
Our case series in a referral hospital in the Islamic Republic of Iran showed a high pro-portion of TB/HIV patients with low CD4 counts, with 79% having CD4 < 350 cells/mm3. Also, opportunistic infections such as toxoplasmosis occurred in a number of patients. With further evaluations and larger sample sizes, more accurate statistical data would be obtained.

Eastern Mediterranean Health Journal, Vol. 14, No. 2, 2008 289
املجلة الصحية لشرق املتوسط، منظمة الصحة العاملية، املجلد الرابع عشر، العدد ٢، ٢٠٠٨
References
1. Cahn P et al. Tuberculosis and HIV, a partnership against the most vulnerable. Journal of the International Association of Physicians in AIDS Care, 2003, 2(3):106–23.
2. Von Reyn CF, Vuola JM. New vaccines for the prevention of tuberculosis. clinical Infectious diseases, 2002, 35:465–74.
3. Corbett EL et al. The growing burden of tuberculosis: global trends and interac-tions with the HIV epidemic. Archives of internal medicine, 2003, 163:1009–21.
4. Williams BG, Dye C. Antiretroviral drugs for tuberculosis control in era of HIV/AIDS. Science, 2003, 301:1535–7.
5. Daley CL et al. An outbreak of tuberculo-sis with accelerated progression among persons infected with the human immu-nodeficiency virus. An analysis using re-striction-fragment-length polymorphisms. New England journal of medicine, 1992, 326:231–5.
6. Selwyn PA et al. A prospective study of the risk of tuberculosis among intrave-nous drug users with HIV. New England journal of medicine, 1993, 328:1137–44.
7. Toossi Z. Virological and immunological impact of tuberculosis on human immuno-deficiency virus type 1 disease. Journal of infectious diseases, 2003, 188(8):1146–55.
8. Davies PDO. The world-wide increase in tuberculosis: how demographic changes, HIV infection and increasing numbers in poverty are increasing tuberculosis. An-nals of medicine, 2003, 35(4):235–43.
9. Tuberculosis: strategy and operations, monitoring and evaluation. Geneva, World Health Organization, 2003.
10. Ahya SN, Flood K, Paranjothi S, eds. The Washington manual of medical therapeu-tics, 30th ed. Philadelphia, Lippincott, Williams and Wilkins, 2001.
11. Mohanty KC, Bendre S. Changing trends in management of HIV and TB. Journal of the Indian Medical Association, 2003, 101(3):186–8.
12. Pathni AK, Chauhan LS. HIV/TB in In-dia: a public health challenge. Journal of the Indian Medical Association, 2003, 101(3):148–9.
13. Morozova I et al. Impact of the growing HIV-1 epidemic on multidrug-resistant tu-berculosis control in Latvia. International journal of tuberculosis and lung disease, 2003, 7(9):903–6.
14. Batyrov FA et al. Kontingent VICH-in-fitsirovannykh bol’nykh tuberkulezom v protivotuberkuleznom uchrezhdenii [A category of patients with Tuberculosis concomitant with HIV infection in an anti-TB facility]. Problemy tuberkuleza i bolez-nei legkikh, 2003, (5):6–9.
15. Garcia Vazquez E, Cedillos RA, Wheeler DA. Clinical and demographic features of HIV infection in El Salvador. Revista panamericana de salud pública, 2003, 13(5):327–31.
16. Leim JM et al. Epidemiology and clinical features of HIV infection/AIDS in Korea. Yonsei medical journal, 2003, 44(3):363–70.
17. Mori T et al. [An observation on tuber-culosis associated with HIV infection in Japan.] Kekkaku, 1997, 72(12):649–57 [in Japanese].
18. Dey SK, Pal NK, Chakrabarty MS. Cases of human immunodeficiency virus infec-tion and tuberculosis—early experiences of different aspects. Journal of the Indian Medical Association, 2003, 101(5):291–6.
19. Zamani S et al. Prevalence of and risk fac-tors associated with HIV-1 infection among drug users visiting treatment centers in Tehran, Iran. AIDS, 2005, 19(7):709–16.

290 La Revue de Santé de la Méditerranée orientale, Vol. 14, No 2, 2008
املجلة الصحية لشرق املتوسط، منظمة الصحة العاملية، املجلد الرابع عشر، العدد ٢، ٢٠٠٨
20. Senya C et al. Spectrum of opportunistic infections in hospitalized HIV-infected patients in Phnom Penh, Cambodia. In-ternational journal of STD & AIDS, 2003, 14(6):411–6.
21. Vajpayee M et al. Spectrum of opportunis-tic infections and profile of CD4(+) counts among AIDS patients in north India. Infec-tion, 2003, 31(5):336–40.
22. Dalcolmo M. Tuberculosis and HIV infec-tion Brazil—update and overview. TB & HIV, 1996, Jun–Aug (11):26.
23. Torrens JK. HIV and tuberculosis in a ru-ral hospital in Kenya. East African medical journal, 2000, 77(4):185–8.
24. Havlir DV, Barnes PF. Tuberculosis in patients with human immunodeficiency virus infection. New England journal of medicine, 1999, 340(5):367–73.
25. Pasqualotto AC et al. Retrospective study of 668 cultures for Mycobacteria in a refer-ence hospital for AIDS in southern Brazil. Brazilian journal of infectious diseases, 2003, 7(2):126–8.
26. Zumla A et al. Impact of HIV infection on tuberculosis, Postgraduate medical jour-nal, 2000, 70:259–68.
27. Murray J et al. Human immunodeficiency virus and the outcome of treatment for new and recurrent pulmonary tuberculo-sis in African patients. American journal of respiratory and critical care medicine, 1999, 159:733–40.
28. Gordin FM et al. The impact of human immunodeficiency virus infection on drug resistant tuberculosis. American journal of respiratory and critical care medicine, 1996, 154:1478–83.
29. Mitike G, Kebede D, Yeneneh H. HIV infection and antituberculosis drug re-sistance among pulmonary tuberculosis patients in Harar tuberculosis centre, Ethi-
opia. East African medical journal, 1997, 74:154–7.
30. Perriens JH et al. Pulmonary tuberculo-sis in HIV-infected patients in Zaire. A controlled trial of treatment for either 6 or 12 months. New England journal of medi-cine, 1995, 332(12):779–86.
31. Munstiff SS et al. Rifampin-monoresist-ant tuberculosis in New York city, 1993–1994. Clinical infectious diseases, 1997, 25:1465–7.
32. Lutfey M et al. Independent origin of mono-rifampin-resistant mycobacterium tuberculosis in patients with AIDS. Ameri-can journal of respiratory and critical care medicine, 1996, 153:837–40.
33. Centers for Disease Control. Treatment for tuberculosis. Morbidity and mortality weekly report, 2003, 52:51–4.
34. Perlman DC et al. Variation of chest radio-graphic patterns in pulmonary tuberculosis by degree of human immunodeficiency vi-rus-related immunosuppression. The Terry Beirn Community Programs for Clinical Re-search on AIDS (CPCRA). The AIDS Clini-cal Trials Group (ACTG).Clinical infectious diseases, 1997, 25:242–6.
35. Kawooya VK, Kawooya M, Okwera A. Radiographic appearance of pulmonary Tuberculosis in HIV-1 seropositive and seronegative adult patients East African medical journal, 2000, 77(6):303–7.
36. Mayau C, Cadranel J. Tuberculosis in AIDS: past or new problems. Thorax, 1999, 54:567–71.
37. Colebunders R, Lambert ML. Manage-ment of co-infection with HIV and TB. British medical journal, 2002, 324:802–3.
38. Centers for Disease Control. The 1993 revised classification system for HIV in-fection and expanded surveillance case definition for AIDS among adolescents
Eastern Mediterranean Health Journal, Vol. 14, No. 2, 2008 291
املجلة الصحية لشرق املتوسط، منظمة الصحة العاملية، املجلد الرابع عشر، العدد ٢، ٢٠٠٨
and adults. Morbidity and mortality weekly report, 1993, 41(17):1–19.
39. Currie CS et al. Tuberculosis epidemics driven by HIV is prevention better than cure. AIDS, 2003, 17(17):2501–8.
40. Morris L et al. Human immunodeficiency virus-1 RNA levels and CD4 lymphocyte counts, during treatment for active tu-berculosis, in South African patients. Journal of infectious diseases, 2003, 187(12):1967–71.
Tuberculosis infection and transmissionLeft untreated, each person with active TB disease will infect around 10–15 people every year. But people infected with TB bacilli will not necessarily become sick with the disease. When someone’s immune system is weakened, the chances of becoming sick are greater. 5-10% of those infected with TB bacilli become sick or infectious at some time during their life. People infected with both HIV and TB are much more likely to develop TB disease. In 2005, estimated per capita TB incidence was stable or falling in all six World Helath Organization (WHO) regions. However, the slow de-cline in incidence rates is offset by population growth. Consequently, the number of new cases arising each year is still increasing glob-ally and in the WHO regions of Africa, the Eastern Mediterranean and South-East Asia.In 2006, WHO launched the new Stop TB Strategy. The core of this strategy is DOTS, the TB control approach launched by WHO in 1995. Since its launch, more than 22 million patients have been treated under DOTS-based services. The new strategy builds on this suc-cess, while recognizing the key challenges of TB/HIV and MDR-TB. It also responds to access, equity and quality constraints, and adopts evidence-based innovations in engaging with private health-care pro-viders, empowering affected people and communities and helping to strengthen health systems and promote research.
Source: Fact sheet N°104, available in Arabic, English and French (http://www.stoptb.org/resource_center/fact_sheets.asp).

292 La Revue de Santé de la Méditerranée orientale, Vol. 14, No 2, 2008
املجلة الصحية لشرق املتوسط، منظمة الصحة العاملية، املجلد الرابع عشر، العدد ٢، ٢٠٠٨
Knowledge and attitude about HIV/AIDS of schoolteachers in Yazd, Islamic Republic of Iran S.S. Mazloomy1 and M.H. Baghianimoghadam1
1Department of Health Services, Faculty of Health, Shahid Sadoughi University of Medical Sciences and Health Services, Yazd, Islamic Republic of Iran (Correspondence to S.S. Mazloomy: [email protected]).Received: 12/05/05; accepted: 18/09/05
ABSTRACT A cross-sectional interview study was made with 290 teachers in 10 high schools in Yazd city, Islamic Republic of Iran. More than 90% of the participants had previously received information about HIV and AIDS. Only 207 (71.4%) correctly answered all questions on methods of transmission of HIV/AIDS. Most knew about sexual contact (93.1%) and infected blood (92.1%) as methods of transmission. Some teachers (20.3%) thought that mosquitoes could transmit HIV/AIDS. Regarding attitudes toward HIV/AIDS, over 55% of the teachers agreed or strongly agreed that infected people should be quarantined, whereas 17% agreed or strongly agreed that AIDS is a specific disease of those with high-risk sexual behaviour. Married teachers held more positive attitudes toward HIV/AIDS than unmarried teachers.
Connaissances et attitudes vis-à-vis du VIH/sida chez des enseignants de Yazd (République islamique d’Iran) RÉSUMÉ Une étude transversale par entretiens a été menée auprès de 290 enseignants de 10 établissements d’enseignement secondaire de Yazd (République islamique d’Iran). Plus de 90 % des participants avaient déjà reçu des informations sur le VIH et le sida. Seuls 207 (71,4 %) connaissaient les véritables modes de transmission du VIH/sida. La plupart d’entre eux savaient que les contacts sexuels (93,1 %) et le sang contaminé (92,1 %) en faisaient partie. Certains enseignants (20,3 %) pensaient que les moustiques pouvaient transmettre le virus. En ce qui concerne les attitudes vis-à-vis du VIH/sida, plus de 55 % des enseignants étaient favorables ou très favorables à la mise en quarantaine des personnes infectées, alors que 17 % pensaient ou étaient persuadés que le sida est une maladie qui touche surtout les personnes ayant un comportement sexuel à haut risque. Les enseignants mariés avaient des attitudes plus positives vis-à-vis du VIH/sida que les enseignants non mariés.
29090
20771.493.1
92.120.355
17

Eastern Mediterranean Health Journal, Vol. 14, No. 2, 2008 293
املجلة الصحية لشرق املتوسط، منظمة الصحة العاملية، املجلد الرابع عشر، العدد ٢، ٢٠٠٨
Introduction
The number of people with HIV/AIDS is estimated to be 39.5 million and the number of newly infected cases of HIV in 2006 was 4.3 million [1], with over 90% of new cases occurring in less developed countries [2]. There continues to be a considerable amount of research on HIV in the areas of preventive vaccines, microbicides, sexu-ally transmitted diseases (STD) control and antiretroviral therapy. As effective forms of these interventions are in many cases not yet available, there is a critical need to focus on initiating and maintaining behaviour change in the population [3]. Unfortunately there are few studies from developing countries that have been able to examine the key fac-tors that determine how much people know about HIV/AIDS prevention [4].
The prevalence of HIV in the Islamic Republic of Iran, like other parts of the world, has been slowly rising in recent years. The prevalence of HIV in the country was 2 per 100 000 in 2004 [5]. This rate is low compared with the rates in many coun-tries, including the United States (0.61%) and especially African countries such as Zimbabwe (21.7% –27.8%) [6]. Although HIV prevalence is low in the Islamic Re-public of Iran, existing conditions could lead to the rapid spread of HIV/AIDS.
An important factor fuelling the spread of HIV/AIDS in developing countries is believed to be poor knowledge about how the disease is spread and how it can be prevented. The results of a survey in Mada-gascar showed that 68% of participants in the study did not know that vaginal sex with a properly used condom is low risk [7]. A study of students in the Islamic Republic of Iran demonstrated that the knowledge of students about HIV/AIDS was moderate [8] and a study of high-school teachers showed that only 63.3% had a good level of knowledge [9].
Because schoolteachers have an im-portant role to play in national strategies towards HIV/AIDS prevention, the aim of this study was to assess the knowledge and attitude of teachers in Yazd city about HIV/AIDS.
Methods
In this cross-sectional study, a questionnaire was completed anonymously by 290 teach-ers from 10 high schools in Yazd city, Is-lamic Republic of Iran, in winter 2004. The teachers were selected by cluster sampling from the list of high schools at the Depart-ment of Education of Yazd Province.
The data were collected using a spe-cially designed questionnaire consisting of 3 sections: demographic data and previous sources of knowledge about HIV and AIDS (6 questions), knowledge about HIV/AIDS, routes of transmission and methods of prevention and control (17 questions) and attitudes to HIV/AIDS (3 questions). The maximum score was 17 and a score > 14 was considered good, 10–14 moderate and < 10 poor. The 3 attitude questions asked if people infected with HIV/AIDS should be quarantined, if AIDS is a specific disease of those with high-risk sexual behaviours and if you can catch AIDS from speaking to people infected with HIV. Attitudes were score on a 5-point Likert scale (5 = strongly agree to 1 = strongly disagree).
Frequency calculations, Spearman rank correlation and chi-squared tests were per-formed using SPSS.
Results
Of the 290 participants, 131 (45.2%) were women and 159 (54.8%) men; 268 (92.4%) were married. Most of the participants (90%) had previously received information
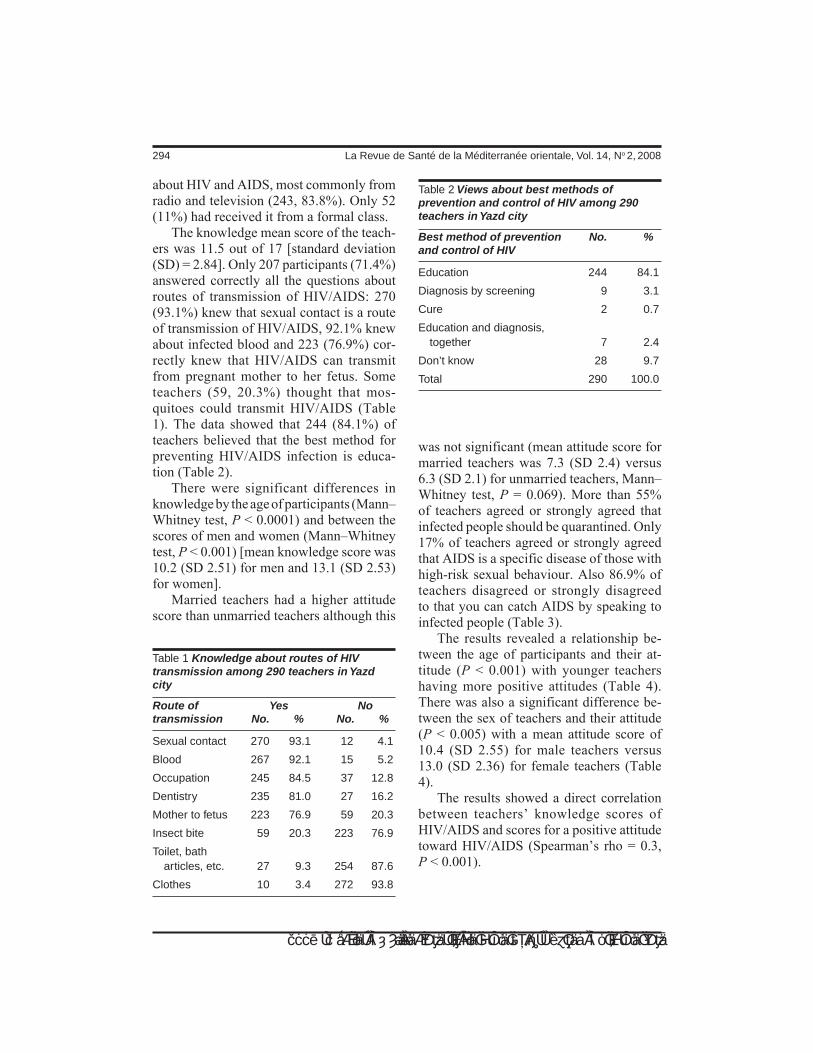
294 La Revue de Santé de la Méditerranée orientale, Vol. 14, No 2, 2008
املجلة الصحية لشرق املتوسط، منظمة الصحة العاملية، املجلد الرابع عشر، العدد ٢، ٢٠٠٨
about HIV and AIDS, most commonly from radio and television (243, 83.8%). Only 52 (11%) had received it from a formal class.
The knowledge mean score of the teach-ers was 11.5 out of 17 [standard deviation (SD) = 2.84]. Only 207 participants (71.4%) answered correctly all the questions about routes of transmission of HIV/AIDS: 270 (93.1%) knew that sexual contact is a route of transmission of HIV/AIDS, 92.1% knew about infected blood and 223 (76.9%) cor-rectly knew that HIV/AIDS can transmit from pregnant mother to her fetus. Some teachers (59, 20.3%) thought that mos-quitoes could transmit HIV/AIDS (Table 1). The data showed that 244 (84.1%) of teachers believed that the best method for preventing HIV/AIDS infection is educa-tion (Table 2).
There were significant differences in knowledge by the age of participants (Mann–Whitney test, P < 0.0001) and between the scores of men and women (Mann–Whitney test, P < 0.001) [mean knowledge score was 10.2 (SD 2.51) for men and 13.1 (SD 2.53) for women].
Married teachers had a higher attitude score than unmarried teachers although this
was not significant (mean attitude score for married teachers was 7.3 (SD 2.4) versus 6.3 (SD 2.1) for unmarried teachers, Mann–Whitney test, P = 0.069). More than 55% of teachers agreed or strongly agreed that infected people should be quarantined. Only 17% of teachers agreed or strongly agreed that AIDS is a specific disease of those with high-risk sexual behaviour. Also 86.9% of teachers disagreed or strongly disagreed to that you can catch AIDS by speaking to infected people (Table 3).
The results revealed a relationship be-tween the age of participants and their at-titude (P < 0.001) with younger teachers having more positive attitudes (Table 4). There was also a significant difference be-tween the sex of teachers and their attitude (P < 0.005) with a mean attitude score of 10.4 (SD 2.55) for male teachers versus 13.0 (SD 2.36) for female teachers (Table 4).
The results showed a direct correlation between teachers’ knowledge scores of HIV/AIDS and scores for a positive attitude toward HIV/AIDS (Spearman’s rho = 0.3, P < 0.001).
Table 1 Knowledge about routes of HIV transmission among 290 teachers in Yazd city
Route of Yes Notransmission No. % No. %
Sexual contact 270 93.1 12 4.1
Blood 267 92.1 15 5.2
Occupation 245 84.5 37 12.8
Dentistry 235 81.0 27 16.2
Mother to fetus 223 76.9 59 20.3
Insect bite 59 20.3 223 76.9
Toilet, bath articles, etc. 27 9.3 254 87.6
Clothes 10 3.4 272 93.8
Table 2 Views about best methods of prevention and control of HIV among 290 teachers in Yazd city
Best method of prevention No. %and control of HIV
Education 244 84.1
Diagnosis by screening 9 3.1
Cure 2 0.7
Education and diagnosis, together 7 2.4
Don’t know 28 9.7
Total 290 100.0
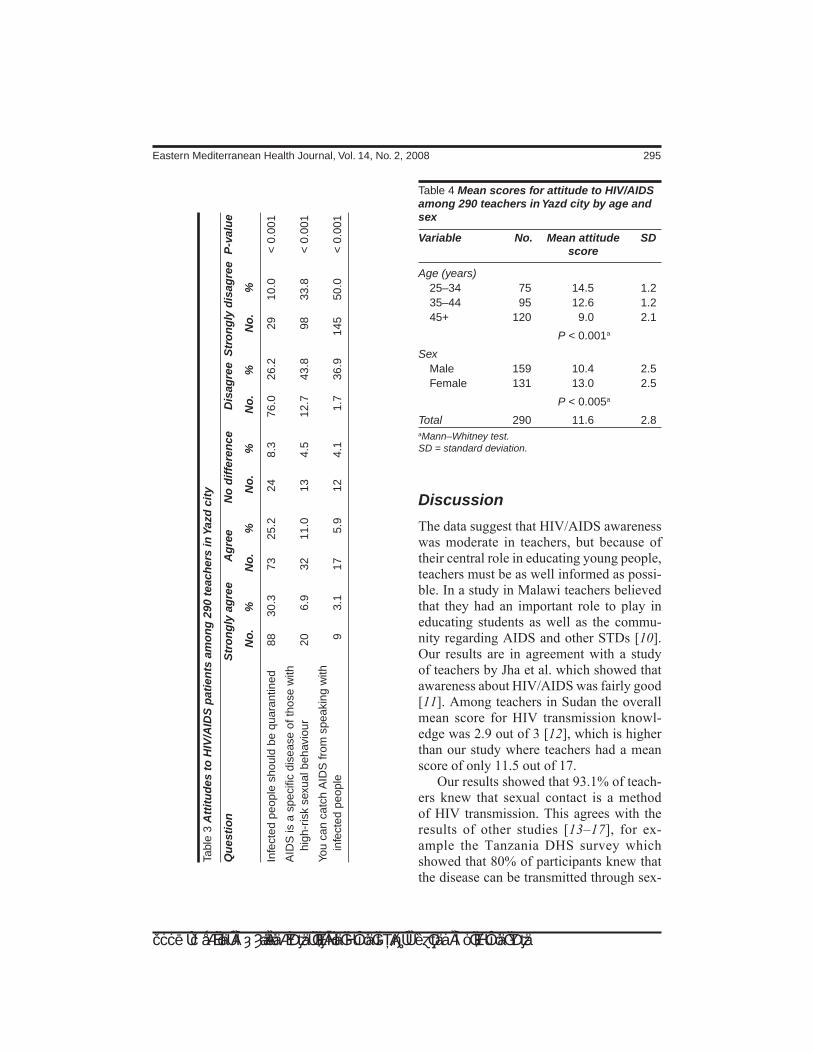
Eastern Mediterranean Health Journal, Vol. 14, No. 2, 2008 295
املجلة الصحية لشرق املتوسط، منظمة الصحة العاملية، املجلد الرابع عشر، العدد ٢، ٢٠٠٨
Discussion
The data suggest that HIV/AIDS awareness was moderate in teachers, but because of their central role in educating young people, teachers must be as well informed as possi-ble. In a study in Malawi teachers believed that they had an important role to play in educating students as well as the commu-nity regarding AIDS and other STDs [10]. Our results are in agreement with a study of teachers by Jha et al. which showed that awareness about HIV/AIDS was fairly good [11]. Among teachers in Sudan the overall mean score for HIV transmission knowl-edge was 2.9 out of 3 [12], which is higher than our study where teachers had a mean score of only 11.5 out of 17.
Our results showed that 93.1% of teach-ers knew that sexual contact is a method of HIV transmission. This agrees with the results of other studies [13–17], for ex-ample the Tanzania DHS survey which showed that 80% of participants knew that the disease can be transmitted through sex-
Tabl
e 3
Att
itu
des
to
HIV
/AID
S p
atie
nts
am
on
g 2
90 t
each
ers
in Y
azd
cit
y
Qu
esti
on
S
tro
ng
ly a
gre
e A
gre
e N
o d
iffe
ren
ce
Dis
agre
e S
tro
ng
ly d
isag
ree
P-v
alu
e
No
. %
N
o.
%
No
. %
N
o.
%
No
. %
Infe
cted
peo
ple
shou
ld b
e qu
aran
tined
88
30
.3
73
25.2
24
8.
3 76
.0
26.2
29
10
.0
< 0
.001
AID
S is
a s
peci
fic d
isea
se o
f tho
se w
ith
hi
gh-r
isk
sexu
al b
ehav
iour
20
6.
9 32
11
.0
13
4.5
12.7
43
.8
98
33.8
<
0.0
01
You
can
catc
h A
IDS
from
spe
akin
g w
ith
in
fect
ed p
eopl
e 9
3.1
17
5.9
12
4.1
1.7
36.9
14
5 50
.0
< 0
.001
Table 4 Mean scores for attitude to HIV/AIDS among 290 teachers in Yazd city by age and sex
Variable No. Mean attitude SD score
Age (years) 25–34 75 14.5 1.2 35–44 95 12.6 1.2 45+ 120 9.0 2.1
P < 0.001a
Sex Male 159 10.4 2.5 Female 131 13.0 2.5
P < 0.005a
Total 290 11.6 2.8aMann–Whitney test. SD = standard deviation.

296 La Revue de Santé de la Méditerranée orientale, Vol. 14, No 2, 2008
املجلة الصحية لشرق املتوسط، منظمة الصحة العاملية، املجلد الرابع عشر، العدد ٢، ٢٠٠٨
ual contact [13]. Our results do not support Peltzer’s study of teachers which indicated very poor general knowledge about trans-mission of HIV [18] and Chatterjee et al. who showed that only 16.2% of teachers had clear knowledge about HIV transmis-sion and prevention [19].
In our study 76.9% of teachers knew that HIV can transmit from pregnant mother to her fetus which is lower than Walter’s study reported in 2001 that 95% of women knew that one of the methods of transmission of HIV/AIDS is from mother to baby [20].
Some of our participants (20.3%) be-lieved erroneously that mosquitoes could transmit HIV/AIDS. In a study in Mada-gascar, most participants thought that mos-quitoes could transmit HIV/AIDS [7]. In another study of Iranian students, 33% believed that mosquito bites could transmit HIV/AIDS [8].
Our data show that 90% of participants had previously received HIV and AIDS information, 83.8% from radio and televi-sion. In Madagascar 88% of participants’ information was from radio [7]. In another Iranian study, most information was from television [8]. In a study in Yemen, televi-sion was the most common source of infor-mation [21]. Agrawal et al. showed that the mass media are important for disseminating knowledge on HIV/AIDS in India [22].
The results of our study show that 30.3% of teachers believed that infected people should be quarantined and this agrees with the results of Brook who reported that 39% of teachers in Israel thought that a pupil infected with HIV should be kept away from school [23]; however, this was a study from 1994 when fewer people would be expected to know about AIDS. A study in Yemen [21] revealed an intolerant attitude toward AIDS- and HIV-positive patients that was the opposite of our study where, taking account of responses to all 3 attitude questions, attitudes towards HIV/AIDS were generally positive.
Boscarino and DiClemente argued that as new school-based HIV and AIDS poli-cies and prevention programmes became formulated in the 1990s, teacher input would be critical to effective programme develop-ment and implementation [24]. Our data indicate a direct relationship between teach-ers’ knowledge of HIV/AIDS and a positive or supportive attitude toward HIV/AIDS. To achieve success, it is important that teachers’ knowledge, comfort, and support be taken into consideration during both the development and implementation phases of school-based programmes. Finally, we recommend that professional development for Iranian teachers include strategies for educating adolescents about HIV/AIDS.
References1. Global AIDS epidemic continues to grow.
World Health Organization press release (http://www.who.int/hiv/mediacentre/news62/en/index.html, accessed 30 Au-gust 2007).
2. Ramazanghani A, Rostami S, Shokrolah A. Evaluation of the rate of awareness and attitude of high school students in Te-hran government schools towards AIDS. Journal of Shahid Sadoughi University of
Medical Sciences and Health Services, 2003, 11(1):42–7.
3. Koblin BA et al. High-risk behaviors among men who have sex with men in 6 us cities: baseline data FROM the EX-PLORE study. American journal of public health, 2003, 93(6):926–32.
4. Aggarwal RM, Rous JJ. Know AIDS for No AIDS. Determinants of knowledge

Eastern Mediterranean Health Journal, Vol. 14, No. 2, 2008 297
املجلة الصحية لشرق املتوسط، منظمة الصحة العاملية، املجلد الرابع عشر، العدد ٢، ٢٠٠٨
regarding HIV/AIDS among women in India. Paper presented at conference on 75 years of Development Research, Cornell University, May 2004 (http://www.econ.yale.edu/seminars/NEUDC03/Agagrwal&Rous-AIDS.pdf, accessed 8 January 2007).
5. HIV/AIDS in Iran. UNICEF website (http://www.unicef.org/iran/media_2016.html, accessed 30 August 2007).
6. Country profile: Zimbabwe. World Health Organization factsheet (http://www.who.int/hiv/HIVCP_ZWE.pdf, accessed 30 August 2007).
7. Lanouette NM et al. HIV- and AIDS-related knowledge, awareness, and prac-tices in Madagascar. American journal of public health, 2003, 93(6):917–9.
8. Tavoosi A et al. Knowledge and attitude towards HIV/AIDS among Iranian stu-dents. BMC public health, 2004, 4:17.
9. Nouhi Siahroudi A et al. Knowledge and attitude toward HIV/AIDS among high school teachers of Polad Shahr, Isfahan. Paper presented at the 1st National Con-gress on Health Education Yazd, Islamic Republic of Iran , 2003.
10. Kumar A et al. Teachers’ awareness and opinion about AIDS: implications for school based AIDS education. Jour-nal of communicable diseases, 1995, 27(2):101–6.
11. Jha N et al. Teachers’ awareness and opinion about AIDS—a study from east-ern Nepal. Journal of communicable dis-eases, 2001, 33(3):105–211.
12. Elzubier AG, El Nour MH, Ansari EH. AIDS-related knowledge and miscon-ceptions among high secondary school teachers and students in Kassala, Su-dan. East African medical journal, 1996, 73(5):295–7.
13. Tanzania DHS survey reveals gaps in AIDS knowledge. Newsletter (Macro Sys-tems. Institute for Resource Develop-
ment. Demographic and Health Surveys), 1993, 6(1):8–9.
14. Chesney M, Smith AW. Critical delays in HIV testing and care: the potential role of stigma. American behavioral scientist, 1999, 42(7):1162–74.
15. Herek GM. AIDS and stigma. American behavioral scientist, 1999, 42:1102–12.
17. Ayo-Yusuf I, Naidoo S, Chikte UM. The role of primary school teachers in HIV prevention in South Africa. Journal of the South African Dental Association, 2001, 56(12):596–8.
18. Peltzer K. Knowledge and attitudes about HIV/AIDS of a sample of school teachers in South Africa. Psychological reports, 2000, 87(3 Pt 2):1065–6.
19. Chatterjee C et al. A study on awarness of AIDS among school students and teach-ers of higher secondary schools in north Calcutta. Indian journal of public health, 2001, 45(1):27–30.
20. Walter EB et al. New mothers’ knowledge and attitudes about perinatal human im-munodeficiency virus infection. Obstetrics and gynecology, 2001, 97(1):70–6.
21. Al-Serouri AW et al. Knowledge, attitude and beliefs about HIV/AIDS in Sana’a, Yemen. Eastern Mediterranean health journal, 2002, 8(6):706–15.
22. Agrawal HK et al. Knowledge of and at-titude to HIV/AIDS of senior secondary school pupils and trainee teachers in Udupi District, Karnataka, India. Annals of tropical paediatrics, 1999, 19:143–9.
23. Brook U. Teachers’ attitude towards AIDS: an explorative study in Israel. Pa-tient education and counselling, 1994, 24(3):337–40.
24. Boscarino JA, DiClemente RJ. AIDS knowledge, teaching comfort, and support for AIDS education among school teach-ers: a statewide survey. AIDS education and prevention, 1996, 8(3):267–77.

298 La Revue de Santé de la Méditerranée orientale, Vol. 14, No 2, 2008
املجلة الصحية لشرق املتوسط، منظمة الصحة العاملية، املجلد الرابع عشر، العدد ٢، ٢٠٠٨
Knowledge, attitudes and beliefs about tuberculosis in urban MoroccoS. Ottmani,1 Z. Obermeyer,2 N. Bencheikh3 and J. Mahjour 3
1Stop TB Department, World Health Organization, Geneva, Switzerland.2Harvard Medical School, Boston, Massachusetts, United States of America (Correspondence to Z. Obermeyer: [email protected]). 3Department of Epidemiology and Disease Prevention, Ministry of Health, Rabat, Morocco.Received: 23/01/07; accepted: 24/04/07
ARSTRACT We sought to characterize conceptions of tuberculosis (TB) in an urban population in Mo-rocco. Thus 301 subjects, some being treated for TB (patients) and some attending health facilities for other conditions (non-patients), in 2 Moroccan cities were surveyed. Most patients did not identify their illness as TB referring instead to a body region or symptom. Non-patients tended to cite causative fac-tors related to living conditions, home and family. There was considerable stigma associated with TB. Most non-patients knew that TB was treatable, but few were aware that diagnosis and treatment were free. Popular understandings of TB etiology and transmission in this population differ from the biomedi-cal view, highlighting the need for better communication about the disease.
Connaissances, attitudes et croyances relatives à la tuberculose en milieu urbain au Maroc RÉSUMÉ Nous avons cherché à décrire la façon dont est perçue la tuberculose dans une population urbaine au Maroc. Notre étude a porté sur 301 sujets qui, pour certains, recevaient un traitement antituberculeux (patients) et pour d’autres, se rendaient dans des établissements de santé pour d’autres maladies (non-patients), dans deux villes marocaines. La plupart des patients ne mettaient pas le nom de « tuberculose » sur leur maladie, mais évoquaient plutôt une région du corps ou un symptôme. Les non-patients avaient tendance à évoquer des facteurs causals liés aux conditions de vie, au logement et à la famille. La tuberculose suscitait énormément de préjugés défavorables. La plupart des non-patients savaient que la tuberculose pouvait se soigner, mais beaucoup ignoraient que le diagnostic et le traitement étaient gratuits. Les idées sur l’étiologie et la transmission de la tuberculose qui circulaient dans cette population s’opposent au point de vue biomédical, ce qui met en lumière la nécessité d’une meilleure communication sur cette maladie.
301

Eastern Mediterranean Health Journal, Vol. 14, No. 2, 2008 299
املجلة الصحية لشرق املتوسط، منظمة الصحة العاملية، املجلد الرابع عشر، العدد ٢، ٢٠٠٨
Introduction
Morocco has had a national tuberculosis control programme for more than 40 years, and was one of the first countries to adopt the DOTS (directly observed treatment, short-course) strategy in the early 1990s. For the past 10 years, the Moroccan Na-tional Tuberculosis Programme (NTP) is estimated to have met and exceeded inter-national targets for estimated case detection and treatment success rates [1]. The NTP is fully funded by the Moroccan government, providing consultation and treatment at no cost to patients.
The Moroccan NTP uses passive case-finding, a method of case detection that relies on patients to present themselves to public health facilities for diagnosis and treatment. It is thus important to understand the factors that encourage and discour-age patients to seek care. Knowledge and perceptions of illness and its treatment are known to affect the way in which tubercu-losis patients utilize health services [2–6]. This study sought to examine beliefs sur-rounding tuberculosis in Morocco, in both tuberculosis patients and others seeking care in public health facilities, with a view to understanding care-seeking behaviour. Specific factors explored were the nature of tuberculosis and its transmission; the stigma attached to the illness and its consequences; and patients’ understandings of health serv-ice provision for tuberculosis.
Methods
The study population was drawn from 2 urban regions of Morocco thought to have high rates of tuberculosis: the prefecture of Ben M’sik-Sidi Othman in the city of Casa-blanca and the prefectures of Fes-Medina and Zouagha-Moulay Yacoub in the city of Fes. In both cities, 3 government commu-
nity health centres were selected, along with 1 government health centre specializing in management of tuberculosis and chest dis-eases. These centres were chosen because they serve the mostly urban, poor patient groups that are of primary interest to the tu-berculosis control programme, and because personnel at these centres had the training and ability to carry out the survey.
The population was selected to represent 3 distinct populations of adults (over 20 years old): 1) patients diagnosed with tuber-culosis and currently undergoing treatment; 2) patients who were suspected of having tuberculosis but had not yet undergone confirmation by appropriate investigation, including sputum testing; and 3) a group of patients meant to represent the gen-eral population, who presented to the same health centres for illnesses unrelated to tuberculosis. The latter 2 were grouped into the category of non-patients, and results from these 2 groups are presented together unless noted otherwise.
The survey was designed to elicit sub-jects’ views about 3 main topics: the nature of tuberculosis and its transmission, stigma surrounding the disease, and knowledge of treatment and health service provision. Specific questions on these topics were tailored to individual patient groups. Tuber-culosis patients were administered an open questionnaire, aimed at understanding how they viewed their own illness, instances of stigmatization they had faced, and knowl-edge of available health services including treatment. Non-patients were given a modi-fied closed questionnaire administered by an interviewer, designed to explore popular notions of tuberculosis etiology and trans-mission, the perceived stigma attached to the disease, awareness of services offered, and sources of information about tubercu-losis.

300 La Revue de Santé de la Méditerranée orientale, Vol. 14, No 2, 2008
املجلة الصحية لشرق املتوسط، منظمة الصحة العاملية، املجلد الرابع عشر، العدد ٢، ٢٠٠٨
The questionnaire was first field tested in the city of Rabat, then applied to the sites of this study. In both Casablanca and Fes, the team consisted of 1 supervisor and 2 researchers recruited from the health personnel of the facilities. Researchers were given a training session on quantitative and qualitative research methods. Patients entering the study facilities during the study period (summer 2000) (4 days in each city) were enrolled in the study serially until the quotas for each patient group were reached (60 subjects for patients and suspected cases, 180 for other health service users), with informed consent obtained in line with national standards. Results were aggregated and analysed by the study team in Microsoft Excel. The study was designed in conform-ity with the ethical standards of the Moroc-can NTP and Ministry of Health.
Results
Sociodemographic characteristics of the study sample are summarized in Table 1. The respondents were was mostly urban residents with little or no education. Just over half (52%) were unemployed. Fifty-six per cent (56%) of the subjects had been referred to the public tuberculosis health services by a private doctor. Of the patients under treatment for tuberculosis, 13% had undergone treatment for over 6 months, implying a continuation, relapse or chronic case.
Knowledge of tuberculosisPatients being treated for tuberculosis had a variety of different answers when asked to describe the nature of their illness (Table 2). Only 1 in 5 patients responded that he/she was suffering from tuberculosis (sall). The commonest answer was a reference to the affected body region, namely the chest
(sdar). Others cited more traditional under-standings of excess water (mayy) in the ab-domen. Still others identified their problem in terms of symptoms experienced.
Only 9% of non-patients identified an infectious cause when asked about the etiol-ogy of tuberculosis. The majority of these instead had conceptions of tuberculosis
Table 1 Population characteristics
Characteristic No. %
Reason for visit Known tuberculosisa 61 20 Suspected tuberculosis 60 20 Other 180 60
Location Casablanca 151 50 Fes 150 50
Milieu Urban 290 96 Ruralb 11 4
Age (years) 20–24 72 24 25–34 94 32 35–44 76 25 45+ 59 20
Sex Male 141 47 Female 160 53
Education None 138 46 Primary 82 27 Secondary 81 27
Employment Unemployed 158 52 Unskilled/semi-skilled 61 20 Professional/student 74 25 Other 8 3
Total 301 100aOne additional patient was recruited to ensure that the sample size of 60 would be reached if any questionnaires proved unusable.bAlthough the study was conducted in an urban setting, some patients were rural residents temporarily in town.
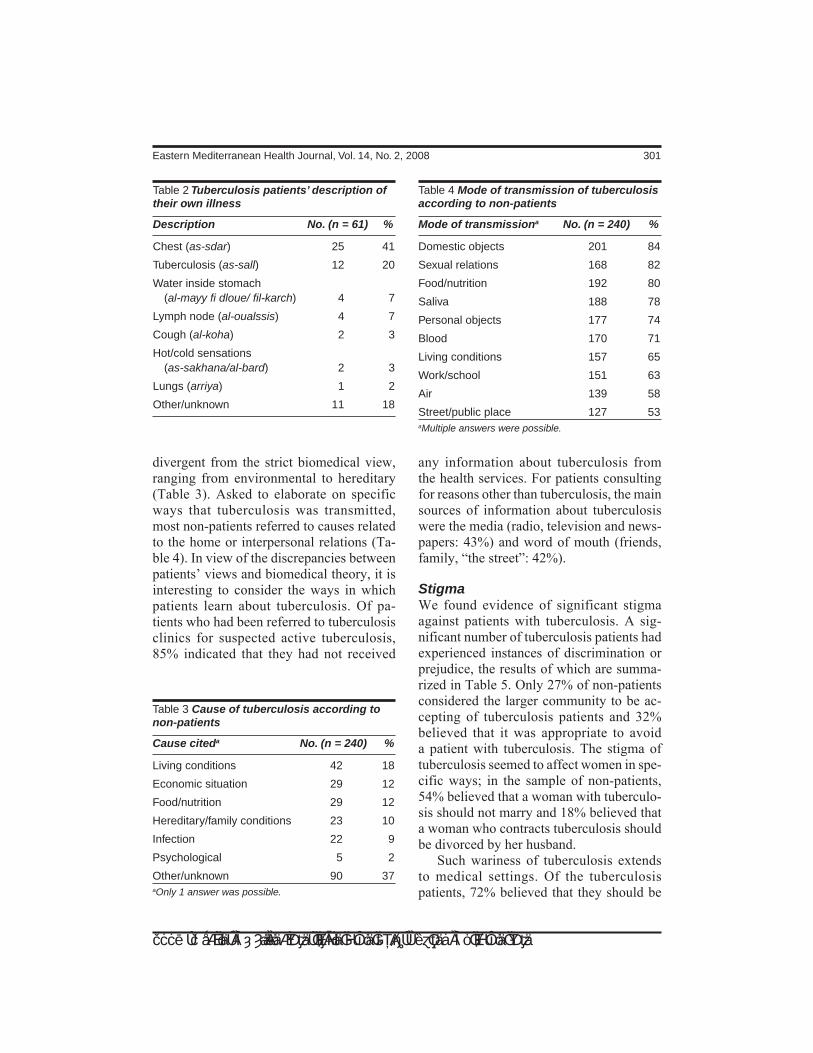
Eastern Mediterranean Health Journal, Vol. 14, No. 2, 2008 301
املجلة الصحية لشرق املتوسط، منظمة الصحة العاملية، املجلد الرابع عشر، العدد ٢، ٢٠٠٨
divergent from the strict biomedical view, ranging from environmental to hereditary (Table 3). Asked to elaborate on specific ways that tuberculosis was transmitted, most non-patients referred to causes related to the home or interpersonal relations (Ta-ble 4). In view of the discrepancies between patients’ views and biomedical theory, it is interesting to consider the ways in which patients learn about tuberculosis. Of pa-tients who had been referred to tuberculosis clinics for suspected active tuberculosis, 85% indicated that they had not received
any information about tuberculosis from the health services. For patients consulting for reasons other than tuberculosis, the main sources of information about tuberculosis were the media (radio, television and news-papers: 43%) and word of mouth (friends, family, “the street”: 42%).
StigmaWe found evidence of significant stigma against patients with tuberculosis. A sig-nificant number of tuberculosis patients had experienced instances of discrimination or prejudice, the results of which are summa-rized in Table 5. Only 27% of non-patients considered the larger community to be ac-cepting of tuberculosis patients and 32% believed that it was appropriate to avoid a patient with tuberculosis. The stigma of tuberculosis seemed to affect women in spe-cific ways; in the sample of non-patients, 54% believed that a woman with tuberculo-sis should not marry and 18% believed that a woman who contracts tuberculosis should be divorced by her husband.
Such wariness of tuberculosis extends to medical settings. Of the tuberculosis patients, 72% believed that they should be
Table 2 Tuberculosis patients’ description of their own illness
Description No. (n = 61) %
Chest (as-sdar) 25 41
Tuberculosis (as-sall) 12 20
Water inside stomach (al-mayy fi dloue/ fil-karch) 4 7
Lymph node (al-oualssis) 4 7
Cough (al-koha) 2 3
Hot/cold sensations (as-sakhana/al-bard) 2 3
Lungs (arriya) 1 2
Other/unknown 11 18
Table 3 Cause of tuberculosis according to non-patients
Cause citeda No. (n = 240) %
Living conditions 42 18
Economic situation 29 12
Food/nutrition 29 12
Hereditary/family conditions 23 10
Infection 22 9
Psychological 5 2
Other/unknown 90 37aOnly 1 answer was possible.
Table 4 Mode of transmission of tuberculosis according to non-patients
Mode of transmissiona No. (n = 240) %
Domestic objects 201 84
Sexual relations 168 82
Food/nutrition 192 80
Saliva 188 78
Personal objects 177 74
Blood 170 71
Living conditions 157 65
Work/school 151 63
Air 139 58
Street/public place 127 53aMultiple answers were possible.
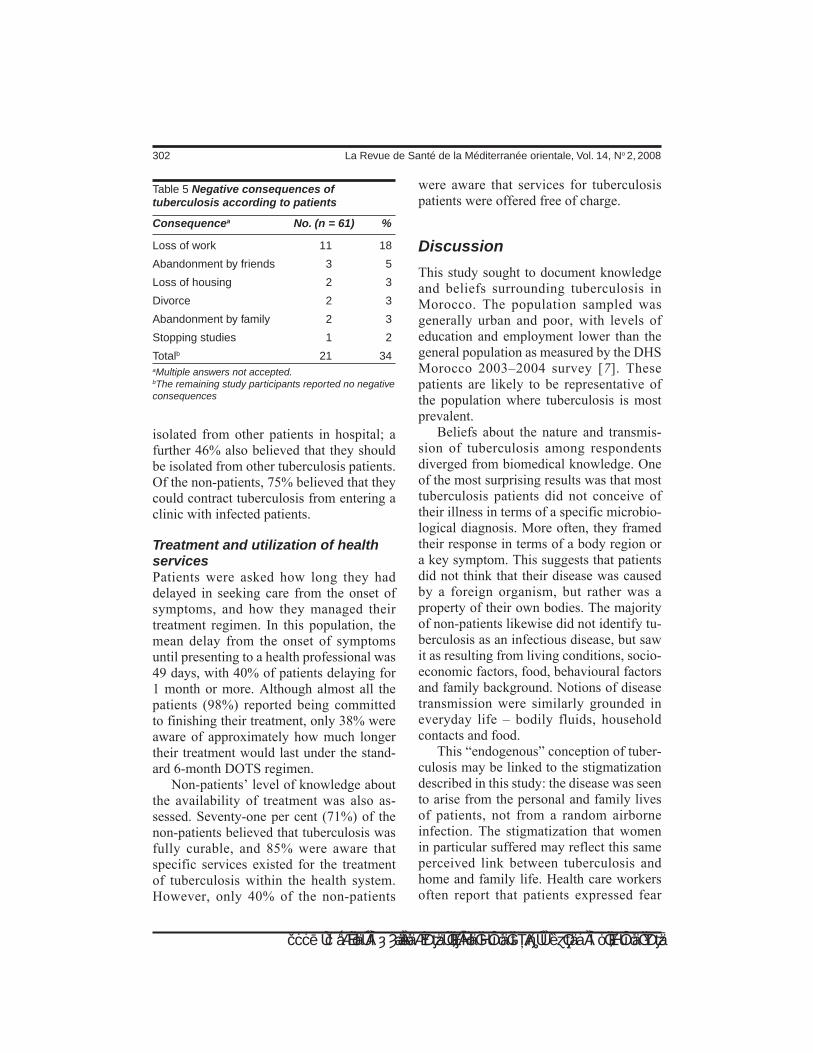
302 La Revue de Santé de la Méditerranée orientale, Vol. 14, No 2, 2008
املجلة الصحية لشرق املتوسط، منظمة الصحة العاملية، املجلد الرابع عشر، العدد ٢، ٢٠٠٨
isolated from other patients in hospital; a further 46% also believed that they should be isolated from other tuberculosis patients. Of the non-patients, 75% believed that they could contract tuberculosis from entering a clinic with infected patients.
Treatment and utilization of health servicesPatients were asked how long they had delayed in seeking care from the onset of symptoms, and how they managed their treatment regimen. In this population, the mean delay from the onset of symptoms until presenting to a health professional was 49 days, with 40% of patients delaying for 1 month or more. Although almost all the patients (98%) reported being committed to finishing their treatment, only 38% were aware of approximately how much longer their treatment would last under the stand-ard 6-month DOTS regimen.
Non-patients’ level of knowledge about the availability of treatment was also as-sessed. Seventy-one per cent (71%) of the non-patients believed that tuberculosis was fully curable, and 85% were aware that specific services existed for the treatment of tuberculosis within the health system. However, only 40% of the non-patients
were aware that services for tuberculosis patients were offered free of charge.
Discussion
This study sought to document knowledge and beliefs surrounding tuberculosis in Morocco. The population sampled was generally urban and poor, with levels of education and employment lower than the general population as measured by the DHS Morocco 2003–2004 survey [7]. These patients are likely to be representative of the population where tuberculosis is most prevalent.
Beliefs about the nature and transmis-sion of tuberculosis among respondents diverged from biomedical knowledge. One of the most surprising results was that most tuberculosis patients did not conceive of their illness in terms of a specific microbio-logical diagnosis. More often, they framed their response in terms of a body region or a key symptom. This suggests that patients did not think that their disease was caused by a foreign organism, but rather was a property of their own bodies. The majority of non-patients likewise did not identify tu-berculosis as an infectious disease, but saw it as resulting from living conditions, socio-economic factors, food, behavioural factors and family background. Notions of disease transmission were similarly grounded in everyday life – bodily fluids, household contacts and food.
This “endogenous” conception of tuber-culosis may be linked to the stigmatization described in this study: the disease was seen to arise from the personal and family lives of patients, not from a random airborne infection. The stigmatization that women in particular suffered may reflect this same perceived link between tuberculosis and home and family life. Health care workers often report that patients expressed fear
Table 5 Negative consequences of tuberculosis according to patients
Consequencea No. (n = 61) %
Loss of work 11 18
Abandonment by friends 3 5
Loss of housing 2 3
Divorce 2 3
Abandonment by family 2 3
Stopping studies 1 2
Totalb 21 34aMultiple answers not accepted.bThe remaining study participants reported no negative consequences

Eastern Mediterranean Health Journal, Vol. 14, No. 2, 2008 303
املجلة الصحية لشرق املتوسط، منظمة الصحة العاملية، املجلد الرابع عشر، العدد ٢، ٢٠٠٨
that women in particular might contaminate their family members, especially children living in their household (Chentoufi A. Personal communication, 2004).
Interestingly, despite lack of awareness of infection as the proximal cause of tuber-culosis, respondents’ views of causation corresponded in some degree with known risk factors for infection. The 4 factors most commonly cited as “causes” of tuberculosis are known risk factors for infection: living conditions, socioeconomic status, nutrition [8,9], and having a family member with tuberculosis [10,11]. Thus popular beliefs in this instance corresponded to empirical knowledge of the distal causes of tubercu-losis.
Our study suggests clues regarding the factors that contribute to diagnostic delay, the time during which patients with ac-tive pulmonary tuberculosis transmit the disease. These include lack of knowledge about the disease, stigma, not knowing that free treatment is available, and fear of expo-sure to contagion in the tuberculosis clinic. These are comparable to factors highlighted by studies in other settings [3,12–14].
This study is limited by the relatively small sample size and the different tools that were used in the different sites, which precludes formal statistical analyses. The results do, however, describe prevalent views of the disease and provide indications
regarding the connections between these beliefs and patterns of health service utiliza-tion. Building on previous studies [15,16], there is an opportunity to focus education about tuberculosis using patients’ beliefs as a starting point.
Conclusions
Most patients in this predominantly urban sample had little knowledge of tuberculosis, its causes, or its transmission. The popular conception of tuberculosis that emerged from this study was that of a disease with its roots in the social and personal lives of its victims. Such beliefs may contribute to the under-utilization of health services as well as the significant stigma of tuberculo-sis in Morocco. There is an opportunity for health services to work with patients and the general population, starting from their own beliefs, to help them gain a better un-derstanding of the disease and its treatment, which may lead to more treatment and less stigma.
Acknowledgement
The Harvard Medical School Office of En-richment Programs provided funding sup-port for the writing phase of this study.
References1. Global tuberculosis control: surveillance,
planning, financing. Geneva, World Health Organization, 2006 (WHO/HTM/TB/2006.362).
2. Asch S et al. Why do symptomatic pa-tients delay obtaining care for tuberculo-sis? American journal of respiratory and critical care medicine, 1998, 157:1244–8.
3. Auer C et al. Health seeking and per-ceived causes of tuberculosis among patients in Manila, Philippines. Tropical medicine and international health, 2000, 5:648–56.
4. Barnhoorn F, Adriaanse H. In search of factors responsible for noncompliance among tuberculosis patients in Wardha
304 La Revue de Santé de la Méditerranée orientale, Vol. 14, No 2, 2008
املجلة الصحية لشرق املتوسط، منظمة الصحة العاملية، املجلد الرابع عشر، العدد ٢، ٢٠٠٨
District, India. Social science & medicine, 1992, 34:291–306.
5. Hoa NP et al. Knowledge of tuberculosis and associated health-seeking behaviour among rural Vietnamese adults with a cough for at least three weeks. Scandina-vian journal of public health supplement, 2003, 62:59–65.
6. Wandwalo ER, Morkve O. Knowledge of disease and treatment among tuberculo-sis patients in Mwanza, Tanzania. Inter-national journal of tuberculosis and lung disease, 2000, 4:1041–6.
7. Ministry of Health [Morocco], ORC Macro, Arab League. Enquête sur la population et la santé familiale (EPSF) 2003-2004. Calverton, Maryland, ORC Macro, 2005.
8. Frieden TR et al. Tuberculosis. Lancet, 2003, 362:887–99.
9. Rieder H. Epidemiologic basis of tuber-culosis control. Paris, International Union Against Tuberculosis and Lung Disease, 1999.
10. Lienhardt C et al. Risk factors for tuber-culosis infection in sub-Saharan Africa: a contact study in The Gambia. American journal of respiratory and critical care medicine, 2003, 168:448–55.
11. Lienhardt C et al. Risk factors for tuber-culosis infection in children in contact
with infectious tuberculosis cases in the Gambia, West Africa. Pediatrics, 2003, 111:e608–14 (http://pediatrics.aappub-lications.org/cgi/content/full/111/5/e608, accessed 31 October 2007).
12. Needham DM, Godfrey-Faussett P, Fos-ter SD. Barriers to tuberculosis control in urban Zambia: the economic impact and burden on patients prior to diagnosis. International journal of tuberculosis and lung disease, 1998, 2:811–17.
13. Steen TW, Mazonde GN. Pulmonary tu-berculosis in Kweneng District, Botswana: delays in diagnosis in 212 smear-positive patients. International journal of tubercu-losis and lung disease, 1998, 2:627–34.
14. Wandwalo ER, Morkve O. Delay in tu-berculosis case-finding and treatment in Mwanza, Tanzania. International journal of tuberculosis and lung disease, 2000, 4:133–8.
15. Migliori GB et al. AIDS and tuberculo-sis control programmes: an integrated approach at educational level. Monaldi archives of chest diseases, 1996, 52:102–7.
16. Jaramillo E. The impact of media-based health education on tuberculosis diagno-sis in Cali, Colombia. Health policy and planning, 2001, 16:68–73.

Eastern Mediterranean Health Journal, Vol. 14, No. 2, 2008 305
املجلة الصحية لشرق املتوسط، منظمة الصحة العاملية، املجلد الرابع عشر، العدد ٢، ٢٠٠٨
Effects of omega-3 fatty acid supplements on serum lipids, apolipoproteins and malondialdehyde in type 2 diabetes patients F. Shidfar,1 A. Keshavarz,2 S. Hosseyni,3 A. Ameri4 and S. Yarahmadi5
1Department of Nutrition; 4Department of Health, School of Health, Iran University of Medical Sciences, Tehran, Islamic Republic of Iran (Correspondence to F. Shidfar: [email protected]).2Department of Nutrition, School of Health; 5Department of Endocrinology, School of Medicine, Tehran University of Medical Sciences, Tehran, Islamic Republic of Iran.3Department of Chemistry, Azad Islamic University, Sari, Islamic Republic of Iran.Received: 15/06/05; accepted: 30/01/06
ABSTRACT In order to test whether hyperlipidaemia and glycaemic control can be improved among diabetes patients by dietary supplementation with purified omega-3 fatty acids, we carried out a double-blind, placebo-controlled trial on 50 type 2 diabetes patients randomized to 2 g/day purified omega-3 fatty acids or placebo for 10 weeks. Fasting triglycerides decreased significantly with supplementation relative to placebo (P = 0.01). There was a significant decrease in ApoB-100 and malondialdehyde compared to baseline values and compared to the control group. Omega-3 fatty acids had no significant effect on serum lipid levels, ApoA-I, glucose, insulin and HbA1c.
Effets de l’apport en acides gras oméga 3 sur les lipides sériques, les apolipoprotéines et le malondialdéhyde chez les diabétiques de type 2 RÉSUMÉ Dans cette étude, nous avions pour objectif de vérifier si l’hyperlipidémie et le contrôle de la glycémie pouvaient être améliorés chez les diabétiques par une supplémentation alimentaire à base d’acides gras oméga 3 purifiés. Nous avons réalisé un essai en double aveugle contre placebo sur 50 patients atteints de diabète de type 2 randomisés pour recevoir 2 g/jour d’acides gras oméga 3 purifiés ou un placebo pendant 10 semaines. Les triglycérides à jeun ont diminué de manière significative avec la supplémentation, par rapport au placebo (p = 0,01). On a observé une réduction importante de l’apoB-100 et du malondialdéhyde par rapport à la valeur de référence et au groupe témoin. Les acides gras oméga 3 n’avaient pas d’effet significatif sur les niveaux de lipides sériques, d’apoA-I, de glucose, d’insuline et de HbA1c.
3
3
50
23
30.01=P
ApoB-100
31-A
HbA1c
306 La Revue de Santé de la Méditerranée orientale, Vol. 14, No 2, 2008
املجلة الصحية لشرق املتوسط، منظمة الصحة العاملية، املجلد الرابع عشر، العدد ٢، ٢٠٠٨
Introduction
The prevalence of type 2 diabetes has in-creased greatly in the past few years, and an even greater increase is foreseen in the next few years [1]. For this reason, the disease is considered to be one of the epidemics of the new century.
Cardiovascular disease (CVD) accounts for up to 80% of mortality in persons with type 2 diabetes, with the age-adjusted rela-tive risk of death due to CVD being 2–4-fold higher than in the general population [2,3]. Patients with type 2 diabetes are predisposed to increased platelet aggre-gation [4,5], impaired fibrinolysis [6,7], endothelial dysfunction [8,9], increased platelet activation [10,11], hyperlipidaemia and insulin resistance [1–3]. This increases their risk of atherothrombosis, an important process in the determination of morbidity and mortality from coronary heart disease (CHD).
There is considerable evidence for a pro-tective effect of dietary omega-3 fatty acids in the prevention of heart disease [12–15], especially in a high-risk population [16,17]. Omega-3 fatty acids improve dyslipidaemia [2,18–20], vascular [2,8,11] and platelet function [2,11,20], and heart rate [19,21]. They lower blood pressure in hypertensive patients [18,20] and can reduce the risk of sudden cardiac death [20,22]. In addition, insulin sensitivity has been positively cor-related with concentration of omega-3 fatty acids in skeletal muscle [23]. Therefore, an increased intake may be of particular benefit to type 2 diabetes patients [2,11,13].
Some reports have raised the possibility of an adverse effect of high doses of omega-3 fatty acids on glycaemic control in type 2 diabetes patients [20,24–26]. The results of other studies indicated that omega-3 fatty acids do not seem to have any effect on gly-caemic control [22,23], at least in humans
[19,27,28], or even mentioned favourable effects on glycaemic control [13,22,29].
The importance of this relates to evi-dence that the level of glycaemia in type 2 diabetes patients predicts all-cause and CVD mortality [30], and that intensive blood glucose control decreases the risk of microvascular complication [31]. Conse-quently, some experts urge caution in the use of omega-3 fatty acids in type 2 diabetes patients [20,24–26] whereas others encour-age such use, albeit at doses < 3 g/day [13,32,33].
On the other hand, a concern remains with respect to the potential for increased lipid peroxidation following omega-3 fatty acid intake [2,21,34]. To date, the in vivo data are inconclusive, owing primarily to limitations in the methodologies employed. Some previous data do not support the liter-ature suggesting adverse effects of omega-3 fatty acids on lipid peroxidation [2,21,35].
In view of the increasing use of omega-3 fatty acids in the diet as food additives or as therapeutic substances, it is important to determine the extent of any effects, and possible benefits have to be weighed against the potential for impairment of glycaemic control and lipid peroxidation in type 2 diabetes patients.
The aim of this study was to determine the effects of purified omega-3 fatty acids on serum lipoproteins, apolipoprotein B-100 (Apo B-100), apolipoprotein A-I (Apo A-I), malondialdehyde (MDA) (as index for lipid peroxidation), and glycaemic control in patients with type 2 diabetes.
Methods
ParticipantsWe recruited non-smoking, treated hyper-tensive, type 2 diabetes patients (28 men and 28 women) aged 33–75 years from the endocrine clinic of Shariati Hospital,

Eastern Mediterranean Health Journal, Vol. 14, No. 2, 2008 307
املجلة الصحية لشرق املتوسط، منظمة الصحة العاملية، املجلد الرابع عشر، العدد ٢، ٢٠٠٨
Tehran, Islamic Republic of Iran. The study was carried out over the period October 2004–February 2005; during this time there were a total of 56 patients who met the se-lection criteria.
Patients had been diagnosed with diabe-tes within the previous 6 years. All had been on antihypertensive therapy for a minimum of 3 months and showed evidence of diabe-tes (fasting glucose ≥ 126 mg/dL or 2-hour postprandial glucose ≥ 200 mg/dL before diagnosis and treatment) [9]. Patients were included if they were taking oral hypogly-caemic agents but not insulin. All patients had HbA1c < 9%, body mass index < 30 kg/m2, clinic systolic blood pressure > 115 mmHg and < 180 mmHg, and diastolic blood pressure < 110 mmHg, serum total cholesterol and triacylglycerol ≥ 200 mg/dL. None ate > 2 fish meals per week nor were they regular consumers of fish oil sup-plements [11,18]. Patients were excluded if they had a recent (within previous 3 months) or past history of symptomatic heart dis-ease; myocardial infarction; angina pectoris or stroke; surgery; liver, renal (plasma cre-atinine > 1.62 mg/dL) or thyroid disease; or used nonsteroidal anti-inflammatory drugs, estrogen, progesterone or antioxidant vita-mins. Patients on lipid-lowering drugs and aspirin were included, but were asked not to change the dose [9,11,18].
The ethics committee of Tehran Univer-sity of Medical Sciences approved the study and all participants gave written informed consent.
Study designThis study was done as a double-blind, placebo-controlled trial of parallel design. During a 3-week baseline period, partici-pants continued their usual diet. They were stratified by sex, serum total cholesterol (TC) and triacylglycerol (TG), and ran-domly assigned to 2 g/day purified omega-3 fatty acids or placebo (control) capsules
(supplied as 1-g capsules) (Super EPA 2000, Advanced Nutritional Technologies, United States of America) for 10 weeks. The puri-fied omega-3 fatty acids capsules contained only 520 mg eicosapentaenoic acid and 480 mg docosahexaenoic acid. The placebo capsules contained 300 mg saturated fatty acids, 100 mg monounsaturated fatty acids, and 600 mg linoleic acid [21,36].
All patients were asked to maintain their usual diet and physical activity level and not to alter their lifestyle during the inter-vention. Dietary intake was monitored by the same dietitian throughout the study and participants were asked to complete a 24-hour diet recall questionnaire at the beginning and after 3, 6 and 10 weeks and a lifestyle questionnaire (e.g. physical activity, income) at baseline and at the end of the 10 weeks intervention. The patients were followed up by telephone each week; patients who had no phone were instructed to return to the clinic every other week. Par-ticipants were required to provide venous blood samples after fasting overnight for 12–14 hours on day 0 and at the end of the intervention (10th week).
Laboratory analysesFasting serum lipoproteins, Apo B-100, Apo A-I, MDA, glucose and insulin were meas-ured twice at baseline and twice at the end of intervention. All samples were collected while the patient rested in a supine position for 10 minutes and all analyses were carried out within 12 hours of collection. Samples were stored at –3 °C in the interim. There was no preservative in the glucose samples. Serum glucose was measured with a Cobas MIRA analyser (Roche Diagnostic, Basel, Switzerland) by enzymatic method (MAN Co., Tehran). Serum insulin was measured by radioimmunoassay with an automated immunoassay analyser (Tosoh Corporation, Tokyo). HbA1c was measured by colori-metric method (MAN Co.).

308 La Revue de Santé de la Méditerranée orientale, Vol. 14, No 2, 2008
املجلة الصحية لشرق املتوسط، منظمة الصحة العاملية، املجلد الرابع عشر، العدد ٢، ٢٠٠٨
Serum lipoproteins, Apo B-100 and Apo A-I were assayed with a Cobras MIRA analyser (Roche Diagnostics). TC and TG levels were measured enzymatically with the triacylglycerol GPO-PAP-cholesterol CHOD-PP kit (MAN Co.). Serum high-density lipoprotein cholesterol (HDL-C) was determined enzymatically using the CHOD-PAP kit after precipitation of the chylomicrons, very low density lipoprotein cholesterol and low density lipoprotein cho-lesterol (LDL-C) with phosphotungstic acid and Mg+2. Serum LDL-C was determined enzymatically using the CHOD-PAP kit after precipitation of LDL with heparin and sodium citrates, from the following formula: LDL-C = TC – cholesterol in supernatant.
Serum Apo A-I and Apo B-100 were measured immunoturbidometrically (Pars Azmun Co., Tehran,). Serum MDA was measured colorimetrically using thiobar-biruric acid (TBA) reagent (Daiichi Pure Chemical Co. Ltd, Tokyo) dissolved in 2M sodium sulfate by heating with 1,1,3,3-tetraethoxy-propane (Tokyo Kasei Co. Ltd, Tokyo) as a standard solution [37].
The intra-assay coefficients of variation for these assays (n = 10) were 1.4%, 1.4%, 1.3%, 1.4%, 2.18%, 3.6%, 1.9%, 1.9% and 2.3% for TC, HDL-C , LDL-C, TG, ApoB-100, ApoA-I, MDA, glucose and insulin respectively and the inter-assay coefficients of variation (n = 10) were 0.9%. 1.1%, 0.95%, 1.84%, 2.35%, 2.1%, 2.1%, 2.2% and 2.2% respectively. Accuracy (sensitiv-ity and specificity) was assessed for the analytes (e.g. sensitivity for Apo A-I and Apo B-100 were 0.2 and 0.3 mg/dL respec-tively). We used a Randox serum control as a quality control material [18].
Statistical analysesAll data are expressed as mean (standard deviation). The level of significance chosen was P < 0.05. The normal distribution of the variable was checked by Kolmogorov–
Smirnov test. In order to test whether the differences between the mean values of the items studied in both groups were signifi-cant, the Student t-test was used. Differences in the same hyperlipidaemic patient before and after 10 weeks of intervention were evaluated by paired t-tests; diet records were analysed using Food processor II software [38]. For comparison of means in different intervals of 24-hour recall questionnaires, analysis of variance was used. For qualita-tive variables (e.g. education, occupation, income), chi-squared test was used. Data were analysed using SPSS, version 10.
Results
Only 50 of the 56 randomly assigned pa-tients completed the study. Baseline char-acteristics of the patients confirmed that they were well matched for the inclusion criteria (Table 1). There were no significant differences between the groups in type and number of antihypertensive or oral hypoglycaemic medications. Evidence of adherence to the diets came from analysis of diet records and capsule count.
There were no significant differences between the groups in total energy intake, nutrient intake or body weight at baseline, and no significant changes took place dur-ing the intervention.
Relative to placebo, omega-3 fatty acids had no significant effects on fasting glucose, insulin or HbA1c levels (Table 2).
There were no significant differences in fasting serum lipoproteins, glucose, insulin, HbA1c, apoproteins and MDA at baseline between groups (Table 2). There were no significant changes in lipoproteins with pla-cebo supplementation. In the omega-3 fatty acid group, fasting TG decreased signifi-cantly by 31.2 % (P = 0.01) relative to the placebo group; there was also a significant decrease at the end of the study compared

Eastern Mediterranean Health Journal, Vol. 14, No. 2, 2008 309
املجلة الصحية لشرق املتوسط، منظمة الصحة العاملية، املجلد الرابع عشر، العدد ٢، ٢٠٠٨
to in the test group (P = 0.002) (Table 2). There was a significant decrease in Apo B-100 and MDA after intervention com-pared to baseline value (P = 0.02 for both) and also compared to the control group (P = 0.03 for both) (Table 2). At the end of the study, TG/HDL-C had significantly decreased compared to baseline levels (P = 0.04 for both) and also compared to the control group (P = 0.04) (Table 2).
Discussion
Our finding of no adverse effect of omega-3 fatty acids on glycaemic control is support-ed by reports of a non-significant change in fasting glucose after consumption of omega-3 fatty acids or fish oils [1,6,19,27]. The other reports found a significant increase in HbA1c and fasting glucose in type 2 diabe-tes patients after a fish diet [38] or omega-3 fatty acids [6,18,20,24–26,33]. Fish oil may worsen glycaemic control by diverting sub-strates from lipogenesis to gluconeogenesis in the process of inhibiting hepatic synthesis [6,38].
The disparate findings concerning ef-fects on glycaemic control in type 2 dia-betes patients may be related to the dose
of omega-3 fatty acids (it appears > 3 g omega-3 fatty acids/day has an adverse effect) [7,18]; differences in oral diabetic medication; degrees of obesity and insulin resistance; the presence of other conditions such as hypertension that may also affect insulin sensitivity; and lack of diet control during intervention [1,6,19,28]. There was no difference in fasting insulin between groups after the intervention. This concurs with other controlled studies in type 2 dia-betes patients [1,6,7,19], however, in hyper-lipidaemic patients with hyperinsulinaemia, 3.4 g fish oil/day for 6 months caused a sig-nificant decrease in fasting insulin [20]. The increase in fasting glucose in other studies may be due to hepatic glucose output, which is highly correlated with the degree of fast-ing hyperglycaemia [11].
The TG-lowering effect of omega-3 fatty acids is well established [2,18–20] and may be related to an increase in hepatic glucose output [18]. An increase in peroxi-some proliferator-activated receptor α with supplementation leads to increased hepatic uptake and oxidation of free fatty acids as well as increased fatty acid oxidation in skeletal muscle. The consequent decrease in free fatty acid availability would lead to de-creased TG synthesis. It is conceivable that TG might influence the binding of insulin to its receptor or interfere with early post-binding steps [18,33]. Moreover, higher se-rum TG leads to a resistance to the antilipo-lytic effect of insulin. Therefore, a reduction in serum TG levels might improve insulin sensitivity [1,19,28]. We did not, however, measure insulin sensitivity, and this is one of the limiting factors of this study.
The effects of omega-3 fatty acids on lipo-proteins are contradictory, these findings may be explained in part by variations in the amount of omega-3 fatty acids consumed, the manner in which they are presented (fish, fish oils or purified oils), and the lipoprotein phenotype of the patients [21,33]. Previous
Table 1 Baseline characteristics of patients in test and control groups
Characteristic Control group Omega-3 fatty (n = 25) acid group (n = 5) Mean SD Mean SD
Age (years) 54.1 11.1 53.4 11.7
Weight (kg) 89.1 2.3 88.7 2.0
BMI (kg/m2) 29.0 0.7 28.4 0.5
Waist-to-hip ratio 0.93 0.01 0.94 0.01
Male/female ratio 12/13 12/13SD = standard deviation.BMI = body mass index.

310 La Revue de Santé de la Méditerranée orientale, Vol. 14, No 2, 2008
املجلة الصحية لشرق املتوسط، منظمة الصحة العاملية، املجلد الرابع عشر، العدد ٢، ٢٠٠٨
Table 2 Blood analysis for fasting patients in test and control groups at baseline and post-intervention
Serum component Control group Omega-3 fatty (n = 25) acid group (n = 5) Mean SD Mean SD
Glucose (mg/dL) Baseline 146.1 27.7 148.2 30.2 Post-intervention 142.3 30.1 151.8 30.9
Insulin (pmol/L) Baseline 111.6 57.2 115.9 64.0 Post-intervention 119.7 84.5 119.7 84.5
HbA1c (%) Baseline 7.1 0.1 7.4 0.2 Post-intervention 7.0 0.1 7.3 0.3
ApoB-100 (mg/dL) Baseline 157.8 21.1 151.3 19.5 Post-intervention 152.1 13.2 134.7a,b 23.2
ApoA-I (mg/dL) Baseline 174.0 23.7 175.5 49.1 Post-intervention 167.0 21.4 176.1 40.2
MDA (nmol/mL) Baseline 3.3 1.1 3.1 1.4 Post-intervention 3.5 0.9 1.9c,d 0.7
Total cholesterol (mg/dL) Baseline 249.6 45.3 244.3 30.9 Post-intervention 237.7 34.6 234.2 38.1
HDL-C (mg/dL) Baseline 38.1 8.3 38.9 8.7 Post-intervention 37.8 9.1 37.1 10.1
LDL-C (mg/dL) Baseline 168.3 37.2 160.6 41.2 Post-intervention 170.1 41.2 158.1 44.0
LDL-C/HDL-C Baseline 4.4 1.1 4.1 2.3 Post-intervention 4.5 2.1 4.2 1.9
TG/HDL-C Baseline 8.0 2.1 7.6 2.9 Post-intervention 8.5 2.9 5.5ee,f 1.8
TG (mg/dL) Baseline 306.4 39.1 299.2 28.1 Post-intervention 322.0 36.5 205.1b,g 23.5SD = standard deviation.aSignificantly different from control group at end of study (t-test of difference scores): P = 0.03.bSignificantly different from baseline of supplemented group (paired t-test): P = 0.02.cSignificantly different from control group at end of study (t-test of difference scores): P = 0.03.dSignificantly different from baseline of supplemented group (paired t-test): P = 0.02.eSignificantly different from control group at end of study (t-test of difference scores): P = 0.04.fSignificantly different from baseline of supplemented group (paired t-test): P = 0.04.gSignificantly different from control group at end of study (t-test of difference scores): P = 0.01.

Eastern Mediterranean Health Journal, Vol. 14, No. 2, 2008 311
املجلة الصحية لشرق املتوسط، منظمة الصحة العاملية، املجلد الرابع عشر، العدد ٢، ٢٠٠٨
studies showed that the TG-lowering effect of omega-3 fatty acids is greater in those with higher initial TG concentration and higher consumption of omega-3 fatty acids [38]. In a placebo-controlled study, 4 g omega-3 fatty acids reduced TG by 42% in comparison with 31.2% in our study [33]. We observed no significant effect of omega-3 fatty acids on TC. In contrast, Grimsgaard et al. [39] reported an increase in TC with omega-3 fatty acids. The differ-ence may have been related to differences in the baseline serum lipoprotein concentra-tion of the type 2 diabetes patients.
The significant decrease of Apo B-100 at the end of study indicates a decrease in the number of LDL and VLDL particles. This might be expected to contribute to a reduction in atherogenic risk in people with type 2 diabetes [15,32,38]. Both TG and HDL-C are major determinants of LDL particle size [20,29,38] and the TG/HDL-C ratio is a stronger predictor of myocardial infarction than LDL-C/HDL-C in type 2 diabetes patients [6,19,20,25]. TG/HDL-C was significantly lower at the end of study compared to placebo (P < 0.05). This is associated with decreased risk of coronary heart disease and preventing the transition from atherosclerosis to atherothrombosis [19,20,24].
Omega-3 fatty acid supplementation leads to a significantly lower level of MDA compared to the placebo group, which had good clinically relevant aspects. Potential
mechanisms for the decrease in MDA may relate to the assembly of omega-3 fatty acids in membrane lipids and lipoproteins making the double bonds less available for free radical attack, inhibition of the pro-oxidant enzyme phospholipase A2 and stimulation of anti-oxidant enzymes [2,21,37]. In this regard, omega-3 fatty acids upregulate gene expression of antioxidant enzymes and down regulate genes associated with pro-duction of reactive oxygen species [35,37]. Consequently, the data relating to the effects of omega-3 fatty acids on MDA in vivo are contradictory [34]. These inconsistencies could be related to differences in the popu-lation studied, the duration of the study, the antioxidant content of the supplement or background diet. The most plausible explanation, however, is differences in the methodologies employed to assess lipid peroxidation [2,21]. Sample size in these studies was rather small, so extrapolating the conclusions to the general population may not be valid in all cases.
Our findings suggest that 2 g/day puri-fied omega-3 fatty acids offer substantial advantages on prevention of CVD in type 2 diabetes patients. In view of their overall favourable effects on CVD reduction, there appears to be no reason why omega-3 fatty acids should not be given to type 2 diabetes patients and these finding suggest that regu-lar fish consumption should be considered as part of a healthy diet for diabetes man-agement.
References1. Rivellese AA, Lilli S. Quality of dietary
fatty acids, insulin sensitivity and type 2 diabetes. Biomedicine & pharmacothera-py, 2003, 57:84–7.
2. Mori TA et al. Effects of eicosapentaenoic and docosahexaenoic acid on oxidative stress and inflammatory markers in treat-ed-hypertensive type 2 diabetic subjects.
Free radical biology & medicine, 2003, 35(7):772–81.
3. Haffner SM et al. Mortality from coronary heart disease in subjects with type 2 diabetes and in nondiabetic subjects with and without prior myocardial infarction. New England journal of medicine, 1998, 339:229–34.

312 La Revue de Santé de la Méditerranée orientale, Vol. 14, No 2, 2008
املجلة الصحية لشرق املتوسط، منظمة الصحة العاملية، املجلد الرابع عشر، العدد ٢، ٢٠٠٨
14. Ovide-Bordeaux S, Grynberg A. Docosa-hexaenoic acid affects insulin deficiency-and insulin resistance-induced alterations in cardiac mitochondria. American journal of physiology. Regulatory, integrative and comparative physiology, 2004, 286(3):R519–27.
15. Von Schacky C. [Secondary prevention of coronary heart disease]. MMW Fort-schritte der Medizin, 2003, 145(13):28–30 [in German].
16. Steinmetz A. Treatment of diabetic dys-lipoproteinemia. Experimental & clini-cal endocrinology & diabetes, 2003, 111(5):239–45.
17. Nomura S, Kanazawa S, Fukuhara S. Ef-fects of eicosapentaenoic acid on platelet activation markers and cell adhesion mol-ecules in hyperlipidemic patients with type 2 diabetes mellitus. Journal of diabetes complications, 2003, 17(3):153–9.
18. Woodman RJ et al. Effects of purified eicosapentaenoic and docosahexaenoic acids on glycemic control, blood pres-sure and serum lipids in type 2 diabetic patients with treated hypertension. Amer-ican journal of clinical nutrition, 2002, 7(5):1007–15.
19. Sirtori CR, Galli C. N-3 fatty acids and dia-betes. Biomedicine & pharmacotherapy, 2002, 56:367–406.
20. Erkkilä AT et al. Fish intake is associated with a reduced progression of coronary artery atherosclerosis in postmenopau-sal women with coronary artery disease. American journal of clinical nutrition, 2004, 80(3):626–32.
21. Shidfar F et al. Comparison of the effect of simultaneous administration of vitamin C and omega-3 fatty acids on lipopro-teins, Apo A-I, Apo B and MDA in hyper-lipidemic patients. International journal of vitamin and nutrition research, 2003, 73 (3):163–70.
4. Carr ME. Diabetes mellitus: a hyperco-agulable state. Journal of diabetes com-plications, 2001, 15:44–54.
5. Isaev VA, Panchenko VM, Liutova LV. [Use of biologically active supplement containing omega-3 polyunsaturated fatty acids in patients with type 2 diabetes mel-litus]. Voprosy pitania, 2004, 73(1):16–9 [in Russian].
6. Hu FB et al. Fish and long-chain omega-3 fatty acid intake and risk of coronary heart disease and total mortality in diabetic wom-en. Circulation, 2003, 107(14):1852–7.
7. Nettleton JA, Katz R. N-3 long-chain poly-unsaturated fatty acids in type 2 diabetes: a review. Journal of the American Dietetic Association, 2005, 105(3):428–40.
8. Goirand F et al. Effect of dietary docosa-hexaenoic acid on the endothelium-de-pendent vasorelaxation in diabetic rats. Clinical and experimental pharmacology & physiology, 2005, 32(3):84–90.
9. West SG et al. Acute effects of monoun-saturated fatty acids with and without omega-3 fatty acid on vascular reactivity in individuals with type 2 diabetes. Diabe-tologia, 2005, 48(1):13–22.
10. Zamaria N. Alteration of polyunsaturated fatty acid status and metabolism in health and disease. Reproduction, nutrition, de-velopment, 2004, 44(3):273–82.
11. Woodman RJ et al. Effect of purified eicosapentaenoic acid and docosahexae-noic acid on platelet, fibrinolytic and vas-cular function in hypertensive type 2 di-abetic patients. Atherosclerosis, 2003, 166:85–93.
12. Steyn NP et al. Diet, nutrition and the pre-vention of type 2 diabetes. Public health nutrition, 2004, 7(1A):147–65.
13. Neff LM. Evidence-based dietary rec-ommendations for patients with type 2 diabetes mellitus. Nutrition in clinical care, 2003, 6(2):51–61.

Eastern Mediterranean Health Journal, Vol. 14, No. 2, 2008 313
املجلة الصحية لشرق املتوسط، منظمة الصحة العاملية، املجلد الرابع عشر، العدد ٢، ٢٠٠٨
22. Li D. Omega-3 fatty acids and non com-municable disease. Chinese medical jour-nal, 2003, 116(3):453–8.
23. Kusunoki M et al. Ethyl icosapentate (omega-3 fatty acid) causes accumulation of lipids in skeletal muscle but suppresses insulin resistance in OLETF rats. Metabo-lism, 2003, 52(1):30–4.
24. Glauber H, Wallace P, Griver K. Adverse metabolic effect of omega 3 fatty acids in non-insulin-dependent diabetes mel-litus. Annals of internal medicine, 1988, 108:663–8.
25. Meyer KA et al. Dietary fat and incidence of type 2 diabetes in older Iowa women. Diabetes care, 2000, 24(9):1528–35.
26. Steerenberg PA et al. Long term effect of fish oil diet on basal and stimulated plasma glucose and insulin levels in ob/ob mice. Diabetes, nutrition & metabolism, 2002, 15(4):205–14.
27. Harding AH et al. Habitual fish consump-tion and glycated haemoglobin: the EPIC-Norfolk study. European journal of clinical nutrition, 2004, 58(2):277–84.
28. Lovejoy JC. The influence of dietary fat on insulin resistance. Current diabetes reports, 2002, 2(5):435–40.
29. Thorsdottir I, Hill J, Ramel A. Omega-3 fatty acid supply from milk associates with lower type 2 diabetes in men and coro-nary heart disease in women. Preventive medicine, 2004, 39(3):630–4.
30. Wei M, Gaskill SP, Haffner SM. Effects of diabetes and level of glycemia on all-cause and cardiovascular mortality. The San Antonio Heart Study. Diabetes care, 1998, 21:1167–72.
31. UK Prospective Diabetes Study Group. Intensive blood glucose control with sulphonylurea or insulin compared with conventional treatment and risk of com-plications in patients with type 2 diabetes (UKPDS 33). Lancet, 1998, 352:837–53.
32. Cernea S, Hâncu N, Raz I. Diet and coronary heart disease in diabetes. Acta diabetologica, 2003, 40(Suppl. 2):S389–400.
33. Mori TA et al. Purified eicosapentae-noic and docosahexaenoic acids have differential effects on serum lipids and lipoproteins, LDL particle size, glucose and insulin in mildly hyperlipidemic men. American journal of clinical nutrition, 2000, 71(5):1085–94.
34. Nenseter MS, Drevon CA. Dietary polyun-saturates and peroxidation of low density lipoproteins. Current opinion in lipidology, 1996, 7(1):8–13
35. Takahashi M et al. Fish oil feeding alters liver gene expressions to defend against PRAP activation and ROS production. American journal of physiology. Gastroin-testinal & liver physiology, 2002, 282(2):G338–48.
36. Satoh K. Serum peroxide in cerebrov-ascular disorders determined by a new colorimetric method. Clinica chimica acta, 1978, 90(1):37–43.
37. Kesavulu MM et al. Effect of omega-3 fatty acids on lipid peroxidation and anti-oxidant enzyme status in type 2 diabetic patients. Diabetes & metabolism, 2002, 28(1):20–6.
38. Stark KD et al. Effect of a fish oil concen-trate on serum lipids in postmenopau-sal women receiving and non receiving hormone replacement therapy in a pla-cebo-controlled double-blind trial. Ameri-can journal of clinical nutrition, 2000, 72:389–94.
39. Grimmsgaard S et al. Highly purified eicosapentaenoic acid and docosa-hexaenoic acid in humans have similar triacylglycerol-lowering effects but diver-gent effects on serum fatty acids. Amer-ican journal of clinical nutrition, 1997, 66(3):649–59.

314 La Revue de Santé de la Méditerranée orientale, Vol. 14, No 2, 2008
املجلة الصحية لشرق املتوسط، منظمة الصحة العاملية، املجلد الرابع عشر، العدد ٢، ٢٠٠٨
Patterns of lipid changes among type 2 diabetes patients in SudanH.A. Elnasri1 and A.M. Ahmed1
1Department of Medicine, University of Bahr Elghazal, Sudan (Correspondence to A.M. Ahmed: [email protected]). Received: 23/11/05; accepted: 13/02/06
ABSTRACT This study investigated the patterns and determinants of lipid disorders among a group of 250 type 2 adult diabetic patients and 60 age- and sex-matched healthy controls in Sudan. Demo-graphic and clinical data, body mass index and waist circumference, and fasting blood samples were taken to estimate the glucose and lipid profile. The mean duration of diabetes was 9.4 years and 46.0% of patients had poor glycaemic control. Compared to controls we detected a statistically significant in-crease in triglycerides level and a decrease in HDL-C levels. Other lipid values showed a slight increase compared to controls. There was a statistically significant association of triglycerides and HDL-C with increasing age, female sex, obesity, physical inactivity and poor glycaemic control of diabetes.
Caractéristiques des anomalies lipidiques chez des patients diabétiques de type 2 au SoudanRÉSUMÉ Cette étude a porté sur les caractéristiques et les déterminants des troubles lipidiques dans un groupe de 250 adultes atteints de diabète de type 2 et dans un groupe témoin de 60 sujets sains du même âge et du même sexe au Soudan. Les données démographiques et cliniques, l’indice de masse corporelle et le tour de taille des patients ont été établis, et des prélèvements de sang à jeun ont été réalisés afin d’évaluer leur profil glycémique et lipidique. L’ancienneté moyenne du diabète était de 9,4 ans et chez 46,0 % des patients, la glycémie n’était pas bien contrôlée. La comparaison avec les témoins nous a permis de détecter une augmentation statistiquement significative du taux de triglycérides et une diminution des taux de cholestérol HDL (C-HDL). Les autres valeurs lipidiques étaient légèrement augmentées par rapport aux témoins. On observait une association statistiquement significative entre les triglycérides et le C-HDL d’une part, et l’augmentation de l’âge, le sexe féminin, l’obésité, la sédentarité et le mauvais contrôle de la glycémie d’autre part.
25060
9.446.0

Eastern Mediterranean Health Journal, Vol. 14, No. 2, 2008 315
املجلة الصحية لشرق املتوسط، منظمة الصحة العاملية، املجلد الرابع عشر، العدد ٢، ٢٠٠٨
Introduction
There are 2 major types of lipids in the blood: cholesterol and triglycerides. They are carried on 4 types of lipoproteins: chy-lomicrons, low-density lipoproteins (LDL), very-low-density lipoproteins (VLDL) and high-density lipoproteins (HDL). The chy-lomicrons are raised only after eating a fat-containing meal. The primary function of lipid particles is that of fat transport: after feeding, to the liver and adipose stor-age areas, or during fasting, when lipids are recalled from depots to peripheral tissues for energy requirements. Cholesterol is an essential component in cell membranes and steroid hormones.
Nowadays, the term “dyslipidaemia” is increasingly being used to describe abnor-mal changes in lipid profile, replacing the old term “hyperlipidaemia”. Dyslipidaemia encompasses changes in HDL-cholesterol (HDL-C), the size and density of LDL-cholesterol (LDL-C) and the total choles-terol/HDL-C ratio (TC/HDL-C) [1]. The term diabetic dyslipidaemia comprises a triad of raised triglycerides, reduced HDL-C and excess of small, dense LDL particles [2,3]. The lipid abnormalities are prevalent in diabetes mellitus because insulin resist-ance or deficiency affects key enzymes and pathways in lipid metabolism [1]. In particular, the following processes are af-fected: apoprotein production, regulation of lipoprotein lipase, action of cholesteryl ester, transfer proteins and hepatic and peripheral actions of insulin [1]. Even more, it has been proposed that the composition of lipid particles in diabetic dyslipidaemia is more atherogenic than other types of dyslipidaemia. This means that even nor-mal lipid concentrations might be more atherogenic in diabetic than in nondiabetic people [4].
Only in recent years have researchers in the Eastern Mediterranean Region and
Africa started to study lipid changes among diabetic and nondiabetic people. In a Saudi study comprising 1155 diabetic type 2 pa-tients, dyslipidaemia was reported among 46% (second only to hypertension) [5]. Al Muhtaseb’s study of Arab women indi-cated an incidence of 50% of lipid disorders among type 2 diabetic patients [6]. The only Sudanese study indicated a high incidence of lipid changes among diabetic patients that are comparable to the regional literature [7].
Nowadays, in Sudan and elsewhere in Africa, diabetes is no longer a “rare” or “Western” disease and deserves some of the attention and resources that are now diverted to communicable diseases. The causal association between atherosclerosis and dyslipidaemia is well established. In diabetes the associated hyperglycaemia, obesity and insulin changes highly acceler-ate the progression to atherosclerosis [2]. Atherosclerosis accounts for up to 80% of deaths in diabetic patients due to coronary heart disease (CHD) and cerbrovascular or peripheral vascular disease [2,3].
There is a relative lack of local and re-gional literature on the problem of diabetic dyslipidaemia. By studying diabetic dyslipid-aemia among a group of our patients we hoped to draw attention of the medical com-munity to the occurrence and magnitude of this problem in Sudan. In particular, the macrovascular complications of diabetes are becoming increasingly apparent among our hospital patients in Omdurman. We believed that our study would add a badly needed body of information on lipid chang-es among our diabetic population, bearing in mind that the only similar study was done 13 years ago [7]. Thus future research on this subject will refer not only to literature derived from patients living in industrial-ized environments largely different from ours. We aimed to investigate the patterns

316 La Revue de Santé de la Méditerranée orientale, Vol. 14, No 2, 2008
املجلة الصحية لشرق املتوسط، منظمة الصحة العاملية، املجلد الرابع عشر، العدد ٢، ٢٠٠٨
and determinants of lipid disorders among type 2 diabetic patients. In particular, we investigated the association of lipid disor-ders with age, sex, weight, physical activity and duration of and glycaemic control of diabetes.
Methods
Sample and settingOur study was carried out at a public medi-cal clinic for chronic diseases (run by the second author) in Omdurman, Sudan, in the period September to October 2004. Our clinic is part of a public multi-specialty clin-ic comprising medical and surgical referral clinics, serving patients under the umbrella of the Sudan Insurance Authority. Most of our patients have diabetes or hypertension or both. The diabetic patients registered at the clinic come for monthly follow-up vis-its for assessment of glycaemic control and treatment of any intercurrent illness. The aims, nature and procedures of the study were fully explained to the potential study population and a clear verbal consent was required. The potential population of our study was all the adult patients with type 2 diabetes attending our clinic. We excluded patients with factors that might affect blood lipids, such as renal or hepatic disease, alcohol intake and the use of drugs such as thiazide diuretics and oral contraceptives.
Data collectionThe study had 3 steps of data collection: a questionnaire; measurements of blood pressure, height, weight and waist circum-ference; and collection of blood samples to estimate blood lipids and glucose.
QuestionnaireThe data required from our patients in-cluded age, sex, duration of diabetes (< and
≥ 10 years), types of antidiabetic treatment and degree of physical activity. We graded physical activity according to the number of episodes of exercise undertaken per week. The patients were categorized as active (≥ 3 times per week) or inactive (< 3 times per week), according to the recommendations of the American Heart Association [8].
MeasurementsBlood pressure was measured using a mer-cury sphygmomanometer with the subject sitting down after a 5-minute rest. The pa-tients were classified as having high blood pressure if they had systolic blood pressure > 160 mmHg and diastolic blood pressure > 95 mmHg, or if they were already receiv-ing antihypertension drug therapy.
Body mass index (BMI) was based on the formula of weight (in kilograms) divided by the square height (in metres). The results of this formula classified our patients as un-derweight (BMI < 18 kg/m2), normal (BMI 18–24.9 kg/m2), overweight (BMI 25–29.9 kg/m2) and obese (BMI > 30 kg/m2). The weight was measured in kilograms, with participants wearing clothes but no shoes. A lever balance scale was used and was zeroed immediately before each session and was regularly checked using a known fixed weight. The same scale was used to weigh all the study participants. The height of the participants without shoes was measured to the nearest centimetre. The participants were asked to stand upright with their back against the stand, heels together and eyes directed forward so that the top of the tragus of the ears was horizontal with the inferior orbital margin and the measuring plate was lowered onto the scalp to give the correct level. We used the same instrument for all the patients.
Waist circumference was measured with the patient standing up, and the waist was

Eastern Mediterranean Health Journal, Vol. 14, No. 2, 2008 317
املجلة الصحية لشرق املتوسط، منظمة الصحة العاملية، املجلد الرابع عشر، العدد ٢، ٢٠٠٨
measured at the level of the umbilicus as the smallest girth between the lower margin of the ribs and the iliac crests.
Blood samples were taken from each patient after they had been fasting for 10–12 hours.
The control group consisted of 60 age- and sex-matched healthy subjects (recruited from the medical school staff and students), who were not suffering from an acute ill-ness or a metabolic disease that affected blood lipids and had no family history of hypercholesterolaemia. We measured BMI and lipid profile for all controls.
Laboratory dataBlood samples were collected by venipunc-ture in EDTA-coated tubes and then centri-fuged for plasma immediately. The blood glucose level was measured immediately.
The remaining plasma was stored at 4 ºC for further analysis for total cholesterol, triglycerides, HDL-C and LDL-C using commercial kits (Spinreact, Spain). VLDL-C was calculated according to the formula: VLDL-C = TC – (LDL-C + HDL-C).
The TC/HDL-C ratio was calculated by dividing the 2 means of each group. The measurement of chylomicrons was not in-cluded in the study as they rise only shortly after eating a fat-containing meal and are then normally completely metabolized. Abnormal lipid values were defined as: total cholesterol > 6 mmol/L, triglycerides > 1.6 mmol/L, HDL-C < 1.05 mmol/L, LDL-C > 3.8 mmol/L,VLDL-C > 1.05 mmol/L and TC/HDL-C ratio > 6.
Patients with fasting blood glucose < 8 mmol/L were classified as having fair glycaemic control and ≥ 8 mmol/L as poor glycaemic control.
Statistical analysisThe data were presented as mean and stand-ard deviation (SD), and were analysed using
SPSS, version 10. The test for significance was Student’s t-test. A P-value of 0.05 or less was considered statistically significant.
Results
Our study included 250 patients (95 male and 155 female), mean age 52 (SD 13) years (range 31–80 years). The female pa-tients were slightly younger than the male patients: mean age 51 (SD 11) years versus 54 (SD 12) years. According to the BMI criteria, 112 patients (44.8%) were normal weight, 74 (29.6%) were overweight and 64 (25.6%) were obese, with an overall mean BMI of 28.7 (SD 6.4) kg/m2. The female pa-tients were more overweight than the male patients with a mean BMI of 29.6 (SD 3.0) kg/m2 versus 27.7 (SD 2.5) kg/m2. Accord-ing to the waist circumference, 21 patients (8.4%) had abdominal obesity. Only 66 of our patients (26.4%) were physically active and 184 were inactive (73.6%). Female pa-tients were less active than male patients.
The mean duration of diabetes among our patients was 9.4 (SD 5.3) years (range 1–33 years). The female patients had earlier onset of diabetes than the male patients: mean duration 9.5 (SD 5.2) years versus 8.9 (SD 5.3) years. Of our patients 24 (9.6%) were on no treatment, 32 (12.0%) were using diet control, 146 (58.4%) were taking oral hypoglycaemic agents and 48 (19.2%) were on insulin. Glycaemic control of dia-betes was classified as fair for 135 patients (54.0%) and poor for 115 (46.0%). The fe-male patients had worse control than males (49.0% versus 41.0% had poor control). The mean systolic blood pressure was 140 (SD 19) mmHg and mean diastolic blood pressure was 84 (SD 10) mmHg. According to the criteria adopted, 74 patients (29.6%) were hypertensive and 175 (70.4%) normo-tensive.

318 La Revue de Santé de la Méditerranée orientale, Vol. 14, No 2, 2008
املجلة الصحية لشرق املتوسط، منظمة الصحة العاملية، املجلد الرابع عشر، العدد ٢، ٢٠٠٨
Table 1 summarizes the characteristics of patients (n = 250) and controls (n = 60). The control group had lower BMI and blood pressure than the patients, and were more physically active. The difference in systolic and diastolic pressure was statistically sig-nificant (P < 0.05).
The mean value of blood lipids among the patients and controls are shown in Table 2. The levels of total cholesterol, triglyc-erides, LDL-C and VLDL-C were higher among patients than controls. The difference for triglycerides was statistically significant (P < 0.05). The HDL-C was significantly lower in patients (P < 0.05).
The distribution of abnormal lipid val-ues among individual patients showed some variations. Abnormal total cholesterol was detected in 74 patients (29.6%), raised trig-lycerides in 122 (48.8%), low HDL-C in 65 (26.0%), high LDL-C in 38 (15.2%), high VLDL-C in 78 (14.0%) and TC/ HDL-C ratio > 6 in 35 patients (14%). According to these figures almost half the patients had some lipid abnormality, i.e. diabetic dyslipidaemia. Among the controls, raised total cholesterol was recorded in 8 patients (13.3%), raised triglycerides in 9 (15%), low HDL-C in 4 (6.6%), high LDL-C in 8 (13.3%), high VLDL-C in 6 (10.0%). The TC/HDL-C ratio was > 6 in 3 patients.
Table 3 shows the distribution of mean lipid values by 10-year age groups among the diabetic patients. The levels of total cho-lesterol showed a progressive increase with age up to the age of 60 years. The difference in the values of total cholesterol, triglyc-erides and HDL-C between the youngest and oldest age groups were statistically significant (P < 0.05).
The association between the mean lipid values among our patients and their sex, diabetes duration, glycaemic control, physi-cal activity, BMI and waist circumference is shown in Table 4. With the exception of duration of diabetes, the mean lipid val-ues showed clear differences. Females, the obese, the physically inactive and the poorly controlled patients showed higher levels of total cholesterol, triglycerides, LDL-C, VLDL-C and TC/HDL-C ratio, and lower levels of HDL-C. Among these groups the differences in triglycerides and HDL-C were statistically significant (P < 0.05), but not for other parameters.
Discussion
Our study in Sudan indicated that nearly half our diabetic patients had some disor-der in their lipid profile. This figure is to
Table 1 Demographic and clinical characteristics of diabetic patients and healthy controls
Characteristic Patients Controls (n = 250) (n = 60)
Mean (SD) age (years) 53 (11) 52 (10)
Male/female (No.) 95/155 22/38
Mean (SD) body mass index (kg/m2) 28.7 (6.0) 26.0 (4.4)
Mean (SD) waist circumference (cm) 96 (8.4) 93 (8.5)
Mean (SD) systolic blood pressure (mmHg) 140 (19) 127 (12)
Mean (SD) diastolic blood pressure (mmHg) 84 (10) 72 (9)
Physically active/inactive (No.) 66/184 21/39n = number of patients; SD = standard deviation.

Eastern Mediterranean Health Journal, Vol. 14, No. 2, 2008 319
املجلة الصحية لشرق املتوسط، منظمة الصحة العاملية، املجلد الرابع عشر، العدد ٢، ٢٠٠٨
some extent lower than that reported in international studies. For example, 70% of the Americans and up to 85% of Finn-ish diabetic patients were reported to have lipid abnormalities [2,9]. The Canadian Heart Association reported that up to half the diabetic patients had low HDL-C [2]. The difference in dietary habits and climate are claimed to justify the difference in lipid profile between our study and international
studies. The findings of other regional stud-ies are somewhat similar to our study. Nige-rian and Kuwaiti studies show an incidence of lipid disorders of around 50% among diabetic patients [10,11].
In accordance with other studies, the most common recognized abnormality was hypertriglyceridaemia (which was reported in nearly half the patients). Some studies on triglyceride levels showed a significant
Table 2 Distribution of mean lipid values among diabetic patients and healthy controls
Variable Mean (SD) values P-value Patients Controls (n = 250) (n = 60)
Total cholesterol (mmol/L) 5.69 (0.28) 5.20 (0.15) NS
Triglycerides (mmol/L) 1.71 (0.27) 1.16 (0.21) < 0.05
HDL-C (mmol/L) 0.93 (0.15) 1.11 (0.18) < 0.05
LDL-C (mmol/L) 3.68 (0.21) 3.45 (0.14) NS
VLDL-C (mmol/L) 1.01 (0.26) 0.81 (0.11) NS
TC/HDL-C 6.11 (1.86) 4.69 (0.13) NSn = number of patients; SD = standard deviation; NS = non-significant.HDL-C = high-density lipoprotein cholesterol; LDL-C = low-density lipoprotein cholesterol; VLDL-C = very-low-density lipoprotein cholesterol; TC/HDL-C = total cholesterol/HDL-C ratio.
Table 3 Distribution of mean lipid values by age group among 250 diabetic patients
Variable Mean (SD) values 31–40 years 41–50 years 51–60 years 71–80 years (n = 25) (n = 82) (n = 60) (n = 15)
Total cholesterol (mmol/L)* 5.53 (0.21) 5.68 (0.23) 5.81 (0.25) 5.78 (0.52)
Triglycerides (mmol/L)* 1.66 (0.11) 1.69 (0.25) 1.74 (0.34) 1.90 (0.18)
HDL-C (mmol/L)* 1.13 (0.23) 1.01 (0.12) 0.88 (0.17) 0.86 (0.27)
LDL-C (mmol/L) 3.43 (0.25) 3.65 (0.29) 3.81 (0.12) 3.75 (0.17)
VLDL-C (mmol/L) 0.82 (0.19) 0.94 (0.22) 1.09 (0.31) 0.96 (0.14)
TC/HDL-C (mmol/L) 4.89 (0.17) 5.60 (0.90) 6.63 (0.14) 6.72 (0.19)n = number of patients; SD = standard deviation.*P < 0.05.HDL-C = high-density lipoprotein cholesterol; LDL-C = low-density lipoprotein cholesterol; VLDL-C = very-low-density lipoprotein cholesterol; TC/HDL-C = total cholesterol/HDL-C ratio.

320 La Revue de Santé de la Méditerranée orientale, Vol. 14, No 2, 2008
املجلة الصحية لشرق املتوسط، منظمة الصحة العاملية، املجلد الرابع عشر، العدد ٢، ٢٠٠٨
sex-dependant pattern, with male diabetic patients having higher levels than female patients. This might be related to excessive smoking or alcohol consumption. This fac-tor was not applicable in our study as we excluded smokers and alcohol consumers. Instead, the levels of triglycerides were remarkably higher among female patients. The possible explanation for this is the dominance of overweight and obesity (both generalized and abdominal) among our fe-male patients. It has been found that hyper-triglyceridaemia is reported 4 times more in overweight and obese patients [12]. Some researchers associate the high triglyceride
level to the poor glycaemic control of diabe-tes [13]. This hypothesis is supported by the reduction of the triglyceride level with the improvement of glycaemic control (in the absence of weight gain) [13]. The increase in triglycerides in poorly controlled patients was related to the decrease of activities of adipose tissue and muscle lipoprotein lipase activity [12]. In contrast to triglycerides and HDL-C levels, the LDL-C level was not significantly different between patients with poor and fair control, in accordance with other studies [2].
Our study showed lower HDL-C levels compared with controls. The importance
Table 4 Association of some patients’ characteristics to the mean values of their blood lipids
Characteristic Mean (SD) values Total Triglycerides HDL-C LDL-C VLDL-C TC/HDL-C cholesterol (mmol/L) (mmol/L) (mmol/L) (mmol/L) (mmol/L) (mmol/L)
Sex Male* 5.51 (0.62) 1.21 (0.33)* 0.88 (0.14)* 3.52 (0.39 0.98 (0.15) 6.26 (0.44) Female 5.90 (0.73) 1.81 (0.25) 0.81 (0.41) 3.75 (0.27) 1.15 (0.32) 7.28 (0.27)
Diabetes duration < 10 years 5.71 (0.34) 1.68 (0.10) 0.88 (0.11) 3.71 (0.45) 0.98 (0.19) 6.48 (0.31) ≥ 10 years 5.66 (0.38) 1.70 (0.21) 0.92 (0.12) 3.66 (0.27) 1.02 (0.13) 6.15 (0.19)
Glycaemic control* Fair 5.52 (0.13) 1.59 (0.26)* 1.01 (0.19)* 3.53 (0.12) 0.93 (0.15) 5.52 (0.13) Poor 5.87 (0.34) 2.11 (0.15) 0.81 (0.11) 3.79 (0.22) 1.11 (0.21) 7.24 (0.30)
Physical activity Active 5.59 (0.12) 1.53 (0.25)* 1.04 (0.34)* 3.61 (0.29) 0.98 (0.33) 5.37 (0.35) Inactive 5.87 (0.69) 1.69 (0.69) 0.86 (0.26) 3.71 (0.28) 1.11 (0.15) 6.82 (2.65)
Body mass index* Normal 5.31 (0.13) 1.52 (0.53)* 1.11 (0.20)* 3.53 (0.41) 0.89 (0.61) 4.78 (0.06) Overweight 5.53 (0.27) 1.81 (0.45) 0.99 (0.31) 3.71 (0.53) 0.94 (0.44) 5.58 (0.87) Obese 5.98 (0.73) 1.92 (0.21) 0.83 (0.15) 3.84 (0.31) 1.11 (0.35) 7.20 (0.48)
Waist circumference* No abdominal obesity 5.61 (0.23) 1.62 (0.12)* 0.99 (0.21)* 3.51 (0.19) 0.95 (0.17) 5.66 (1.09) Abdominal obesity 6.21 (0.32) 1.95 (0.20) 0.78 (0.18) 3.89 (0.25) 1.21 (0.05) 7.96 (1.77)SD = standard deviation.*P < 0.05. HDL-C = high-density lipoprotein cholesterol; LDL-C = low-density lipoprotein cholesterol; VLDL-C = very-low-density lipoprotein cholesterol; TC/HDL-C = total cholesterol/HDL-C ratio.

Eastern Mediterranean Health Journal, Vol. 14, No. 2, 2008 321
املجلة الصحية لشرق املتوسط، منظمة الصحة العاملية، املجلد الرابع عشر، العدد ٢، ٢٠٠٨
of this parameter stems from the growing evidence that reduced HDL-C is a power-ful predicator for premature CHD [14]. Our study indicated a positive association between poor glycaemic control and the low level of HDL-C. Hyperglycaemia pro-gressively increases the transfer of cho-lesterol esters from HDL-C to VLDL-C particles [1]. The denser LDL particles acquire a large proportion of these HDL es-ters, further diminishing the HDL-C level. In addition, HDL-C is a ready substrate for hepatic lipase which converts it into smaller particles, which are readily cleared from the plasma [15]. As with the triglycerides, improvement in glycaemic control leads to an increase in the levels of HDL-C, supporting the evidence for a role for poor glycaemia in decreasing the level of this lipoprotein. Apart from HDL-C, the ratio of total cholesterol to HDL-C is regarded as a predictor of CHD risk, especially with values > 6 [16].
As in other studies, the level of VLDL-C was lower than controls [1]. Poor in-sulinization results in increased lipolysis in adipocytes. The resulting increase in fatty acid transport to the liver, which is a common abnormality in type 2 diabetes, may cause an increase in VLDL-C. Insulin directly degrades the apo B (which is the major protein of VLDL particles) [17] and thus insulin may increase secretion of apo B (and then VLDL).
A brief glance at our study sample in-dicates that the female sex was dominant. Our clinic was held in the morning, a time that women (who were mostly housewives) prefer to attend. In accordance with some studies, our study showed that dyslipidae-mia occurs more in diabetic women [12]. Two previous studies reported higher cho-lesterol in Arab women [6,7]. Erasmus et al. reported a high level of triglycerides and low HDL-C in diabetic women in Nigeria
[18]. Our findings might be surprising to some clinicians, who tend to request more lipid profile tests and prescribe more lipid-lowering drugs to their male patients com-pared to women [19]. Our study indicates a positive association between age and lipid abnormalities, with higher levels among older than younger ages. This fact, to some extent, may hold true for nondiabetic sub-jects. For example, total cholesterol and LDL-C may increase with age in those with otherwise good health. Some studies indi-cate that the level of triglycerides decreases after the sixth decade, stating reasons such as lower food intake and absorption and increased rate of catabolism [20]. The age factor may show a different pattern when lipid disorders first appear in childhood or early adulthood. Here, lipid disorders do not remain constant over time. Such patients may have normal lipid values later in life [1].
The association between weight gain and lipid disorders is beyond doubt, to the extent that even a slight reduction by 5%–10% of weight may positively influ-ence lipid values in diabetic patients [21]. Using BMI or waist circumference as in-dices of weight, our study patients were predominantly above the normal weight. The obese patients had higher levels of triglycerides and lower levels of HDL-C. In fact our patients showed a gradual increase in the levels of cholesterol and triglycerides from normal to overweight to obesity BMI values. The effects of obesity on lipid me-tabolism are mediated by insulin resistance, resulting in higher levels of triglycerides, and low HDL-C [22]. A proportion of our patients had abdominal obesity and showed more marked prevalence of abnormal lipid values than those with generalized obes-ity. Abdominal obesity is associated with qualitative and quantitative lipid changes [23,24]. Such changes include, for example,

322 La Revue de Santé de la Méditerranée orientale, Vol. 14, No 2, 2008
املجلة الصحية لشرق املتوسط، منظمة الصحة العاملية، املجلد الرابع عشر، العدد ٢، ٢٠٠٨
overproduction of VLDL-C and production of smaller and denser LDL particles. Some researchers even suggest that measuring waist circumference might be the “cheapest and easiest” method to determine the likeli-hood of a patient having small, dense LDL particles [21].
The results of our study indicate a clear association between glycaemic control of diabetes and appearance of dyslipidaemia. The positive improvement in lipid profile with fair glycaemic control is evident from many studies [25]. The epidemiological analysis of the United Kingdom Prospective Diabetes Study data has shown that a con-tinuous relationship exists between the risks of microvascular complications and degree of glycaemic control [25]. The association of hyperglycaemia and hypertriglycerid-aemia can be explained by the decrease in the adipose tissues and muscle lipoprotein lipase activity [26]. Hyperglycaemia (to-gether with increased free fatty acids) tends to increase the hepatic secretion of VLDL-C [26]. In uncontrolled diabetic patients, it has been reported that the activity of lipoprotein lipase and hence clearance of VLDL-C in the circulation is diminished due to insulin resistance [27]. The level of total cholesterol is usually normal or near normal if glyc-aemic control is adequate, and worsening of control raises the level [16].
The increase of lipid abnormalities with age in our study may erroneously raise a suspicion of a possible association with duration of diabetes. But looking at those with < and ≥ 10 years duration of diabetes, the distribution of lipid values was similar between the 2 groups. Furthermore, some researchers detected lipid abnormalities in prediabetic subjects with insulin resistance (but normal plasma glucose) [28]. This finding might suggest a role for abnor-malities of insulin action, independent of blood glucose level [28]. In support of this
hypothesis, an oral hypoglycaemic agent called thiazoladinedione, which improves insulin actions on peripheral tissues, highly improves the lipid profile (in contrast to other hypoglycaemic drugs) [29]. We rather advocate the view that there is a disso-ciation between duration of diabetes and dyslipidaemia. In fact the occurrence of dyslipidaemia depends on factors such as insulin action on peripheral tissues and liver, apoprotein production and regulation of lipoprotein lipase [1]. The duration of diabetes seems to play only a minor role in modifying these factors. In addition, clinicians tend to neglect looking for other secondary causes of dyslipidaemia, such as renal disease, alcohol consumption and cer-tain drugs. These factors may accelerate the progression of dyslipidaemia at any stage of diabetes (i.e. irrespective of duration).
Our study clearly shows the dominance of physical inactivity among our study population and the increased prevalence of lipid disorders. The difference in weight is only a partial explanation, as a proportion of inactive patients maintain a normal weight. Some studies indicate that physical inactiv-ity per se may initiate some lipid changes, in particular reduced HDL-C levels [30].
Conclusion
Our study showed a high prevalence of lipid disorders among diabetic patients in Sudan. There was a positive association between li-pid disorders and age, sex, weight, physical activity and glycaemic control. Thus lipid disorders occurred more among the aged, the female, the obese, the less active and the poorly-controlled diabetic patients. The high prevalence of lipid disorders in our study suggests that they might be playing a major role in the development of athero-sclerosis in Sudanese patients. The optimal care of diabetic patients should include pe-

Eastern Mediterranean Health Journal, Vol. 14, No. 2, 2008 323
املجلة الصحية لشرق املتوسط، منظمة الصحة العاملية، املجلد الرابع عشر، العدد ٢، ٢٠٠٨
riodic screening for lipid abnormalities. Ag-gressive lifestyle changes, such as weight reduction and physical exercise should be initiated first. Addition of lipid-lowering drugs should be considered if such changes do not achieve effective lipid control. The optimum treatment with antidiabetic drugs
to obtain fair glycaemic control should go hand-in-hand with lipid-lowering drugs. Further research on lipid disorders in diabet-ic patients are recommended to study type 1 patients, children and adolescents with type 2 diabetes and prediabetic subjects.
References
1. Goldberg IJ. Diabetic dyslipidaemia: causes and consequences. Journal of clinical endocrinology and metabolism, 2001, 8(3):965–71.
2. O’Brien T, Nguyen TT, Zimmerman BR. Hyperlipidemia and diabetes mellitus. Mayo Clinic proceedings, 1998, 73:969–76.
3. Colhoun HM et al. Primary prevention of cardiovascular disease with atorvastatin in type 2 diabetes in the Collaborative Atorvastatin Diabetes Study (CARDS): multicentre randomised placebo-control-led trial. Lancet, 2004, 364:685–98.
4. Taskinen MR. Diabetic dyslipidaemia. Atherosclerosis. Supplements, 2002, 3(1):47–51.
5. Akbar DH, Ahmed MM, Algambi AA. Car-diovascular risk factors in Saudi and non-Saudi diabetics. Saudi medical journal, 2003, 24(6):686–7.
6. Al Muhtaseb N et al. Lipoproteins and apolipoproteins in young non obese Arab women with NIDDM treated with insulin. Diabetes care, 1989, 12:325–31.
7. Ahmed SAM, Idris ATM, El Mahdi EM. The levels of lipoproteins in Sudanese diabetics. Sudan medical journal, 1993, 33:1–12.
8. US Department of Health and Human Services. Physical activity and health. A report of the Surgeon General. Atlan-ta, Georgia, Centers for Diseases Con-trol and Prevention, National Center for Chronic Disease Prevention and Health Promotion, 1996:23–31.
9. Harris MI. Hypercholesterolemia in dia-betes and glucose intolerance in the U.S. population. Diabetes care, 1991, 14:366–74.
10. Akanji AO. Diabetic dyslipidaemia in Kuwait. Medical principles and practice, 2002, 11:47–55.
11. Erasmus RT, Olujeopa O, Adelowo O. Correlation between glycosylated haemo-globin and serum lipids. Central African journal of medicine, 1987, 32:231–6.
12. UK Prospective Diabetes Study 27. Plas-ma lipids and lipoproteins at diagnosis of NIDDM: effects of age and gender. Diabe-tes care, 1997, 20:1683–7.
13. Abbate SL, Brunzell JD. Pathophysiology of hyperlipidemia in diabetes. Journal of cardiovascular pharmacology, 1990, 16:S1–7.
14. Packard C, Nunn A, Hobbs R. High den-sity lipoprotein: guardian of the vascular system? International journal of clinical practice, 2002, 56:761–71.
15. Horowitz BS et al. Increased plasma and renal clearance of an exchangeable pool of apolipoprotein A-I in subjects with low levels of high density lipoprotein cho-lesterol. Journal of clinical investigation, 1993, 91(4):1743–52.
16. Laakso M. Dyslipidemia, morbidity, and mortality in non-insulin-dependent diabe-tes mellitus. Lipoproteins and coronary heart disease in non-insulin-dependent diabetes mellitus. Journal of diabetes and its complications, 1997, 11:137–41.

324 La Revue de Santé de la Méditerranée orientale, Vol. 14, No 2, 2008
املجلة الصحية لشرق املتوسط، منظمة الصحة العاملية، املجلد الرابع عشر، العدد ٢، ٢٠٠٨
17. Sparks JD, Sparks CE. Insulin modula-tion of hepatic synthesis and secretion of apolipoprotein B by rat hepatocytes. Journal of biological chemistry, 1990, 265(15):8854–62.
18. Erasmus RT et al. Plasma HDL cholester-ol, triglyceride and total cholesterol levels in non-insulin treated Nigerian diabet-ics. Tropical and geographical medicine, 1989, 41:238–41.
19. Nau DP, Mallya U. Sex disparity in the management of dyslipidemia among pa-tients with type 2 diabetes mellitus in a managed care organization. American journal of managed care, 2005, 11:69–73.
20. Boshtam M et al. Obesity and associ-ated cardiovascular risk factors in Isfahan population: Isfahan Cardiovascular Risk Factor Survey. Atheroscleroza, 1997, 1(4):7–11.
21. Lemieux I et al. Hypertriglyceridemic waist. A marker of the atherogenic meta-bolic triad (hyperinsulinemia; hyperap-olipoprotein b; small, dense LDL) in men? Circulation, 2000, 102:179–84.
22. DiGirolumo M. Cellular, metabolic and clinical consequence of adipose mass enlargement in obesity. Nutrition, 1991, 7(4):287–9.
23. Campanini M et al. Lipid metabolic dis-orders in obesity: their epidemiology, physiopathology and clinico-therapeutic implications. Annali italiani di medicina interna, 1997, 12:223–9.
24. Watamori M et al. Intra-abdominal fat: is it a major factor in developing diabetes
and coronary artery disease? Diabetes research and clinical practice, 1996, 30 (Suppl.):S25–30.
25. Stratton IM et al. Association of glycaemia with macrovascular and microvascular complications of type 2 diabetes (UKPDS 35): prospective observational study. Brit-ish medical journal, 2000, 321:405–12.
26. McKenney JM. Understanding and treat-ing dyslipidemia associated with nonin-sulin-dependent diabetes mellitus and hypertension. Pharmacotherapy, 1993, 13:340–52.
27. Keller U, Golay A, Pomatto D. Dyslipi-damie bei Diabetes mellitus: Bedeutung, Diagnostik und Behandlung [Dyslipi-demia in diabetes mellitus: significance, diagnosis and treatment]. Schweizerische Rundschau für Medizin Praxis, 1990, 79:1199–204.
28. Haffner SM et al. Insulin-resistant predia-betic subjects have more atherogenic risk factors than insulin-sensitive prediabetic subjects. Circulation, 2000, 101:975–80.
29. Ginsberg H, Plutzky J, Sobel BE. A review of metabolic and cardiovascular effects of oral antidiabetic agents: beyond glucose-level lowering. Journal of cardiovascular risk, 1999, 6(5):337–45.
30. Connelly P et al. Prevalence of high plas-ma triglyceride combined with low HDL-C levels and its association with smoking, hypertension, obesity, diabetes, seden-tariness and LDL-C levels in the Cana-dian population. Canadian Heart Health Surveys Research Group. Canadian jour-nal of cardiology, 1999, 15(4):428–33.

Eastern Mediterranean Health Journal, Vol. 14, No. 2, 2008 325
املجلة الصحية لشرق املتوسط، منظمة الصحة العاملية، املجلد الرابع عشر، العدد ٢، ٢٠٠٨
Thyroid autoantibodies in women with and without thyroid disorders in an iodine-replete area A. Aminorroaya,1 M. Momenzadeh,1 S. Hovsepian,1 S. Haghighi1 and M. Amini1
1Isfahan Endocrine and Metabolism Research Centre, Isfahan University of Medical Sciences, Isfahan, Islamic Republic of Iran (Correspondence to A. Aminorroaya: [email protected]).Received: 16/11/05; accepted: 23/01/06
ABSTRACT To compare the prevalence of positive autoantibodies in patients with thyroid disorders and healthy subjects in an iodine-replete area of the Islamic Republic of Iran, we studied 930 women in a clinic-based study: 698 patients (286 hypothyroid, 140 hyperthyroid, 272 with simple goitre) and 232 healthy women. Serum thyroxine (T4), triiodothyronine (T3), thyroid stimulating hormone, and anti-thyroid antibodies were measured. Positive autoantibodies were detected in 75.5% of patients with hy-pothyroidism, 73.6% of those with hyperthyroidism, 48.9% of those with simple goitre and 35.8% of the control group (P < 0.001). Autoimmunity may have a role in the genesis of common thyroid disorders.
Autoanticorps thyroïdiens chez les femmes avec et sans troubles thyroïdiens dans une région riche en iode RÉSUMÉ Afin de comparer la prévalence des autoanticorps positifs chez les patients atteints de troubles thyroïdiens et chez des sujets en bonne santé dans une région riche en iode de la République islamique d’Iran, nous avons effectué une étude clinique sur 930 femmes : 698 patientes (286 hypothyroïdiennes, 140 hyperthyroïdiennes et 272 présentant un goitre simple) et 232 femmes en bonne santé. La thyroxine (T4), la triiodothyronine (T3), la thyréostimuline, ou TSH (pour thyroid stimulating hormone) sériques et les anticorps antithyroïdiens ont été mesurés. Des autoanticorps positifs ont été détectés chez 75,5 % des patientes atteintes d’hypothyroïdie, 73,6 % de celles atteintes d’hyperthyroïdie, 48,9 % de celles présentant un goitre simple et 35,8 % dans le groupe témoin (p < 0,001). L’auto-immunité peut avoir un rôle dans l’apparition des troubles thyroïdiens courants.
930286140272goiter
232T4T3
75.5
73.648.935.8
0.001<

326 La Revue de Santé de la Méditerranée orientale, Vol. 14, No 2, 2008
املجلة الصحية لشرق املتوسط، منظمة الصحة العاملية، املجلد الرابع عشر، العدد ٢، ٢٠٠٨
Introduction
Iodine deficiency disorders were preva-lent in the Islamic Republic of Iran prior to 1989 when the national salt iodization programme was initiated [1]. A law for the mandatory production of iodized salt for households was passed in 1994. Since then, the country has achieved a sustainable con-trol programme for iodine deficiency [1,2].
Isfahan is a centrally located city in the Islamic Republic of Iran with a population of about 1 000 000. In a study conducted on 3000 Isfahan students after 8 years of iodine repletion, 94% had sufficient iodine consumption [2]. Despite this, however, the prevalence of goitre was still high (63%) [2]. So the question of iodine-induced autoimmune thyroid disease was raised [2,3]. A randomized, double-blind, placebo-controlled trial reported the transient occur-rence of high levels of thyroid antibodies in 6 of 31 patients with endemic goitre treated daily for 6 months with a supraphysiologic dose of 500 μg/day iodine. Therefore, it was concluded that iodine may induce thyroid autoimmunity in patients with endemic goitre [3].
The clinical implications of thyroid au-toimmunity following correction of iodine deficiency are, however, still unclear [4]. In a survey done in Shahriar, Islamic Republic of Iran, positive antithyroid antibodies were observed in 3.1% of the population before iodine supplementation [5]. In a clinic-based study in Shiraz in 1981, antithyroid antibodies were found in 2% of healthy volunteers, 3% of patients with simple goi-tre, 41% of those with hyperthyroidism and 67% of those with hypothyroidism [6].
As high titres of antithyroid antibodies are strongly suggestive of thyroid autoim-munity [7], we investigated the frequency of thyroid autoantibodies 12–14 years after iodine repletion in Isfahan by measuring
these antibodies in patients with thyroid disorders and in a healthy control group.
Methods
ParticipantsWomen were chosen for this study as it is known they have a higher prevalence of thyroid autoimmune markers and goitre compared with men [7]. Isfahan Endocrine and Metabolism Research Centre is a refer-ral centre for endocrine disorders. All 990 women in Isfahan who met the inclusion criteria and who were referred to the out-patient endocrine clinic during the period April 2001–March 2003 were invited to participate in the study; 930 agreed and gave voluntary informed consent. Those who were pregnant or on medications which would affect thyroid function tests (e.g. oral contraceptive pills, levothyroxine or thiona-mides) were excluded.
Participants were classified into 4 groups, hypothyroidism, hyperthyroidism, simple goitre, and a healthy control group (no goitre and normal thyroid function). The women in the control group were those with certain nonspecific symptoms who had been referred with suspected thyroid disor-der, but after history-taking and physical examination, were diagnosed as completely healthy and their thyroid function tests were normal.
Initial clinical evaluation included tak-ing demographic data, noting symptoms of hypo- and hyperthyroidism, physical examination for signs of thyroid dysfunc-tion and presence or absence of goitre. A thyroid gland whose lateral lobes had a volume greater than the terminal phalanges of the thumbs of the person examined was considered goitrous [4].
The protocol was approved by the Insti-tutional Review Board and Medical Ethics

Eastern Mediterranean Health Journal, Vol. 14, No. 2, 2008 327
املجلة الصحية لشرق املتوسط، منظمة الصحة العاملية، املجلد الرابع عشر، العدد ٢، ٢٠٠٨
Committee of Isfahan University of Medi-cal Sciences.
Laboratory measurementsCommercially-available kits were used to measure serum concentrations of thyrox-ine (T4) and triiodothyronine (T3) by ra-dioimmunoassay using a gamma counter (Berthold Technologies GmbH, Germany), and thyroid-stimulating hormone (TSH) by immunoradiometric assay (Kavoshyar, Te-hran). The normal (reference) ranges were: T4: 5.50–11.03 µg/dL; T3: 80–200 ng/dL; TSH: 0.36–3.68 mIU/L. Those with TSH values > 3.68 mIU/L were diagnosed as having hypothyroidism. Those with T4 val-ues > 11.03 µg/dL and/or T3 > 200 ng/dL and TSH < 0.36 mIU/L were diagnosed as having hyperthyroidism. Simple goitre was defined as presence of goitre with normal thyroid function (T4, T3 and TSH within normal range).
Serum antithyroid peroxidase (anti-TPO/TPOAb) and antithyroglobulin (anti-Tg/TgAb) were measured by enzyme-linked immunosorbent assay standardized against the WHO reference preparation 66/387 for anti-TPO and 65/93 for anti-Tg antibodies (DRG Instruments GmbH, Germany). The intra-assay variation was 5.3% for TPOAb and 3.3% for TgAb. The inter-assay vari-
ation for was 2.0% TPOAb and 4.0% for TgAb.
Serum TPOAb < 50 IU/mL was defined as normal (negative) and > 75IU/mL as elevated (positive). Serum TgAb < 100 IU/mL was defined as normal (negative) and > 150 IU/mL as elevated (positive).
Statistical analysisData with normal distribution were shown as mean and standard deviation (SD), unless stated otherwise. We compared variables using analysis of variance, chi-squared and t-tests as appropriate using SPSS, version 12, and Epi-Info, version 6.04. P < 0.05 was considered statistically significant.
Results of variables not distributed nor-mally are shown as box plots with 25th, 50th and 75th percentiles.
Results
Mean age in hypothyroid, hyperthyroid, simple goitre and control groups was 27.0 (SD 12.1), 30.1 (SD 13.5), 28.2 (SD 13.9) and 27.3 (SD 13.1) years, respectively. There was no difference in age between groups.
Mean levels for serum T4, T3 and TSH are shown in Table 1. As expected, mean T4
Table 1 Mean thyroid hormone levels in women with thyroid disorders and in a control group in Isfahan
Variable Patients Controls Hypothyroidism Hyperthyroidism Simple goitre (n = 232) (n = 286) (n = 140) (n = 272) Mean SD Mean SD Mean SD Mean SD
T4 (µg/dL) 6.9* 4.2 16.5* 6.9 7.9 1.4 8.1 1.4
T3 (ng/dL) 112.7* 47.7 229.8* 151.9 131.1 24.9 128.4 26.1
TSH (mIU/mL) 23.5* 32.3 0.1* 0.1 1.5 0.8 1.6 0.8*P value < 0.05.SD = standard deviation.T3 = triiodothyronine; T4 = thyroxine; TSH = thyroid stimulating hormone.

328 La Revue de Santé de la Méditerranée orientale, Vol. 14, No 2, 2008
املجلة الصحية لشرق املتوسط، منظمة الصحة العاملية، املجلد الرابع عشر، العدد ٢، ٢٠٠٨
and T3 levels were statistically significantly lower in hypothyroid women and statisti-cally significantly higher in the hyperthy-roid group than in the control group (P < 0.05). Mean TSH level was higher in hypothyroid patients than in those who were euthyroid, and was suppressed in those with hyperthyroidism.
Medians for TPOAb and TgAb were higher in the hypo- and hyperthyroidism and simple goitre groups than in the control group. The distribution of autoantibody concentration is shown as box plots (Fig-ures 1 and 2). Median (range) for TPOAb in these groups was 200 (< 1–8361), 200 (5–5200), 30 (< 1–2975) and 20 (< 1–2336) IU/mL, respectively and for TgAb was 197
(1–9317), 165 (4–5500), 67 (< 1–4219) and 27 (< 1–4219) IU/ mL, respectively.
Frequency of positive antithyroid anti-bodies was statistically significantly higher in the hypo- and hyperthyroidism groups than in the control group (Table 2). This was also higher in the simple goitre group, but not statistically significantly. Frequency of positive TPOAb and/or TgAb was similar in the hypo- and hyperthyroidism groups. Fre-quency of positive autoantibodies did not increase with age in patients with thyroid disorders or in the control group.
Negative thyroid antibody levels were lower in the hypothyroidism (P < 0.001), hyperthyroidism (P < 0.001) and simple goitre (P < 0.05) groups than in the control
Figure 1 Serum antithyroid peroxidase (TPO) antibody levels in women with thyroid disorders and in a control group in Isfahan (box plot, SPSS 12)

Eastern Mediterranean Health Journal, Vol. 14, No. 2, 2008 329
املجلة الصحية لشرق املتوسط، منظمة الصحة العاملية، املجلد الرابع عشر، العدد ٢، ٢٠٠٨
group (Table 2). The difference was statisti-cally significant except for TPOAb in the simple goitre group.
Only-positive TPOAb was detected in 22.0% of those with hypothyroidism, 20.7% of those with hyperthyroidism, 16.5% of those with simple goitre and 14.7% of the control group. For only-positive TgAb, corresponding values were 9.4%, 11.4%, 11.8% and 9.1%, respectively. Only-posi-tive TPOAb was more frequent than only-positive TgAb in the hypo- (P < 0.001) and hyperthyroidism (P < 0.05) groups.
Of those women with positive TPOAb, 66.7% in the hypothyroidism group, 65.9% in the hyperthyroidism group, 55.4% in the simple goitre group and 42.4% of the con-trol group also had positive TgAb; 82.4%,
77.8%, 63.6% and 54.3% of those with pos-itive TgAb in these groups also had positive TPOAb. The difference was not statistically significant except in the hypothyroid group (P < 0.001).
Discussion
In this study, thyroid autoantibodies were measured in women referred to an endo-crine clinic in Isfahan, an iodine-replete area. Serum concentrations of both TPOAb and TgAb were much higher in all 3 groups with thyroid disorders in comparison with the healthy control group.
Prevalence of positive antithyroid anti-bodies (TPOAb and/or TgAb) was 75.5%,
Figure 2 Antithyroglobulin (Tg) antibody levels in women with thyroid disorders and in a control group in Isfahan (box plot, SPSS 12)

330 La Revue de Santé de la Méditerranée orientale, Vol. 14, No 2, 2008
املجلة الصحية لشرق املتوسط، منظمة الصحة العاملية، املجلد الرابع عشر، العدد ٢، ٢٠٠٨
Table 2 Antithyroid antibodies in patients with thyroid disorders and in a control group in Isfahan
Antithyroid Patients Controlsantibody Hypothyroidism Hyperthyroidism Simple goitre (n = 232) (n = 286) (n = 140) (n = 272) No. % No. % No. % No. %
Positivea TPOAb 189* 66.1 87* 62.1 101 37.1 62 26.7 TgAb 153* 53.5 72* 51.4 88 32.4 46 19.8 TPOAb + TgAb 126* 44.1 56* 40.0 56 20.6 25 10.8 TPOAb or TgAb 216* 75.5 103* 73.6 133* 48.9 83 35.6
Negativeb TPOAb 76* 26.6 47* 33.6 152 55.9 154 66.4 TgAb 107* 37.4 55* 39.3 166* 61.0 164 70.7 TPOAb + TgAb 45* 15.7 29* 20.7 111* 40.8 128 55.2TPOAb = serum antithyroid peroxidase; TgAb = serum antithyroglobulin.*P value < 0.05.aPositive TPOAb > 75 IU/mL; positive TgAb > 150 IU/mL.bNegative TPOAb < 50 IU/mL; negative TgAb < 100 IU/mL.
73.6%, 48.9% in patients with hypothy-roidism, hyperthyroidism and simple goitre. It was much higher than in the control group (35.8%), although this was also high. In a clinic-based study in Shiraz, Islamic Repub-lic of Iran, during the iodine deficient period (1981), corresponding values were 67%, 41%, 3% and 2% (control group) [6]. In our study in Isfahan, after iodine supplementa-tion, the prevalence of positive antithyroid antibodies was much higher than in Shiraz in all groups. The concentration of these antibodies had not been measured in Isfahan before iodine supplementation so we could not compare our data with previous findings for the same population. This is one of the limitations of this study.
In a Greek study, carried out 7 years af-ter iodine repletion, a 3-fold increase in the prevalence of autoimmune thyroiditis was observed among schoolchildren evidenced by TPOAb and/or TgAb levels [8]. In Iran, frequency of positive thyroid autoantibodies was 2% in Shiraz in a disease-free popula-
tion before iodine supplementation [6]. In our sample in Isfahan, after elimination of iodine deficiency, it was 35.6% in healthy subjects, 18 times higher after iodine reple-tion.
In Zimbabwe, an iodine-replete country, 39% of hyperthyroid patients had positive TPOAb or TgAb. None of these antibodies was positive in patients with simple goitre [9]. In Isfahan, it was 75.5% and 48.9% in hypothyroid and simple goitre patients. It seems that iodine prophylaxis-induced autoimmune thyroid disorders are more prevalent in Isfahan than Zimbabwe, even in goitre without thyroid dysfunction. These simple goitres may progress to hypo- and hyperthyroidism in future.
In this study from Isfahan, TPOAb was positive in 66.3%, 62.1% and 26.8% of women with hypo- and hyperthyroidism, simple goitre and control groups, respec-tively. In a recent study in Tehran on women with postpartum thyroiditis and a control group, positive anti-TPO was observed

Eastern Mediterranean Health Journal, Vol. 14, No. 2, 2008 331
املجلة الصحية لشرق املتوسط، منظمة الصحة العاملية، املجلد الرابع عشر، العدد ٢، ٢٠٠٨
in 61.5% and 19.0% respectively [10]. Prevalence of positive autoantibodies was similar in women with thyroid dysfunction in Tehran and Isfahan, but was higher in the Isfahan control group (Table 2).
In Pakistan, positive TPOAb was ob-served in 78.9% of patients with Graves’ disease and in 13.3% of the control group; positive TgAb was observed in 57.9% in patients and 6.7% of the control group [11]. Prevalence of positive antibodies in those with thyroid disorders was similar to the findings in our study, but lower in the control group. While the prevalence of thyroid autoantibodies is generally higher in women, and all participants in our study were female [12–14], higher prevalence of antibodies in healthy Isfahani subjects compared with Pakistani people cannot be explained by patient selection as higher prevalence of positive antibodies has been observed in disease-free women in Tehran, too [10]. In comparison to reports from Zimbabwe, Pakistan and Tehran, prevalence of positive antibodies in the control group was higher in Isfahan [9–11]. It appears that Isfahani people are more susceptible to thyroid autoimmunity.
In Sri Lankan schoolgirls, the preva-lence of TgAb has been markedly raised since iodine supplementation, ranging be-tween 14.3% (11-year-old girls) and 69.7% (16-year-old girls), but the prevalence of TPOAb was ≤ 10% in all age groups [14]. In our study, the prevalence of positive antibodies did not increase with age in any group. In Thailand, prevalence of anti-thyroid antibodies was higher in an elderly compared to a younger age group (14.69% versus 5.02%) [12]. Prevalence of thyroid antibodies in the population of the United States of America, National Health and Nutrition Examination Survey (NHANES
III) study, increased with age [13]. These 3 studies were population-based but ours was clinic-based. This might explain why we fond no correlation between age and positive antithyroid autoantibodies.
In the NHANES III study and also in a study from Bangladesh, TgAb alone in the absence of TPOAb was not significantly associated with thyroid disease [13,15]. In Budapest, 57.9% of hyperthyroid patients who had positive anti-TPOAb were nega-tive for anti-TgAb, whereas 9.4% of those with positive anti-TgAb were anti-TPOAb negative [16]. Corresponding values were 22.0% and 9.4% respectively in our study.
In recent study, only-positive TPOAb was more prevalent than only-positive TgAb in hypo- and hyperthyroidism, but the difference was not as great as in other studies [13,15,16]. However, the higher prevalence of TPOAb compared to TgAb and both combined, similar to the above studies, makes measurement of anti-Tg superfluous. Prevalence of negative anti-thyroid antibodies was much higher in the control group, and serum titres of these anti-bodies were significantly higher in those with thyroid disorders than in the control group in Isfahan, Islamic Republic of Iran.
Although the findings of the present study may suggest that iodine-induced autoimmune thyroid disease is increasing in the Islamic Republic of Iran since iodine re-pletion, a cohort population-based study is recommended to investigate this possibility. It appears that TPOAb measurement would be enough to survey thyroid autoimmunity.
Acknowledgement
We are grateful to M. Majid Abyar for com-puter technical assistance.

332 La Revue de Santé de la Méditerranée orientale, Vol. 14, No 2, 2008
املجلة الصحية لشرق املتوسط، منظمة الصحة العاملية، املجلد الرابع عشر، العدد ٢، ٢٠٠٨
References
1. Azizi F et al. Sustainable control of iodine deficiency in Iran: beneficial results of the implementation of the mandatory law on salt iodization. Journal of endocrinological investigation, 2002, 25(5):409–13.
2. Aminorroaya A et al. Effects of iodized salt consumption on goiter prevalence in Isfahan: the possible role of goitrogens. Endocrine practice, 2001, 7(2):95–8.
3. Kahaly GJ et al. Iodide induces thyroid autoimmunity in patients with endemic goitre: a randomised, double-blind, pla-cebo-controlled trial. European journal of endocrinology, 1998, 139(9):290–7.
4. Delonge FM. Iodine deficiency. In: Braver-man LE, Utiger RD, eds. Werner & Ing-bar’s The thyroid, 8th ed. Philadelphia, Lippincott Williams & Wilkins, 2000:295–316.
5. Azizi F, Navai L, Fattahi F. Goiter preva-lence, urinary iodine excretion, thyroid function and anti-thyroid function and anti-thyroid antibodies after 12 years of salt iodization in Shahriar, Iran. International journal for vitamin and nutrition research, 2002, 72:291–5.
6. Khaleeli AA. Prevalence of thyroid anti-bodies in Shiraz, Iran, an area with iodine deficiency. Postgraduate medical journal, 1981, 57(663):23–7.
7. Dayan CM, Daniels GH. Chronic autoim-mune thyroiditis. New England journal of medicine, 1996, 335:99–107.
8. Zois C et al. High prevalence of autoim-mune thyroiditis in schoolchildren after elimination of iodine deficiency in north-western Greece. Thyroid, 2003, 13:485–9.
9. Chinyanga EA, Benni A, Siziya S. Thyroid status and the levels of thyroid auto-an-tibodies in the sera of hyperthyroid and goitrous subjects. Central African journal of medicine, 2000, 46(9):251–5.
10. Shahbazian HB, Sarvghadi F, Azizi F. Prevalence and characteristics of post-partum thyroid dysfunction in Tehran. European journal of endocrinology, 2001, 145:397–401.
11. Tayyab M, Bhatti KU, Ditta A. Prevalence of thyroid microsomal and thyroglobulin autoantibodies in goitrous lesions. Jour-nal of Ayub Medical College, Abbottabad, 2001,13(3):16–8.
12. Hanvivatvong O et al. Prevalence of au-toantibodies in Thai elderly. Journal of the Medical Association of Thailand, 2003, 86(Suppl. 2):S242–9.
13. Hollowell JG et al. Serum TSH, T(4), and thyroid antibodies in the United States population (1988 to 1994): National Health and Nutrition Examination Survey (NHANES III). Journal of clinical endo-crinology & metabolism, 2002, 87(2):486–8.
14. Premawardhana LD et al. Increased prev-alence of thyroglobulin antibodies in Sri Lankan schoolgirls—is iodine the cause? European journal of endocrinology, 2000, 143(2):185–8.
15. Hasanat MA et al. Status of antithyroid antibodies in Bangladesh. Postgraduate medical journal, 2000, 76(896):345–9.
16. Foldes I, Levay A. [Antibodies against thy-roid gland peroxidase and thyroglobulin in various thyroid diseases]. Orvosi hetilap, 1994, 135(29):1579–84 [in Hungarian].
Eastern Mediterranean Health Journal, Vol. 14, No. 2, 2008 333
املجلة الصحية لشرق املتوسط، منظمة الصحة العاملية، املجلد الرابع عشر، العدد ٢، ٢٠٠٨
Body mass index of Kuwaiti adolescents aged 10–14 years: reference percentiles and curvesA.N. Al-Isa1 and L. Thalib1
1Department of Community Medicine and Behavioural Sciences, Faculty of Medicine, University of Kuwait, Kuwait (Correspondence to A.N. Al-Isa: [email protected]). Received: 31/05/05; accepted: 18/01/06
ABSTRACT The aim of this population-based study was to develop body mass index (BMI) reference standards for Kuwaiti adolescents for use in Kuwait and other Gulf countries. All available intermedi-ate school students aged 10–14 years (32 624 males and 30 209 females) were measured for weight and height. Polynomial regression smoothing techniques were used to obtain the best-fitting curves for BMI percentiles. The BMI of boys at lower centiles and ages was almost always higher than girls. At higher centiles, the BMI of girls was almost always higher than boys. The data were compared with the United States National Center for Health Statistics standards and data from Saudi Arabian and Iranian adolescents.
Indice de masse corporelle des adolescents koweïtiens âgés de 10 à 14 ans : percentiles et courbes de référenceRÉSUMÉ Cette étude en population avait pour objectif de mettre au point des normes de référence en matière d’indice de masse corporelle (IMC) concernant les adolescents koweïtiens, en vue de leur utilisation au Koweït et dans d’autres pays du Golfe. On a ainsi relevé la taille et le poids de tous les élèves des collèges âgés de 10 à 14 ans disponibles (32 624 garçons et 30 209 filles). Des techniques de lissage par régression polynomiale ont été utilisées pour obtenir les meilleures courbes d’ajustement des percentiles de l’IMC. L’IMC des garçons dans les centiles et aux âges les plus bas était presque toujours supérieur à celui des filles. Dans les centiles les plus élevés, l’IMC des filles était presque toujours supérieur à celui des garçons. Ces données ont été comparées aux normes du United States National Center for Health Statistics et aux données relatives aux adolescents saoudiens et iraniens.
10–14
BMI
10146243220930
smoothing

334 La Revue de Santé de la Méditerranée orientale, Vol. 14, No 2, 2008
املجلة الصحية لشرق املتوسط، منظمة الصحة العاملية، املجلد الرابع عشر، العدد ٢، ٢٠٠٨
Introduction
The stage of adolescence has been defined as ages 10 to 19 years [1], a group that rep-resents about 20% of the general population [2]. During adolescence, the highest weight gain is concurrent with the greatest height gain [3]. As a consequence, the rate of rise of body mass index (BMI) accelerates not long after puberty. It has been suggested that this increase in BMI is related less to chronologic age than to pubertal develop-ment [3,4].
Although BMI has been recommended for assessing overweight and obesity among adolescents, an acceptable universal BMI reference standard for international use has not yet been developed [5–7]. Research about the suitability of reference stand-ards for different populations is limited as references may over- or underestimate the levels of obesity among different popu-lations. Moreover, some populations in developing countries may mature later than in developed countries [6,8]. Therefore, it is difficult to make comparisons between countries during this stage of development [9,10]. BMI levels have been shown to vary in adolescence according to age and sex [5].
Although the creation of standard BMI levels by age and sex based on local data have been advocated [11], it may be un-necessary for each country to develop its own standards. A more practical alternative is for a series of references to be developed so that the one that most closely matches the study population can be chosen [12]. At present there are no reference standards for use in Kuwait or other Gulf Arab popula-tions. The purpose of this study was to develop reference BMI centile curves for Kuwaiti adolescents aged 10–14 years, for use in Kuwait and possibly neighbouring Gulf countries.
Methods
SampleThis population-based study was conducted with the collaboration of the Ministry of Education and the Ministry of Health in Kuwait, under the control of the first author, to develop BMI reference standards and curves for local use, especially for Kuwaiti adolescents aged 10–14 years. No financial support was required. The data collection period was October 1997–May 1999.
Pre-university public education in Ku-wait of 14 years includes 2 years of kin-dergarten, and 4 years each of elementary, intermediate and secondary education. A list of intermediate schools was obtained from the Ministry of Education, and all of them were included in the study since they are attended by the majority of the target population aged 10–14 years. The total number of intermediate public schools was 158 at the time of the study. Males and females attend separate schools at interme-diate level. The sample comprised 62 833 intermediate school students (32 624 males and 30 209 females), representing 84% of the target population (Kuwaiti pupils en-rolled in intermediate schools). The schools were distributed over all geographical areas of the country and therefore students rep-resented all socioeconomic strata of the population.
MeasurementsThe data collected for the study were sex, age, weight and height. The data collection process included quality control checks and crosschecks. Each school had a nurse who measured the students’ weights and heights every year as part of his/her responsibili-ties. So each nurse was experienced in these measurements. The first author selected and further trained the 10 most experienced

Eastern Mediterranean Health Journal, Vol. 14, No. 2, 2008 335
املجلة الصحية لشرق املتوسط، منظمة الصحة العاملية، املجلد الرابع عشر، العدد ٢، ٢٠٠٨
school nurses on how to use the scale and stadiometer.
Age was ascertained to the nearest month from the pupil’s civil identification card which contained his/her date of birth and was kept in the school file.
The measurements of weight and height were taken by the nurses. A team of 2 nurses visited each school. One measured weight and the other height. Weight was measured to the nearest 0.1 kg with the participant standing and wearing light clothes, using a pre-calibrated digital Seca scale, which was recalibrated at each different location. Height was measured to the nearest 0.1 cm while the participant was standing without shoes, using a specially designed portable stadiometer with a spirit level to ensure that it was parallel to the floor during meas-urement. Measurements were recorded 3 times and the mean reading was recorded by a school teacher or a secretary against the name of the students on the class list obtained from the school.
BMI, weight in kilograms divided by height in metres squared (kg/m2), was used as an index of overweight and obesity and was calculated for each age and sex. The BMI curves were then compared with the United States National Center for Health Statistics (NCHS) population reference data from the National Health and Nutri-tion Examination Survey (NHANES-1) [11]. We also reviewed 2 other similar studies that compared the BMI of Saudi Arabian and Iranian adolescents with that of the Americans [13,14]. These 2 studies were chosen not only for the proximity of their populations to Kuwait but because the majority of the original settlers of Kuwait came from Saudi Arabia and the Islamic Republic of Iran.
Data analysisSPSS for Windows, version 11 was used for data analysis. Children were grouped into
year groups of 10–14 years based on their age and the 5th, 15th, 25th, 50th, 75th, 85th and 95th percentiles, which were empiri-cally calculated for each group. Percentile curves were then constructed and smoothed using best-fitting polynomials. The best-fitting model was selected using R2 criteria. Linear, quadratic cubic, exponential and inverse polynomials were assessed prior to selecting the best-fitting method, which was the cubic polynomial in most cases. Then centile curves were visually compared between groups (i.e. between males and females and between countries).
Results
BMI centiles for Kuwaiti adolescentsTable 1 shows the BMI centiles of Kuwaiti children aged 10–14 years. At the 5th cen-tile and up to the age of 12 years, the BMI of boys was higher than that of girls. At the 15th centile and up to the age of 11 years, the BMI of boys was higher than girls. At the 25th centile, the BMI of boys was higher than girls at age 11 years. Thereafter, with 2 exceptions, at ages 10 and 14 years for the 95th centile, the BMI of girls exceeded that of boys at every age and centile category. This was reflected also in the smoothed centile curves comparing male and female BMI values (Figure 1).
Comparison with other countriesFigure 2 compares the smoothed percentile BMI curves of Kuwaiti males aged 10–14 years with their American counterparts from the NCHS data. At the lowest centile (5th), the BMI of the Americans was higher than that of Kuwaitis in every age category. At the 25th centile, the BMI of Kuwaitis was higher than that of the Americans ex-cept at ages > 13 years. At higher centiles, the BMI of Kuwaitis was higher than that of the Americans.

336 La Revue de Santé de la Méditerranée orientale, Vol. 14, No 2, 2008
املجلة الصحية لشرق املتوسط، منظمة الصحة العاملية، املجلد الرابع عشر، العدد ٢، ٢٠٠٨
Figure 3 compares the smoothed percen-tile BMI curves of Kuwaiti females aged 10–14 years with their NCHS American counterparts. A very similar pattern was noted as for boys, but at the lowest centile the BMI of Kuwaiti girls at ages > 13 years began to exceed that of the Americans. At the 25th centile, a reverse trend was noted, the BMI of the Americans being higher than the youngest age group of Kuwaitis (10 years). Thereafter, the BMI of Kuwaiti girls was higher than that of the Americans, ex-cept that the gap between the 2 groups at the 50th and 75th centiles was narrower among girls than among boys. At the 95th centile, the gap between Kuwaiti and American males was wider than between Kuwaiti and American females.
Figures 4 and 5 compare the BMI curves for Saudi Arabian and Iranian adolescents with those of the Kuwaitis and Americans. At the 5th centile for males, the BMI of Americans was higher than all the other nationalities, especially at older ages (Fig-ure 4). The BMI of Iranians was the low-est, followed by the Saudi Arabians and Kuwaitis. At the 50th centile, the BMI of Saudi Arabians and Iranians was very close but consistently lower than the Americans, but the pattern of change was similar to the Americans. At the 95th centile, which is usually used as an index of adiposity, the BMI of Saudi Arabians and the Americans almost overlapped, except at age > 13 years. The BMI of Iranians was far below both the Saudi Arabians and the Americans and the BMI of the Kuwaitis was the highest (Figure 4).
For girls, a similar pattern was noted, although with some variations (Figure 5). At the 5th centile, the BMI of Kuwaiti girls was lower at age > 13 years than American girls. The lowest group was the Iranians followed by the Saudi Arabians. At the 50th centile, the BMI of Kuwaitis was consist-Ta
ble
1 B
od
y m
ass
ind
ex (
BM
I) p
erce
nti
les
of
Ku
wai
ti m
ale
(M)
and
fem
ale
(F)
child
ren
ag
ed 1
0–14
yea
rs
Ag
e
n
BM
I per
cen
tile
s (k
g/m
2 )g
rou
p
5th
15
th
25th
50
th
75th
85
th
95th
(yea
rs)
M
F
M
F
M
F
M
F
M
F
M
F
M
F
M
F
10–
< 1
1 93
07
8473
14
.1
13.4
15
.2
14.8
16
.0
15.7
17
.9
18.0
21
.0
21.3
23
.4
23.5
27
.7
27.8
11–
< 1
2 80
53
7778
14
.4
14.0
15
.6
15.5
16
.4
16.5
18
.6
19.2
22
.5
23.0
25
.0
25.2
29
.6
29.5
12–
< 1
3 73
39
6871
14
.7
14.6
16
.0
16.2
17
.1
17.4
19
.5
20.2
23
.5
23.9
25
.8
26.4
30
.1
30.8
13–
< 1
4 60
16
5243
15
.0
15.3
16
.3
17.1
17
.3
18.2
19
.7
20.8
23
.5
24.6
26
.1
27.3
31
.2
32.3
14–
< 1
5 19
09
1844
15
.0
16.2
16
.4
17.8
17
.3
19.0
19
.6
21.5
23
.7
25.3
26
.7
27.9
31
.8
31.6
n =
tota
l num
ber
of p
artic
ipan
ts.

Eastern Mediterranean Health Journal, Vol. 14, No. 2, 2008 337
املجلة الصحية لشرق املتوسط، منظمة الصحة العاملية، املجلد الرابع عشر، العدد ٢، ٢٠٠٨
Figure 1 Body mass index percentiles of Kuwaiti children aged 10–14 years
Figure 2 Body mass index percentiles of Kuwaiti male children aged 10–14 years: comparison with their American counterparts (United States National Center for Health Statistics population reference data) [11]

338 La Revue de Santé de la Méditerranée orientale, Vol. 14, No 2, 2008
املجلة الصحية لشرق املتوسط، منظمة الصحة العاملية، املجلد الرابع عشر، العدد ٢، ٢٠٠٨
Figure 3 Body mass index percentiles of Kuwaiti female children aged 10–14 years: comparison with their American counterparts (United States National Center for Health Statistics population reference data) [11]
Figure 4 Body mass index percentiles of male children aged 10–14 years: comparison of Kuwaiti children with American [11], Saudi Arabian [13] and Iranian [14] children

Eastern Mediterranean Health Journal, Vol. 14, No. 2, 2008 339
املجلة الصحية لشرق املتوسط، منظمة الصحة العاملية، املجلد الرابع عشر، العدد ٢، ٢٠٠٨
ently higher than the Americans and the BMI gap widened at higher ages. The BMI of Saudi Arabians at this centile was lower than the Americans up to the age of 12 years. Thereafter, it increased slightly over the Americans and the gap between them widened at > 13 years. The BMI of Iranians was consistently lower than the Americans and the gap was narrower at both ends of the age range, at 10 and 14 years. At the 95th centile, the BMI of Kuwaitis surpassed all others and the widest gap was between it and the Iranians. The BMI of Saudi Ara-bians was closest to the Americans, being lower at age 11 years and higher at all others ages, especially at > 13 years of age. At ages 11 to 13 years, the BMI of Saudi Arabians was consistently higher than the Americans (Figure 5).
Discussion
Our data for BMI shows that, on average, Kuwaiti children were heavier and shorter than their American counterparts, which may overestimate their level of obesity and also their underweight, as the Americans seem to be better nourished. These differ-ences may be attributed to genetic rather than nutritional deficiencies [15–17]. This is confirmed, with regard to nutritional status, by the Saudi Arabian and the Iranian studies, which concluded that the differ-ences between the BMI of Saudi Arabians, Iranians and Americans may be attributed to genetic rather than environmental factors [13,14]. The Iranian study further suggested that if serious malnutrition existed among Iranians in proportion to the general popu-
Figure 5 Body mass index percentiles of female children aged 10–14 years: comparison of Kuwaiti children with American [11], Saudi Arabian [13] and Iranian [14] children
Iran

340 La Revue de Santé de la Méditerranée orientale, Vol. 14, No 2, 2008
املجلة الصحية لشرق املتوسط، منظمة الصحة العاملية، املجلد الرابع عشر، العدد ٢، ٢٠٠٨
lation, then the pattern of upper centiles would follow that of the Americans and lower centiles would be much lower than anticipated. The shift in the Iranian centiles may suggest that either the Iranian diet does not promote growth as does the American or that the shift may be due to genetic dif-ferences [14]. This may be true for Kuwaitis and Saudi Arabians at the lowest centile.
Nonetheless, the shared issue is the ge-netic factor. It has been reported that the genetic influence on BMI seen in adulthood may have already been expressed at age 7 years and its influences supersedes that of environmental factors [18]. These findings suggest that the central issue for the dif-ferences between the BMI of Americans compared with the cited nationalities, in-cluding the present study, may be genetic in nature, which also suggest that the NCHS reference centiles are too high for identify-ing underweight and nutritional status in the compared nationalities.
Recently BMI standards have been rec-ommended for determining overweight and obesity among adolescents. Well-nourished adolescents could be used to develop local BMI reference standards and compare stud-ies of the same ethnicity with these stand-ards [19], but the creation of such references would be a difficult undertaking. Moreover, it is unlikely that each country needs to de-velop its own standards. As an alternative, a series of references can be developed for ethnic, national or regional groups of simi-lar genetic composition and the reference that closely matches the study population can be chosen. A measure of body shape, the Cormic index (CI)—sitting height di-vided by standing height—may be useful in this context. For example, if a study shows an average CI of 0.5, authors of a given study would use a reference set of data with a value close to the CI. However, this may make the data collection procedures more
cumbersome since it would require weight, height, BMI and CI to be measured [12]. A solution for this controversy has been provided by producing BMI cut-off points for various nationalities which are age and sex specific [7]. This method may eliminate the bias occurring from using the relatively overweight American population as the reference, as in the case of NCHS data. However, this method requires exact age values and it may not be suitable for Nilotic Africans and Australian Aborigines [12].
A major problem that faces the develop-ment of international reference standards for adolescents is that sexual development differs between populations [20]. As an illustration, comparing a study population of prepubertal adolescents with a refer-ence population of postpubertal adolescents would be invalid because the normal BMI for the 2 groups would also be different. Nutritional status, especially undernutri-tion, may play a role in the sexual develop-ment of adolescents of various populations and consequently growth spurts [20–22]. Early maturing adolescents of the same age face a greater increase in weight than their late maturing counterparts and this increase in weight has long-term effects [23]. Anthropometric values of adolescents vary noticeably between countries and so does maturation status. It has been recom-mended that the BMI of adolescents should be interpreted based on sex, age and matura-tion [6]. The unadjusted prevalence used chronological age-matched BMI cut-offs, while the adjusted prevalence made certain adjustments, such as population adjustment (for an individual’s nutritional status), thus taking into consideration maturational dif-ferences between populations [8].
To solve part of this problem, BMI data collection should be carried out during the age at which certain maturational landmarks occur, such as the age of menarche among

Eastern Mediterranean Health Journal, Vol. 14, No. 2, 2008 341
املجلة الصحية لشرق املتوسط، منظمة الصحة العاملية، املجلد الرابع عشر، العدد ٢، ٢٠٠٨
girls. Equivalent markers of sexual develop-ment for boys have not been established. One possibility might be self-assessment of genital stage development, for example using illustrations of various stages of de-velopment and comparing them with physi-cal examination findings. Axillary hair, for example, could be considered as a marker of sexual development. This method, however, has not been fully validated [4,22,24–29] and in addition these developmental stages may be difficult to apply in the Gulf region due to cultural taboos.
Nevertheless, in less developed coun-tries, BMI should be further explored in adolescents. This may require longitudinal studies to ascertain whether adolescents falling below certain cut-off points for BMI have raised levels of morbidity and mortal-ity. However, it was felt from the overall, average-based analysis that any changes in slopes in the smoothed curves could most plausibly be explained only by pubertal changes. The use of BMI, therefore, should be continued until other indices of adipos-ity have been thoroughly explored. It is
well known that BMI is age-dependent. The use of American NCHS references for adolescents should be discouraged. Instead, multinational references should be encour-aged such as described recently in a pooled analysis of 6 large, nationally representative, cross-sectional growth studies (in Brazil, Great Britain, Hong Kong, the Netherlands,
Singapore and the United States of America) [7]. These may as yet be the best references currently available, especially for develop-ing countries. However, for populations composed predominantly of ethnic groups not included in the multinational reference population, the appropriateness of the refer-ence data should be carefully evaluated before utilizing it [12,30,31].
While we do not necessarily recommend that our study findings be applied to the population of Saudi Arabia or the Islamic Republic of Iran, we suggest, as others have, that the use of the American reference standards may not be entirely valid for as-certaining the degree of adiposity in Kuwait or elsewhere in the Eastern Mediterranean Region.
References
1. Use and interpretation of anthropometric indicators of nutritional status. Report of a WHO working group. Bulletin of the World Health Organization, 1986, 64:929–41.
2. The management of nutrition in major emergencies, 2nd ed. Geneva, World Health Organization, 2000:236.
3. Riley AP. Dynamic and static measures of growth among pre- and post-menarcheal females in rural Bangladesh. American journal of human biology, 1990, 2:255–64.
4. Riley AP, Huffman SL, Chowdhury AK. Age at menarche and postmenarcheal growth in rural Bangladeshi females. An-nals of human biology, 1989, 16:347–59.
5. Must A, Dallal GE, Dietz WH. Reference data for obesity: 85th and 95th percentiles of body mass index (wt/ht2) and triceps skinfold thickness. American journal of clinical nutrition, 1991, 53:839–46.
6. Physical status: the use and interpreta-tion of anthropometry. Report of a WHO Expert Committee. Geneva, World Health Organization, 1995:263–311, 445 (WHO Technical Report Series No. 854).
7. Cole TJ et al. Establishing a standard definition for child overweight and obesity worldwide: international survey. British medical journal, 2000, 320:1240–3.
8. Wang Y, Adair L. How does maturity ad-justment influence the estimates of over-

342 La Revue de Santé de la Méditerranée orientale, Vol. 14, No 2, 2008
املجلة الصحية لشرق املتوسط، منظمة الصحة العاملية، املجلد الرابع عشر، العدد ٢، ٢٠٠٨
weight prevalence in adolescents from different countries using an international reference? International journal of obes-ity, 2001, 25:550–8.
9. Guilluame M. Defining obesity in child-hood: current practice. American journal of clinical nutrition, 1999, 70:126S–30S.
10. Power C, Lake JK, Cole TJ. Measurement and long-term health risks of child and adolescent fatness. International journal of obesity and related metabolic disor-ders, 1997, 21:507–26.
11. Hammer LD et al. Standardized percen-tiles curves of body-mass index for chil-dren and adolescents. American journal of diseases of children, 1991, 145:259–63.
12. Woodruff BA, Duffield A. Anthropomet-ric assessment of nutritional status in adolescent populations in humanitarian emergencies. European journal of clinical nutrition, 2002, 56:1108–18.
13. Magbool GM. Body mass index of Saudi children ages six to 16 years from the Eastern Province. Annals of Saudi medi-cine, 1994, 14:495–8.
14. Hosseini M et al. Standardized percentile curves of body mass index of Iranian children compared to the US population reference. International journal of obesity, 1999, 23:783–6.
15. Al-Isa AN, Moussa MAA. Obesity among Kuwaiti preschool children aged 0–5 years: prevalence and comparison with the NCHS/CDC reference population. Nutrition and health, 1998, 12:235–46.
16. Al-Isa AN, Moussa MAA. Nutritional sta-tus of Kuwaiti elementary school children aged 6–10 years: comparison with the NCHS/CDC reference population. Inter-national journal of food science and nutri-tion, 2000, 51:221–8.
17. Al-Sekait MA, Al-Nasser AM, Bamgboye EA. The growth pattern of school children
in Saudi Arabia. Saudi medical journal, 1992, 13:141–6.
18. Sorensen TI, Holst C, Stunkard AJ. Child-hood body mass index—genetic and fa-milial environmental influences assessed in a longitudinal adoption study. Interna-tional journal of obesity, 1992, 16:705–14.
19. Chamruengsri K et al. Nutritional status of low socioeconomic school children at Srakaew Temple, Ang Thong. Journal of the Medical Association of Thailand, 1991, 74:24–9.
20. Eveleth PB, Tanner JM. Worldwide vari-ations in human growth, 2nd ed. Cam-bridge, Cambridge University Press, 1990.
21. Ahmed F et al. Dietary patterns, nutrient intake and growth of adolescent school girls in urban Bangladesh. Public health nutrition, 1998, 1:83–92.
22. Delgado HL, Hurtado E. Crecimiento fisico y menarquia en adolescentes de Guatemala [Physical growth and me-narche in Guatemalan adolescents]. Archivos latinoamericanos de nutricion, 1990, 40:503–17.
23. van Lenthe FJ, Kemper CG, van Meche-len W. Rapid maturation in adolescence results in greater obesity in adulthood: the Amsterdam Growth and Health Study. American journal of clinical nutrition, 1996, 64:18–24.
24. Brabin I et al. How do they grow? A study of south-eastern Nigerian adolescent girls. Acta paediatrica, 1997, 86:1114–20.
25. Chaturvedi S et al. Nutritional status of married adolescent girls in rural Raja-sthan. Indian journal of pediatrics, 1994, 61:695–701.
26. Leung SS et al. Secular changes in standing height, sitting height and sexual maturation of Chinese—the Hong Kong
Eastern Mediterranean Health Journal, Vol. 14, No. 2, 2008 343
املجلة الصحية لشرق املتوسط، منظمة الصحة العاملية، املجلد الرابع عشر، العدد ٢، ٢٠٠٨
Growth Study, 1993. Annals of human biology, 1996, 24:521–32.
27. Samsudin. The age of menarche as relat-ed to physical growth of junior high school girls in Jakarta. Paediatrica indonesiana, 1990, 30:254–60.
28. Simondon KB, Simon I, Simondon F. Nutritional status and age at menarche of Senegalese adolescents. Annals of hu-man biology, 1997, 24:521–32.
29. Hardoff D, Tamir A. Self-assessment of pubertal maturation in socially dis-advantaged learning-disabled adoles-
cents. Journal of adolescent health, 1993, 14:398–400.
30. Al-Sendi AM, Shetty P, Musaiger AO. Prevalence of overweight and obesity among Bahraini adolescents: a compari-son between three different sets of crite-ria. European journal of clinical nutrition, 2003, 53:471–4.
31. Deurenberg-Yap M, Deurenberg P. Is a re-evaluation of WHO body mass in-dex cut-off values needed? The case of Asians in Singapore. Nutrition reviews, 2003, 61(5 Pt. 2):S80–7.
Obesity and overweightWorld Health Organization projections indicate that globally in 2005, approximately 1.6 billion adults (over 15 years) were overweight and at least 400 million were obese. It is further projected that by 2015, approximately 2.3 billion adults will be overweight and more than 700 million obese.Once considered a problem only in high-income countries, overweight and obesity are now dramatically on the rise in low- and middle-income countries, particularly in urban settings. Many of these countries are now facing a “double burden” of disease: while they continue to deal with the problems of infectious disease and under-nutrition, they are experiencing a rapid upsurge in chronic disease risk factors such as obesity and overweight. It is, moreover, not uncommon to find under-nutrition and obesity existing side-by-side within the same country, the same community and even the same household.
Source: WHO Fact sheet No. 311 (http://www.who.int/mediacentre/factsheets/fs311/en/index.html.)

344 La Revue de Santé de la Méditerranée orientale, Vol. 14, No 2, 2008
املجلة الصحية لشرق املتوسط، منظمة الصحة العاملية، املجلد الرابع عشر، العدد ٢، ٢٠٠٨
Self-reported knowledge and pattern of physical activity among school students in Al Khobar, Saudi ArabiaA.Z.A. Taha1
1Department of Family and Community Medicine, College of Medicine, King Faisal University, Dammam, Saudi Arabia (Correspondence to A.Z.A. Taha: [email protected]).Received: 13/07/05; accepted: 23/01/06
ABSTRACT The aim of this cross-sectional study was to determine the self-reported knowledge and pattern of physical activity among a sample of 1240 male and 1331 female intermediate and secondary school students in Al-Khobar city, Saudi Arabia. The majority of male and female students knew that physical activity is protective against diseases in general (92.9% and 91.8% respectively) and in the prevention of obesity (69.4% and 78.5%) but had poor knowledge about the role of physical activity in the prevention of diabetes mellitus and hypertension. Significantly more male students than female students practised physical activity 3+ times per week (45.6% versus 33.7%). Age and the knowledge that exercise protects from obesity were the main determinants of the practice of physical activity among male students.
Connaissances déclarées et habitudes en matière d’exercice physique chez les écoliers d’Al Khobar (Arabie saoudite)RÉSUMÉ Cette étude transversale avait pour objectif de déterminer les connaissances et les habitudes en matière d’exercice physique d’un échantillon de 1240 garçons et 1331 filles fréquentant des établissements scolaires de niveau intermédiaire et secondaire à Al Khobar (Arabie saoudite). La majorité de ces garçons et filles savaient que l’exercice physique a une action protectrice contre les maladies en général (92,9 % et 91,8 % respectivement) et une action préventive contre l’obésité (69,4 % et 78,5 %), mais connaissaient mal le rôle de cette activité dans la prévention du diabète sucré et de l’hypertension. Les garçons qui pratiquaient une activité physique au moins trois fois par semaine étaient beaucoup plus nombreux que les filles (45,6 % contre 33,7 %). L’âge et la connaissance du rôle protecteur de l’exercice physique contre l’obésité étaient les principaux déterminants de la pratique de cette activité parmi les écoliers.
p g p p y y g
12401331
92.991.869.478.5
45.6
33.7

Eastern Mediterranean Health Journal, Vol. 14, No. 2, 2008 345
املجلة الصحية لشرق املتوسط، منظمة الصحة العاملية، املجلد الرابع عشر، العدد ٢، ٢٠٠٨
Introduction
Several studies have shown that regular ex-ercise and physical activity reduces the risk of coronary heart disease (CHD) [1–5] and has benefits in reducing morbidity and mor-tality from several chronic diseases in adults [2,6]. The relative risk for CHD associated with physical inactivity is approximately 1.9, slightly lower than the relative risks associated with increased systolic blood pressure (2.1), cigarette smoking (2.5) and elevated serum cholesterol levels (2.4) [5,7]. Scientific evidence also shows an as-sociation between regular physical exercise and the lowering of several other risk fac-tors for cardiovascular disease, including blood lipid levels, resting blood pressure among persons with borderline hyperten-sion, overweight, and glucose tolerance and insulin sensitivity [8–10].
Observations and current studies in-dicate that today’s children are probably less fit than children decades ago [11–13]. Children tend to be more overweight and sedentary than before. A study in the United States of America (USA) of male and female adolescents aged 10–16 years examined the effects of physical activity, television view-ing, videogame playing, socioeconomic status and ethnicity on body mass index (BMI) [14]. The study showed that the weight of male adolescents appeared to be more related to exercise habits than to television or videogame habits. Increased participation in high-intensity exercise ap-peared to be important. A cohort study of 9 to 14-year-old girls and boys in the USA showed that for both boys and girls, the increase in BMI over 1 year was larger in those who reported spending more time on television/videos/games during the year, and in those who reported increased caloric intakes over 1 year [13]. Larger year-to-year increases in BMI were also seen among
girls who reported higher caloric intakes and less physical activity during the year between the 2 BMI measurements. We observed a similar pattern in Saudi Arabia from research projects conducted by medi-cal students during their field courses in different parts of the country.
A survey of the associations between physical activity and other health behav-iours in a sample of USA high-school stu-dents showed that low physical activity was associated with several other negative health behaviours in teenagers, such as cigarette smoking, marijuana use, lower fruit and vegetable consumption, greater television watching, and failure to wear a seat belt in cars [15].
In Saudi Arabia, sport is usually in-cluded in the school curriculum for boys’ schools at all levels (primary, intermediate and secondary). However, there are no sport classes in girls’ schools. Girls and women in Saudi Arabia practice physical exercise in private women centres and in playgrounds. Al Refaee and Al-Hazza, in their study of 1333 Saudi males aged 19 years and older in Riyadh, Saudi Arabia, showed that over 53% were totally physically inactive and another 27.5% were irregularly active. Only 19% of the entire sample were active on a regular basis [16].
The aim of the present study was to determine self-reported patterns of physical activity, and knowledge about the benefits of physical activity, among male and female school students in Al-Khobar city, Saudi Arabia.
Methods
SampleThis was a cross-sectional study conducted in the Al-Khobar area of Eastern Province of Saudi Arabia in 2001–02. Al-Khobar is

346 La Revue de Santé de la Méditerranée orientale, Vol. 14, No 2, 2008
املجلة الصحية لشرق املتوسط، منظمة الصحة العاملية، املجلد الرابع عشر، العدد ٢، ٢٠٠٨
the second largest modern city after Dam-mam, the capital of the Eastern Province of Saudi Arabia, with an estimated popula-tion of 150 000 [17]. There are 14 govern-ment and 12 private intermediate schools and 8 government and 4 private secondary schools for boys. Regarding girls, there are 16 government and 11 private intermediate schools, and 10 government and 8 private secondary schools. The target population consisted of 3rd grade intermediate and all 3 grades of secondary school male and female students (both Saudis and non-Saudis) in the Al-Khobar area. The size of this target population was 13 868 students, comprising 5870 males and 7998 females.
It was decided to take a random sam-ple of 25% of schools in the Al-Khobar area, taking into consideration the resources available for the field survey (in terms of manpower, time and money). A multistage stratified self-weighting sampling design was adopted. Each school was divided into government and private, and further clas-sification was made on the basis of interme-diate and secondary level. At the 1st stage, a systematic random sampling procedure (with probability proportional to size) was used to select 9 schools for boys (5 govern-ment and 4 private) out of 38 schools, and 13 schools for girls (8 government and 5 private) out of 45 schools. At the 2nd stage the classes were selected at each level using a simple random sampling design. All stu-dents in the selected classes were included in the study. The total number of selected students was 2571, comprising 1240 males and 1331 females.
Data collectionTwo sets of self-administered question-naires were used: one for male and the other for female students. The questionnaires were designed by the author and other ex-perts after reviewing the literature. The 2
questionnaires were similar except that questions on drug abuse and use of seatbelts when driving were not included in the fe-male questionnaires. The questionnaire was part of a comprehensive questionnaire on lifestyle, knowledge and self-reported be-haviours among school students and teach-ers in Al-Khobar schools. The questionnaire contained questions on demographic data, knowledge about the benefits of physical activity and details of their own practice of physical exercise (frequency, duration). Other questions included knowledge about healthy foods, obesity, diabetes mellitus, hypertension, smoking and drug abuse.
The data collection was made under standardized conditions (i.e. written proto-col and guidelines for measuring weight and height) by 3 male physicians for male stu-dents and by 3 females (1 pharmacist and 2 female nurses) for female schools. Physical activity was defined as any bodily move-ment produced by skeletal muscles that resulted in energy expenditure above the basal level [18]. Effective physical activity was defined as regular exercise 3 or more times per week for at least 20 minutes per session [19]. Data on physical activity was collected by self-reported questionnaire. Heights and weights were measured for each student barefoot wearing light clothes. A digital weighing scale (SECA 708) with a height measuring rod attached to the scale was used. BMI was estimated as weight (kg)/height2 (m2) [20].
A pilot study was conducted in a male and female school to test the question-naires and organizational procedures. The fieldwork took about 8 weeks. The students answered the questions themselves under the supervision of the field workers. Those who were absent or on vacation were noted and interviewed during subsequent days of fieldwork (8 weeks). A response rate of 100% was obtained. The response rate for

Eastern Mediterranean Health Journal, Vol. 14, No. 2, 2008 347
املجلة الصحية لشرق املتوسط، منظمة الصحة العاملية، املجلد الرابع عشر، العدد ٢، ٢٠٠٨
specific questions ranged between 84.1% and 100.0% for boys and 89.6% and 100.0% for girls.
Data analysisSPSS-PC, version 10 computer software was used for data analysis. The difference between the 2 proportions was tested using the chi-squared test to detect any significant difference between male and female stu-dents. Logistic regression analysis was used to determine associations between different variables while controlling for confounding variables. A test–retest method was used to check for reliability. Reliability was cal-culated for each question concerned with self-reported knowledge and behaviour. The kappa statistic ranged from 0.4 to 0.7. This was considered as fair to good reli-ability [21].
The independent variables entered into the logistic regression model were: type of school (government/private; intermedi-ate/secondary), age, nationality, father’s and mother’s education, weight, height, BMI, knowledge of healthy fats in food, knowledge of benefits of fibre-rich diets, knowledge of dangers of drug abuse, knowl-edge of complications of diabetes mellitus, knowledge of complications of high blood pressure, knowledge of complications of obesity, knowledge that exercise protects from disease, knowledge that exercise pro-tects from heart disease, knowledge that exercise protects from obesity, knowledge of toxic substances in cigarettes, knowledge of dangers of passive smoking and current cigarette smoking habit.
Results
The mean [standard deviation (SD)] age of all students was 16.3 (1.7) years: 16.5 (SD 1.8) for male students with age rang-ing from 12 to 23 years, and 16.1 (SD 1.7)
for females with age ranging from 13 to 26 years. Table 1 shows the demographic characteristics of school students. About three-quarters of the selected schools were government schools. Secondary-school stu-dents formed the majority for both sexes. The majority of students were of Saudi Arabian nationality. There were statistically significant differences between male and female students with respect to both father’s and mother’s education.
The majority of the students of both sexes knew that exercise in general protects from certain diseases (92.9% and 91.8% for male and female student respectively) and can prevent obesity (69.4% and 78.5%) (Table 2). Fewer students of both sexes knew about the beneficial effects of physical activity in the prevention of heart disease, hyperten-sion, diabetes mellitus or psychological stress. Male students had significantly bet-ter knowledge about the benefits of physical activity in preventing hypertension, diabetes mellitus and smoking than female students. However, female students had significantly better knowledge about the role of physi-cal activity in preventing obesity (78.5% versus 69.4%). The striking result was the poor knowledge of both male and female students about the role of physical activity in the prevention of diabetes mellitus and hypertension, which are common health problems in Saudi Arabia.
A significantly higher proportion of male students reported that they practised physical activity than did female students (91.0% versus 81.8% respectively) (Table 3). Significantly more male students prac-tised exercise 3 or more times per week and for more than 0.5 hour per session than did female students (P < 0.001). The main types of exercise habits of male students were football (69.8%), swimming (39.6%) and walking (32.7%) (Table 4). Female students mainly practised walking (60.3%),
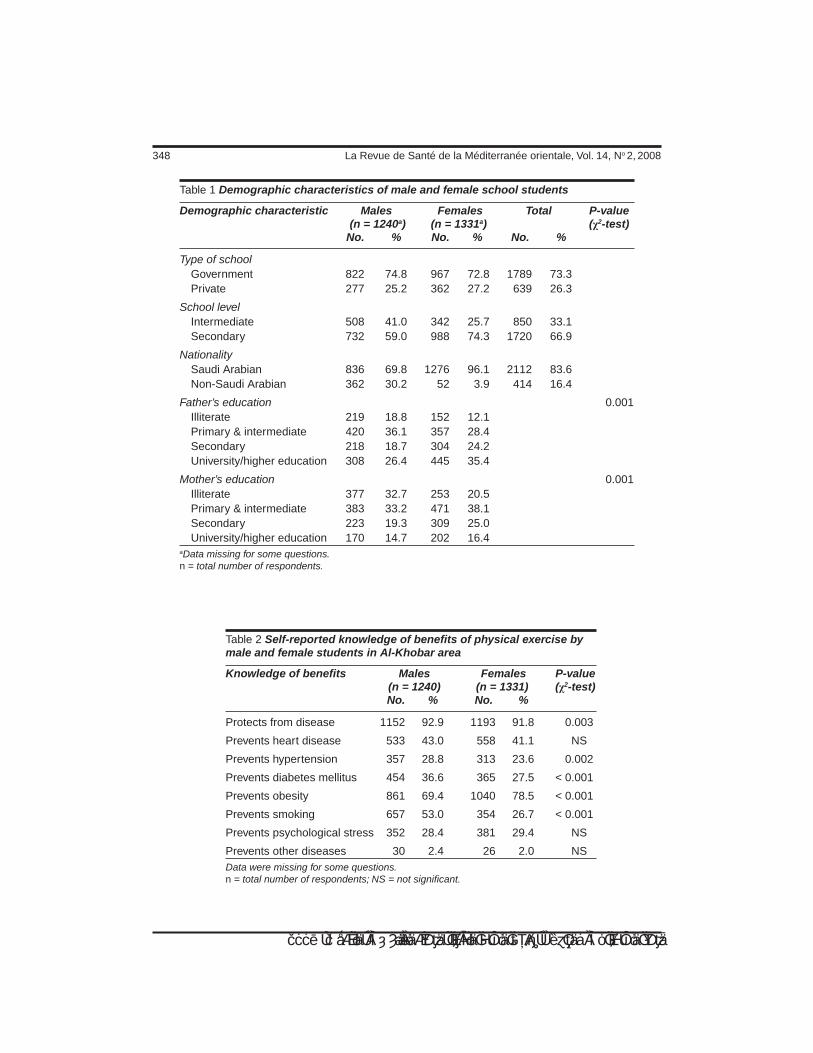
348 La Revue de Santé de la Méditerranée orientale, Vol. 14, No 2, 2008
املجلة الصحية لشرق املتوسط، منظمة الصحة العاملية، املجلد الرابع عشر، العدد ٢، ٢٠٠٨
Table 1 Demographic characteristics of male and female school students
Demographic characteristic Males Females Total P-value (n = 1240a) (n = 1331a) (χ2-test) No. % No. % No. %
Type of school Government 822 74.8 967 72.8 1789 73.3 Private 277 25.2 362 27.2 639 26.3
School level Intermediate 508 41.0 342 25.7 850 33.1 Secondary 732 59.0 988 74.3 1720 66.9
Nationality Saudi Arabian 836 69.8 1276 96.1 2112 83.6 Non-Saudi Arabian 362 30.2 52 3.9 414 16.4
Father’s education 0.001 Illiterate 219 18.8 152 12.1 Primary & intermediate 420 36.1 357 28.4 Secondary 218 18.7 304 24.2 University/higher education 308 26.4 445 35.4
Mother’s education 0.001 Illiterate 377 32.7 253 20.5 Primary & intermediate 383 33.2 471 38.1 Secondary 223 19.3 309 25.0 University/higher education 170 14.7 202 16.4 aData missing for some questions. n = total number of respondents.
Table 2 Self-reported knowledge of benefits of physical exercise by male and female students in Al-Khobar area
Knowledge of benefits Males Females P-value (n = 1240) (n = 1331) (χ2-test) No. % No. %
Protects from disease 1152 92.9 1193 91.8 0.003
Prevents heart disease 533 43.0 558 41.1 NS
Prevents hypertension 357 28.8 313 23.6 0.002
Prevents diabetes mellitus 454 36.6 365 27.5 < 0.001
Prevents obesity 861 69.4 1040 78.5 < 0.001
Prevents smoking 657 53.0 354 26.7 < 0.001
Prevents psychological stress 352 28.4 381 29.4 NS
Prevents other diseases 30 2.4 26 2.0 NSData were missing for some questions. n = total number of respondents; NS = not significant.
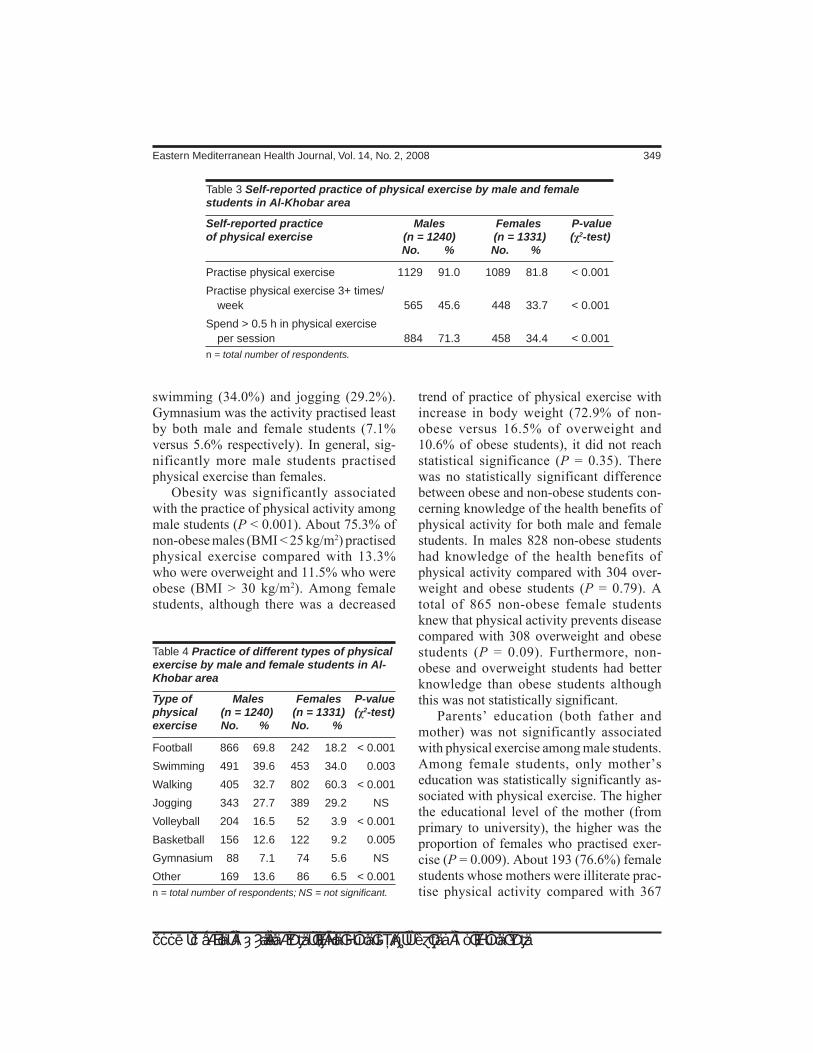
Eastern Mediterranean Health Journal, Vol. 14, No. 2, 2008 349
املجلة الصحية لشرق املتوسط، منظمة الصحة العاملية، املجلد الرابع عشر، العدد ٢، ٢٠٠٨
swimming (34.0%) and jogging (29.2%). Gymnasium was the activity practised least by both male and female students (7.1% versus 5.6% respectively). In general, sig-nificantly more male students practised physical exercise than females.
Obesity was significantly associated with the practice of physical activity among male students (P < 0.001). About 75.3% of non-obese males (BMI < 25 kg/m2) practised physical exercise compared with 13.3% who were overweight and 11.5% who were obese (BMI > 30 kg/m2). Among female students, although there was a decreased
trend of practice of physical exercise with increase in body weight (72.9% of non-obese versus 16.5% of overweight and 10.6% of obese students), it did not reach statistical significance (P = 0.35). There was no statistically significant difference between obese and non-obese students con-cerning knowledge of the health benefits of physical activity for both male and female students. In males 828 non-obese students had knowledge of the health benefits of physical activity compared with 304 over-weight and obese students (P = 0.79). A total of 865 non-obese female students knew that physical activity prevents disease compared with 308 overweight and obese students (P = 0.09). Furthermore, non-obese and overweight students had better knowledge than obese students although this was not statistically significant.
Parents’ education (both father and mother) was not significantly associated with physical exercise among male students. Among female students, only mother’s education was statistically significantly as-sociated with physical exercise. The higher the educational level of the mother (from primary to university), the higher was the proportion of females who practised exer-cise (P = 0.009). About 193 (76.6%) female students whose mothers were illiterate prac-tise physical activity compared with 367
Table 3 Self-reported practice of physical exercise by male and female students in Al-Khobar area
Self-reported practice Males Females P-valueof physical exercise (n = 1240) (n = 1331) (χ2-test) No. % No. %
Practise physical exercise 1129 91.0 1089 81.8 < 0.001
Practise physical exercise 3+ times/ week 565 45.6 448 33.7 < 0.001
Spend > 0.5 h in physical exercise per session 884 71.3 458 34.4 < 0.001n = total number of respondents.
Table 4 Practice of different types of physical exercise by male and female students in Al-Khobar area
Type of Males Females P-valuephysical (n = 1240) (n = 1331) (χ2-test)exercise No. % No. %
Football 866 69.8 242 18.2 < 0.001
Swimming 491 39.6 453 34.0 0.003
Walking 405 32.7 802 60.3 < 0.001
Jogging 343 27.7 389 29.2 NS
Volleyball 204 16.5 52 3.9 < 0.001
Basketball 156 12.6 122 9.2 0.005
Gymnasium 88 7.1 74 5.6 NS
Other 169 13.6 86 6.5 < 0.001n = total number of respondents; NS = not significant.
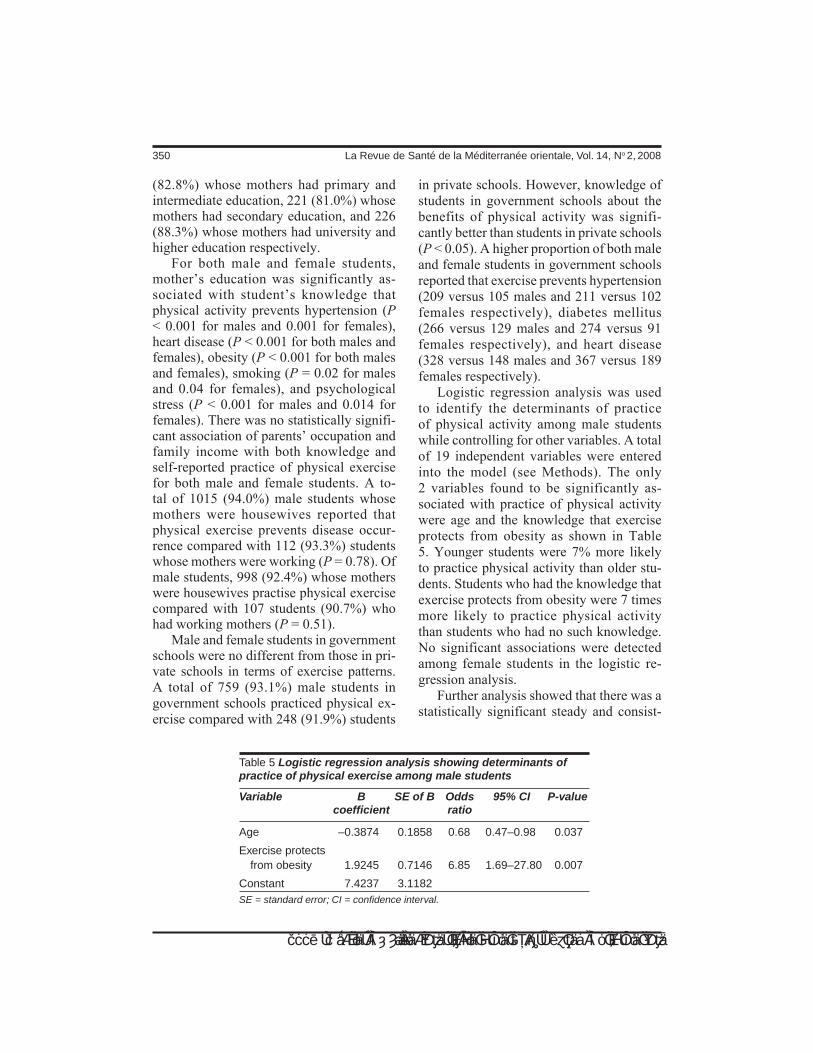
350 La Revue de Santé de la Méditerranée orientale, Vol. 14, No 2, 2008
املجلة الصحية لشرق املتوسط، منظمة الصحة العاملية، املجلد الرابع عشر، العدد ٢، ٢٠٠٨
(82.8%) whose mothers had primary and intermediate education, 221 (81.0%) whose mothers had secondary education, and 226 (88.3%) whose mothers had university and higher education respectively.
For both male and female students, mother’s education was significantly as-sociated with student’s knowledge that physical activity prevents hypertension (P < 0.001 for males and 0.001 for females), heart disease (P < 0.001 for both males and females), obesity (P < 0.001 for both males and females), smoking (P = 0.02 for males and 0.04 for females), and psychological stress (P < 0.001 for males and 0.014 for females). There was no statistically signifi-cant association of parents’ occupation and family income with both knowledge and self-reported practice of physical exercise for both male and female students. A to-tal of 1015 (94.0%) male students whose mothers were housewives reported that physical exercise prevents disease occur-rence compared with 112 (93.3%) students whose mothers were working (P = 0.78). Of male students, 998 (92.4%) whose mothers were housewives practise physical exercise compared with 107 students (90.7%) who had working mothers (P = 0.51).
Male and female students in government schools were no different from those in pri-vate schools in terms of exercise patterns. A total of 759 (93.1%) male students in government schools practiced physical ex-ercise compared with 248 (91.9%) students
in private schools. However, knowledge of students in government schools about the benefits of physical activity was signifi-cantly better than students in private schools (P < 0.05). A higher proportion of both male and female students in government schools reported that exercise prevents hypertension (209 versus 105 males and 211 versus 102 females respectively), diabetes mellitus (266 versus 129 males and 274 versus 91 females respectively), and heart disease (328 versus 148 males and 367 versus 189 females respectively).
Logistic regression analysis was used to identify the determinants of practice of physical activity among male students while controlling for other variables. A total of 19 independent variables were entered into the model (see Methods). The only 2 variables found to be significantly as-sociated with practice of physical activity were age and the knowledge that exercise protects from obesity as shown in Table 5. Younger students were 7% more likely to practice physical activity than older stu-dents. Students who had the knowledge that exercise protects from obesity were 7 times more likely to practice physical activity than students who had no such knowledge. No significant associations were detected among female students in the logistic re-gression analysis.
Further analysis showed that there was a statistically significant steady and consist-
Table 5 Logistic regression analysis showing determinants of practice of physical exercise among male students
Variable B SE of B Odds 95% CI P-value coefficient ratio
Age –0.3874 0.1858 0.68 0.47–0.98 0.037
Exercise protects from obesity 1.9245 0.7146 6.85 1.69–27.80 0.007
Constant 7.4237 3.1182 SE = standard error; CI = confidence interval.

Eastern Mediterranean Health Journal, Vol. 14, No. 2, 2008 351
املجلة الصحية لشرق املتوسط، منظمة الصحة العاملية، املجلد الرابع عشر، العدد ٢، ٢٠٠٨
ent decline in the level of exercise habits with age from 3rd grade intermediate all the way to 3rd grade secondary school (96.8% practised exercise at age 14 years compared with 85.1% at age 18 years for males and 89.9% practised exercise at age 14 years compared with 70.6% at age 18 years for females). This decline was also coupled with inadequate knowledge about benefits of physical activity. A non-significant (P > 0.05) lower proportion of older (ages 18–23 years) than younger (ages 12–17 years) students reported that exercise prevents smoking (180 versus 376 males and 68 versus 250 females respectively), hyperten-sion (97 versus 211 males and 55 versus 225 females respectively), diabetes mel-litus (209 versus 105 males and 211 versus 102 females respectively), heart disease (126 versus 326 males and 104 versus 409 females respectively), psychological stress (91 versus. 215 males and 61 versus 299 females respectively).
Table 6 shows sources of knowledge about health and disease as reported by male and female students. The main sources of knowledge about health and disease for both male and female students were tel-evision, magazines and daily newspapers. The primary health care centre was the lowest source of knowledge for both male and female students (17.4% and 15.7% respectively). Gender differences in sources of health knowledge were statistically sig-nificant for hospital, school and magazines which were utilized significantly more by female than male students.
Discussion
The study showed that the knowledge of the beneficial effect of physical exercise as a preventive measure against ill-health in general was high among students. This is a desirable situation that has to be maintained,
developed and improved by well-concert-ed school health education programmes. However, both male and female students’ knowledge about the beneficial effects of exercise against specific serious chronic problems, such as diabetes mellitus and hypertension, was inadequate, with female students having significantly less knowl-edge than males on several questions. This reflects their lack of orientation about these common chronic health problems which might be due to lack of health information at school or through the mass media. This result was similar to the study of Khattab et al. in a family practice centre in Abha, Saudi Arabia [22]. This showed that only 22.6% of 146 inactive males and females and 33.0% of 60 moderately active people perceived their inactivity as harmful to their health. The results were also similar to stud-ies conducted among college students in Canada, Nigeria and the USA to detect the adequacy of health knowledge necessary to live a healthy life, which showed that poor knowledge about chronic disease was one
Table 6 Sources of knowledge about health and disease as reported by male and female students in Al-Khobar area
Source of Males Females P-value knowledge (n = 1240) (n = 1331) (χ2-test) No. % No. %
Television 723 58.3 811 60.9 NS
Daily newspapers 408 32.9 458 34.4 NS
Magazines 387 31.2 519 39.0 < 0.001
School 355 28.6 432 32.5 0.035
Books 308 24.8 374 28.1 NS
Radio 292 23.5 296 22.2 NS
Hospital 291 23.5 381 28.6 0.003
Primary health care centre 216 17.4 209 15.7 NSn = total number of respondents; NS = not significant.

352 La Revue de Santé de la Méditerranée orientale, Vol. 14, No 2, 2008
املجلة الصحية لشرق املتوسط، منظمة الصحة العاملية، املجلد الرابع عشر، العدد ٢، ٢٠٠٨
of the greatest weaknesses in health knowl-edge [23–25].
The practice of physical exercise was reported by high proportions of both male and female students. This is an encouraging finding that should be fostered as a counter-balance to intense television watching by all age groups. On the other hand, the practice of physical exercise among females was less than that among male students. This finding could be partly accounted for by the inadequate knowledge of female students about the benefits of physical exercise and by the lack of physical exercise classes in female schools. Data analysed by the Centers for Disease Control and Prevention in the USA from the 1994 Behavioral Risk Factor Surveillance System showed that in every state surveyed, most adults were not participating in regular physical activity [26].
The finding that the practice of physical activity was significantly lower among obese students is consistent with several studies that have shown that obese adoles-cents are less active than non-obese young people [11,12]. Al-Refaee and Al-Hazzaa in their study on Saudi males aged 19 years and older showed a higher percentage of obesity among the inactive (18%) than among the active (13%) men [16]. Our study showed a higher proportion of respondents practising physical exercise than Al-Refaee and Al-Hazzaa, who showed only 47% practicing physical exercise. This may be explained by the difference in the age of the sample. In our study the mean age of boys was 16.5 years (range 12–23 years) while in Al-Refaee and Al-Hazzaa study the mean age was 41.1 years (range 19–68). Other studies of heart rate telemetry of Saudi boys during and after school time indicated that Saudi boys spent a limited time on activities that raised the heart rate above 159 beats per minute [27,28]. The study showed that lev-
els of both moderate and vigorous physical activities among Saudi boys were consider-ably lower than those levels reported from other countries [29–31].
The influence of mother’s education on student’s knowledge of the benefits of physical activity was an interesting find-ing. A possible explanation might be that educated mothers are more conscious and concerned about the health of their children and convey this message to them. Further enquiry is needed to explore this point for future intervention strategies to promote physical activity. Students in government schools were more knowledgeable about the benefits of physical activity than those in private schools. Although three-quarter of students were from government schools, no explanation could be given for this dif-ference. The curriculum of the schools, the teachers’ roles and health education opportunities might have played a role in this aspect.
Possible reasons for younger students practising physical exercise more than older students are that older students might be spending more of their time using the In-ternet, watching television or playing video games. Another reason might be due to the high prevalence of obesity among older students. This study showed a significant association between knowledge that exer-cise protects from obesity and the practice of physical exercise. A similar study in the USA found a significant relation between physical activity and eating healthy foods [32].
A limitation of the study is that some students might have over-reported their practice of physical exercise and their knowledge of healthy behaviours. In ad-dition, psychosocial factors and students’ beliefs, which were shown by some studies to be important determinants of physical exercise [33,34], were not explored.

Eastern Mediterranean Health Journal, Vol. 14, No. 2, 2008 353
املجلة الصحية لشرق املتوسط، منظمة الصحة العاملية، املجلد الرابع عشر، العدد ٢، ٢٠٠٨
Conclusions and recommendations
Both male and female students had good knowledge about the benefits of physical activity. However, they had poor knowl-edge about the role of physical activity in the prevention of diabetes mellitus and hypertension. Health education should con-centrate on clarifying these areas. Age and the knowledge that exercise protects from obesity were the main determinants of the practice of physical activity among male students. These findings support the need for health promotion programmes that in-crease the number of physically active stu-dents.
Positive long-term lifestyle changes, including physical exercise, need to be established early in life, because cardiovas-cular risk factors, including obesity, tend to track from childhood to adulthood [2,8,35].
Programmes to increase regular physical activity should be established. Such pro-grammes should include health education, increase supervised physical education and physical exercise sessions, competition and prizes, and active involvement of teachers. More intervention efforts need to be di-rected towards female students in particular, as their knowledge and practice of physical activity were inadequate. Extracurricular physical activity programmes that address the needs and interests of all students should be provided by school authorities.
Acknowledgements
The author extends great thanks and appre-ciation to King AbdulAziz City for Science and Technology for their support to conduct this study and to all school administrators, and students.
References
1. Haapanen N et al. Association of lei-sure time physical activity with the risk of heart disease, hypertension and diabetes in middle-aged men and women. Inter-national journal of epidemiology, 1997, 26:739–47.
2. Paffenbarger RS, Wing AL, Hyde R. Phys-ical activity as an index of heart attack risk in college alumni. American journal of epidemiology, 1978, 108:161–75.
3. Oberman A. Exercise and the primary prevention of cardiovascular disease. American journal of cardiology, 1985, 55:10D–20D.
4. Paffenbarger RS Jr, Hyde RT. Exercise in the prevention of coronary heart disease. Preventive medicine, 1984, 13:3–22.
5. Berlin JA, Colditz GA. A meta-analysis of physical activity in the prevention of coronary heart disease. American journal of epidemiology, 1990, 132:612–28.
6. May GS et al. Secondary prevention after myocardial infarction: a review of long term trials. Progress in cardiovascular diseases, 1982, 24:331–52.
7. Pooling Project Research Group. Rela-tionship of blood pressure, serum choles-terol, smoking habit, relative weight and ECG abnormalities to incidence of major coronary events: final report of the Pool-ing Project. Journal of chronic diseases, 1978, 31:202–306.
8. Physical activity and health: a report of the Surgeon General. Atlanta, Gerogia, Department of Health and Human Serv-ices, National Center for Chronic Disease Prevention and Health Promotion, Presi-dent’s Council on Physical Fitness and Sports, 1996.
9. Burchfiel CM, Sharp DS, Curb JD. Physi-cal activity and incidence of diabetes: the
354 La Revue de Santé de la Méditerranée orientale, Vol. 14, No 2, 2008
املجلة الصحية لشرق املتوسط، منظمة الصحة العاملية، املجلد الرابع عشر، العدد ٢، ٢٠٠٨
Honolulu Heart Program. American jour-nal of epidemiology, 1995, 141:360–8.
10. Perry IJ, Wannamethee SG, Walker MK. Prospective study of risk factors for de-velopment of non-insulin dependent dia-betes in middle-aged British men. British medical journal, 1995, 310:560–4.
11. Proimos J, Sawyer S. Obesity in child-hood and adolescence. Australian family physician, 2000, 29(4):321–6.
12. Klesges RC, Shelton ML, Klesges LM. Effects of television on metabolic rate: potential implications for childhood obes-ity. Pediatrics, 1993, 91:281–6.
13. Berkey CS et al. Activity, dietary intake, and weight changes in a longitudinal study of preadolescent and adolescent boys and girls. Pediatrics, 2000, 105:E56.
14. McMurray RG et al. The influence of physical activity, socioeconomic status, and ethnicity on the weight status of adolescents. Obesity research, 2000, 8(2):130–9.
15. Pate RR et al. Associations between physical activity and other health behav-iors in a representative sample of US adolescents. American journal of public health, 1996, 86:1577–81.
16. Al-Refaee SA, Al-Hazzaa HM. Physical activity profile of adult males in Riya-dh City. Saudi medical journal, 2001, 22(9):784–9.
17. Abdul Aziz A, Banerji S. Welcome to East-ern Province, Saudi Arabia. Al Khobar, Saudi Arabia, Atariki Press (for Informa-tion Window Agency), 1993.
18. Caspersen C, Powell K, Christensen G. Physical activity, exercise, and physi-cal fitness: definition and distinctions for health-related research. Public health reports, 1985, 100:126–31.
19. LaPorte RE, Montoye HJ, Caspersen CJ. Assessment of physical activity in
epidemiologic research: problems and prospects. Public health reports, 1985, 100:131–46.
20. Macleod J, Edwards C, Bouchier I, eds. Davidson’s principles and practice of medicine, 15th ed. Hong Kong, Churchill Livingstone, 1987.
21. Fleiss JL. Statistical methods for rates and proportions, 2nd ed. New York, John Wiley & Sons, 1981.
22. Khattab MS et al. Risk factors of coronary heart disease: attitude and behaviour in family practice in Saudi Arabia. East-ern Mediterranean health journal, 1999, 5:35–45.
23. Schuster C et al. A multinational compari-son of health knowledge: college students in Canada, Nigeria, and the United States. College student journal, 1999, 33:8.
24. Nicholson T et al. The Health Knowledge Inventory-Alpha: a personal health knowl-edge test for high school seniors. Journal of school health, 1991, 61(4):430–2.
25. Smith BA et al. Health knowledge of predominantly Mexican American high school students. Journal of health educa-tion, 1998, 29(1):21–5.
26. State-specific prevalence of participa-tion in physical activity—Behavioral Risk Factor Surveillance System, 1994. Mor-bidity and mortality weekly report, 1996, 45(31):673–5.
27. Al-Hazzaa H, Sulaiman M. Maximal oxy-gen uptake and daily physical activity in 7 to 12-year-old boys. Pediatric exercise science, 1993, 5:357–66.
28. Al-Hazzaa H et al. Cardiorespiratory fit-ness, physical activity patterns, and se-lected coronary artery disease risk factors in preadolescent boys. International jour-nal of sports medicine, 1994, 15:267–72.
29. Armstrong N, Bray S. Physical activity patterns defined by continuous heart rate

Eastern Mediterranean Health Journal, Vol. 14, No. 2, 2008 355
املجلة الصحية لشرق املتوسط، منظمة الصحة العاملية، املجلد الرابع عشر، العدد ٢، ٢٠٠٨
monitoring. Archives of disease in child-hood, 1991, 66:245–7.
30. Gilbey H, Gilbey M. The physical activity of Singapore primary school children as estimated by heart rate monitoring. Pedi-atric exercise science, 1995, 7:26–35.
31. Sallo M, Sila R. Physical activity with mod-erate to vigorous intensity in preschool and first grade schoolchildren. Pediatric exercise science, 1997, 9:44–54.
32. Johnson MF et al. Interrelationships be-tween physical activity and other health behaviors among university women and men. Preventive medicine, 1998, 27(4):536–44.
33. Reynolds KD et al. Psychosocial predic-tors of physical activity in adolescents. Preventive medicine, 1999, 19:541–51.
34. Garcia AW et al. Changes in physical activity beliefs and behaviors of boys and girls across the transition to junior high school. Journal of adolescent health, 1998, 22(5):394–402.
35. Kelder SH et al. Longitudinal tracking of adolescent smoking, physical activity, and food choice behaviors. American journal of public health, 1994, 84(7):1121–6.
WHO report on the global tobacco epidemic, 2008 The MPOWER packageThis landmark new report presents the first comprehensive worldwide analysis of tobacco use and control efforts. It provides countries with a roadmap to reverse the devastating global tobacco epidemic that could kill up to one billion people by the end of this century.The report outlines the MPOWER package, a set of 6 key tobacco con-trol measures that reflect and build on the World Health Organization Framework Convention on Tobacco Control. It can be downloaded at: http://www.who.int/tobacco/mpower/en/index.html.

356 La Revue de Santé de la Méditerranée orientale, Vol. 14, No 2, 2008
املجلة الصحية لشرق املتوسط، منظمة الصحة العاملية، املجلد الرابع عشر، العدد ٢، ٢٠٠٨
Facial cleft and associated anomalies: incidence among infants at a Jordanian medical centreH.E. Aqrabawi1
1Neonatal Unit, King Hussein Medical Centre, Amman, Jordan (Correspondence to H.E. Aqrabawi: [email protected]).Received: 27/10/05; accepted: 23.01/06
ABSTRACT To estimate incidence of cleft lip and cleft palate among Jordanian infants and to identify associated anomalies, we carried out a prospective, hospital-based study over a 5-year period, Janu-ary 2000–January 2005. The total number of liveborn infants was 25 440, 60 of whom (2.4/1000) had facial clefts: 20 (33%) with cleft lip, 15 (25%) with cleft palate and 25 (42%) with both. Congenital heart disease was the commonest associated anomaly (47%) identified, followed by skeletal abnormalities (13%). Renal anomalies were found in 10% of cases. The high prevalence of congenital heart disease may justify routine echocardiography screening. The high consanguineous marriage rate may be a contributing factor to the high incidence of cleft anomalies.
Fissures faciales et anomalies associées : incidence chez les nourrissons d’un centre médical jordanienRÉSUMÉ Afin d’estimer l’incidence des cas de fente labiale et de fente palatine chez les nourrissons jordaniens et de repérer les anomalies associées, nous avons mené une étude prospective en milieu hospitalier sur une période de cinq ans, de janvier 2000 à janvier 2005. Le nombre total d’enfants nés vivants a été de 25 440, dont 60 (2,4/1000) présentaient des fissures faciales : 20 (33 %) une fente labiale, 15 (25 %) une fente palatine et 25 (42 %) une fente labio-palatine. Parmi les anomalies associées recensées, la cardiopathie congénitale était la plus courante (47 %), suivie des anomalies squelettiques (13 %). Des anomalies rénales ont été observées dans 10 % des cas. La prévalence élevée de cardiopathies congénitales peut justifier un dépistage systématique par échocardiographie. Le taux élevé de mariages consanguins peut être un facteur contribuant à l’incidence élevée des anomalies telles que ces fissures.
20002005254402.41000
30254247إذ
1310
Eastern Mediterranean Health Journal, Vol. 14, No. 2, 2008 357
املجلة الصحية لشرق املتوسط، منظمة الصحة العاملية، املجلد الرابع عشر، العدد ٢، ٢٠٠٨
Introduction
Cleft lip, with or without cleft palate, is a common congenital anomaly that has a strong negative effect on a family expecting to have a normal smiling baby. It results from failure of fusion of the fronto-nasal and maxillary processes. Worldwide, esti-mated incidence is about 1/1000 births [1]. It is usually of polygenic inheritance (rarely autosomal dominant) and has a higher fre-quency in some families. It is more common in the pregnancies of older mothers. The risk of recurrence in subsequent pregnan-cies is about 5%. It may be unilateral (70% on left side) or bilateral.
Cleft palate results from failure of fu-sion of the palatine processes and the nasal septum. Incidence is estimated to be around 1/2000 births [2]. In 70% of cases it is as-sociated with cleft lip. A variety of clefting abnormalities occur [1–3]: simple cleft of the soft palate; submucous cleft (a bony defect completely covered by mucosa, often there is bifid uvula; and complete cleft of the soft and hard palate, which may involve the alveolar bone. This may be unilateral, bilateral, or involve the midline.
Cleft lip and cleft palate have been associated with maternal anticonvulsant therapy, and can also occur in fetal alcohol syndrome [4].
Descriptive epidemiologic studies have been carried out in many countries, how-ever, no such study has ever been performed in Jordan. We describe a hospital-based study that was conducted at King Hussein Medical Centre to estimate the incidence of cleft lip and cleft palate among Jordanian infants and to identify the commonest as-sociated congenital anomalies.
Methods
This study was carried out at the mater-nity care unit, a regular unit that performs
300–500 deliveries monthly, in King Hus-sein Medical Centre in Jordan. The centre is a large public hospital that serves the capital city of Amman and its suburbs. The estimated population of this area is about 1 million.
All liveborn babies, both term and pre-term, who were born in the maternal care unit over a 5-year period from January 2000 to January 2005 were included in the survey. Stillborn babies were excluded. The total number of infants with cleft lip, cleft palate or both was determined prospectively.
All mothers of affected babies were interviewed postnatally by the paediatri-cians in the neonatal unit. A detailed ante-natal history, including previous medical illness, drug exposure, antenatal visits, vitamin intake, and ultrasound scans was taken from each mother. Family history was also reviewed. After thorough physi-cal examination, all affected babies had a skeletal survey, 2D echocardiography and renal ultrasound to identify associated anomalies. These were the only anomalies looked for because they are easy to detect and screen for. Dental anomalies were ex-cluded because they were considered part of the cleft anomalies. Central nervous system malformations were also excluded because they need special neuroimaging studies that could not be performed for all affected infants as routine screening tests, although they were done for some infants with mul-tiple anomalies. Chromosomal and genetic studies were not done as screening because they are not available in the centre, and are too expensive to be performed outside.
Multiple malformation was deemed to be present if more than 2 organ systems were affected.
Results
The total number of liveborn babies during the study period was 25 440. Sixty were
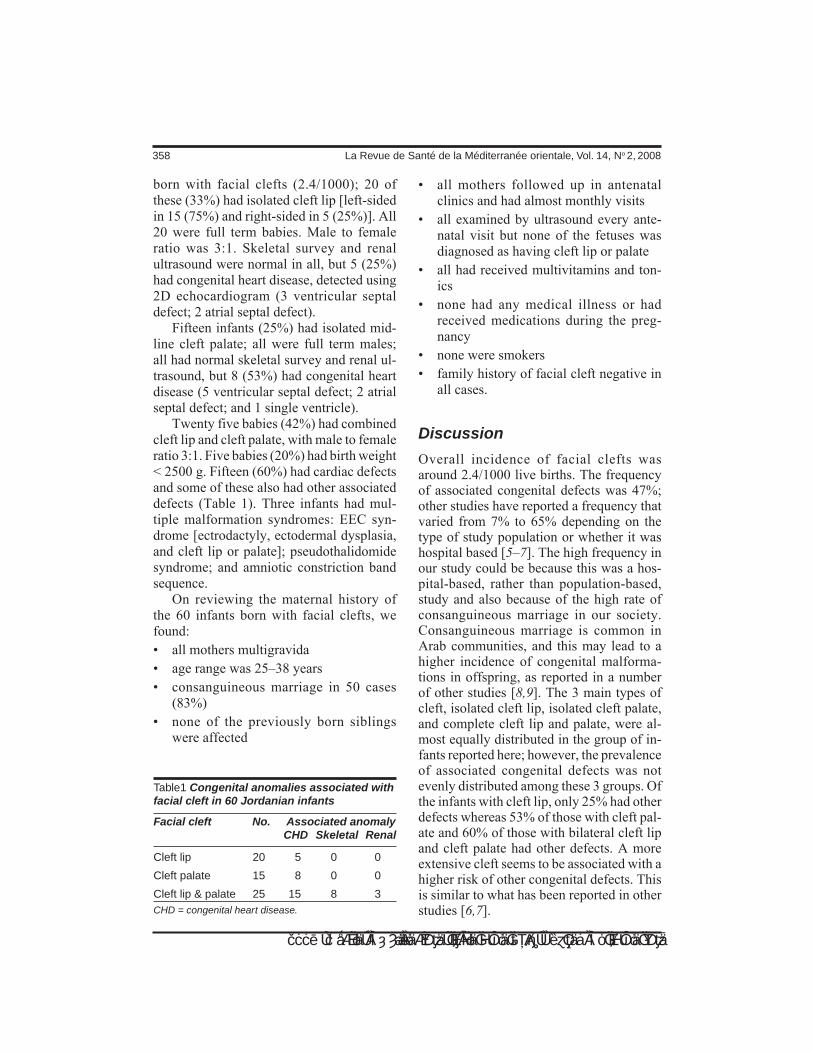
358 La Revue de Santé de la Méditerranée orientale, Vol. 14, No 2, 2008
املجلة الصحية لشرق املتوسط، منظمة الصحة العاملية، املجلد الرابع عشر، العدد ٢، ٢٠٠٨
born with facial clefts (2.4/1000); 20 of these (33%) had isolated cleft lip [left-sided in 15 (75%) and right-sided in 5 (25%)]. All 20 were full term babies. Male to female ratio was 3:1. Skeletal survey and renal ultrasound were normal in all, but 5 (25%) had congenital heart disease, detected using 2D echocardiogram (3 ventricular septal defect; 2 atrial septal defect).
Fifteen infants (25%) had isolated mid-line cleft palate; all were full term males; all had normal skeletal survey and renal ul-trasound, but 8 (53%) had congenital heart disease (5 ventricular septal defect; 2 atrial septal defect; and 1 single ventricle).
Twenty five babies (42%) had combined cleft lip and cleft palate, with male to female ratio 3:1. Five babies (20%) had birth weight < 2500 g. Fifteen (60%) had cardiac defects and some of these also had other associated defects (Table 1). Three infants had mul-tiple malformation syndromes: EEC syn-drome [ectrodactyly, ectodermal dysplasia, and cleft lip or palate]; pseudothalidomide syndrome; and amniotic constriction band sequence.
On reviewing the maternal history of the 60 infants born with facial clefts, we found:• all mothers multigravida • age range was 25–38 years• consanguineous marriage in 50 cases
(83%)• none of the previously born siblings
were affected
Table1 Congenital anomalies associated with facial cleft in 60 Jordanian infants
Facial cleft No. Associated anomaly CHD Skeletal Renal
Cleft lip 20 5 0 0
Cleft palate 15 8 0 0
Cleft lip & palate 25 15 8 3 CHD = congenital heart disease.
• all mothers followed up in antenatal clinics and had almost monthly visits
• all examined by ultrasound every ante-natal visit but none of the fetuses was diagnosed as having cleft lip or palate
• all had received multivitamins and ton-ics
• none had any medical illness or had received medications during the preg-nancy
• none were smokers• family history of facial cleft negative in
all cases.
Discussion
Overall incidence of facial clefts was around 2.4/1000 live births. The frequency of associated congenital defects was 47%; other studies have reported a frequency that varied from 7% to 65% depending on the type of study population or whether it was hospital based [5–7]. The high frequency in our study could be because this was a hos-pital-based, rather than population-based, study and also because of the high rate of consanguineous marriage in our society. Consanguineous marriage is common in Arab communities, and this may lead to a higher incidence of congenital malforma-tions in offspring, as reported in a number of other studies [8,9]. The 3 main types of cleft, isolated cleft lip, isolated cleft palate, and complete cleft lip and palate, were al-most equally distributed in the group of in-fants reported here; however, the prevalence of associated congenital defects was not evenly distributed among these 3 groups. Of the infants with cleft lip, only 25% had other defects whereas 53% of those with cleft pal-ate and 60% of those with bilateral cleft lip and cleft palate had other defects. A more extensive cleft seems to be associated with a higher risk of other congenital defects. This is similar to what has been reported in other studies [6,7].

Eastern Mediterranean Health Journal, Vol. 14, No. 2, 2008 359
املجلة الصحية لشرق املتوسط، منظمة الصحة العاملية، املجلد الرابع عشر، العدد ٢، ٢٠٠٨
Isolated cleft lip or palate was not as-sociated with impaired fetal growth or pre-maturity. In contrast, 20% of babies with combined cleft lip and palate had birth weight < 2500 g.
There are divergent reports in the litera-ture as to which congenital malformations are most common in cleft babies. Stark, in a review of 100 infants, found clubfoot to be the most common malformation [10]. Other investigators have reported an increased number of malformations in the head re-gion, the extremities, the genital region or the central nervous system [9,11]. The most common single congenital anomaly in our study was congenital heart disease; it oc-curred in about 50% of all affected babies. Anomalies of the extremities and skeletal system were mainly associated with cleft lip
and palate. Renal anomalies were relatively rare and associated with more severe clefts.
Conclusion
The high prevalence of malformations in cleft infants emphasizes the need for a thor-ough investigation of these infants; routine echocardiography screening for cardiac malformations may need to be considered. Close cooperation between the plastic sur-geon, the orthodontist and the paediatrician is important to comprehensively cover all aspects of these often complicated cases. Consanguineous marriage should be dis-couraged in our society as it is implicated in the higher incidence of congenital malfor-mations, although more formal studies are needed to investigate this issue.
References 1. Shprintzen RJ et al. Anomalies associ-
ated with cleft lip, palate, or both. Ameri-can journal of medical genetics, 1985, 20(4):585–95.
2. Vaughan CV. Growth and development in the infant and child. In: Behrman RE, Kliegman R, Jenson HB, eds. Nelson text-book of pediatrics, 16th ed. Philadelphia, WB Saunders Co., 2000.
3. Carmichael SL et al. Socio-economic sta-tus and risk of conotruncal heart defects and orofacial clefts. Pediatric and perina-tal epidemiology, 2003, 17:264–71.
4. Elahi MM et al. Epidemiology of cleft lip and cleft palate in Pakistan. Plas-tic and reconstructive surgery, 2004, 113(6):1548–55.
5. Lilius DP. Clefts with associated anoma-lies and syndromes in Finland. Scandi-navian journal of plastic & reconstructive surgery & hand surgery, 1992, 26(2):185–96.
6. Vieira AR et al. Inheritance of cleft palate in South America: evidence for a major lo-
cus recessive. Orthodontics & craniofacial research, 2003, 6(2):83–7.
7. Rintala AE. Epidemiology of orofacial clefts in Finland: a review. Annals of plas-tic surgery, 1986, 17:456–9.
8. Bromiker RA et al. Association of parental consanguinity with congenital malforma-tions among Arab newborns in Jerusa-lem. Clinical genetics, 2004, 66(1):63–6.
9. Rajabian M H, Shurkat M. An epidemio-logical study of oral clefts in Iran (analy-sis of 1669 cases). Iranian journal of plastic & reconstructive surgery, 1999, 2(6):17–26.
10. Stark RB, ed. Cleft palate: a multidisci-pline approach. New York, Harper & Row, 1968:303.
11. Knox G, Braithwaite F. Cleft lips and palates in Northumberland and Durham. Archives of disease in childhood, 1963, 38:66–70.

360 La Revue de Santé de la Méditerranée orientale, Vol. 14, No 2, 2008
املجلة الصحية لشرق املتوسط، منظمة الصحة العاملية، املجلد الرابع عشر، العدد ٢، ٢٠٠٨
Comparison of oral ibuprofen and indomethacin on closure of patent ductus arteriosus in preterm infantsSh. Pourarian,1 N. Pishva,1 A. Madani1 and M. Rastegari2
1Division of Neonatology; 2Division of Cardiology, Department of Paediatrics, Shiraz University of Medical Sciences, Shiraz, Islamic Republic of Iran (Correspondence to Sh. Pourarian: [email protected]). Received: 05/04/05; accepted: 23/01/06
ABSTRACT Although intravenous indomethacin and ibuprofen are widely used for closure of patent ductus arteriosus in premature infants, these formulations are unavailable in the Islamic Republic of Iran. In this study of the therapeutic effects of oral treatments, 20 preterm infants were randomized to oral ibuprofen (1 × 10 mg/kg, then 2 × 5 mg/kg at 24-hour intervals) or oral indomethacin (3 × 0.2 mg/kg at 24-hour intervals). Complete ductal closure was seen in 7/10 of the indomethacin and 8/10 of the ibuprofen group. The difference was not significant. There was no reopening after the ductal closure during the hospital stay or in the follow-up visits in either group and no excessive increases in the blood urea nitrogen or serum creatinine levels were observed.
Comparaison des effets de l’ibuprofène et de l’indométacine par voie orale sur la fermeture du canal artériel persistant chez les prématurésRÉSUMÉ Alors que l’indométacine et l’ibuprofène par voie intraveineuse sont très souvent utilisés pour la fermeture du canal artériel persistant chez les enfants nés avant terme, ces formulations ne sont pas disponibles en République islamique d’Iran. Dans cette étude sur les effets thérapeutiques des traitements oraux, 20 prématurés ont été randomisés pour recevoir de l’ibuprofène par voie orale (1 ×10 mg/kg, puis 2 × 5 mg/kg à intervalles de 24 heures) ou de l’indométacine par voie orale (3 × 0,2 mg/kg à intervalles de 24 heures). Une fermeture complète du canal a été observée chez 7 nouveau-nés sur 10 du groupe indométacine et chez 8 sur 10 du groupe ibuprofène. Cette différence n’est pas significative. Il n’y a pas eu ensuite de réouverture du canal artériel au cours de l’hospitalisation ou des visites de contrôle dans l’un ou l’autre groupe, ni d’augmentation excessive des taux d’azote uréique du sang ou de créatinine sérique.
20
1X102X524
3X0.224710
810

Eastern Mediterranean Health Journal, Vol. 14, No. 2, 2008 361
املجلة الصحية لشرق املتوسط، منظمة الصحة العاملية، املجلد الرابع عشر، العدد ٢، ٢٠٠٨
Introduction
Patent ductus arteriosus (PDA) is one of the most common clinical findings and most frequent source of complications in premature infants [1]. The presence of res-piratory distress syndrome (RDS) is also associated with increased frequency of sig-nificant PDA [2]. The incidence of PDA in very-low-birth weight infants with RDS is about 40% on the 3rd day of life, leading to several undesirable consequences, includ-ing haemodynamic, pulmonary, cerebral, renal and gastrointestinal disturbances [3]. The treatment of PDA, particularly when accompanied by RDS, is therefore crucial in preterm infants.
A number of studies carried out in the last decade have demonstrated the effec-tiveness of intravenous indomethacin and ibuprofen for closure of PDA, and these are now widely used as treatments [1–7]. How-ever, the intravenous form of these drugs is unavailable in the Islamic Republic of Iran, and a comparative study was therefore conducted to evaluate the therapeutic ef-fects of oral administration of indomethacin capsules or ibuprofen suspension on closure of PDA in preterm infants.
Methods
This study was conducted in the neonatal intensive care unit of the Nemazee hospital, Shiraz, Islamic Republic of Iran over a 6-month period in 2001.
All eligible premature infants of less than 37 weeks gestation who were admitted to the hospital during their first 10 days of life with clinical PDA confirmed by Dop-pler echocardiography were enrolled in the study. They were randomized into ibupro-fen or indomethacin groups. As soon as the diagnosis was made for the 1st eligible baby, he/she was enrolled to the ibuprofen
group and then the next eligible baby was assigned to the indomethacin group, and so on. The randomized distribution sequence was continued until the statistically recom-mended sample size was achieved.
The non-eligible infants were those with major congenital malformations, congenital heart defects, persistent pulmonary hyper-tension, intraventricular haemorrhage, blood urea nitrogen (BUN) concentration > 14 mmol/L, hyperbilirubinaemia in the level of exchange transfusion [3], bleeding tendency, evidence of necrotizing entero-colitis (NEC), platelet count < 50 000 /mm3, oliguria < 1 mL/kg/hr, and serum creatinine concentration > 1.8 mg/dL [8].
For the indomethacin group, the powder content of a 25 mg indomethacin capsule (Hakim Pharmaceutical Company, Tl-67-HM-026) was freshly prepared by dissolv-ing in 25 mL distilled water. This was given orally as 0.2 mg/kg for 3 doses at 24-hour intervals [8]. For the ibuprofen group, an ibuprofen oral suspension containing 100 mg in 5 mL (Hakim Pharmaceutical Com-pany, 75-HM-30) was given as an initial dose of 10 mg/kg, followed by 2 further doses of 5 mg/kg at 24-hour intervals [8]. Administration of the 2nd or 3rd doses of each drug was dependent on achievement of ductal closure after the initial doses.
Apart from the regular daily care and clinical examinations, a 2nd and 3rd Dop-pler echocardiographic evaluation was performed for all neonates shortly after receiving the last doses of the drugs and 1 week later to visualize the state of the ductus and the shunting through it.
The 2 groups were evaluated and com-pared for sex, gestational age, vital signs and age at starting treatment, ductal closure, serum bilirubin level, renal function, throm-bocyte count and evidence of NEC.
The Fisher exact test was used for data analysis.

362 La Revue de Santé de la Méditerranée orientale, Vol. 14, No 2, 2008
املجلة الصحية لشرق املتوسط، منظمة الصحة العاملية، املجلد الرابع عشر، العدد ٢، ٢٠٠٨
The Board of the Department of Pae-diatrics and the Committee for Research Proposals approved the study design, and informed consent for participation in the study was obtained from all the parents.
Results
In a period of about 6 months from May to October 2001, 63 neonates were admitted to the neonatal intensive care unit, 45 of whom were premature. A total of 7 preterm infants did not develop PDA. From the remaining 38 eligible infants, 18 were ex-cluded during the study (5 died on the 2nd or 3rd day of life due to asphyxia and in-traventricular haemorrhage, 8 had bleeding tendency following fulminant septicaemia, 2 had elevated BUN and renal dysfunction, and 3 developed right-to-left shunting with severe pulmonary hypertension). Therefore, 20 preterm infants with symptomatic PDA confirmed by Doppler echocardiography
entered the study and were randomized into ibuprofen and indomethacin groups
The characteristics of both groups are shown in Table 1. No significant differ-ences were found between the 2 groups in terms of birth weight, gestational age, sex, related maternal conditions, required trend of other treatments and some of the predict-able complications of prematurity.
Of the 20 neonates, 14 who had hyper-bilirubinaemia before the onset of treat-ment received phototherapy; none of them needed exchange transfusion during or after therapy. The mean airway pressure and mean fraction of inspired oxygen (FIO2) concentration following PDA treatment were not different between the groups.
Complete ductal closure was seen in 15 babies: 7/10 in the indomethacin group and 8/10 in the ibuprofen group. The difference was not significant (P = 0.5). There was no reopening during the hospital stay or in the follow-up visits in either group.
Table 1 Pretreatment characteristics of neonates with patent ductus arteriosus in the indomethacin and ibuprofen treatment groups
Neonate characteristic Indomethacin Ibuprofen (n = 10) (n = 10)
Mean (SD) birth weight (g) 1720 (630) 1860 (402)
Mean (SD) gestational age (weeks) 33.2 (3.1) 31.3 (4.4)
Sex (No. of males) 6 7
Maternal premature rupture of membranes (%) 70 50
Maternal pre-eclampsia (%) 33 35
Maternal betamethasone treatment (%) 80 75
Mean (SD) airway pressure at 24 hr (cm H2O) 8.1 (2.1) 7.5 (2.1)
Mean (SD) fraction of inspired oxygen at 24 hr (%) 55 (23) 59 (35)
Surfactant therapy (No.) 7 8
Mean (range) age at onset of therapy (days) 6.4 (5–8) 5.5 (4–7)
Respiratory distress syndrome (No.) 9 10
Hyperbilirubinaemia (No) 7 7n = number of neonates; SD = standard deviation.No significant differences between groups (P > 0.5).

Eastern Mediterranean Health Journal, Vol. 14, No. 2, 2008 363
املجلة الصحية لشرق املتوسط، منظمة الصحة العاملية، املجلد الرابع عشر، العدد ٢، ٢٠٠٨
There were no significant differences in the levels of serum creatinine before and after treatment with oral ibuprofen or indomethacin (mean differences were 0.35 and 0.45 mg/dL respectively). No neonate in either group developed cardiac insuf-ficiency and none of them demonstrated drug side-effects such as excessive increase in BUN level (> 14 mmol/L), NEC, gastro-intestinal disorders, thrombocytopaenia (< 50 000 mm3) or bleeding tendency.
All 5 preterm infants who required sur-gical ligation of the ductus had weight < 1270 g and gestational age < 30 weeks. Two of them (1 in each group) had severe respiratory distress and pulmonary hyper-tension. Respiratory distress was defined as respiratory rate more than 60 breaths/minute. These 2 neonates (1 in each group) had respiratory rate of > 80 breaths/minute and both had proven echocardiographic evidence of pulmonary hypertension. The other 3 neonates (2 in the ibuprofen and 1 in the indomethacin group) who needed high oxygen therapy (100%) had large PDA and cardiac insufficiency.
Discussion
Intravenous indomethacin, and also since 1993 intravenous ibuprofen [4], have been proven effect and are the conventionally used drugs to treat haemodynamically significant PDA in preterm infants [5]. Although both are cyclo-oxygenase blockers, they have different effects on regional circulation [5]. Indomethacin may cause significant reduc-tions in cerebral and gastrointestinal blood flow [9], and may be associated with altered platelet function and gastrointestinal perfo-ration or haemorrhage [3]. Ibuprofen closes the ductus with enhancement of cerebral blood flow autoregulation, with no intesti-nal haemodynamic derangement [3,10] or increased incidence of intracranial haemor-
rhage [5]. However, in the present study no neonate in either group developed signs of bleeding or gastrointestinal disorders. Compared with indomethacin, ibuprofen is believed to be less likely to induce NEC [7]. Data indicate that there is an increased risk of NEC and bowel perforation in premature infants with PDA receiving indomethacin due to a significant reduction in mesenteric blood flow velocity [11]. No signs sug-gestive of NEC were observed among the neonates of either group in our study.
By comparison, ibuprofen has fewer effects on renal function in terms of urine output and fluid retention [5]. Ibuprofen-treated patients have higher urine output and creatinine clearance, with lower BUN values, in contrast to indomethacin-treated infants [2,3] who show a significant number of oliguric patients, increases in serum creatinine and a tendency for lower frac-tional excretion of sodium [5]. However, no significant differences in the levels of serum creatinine before and after treatment with oral ibuprofen or indomethacin were observed in our study, and no neonate in either group demonstrated an excessive increase in BUN level.
The efficacy of ibuprofen is comparable to indomethacin for closure of PDA in many clinical trials [5–7,9–11] and while concern remains regarding the safety of indomethacin, intravenous ibuprofen has been used without significant adverse ef-fects [3,4,12–14].
In our study ductal closure was achieved in 70% the indomethacin group and 80% the ibuprofen group. These results are com-parable with other recent studies. Ductal closure has been reported to be achieved in 66% to 93% of cases after indomethacin treatment [2,3,5–7,9,10] and in 62% to 90% of neonates treated with ibuprofen [1–3,5,6,9–13]. Therefore, if they were equally effective, oral ibuprofen for PDA

364 La Revue de Santé de la Méditerranée orientale, Vol. 14, No 2, 2008
املجلة الصحية لشرق املتوسط، منظمة الصحة العاملية، املجلد الرابع عشر، العدد ٢، ٢٠٠٨
closure would have several important ad-vantages over the intravenous route for the same purpose [1,2].
Conclusion
The intravenous types of indomethacin and ibuprofen are not available in the Islamic Republic of Iran. Our study suggests that oral preparations of these drugs may have a similar efficacy to the intravenous prepara-
tions for ductal closure in preterm infants in developing countries where supplies of intravenous drugs are unavailable. Consid-ering the reported side-effects of indometh-acin, oral ibuprofen suspension should be regarded as a safer alternative. However, drug serum levels were not measured in this study, and in view of the small study sample, larger comparative studies are war-ranted.
References1. Lemons JA et al. Very low birth weight
outcomes of the National Institute of Child Health and Human Development Neo-natal Research Network, January 1995 Through December 1996. Pediatrics, 2001, 107:E1.
2. Hammoud MS et al. Incidence and risk factors associated with the patency of ductus arteriosus in preterm infants with respiratory distress syndrome in Ku-wait. Saudi medical journal, 2003, 24(9):982–5.
3. Clyman RI. Medical treatment of pat-ent ductus arteriosus in premature in-fants. In: Long WA, ed. Fetal and neonatal cardiology. Philadelphia: WB Saunders, 1990:682–-90.
4. Varvarigou A et al. Early ibuprofen admin-istration to prevent patent ductus arterio-sus in premature newborn infants. Journal of the American Medical Association, 1996, 275(7):539–44.
5. Lago P et al. Safety and efficacy of ibu-profen versus indomethacin in preterm in-fants treated for patent ductus arteriosus: a randomised controlled trial. European journal of pediatrics, 2002, 161(4):202–7.
6. Supapannachart S, Limrungsikul A, Khow-sathit P. Oral ibuprofen and indomethacin for treatment of patent ductus arteriosus
in premature infants: a randomized trial at Ramathibodi Hospital. Journal of the Medical Association of Thailand, 2002, 85(Suppl. 4):S1252–8.
7. Chotigeat U, Jirapapa K, Layangkool T. A comparison of oral ibuprofen and intra-venous indomethacin for closure of pat-ent ductus arteriosus in preterm infants. Journal of the Medical Association of Thailand, 2003, 86(Suppl. 3):S563–9.
8. Behrman RE, Kliegman RM, Jensen HB. Nelson textbook of pediatrics, 17th ed. Philadelphia, Saunders, 2004: 580.
9. Patel J et al. Randomized double-blind controlled trial comparing the effects of ibuprofen with indomethacin on cerebral hemodynamics in preterm infants with patent ductus arteriosus. Pediatric re-search, 2000, 47(1):36–42.
10. Mosca F et al. Comparative evaluation of the effects of indomethacin and ibupro-fen on cerebral perfusion and oxygena-tion in preterm infants with patent ductus arteriosus. Journal of pediatrics, 1997, 131(4):549–54.
11. Pezzati M et al. Effects of indomethacin and ibuprofen on mesentric and renal blood flow in preterm infants with patent ductus arteriosus. Journal of pediatrics, 1999, 135(6):733–8.
Eastern Mediterranean Health Journal, Vol. 14, No. 2, 2008 365
املجلة الصحية لشرق املتوسط، منظمة الصحة العاملية، املجلد الرابع عشر، العدد ٢، ٢٠٠٨
12. De Carolis MP et al. Prophylactic ibupro-fen therapy of patent ductus arteriosus in preterm infants. European journal of pediatrics, 2000, 159(5):364–8.
13. Dani C et al. Prophylaxis of patent ductus arteriosus with ibuprofen in preterm infants. Acta paediatrica, 2000, 89(11):1369–74.
14. Gournay V et al. Pulmonary hypertension after ibuprofen prophylaxis in very preterm infants. Lancet, 2002, 359(9316):1486–8.
Maternal, newborn health and povertyPaper No. 1: The effect of maternal–newborn ill-health on house-holds: economic vulnerability and social implicationsPregnancy and childbirth are wonderful and life-changing events. They can also bring potential for illness and suffering. Women from eco-nomically developing societies are especially vulnerable during these periods. The overall objective of this paper is to undertake a review of the evidence base on economic vulnerability and social implications in relation to maternal and newborn ill-health, and to highlight the major gaps in this evidence base.The paper can be downloaded at: http://www.who.int/reproductive-health/universal_coverage/issue1/index.htm.

366 La Revue de Santé de la Méditerranée orientale, Vol. 14, No 2, 2008
املجلة الصحية لشرق املتوسط، منظمة الصحة العاملية، املجلد الرابع عشر، العدد ٢، ٢٠٠٨
Profile of paediatric emergency cases in Yemen: the need for evidence-based guidelinesA.A. Ishak,1 N.H. Al-Jayefy1 and Y.A. Raja’a2
1Department of Paediatrics; 2 Department of Community Medicine, Faculty of Medicine and Health Sciences, Sana’a University, Sana’a, Yemen (Correspondence to Y.A. Raja’a: [email protected]). Received: 12/09/05; accepted: 05/02/06
ABSTRACT This study describes the status and characteristics of children presenting to emergency services in hospitals and health centres in Yemen in order to inform the development of guidelines for paediatric emergency services. Information was collected from 7 hospitals and 2 health centres in 5 governorates about 3454 cases, mostly aged < 2 years old. The majority of paediatric emergency cases were due to respiratory system problems (28.6%) and gastrointestinal problems (25.5%); 36.4% of children presented with a duration of complaint exceeding 4 days. One-third of cases (33.2%) were treated with 3rd generation cephalosporins alone or in combination with other antibiotics. The mortality rate was 1.9%. The most important causes of death were cardiac and respiratory failure.
Profil des cas d’urgence pédiatrique au Yémen : nécessité de principes directeurs reposant sur des bases factuellesRÉSUMÉ Dans le cadre de cette étude, nous avons décrit la situation et les caractéristiques des enfants qui arrivent dans les services d’urgences des hôpitaux et des centres médicaux du Yémen afin de contribuer à l’élaboration de principes directeurs destinés aux services d’urgences pédiatriques. Les informations ont été recueillies auprès de sept hôpitaux et de deux centres médicaux de cinq gouvernorats, à propos de 3454 cas pour la plupart âgés de moins de deux ans. La majorité de ces cas d’urgence pédiatrique étaient dus à des troubles de l’appareil respiratoire (28,6 %) et à des troubles gastro-intestinaux (25,5 %) ; à leur arrivée, 36,4 % des enfants se plaignaient depuis plus de quatre jours. Un tiers des cas (33,2 %) ont été traités avec des céphalosporines de troisième génération, seules ou associées à d’autres antibiotiques. Le taux de mortalité était de 1,9 %. Les causes de décès les plus importantes étaient l’insuffisance cardiaque et l’insuffisance respiratoire.
3454
28.625.5
36.4
33.2cephalosporins
1.9

Eastern Mediterranean Health Journal, Vol. 14, No. 2, 2008 367
املجلة الصحية لشرق املتوسط، منظمة الصحة العاملية، املجلد الرابع عشر، العدد ٢، ٢٠٠٨
Introduction
The majority of the population of Yemen are still living in rural areas, but the propor-tion decreased from around 82% in 1988 to 73% according to the 2003–04 annual statistical report of the Yemeni Ministry of Population and Public Health. Although mortality rates have declined due to better socioeconomic status and better health care coverage, the rates are still relatively high, especially in rural areas [1,2].
The paediatric emergency services play a very important part in the prevention of disease and disability. However, the high cost of these services, which are based on high-cost technology serving a minority of conditions, has to be considered in relation to the needs of the majority of patients and the community. Therefore, there is a need for guidelines that address how to prevent complications arising from emergencies with minimal or no intervention [3,4].
Health services have mostly been de-veloped on vertical selective programmes that address priority diseases. Paediatric emergency services are delivered as part of the overall health delivery system. Duke et al. have shown in a study of 21 hospitals in developing countries that the lack of quality paediatric care may result in unnecessary suffering or avoidable death [5]. In Yemen the quality of paediatric emergency services is affected by the lack of clinical practice protocols adapted to local circumstances, the weakness of the referral system, the underdeveloped administrative and techni-cal setup, and a lack of public awareness and participation. Although there may be some individual efforts and protocols for treatment of certain diseases in the field of emergency medicine, a uniformity of approach and local adaptations are urgently needed. Local adaptation may be difficult due to the fact that practising physicians
in Yemen have pursued their training in an array of medical schools in different languages.
Pre-hospital care is another very impor-tant aspect of paediatric emergency services capable of greatly contributing to minimiz-ing complications. Yet, knowledge, facili-ties and experience at the level of health providers and the public at large may be limited or non-existent.
Primary care services in Yemen started to take shape with the development of a locally adapted module of the Integrated Management of Childhood Illnesses (IMCI) strategy, which gives a good background for similar modules at higher levels of service. Quality paediatric emergency services at primary care level essentially depend on the recognition of danger signs and then refer-ral to higher levels of care. However, the IMCI guidelines and the training modules do not include essential pre-hospital care methods that are needed for teaching not only to primary care workers but also to the public [6].
In the field of paediatric emergency services, families lack basic knowledge, experience and support, such as pre-hospital care and social services. A signifi-cant proportion of the cost of health care is also borne by families in spite of the fact that government legislation includes the free provision of medical services to the public. The economic burden on the family due to expensive social habits such as chew-ing khat (a strong habit-forming plant [7]) or smoking cigarettes reduces a family’s capacity to cope with health care costs.
This study aims to describe the status and characteristics of children presenting to emergency services in hospitals and health centres in Yemen in order to add local input to the development of guidelines for paediatric emergency services.

368 La Revue de Santé de la Méditerranée orientale, Vol. 14, No 2, 2008
املجلة الصحية لشرق املتوسط، منظمة الصحة العاملية، املجلد الرابع عشر، العدد ٢، ٢٠٠٨
Methods
SettingThis descriptive study was conducted in 7 hospitals located in 5 out of the 15 gover-norates of Yemen over the period May to December 2004. The sites were selected to represent the various geographical areas of the country, including the highlands, the midlands and the coastal areas. Different categories of hospitals were also repre-sented at a range of levels: 2 teaching and referral hospitals, 2 large and 2 small hospi-tals and 1 private hospital; 2 health centres were also chosen (1 in a highland and 1 in a coastal area).
Data collection We studied 3454 paediatric emergency cases: 10.7% from health centres and 89.3% from hospitals. For the purpose of our study we defined a paediatric emergency case as a child aged 0–16 years which needed im-mediate intervention to save life or prevent complications.
For each case, pre-emergency, emer-gency and personal characteristics were recorded using a datasheet compiled by physicians at the medical emergency depart-ments at the hospitals and health workers at the health centres. Other data were collected directly from the adult who brought the child, the majority being one or both of the parents. Data collectors were medical care providers at the health care facility in the targeted governorates during the process of medical care. They were trained by the principal investigator during the prepara-tory stage of the research. The purpose of the study was explained to all of them and each investigator was asked to record the scheme of management of each case. A draft of our future common guidelines was given to each hospital in order be used in the process of care, inviting at the same time
comments on the guide, based on local and personal experience of the participants in the study. The activity of the research was planned to be followed by a workshop in order to study the data and the experience during the study period in order to provide practical experience to the guide for doctors in the hospital, especially the role of doctors in the IMCI system of care. The workshop was conducted a few months after the end of the study; follow-up of the development of common local protocol is still in progress by the principal investigator.
The patients were all paediatric emer-gency cases attending for emergency care at hospitals or during general sessions at primary care centres during the study period. The data collected from parents included: personal information; family and social history; transport conditions; dura-tion of complaint; and cost of treatment. Data recorded by the health care provider providing the immediate care to the patient were: diagnosis; management of the case; and use of drugs.
A separate questionnaire was designed to obtain some baseline data about the rates and types of childhood accidents in the past year, in order to inform campaigns to raise public awareness about childhood accidents. It was a retrospective study conducted at the same time as the main survey from parents who were in the hospital for any purpose of care and a few questionnaires were dis-tributed to other institutions and women’s gatherings. Information was collected by volunteers, who were able to fill in the simple self-administered questionnaire.
Data analysis Initial evaluation of the data from health centres and hospitals suggested that the findings were homogenous and therefore the data were pooled and analysed collec-tively. The collected data was entered into a

Eastern Mediterranean Health Journal, Vol. 14, No. 2, 2008 369
املجلة الصحية لشرق املتوسط، منظمة الصحة العاملية، املجلد الرابع عشر، العدد ٢، ٢٠٠٨
computer and analysed using SPSS, version 11.5, to calculate frequencies.
Results
The total number of paediatric emergency cases recorded was 3454; 59% were males and 41% were females. Data were miss-ing for many variables due to either recall problems or work pressure during the emer-gency care.
The age range was 0–192 months and the median age was 14 months. A total of 60% were below the age of 2 years (Table 1). Patients attended in similar numbers on all days of the week, mostly between 06.00 and 12.00 hours (48.4%, 1433/2959 visits for which data was available).
Out of 320 cases where the attendant answered the question about transportation time, 47% reported that they took more than 30 minutes to reach the hospital, and no cases were transported by ambulance.
In almost half of the 3209 cases (1459, 48.3%) the child’s attendant had not sought any medical advice before the visit to the emergency department. The remaining cas-es had been seen in a hospital (670, 20.9%), private practice (454, 14.1%) or health centre/primary care unit (470, 14.6%), more
than one place (66, 2.1%); only 0.3% (11) were seen by a non-professional worker.
The cumulative duration of complaints was: 1 day for 17.3% of cases, 2 days 37.7%, 3 days 54.4% and 4 days 63.5%. The dura-tion of complaint was > 4 days in 36.5% (1179/3232) of cases. Of these, 14.1% (166) had respiratory problems and 17.4% (206) had diarrhoea.
Table 2 shows the conditions of the children during transport, as reported by the attendant who brought the child (in most cases the parents). Over half (57.8%) were suffering from respiratory or gastrointesti-nal infections.
Table 3 shows the distribution of cases by body system affected. Respiratory prob-lems were 28.6%, diarrhoea and dehydra-tion 25.5%, high fever 11.0%, and coma and shock 1.4%. Of the respiratory infections 16% were due to pneumonia (no specific causes recorded) and the rest were due to bronchial asthma.
Table 4 shows the distribution of cases by diagnosis. The majority of specific di-agnostic conditions were labelled as gas-troenteritis, pneumonia, high fever, febrile conditions, etc. Other reported conditions represented all systems but in relatively few numbers.
Table 1 Age and sex distribution of the sample of children presenting for paediatric emergency care
Age group Male Female Total No. % No. % No. %
Newborn (0–28 days) 143 4.3 89 2.7 232 7.0
Infant (28 days–1 year) 819 24.7 561 16.9 1380 41.6
Toddler (1–2 years) 640 19.3 457 13.8 1097 33.1
Preschool (2–4 years) 123 3.7 75 2.3 198 6.0
School (4–12 years) 206 6.2 149 4.5 355 10.7
Adolescent (12–16 years) 34 1.0 18 0.5 52 1.5
Total 1965 59.2 1349 40.8 3314a 100.0aMissing data = 140.

370 La Revue de Santé de la Méditerranée orientale, Vol. 14, No 2, 2008
املجلة الصحية لشرق املتوسط، منظمة الصحة العاملية، املجلد الرابع عشر، العدد ٢، ٢٠٠٨
Out of 2687 patients investigated, at least 1 laboratory test was done for almost 95%. Some of these tests were: complete blood count and other haematological stud-ies (15.0%), chest X-ray (10.2%) and serum electrolytes (3.6%). Side laboratories oper-ated by physicians (i.e. facilities for rapid
diagnosis such as tapes, microscope and slides for blood picture, blood sugar and blood urea, etc.) were not available in any of the research sites. The possibility of accurate diagnosis supported by laboratory evidence was not possible for the majority of diagnostic conditions, such as diarrhoea, respiratory infection and fever. Some cases were already diagnosed, such as sickle-cell anaemia, 2.3% (n = 78) and cardiac condi-tions, including congenital and rheumatic heart diseases 3.3% (n = 108).
ManagementTable 5 shows the use of antibiotics in the paediatric emergency services. The majori-ty of children treated were given a combina-tion of at least 2 antibiotics. Cephalosporins alone or in combination comprised 32% of all cases, of which 1st generation ce-phalosporins represented 0.4% while the 3rd generation cephalosporins represented 12.6%.
Table 2 Conditions of children during transport for emergency care
Condition No. %
Respiratory distress 1057 32.1
Diarrhoea and vomiting 847 25.7
High fever 546 16.6
Convulsions 298 9.2
Normal 171 5.3
Coma 163 5.0
Weakness 122 3.7
Irritability 40 1.2
Bleeding 40 1.2
Total 3302a 100.0aMissing data = 152.
Table 3 Distribution of cases by body system affected among children presenting to health facilities for emergency care
Condition No. %
Respiratory problem 976 28.6
Gastrointestinal problem 871 25.5
High fever 375 11.0
Haematology problem 233 6.8
Cardiac disease 116 3.4
Renal disease 88 2.6
Poisoning 64 1.9
Coma and shock 48 1.4
Other disease 638 18.8
Total 3409a 100.0aMissing data = 45.
Table 4 Distribution of cases by diagnosis among children presenting to health facilities for emergency care
Condition No. %
Diarrhoea 675 20.3
Pneumonia 565 16.9
Malaria 216 6.5
Meningitis 101 3.0
Bronchial asthma 101 3.0
Febrile convulsions 98 2.9
Septicaemia 96 2.9
Sickle-cell anaemia 78 2.3
Severe anaemia of unknown cause 76 2.3
Congenital heart disease 108 3.3
Other 1224 36.6
Total 3338a 100.0aMissing data = 116.

Eastern Mediterranean Health Journal, Vol. 14, No. 2, 2008 371
املجلة الصحية لشرق املتوسط، منظمة الصحة العاملية، املجلد الرابع عشر، العدد ٢، ٢٠٠٨
Parent’s characteristics The majority of mothers were housewives (n = 3207, 92.8%) and were present at the child’s examination in 83.3% of cases (n = 2876). The occupation of fathers was: labourer (36.4%), employee (8.5%), private business (17.8%), student (1.4%), unem-ployed (8.5%) and other/unknown (4.7%). Fathers were present at 76.1% of examina-tions (n = 2630). The proportion of mothers who reported chewing khat and smoking tobacco was 8.5% and for fathers the rate was 46.6%.
Results of analysis of 246 question-naires about childhood accidents showed that 16.2% were falls from a height, 15.5% car accidents and 10.0% burns and scalds; other forms of violence were solid object wound (8.0%), stab wound (5.0%), gunshot wound (2.0%) and drug poisoning (6.0%).
Outcomes Table 6 reveals that 1.9% of the paediatric emergency cases (n = 65) died. Out of those children, 1 died suffocating from a foreign body and 1 was a victim of a car accident who had a broken spine caused by the res-cuers. Causes of death were mostly cardiac
Table 5 Antibiotics prescribed for children at emergency care faculties
Antibiotic No. %
Cephalosporin + ampicillin or amoxycillin 439 20.6
Aminoglycosides + ampicillin or amoxycillin 312 14.7
3rd generation cephalosporin 269 12.6
Ampicillin 248 11.7
Amoxycillin 180 8.5
Penicillin 141 6.6
Trimethoprim + TMX 76 3.6
TMX + nalidixic acid 76 3.6
2nd generation cephalosporin 40 1.9
Penicillins + chloramphenicol 26 1.2
Amoxycillin + clavulanic acid 24 1.1
Aminoglycosides 17 0.8
Nalidixic acid 15 0.7
1st generation cephalosporin 8 0.4
Other 257 12.1
Total 2128a 100.0
None 874 TMX = sulfamethoxazoleaMissing data = 452.NB: 3rd generation cephalosporin alone and in combination with other antibiotics represented 33.2% of all cases.
Table 6 Outcome of paediatric emergencies after management at emergency health facilities during the first 24 hours of observation
Condition No. %
Cured 681 19.7
Transferred to another facility 148 4.3
Discharged against medical advice 126 3.6
Remained on treatment 2278 66.0
Died 65 1.9
Missing data 156 4.5
Total 3454 100.0
Other drugs were used for 1440 cas-es (41.7%): cortisone (12.2%), diuretics (12.0%), diazepam (11.2%) and dopamine (9.7%).
A total of 9.9% of children were given cardiopulmonary resuscitation, 8.0% were given a blood transfusion, and 30.0% were put on oxygen therapy. Two thirds of pa-tients (2326/3454, 67.3%) were put on in-travenous fluids and analysis of 1763 cases where information was available showed that 3.5% had saline, 14.7% glucose, 44.1% glucose saline and 13.5% Ringer’s solu-tion.

372 La Revue de Santé de la Méditerranée orientale, Vol. 14, No 2, 2008
املجلة الصحية لشرق املتوسط، منظمة الصحة العاملية، املجلد الرابع عشر، العدد ٢، ٢٠٠٨
(32%) and respiratory (20%). In Figure 1 we summarize 3 cases, examples of poor pre-hospital practice by members of the public in paediatric emergencies, in order to give examples of problems which could have been prevented by correct pre-hospital care.
CostThe answers to the questions on costs of emergency treatment were very difficult to analyse because of the difficulty in cat-egorizing them, as the majority of parents tended to exaggerate the cost and or confuse the treatment and other costs. Although the treatment of emergency cases is generally free, patients have to pay for medical sup-plies and in some hospitals there is also a nominal fee. Our estimate of the average cost of medical care, subsidies and transport for a case of febrile convulsions was around US$ 34.
Discussion
Yemen is a country which suffers a heavy burden of infection and malnutrition; this is partially due to people’s lifestyle and the country’s ecology. Moreover, emergency situations are further complicated due to the effects of “haphazard modernization” in terms of misuse of drugs, exposure to chemicals, motor car accidents and even from lack of, or improper, medical services [1–3].
The overall impression from our explo-ration of paediatric emergency services is that there is no system of practice followed (initial triage, assessment, monitoring, uni-form definitions and documentation, fol-low-up, etc.). This agrees with observations on paediatric emergency services in other underdeveloped countries [4,5].
The age and sex distribution of children showed that the majority were males below
Figure 1 Examples of poor pre-hospital practice by members of the public in paediatric emergencies
Case report 1: A newborn baby arrived at the hospital after almost 1.5 hours of travel, during which he was cyanosed
• Expected result: brain damage
• Level of knowledge of the individual who attended the incident: none
• Pre-hospital care: breathing for the infant and sucking secretions
Case report 2: Child pulled by the hand by the rescuers from underneath a car in a car accident
• Result: broken spine
• Level of knowledge of the individual who attended the incident: none
• Pre-hospital care: spine support
Case report 3: A 3-year-old child arrived dead at the hospital
• Cause: swallowed a large piece of soap.
• Level of knowledge of the individual who attended the incident: none
• Pre-hospital: Heimlich manoeuvre

Eastern Mediterranean Health Journal, Vol. 14, No. 2, 2008 373
املجلة الصحية لشرق املتوسط، منظمة الصحة العاملية، املجلد الرابع عشر، العدد ٢، ٢٠٠٨
the age of 12 years of age. A high propor-tion of our paediatric emergency cases pre-sented late to the hospital or health centre (over 60% with a duration of complaint of 4 days), which has a negative impact on the outcome. Most of them were cases of diarrhoea and respiratory illnesses, which are the most common presenting diagnoses to both emergency and non-emergency services among Yemeni children. Generally speaking, these conditions are at the top of the list as presenting symptoms according to previous surveys over the past 2 decades [1]. From a study in India it has also been shown that diarrhoea and acute respiratory infections are the most important reasons for utilization of primary and secondary levels of paediatric emergency services [8].
The use of antibiotics shown by our sur-vey reflects more a prescribing habit than a prescribing rationale, and effective drug promotion rather than drug information. Of all drugs used 51% were prescribed for respiratory infections, either 3rd generation cephalosporins alone or a combination of broad-spectrum penicillin and/or aminogly-cosides. Compliance with the use of antibi-otics is difficult for patients’ families when we take into account the high cost of drugs and the fathers’ occupation (36.4% of all the patients’ attendants were labourers who de-pend on daily wages). The development of organisms resistant or multiply resistant to antibiotics is disastrous to the health of the community at large. The problem is even more serious in situations of poor quality control, i.e. a lack of proper guidelines on alternatives to technological facilities in the process of clinical decision-making and rational use of antibiotics [9,10].
Cardiopulmonary resuscitation was ap-plied to only few cases, suggesting that very few staff are actually trained and very few sites have the technical facilities for simple life support. Prehospital knowledge
and practice is deficient in this area of care. We felt that there is a need to educate the general public, especially parents, about the correct methods of prehospital care for problems such as suffocation, ingestion of foreign bodies, burns, etc. Other research shows that many children in developing countries die before reaching any health facility and many more die because there is no chance to reach a health facility [11].
The use of intravenous fluids in this survey suggests overuse. Of all fluids, 33% were given to cases of diarrhoea and 21% to cases of respiratory infections. Unfortu-nately, oral rehydration corners were not available in the emergency units, which could have been very useful to decrease the need for intravenous fluids in mild cases [12–14].
Oxygen was given to 30% of cases. Previous studies have shown that oxygen can be used in as low as 16% concentration. In our sites, where oxygen is used without proper laboratory monitoring or other means of control such as transcutaneous monitor-ing, it may be safer and more economical to use air for resuscitation as an alternative which has been shown to be as effective as oxygen [15].
The socioeconomic parameters of par-ents, i.e. manual occupations, low level of education and khat-chewing and smok-ing habits, all constitute additional factors which add to the inability of the family to cope with emergency situations. Poverty, in addition to maldistribution of the family budget, further exacerbates the problem of coping with emergency situations [1].
The outcome of the paediatric emer-gency services care could not be evaluated properly. The significance of information on the outcome can neither be accurate nor representative of the community being studied, essentially due to a selection bias on the one hand and to inability to carry out

374 La Revue de Santé de la Méditerranée orientale, Vol. 14, No 2, 2008
املجلة الصحية لشرق املتوسط، منظمة الصحة العاملية، املجلد الرابع عشر، العدد ٢، ٢٠٠٨
proper follow-up. The mortality rate was 1.9%. The most important causes of death reported in this study were cardiac and respiratory failure.
The language of medical records is Eng-lish for hospitals and Arabic at IMCI centres. At IMCI centres, records are structured and unified, whereas those of the hospital are in the form of a register which is not structured or unified. However, paediatric emergency services cases cannot be traced due to the fact that all emergency cases are referred and no records can be traced for the referral and or the feedback process. The referral system is generally very weak at all levels of the health service. The process of referral is affected by the difference in management between primary care services, practising according to guidelines, and higher levels, operating according to individual opinions [7] [Ishak A. Evaluation of IMCI in Yemen. Unpublished report to UNICEF, March 2005].
Although almost all emergency situa-tions at primary care level are referred to higher levels, there are many situations where referral is impossible. Furthermore, cases such as burns, scalds, bleeding and injuries, which need at least first-aid care, are not included in the IMCI guidelines. Simoes et al. have shown from a study on the management of severely ill children at first-level health facilities in sub-Saharan Africa that there are also situations where referral is difficult or impossible, but the health worker can mange if he/she and the centre are prepared to do so [16].
There is probably a significant short-age of reference sources in the country for paediatric emergency services care, such as poisoning information, patterns of resist-
ance to antibiotics, medicolegal advice, so-cial support, scientific and educational data, etc., all of which add further dimensions to the complex issue of safety and efficiency of paediatric emergency services [17,18].
The lessons learned from this experience with regard to the development of a manual for paediatric emergency services are as follows:• Information systems for paediatric emer-
gency services at primary and secondary levels of service need to be developed so that the clinical guidelines at both levels can be periodically evaluated.
• All available information and experi-ences should be combined to create the proposed unified guidelines.
• There is a real need for alternative means of laboratory support, such as a scoring system for evaluation, and for alterna-tive means of therapy based on evidence from the financial, technical and safety points of view, e.g. the use oral rehy-dration solution instead of intravenous fluids even in moderately severe cases, the use of air instead of oxygen for re-suscitation, the use of clinical scores to differentiate bacterial from viral infec-tions, the use of simple side laboratories to be operated by physicians.
Acknowledgements
This study was supported by the High Council for Mothers and Children and sup-ported financially by UNICEF (Sana’a Of-fice). Thanks are due to the directors and colleagues at the research sites and at the Department of Child Health in the Ministry of Health.

Eastern Mediterranean Health Journal, Vol. 14, No. 2, 2008 375
املجلة الصحية لشرق املتوسط، منظمة الصحة العاملية، املجلد الرابع عشر، العدد ٢، ٢٠٠٨
References
1. Government of Yemen, UNICEF, World Bank, Barnen R. Children and women in Yemen: a situation analysis: health and nutrition. Washington DC, UNICEF, 1999.
2. The Yemen family health survey, 2003. Sana’a, Yemen, Ministry of Public Health and Population and Central Statistical Organization, 2003.
3. Stidham GL. Emergencies in international child health. Current opinion in pediatrics, 1977, 9(3):254–8.
4. Sarnaik AP, Daphtary K, Sarnaik AA. Ethi-cal issues in pediatric intensive care in developing countries: combining western technology and eastern wisdom. Indian journal of pediatrics, 2005, 72:339–42.
5. Duke T et al. Improving the quality of paediatric care in peripheral hospitals in developing countries. Archives of disease in childhood, 2003, 88:563–5.
6. Integrated management of childhood ill-ness. Geneva, World Health Organiza-tion, 2001 (WHO/FCH/CAH/00.40/2001).
7. Al-Motarreb A, Baker K, Broadley KJ. Khat: pharmacological and medical as-pects and its social use in Yemen. Phyto-therapy research, 2002, 16(5):403–13.
8. Singhi S, Singhi S, Gupta G. Comparison of pediatric emergency patients in a terti-ary care hospital vs a community hospital. Indian pediatrics, 2004, 41:67–72.
9. Archibald LK, Reller LB. Clinical micro-biology in emerging countries. Emerging infectious diseases, 2001, 7(2):302–5.
10. Gaur AH, Hare ME, Shorr RI. Provider and practice characteristics associated with antibiotic use in children with pre-
sumed viral respiratory tract infections. Pediatrics, 2005, 115(3):635–41.
11. Gove S et al. Development and technical basis of simplified guidelines for emer-gency triage assessment and treatment in developing countries. WHO Integrated Management of Childhood Illness (IMCI) Referral Care Project. Archives of disease in childhood, 1999, 81:473–7.
12. Tamburlini G et al. Evaluation of guide-lines for emergency triage assessment and treatment in developing countries. Archives of disease in childhood, 1999, 81(6):478–82.
13. Dalby-Payne J, Elliot E. Gastroenteri-tis in children. Clinical evidence, 2004, Dec(12):443–54.
14. Saugstad OD, Rootwelt T, Aalen O. Resuscitation of asphyxiated newborn infants with room air or oxygen: an in-ternational controlled trial, the Respair 2 study. Pediatrics, 1998, 102(1):e1–7.
15. Razzak JA, Kellermann AL. Emergency medical care in developing countries: is it worthwhile. Bulletin of the World Health Organization, 2002, 80(11):900–5.
16. Simoes EAF et al. Management of severe-ly ill children at first level health facilities in the sub-Saharan Africa when referral is difficult. Bulletin of the World Health Or-ganization, 2003, 81(7):522–31.
17. Nolan T et al. Quality of hospital care for seriously ill children in less-developed countries. Lancet, 2001, 357:106–10.
18. Robertson MA, Molyneux E M. Triage in the developing world—can it be done? Archives of disease in childhood, 2001, 85:208–13.
376 La Revue de Santé de la Méditerranée orientale, Vol. 14, No 2, 2008
املجلة الصحية لشرق املتوسط، منظمة الصحة العاملية، املجلد الرابع عشر، العدد ٢، ٢٠٠٨
Nocturnal enuresis and its treatment among primary-school children in Oromieh, Islamic Republic of IranN. Pashapour,1 S. Golmahammadlou2 and H. Mahmoodzadeh1
1Department of Paediatrics; 2Department of Mother and Child Health, Oromieh University of Medical Science, Oromieh, Islamic Republic of Iran (Correspondence to N. Pashapour: [email protected]). Received: 10/10/05; accepted: 23/01/06
ABSTRACT The aim of this study was to determine the frequency and treatment of enuresis among primary-school children living in Oromieh city, Islamic Republic of Iran. A questionnaire was answered by parents of 3500 selected students at the annual school enrolment in summer 2004. The frequency of nocturnal enuresis was 7.7%. Enuresis frequency was significantly higher among boys (8.6%) than girls (6.7%). Treatment methods used were: medication, water restriction, awaking for voiding and enuresis alarm in 57.8%, 18.1%, 11.5% and 2.6% of cases respectively. The frequency of nocturnal enuresis is similar to other studies but treatment methods were different.
L’énurésie nocturne et son traitement chez les enfants des écoles primaires d’Oromieh en République islamique d’IranRÉSUMÉ Dans cette étude, nous avions pour objectif de déterminer la fréquence et le traitement de l’énurésie chez les enfants des écoles primaires d’Oromieh (République islamique d’Iran). Les parents de 3500 écoliers sélectionnés lors de l’inscription annuelle à l’école, pendant l’été 2004, ont répondu à un questionnaire. La fréquence de l’énurésie nocturne était de 7,7 %. Elle était significativement plus élevée chez les garçons (8,6 %) que chez les filles (6,7 %). Les méthodes de traitement suivantes étaient utilisées : médicaments, restriction en eau, réveil de l’enfant pour la miction et système d’alarme dans 57,8 %, 18,1 %, 11,5 % et 2,6 % des cas. Dans cette étude, la fréquence de l’énurésie nocturne était similaire à celle révélée par d’autres études, mais les méthodes de traitement étaient différentes.
350020047.78.66.7
57.818.12.6

Eastern Mediterranean Health Journal, Vol. 14, No. 2, 2008 377
املجلة الصحية لشرق املتوسط، منظمة الصحة العاملية، املجلد الرابع عشر، العدد ٢، ٢٠٠٨
Introduction
Nocturnal enuresis has been described as the involuntary voiding of urine during sleep, in the absence of congenital or ac-quired defects of the central nervous system or the urinary tract in a child aged 5 years or over [1]. For the great majority of chil-dren, the presence of nocturnal enuresis is a source of shame and embarrassment. It profoundly affects the child’s life socially, emotionally and behaviourally and also impacts on the everyday life of his/her fam-ily [2]. The frequency of enuresis changes with age and its prevalence ranges widely in various countries [3]. A study revealed that only about one-third of the families of children with this frequently troubling prob-lem seek help from a physician [4]. Various interventions are used to treat nocturnal enuresis [5]. A recent case–control study of self-esteem showed impaired self-esteem in children with nocturnal enuresis before treatment compared with control children. Patients improved to the level of controls after 6 months of treatment [6]. The study also showed that the degree of success was related to the type of treatment [6].
There is little research regarding preva-lence of nocturnal enuresis and its treatment in the Islamic Republic of Iran. This study aimed to determine the frequency and types of treatment of enuresis among primary-school children in Oromieh city.
Methods
SampleThe population studied were primary-school children aged 7–12 years old who were en-rolled at primary schools in Oromieh city, Islamic Republic of Iran. According to the estimated prevalence of enuresis and popu-
lation size, a sample size of 3243 with con-fidence level of 95% was needed. Therefore 3500 students were selected for the study, randomly selected from all primary-school classes in the city. Every school and class received their sample size quota according to student numbers.
Data collectionThis was a descriptive cross-sectional study. For each selected child a question-naire was answered by one of the parents during annual enrolment in summer 2004. Data collection was done by interviews in cooperation with the school heath centre workers. All parents were asked if their child had suffered from nocturnal enuresis in the previous 6 months and, if so, what kind of treatment had been used. The study was approved by the research council of the University of Oromieh.
Primary nocturnal enuresis was defined as bed-wetting at least once a week in a child who has not had night-time bladder control for 6 months or more. We included cases who at the time of study had primary nocturnal enuresis. Secondary enuresis and diurnal enuresis without nocturnal enuresis were excluded from study. Treatments were categorized as enuresis alarm, medication, water restriction, awaking for voiding and untreated, based on the results of a pilot study and literature review. The children who had several methods of treatments were categorized under the most commonly used ones.
Data analysisThe chi-squared test was used for statisti-cal analysis for calculating the frequency difference between the 2 sexes. A level of P < 0.05 was considered statistically sig-nificant.
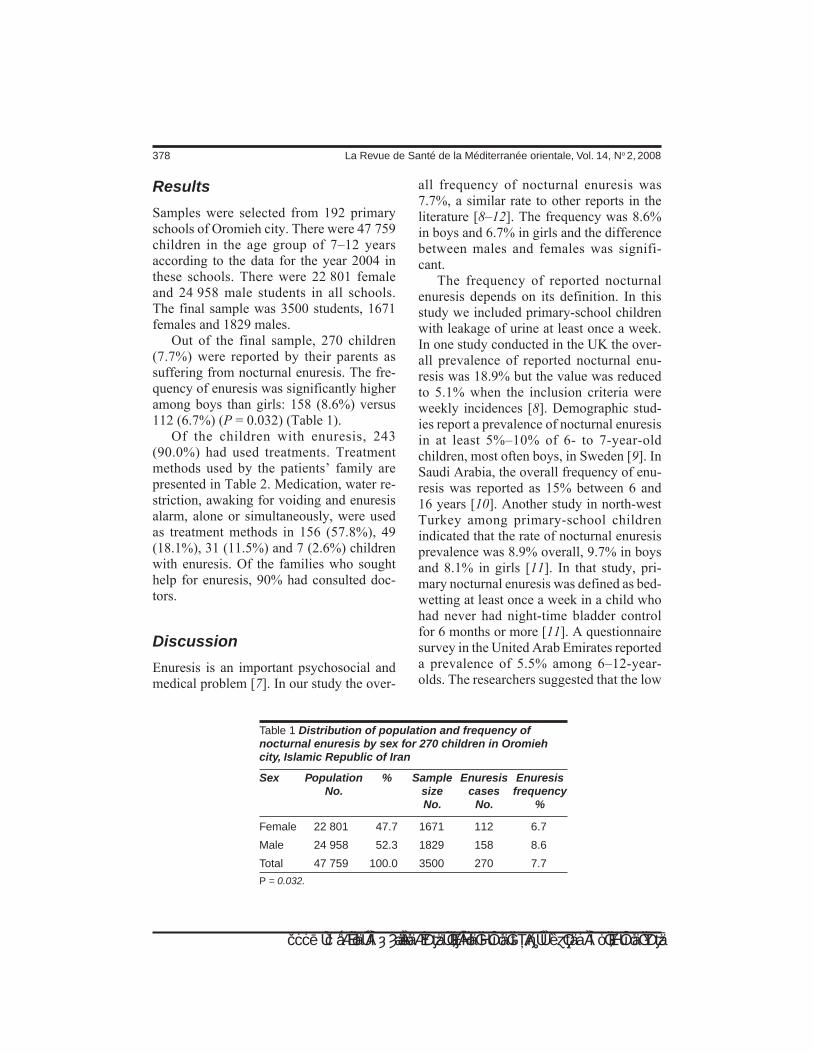
378 La Revue de Santé de la Méditerranée orientale, Vol. 14, No 2, 2008
املجلة الصحية لشرق املتوسط، منظمة الصحة العاملية، املجلد الرابع عشر، العدد ٢، ٢٠٠٨
Results
Samples were selected from 192 primary schools of Oromieh city. There were 47 759 children in the age group of 7–12 years according to the data for the year 2004 in these schools. There were 22 801 female and 24 958 male students in all schools. The final sample was 3500 students, 1671 females and 1829 males.
Out of the final sample, 270 children (7.7%) were reported by their parents as suffering from nocturnal enuresis. The fre-quency of enuresis was significantly higher among boys than girls: 158 (8.6%) versus 112 (6.7%) (P = 0.032) (Table 1).
Of the children with enuresis, 243 (90.0%) had used treatments. Treatment methods used by the patients’ family are presented in Table 2. Medication, water re-striction, awaking for voiding and enuresis alarm, alone or simultaneously, were used as treatment methods in 156 (57.8%), 49 (18.1%), 31 (11.5%) and 7 (2.6%) children with enuresis. Of the families who sought help for enuresis, 90% had consulted doc-tors.
Discussion
Enuresis is an important psychosocial and medical problem [7]. In our study the over-
all frequency of nocturnal enuresis was 7.7%, a similar rate to other reports in the literature [8–12]. The frequency was 8.6% in boys and 6.7% in girls and the difference between males and females was signifi-cant.
The frequency of reported nocturnal enuresis depends on its definition. In this study we included primary-school children with leakage of urine at least once a week. In one study conducted in the UK the over-all prevalence of reported nocturnal enu-resis was 18.9% but the value was reduced to 5.1% when the inclusion criteria were weekly incidences [8]. Demographic stud-ies report a prevalence of nocturnal enuresis in at least 5%–10% of 6- to 7-year-old children, most often boys, in Sweden [9]. In Saudi Arabia, the overall frequency of enu-resis was reported as 15% between 6 and 16 years [10]. Another study in north-west Turkey among primary-school children indicated that the rate of nocturnal enuresis prevalence was 8.9% overall, 9.7% in boys and 8.1% in girls [11]. In that study, pri-mary nocturnal enuresis was defined as bed-wetting at least once a week in a child who had never had night-time bladder control for 6 months or more [11]. A questionnaire survey in the United Arab Emirates reported a prevalence of 5.5% among 6–12-year-olds. The researchers suggested that the low
Table 1 Distribution of population and frequency of nocturnal enuresis by sex for 270 children in Oromieh city, Islamic Republic of Iran
Sex Population % Sample Enuresis Enuresis No. size cases frequency No. No. %
Female 22 801 47.7 1671 112 6.7
Male 24 958 52.3 1829 158 8.6
Total 47 759 100.0 3500 270 7.7
P = 0.032.
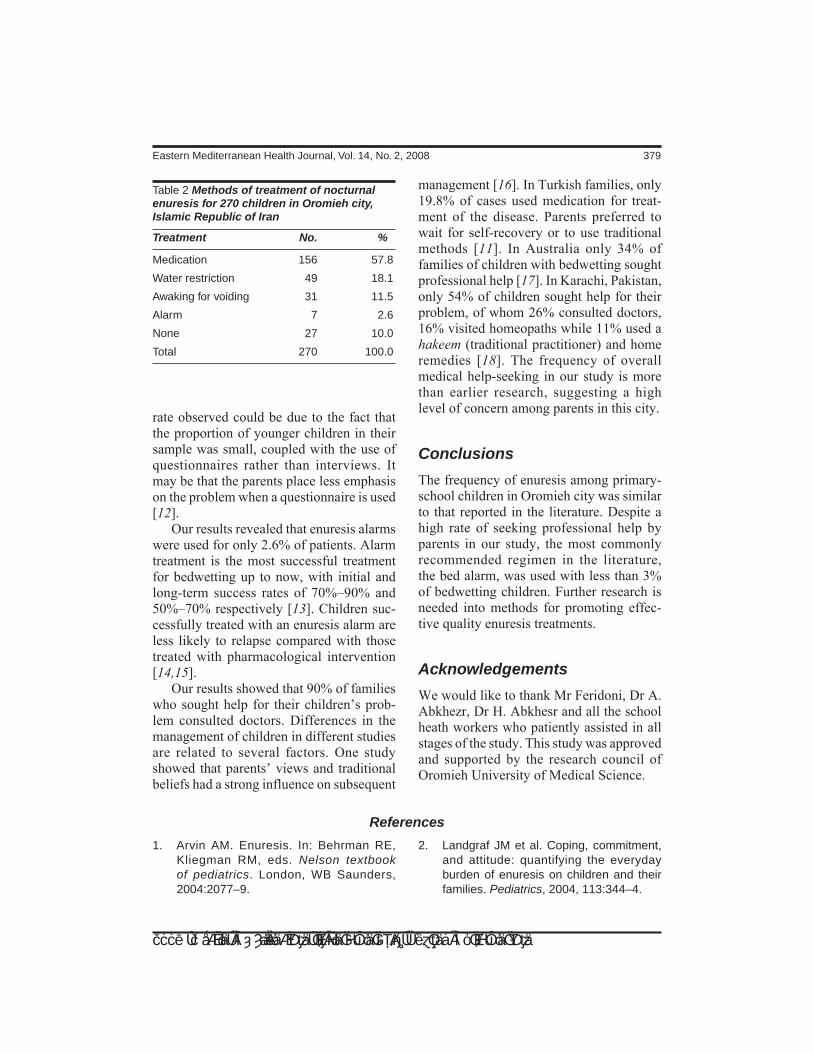
Eastern Mediterranean Health Journal, Vol. 14, No. 2, 2008 379
املجلة الصحية لشرق املتوسط، منظمة الصحة العاملية، املجلد الرابع عشر، العدد ٢، ٢٠٠٨
rate observed could be due to the fact that the proportion of younger children in their sample was small, coupled with the use of questionnaires rather than interviews. It may be that the parents place less emphasis on the problem when a questionnaire is used [12].
Our results revealed that enuresis alarms were used for only 2.6% of patients. Alarm treatment is the most successful treatment for bedwetting up to now, with initial and long-term success rates of 70%–90% and 50%–70% respectively [13]. Children suc-cessfully treated with an enuresis alarm are less likely to relapse compared with those treated with pharmacological intervention [14,15].
Our results showed that 90% of families who sought help for their children’s prob-lem consulted doctors. Differences in the management of children in different studies are related to several factors. One study showed that parents’ views and traditional beliefs had a strong influence on subsequent
management [16]. In Turkish families, only 19.8% of cases used medication for treat-ment of the disease. Parents preferred to wait for self-recovery or to use traditional methods [11]. In Australia only 34% of families of children with bedwetting sought professional help [17]. In Karachi, Pakistan, only 54% of children sought help for their problem, of whom 26% consulted doctors, 16% visited homeopaths while 11% used a hakeem (traditional practitioner) and home remedies [18]. The frequency of overall medical help-seeking in our study is more than earlier research, suggesting a high level of concern among parents in this city.
Conclusions
The frequency of enuresis among primary-school children in Oromieh city was similar to that reported in the literature. Despite a high rate of seeking professional help by parents in our study, the most commonly recommended regimen in the literature, the bed alarm, was used with less than 3% of bedwetting children. Further research is needed into methods for promoting effec-tive quality enuresis treatments.
Acknowledgements
We would like to thank Mr Feridoni, Dr A. Abkhezr, Dr H. Abkhesr and all the school heath workers who patiently assisted in all stages of the study. This study was approved and supported by the research council of Oromieh University of Medical Science.
Table 2 Methods of treatment of nocturnal enuresis for 270 children in Oromieh city, Islamic Republic of Iran
Treatment No. %
Medication 156 57.8
Water restriction 49 18.1
Awaking for voiding 31 11.5
Alarm 7 2.6
None 27 10.0
Total 270 100.0
References
1. Arvin AM. Enuresis. In: Behrman RE, Kliegman RM, eds. Nelson textbook of pediatrics. London, WB Saunders, 2004:2077–9.
2. Landgraf JM et al. Coping, commitment, and attitude: quantifying the everyday burden of enuresis on children and their families. Pediatrics, 2004, 113:344–4.
380 La Revue de Santé de la Méditerranée orientale, Vol. 14, No 2, 2008
املجلة الصحية لشرق املتوسط، منظمة الصحة العاملية، املجلد الرابع عشر، العدد ٢، ٢٠٠٨
3. Schober JM et al. The impact of mono-symptomatic nocturnal enuresis on at-tachment parameters. Scandinavian journal of urology and nephrology, 2002, 38:47–52.
4. Thiedke C. Nocturnal enuresis. American family physician, 2003, 67(7):1499–506.
5. Glanzener CM, Peto RE, Evans JH. Effect of intervention for treatment of nocturnal enuresis in children. Quality & safety in health care, 2003, 12:390–4.
6. Longstaffe S, Moffat ME, Whalten JC. Be-havioral and self-concept changes after six months of enuresis treatment: a ran-domized controlled trial. Pediatrics, 2000, 105:935–40.
7. Akis N, Irgi E, Aytekin N. Enuresis and effective factors. Scandinavian journal of urology and nephrology, 2002, 37:199–203.
8. Redsell SA, Collierv J, Evans J. Children presenting at UK community clinics—comparison with hospital-based samples. Scandinavian journal of urology and ne-phrology, 2003, 37:239–45.
9. Hjalmas K. Enuresis in children. Brazilian journal of urology, 2002, 28:232–49.
10. Ugurlap S et al. Frequency of enuresis, constipation and enuresis association with constipation in a group of school chil-dren aged 5–9 years in Malayata, Turkey. Turkish journal of medical science, 2003, 33:315–20.
11. Unalack M et al. Enuresis nocturna: prev-alence and risk factors among school age children in northwest Turkey. European journal of general medicine, 2004, 1:21–5.
12. Eapen V, Mabrouk AM. Prevalence and correlates of nocturnal enuresis in the United Arab Emirates. Saudi medical journal, 2003, 24(1):49–51.
13. Leerdam FJ et al. Alarm treatment is successful in children with day- and night-time wetting. Scandinavian journal of urol-ogy and nephrology, 2004, 38:211–5.
14. Dhanidharka VR. Primary nocturnal enu-resis—where do we stand? Indian pediat-rics, 2000, 37:135–40.
15. Taneli C et al. Effect of alarm treatment on bladder storage capacities in monosymp-tomatic nocturnal enuresis. Scandinavian journal of urology and nephrology, 2004, 38:207–10.
16. Chao SM et al. Primary monosympto-matic nocturnal enuresis in Singapore. Parental perspective in an Asian commu-nity. Annals of the Academy of Medicine of Singapore, 1997, 26(2):179–83.
17. Cadwell Ph et al. Bedwetting and toilet training problems in children. Medical journal of Australia, 2005, 182(4):190–2.
18. Mithani S, Zaidi Z. Bed wetting in school children of Karachi. Journal of the Pakistan Medical Association, 2005, 55(1):2–5.

Eastern Mediterranean Health Journal, Vol. 14, No. 2, 2008 381
املجلة الصحية لشرق املتوسط، منظمة الصحة العاملية، املجلد الرابع عشر، العدد ٢، ٢٠٠٨
Knowledge of Iraqi primary health care physicians about breastfeedingE.J. Al-Zwaini,1 S.J. Al-Haili2 and T.M. Al-Alousi3
1Department of Paediatrics, Al-Kindey College of Medicine, Baghdad University, Baghdad, Iraq (Correspondence to E.J. Al-Zwaini: [email protected]). 2Department of Paediatrics, College of Medicine, Al-Anbar University, Ramadi, Iraq.3Maternity and Child Hospital, Ramadi, Iraq.Received: 21/11/02; accepted: 08/02/06
ABSTRACT A questionnaire survey was conducted on 50 primary health care physicians in Ramadi city, Iraq, in 2001 to assess their knowledge and identify misperceptions about breastfeeding. Basic knowledge about the main processes of breastfeeding was good (when to start feeding, frequency of feeding, relactation, importance of psychological factors), but there were deficiencies in their ability to deal with some practical problems related to breastfeeding. Only 64% would advise continuation of breastfeeding when a lactating mother discovers that she is pregnant, 38% of them thought a mother’s ability to breastfeed was related to breast size and only 66% knew when to start feeding after caesarean section. Steps for improving the knowledge and training are addressed.
Connaissances des médecins de soins primaires iraquiens en matière d’allaitement maternelRÉSUMÉ Une enquête par questionnaire a été réalisée en 2001 auprès de 50 médecins de soins primaires à Ramadi (Iraq) afin d’évaluer leurs connaissances et de détecter les idées erronées qu’ils pouvaient avoir au sujet de l’allaitement maternel. Leurs connaissances élémentaires sur les principes essentiels de l’allaitement maternel étaient satisfaisantes (début idéal de l’allaitement, fréquence, relactation, importance des facteurs psychologiques), mais ils avaient parfois des difficultés à remédier à certains problèmes pratiques relatifs à la promotion de l’allaitement au sein. Seuls 64 % d’entre eux conseillaient la poursuite de l’allaitement lorsqu’une mère allaitant découvrait qu’elle était enceinte, 38 % pensaient que la capacité d’une mère à allaiter avait un rapport avec la taille des seins et 66 % seulement savaient quand faire débuter l’allaitement après une césarienne. Des mesures destinées à améliorer les connaissances et la formation sont à l’étude.
2001
643866

382 La Revue de Santé de la Méditerranée orientale, Vol. 14, No 2, 2008
املجلة الصحية لشرق املتوسط، منظمة الصحة العاملية، املجلد الرابع عشر، العدد ٢، ٢٠٠٨
Introduction
Beastfeeding is recognized as the best way to provide for both the growth and health of infants and has unique biological and emo-tional effects on the mother and child [1]. Promotion of exclusive breastfeeding in the first 4–6 months of life is one of the most effective interventions for improving child survival [2]. The mortality risk of artificially-fed infants is 3–5 times higher than for breastfed babies [3]. Breastfeeding is con-sidered a life-saving practice in developing countries and has been reported to improve infant survival rates in poor countries [4,5]. Despite the well-known benefits, there is a well-documented decline in breastfeeding in many countries, especially developing ones. In contrast, a resurgence of breast-feeding in many industrialized countries has been noted [6].
The decline of breastfeeding in develop-ing countries can be attributed to a variety of social, economic and cultural factors. The health services may contribute to the decline by failing to encourage mothers to breastfeed, by separating mothers and babies after birth and by promoting the use of formula milk [1]. All health workers, particularly primary health care physicians (PHCPs), play an important role in the ini-tiation and duration of breastfeeding. They should be able to promote breastfeeding, to provide appropriate information and to demonstrate a thorough practical knowl-edge of breastfeeding management [1]. However, among the documented causes of decline in breastfeeding are the attitudes and practices of health workers, particularly physicians who are known to be ambiva-lent about breastfeeding [7]. There are an increasing number of health professionals who are ill-educated with regard to breast-feeding and have misconceptions about human milk and a negative attitude towards
breastfeeding [8]. When confronted with lactation difficulties in new mothers, many find it easier to recommend formula milk to prevent further problems and inconvenience [9]. Additionally, health workers are not immune to popular beliefs and practices concerning breastfeeding and lactation that are deeply ingrained in many societies [10]. Some of these beliefs might be harmful.
An active programme to promote breast-feeding was adopted by the Iraqi Ministry of Health (MOH) in 1992. The goals were to decrease mortality and morbidity and the prevalence of malnutrition in infants less than 2 years of age. In Iraq in 1997 the percentages of mothers breastfeeding for 1 month was 91.8%, for 2 months 80.6%, for 3 months 76%, between 4–12 months 63%–68% and in the 2nd year 50% [11].
The aim of this study was to assess the knowledge and to identify misperceptions about breastfeeding among PHCPs in Al-Anbar governorate of Iraq.
Methods
This cross-sectional study was conducted at the maternity and child hospital in Ra-madi city. All PHCPs participating in a refresher course carried out in the hospital during May 2001 were the subject of this study. This course was one of the many courses arranged by the MOH with the aim of improving the knowledge and practice of physicians working at primary health care centres. It usually invites doctors from all provinces in the governorate and covers subjects related to programmes adopted by the MOH such as acute respiratory in-fections, control of diarrhoeal diseases, expanded programme of immunization and breastfeeding. There are 149 physicians in the 113 health care centres in different provinces of the governorate.

Eastern Mediterranean Health Journal, Vol. 14, No. 2, 2008 383
املجلة الصحية لشرق املتوسط، منظمة الصحة العاملية، املجلد الرابع عشر، العدد ٢، ٢٠٠٨
Self-administered pretested question-naires were distributed to all PHCPs before the start of the course. The objective of the study was explained to all participants. Physicians filled the questionnaires simul-taneously, privately and separately. In order to increase the response rate and ensure the answers were candid, the questionnaire was anonymous. The questionnaire was designed to test the background knowledge of physicians about the process of breast-feeding, such as breastfeeding in newly pregnant mothers, breastfeeding and diar-rhoea, effects of psychological factors, diet and size of breast on breastfeeding, the use of pacifiers and the adverse effects of breastfeeding on the health of mothers. It also included questions to test the ability of physicians to deal with different problems and questions they may face during their practice, such as when to start breastfeeding after normal vaginal delivery and caesarean section, relactation, cracked nipples, how often a mother should breastfeed her baby and when to start complementary foods.
The respondents were given sufficient time to fill out the questionnaires (20 min-utes) and questionnaires with incomplete data were eliminated from the final analy-sis. Since the questionnaires were designed to assess the knowledge of PHCPs about breastfeeding, recall bias was not a prob-lem.
Results
A total of 50 PHCPs filled the question-naires completely. There were 17 (34%) males and 33 (66%) females and the mean age was 36 (standard deviation 5.8) years.
Table 1 shows a summary of the overall response of physicians to questions about basic knowledge about the process of the breastfeeding. Almost all of the respondents (98%) gave a satisfactory response about
Table 1 Overall response of primary care physicians (n = 50) in Al-Anbar to questions about breastfeeding
Question No. %
When a breastfed baby develops diarrhoea Stop breast feeding immediately 0 0 Continue breastfeedinga 49 98 Don’t know 1 2
Breastfeeding and new pregnancy Stop breastfeeding immediately 7 14 Continue for weeks 8 16 Continue for monthsa 32 64 Don’t know 3 6
Relationship between psychological factors and successful breastfeeding There is a relationa 47 94 No relation 3 6 Don’t know 0 0
Relationship between size of breast and successful breastfeeding There is a relation 19 38 No relationa 29 58 Don’t know 2 4
Relationship between diet of the mother and successful breastfeeding There is a relationa 39 78 No relation 10 20 Don’t know 1 2
Breastfeeding as contraception Usefula 44 88 Not useful 3 6 Don’t know 3 6
The use of a pacifier Useful and desirable 1 2 Not useful, not harmful 5 10 Not useful and harmfula 43 86 Don’t know 1 2
Breastfeeding has adverse effects on the health of mothers Yes 8 16 No 41 82 Don’t know 1 2aCorrect answer.

384 La Revue de Santé de la Méditerranée orientale, Vol. 14, No 2, 2008
املجلة الصحية لشرق املتوسط، منظمة الصحة العاملية، املجلد الرابع عشر، العدد ٢، ٢٠٠٨
continuation of breastfeeding if an infant develops diarrhoea, but only 32 (64%) of them would advise continuation of breast-feeding for months when a lactating mother discovers that she is pregnant; 14% would advise her to stop breastfeeding immedi-ately.
The majority of the physicians (94%) gave the correct answer regarding the re-lationship between psychological factors and successful breastfeeding but 38% of them thought that the mother’s ability to breastfeed is related to her breast size.
When asked about the relationship be-tween diet and successful breastfeeding, 78% of the respondents believed there was a relation while 20% thought there was not.
The majority of the PHCPs gave the correct answers when asked about the role of breastfeeding as a contraceptive (88%), harmful effects of pacifiers (86%) and the lack of an adverse effect of breastfeeding on the health of mothers (82%).
Table 2 shows the response of physi-cians to questions to explore their abilities to deal with practical points about how to breastfeed. The majority of the PHCPs (92%) knew when mothers with normal vaginal delivery should start feeding but only 66% knew when to start it after caesar-ean section.
When physicians were asked about how often a mother should breastfeed her baby, only 36 (72%) knew the right frequency (on demand). Most of the physicians (82%) be-lieved that a mother who stops breastfeed-ing temporarily for weeks or months could start breastfeeding again if she wanted.
When the physicians were asked about the management of cracked nipples, only 14% would advise the use of antiseptic oint-ment or antibiotics and 34% would advise to wash the breast with soap and water; 42% would advise to continue breastfeeding without treatment and 8% would suggest termination of breastfeeding.
Table 2 Responses of primary care physicians (n = 50) in Al-Anbar to questions about practical aspect of breastfeeding
Question No. %
When after normal vaginal delivery should mothers start breastfeeding? 30 minutesa 46 92 6 hours 2 4 1 day 2 4 3 days 0 0 Don’t know 0 0
When after caesarean section should mothers start breastfeeding? 12 hoursa 33 66 1 day 11 22 3 days 1 2 Don’t know 5 10
How often should mothers breastfeed their babies? Every 2 hours 9 18 Every 4 hours 4 8 Every 6 hours 0 0 On demanda 36 72 Don’t know 1 2
Relactation Possiblea 41 82 Not possible 5 10 Don’t know 4 8
Management of cracked nipples Stop breastfeeding 4 8 Wash breast with soap and water only 17 34 Use antiseptic ointment and antibioticsa 7 14 Continue breastfeeding without treatment 21 42 Don’t know 1 2
When to start semisolid foods Before 4 months 0 0 4–6 monthsa 46 92 After 6 months 4 8 Don’t know 0 0aCorrect answer.

Eastern Mediterranean Health Journal, Vol. 14, No. 2, 2008 385
املجلة الصحية لشرق املتوسط، منظمة الصحة العاملية، املجلد الرابع عشر، العدد ٢، ٢٠٠٨
Regarding the best time to start sup-plemental foods for the infant, the major-ity (92%) gave the correct answer (4–6 months).
Discussion
This study demonstrates clearly that PHCPs are deficient in some aspects of their basic knowledge about breastfeeding and in their abilities to deal with practical problems re-lated to the promotion of breastfeeding.
Although the majority of PHCPs (98%) would advise a mother to continue breast-feeding if the baby develops diarrhoea, only 64% of them would advise continuing breastfeeding for months when the mother discovers that she is pregnant. It is not necessary to stop breastfeeding when a lac-tating mother becomes pregnant. While the quantity of milk may decrease, the quality of milk may be still good and breastfeeding for the first few months of pregnancy will cause no harm to the child in her uterus [12]. In a study of female college students in Ramadi city in 2001, only 11% thought that a pregnant woman should continue breast-feeding for months [13]. Furthermore, a study of Ramadi women found that weaning from the breast was due to a new pregnancy in 36% [14]. In a study from Sudan, the majority of the mothers (89.2%) thought that a new pregnancy contraindicated the continuation of breastfeeding [15] and in Norway a new pregnancy was found to be the only important reason for ceasing to breastfeed within 2 years [16]. The concept of stopping breastfeeding when a mother discovers she is pregnant is probably deeply ingrained and widespread throughout the world [10,17,18]. In a study from the United Kingdom, 23% of the health professionals agreed that breastfeeding should stop if pregnancy occurs, and a further 22% were not sure. In Saudi Arabia, 32% of health
workers would advise to stop breastfeeding immediately when a mother got pregnant [17,19].
When the PHCPs were asked about the role of psychological factors, diet and size of the breast in successful breastfeed-ing, the majority (94%) recognized the importance of psychological factors but only 78% believed in the role of the diet and 38% of them thought the size of breast was important for successful breastfeed-ing. The role of psychological factors is beyond doubt. Anxiety, associated with unfounded fears of lactation failure and of milk insufficiency, is one of the most com-mon reasons for mothers failing to initiate breastfeeding, interrupting it prematurely or beginning complementary feeding before it is nutritionally required. Emotional sup-port will strengthen a mother’s confidence that she can successfully breastfeed [1]. One-third of the PHCPs in this study were unaware of the role of dietary factors in successful breastfeeding. Nutritional re-quirements during lactation are greater than in pregnancy, so women should be taught about the importance of adequate diet in order to sustain lactation without depleting their own nutritional store. Particular at-tention should be paid to intake of protein, calcium and vitamins. One of the important misperceptions about breastfeeding shown in this study is the belief that successful breastfeeding is affected by the size of the breast. A similar figure was obtained among female college students in Ramadi city [13]. This supports the idea that doctors are not immune to widespread misconceptions about breastfeeding in the community. Ef-forts should be made to increase the aware-ness of PHCPs and other health workers about this issue.
The use of pacifiers is thought to be one of the causes for early weaning [1,20–22]. In one study the risk that a child would be
386 La Revue de Santé de la Méditerranée orientale, Vol. 14, No 2, 2008
املجلة الصحية لشرق املتوسط، منظمة الصحة العاملية، املجلد الرابع عشر، العدد ٢، ٢٠٠٨
weaned at any age between 1–24 months was higher in pacifier users than in non-users [23]. Most of our PHCPs (86%) un-derstood the harmful effects of pacifiers. Avoidance of pacifiers is one of the steps adopted by the World Health Organization (WHO) to promote successful breastfeeding [1].
Of the participating physicians, 16% thought that breastfeeding adversely af-fects the health of lactating mothers. These adverse effects ranged from hair loss, time wasting to maternal nutritional depletion. This is a slightly lower figure than among female college students in Ramadi city (22%) [13]. These misbeliefs about the adverse effects of breastfeeding seem to be widespread in our community. Other adverse effects of breastfeeding that were suggested were disease transmission and spoiling the shape of the breast. Some of these claimed adverse effects are incorrect (spoiling the shape of the breast and time wasting), some are erroneously attributed to breastfeeding (hair loss can explained by hormonal changes occurring around the time of delivery) and some are preventable (disease transmission and nutritional deple-tion).
PHCPs play an important role in the ini-tiation and success of breastfeeding and they are usually challenged by critical questions regarding the initiation and continuation of breastfeeding. Their ability to help mothers to breastfeed successfully and solve prob-lems related to breastfeeding is proportional to their knowledge about breastfeeding. When the PHCPs were asked about the best time for starting breastfeeding after normal vaginal delivery, the majority (92%) gave a satisfactory response, but when asked about the best time to start it after caesarean section, only 66% knew the correct answer. Breastfeeding should start as early as pos-sible, preferably within the first hours. After
caesarean section, the mother will probably require more help to find a comfortable feeding position and to attach the baby to the breast in the first few days than she would if she had been vaginally delivered [24]. The small number of PHCPs who re-sponded correctly to the question about the right time for first feeding after caesarean section is probably related to the fact that they are not usually in contact with women after caesarean section.
About two-thirds of PHCPS recognized on-demand feeding as the best frequency for feeding a baby. Most recent studies recommend on-demand feeding, whereby babies are offered breastfeeding whenever they want [25–28]. In one study from Spain, on-demand feeding was found to be strongly associated with successful breastfeeding in both hospital and home deliveries [29]. En-couraging breastfeeding on demand is one of the steps adopted by WHO for successful breastfeeding [1].
Most of the participating physicians (82%) knew that relactation is possible. This is reassuring when compared with the response of the health workers from Saudi Arabia (30%) [19]. Relactation is possible and there are steps that can be taught to a mother if she needs to restart breastfeeding [27]. A woman of any age can relactate, if she is adequately motivated for frequent suckling, irrespective of her parity, nutri-tional status, lactation gap, birth order of the child or whether she has fed her previ-ous baby or not [2]. Unfortunately, only 39% of female college students in Ramadi city knew about relactation [13]. This low response probably reflects the misbelief of the older women in our community that this milk might be harmful for the baby.
PHCPs in this study seemed to be igno-rant about how to deal with the problem of cracked nipples. Only 14% recommended the use of antiseptic ointment or antibiot-
Eastern Mediterranean Health Journal, Vol. 14, No. 2, 2008 387
املجلة الصحية لشرق املتوسط، منظمة الصحة العاملية، املجلد الرابع عشر، العدد ٢، ٢٠٠٨
ics. Lactating mothers are more likely to develop sore nipples, especially those with engorged breasts and women with small or flat nipples. Sometime soreness might develop into a crack, which is very painful and might interfere with breastfeeding.
When asked about the best time to start semisolid foods, the majority of physicians (92%) knew the correct answer. This posi-tive response is consistent with what is rec-ommended by WHO [1] and most standard paediatric textbooks.
The role of the entire health system is considered vital for breastfeeding to be suc-cessfully initiated and established. Ideally, all health workers with whom expectant and new mothers come into contact should be committed to promoting breastfeeding and should be able to provide appropriate information as well as demonstrate a thor-ough practical knowledge of breastfeeding management [1].
From the results of this study, we con-clude that PHCPs in Al-Anbar governorate lack some basic knowledge about breastfeed-
ing and are inadequately trained to manage some related problems. As breastfeeding is considered a life-saving practice in develop-ing countries and the role of health workers, especially PHCPs, in protecting, promoting and supporting breastfeeding is undisputed, the need for improving knowledge and training of PHCPs is vital. This can be achieved through many steps such as: the integration of WHO basic concepts related to breastfeeding programmes into the cur-riculum of all medical colleges; including topics related to breastfeeding updates in continuous medical education programmes; and making available to all PHCPs the WHO/UNICEF publications related to breastfeeding. Furthermore, establishing breastfeeding clinics in the major primary health care centres in the governorate is essential. These clinics should be managed by physicians who are adequately trained to manage and promote breastfeeding and are well-prepared to deal with the many problems that might be encountered by lactating mothers.
References1. Protecting, promoting and supporting
breast-feeding. The special role of ma-ternity services. A joint WHO/UNICEF statement. Geneva, World Health Organi-zation, 1989.
2. The optimal duration of exclusive breast-feeding. Results of a WHO systematic re-view. Geneva, World Health Organization, 2001 (Note for the press No. 7) (http://www.who.int/inf-pr-2001/en/note2001-07.html, accessed 16 August 2007).
3. Macedo CG. Infant mortality in the Ameri-cas. Bulletin of the Pan American Health Organization, 1988, 22:303–12.
4. Report of the Task Force on the Assess-ment of the Scientific Evidence Relat-ing to infant feeding practice and infant health. Pediatrics, 1984, 74:529–762.
5. Briend A, Wojtyniak, Rowland MGM. Breast feeding, nutritional state, and child survival in rural Bangladesh. British medi-cal journal, 1988, 296:879–82.
6. The state of child health in the Eastern Mediterranean Region, 2nd ed. Alexan-dria, World Health Organization Regional Office for the Eastern Mediterranean, 1995:116 (WHO/EMRO Technical Publi-cation, No. 9).
7. Helsing E, Randa S. Baby friendly hospital initiative. In: Scientific update: Compen-dium of articles on lactation and human milk: Issue 1. Copenhagen, World Health Organization Regional Office for Europe, 1993.
8. Breastfeeding patterns: a review of stud-ies in the Eastern Mediterranean Region,

388 La Revue de Santé de la Méditerranée orientale, Vol. 14, No 2, 2008
املجلة الصحية لشرق املتوسط، منظمة الصحة العاملية، املجلد الرابع عشر، العدد ٢، ٢٠٠٨
2nd ed. Alexandria, World Health Or-ganization Regional Office for the Eastern Mediterranean, 1993 (WHO/EMRO Tech-nical Publication, No. 4).
9. Michelman D, Faden R, Giolen A. Pedia-tricians and breastfeeding promotion: attitude, beliefs and practice. American journal of health promotion, 1990, 4:181–6.
10. Bella H, Dabal BK. Misperceptions about breast feeding among Saudi female col-lege students. Annals of Saudi medicine, 1998, 18:69–72.
11. [Survey about breast feeding and comple-mentary feed in Iraq]. Baghdad, Ministry of Health in cooperation with World Health Organization, 1997:9 [in Arabic].
12. Guidelines for training community health workers in nutrition, 2nd ed. Geneva, World Health Organization, 1986.
13. Al-Zwaini EJ et al. Misperceptions about breast feeding among female college students in Ramadi. Journal of Al-Anbar, 2001, 3:10–5.
14. Al-Hamwandi A, Al-Ani Z, Al-Jugaifi T. Weaning patterns in Ramadi district. Jour-nal of Al-Anbar, 2001, 3:43–8.
15. Salih MA et al. Attitude and practices of breast-feeding in Sudanese urban and ru-ral communities. Tropical and geographi-cal medicine, 1993, 45:171–4.
16. Bohler E, Bergström S. Premature wean-ing in east Bhutan: only if the mother is pregnant again. Journal of biosocial sci-ence, 1995, 27:253–65.
17. Beeken S, Waterston T. Health services support of breast-feeding: are we prac-tising what we preach? British medical journal, 1992, 305:285–7.
18. Anokute CC. Infant feeding in King Khalid university hospital. Journal of the Royal Society of Health, 1988, 108:199–200.
19. Bella H. Are health workers adequately trained to manage and promote breast
feeding? Saudi medical journal, 1998, 19:441–5.
20. Barros FC et al. Use of pacifiers is as-sociated with decreased breast feeding duration. Pediatrics, 1995, 95:497–9.
21. Vogel AM, Hutchison BL, Mitchell EA. The impact of pacifier use on breast-feeding: a prospective cohort study. Journal of pae-diatrics and child health, 2001, 37:58–63.
22. Kramer MS et al. Pacifier use, early wean-ing, and cry/fuse behavior: a randomized controlled trial. Journal of the American Medical Association, 2001, 286:322–6.
23. Victoria CG et al. Use of pacifiers and breast feeding duration. Lancet, 1993, 341:404–6.
24. Royal College of Midwives. Success-ful breast feeding, 2nd ed. Edinburgh, Churchill Livingstone, 1991:77.
25. Cunningham AS, Jelliffe DB, Jelliffe EFB. Breast-feeding and health in the 1980s: a global epidemiological review. In: Sci-entific update: compendium of articles on lactation and human milk: Issue 1. Copen-hagen, World Health Organization Re-gional Office for Europe, 1993:659–62.
26. King FS. Helping mothers to breastfeed. Nairobi, African Medical and Research Foundation, 1987.
27. Helsing E, King FS. Breast feeding in practice. A manual for health workers. Ox-ford, Oxford Medical Publications, 1985.
28. Cameron M, Hofvander Y. Manual on feeding infants and young children. Ox-ford, Oxford University Press, 1983.
29. Temboury Molina MC et al. Importancia de las rutinas de la maternidad en el exito de la lactancia materna [Importance of maternity routines in the success of ma-ternal breast-feeding]. Anales espanoles de pediatria, 1992, 36:367–70.
Eastern Mediterranean Health Journal, Vol. 14, No. 2, 2008 389
املجلة الصحية لشرق املتوسط، منظمة الصحة العاملية، املجلد الرابع عشر، العدد ٢، ٢٠٠٨
Attitudes and beliefs about cervical smear testing in ever-married Jordanian womenZ.O. Amarin,1 L.F. Badria1 and B.R. Obeidat1
1Department of Obstetrics and Gynaecology, Jordan University of Science and Technology, Irbid, Jordan (Correspondence to Z.O. Amarin: [email protected]).Received: 10/10/05; accepted: 23/01/06
ABSTRACT To investigate attitudes and beliefs that affect a woman’s decision to undergo cervical smear screening, we carried out a survey of 760 women attending general obstetrics and gynaecology clinics in Irbid, Jordan between June 2004 and April 2005. Knowledge of cervical cancer and the Pap smear test was inadequate in less-educated and older patients. Of the 109 women who had previously had the test, 104 (95.4%) had opportunistic testing. Around 95% of the sample had never had the test. Major barriers to Pap smear screening included inadequate knowledge about the test, not being referred by a health professional and fear of having a bad result. The current screening programme is not effective in reaching the majority of the population.
Attitudes et croyances vis-à-vis des frottis du col de l’utérus chez des femmes jordaniennes non célibatairesRÉSUMÉ Afin d’étudier les attitudes et les croyances qui influencent la décision d’une femme à se soumettre à un frottis du col de l’utérus, nous avons réalisé une enquête auprès de 760 femmes se rendant aux consultations d’obstétrique générale et de gynécologie à Irbid (Jordanie) entre juin 2004 et avril 2005. Les connaissances relatives au cancer du col de l’utérus et au frottis cervico-utérin (test de Papanicolaou) étaient insuffisantes chez les patientes les moins instruites et les plus âgées. Sur les 109 femmes qui avaient déjà subi le test, 104 (95,4 %) avaient fait l’objet d’un dépistage opportuniste. Près de 95 % des femmes de l’échantillon n’avaient jamais subi cet examen. Les principaux obstacles au frottis cervico-utérin étaient le manque de connaissances sur cet examen, le fait de ne pas être adressée par un professionnel de santé et la peur de mauvais résultats. Le programme de dépistage actuel ne parvient pas à atteindre la majorité de la population.
20042005760
10910495.495

390 La Revue de Santé de la Méditerranée orientale, Vol. 14, No 2, 2008
املجلة الصحية لشرق املتوسط، منظمة الصحة العاملية، املجلد الرابع عشر، العدد ٢، ٢٠٠٨
Introduction
From a global perspective cervical cancer is the third most common form of cancer among women [1]. It is also potentially one of the most preventable [2]. Ever since the concept of cervical smears was first de-scribed by Papanicolaou and Traut in 1941, screening for cervical cancer has been one of the few tests which have been shown to be able to directly reduce mortality and morbidity [3]. For this to be achieved, how-ever, there must be a high rate of accept-ance by women of regular and high quality testing, with follow-up of abnormalities. A systematic, population-based screening programme which incorporates a call–recall system and adequate quality control meas-ures can help to ensure maximum benefit and impact on incidence and mortality of the disease [4].
In many developed countries where sophisticated screening programmes are established, cervical cancer has decreased considerably [5]. In developing countries, on the other hand, the situation is quite dif-ferent. Cervical cancer is the most common female malignancy in a few countries [6,7], with very little change in its incidence. Morbidity and mortality are high because most women present at an advanced stage of the disease [8].
In many developing countries, wom-en’s knowledge of cervical cancer is very limited. It has been demonstrated that the vast majority of women in some coun-tries had not heard of cervical cancer and even more knew nothing about cervical screening [9,10]. It seems that the discrep-ancy between developed and developing countries concerning rates of incidence and mortality of cervical cancer is paralleled by a similar discrepancy regarding education and knowledge of cervical cancer and its prevention. Another reason for poor uptake
in the cervical screening programme may be the lack of communication between healthcare workers and patients regarding availability and benefits of the screening.
In developed countries, infrequent up-take of cervical smear tests is more often recorded among women who are older, poorer or from minority backgrounds [11]. Furthermore, demographic factors such as age, education and ethnicity, and sociopsy-chological factors such as social class, per-sonality, embarrassment, fear and lack of health insurance, and also structural factors such as beliefs, attitude and knowledge about the disease and the smear test have been documented as determinants of an in-dividual’s participation in cancer screening [12,13]. Another important issue, for which few published data are available, is whether women who are informed about the benefits of cervical screening may be reluctant for some reason to have cervical smears.
This survey was carried out in order to collect information concerning knowledge, attitudes and practices towards cervical cancer, the Papanicolaou (Pap) test and barriers to screening, and to investigate the influence of socioeconomic background on knowledge and use of cervical cancer screening. The results will provide baseline information on cervical cancer screening uptake among women in Jordan.
Methods
The study was performed between June 2004 and April 2005 at King Abdallah University Hospital at Jordan University of Science and Technology, Irbid, Jordan. This is a large tertiary referral hospital serving mainly the northern part of the country.
A questionnaire was constructed for this survey to measure health behaviours in national surveys. The questionnaire was

Eastern Mediterranean Health Journal, Vol. 14, No. 2, 2008 391
املجلة الصحية لشرق املتوسط، منظمة الصحة العاملية، املجلد الرابع عشر، العدد ٢، ٢٠٠٨
pilot-tested in a sample of 30 women who were not part of the study sample to ensure cultural acceptance and level of validity and degree of repeatability (ĸ = 0.85).
Only married or previously married women were included in the study (single women were excluded for cultural reasons). Questionnaires were given to all 794 eligi-ble women who were attending 3 general obstetrics and gynaecology clinics during the study period. Informed consent was obtained verbally from all the participants. Thirty four women refused to participate when invited or responded incompletely to the questionnaire and were excluded.
The information included in the ques-tionnaire was of a multiple choice type and covered: demographic data on age, occupa-tion, education, marital status, number of children; general knowledge about cervical cancer and cervical smear tests; data on reasons and circumstances of having/not having a smear test; and general preferences about future testing.
Results
Of the 794 questionnaires distributed to the clinics, 760 (95.7%) were completed. De-mographic characteristics of the respond-ents are shown in Table 1. The mean age of the women completing the survey was 36.4 [standard deviation (SD) 8.9; range 17–72)] years. Educational attainment ranged from no formal schooling to vocational college education or higher. Over 80% of the wom-en had completed primary school.
The mean number of children was 5.3 (SD 1.8). Women who had delivered chil-dren were significantly more likely to have received a Pap smear (96.9%) than women who had no children (P < 0.05). We found that 85.0% (646) reported that they were
currently sexually active, and of these, 65.7% (425) reported using some type of birth control. The most commonly used methods were coitus interruptus (34%), rhythm method (24%), sheath (14%), oral contraception (9%), and the intra-uterine device (6%). The mean number of annual clinic visits (family planning and general gynaecology clinics) was 4.2 (SD 1.8; range: 1–20).
Approximately half (48.8%) the wom-en interviewed had heard about the Pap smear and 253 (33.3%) had heard about cervical cancer. These had a higher level of education: secondary or college versus no education or primary school only (P < 0.001 for both). Despite the moderate
Table 1 Sociodemographic data for a sample of 760 ever-married women from Irbid, Jordan
Characteristic No. %
Age group (years) 17–24 167 22.0 25–44 372 48.9 45–66 154 20.3 > 66 67 8.8
Employment status Employed 114 15.0 Unemployed 646 85.0
Educationa No formal schooling 121 15.9 Primary 349 45.9 Secondary 167 22.0 College/university 121 15.9
Marital status Married 661 87.0 Widowed/divorced 99 13.0
Parity Parous 737 96.9 Nulliparous 23 3.0aData missing for 2 participants.

392 La Revue de Santé de la Méditerranée orientale, Vol. 14, No 2, 2008
املجلة الصحية لشرق املتوسط، منظمة الصحة العاملية، املجلد الرابع عشر، العدد ٢، ٢٠٠٨
awareness about cervical cancer, 85.7% of the women had never received a Pap smear. One hundred and nine had ever had a Pap smear (14.3%; 104 opportunistic and 5 non-opportunistic), and more than half of these (52.2%) had smears within the previous 3 years. Only 5.6% reported having regular tests. The rates of smear testing varied significantly with age. Older women were the least likely to have Pap smears in their lifetime, currently or regularly; < 8.0% of the 66 participants ≥ 65 years old had had a Pap smear within the previous 3 years, and only 4.6 % had regular examinations.
For the 14.3% of women who had ever received a Pap smear, the average length of time they planned until their next smear was 0.9 (SD 0.4; range: 1–5) years. Further, 62.8% of respondents who had heard of the Pap smear preferred a female health care provider and 11.5% reported being very reluctant to have a Pap smear if only a male health care provider was available. The responses to questions assessing women’s knowledge about the Pap test and prefer-ence about future screening are shown in Table 2.
Among the 52 women (47.7%) who had not had a Pap smear within the previ-ous 3 years, the most frequent reason was anxiety regarding physical privacy. Other reasons for not seeking screening among the whole study sample related to a lack of knowledge about cervical cancer screening. Some women believed that screening was only applicable when it was suggested by a health professional. Others were fearful of having a bad result or were too embarrassed to undergo the test. Some believed that the sampling technique would be painful. The potential barriers toward cervical cancer screening among the whole study popula-tion are shown in Table 3.
Table 2 Knowledge of the purpose of Pap smear screening and preferences regarding future testing among respondents who had heard of the test (n = 371)
Variable Knowledge No. %
Purpose of Pap smear Detection of cancer of the cervix 293 79.0 Prevention of cancer of the cervix 115 31.0 Detection of other cancers 22 5.9 Other 14 3.8
Preference about future testing Prefer a female health care provider 233 62.8 Would be very reluctant if only a male health care provider was available 41 11.1
Table 3 Perceived barriers to Pap smear screening in a sample of 760 ever-married women from Irbid, Jordan
Barrier No. %
Inadequate/lack of knowledge 509 67.0
Not suggested by a health professional 494 65.0
Fear of having a bad result 212 27.9
Embarrassment 197 25.9
Fear of pain 114 15.0
Absence of disease symptoms 114 15.0
Lack of time 106 13.9
Lack of privacy 60 7.9
Financial reasons 52 6.8
Difficulty accessing the service 49 6.4
Discussion
High coverage of women at risk of cervi-cal cancer is a key element in achieving a successful screening programme [14].

Eastern Mediterranean Health Journal, Vol. 14, No. 2, 2008 393
املجلة الصحية لشرق املتوسط، منظمة الصحة العاملية، املجلد الرابع عشر، العدد ٢، ٢٠٠٨
Since the introduction of the Pap test as a screening method, the incidence of invasive cervical cancer in countries where the ma-jority of women receive regular screening has decreased by more than 70% over the past 5 decades [15]. In contrast, some are still falling short of the objective of other countries that, by the year 2010, over 90% of all women will have had 1 cervical smear test within the preceding 3 years [16].
Reported prevalence of Pap testing was 80% among a random sample of British women aged 15–78 years [17], 87%–88% among Hispanic women in America [18] and 73% among women in Singapore [19]. The rate of Pap smear testing in our study was very low at 14.3% and only 7.5% had had a test within the previous 3 years and could be considered adequately screened. Of even more concern is that only 5.6% of the study population undergo regular screening. This is especially the case for the population most at risk for cervical cancer. Several factors could account for low preva-lence, including lack of organized screening programmes, lack of awareness, myths and misconceptions [18]. It is important that cervical cancer screening programmes are affordable, accessible, and considered appropriate by the target population. We as-sessed some of these aspects in our survey.
To attend the programme, women have to be aware both of the disease and of the means of early detection and preven-tion. There are several studies showing that knowledge about cervical cancer and Pap testing influences uptake of cervical cancer screening services [18,19]. This was especially true among the women in this study. Whereas about 80% of those interviewed knew cervical cancer could be detected, only 30.9% referred to the Pap test as a means to prevention. We identified this gap in knowledge as one of the most impor-tant determinants of inadequate screening
status. Lack of knowledge was reported by 66.9% of respondents as a perceived barrier to Pap smear testing. This is consistent with reports from other countries where lack of knowledge and factors related to low socio-economic status and education level were major barriers to screening [19,20].
The overall poor knowledge about cer-vical cancer and Pap testing in this study would greatly hamper a population-based cytologic screening programme. This poor knowledge may be related to lack of basic education. Nearly 16% of our respond-ents had no formal education. In a Kenyan survey, the illiteracy rate among cervical cancer patients was about 6 times higher than that among the general population of women aged 15–45 years [21].
Our findings demonstrated a lower uptake of Pap test receipt, currency and knowledge to be most prevalent among older age groups. This finding is congruent with a few other studies, where older age was shown to be associated with under-screening [22,23]. The underutilization of the Pap test among older women and their lower likelihood of having knowledge of the test are alarming as mortality rates from cervical cancer are highest among these women [24]. Similarly, and in agreement with other studies [25,26], lower level of education and knowledge was associated with a lower likelihood of Pap screening.
There is currently a lack of information on what educational strategy is most effec-tive for underserved women. A strategy that is successful for one group may not be suitable or appropriate for another. The recommendation of the general practitioner is most often acceptable, and is likely to lead to screening. It has been shown that health care provider recommendations are strong predictors of cervical cancer screen-ing [22]. Practitioners need to offer clear explanations and recognize the importance

394 La Revue de Santé de la Méditerranée orientale, Vol. 14, No 2, 2008
املجلة الصحية لشرق املتوسط، منظمة الصحة العاملية، املجلد الرابع عشر، العدد ٢، ٢٠٠٨
of exhibiting an unhurried approach when dealing with underserved groups.
Most of the women in this study who had had at least one Pap smear test (86.2%) had opportunistic testing, i.e. as a result of attending for other services such as family planning, antenatal care and gynaecological services [27]. This indicates that Pap smear tests are used mostly as diagnostic rather than as screening tests. Nevertheless, it has been demonstrated that opportunistic strate-gies are effective and acceptable [28].
Another barrier to having a smear test that featured prominently in this study was embarrassment. This was reported as a perceived barrier by 25.9% of respondents and confirmed the findings of other reports [29,30]. The importance of this in Pap smear screening was highlighted in a study which showed that women who claimed to be too embarrassed to have a Pap test were 7 times more likely to be overdue than women who reported no embarrassment [31]. This issue is worth noting regarding attempts to redress Pap test underutilization among women. A female practitioner may be more appropriate and acceptable among women from some cultural backgrounds as their attitudes are influenced by cultural and re-ligious beliefs [32]. A very high percentage of women in this study (62.8%) expressed preference for having a female administer their test. Clearly, there is a need to provide Pap smear services that are both acceptable and accessible in a way that addresses these cultural associations. This approach should include paying attention to unnecessary exposure and ensuring adequate covering of the woman’s body during examination. Where possible, screening services should be provided by female health workers.
As regards other barriers to Pap smear screening, 27.8% of women in this study experienced anxiety about getting a bad result, which is concurrent with similar
research which reported anxiety and fear in association with an invitation to participate in screening and during the actual participa-tion [33]. However, a later study reported that the majority of women considered the test to be of no major concern [34]. The reason for anxiety in some patients has been suggested to result from the sensitive situ-ation concerning intimacy associated with the examination.
Concern about pain and discomfort as-sociated with screening was reported as a perceived barrier in our study. This may be a difficult barrier to overcome among asymptomatic women. Those who ex-pressed this concern may have had painful and unpleasant experiences with prior Pap tests, or have heard about such experiences from others. To help women cope with con-cerns about pain and discomfort associated with Pap tests, interventions could focus on detailing the nature of the sample and teaching women some relaxation skills. In addition, the possibility of pain needs to be acknowledged rather than ignored so that women can feel a sense of trust.
Absence of disease symptoms was re-ported as another perceived barrier to hav-ing a smear test. The belief that screening is unnecessary in the absence of symptoms could be overcome by providing more pre-cise information. Education should focus on the preventive nature of the Pap smear and to counter the idea that it is only necessary in the presence of symptoms.
As regards other perceived barriers in this study, neither the financial factor nor accessibility seemed to be a problem. Al-though many seem to be willing to pay for a Pap test, availability of screening serv-ices free of charge is important for reaching people for whom financial problems are an obstacle to screening.
A population-based screening pro-gramme remains the most cost-effective

Eastern Mediterranean Health Journal, Vol. 14, No. 2, 2008 395
املجلة الصحية لشرق املتوسط، منظمة الصحة العاملية، املجلد الرابع عشر، العدد ٢، ٢٠٠٨
strategy to reduce incidence, morbidity and mortality from cervical cancer [3]. Poli-cies and initiatives aimed at ameliorating sociodemographic differences in Pap test screening should focus on the health work-ers who are likely to provide services for the underscreened segments of the population. They should be encouraged to recommend screening to their patients regardless of their age or sociodemographic and economic sta-tus. In this context, we suggest that cervical cancer screening strategies should be part of a more comprehensive health policy that ensures accessibility of regular health care to the underserved women.
As to the accuracy of this survey, the possibility of overestimation should be taken into account. It has previously been shown that self-reports overestimate partici-pation in cervical cancer screening [35]. Ex-amining the agreement between health care provider records and patients’ self-reports, it has been found that women overestimate the number of smears taken in previous years and how recently they had a Pap test [36].
This study was an initial effort to exam-ine cervical cancer screening knowledge and practices limited to a specific geograph-ic region in the north of Jordan. Similar studies need to be conducted in other areas
of the country to generalize the findings. However, these findings have important implications for health practitioners and policy makers.
Conclusions
The current programme, based on opportun-istic screening, is not effective in reaching the majority of the population. A large pro-portion of the women did not know about Pap smears and misconceptions still exist. There is need to increase awareness about Pap smear testing and to strengthen the ex-isting health care infrastructure to be able to perform smears. Incorporation of screening into routine primary care services should be considered as well as a more pro-active approach to inviting women to attend the programme.
Acknowledgements
The authors thank the volunteer nurses whose collaboration made this work pos-sible. This study was supported by Jordan University of Science and Technology, Ir-bid, Jordan. The authors express sincere ap-preciation to the all women who completed the questionnaire.
References1. Parkin DM, Pisani P, Ferlay J. Estimates
of the worldwide incidence of 25 major cancers in 1990. International journal of cancer, 1999, 80(6):827–41.
2. Pontin J et al. Strategies for global control of cervical cancer. International journal of cancer, 1995, 60(1):1–26.
3. Bergstrom R, Sparen P, Adami HO. Trends in cancer of the cervix uteri in Sweden fol-lowing cytological screening. British jour-nal of cancer, 1999, 81(1):159–66.
4. Miller AB. Failures of cervical cancer screening. American journal of public health, 1995, 85(6):761–2.
5. Aareleid T et al. Cervical cancer incidence and mortality trends in Finland and Esto-nia: a screened vs. an unscreened popu-lation. European journal of cancer, 1993, 29A(5):745–9.
6. Ferlay J et al. GLOBOCAN 2002: can-cer incidence, mortality and prevalence worldwide. Lyon, France, IARC Press,

396 La Revue de Santé de la Méditerranée orientale, Vol. 14, No 2, 2008
املجلة الصحية لشرق املتوسط، منظمة الصحة العاملية، املجلد الرابع عشر، العدد ٢، ٢٠٠٨
2004 (IARC Cancer Base No. 5, version 2.0).
7. Sankaranarayanan R, Black RJ, Parkin DM, eds. Cancer survival in developing countries. Lyon, France, IARC Press, 2004 (IARC Scientific publications No. 145).
8. Bailie RS et al. Trends in cervical cancer mortality in South Africa. International journal of epidemiology, 1996, 25(3):488–93.
9. Ayayi IO, Adewole IF. Knowledge and at-titude of general outpatient attendants in Nigeria to cervical cancer. Central African journal of medicine, 1998, 44(2):41–3.
10. Kidanto HL, Kilewo CD, Moshiro C. Can-cer of the cervix: knowledge and attitudes of female patients admitted at Muhimbili National Hospital, Dar es Salaam. East African medical journal, 2002, 79(9):467–75.
11. Lauver D, Addressing infrequent cancer screening among women. Nursing out-look, 1992, 40(5):207–12.
12. Bener A, Denic S, Alwash R. Screening for cervical cancer among Arab women. International journal of gynaecology and obstetrics, 2001, 74(3):305–7.
13. Maaita M, Barakat M. Jordanian women’s attitudes towards cervical screening and cervical cancer. Journal of obstetrics and gynaecology, 2002, 22(4):421–2.
14. Miller AB. Cervical cancer screening pro-grammes: managerial guidelines. Ge-neva, World Health Organization, 1992.
15. Saslow D et al. American Cancer Society guideline for the early detection of cervical neoplasia and cancer. CA: a cancer jour-nal for clinicians, 2002, 52(6):342–62.
16. Healthy people 2010, vol. I. Washington DC, US Department of Health and Human Services, 2001:3–15.
17. Yu CK, Rymer J. Women’s attitude to and awareness of smear testing and cervical
cancer. British journal of family planning, 1998, 23:127–33.
18. Coughlin SS, Uhler RJ. Breast and cervi-cal screening practices among Hispanic women in the United States and Puerto Rica, 1998–99. Preventive medicine, 2002, 34(2):42–51.
19. Seow A et al. Beliefs and attitudes as de-terminants of cervical cancer screening: a community-based study in Singapore. Preventive medicine, 1995, 24(2):134–41.
20. Wood K, Jewkes R, Abrahams N. Clean-ing the womb: constructions of cervical screening and womb cancer among rural black women in South Africa. Social sci-ence and medicine, 1997, 45(2):283–94.
21. Kenya Demographic and Health Sur-vey 1998. Calverton, Maryland, National Council for Population and Development, Central Bureau of Statistics & Macro In-ternational Inc., 1999:9–27.
22. Mandelblatt JS et al. Breast and cer-vix cancer screening among multiethnic women: role of age, health, and source of care. Preventive medicine, 1999, 28:418–25.
23. Wang PD, Lin RS. Sociodemographic fac-tors of Pap smear screening in Taiwan. Public health, 1996,110(2):123–7.
24. Breast and cervical cancer screening in Australia 1996–97. Canberra, Austral-ian Institute of Health and Welfare, 1998 (AIHW Cat. No. CAN 3).
25. Taylor D et al. Cervical screening by so-cio-economic status in Australia. Australia and New Zealand journal of public health, 2001, 25(3):256–60.
26. Cesar JA et al. Fatores associados à não realização de exame citopatológico de colo uterino no extremo Sul do Brasil [Factors associated with non-participation in screening for cervical cancer in South-ern Brazil]. Cadernos de saúde pública, 2003, 19(5):1365–72.
Eastern Mediterranean Health Journal, Vol. 14, No. 2, 2008 397
املجلة الصحية لشرق املتوسط، منظمة الصحة العاملية، املجلد الرابع عشر، العدد ٢، ٢٠٠٨
27. Bailie RS et al. Trends in cervical cancer mortality in South Africa. International jour-nal of epidemiology, 1996, 25:488–93.
28. Ward J, Donnelly N, Holt P. Impact in gen-eral practice of the organised approach to the prevention of cancer of cervix. Aus-tralia and New Zealand journal of public health, 1998, 22:336–41.
29. Ganguly I. Promoting the health of women of non-English speaking backgrounds in Australia. World health forum, 1995, 16(2):157–63.
30. Lovell S, Kearns RA, Friesen W. Socio-cultural barriers to cervical screening in South Auckland, New Zealand. Social science & medicine, 2007, 65(1):138–50.
31. Cockburn J et al. Barriers to cervical screening in older women. Australian family physician, 1992, 21(7):973–8.
32. Underwood SM, Shaikha L, Bakr D. Veiled yet vulnerable: breast cancer screening
and the Muslim way of life. Cancer prac-tice, 1999, 7(6):285–90.
33. Foxwell M, Alder E. More information equates with less anxiety. Reducing anxi-ety in cervical screening. Professional nurse, 1993, 9(1):32–6.
34. Tishelman C et al. Research on risk and risk in research. Theoretical and practi-cal experiences from a multidisciplinary study on cervical cancer screening in ur-ban Sweden. Qualitative health research, 1999, 9(1):45–60.
35. Stratton J. Recruitment for cervical cancer screening: a review of literature. Can-berra, Australia, Department of Human Services and Health, 1994.
36. Walter SD et al. A comparison of physi-cian and patient reports of Pap smear histories. Journal of clinical epidemiology, 1988, 41:401–10.
CorrectionEastern Mediterranean health journal reviewers’ panel, 2007. Eastern Mediterranean Health Journal, 2008, Vol. 14, No. 1, pages 234–8.Dr Nabil Kronfol should have been included in our reviewers’ panel for 2007. Dr Kronfol is a long-standing and esteemed reviewer for EMHJ and we regret the inadvertent omission of his name.

398 La Revue de Santé de la Méditerranée orientale, Vol. 14, No 2, 2008
املجلة الصحية لشرق املتوسط، منظمة الصحة العاملية، املجلد الرابع عشر، العدد ٢، ٢٠٠٨
Community-based study of unintentional injuries among preschool children in DamascusH. Bashour1 and M. Kharouf1
1Department of Family and Community Medicine, Faculty of Medicine, Damascus University, Syrian Arab Republic (Correspondence to H. Bashour: [email protected]).Received: 15/10/05; accepted: 23/01/06.
ABSTRACT To assess injuries among 1125 preschool children in Damascus, and to investigate the risk factors, a retrospective home survey of childhood injuries for a period of 12 months was carried out in 4 areas of residence: agricultural rural, non-agricultural rural, periurban and urban. More than 75% of mothers believed that injuries were preventable. During the year preceding the study, 261 injuries were reported, an incidence of 23%. The most frequent injuries were from falls, 52.0%, and most injuries (73.9%) occurred inside the home. Area of residence was the only independent predictor for the occur-rence of childhood injuries.
Étude communautaire sur les traumatismes non intentionnels chez les enfants d’âge préscolaire à DamasRÉSUMÉ Afin d’évaluer les traumatismes chez 1125 enfants d’âge préscolaire à Damas et d’étudier les facteurs de risque de ces traumatismes, une enquête ménage rétrospective sur les traumatismes chez l’enfant a été menée sur une période 12 mois dans quatre milieux : rural agricole, rural non agricole, périurbain et urbain. Plus de 75 % des mères estimaient que les traumatismes étaient évitables. Au cours de l’année ayant précédé l’enquête, 261 traumatismes avaient été déclarés, ce qui correspond à une incidence de 23 %. Les traumatismes les plus fréquents étaient dus à des chutes (52,0 %) et la majorité des traumatismes (73,9 %) se produisaient au domicile. Le type d’environnement était le seul facteur prédictif indépendant de la survenue de traumatismes chez les enfants.
1125
12
75
2612352
73.9

Eastern Mediterranean Health Journal, Vol. 14, No. 2, 2008 399
املجلة الصحية لشرق املتوسط، منظمة الصحة العاملية، املجلد الرابع عشر، العدد ٢، ٢٠٠٨
Introduction
Homes should be a haven of safety for young children, nevertheless, they represent the most frequent site of injury occurrence. Injuries are the leading cause of death in childhood and a significant cause of mor-bidity [1,2]. The size of this public health problem differs between developed and developing countries [3]. In most industri-alized countries, including Canada and the United States of America, unintentional injuries rank as the number one cause of death and a leading cause of hospitalization for children older than 1 year [4]. Most of those injuries occurred at home.
Injuries also account for significant health service utilization, presenting an enormous social and economic burden. The impact of childhood injury is immense in terms of the direct financial cost and the enormous emotional toll of death and disability. Injury prevention thus deserves highest priority from those responsible for improving child health [5].
Two population-based studies carried out in Syria in 1996 and 2001 reported that injuries were the leading cause of death among children aged 1–4 years [6,7]. There is no surveillance system to monitor the oc-currence of childhood injuries in the coun-try. Data from hospitals and emergency departments, although available, are not the ideal source to study epidemiological features of childhood injuries owing to their poor quality. Furthermore, such sources would only report the serious and fatal cases. A national study of injuries among preschool children in 2001 reported 10.4% prevalence, 50% of which occurred at home [Ministry of Health, unpublished report (A study of the prevalence of accidents among preschool children), 2001]. The epidemiological literature has identified demographic and social characteristics as well as behaviours of both children and
their parents as risk factors for childhood injury [8].
To date, most research has been con-ducted in industrialized countries, and only a few studies have been done in developing countries. Our study aimed to assess the magnitude of injuries among preschool children in Damascus and to investigate their risk factors. We took into considera-tion a wide range of aspects of children and their families in an attempt to identify the most significant risks. The findings should serve as a basis for formulating community-based intervention for possible testing and implementation.
Methods
Study populationChildren under 5 years of age residing in 4 different areas in Damascus, the capi-tal of Syria, were recruited for this study. Administratively, Damascus consists of 2 provinces, the city and rural Damascus. The areas of residence were: rural (agricul-tural); rural (non-agricultural); peri-urban and urban. Children were identified via a house-to-house survey in the selected areas. The main selection criteria apart from the areas of residence included the total popu-lation (minimum 5000; Ministry of Health criterion for establishing a health centre is population ≥ 5000) and the existence of a defined health centre that served the area. The areas selected were: Kaissa (rural, agricultural); Khyaret Dannoun (rural, non-agricultural); Daff Al-Shok (peri-urban), and Al-Adawi (urban).
After stratifying for the type of area (ur-ban or rural), areas were selected randomly from an official list of areas/populations served by health centres which was pro-vided by the Directorate of Health Districts, Ministry of Health. A sampling frame that included all areas with a population of approximately 5000 persons was formu-
400 La Revue de Santé de la Méditerranée orientale, Vol. 14, No 2, 2008
املجلة الصحية لشرق املتوسط، منظمة الصحة العاملية، املجلد الرابع عشر، العدد ٢، ٢٠٠٨
lated as a base for random selection. The minimum sample size was calculated on the basis of estimating prevalence using a 95% confidence and an 80% power and an estimated prevalence of 10%; acceptable level of error was 2%. The sample size was increased by a factor of 1.5 to allow for the sampling design. Thus the required sample was estimated at 1296.
The population of Kaissa are mainly engaged in agricultural work. A small river crosses the village, and the houses are iso-lated from each other. In Khyaret Dannoun, people are mainly engaged in manual labour. The village is located in rather desert-like area close to an industrial compound and the houses are close to each other. Daff Al-Shok is a peri-urban area where the houses are very crowded and not well constructed. The people are mainly engaged in small businesses. Al-Adawi is an urban area in Damascus with tower-like buildings.
Data collectionTwo questionnaires were used to serve the purpose of the study. The first was a census-like form for the house-to-house survey to identify families with children under 5 years old. The second, the main tool of the study, was a semi-structured questionnaire enquiring about occurrence of injuries. An injury was defined in this study as any acci-dent that occurred to the child and required medical attention, not necessary profession-al (i.e. home management was included). The questionnaire collected demographic data on the family and the child; history of injuries in the previous year; mother’s knowledge related to childhood injuries; and environmental description of the home. It was administered to only 1 randomly se-lected child in families which included > 1 child aged < 5 years. This was done to avoid the clustering effect that may arise from col-lecting data from the same family.
A score was given for the child’s home environment by the field workers. The score was based on their assessment of the envi-ronmental hazards existing in the home. The field workers were supplied with a checklist of 60 items adapted from the safety guides of the Home Safety Council [9] which they used as a guide in scoring the home environment using a scale from 0 to 10 rather than exactly scoring the checklist due to the extensiveness of the list and its rela-tive irrelevance to all houses. All data were collected by 2 young female sociologists who were specially trained to implement the study tools.
Informed consent of the parents was obtained before the interview, and the com-munity representatives were informed about the study. The study proposal was cleared by ethical review boards at the Faculty of Medicine, Damascus University. The field work lasted from early January 2004 to July 2004.
We carried out a classification of the injuries based on Chapter XX (External causes of morbidity and mortality) of the International classification of diseases, version 10 (ICD-10) [10].
Statistical analysisData from the 2 questionnaires were checked before data entry. Missing values were allowed for in the analysis. Data were ana-lysed using SPSS for Windows, version 11. Descriptive statistics were used to examine the characteristics of the participants. The chi-squared test was used to compare pro-portions, and the t-test to compare means. Significance level was 0.05. Stepwise mul-tiple regression was performed to iden-tify risk factors remaining independently significant after adjustment for the other variables.
Eastern Mediterranean Health Journal, Vol. 14, No. 2, 2008 401
املجلة الصحية لشرق املتوسط، منظمة الصحة العاملية، املجلد الرابع عشر، العدد ٢، ٢٠٠٨
Results
A total of 1817 houses were surveyed in the 4 areas we studied. This included all the houses in the rural and suburban sites, and a similar number of houses from the urban site. The families were nuclear in 83.1% of all surveyed families. This ranged from 29.2% in Kaissa (rural agricultural site) to 90.0% in Al-Adawi (urban site). A total of 1125 eligible children were enrolled in the study. Mothers were the respondents in 95.4% of cases, with no refusals to partici-pate.
The characteristics of the children under study and their families are shown in Ta-ble 1. Mean family size was 6.1 [standard deviation (SD) = 2.9]. Around 75% of the children were > 2 years old. More than half the mothers had ≤ 6 years of school education; 34.1% of the fathers had a small business.
The incidence of childhood injuries, calculated retrospectively for the year pre-ceding the study, was 23.2% (Table 2). Almost 75% of injuries occurred inside the home. The injured child was on his/her own in 40.9% of cases. The most frequent type of injury was cuts. The classification was based on the detailed history of the injury as described by the mother. The most frequent cause of childhood injuries was falls. All injuries were mild (manageable at home) or moderate (required medical attention).
Almost 80% of mothers thought that ac-cidents were preventable (Table 3). In their opinion, the causes of the most dangerous childhood injuries were road accidents.
As assessed by the field workers, the mean score for home safety was low, 3.7 (SD 2.9) from a maximum of 10 (Table 4). This was not surprising as field workers were requested to note all possible hazards in the house.
On bivariate analysis of the potential risk factors for childhood injury, the relationship
was significant for site (type of location), birth order and number of residents in the house (Table 1).
However, in the logistic regression model, which included all variables, area of residence was the only independent predic-tor. Living in a rural non-agricultural type of location compared with an urban setting was associated with a significant increase in odds of having an injury [adjusted odds ratio (OR) = 3.8; 95% CI: 2.3–6.3]. Living in a rural agricultural area was also associ-ated with a significant increase in the odds of having an injury (adjusted OR = 2.1; 95% CI: 1.3–3.4).
Discussion
Unintentional injury constitutes a major public health problem that could be assessed by the resulting morbidity and mortality. This study calls attention to unintentional injury as a major cause of morbidity among preschool children living in different set-tings in Damascus. The incidence reported in this study exceeds that previously report-ed in the country, 10.4%, by the Ministry of Health study [Ministry of Health, un-published report (A study of the prevalence of accidents among preschool children), 2001]. However it compares quite well with other community-based studies in develop-ing countries, around 12%–30%, although recall periods differed [3,11–13]. The in-jury pattern found in this study is generally similar to that in many other countries in the Region such as Jordan, Islamic Republic of Iran, and United Arab Emirates [12,14,15].
This study uncovered a significant re-lationship between type of location (rural) where the child lives and the occurrence of injury. We believe that further exploration of this relationship is warranted in future studies. A study in a Brazilian squatter settlement also reported a high prevalence
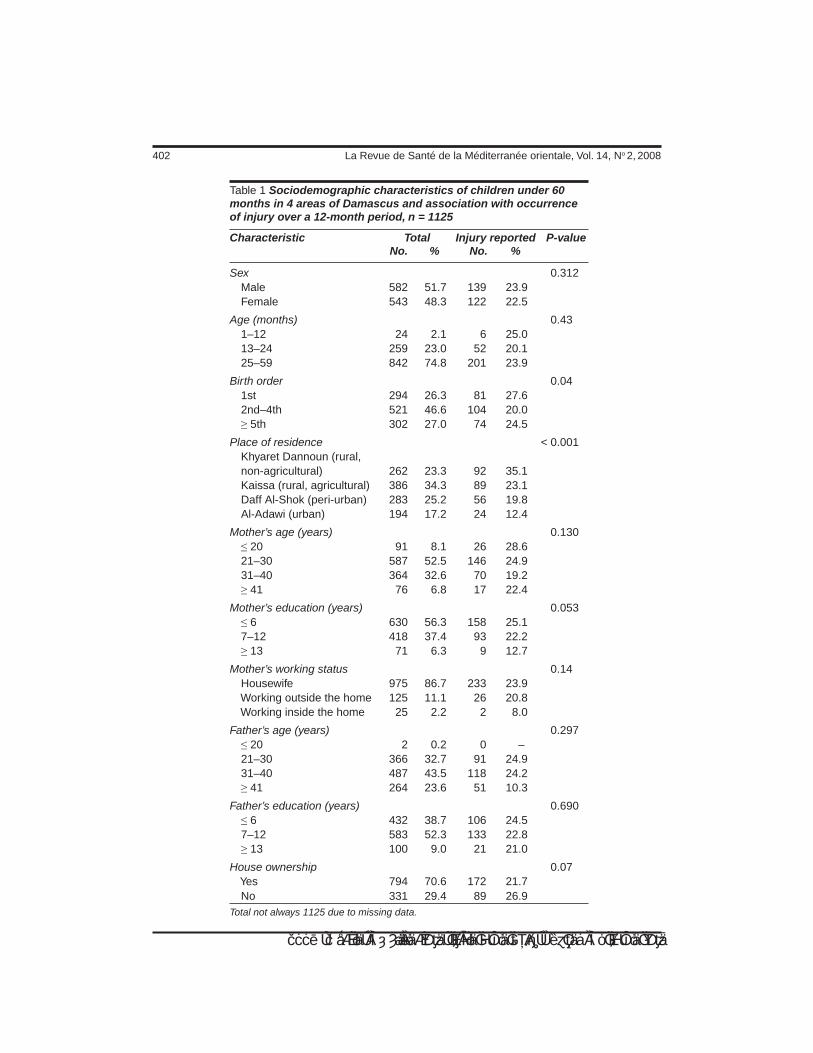
402 La Revue de Santé de la Méditerranée orientale, Vol. 14, No 2, 2008
املجلة الصحية لشرق املتوسط، منظمة الصحة العاملية، املجلد الرابع عشر، العدد ٢، ٢٠٠٨
Table 1 Sociodemographic characteristics of children under 60 months in 4 areas of Damascus and association with occurrence of injury over a 12-month period, n = 1125
Characteristic Total Injury reported P-value No. % No. %
Sex 0.312 Male 582 51.7 139 23.9 Female 543 48.3 122 22.5
Age (months) 0.43 1–12 24 2.1 6 25.0 13–24 259 23.0 52 20.1 25–59 842 74.8 201 23.9
Birth order 0.04 1st 294 26.3 81 27.6 2nd–4th 521 46.6 104 20.0 ≥ 5th 302 27.0 74 24.5
Place of residence < 0.001 Khyaret Dannoun (rural, non-agricultural) 262 23.3 92 35.1 Kaissa (rural, agricultural) 386 34.3 89 23.1 Daff Al-Shok (peri-urban) 283 25.2 56 19.8 Al-Adawi (urban) 194 17.2 24 12.4
Mother’s age (years) 0.130 ≤ 20 91 8.1 26 28.6 21–30 587 52.5 146 24.9 31–40 364 32.6 70 19.2 ≥ 41 76 6.8 17 22.4
Mother’s education (years) 0.053 ≤ 6 630 56.3 158 25.1 7–12 418 37.4 93 22.2 ≥ 13 71 6.3 9 12.7
Mother’s working status 0.14 Housewife 975 86.7 233 23.9 Working outside the home 125 11.1 26 20.8 Working inside the home 25 2.2 2 8.0
Father’s age (years) 0.297 ≤ 20 2 0.2 0 – 21–30 366 32.7 91 24.9 31–40 487 43.5 118 24.2 ≥ 41 264 23.6 51 10.3
Father’s education (years) 0.690 ≤ 6 432 38.7 106 24.5 7–12 583 52.3 133 22.8 ≥ 13 100 9.0 21 21.0
House ownership 0.07 Yes 794 70.6 172 21.7 No 331 29.4 89 26.9 Total not always 1125 due to missing data.

Eastern Mediterranean Health Journal, Vol. 14, No. 2, 2008 403
املجلة الصحية لشرق املتوسط، منظمة الصحة العاملية، املجلد الرابع عشر، العدد ٢، ٢٠٠٨
tions about the importance of environment in any injury prevention programme.
Homes, in general, were not safe for children, and the outside environment was very much problematic in rural areas, where children spend more time outside the home. In addition, they are prone to many hazards in poorly structured houses. The rural popu-lation in the Syrian Arab Republic is about 50% of the total population, thus, serious consideration of the findings is warranted. What further complicates the issue is the low socioeconomic status of rural families. The higher occurrence of childhood injury in 2 areas of our study could be an indica-tion of the combination of poor housing, risky recreation spaces, and the use of off-site toilet arrangements in the dark as major causes.
Our findings are, however, surprising in other ways: there was no correlation with the age and sex of the child, as has been reported previously [17]. Also, socio-
Table 2 Occurrence of injuries in children under 60 months in 4 areas of Damascus over a 12-month period, n = 1125
Variable No. %
Injury reported Yes 261 23.2 No 864 76.8
Place Inside the home 190 73.9 Outside the home 67 26.1
Type Cuts 124 48.4 Burns 59 23.0 Bruising/fracture 28 10.9 Other 45 17.6
Cause Fall 133 52.0 Exposure to inanimate mechanical forces 48 18.8 Exposure to fire & flames 30 11.7 Exposure to hot substances 26 10.2 Exposure to electric current 8 3.1 Accidental poisoning 5 2.0 Exposure to animate mechanical forces 4 1.6 Accidental drowning 2 0.8
Child had a companion at the time of the injury Yes 152 59.1 No 105 40.9
Outcome Complete recovery 237 90.8 Consequences 24 9.2The total is not always the same owing to missing data.
of injuries (30%), which was related to the rough topography of the location [11]. A study in Uganda found, however, higher incidence of injury in urban settings [16]. Rural and urban differences in the occur-rence of childhood injuries, although well reported in the literature, showed varied results. Acknowledging the importance of type of location in our study raises ques-
Table 3 Mothers’ perception of childhood injuries
Perception of mother No. %
Injuries are preventable Yes 882 78.6 No 240 21.4
Most dangerous cause of injury Road accident 451 34.9 Exposure to fire 305 23.6 Drowning 209 16.2 Exposure to electricity 140 10.8 Falls 112 8.7 Poisoning 74 5.7
Reasons for childhood injuries Lack of attention and care 597 74.8 Child’s hyperactivity 85 10.6 Being outside the home 64 8.0 Do not know 42 5.3 God’s will 10 1.3The total is not always the same owing to missing data.

404 La Revue de Santé de la Méditerranée orientale, Vol. 14, No 2, 2008
املجلة الصحية لشرق املتوسط، منظمة الصحة العاملية، املجلد الرابع عشر، العدد ٢، ٢٠٠٨
Table 4 Relationship between the occurrence of injuries and characteristics of the home in children under 60 months in 4 areas of Damascus
Characteristic Injuries reported P-value Yes No Mean (SD) Mean (SD)
Size of family 6.2 (3.1) 6.1 (2.8) 0.68
No. resident at house 9.0 (6.6) 8.1 (5.5) 0.03
Score for home environment (total = 10) 3.7 (2.9) 3.3 (2.9) 0.08SD = standard deviation.
demographic characteristics did not cor-relate with childhood injury, except for number of residents in the house (this could be a proxy-indicator of the poor socioeco-nomic status of families). Furthermore, we found no significant correlation between the occurrence of childhood injuries and the score given to the home environment. This is not surprising as the tool used to assess the home environment was very sophisti-cated for the setting.
Child safety programmes need to be tailored to the home environment in dif-ferent settings. Interestingly, most of the women in this study perceived behavioural issues such as lack of attention and care to be responsible for childhood injuries; they did not, however, fully appreciate the role of the child’s environment.
The main limitation of this study was the long recall period that was used. Thus we presume the occurrence of unintentional injuries may have been under-estimated. A recent study from Tanzania recommended
a recall period as short as 3 months for non-fatal injuries [18]. We do not, however, think that recall problems affected our main conclusion regarding the difference between rural and urban areas.
Our findings support the role of environ-ment in the occurrence of childhood injuries, and also call for this issue to be considered in injury prevention programmes and rural development projects. There is also a need for further research on the determinants of childhood injuries in developing countries.
Acknowledgements
Our appreciation is due to the mothers who gave us much of their busy time. We are indebted to Professor M. Khogali for his valuable comments on the manuscript.
This study received financial support from the WHO Eastern Mediterranean Re-gional Office Special Grant for Research in Priority Areas of Public Health.
References1. Krug EG, Sharma GK, Lozano R. The glo-
bal burden of injuries. American journal of public health, 2000, 90(4):523–6.
2. Rivara FP, Grossman DC, Cummings P. Injury prevention. New England journal of medicine, 1992, 337(8):543–8.
3. Bartlett SN. The problem of children’s injuries in low income countries: a re-view. Health policy and planning, 2002, 17(1):1–13.
4. Morrongiello BA, Ondejko L, Littlejohn A. Understanding toddlers’ in-home injuries:

Eastern Mediterranean Health Journal, Vol. 14, No. 2, 2008 405
املجلة الصحية لشرق املتوسط، منظمة الصحة العاملية، املجلد الرابع عشر، العدد ٢، ٢٠٠٨
I. Context, correlates, and determinants. Journal of pediatric psychology, 2004, 29(6):433–46.
5. Ramsay LJ et al. Unintentional home injury in preschool-aged children: looking for the key—an exploration of the inter-relationship and relative importance of potential risk factors. Public health, 2003, 117:404–11.
6. Abu-Rashid N, Al-Jirf S, Bashour H. Causes of death among Syrian children using the method of verbal autopsy. East-ern Mediterranean health journal, 1996, 2(3):440–8.
7. Causes of deaths among children under five years. Damascus, Syrian Arab Re-public, Ministry of Health, 2001 [in Ara-bic].
8. Grossman D, Rivara F. Injury control in childhood. Pediatric clinics of North America, 1992, 39(3):471–85.
9. Safety guides. Washington, DC, Home Safety Council, 2006 (www.homesafe-tycouncil.org/safety_guide/safetyguide.aspx, accessed 26 June 2007).
10. International classification of diseases, version 10 (ICD-10). Geneva, World Health Organization, 1992.
11. Reichenheim ME, Harpham T. Child ac-cidents and associated risk factors in
a Brazilian squatter settlement. Health policy and planning, 1989, 4:162–7.
12. Janson S et al. Accident risks for suburban pre-school Jordanian children. Journal of tropical pediatrics, 1994, 40(2):88–93.
13. Butchart A, Kruger J, Lekoba R. Percep-tions of injury causes and solutions in Johannesburg township: implications for prevention. Social science and medicine, 2000, 50(3):331–44.
14. Mohammadi R et al. Unintentional home-related injuries in the Islamic Republic of Iran: findings from the first year of a national programme. Public health, 2005, 119(10):919–24.
15. Bener A, Al-Salman KM, Pugh RN. Injury mortality and morbidity among children in the United Arab Emirates. European jour-nal of epidemiology, 1998, 14(2):175–8.
16. Kobusingye O, Guwantudde, Lett R. In-jury patterns in rural and urban Uganda. Injury prevention, 2001, 7(1):46–50.
17. Del Ciampo LA et al. Incidence of child-hood accidents determined in a study based on home surveys. Annals of tropi-cal paediatrics, 2001, 21(3):239–43.
18. Moshiro C et al. Effect of recall on esti-mation of non-fatal injury rates: a com-munity-based study in Tanzania. Injury prevention, 2005, 11(1):48–52.
406 La Revue de Santé de la Méditerranée orientale, Vol. 14, No 2, 2008
املجلة الصحية لشرق املتوسط، منظمة الصحة العاملية، املجلد الرابع عشر، العدد ٢، ٢٠٠٨
Flying bullets and speeding cars: analysis of child injury deaths in the Palestinian TerritoryA. Shaheen1 and P. Edwards1
1Department of Epidemiology and Population Health, London School of Hygiene and Tropical Medicine, London, United Kingdom (Correspondence to A. Shaheen: [email protected]).Received: 07/01/07; accepted: 25/05/07
ABSTRACT Despite the fact that children account for over half the Palestinian population, little at-tention has been paid to the problem of child injuries. We examined the types of injury mortality in children aged 0–19 years in the West Bank and Gaza Strip (Palestinian Territory) and compared these with similar data for children in Israel and England and Wales. We used data from death certificates covering 2001–2003. Death rates per 100 000 children per year were estimated. The leading cause of injury mortality in Palestinian children was accidents caused by firearms missiles (9.6). In comparison, transport accidents were the leading cause of death in children in both Israel (5.0) and England and Wales (3.5).
Tirs de balles et vitesse des voitures : analyse de la mortalité infantile liée aux traumatismes dans le territoire palestinienRÉSUMÉ Bien que plus de la moitié de la population palestinienne soit composée d’enfants, le problème des traumatismes chez l’enfant bénéficie de peu d’attention. Nous avons examiné les types de traumatismes mortels chez les enfants âgés de 0 à 19 ans en Cisjordanie et dans la bande de Gaza (territoire palestinien) et les avons comparés aux mêmes données concernant les enfants d’Israël, d’Angleterre et du Pays de Galles. Nous avons utilisé les données figurant sur les certificats de décès de la période 2001-2003. Les taux de mortalité pour 100 000 enfants par an ont été estimés. La mortalité liée aux traumatismes chez les enfants palestiniens avait pour principale cause les accidents provoqués par les projectiles d’armes à feu (9,6). Par comparaison, les accidents de transport étaient la principale cause de décès chez les enfants en Israël (5,0) ainsi qu’en Angleterre et au Pays de Galles (3,5).
19
20012003
9.65.03.5
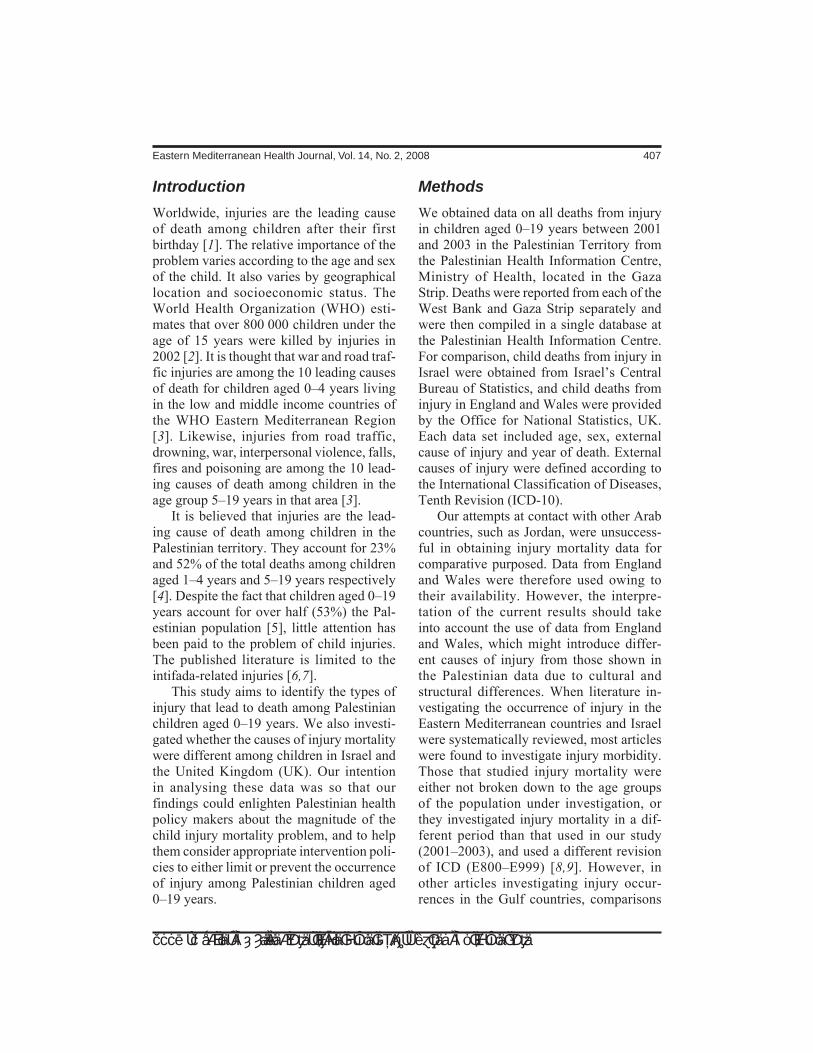
Eastern Mediterranean Health Journal, Vol. 14, No. 2, 2008 407
املجلة الصحية لشرق املتوسط، منظمة الصحة العاملية، املجلد الرابع عشر، العدد ٢، ٢٠٠٨
Introduction
Worldwide, injuries are the leading cause of death among children after their first birthday [1]. The relative importance of the problem varies according to the age and sex of the child. It also varies by geographical location and socioeconomic status. The World Health Organization (WHO) esti-mates that over 800 000 children under the age of 15 years were killed by injuries in 2002 [2]. It is thought that war and road traf-fic injuries are among the 10 leading causes of death for children aged 0–4 years living in the low and middle income countries of the WHO Eastern Mediterranean Region [3]. Likewise, injuries from road traffic, drowning, war, interpersonal violence, falls, fires and poisoning are among the 10 lead-ing causes of death among children in the age group 5–19 years in that area [3].
It is believed that injuries are the lead-ing cause of death among children in the Palestinian territory. They account for 23% and 52% of the total deaths among children aged 1–4 years and 5–19 years respectively [4]. Despite the fact that children aged 0–19 years account for over half (53%) the Pal-estinian population [5], little attention has been paid to the problem of child injuries. The published literature is limited to the intifada-related injuries [6,7].
This study aims to identify the types of injury that lead to death among Palestinian children aged 0–19 years. We also investi-gated whether the causes of injury mortality were different among children in Israel and the United Kingdom (UK). Our intention in analysing these data was so that our findings could enlighten Palestinian health policy makers about the magnitude of the child injury mortality problem, and to help them consider appropriate intervention poli-cies to either limit or prevent the occurrence of injury among Palestinian children aged 0–19 years.
Methods
We obtained data on all deaths from injury in children aged 0–19 years between 2001 and 2003 in the Palestinian Territory from the Palestinian Health Information Centre, Ministry of Health, located in the Gaza Strip. Deaths were reported from each of the West Bank and Gaza Strip separately and were then compiled in a single database at the Palestinian Health Information Centre. For comparison, child deaths from injury in Israel were obtained from Israel’s Central Bureau of Statistics, and child deaths from injury in England and Wales were provided by the Office for National Statistics, UK. Each data set included age, sex, external cause of injury and year of death. External causes of injury were defined according to the International Classification of Diseases, Tenth Revision (ICD-10).
Our attempts at contact with other Arab countries, such as Jordan, were unsuccess-ful in obtaining injury mortality data for comparative purposed. Data from England and Wales were therefore used owing to their availability. However, the interpre-tation of the current results should take into account the use of data from England and Wales, which might introduce differ-ent causes of injury from those shown in the Palestinian data due to cultural and structural differences. When literature in-vestigating the occurrence of injury in the Eastern Mediterranean countries and Israel were systematically reviewed, most articles were found to investigate injury morbidity. Those that studied injury mortality were either not broken down to the age groups of the population under investigation, or they investigated injury mortality in a dif-ferent period than that used in our study (2001–2003), and used a different revision of ICD (E800–E999) [8,9]. However, in other articles investigating injury occur-rences in the Gulf countries, comparisons

408 La Revue de Santé de la Méditerranée orientale, Vol. 14, No 2, 2008
املجلة الصحية لشرق املتوسط، منظمة الصحة العاملية، املجلد الرابع عشر، العدد ٢، ٢٠٠٨
with England and Wales were found to have been made [10,11].
We used published census data to cal-culate death rates from injury per 100 000 population. Assuming no change in the age distribution over the 3 years, the estimated population of the middle year (2002) was used to calculate the overall and specific injury mortality rates in the West Bank and Gaza Strip, while in Israel and England and Wales, we used the estimated population for the year 2001. The annual rates were estimated by dividing the specific injury mortality rates by 3. Stata, version 9.2, was used to estimate death rates with 95% con-fidence intervals. To compare age-specific mortality rates in the 3 countries, we stand-ardized for age using a combination of the 3 populations as our standard population.
Results
The overall annual injury mortality rate in Palestinian children (18.1/100 000 children) was almost twice that in Israel (10.0/100 000 children) and more than 3 times that in Eng-
land and Wales (5.2/100 000 children) (Ta-ble 1). In all 3 countries, the overall annual injury mortality rate was higher among boys than girls. Overall annual injury mortal-ity rates were highest among children aged 15–19 years in all 3 populations (Table 1).
In each country, the leading causes of injury death varied according to age. The most common cause among Palestinian children aged 15–19 years was accidents caused by firearms missiles with annual mortality rate of 34.6 (95% CI: 31.2–38.3) deaths per 100 000 children, followed by transport accidents with annual mortal-ity rate of 2.2 (95% CI: 1.4–3.3) deaths per 100 000 children (Table 2). The most common cause among Palestinian children aged 10–14 years was accidents caused by firearms missiles, followed by transport accidents. The leading causes among those aged 5–9 years were transport accidents, accidents caused by firearms missiles and falls, and for children aged 0–4 years the leading causes of injury death were trans-port accidents, accidental drowning and submersion, and falls (Table 2).
Table 1 Injury mortality rates in children aged 0–19 years in the Palestinian Territory, Israel and England and Wales for the period 2001–03
Characteristic Palestinian Territory Israel England and Wales No.a Rateb (95% CI) No.a Rateb (95% CI) No.a Rateb (95% CI)
Sex Female 214 7.5 (6.5–8.6) 208 6.0 (5.2–6.8) 540 2.8 (2.6–3.1) Male 846 28.1(26.2–30.1) 507 13.8 (12.6–15.0) 1535 7.6 (7.3–8.1)
Age (years) 0–4 246 14.0 (12.0–16.0) 100 5.0 (4.1–6.1) 439 4.7 (4.3–5.2) 5–9 168 10.0 (9.0–12.0) 70 3.9 (3.0–4.9) 206 2.1 (1.8–2.4) 10–14 175 13.0 (11.0–15.0) 83 4.9 (3.9–6.0) 362 3.5 (3.2–3.9) 15–19 471 41.0 (37.0–45.0) 462 27.7 (25.2–30.3) 1045 10.8 (10.2–11.5)
Total 1060 18.1c (17.0–19.2) 715 10.0c (9.3–10.7) 2052 5.2c (5.0–5.5)aNumber of children who died from injury. bPer 100 000 children per year.cNo differences were detected between the overall age-specific injury mortality rate and the age-adjusted mortality rate.CI = confidence interval.

Eastern Mediterranean Health Journal, Vol. 14, No. 2, 2008 409
املجلة الصحية لشرق املتوسط، منظمة الصحة العاملية، املجلد الرابع عشر، العدد ٢، ٢٠٠٨
Tabl
e 2
Th
e 5
lead
ing
cau
ses
of
inju
ry d
eath
s am
on
g c
hild
ren
ag
ed 0
–19
year
s in
th
e P
ales
tin
ian
Ter
rito
ry, I
srae
l an
d E
ng
lan
d a
nd
W
ales
for
the
per
iod
200
1–03
: dis
trib
uti
on
acc
ord
ing
to
ag
e
Cau
se (
ICD
-10
cod
e)
0–4
year
s 5–
9 ye
ars
10–1
4 ye
ars
15–1
9 ye
ars
Tota
l
N
o.
Rat
ea (9
5% C
I)
No
. R
atea
(95%
CI)
N
o.
Rat
ea (9
5% C
I)
No
. R
atea
(95%
CI)
N
o.
Rat
ea (9
5% C
I)
Pal
estin
ian
terr
itory
F
irear
ms
mis
sile
s
(W32
–W34
) 26
1.
4 (0
.9–2
.0)
51
3.2
(2.4
–4.2
) 11
2 8.
3 (6
.8–1
0.0)
37
7 34
.6 (
31.2
–38.
3)
566
3.2
(3.0
–3.4
)
Tran
spor
t acc
iden
ts
(V
01–V
99)
102
5.4
(4.4
–6.5
) 75
4.
7 (3
.7–5
.8 )
28
2.
1 (1
.4–3
.0)
24
2.2
(1.4
–3.3
) 22
9 1.
3 (1
.0–1
.4)
A
ccid
enta
l dro
wni
ng &
subm
ersi
on (
W65
–W74
) 50
2.
7 (5
.9–1
0.5)
13
0.
8 (0
.4–1
.4)
10
0.7
(0.4
–1.4
) 17
1.
6 (0
.9–2
.5)
90
0.5
(4.3
–0.7
)
Falls
(W
00–W
19)
40
2.1
(1.5
–2.9
) 18
1.
1 (0
.7–1
.8)
7 0.
5 (0
.21–
1.1)
3
0.3
(0.1
–0.8
) 68
0.
4 (0
.3–0
.5)
A
ssau
lt (X
85–Y
09)
3 0.
2 (0
.03–
0.5)
3
0.2
(0.0
3–0.
6)
2 0.
2 (0
.01–
0.5)
19
1.
7 (1
.0–2
.6)
27
0.2
(0.1
–0.2
)
Isra
el
Tran
spor
t acc
iden
ts
(V
01–V
99)
69
3.5
(2.7
–4.4
) 56
3.
1 (2
.3–4
.0)
40
2.3
(1.7
–3.2
) 19
7 11
.8 (
10.2
–13.
6)
362
1.7
(1.5
–1.8
)
Falls
(W
00–W
19)
8 0.
4 (0
.17–
0.8)
0
– 3
0.2
(0.0
3–0.
5)
7 0.
4 (0
.2–0
.9)
18
0.1
(0.0
5–0.
1)
Inte
ntio
nal s
elf h
arm
(X60
–X84
) 0
– 0
– 7
0.4
(0.1
6–0.
9)
98
5.8
(4.8
–7.2
) 10
5 0.
5 (0
.4–0
.6)
A
ccid
enta
l dro
wni
ng a
nd
su
bmer
sion
(W
65–W
74)
10
0.5
(0.2
4–0.
93)
7 0.
4 (0
.15–
0.8)
8
0.5
(0.2
0–0.
9)
14
0.8
(0.5
–1.4
) 39
0.
2 (0
.1–0
.2)
A
ssau
lt (X
85–Y
09)
11
0.6
(0.2
7–1.
0)
3 0.
2 (0
.03–
0.5)
2
0.1
(0.0
1–0.
4)
43
2.6
(1.8
–3.5
) 59
0.
3 (0
.2–0
.4)
Eng
land
& W
ales
Tr
ansp
ort a
ccid
ents
(V01
–V99
) 84
0.
9 (0
.7–1
.1)
88
0.8
(0.7
–1.0
) 19
1 1.
8 (1
.5–2
.1)
1004
9.
7 (9
.1–1
0.3)
13
74
3.5
(3.3
–3.7
)
Eve
nt o
f und
eter
min
ed
in
tent
(Y
10–Y
34)
95
1.0
(0.8
–1.2
) 27
0.
3 (0
.2–0
.4)
49
0.5
(0.3
–0.6
) 46
1 4.
5 (4
.1–4
.9)
632
1.5
(1.4
–1.7
)
Inte
ntio
nal s
elf h
arm
(X60
–X84
) 0
– 0
– 13
0.
1 (0
.06–
0.2)
23
2 2.
2 (1
.9–2
.5)
248
0.6
(0.5
–0.7
)
Suf
foca
tion
& e
xpos
ure
(W
75–W
99)b
103
1.1
(0.9
–1.3
) 6
0.1
(0.0
2–0.
1)
45
0.4
(0.3
–0.6
) 53
0.
5 (0
.4–0
.7)
207
0.5
(0.4
–0.6
)
Poi
soni
ng (
X40
–X49
)c 4
< 0
.1 (0
.01–
0.1)
0
– 3
0.3
(0.0
1–0.
08)
106
1.0
(0.8
–1.2
) 11
2 0.
3 (0
.2–0
.3)
CI =
con
fiden
ce in
terv
al.
a Per
100
000
chi
ldre
n ye
ar p
er.
b Acc
iden
tal s
uffo
catio
n an
d ex
posu
re to
uns
peci
fied
man
-mad
e en
viro
nmen
tal f
acto
rs.
c Acc
iden
tal p
oiso
ning
by,
and
exp
osur
e to
, nox
ious
sub
stan
ces.

410 La Revue de Santé de la Méditerranée orientale, Vol. 14, No 2, 2008
املجلة الصحية لشرق املتوسط، منظمة الصحة العاملية، املجلد الرابع عشر، العدد ٢، ٢٠٠٨
The leading causes of injury death among Israeli children aged 15–19 years were transport accidents, intentional self harm, and assault, with annual injury rates of 11.8 (95% CI: 10.2–13.6), 5.8 95% CI: (95% CI: 4.8–7.2) and 2.6 (1.8–3.5) deaths per 100 000 children respectively. Transport accidents were also the most common cause of injury deaths among Israeli children aged 10–14, 5–9 and 0–4 years (Table 2).
In England and Wales, the leading caus-es of injury deaths among children aged 15–19 years were transport accidents, event of undetermined intent, and intentional self harm, with annual injury rates of 9.7 (95% CI: 9.1–10.3), 4.5 (95% CI: 4.1–4.9), and 2.2 (95% CI: 1.9–2.5) deaths per 100 000 children. Transport accidents were also the most common cause of injury deaths among children aged 10–14 and 5–9 years. Among those aged 0–4 years, accidental suffoca-tion, and exposure to unspecified man-made environmental factors were the most com-mon cause of injury deaths (Table 2).
The overall injury mortality rate in the West Bank and Gaza Strip increased be-tween 2001 and 2002 and then decreased somewhat between 2002 and 2003; the differences were statistically significant (P < 0.001) (Table 3). The decrease be-tween 2002 and 2003, however, mainly reflected the trend in the West Bank: injury mortality rates remained high in the Gaza Strip. Accidents caused by firearm missiles
contributed the greatest proportion (62.3%) to the increase in overall injury mortality rates in the Palestinian Territory in 2002 (Figure 1).
In the 0–4 years age group, the rate of death from transport accidents [5.4/100 000 children (95%CI: 10.2–13.6)] was higher in the Palestinian Territory than in the UK and Israel (Table 2). Conversely, in the 15–19 years age-group, transport accident death rates were higher in Israel and England and Wales than in the Palestinian territory. The observed differences were statistically significant (P < 0.001).
Discussion
Firearms missiles were the most common cause of injury death in Palestinian children aged 10–14 and 15–19 years. This is likely to be due to violence by the occupation forces. Previous studies have highlighted this and reported that children were delib-erately targeted by soldiers, who directed their fire to the upper part of the body with intent to kill [6,12,13]. The injury mortality rate in children in the Gaza Strip was higher than in children in the West Bank, with a particularly strong peak in 2002 due mainly to injury from firearms missiles. The differ-ence could be a consequence of the exten-sive violence imposed by the occupation on children living in Gaza [14].
Table 3 Trend in injury mortality rates in children aged 0–19 years in the Gaza Strip and West Bank for the period 2001–03
Location 2001 2002 2003 Ratea 95% CI Ratea 95% CI Ratea 95% CI
West Bank 10.4 1.7–2.1 16.4 2.2–2.4 11.3 1.8–2.0
Gaza Strip 19.0 3.0–3.5 28.4 3.7–4.0 28.7 3.5–3.9aPer 100 000 children.CI = confidence interval.
Eastern Mediterranean Health Journal, Vol. 14, No. 2, 2008 411
املجلة الصحية لشرق املتوسط، منظمة الصحة العاملية، املجلد الرابع عشر، العدد ٢، ٢٠٠٨
Crowding and low socioeconomic status could be other risk factors for this increase. The Gaza Strip is one of the most densely populated areas in the world. It has a popu-lation density of 9000 persons per square mile [15], and has a high unemployment rate, estimated at 39.9% in 2002 [16].
One particular strength of this study is the use of mortality data, which may be more reliable than morbidity data, which suffer from under-reporting if reliant on medical records, because not all injured children will seek medical care [17]. On the other hand, under-reporting of cause of injury is common in Palestinian death certificates, particularly for intentional in-juries [17]. Nevertheless, this is unlikely to change our conclusions substantially. In Israel as well as in England and Wales [18], under-reporting of cause of injury death is rare for children.
Calculating the incidence of injury among Palestinian children was based on the most up-to-date data, except for firearms missiles, provided by the Palestinian Health Information Centre. Unfortunately, data on
the impact of injury in Palestinian children before the intifada were not available. The current data lack information regarding so-cial class, hence an assessment of whether social class was a confounding variable was not possible. Data on transport mortality were not complete, hence we were unable to identify specific risk groups (drivers, pedestrians, cyclists or passengers). Owing to lack of data on age-specific mortality we were unable to investigate the impact of the injury problem on premature mortality, years of potential life lost prior to age 65.
Overall injury mortality rate was much higher in the Palestinian Territories than in Israel and England and Wales. This may be partly attributable to differences in socio-economic status, for which we have been unable to control. In all 3 communities, injury mortality was higher among boys than girls and children aged 15–19 years were the most affected. With respect to the predominance of males, similar patterns have been reported in other studies [19,20]. Our findings support other reports showing
Figure 1 Trends in injury mortality rates in children aged 0–19 years in the Palestinian Territory by firearm missiles and transport accidents for the period 2001–03

412 La Revue de Santé de la Méditerranée orientale, Vol. 14, No 2, 2008
املجلة الصحية لشرق املتوسط، منظمة الصحة العاملية، املجلد الرابع عشر، العدد ٢، ٢٠٠٨
that the injury mortality rate increases in the under 20 years age group [21,22].
Interestingly, the pattern of transport ac-cidents in Palestinian children was markedly different from that in Israel and England and Wales. While the transport accident rate showed no or even negative association with age in Palestinian children, it showed a sharp rise in Israel and in England and Wales in children aged 15–19 years. In Palestinian camps and villages there are no real playing places and as a result young children are exposed to dangerous surroundings as they play in the streets [23].
The legal driving age in the Palestinian Territory is 16 years, but as a result of the low socioeconomic status, Palestinian ado-lescents have very limited access to cars. The Palestinian Central Bureau of Statistics estimated the private car ownership to be 24.4 per 1000 population [24] compared to 232.7 per 1000 population in Israel and 433.6 per 1000 population in England and Wales. Further restrictions on travelling by private car are usually imposed by the military checkpoints of the occupation [25]. These checkpoints usually exist between Palestinian cities forcing people to travel on foot or to use public transport. In an attempt to avoid military checkpoints, some Pales-tinians use bypass roads which makes them a target for the occupation forces [13].
Conclusions
We have identified a particularly high in-jury death rate in children living in the Gaza Strip. This research provides a baseline orientation on the burden of injury mortal-ity in children in the Palestinian Territory. It is hoped that our findings can stimulate and guide future research and interventional work focusing on this major public health problem. Intervention policies must be in-
formed by valid morbidity data, and it is recommended that injury surveillance sys-tems be set up. In the Palestinian Territory, health issues cannot be separated from the political issues. The current crisis situation is likely to impede effective implementation of intervention policies.
In order to reduce mortality due to firearms missiles in Palestinian children, the international community needs to take practical steps to activate the peace process. Several strategies have been recommended by Aboutanos and Baker to reduce the ef-fect of war on civilians [26]. It is believed that prevention of selling, distribution and manufacture of firearm missiles, ammuni-tion and land mines might be options to reduce the effect of war injuries on the civil population.
For transport accidents, accidental drowning and submersion, falls and as-sault, low cost intervention policies could be implemented to prevent the occurrence of these injuries among the Palestinian children. These policies could be based on a health education campaign that targeted parents. The media could be used to in-crease the awareness of the injury problem among the general population, in particular, with respect to transport accident deaths in children aged 0–4 years.
Acknowledgements
The authors would like to thank the Ford Foundation for sponsoring the study of the first author at the London School of Hygiene and Tropical Medicine. We thank the Palestinian Health Information Centre, in particular Miss Khitam Hamad, for pro-viding the mortality data. We also thank Professor Ian Roberts and Sir Iain Chalm-ers whose comments helped to improve this manuscript.

Eastern Mediterranean Health Journal, Vol. 14, No. 2, 2008 413
املجلة الصحية لشرق املتوسط، منظمة الصحة العاملية، املجلد الرابع عشر، العدد ٢، ٢٠٠٨
References
1. Peden M, McGee K, Sharma G. The injury chart book: a graphical overview of the global burden of injuries. Geneva, World Health Organization, 2002.
2. Child injuries and violence. Geneva, World Health Organization, 2005 (http://www.who.int/violence_injury_prevention/child/en/, accessed 4 November 2007).
3. Peden M, Scurfield R, Sleet D. World re-port on road traffic injury prevention. Ge-neva, World Health Organization, 2004.
4. Annual report 2003: leading causes of death. Gaza, Palestine, Ministry of Health, 2004.
5. Palestinian children: issue and statistics. Ramallah, Palestine, Palestinian Central Bureau of Statistics, 2004.
6. Helweg-Larsen K et al. Systematic medi-cal data collection of intentional injuries during armed conflicts: a pilot study con-ducted in West Bank, Palestine. Scan-dinavian journal of public health, 2004, 32(1):17–23.
7. Halileh SO et al. The impact of the intifada on the health of a nation. Medicine, con-flict and survival, 2002, 18(3):239–48.
8. Hamam MA, El-Sayed EH. Injury in Egypt: ‘the hidden epidemic’. Trauma quarterly, 1999, 14(3):261–7.
9. Soori H, Naghavi M. Childhood deaths from unintentional injuries in rural areas of Iran. Injury prevention, 1998, 4(3):222–4.
10. Bener A, Crundall D. Road traffic acci-dents in the United Arab Emirates com-pared to Western countries. Advances in transportation studies, 2005, A(6):5–12.
11. Bener A. The neglected epidemic: road traffic accidents in a developing country, State of Qatar. International journal of injury control and safety promotion, 2005, 12(1):45–7.
12. Summerfield DA. Israeli army’s shoot to kill policy: Israeli soldiers confirm the poli-cy documented in journal. British medical journal, 2005, 331(7518):699.
13. Israeli violation against the health sec-tor. Gaza, Palestine, Ministry of Health, 2005.
14. The Palestinian Ministry of Health accuses Israeli occupation forces for its continuous violation against the health sector. Gaza, Palestine, Ministry of Health, 2005.
15. Polk L. Gaza Strip: the politics of wa-ter and electricity. Dallas, Texas, Dallas Peace Center, 2006 (http://dallaspeace-center.org/?q=node/1120, accessed 3 November 2007).
16. Annual report 2004: labour force survey. Ramallah, Palestine, Palestinian Central Bureau of Statistics, 2005.
17. Annual report 2004: health status in Pal-estine. Gaza, Palestine, Ministry of Health, 2005.
18. DiGuiseppi C, Roberts I, Li L. Influence of changing travel patterns on child death rates from injury: trend analysis. British medical journal, 1997, 314(7082):710–3.
19. Kozik CA et al. Causes of death and un-intentional injury among schoolchildren in Thailand. Southeast Asian journal of tropical medicine and public health, 1999, 30(1):129–35.
20. Gofin R et al. Injury inequalities: morbid-ity and mortality of 0–17 year olds in Is-rael. International journal of epidemiology, 2002, 31(3):593–9.
21. Zwi KJ et al. Patterns of injury in children and adolescents presenting to a South African township health centre. Injury pre-vention, 1995, 1(1):26–30.
22. Roberts I, DiGuiseppi C, Ward H. Child-hood injuries: extent of the problem, epi-
414 La Revue de Santé de la Méditerranée orientale, Vol. 14, No 2, 2008
املجلة الصحية لشرق املتوسط، منظمة الصحة العاملية، املجلد الرابع عشر، العدد ٢، ٢٠٠٨
demiological trends, and costs. Injury prevention, 1998, 4(4 suppl.):S10–6.
23. Mueller BA, Rivara FP, Bergman AB. Urban-rural location and the risk of dying in a pedestrian-vehicle collision. Journal of trauma, 1988, 28(1):91–4.
24. Annual report 2001: transportation and communication statistics in the Palestin-ian Territory. Ramallah, Palestine, Pales-tinian Central Bureau of Statistics, 2001
(http://www.pcbs.gov.ps/_pcbs/asb_pal/tab_26.aspx, accessed 15 June 2005).
25. In focus: Movement restrictions. Ramal-lah, Al-Haq (http://www.alhaq.org/cp-cam-paign/movement-restrictions_legality.htm, accessed 26 September 2005).
26. Aboutanos MB, Baker SP. Wartime civil-ian injuries: epidemiology and interven-tion strategies. Journal of trauma, 1997, 43(4):719–26.
Healthy environments for children: facts and figures Over five million children per year die from illnesses and other condi-tions caused by the environments in which they live, learn and play.Around two million under fives die every year from acute respiratory infection, the largest killer of young children. The second most com-mon cause is diarrhoea—a total of 1.3 million deaths each year. The most common vector-borne diseases are transmitted by mosqui-toes. Every year, malaria kills approximately one million children, many of them under five; dengue haemorrhagic fever kills an estimated 10 000, while Japanese encephalitis kills around 8000. In 2001, an estimated 685 000 children under the age of 15 were killed by unintentional injuries including those resulting from road traf-fic accidents, falls, burns and drowning. Worldwide approximately 20% of deaths due to such injuries occur in children under 15 years; the vast majority of these occur in low- and middle-income countries. The Healthy Environments for Children Alliance promotes a number of simple, low-cost, effective and sustainable measures to combat the environmental risks to children. A full listing of what is possible (some of which are simple measures which can be taken at home or in schools) is available on the HECA website:www.who.int/heca/en.

Eastern Mediterranean Health Journal, Vol. 14, No. 2, 2008 415
املجلة الصحية لشرق املتوسط، منظمة الصحة العاملية، املجلد الرابع عشر، العدد ٢، ٢٠٠٨
Perspectives on domestic violence: case study from Karachi, PakistanF. Rabbani,1,2 F. Qureshi2 and N. Rizvi2
1Karolinska Institutet, Stockholm, Sweden (Correspondence to F. Rabbani: [email protected]).2Department of Community Health Sciences, Aga Khan University, Karachi, Pakistan . Received: 13/07/05; accepted: 09/03/06
ABSTRACT There is no adequate profile of domestic violence in Pakistan although this issue is fre-quently highlighted by the media. This case study used qualitative and quantitative methods to explore the nature and forms of domestic violence, circumstances, impact and coping mechanisms amongst selected women victims in Karachi. Violence was a continuum: all the women reported verbal abuse, often escalating into physical, emotional, sexual and economic abuse. The husband was the most com-mon perpetrator. Women suffered in silence due to sociocultural norms, misinterpretation of religious beliefs, subordinate status, economic dependence and lack of legal redress. Besides short-term local measures, public policy informed by correct interpretation of religion can bring about a change in pre-vailing societal norms.
La violence familiale : une étude de cas à Karachi (Pakistan)RÉSUMÉ Il n’est pas possible de dresser un tableau exact de la violence familiale au Pakistan, même si les médias accordent souvent une large place à ce problème. Dans le cadre de cette étude de cas, nous avons appliqué des méthodes qualitatives et quantitatives pour examiner la nature de la violence familiale et les formes qu’elle revêt, les circonstances dans lesquelles elle se produit, ses effets ainsi que les mécanismes d’adaptation chez un certain nombre de femmes victimes de violence à Karachi. La violence était omniprésente : toutes les femmes indiquaient qu’elles faisaient l’objet de harcèlement verbal, qui dégénérait souvent en violence physique, émotionnelle, sexuelle et économique. Le plus souvent, c’est le mari qui était l’auteur des violences. Les femmes souffraient en silence en raison des normes socioculturelles, d’une interprétation erronée des concepts religieux, de leur statut de subordonnées, de leur dépendance économique et de l’absence de réparation en justice. Outre des mesures locales à court terme, une politique gouvernementale inspirée par une interprétation correcte de la religion peut amener un changement dans les normes sociétales existantes.

416 La Revue de Santé de la Méditerranée orientale, Vol. 14, No 2, 2008
املجلة الصحية لشرق املتوسط، منظمة الصحة العاملية، املجلد الرابع عشر، العدد ٢، ٢٠٠٨
Introduction
Domestic violence (a proportion of the total violence against women) may be defined as any act committed within the family by a family member, or behaviour that results in physical harm or psychological injury to an intimate partner or other member of the family [1,2]. Disparity in the defini-tion and determinants of domestic violence across cultures makes comparative studies difficult. Globally, domestic violence and rape constitute 5% of the health burden for women in their reproductive years [2] and has been reported from countries as varied as the United States of America, Chile, Peru, Egypt, Papua New Guinea, India (dowry deaths), China (female infanticide) and Bangladesh [1–8]. In a study conducted in Pakistan, domestic violence emerged as an important public health concern, with 100% of men respondents admitting to ver-bal abuse, 33% to physical abuse and 78% to sexual abuse of their wives [9].
The social causes of domestic violence in developing countries stem from econom-ic backwardness, insufficient protection by laws, low educational levels, a patriarchal society and the low social status of women [10–12]. In Pakistan, men are generally con-sidered superior and women seen as chattels who are expected to be dutiful to husbands and children, especially as they lack eco-nomic security [13].
Apart from the physical dangers, the psychosocial consequences of violence are also grave. Victims are more likely to use marijuana and alcohol for coping, to have depression and to attempt suicide [14–16]. Domestic violence endangers women’s autonomy and social stability and drains their emotional strength and self-esteem. Frequently, there is an associated negative impact on women’s reproductive health [17].
For the woman, strategies for dealing with violence range from leaving the ag-gressor, accepting the violence or resorting to self-defence [11]. Recent studies are focusing on helping the victims deal with the consequences of partner violence [18].
Pakistan lags far behind most develop-ing countries in women’s health and gender equity. The sex ratio is one of the most un-favourable to women in the world, a result of excess female mortality during child-hood and childbearing. Lack of mobility, decision-making power and income, as well as prohibitions against seeking care from male providers, present serious constraints to women’s ability to use the limited serv-ices that are available [19].
Uneducated, tired from repeated child-bearing and economically dependent, women are also vulnerable to crimes and violence. The latter can be attributed to different cultural, sociological and political factors. State legislations (not always bound by Islamic law) favour the traditional cul-tural bias against women with regards to age at marriage, choice of husband, rights to inheritance, divorce, etc. [20]. Poverty, ignorance, economic dependence and tradi-tion exacerbate the situation. Pakistan’s national plan of action specifically recom-mends “...measures to deter and address incidence of domestic and sexual violence” [21].
The popular press has also highlighted issues related to this in the sociocultural perspective of Pakistani society. However, there is little local scientific evidence avail-able in this area. Studies from other South Asian countries, with which Pakistan shares many sociocultural traditions, indicate that domestic violence is a grave problem in the region [7]. Except for one or two pre-liminary studies directly reporting on the issue [9,17], we did not find any published population data on domestic violence in Pa-

Eastern Mediterranean Health Journal, Vol. 14, No. 2, 2008 417
املجلة الصحية لشرق املتوسط، منظمة الصحة العاملية، املجلد الرابع عشر، العدد ٢، ٢٠٠٨
kistan. Another study has indirectly probed the issue, looking at Pakistani obstetricians’ knowledge of the prevalence of domestic violence in clinical practice and their at-titudes towards instituting screening proto-cols during routine antenatal care [22].
Our study therefore proposed an initial investigation of the nature and forms of domestic violence, the surrounding cir-cumstances, the impact on victims and coping mechanisms used by victims in Karachi. The ultimate aim was to establish hypotheses for larger studies to establish the extent of the problem and cause–effect relationships so that appropriate preventive strategies can be recommended.
Methods
It is difficult to obtain reliable and accurate information through a representative large household survey on a sensitive and ill-defined issue such as domestic violence. We therefore used the case study approach as a form of empirical enquiry. A case study investigates a contemporary phe-nomenon within its real-life context and is especially of use where the boundaries between the phenomenon and its context are not clearly defined [23]. Multiple sources of evidence are usually relied upon, with the data converging through triangulation. This approach benefits from the prior de-velopment of theoretical propositions, in this case the Duluth model [24]. This is a classic model of behaviour characterized by the misuse of power and control by one person over another. Initially conducted as part of an experiment in Duluth, United States of America, this programme has now become a model for use by other interven-tion projects.
Using a mix of qualitative and quan-titative techniques, data collection was
conducted in Karachi, Pakistan from 1999–2001 by the Department of Community Health Sciences at Aga Khan University. Initially domestic violence was studied by interviews with key informants and opinion leaders and through focus group discussions (FGDs). Eight key informant interviews were done with people who were knowl-edgeable health care providers, opinion leaders and social workers. FGDs were used to gather knowledge regarding com-munity perceptions of domestic violence, the magnitude of the problem, types of violence, causes, impact, coping strategies and the role of community leaders and the media. Of the 13 FGDs completed, 8 were with women and 5 with men. These discus-sions were conducted with representatives from the major ethnic groups of Pakistan (Balochis, Pathans, Punjabis, Sindhis and Urdu speaking people whose parents mi-grated from India). Both key informant interviews and FGDs lasted for about 2 hours each. FGDs were audiotaped, group dynamics were observed and notes were taken and transcribed later. Confidentiality was assured and external distractions were minimized. FGDs were organized either at the homes of community activists or at the Department of Community Health Sciences.
Key informant interviews and FGDs were edited, translated (where necessary) and transcribed by the team. Information from key informants and FGDs was used to develop a semistructured questionnaire with both closed- and open-ended questions. As it was not practical to conduct a random sur-vey on this issue, we used convenience sam-pling to identify 108 respondents (women victims) who had reported experiencing any type of violence from husbands and/or other family members and administered this questionnaire to them. These victims
418 La Revue de Santé de la Méditerranée orientale, Vol. 14, No 2, 2008
املجلة الصحية لشرق املتوسط، منظمة الصحة العاملية، املجلد الرابع عشر، العدد ٢، ٢٠٠٨
were identified with the support of human rights organizations, social activists and by field staff of the Department of Commu-nity Health Sciences working in Aga Khan University’s community-based health and development programmes. The majority of interviews (75) were conducted at the homes of the victims, community volun-teers or activists, and community health centres. Urdu (the national language, under-stood by all) was used for interviews. The open-ended questions in the questionnaire were later back-translated into English and a complete profile of each case was written by the first 2 authors. This helped to de-velop detailed narrative accounts of circum-stances surrounding the violent episodes and to highlight emergent themes. This structured questionnaire obtained informa-tion on key sociodemographic features, the perpetrator of violence, types of violence (verbal, physical, psychological or emo-tional, sexual, economic) and the duration, frequency, extent and severity of violence. The circumstances or events leading up to the occurrence, the impact and outcomes (adjustment, management, coping) were also explored.
Institutional ethical approval was obtained. The purpose of the study was explained and verbal consent taken from re-spondents. The latter were free to terminate the interview at will. All efforts were made to ensure the privacy, confidentiality and security of the interviewee. Data from these 108 cases were coded, edited and cleaned using Fox Pro version 2.6, then double-entered in Epi-Info, version 6.04C. The er-ror rate was under 1%.
Statement of consent to participateThis is to verify that all persons on whom the research has been carried out have given their informed verbal consent prior to the start of the interviews. No information has
been revealed in this study linking results to individual respondents. Moreover the Com-munity Management Teams in all field sites of Urban Health Program, Dept of CHS, Aga Khan University, Karachi, consented to conduct of focus group discussions either on or off the field premises. The key in-formants were experts in the field and were contacted by appointment for their time to contribute their views on this study.
Results
There was a great concurrence of views obtained from the 3 techniques: key inform-ant interviews, FGDs and case interviews. The team developed types and categories of abuse using the definitions of domestic vio-lence quoted earlier. We also consulted the Duluth model of power and control to clas-sify types of abuse [24]. Of the 108 women interviewed, 102 (94%) were ever-married while there were 6 women in our sample who had never married and were single. Of the ever-married women, 61 were currently married, 21 divorced (a relatively high pro-portion compared to the prevailing norm as these were specially selected cases), 17 separated and 3 widowed at the time of the interview. The mean age of respondents was 33 years. As judged by the ownership of as-sets, most families were reasonably well off with 64% owning a television and 69% reporting living in a family-owned house. Only 56% of the women were literate.
Nature and forms of domestic violenceAbuse was classified as “verbal” when there was use of bad or abusive language, loud tone, bullying, threatening (oral threats, intimidating behaviour, gestures, throwing or smashing things). All women (100%) reported being abused verbally and 58%
Eastern Mediterranean Health Journal, Vol. 14, No. 2, 2008 419
املجلة الصحية لشرق املتوسط، منظمة الصحة العاملية، املجلد الرابع عشر، العدد ٢، ٢٠٠٨
reported psychological abuse (such as sus-pected or actual infidelity by the husband, emotional blackmail by the perpetrator, character assassination, social isolation or perceived neglect of basic needs by the husband) in combination with other abuse types. Physical violence occurred generally in combination with verbal and/or psycho-logical abuse and was reported by 76% of women. It ranged from slapping, pulling hair, pushing or shoving, grabbing, hitting with an object and twisting the arms (mild forms) to kicking, punching, suffocating, intentional burns, hitting that resulted in fracture or injury to a vital organ (severe forms). Physical injury during pregnancy was also reported. Overall 12% of women reported some form of sexual abuse, nearly always in combination with other forms of violence. This included rape, forced prosti-tution and forced intercourse in marriage. On the whole, 39% women suffered some form of economic control. This included withholding money from the victim or re-fusal to meet household expenses, control of the woman’s wages or assets and stealing valuable assets such as personal jewellery or land, etc. Economic abuse also always occurred in combination with other forms of violence.
Perpetrators and frequency of abuseThe husband was the most common perpe-trator (88%) of violence, most often in com-bination with other members of his family. However in 58% of cases the husband alone was involved. Among the other perpetra-tors, the mother-in-law (15%) was the next most common abuser, in concert with her daughter(s) or other son(s). Mothers-in-law provoked or initiated violence against the victim by complaining to the husband. The mean duration of abuse was 11 years. Fre-quent abuse was defined as occurring every
month, every week or every day. This was reported in 92% of cases.
Women’s response to abuseIn answer to a question as to what women did in response to abuse, individual victims reported a range of coping strategies. Most victims used more than one strategy. Ini-tially most (90%) kept quiet or used strate-gies to minimize provoking factors; 58% resisted and either answered back or fought back; 56% talked to someone; 28% returned to their parent’s house, leaving the husband either temporarily or conditionally; 26% initiated some legal action for separation, divorce or for recovery of property; 17% reported that they went visit a friend or rela-tive just to get out of the home environment and tension. Women actively reduced occa-sions that resulted in abuse: “I don’t ask for money anymore”; “I have found a job”; “I keep quiet now till he has cooled down, and express my views later”. Those who had poor family support systems (parents dead or very poor) were more likely to accept the situation and continue to live with the husband rather than return to their parental home.
Consequences of abusePhysical abuse was reported by over two thirds of the women. The most common site of injuries was head, neck, face and arms. Bruises, aches, pains and local swelling were commonly reported, and victims resorted to home remedies and self-treatment. Less commonly there were cuts or more grave injuries such as fractures that required medical assistance. There was one case of burns (reported as unintentional injury to police) and the woman later died in hospital.
All forms of abuse had a psychological impact. Depression escalated into anger.
420 La Revue de Santé de la Méditerranée orientale, Vol. 14, No 2, 2008
املجلة الصحية لشرق املتوسط، منظمة الصحة العاملية، املجلد الرابع عشر، العدد ٢، ٢٠٠٨
There were 10 suicide attempts by 9 women (6 ingested tranquillizers or insecticide, and 3 poured kerosene or petrol over themselves and set that on fire but were subsequently saved); 3 others reported suicidal thoughts. Women reported that they did struggle and fight back, but over time they were emotionally exhausted and their attitude became fatalistic. They blamed “fate” for their circumstances and expressed a sense of helplessness and despair.
No male victims of domestic violence were identified in this sample, but men in FGDs pointed out that marital discord definitely has a negative emotional impact on men too. Directly or indirectly, chil-dren were also victims. Interviewed victims reported a great deal of concern for and impact on their offspring.
Discussion
In Arab and Islamic countries, domestic violence is not yet considered a major con-cern, despite its increasing frequency and serious consequences. Surveys in Egypt, Palestine, Israel and Tunisia show that at least 1 out of 3 women is beaten by her hus-band [25]. The indifference to this type of violence stems from attitudes that domestic violence is a private matter and, usually, a justifiable response to misbehaviour on the part of the wife. This is in contrast to Islam-ic teachings. Marriage in Islam is a sacred act as stated in the Quran, “And one of His signs is that He hath created for you mates of your own species that ye may find com-fort and rest in their company; and (with that end in view) hath put between you love and tenderness” (30:21). The Quran has clearly stated that women have rights even as they have duties, according to what is equitable, but men are a degree above them (2:228). The slight superiority is to be read in conjunction with another passage which states among other things, that men are
trustees, guardians and protectors of women because men excel in physical strength and because men expend their means (4:34). Islam emphasizes that a person’s status in society is determined by their deeds and not by gender. In early Islam, women excelled in scholarship, medicine and warfare. How-ever, with the passage of time, based on the Islamic teaching of tolerance and respect for other religions, the area that now comprises Pakistan absorbed much from the preva-lent local cultures (Hinduism, Buddhism) and changed its view of women’s status [26]. Ironically, selective excerpts from the Quran are widely misinterpreted without regard to context in order to justify men’s supremacy over women. Polygamy (which is allowed in Islam, provided the husband is able to treat all wives with equality and justice) has also often been misquoted and used to promote promiscuity. Also wom-en’s religious rights to remarry and divorce are disapproved by this society.
This discrimination against women is neither a new phenomenon nor restricted to Pakistan. From many perspectives women in South Asia (particularly Pakistan, India and Bangladesh) find themselves in sub-ordinate positions to men and are socially, culturally and economically dependent on them [27]. In these Asian countries with agriculture-based economies, the historical tribal feudal system and patriarchal struc-tures accord women a secondary role. As in other Muslim societies [28], in Pakistan women’s only close relationship with an unrelated male is with their husband. In Pa-kistan women are excluded from monetary transactions in markets for the goods they produce. Education for girls is thought to “spoil” and distract them from attention to household tasks. There is no value placed on girls attaining more than a primary edu-cation [29]. A girl child is considered only a “visitor” in the house where she is born and that eventually she has to go to her “real”

Eastern Mediterranean Health Journal, Vol. 14, No. 2, 2008 421
املجلة الصحية لشرق املتوسط، منظمة الصحة العاملية، املجلد الرابع عشر، العدد ٢، ٢٠٠٨
or marital home. These cultural perceptions are related to the strong image of women as dependent/private wives and mothers [30]. In South Asian society women themselves consider that they are incomplete, insecure, ineffective and inefficient without males [26]. On the basis of this concept, the male member is dominant in society and the female members are expected to be docile. Men are able to exploit women’s weakness-es. In fact, every aspect of women’s lives is more highly controlled than for their male counterparts. It has resulted in a society in which women endure discrimination and violence simply because they are women.
Given this cultural and religious context from Pakistan and other countries in the region, and based on various sources of data
in our study, we present here a thematic analysis of circumstances surrounding do-mestic violence (Figure 1).
Thematic analysis Violence is a continuumBased on data from our study, violence seems to follow a sequential pattern. The sequence appears to start with verbal abuse, escalating into anger and then exploding into all forms of violence. Just as reported elsewhere [28], shouting or yelling is quite culturally acceptable. In this study, isolated episodes of violence were uncommon. Gen-erally violence occurred in cycles: abuse was followed by a quiescent period lasting for various durations before restarting.
Figure 1 Perspectives on domestic violence: emergent themes from a case study of women victims in Karachi, Pakistan
422 La Revue de Santé de la Méditerranée orientale, Vol. 14, No 2, 2008
املجلة الصحية لشرق املتوسط، منظمة الصحة العاملية، املجلد الرابع عشر، العدد ٢، ٢٠٠٨
Arranged marriages and family formation patternsAll the customs governing marriage in Pa-kistan are highly male-oriented. In arranged marriages—the most common kind in Pa-kistan and in this sample too—and cousin marriages at a relatively young age, it is usually the husband’s family who sends out the proposal for marriage to the prospective bride’s parents. The feelings and prefer-ences of the couple concerned are often not taken into consideration. The bride has to move to live in the husband’s home and is expected to make adjustments while the bridegroom continues to live in his ances-tral home. Reporting on gender relations in South Asia, another study reports that the functioning of the “family unit” requires the subsuming of women’s interests and ignores the real-life experiences of women. It further adds that the notion of “family” is constantly undergoing change [31]. The majority of our victims lived in joint fami-lies with interference from in-laws. Usually minor differences and arguments between the couple exploded into various forms of violence upon incitement by in-laws. Vic-tims reported that such a family system acts “like a matchstick which evokes a fire”.
Lack of economic resources Arguments begin with verbal exchanges triggered by demands for money. At the time of our study, the average monthly household income in Pakistan was US$ 137 [32]. In this study many arguments began about the needs of the family and a lack of resources, and who decides how to use the resources. The husband usually either keeps the income himself or gives it to his mother. The majority of men are financially insecure with demands for money increas-ing with time. One woman victim said that “when a man cannot establish his author-ity intellectually or economically, he may
do this physically”. This is in concurrence with theories that explain the prevalence and occurrence of violence. It is reported that males are considered as macho beings and aggression is an important trait. If men sense a loss of control—for example, if the woman somehow gets stronger education-ally or economically—they try to regain control by battering or other forms of vio-lence until she surrenders [26].
Declining social support from maternal homeAfter the death of parents, especially the mother, it is customary in Pakistani society for sons to inhabit the maternal home. It was observed in our study that the strong social support and integrated family system weak-ens with time and sisters-in-law (brother’s wives) do not usually welcome back the victim and her children if they try to return on the grounds that the latter has already had her share of the family inheritance in the form of a dowry at marriage and is an added burden to the family now. Brothers neither support financially nor accept the divorced sisters to work outside for wages as it would damage the family honour. As one woman in the study said “what choices do we have?” Thus the woman victim of violence has little option except to continue in the current relationship.
Lack of legal support systemIn Islam, guardianship (especially for mi-nors) for the purpose of marriage is allowed because of the necessity for a proper and suitable match, which may not always be available [33]. Guardianship extends to the father and grandfather and in their absence other relations. However, again this guardi-anship was reportedly misused (although few women victims in this study reported this) to marry women without respecting their choice or taking their consent. Later it

Eastern Mediterranean Health Journal, Vol. 14, No. 2, 2008 423
املجلة الصحية لشرق املتوسط، منظمة الصحة العاملية، املجلد الرابع عشر، العدد ٢، ٢٠٠٨
was difficult to break out of the matrimonial bond because of the social stigma attached to divorce. Victims often said “this does not happen in our family”. The victims in this study stayed in abusive relationships, were reluctant to initiate legal action and even returned to their husbands because of their children. Khula or request for dissolution of marriage by wife, although allowed by religion, is comparatively rare. As one of our victims reported “if there is anyone to be blamed for breaking the bond it is quite usual that a fault is found in the woman; therefore I bear the violence”. The judicial system is not conducive to taking quick decisions in issues related to matrimony as they are publicly regarded as personal matters.
Woman viewed as an objectBesides complaints about the inability of a wife to take good care of household mat-ters, her physical appearance—for exam-ple, not being up to accepted standards of beauty—was also the subject of abuse. In one of the FGDs with men it was pointed out that inspired by the media, young men usually demand a smart, pretty and dutiful wife, and when this expectation is not met they try to find fault in trivial matters. This often leads to arguments and evokes violent masculine behaviour.
Unmet needs for sexAlthough not overtly reported, there were arguments about unmet needs for sex. A few women also reported undesired marital intercourse. Alcohol and substance abuse were not reported to be major triggers of sexual violence. However, they were re-ported in combination with other factors listed above, especially among a particular periurban community.
Culture of acceptance and silenceWomen “accepted” abuse by husbands as normative behaviour, and believed that if adjustments have to be made, it is the wom-en’s role to make the change. Other studies have also reported that victims may show little or no resistance so as to minimize the renewed aggression or injuries [28]. The women interviewed were very reluctant to share deeply personal and private issues of abuse with anyone, possibly because of shame (“people just laugh”), or helplessness (“what can anyone do anyway?”), and fear of causing distress to their families. The first ones to hear are probably close female friends or mothers but there is great reluc-tance to take any action.
LimitationsThe cases in our study were specially se-lected to identify the nature and forms of domestic violence, circumstances around violent episodes and the impact and cop-ing mechanisms used by victims. This case study was part of an initial assessment to generate hypotheses about possible deter-minants and factors associated with do-mestic violence. It is important to keep in mind that the study presents reported data of perceived abuse by the respondents only. No corroborating information was obtained from other sources or the husbands, but often neighbours, family or community members were aware of the discord and had identified victims for the research team.
RecommendationsIn the absence of relevant appropriate infor-mation, population-based epidemiological studies should explore culturally appropri-ate means of identifying and responding to abused women in resource-poor settings such as Pakistan. The community health
424 La Revue de Santé de la Méditerranée orientale, Vol. 14, No 2, 2008
املجلة الصحية لشرق املتوسط، منظمة الصحة العاملية، املجلد الرابع عشر، العدد ٢، ٢٠٠٨
houses in the Islamic Republic of Iran, panchayat in India and union parishads in Bangladesh act as the focal point for facilities, personnel and service delivery and offer empowerment initiatives [19]. Short-term efforts in Pakistan could include community-based health and family plan-ning clinics to put abused women in contact with support services, since they have on-going contact with the population at risk. Proper training and protocols are required to sensitize lady health workers—who have access to households under the government programme—to the issue of gender-based violence. A focus on community support groups and gender sensitization workshops is required. Counselling support and advo-cacy, as well as the mass media, need to be organized to address the issue.
Conclusion
Violence against women is not inevitable. The success of efforts to combat violence against women depends on a change in prevailing societal norms and correct inter-pretation and communication of the rights conferred to women by Islam. As long as society accepts the dominant masculine role and tolerates violent treatment of women, domestic violence will remain a problem.
Moreover, domestic violence should not be seen as private; it is a social problem
whose resolution will require public poli-cies, including appropriate legislation and protection of women’s rights.
Acknowledgements
Gratitude is expressed to the World Health Organization Centre for Health Develop-ment, Kobe, Japan for providing the funds to the principal investigator, Dr Asma Fozia Qureshi, to conduct this study under project ID number HQ/99/010793 (later reported in the WHO Centre for Health Develop-ment, Kobe, Japan’s International Public Health special edition as a part of a pilot research project on urban violence and health in 2001: ISBN 3-932136-82-9). We are thankful to our research assistants, Ms Fatima Sajan, Ms Anila Zaheeruddin and Zia Sultana, for assisting in conducting and transcribing the interviews. Ms Kausar S Khan, Drs Anwar Islam, Parvez Nayani and Riffat Zaman worked in the faculty research group. We thank the victim respondents for sharing their life circumstances with us and last but not least we must acknowledge our key informants, participants and staff of the Urban Health Programme, the Depart-ment of Community Health Sciences at Aga Khan University, and community activists for participating in this study.
References1. Tjaden P. What is violence against
women? Defining and measuring the problem: a response to Dean Kilpatrick. Journal of interpersonal violence, 2004, 19(11):1244–51.
2. Krug EG et al. eds. World report on vio-lence and health. Geneva, World Health Organization, 2002.
3. Heise L, Ellsberg M, Gottmoeller M. A glo-bal overview of gender-based violence. International journal of gynaecology and obstetrics, 2002, 78(Suppl. 1):S5–14.
4. Heise LL et al. Violence against women: a neglected public health issue in less developed countries. Social science & medicine, 1994, 39(9):1165–79.
Eastern Mediterranean Health Journal, Vol. 14, No. 2, 2008 425
املجلة الصحية لشرق املتوسط، منظمة الصحة العاملية، املجلد الرابع عشر، العدد ٢، ٢٠٠٨
5. The world’s women 2000: trends and statistics. New York, United Nations, De-partment of Economic and Social Affairs, 2000.
6. Anderson JW, Moore M. Born oppressed: women in the developing world face cra-dle-to-grave discrimination. Washington post, 14 February 1993, Section A:1.
7. Bates ML et al. Socioeconomic factors and processes associated with domestic violence in rural Bangladesh. Interna-tional family planning perspectives, 2004, 30(4):190–9.
8. Parish WL et al. Intimate partner violence in China: national prevalence, risk factors and associated health problems. Interna-tional family planning perspectives, 2004, 30(4):174–81.
9. Shaikh MA. Domestic violence against women—perspective from Pakistan. Journal of the Pakistan Medical Associa-tion, 2000, 50(9):312–4.
10. Xu X et al. Prevalence of and risk factors for intimate partner violence in China. American journal of public health, 2005, 95(1):78–85.
11. Jewkes R, Levin J, Penn-Kekana L. Risk factors for domestic violence: findings from a South African cross-sectional study. Social science & medicine, 2002, 55(9):1603–17.
12. Ellsberg M et al. Candies in hell: wom-en’s experiences of violence in Nicara-gua. Social science & medicine, 2000, 51(11):1595–610.
13. Miller BD. Daughter neglect, women’s work, and marriage: Pakistan and Bang-ladesh compared. Medical anthropology, 1984, 8(2):109–26.
14. Wingood GM, DiClemente RJ, Raj A. Adverse consequences of intimate part-ner abuse among women in non-urban domestic violence shelters. American
journal of preventive medicine, 2000, 19(4):270–5.
15. Otoo-Oyortey N. A battered woman needs more than biological help. IPPF medical bulletin, 1997, 31(3):5–6.
16. Hou WL, Wang HH, Chung HH. Domestic violence against women in Taiwan: their life-threatening situations, post-traumat-ic responses, and psycho-physiological symptoms. An interview study. Interna-tional journal of nursing studies, 2005, 42(6):629–36.
17. Fikree FF, Bhatti LI. Domestic violence and health of Pakistani women. Interna-tional journal of gynaecology and obstet-rics, 1999, 65(2):195–201.
18. Arriaga XB, Capezza NM. Targets of partner violence: the importance of under-standing coping trajectories. Journal of in-terpersonal violence, 2005, 20(1):89–99.
19. Tinker AG. Improving women’s health in Pakistan. Human development network. Health, nutrition and population series. Washington DC, World Bank, 1998.
20. Crime or custom? Violence against wom-en in Pakistan. New York, Human Rights Watch, 1999.
21. Nishtar S et al. The national action plan for the prevention and control of non-com-municable diseases and health promotion in Pakistan—prelude and finale. Jour-nal of the Pakistan Medical Association, 2004, 54(12 Suppl. 3):S1–8.
22. Fikree FF et al. Pakistani obstetricians’ recognition of and attitude towards do-mestic violence screening. International journal of gynaecology and obstetrics, 2004, 87(1):59–65.
23. Yin RK, ed. Case study research: design and methods, 3rd ed. Applied Social Re-search Methods Series. Volume 5. Thou-sand Oaks, California, Sage Publications, 2002.

426 La Revue de Santé de la Méditerranée orientale, Vol. 14, No 2, 2008
املجلة الصحية لشرق املتوسط، منظمة الصحة العاملية، املجلد الرابع عشر، العدد ٢، ٢٠٠٨
24. Pence E, Paymar M. Education groups for men who batter: the Duluth model. New York, Springer, 1993.
25. Douki S et al. Violence against women in Arab and Islamic countries. Archives of women’s mental health, 2003, 6(3):165–71.
26. Niaz U. Violence against women in South Asian countries. Archives of women’s mental health, 2003, 6:173–84.
27. Changing gender relations in the house-hold. In: Naryan D et al. Voices of the poor: can anyone hear us? New York, Oxford University Press, 2000.
28. Ahmed AM, Elmardi AE. A study of do-mestic violence among women attend-ing a medical centre in Sudan. Eastern Mediterranean health journal, 2005, 11(1/2):164–74.
29. Ibraz TS, Fatima A. Uneducated and unhealthy: the plight of women in Paki-stan. Pakistan development review, 1993, 32(4):905–13.
30. Ibraz TS. Cultural perceptions and the productive roles of rural Pakistani women. Pakistan development review, 1992, 31(4 Pt. 2):1293–304.
31. Mukhopadhyay M. Gender relations, de-velopment practice and “culture”. Gender and development, 1995, 3(1):13–8.
32. Household integrated economic survey 1998–99. Islamabad, Statistics Division, Ministry of Economic Affairs and Statis-tics, Government of Pakistan, 1999.
33. Husain A. Muslim personal law: an expo-sition. Nawatu Ulama, Lucknow, India, All India Personal Law Board, Camp Office, 1989 (ASIN:B0007C24F0).
Clinical management of rape survivors: developing protocols for use with refugees and internally displaced persons, 2007 (Revised edition)--Arabic versionThis guide describes best practices for clinical management of people who have been raped in emergency situations. It is intended for use by qualified health-care providers in developing protocols for the management of rape survivors in emergencies, taking into account available resources and national policies and procedures. It can also be used in planning health-care services and training health-care provid-ers. The guide includes detailed guidance on the clinical management of women, men and children who have been raped. The first version was field-tested at several sites. Feedback from these field-tests has been included in the current revised version. The guide is published in Arabic, English and French and can be downloaded at: http://www.who.int/gender/documents/newpublications/en/index.html.

Eastern Mediterranean Health Journal, Vol. 14, No. 2, 2008 427
املجلة الصحية لشرق املتوسط، منظمة الصحة العاملية، املجلد الرابع عشر، العدد ٢، ٢٠٠٨
Development of the International Consortium for Blood Safety (ICBS) HCV panelsS. Diaz,1 P. Liu,1 W.L. Kuhnert,1 M. Healy,2 A.M. Prince3 and M.M. El-Nageh3
1Division of Viral Hepatitis, National Center for HIV/AIDS, Viral Hepatitis, STD and TB Prevention (proposed), Centers for Disease Control and Prevention, Atlanta, Georgia, United States of America.2Bacterial Barcodes Incorporated, Athens, Georgia, United States of America.3International Consortium for Blood Safety (ICBS), New York, United States of America (Correspondence to M. El-Nageh: [email protected]).Received: 26/11/06; accepted: 07/02/07
ABSTRACT To evaluate the sensitivity and specificity of assays used to screen blood for antibody to hepatitis C virus (HCV) infection, the International Consortium for Blood Safety (ICBS) established fully characterized ICBS panels. ICBS collected and characterized 1007 anti-HCV-positive plasma units from geographically diverse origins by ELISA, RIBA, RT-PCR, and sequence-based genotyping, 539 of which met the definition of a true positive. Of these, 200 confirmed positive plasma units, representing the 6 major HCV genotypes, were selected to assemble the true-positive constituents of the panel. The negative panel comprises 181 plasma units collected from the USA. The panels have proved valuable for determining the performance of anti-HCV assays thus permitting national authorities, especially in resource-limited countries, to make informed deci-sions on selection of affordable and reliable assays.
Création par l’International Consortium for Blood Safety (ICBS) de panels pour le dépistage du VHCRÉSUMÉ Afin d’évaluer la sensibilité et la spécificité des tests utilisés pour effectuer une recherche d’anticorps dirigés contre le VHC (virus de l’hépatite C) dans le sang, l’International Consortium for Blood Safety (ICBS) a créé des panels correctement définis. L’ICBS a recueilli et caractérisé 1007 unités de plasma anti-VHC positives provenant de zones géographiques diverses en utilisant les tests ELISA, RIBA, RT-PCR et le génotypage par l’analyse des séquences ; 539 d’entre elles correspondaient à la définition d’un vrai positif. Sur ces unités, 200 confirmées positives représentant les six principaux génotypes VHC ont été sélectionnées pour constituer les vrais positifs du panel. Le panel négatif est constitué de 181 unités de plasma recueillies aux États-Unis. Les panels se sont avérés utiles pour déterminer la performance des tests anti-VHC, ce qui a permis aux autorités nationales, notamment dans les pays disposant de ressources limitées, de choisir en connaissance de cause des tests abordables et fiables.
ICBSPanels
1007
ELISA
RIBART-PCR
539
181
428 La Revue de Santé de la Méditerranée orientale, Vol. 14, No 2, 2008
املجلة الصحية لشرق املتوسط، منظمة الصحة العاملية، املجلد الرابع عشر، العدد ٢، ٢٠٠٨
Introduction
Infection with hepatitis C virus (HCV) is a global health problem, with an estimated 170 million chronically infected persons worldwide. Prevalence varies greatly by region and country. Countries in Africa and Asia have the highest reported HCV infec-tion prevalence rates, whereas Japan, Aus-tralia, and the industrialized countries of North America and Europe have relatively low prevalence. Rates range from ≥ 22% in Egypt, the country with the highest reported prevalence, to as low as 0.6% in Germany. Persons with persistent HCV infection are at high risk for development of chronic liver disease, cirrhosis and hepatocellular carcinoma [1,2].
Sources of HCV infection include: unsafe injections, transfusion of blood or blood products from unscreened or inad-equately screened blood donors, transfusion of blood products that have not undergone viral inactivation, long-term haemodialysis, organ transplantation, and medical or dental procedures performed with inadequately sterilized instruments. An unsafe blood sup-ply represents a major contributor to the to-tal HCV disease burden in many developing countries. The World Health Organization (WHO) estimates that blood donations up to 13 million units of the global blood supply, mainly in low or medium Human Develop-ment Index countries, are not screened for all relevant transfusion-transmissible infections [3].
Three main factors determine the ef-ficiency of anti-HCV diagnostics: 1) target antigens used in the assay design, 2) profes-sional skill of the technician performing the assay, and 3) laboratory environment. In many countries, test kits must be licensed by a national control authority before they can be used by blood transfusion services to screen donated blood. Licensure might
involve testing each kit against a panel of specimens obtained from the general population to determine the kit’s sensitivity and specificity compared to a reference test. In many developing countries, test kits are licensed based on their licensure elsewhere in the world. Furthermore, because HCV can be classified into 6 major genotypes and more than 60 subtypes, test kits should be assessed for their accuracy and consistency across the range of known HCV genotypes and subtypes.
In resource-challenged countries, the expense of currently available assays for blood screening results in a lack of or in-consistent testing of blood donations. In addition, transfusion services and labora-tories are hampered by the generally poor specificity of anti-HCV screening assays. These 2 constraints underscore the need to identify diagnostic test kits that are sensitive and specific and also affordable.
The International Consortium for Blood Safety (ICBS), a charitable non-for-profit organization operational since 1998, has specific goals, which include the identifica-tion and evaluation of reliable and afforda-ble assays for screening of blood donations. In line with its goals, ICBS decided to establish HCV panels (as well as the ICBS HBV panels) for comparative evaluation of commercially available test kits. The ICBS HCV panels were developed at the ICBS Collaborating Center at the Division of Viral Hepatitis, Centers for Disease Control and Prevention (CDC), Atlanta, United States of America (USA), with the assist-ance of the former Visible Genetics Inc., Norcross, Georgia, USA. The aim of creat-ing the HCV panels was to provide fully characterized panels of anti-HCV-positive and -negative samples that can be used to determine the sensitivity and specificity of test kits manufactured anywhere in the world.

Eastern Mediterranean Health Journal, Vol. 14, No. 2, 2008 429
املجلة الصحية لشرق املتوسط، منظمة الصحة العاملية، املجلد الرابع عشر، العدد ٢، ٢٠٠٨
Methods
Plasma specimensA total of 1007 anti-HCV initially reactive (IR) plasma units were obtained from col-laborators in Brazil, Egypt, Indonesia, Ivory Coast, South Africa, the USA and Viet Nam. Certain regions were selected based on the prevalence of unique genotypes and subtypes to ensure their inclusion in the ICBS Panel.
Each collaborator was at the start asked to store anti-HCV IR specimens. After permission to export from each participat-ing country was obtained, all IR plasma units were shipped frozen, on dry ice, to the ICBS Collaborating Center (Division of Viral Hepatitis, CDC) where they were characterized. All of the samples received were unlinked; no information related to the blood donors was provided. Units were selected for inclusion in the ICBS Panels based on: 1) the definition of true positivity, 2) the diversity by genotype and subtype, 3) the confirmatory assay banding patterns (RIBA 3.0, Chiron, Emeryville, California, USA), 4) the geographic region, and 5) the volume of material. The original strategy was to prepare anti-HCV ICBS Panels com-posed of approximately an equal number of panel constituents across all genotypes.
The ICBS collaborators from develop-ing countries faced obstacles and failed in getting permission from the authorities in their countries to export normal negative plasma units to ICBS for the inclusion in the ICBS negative panel. Therefore, for spe-cificity determination, a total of 181 plasma units negative for markers of HCV (anti-HCV), hepatitis B virus (HBV; HBsAg and anti-HBc), human immunodeficiency virus (HIV; anti-HIV-1/2 and HIV-1 p24 Ag), human T-cell lymphotropic virus (HTLV; anti-HTLV I/II), syphilis, and parvovirus B19 (DNA PCR) infection were acquired
from the USA. These plasma units were also screened for HCV and HIV by nucleic acid tests using Procleix HIV-1 and HCV/nucleic acid pooled testing (Gen-Probe Inc., San Diego, California, USA). In addition, ICBS constructed 19 pooled units (each assembled by pooling 2 to 4 small-volumes plasma units from the same country) from IR samples when tested in their countries of origin. These IR samples were obtained from Indonesia, Egypt and Ivory Coast that were subsequently found to be nega-tive by retesting at CDC. However, addi-tional testing using these 19 pooled samples demonstrated an unacceptable number of false-positive results with many of the test kits evaluated and therefore these pooled samples were omitted from the final panel.
Characterization of plasma unitsAll IR units were retested at CDC by an anti-HCV screening assay (Ortho EIA 3.0, Ortho-Clinical Diagnostics, Raritan, New Jersey, USA) and positive specimens were retested in duplicate. Repeatedly positive units were confirmed by automated RIBA 3.0 and by quantitative reverse-transcription polymerase chain reaction (RT-PCR) (Ro-che Amplicor, Roche Molecular Systems, Roche Diagnostic Systems Inc., Branch-burg, New Jersey, USA).
Viral RNA isolationHCV-specific RNA was extracted from 100 μL of serum or plasma using Tripure isolation reagent (Roche Applied Science, Indianapolis, Indiana, USA), according to the manufacturer’s protocol.
Reverse transcription (RT) A 17-μL per sample RT mix, containing 2 μL of 10X PCR buffer without mag-nesium chloride (Perkin-Elmer), 4 μL of 25 mM magnesium chloride, 8 μL of 2.5 mM deoxynucleotide-triphosphate (dNTP),

430 La Revue de Santé de la Méditerranée orientale, Vol. 14, No 2, 2008
املجلة الصحية لشرق املتوسط، منظمة الصحة العاملية، املجلد الرابع عشر، العدد ٢، ٢٠٠٨
and 2 μL of random primers and 1 μL of reverse primer, was prepared and mixed with the air-dried RNA pellet. The sample was heated at 94 °C for 3 minutes, rapidly frozen on dry ice, thawed on ice, and then centrifuged at 2000 rpm for 1 minute; 3 μL of the RT enzyme mix (1.5 μL of RNAse- and DNAse-free water, 1 μL of AMV-re-verse transcriptase, and 0.5 μL of RNAse inhibitor) was added to the sample. After incubation at 42 °C for 60 minutes and heat-ing at 95 °C for 5 minutes, the sample was chilled on ice.
Nested RT-PCR and sequencing Nested RT-PCR was performed accord-ing to the method described by Nainan, Cromeans and Margolis [4].
Primer sequences Primer sequences for the 5′UTR region were synthesized as follows: outer-forward, 5′GTG CAC GGT CTA CGA GAC CT; outer-reverse, 5′CTG TGA GGA ACT ACT GTC T; inner-forward, 5′CCC TAT CAG GCA GTA CCA CAA; inner- reverse, 5′GAA AGC GTC TAG CCA TGG CGT.
Primer sequences for the NS5B region were as follows: outer-forward, 5′TGG GGA TCC CGT ATG ATA CCC GCT GCT TTG A; outer-reverse, 5′GGC GGA ATT CCT GGT CAT AGC CTC CGT GAA; inner-forward, 5′CTC AAC CGT CAC TGA GAG AGA CAT; inner-reverse, 5′GCT CTC AGG CTC GCC GCG TCC TC.
Genotype analysis by nucleotide sequencing and phylogenetic analysisAll confirmed anti-HCV-positive units were genotyped and subtyped by direct DNA sequencing of the NS5b region and the 5′-UTR region, both by CDC and by
the former Visible Genetics Inc. Geno-type/subtype assignment was based on the classification of Simmonds et al. [5]. Ad-ditional genotype/subtype assignment was conducted on some of anti-HCV units based on the methods of Tokita et al. [6] (full data available at http://www.emro.who.int/pub-lications/emhj/index.asp). The sequences obtained in this study were analysed by both homology- and phylogenetic-based meth-ods. Sequences were edited using BioEdit and aligned with ClustalX. Genotyping (including subtyping) was done using the neighbour-joining method in Clustal X with a set of reference sequences from each gen-otype that clustered with the test sequences to form specific clades. All the 200 con-stituents of the HCV panel were genotyped by CDC and many of these constituents (126 out of 200) were also genotyped by the former Visible Genetics Inc. Thus in total 126 panel constituents were assigned a genotype and subtype based on concordant results from the 2 independent laboratories (CDC and former Visible Genetics Inc.).
Establishment of the HCV ICBS Panel specimens It was estimated by a special ICBS task force for establishing the ICBS panels that, for the purpose of evaluating anti-HCV assays, an HCV panel of 200 genotyped constituents is reasonably suitable for comparative evalua-tion of the sensitivity of commercially avail-able anti-HCV assays. The 200 constituents of the ICBS anti-HCV Panel were selected from 539 specimens that met the definition of a true positive. A true-positive specimen was defined as one that was repeatedly reactive by the screening assay, RIBA 3.0 positive, and positive in the RT-PCR-based genotyping assay; specimens classified as indeterminate by RIBA 3.0 did not meet the definition. Specimens were selected for the ICBS Panel based on: 1) serologic
Eastern Mediterranean Health Journal, Vol. 14, No. 2, 2008 431
املجلة الصحية لشرق املتوسط، منظمة الصحة العاملية، املجلد الرابع عشر، العدد ٢، ٢٠٠٨
confirmation as positive (indeterminate specimens were excluded); 2) concordant genotype/subtype if possible (i.e. genotyp-ing conducted by both CDC and the former VGI); 3) RIBA 3.0 banding patterns; 4) geographic origin; and 5) volume of ≥ 100 mL. Plasma units meeting the selection cri-teria were manufactured into panels under contract according to Good Manufacturing Practice/Good Laboratory Practice.
The required minimum volume of each plasma unit to manufacture the HCV panel samples was 200 mL. However, the volume of most plasma units obtained from certain geographic areas, such as Indonesia and Viet Nam, was < 200 mL because of the small volume (approximately 250 mL) of blood units collected by blood banks in these countries. Plasma units with volumes < 200 mL selected for the panel were brought up to the required 200-mL volume by adding plasma that was negative for HIV, HBV and HCV markers. The addition of the negative plasma to bring up the volume of some of the anti-HCV panel samples to the required 200-mL volume did not affect their detec-tion by anti-HCV assays. All manufactured units in the anti-HCV panel and the nega-tive panel were retested and confirmed to meet the criteria of “true positive” and “true negative” respectively.
Inclusion of weak-positive samples in the ICBS HCV panelThe ICBS HCV panel includes weak-positive samples (optical density reading close to the cut-off point of the assay) with signal to cut-off (s/co) ratios low enough to challenge the sensitivity of the anti-HCV assays being evaluated and distin-guish between sensitive and less sensitive assays. Post-manufacturing use of the 200 ICBS HCV panel members to evaluate the sensitivity of 44 commercial ELISA as-
says, showed that 19 HCV panel specimens (panel members number: 169, 33, 76, 156, 166, 12, 178, 67, 18, 198, 54, 121, 172, 73, 116, 164, 79, 104 and 13 in the order of the number of false negatives with the 19 HCV samples) are weak positives having screen-ing-test-positive signals close to the cut-off where differences in the antibody reactivity would be more likely to be seen. These 19 anti-HCV panel samples gave false nega-tive results in ≥ 2 ELISA assays of the 44 test kits evaluated (full data available at http://www.emro.who.int/publications/emhj/index.asp).
Inclusion of commercial seroconversion panelsThe ICBS anti-HCV Panel was supple-mented with 3 commercially available HCV seroconversion panels for use for the ICBS comparative performance studies of anti-HCV assays [7]. These 3 seroconversion panels are: PHV 914, PHV 920 (BBI Diag-nostics, West Bridgewater, Massachusetts, USA) and HCV 6212 (Impath-BCP, Fran-klin, Maryland, USA). The panels were selected to represent different reaction pat-terns, i.e. core only (PHV914), NS3 only (HCV 6212) and core + NS3 (PHV920) and to include different genotypes, i.e. genotype 1a (PHV 920) and genotype 2b (PHV 914). Characterization data were taken from the data sheets of the respective panel suppliers but are all based on Chiron RIBA HCV 3.0 Strip Immunoassay (Chiron Corporation, Emeryville, California, USA).
Storage of ICBS panelsThe ICBS panels are stored at –70 °C in the ICBS Test-Kit Evaluation Center, at Paul-Ehrlich-Institut (PEI), Langen, Ger-many, where the test kits evaluations were performed.
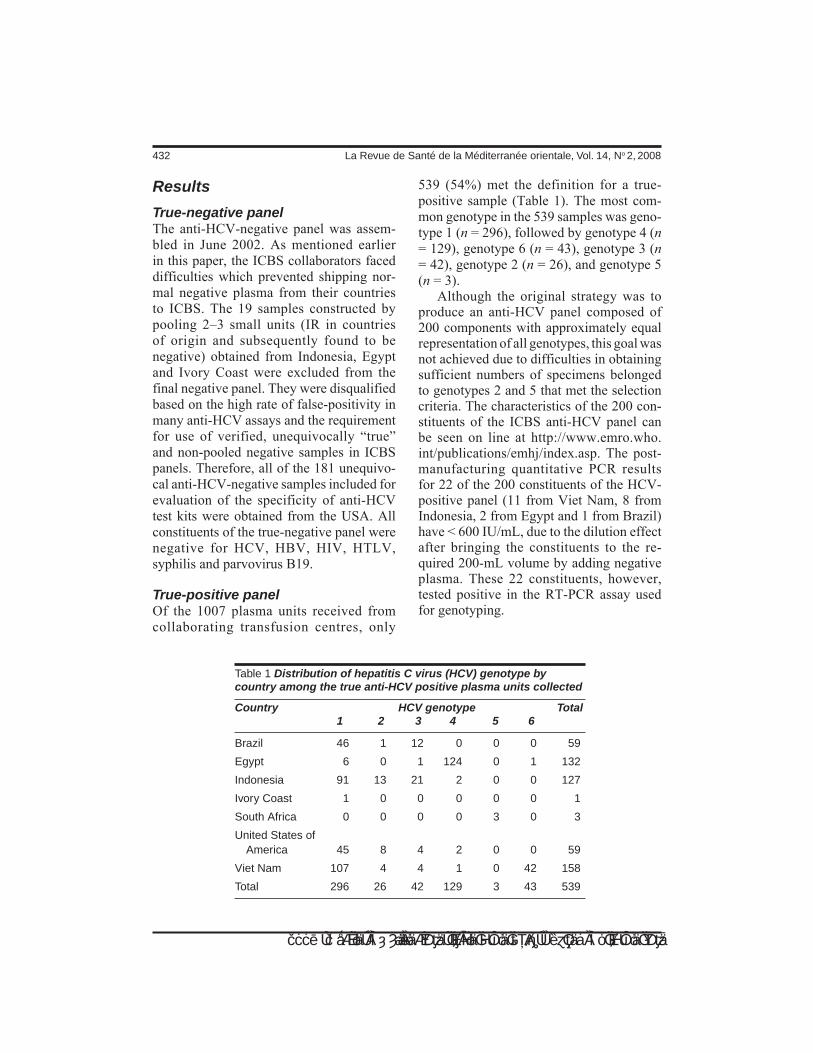
432 La Revue de Santé de la Méditerranée orientale, Vol. 14, No 2, 2008
املجلة الصحية لشرق املتوسط، منظمة الصحة العاملية، املجلد الرابع عشر، العدد ٢، ٢٠٠٨
Results
True-negative panelThe anti-HCV-negative panel was assem-bled in June 2002. As mentioned earlier in this paper, the ICBS collaborators faced difficulties which prevented shipping nor-mal negative plasma from their countries to ICBS. The 19 samples constructed by pooling 2–3 small units (IR in countries of origin and subsequently found to be negative) obtained from Indonesia, Egypt and Ivory Coast were excluded from the final negative panel. They were disqualified based on the high rate of false-positivity in many anti-HCV assays and the requirement for use of verified, unequivocally “true” and non-pooled negative samples in ICBS panels. Therefore, all of the 181 unequivo-cal anti-HCV-negative samples included for evaluation of the specificity of anti-HCV test kits were obtained from the USA. All constituents of the true-negative panel were negative for HCV, HBV, HIV, HTLV, syphilis and parvovirus B19.
True-positive panel Of the 1007 plasma units received from collaborating transfusion centres, only
539 (54%) met the definition for a true-positive sample (Table 1). The most com-mon genotype in the 539 samples was geno-type 1 (n = 296), followed by genotype 4 (n = 129), genotype 6 (n = 43), genotype 3 (n = 42), genotype 2 (n = 26), and genotype 5 (n = 3).
Although the original strategy was to produce an anti-HCV panel composed of 200 components with approximately equal representation of all genotypes, this goal was not achieved due to difficulties in obtaining sufficient numbers of specimens belonged to genotypes 2 and 5 that met the selection criteria. The characteristics of the 200 con-stituents of the ICBS anti-HCV panel can be seen on line at http://www.emro.who.int/publications/emhj/index.asp. The post-manufacturing quantitative PCR results for 22 of the 200 constituents of the HCV-positive panel (11 from Viet Nam, 8 from Indonesia, 2 from Egypt and 1 from Brazil) have < 600 IU/mL, due to the dilution effect after bringing the constituents to the re-quired 200-mL volume by adding negative plasma. These 22 constituents, however, tested positive in the RT-PCR assay used for genotyping.
Table 1 Distribution of hepatitis C virus (HCV) genotype by country among the true anti-HCV positive plasma units collected
Country HCV genotype Total 1 2 3 4 5 6
Brazil 46 1 12 0 0 0 59
Egypt 6 0 1 124 0 1 132
Indonesia 91 13 21 2 0 0 127
Ivory Coast 1 0 0 0 0 0 1
South Africa 0 0 0 0 3 0 3
United States of America 45 8 4 2 0 0 59
Viet Nam 107 4 4 1 0 42 158
Total 296 26 42 129 3 43 539

Eastern Mediterranean Health Journal, Vol. 14, No. 2, 2008 433
املجلة الصحية لشرق املتوسط، منظمة الصحة العاملية، املجلد الرابع عشر، العدد ٢، ٢٠٠٨
Table 2 shows the number of ICBS anti-HCV panel constituents by genotype and country of origin. The most diverse genotype by country of origin was genotype 1, with 66 constituents representing 6 coun-tries from different regions of the world. Genotype 2 constituents originated from 4 countries, but only 23 samples met the criteria for inclusion in the anti-HCV panel. Genotype 3 constituents also originated from 4 countries; 40 of the true-positive units were included. The 36 constituents belonging to genotype 4 were obtained from 4 countries, but most originated in Egypt. All except one of the genotype 6 constituents were obtained from Viet Nam, and all 3 constituents belonging to genotype 5 were from South Africa. The constituents of the anti-HCV panel for genotypes 4, 5, and 6 did not reflect such diversity because they were obtained from regions where the respective genotype is most prevalent compared to other regions.
Discussion
The genotyped ICBS anti-HCV PanelAn ICBS anti-HCV Panel was established as a “real world” panel to determine the
performance of individual test kits but not to monitor lot quality or intra-assay vari-ability on a regular basis. The ICBS Panel was assembled to facilitate the evaluation and identification of reliable and affordable HCV test kits.
The ICBS HCV panel, composed of 200 unequivocally confirmed anti-HCV positive constituents collected from diverse geographical regions of the world selected on the basis of the prevalence of genotypes and subtypes to ensure their inclusion in the panel, provides details on genotypes, s/co values of the screening assay (Ortho HCV 3.0), antibody profile (HCV RIBA 3.0) and PCR result (quantified). Yet the variability in characteristics and sequences of the HCV panel constituents may have been restricted by the sensitivity of initial ELISAs and by the sequences detected by the molecular assays used for genotyping, which may cause a probable exclusion of some variants. However, the ICBS HCV panel potentially serves as an alternative (or complementary panel) to other panels used to perform comparative performance stud-ies of anti-HCV assays. This panel was used together with commercial seroconversion panels in the evaluation of 44 assays for
Table 2 Distribution of hepatitis C virus (HCV) genotypes among the selected HCV panel constituents
Country HCV genotype Total 1 2 3 4 5 6
Brazil 13 1 0 0 0 12 26
Egypt 4 0 0 31 0 1 36
Indonesia 16 11 21 2 0 0 50
Ivory Coast 1 0 0 0 0 0 1
South Africa 0 0 0 0 3 0 3
United States of America 7 8 4 2 0 0 21
Vietnam 25 3 3 1 0 31 63
Total 66 23 28 36 3 44 200

434 La Revue de Santé de la Méditerranée orientale, Vol. 14, No 2, 2008
املجلة الصحية لشرق املتوسط، منظمة الصحة العاملية، املجلد الرابع عشر، العدد ٢، ٢٠٠٨
antibodies to HCV in addition to in addition to 5 other assays licensed in the European Union (EU), used for comparison. The true-positive ICBS Panel has already proven valuable for the selection of high-sensitivity screening assays manufactured in the devel-oping world and countries in transition and the substantial variability in sensitivity and specificity among the assays documented the value of the panel [7]. Continued use of the ICBS Panel to evaluate the performance of anti-HCV assays will fill an important need by identifying reliable and affordable test kits that can be used in countries with limited resources.
Evaluations of test kits to date have shown no obvious genotype-specific detec-tion failures, indicating that current assays do not appear to be genotype specific [7]. Thus, the lack of equal representation of all genotypes on the ICBS Panel might not affect sensitivity determinations.
Comparison to other HCV panels used for comparative evaluation of anti-HCV assaysOther HCV panels used by other institutions to perform evaluation studies of anti-HCV assays include the panels used by WHO and the National Institute of Infectious Diseases (NIID), Toyama, Shinjuku, Tokyo, Japan [8–10]. The WHO panel includes 68 sero-logically anti-HCV positive specimens (1 from Africa, 20 from Asia, 40 from Europe and 7 from Latin America). The specimens in the WHO panel were screened by 2 refer-ence ELISAs (Ortho 3.0 Enhanced SAVe from Ortho Clinical Diagnostics and Mono-lisa anti-HCV Plus from Bio-Rad). Speci-mens showing reactivity with either or both ELISAs were further characterized by using Chiron HCV RIBA 3.0. When results of the reference ELISAs and the HCV RIBA 3.0 were all positive, a specimen was consid-ered anti-HCV positive. Similarly, speci-
mens showing discordant ELISA reactivity and a positive HCV RIBA 3.0 were consid-ered anti-HCV positive. When the initial ELISA results were discordant, specimens having negative HCV RIBA 3.0 results were considered anti-HCV negative. As it is the case with the ICBS panel specimens, WHO specimens with discordant ELISA results and indeterminate HCV RIBA 3.0 were excluded from the panel. The WHO panel was used to evaluate 5 simple/rapid anti-HCV tests (report 1) followed by the evaluation of an additional 5 anti-HCV assays (2 simple/rapid tests and 3 ELISAs) with the inclusion of 4 reference assays for comparative purposes (report 2) [8,9].
As for the HCV panel used by NIID, Japan, to re-evaluate 25 anti-HCV test kits approved for marketing in Japan, it is com-posed of 20 NIID HCV antibody positive sera from the Institute, 1 commercial low titre panel and 2 commercial HCV antibody seroconversion panels.
Limitations of the negative panels used for comparative evaluationThe ICBS HCV negative panel used to investigate commercial anti-HCV assays is composed of 181 samples, while the WHO’s anti-HCV negative panel and that of NIID, Japan, are composed of 189 and 19 samples respectively. These panels can only provide a limited specificity estimate. Still, the ICBS HCV negative panel gave an impression on the general specificity that could be expected by the assays [7]. Some centres, contemplating the introduction of a test, evaluate specificity by performing ≥ 2000 tests. Specificity found in 1 country may not necessarily be similar in another. Since different countries may have their own “false-positive populations”, specifi-city is best determined locally by inclusion of some negative samples from the local population. The false-positive results of the
Eastern Mediterranean Health Journal, Vol. 14, No. 2, 2008 435
املجلة الصحية لشرق املتوسط، منظمة الصحة العاملية، املجلد الرابع عشر، العدد ٢، ٢٠٠٨
19 pooled samples might have been the re-sult of pooling, hypergammaglobulinaemia, connective tissue disorders, or other factors related to the origin of these samples. The questionable pooled samples were derived from countries in which malaria and other parasitic infestations are common. It was presumed in other studies that stimulation of polyclonal antibody production from recur-rent malaria infection could produce false-positive anti-HCV enzyme immunoassay results, thereby generating a high false-posi-tive rate [11–13]. Nonetheless, when used in the tropics, the negative panel might underes-timate the expected number of false-positive results. Supplementing future panels with additional samples from tropical regions will assist in alleviating this problem.
Need for affordable confirmatory assaysIn some resource-limited countries, a high rate of false-positive findings might limit the blood supply available for transfusions, leading to increased adverse patient out-comes. Because the use of the RIBA assay as a confirmatory test might not always be possible due to its cost, affordable con-firmatory assays should be developed and made available for countries with limited resources. Identification and establishment of regional confirmatory laboratories ca-pable of performing RIBA assays, nucleic acid testing by RT-PCR, and/or testing for HCV core antigen by ELISA would also be highly advantageous. HCV core antigen can be detected during the window phase of infection and appears to be a suitable additional marker for screening of blood donations [14–16].
Conditioned availability of ICBS HCV panel samplesIn line with the strong belief of ICBS in capacity-building, developing countries
that have national control authority labora-tories could initially be offered, at no cost, small samples of the ICBS Panel to help them develop their panels for continued use. These control authority laboratories should have appropriate facilities and resources, including properly trained personnel able to validate candidate tests and commit-ted to develop their own country/region specific panels (in phases) according to a well-defined plan and time frame. In spite of the importance of including serocon-version panels in national HCV panels to evaluate diagnostic sensitivity in assays and estimate delay in detection of anti-HCV, se-roconversion panels are very expensive and their high cost may hinder their inclusion in national panels of many countries with restricted economies.
Use of the ICBS HCV Panel by the ICBS Test Kits Evaluation CenterThe great majority of countries in the de-veloping world do not have regulatory in-stitutions capable of properly evaluating test kits. Therefore, ICBS recognized the necessity of establishing a centralized test-kit evaluation centre in an attempt to fill the gap. ICBS and Paul-Ehrlich-Institut in Langen, Germany agreed to collaborate in this regard. The Paul-Ehrlich-Institut agreed to foster the “ICBS Blood Screening & Test-Kits Evaluation Centre” within its framework. This centre is carefully evaluat-ing available commercial assays using the ICBS panels. Information on sensitivity and specificity of evaluated assays are posted on the ICBS website (www.icbs-web.org). This information, together with other avail-able information, may help countries with no control authority laboratories in making informed decision for selecting reliable and affordable assays to be used by blood banks for screening of blood donations.

436 La Revue de Santé de la Méditerranée orientale, Vol. 14, No 2, 2008
املجلة الصحية لشرق املتوسط، منظمة الصحة العاملية، املجلد الرابع عشر، العدد ٢، ٢٠٠٨
Acknowledgements
This work is among the activities of the International Consortium for Blood Safety (ICBS) funded by the Global Health Pro-gram of the Bill and Melinda Gates Foun-dation.
We are grateful to Dr Howard A. Fields, Division of Viral Hepatitis, CDC, Atlanta, for his scientific input, guidance, and expert supervision during the establishment of the panels. We are also indebted to Dr Harold S. Margolis, former Director, Division of Viral Hepatitis, CDC, Atlanta, for his invaluable support. We thank Dr Chong-Gee Teo, Dr Susan Goldstein and Dr John Ward, from the Division of Viral Hepatitis, CDC, At-lanta, for critical review of the manuscript. Our thanks are also due to the following col-
laborators who generously provided anony-mous plasma units: Dr Marcia Otani and Dr Ester Sabino (Brazil), Dr Salwa Yousef and Dr Heba Rashid (Egypt), Dr Auda Aziz (In-donesia), Dr Seidoo Konate (Ivory Coast), Dr Anthon du P. Heyns (South Africa), Dr Jay Valinsky and Dr Susan Stramer (USA), and Dr Thu Van (Viet Nam).
Authors’ note
Susan Diaz is currently working with the Pediatric Dengue Vaccine Initiative (PDVI), Emory Vaccine Center, Atlanta, Georgia, USA. Pengbo Liu is currently working with the Department of Global Health, Rollins School of Public Health, Emory University, Atlanta, Georgia, USA.
References1. Anonymous. Global surveillance and con-
trol of hepatitis C: report of a WHO con-sultation organized in collaboration with the Viral Hepatitis Prevention Board, Ant-werp, Belgium. Journal of viral hepatitis, 1999, 6:35–47.
2. Shepard CW, Finelli L, Alter MJ. Global epidemiology of hepatitis C virus infec-tion. Lancet infectious diseases, 2005, 5:558–67.
3. Global database on blood safety: sum-mary report, 1998–1999. Geneva, World Health Organization, 2001:1–8 (http://www.who.int/bloodsafety/global_data-base/en/SumRep_English.pdf, accessed 22 October 2007).
4. Nainan OV, Cromeans TL, Margolis HS. Sequence-specific, single primer amplifi-cation and detection of PCR products for identification of hepatitis viruses. Journal of virological methods, 1996,61:127–34
5. Simmonds P et al. Classification of hepati-tis C virus into six major genotypes and a series of subtypes by phylogenetic analy-
sis of the NS–5 region. Journal of general virology, 1993, 74:2391–9.
6. Tokita H et al. Hepatitis C virus variants from Jakarta, Indonesia classifiable into novel genotypes in the second (2e and 2f), tenth (10a) and eleventh (11a) genetic groups. Journal of general virology, 1996, 77:293–301.
7. Scheiblauer H et al. Evaluation of the per-formance of 44 assays used in countries with limited resources for the detection of antibodies to hepatitis C virus. Transfu-sion, 2006, 46:708–18.
8. Hepatitis C assays: operational character-istics (phase I): report 1. Geneva, World Health Organization, 2001 (WHO/BCT/BTS/01.2).
9. Hepatitis C assays: operational character-istics (phase I): report 2. Geneva, World Health Organization, 2001 (WHO/BCT/BTS/01.5).
10. Committee for Evaluation of In Vitro Di-agnostic Devices. Re-evaluation of HCV

Eastern Mediterranean Health Journal, Vol. 14, No. 2, 2008 437
املجلة الصحية لشرق املتوسط، منظمة الصحة العاملية، املجلد الرابع عشر، العدد ٢، ٢٠٠٨
Ab detection kits approved for marketing in Japan. Japan journal of infectious dis-eases, 2002, 55:33–6.
11. Aceti A et al. Anti-HCV false positivity in malaria. Lancet, 1990, 336:1442–3.
12. Aceti AG, Taliani G. Hepatitis C virus testing in African sera. Annals of internal medicine, 1992, 116:427.
13. Souto FJ, Fontes CJ, Gaspar AM. Preva-lence of hepatitis B and C virus markers among malaria-exposed gold miners in Brazilian Amazon. Memórias do Instituto Oswaldo Cruz, 2001, 96:751–5.
14. Lee SR et al. Efficacy of a hepatitis C virus core antigen enzyme-linked immunosorb-ent assay for the identification of “window-phase” blood donations. Vox sanguinis, 2001, 80:19–23.
15. Grant PR, Sims CM, Tedder RS. Quantifi-cation of HCV RNA levels and detection of core antigen in donations before serocon-version. Transfusion, 2002, 42:1032–6.
16. Nubling CM et al. Sensitivity of HCV core antigen and HCV RNA detection in the early infection phase. Transfusion, 2002, 42:1037–45.
AIDE-MEMOIRE for national blood programmesA well-organized blood transfusion service, with quality systems in all areas, is a prerequisite for the safe and effective use of blood and blood products.The HIV/AIDS pandemic has focused particular attention on the impor-tance of preventing transfusion-transmitted infections. Recipients of blood products are also infected by hepatitis B and C viruses, syphilis and other infectious agents, such as Chagas disease. The global bur-den of disease due to unsafe blood transfusion can be eliminated or substantially reduced through an integrated strategy for blood safety, which includes:establishment of a nationally-coordinated transfusion service
collection of blood only from voluntary non-remunerated blood donors from low-risk populationstesting of all donated blood, including screening for transfusion-transmissible infections, blood grouping and compatibility testingreduction in unnecessary transfusions through effective clinical use, including the use of simple alternatives, wherever possible.
This aide-mémoire is available in English, French, Portugese and Span-ish, and can be accessed from: http://www.who.int/bloodsafety/en/.
•
•
•

438 La Revue de Santé de la Méditerranée orientale, Vol. 14, No 2, 2008
املجلة الصحية لشرق املتوسط، منظمة الصحة العاملية، املجلد الرابع عشر، العدد ٢، ٢٠٠٨
Frequency of and barriers to utilization of mental health services in an Iranian populationA. Ghanizadeh,1 N. Arkan,2 M.R. Mohammadi,3 M.A. Ghanizadeh-Zarchi4 and J. Ahmadi5
1Division of Child and Adolescent Psychiatry; 2Medical School; 5Department of Psychiatry, Research Centre for Psychiatry and Behavioural Sciences, Shiraz University of Medical Sciences, Shiraz, Islamic Republic of Iran (Correspondence to A. Ghanizadeh: [email protected]). 3Department of Child and Adolescent Psychiatry, Psychiatry and Psychology Research Centre of Iran, Tehran University of Medical Sciences, Tehran, Islamic Republic of Iran.4Shahid Sadooghi University of Medical Sciences, Yazd, Islamic Republic of Iran. Received: 15/09/05; accepted: 19/12/05
ABSTRACT This study in 2005 compared the need for mental health services, actual use of services and barriers to use by 3 groups in Shiraz city in the Islamic Republic of Iran: a sample of the general population, parents of children with mental illness and primary-school teachers. Among the general population, 76.0% reported that they had wanted help in the previous 6 months and, of these, 50.0% actually sought it. The rates for parents of children with mental problems were 81.3% and 55.4% and for teachers were 60.0% and 35.0% respectively. The most common barriers to service use were logistic, especially the cost of and inconvenient access to services. Barriers related to perceptions of mental health services were also important, such as lack of trust and perceptions of friends/family.
Fréquence d’utilisation des services de santé mentale dans une population iranienne et obstacles à cette utilisationRÉSUMÉ Cette étude réalisée en 2005 a comparé les besoins en services de santé mentale, l’utilisation effective de ces services et les obstacles à leur utilisation dans trois groupes à Chiraz (République islamique d’Iran) : un échantillon de la population générale, des parents d’enfants atteints de maladie mentale et des enseignants d’école primaire. Dans la population générale, 76,0 % des personnes ont déclaré avoir souhaité obtenir de l’aide au cours des six mois précédents et, parmi ces personnes, 50,0 % ont fait les démarches en ce sens. Les taux chez les parents d’enfants atteints de maladie mentale étaient respectivement de 81,3 % et 55,4 % et chez les enseignants, de 60,0 % et 35,0 %. Les obstacles les plus courants à l’utilisation des services de santé mentale étaient structurels ; il s’agissait en particulier du coût et de la difficulté d’accès. Les obstacles liés aux idées que les personnes se faisaient des services de santé mentale étaient également importants, par exemple le manque de confiance et l’opinion des amis ou de la famille.
2005
3
76.050.0
81.3
55.460.035.0
Eastern Mediterranean Health Journal, Vol. 14, No. 2, 2008 439
املجلة الصحية لشرق املتوسط، منظمة الصحة العاملية، املجلد الرابع عشر، العدد ٢، ٢٠٠٨
Introduction
After cardiovascular disorders, mental ill-ness is the second leading cause of disabil-ity and premature mortality. The burden of mental disorders is more than 15% of the overall burden of disease from all causes and is even greater than the burden asso-ciated with all forms of cancer [1]. In the Islamic Republic of Iran there has been little research into mental health, despite estimates suggesting that around 7 million people suffer from one or more psychiatric disorder [2]. There is an urgent need for prevention and treatment of mental health illness and for better access to mental health care facilities.
There are many effective treatments and service delivery strategies for mental illnesses. Therefore individuals should be encouraged to seek treatment when they find themselves experiencing the signs and symptoms of mental distress. Reluctance to seek care is a result of very real barri-ers including the stigma of mental illness. Utilization of services is affected by many interacting factors, such as individual and help-seeking preferences, access, availabil-ity and referral practices [3].
In terms of individual characteristics, culturally influenced cognitive explanatory models for constructs such as problem rec-ognition may help in explaining differences in service use [4,5]. Seeking help is a target-oriented behaviour that entails psychologi-cal “costs”, such as feeling dependent and inferior. The final decision to seek or not to seek help is a function of a range of different factors [6]. A study of barriers to seeking mental health care in a rural impoverished population in the United States reported that the most common reason was the cost of care (40.0%), followed by lack of insurance (30.4%), inconvenient hours (18.1%) and unavailability of care (15%) [7].
Part of the problem is that we lack a standard definition of outpatient mental health services utilization and there is lit-tle consensus on what services constitute mental health treatment. This impacts on estimates of demand for mental health serv-ice and, because it is highly sensitive to how treatment is defined, we should be cautious in evaluating mental health utilization data. A general population study showed that 41.1% of the people studied in the United States of America had received some treat-ment in the previous 12 months, including 12.3% by a psychiatrist, 16.0% by a non-psychiatrist mental health specialist, 22.8% by a general medical provider and 6.8% by a complementary or alternative medical provider [8].
To our knowledge there has been no published research regarding the frequency of, and the barriers to, utilization of mental health services in the Islamic Republic of Iran. This study in Shiraz city compared the utilization of mental health services by 3 groups of people: a sample of the general population, parents of children with mental illness and primary-school teachers. It also assessed the association between the groups and barriers to utilization of mental health care.
While the levels of service utilization are a reflection of barriers to mental health care, it is important to assess both aspects. Barriers to mental health care focus on the perceptions of subjects about the factors that prevent access or create difficulties in accessing mental health services [9], while service utilization focuses on the actual receipt of services [10]. Thus, we used a general population sample to look mainly at barriers to help-seeking and a sample of parents of children with mental illness as a group who have actually received services. A group of teachers was included because we hypothesized that they were likely to be

440 La Revue de Santé de la Méditerranée orientale, Vol. 14, No 2, 2008
املجلة الصحية لشرق املتوسط، منظمة الصحة العاملية، املجلد الرابع عشر، العدد ٢، ٢٠٠٨
better educated on average and would be more aware of mental health problems and face fewer barriers to utilization.
Methods
The study was conducted in January and February 2005 in Shiraz city.
SampleThe 3 study groups included 100 people selected from the general population, 80 parents of children with psychiatric disor-ders and 100 primary-school teachers. The entire city was divided into a grid of sectors covering 4 educational areas. The teacher and general population participants were selected by stratified random sampling, 25 subjects for each group from each area sector. The parents were randomly selected from the parents of children referring to the Hafez Hospital outpatient child psychiatric clinic. The psychiatric diagnoses of the children were mostly disruptive behaviour disorders, anxiety disorders and mood dis-orders. Parents of children with mental re-tardation were excluded. None of the people selected refused to participate.
Data collectionA self-reported questionnaire was prepared by the authors based on a previous study about barriers to mental health care [10]. The questionnaire was translated into Farsi by the psychiatrist researchers, and the Farsi version was back-translated by another psy-chiatrist. It was reviewed and reconfirmed by the team and the final translation was fixed by consensus. To examine the feasi-bility of the questionnaire, it was adminis-tered to parents in a child and adolescent psychiatry clinic in a pilot study. After approval of its performance, it was used in the current study. The test–retest validity was 0.85.
The questionnaire asked about demo-graphic data (age, sex, educational level and marital status) and history of referral for any mental illness in the past 6 months to a general practitioner (GP), psychiatrist, friend, psychologist, relative, counselling centre or traditional fortune-teller (falgir in Farsi). They were also asked about bar-riers to referral to any of these. No formal classification system for mental disorders was used. The study was not limited to ask-ing about specific mental health problems and therefore mental health problems were defined as the respondents’ perceived need for mental health care.
The questions included: Have you ever sought help for a mental health problem or did you think you had symptoms of a mental disorder in the last 6 months? Have you ever had any mental health problem or thought you had symptoms of a mental disorder in the last 6 months for which you did not seek any help? What were the barriers to using the help sources? For the last question re-spondents were asked to respond to each of 15 possible barriers to use of services; there were 6 statements about logistic barriers, 2 about barriers related to perceptions of mental health problems and 7 about barriers related to mental health services. Each state-ment was scored 0 (no barrier) or 1 (barrier). The respondents were divided into those who had actually contacted a mental health service provider and those who wanted help but had not yet made contact.
The participants were given sufficient time to complete the questionnaire in pri-vate. The questionnaire was self-reported, but illiterate respondents were interviewed by the researcher. All participants were informed about the purpose of the study and reassured about anonymity and all gave consent for participation and publication of the results.

Eastern Mediterranean Health Journal, Vol. 14, No. 2, 2008 441
املجلة الصحية لشرق املتوسط، منظمة الصحة العاملية، املجلد الرابع عشر، العدد ٢، ٢٠٠٨
AnalysisThe association of any reported barriers between the groups was analysed using chi-squared tests. Independent t-tests were used to compare the mean scores of the items in 3 categories: logistic barriers, barriers related to perceptions of mental health problems and barriers related to perceptions of mental health services. The correlation of age and years of education with the different catego-ries of barriers was analysed. A univariate general linear model was used to compare the mean score of the types of barriers be-tween the 3 groups and study the effect of educational level as a covariant factor.
Results
The study samples were 100 people from the general population, 80 parents of chil-dren and adolescents with mental illness and 100 primary school teachers. The pro-portions of males in the 3 samples were 44 (44.0%), 30 (38.0%) and 20 (20.0%) respectively. The proportion of married subjects was 84.4% in the general popula-tion, 98.8% among relatives and 60.0% among teachers. The mean number of years of education was 12.1 years in the general population group, 13.4 years for the teach-
ers and 10.8 years for relatives of children with mental illness.
Table 1 shows the proportion of each sample who said that they had wanted help or thought they had symptoms of a men-tal disorder in the last 6 months and the proportion who actually sought help for a mental disorder in that time. Of the general population, 76 (76.0%) reported that they had wanted help and, of these, 38 (50.0%) actually sought it. The corresponding per-centages for parents of children with mental problems were 81.3% and 55.4% and for teachers were 60.0% and 35.0%
The types of barriers to seeking help reported by the whole sample and by those who said they had wanted help with mental problems are shown on Table 2. Logistic barriers to service use were reported by 34.0% of the general population, 47.5% of parents and 18.0% of teachers and this was a significant difference between groups (chi-squared test, P < 0.001). Among the logistic barriers, the cost of the services was the most commonly reported barrier, followed by inconvenience of services, distance to services and not knowing where to go. Bar-riers related to perceptions of mental health services were also important, with 46.0% of the general population, 50.0% of par-
Table 1 Percentage of people in the 3 groups who wanted help with mental health problems, and percentage who actually sought help, in the previous 6 months
Sample Wanted help Actually sought help No. %a No. %b
General population (n = 100) 76 76.0 38 50.0
Parents of children with mental illness (n = 80) 65 81.3 36 55.4
Teachers (n = 100) 60 60.0 21 35.0aPercentage of the whole sample who wanted help.bPercentage of those who wanted help who actually sought it.n = total number of respondents.
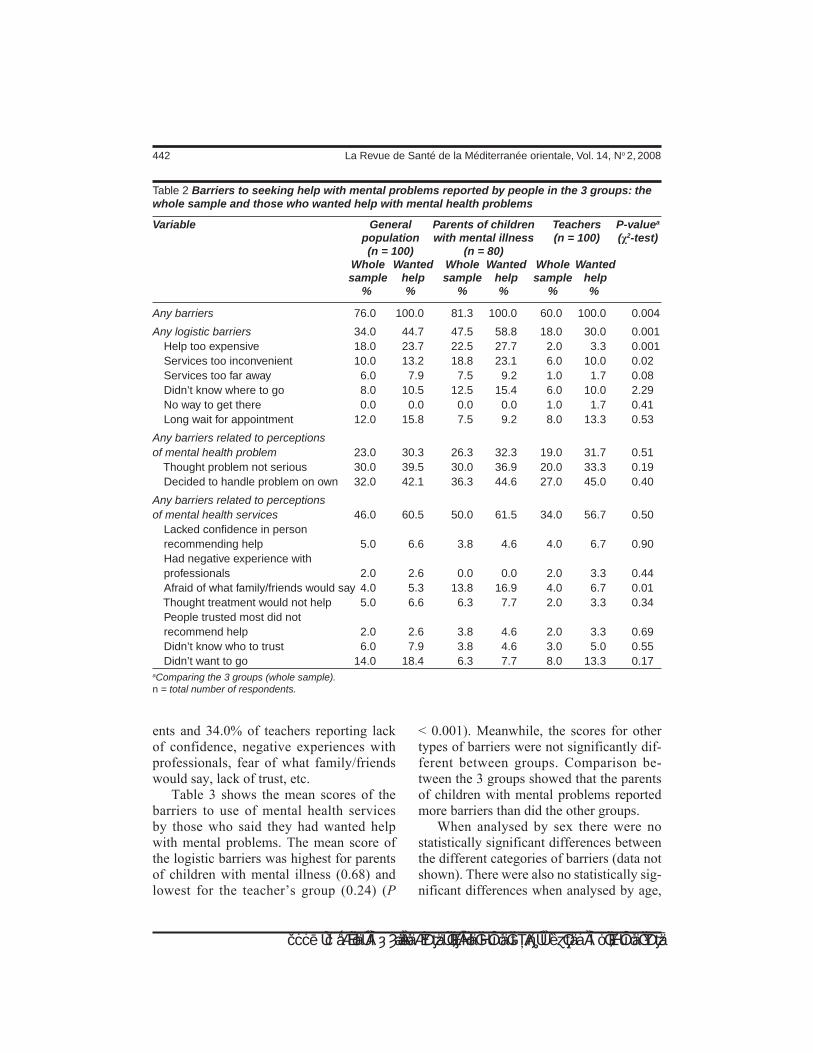
442 La Revue de Santé de la Méditerranée orientale, Vol. 14, No 2, 2008
املجلة الصحية لشرق املتوسط، منظمة الصحة العاملية، املجلد الرابع عشر، العدد ٢، ٢٠٠٨
ents and 34.0% of teachers reporting lack of confidence, negative experiences with professionals, fear of what family/friends would say, lack of trust, etc.
Table 3 shows the mean scores of the barriers to use of mental health services by those who said they had wanted help with mental problems. The mean score of the logistic barriers was highest for parents of children with mental illness (0.68) and lowest for the teacher’s group (0.24) (P
< 0.001). Meanwhile, the scores for other types of barriers were not significantly dif-ferent between groups. Comparison be-tween the 3 groups showed that the parents of children with mental problems reported more barriers than did the other groups.
When analysed by sex there were no statistically significant differences between the different categories of barriers (data not shown). There were also no statistically sig-nificant differences when analysed by age,
Table 2 Barriers to seeking help with mental problems reported by people in the 3 groups: the whole sample and those who wanted help with mental health problems
Variable General Parents of children Teachers P-valuea
population with mental illness (n = 100) (χ2-test) (n = 100) (n = 80) Whole Wanted Whole Wanted Whole Wanted sample help sample help sample help % % % % % %
Any barriers 76.0 100.0 81.3 100.0 60.0 100.0 0.004
Any logistic barriers 34.0 44.7 47.5 58.8 18.0 30.0 0.001 Help too expensive 18.0 23.7 22.5 27.7 2.0 3.3 0.001 Services too inconvenient 10.0 13.2 18.8 23.1 6.0 10.0 0.02 Services too far away 6.0 7.9 7.5 9.2 1.0 1.7 0.08 Didn’t know where to go 8.0 10.5 12.5 15.4 6.0 10.0 2.29 No way to get there 0.0 0.0 0.0 0.0 1.0 1.7 0.41 Long wait for appointment 12.0 15.8 7.5 9.2 8.0 13.3 0.53
Any barriers related to perceptions of mental health problem 23.0 30.3 26.3 32.3 19.0 31.7 0.51 Thought problem not serious 30.0 39.5 30.0 36.9 20.0 33.3 0.19 Decided to handle problem on own 32.0 42.1 36.3 44.6 27.0 45.0 0.40
Any barriers related to perceptions of mental health services 46.0 60.5 50.0 61.5 34.0 56.7 0.50 Lacked confidence in person recommending help 5.0 6.6 3.8 4.6 4.0 6.7 0.90 Had negative experience with professionals 2.0 2.6 0.0 0.0 2.0 3.3 0.44 Afraid of what family/friends would say 4.0 5.3 13.8 16.9 4.0 6.7 0.01 Thought treatment would not help 5.0 6.6 6.3 7.7 2.0 3.3 0.34 People trusted most did not recommend help 2.0 2.6 3.8 4.6 2.0 3.3 0.69 Didn’t know who to trust 6.0 7.9 3.8 4.6 3.0 5.0 0.55 Didn’t want to go 14.0 18.4 6.3 7.7 8.0 13.3 0.17aComparing the 3 groups (whole sample).n = total number of respondents.

Eastern Mediterranean Health Journal, Vol. 14, No. 2, 2008 443
املجلة الصحية لشرق املتوسط، منظمة الصحة العاملية، املجلد الرابع عشر، العدد ٢، ٢٠٠٨
but there was a correlation between years of education and the total score of logistic bar-riers and the total score of barriers related to mental health services (Table 4).
Table 5 shows that that when asked “did you get help when you had your mental problem”, parents of children with mental problems had received professional help from medical professionals more than the
other groups: 18.8% had sought help from a general practioner (GP), 35.0% from a psychiatrist and 7.5% from a psychologist. The general population sample was more likely to use informal sources: 21.0% had sought help from friends for a perceived mental health problem. Teachers had sought help less than the other groups: only 26.0% of teachers sought help from at least 1 of
Table 3 Types of barriers to seeking help for mental problems: comparison of the mean score between the 3 groups for those who wanted help with mental problems
Group Total no. of Mean 95% CI F- P-value respondents score statistic
Logistic barriers General population 100 0.54 0.36–0.71 7.86 0.001 Parents of children with mental illness 100 0.68 0.49–0.88 Teachers 80 0.24 0.12–0.35
Barriers related to perceptions of mental health problems General population 100 0.62 0.49–0.82 1.76 0.17 Parents of children with mental illness 100 0.66 0.49–0.82 Teachers 80 0.47 0.32–0.61
Barriers related to mental health services General population 100 0.38 0.21–0.54 1.01 0.36 Parents of children with mental illness 100 0.37 0.21–0.53 Teachers 80 0.25 0.13–0.36 CI = confidence interval.
Table 4 Correlation of age and educational level with the total scores of barriers to seeking help for mental health problems for those who wanted help with mental problems
Variable Correlation coefficient Total Total Total score score of score of of barriers logistic barriers related to barriers related to mental perceptions health services
Age (years) 0.0 0.1 0.06
Mean years of education 0.17* 0.01 0.03**P < 0.05.

444 La Revue de Santé de la Méditerranée orientale, Vol. 14, No 2, 2008
املجلة الصحية لشرق املتوسط، منظمة الصحة العاملية، املجلد الرابع عشر، العدد ٢، ٢٠٠٨
the sources compared with 61.3% of parents and 45.0% of the general population. Very few of any group had consulted a traditional fortune-teller or falgir.
Discussion
The results of our study suggest that teach-ers referred less than the other groups to one of the sources of help for mental problems. Parents of children with mental illness re-ferred more to the GP, psychiatrist and/or psychologist. The findings suggest the pos-sibility of higher awareness of mental health problems among parents of children with mental health problems, and low confidence in services or greater barriers to referrals to psychiatrist among teachers and the general population. High utilization rates would be expected in this high-risk sample. Also, it should be noted that most of the parents in the sample were mothers, most probably due to the sampling method (they attend services with their children), and it has been
shown that women use mental health serv-ices more than men [11] because they have a greater readiness to identify themselves as having a problem [12].
In all 3 groups the GP was one of the most used sources of help. It shows that GPs should be aware of the specific symp-tomatic and psychological needs of clients, the psychosocial context in which mental health problems are experienced and the im-plications for help-seekers. Also, it shows the necessity of keeping medical students’ education up-to-date in accordance with community mental health needs. Overall, the general population preferred family and friends to professional help agencies, which is consistent with the findings from previous studies [13]. Preference for friends over professionals for help-seeking raises questions about the quality and type of help received, because, although friends are a source of support, they are not trained in providing help for any kind of mental health problem. Therefore, using friends as the
Table 5 Source of help for mental problems reported by people in the 3 groups in the whole sample
Source of help General Parents of Teachers P-value population children (n = 100) (χ2 test) (n = 100) with mental illness (n = 80) No. % No. % No. %
General practitioner 10 10.0 15 18.8 9 9.0 0.09
Psychiatrist 12 12.0 28 35.0 2 2.0 0.001
Psychologist 4 4.0 6 7.5 0 0.0 0.02
Counselling centre 4 4.0 12 15.0 3 3.0 0.02
Friend 21 21.0 4 5.0 7 7.0 0.001
Relative 8 8.0 4 5.0 6 6.0 0.74
Fortune-teller (falgir) 1 1.0 3 3.8 2 2.0 0.44
Referred to at least 1 sourcea 45 45.0 49 61.3 26 26.0 0.001aRespondents could get help from more than one provider. n = total number of respondents.
Eastern Mediterranean Health Journal, Vol. 14, No. 2, 2008 445
املجلة الصحية لشرق املتوسط، منظمة الصحة العاملية، املجلد الرابع عشر، العدد ٢، ٢٠٠٨
only source of support may place people with severe mental health problems at risk. Another interesting finding was the low rate of referral to fortune-tellers or falgir, suggesting that our participants were not superstitious and that health professionals play a greater role in helping people with mental health problems.
A greater use of friends by the general population sample may be due to their per-ceptions that health professionals cannot provide for their needs. However, parents of children with mental health illness who already utilized these services referred to them more than did the other groups. It shows that experience with professionals gives people greater confidence in using their services.
A previous study found that the main barrier to seeking help was the perception of family and friends about mental health problems [14]. In the current study this was not reported as a major reason. The most common barriers to service use were logistic. Parents of children with mental illness more than the other groups reported 1 or more such barriers as a reason for not referring to a psychiatrist, GP or a psycholo-gist. The logistic barriers included factors such as getting help was too expensive and inconvenience of services. It is possible that these parents had already referred to a psychiatrist for their children and they may have experienced these barriers. The mean score of logistic barriers was highest among
parents of children with mental illness and lowest among the teachers’ group. These barriers were mentioned by the parents of children with mental illness who had already used the services. Meanwhile, the scores for other types of barriers were not significantly different between groups.
Some limitations of the current study are the potentially skewed age and educational level of the sample, and that factors such as family income and urban/rural location were not covered [15]. This cross-sectional study used data that relied on subjects’ self-reports, which may be affected by cognitive and culturally influenced biases. More research is recommended to study the complex processes that lead people to men-tal health service utilization and the specific reasons for lack of use of services in a larger sample in both rural and urban areas. The study also did not survey mental disorders as such, but addressed self-reported mental health problems.
Conclusion
This study provides an insight for mental health policy-makers and programme de-velopers in the Islamic Republic of Iran and strongly suggests that promoting the mental health of people would be a sound invest-ment to prevent mental health problems and to reduce the economic burden associated with them.
References1. Mental health: a report of the Surgeon
General. Rockville, Maryland, US Depart-ment of Health and Human Services, Sub-stance Abuse and Mental Health Services Administration, 1999.
2. Mohammadi MR et al. An epidemiolog-ical survey of psychiatric disorders in
Iran. Clinical practice and epidemiology in mental health, 2005, 1:16.
3. Costello EJ et al. A family network-based model of access to child mental health services. Research in community and mental health, 1998, 9:165–90.

446 La Revue de Santé de la Méditerranée orientale, Vol. 14, No 2, 2008
املجلة الصحية لشرق املتوسط، منظمة الصحة العاملية، املجلد الرابع عشر، العدد ٢، ٢٠٠٨
4. Zwaanswijk M et al. Help seeking for emo-tional and behavioural problems in chil-dren and adolescents: a review of recent literature. European child & adolescent psychiatry, 2003, 12(4):153–61.
5. Teagle SE. Parental problem recogni-tion and child mental health service use. Mental health services research, 2002, 4(4):257–66.
6. Nadler R. Help seeking behavior as coping resources. In: Rosebaum M, ed. Learned resource on coping skills, self-control, and adaptive behavior. New York, Springer, 1991.
7. Fox JC et al. Barriers to help seeking for mental disorders in a rural impoverished population. Community mental health journal, 2001, 37(5):421–36.
8. Wang PS et al. Twelve-month use of men-tal health services in the United States. Results from the National Comorbidity Survey replication. Archives of general psychiatry, 2005, 62(6):629–40.
9. Kazdin AE, Wassell G. Predictors of bar-riers to treatment and therapeutic change in outpatient therapy for antisocial children and their families. Mental health services research, 2000, 2:27–40
10. Owens PL et al. Barriers to children’s mental health services. Journal of the American Academy of Child and Adoles-cent Psychiatry, 2002, 41:731–8.
11. Riggs S, Cheng T. Adolescents’ willing-ness to use a school-based clinic in view of expressed health concerns. Journal of adolescent health care, 1988, 9:208–13.
12. Saunders SM et al. Formal help-seeking behavior of adolescents identify-ing themselves as having mental health problems. Journal of the American Acad-emy of Child and Adolescent Psychiatry, 1994, 33:718–28.
13. Tishby O et al. Help-seeking attitudes among Israeli adolescents. Adolescence, 2001, 36(142):249–64.
14. Kuhl J, Jarkon-Horlick L, Morrissey R. Measuring barriers to help-seeking be-havior in adolescents. Journal of youth and adolescence, 1997, 26(6):637–50.
15. Kessler RC et al. Lifetime and 12-month prevalence of DSM-III-R psychiatric disor-ders in the United States. Results from the National Comorbidity Survey. Archives of general psychiatry, 1994, 51:8–19.

Eastern Mediterranean Health Journal, Vol. 14, No. 2, 2008 447
املجلة الصحية لشرق املتوسط، منظمة الصحة العاملية، املجلد الرابع عشر، العدد ٢، ٢٠٠٨
Using SERVQUAL for assessing and improving patient satisfaction at a rural health facility in Pakistan B.T. Shaikh,1 N. Mobeen,1 S.I. Azam1and F. Rabbani1,2
1Department of Community Health Sciences, Aga Khan University, Karachi, Pakistan (Correspondence to B.T. Shaikh: [email protected]). 2Karolinska Institutet, Stockholm, Sweden.Received: 30/09/05; accepted: 05/02/06
ABSTRACT A cross-sectional study of patient satisfaction with care was conducted over a period of 1 year from March 2004 to March 2005 in a secondary-level hospital in a peri-urban area of Karachi, Pakistan. Using the SERVQUAL tool and exit interviews, data were collected quarterly from a total of 1533 patients. Results sharing and capacity-building workshops were arranged during the 4 phases of the survey to sensitize the staff of the hospital to work towards improving patient satisfaction. The level of satisfaction of the patients with the outpatient health services provided showed a gradual increase from 34.4% to 82.0% over the 1-year period.
Utilisation de la mesure SERVQUAL aux fins de l’évaluation et de l’amélioration de la satisfaction des patients dans un établissement de santé rural au Pakistan RÉSUMÉ Une étude transversale portant sur la satisfaction des patients en matière de soins a été réalisée sur une période d’un an, de mars 2004 à mars 2005, dans un hôpital de niveau secondaire d’une zone périurbaine de Karachi ( Pakistan). Grâce à l’outil SERVQUAL et aux entretiens de sortie, des données ont pu être recueillies chaque trimestre auprès de 1533 patients au total. Des ateliers destinés à la mise en commun des résultats et au renforcement des capacités ont été organisés pendant les quatre phases de l’étude afin de sensibiliser le personnel de l’hôpital et de l’encourager à améliorer la satisfaction des patients. Le niveau de satisfaction des patients vis-à-vis des services de soins externes dispensés est passé progressivement de 34,4 % à 82,0 % pendant la période d’un an.
20042005
1533
34.482.0

448 La Revue de Santé de la Méditerranée orientale, Vol. 14, No 2, 2008
املجلة الصحية لشرق املتوسط، منظمة الصحة العاملية، املجلد الرابع عشر، العدد ٢، ٢٠٠٨
Introduction
Quality in health is about care and caring. Quality of care can be defined as “the de-gree to which health services for individuals and populations increase the likelihood of desired health outcomes and are consistent with current professional knowledge” [1]. It has also been defined as “the totality of features and characteristics of a service that bear on its ability to satisfy a given need” [2]. Studies have found that the most im-portant factors influencing patients’ choice of clinic are staff attitudes, the clinical environment, the services available and the operating hours [3,4].
The rising demand for assessment of quality can be attributed to rising costs of health care, constrained resources and evidence of variations in clinical practice [5]. The World Health Organization em-phasized the importance of quality in the delivery of health care, as defined by the criteria of effectiveness, cost and social ac-ceptability [6]. Other authors have stressed the need to assess “structural quality” or the availability of the health care structures and “process quality” through which care is delivered [7–9]. This assessment of quality is based on the application of professional standards that integrate measurement of patients’ views and their experiences [10]. The assessment of patient satisfaction rep-resents a comparative balance between their perceptions of the service delivered and the expected standard they had set for the service [11]. Appraisal of patient satisfac-tion has been advocated as a reliable and inexpensive way to assess quality of serv-ices [12,13]. Giving importance to patient’s views in improving the quality of health services is to respect the sovereignty of the consumer and to democratize the process of care [14]. To evaluate patient satisfaction, researchers have used various approaches,
such as evaluating the services during a specific time period, usually 6 months to 1 year, or by collecting data at the time of a specific medical care visit [15,16]. The latter approach was used in this study in Pakistan.
Study rationale The average number of contacts with a health care provider for Pakistanis over the age of 5 years was 5.4 per year in 1998 [17]. Only 21% of the patients with an acute ill-ness seek care at a public sector first-level health facility and a lack of quality care is one of the main reasons. In private hospitals and health care outlets, the quality of serv-ices is also compromised. A reliable system of information has always been missing in the health sector. These facts are sufficient to support the need to assess patient satisfac-tion with public and private health facilities in order to bring about an overall improve-ment in the quality of services delivered.
The present study was designed for the Health and Nutrition Development Soci-ety (HANDS), a Karachi-based nongovern-mental organization, to explore aspects of quality of services and the level of patient satisfaction and to bring about an improve-ment in the delivery of outpatient serv-ices in its secondary health care facility in Jamkanda village of Bin Qasim town, Karachi. The hospital is run by HANDS as a public–private partnership with the local government.
Objectives of the studyThe research question was whether a peri-odic surveillance of quality of care brings about improvement in patient satisfaction with health care services. The objectives were: to estimate periodically levels of patient satisfaction through the use of the SERVQUAL tool [18], assessing the qual-ity of care; to sensitize the management
Eastern Mediterranean Health Journal, Vol. 14, No. 2, 2008 449
املجلة الصحية لشرق املتوسط، منظمة الصحة العاملية، املجلد الرابع عشر، العدد ٢، ٢٠٠٨
of the facility and the health providers to the needs of their patients; and to demon-strate an improvement in patient satisfac-tion through the use of this tool.
Methods
This was a cross-sectional facility-based study over a period of 1 year, from March 2004 to March 2005. Exit interviews were conducted with patients every quarter. Built into the study was an intervention with the facility staff in each quarter, after each phase of data collection.
SampleIn the absence of available estimates on pa-tient dissatisfaction with health services and with an estimated population of approxi-mately 5000 attending outpatient services per quarter, we assumed a 50% prevalence of dissatisfaction, type 1 error of 5% and a bond on error of estimation to be 5%. The sample size was thus calculated to be 384 for each phase. This implies that for track-ing patient satisfaction with services every quarter, at least 384 exit interviews should be conducted with clients. On the days of interviews, a total of 1533 outpatients who gave consent for interview were recruited.
Data collectionPatients were requested to participate in the interview when they came out of the hos-pital after a consultation with a health care provider. All patients who were resident in the catchment area of the hospital for the previous 6 months and were aged over 18 years at the time of interview were included. The respondents excluded were those who were seriously ill, staff members of the hos-pital and medico-legal cases.
After obtaining consent and explaining the purpose of the project, interviews were conducted. The interviewers had rigor-
ous training on the questionnaire itself, interviewing skills and research ethics. The original English questionnaire was translat-ed and administered in Urdu. The interview guidelines contained explicit explanations and phrasing of all the questions.
The SERVQUAL tool uses 5 dimen-sions to assess the quality of services: reli-ability, responsiveness, assurance, empathy and tangibility [18]. The aim of using this tool on a periodic basis is to assess the level of patient satisfaction with the services by tracking these dimensions of service qual-ity. Therefore, the independent variables were the 5 dimensions of service quality as shown in Figure 1. Patient satisfaction was the dependent and outcome variable and would finally be graded as satisfied, some-what satisfied and dissatisfied depending on the cumulative score obtained. Informa-tion on age, sex, education, occupation, income, and outdoor service used were also obtained.
Each of the 15 items listed under the 5 quality of care dimensions (reliability, responsiveness, assurance, empathy, tangi-bility) carried an equal weighting and were based on patient’s responses categorized as dissatisfied, somewhat satisfied and satis-fied, scored 0, 1 and 2 respectively on a Likert scale of 0–2 (Figure 1). This method of providing a range of choices takes care of variability of responses and gives the respondent an opportunity to express the precise nature of his/her point of view [18]. The maximum possible score was 30 for a patient who rated all 15 items as satisfactory. For overall satisfaction, a cumulative score of 24 or above (80% or above) was consid-ered as “satisfied”, 18–24 (60%–79%) as “somewhat satisfied” and below 18 (< 60%) as “dissatisfied” with quality of services. Through the use of this instrument each quarter, analysis would show variations in the satisfaction level. This analysis is

450 La Revue de Santé de la Méditerranée orientale, Vol. 14, No 2, 2008
املجلة الصحية لشرق املتوسط، منظمة الصحة العاملية، املجلد الرابع عشر، العدد ٢، ٢٠٠٨
Figure 1 The SERVQUAL tool for assessing patients’ satisfaction with quality of care (an Urdu translation was used in the survey)
Item
no
.D
imen
sio
ns
of
qu
alit
y o
f ca
reIt
ems
Lev
el o
f sa
tisf
acti
on
0D
issa
tisf
ied
1S
om
ewh
at
sati
sfie
d
2S
atis
fied
1.R
elia
bilit
yS
een
acco
rdin
g to
exp
ecta
tions
Got
the
prob
lem
sol
ved
Giv
en/r
ecei
ved
the
requ
ired
trea
tmen
t
2.R
espo
nsiv
enes
sH
ospi
tal s
taff
give
s pr
ompt
atte
ntio
n
Hos
pita
l sta
ff do
es n
ot k
eep
patie
nt w
aitin
g
Hos
pita
l sta
ff he
lps
acco
rdin
g to
the
need
3.A
ssur
ance
Hos
pita
l is
trus
twor
thy
Doc
tor
is q
ualif
ied
Hos
pita
l sta
ff ar
e co
urte
ous
4.E
mpa
thy
Hos
pita
l sta
ff ar
e ca
ring
Sta
ff gi
ve in
divi
dual
atte
ntio
n
Doc
tor
calls
pat
ient
by
nam
e
5.Ta
ngib
ility
Doc
tor’s
offi
ce is
cle
an
Hos
pita
l sta
ff us
e st
anda
rd in
stru
men
ts
Pre
scrip
tion
give
n is
eas
y to
und
erst
and

Eastern Mediterranean Health Journal, Vol. 14, No. 2, 2008 451
املجلة الصحية لشرق املتوسط، منظمة الصحة العاملية، املجلد الرابع عشر، العدد ٢، ٢٠٠٨
simple and easy and can be done by facility staff to monitor quality of care on a regular basis and facilitate planning.
Data analysisThe quality of data was ensured through field editing by the interviewers and random audit of 5% of forms by the study coordina-tor. Data were double entered, checked for consistency and cleaned in Epidata, version 3.0 and analysed using SPSS, version 13. At the end of the study period, the distribution of satisfaction was computed for all the 4 phases and the chi-squared test was used as a test of significance. Cross-tabulations were carried out between independent vari-ables (age, sex, education, occupation, in-come, outdoor services used) and the level of satisfaction, the dependent variable.
Staff interventions Better understanding of consumer needs and more effective responses was the prime focus of the interventions with staff. The quarterly results of the survey helped in de-signing the workshops for capacity-building and sensitization of the hospital staff and managers to bring about a positive change. Each phase of data collection was followed by a specially designed workshop for the management staff and the health personnel of the facility. The results of each phase were shared with the facility staff in order to sensitize them to the issue of patient satis-faction. Themes and focus of the workshops were suggested by the staff themselves. The project team then developed the sessions accordingly.
Intervention I: Concepts of quality in health care. The baseline data collection or 1st phase was followed by the 1st workshop on the concepts of quality of care in health. The objectives covered in this workshop were: defining the notion of quality of care;
quality of care and its significance in health care; and its relationship with patient satis-faction.
Intervention II: Counselling skills and interpersonal communication. The 2nd phase was followed by the 2nd workshop on counselling skills and interpersonal communication. The objectives were: im-portance of counselling and interpersonal communication; types of counselling; skills and principles of counselling. Role-plays were also included to enhance the under-standing of the concepts.
Intervention III: Gender and health. The 3rd workshop focused on gender-related is-sues in health. The objectives were patient’s perspectives of quality of care; understand-ing gender-specific issues and the needs of their clients especially women; and the im-portance of behaviour and attitude change.
Results
Sociodemographic detailsThe age breakdown of the patients showed that 31% were aged < 25 years, 38% were 25–34 years, 23% were 35–49 years and 8% were > 50 years. The majority of the patients were women (85%). As for literacy levels, 56% were illiterate, 10% could just read and write or had some informal re-ligious education, 24% had 5–8 years of schooling and 10% were educated until 10th grade. The majority of the clients were housewives (70%), 20% were involved in agricultural labour or daily wage work, and 10% were either in service or were skilled labourers having their own business. The median monthly income of the patients was around rupees (Rs) 3500 (US$ 58) per month, interquartile range Rs 2500–6000 (US$ 42–100) per month.

452 La Revue de Santé de la Méditerranée orientale, Vol. 14, No 2, 2008
املجلة الصحية لشرق املتوسط، منظمة الصحة العاملية، املجلد الرابع عشر، العدد ٢، ٢٠٠٨
Satisfaction trendsOf the patients, 60% came to the health facility for a consultation to the general outpatient service whereas 40% came for a gynaecological consultation. The level of satisfaction of the patients with regards to the health services provided in the facility showed a gradual increase over a period of 1 year in 4 phases. The baseline satisfaction level of 34.4% rose to 82.0% after the 4th round of data collection (Table 1).
Cross-tabulationsFor age, trends showed a gradual increase in satisfaction in all age groups of patients, which was more pronounced in the repro-ductive age group (Figure 2). An analysis by sex was not done as the respondents were predominantly women due to the fact that survey was conducted during daytime.
Analysing the satisfaction level in vari-ous groups with different education status, it was observed that satisfaction levels im-proved more among the illiterate patients as compared to the other groups (Figure 3).
The majority of our respondents were housewives, and the satisfaction level of this group fluctuated during different phases
(between 60%–70%). This was attributed to changes in the staffing due to the turnover of staff members—women doctors were available in the facility at one time and not later on—which led to dissatisfaction among the patients. Cessation of the some of the antenatal services for logistic reasons was one of the causes of dissatisfaction at one stage.
The other groups, including day labour-ers, agricultural labourers, government or private sector employees, students and busi-nessmen, however, showed an increase in satisfaction level over the study period (> 75% in the last phase).
When the services visited were cross-analysed, it was observed that generally the level of satisfaction for both the outpatient departments improved except in phase 2, when an experienced woman doctor left and a new doctor was recruited.
Chi-squared, 1-way ANOVA and Kruskal–Wallis tests were applied to all independent variables to study their effect on the overall level of satisfaction of the patients. No significant effect of age (P = 0.233), education (P = 0.282), occupation (P = 0.140) and income (P = 0.368) was ob-
Figure 2 Distribution of patient satisfaction by age in different phases of the study

Eastern Mediterranean Health Journal, Vol. 14, No. 2, 2008 453
املجلة الصحية لشرق املتوسط، منظمة الصحة العاملية، املجلد الرابع عشر، العدد ٢، ٢٠٠٨
served; whereas sex (P < 0.001) and service used (P < 0.001) had a significant effect on the level of satisfaction.
Discussion
Patient satisfaction surveys are being in-creasingly conducted globally to study pa-
tient views on a number of matters such as information needs, interpersonal and organizational aspects of care and value of medical treatment [19–22]. The users express their satisfaction with some of the components of health care as compared to others; therefore these viewpoints ought to be considered by health planners and health
Table 1 Distribution of patient satisfaction level in different phases of the study and the interventions for health facility staff carried out at each phase
Study phase Level of patient satisfaction Dissatisfied Somewhat Satisfied satisfied % % %
Phase I (baseline) 36.0 29.7 34.4 Intervention: Workshop on concepts of quality of care
Phase II 25.5 40.1 34.4 Intervention: Workshop on counselling skills, interpersonal communication and confidence building
Phase III 21.9 22.5 55.6 Intervention: Workshop on gender and health
Phase IV 4.9 13.0 82.0χ2 = 257.762, P < 0.001.
Figure 3 Distribution of patient satisfaction by educational level in different phases of the study

454 La Revue de Santé de la Méditerranée orientale, Vol. 14, No 2, 2008
املجلة الصحية لشرق املتوسط، منظمة الصحة العاملية، املجلد الرابع عشر، العدد ٢، ٢٠٠٨
service researchers to work out various strategies and solutions to improve patient satisfaction [23]. Patient satisfaction is well recognized now because of the influence of perceived quality over demand [24]. The role of the health centres that provide health services needs to be addressed through the people’s own experiences as it influences their satisfaction with the care, improves quality of service and in turn its utiliza-tion [25,26]. The providers must get first-hand information from their clients which should help them to reorient their services by adopting a more client-centred approach, transforming their attitude and introducing a convivial ambiance at health service outlets based on the feedback of their clients [27]. They also need to be more compassionate and caring to the needs of the people they serve [28].
A periodic assessment of patient satis-faction can sensitize the management of a health care facility and health providers to the needs of their patients. In our study, a great deal of change in the attitudes and be-haviours of the staff members of the hospi-tal was observed, which was then reflected in an improved level of satisfaction of the patients visiting the outpatient departments of the facility. In fact, the whole process of data collection, sharing the results with the staff of the hospital, brainstorming on the issues and gaps identified and conducting a capacity-building workshop at the end of each phase helped to sensitize the manage-ment as well as individual staff members of the hospital.
In the workshops, the constraints and gaps in communication between clients and health care providers were identified, as were differences in the perceptions of clients and providers. The difficulties on the part of the health providers in deal-ing with the clients were examined. In an atmosphere of consensus, solutions to all
the problems were discussed. The concepts of quality services and patient satisfac-tion were explained and discussed in depth with the staff of the health facility, hence enhancing their understanding of these is-sues. We deduced subjectively that the staff appreciated the concept of patients’ rights and autonomy while inside the facility. Be-sides the workshops designed by the study team, the efforts put in by the facility staff were commendable. This was eventually reflected in their dealings with the patients and the results showed great improvement in the satisfaction level of the patients com-ing to the hospital.
Conclusion
Although this 1-year intervention to peri-odically gauge the satisfaction level showed an increased level of patient satisfaction, the challenge is to sustain, and further improve, this level in the service. It can be concluded that this particular instrument or these kinds of periodic exercises can help identify gaps in the service with regard to quality of care and thus give an indication of the perform-ance of the health care system.
Acknowledgements
We are extremely thankful to the staff of the hospital and management of the Health And Nutrition Development Society (HANDS) especially Dr Khalid Pervez for courteously facilitating us during the study period. We are grateful for the cooperation of all the participants, the patients who spared their time and shared their views with us.
We are also grateful to the World Health Organization Regional Office for the East-ern Mediterranean for providing funding for the study.

Eastern Mediterranean Health Journal, Vol. 14, No. 2, 2008 455
املجلة الصحية لشرق املتوسط، منظمة الصحة العاملية، املجلد الرابع عشر، العدد ٢، ٢٠٠٨
References1. Definitions of quality in healthcare. In:
Brown JA, ed. The healthcare quality handbook: a professional resource and study guide, 17th ed. Pasadena, Califor-nia, JB Quality Solutions Inc., 2002.
2. Terms, concepts, principles. In: Bauer JE, Duffy GL, Westcott RT, eds. The quality improvement handbook. Milwaukee, ASQ Quality Press, 2002.
3. Creel CL, Perry JR. Improving the quality of reproductive health care for young peo-ple. Washington DC, Population Council and Population Reference Bureau, 2003 (New Perspectives on Quality of Care No. 4).
4. Savage R, Armstrong D. Effect of a gen-eral practitioner’s consulting style on pa-tients’ satisfaction: a controlled study. British medical journal, 1990, 301:968–70.
5. Campbell SM, Roland MO, Buetow SA. Defining quality of care. Social science & medicine, 2000, 51:1611–25.
6. World health report 2000. Health systems: improving performance. Geneva, World Health Organization, 2000.
7. Garner P, Thomason J, Donaldson D. Quality assessment of health facilities in rural Papua New Guinea. Health policy and planning, 1990, 5:49–59.
8. Nicholas DD, Heiby JR, Hatzell TA. The quality assurance projects: introducing quality improvement to primary health care in less developed countries. Quality assurance in health care, 1991, 3:147–65.
9. Margolis SA et al. Patient satisfaction with primary health care services in the United Arab Emirates. International journal of quality in health care, 2003, 15(3):241–9.
10. Haddad S et al. Patient perception of quality following a visit to a doctor in a primary care unit. Family practice, 2000, 17:21–9.
11. Aharony L, Strasser S. Patient satisfac-tion: what we know about and what we still need to explore. Medical care review, 1993, 50:49–79.
12. Davies AR, Ware JE Jr. Involving con-sumers in quality of care assessment. Health affairs, 1988, 7:33–48.
13. Goldman RL. The reliability of peer as-sessment of quality of care. Journal of the American Medical Association, 1992, 267:958–60.
14. Calnan M. Towards a conceptual frame-work of lay evaluation of health care. Social science & medicine, 1988, 27:927–33.
15. Davies AR, Ware JE, Brook RH. Con-sumer acceptance of prepaid and fee for service medical care: results from a ran-domized controlled trial. Health services research, 1986, 21:429–52.
16. DiMatteo MR, Hays R. The significance of patients’ perceptions of physician con-duct: a study of patient satisfaction in a family practice center. Journal of commu-nity health, 1980, 6:18–34.
17. Pakistan Medical Research Council. Pat-terns of health care utilization. Islama-bad, National Health Survey of Pakistan, 1998.
18. Parasuraman A, Zeithaml VA, Berry LL. SERVQUAL: a multi-item scale for measuring consumer perceptions of serv-ice quality. Journal of retailing, 1988, 64(1):12–40.
19. Wensing M, Elwyn G. Research on pa-tients’ views in the evaluation and im-provement of quality of care. Quality and safety in health care, 2002, 11:153–7.
20. Ray F. Surveys of patient satisfaction: important general considerations. British medical journal, 1991, 302:887–9.
21. Roghmann K, Hengst A, Zastowny T. Satisfaction with medical treatment: its

456 La Revue de Santé de la Méditerranée orientale, Vol. 14, No 2, 2008
املجلة الصحية لشرق املتوسط، منظمة الصحة العاملية، املجلد الرابع عشر، العدد ٢، ٢٠٠٨
measurement and relation to utilization. Medical care, 1997, 17:461–77.
22. Weiss B, Senf J. Patient satisfaction sur-vey instrument for use in health mainte-nance organizations. Medical care, 1990, 28:434–45.
23. Hall JA, Dornan MC. What patients like about their medical care and how often they are asked: A meta-analysis of the satisfaction literature. Social science & medicine, 1988, 27(9):935–9.
24. McPake B. User charges for health serv-ices in developing countries: a review of the economic literature. Social science & medicine, 1993, 36:1397–405.
25. Gilson L, Alilio M, Heggenhougen K. Com-munity satisfaction with primary health
care services: An evaluation undertaken in the Morogoro region of Tanzania. Social science & medicine, 1994, 39(6):767–80.
26. Lawthers AG et al. Using patient surveys to measure the quality of outpatient care in Krakow, Poland. International journal of quality in health care, 1999, 11(6):497–506.
27. Shaikh BT. Quality of health care: an ab-solute necessity for patient satisfaction. Journal of the Pakistan Medical Associa-tion, 2005, 55(11):515–6.
28. Soar Filho EJ. A interacao medico-cliente [The client–doctor interaction]. Revista da Associacao Medica Brasileira, 1998, 44(1):35–42.
Integrating prevention into health careMany diseases can be prevented, yet health care systems do not make the best use of their available resources to support this process. All too often, health care workers fail to seize opportunities to inform patients about health promotion and disease prevention strategies. Most health care systems are based on responding to acute problems, and urgent needs of patients. While these are appropriate for acute problems, a notable disparity occurs when applying this model of care to the prevention and management of chronic conditions. In this re-gard, current health care systems worldwide fall short.When patients are systematically provided with information and skills to reduce health risks, they are more likely to adopt risk-reducing be-haviours that can dramatically reduce the long-term burden and health care demands of chronic conditions. To promote prevention in health care, awareness-raising is crucial to promote a change in thinking and to stimulate the commitment and action of patients and families, health care teams, communities, and policy-makers.
Source: WHO Fact sheet No. 17 (http://www.who.int/mediacentre/factsheets/fs172/en/index.html2.)

Eastern Mediterranean Health Journal, Vol. 14, No. 2, 2008 457
املجلة الصحية لشرق املتوسط، منظمة الصحة العاملية، املجلد الرابع عشر، العدد ٢، ٢٠٠٨
240
87.567.5
27.525.516.3
Rural women’s use of indoor air pollutants in Alexandria Governorate: relationship with socio-demographic characteristics and illnessABSTRACT This study determined the relationship between women’s use of indoor air pollutants and sociodemographic variables and illness. Data were collected by observation and interview of 240 rural women in Alexandria Governorate. The use of chemical and microbial indoor air pollutants was high in 87.5% and 67.5% of the women respectively. Also, 27.5% of the women had chronic headache, 25.5% respiratory diseases and 16.3% eye diseases. There was a significant positive relationship between women’s level of use and number of sons, type of family and number of family members; there was a significant negative relationship with women’s education and their son’s education. There were signifi-cant positive relationships between illness and overuse of insecticides, garbage burning in front of the house and having an unclean house.
معهد حبوث اإلرشاد الزراعي والتنمية الريفية، مركز البحوث الزراعية، اإلسكندرية، مصراالستالم: 06/04/13، القبول: 06/06/21
Amal El Sayed El Asaal, Agricultural Extension & Rural Development Research Institute, Agricultural
Research Centre, Alexandria, Egypt.
L’utilisation de polluants de l’air intérieur par les femmes en zone rurale dans le gouvernorat d’Alexandrie : relation avec les caractéristiques sociodémographiques et la santéRÉSUMÉ Cette étude se proposait de déterminer la relation existant entre, d’une part, l’utilisation par les femmes de polluants de l’air intérieur et, d’autre part, les variables sociodémographiques et la santé. La collecte des données a reposé sur l’observation et l’interrogatoire de 240 femmes en milieu rural dans le gouvernorat d’Alexandrie. Il a été constaté un usage intensif de polluants de l’air intérieur de type chimique et microbiologique chez 87,5 % et 67,5 % de ces femmes respectivement. Par ailleurs, 27,5 % des femmes présentaient des céphalées chroniques, 25,5 % des pathologies respiratoires et 16,3 % des affections oculaires. Il est apparu une relation positive significative entre le degré d’utilisation de ces produits par les femmes et le nombre de fils, le type de famille et le nombre d’individus constituant celle-ci, relation qui s’est avérée significativement négative si l’on considérait le niveau d’instruction de la femme et de ses fils. Il a été constaté une relation positive significative entre la maladie et la surutilisation des insecticides, le brûlage des ordures devant le domicile et le mauvais entretien de ce dernier.
العالقة بني استخدام السيدات الريفيات مللوثات اهلواء داخل االجتماعية اخلصائص وبني اإلسكندرية حمافظة يف املنازل
الدميغرافية لألسرة واإلصابة باألمراضآمال السيد حممود العسال

458 La Revue de Santé de la Méditerranée orientale, Vol. 14, No 2, 2008
املجلة الصحية لشرق املتوسط، منظمة الصحة العاملية، املجلد الرابع عشر، العدد ٢، ٢٠٠٨
–
3-1
WHO2000
354
American Lung Association
2
5,6
)1(
.)2(
..
)3(
.)4(
.)5(
.American Lung Association
2
7.
8
15
Eastern Mediterranean Health Journal, Vol. 14, No. 2, 2008 459
املجلة الصحية لشرق املتوسط، منظمة الصحة العاملية، املجلد الرابع عشر، العدد ٢، ٢٠٠٨
.
50
20
4–84
9
2,9
.10
1112
13

460 La Revue de Santé de la Méditerranée orientale, Vol. 14, No 2, 2008
املجلة الصحية لشرق املتوسط، منظمة الصحة العاملية، املجلد الرابع عشر، العدد ٢، ٢٠٠٨
14
.
1.
2.
.3.
.4.
.
)1(
–––.
)2(
––.)3(
..
209024011.5
.
Eastern Mediterranean Health Journal, Vol. 14, No. 2, 2008 461
املجلة الصحية لشرق املتوسط، منظمة الصحة العاملية، املجلد الرابع عشر، العدد ٢، ٢٠٠٨
.
–.
.
1
..
..3
21.
10.550
10.5.
.
18.950
9.
.2
-3030
4040.-
34.

462 La Revue de Santé de la Méditerranée orientale, Vol. 14, No 2, 2008
املجلة الصحية لشرق املتوسط، منظمة الصحة العاملية، املجلد الرابع عشر، العدد ٢، ٢٠٠٨
--
.-.-.-
3
SPSS
Kendall's tau-c
.
1
)1(56.2530–40.)2(67.5)3(90.)4(62.9.)5(52.54.)6(63.7550
)7(32.512.5
1.67.

Eastern Mediterranean Health Journal, Vol. 14, No. 2, 2008 463
املجلة الصحية لشرق املتوسط، منظمة الصحة العاملية، املجلد الرابع عشر، العدد ٢، ٢٠٠٨
96.25
1
87.5
67.5
1
30
30–40
40
69
135
36
28.75
56.25
15
4
4–6
114
96
30
47.50
40.00
12.50
162
33
6
15
24
67.5
13.75
2.5
6.25
10
6
6–18
18
153
33
120
165
72
63.75
13.75
50.00
68.75
30
24
216
10
90128
78
30
4
53.33
32.50
12.50
1.67
151
89
62.9
37.1

464 La Revue de Santé de la Méditerranée orientale, Vol. 14, No 2, 2008
املجلة الصحية لشرق املتوسط، منظمة الصحة العاملية، املجلد الرابع عشر، العدد ٢، ٢٠٠٨
87%
13%0%
0%
67%
33%
0%0%
1
1
2
-28.75
-26.25
-38.7542.50
25
-33.75
2888.75
-35

Eastern Mediterranean Health Journal, Vol. 14, No. 2, 2008 465
املجلة الصحية لشرق املتوسط، منظمة الصحة العاملية، املجلد الرابع عشر، العدد ٢، ٢٠٠٨
2
240
6928.75
6326.25
9338.75
10242.50
8133.75
21388.75
8435.0
2
3
-75
15
-74.58
-56.25
-55
-30
-6.25

466 La Revue de Santé de la Méditerranée orientale, Vol. 14, No 2, 2008
املجلة الصحية لشرق املتوسط، منظمة الصحة العاملية، املجلد الرابع عشر، العدد ٢، ٢٠٠٨
3
240
18075.0
17974.58
13556.25
13255.0
7230.0
156.25
433.75
27.525.816.25
51.25
18.7512.5
4
8133.75--
6627.531.25
6225.84518.75
3916.253012.5
12531.25
31.2593.75
1
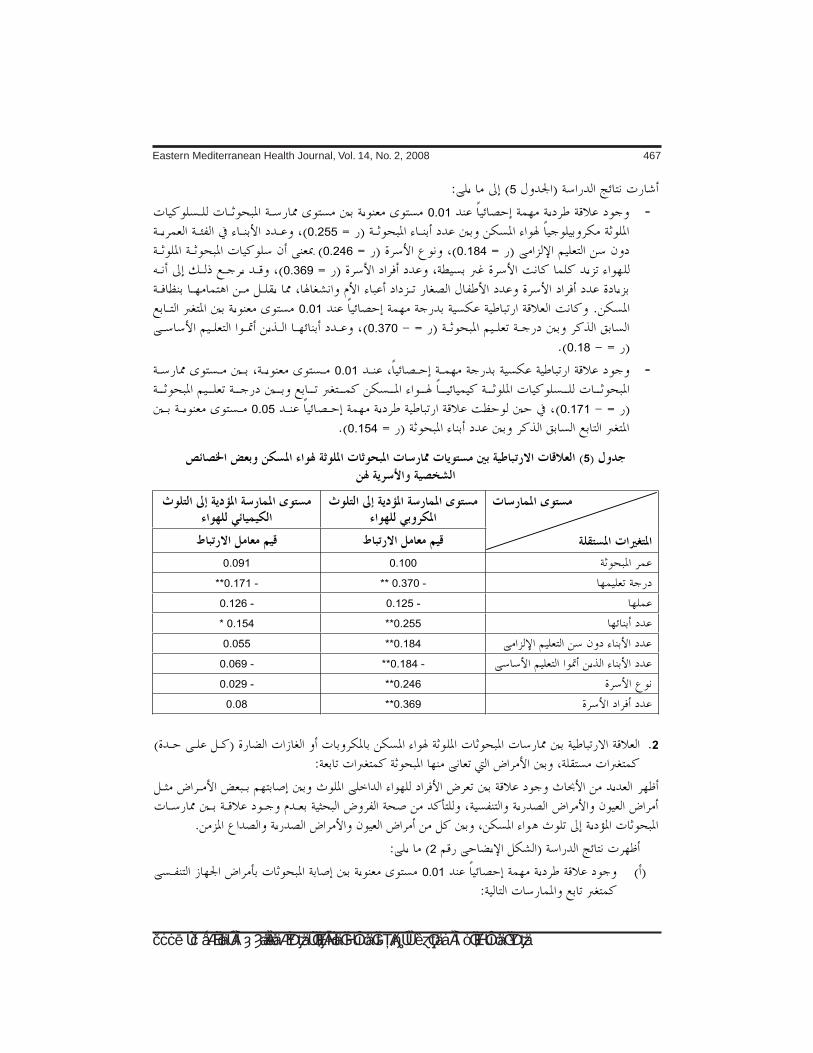
Eastern Mediterranean Health Journal, Vol. 14, No. 2, 2008 467
املجلة الصحية لشرق املتوسط، منظمة الصحة العاملية، املجلد الرابع عشر، العدد ٢، ٢٠٠٨
5
-0.01
0.255
0.1840.246
0.369
0.01
0.370
0.18
-0.01
0.1710.05
0.154
5
0.1000.091
-0.370** -0.171**
-0.125-0.126
0.255**0.154*
0.184**0.055
-0.184**-0.069
0.246**-0.029
0.369**0.08
2
2
0.01

468 La Revue de Santé de la Méditerranée orientale, Vol. 14, No 2, 2008
املجلة الصحية لشرق املتوسط، منظمة الصحة العاملية، املجلد الرابع عشر، العدد ٢، ٢٠٠٨
-0.252
0.2260.2570.2510.175
-0.05
0.147
0.01
-0.2430.2040.2020.311
-0.05
0.142
0.01
-0.3760.2710.208
-0.05
0.1590.1400.139
0
0.05
0.1
0.15
0.2
0.25
0.3
0.35
0.4
2

Eastern Mediterranean Health Journal, Vol. 14, No. 2, 2008 469
املجلة الصحية لشرق املتوسط، منظمة الصحة العاملية، املجلد الرابع عشر، العدد ٢، ٢٠٠٨
References
1. ،(1994) طه أمحد وصادق الدنشاري الدين عز مسوم البيئة – أخطار تلوث اهلواء واملاء والغذاء. دار املريخ للنشر، الرياض، اململكة العربية السعودية.
2. American Lung Association. Indoor air pollution fact sheet, 1999. (http://www.lungusa.org/site/pp.asp?c=dvLUK9O0E&b=35381, accessed 27 May 2007).
3. El Awady A. Living on a poisoned globe. Islam Online (http://www.islamonline.net/English/Science/2003/03/article08.shtml, accessed 27 May 2007).
4. Air pollution. Geneva, World Health Or-ganization, 2000 (WHO Fact sheet No. 187).
حممد نبهان سويلم (1999)، التلوث البيئي وسبل .5وزارة للكتاب. العامة املصرية اهليئة مواجهته.
الدولة لشئون البيئة.وحماور .6 البيئة ،(2000) الزوكة مخيس حممد
تدهورها وآثارها على صحة اإلنسان. دار املعرفةاجلامعية باإلسكندرية.
اهلوائي .7 التلوث ،(1999) األعوج إبراهيم طلعت والبيئة. اهليئة املصرية العامة للكتاب.
األمراض .8 ،(1982) مانشوت وبيتر شويس جان ،7 رقم الريفية الصحة سلسلة باهلواء. املنقولة
املؤسسة اإلفريقية للطب والبحوث.9. Mishra V. Smoke and fire. Our planet,
2001. Poverty, health and the environ-
ment issue (www.ourplanet.com/txtver-sn/122/mishra.html, accessed 27 May 2007).
حسن عبد الرؤوف اهلندي (1986)، تأثري املبيدات .10 احلشرية املنـزلية على حيوانات التجارب، رسالة ماجستري، قسم االقتصاد املنـزيل، كلية الزراعة،
جامعة اإلسكندرية. ليلى محاد الشناوي (1995)، دراسة السلوك البيئي .11
العلمية اجلمعية يف منشور حبث الريفية. للمرأة لإلرشاد الزراعي.
االحتياجات .12 ،(1997) السيد اهللا عوض عزيزة جمال يف البحرية مبحافظة للريفيات اإلرشادية مؤمتر يف منشور حبث التدهور. من البيئة محاية يف الزراعي التعاوين اإلرشادي العمل إستراتيجية
ظل سياسة التحرر االقتصادي، القاهرة.دراسة .13 ،(1997) السباعي اخلالق عبد سوزي
واملمارسات املعارف مستوى يف املؤثرة العوامل قرى بعض يف الريفية للمرأة البيئة بتلوث املتعلقة اإلسكندرية. مبحافظة الزراعية املعمورة منطقة جامعة الزراعي، اإلرشاد قسم دكتوراه. دراسة
اإلسكندرية.برنامج .14 ختطيط :(1999) العسال السيد آمال
لإلرشاد املتوقع الدور يعكس إرشادي تعليمي حبث الريفية. املرأة تنمية يف املنـزيل االقتصادي منشور يف املؤمتر املصري الرابع لالقتصاد املنـزيل.9 جملد املنوفية. جامعة املنـزيل، االقتصاد جملة
عدد (4) أكتوبر 1999.

470 La Revue de Santé de la Méditerranée orientale, Vol. 14, No 2, 2008
املجلة الصحية لشرق املتوسط، منظمة الصحة العاملية، املجلد الرابع عشر، العدد ٢، ٢٠٠٨
Review
Caesarean section in countries of the Eastern Mediterranean RegionM.H. Baldo1
1Department of Obstetrics and Gynaecology, University of Al Zaiem Al Azhari, North Khartoum, Sudan (Correspondence to M.H. Baldo: [email protected]).Received: 12/10/05; accepted: 30/01/06
ABSTRACT This paper reviews global data on caesarean section (CS) focusing on Eastern Mediter-ranean Region (EMR) countries for which data could be obtained. CS rates in the EMR tend to aver-age around 10%. The data, however, are often not representative of the whole country, being mostly hospital rather than community based. Global and regional CS trends, determinants, and outcomes are presented. Controversies and consensus over the indications for CS are reviewed. The cost of rising CS rates, women’s involvement in decision-making, the role of health workers, data quality and legal aspects are highlighted, with discussion of the aim of reducing unduly high CS rates and promoting high-quality maternity care.
La césarienne dans les pays de la Région de la Méditerranée orientaleRÉSUMÉ Ce document examine les données mondiales relatives à la césarienne, en particulier dans les pays de la Région de la Méditerranée orientale pour lesquels des informations ont pu être obtenues. Les taux de césarienne dans cette Région tournent en moyenne autour de 10 %. Cependant, ces données ne sont pas souvent représentatives de l’ensemble du pays, car elles sont essentiellement obtenues en milieu hospitalier, et non pas dans les structures de proximité. Le document présente les tendances, les déterminants et les résultats en matière de césarienne aux niveaux mondial et régional. Il évoque les controverses et les consensus à propos des indications de césarienne. Le coût de l’augmentation des taux de césarienne, la participation des femmes à la prise de décision, le rôle des agents de santé, la qualité des données et les aspects juridiques sont mis en lumière et accompagnés d’un débat sur l’objectif de réduction des taux inutilement élevés de césarienne et de promotion de soins maternels de qualité.
10

Eastern Mediterranean Health Journal, Vol. 14, No. 2, 2008 471
املجلة الصحية لشرق املتوسط، منظمة الصحة العاملية، املجلد الرابع عشر، العدد ٢، ٢٠٠٨
Introduction
The increasing rates of caesarean section (CS) delivery have been debated globally for over 2 decades, especially during the 1980s, when a peak was reached in indus-trialized countries [1]. Professional de-liberations continued on such themes as evaluation of CS rates, management of difficult childbirth and labour, management of labour after previous CS and strategies for reducing CS rates [2–4]. This lead to guidelines from the relevant United Nations (UN) agencies that CS rates in a country should be between 5% and 15% and en-couragement of further research on the issue [5–7]. Reducing maternal mortality by three quarters by the year 2015 became an impor-tant Millennium Developmental Goal in the Millennium Declarations [8]. A suggestion that the rate of CS can act as a proxy indica-tor of maternal mortality (i.e. rising rates of CS indicate improved maternal care) has been questioned [9], as good obstetric outcomes may be associated with low rates of CS [10].
The objectives of this paper are to re-view: the rates, indications and outcomes of CS; the role of health workers in influ-encing the frequency of CS; the costs of CS; women’s concerns and involvement in decision-making to have CS; and the legal and professional implications of performing CS, with special reference to counties of the Eastern Mediterranean Region (EMR) of the World Health Organization (WHO), mainly Sudan, and other international data.
The information sources used for this review included: peer-reviewed journals, both regional and international; the In-ternet (press releases, online magazines, official reports, online debates, clinical practice guidelines and expert consensus pages websites provided several references, sometimes web-lists, for different sources);
international conference reports on obstet-ric and gynaecology, statistical reviews, CS rates, evaluations, policies, strategies, monitoring and other managerial issues; survey results and statistical reports, mainly from Sudan and Saudi Arabia; thesis ab-stracts [11]; textbooks [12–14]; official data from ministries of health; WHO docu-ments, clinical guidelines and workshop recommendations; and Royal College of Obstetricians and Gynaecologists (RCOG) green-top guidelines [15].
After the topic of CS was chosen, the subtopics were defined, mainly debatable issues and developments in CS rates and trends. The above objectives were then set. EMR country information, mostly from Su-dan, was compiled and reviewed. Only one randomized controlled trial of a Canadian multicentre collaborative group on manage-ment of breech birth was identified [16]. The majority of references were retrospec-tive, case-controlled studies published in peer-reviewed journals. Textbooks, though generally weaker sources of information, are mostly reliable. Public health aspects of CS were emphasized. Similarly, health financing, women’s issues, data quality and outcomes were specifically addressed. Throughout the review, international data are presented initially, followed by regional data with comments.
Worldwide trends in caesarean section rates
Sir John Peel in the 1960s pioneered the sur-vey of rates of CS and of vaginal birth after CS (VBAC) [17]. In the 1980s, a marked increase in CS rates in developed coun-tries prompted studies on CS from hospital records, fertility data, births, deaths and insurance claims. Most industrialized coun-tries then had CS rates of 10%–13%, the

472 La Revue de Santé de la Méditerranée orientale, Vol. 14, No 2, 2008
املجلة الصحية لشرق املتوسط، منظمة الصحة العاملية، املجلد الرابع عشر، العدد ٢، ٢٠٠٨
lowest in Japan (7%) and highest in Brazil (32%). Brazil’s rate remained the highest, even though it was based on all deliveries and not on hospital deliveries alone [1]. The denominator for CS rates was mostly from hospital-based deliveries of at-risk women.
CS rates in several countries worldwide are shown in Table 1. In Scotland in the United Kingdom (UK), CS rates increased from 5% to 20% in 30 years from 1971–2001; the overall UK rate also increased from just 4% to 20%–24 % [18]. The rate in the United States of America was similar at 23.5% [19]. Chile’s rate in 2001 was 40% and in Brazil in the same year it was 80% of hospital deliveries [20]. There is a great disparity between country rates, however. Extremely low CS rates, such as < 1%, may indicate substandard maternity care whereas for VBAC, if cases are not well-selected and carefully followed-up during labour, more scar dehiscence will result.
In Sub-Saharan Africa, CS rates of < 5% are quoted. In Niger, for instance, it is
as low as < 1%. The exceptions are Kenya and Ghana with rates of up to 22% [21]. CS rates comparing rural with urban locations in some African countries are shown in Table 2 [22].
For New Zealand the most recent CS rate from 2000–01was 22.1%, the operative vaginal delivery rate was 10.3%, with hos-pital births < 70%. The CS rate increased from 18.2% to 20.8% between 1997 and 2000 similar to developed countries trends [23]. Hopefully, these are not benchmarks for developing countries.
Trends in caesarean section rates in the Eastern Mediterranean Region
There are a number of reports of the CS rates in countries of the EMR. These are summarized in Table 3. In Jordan, the CS rates at Queen Alia Military Hospital rose from 4.8% to 8.5% between 1991 and 1997,
Table 1 Examples of international caesarean section (CS) rates
Country CS rate (%) Comment Reference
Brazil 32 Out of all births [21]
80 Hospital data
Chile 40 [21]
Ghana/Kenya 22 [22]
Japan 7 [1]
Niger < 1 [22]
New Zealand 22.1 [23]
United Kingdom 20–24 Increase from 4% [20] 30 years previously
Sub-Saharan Africa 5 [22]
United States of America 23.5 [19]

Eastern Mediterranean Health Journal, Vol. 14, No. 2, 2008 473
املجلة الصحية لشرق املتوسط، منظمة الصحة العاملية، املجلد الرابع عشر، العدد ٢، ٢٠٠٨
with an average rate of 7.7% over the pe-riod. The rate of forceps deliveries was 3% and the vacuum extraction (VE) rate was 0.88% [24]. From 1990 to 2001 the CS rate in Jordan overall increased from 8.0% to 10.9% [25].
This study and others in Jordan also looked at trends in the indications for CS. Breech presentation and fetal distress in-creased significantly from 1990 to 2001 as
indications for CS, while dystocia and pre-vious CS scar decreased [25]. Fetal distress became an important indication because of limited use of fetal scalp sampling. How-ever, intrapartum fetal heart monitoring may unnecessarily increase CS rates due to incorrect interpretation of tracings and diagnosis of fetal distress [26].
A statistical comparison of CS rates in 3 hospitals in Irbid showed a statistically
Table 2 Single live birth by caesarean section (CS) in sub-Saharan Africa in 3 years before the health survey by place of mother’s residence
Country Year Births by caesarean section (%) Total Rural Urban
Burkina Faso 1992/99 1.1/1.1 0.5/1.0 4.7/2.5
Cameroon 1991/98 2.3/2.6 1.7/2.3 3.3/3.3
Ghana 1993/98 4.4/4.1 2.9/2.8 8.4/8.0
Kenya 1993/98 5.4/6.7 4.1/5.7 13.9/11.1
Madagascar 1992/97 0.9/0.7 0.8/0.3 1.5/2.3
Niger 1992/98 0.8/0.6 0.6/0.3 2.1/2.1
Tanzania 1992/96 2.6/2.2 2.1/1.5 4.6/5.0
Zambia 1992/96 2.6/1.6 1.4/0.8 4.0/3.0Reference: Buekens P, Curtis S, Alayón S [22].
Table 3 Caesarean section (CS) rates in some Eastern Mediterranean Region countries
Country CS rate (%) Comment Reference
Jordan 10.9 Increased from 7.7% [24] (August 1991–July 1999) Forceps 3%, vacuum extraction 0.88%
Oman 10 [32]
Saudi Arabia 10.0 Hospital data [30]
8.1 National survey
Sudan 8 State hospital [11]
23 Khartoum Civil Hospital
35.8 University hospital

474 La Revue de Santé de la Méditerranée orientale, Vol. 14, No 2, 2008
املجلة الصحية لشرق املتوسط، منظمة الصحة العاملية، املجلد الرابع عشر، العدد ٢، ٢٠٠٨
significant difference in the number of, and indications for, previous CS, but not of com-plications, between the 3 hospitals [27].
A study of indications for CS in Princess Badea hospital in Irbid revealed a 14-fold increase in the risk of having a caesar-ean hysterectomy in patients with placenta praevia and previous CS, compared with patients with placenta praevia but no previ-ous CS [28].
Again in Jordan, comparing 150 forceps deliveries in 1995–99 with 420 vacuum deliveries, serious neonatal morbidity was rare when CS followed promptly on failure of delivery. Forceps were more injurious to the mother, while VE caused greater fetal morbidity. VE was recommended instead of forceps, as it can achieve rotation of the vertex [29]. It is a useful technique in remote areas, but the spare parts need to be readily available, and proper training of midwives is required.
The author, while working in Saudi Arabia, undertook a calculation of the an-nual CS rates from Ministry of Health an-nual health reports from 1979 to 1999 (M. Baldo, unpublished report). The CS rate started at 3.9%, increased to 6.0% in 1983, levelling off at about 6.5% until 1991, then gradually increasing to 11.5% in 1999. Another, published, study calculated the CS rate to be 10% in Saudi Arabia, reaching 20% in tertiary centres; it was suggested that cultural and regulatory factors lead to either early or too late interference in delivery [30]. Another Saudi hospital-based review of indications for primary CS on 207 records of grandmultiparas (1988–92) gave a CS rate of 0.96%, with dystocia being the commonest indication [31]. Dystocia and obstructed labour in grand multiparas are possibly due to the baby’s size or secondary pelvic contraction.
In 1997 the Saudi Arabian Ministry of Health, in collaboration with the WHO
Regional Office for the Eastern Mediter-ranean undertook a case-finding study on maternal mortality from all sources (S. Mawaideh 1997, unpublished report). Out of a total of 21 maternal deaths identified, 8 (38%) were associated with CS, 5 with eclampsia (24%) and 2 each (10%) with breech, placenta praevia and fetal distress and 1 (4%) each with ruptured uterus and aortic valve disease.
In southwestern Saudi Arabia, the rate of VE delivery was 10.8%, but with a high failure rate of 12.4%, and with a high rate of neonatal trauma, predominantly subgaleal haemorrhage [32].
The Saudi Family Health Survey 1996, a collaboration between the Ministry of Health, WHO and the United Nations Population Fund found a CS rate of 8.1%, higher for women 35 years or older than for younger women (11% versus 7%), for urban than rural (9% versus 5%) and for university graduates than illiterate women than (10.1% versus 6.7%).
A comparative study of active manage-ment of prelabour rupture of the membranes in a Saudi and a Sudanese maternity hospital gave rates of instrumental vaginal delivery of 13.1% and 10.8%, while CS rates were 16.0% and 15.8% respectively [11].
In Oman, the CS rate reached 10.2% in the year 2002, similar to that of Jordan [33].
In the Islamic Republic of Iran, the CS rates in 3 teaching hospitals increased from 35.4% to 42.3% between 1999–2003, ex-plained by an increase in the rate of elective CS [34].
In Sudan, the Federal Ministry of Health statistical health report of 2005 gives CS rates for the years 2000–2005 as 42.2%, declining to 24.2%, rising again to 32.2%, then decreasing to 28.8%, although the reliability of reporting may be questionable [35]. CS rates for a university hospital, a

Eastern Mediterranean Health Journal, Vol. 14, No. 2, 2008 475
املجلة الصحية لشرق املتوسط، منظمة الصحة العاملية، املجلد الرابع عشر، العدد ٢، ٢٠٠٨
teaching hospital and a provincial hospital in Sudan in the 1990s were 35.8%, 23.9% and 8.0% respectively [11]. Repeat CS, dystocia, breech presentation and hyper-tensive disorders were the main indications for CS. Of patients with primary CS, 96.0% had a second CS in the university hospi-tal, compared with 80.1% of those in the teaching hospital. The latter also had more emergency CSs. The CS indications were relative rather than absolute; staff could be less conservative or the hospital received more referrals. At the university hospital, junior doctors had less chance to perform the operation.
Comparing active management of la-bour in primigravidas to non-interference, the CS rate in Sudan could be reduced from 9% to 1%. Instrumental delivery, however, was 16% in the study group and 14% in the controls [11]. In a Sudanese randomized controlled study, comparing forceps with vacuum deliveries (174 forceps and 112 VE) success was 89.3% for VE and 85.1% for forceps [11]. VE achieved more rotational delivery, fewer maternal complications and was recommended for use in rural areas. Perinatal mortality was higher for forceps than VE deliveries, with a ratio of 3:1.
Another determinant of rising CS rates has been suggested to be the sex of the fetus as male sex has been associated with higher CS rates [36]. Widespread use of ultrasound to determine fetal sex could be a factor.
Indications for CS
Breech presentationA Canadian research group concluded that the safest method of delivery for breech presentations was via CS [16]. The breech CS births group had 4 times less mortality or morbidity in 6 weeks than the vaginal birth group (1.6%–5.0%). There was no
difference in risk to the mother (< 4%). The RCOG, too, has recommended planned CS for term breech delivery, but suggested that incidence be reduced by external ce-phalic version (ECV) for uncomplicated term breech presentations [37]. There was no statistically significant increased risk in maternal mortality in the planned CS group versus the planned vaginal delivery group (3.9 versus 3.2 per 100 000) [16]. The mother’s risk became significant with a policy of elective CS, however. Unfortu-nately, the increasingly common practice of CS for breech babies reduces physicians’ experience in breech delivery, but is still advisable, because most bad outcomes are the result of sub-optimal care [37]. In devel-oping countries, breech delivery may even take place at home, assisted by a midwife. The generally accepted practice is to allow spontaneous breech delivery in a health care facility with no contraindications for vaginal birth even for primigravidas, with precautions such as attendance of a paedia-trician.
In 1988 a study showed that ECV after 36 weeks gestation could be successfully performed without major complications in 82% of 56 women, even breech cases with 1 or 2 previous scars; 65% delivered vaginally [38]. Larger confirmatory studies were suggested.
In India during 1994/96, the incidence of breech deliveries was 3.95%; pre-term breech deliveries were 1.9% [39]. The CS rate for breech babies was 31%. Live births were 81% of vaginal versus 86% of CS births. Many obstetricians, however, viewed pre-term breech delivery as risky, best managed by primary CS.
In Jordan 80% of obstetricians prefer CS for breech presentations. However, there were reservations about performing CS for babies of less than 30 weeks gestation due

476 La Revue de Santé de la Méditerranée orientale, Vol. 14, No 2, 2008
املجلة الصحية لشرق املتوسط، منظمة الصحة العاملية، املجلد الرابع عشر، العدد ٢، ٢٠٠٨
to lack of suitable neonatal care facilities [40,41].
The perinatal outcomes of singleton breech presentations of 112 nulliparous mothers delivered after 37 weeks, either vaginally or by CS, were published in Saudi Arabia [42]. Out of 96 breech trials 67% had a successful vaginal delivery. Women delivered by CS were significantly older than those delivered vaginally (P < 0.0001) or by emergency CS (P < 0.004). CS births were heavier than those delivered vaginally (P < 0.0001). There were no significant differences in 5-minute Apgar scores or perinatal mortality. It was concluded that with proper selection of nulliparous breech pregnancies for vaginal delivery, CS was mostly avoidable without compromising perinatal outcome.
Another study showed that the frequency of Saudi breech deliveries was 2.8%, with 82% being delivered by CS; 94.4% of the latter were primaparas [43]. Possibly the decision was left to individual obstetricians. Ensuring the standard practice of “grand rounds”, audits and discharge clinics will ensure teamwork and appropriate deci-sions.
In a study in Sudan of vaginal deliv-ery versus operative delivery involving 76 primigravidas with singleton breech presen-tations, the CS rate was 71%, 36.8% being emergency operations [11]. In another study with 83 term breech deliveries, 65.1% were multigravidas [11]. The overall CS rate was 44.6% (65.5% in primigravidas, 33.3% in multigravidas). It was concluded that vagi-nal delivery for selected term breech cases was safe. Routine CS is not justified even in primigravidas.
Twin pregnancy CS is of no advantage in the majority of cases of twin pregnancy, particularly if both
are presenting by the vertex [44,45]. A Sau-di study gave a CS rate for twins of 32.2% compared with 3.6% for single babies [46].
In Sudan, at Omdurman Maternity Hos-pital in October 2000, the total deliveries were 11 218 with 2082 CSs and the CS rate for twin with complications was 5% [11]. Primary CS was recommended for twins if the first one is transverse. Even when the first one is in the breech position, its size is usually reasonable and delivery can be spontaneous. The after-coming head needs to be protected by forceps as well as in vertex presentations.
Prolonged pregnancy For an uncomplicated prolonged pregnancy the CS rate in Sudan was 7.9% for the study (126 cases) and 15.8% for controls (256 cases) [11]. For Jordan, comparing the CS rates for postdate pregnancies, with induced or spontaneous labour, the overall CS rate was 9.4% with no statistically significant difference. The assisted vaginal delivery rate was 7%, higher for the induced group, but not statistically significant. Induction of labour was justified in the interest of the baby [47].
Preterm birthsA study of the perinatal mortality rate of preterm births born by CS in Jeddah, Saudi Arabia in 1988 showed the preterm birth rate was 9.3%. The perinatal mortality rate was 40.8/1000, with 14.2% delivered by CS [48].
In a tertiary hospital in Saudi Arabia, the survival of babies < 1000 g in weight was 71.4% for CS births compared with 46.7% born vaginally. Accordingly CS improved the survival chances of babies between 500–1499 g. CS was recommended for breech babies with weight < 1500 g if the neonatal technology was available. For
Eastern Mediterranean Health Journal, Vol. 14, No. 2, 2008 477
املجلة الصحية لشرق املتوسط، منظمة الصحة العاملية، املجلد الرابع عشر، العدد ٢، ٢٠٠٨
multiple pregnancies, elective CS is indi-cated for preterm babies or the first breech twin [49].
In Sudan the pre-term CS rate was 11.6% for cases and 13.0% for controls, while it was 41% in the university hospital [11]. The university hospital CS rates for preterm babies could be influenced by research considerations.
Previous CSThe old dictum “once a CS always a CS” has been invalid since the 1980s. Indeed in one study 70%–80% of women with previous CS proceeded to have a successful vaginal birth [50].
In Jordan a study of antenatal computed tomography to assess the pelvis showed that it was of limited value for 100 cases and 119 controls of women with previous CS. The success rate was 49.0% for cases and 78.2% for controls [51]. In the UK in 1999, the repeat CS rate was 54% [52]. In Colombo, Sri Lanka, 63.2% of cases of “trial of scar” (attempted vaginal delivery after previous CS) succeeded [53]. In contrast, in Aus-tralia, only 25.3% had successful VBAC [53].The incidence of scar dehiscence was 3.7% in Colombo, only 0.3% in Australia. The specialists participated in the decision on CS in 37.5% of cases only [53]. With high CS rates after previous CS, the cost and mother’s obstetric future need to be considered as well.
In developed countries the main reason for increasing CS rates is repeat CS. One study showed that this was responsible for 40% of all CS, a 68% increase between 1979 and 1982 [54]. However, more than one previous CS is believed not to contrain-dicate a subsequent vaginal birth without risk [55]. In 1989 the CS rate in the United States of America (USA) was 23.8%, 81.5% were repeat CS, vaginal births being 18.5% [56]. Around 25% insisted on having or
were keen to have CS. The high CS rates in the USA are possibly the result of litigation or financial gain; repeat CS is the common-est indication for CS.
In Jordan, a 75% success rate of VBAC was achieved, compared with 50% in Eu-rope and 25% in the USA [57]. Repeat CS decreased in Jordan from 1991 to 1999, the latest rate being 19% [24]. During 1989–93 the rate of successful vaginal delivery after 1 or 2 CSs among 310 Saudi hospital de-liveries was 62.6%, demonstrating that in the absence of contraindications, a “trial of scar” could be safely allowed [58].
A Saudi study conducted during 1990–98 concluded that the rate of CS after previous CS could be reduced [59]. In 2578 cases of previous CS out of 61 060 births, 37.5% of them had a repeat CS. The VBAC group included 1% assisted breech deliveries. A total of 15 patients with previous scars suffered from a ruptured uterus, but with no adverse outcome; hysterectomy was not required. The ratio of ruptured uterus in women with previous trial of scar was 1:172. The occurrence of ruptured uterus in VBAC indicates substandard care. Involve-ment of senior staff in deciding on CS and judicious use of oxytocin for managing dystocia have been emphasized [59,60]. A previous study done in the same Saudi hospital during 1979–85 reported 13 cases of ruptured uterus, 8 of which had a previ-ous CS scar and 3 were induced by prostag-landin E2. Two of the 5 cases with intact uteri were similarly induced. There were 5 perinatal deaths and 1 maternal death [60]. The ratio of ruptured uterus in women with previous trial of scar were not compared for these studies, however.
Table 4 summarizes the results of 3 data sets of emergency postpartum hysterecto-mies (EPPHs) from 2 Saudi hospitals and 1 Canadian centre. It shows the CS and EPPH rates and the proportions of CSs out

478 La Revue de Santé de la Méditerranée orientale, Vol. 14, No 2, 2008
املجلة الصحية لشرق املتوسط، منظمة الصحة العاملية، املجلد الرابع عشر، العدد ٢، ٢٠٠٨
of EPPHs and maternal deaths. The Taif hospital’s CS rate increased from 8%–10% in 1990 to 15.1% in 1998. Reducing it would probably avoid CS hysterectomy. Atonia, ruptured uterus and placenta accreta were the commonest indications for hys-terectomy, but with varying order [61–63]. Although hysterectomy was the usual prac-tice, repair of the uterus was followed by pregnancy in Saudi Arabia [64].
Scar dehiscence is rare, mostly asymp-tomatic and without complications. Vaginal delivery is considered the safest route in most of these patients. However, in Bah-rain the CS scar was the commonest cause of uterine rupture, rupture of the intact uterus being more serious. The overall CS rate was 7.6% over 2 decades, 5.9% and 9.95% respectively for the 1st and 2nd decades [65]. The study suggested that a postdelivery check on the previous scar per vaginum is necessary, especially in cases of unexplained bleeding.
A 5-year study in Yemen reported a 1.1% incidence of uterine rupture (60/5547 births); 28.3% were after a previous CS,
14.0% were caused by oxytocin, 2.3% by misoprostol [66]. Hysterectomy was done for 55% of cases, while 3.3% had vesi-covaginal fistulae. Contributory factors included no prenatal care (93.3%), obstruct-ed labour (95.0%) and grand multiparity (69.8%). Indiscriminate use of oxytocin by midwives at home and injudicious use of both oxytocin and misoprostol at hospital level were incriminated. Family planning was stressed as a preventive measure.
A report of 2 studies on uterine rupture from Sudan and Yemen showed that 33.9% of women from Yemen and 35.5% from Sudan had a previous CS scar [11]. In Su-dan, 70.6% were less than 35 years old and 61.8% were of low parity, had no antenatal care and/or had prolonged labour at home. In Sudan the rate of vaginal birth after pri-mary CS was 80.8% and the uterine rupture rate was 1.9% [11]. Those with non-recurrent indications were 85.0% compared with 66.6% with recurrent indications. Although no mothers died, this was still an unfortu-nate situation as the women’s obstetric fu-ture has been jeopardized. In Sudan, repeat
Table 4 Postpartum hysterectomies from 2 Saudi centres and 1 Canadian centre
Variable Jeddah, Saudi Taif, Saudi Canada Arabia Arabia 1990–97 1990–98 1983–93
No. of deliveries 18 842 74 200 59 839
No. (%) of CS 2 449 (13.0) 1130 (15.1) 10 472 (17.5)
No. (%) of EPPH 23 (0.12) 25 (0.03) 25 (0.04)
No. of CS/EPPH (%) 8/23 (75) 13/25 (52) 19/25 (76)
No. of deaths/EPPH 1/23 2/25 Nil
Indications for hysterectomy (%) Atonia 43.5 24.0 24.0 Uterine rupture 30.4 40.0 28.0 Placenta accreta 26.1 36.0 36.0References: [61–63].CS = caesarean section; EPPH = emergency postpartum hysterectomy.
Eastern Mediterranean Health Journal, Vol. 14, No. 2, 2008 479
املجلة الصحية لشرق املتوسط، منظمة الصحة العاملية، املجلد الرابع عشر، العدد ٢، ٢٠٠٨
CS up to 4 times was as safe as 2 or 3 times when performed under appropriate condi-tions; 13% of induced labours ended in CS at Omdurman Maternity Hospital [11]. Prostaglandins were necessary, at least for cases with low Bishop scores, although this is a dangerous practice. Globally, the risk of uterine rupture with vaginal births after CS is given as 1:200 (0.22% overall and 0.18% in developed countries) [55]. From Sudan too, out of 207 cases of obstructed labour, the incidence of uterine rupture was 2.9% [67]. Fifty cases of vesicovaginal fistula were reported from a vesicovaginal fistula centre in Sudan. Obstructed labour caused 28% of the latter, forceps delivery 14%, CS 16% and hysterectomy 24%. At least 54% were a result of poor medical competencies, requiring retraining, audit and supervision of medical staff [68].
Sexually transmitted infectionsHIV/AIDS and sexually transmitted infec-tions are indications for CS. A European case–control study showed that CS sig-nificantly lowers the risk of mother-to-child-transmission (MTCT) of HIV without increasing the risk to the mother [69]. As to active herpes, however, the RCOG advises that the risks to the baby are slight and are to be weighed against the mother’s risk of CS. Even recurrent herpes infection is not an in-dication for CS [70]. Vertical transmission of hepatitis C (HVC) is more common with forceps delivery, greater in the presence of simultaneous HIV infection. The role of CS in reducing MTCT of HCV and breast-feeding increasing it are confirmed [71]. In Saudi Arabia the MTCT is 5%, and 0.5% of screened pregnant women tested positive for HIV [72]. The Sudan HIV/AIDS preva-lence in pregnancy assessed by a serological survey was 1% [73]. Seropositivity for HIV at a teaching hospital antenatal clinic was 0.4% [11].
Maternal mortality rates after CS
In general, although CS has a mortality rate < 1%, in many developing countries maternal mortality is 10–20 times greater with CS than with normal births [74]. The increased risk of CS mortality exists even with elective CS, with no pathology. Ma-ternal mortality ratios of 500/100 000 live births are generally associated with CS rates of 5% or less, but low maternal mortality ratios can coexist with a wide range of CS rates, possibly associated with high levels of normal vaginal delivery. Thus the CS rate is not a good indicator of the quality of obstetric care.
In Egypt in 1989, CS was the 4th direct cause of maternal mortality at 10%. Overall 6.2% of maternal deaths were associated with CS [75]. In Libya, out of 14 maternal deaths 6 followed from CS; 3 of the de-ceased had previous CS, 1 had 2 previous CS, complicated by placenta praevia. The overall maternal mortality ratio in Libya was 17.5/100 000 live births [76].
Previous CS and placenta praevia are a particularly dangerous combination. Ab-dominal delivery significantly increases the risk of subsequent placenta praevia [77]. In 1988–91 the incidence of major placenta praevia in a Saudi hospital was 0.73% (96/13032), all delivered by CS [78]. In Oman, the incidence of placenta praevia was 0.6% compared with the usual figure of 0.5%; 72.2% were of major degree [33]. The Jeddah study proposed that data from “near-miss” cases was a measure of progress in maternity care, with maternal mortality becoming so rare [62]. Obstetric risks such as placenta praevia constitute a small percentage of pregnancy risks, but can have catastrophic outcomes (Pareto effect).
Poor anaesthetic practice in CS, for example due to empty gas cylinders or
480 La Revue de Santé de la Méditerranée orientale, Vol. 14, No 2, 2008
املجلة الصحية لشرق املتوسط، منظمة الصحة العاملية، املجلد الرابع عشر، العدد ٢، ٢٠٠٨
incorrect intubation practice, is a cause of dramatic maternal deaths. Epidural anaes-thesia increases CS rates, as the mother is unable to push, but can be a significant factor in successful VBAC [79].
A Saudi hospital study estimated the CS rate at 8.1% and maternal mortality ratio at 17.6/100 000 live births [80], similar to Libya [76]; it is almost equal to that of the Sudan survey [11]. CS contributed to 37% of deaths (29/79), 82% of deaths after emer-gency CS, 18% after elective CS, but not all were attributable to the CS. Thromboem-bolism caused 17% of maternal deaths, 7% from amniotic fluid embolism. Haem-orrhage caused 27% and problems with anaesthesia just 1%. Emergency obstetric care, basic or essential, needs strengthen-ing. Maternal mortality after an elective CS should not occur.
The elective CS rate in Sudan is 44.3%, the emergency rate is 55.7%. The frequency of elective versus emergency CS (1168 cases) was higher at university than other teaching hospitals. Maternal deaths fol-lowing CS were 4 out of 1168 CSs. At the maternity hospital, maternal mortality was given as 8% of 1078 primary CSs [11]. In the same maternity hospital, 381/2032 CSs were primary CSs, total deliveries be-ing 11 218. Six maternal deaths occurred, after emergency CSs. In Sudan the main causes of post-CS mortality were infection, incorrect intubation and eclampsia. Post-CS antibiotics are routine, except at the university hospital. Anaesthesia is given by medical assistants, except at the university hospital, where it is given by anaesthetic registrars. Consultants anaesthetize just 7% of obstetric patients. Spinal anaesthesia is increasingly used. Epidural anaesthesia is being introduced at the university hospital [11]. Anaesthetic accidents, the result of incorrect intubation or the oxygen cylinders being empty, are cases of sheer negligence.
Infection is the commonest cause of morbidity after CS, with rates of 13%–65%, and are a major cause of mortality [11]. The reduction of endometritis by two-thirds and wound infection by three-quarters justifies giving prophylactic antibiotics for non-elective CSs [81]. From Saudi Arabia the incidence of post-CS infection is reported to be 4.5% [82]. For Jordan it is 8.1%, mainly caused by Staphylococus aureus. Prophy-lactic antibiotics reduce post-CS infections and costs [83]. No significant difference was found on using a specific antibiotic for elective CS and nonelective ones; the most effective antibiotic has to be decided [84]. Recently nonclosure of the visceral or pari-etal peritoneum, or both, reduced operation time, postoperative morbidity and use of analgesics [85]. Infection may be caused by Clostridium tetani or an anaerobic organism with septicaemia that can be fatal. In Sudan in 1999, coverage of pregnant women with tetanus toxoid was only 52% [86].
Elective CS, ethical and legal issues
In the UK the rise and variability in CS rates generated a public debate about au-dit of CS rates and quality of care. Rates are as low as 13%–15% and as high as 25%–30% in different hospitals in the UK. Of women allowed VBAC, 70% usually succeed in a vaginal delivery [87]. Apart from the medical determinants, the health providers themselves may contribute to the increase in CS rates. In London, 31% of female obstetricians and 8% of male ones would choose elective CS for a normal term pregnancy [88]. In the USA, 50% and up to two-thirds of obstetricians in Florida are females. Older obstetricians in the USA, mostly males, are leaving the profession be-cause of increasing litigation. Legal claims
Eastern Mediterranean Health Journal, Vol. 14, No. 2, 2008 481
املجلة الصحية لشرق املتوسط، منظمة الصحة العاملية، املجلد الرابع عشر، العدد ٢، ٢٠٠٨
against obstetricians for negligence, for example, are increasing, possibly encour-aged by lawyers. In the USA, the average number of claims per 100 physicians tri-pled between 1980 and 1985. More than 70% of the obstetricians have been sued at least once [89]. The rise in malpractice claims has been accompanied by a 2300% increase in the number of awards over $US 1 million. Insurance companies levy higher premiums on obstetricians than other doc-tors [89].
The Royal College of Midwives has found that CS births are highest among minority groups and older women, and argue that CSs are unwanted, unnecessary and a financial drain on the health care system. More than 10% of women in the UK felt that the decision about their mode of delivery was entirely theirs and 50% of them would opt for a CS [90,91].
A study in the UK showed that high percentages of women favoured CS for relatively minor indications to avoid urinary and sexual problems after vaginal delivery [92]. Operative vaginal delivery especially can cause perineal tears of varying severity and, if not repaired properly, may cause immediate or late incontinence of faeces and flatus.
The nurse midwife’s role in achieving a lower CS rate was reported from Jordan [24,25]. In developed countries, where de-livery by qualified midwives predominates, CS rates are generally lower [93]. In the USA, the birth assistant, called the doula, lends professional support during childbirth, but has no clinical tasks. Doulas have been shown to reduce the CS rate in the USA by 10%, presumably by reassuring and achiev-ing relaxation of mothers, whereas epidural anaesthesia is associated with increased CS rates due to immobilization and failure to push in the second stage [94,95]. In Sudan, village midwives assist home births, which
are around 86% of all births, in addition to shouldering environmental, social and child health tasks.
Without informed consent, especially when a tubal tie is needed, and without proper preparation, CS can lead to serious psychological morbidity of the delivered woman [96,97]. In Saudi Arabia the felt needs of delivered women are not met by professional caregivers—CS was described as an unpleasant experience—and may be followed by severe psychological problems [98]. In Australia, although more than 80% of women having elective CS, and 50% of those having emergency CS, reported involvement in the decision, 20%–50% of those delivered by CS were not completely satisfied. More information before CS might contribute to reducing the rate [99].
CS on request or by court order in the baby’s interest is raising ethical and profes-sional questions about whether obstetricians should respond passively to patients’ de-mands. If a CS is refused, the physician may be at-risk of being sued, but not if it is done unnecessarily early for fear of litigation, when a spontaneous delivery is expected, or waiting too long to avoid doing the CS for at-risk cases.
Educating health workers and creat-ing regional tertiary centres for managing perinatal problems in cases referred from inadequately equipped hospitals are good interventions. Over-medicalization and commercialization lead to increasing mal-practice suits and a tendency towards defen-sive obstetrics [1]. The flourishing private care even at government institutions, or the widespread introduction of health insurance schemes, encourages CS births.
The occurrence of cerebral palsy after delivery is a problem for the family and the obstetrician, despite the widespread use of electronic fetal monitoring and rising CS rates [100]. It is not the result of birth

482 La Revue de Santé de la Méditerranée orientale, Vol. 14, No 2, 2008
املجلة الصحية لشرق املتوسط، منظمة الصحة العاملية، املجلد الرابع عشر، العدد ٢، ٢٠٠٨
trauma, and probably occurs during preg-nancy or after delivery. Intrapartum events account for no more than 10% of cases of cerebral palsy [101,102]. In the US the interests of a viable fetus can be legally pre-served in cases of conflicting maternal–fetal interests. In the UK, however, a woman has no legal choice to have CS, while the fetus has no legal status on CS [103]. For developing countries congenital anomalies are considered priority problems.
In the UK there is concern about ris-ing CS rates and there are questions about whether balanced information is provided to women. Although only 1% of elective CSs are actually performed solely on ma-ternal request, rising CS rates make women less confident in their ability to have a spontaneous birth. Maternal mortality has been given as 6 times greater for CS than for spontaneous vaginal delivery, being 3 times greater for elective and 9 times for emergency CS. The increased costs as a re-sult of rising CS rates are also a concern for a publicly-funded national health service.
In both Sudan and Saudi Arabia, health insurance has been introduced, but it may have the effect of increasing CS rates. Cost-recovery in Sudan is almost universal, par-ticularly for surgical operations. The poor and disadvantaged groups are particularly harmed by such policies.
Quality control and audit
Positive action can control rising CS rates. The RCOG advocates development of evidence-based rather than opinion-based guidelines, and ensuring their implementa-tion through evaluation processes [104].
Quality control, audit and clinical gov-ernance are means of sustaining excel-lence. Leadership and peer-led efforts in the United States have succeeded in reducing CS from 40% to 21.2% in 5 years by setting
targets, implementation and conducting 5 evaluations [79]. A study in 5 Latin Ameri-can countries involving 23 hospitals and 149 206 deliveries hypothesized whether a mandatory second opinion before every non-emergency CS could reduce their number. Second opinions, however, tended to con-firm the first opinion [105].
Demographic and Health Survey data from 6 developing countries showed higher CS rates than hospital data suggest [106]. The CS rates of Saudi Arabia are not com-parable to those of Sudan, as 91.4% of Saudi births are hospital-based compared with 14% in Sudan. In Saudi Arabia, hos-pital and community maternal mortality rates are similar, 11.5% and 8.1%, while for Sudan the discrepancy is greater 18% and 2% respectively, as only at-risk cases deliver in hospital (14%).
The RCOG classified the urgency of CS into 4 grades: emergency, urgent, scheduled and elective to be adopted, considering legal aspects [103]. The RCOG emergency classification can be utilized by develop-ing countries. Complete and accurate CS reports are to be compiled regularly.
Conclusion
CS rates are still increasing worldwide, but are levelling off in a few countries. A proportion of CSs may be unnecessary or unwanted. Maternal mortality can be 10 times greater after CS than vaginal delivery in developing countries, while in devel-oped countries it is 2–4 times. Accordingly, international concern has been aroused. Unfortunately, data sources are exclusively hospital-based and not routinely reported. CS rates in developed countries reached 23%–24% while for some EMR countries rates are mostly around 10%, although the data are mostly from Saudi Arabia, Sudan and Jordan.

Eastern Mediterranean Health Journal, Vol. 14, No. 2, 2008 483
املجلة الصحية لشرق املتوسط، منظمة الصحة العاملية، املجلد الرابع عشر، العدد ٢، ٢٠٠٨
The determinants of rising CS rates are obstetric, medical, professional and individual-related. The main obstetric de-terminants are less use of operative vaginal delivery and VBAC, breech presentation, twins and preterm delivery. Vaginal de-livery is now encouraged for these, in the absence other contraindications, but quality of care is required. The baby is no longer sacrificed for the sake of its mother, but a mother still decides on behalf of her baby. Dystocia and fetal distress are common manageable reasons for unnecessary CSs. Medical indications include communicable diseases such as AIDS. Professional reasons for greater use of CS include financial gain and/or fear of litigation. Decision-making about birth at the level of the individual woman is a right.
In summary, poor safe motherhood programmes, because of lack of access, improper referral, or reluctance to accept referrals by patients and relatives or lack of means of transportation, all lead to delays in doing CSs, leading to increased mortality and morbidity. Midwives may use oxytocin at home, causing ruptured uterus and death. Intrapartum fetal heart tracing is recognized to increase CS rates unnecessarily, as trac-ings may be subject to legal scrutiny. Very
low CS rates signify substandard care or negligence or unavailability of physicians. In Africa nurses are trained to undertake CSs instead [107]. Improper handling of deliveries, too frequent vaginal examina-tions, lack of hygiene and prolonged labour, all lead to endometritis.
To reduce increasing CS rates, opera-tive vaginal delivery has been suggested, although this too is not without risk [108]. The RCOG considers the vacuum extractor the instrument of choice [52]. A low forceps for a vertex or breech presentation, properly applied, protects the fetal head, especially for preterm babies.
The leadership role of senior staff, peer-led efforts, regulating private care, effective guidelines, problem-solving strategies and a team approach are important strategies to pursue. Peer-reviewed journals, including electronic ones, provide evidence-based information for quality care [109]. The consent of wife and husband, though more controversial in developing country situa-tions, is essential, especially for elective op-erations. More research on CS is needed, for example, on the need for a second opinion and on the benefits of reducing or increas-ing CS rates.
References1. Proceedings of the XII World Congress
of Gynecology and Obstetrics, Rio de Janeiro, October 1988. In: Advances in gynecology and obstetrics, Volume 5. Pregnancy and labor. London, Parthenon Publishing Group, 1989.
2. Evaluation of cesarean delivery. Wash-ington DC, American College of Obstetri-cians and Gynecologists, 2000:12.
3. Policy statement: dystocia. Ottawa, On-tario, Society of Obstetricians and Gy-naecologists of Canada, 1993 (Clinical Practice Guidelines No. 40).
4. Bernstein P. Strategies to reduce the incidence of cesarean delivery — part II: management of labor and vaginal birth after cesarean delivery. Washington, DC, Medscape, 2000 (http://www.medscape.com/viewarticle/424243, accessed 24 July 2007).
5. Summary of the programme of action. International Conference on Population and Development, Cairo, Egypt, 5–13 September 1994 (ICPD ’94) (http://www.un.org/ecosocdev/geninfo/populatin/icpd.htm, accessed 24 July 2007).
484 La Revue de Santé de la Méditerranée orientale, Vol. 14, No 2, 2008
املجلة الصحية لشرق املتوسط، منظمة الصحة العاملية، املجلد الرابع عشر، العدد ٢، ٢٠٠٨
6. UNICEF/WHO/UNFPA. Guidelines for monitoring the availability and use of ob-stetric services. New York, United Nations Population Fund, 1997.
7. UNDP/UNFPA/WHO/World Bank Spe-cial Programme of Research. Highlights of achievements, 1990–2001. Geneva, World Health Organization, Department of Reproductive Health and Research, Family and Community Health, 2003:23.
8. The millennium declarations. New York, United Nations, 2000 (Resolution A/RES/55/2).
9. Abu Zahr C, Wardlaw T. Maternal mor-tality at the end of a decade: signs of progress? Bulletin of the World Health Organization, 2001, 79(6):565–6.
10. Ronsmans C et al. Questioning the indi-cators of need for obstetric care. Bulletin of the World Health Organization, 2002, 80(4):317–24.
11. Zaki A, Gerais A, Mirghani H, eds. The book of abstracts. Clinical MD obstetrics and gynaecology research theses, April 1994–October 2000. Khartoum, Sudan, University of Khartoum, Postgraduate Medical Studies Board, Department of Obstetrics and Gynaecology, 2000.
12. Sachs BP et al. Reproductive health care for women and babies: policy and ethics. New York, Oxford University Press, 1995.
13. Baum JD. Birth risks. In: Enkin MW, ed. Intra-partum care of fetus and mother in developed countries. New York, Raven Press, 1993:153–4.
14. Mahowald MB. Women and children in health care. An unequal majority. New York, Oxford University Press, 1993.
15. Green-top guidelines. Royal College of Ob-stetricians and Gynaecologists (http://www.rcog.org.uk/index.asp?PageID=1042, ac-cessed 3 September 2007).
16. Hannah ME et al. Planned caesarean section versus planned vaginal birth
for breech presentation at term: a ran-domised multicentre trial. Term Breech Trial Collaborative Group. Lancet, 2000, 356:1375–83.
17. Caesarean section survey: records of Sir John Peel. London, Royal College of Obstetricians and Gynaecologists, 1967–1968 (GB 1538 M5).
18. New guidance to reduce unnecessary caesarean sections. Scottish Executive News Release SE1827/2001, 6 August 2001 (http://www.scotland.gov.uk/News/Releases/2001/08/b6232531-1eaf-4952-83b6-6b18f0601d13, accessed 3 Sep-tember 2007).
20. Dosa L. Caesarean section delivery, an increasingly popular option. Bulletin of the World Health Organization, 2001, 79(12):1173.
21. Access to caesarean section still poor in sub-Saharan Africa. Reproductive health matters, 2003, 11(22):2–3.
22. Buekens P, Curtis S, Alayón S. Demo-graphic and Health Surveys: caesarean section rates in sub-Saharan Africa. Brit-ish medical journal, 2003, 326:136.
19. Taffel SM, Placek PJ, Kosary CL. U.S. cesarean section rates, 1990: an update. Birth, 1992, 19:21–2.
23. Report on maternity 2000 and 2001. Wellington, New Zealand, New Zealand Health Information Service, 2003.
24. Akasheh HF, Amarin V. Caesarean sec-tions at Queen Alia Military Hospital Jordan: a six-year review. Eastern Medi-terranean health journal, 2000, 6(1):41–5.
25. Hindawi IM, Meri ZB. The Jordanian cae-sarean section rate. Saudi medical jour-nal, 2004, 25(11):1632–5.
26. Prentice A, Lind T. Fetal heart monitoring during labour—too frequent intervention, too little benefit? Lancet. 1987, 2:1375–7.
27. Amarin ZO et al. Variation in repeat cae-sarean section complication rates among

Eastern Mediterranean Health Journal, Vol. 14, No. 2, 2008 485
املجلة الصحية لشرق املتوسط، منظمة الصحة العاملية، املجلد الرابع عشر، العدد ٢، ٢٠٠٨
3 hospitals in northern Jordan. Eastern Mediterranean health journal, 2000, 12(5):610–8.
28. Alchalabi HA et al. Does the number of previous caesarean deliveries affect ma-ternal outcome and complication rates? Eastern Mediterranean health journal, 2007, 13(3):544–50.
29. Shihadah A, Al-Najdawi W. Forceps or vacuum extraction: a comparison of maternal and neonatal morbidity. East-ern Mediterranean health journal, 2001, 7(1/2):106–14.
30. Khashoggi T et al. Primary caesarean sec-tion in King Khalid University Hospital: Indi-cations and obstetric outcomes. Annals of Saudi medicine, 1995, 15(6):585–8.
31. Al Nuaim L. Primary cesarean section in the grandmultipara. Saudi medical jour-nal, 1996, 17(2):167–70.
32. Bhat S, Hamdi IM, Bhat SK. Placenta pre-via in a referral hospital in Oman. Saudi medical journal, 2004, 25(6):728–31.
33. Benjamin B, Khan MR. Pattern of external birth trauma in southwestern Saudi Arabia. Journal of trauma, 1993, 35(5):737–41.
34. Riazi MK, Ibrahimi A, Stovan N. Caesar-ean section rates in teaching hospitals of Tehran: 1999–2003. Eastern Mediterra-nean health journal, 2007, 12(2):457–60.
35. Annual health statistical reports. Khar-toum, National Health Information Centre, Federal Ministry of Health, 1995–2000.
36. Lieberman E et al. The association of fetal sex with the rate of cesarean sec-tion. American journal of obstetrics and gynecology, 1997, 176(3):667–71.
37. The management of breech presentation. Guideline No. 20. London, Royal College of Obstetricians and Gynaecologists, re-vised 2001.
38. Flamm BL et al. External cephalic version after cesarean section. American jour-
nal of obstetrics and gynecology, 1991, 165:370–2.
39. Warke HS, Sarogi RM, Sangawalla SM. Should a preterm breech go for vaginal delivery or caesarean section? Journal of postgraduate medicine, 1999, 45(1):1–4.
40. Ziadah SM, Sunna EL. Decreased ce-sarean section birth rates and improved prenatal outcome: a seven-year study. Birth, 1995, 22:144–7.
41. Ziadeh HS, Abu Hejija AT, El Sunna E. Preterm singleton breech in North Jordan vaginal versus abdominal delivery. Gyne-cologic and obstetric investigation, 1997, 44:169–72.
42. Abu-Heija A, Ali AM. Is breech presen-tation in nulliparous women at term an absolute indication for cesarean section? Annals of Saudi medicine, 2001, 21(3-4):190–2.
43. Akinola SE et al. Assisted breech delivery, is the art fading? Saudi medical journal, 2002, 23(4):423–6.
44. Rydhstrom H, Ingermarson I, Ohrlander S. Lack of correlation between caesarean section rate and improved prognosis for low-birth-weight twins (less than 2500 grms). British journal of obstetrics and gynaecology, 1990, 97(3):229–33.
45. Blickstein I. Cesarean section for all twins? In: Proceedings of the first world congress on: controversies in obstetrics, gynecology and infertility. Prague, Czech Republic, 1999 (http://www.obgyn.net/displayarticle.asp?page=/firstcontrover-sies/prague1999blickstein2, accessed 24 July 2007).
46. Babay ZA, Addar MH, Al Meshari A. Mul-tiple pregnancy management: the King Khalid University experience. Annals of Saudi medicine, 1994, 14(5):405–8.
47. Al-Taani M. Pregnancies past the ex-pected date of confinement: labour and

486 La Revue de Santé de la Méditerranée orientale, Vol. 14, No 2, 2008
املجلة الصحية لشرق املتوسط، منظمة الصحة العاملية، املجلد الرابع عشر، العدد ٢، ٢٠٠٨
delivery outcome. Eastern Mediterranean health journal, 2003, 9(5/6):955–60.
48. Milaat WA, Du V Florey C. Perinatal mortality in Jeddah, Saudi Arabia. In-ternational journal epidemiology, 1992, 21(1):82–90.
49. Algwiser AA. Perinatal mortality at the Armed Forces Hospital, Riyadh, Sau-di Arabia: five year review of 22,203 births. Annals of Saudi medicine, 1993, 10(3):268–74.
50. Flamm B et al. Vaginal birth after caesar-ean sections. Results of a multi-center study. American journal of obstetrics and gynecology, 1998, 158:1079–84.
51. Abu Ghazzeh YM, Barqawi R. An apprais-al of computed tomography pelvimetry in patients with previous caesarean section. Eastern Mediterranean health journal, 2000, 6(2/3):260–4.
52. Effective procedures in obstetrics: suit-able audit. Manchester, Royal College of Obstetricians and Gynaecologists Na-tional Audit Unit, 1993.
53. Seneviratne HR. The caesarean section rate is rising: attempts to curb it must be based on good obstetric care. Ceylon medical journal, 2001, 46(4):119–20.
54. Anderson GM, Lomas J. Determinants of the increasing caesarean birth rate. New England journal of medicine, 1984, 311:887–97.
55. Cesarean fact sheet. In: The compleat mother: the magazine of pregnancy, birth and breastfeeding (http://www.compleat-mother.com/factsheet.htm, accessed 24 July 2007).
56. Field MJ, Lohr KN, eds. Guidelines for clinical practice: from development to use. Washington, DC, National Academy Press, 1992
57. Abu Heija AT, Zayed FF, Badria LF. Can we reduce repeat caesarean section de-
liveries? Saudi medical journal, 1998, 19:728–30.
58. Soltan MH et al. Trial of vaginal deliv-ery following cesarean section: obstetric outcome. Saudi medical journal, 1996, 17(2):171–5.
59. Mesleh RA, Kurdi AM, Ayoub HS. Can the rate of caesarean section be re-duced? Saudi medical journal, 2000, 21(11):1054–7.
60. Mesleh RA, Sabbagh TO, Ayoub HS. Rup-tured uterus—still an obstetric problem. Saudi medical journal, 1987, 8(5):493–502.
61. Nasrat HA et al. “Near-miss” obstetric morbidity in an inner city hospital in Saudi Arabia. Eastern Mediterranean health journal, 1999, 5(4):717–26.
62. Alsayali ARA, Baloul SMA. Emergency ob-stetric hysterectomy: 8-year review at Taif maternity hospital, Saudi Arabia. Annals of Saudi medicine, 2000, 20(5–6):454–6.
63. Tal lab F, Helewa M. Per ipartum hysterectomy: 10-year experience in two Manitoba tertiary centers. Annals of Saudi medicine, 1998, 18(5):398–400.
64. Soltan MH, Khashoggi T, Adelusi B. Pregnancy following rupture of the gravid uterus. International journal of gynecology and obstetrics, 1996, 52:37–42.
65. Sndhu AK, Al Jufairi ZA. A compara-tive analysis of uterine rupture in 2 decades. Saudi medical journal, 2002, 23(12):1467.
66. Diab AE. Uterine ruptures in Yemen. Saudi medical journal, 2005, 36(2):264–9.
67. Dafallah SE, Ambago J, El-Agib F. Ob-structed labor in a teaching hospital in Sudan. Saudi medical journal, 2003, 24(10):1102–4.
68. El Imam M, El Hassan M, Adam I. Vesico-vaginal fistula in Sudanese women. Saudi medical journal, 2005, 26(2):341.

Eastern Mediterranean Health Journal, Vol. 14, No. 2, 2008 487
املجلة الصحية لشرق املتوسط، منظمة الصحة العاملية، املجلد الرابع عشر، العدد ٢، ٢٠٠٨
69. Elective caesarean-section versus vagi-nal delivery in prevention of vertical HIV-1 transmission: A randomised clinical trial. The European Mode of Delivery Collabo-ration. Lancet, 1999, 353:1035–9.
70. Management of genital herpes in preg-nancy. Guideline No. 30. London, Royal College of Obstetrics and Gynaecology, March 2002.
71. HCV & pregnancy, risk factors for trans-mission: breastfeeding, c-section, use of forceps in delivery. Highlights from Diges-tive Disease Week, May 20–23, 2001, At-lanta, Georgia. New York, National AIDS Treatment Advocacy Project, 2001.
72. Al-Mazrou YY et al. HIV/AIDS epidemic features and trends in Saudi Arabia. Annals of Saudi medicine, 2005, 25(2):100–4.
73. Sudan’s National Control Program. The National Strategic Plan for the Prevention and Control of HIV/AIDS in the Sudan 2003–2005. Khartoum, Republic of Su-dan, Federal Ministry of Health, 2002.
74. Moldin P, Hokegard KH, Nielsen TF. Ce-sarean section and maternal mortality in Sweden 1973. Acta obstetricia et gyneco-logica scandinavica, 1984, 63(1):7–11.
75. Saleh S et al., eds. Maternal mortality in Menoufia: a study of reproductive age mortality. Cairo, Social Research Center, American University in Cairo, 1987.
76. Legnain M., Singh R, Busarira MO. Mater-nal mortality in Benghazi: a clinicoepide-miological study. Eastern Mediterranean health journal, 2000, 6(2/3):283–92.
77. Chattopadhyay SK, Kharif H, Sherbeeni MM. Placenta praevia and accreta after previous caesarean section. European journal of obstetrics, gynecology, and reproductive biology, 2003, 52(3):151–6.
78. Khashoggi T. Maternal and neonatal out-come in major placenta previa. Annals of Saudi medicine, 1995, 15(4):313–16.
79. Morton SC et al. Effect of epidural anal-gesia for labor on the cesarean delivery rate. Obstetrics and gynecology, 1994, 83:1045–52.
80. Al Meshari AA et al. Epidemiology of ma-ternal mortality in Saudi Arabia. Annals of Saudi medicine, 1995, 15(4):317–23.
81. Smail F. Antibiotic prophylaxis and cae-sarean section. British Journal of obstet-rics and gynaecology, 1992, 99:789–16.
82. Habib FA. Incidence of post cesarean section wound infection in a tertiary hospi-tal, Riyadh. Saudi medical journal, 2002, 23(9):1059–63.
83. Kaplan NM et al. Microbiology of wound infection after caesarean section in a Jor-danian hospital. Eastern Mediterranean health journal, 2003, 9(5/6):1069–73.
84. Adam I, Adam ES, Gerais AS. Rand-omized trial of ceftriaxone prophylaxis in elective cesarean section. Saudi medical journal, 2005, 26(3):500–1.
85. Peritoneal closure. Guideline No. 15. London, Royal College of Obstetrics and Gynaecology, revised July 2002.
86. Sudan safe motherhood survey, 1999. Khartoum, Department of Reproductive Health, Federal Ministry of Health, Sudan, 1999.
87. Thomas J, Paranjothy S. National sentinel caesarean section audit report. London, Clinical Effectiveness Support Unit, Royal College of Obstetricians and Gynaecolo-gists, 2001.
88. Al-Mufti R, McCarthy A, Fisk NM. Ob-stetricians’ personal choice and mode of delivery. Lancet, 1996, 347:544.
89. Professional liability assurance and its ef-fects: report of a 1990 survey of ACOG’s membership. Washington, DC, American College of Obstetricians and Gynecolo-gists, 1990.
488 La Revue de Santé de la Méditerranée orientale, Vol. 14, No 2, 2008
املجلة الصحية لشرق املتوسط، منظمة الصحة العاملية، املجلد الرابع عشر، العدد ٢، ٢٠٠٨
90. Mould TAJ et al. Women’s involvement with the decision preceding their cae-sarean section and their degree of sat-isfaction. British journal of obstetrics and gynaecology, 1996, 103:1074–7.
91. Paterson-Brown S. Should doctors per-form an elective caesarean section on re-quest? Yes, as long as the woman is fully informed. British medical journal, 1998, 317:462–5.
92. Sultan AH et al. Anal–sphincter disruption during vaginal deliveries. New England journal of medicine, 1993, 329:1905–11.
93. Butler J, Abrahams B, Parker J. Support-ive nurse midwife care is associated with reduced cesarean section. American jour-nal of obstetrics and gynecology, 1993, 168:1407–13.
94. Klaus M et al. Maternal assistance and support in labor: father, nurse, midwife, or doula? Clinical consultations in obstetrics and gynecology, 1992, 4(4):211–7.
95. Morton SC et al. Effect of epidural anal-gesia for labor on the caesarean delivery rate. Obstetrics and gynecology, 1994, 83:1045 –52.
96. Eddy A. Consent in obstetrics—a legal view. The obstetrician and gynaecologist, 2002, 4(2):97–100.
97. Bhutta ZA. Beyond informed consent. Bulletin of the World Health Organization, 2004, 82(10):771–6.
98. Al-Nuaim LA. Views of women towards cesarean section. Saudi medical journal, 2004, 25(6):707–10.
99. Turnbull D et al. Women’s role and satis-faction in the decision to have a caesar-ean section. Medical journal of Australia, 1999, 170:580–3.
100. Nelson KB. What proportion of cerebral palsy is related to birth asphyxia? Journal of pediatrics, 1988, 112:572–5.
101. The use of electronic foetal monitoring: the use and interpretation of the CTG in intrapartum foetal surveillance. London, Royal College of Obstetricians and Gy-naecologists, 2001.
102. Rashid M, Rashid RS. Brief review. Update on intrapartum fetal monitoring. Annals of Saudi medicine, 2003, 23(1–3):43–7.
103. Supplement to a consideration of the law and ethics in relation to court-authorized obstetric intervention. London, Royal Col-lege of Obstetricians and Gynaecologists, 1996.
104. Clinical Effectiveness Support Unit, Royal College of Obstetricians and Gynaecolo-gists. The implementation and uptake of guidelines in obstetrics and gynaecology. The obstetrician and gynaecologist, 2001, 3(2):93–5.
105. Hendry J. Second opinion policy results in small but significant reduction in cae-saraen section rates in Latin American hospitals. Lancet, 2004, 363:1934–40.
106. Stanton CK et al. Reliability of data on caesarean section in developing coun-tries. Bulletin of the World Health Organi-zation, 2005, 83(6):449–55.
107. Vaz F et al. Training medical assistants for surgery. Bulletin of the World Health Organization, 1999, 77(8):688–90.
108. Towner D et al. Effect of mode of deliv-ery in nulliparous women on neonatal intracranial injury. New England journal of medicine, 1999, 341(23):1709–14.
109. WHO’S new electronic journal promotes evidence-based reproductive health care in developing countries, Press release WHO/27, 4 March 1998. Geneva, World Health Organization (http://www.who.int/inf-pr-1998/en/pr98-27.html, accessed 27 July 2007).

Eastern Mediterranean Health Journal, Vol. 14, No. 2, 2008 489
املجلة الصحية لشرق املتوسط، منظمة الصحة العاملية، املجلد الرابع عشر، العدد ٢، ٢٠٠٨
Guidelines for authors
1. Papers submitted for publication must not have been published or accepted for publication elsewhere. The Eastern Mediterranean Regional Office reserves all rights of reproduction and republication of material that appears in the Eastern Mediterranean health journal (EMHJ).2. Original papers written in Arabic, English or French may be sent for consideration to the Editor-in-chief, Eastern Mediterranean health journal, WHO Regional Office for the Eastern Mediterranean, PO Box 7608, Nasr City (11371), Cairo, Egypt. Papers can also be submitted by email to [email protected]. Papers will be abstracted in all three languages.3. The subject of the paper should pertain to public health or some other related technical and scientific subject within the field of interest of the World Health Organization, with special reference to the Eastern Mediterranean Region.4. Three copies of each manuscript should be provided. The text, together with the accompanying tables and figures, should not exceed 15 double-spaced typewritten or printed A4 pages (4500 words) and should be printed on one side only. When the manuscript is accepted or conditionally accepted, the author will be requested to submit a 3.5 inch computer diskette containing the text, tables, graphs and illustrations. For English and French papers, please provide the text, upon the editor’s request, in both wordprocessed format (we prefer Microsoft Word for the PC but can translate most other formats) and also saved as a text/ASCII file. Papers submitted in Arabic should follow the same guidelines as papers written in English or French. If the paper is a translation of all or part of another unpublished work, a copy in the original language should be submitted too. Where possible, graphs should be provided in Harvard Graphics under Windows or Excel, and the illustrations and photographs should be provided in EPS or TIFF format. However, it is necessary to provide three sets of original photographs and figures with the background data. If there is any text or lettering on the photographs, an additional clean set should be provided without the text/lettering.5. All papers received will be peer reviewed, and on the basis of the reviewer’s comments, the Editorial Board reserves the right to accept or reject any paper. Papers are accepted on the understanding that they are subject to statistical and editorial revision as deemed necessary, including abridgement of the text and omission of tabular or graphic material.6. The title of the paper should be as concise as possible, preferably around 10 words, and should be placed on a separate sheet, together with the full name(s) of the author(s), institutional affiliations(s) and highest scientific degrees obtained. The mailing address, as well as any other contact information (email address, fax, telephone) of the corresponding author should be provided. The number of authors should not exceed five. All authors should have made material contribution to either the design, analysis or writing of the study and have approved the final version submitted. Authors may be asked to verify their contribution. Other names may be included in the acknowledgements.7. To facilitate the translation of abstracts and authors’ names, authors whose mother tongue is written in Arabic characters and writing in English or French should supply their full names in Arabic script and provide transliterations.

490 La Revue de Santé de la Méditerranée orientale, Vol. 14, No 2, 2008
املجلة الصحية لشرق املتوسط، منظمة الصحة العاملية، املجلد الرابع عشر، العدد ٢، ٢٠٠٨
8. Papers reporting original research findings should follow the IMRAD format: Introduction; Materials (subjects) and methods; Results; Analysis; and Discussion. An abstract of no more than 100 words should be supplied, clearly and briefly stating the objectives, context, results and conclusions. 9. Authors should verify where appropriate that all persons on whom research has been carried out have given their informed consent, and where participants (living or dead) were unable to give such consent, that surrogate consent was obtained. 10. Review articles should contain sections dealing with objectives, sources, methods of selection, compilation and interpretation of data and conclusions.11. In-text citations of published works should be limited to essential up-to-date references. Apart from review articles, a maximum of 25 references is advisable. They should be numbered separately as they occur in the text with sequential Arabic numerals in parentheses [square brackets]. These references should appear in a numbered list on a separate page at the end of the paper. They should contain the following elements of information as appropriate: name(s) and initial(s) of author(s); title of paper or book in its original language plus translation; complete name of journal plus volume number and page range; name of publisher (commercial or institutional) and place of publication (city and country); and date of publication. Papers with inadequate references or references not arranged according to these principles will be returned to the author for correction. The following are examples of the Journal’s preferred style:Book: Al Hamza B, Smith A. The fifth sign of identity. Cairo, American University Press, 1990.Journal article: Jones A et al. One day in Tibet. Journal of tautology, 1993, 13(5):23–7.Document: Al-Itneen M, ed. The principles of uncertainty. Geneva, World Health Organization, 1985 (document WHO/DOC/537).12. Figures and tables with appropriate captions should each be on a separate sheet, numbered sequentially with arabic numerals and attached to the end of the paper. Each figure and table should be referred to in the text and its placement in the text should be clearly indicated where appropriate. Where appropriate, sources should be given for each figure or table. If any figures, tables or other materials have been copied from other sources, authors have the sole responsibility for securing the necessary permission. In order to avoid layout problems in final production tables and figures should be limited as far as possible. Not more than one table or figure per 1000 words is preferable. Figures derived from data must be accompanied by those data to enable redrawing if necessary.13. Original papers and diskettes will not be returned except upon request by the principal author.14. On publication the authors will receive one copy each of the issue in which the article appears and the principal author will receive 50 reprints. Requests for further reprints and pricing information may be obtained from the Editor-in-chief.
Eastern Mediterranean Health Journal, Vol. 14, No. 2, 2008 491
املجلة الصحية لشرق املتوسط، منظمة الصحة العاملية، املجلد الرابع عشر، العدد ٢، ٢٠٠٨
.
.
.
.A4
,
Microsoft WordASCII
WindowsExcelEPSTIFF
.
.
.
492 La Revue de Santé de la Méditerranée orientale, Vol. 14, No 2, 2008
املجلة الصحية لشرق املتوسط، منظمة الصحة العاملية، املجلد الرابع عشر، العدد ٢، ٢٠٠٨
.
.
.
.
Al Hamza B, Smith A. The fifth sign of identity. Cairo, American University Press, 1990.
Jones A et al. One day in Tibet. Journal Of tautology, 1993,13(5): 23-7.
Al-Itneen M, ed. The principles of uncertainty. Geneva, World Health Organization, 1985 (document WHO/DOC/537).
.
.
.

Eastern Mediterranean Health Journal, Vol. 14, No. 2, 2008 493
املجلة الصحية لشرق املتوسط، منظمة الصحة العاملية، املجلد الرابع عشر، العدد ٢، ٢٠٠٨
Directives à l’intention des auteurs
1. Les articles soumis pour publication ne doivent pas avoir été publiés ou acceptés pour publication dans d’autres revues. Le Bureau régional de la Méditerranée orientale se réserve tous les droits de reproduction ou de republication des matériels qui paraissent dans La Revue de Santé de la Méditerranée orientale.2. Les articles originaux en anglais, arabe ou en français peuvent être soumis pour considération au Rédacteur en chef de La Revue de Santé de la Méditerranée orientale, Bureau régional de l’OMS pour la Méditerranée orientale, BP 7608, Cité Nasr (11371), Le Caire (Égypte). Les articles peuvent également être envoyés par courriel à l’adresse suivante : [email protected]. Ils seront résumés dans les trois langues.3. Le sujet de l’article doit concerner la santé publique ou d’autres domaines techniques et scientifiques connexes dans le champ d’intérêt de l’Organisation mondiale de la Santé, se rapportant plus particulièrement à la Région de la Méditerranée orientale.4. Chaque manuscrit doit être fourni en trois exemplaires. Le texte, avec les tableaux et les figures qui l’accompagnent, ne devrait pas dépasser 15 pages, format A4, dactylographiées ou imprimées en double interligne (4500 mots) et devrait être imprimé sur le recto seulement. Lorsque le manuscrit est accepté, avec ou sans conditions, l’auteur doit soumettre une disquette informatique de 3,5 pouces, contenant le texte, les tableaux, les graphiques et les illustrations. Pour les articles en anglais et en français, à la demande de l’éditeur, le texte devra être fourni en format traitement de texte (de préférence Microsoft Word pour PC, mais la plupart des autres formats peuvent être convertis) et sauvegardé également dans un fichier texte ASCII. Les articles soumis en arabe devraient suivre les mêmes directives que les articles rédigés en anglais ou en français. Si l’article est une traduction, dans son intégralité ou en partie, d’un autre document non publié, une copie de ce document dans la langue d’origine devrait également être soumise. Si possible, les graphiques devraient être fournis en format Harvard Graphics pour Windows ou Excel, et les illustrations et photographies devraient être en format EPS ou TIFF. Toutefois, il est nécessaire de fournir trois jeux des photographies et figures d’origine avec les données de base. Si les photographies comportent un texte ou lettrage, un jeu supplémentaire doit être fourni sans ce texte/lettrage.5. Tous les articles seront revus par des pairs, et sur la base des commentaires du réviseur, le Comité de rédaction se réserve le droit d’accepter ou de rejeter tout article. Les articles sont acceptés sous réserve de la révision dont ils feront l’objet au plan statistique et rédactionnel, comme jugé nécessaire, ce qui peut amener à abréger le texte et supprimer certaines données présentées sous forme de tableaux ou de graphiques.6. Le titre de l’article devrait être aussi concis que possible, de préférence 10 mots environ, et devrait être mis sur une page séparée, avec le nom complet de l’auteur (ou des auteurs), l’organisme (ou les organismes) d’appartenance et le diplôme scientifique le plus élevé obtenu. L’adresse pour la cor-respondance, ainsi que toute autre information nécessaire (adresse courriel, télécopie, téléphone) pour contacter l’auteur correspondant devraient être fournies. Le nombre des auteurs ne devrait pas dépasser cinq. Tous les auteurs devraient avoir apporté une contribution matérielle à la conception, à l’analyse ou à la rédaction de l’étude et avoir approuvé la version finale soumise. Une vérification de cette contribution peut être demandée aux auteurs. Les noms d’autres personnes peuvent être inclus dans les remerciements.
494 La Revue de Santé de la Méditerranée orientale, Vol. 14, No 2, 2008
املجلة الصحية لشرق املتوسط، منظمة الصحة العاملية، املجلد الرابع عشر، العدد ٢، ٢٠٠٨
7. Afin de faciliter la traduction des résumés et du nom des auteurs, les auteurs dont la langue maternelle s’écrit en caractères arabes et qui rédigent en anglais ou en français doivent fournir leur nom complet en écriture arabe ainsi qu’une transcription.8. Les articles présentant des résultats de recherche originale devront suivre le format IMRAD : introduction, matériel (sujets) et méthodes ; résultats ; analyse ; et discussion. Un résumé de 100 mots maximum sera fourni, mentionnant clairement les objectifs, le contexte, les résultats et les conclusions.9. Les auteurs devront vérifier, le cas échéant, que toutes les personnes sur lesquelles la recherche porte ont donné leur consentement éclairé, et lorsque des participants (vivants ou décédés) n’ont pas pu donner ce consentement, qu’un consentement de substitution a été obtenu.10. Les articles d’analyse devront comporter des sections portant sur les objectifs, les sources, les méthodes de sélection, la compilation et l’interprétation des données et des conclusions.11. Les citations dans le texte de travaux publiés devraient être limitées aux références essentielles récentes. Hormis les articles d’analyse, il est conseillé de ne pas dépasser 25 références. Elles devraient être numérotées en chiffres arabes placés entre parenthèses [crochets] selon l’ordre dans lequel elles apparaissent dans le texte. Ces références devraient figurer sous forme de liste numérotée sur une page séparée à la fin de l’article. Elles devraient contenir les éléments d’information suivants, selon le cas : nom(s) et initiale(s) de l’auteur/des auteurs ; titre de l’article ou de l’ouvrage dans sa langue originale ainsi que la traduction ; nom complet de la revue ainsi que le numéro du volume et les pages concernées ; nom de la maison d’édition (commerciale ou institutionnelle) et lieu de publication (ville et pays) ; et date de la publication. Les articles comportant des références inadéquates ou dont les références ne sont pas organisées conformément à ces principes seront renvoyés aux auteurs pour correction. Exemples du style préféré de La Revue :Livre : Al Hamza B, Smith A. The fifth sign of identity. Cairo, American University Press, 1990.Article de Revue : Jones A et al. One day in Tibet. Journal of tautology, 1993, 13(5):23–7.Document : Al-Itneen M, ed. The principles of uncertainty. Geneva, World Health Organization, 1985 (document WHO/DOC/537).12. Les figures et les tableaux avec les légendes appropriées devraient être placés chacun(e) sur une feuille séparée, numérotés en chiffres arabes selon l’ordre et joints à la fin du document. Chaque figure et chaque tableau devraient avoir une référence dans le texte et son emplacement dans le texte devrait être indiqué clairement le cas échéant. Au besoin, les sources devraient être mentionnées pour chaque figure ou tableau. Si des figures, tableaux ou d’autres matériels ont été copiés d’autres sources, les auteurs portent l’entière responsabilité d’obtenir l’autorisation nécessaire. Afin d’éviter les problèmes de mise en page lors de la production finale, le nombre de tableaux et figures devrait être limité autant que possible. Il est préférable de ne pas avoir plus d’un tableau ou d’une figure pour 1000 mots. Les figures établies à partir de données doivent être accompagnées de ces données pour permettre une recomposition, le cas échéant.13. Les articles originaux et les disquettes ne seront pas renvoyés sauf si l’auteur principal en fait la demande.14. Lors de la publication, les auteurs recevront chacun un exemplaire du numéro dans lequel l’article paraît et l’auteur principal recevra 50 tirés à part. Les demandes de tirés à part supplémentaires et les informations sur le prix peuvent être obtenues auprès du Rédacteur en chef.

Eastern Mediterranean Health Journal, Vol. 14, No. 2, 2008 495
املجلة الصحية لشرق املتوسط، منظمة الصحة العاملية، املجلد الرابع عشر، العدد ٢، ٢٠٠٨
WHO sales and discount policy
Objective
Within the financial obligations of the pub lish ing and distribution process, prices of WHO pub li -ca tions are kept as low as pos si ble in order to maximize their dissemination and reach read ers for whom they are intended.
The price and discount policies for WHO/EMRO and WHO/HQ publications are as fol lows:
Price and discount policy for WHO/EMRO publications
• EMRO publications are priced in US dol lars.
• Sales agents receive a 40% discount and 30 days credit. Credit limit is US$ 500.00.
• Bulk orders of individual books, i.e. 1000 copies per title, qualify the agent for a 50% dis-count instead of a 40% dis count; how ev er, pay ment of total value must be made before dispatch of pub li ca tions is effected.
• Dispatch charges are calculated at 25% of cover prices.
• Present delivery time average is two weeks from date of receipt of firm order.
Price and discount policy for WHO/HQ publications
• WHO/HQ publications and sub scrip tions are priced in Swiss francs. Clients in de vel op ing coun tries are eligible for a spe cial tar iff which in all cases is 30% less than the Swiss francs regular prices.
• Sales agents receive a 40% discount for book or ders and 20% for subscription orders. Cred it limit is Swiss francs 1000.00.
• Bulk or ders qualify the agents for a spe cial higher dis count, provided the dispatch of the whole or der is done to the same consignee. In this case, a proforma invoice will be issued by WHO/HQ, and the order will be dis patched only upon receipt of payment. No re turn of books or periodicals will be accepted.
• Payment of invoices may be made in US dol lars at the official rate of exchange at the date of payment.
• Present delivery time av er age is four weeks from date of receipt of orders.
A WHO/EMRO Publications Price List is available on request.

ISSN 1020-3397
© WORLD HEALTH ORGANIZATION, 2008Publications of the World Health Organization enjoy copyright protection in accordance with the pro visions
of Protocol 2 of the Universal Copyright Convention. All rights reserved.The designations employed and the presentation of the material in this publication do not imply the ex-
pression of any opinion whatsoever on the part of the Secretariat of the World Health Organization con cerning the legal status of any country, territory, city or area or of its authorities, or concerning the de limi tations of its frontiers or boundaries.
The mention of specific companies or of certain manufacturers’ products does not imply that they are endorsed or recommended by the World Health Organization in preference to others of a similar nature that are not men tioned.
The authors alone are responsible for the views expressed, which do not necessarily reflect the opin ion of the World Health Organization or of its Member States.
Cover designed by Ahmed HassaneinPrinted on acid-free paper
Printed by League of Arab States Printshop
EASTERN MEDITERRANEAN HEALTH JOURNALIS the official health journal published by the Eastern Mediterranean Re gional Office of the World Health Organization. It is a forum for the presentation and promotion of new policies and initiatives in health services; and for the exchange of ideas, concepts, epidemiological data, re search findings and other in for mation, with special reference to the Eastern Mediterranean Region. It addresses all members of the health pro fession, medical and other health educational in sti tutes, interested NGOs, WHO Collabo rating Centres and individuals within and outside the Region.
LA REVUE DE SANTÉ DE LA MÉDITERRANÉE ORIENTALEEST une revue de santé officielle publiée par le Bureau régional de l’Organisation mondiale de la Santé pour la Méditerranée orientale. Elle offre une tribune pour la présentation et la promotion de nouvelles politiques et ini tiatives dans le domaine des ser vices de santé ainsi qu’à l’échange d’idées, de concepts, de données épidémiologiques, de résultats de recherches et d’autres informations, se rapportant plus particulièrement à la Région de la Méditerranée orientale. Elle s’adresse à tous les professionnels de la santé, aux membres des instituts médicaux et autres instituts de formation médico-sanitaire, aux ONG, Centres collaborateurs de l’OMS et personnes concernés au sein et hors de la Région.
The Eastern Mediterranean Health Journal is abstracted/indexed in the Index Medicus and MEDLINE (Medical Litera-ture Analy sis and Retrieval Systems on Line) and the ExtraMed-Full text on CD-ROM, the Cu mu lative Index to Nursing and Allied Health Lit era ture (CINAHL), CAB International, Lexis Nexis™, Scopus and the Index Medicus for the WHO Eastern Medi terra nean Region (IMEMR).EMHJ is also available on the World Wide Web: http://www/emro.who.int/emhj.htm
ALL ARTICLES ARE PEER REVIEWED
COVER: Remote sensing image of the area of the world that includes the Eastern Mediterranean Region. Cover image pro duced by the Canada Centre for Remote Sensing, Ottawa, Canada. (NOAA AVHRR Com pos ite) Re pro duced with permission

Member States of the World Health OrganizationEastern Mediterranean Regional Committee
Afghanistan Bahrain Djibouti Egypt Islamic Republic of Iran Iraq Jordan Kuwait Lebanon Libyan Arab Jamahiriya Morocco
Oman Pakistan Palestine Qatar Saudi Arabia Somalia SudanSyrian Arab Republic Tunisia United Arab Emirates Republic of Yemen
États Membres du Comité régional de la Méditerranée orientalede l’Organisation mondiale de la Santé
Afghanistan Arabie saoudite Bahreïn Djibouti ÉgypteÉmirats arabes unis République islamique d’Iran Iraq
Jamahiriya arabe libyenne Jordanie Koweït Liban MarocOman Pakistan Palestine Qatar République arabe syrienne Somalie
Soudan Tunisie République du Yémen
Correspondence
Editor-in-chiefWHO Eastern Mediterranean Regional Office
P.O. Box 7608 Tel: (202) 2670 2535 Fax: (202) 2670 2492Nasr City, Cairo 11371 email: [email protected] (202) 2670 2494Arab Republic of Egypt [email protected]
Subscription details
Individual copies: US$ 15.00
Annual subscription: US$ 60.00
There is a 50% discount for orders from developing countries
Prices include cost of dispatch
البلدان أعضاء اللجنة اإلقليمية لشرق املتوسط يف منظمة الصحة العاملية األردن أفغانستان اإلمارات العربية املتحدة باكستان البحرين تونس
اجلماهريية العربية الليبية مجهورية إيران اإلسالمية اجلمهورية العربية السورية اجلمهورية اليمنية جيبويت السودان الصومال العراق عمان فلسطني قطر
الكويت لبنان مصر املغرب اململكة العربية السعودية