Drivers of deforestation and forest degradation in areas surrounding Mkata village, Kilosa District,...
28
SOKOINEUNIVERSITY OF AGRICULTURE FACULTY OF FORESTRY AND NATURE CONSERVATION DEPARTMENT OF FOREST MENSURATION AND MANAGEMENT SPECIAL PROJECT REPORT Drivers of deforestation and forest degradation in areas surrounding Mkata village, Kilosa District, Tanzania. Student Name: MfilingeShadrack Reg. Number: FOR/D/11/T/0010 Supervisor: Prof. Luoga E.J. A SPECIAL PROJECT REPORT SUBMITTED IN PARTIAL FULFILMENT OF THE REQUIREMENT FOR DEGREE OF BSC.FORESTRY OF SOKOINE UNIVERSITY OF AGRICULTURE June 2014
-
Upload
independent -
Category
Documents
-
view
3 -
download
0
Transcript of Drivers of deforestation and forest degradation in areas surrounding Mkata village, Kilosa District,...
SOKOINEUNIVERSITY OF AGRICULTURE
FACULTY OF FORESTRY AND NATURE CONSERVATION
DEPARTMENT OF FOREST MENSURATION AND MANAGEMENT
SPECIAL PROJECT REPORT
Drivers of deforestation and forest degradation in areas surrounding Mkata village, Kilosa
District, Tanzania.
Student Name: MfilingeShadrack
Reg. Number: FOR/D/11/T/0010
Supervisor: Prof. Luoga E.J.
A SPECIAL PROJECT REPORT SUBMITTED IN PARTIAL FULFILMENT OF THE
REQUIREMENT FOR DEGREE OF BSC.FORESTRY OF SOKOINE UNIVERSITY OF
AGRICULTURE
June 2014
ABSTRACT
The study was carried out to identify the key drivers of deforestation and forest degradation as
well as to determine the extent of deforestation in Mkata village, Kilosa, Morogoro, Tanzania.
Data were collected by questionnaires to draw out the information from the selected village
leaders, and representative of household
The Statistical Package for Social Sciences (SPSS) was the main tool for quantitative data
analysis. Formal data analyses were preceded by cleaning up of the data and coding that
facilitated further analysis. Descriptive statistical analysis using frequency counts and
percentages was used to describe the socio economic characteristics of respondents for 4 sub-
villages selected based on the village register. Qualitative data were analyzed using content and
structural functional analytical techniques in which components of verbal discussions from
different respondents were broken down into the smallest meaningful units of information,
values and attitudes of respondents. This helped me in finding out the values and attitudes of the
respondents after analysis.
Results revealed that there is high extent of deforestation in Mkata village which is attributed to
poverty of local people. to the latter exert great pressure to the forest by engaging in activities
that accelerate the deforestation and forest degradation. Those activities include charcoal
making, collection of firewood for domestic consumption as the main source of energy, cutting
poles for house building and in the minimum level the timber harvesting and agriculture. Animal
grazing within the forest was also identified to contribute in forest degradation, together with
minimum occurrences of fire events.

ACKNOWLEDGEMENT
Firstly, I would like to thank to the Almighty God for his security and healthy provision for the
whole duration of my studies at SUA.I also would like express my heartfelt thanks to my
supervisor Prof. E.J. Luoga for his guidance, constructive criticism and tireless efforts
throughout the course of this study. Grateful acknowledgement is extended to the staffs of the
department of Forest Mensuration and Management; Prof. Kajembe, Prof. Malimbwi, Prof.
Kashaigili, Dr. Nzunda, Dr. Zahabu, Dr. Mbeyale, and Dr. Katani for their comments and advice
during the proposal of this study.
Special thanks and profound appreciation should go to the Higher Education Students Loan
Board (HESLB) for the financial support without which my studies at SUA would have been
impossible. I am also highly indebted to the village chairperman (Prisca Cosmas) andthe sub-
villages named as Innocent Sisty, Juma Mpwani, Calory Joseph and Amos Selemani who spared
their valuable time to work tirelessly with me during the whole period of data collection.
My special thanks are also due to my parents, particularly my late mother Tobietha Kindole and
my father Atilio J. Mfilinge who built the foundation stones for my education. I also would like
extend my thankfulness to my lovely wife Rosemary M. Kapama and our beloved sons Joseph S.
Mfilinge, Marcel S. Mfilinge and John S. Mfilinge for their constant tolerances, prayers,
encouragement and support during my studying at SUA.I also would like to extend my
appreciation to my friend Joseph Makero and his family for their moral support and care during
my field practical periods in Arusha (SUATF) as well his academic advice and directives for the
whole period of my study at SUA.
I wish also to express my special thanks to my colleagues Bsc.Forestry students few of them to
mention, Masalu Gaston, Thadeo Elias, Nkonomagaka Oscar, Mgaluli Hamad, Balele Fabian and
Mtashaga Jovanes for their cooperation and friendly company. For those whom I have not
mentioned but have been helpful, I say thank you very much.”NYONGISYE”.
DEDICATION
I dedicate this work to my lovely wife Rosemary M. Kapama, our beloved sons Joseph S.
Mfilinge, Marcel S. Mfilinge and John S. Mfilinge, my brother Fadhili M. Mfilinge and my
young-brother Astipe A. Kibuga for their encouragement, prayers, love, patience and support
they provided to me during the whole period of my studies.
COPYRIGHT
No part of this report may be reproduced, stored in any retrieval system or transmitted by any
means without prior written permission of the author Mfilinge Shadrack or the Sokoine
University of Agriculture Morogoro, Tanzania on behalf of the author.
DECLARATION
I Mfilinge Shadrack hereby declarethat this report has been written by me as a result of my
studies on Drivers of deforestation and forest degradation in areas surrounding Mkata village,
Kilosa District, Tanzania.
Name of the student:Mfilinge Shadrack
Signature:………………………………
Date: ……………………………………
The above declaration is confirmed by:
Name of Supervisor: Prof. E.J. Luoga
Signature:
Date: 22/06/2014…………………………………
Ag. Head of Department:Dr. Katani
Signature:…………………………..
Date:………………………………...
Dean of Faculty:Prof. Ngaga Y.M
Signature:………………………….
Date:……………………………….
Contents
ABSTRACT .................................................................................................................................... 1
ACKNOWLEDGEMENT .............................................................................................................. 2
DEDICATION ................................................................................................................................ 3
CHAPTER ONE ............................................................................................................................. 4
1.0 INTRODUCTION .................................................................................................................... 6
1.1 Background information ........................................................................................................... 6
1.2 Problem statement and justification .......................................................................................... 7
4.3 Objectives ................................................................................................................................. 8
4.3.1 General objective ................................................................................................................... 8
4.3.2 Specific objectives ................................................................................................................. 8
4.4 Research questions .................................................................................................................... 8
CHAPTER TWO ............................................................................................................................ 9
2.0 LITERATURE REVIEW ......................................................................................................... 9
2.1 Overview ................................................................................................................................... 9
2.1.1 Agriculture ........................................................................................................................... 10
1.1.2 Expansion of infrastructure .................................................................................................. 11
1.1.3 Wood extractions ................................................................................................................. 12
CHAPTER THREE ...................................................................................................................... 13
3.0 MATERIAL AND METHODS .............................................................................................. 13
3.1 Description of the study area .................................................................................................. 13
3.1.1 Location and boundaries ...................................................................................................... 13
3.1.2 Climatic conditions .............................................................................................................. 13
3.1.3 Population and ethnics ......................................................................................................... 13
3.1.4 Common crops grown .......................................................................................................... 13
3.1.5 Vegetation cover .................................................................................................................. 14
3.2.0 Method of data collection .................................................................................................... 14
3.2.1 Sampling techniques ............................................................................................................ 14
3.2.2.0 Data collection .................................................................................................................. 14
3.2.2.1 Primary data ...................................................................................................................... 14
3.2.2.2 Secondary data .................................................................................................................. 14
3.3.0 Data analysis ........................................................................................................................ 15
CHAPTER FOUR ......................................................................................................................... 15
4.0 RESULTS AND DISCUSSION ............................................................................................. 15
4.1 Socio-economic characteristics of the respondents ................................................................ 15
4.1.1 Sex distribution .................................................................................................................... 15
Table 1: Sex of respondents in Mkata Village .............................................................................. 15
4.1.2 Age of respondents .............................................................................................................. 15
Table 2: Age of respondents in Mkata Village ............................................................................. 16
4.1.3 Educational level .................................................................................................................. 16
Table 3: Education level of respondents in Mkata Village ........................................................... 16
4.4 Economic activities ................................................................................................................. 17
Table 4: Economic activities of respondents in Mkata Village .................................................... 17
4.5 Key drivers of deforestation and forest degradation ............................................................... 17
Figure 1.The key drivers of deforestation and forest degradation ................................................ 18
4.6 Extent of deforestation ............................................................................................................ 19
Figure 2.Extent of deforestation in Mkata village ........................................................................ 19
CHAPTER FIVE .......................................................................................................................... 20
5.0 CONCLUSION and RECOMMENDATION ........................................................................ 20
5.1 Conclusion .............................................................................................................................. 20
5.2 Recommendations ................................................................................................................... 21
REFERRENCES: .......................................................................................................................... 22
CHECKLIST FOR KEY INFORMANTS ................................................................................... 24
A. Households general information. ............................................................................................. 25
B: Awareness of community in deforestation .............................................................................. 26
C: Benefits from the forests .......................................................................................................... 26
CHAPTER ONE
1.0 INTRODUCTION
1.1 Background information Deforestation has recently become a major concern for many countries in the world. It is one of
the most pressing land use problems. Deforestation is occurring around the world on a scale
never known before. More than 30% of the world's forest is believed to have been deforested
(Litvinoff, 1990). By the early 1990s, almost 40% of the earth's land surface had been converted
into cropland and permanent pasture (WRI, 1996).
Deforestation is caused by multiple drivers and pressures, including conversion of land for
agricultural uses, infrastructure development, wood extraction for industries and domestic uses
(Geist and Lambin, 2002; Angelsen and Kaimowitz, 1999; Schaeffer et al., 2005; Fearnside,
2006). Forest loss is also caused by biofuels purposes and minerals exploration caused by many
factors but, according to the latest analyses (UCS, 2011). Countries responsible for this
international demand need to take steps to reduce those pressures in conjunction with efforts by
forested countries to reduce domestic drivers of deforestation and forest degradation (CAN
2011).
The overall net loss in the period between 2000 and 2005 was about 7.3 million hectares forest
area per year (equivalent to 0.18% of forest cover) versus a net loss of 8.9 million hectares
(equivalent to 0.22% of forest cover) per year in the period from 1990 to 2000 (Rademaekers et
al., 2010).
Tanzania, like many African countries has been experiencing rapid rates of deforestation.
However, estimates of the magnitude and rate of deforestation have varied widely, for example,
MTNRE, (1989a), estimates that Tanzania has been losing between 300,000 and 400,000 ha of
forest per annum. WRI, (1990) and World Bank, (1992) estimates give an average annual rate of
130,000 ha or 0.3%. Ahlback (1988), on the other hand, believes that the annual rate of
deforestation has already exceeded 700,000 ha. But, according to MNRT (2001), the forest cover
in Tanzania has decreased from 44 million ha in 1961 to 33.5 million ha in 1998. This decrease
account annual loss of 0.73%. Such differences of data have made it difficult to examine the
magnitude of the problem and to come up with strategies aimed at minimizing it and dealing
with its impacts.
Deforestation in Tanzania is widely spread, for example, in Kilosa particularly in Rubeho
Mountain range, 82% of the total loss of forest happened before 1955, with a further 10.3%
between 1975 and 2000 (Hall, Burgess et al., 2009 in Kajembe et al., 2012). The two major
forces of deforestation within Kilosa district are forest clearing for agriculture, plantations???,
extraction of biomass for energy consumption and increasing urbanization due to population
growth (Hall et al., 2009, in Kajembe et al., 2012). In addition, timber production and bushfires
are also seen as other significant causes of deforestation (Kajembe et al., 2012).
1.2 Problem statement and justification
It was observed that, among the challenges facing Kilosa District is rate of deforestation being
experienced in many parts of the district. Many communities in Kilosa district do clear forest
land for agriculture, firewood, charcoal production, poles and lumbering purposes. Forest fire is
also a big problem in Kilosa, it occurs every year and causing great destruction in the forests
ecosystem. The outbreak of forest fire in Kilosa is caused by hunters, farmers, livestock keepers,
honey gatherers, timber sawyers (Kibuga and Samweli, 2010). These conversions of forest land
by different drivers have almost made some of tree species to disappear completely. Despite of
Forest Act of 2002, governing the issue of forestry in Tanzania, there are no by laws in most of
the villages in Tanzania and Kilosa in particular for controlling forest activities. This gap
accelerates the rate of people to clear the forests (Kibuga and Samweli, 2010). Some effort has
been taken by the Government of United Republic of Tanzania and some Non Government
Organization like TFCG and MJUMITA to slow down deforestation rate in Kilosa district, by
rising awareness on communities on forest management activities and supporting some villages
with forest protective gears and assist them to make land use plan and by laws.
Despite of these effort made by Government and NGOs to rectify the impact of deforestation in
Kilosa district, more information on drivers of deforestation and their extent is still needed from
each site. This will assist to understand and solve them based on how they cause deforestation.
This study aimed to fill up the present information gap on drivers of deforestation and
degradation and their magnitude. The results of this study will be potential for researchers as the
basis for further studies on drivers of D and D, policy makers and local communities to take the
appropriate measures in reducing deforestation.
4.3 Objectives
4.3.1 General objective
To assess the drivers of deforestation and forest degradation in Mkata village.
4.3.2 Specific objectives
1. To identify the key drivers of deforestation and forest degradation.
2. To determine the extent of deforestation.
4.4 Research questions
(1) What are the key drivers of deforestation and forest degradation in Mkata village?
(2) What is the extent of deforestation?
CHAPTER TWO
2.0 LITERATURE REVIEW
2.1 Overview
Drivers of deforestation are all human activities that support their daily livelihoods and their
underlying factors that may thus accelerate the deforestation. These drivers are of two types’
namely proximate or direct drivers and underlying or indirect drivers. The direct drivers may
further be categorized into primary drivers and the secondary drivers.
Proximate or direct drivers of deforestation are human activities that directly affect the loss of
forests and thus constitute proximate sources of change, that result from complex interactions of
underlying forces in social, political, economic, technological and cultural domains (Geist and
Lambin, 2001).
Direct drivers can be grouped into different categories such as agriculture expansion, expansion
of infrastructure and wood extraction (Geist and Lambin, 2001). Although agricultural expansion
has been determined as the key driver of deforestation in the tropics (Gibbs et al., 2010), drivers
vary regionally and change over time (Rudel et al., 2009, Boucher et al., 2011).
Underlying driving forces are seen to be fundamental forces that underpin the more obvious or
proximate causes of tropical deforestation. They can be seen as a complex of social, political,
economic, technological and cultural variables that constitute initial conditions in the human-
environmental relations that are structural in nature (Geist and Lambin, 2001).
Deforestation is caused by multiple drivers and pressures, including conversion for agricultural
uses, infrastructure development, wood extraction (Geist and Lambin, 2002, Angelsen and
Kaimowitz, 1999; Schaeffer et al., 2005; Fearnside, 2006), agricultural product prices, and a
complex set of additional institutional and location-specific factors (UNFCCC, 2006), which can
be extremely important in certain localities. Most importantly, the specific characteristics and
magnitude of the socioeconomic drivers behind deforestation vary widely across continents,
regions and countries (Rademaekers et al., 2010).
Since the 1980s, numerous attempts have been made to explain the causative pattern of tropical
deforestation (e.g., Tucker and Richards, 1983;Allen and Barnes, 1985; Walker, 1987; Richards
and Tucker, 1988; Rudel, 1989; Burns et al., 1994; Williams, 1990, 1994; Kimsey, 1991; Stern,
Young and Druckman, 1992; Amelung and Diehl, 1992; Brown and Pearce, 1994; Bilsborrow,
1994; Krutilla et al., 1994; Lambin, 1994, 1997; Capistrano and Kiker, 1995; Painter and
Durham, 1995; Bernard and Koninck, 1996; Sponsel et al., 1996; Bawa and Dayanandan, 1997,
1998; Rudel and Roper, 1996, 1997; Kant and Redantz, 1997; Murali and Hedge, 1997;
Amsberg,1998; Ehrhardt-Martinez, 1998; Kaimowitz and Angelsen, 1998; Mather et al., 1998;
Palo and Uusivuori, 1999; Wibowo and Byron, 1999; Angelsen and Kaimowitz, 1999; Wunder,
2000; Mather and Needle, 2000). Theories have produced rich arguments, especially coming
from the neoclassical, impoverishment and political ecology schools of thinking, but empirical
evidence continues to suffer from cross-national statistical analyses, in some cases linked to
debatable rates of forest cover change (Geist and Lambin, 2001).
2.1.1 Agriculture
Agriculture is the main driver of deforestation, but with differences in geographic distribution of
the importance of commercial versus subsistence agriculture (Hosonuma et al., 2012).
Agriculture is estimated to be the proximate driver for around 80% of deforestation worldwide
(Kissinger et al., 2012).
Commercial agriculture is the most important driver in Latin America 68%, while in Africa and
Asia it contributes to around 35% of deforestation (Hosonuma et al., 2012). Much of the forest
conversion and emissions from land use in Latin America over the last few decades has been due
to the expansion of large-scale crop and pastureland (Houghton, 2010). Much of the forest
conversion across tropical Asia was driven by large-scale agricultural and timber plantations
(Doug et al., 2011). Unlike Asia and Latin America, African deforestation remains dominated by
small-scale processes, not by large-scale globalized agriculture (De Fries et al., 2010; Fisher,
2010). Local and subsistence agriculture is quite equally distributed among the continents 27% to
40% which makes sense since this type of land use change remains widespread in all areas in the
tropics and sub-tropics.
In recent decades, commercial agriculture, supplying urbanizing populations and global
commodity markets, has overtaken small-scale agricultural production to become the leading
cause of agricultural expansion and of deforestation emissions in the tropics (De Fries et al.,
2010; Rudel et al., 2009).
In some cases it is believed that the effect of farming systems especially shifting cultivation has
remarkable effects on tree species diversity in tropical forests (Shaba, 1993; Luoga et al., 2000;
Darlong, 2002). This is probably due to the fact that farming involves clearing of forest cover,
continuous seedling removal and depletion of soil nutrients (Silayo et al., 2006). Pastoralism and
farming are practiced in various places in Tanzania such as Kilosa. However the influence of
these practices to the forest tree resources at a local scale is not well captured/understood (Luoga
et al., 2009).
1.1.2 Expansion of infrastructure
Expanding cities and towns require land to establish the infrastructures necessary to support
growing population which is done by clearing the forests (Mather, 1991; Sands, 2005). Tropical
forests are a major target of infra-structure developments for oil exploitation, logging
concessions or hydropower dam construction which inevitably conveys the expansion of the road
network and the construction of roads in pristine areas (Kaimowitz and Angelsen, 1998). The
construction of roads, railways, bridges and airports opens up the land to development and brings
increasing numbers of people to the forest frontier (Geist and Lambin, 2001).
Transport infrastructure is one of the most robust predictors of tropical deforestation. Many
studies have shown a positive correlation between road infrastructure development and
deforestation in the various tropical forest blocks. Roads accelerate forest fragmentation and
reduce forest regrowth.
The creation of transportation infrastructure such as, roads and railways might have both direct
and indirect impacts on forests. Direct impacts are usually limited and only encompass a strip of
a few meters on each side of the transport line (a security lane that needs to be deforested) and
indirect impacts closely correlate with population density.
In the case of the southern Cameroon, where population density is low, Mertens and Lambin,
(1997) showed that 80% of total deforestation occurs within a distance of less than 2 kilometers
of roads; beyond a distance of 7.5 kilometers, deforestation ceases. Currently in Kilosa District,
there is project of road construction from Dumila to Mikumi that is expected to be used as the
highway instead of Iringa road, this project might already been accelerated forest fragmentation
as well as reduces the forest regrowth in some villages and no study have been carried out to
quantify its impacts to the forest cover in areas it passes.
1.1.3 Wood extractions
About 90% of the people in developing countries depend upon wood or charcoal as their main
source of household fuel (Grainger, 1990). Firewood and charcoal accounts for 92% of the
primary energy consumed (Monela et al., 1999: Kaale, 1998). It has been argued that poverty in
rural communities and the increasing demand for cooking energy for the growing urban
population has contributed to the thriving of charcoal production activities often linked to
environmental degradation (Uisso and Balama, 2006). High prices for alternative cooking
energy, like kerosene, electricity, and gas, have also contributed to high demand for charcoal in
urban areas-a cheaper source of energy (Uisso and Balama, 2006).
The extraction of wood or timber in combination with other proximate causes and factors is
reported to lead to deforestation in 102 out of 152 cases (67%). Commercial wood extraction, be
it clear-cutting or selective timber logging, occurs in more than half of all cases (52%), while the
impact of fuel wood extraction (28%), pole wood extraction (20%), and charcoal production
(10%) tend to be lower (Geist and Lambin, 2001). In Kilosa District, Mkata village in particular,
charcoal production and other wood extractions are being done and the charcoal bags are
arranged along the road the way to Kilosa town but their quantities are not well known.
CHAPTER THREE
3.0 MATERIAL AND METHODS
3.1 Description of the study area
3.1.1 Location and boundaries
This study was conducted in Mkata village, Kilosa district. Mkata village is located around
638′39″S, 3728′30″E in the area of flat lowland of the eastern part of Kilosa district called
Mkata plain. There are seven villages in this area, namely Twatwatwa, Mbwade, Msowero,
Mabwegere, Luhozi, Kiduhi, and Mfilisi, with Twatwatwa village occupying the largest portion
of about 32000ha (Nduwamungu et al., 2004 in Kajembe et al., 2013).Locations near Mkata
sorted by distance in kilometers are Lubungo-19, Melela-20, Mbesegera-21, Masimbu-22,
Kimamba-24, Rudewa-25, Mvumi-27, Kimyezi-27, Mauzi-28, Mongota-29 (Maphill, 2013).
3.1.2 Climatic conditions
Kilosa district where Mkata village lies has the humid lowland ecological climatic zone, 400m-
600m above sea level (SAGCOT, 2013). Kilosa District experiences Bimodal rainfall of average
732mm per year, with long rains between March-May and short rains between Mid - October-
December. The mean annual temperature in Kilosa is about 25C (Kajembe et al., 2013).
3.1.3 Population and ethnics
According to 2012 population and housing census, the population of Kilosa district is 438,175
with the average household size of 4.2. The district has three (3) major ethnic groups namely
Wakagulu in the north, Wasagala in the central zone and Wavidunda in the south. Despite the
presence of such ethnic groups in the district there are also many people of other ethnics like
Wakinga, Wahehe, Wagogo, Wakutu, Arabs, Masai, Barabaig, and Sukuma who’s migrated to
the area over the last decades.
3.1.4 Common crops grown
More than 80% of people in Kilosa district depend on agriculture (KDC, 2010) and with its
varied conditions, ranging from a plateau characterized by seasonally flooded plains, to
mountainous areas with altitudes surpassing 2000 meters, Kilosa District offers a variety of agro-
ecological conditions for farming (Maganga et al., 2007). Various crops are grown in Kilosa
district including maize, rice, cassava, millet, beans and bananas. Apart from those food crops,
the main cash crops grown in Kilosa district are sisal, cotton, wheat, cashew nuts, coconuts,
sugarcane and tobacco. There is a limited use of inputs such as improved seeds, fertilizers and/or
manure, the majority 95% use hand hoes for cultivation (Yanda et al., 1997; KDC, 2010).
3.1.5 Vegetation cover
The vegetation in Kilosa District is characterized by both Mediterranean and tropical types,
depending largely on altitude along the south-north exterior (Kajembe et al., 2013). Typically it
consists of miombo woodland with grass and shrub covering the soils (Misana, 1997;
Benjaminsen et al., 2009; KDC, 2010).
3.2.0 Method of data collection
3.2.1 Sampling techniques
Systematic sampling was employed in selecting four sub-villages Mkata village. A total of 40
households from four sub villages were selected randomly, this make an average of ten
households per sub village. This number of households was attempted because of the constraint
of time and fund allocated.
3.2.2.0 Data collection
3.2.2.1 Primary data
Data was collected by using three techniques; households interview, checklist and focus group
discussion. Questionnaires with both close and open ended (Appendix 3) were used to collect
data from the households. The heads of households was targeted to respond on behalf of the
family members. Checklist (Appendix 4) was also used to obtain data from key informants.
Focus group discussions with village leaders and sub-village leaders in Mkata village were
conducted to supplement the data.
3.2.2.2 Secondary data
Secondary data were obtained from different sources like library, website and other relevant
materials. Such kind of data include; books, reports, journals, papers, libraries and internet
surfing.
3.3.0 Data analysis
Data were coded and analyzed by using computer program; Statistical Package for Social
Sciences (SPSS). The results were presented in form of histogram, frequency, pie charts,
andtables.
CHAPTER FOUR
4.0 RESULTS AND DISCUSSION
4.1 Socio-economic characteristics of the respondents
The socio-economic characteristics in this report include four sections; sex distribution of
respondents, age of respondent, education level and economic activities of the respondents.
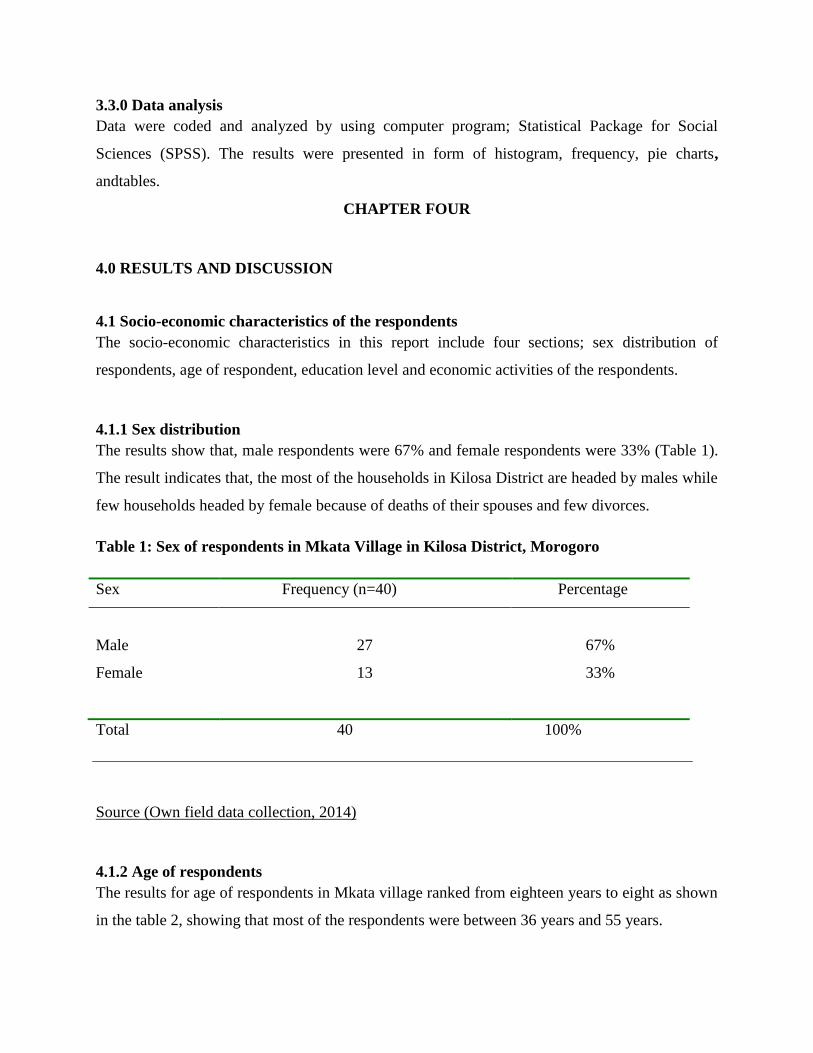
4.1.1 Sex distribution
The results show that, male respondents were 67% and female respondents were 33% (Table 1).
The result indicates that, the most of the households in Kilosa District are headed by males while
few households headed by female because of deaths of their spouses and few divorces.
Table 1: Sex of respondents in Mkata Village in Kilosa District, Morogoro
Sex Frequency (n=40) Percentage
Male 27 67%
Female 13 33%
Total 40 100%
Source (Own field data collection, 2014)
4.1.2 Age of respondents
The results for age of respondents in Mkata village ranked from eighteen years to eight as shown
in the table 2, showing that most of the respondents were between 36 years and 55 years.
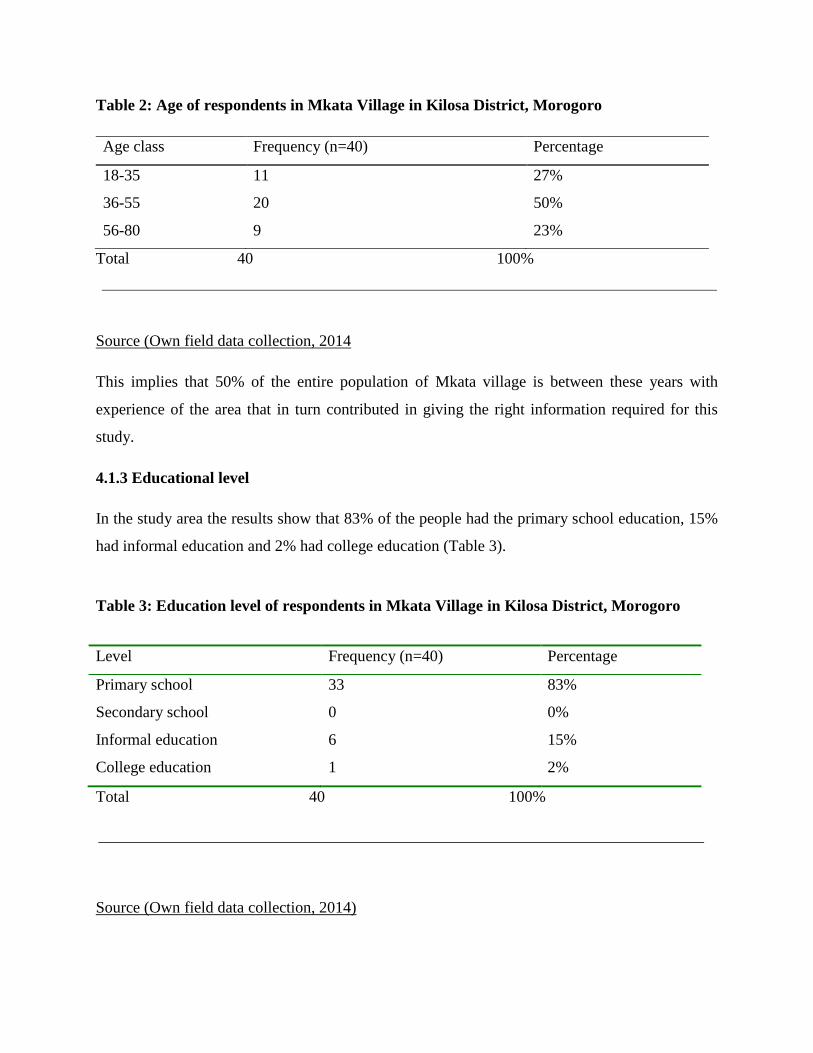
Table 2: Age of respondents in Mkata Village in Kilosa District, Morogoro
Age class Frequency (n=40) Percentage
18-35 11 27%
36-55 20 50%
56-80 9 23%
Total 40 100%
Source (Own field data collection, 2014
This implies that 50% of the entire population of Mkata village is between these years with
experience of the area that in turn contributed in giving the right information required for this
study.
4.1.3 Educational level
In the study area the results show that 83% of the people had the primary school education, 15%
had informal education and 2% had college education (Table 3).
Table 3: Education level of respondents in Mkata Village in Kilosa District, Morogoro
Level Frequency (n=40) Percentage
Primary school 33 83%
Secondary school 0 0%
Informal education 6 15%
College education 1 2%
Total 40 100%
Source (Own field data collection, 2014)
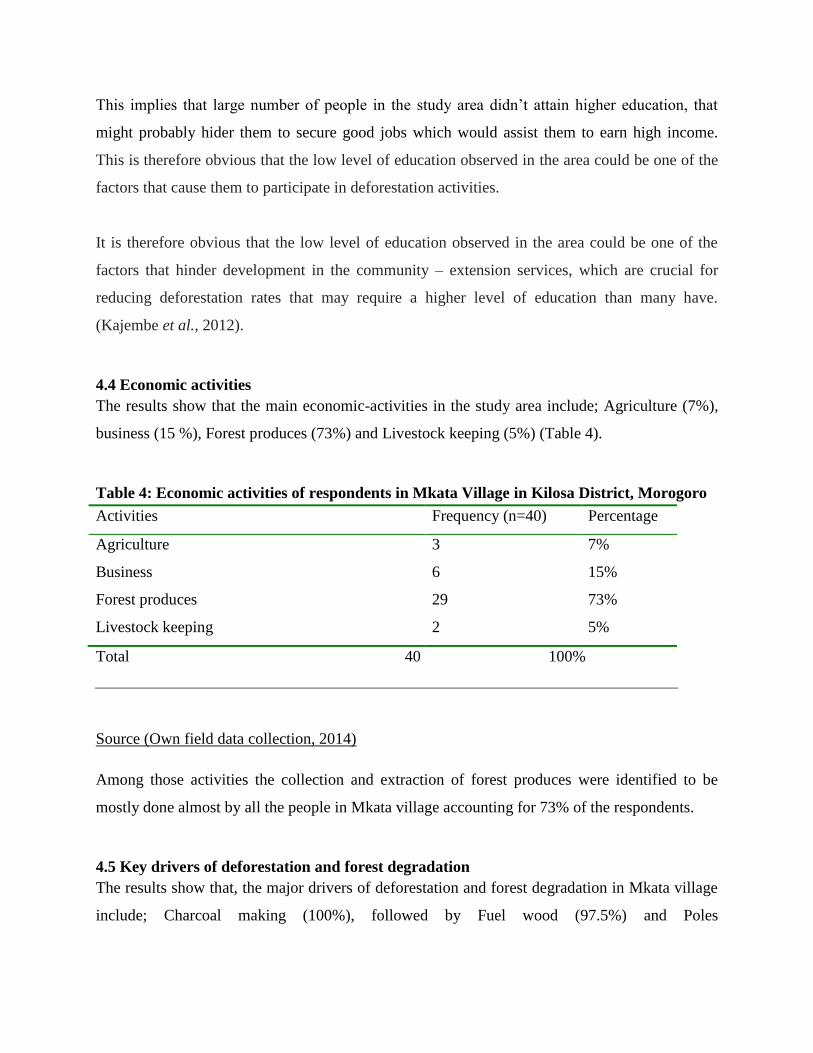
This implies that large number of people in the study area didn’t attain higher education, that
might probably hider them to secure good jobs which would assist them to earn high income.
This is therefore obvious that the low level of education observed in the area could be one of the
factors that cause them to participate in deforestation activities.
It is therefore obvious that the low level of education observed in the area could be one of the
factors that hinder development in the community – extension services, which are crucial for
reducing deforestation rates that may require a higher level of education than many have.
(Kajembe et al., 2012).
4.4 Economic activities The results show that the main economic-activities in the study area include; Agriculture (7%),
business (15 %), Forest produces (73%) and Livestock keeping (5%) (Table 4).
Table 4: Economic activities of respondents in Mkata Village in Kilosa District, Morogoro
Activities Frequency (n=40) Percentage
Agriculture 3 7%
Business 6 15%
Forest produces 29 73%
Livestock keeping 2 5%
Total 40 100%
Source (Own field data collection, 2014)
Among those activities the collection and extraction of forest produces were identified to be
mostly done almost by all the people in Mkata village accounting for 73% of the respondents.
4.5 Key drivers of deforestation and forest degradation
The results show that, the major drivers of deforestation and forest degradation in Mkata village
include; Charcoal making (100%), followed by Fuel wood (97.5%) and Poles
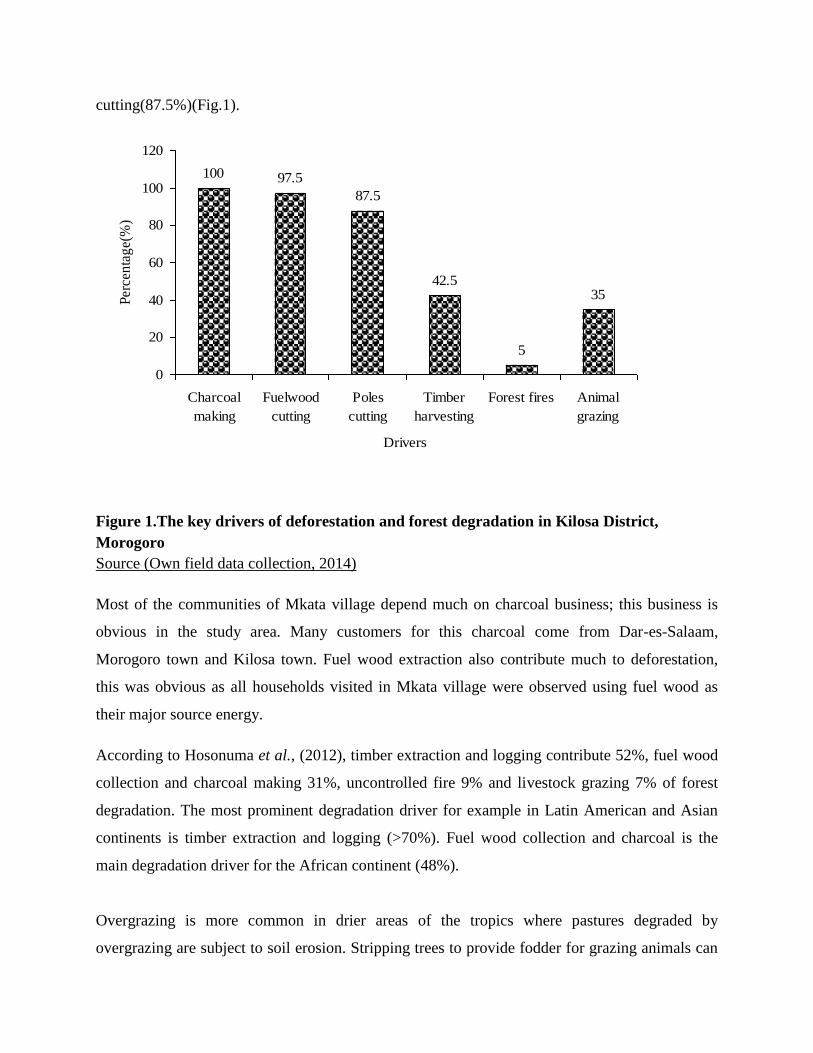
cutting(87.5%)(Fig.1).
100 97.5
87.5
42.5
5
35
0
20
40
60
80
100
120
Charcoal
making
Fuelwood
cutting
Poles
cutting
Timber
harvesting
Forest fires Animal
grazing
Drivers
Per
cen
tag
e(%
)
Figure 1.The key drivers of deforestation and forest degradation in Kilosa District,
Morogoro
Source (Own field data collection, 2014)
Most of the communities of Mkata village depend much on charcoal business; this business is
obvious in the study area. Many customers for this charcoal come from Dar-es-Salaam,
Morogoro town and Kilosa town. Fuel wood extraction also contribute much to deforestation,
this was obvious as all households visited in Mkata village were observed using fuel wood as
their major source energy.
According to Hosonuma et al., (2012), timber extraction and logging contribute 52%, fuel wood
collection and charcoal making 31%, uncontrolled fire 9% and livestock grazing 7% of forest
degradation. The most prominent degradation driver for example in Latin American and Asian
continents is timber extraction and logging (>70%). Fuel wood collection and charcoal is the
main degradation driver for the African continent (48%).
Overgrazing is more common in drier areas of the tropics where pastures degraded by
overgrazing are subject to soil erosion. Stripping trees to provide fodder for grazing animals can
also be a problem in some dry areas of the tropics but is probably not a major cause of
deforestation. Animals remove the vegetation and winds finished the job by blowing away the
top soil, transforming grasslands into desert (Chakravarty et al., 2011).
It should be noted that Kilosa District is known to have frequent and serious conflicts between
farmers and pastoralists due to poor land-use plans, poor institutional structures and insufficient
land resources (e.g. water, pasture) for livestock (Benjaminsen et al., 2009 in Kajembe et al.,
2012).
Forest fire occurrences is minimal by only 5% because of absence of forest grasses now days
attributed much by overgrazing as huge herds of cows are being grazed within forest done by
Masai community.
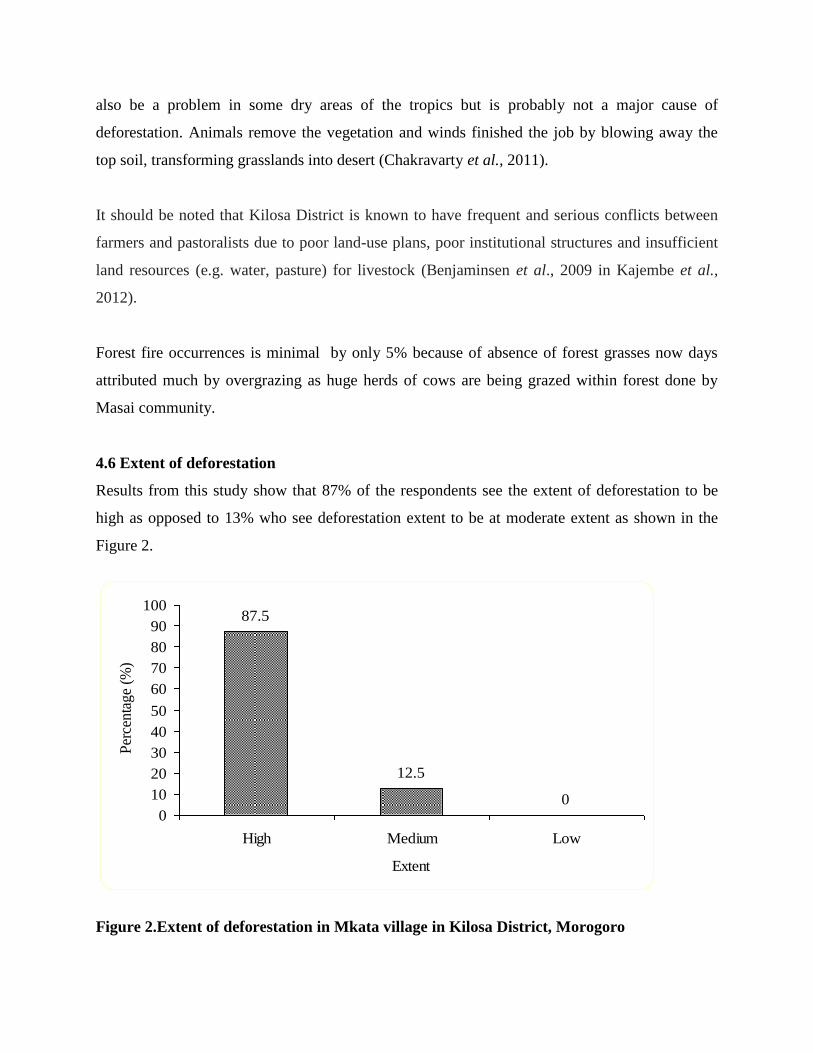
4.6 Extent of deforestation
Results from this study show that 87% of the respondents see the extent of deforestation to be
high as opposed to 13% who see deforestation extent to be at moderate extent as shown in the
Figure 2.
87.5
12.5
00
10
20
30
40
50
60
70
80
90
100
High Medium Low
Extent
Per
centa
ge
(%)
Figure 2.Extent of deforestation in Mkata village in Kilosa District, Morogoro
Source (Own field data collection, 2014)
This extent of deforestation at Mkata village is high due to much dependence to forest produces
as the main source of income and other needs to offset the poverty situation they mostly have.
Most respondents due to their low level of income said openly that their daily activities are
largely done within the forest which most of them accelerate deforestation and forest degradation
as shown on the results of the key drivers of deforestation and forest degradation above (Figure
1).
Deforestation occurred at the rate of 9.2 million hectares per annum from 1980-1990, 16 million
hectares per annum from 1990-2000 and decreased to 13 million hectares per annum from 2000-
2010. The net change in forest area during the last decade was estimated at -5.2 million hectares
per year, the loss area equivalent to the size of Costa Rica or 140 km2 of forest per day was
however lesser than that reported during 1990-2000 which was 8.3 million hectares per year
equivalent to a loss of 0.20% of the remaining forest area each year. The current annual net loss
is 37% lower than that in the 1990s and equals a loss of 0.13% of the remaining forest area each
year during this period (Chakravarty et al., 2011).
CHAPTER FIVE
5.0 CONCLUSION AND RECOMMENDATION
5.1 Conclusion
From the results and discussion it shows the extent of deforestation and forest degradation in
Mkata village is generally at high level due to poverty situation the people of Mkata village have
of which it enforces them to engage in practices that accelerates the deforestation as well as
forest degradation. Such practices include the charcoal making, collection of firewood for fuel
wood as they cannot afford alternative sources of energy and cutting poles for house building.
But also overgrazing, timber harvesting and to a minimum level the agriculture and fire events.
These also lead to extinction of some tree species and loss of healthy and vigour ecosystem used
to be.
5.2 Recommendations
The following recommendations should be done to reduce this high extent of deforestation in
Mkata village:
Provision of special incentives to people of Mkata village so that can be used as a capital
of engaging in other economic activities such as business to reduce the pressure to the
forest.
Extension services should be done to create awareness about the effects of deforestation
and what appropriate measures should be taken to reduce and mitigate the associated
problems.
Tree planting campaigns should be conducted to return the original condition of the
forest.
REDD+ programs and others of the like should include the Mkata village so as to secure
the forest as in some extent will support them with incentives that will cut the poverty
present.
PFM especially CBFM should be established or include the Mkata village as current
there is no PFM in the village which make them much free to engage in deforestation.
REFERRENCES:
[Retrieved from"http://en.wikipedia.org/w/index.php?title=Kilosa_District&oldid=544276305
]Site visited on 27 Dec, 2013.
[www.google.com/maphill], visited on 20 Dec, 2013.
CAN (2011).International submission on how to address drivers of deforestation and forest
degradation. [www.google.com] site visited on 1 Dec, 2013.
Doug Boucher,PipaElias, KathrineLininger,Calen May-Tobin,SarahRoquemore and Earl Saxon
(2011).The Root of the problem, What’s Driving Tropical deforestation today?
FAO (2005).Extent of forest resources.
FBD (2001).NationalForest Programme in Tanzania, 2001-2010.
Forrester-Kibuga, K. and B. Samweli (2010).Analysis of the drivers of deforestation and
stakeholders in the Kilosa project site.
Gabrielle Kissinger,MartinHerold, Veronique De Sy (2012).Drivers of deforestation and forest
degradation.
Geist and Lambin (2001).What Drives Tropical deforestation? A meta-analysis of proximate and
underlying causes of deforestation based on sub national case study evidence
George C. Kajembe, Dos Santos A.Silayo, Adam B.S. Mwakalobo, Khamaldin
Mutabazi(2013).The Kilosa District REDD+ pilot project, Tanzania.
Gibbs H K, Ruesch A S, Achard F, Clayton M K, Holmgren P, Ramankutty N and Foley J A
(2010) Tropical forests were the primary sources of new agricultural land in the 1980s
and1990s.
Huettner M,Leemans.R, Kok K and Ebeling J (2009).A comparison of baseline methodologies
for reducing emissions from deforestation and degradation Carbon Balance Manage.
Kaimowitz, D. and Angelsen, A (1998). Economic models of tropical deforestation. A
review.Center for International Forestry Research, Bogor Indonesia.
KDC (2000).The three-year development plan 2000–2003 for Kilosa District.Kilosa District
Council, Kilosa, Morogoro Tanzania.
Kilosa District Council (2010).Kilosa District Profile. District Council, Kilosa, Morogoro
Tanzania.
KoenRademaekers, Lisa Eichler, Johannes Berg, Michael Obersteiner, RetrHaulik (European
Commission Final report, 2010).Study on evolution of some deforestation drivers and
their potential impacts on the costs of an avoiding deforestation scheme.
Luoga E.J, D. A. Silayo, J. M. Abdallah, R. S. Shemdoe (2009). Tree species diversity under
pastoral and farming systems in Kilosa District, Tanzania
Mather, A.S (1991).Global Forest Resources.International Book Distributors, Dehra Dun.
Noriko Hosonuma, Martin Herold,Veronique De Sy, Ruth S De Fries, Maria Brockhaus,Louis
Verchot, Arild Angelsenand Erika Romijn(2012).An assessment of deforestation and
forestdegradation drivers in developingcountries.
Odegaard et al., 2007.Contested identities and resource conflicts in Morogoro Region, Tanzania
– who is indigenous? In: B. Derman, R. Odgaard and E. Sjaastad, ConflictsOverLand and
Water in Africa. James Currey.
Rude.T.K, De Fries.R, Asner.G.P and Laurance.W.F (2009).Changing drivers of deforestation
and new opportunities for conservation.
SAGCOT (2013).SAGCOT Investment Partnership Program, Mkata Ranch Site profile.
Sands R(2005).Forestry in a Global Context,CABI Publishing.
Shishira, E. K., Yanda P. Z. et al., (1997). Kilosa District: Land Use and Natural Resource
Assessment. Report Prepared for Kilosa District Council/Irish Aid. Institute of Resource
Assessment, Dar es Salaam.
SumitChakravarty, S.K. Ghosh, C.P. Suresh, A.N. Dey and Gopal Shukla(2012).Deforestation,
Causes,Effects and Control Strategies, Global Perspectives on Sustainable Forest
Management.
UNFCCC (2010b).Outcome of the work of the ad hoc working group on long-term cooperative
action under the convention-policyapproaches and positive incentives on issues relating
toreducing emissions from deforestation and forest degradationin developing countries:
and the role of conservation, sustainable management of forests and enhancement of
forest carbon stocks in developing countries UNFCCC COP 16.
UNFCCC(2009a).Methodological guidance for activities relating toreducing emissions from
deforestation and forest degradationand the role of conservation, sustainable management
offorests and enhancement of forest carbon stocks in developingcountries Decision COP
15/4.
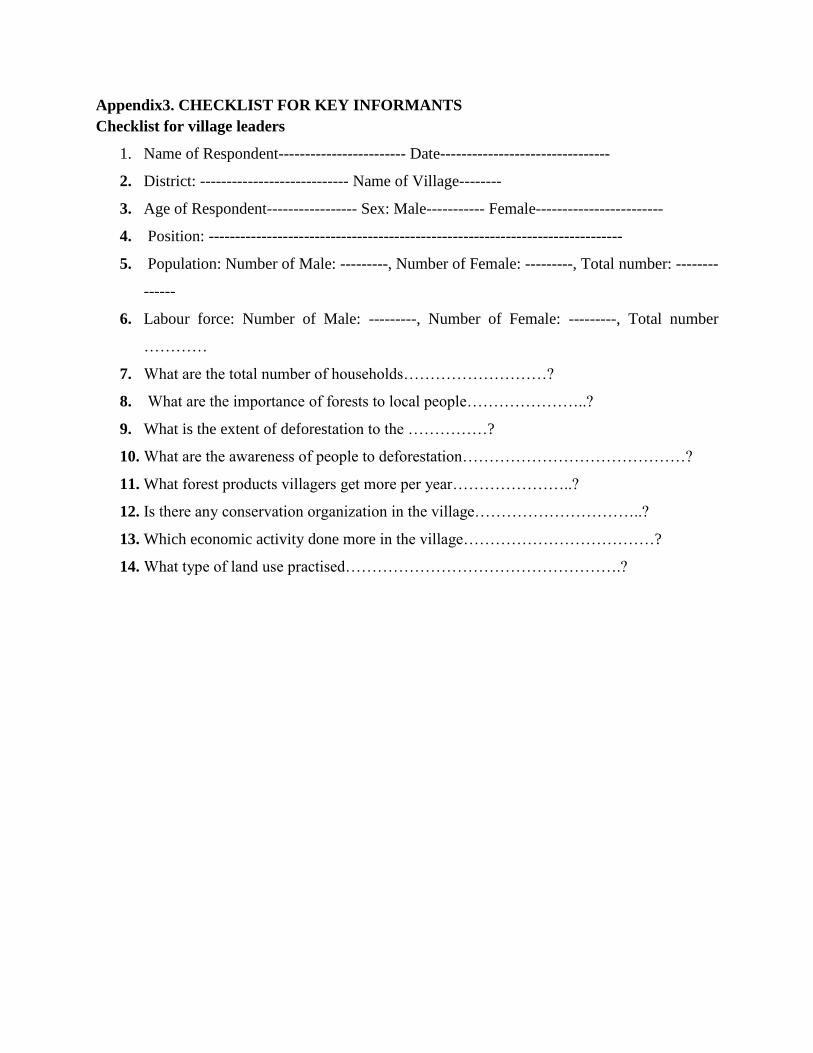
Appendix3. CHECKLIST FOR KEY INFORMANTS
Checklist for village leaders
1. Name of Respondent------------------------ Date--------------------------------
2. District: ---------------------------- Name of Village--------
3. Age of Respondent----------------- Sex: Male----------- Female------------------------
4. Position: ------------------------------------------------------------------------------
5. Population: Number of Male: ---------, Number of Female: ---------, Total number: --------
------
6. Labour force: Number of Male: ---------, Number of Female: ---------, Total number
…………
7. What are the total number of households………………………?
8. What are the importance of forests to local people…………………..?
9. What is the extent of deforestation to the ……………?
10. What are the awareness of people to deforestation……………………………………?
11. What forest products villagers get more per year…………………..?
12. Is there any conservation organization in the village…………………………..?
13. Which economic activity done more in the village………………………………?
14. What type of land use practised…………………………………………….?
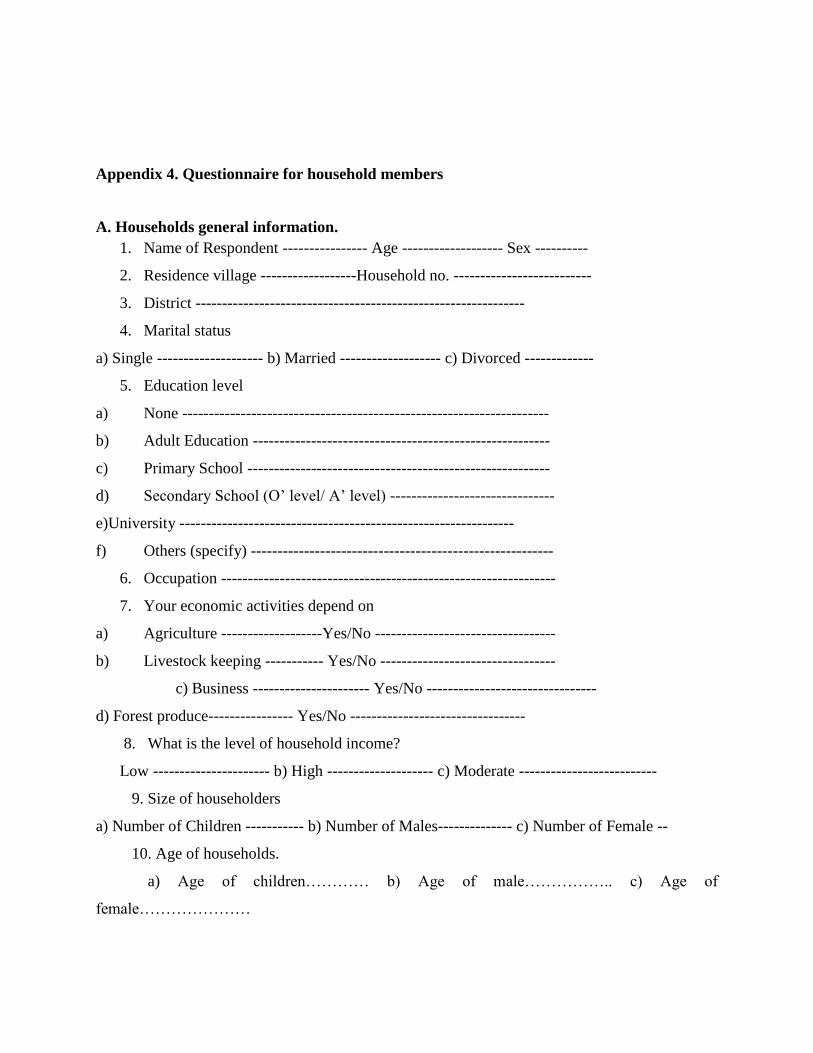
Appendix 4. Questionnaire for household members
A. Households general information.
1. Name of Respondent ---------------- Age ------------------- Sex ----------
2. Residence village ------------------Household no. --------------------------
3. District --------------------------------------------------------------
4. Marital status
a) Single -------------------- b) Married ------------------- c) Divorced -------------
5. Education level
a) None ---------------------------------------------------------------------
b) Adult Education --------------------------------------------------------
c) Primary School ---------------------------------------------------------
d) Secondary School (O’ level/ A’ level) -------------------------------
e)University ---------------------------------------------------------------
f) Others (specify) ---------------------------------------------------------
6. Occupation ---------------------------------------------------------------
7. Your economic activities depend on
a) Agriculture -------------------Yes/No ----------------------------------
b) Livestock keeping ----------- Yes/No ---------------------------------
c) Business ---------------------- Yes/No --------------------------------
d) Forest produce---------------- Yes/No ---------------------------------
8. What is the level of household income?
Low ---------------------- b) High -------------------- c) Moderate --------------------------
9. Size of householders
a) Number of Children ----------- b) Number of Males-------------- c) Number of Female --
10. Age of households.
a) Age of children………… b) Age of male…………….. c) Age of
female…………………
B: Awareness of community in deforestation
1. Do you know about the effects of deforestation?
(i) Yes…………. (ii) No…………
2. Do the government involve you in managing the forest?
(i) Yes………….. (ii) No……………..
3. How do you perceive the deforestation?
(i) Good…………………. (ii) Bad……………
4. Give reason for your choice above
……...........................................................
5. What are the factors that motivate local people to practise deforestation?
(a)………….,. (b) ………, (c)………………, (d)…………, (e)………….
6. Are there any activities which you do in conservation of forest?
(i) Yes…………. (ii) No……………..
C: Benefits from the forests
1.0 Do you get into the forests to collect forests or animal products?
(i) Yes…………………… (ii) No……………………….
2.0 Do the communities allowed to collect forest products free?
(i) Yes --------------------- (ii) No ---------------------
3.0 If yes what are the forest products do you get from the forest reserve
………………………………………………………………………………………….
4.0 Is there any financial benefits do you get from the forests?
(i) Yes…………… (ii) No………..
5.0 If yes what are the sources of financial?
(a)…………….. (b)………….. (c)………………. (d)……………..
6.0 What is the current extent of deforestation?
(a)High............... (b) Medium.............. (c) Low.................
7.0 What are the major drivers that cause deforestation?
(a)Agriculture........ (b)Charcoal production........ (c)Timber harvest.......(d) Fuel wood........
(e)Fire.......... (f) Pastoralism.......... (g)Road construction....... Others...........