Issues surrounding Genre and Gender - Cambridge Assessment
23
1 University of Cambridge Local Examinations Syndicate Assessment of Literacy in the Text Level Strand of the National Literacy Framework at Key Stage Two: Issues surrounding Genre and Gender European Conference on Educational Research 2000, Edinburgh Clare Green and Sylvia Green Primary Assessment Unit Measurement and Psychology Section Research and Evaluation Division 1 Hills Road, Cambridge. CB1 2EU +44 - 01223 - 553843 Fax:+44 - 01223 - 552700 [email protected] Disclaimer: The opinions expressed in this paper are those of the authors and are not to be taken as the opinions of the University of Cambridge Local Examinations Syndicate.
-
Upload
khangminh22 -
Category
Documents
-
view
3 -
download
0
Transcript of Issues surrounding Genre and Gender - Cambridge Assessment

1
University of Cambridge Local Examinations Syndicate
Assessment of Literacy in the Text Level Strand of the NationalLiteracy Framework at Key Stage Two:Issues surrounding Genre and Gender
European Conference on Educational Research 2000, Edinburgh
Clare Green and Sylvia GreenPrimary Assessment UnitMeasurement and Psychology SectionResearch and Evaluation Division�1 Hills Road,Cambridge.CB1 2EU�+44 - 01223 - 553843Fax:+44 - 01223 - 552700�[email protected]
Disclaimer: The opinions expressed in this paper are those of the authors and are not to be takenas the opinions of the University of Cambridge Local Examinations Syndicate.

2
Abstract
The theory that girls achieve higher levels in English than boys has been well researched and, insome ways due to the increased publicity surrounding children’s school performance, thisdifference in performance is well known. It is also widely accepted that girls prefer fiction andboys prefer non-fiction. (APU Primary Language Survey). But is this the whole picture? Thispaper investigates data from the CamPAS English trials. Key Stage 2 children completed readingcomprehension and writing composition activities addressing the text level strand of the NationalLiteracy Framework. Analysis of variations in achievement across a range of genres for readingand writing has allowed for a more detailed exploration of girls’ and boys’ performance withinspecific text types.
Background
The CamPAS project began in 1994. Its aim was to develop materials to support teachers in theirassessment of the core subjects at Key Stage 2. The materials were to focus on areas in whichteachers typically found it more difficult to make valid, reliable assessments. In mathematics thisarea was Ma1, Using and Applying Mathematics, and in science Sc1, Experimental andInvestigative Science. These two assessment packages have been published by CUP(Cambridge University Press).
The third phase of the CamPAS project concerned English. With the implementation of theNational Literacy Strategy, attention shifted away from the National Curriculum Programmes ofStudy and teachers were looking to assess against the new literacy framework for English. ForCamPAS English the target area from the framework was the text level strand. This wouldsupport teachers by providing texts, or text extracts, at suitable levels, with appropriate featuresto use with the Framework. The CamPAS activities address both the reading comprehension andwriting composition criteria from the National Literacy Framework.
The National Literacy Project was set up by the DfEE (Department for Education andEmployment) in 1996. It was established as it was considered that standards in literacy were nothigh enough to compete internationally. Its management was shared by OFSTED (Office forStandards in Education), SCAA (School Curriculum and Assessment Authority), TTA (TeacherTraining Agency) and the BSA (Basic Skills Agency). The NFER (National Foundation forEducational Research) carried out research in 1996 with 9 year olds to survey reading attainmentin England and Wales. The results were interpreted as showing that these countries would becomparable to the average achieved for 91 countries that were part of an earlier internationalcomparison. The English and Welsh scores were said to be lowered due to a ‘long tail’ ofchildren whose achievement was well below average. The Literacy Task Force’s aim was todevelop a strategy to improve levels of literacy in primary schools over a five to ten year periodand to spread good practice. The target was that 80% of eleven-year olds should reach level 4 inthe national tests, level four being the standard expected for that age.
The National Literacy Strategy employed various methods to meet this challenge: the newNational Curriculum for training primary school teachers has a greater focus on equippingtrainees to teach literacy well. Head teachers, governors and key teachers received specialisttraining and all teachers received INSET on implementing the new strategy. The task forcedeveloped a framework for teaching based:
‘on evidence of inspection and successful practice in schools.’ (DfEE, 1997)
A major change for primary teachers was to teach a dedicated and structured literacy hour eachday beginning in the autumn term, 1998, the content and structure of this hour being specified inthe National Literacy Framework.

3
The Task Force acknowledged that children needed a core reading programme, supplementedby a wide range of other reading material, to become successful readers. In writing, they not onlyrecommended that children learn how to present their work correctly and write about differentcontent areas, but that they should also be taught to write in a number of different genres and tolearn about the genre’s particular features.
Points relevant to this paper from the rationale behind the Framework include how literate primarychildren should:
‘know and understand a range of genres in fiction and poetry and understand and be familiar withsome of the ways in which narratives are structured through basic literary ideas of setting,character and plot [and to] understand and be able to use a range of non-fiction texts.’ (DfEE,1997)
Reid and Bentley (1996) discussed the complexities of understanding a text, in as far asrecognising the overall gist of a text as well as its subtleties, the ability to summarise, useinformation texts and strategies for retrieval and the ability to discuss a text. They alsocommented on the effect these should have on assessing reading. They suggested thatresponses to texts should involve:
‘expressing opinions with reference to the text, being aware of themes and images [and]considering the structure of texts and how authors use the language to achieve their effects.’(1996)
If the criteria in the Literacy Framework are taught, children should have the tools to completeassessments of Reid and Bentley’s form, as above. The criteria sampled from the Framework inthe CamPAS English units address all these key features of a reader’s response to a text, hencewe can explore children’s abilities in these areas across a range of text types.
Issues surrounding Genre and Gender
‘Texts are different because they do different things.’ (Cope and Kalantzis, 1993)
This simple explanation summarises how many would classify texts into a specific genre orindeed define genre itself. Books in primary school classrooms and libraries are oftencategorised by their subject matter, for example, animals, countries. They are also traditionallydivided into fiction and non-fiction sections.
Many choose to group texts not on the subject matter or content, but according to the author’spurpose (Littlefair, 1991). If a text is considered to be any meaningful piece of written or spokenlanguage, longer than a couple of sentences, then its genre can be considered to be based onthe authors’ or speakers’ purpose, rather than relating to its linguistic form (Biber, 1988). Youngchildren, however, will most likely look first at the content of a text before considering its otherlinguistic features.
Kress (1982) and Wray and Lewis (1997) describe how texts are structures which are agreedforms:
‘located in a particular set of social practices and understandings.’ (Wray and Lewis, 1997)
These accepted structures vary according to the situation in which the text is to be used.Children must be taught these schematic structures to enable them to communicate using theseagreed conventions. Language choices and ways of expression must be considered in order tomake the text effective in achieving its purpose. Littlefair reports how:

4
‘Research suggests that we cannot assume [children] will implicitly become aware of the varietyof forms and genres of written expression available to them.’
Children may have had a degree of exposure to non-narrative texts, for example, exposition orprocedural texts. Even so, it should not be assumed that without explicitly teaching them thestructure, organisational features and linguistic forms associated with such genres, that childrenwill be able to achieve the desired effect themselves.
The EastLINC team produced a professional development training package which includedmaterials to aid understanding of language use and the purposes associated with various textualgenres. Their categorisation of purpose was as follows:
COMPLAIN PERSUADE EXPRESSFEELINGS
DESCRIBE
ENTERTAIN EXPLAIN INFORM INSTRUCT
REQUEST COMPARE /CONTRAST
Texts can be categorised into genres still further by what they are trying to do. Reports arefactual accounts describing how things are. Procedural texts are also factual, but describe a setof actions to accomplish a goal, with the purpose of explaining. Recounts retell events and theirpurpose may be merely to inform or entertain. Narratives may also be to entertain or to describeor instruct. There are also arguments, explanations and so on. Even if explicitly taught, thissuggests a formidable challenge for the primary child to comprehend and produce texts of thisbreadth of genre and purpose.
Alongside genre, the register of a text should be considered, which is determined by threefactors. Firstly, the tenor, that is the relationship between the author and the reader, theperceived audience. Secondly the field, which is related to the content, for example, who, what,where and when. Lastly, the mode, that is how it is communicated, although here we are onlyconsidering the written form.
Littlefair (1992) expressed the link between genre and register as the genre determining theshape of the communication according to its purpose and the register controlling the choice oflanguage. Both need to be considered and communicated to the young learner.
In order to make it explicit how an author has used language to create the desired effect, theways in which language creates meaning must be taught. More so when considering the written,rather than the spoken form, as children do not have experience of reading and writing a widevariety of genres. These skills need to be taught. Littlefair (1991) suggested that teachingchildren to recognise and expect linguistic features and understanding why they have been usedwould help them become more proficient users of the conventions. Children should be givenopportunities, for example, to write in the third person or passive voice to achieve a more formalscript. Children should also have more exposure to non-chronological texts to learn how best toaccess them and to recognise differences in the ways in which the written form differs from thespoken. Research by Littlefair (1992) confirmed that:
‘Young readers do not simply convert their ability to read stories into an ability to read othergenres.’
We can see the importance for children of building up a knowledge of genre, its socialconventions, the purpose of the text and the register associated with the form. Central to this

5
goal is the necessity for the knowledge and strategies to achieve these effects to be explicitlytaught.
Another significant issue surrounding literacy and young learners is the perceived difference inperformance of girls and boys. In the 1999 standards report for the Key Stage 2 tests, 65% ofboys achieved level 4 (the standard expected for their age) compared to 76% of girls in theNational Tests for English. The QCA’s advice (1998) for raising boys’ achievement related toexposure to a variety of genres. It suggested that English teaching should encompass a widerrange of non-fiction texts and the associated need to assess using a variety of such texts, notsolely relying on reading ability being measured against narrative texts.
OFSTED monitored and evaluated the impact of the early stages of the National LiteracyStrategy. In their report (1999) on the first year’s progress they observed children being taughtto:
‘examine the organisational and presentational devices of non-fiction texts ...[and that]... sharedwriting was usually linked to the genre and structure of the text.’
This seems to indicate that the implementation of the NLF is beginning to have the desired effect.However, it is early days to see where the difficulties will lie and specifically which genres mayprove to be more challenging for perhaps girls or boys in the future.
OFSTED reported in 1996 how girls out-performed boys in the national tests at 7, 11 and 14.More recently, their evaluation of the NLS reports that although girls are continuing to out-performboys in English, the gap is decreasing in reading. Conversely, the NFER’s evaluation of thepupils’ progress in pilot schools during their first 2 years of following the NLF showed girlsprogressing at a faster rate than boys, the observed difference being equivalent to 3 or 4 monthsdevelopment.
Looking at the international picture, Arnot et al (1998) stated that the patterns witnessed inEngland and Wales were mirrored in comparable societies elsewhere and that girls excelled inlanguage globally. Research carried out by the International Study of Educational Achievement(Elley, 1992), into reading literacy found that differences in performance due to gender overrodeobserved national differences. They hypothesised that girls read more and that more frequentreaders become better readers.
It may indeed be true that girls read more fiction that boys (Barrs and Pidgeon, 1993) and withinfiction boys’ and girls’ tastes differ also. Osmont and Davis (1987) found that, even whenpresented with the same text, girls and boys reacted differently to it, with boys focusing on theperceived action and girls more on characterisation and relationships. This too seems to bereflected in their writing, for example in the QCA’s standards report for 1998, where it was foundthat boys’ stories and characters were less well developed than girls’.
Boys seem to avoid engaging with the feminine side of literature, that is that which does not dealwith masculine values and culture. In contrast, girls are more willing to read some moremasculine literature and hence have a wider literary experience. QCA (1998) found again thatboys rarely discussed or wrote about emotional experiences. Arnot et al (1998) made thedistinction in reading material chosen by boys and girls due to the familiarity of the content, thisfamiliarity being due to personal experience at home and at school. Boys are more likely to readabout their hobbies than girls, such information more likely being found in reference rather thanfiction texts. Exploring the world through factual texts reaffirms boys’ preference for impersonaltexts. Littlefair (1992) argues that:
‘our views of girls’ and boys’ relative strengths as readers might be altered in the context of areading curriculum which took more account of boys’ reading interests.’

6
Traditionally children’s reading abilities have been judged more often against fiction and poetrytexts than non-fiction. Arnot et al (1998) suggested that we should acknowledge the combinedverbal and physical activity of reading and acting out plays as well as the reading of non-fictionwhich may advantage boys more.
Often it is social norms and pressures outside the school that influence attitudes to literature andliteracy in boys. However, in the past there has been concern over girls’ underachievement. Theproblem was researched, needs established and help targeted and the situation improved.Perhaps the same procedure needs to be adopted here to see how boys’ achievement in readingand writing can be improved. There is certainly a need to collect more detailed data regardingrelative strengths and weaknesses of girls and boys in literacy and to monitor changes over time.This research goes some way to establishing differences in performance by gender and genreassociated particularly with text types specified in the National Literacy Framework.
Methodology
The National Literacy Framework for teaching contains objectives for teaching. These arearranged into word, sentence and text level objectives. The Framework states that assessmentshould refer to these termly teaching objectives. CamPAS English focused on the text levelstrand of the Framework. The aim was to develop a photocopiable book which would includestimuli, activities, marking guidance, National Curriculum levelling for teacher information andteachers’ notes. It was designed to comprise freestanding, flexible assessment units which couldbe incorporated into the teacher’s formative assessment practice.
The CamPAS English activities were designed for children in Years 3 to 6, that is Key Stage 2(ages 7 to 11). There are 3 units for each year, 12 units in total. Each unit comprises a stimulusand a reading activity which informs the subsequent writing activity. To establish the assessmentcriteria for each unit, teaching objectives from the Framework were grouped together within theunits, one group from the reading comprehension section and one from the writing compositionsection. Thus we could maximise the assessment opportunities with the minimum amount ofreading. The materials are criteria-referenced to the objectives in the Framework.
In order to sample these grouped criteria, ’prime objectives’ needed to be identified. This wasachieved by leading a seminar with a team of English specialists, allocating sections of theframework to groups and considering their reasons for prioritising objectives from the sections,taking into account progression throughout the key stage and the key objectives to be masteredwhen completing each academic year. Subsequently, a sampling grid was developed whichensured that there was a diversity of genres in the texts chosen with a balance of fiction andpoetry and non-fiction texts. The sampled criteria from the Framework were mapped onto theNational Curriculum Programmes of Study and the National Curriculum Level Descriptions toestablish relationships between the documents in a meaningful way. Table 1.1 is an overviewgrid showing the coverage of the National Literacy Framework’s criteria.
Stimulus texts were identified and levelled. The materials were written with each unit comprisinga stimulus text, a set of short answer questions addressing the reading comprehension criteria inthe text level strand of the Framework and one or two long answer questions linked to groupedcriteria from the writing composition section. One fiction and one non-fiction unit were piloted toinform the design and timing for the trials.
Trial 1 took place in April 1999. 12 schools were involved in England and Wales. Within thesample were large and small, rural and urban schools with a mixture of abilities of children andrepresenting a range of geographical areas. There were 6 units for each year group, 24 units intotal. 1250 children were involved in the trial with each child completing two units. It was left tothe teacher’s discretion whether or not to include children in their classes with special educationalneeds.

7
YEAR 3 YEAR 4 YEAR 5 YEAR 6A Living in St LuciaText: InformativeReading: - use headings and sub-headings- identify main points or gist by noting keywords and phrases, list main points - use index and page numbersWriting: - make a simple record of information fromtexts read- complete a simple chart - write a simple non-chronological reportfrom known information for a known audience
D A Viking AdventureText: Historical NarrativeReading:- investigate settings built from detail - respond to character, identify maincharacteristics of key characters and draw on text to justify views - explore narrative orderWriting: - plan a story, identifying the stages of its telling, introduction, build-up, climax, resolution- use paragraphs in story writing to organise and sequence narrative
G Spooked!Text: Play scriptReading: - presentation of character through dialogueand action- personal response- dramatic conventions, asides, gesture, stage directions- tension, empathyWriting:- annotate play script for performance- write play script, applying conventions learnedfrom reading
J Peter�s First BattleText: Classic FictionReading:- articulate personal response to literature- take account of viewpoint- identify why and how a text affects a readerWriting:- summarise a passage in a specified number of words- manipulate narrative perspective by writing in the voice and style of a text
B Ma Liang and his Magic BrushText: Traditional NarrativeReading: - identify typical story theme- identify and discuss main and recurringcharacters- evaluate characters’ behaviour and justifyviewsWriting:- write character portraits using story textand present as a letter- write a story plan for a traditional taleusing a theme from reading
E The Daily PressText: JournalisticReading:- identify main features of newspapers- examine opening sentences that set scenes,capture interest- pick out key sentences/phrases that convey informationWriting:- write newspaper style reports, includingcomposing headlines, editing stories to fit particular space
H Come to the Games!Text: RecountReading:- identify features of recounts: introduction, chronological sequence,supporting illustrations, degree of formality, connectivesWriting:- make notes for different purposes and buildon these in their own writing- write reports for an unknown reader
K Animals in CaptivityText: Discursive Reading:- recognise effective argument, sequencing, linking of points- balanced argument, summarise different sides, clarify strengths and weaknesses of different positions- use persuasive examples, illustrations and evidence- pre-empt or answer potential objectionsWriting:- construct effective arguments, developing a point logically and effectively- support and illustrate points persuasively- anticipate possible objections- harness known views, interests and feelings of audience- tailor writing to formal presentation where appropriate
C Balloon CardsText: InstructionalReading:- identify purpose of instructional texts- how written instructions are organised- read and follow simple instructionsWriting:- write instructions using a range oforganisational devices recognising the importance ofcorrect sequence
F New LifeText: ExplanatoryReading: - scan text, locate key words and phrases,summarise, mark extracts- identify purpose and key features ofexplanatory text- use connectives of timeWriting: - present information in diagrammatic form - fill out brief notes into connected prose- write an explanation of a process, usingconventions identified through reading
I Why not Visit the Park?Text: Persuasive LeafletReading:- compare writing that informs and persuades: the deliberate use of bias, how opinion can be disguised to seem likefact- evaluate text for persuasiveness, clarity- use of rhetorical questionsWriting:- construct argument in note form to persuadeothers of a point of view- draft and write individual letters; to edit andpresent in a finished state
L Scared of Bullies?Text: PoetryReading:- discuss how linked poems relate to one another by theme- comment critically on overall impact of a poem, showing how language and themes have been developed- compare and contrast the work of a single writer- look at connections and contrasts in the work of different writersWriting- annotate a passage in detail in response to specific questions- write a brief helpful review tailored for real audiences- compare texts in writing, drawing out: different styles and preoccupations, strengths and weaknesses, different values and appeal to a reader
Table 1.1 Overview Grid showing National Literacy Framework coverage

8
Each unit was completed by four groups of children. Three groups came from the appropriateyear group for the activity and one from the year group above that for which the unit was written.For example, a Year 4 unit was completed by 3 groups of children from year 4 and one group ofchildren from year 5. This was to enable a Rasch analysis of the data to be carried out (detailslater).
The scripts were returned to the Primary Assessment Unit for marking. Teams of markers weretrained after this trial and later after the second trial. Marking guidance was developed and co-ordination scripts were completed. Answer booklets from each cohort were divided betweenmarkers to minimise marker effects contaminating the data and marker reliability was checkedthroughout, any significant differences in the distribution of marks between markers beingmonitored.
Child level data was collected. The schools sent details of the children’s dates of birth, theirteacher assessed levels for reading and writing and if they were level 4 or 5 on the specialeducational needs register. The special education information was used if a child’s script wasconsidered to contain insufficient answers to be included in the data, as such marks may haveskewed the data overall. The teacher assessment levels were used to inform the statisticalcomparison of characteristic scores achieved by particular level children on a specific activity. Bycomparing children’s achieved scores on the units with their teacher-assessed levels we couldmake assumptions about the characteristic performance of children at the levels for which theunits were aimed.
We also gathered data in the form of teacher feedback. Each classroom teacher was sent ashort questionnaire asking for their opinions. They were asked to comment on the stimulusmaterials, the layout of the materials, the accessibility and reading level of the stimuli and answerbooklets, management and organisation and timing. Their responses were collated and takeninto account when amending the units.
After data analysis had been carried out, the materials were amended for the second trial. Thistook place in November 1999 in 8 schools in England and Wales. From the 24 units 12 wereselected for use in the second trial on the basis of information from the data analysis. 720children were involved, each child completing two units. Again overlap groups were employed inthe same way as in trial 1.
As the trial was to take place during the autumn term, the children would not have covered theteaching objectives in the Framework for that current year. Hence, children in the year groupabove that for which the unit was designed completed the units. For example, Year 5 children atthe start of their year completed year 4 units.
Data was analysed at item, child and unit level and for the package overall to investigate issuessurrounding gender and genre.

9
Analysis
The analysis of how the materials performed during the trials took a variety of forms. One aimwas to improve and amend the questions by considering the difficulty of the questionsindividually, as a unit overall, as set of units across a year group and across the whole key stage.The distribution of scores and any gender differences were also considered when developing thequestions. Results were used to inform the marking guidance. The statistics generated enabledus to explore issues of gender and genre. The following were considered in this process:
fvs (facility values) d.i. (discrimination indices)Cronbach’s Alpha (internal consistency) mean marks overallmean mark girls mean marks boysmean % scores standard deviationt-test (for gender bias) Rasch analysisTable 1.2 shows the results from the second trial of the CamPAS units. The numbers in theshaded boxes beneath show the results from the first trial. For the purpose of this project we willconsider the results from the second trial as it was felt that the units, and hence theircorresponding results, were more reliable. The first column specifies the year group that the unitis written for. The mean scores are given as percentages for the unit overall and are split to showthe results for boys and girls separately and to show the results for reading comprehension (RC)and writing composition (WC) discretely. These figures do not include the scores for children inthe overlap groups. Results for the overlap groups are listed separately i.e. for children from theyear group above that for which the unit was designed. This data was collected to enable Raschanalysis of the results. The rel gives a figure for the reliability of the unit, d.i. is the discriminationindex (a tick indicates there were no questions with any negative discrimination values in the unit,any figures listed indicate the size of any negative discrimination and the question number that itrelates to), the standard deviation (SD) is given as a percentage and the unit total describes thenumber of marks available on a unit. The text type indicates the genre of the stimulus and thefocus summarises the content of the criteria from the Literacy Framework which the unit isassessing.
Figure 1.1 shows the mean percentage scores for all the units in trial 2. In Year 3 (units A - C),

10
Table 1.2Trial 2 resultsTrial 1 results
yr. Unit text type focus mean%
mean%
boysmean
%girls
mean% RC
mean%
RCboys
mean%
RCgirls
mean% WC
mean% WC
boys
mean% WCgirls
Mean%
overlapyear
rel d.i. SD%
UnitTotal
3 2A
informative locate and present
information
68 67 69 68 69 68 67 65 71 75 .81 � 23 19
69 68 70 68 67 68 70 69 71 80 .83 24 24
3 3B
traditional narrative
themecharacter
74 71 77 87 84 89 68 65 71 83 .78 � 20 15
68 67 70 84 84 85 60 57 62 77 .77 19 17
3 4C
instructional organisation and purpose
72 67 76 71 66 76 73 69 76 84 .76 � 23 13
57 54 53 67 68 66 47 45 49 62 .79 24 14
4 7D
historical narrative
narrative order, paragraphs, sequence
66 63 71 67 63 72 66 62 70 85 .83 � 19 26
67 63 70 69 66 73 65 61 69 79 .86 20 26
4 8E
journalistic key sentences act / opinionlayout, voice,formality
52 49 56 58 56 61 43 39 48 65 .75 � 21 17
46 45 47 53 52 53 37 34 40 79 .65 18 17
4 10F
explanatory scanning, summarisingpurpose, structure,language, presentation
65 63 68 67 64 69 64 61 67 91 .83 � 21 22
70 68 73 75 71 79 69 68 70 92 .83 20 21

11
5 13G
play script characterpresentation dramaticconventionsannotation of playscript
75 69 81 81 76 87 68 62 74 56 .71 Q4R-.0291
15 27
63 57 66 67 62 70 58 51 63 67 .83 19 30
5 14H
recount features ofrecounted textsnoting key points
65 60 67 70 64 74 62 59 64 74 .86 � 22 27
57 65 52 57 68 49 60 66 56 77 .84 22 29
5 18I
persuasive read and evaluatelayout, language,purpose,persuasion
55 49 60 53 45 59 57 51 61 71 .73 � 18 29
62 62 62 59 60 58 65 64 66 66 .79 23 32
6 19J
classic fiction /narrative
viewpoint,personal responsenarrativeperspectivevoice, style
55 53 57 63 62 63 46 42 50 .77 Q4-0.05
19 28
56 51 63 81 76 87 39 34 46 .83 22 31
6 22K
discursive effective balancedarguments
67 64 70 73 72 75 62 58 67 .72 � 17 23
54 53 54 55 55 54 53 51 55 .74 17 25
6 23L
poetry theme, format,repetition,languageimpact, contrasts,connectionsreviews, values,appeal
73 69 78 84 79 89 58 54 63 .69 Q1C-0.05Q2A-0.09Q2B-0.07
14 30
55 51 59 63 60 67 43 37 50 .79 19 34

12
the highest mean percentage scores were recorded for unit B. This had a narrative text as itsstimulus and focused on theme and character. Children’s unfamiliarity with the information andinstructional genres of units A and C may explain the corresponding lower scores for these units.This pattern is repeated in Year 4, where unit D’s text is again a narrative, here a historical storyfocusing on setting, character and narrative order. The two non-fiction units in this year groupconcentrate on journalistic and explanatory texts. This again seems to suggest that the childrenlack exposure to a broader range of text types.
In Year 5 (units G - I) the highest mean percentage scores were observed for the unit focusing onplay scripts. The unit with a recounted text as stimulus yielded lower scores and the mostdemanding unit, unit I, was based on a persuasive text in the form of a leaflet. Again familiaritywith the conventions of the arguably less traditional forms of text experienced in the Primaryclassroom could go some way to explaining these differences in outcome. Questions in unit Ilooked at persuasive techniques, bias, fact versus opinion and clarity of texts. The higher orderskills involved in answering such questions could also contribute to it being a more demandingactivity. A different picture emerges in Year 6 (units J - L). The highest mean percentage scoresare found for the poetry unit, unit L. Next is the unit focusing on a discursive text. The lowest forthis year group are observed for unit J with a classic fiction text as stimulus. Although this is anarguably more familiar genre, the criteria addressed in this unit include writing a summary andwriting in the voice and style of the author, both of which proved challenging to the childreninvolved.
figure 1.2 Mean Percentage Scores by Reading Comprehension and Writing Composition
0102030405060708090
100
A B C D E F G H I J K L
unit
mea
n pe
rcen
tage
sco
re
mean-rc mean-wc
Figure 1.2 shows the mean percentage scores spilt by reading comprehension and writingcomposition. It shows that in 10 out of the 12 units the scores for reading are higher than forwriting. The two units where the mean percentage writing scores are higher are unit C,instructional genre, and unit I, persuasive genre. In unit C the reading activity heavily informed thewriting activity which involved writing a set of instructions similar to those given. The stimulus andreading comprehension questions may have acted as a form of scaffolding for modelling thesubsequent writing activity. In unit I the writing activity was to write a persuasive letter to aheadteacher. The familiarity of letter writing as an activity and the familiar school-based contextmay have facilitated the performance of children in this case. The greatest difference in meanpercentage scores appears for unit L, the poetry unit. While the reading comprehensionquestions involved work on theme, format, language, contrasts and connections, the writingactivity demanded the higher order skills of evaluation and synthesis, rather than writing poetry.

13
Asking them to write about a genre rather than in genre may go some way to explaining thecontrast seen here.
The Rasch model is a type of item response model. As it can deal with missing information, it canbe used to compare sets of data for different groups of children linked by completing a commonactivity or to compare sets of data for activities linked by common children having completedthem. Having completed a Rasch analysis, each child is assigned a number corresponding totheir ‘ability’ and each question or question part is assigned a number which corresponds to its‘difficulty’. These parameters are measured in logits, arbitrary units which are related to theprobability of success on a question. The relative values of these measures are independent ofthe group of children completing the activities and the activities they are completing. It is aparticularly useful model to employ here to use with activities which may be presumed to beprogressing in difficulty as the Key Stage progresses or indeed of similar difficulty within aparticular year group. All questions are placed on a common scale of difficulty by the analysisand hence direct comparisons can be made. We can investigate parts within a question andidentify any misfitting questions or question parts, that is those for which unexpected behaviouraffecting responses are observed.
Figure 1.3 shows a vertical summary of the relative difficulty of all the units. The scale on the left-hand side goes from -3 to +2 logits, reading from the bottom to the top shows from the easiest tothe comparatively harder units. Here 1.4 logits is roughly equivalent to 1 National Curriculumlevel or 2 years’ development. We can use this summary to investigate comparability across theKey Stage and consistency of difficulty within a year group. Although the overall picture ofprogression is evident, the analysis indicates some anomalies with the ordering.
Unit B, the narrative text appears the easiest unit, the next two easiest being the other two Year 3units, as expected. Year 4 units D (historical narrative) and F (explanatory) appear the next mostdifficult, but unit E, based on conventions of a journalistic text seems to be proving to be asdifficult as the Year 5 and 6 units. Both the Year 5 and the Year 6 units have similar ranges ofdifficulties. The poetry and play script units come out the easiest and this could again be arguedto be a consequence of these genres being more usually found in the classroom. The hardestunit in this analysis, unit I, is the persuasive text, the conventions of this genre may well beproving an obstacle to the children answering well. This summary may indicate that theexpectations of children, in terms of working with specific genres from the Framework, may beunrealistic and certain text types would be more appropriately introduced at different stages oftheir development.
We can also display these relative difficulties in tables for each year group as follows:
Year 3 Year 4 Year 5 Year 6most difficult informative &
instructionaljournalistic persuasive narrative
↓ narrative recount discursive
least difficult narrative explanatory play script poetry
The fiction and poetry units seem to be the easiest in Years 3, 5 and 6 (aside from unit J,discussed above). In Year 4, the explanatory genre appears easier than the historical narrative.One explanation of this may be that one criteria from the Literacy Framework assessed within thisactivity is that of using paragraphs. However, paragraphs are not mentioned until level 5 in theNational Curriculum level descriptions, which is above the level expected for Year 4 children.

14
Figure 1.3CamPAS English 2nd roundTable 6.0 All Facet Vertical Summary, showing relative difficulty of units,measured in logits.---------------------------------------------------------------- |Measure |+unit |genre │in logits│ │ ----------------------------------------------------------------difficult+ 2 + + | | | | | | | unit I |persuasive | | | unit J |classic fiction | | | | | | | | | | | | | | | | | | | unit H |report | | | unit K |discursive │ + 1 + + | | | | | | | unit G |play script | | | unit E unit L |journalistic poetry | | | | | | | | | | | | | | | | | | | | | | | | │ ↑ * 0 * * | | | | | | | | | | | | | | | | | | | | | | | | | | | | | | | unit D |historical narrative | | | | │ + -1 + unit F +explanatory | | | | | | | | | | | | | | | | | | | | | | | | | | | | | | | | | | | unit A unit C |informative instructional │ + -2 + + | | | | | | | | | | | unit B |narrative | | | | | | | | | | | | | | | | | | | | | | | | │easy + -3 + + ---------------------------------------------------------------- |Measure | unit |genre ----------------------------------------------------------

15
Having considered the relative difficulties of genre we move onto an investigation of performancerelated to gender. Figure 1.4 shows the mean percentage scores spilt by gender. It shows thatgirls out-perform boys in all units in all years. In the lower Key Stage the greatest differences arein the instructional text and the historical narrative. The smallest differences are found with theinformation text and the explanatory text. This reflects the assumption that boys read more ofthese types of non-fiction texts and this familiarity improves their ability to answer regarding thesegenres, hence reducing the disparity in performance. In the upper Key Stage the greatestdifferences are found in the play script and the poetry unit reflecting girls’ ability to respond tocharacter, language and so on. The smallest differences are observed for the recount andclassic fiction units. The writing activity for the recount was in the context of sport which mayhave benefited the boys more than the girls and so reduced the difference in performance.
Figure 1.4 Mean Percentage Scores by Gender
0102030405060708090
100
A B C D E F G H I J K L
unit
mean%score
boy girl
Figure 1.5 shows the mean percentage scores for reading comprehension split by gender. Thegraph shows that in reading girls out-perform boys in all but one of the units, namely theinformation text. Here the scores are close. The reading comprehension questions involvedinformation retrieval and were short answer questions, both which may favour boys, being theirpreferred styles of answering. The largest observed differences overall are found in Year 5. Thegreatest difference in Year 6 is for the poetry unit which suggests that girls may have a greaterexposure to poetry than boys.
Figure 1.6 shows the mean percentage scores for writing composition split by gender. It showsthat girls outperform boys in all units. The differences seem to become slightly bigger as the KeyStage progresses. The observed differences in writing performance appear to be greater than inthe reading. Smaller differences are found with the recount and explanatory texts in Years 4 and5, suggesting boys perform comparatively better when writing in these genres.

16
Figure 1.5 M ean P ercentage S cores for R eading C om prehension by G ender
0102030405060708090
100
A B C D E F G H I J K L
unit
mea
n %
sco
re
boys g irls

17
F ig u r e 1 .6 M e a n P e r c e n ta g e S c o r e s fo r W r itin g C o m p o s itio n b y G e n d e r
01 02 03 04 05 06 07 08 09 0
1 0 0
A B C D E F G H I J K L
u n it
mea
n %
sco
re
b o ys g irls

18
Rasch estimates parameters for children and for items which correspond to their abilities andtheir difficulties respectively. Using these parameters we can generate an expected score foreach child-item encounter. The difference between the expected score and the actual score iscalled the residual. It is possible to analyse the residuals for different groups of people. Analysisof the residuals generated by the Rasch analysis for boys and girls showed that there was nostatistically significant bias for gender.
Gender bias was also investigated using t-tests. Table 1.3 shows the results from theindependent samples t-test with equal variances not assumed. The figures shown are for a 2-tailed significance.
Table 1.3Unit A B C D E F G H I J K LSig.2-tailed
.620 .130 .078 .046 .166 .127 .000 .184 .003 .243 .048 .001
Here figures smaller than 0.05 are considered statistically significant. This shows that there wasgender bias on five of the units. This result is not unexpected as we can see from table 1.2 andfigure 1.4 that girls out-perform boys in the units, so the observed differences in mean percentagescores is enough to explain these values.
It may be more interesting to consider the extent of the differential performance. Unit G showsthe greatest gender bias which may be due to the nature of the questions favouring girls as theyfocused on the presentation of characters and writing in a fictional genre. Unit L seems to reflecta similar pattern, with a very low figure and questions addressing language issues of theme andimpact. The stimulus here, a set of linked poems may also have favoured the girls. Unit I’s lowfigure may be linked to the unit demanding children to evaluate the use of language and using thepersuasive genre in their written answers. Unit A, the information text, yields the highest valuewhich may be due to boys having a more similar ability as girls in accessing this type of text andbeing more successful at answering questions requiring locating and presenting information. Thisreaffirms the notion that boys’ reading habits, related to using information texts to explore theirhobbies, might indeed impact on their reading ability of such texts during assessment. It mayalso be a reflection of how boys prefer more structured writing tasks, as in this unit the writingtask contained a lot of support and demanded shorter answers, including filling in a chart. It isless clear why unit J, classic fiction, has a figure of 0.243. Perhaps by Year 6 boys have had agreater exposure to fiction texts and are more familiar with tasks involving commenting onnarrative perspective and personal response and writing a subsequent adventure. It may also bethat the difficulty of the criteria addressed in this unit has proved very challenging to all thechildren so any gender trends have been skewed by the consequently lower scores.
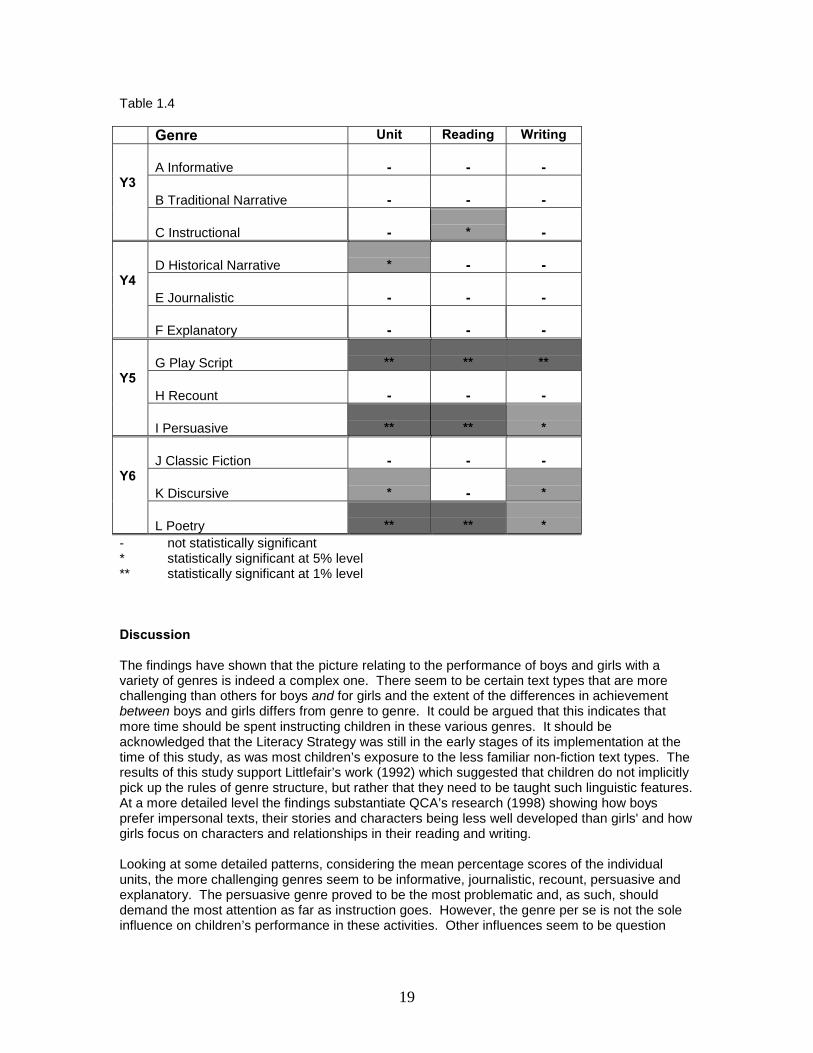
Table 1.4 shows the patterns of statistically significant gender differences on the units overall andfor reading and writing separately. It shows how the significance of gender differences is moremarked in the upper key stage than in the lower key stage. This seems to show that boys do not‘catch up’ as their writing and, more so, their reading ability develops.
The Rasch analysis for gender bias and the t-tests seem to have provided different pictures.However, t-tests only consider the children’s mean marks on the units. These scores areconsidered alongside the standard deviations to calculate if there is a difference in performancebetween boys and girls. We know girls achieve higher levels in literacy than boys so these testsyield statistically significant differences in performance. However, the Rasch analysis looks at thechild’s performance on the test on each item and then compares it to their performance overall.Hence, it takes into account the differential performance of boys and girls and looks fordifferences in performance beyond the ‘expected’ difference. In this case there is no significantdifference beyond that expected.
19
Table 1.4
Genre Unit Reading Writing
A Informative - - -
B Traditional Narrative - - -Y3
C Instructional - * -
D Historical Narrative * - -
E Journalistic - - -Y4
F Explanatory - - -
G Play Script ** ** **
H Recount - - -Y5
I Persuasive ** ** *
J Classic Fiction - - -
K Discursive * - *Y6
L Poetry ** ** *- not statistically significant* statistically significant at 5% level** statistically significant at 1% level
Discussion
The findings have shown that the picture relating to the performance of boys and girls with avariety of genres is indeed a complex one. There seem to be certain text types that are morechallenging than others for boys and for girls and the extent of the differences in achievementbetween boys and girls differs from genre to genre. It could be argued that this indicates thatmore time should be spent instructing children in these various genres. It should beacknowledged that the Literacy Strategy was still in the early stages of its implementation at thetime of this study, as was most children’s exposure to the less familiar non-fiction text types. Theresults of this study support Littlefair’s work (1992) which suggested that children do not implicitlypick up the rules of genre structure, but rather that they need to be taught such linguistic features.At a more detailed level the findings substantiate QCA’s research (1998) showing how boysprefer impersonal texts, their stories and characters being less well developed than girls' and howgirls focus on characters and relationships in their reading and writing.
Looking at some detailed patterns, considering the mean percentage scores of the individualunits, the more challenging genres seem to be informative, journalistic, recount, persuasive andexplanatory. The persuasive genre proved to be the most problematic and, as such, shoulddemand the most attention as far as instruction goes. However, the genre per se is not the soleinfluence on children’s performance in these activities. Other influences seem to be question

20
type, the difficulty of the criterion the question is addressing, the level of support given by thequestion and the context the question is set in.
Considering the performance of girls compared to boys, boys seemed to fall behind most whenthe units involved narrative texts, plays and poetry, which may be as expected if reflecting onboys’ reading habits. More unexpected was the contrast in scores for the instructional text. Boysmay need greater teaching input to understand and use the conventions used in this genre inorder to reproduce them. The observed difference was less for information texts, explanatorytexts and recounts. As previously stated, this may be due to boys greater exposure to informativeand explanatory texts and to the context of sport adopted in the unit concerning recounts.
Looking at the differences in performance on reading comprehension and writing compositionseparately, we can make initial judgements as to where support may need to be targeted. Inreading, boys fell behind most with poetry which could well be lack of exposure or motivation forreading such texts voluntarily. Conversely, the smallest difference was found with the informationtext which could also be accounted for by familiarity. In writing composition boys fell behind mostin the unit connected with the play script, where the activity involved writing a script employingsuitable dramatic conventions. The smallest contrast seen was with the recount and explanatorytexts, as above. The bias analysis pointed towards persuasive writing favouring girls most,followed by poetry. This again suggests these should be areas where teachers target boysspecifically.
Conclusion
The genre of a text affects everything from the large-scale layout of the text on the page to thesmall-scale vocabulary used. Teachers need to know about the linguistics of texts in order toteach their formats, especially when dealing with non-fiction genres. Especially in writing,children need to be taught accepted textual formats in order to make the texts they write achievetheir purposes. Non-fiction texts demand a more abstract understanding and non-linear approachin both reading and writing which in turn demands a systematic teaching approach. Reid andBentley (1996) suggested that we should assess literacy using a wide range of genres. Littlefair(1992) suggested that this may advantage boys. The implementation of the National LiteracyStrategy should promote these concepts. Clearly, there is concern surrounding the underachievement of boys and their attitudes to literacy. This is recognised and a new national projectis due to start to encourage men to take a more active part in teaching their children to read.
This study set out to explore the CamPAS English data in order to investigate how girls’ and boys’performances vary according to genre. In this case it was the genre associated with specificreading comprehension and writing composition activities. The results from the CamPAS trialshave verified existing theories regarding gender and genre in the Primary classroom. Theyconfirm that girls do better than boys in literacy in Key Stage 2. They reinforce studies (forexample, OFSTED, 1998) showing that children achieve better results in reading activities than inwriting, an area of growing concern in Primary education. They have also indicated that, althoughthe National Literacy Framework necessitates that children are exposed to a wider range of texttypes than may have traditionally featured in the Primary classroom, children are still performingbetter in assessments involving fiction and poetry, including play scripts. However, the study hasshown that this is not the whole picture. Within non-fiction texts there are more and lesschallenging genres and the genre per se is far from the only influence on performance.Achievements vary further when considering performance in reading compared to writing. Thisindicates that teachers may have to modify their teaching focuses to accommodate suchdifferences within a genre.
More research is needed in this area to establish a clearer picture of the problems posed bycertain genres and how these challenges differ for girls and boys. Genre theory has importantimplications for teaching literacy, as an awareness of how texts are shaped and organised is

21
needed in order for a text to succeed in its purpose. There is a need to reverse the trend ofprominence of the narrative genre so that assessments can provide a more diagnostic model forteachers to assess children’s work against constructively. In turn this would enable children tosee how to make improvements in the effectiveness of their texts and teachers to plan moreefficiently for progression.

22
References
ARNOLD, H. (1997). Minibook Series No. 10: Reading to Find Out. Hertfordshire: UnitedKingdom Reading Association.
ARNOT, M., GRAY, J., JAMES, M. (1998). Recent Research on Gender and EducationalPerformance. OFSTED Reviews on Research. London: The Stationery Office.
BARRS, M. and PIDGEON, S. (1993). Reading the Difference. Gender and Reading in thePrimary School. U.K.: CLPE
BEECH, J. and SINGLETON, C. (eds.) (1997) The Psychological Assessment of Reading.London and New York: Routledge.
BIBER, D. (1988). Variation across Speech and Writing. Great Britain: Cambridge UniversityPress.
BROOKS, G., PUGH, A. and SCHAGEN, I. (1996). Reading Performance at Nine. Slough,Berkshire: National Foundation for Educational Research and The Open University.
COPE, B. & KALANTIS, M. (1993). The Powers of Literacy: A Genre Approach to TeachingWriting. Hong Kong: Falmer Press
DEPARTMENT FOR EDUCATION AND EMPLOYMENT LITERACY TASK FORCE. (1997). TheImplementation of the National Literacy Strategy: A Summary for Primary Schools. Departmentfor Education and Employment.
DEPARTMENT FOR EDUCATION AND EMPLOYMENT LITERACY TASK FORCE. (1997). TheImplementation of the National Literacy Strategy. Department for Education and Employment
DEREWIANKA, B. (1991, revised impression). Exploring how texts work. Australia: PrimaryTeaching Association.
DEPARTMENT OF EDUCATION AND SCIENCE. (1988). Report of the Committee of Inquiry intothe Teaching of English Language under the Chairmanship of Sir John Kingman, FRS. London:Her Majesty’s Stationery Office.
EastLINC TEAM. (1992). Language in the National Curriculum Project: A focus on primarypractice. Nottingham: Department of English Studies, University of Nottingham.
ELLEY, W. B. (1992). How in the World do Students Read?. Hamburg: International Associationfor the Evaluation of Educational Achievement.
GORMAN, T. P., WHITE, J., ORCHARD L. and TATE A. (1983). Language Performance inSchools: Secondary Survey Report No. 2. London: HMSO
HOLT, G., BOYD, S., DICKINSON, B., LOOSE, J. and O’DONNELL, S. (1999). Education inEngland, Wales and Northern Ireland: A Guide to the System.Slough, Berkshire: National Foundation for Educational Research.
KRESS, G. (1982). Learning to Write. Great Britain: Routledge and Kegan Paul
LITTLEFAIR, A. (1991). Reading all types of writing. Milton Keynes: Open University Press.
LITTLEFAIR, A. (1992). Genres in the Classroom. England: UKRA

23
OFFICE FOR STANDARDS IN EDUCATION. (1995). A Report from the Office of Her Majesty’sChief Inspector of Schools. English: A review of inspection findings 1993/4. London: HerMajesty’s Stationery Office.
OFFICE FOR STANDARDS IN EDUCATION. (1998). Recent research on gender andeducational performance. London: Her Majesty’s Stationery Office.
OFFICE FOR STANDARDS IN EDUCATION. (1999). A Report from the Office of Her Majesty’sChief Inspector of Schools. The National Literacy Strategy: an evaluation of the first year of theNational Literacy Strategy. London: Her Majesty’s Stationery Office.
OSMONT P. and DAVIS J. (1987). Stop, Look and Listen: an account of girls’ and boys’achievement in reading and mathematics in the Primary School. U.K.: ILEA.
QUALIFICATIONS AND CURRICULUM AUTHORITY. (1998). Can do better: raising boys’achievements in English. London: Qualifications and Curriculum Authority.
QUALIFICATIONS AND CURRICULUM AUTHORITY. (2000). Standards at key stage 2. English,mathematics and science. Report on the 1999 national curriculum assessments for 11-year-olds.London: Qualifications and Curriculum Authority.
REID, D. and BENTLEY, D. (eds.) (1996). Reading On! Developing reading at key stage 2.Leamington Spa, Warwickshire: Scholastic Ltd.
STOBART, G. and GIPPS, C. (1997, 3rd Edition). Assessment: A teacher’s guide to the issues.London: Hodder & Stoughton.
SUKHNANDAN, L. (1999). An investigation into gender differences in achievement. Phase 1: areview of recent research and LEA information on provision. Slough, Berkshire: NationalFoundation for Educational Research.
SUKHNANDAN, L., LEE, B. and KELLEHER, S. (2000). An investigation into gender differencesin achievement. Phase 2: school and classroom strategies. Slough, Berkshire: National Foundation for Educational Research.
WHITE, J. and KARAVIS, S. with KISPLA, A. and CHRISTOPHERS, U. (1994).The reading repertoire at Key Stage 2: a selective list of books. Slough: National Foundation forEducational Research.
WRAY, D. (ed.) (1992). Reading Beyond the Story. Widnes, Cheshire: United Kingdom ReadingAssociation.
WRAY, D. and LEWIS, M. (1997). Extending Literacy: children reading and writing non-fiction.London and New York: Routledge.