Challenges to estimating carbon emissions from tropical deforestation
16
Challenges to estimating carbon emissions from tropical deforestation NAVIN RAMANKUTTY *w , HOLLY K. GIBBS w , FRE ´ DE ´ RIC ACHARD z, RUTH DEFRIES§, JONATHAN A. FOLEY w , R. A. HOUGHTON } *Department of Geography, McGill University, 805 Sherbrooke St. W., Montreal, QC, Canada H3A 2K6, wCenter for Sustainability and the Global Environment (SAGE), Nelson Institute for Environmental Studies, University of Wisconsin, 1710 University Avenue, Madison, WI 53726, USA, zInstitute for Environment and Sustainability, Joint Research Centre of the European Commission, CCR/TP 440, Ispra I-21020 (VA), Italy, §Department of Geography, University of Maryland, 2181 Lefrak Hall; College Park, MD 20742, USA, }The Woods Hole Research Center; 149 Woods Hole Road, Falmouth, MA 02540, USA Abstract An accurate estimate of carbon fluxes associated with tropical deforestation from the last two decades is needed to balance the global carbon budget. Several studies have already estimated carbon emissions from tropical deforestation, but the estimates vary greatly and are difficult to compare due to differences in data sources, assumptions, and methodologies. In this paper, we review the different estimates and datasets, and the various challenges associated with comparing them and with accurately estimating carbon emissions from deforestation. We performed a simulation study over legal Amazonia to illustrate some of these major issues. Our analysis demonstrates the importance of considering land-cover dynamics following deforestation, including the fluxes from reclearing of secondary vegetation, the decay of product and slash pools, and the fluxes from regrowing forest. It also suggests that accurate carbon-flux estimates will need to consider historical land-cover changes for at least the previous 20 years. However, this result is highly sensitive to estimates of the partitioning of cleared carbon into instantaneous burning vs. long-timescale slash pools. We also show that carbon flux estimates based on ‘committed flux’ calculations, as used by a few studies, are not comparable with the ‘annual balance’ calculation method used by other studies. Keywords: Amazon, carbon, deforestation, emissions, forest, historical, land-cover, land-use, model, tropical Received 13 March 2006 and accepted 26 May 2006 Introduction Deforestation and other land-cover changes typically release carbon from the terrestrial biosphere to the atmosphere as CO 2 (carbon dioxide), while recovering vegetation in abandoned agricultural or logged land removes CO 2 from the atmosphere and sequesters it in vegetation biomass and soil carbon. Emissions from land-use and land-cover change are perhaps the most uncertain component of the global carbon cycle, with enormous implications for balancing the present-day carbon budget and predicting the future evolution of climate change. Over the last two decades, Houghton and colleagues (Houghton et al., 1983, 1985; Houghton, 1999, 2003a) have compiled land-cover change informa- tion from various national inventory records and used them, within a carbon-cycle model, to estimate global carbon emissions of 2.2 Pg C yr 1 in the 1990s (com- pared with 6.4 Pg C yr 1 from fossil-fuel emissions) and a total release of 156 PgC over the 1850–2000 period (compared with 283 Pg C from fossil-fuel emissions). The average carbon emissions from land-cover change in the 1990s is of the same order of magnitude as the residual carbon sink (Prentice et al., 2001), thereby highlighting the importance of accurately estimating land-use carbon emissions for balancing the global carbon budget. Recently, several new estimates of carbon emissions from land-cover change have emerged (Table 1; Fig. 1). Correspondence: Navin Ramankutty, Department of Geography, McGill University, 805 Sherbrooke St. W., Montreal, QC, Canada H3A 2K6, fax: 1 1 514 398 7437, e-mail: [email protected] Global Change Biology (2006) 12, 1–16, doi: 10.1111/j.1365-2486.2006.01272.x r 2006 The Authors Journal compilation r 2006 Blackwell Publishing Ltd 1
-
Upload
independent -
Category
Documents
-
view
2 -
download
0
Transcript of Challenges to estimating carbon emissions from tropical deforestation

Challenges to estimating carbon emissions fromtropical deforestation
NAV IN RAMANKUT T Y *w , HO L LY K . G I B B S w , F R E D E R I C ACHARD z, R U TH DE F R I E S § ,J ONATHAN A . F O L E Y w , R . A . HOUGHTON }*Department of Geography, McGill University, 805 Sherbrooke St. W., Montreal, QC, Canada H3A 2K6, wCenter for Sustainabilityand the Global Environment (SAGE), Nelson Institute for Environmental Studies, University of Wisconsin, 1710 UniversityAvenue, Madison, WI 53726, USA, zInstitute for Environment and Sustainability, Joint Research Centre of the EuropeanCommission, CCR/TP 440, Ispra I-21020 (VA), Italy, §Department of Geography, University of Maryland, 2181 Lefrak Hall;College Park, MD 20742, USA, }The Woods Hole Research Center; 149 Woods Hole Road, Falmouth, MA 02540, USA
Abstract
An accurate estimate of carbon fluxes associated with tropical deforestation from the lasttwo decades is needed to balance the global carbon budget. Several studies have alreadyestimated carbon emissions from tropical deforestation, but the estimates vary greatlyand are difficult to compare due to differences in data sources, assumptions, andmethodologies. In this paper, we review the different estimates and datasets, and thevarious challenges associated with comparing them and with accurately estimatingcarbon emissions from deforestation. We performed a simulation study over legalAmazonia to illustrate some of these major issues. Our analysis demonstrates theimportance of considering land-cover dynamics following deforestation, including thefluxes from reclearing of secondary vegetation, the decay of product and slash pools, andthe fluxes from regrowing forest. It also suggests that accurate carbon-flux estimates willneed to consider historical land-cover changes for at least the previous 20 years. However,this result is highly sensitive to estimates of the partitioning of cleared carbon intoinstantaneous burning vs. long-timescale slash pools. We also show that carbon fluxestimates based on ‘committed flux’ calculations, as used by a few studies, are notcomparable with the ‘annual balance’ calculation method used by other studies.
Keywords: Amazon, carbon, deforestation, emissions, forest, historical, land-cover, land-use, model,
tropical
Received 13 March 2006 and accepted 26 May 2006
Introduction
Deforestation and other land-cover changes typicallyrelease carbon from the terrestrial biosphere to theatmosphere as CO2 (carbon dioxide), while recoveringvegetation in abandoned agricultural or logged landremoves CO2 from the atmosphere and sequesters it invegetation biomass and soil carbon. Emissions fromland-use and land-cover change are perhaps the mostuncertain component of the global carbon cycle, withenormous implications for balancing the present-daycarbon budget and predicting the future evolution of
climate change. Over the last two decades, Houghtonand colleagues (Houghton et al., 1983, 1985; Houghton,1999, 2003a) have compiled land-cover change informa-tion from various national inventory records and usedthem, within a carbon-cycle model, to estimate globalcarbon emissions of 2.2 PgCyr!1 in the 1990s (com-pared with 6.4 PgCyr!1 from fossil-fuel emissions)and a total release of 156PgC over the 1850–2000 period(compared with 283 PgC from fossil-fuel emissions).The average carbon emissions from land-cover changein the 1990s is of the same order of magnitude as theresidual carbon sink (Prentice et al., 2001), therebyhighlighting the importance of accurately estimatingland-use carbon emissions for balancing the globalcarbon budget.Recently, several new estimates of carbon emissions
from land-cover change have emerged (Table 1; Fig. 1).
Correspondence: Navin Ramankutty, Department of Geography,
McGill University, 805 Sherbrooke St. W., Montreal, QC, Canada
H3A 2K6, fax: 1 1 514 398 7437, e-mail: [email protected]
Global Change Biology (2006) 12, 1–16, doi: 10.1111/j.1365-2486.2006.01272.x
r 2006 The AuthorsJournal compilation r 2006 Blackwell Publishing Ltd 1

Fearnside (2000) estimated that tropical land-coverchanges resulted in a net emission of 2.4 PgCyr!1
during the 1981–1990 period. McGuire et al. (2001) andthe Carbon Cycle Model Linkage Project (CCMLP),based on the historical cropland change dataset ofRamankutty & Foley (1999) that is largely based onnational and subnational land-cover inventory data,estimated that the global establishment and abandon-ment of croplands released 0.6–1 PgCyr!1 in the 1980s(we scale up by 61% to estimate emissions from all land-cover changes of 0.9–1.6 PgCyr!1; see Table 1). Morerecently, DeFries et al. (2002) and Achard et al. (2002,2004) have used remotely sensed tropical deforestationdata (from the Advanced Very High Resolution Radio-meter, AVHRR, and Landsat TM, respectively) to esti-mate releases of 0.3–0.8 PgCyr!1 in the 1980s and 0.5–1.4 PgCyr!1 in the 1990s (Table 1; Fig. 1). These satel-lite-based estimates and the CCMLP study suggestedthat Houghton and colleagues and Fearnside (2000)have overestimated carbon emissions from land-coverchange by up to a factor of two, mainly because ofdifferent estimates of the rates of tropical deforestation(DeFries & Achard 2002; House et al., 2003).However, these five different studies are not directly
comparable. The studies covered different geographicranges and time periods, considered different types ofland-cover changes, made different assumptions abouthistorical land-cover change, and used different carboncycle models (Table 1). For example, the McGuire et al.(2001) and Houghton (2003a) estimates were global,while Fearnside (2000), DeFries et al. (2002) and Achardet al. (2002, 2004) estimates covered the tropics alone1.However, this difference in the geographic domain maybe reconcilable because the vast majority of rapid land-cover changes in the 1980s and 1990s are believed tohave occurred in the tropics (Lepers et al., 2005).Another key difference in these studies lies in their
treatment of carbon emissions. Houghton (2003a) andMcGuire et al. (2001) estimated contemporary carbonfluxes (‘annual balance’ estimate) including the full timetrajectory of historical land-cover changes and ‘inher-ited’ carbon fluxes. Fearnside (2000), on the other hand,excluded historical land-cover changes, but used a‘committed flux’ estimate (as opposed to annual bal-ance) for 1980s deforestation that accounted for all thecarbon fluxes from then until a new equilibrium land-scape was established in the future (see Fearnside (1997)for a detailed explanation of the difference betweenannual balance and committed flux estimates). DeFries
Tab
le1
Estim
ates
ofcarbonem
issionsfrom
land-cover
chan
ge
Study
1980
s(PgCyr!
1)
1990
s(PgCyr!
1)
Datasourcefor
land-cover
chan
ge
Spatialcoverag
ean
dresolution
Lan
d-cover
chan
ge
before
1980
sincluded
?Carboncyclemodel
Houghton
(200
3a)
2.0
2.2
FAO
Forest
Resources
Assessm
ent,an
dother
land-cover
inven
tory
Global,9regions
Yes
Book-keepingmodel
Fearnside
(200
0)2.4
–FA
OForest
Resources
Assessm
ent,an
dother
land-cover
inven
tory
Pan
-tropics,
6regions
No.Useda‘‘committed
flux’’estimate.
Book-keepingmodel
McG
uireet
al.
(200
1)0.9–
1.6*
–Croplandinven
tory
Global,sp
atially-exp
licit
Yes
Ecosystem
models
DeF
ries
etal.
(200
2)0.6(0.3–0
.8)
0.9(0.5–1
.4)
AVHRRdeforestation,based
onpercent
tree
cover
chan
ge
Pan
-tropics,
spatially-
explicit
No
Book-keepingmodel
Ach
ardet
al.
(200
4)–
1.1"
0.3
Lan
dsatdeforestationfrom
TREESproject
forhumid
tropics;FA
ORem
ote
Sensing
Analysisfordry
tropics(FAO,20
01b)
Pan
-tropics,
estimates
for
3tropical
regionsbased
onsample
of30
mscen
es
No,butuseda10
-year
‘‘committedflux’’
estimateas
aproxy.
Book-keepingmodel
* McG
uireetal.(20
01)estimated
carbonem
issionsfrom
croplandch
angeof0.6–
1PgCyr!
1.T
oincludetheinfluen
ceofother
land-use
chan
ges,w
escaled
thisestimateby61
%–
theratioofcroplandem
issionsto
totallan
d-cover
chan
geem
issionsin
the19
80sas
estimated
byHoughton(200
3a)–to
derivetotallan
d-cover
chan
geem
issions,as
inHouse
etal.
(200
3).
1Note that the Achard et al. (2002) study only covered the humid
tropics; however Achard et al. (2004) calculated carbon emissions
for the entire tropics using deforestation estimates for the dry
tropics from the FAO remote sensing analysis (FAO, 2001b)
2 N . RAMANKUT T Y et al.
r 2006 The AuthorsJournal compilation r 2006 Blackwell Publishing Ltd, Global Change Biology, doi: 10.1111/j.1365-2486.2006.01272.x

et al. (2002) also excluded the influence of land-coverchanges before the 1980s, while Achard et al. (2002, 2004)used a 10-year ‘committed flux’ estimate as a proxy forpast land-cover changes. Another difference amongthese studies centers around their treatment of terrestrialecosystem processes: CCMLP study used process-basedglobal ecosystem models, while the other four studiesused ‘book-keeping’ terrestrial carbon cycle models.The studies also differed in their consideration of
land-use practices. While Houghton (2003a) and Fearn-side (2000) considered several different types of land-cover change (deforestation, cropland establishment andabandonment, shifting cultivation, logging and forestdegradation), McGuire et al. (2001) only considered theestablishment and abandonment of croplands, DeFrieset al. (2002) focused on deforestation and regrowth, andAchard et al. (2002, 2004) estimated tropical deforesta-tion, degradation, and regrowth. However, while De-Fries et al. (2002) and Achard et al. (2002, 2004) estimatedregrowth occurring in the 1980s and 1990s, Fearnside(2000) only considered land-cover change initiated in the1980s and its consequence for landscape change in thefuture, and excluded any regrowth that might haveoccurred from previous land-use history.Here, we suggest that while there are now five
different estimates of carbon emissions from tropicaldeforestation, a simple comparison of the estimatesdoes not encompass the full range of uncertainty re-garding land-cover change emissions of carbon (see alsoHoughton 2003b). The five studies have used differentland-cover datasets, covered different domains and
time periods, and different methods to compute carbonfluxes, and are, therefore, not strictly comparable (Table 1).In addition to these five studies, two other recentstudies (Cramer et al. 2004, Jain & Yang, 2005) haveestimated carbon emissions from land-use change usingsome combination of the same datasets as the earlierfive studies, but different carbon models. We, therefore,do not consider those studies further. In this paper, weexplore some of the key issues related to the estimationof carbon emissions from tropical deforestation andperform a case-study simulation over the legal Amazonto illustrate some of these concepts.
Elements of a full analysis of carbon emissions fromtropical deforestation
A complete analysis of carbon emissions from tropicaldeforestation involves the quantification of several keyelements, including rates and dynamics of land-coverchange, initial stock of carbon in vegetation and soils,mode of clearing and fate of cleared carbon, response ofsoils following land-cover change, influence of histor-ical land-cover legacies, and finally the representationof processes in the models used to integrate all of theseelements. We discuss each of these elements in turn,and uncertainties in our state of the knowledge.
Deforestation rates
Estimating deforestation is complicated by the fact thatthere are more than 90 different definitions of forest
0.0
0.5
1.0
1.5
2.0
2.5
3.0
3.5
1920 1930 1940 1950 1960 1970 1980 1990 20000.0
0.5
1.0
1.5
2.0
2.5
3.0
3.5
H2003-range H2003-mean CCMLP-rangeAVHRR TREES F2000
Car
bon
emis
sion
s (P
g C
yr–1
)
Fig. 1 Intercomparison of five different estimates of carbon emissions from global land-cover change. The Houghton (2003a; H2003)
and McGuire et al. (2001; Carbon Cycle Model Linkage Project; CCMLP) estimates were global, while the DeFries et al. (2002; AVHRR),
Achard et al. (2004; TREES), and Fearnside (2000; F2000) studies were pan-tropical. H2003 and CCMLP estimated annual values, while
the other three studies estimated decadal averages.
C A R BON EM I S S I ON S F ROM TROP I CA L D E FOR E S TAT I ON 3
r 2006 The AuthorsJournal compilation r 2006 Blackwell Publishing Ltd, Global Change Biology, doi: 10.1111/j.1365-2486.2006.01272.x

being used around the world (Lepers et al. 2005). TheFood and Agriculture Organization’s (FAO) definitionof forest, which is the most widely used, includesnatural forests and forest plantations with tree canopycover greater than 10%. Most definitions concur thatdeforestation is the conversion of forest to anotherland cover, or the reduction in tree canopy cover belowthe 10% threshold. Sometimes, large-scale deforestationcan occur from an event unrelated to land use (e.g.exceptional Indonesian fires in 1997–1998), and poten-tially followed by salvaging of the standing dead vege-tation. Such events are not considered deforestationevents, but there is the possibility of confusion inobservations.The five studies discussed here used different types
of deforestation data and accordingly had differentdefinitions (Table 1). Houghton (2003) (H2003 here-after) estimated land-cover change in the 1980s and1990s using country-level deforestation statistics fromthe FAO Forest Resources Assessment (FAO, 2001a)(hereafter FRA), and therefore followed the FAO defini-tion of deforestation. Fearnside (2000; F2000 hereafter)also used the FRA to estimate land clearing for the1980s (and other sources for the Brazilian Amazonalone). However, the FRA data are essentially a compi-lation of reports from individual nations and have beencriticized for lack of consistency between countries andbetween assessments (Grainger, 1996; Matthews, 2001).McGuire et al. (2001) (CCMLP hereafter) did not directlyestimate deforestation, but rather inferred changes inland cover from the expansion or abandonment ofcroplands derived from FAO’s FAOSTAT agriculturalstatistics database and other subnational statistics(Ramankutty & Foley, 1999; FAO, 2004). The studies ofDeFries et al. (2002) (AVHRR hereafter) and Achard et al.
(2002, 2004) (TREES hereafter) estimated deforestationrates using satellite remote sensing. The AVHRR studyestimated deforestation to occur when the change inpercent tree cover of an 8 km pixel exceeded a thresholdof 14%. The TREES study defined deforestation as theconversion of forests (closed, open, or fragmented for-ests, plantations, and forest regrowths) to nonforestlands (mosaics, natural nonforest such as shrubs orsavannas, agriculture, and nonvegetated). TREES esti-mated deforestation rates only for the humid tropics(corresponds closely with the FAO definition of ‘closedbroadleaved forest’, FAO 2001a), but Achard et al. (2004)extended this to the entire tropics by using the defor-estation rates estimated for the dry tropics by the FAORemote Sensing Survey (FAO, 2001b).Estimates of deforestation rates vary greatly (Table 2).
For example, FRA’s estimates of deforestation rates forthe 1990s were 23% higher than the TREES estimate forthe humid tropics and 62% higher than the AVHRRestimate for the entire tropics (for an intercomparison,see DeFries & Achard, 2002). Both the AVHRR andTREES estimates are 30% lower than FRA even afterexcluding dry tropical Africa, where the data is mostuncertain and the divergence in estimates the greatest(Houghton & Goodale, 2004). Indeed, FAO’s RemoteSensing Survey also suggests that the FRA (countrydata) estimates may be too high in tropical Africaparticularly for certain countries (e.g. Sudan and Zam-bia), but also points out the difficulty of remote sensinganalysis in the dry tropics (FAO, 2001b). The two pan-tropical estimates covering both the 1980s and 1990salso identify different trends in deforestation rates. TheAVHRR estimate indicates that deforestation rates in-creased between the 1980s and 1990s (Table 2) while theFRA estimate indicates a decrease (FAO, 2001a).
Table 2 Comparison of different estimates of tropical deforestation rates
All tropics (Mha yr!1) Humid tropics (Mha yr!1)
FAO CountrySurvey AVHRR
FAO RemoteSensing
FAO CountrySurvey TREES*
Net forest change in the 1990sTropical Asia !2.4 !2.0 !2.0 !2.5 !2.0Tropical Africa !5.2 !0.4 !2.2 !1.2 !0.7Tropical Latin America !4.4 !3.2 !4.1 !2.7 !2.2Pantropics !12.0 !5.6 !8.3 !6.4 !4.9
Net forest change in the 1980sTropical Asia !2.4 !1.2Tropical Africa !3.9 !0.3Tropical Latin America !7.1 !3.6Pantropics !13.4 !5.1
*This refers to the Achard et al. (2002) study. Achard et al. (2004) used the same values for the humid tropics, and the FAO RemoteSensing data for the entire tropics.
4 N . RAMANKUT T Y et al.
r 2006 The AuthorsJournal compilation r 2006 Blackwell Publishing Ltd, Global Change Biology, doi: 10.1111/j.1365-2486.2006.01272.x

Land-cover dynamics following deforestation
To accurately estimate carbon fluxes from land-coverchange, it is also critical to understand the land-coverdynamics following deforestation (Figs 2 and 3). De-pending on the fate of the land following the initialclearing, biomass of vegetation can remain at a muchlower level than in the primary forest that was cleared(in the case of permanent agriculture), or remain atsome intermediate level associated with a secondaryforest (in the case of shifting cultivation), or accumulateback to nearly the same level as before deforestation (inthe case of agricultural abandonment and regrowth, orlogging and regrowth). Consequently, it is important totrack the extent and age of regrowing vegetation ondeforested land.Tracking the fate of cleared land at the global scale is
exceptionally challenging. To do so requires observa-tions at high spatial and temporal resolutions, detailedclassification schemes, and careful change detection, inorder to be able to separate gross deforestation from netdeforestation (allow regrowing secondary forests andplantations to offset gross rates of clearing). Indeed, thefive studies discussed in this paper have not fullyconsidered the impact of land-cover dynamics follow-ing deforestation in estimating carbon emissions. TheAVHRR study was not able to fully separate gross fromnet deforestation due to the 8 km spatial resolution andinherent problems with the AVHHR sensor (e.g. geolo-cation errors, intersensor calibration) (Agbu & James,1994). The CCMLP, H2003, and F2000 studies relied onnational and subnational statistics that aggregatechange over large regions, and thus also likely under-estimated the transitions between forest, agriculturalland, and secondary regrowth. The TREES study, basedon carefully classified Landsat imagery (30m spatialresolution), and separated by 7 years in time (1990–1997) provides the most comprehensive observations ofland-cover dynamics associated with tropical deforesta-tion. However, it only covers the humid tropics anddoes not provide ‘wall-to-wall’ coverage as it is basedon a sampling scheme.Another important issue to consider is the reclearing
of secondary vegetation. Deforested land in the tropicsoften enters a fallow-cropping cycle, where land iscultivated for a few years, abandoned, and then allowedto regrow into fallow or secondary vegetation which isoften recleared. Secondary fallows may be cleared sev-eral times during a typical fallow-cropping cycle. In theBrazilian Amazon, for example, the reclearing rates ofsecondary forest may rival the primary forest clearingrates (Hirsch et al., 2004). Steininger (2004) also esti-mated significant carbon emissions from the reclearingof secondary forests in the Amazon.
Vegetation and soil carbon stocks
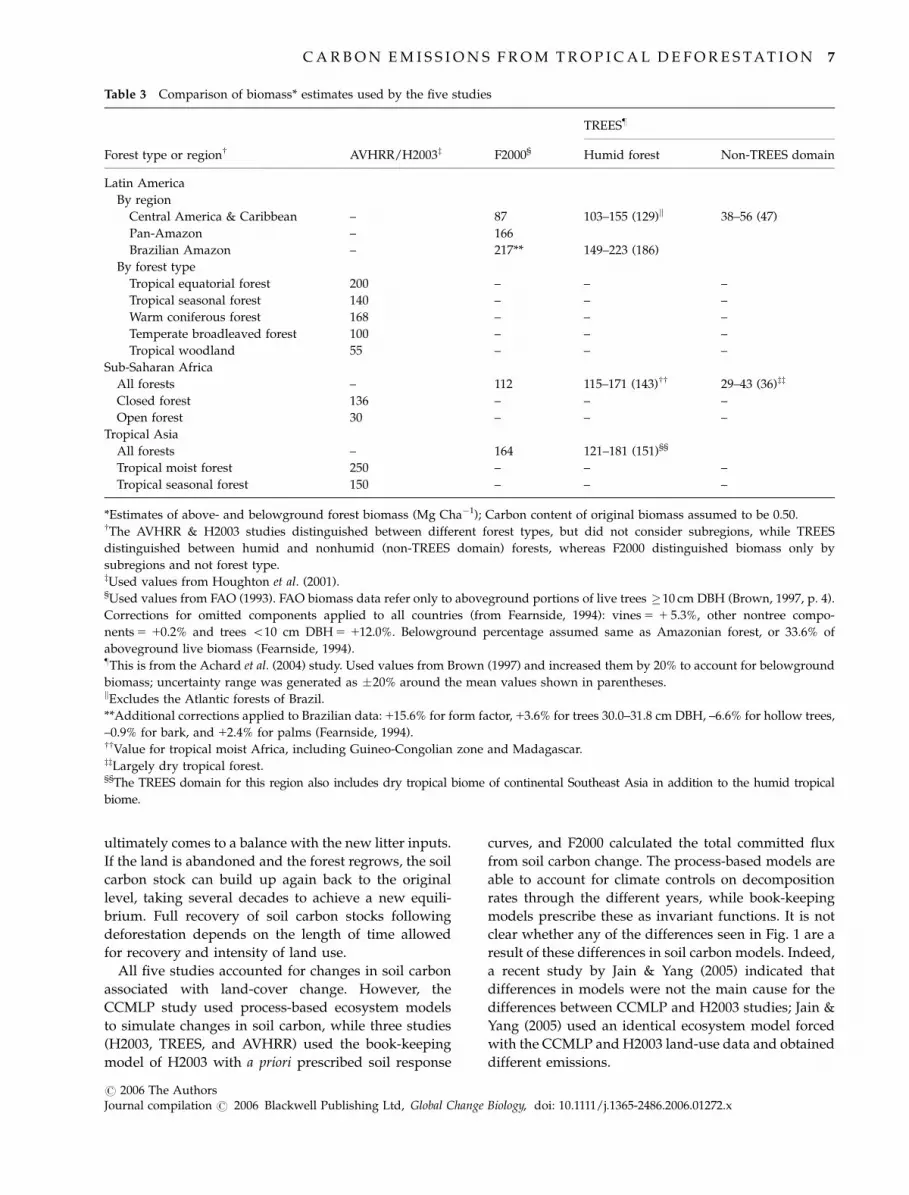
Uncertainty in vegetation carbon stocks is a less appre-ciated source of error in estimates of the carbon emis-sions from land-cover change (Houghton, 2005). Thefive studies used varying estimates of initial vegetationbiomass, and this partly contributes to differences incarbon emissions (see Table 3). In particular, while theAVHRR and H2003 studies used identical biomassestimates (Houghton, 2005), TREES and F2000 useddifferent values, and CCMLP used model-simulatedbiomass (that were not reported in the McGuire et al.,2001 study). Achard et al. (2004) and Houghton (2005)explicitly considered the implications of uncertainty inbiomass for estimates of carbon emissions. Indeed,uncertainty in biomass estimates has been a key sourceof disagreement regarding estimates of carbon emis-sions from tropical deforestation (Eva et al., 2003, Fearnside& Laurance, 2003, 2004). Further, estimates of the spatialdistribution of soil carbon stocks is even more uncertainthan biomass, and both of these critical componentsof the terrestrial carbon budget need to be better char-acterized (see Houghton et al. 2001; Houghton 2005 forreviews).
Mode of clearing and fate of cleared carbon
To accurately estimate the transient behavior of carbonemissions from land-cover change, it is important to
Forest Agriculture
Degraded
abandonmentdeforestationfor agriculture
reclearing
regrowth
?
regrowthSecondary
forest/fallow
logging Bareground
Forest Agriculture
Degraded
abandonment
reclearing
regrowth
?
regrowthSecondary
forest /fallow
regrowth
Fig. 2 Land-cover dynamics following forest clearing or log-
ging. Land-cover transitions between agriculture, secondary
forest, degraded land, and other land uses. It is critical to know
how much land is put to the different uses, and how long it
remains in those uses.
C A R BON EM I S S I ON S F ROM TROP I CA L D E FOR E S TAT I ON 5
r 2006 The AuthorsJournal compilation r 2006 Blackwell Publishing Ltd, Global Change Biology, doi: 10.1111/j.1365-2486.2006.01272.x

understand the method of land clearing. For example, ifdeforestation occurs through slash and burn, most ofthe carbon is released to the atmosphere within a yearduring the burning process, while if deforestationoccurs through clearcut or selective logging, most ofthe useful wood is removed offsite and is used tomake products such as paper, furniture, and otherwood products which oxidize over much longertimescales.H2003 used a book-keeping model to track the fate of
carbon following deforestation. According to this model,a certain fraction of the biomass is burned duringclearing, another fraction is left on site and decays inthe soil, and the remaining portion is removed offsite.The removed biomass is partitioned into various pro-duct pools that decay at 1-, 10-, 100- and 1000-yeartimescales (H2003 uses different parameters for each ofthe nine regions). The CCMLP study, AVHRR, andTREES, all used similar formulations as H2003 forconsidering the fate of carbon following deforestation.Therefore, the differences between these four estimatesare not likely a result of this factor. However, quantita-tive estimates of the mode of clearing and the fate ofproducts are not easily available. For example, signifi-
cant uncertainties persist regarding estimates of howmuch carbon is burnt at the time of clearing, or insubsequent years (Fearnside, 2000). Therefore, the factthat all four studies adopted similar formulations doesnot imply consensus, but rather a lack of alternatives.F2000 implicitly accounts for the carbon emissions fromfuelwood removal and charcoal formation by usingbiomass values that are not reduced to reflect theremoval of these products. Moreover, the committedflux estimate used by F2000 implicitly accounts for thetime dynamics of carbon fluxes into the future until areplacement equilibrium landscape is achieved.
Response of soil carbon
Typically, right after deforestation, soil carbon stockincreases for a short while from the incorporation ofthe slash left from clearing (Houghton et al., 1983).However, soil carbon stock soon decreases because thelitter input to the soil is typically lower in deforestedland (although in some cases, soil carbon stocks canincrease; see review by Murty et al., 2002). This decreasecontinues for a couple of years to decades, and, depend-ing on the land-use practice on the deforested land,
Agriculture
BIO
MA
SSForest
Deforestation
Forest
Deforestation
Forest
Deforestation
Forest
DeforestationTIME
Regrowth
Reclearing
Fallow
Agriculture
Regrowth
Agriculture
Agriculture
Abandon-ment
Regrowth
Secondaryforest
Regrowth
Deforestation
Regrowth
Secondaryforest
Secondaryforest
Fallow
Fig. 3 Different pathways of carbon dynamics following deforestation. Depending on the land-use practices following deforestation,
vegetation carbon can either remain at a lower level, or re-accumulate if the land is abandoned and allowed to regrow back into a forest.
6 N . RAMANKUT T Y et al.
r 2006 The AuthorsJournal compilation r 2006 Blackwell Publishing Ltd, Global Change Biology, doi: 10.1111/j.1365-2486.2006.01272.x
ultimately comes to a balance with the new litter inputs.If the land is abandoned and the forest regrows, the soilcarbon stock can build up again back to the originallevel, taking several decades to achieve a new equili-brium. Full recovery of soil carbon stocks followingdeforestation depends on the length of time allowedfor recovery and intensity of land use.All five studies accounted for changes in soil carbon
associated with land-cover change. However, theCCMLP study used process-based ecosystem modelsto simulate changes in soil carbon, while three studies(H2003, TREES, and AVHRR) used the book-keepingmodel of H2003 with a priori prescribed soil response
curves, and F2000 calculated the total committed fluxfrom soil carbon change. The process-based models areable to account for climate controls on decompositionrates through the different years, while book-keepingmodels prescribe these as invariant functions. It is notclear whether any of the differences seen in Fig. 1 are aresult of these differences in soil carbon models. Indeed,a recent study by Jain & Yang (2005) indicated thatdifferences in models were not the main cause for thedifferences between CCMLP and H2003 studies; Jain &Yang (2005) used an identical ecosystem model forcedwith the CCMLP and H2003 land-use data and obtaineddifferent emissions.
Table 3 Comparison of biomass* estimates used by the five studies
Forest type or regionw AVHRR/H2003z F2000§
TREES}
Humid forest Non-TREES domain
Latin AmericaBy region
Central America & Caribbean – 87 103–155 (129)k 38–56 (47)Pan-Amazon – 166Brazilian Amazon – 217** 149–223 (186)
By forest typeTropical equatorial forest 200 – – –Tropical seasonal forest 140 – – –Warm coniferous forest 168 – – –Temperate broadleaved forest 100 – – –Tropical woodland 55 – – –
Sub-Saharan AfricaAll forests – 112 115–171 (143)ww 29–43 (36)zz
Closed forest 136 – – –Open forest 30 – – –
Tropical AsiaAll forests – 164 121–181 (151)§§
Tropical moist forest 250 – – –Tropical seasonal forest 150 – – –
*Estimates of above- and belowground forest biomass (Mg Cha!1); Carbon content of original biomass assumed to be 0.50.wThe AVHRR & H2003 studies distinguished between different forest types, but did not consider subregions, while TREESdistinguished between humid and nonhumid (non-TREES domain) forests, whereas F2000 distinguished biomass only bysubregions and not forest type.zUsed values from Houghton et al. (2001).§Used values from FAO (1993). FAO biomass data refer only to aboveground portions of live trees #10 cm DBH (Brown, 1997, p. 4).Corrections for omitted components applied to all countries (from Fearnside, 1994): vines5 1 5.3%, other nontree compo-nents5 10.2% and trees o10 cm DBH5 112.0%. Belowground percentage assumed same as Amazonian forest, or 33.6% ofaboveground live biomass (Fearnside, 1994).}This is from the Achard et al. (2004) study. Used values from Brown (1997) and increased them by 20% to account for belowgroundbiomass; uncertainty range was generated as "20% around the mean values shown in parentheses.kExcludes the Atlantic forests of Brazil.**Additional corrections applied to Brazilian data:115.6% for form factor,13.6% for trees 30.0–31.8 cm DBH, –6.6% for hollow trees,–0.9% for bark, and12.4% for palms (Fearnside, 1994).wwValue for tropical moist Africa, including Guineo-Congolian zone and Madagascar.zzLargely dry tropical forest.§§The TREES domain for this region also includes dry tropical biome of continental Southeast Asia in addition to the humid tropicalbiome.
C A R BON EM I S S I ON S F ROM TROP I CA L D E FOR E S TAT I ON 7
r 2006 The AuthorsJournal compilation r 2006 Blackwell Publishing Ltd, Global Change Biology, doi: 10.1111/j.1365-2486.2006.01272.x
Incorporating historical land-cover change
Historical land-cover changes continue to influencecarbon fluxes today due to the response of long-time-scale pools of carbon. The delayed release of carbonfrom product and slash pools that have resulted fromearlier deforestation, or the continued uptake of carbonin the vegetation and soils within secondary forests,results in ‘inherited’ carbon emissions or uptake thatinfluences the present-day carbon budget. For example,recovering forests in the eastern United States areestimated to be a major portion of the present-daycarbon budget for that region (Caspersen et al., 2000,Pacala et al., 2001). Therefore, it is critical to includehistorical land-cover changes while estimating carbonfluxes.H2003 and CCMLP explicitly accounted for historical
land-cover changes in their studies. The AVHRR studydid not consider the influence of land-cover changesbefore the 1980s in their study; they assumed thatcarbon stocks were in equilibrium in 1980. F2000 didnot account for inherited carbon flux, but estimated a‘committed flux’ from land-cover change in the 1980s,which is the ‘long-term net result of converting a givenarea of forest to the equilibrium landscape that willeventually replace it.’ This estimate represents the pre-sent and future carbon emissions committed to theatmosphere from land-cover change in the 1980s. How-ever, such an estimate is not comparable with theannual carbon balance for the 1980s (what the atmo-sphere actually sees in the 1980s). The TREES studyused a 10-year committed flux estimate as a proxy forhistorical changes, suggesting that a 10-year windowwould be comparable with the actual carbon balance inthe 1980s. They interpreted their committed flux as amoving-average window that can be considered to beeither backward looking or forward looking, and overwhich deforestation and regrowth rates are assumed tobe the same as present-day. Whether the committed fluxis an adequate proxy for historical fluxes and compar-able with annual balance depends on the nature of thehistorical land-cover changes, and therefore, should beused with great caution. It may, however, be an im-provement over assuming no historical land-coverchanges at all. We will illustrate the utility of thecommitted flux estimate later using Amazonia as anexample.
Carbon cycle model
All studies estimating carbon emissions from land-cover change at the regional-to-global scale utilize mod-els (often simple spreadsheets) to integrate informa-tion, and to predict the spatial and temporal trajectories
of carbon fluxes. While the rates of land-cover change,and initial stocks of carbon are prescribed, the modelspredict the fate of vegetation carbon stocks if the landis abandoned and vegetation regrows, the dynamicsof soil carbon, and the fate of carbon removed off-site. These carbon dynamics, especially that of vegeta-tion and soil carbon, can be predicted either usingprocess-based ecosystem models or can be prescribeda priori based on observations as done in book-keepingmodels. The process-based ecosystem models canaccount for nonlinearities in carbon dynamics, mostsignificantly the climate controls on decompositionprocesses, that are considered unvarying in the book-keeping models.The CCMLP study used spatially explicit process-
based ecosystem models to simulate carbon dynamicsassociated with land-cover change (although CCMLPalso used a book-keeping model to predict the fate ofcarbon removed offsite), while the AVHRR and TREESstudies used the book-keeping model of H2003. TheAVHRR study applied the book-keeping model in aspatially explicit fashion, while TREES and H2003 ap-plied the model over large regions assuming quantitiessuch as biomass and soil carbon stocks, as well as theland-cover changes, to be homogenous within theregions. F2000 did not perform a time-dependent calcu-lation, but rather estimated committed fluxes. Theramification of these differences in models is not ob-vious, although House et al. (2003), comparing theCCMLP study with H2003, found that the CCMLPcarbon fluxes followed land-conversion rates with alag of about 5 years, while H2003 showed some long-term memory, whereby carbon emissions continued togo up after land-conversion rates stabilized. This dif-ference might result from differences in the carbon cyclemodels, especially the response of the long-term soilcarbon pools. However, as mentioned earlier, Jain &Yang (2005) indicated that differences in models werenot the main cause for the differences between CCMLPand H2003 studies.
Illustration – carbon emissions from land-coverchange in the Amazon
We perform a simulation study over legal Amazonia toillustrate some of the key issues related to estimatingcarbon emissions from land-cover change that werehighlighted in previous sections. We derive annualdeforestation rates from the PRODES database, theBrazilian Space Agency’s (INPE) Landsat analysis for1989–2003 (Fig. 4, INPE, 2000). INPE also provides adecadal-mean estimate of deforestation for 1978–1988.Also, from Tardin et al. (1980; as cited in Fearnside,1982), we obtain cumulative deforested areas of
8 N . RAMANKUT T Y et al.
r 2006 The AuthorsJournal compilation r 2006 Blackwell Publishing Ltd, Global Change Biology, doi: 10.1111/j.1365-2486.2006.01272.x
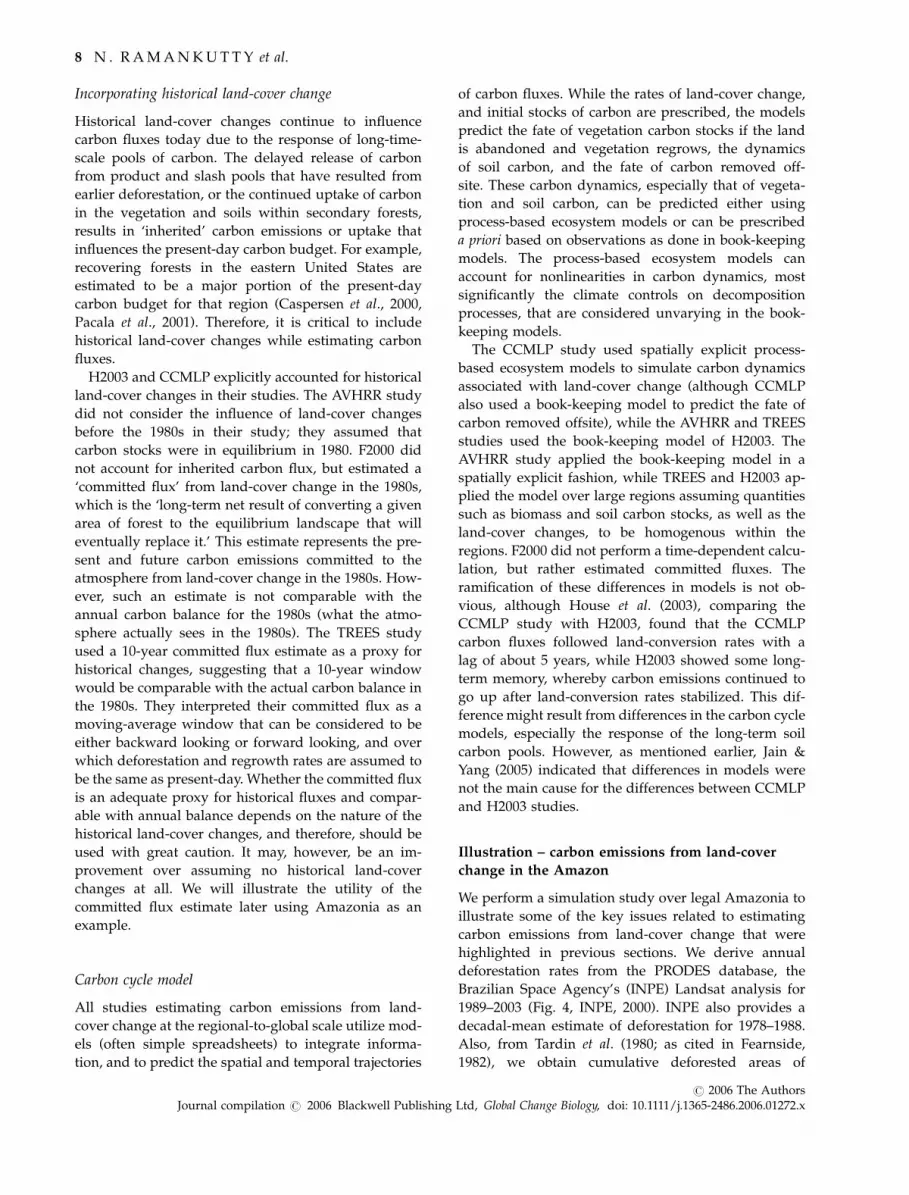
28 595 km2 by 1975 and 77 172 km2 by 1978. Using theseestimates, we estimate annual deforestation rates dur-ing the 1961–1988 period by interpolation, assumingdeforestation rates to be zero before 1961, and assuminglinear growth in deforestation rates during 1961–1974,1975–1977, and 1978–1988. We also smooth the esti-mated annual deforestation rates because we are inter-ested in the long-term trends, and not interannualvariability (Fig. 4).INPE only provides estimates of gross deforestation
(i.e. initial clearing of mature forest, INPE, 2000). Tounderstand the land-cover dynamics following defor-estation, we developed a land-cover transition model.We adapted the Markov matrix of land-cover transitionprobabilities developed by Fearnside (1996), to predicttransitions between primary forest, cropland, pasture,and fallow or secondary forest [e.g. Cardille & Foley,2003; see Appendix A1]. The model predicts that of thetotal deforested land over the 1961–2003 period,roughly 6% remains in croplands, 62% remains inpastures, but almost 32% of the deforested land is inregrowing vegetation (Fig. 4). The resulting areas ofagricultural land are roughly consistent with the agri-cultural census data from IBGE (the Brazilian Instituteof National Statistics and Geography), and the propor-tion of regrowing forests is consistent with the study ofHoughton et al. (2000). The model simulation alsoestimates that the annual rate of clearing of secondaryvegetation exceeds the deforestation rates after 1990;this high rate of secondary vegetation reclearing isconsistent with other studies in the Amazon (Hirsch
et al., 2004; Steininger, 2004). However, this reclearing ismostly of young fallow vegetation representing lowerbiomass clearing, rather than the higher biomass ofmature forest. Whether this reclearing can be observeddepends on the observation method: INPE Landsatanalysis observes the initial clearing of mature forest,but does not revisit that location in future analysis andtherefore will not estimate reclearing (Hirsch et al.,2004), while the AVHRR and TREES analysis do notdistinguish between the clearing of mature and second-ary forests.To estimate the flux of carbon associated with the
land-cover dynamics in Fig. 4, we built a simple book-keeping carbon cycle model for legal Amazonia, similarto that of Houghton et al. (2000; see Appendix A2). Thismodel predicts annual carbon balances from land-coverchange through time. Our results are similar to thosepresented in Houghton et al. (2000) (Fig. 6a). Theinstantaneous burnt flux varies from year to year de-pending on the annual deforestation and fallow reclear-ing rates. The regrowth flux is small initially, and ofopposite sign, but increases over time and attains thesame magnitude as the burnt flux toward the end of thetime period. But the greatest annual flux toward the endof the time period results from the decay of accumu-lated products and slash in the soil (but mostly the slashpool, into which 70% of the initial cleared carbon isallocated). Indeed, during the 1990s in the Amazon, theresults indicate that the magnitude of the net flux ismostly determined by the magnitude of the productand slash decay flux. The flux from regrowing vegeta-
0.0
0.5
1.0
1.5
2.0
2.5
3.0
3.5
1960 1965 1970 1975 1980 1985 1990 1995 20000
10
20
30
40
50
60Fallow regrowthPastureCroplandAnnual deforestation (raw)Annual deforestation (smoothed)Annual fallow reclearing
Cle
arin
g ra
te (
mill
ion
ha y
r–1)
Gro
ssde
fore
sted
Net
defo
rest
ed
Cum
ulat
ive
land
are
a (m
illio
n ha
)
Fig. 4 Deforestation and fallow reclearing rates in the legal Amazon from 1961–2003 (primary y-axis); and land-cover transitions
following deforestation estimated by a Markov transition model (cumulative values shown on secondary y-axis).
C A R BON EM I S S I ON S F ROM TROP I CA L D E FOR E S TAT I ON 9
r 2006 The AuthorsJournal compilation r 2006 Blackwell Publishing Ltd, Global Change Biology, doi: 10.1111/j.1365-2486.2006.01272.x

tion also accumulates to attain the same magnitude (butopposite sign) as the burnt flux. This result highlightsthe importance of considering the fate of deforestedland, the slash and products resulting from the clearing,and historical changes in land cover because the pro-ducts and slash are a result of accumulated carbon frompast land-cover changes.We performed some additional sensitivity experi-
ments using our book-keeping model. To evaluate theerror in carbon flux estimates that would result fromignoring the full land-cover dynamics following defor-estation (Fig. 5), we performed simulations ignoringregrowth, and assuming that regrowing vegetation in-stantaneously attain equilibrium carbon stocks (labelednet deforestation in Fig. 5). As anticipated, the estimatebased on net deforestation (like the CCMLP studywhich inferred deforestation based on changes in agri-cultural land) underestimates the actual carbon emis-sions because it may take up to 100–150 years forregenerating forests to attain the ‘equilibrium’ biomassof mature forests (Brown & Lugo, 1990). On the otherhand, an estimate based on gross deforestation alonewould overestimate carbon fluxes by neglecting theaccumulation of carbon in regrowing vegetation.We performed another simulation where we ignored
the release of carbon from the reclearing of fallow orsecondary vegetation; this assumption, where the re-growth is accounted for but reclearing is not, alsounderestimates carbon emissions (by 17% toward theend of the simulation in 2003 and average of 12% in the1990s). Note that while the fallow reclearing rates
exceed the deforestation rates after 1990 (Fig. 4), thecarbon emissions from reclearing are much lower be-cause the biomass of recleared secondary vegetation ismuch smaller than that of primary forest.Next, we compared committed-flux calculations with
the annual carbon balance approach. The estimate basedon 10-year committed flux misses some of the long-termdynamics in carbon fluxes related to the release fromslash and product pools. In general, the committed fluxestimate overestimates carbon emissions when defores-tation rates are going up, and underestimates emissionswhen deforestation rates are decreasing. This suggeststhat the committed flux calculations are not directlycomparable with the annual-balance calculations. F2000estimated an equilibrium committed flux, which calcu-lates carbon flux commitments far into the future untilan equilibrium landscape is established, and thereforelikely overestimates carbon fluxes.Finally, we did an experiment to explicitly evaluate
the role of historical land-cover changes in present-daycarbon budgets (Fig. 6b). To do so, we reran the modelto calculate annual carbon balances starting from equi-librium in 1981, and again in 1991 (ignoring all carbonfluxes and activity before those dates). The resultsclearly indicate that historical land-cover changes havea large impact on the 1980s and 1990s carbon fluxes inAmazonia. The simulations show that neglecting land-cover change before 1980 underestimates the 1980scarbon fluxes by $38%, and the 1990s fluxes by$13%. Starting calculations in 1991 greatly underesti-mates the 1990s carbon fluxes, by $62%. Again, this is a
Car
bon
emis
sion
s (G
t C y
r–1)
0.00
0.05
0.10
0.15
0.20
0.25
0.30
0.35
0.40
1960 1965 1970 1975 1980 1985 1990 1995 2000 2005
Full land cover accounting
Ignoring regrowth
Net deforestation
Ignoring fallow reclearing
10-year committed flux
Fig. 5 The influence of different assumptions/methods on estimated carbon fluxes from the land-cover changes in Fig. 4.
10 N . RAMANKUT T Y et al.
r 2006 The AuthorsJournal compilation r 2006 Blackwell Publishing Ltd, Global Change Biology, doi: 10.1111/j.1365-2486.2006.01272.x
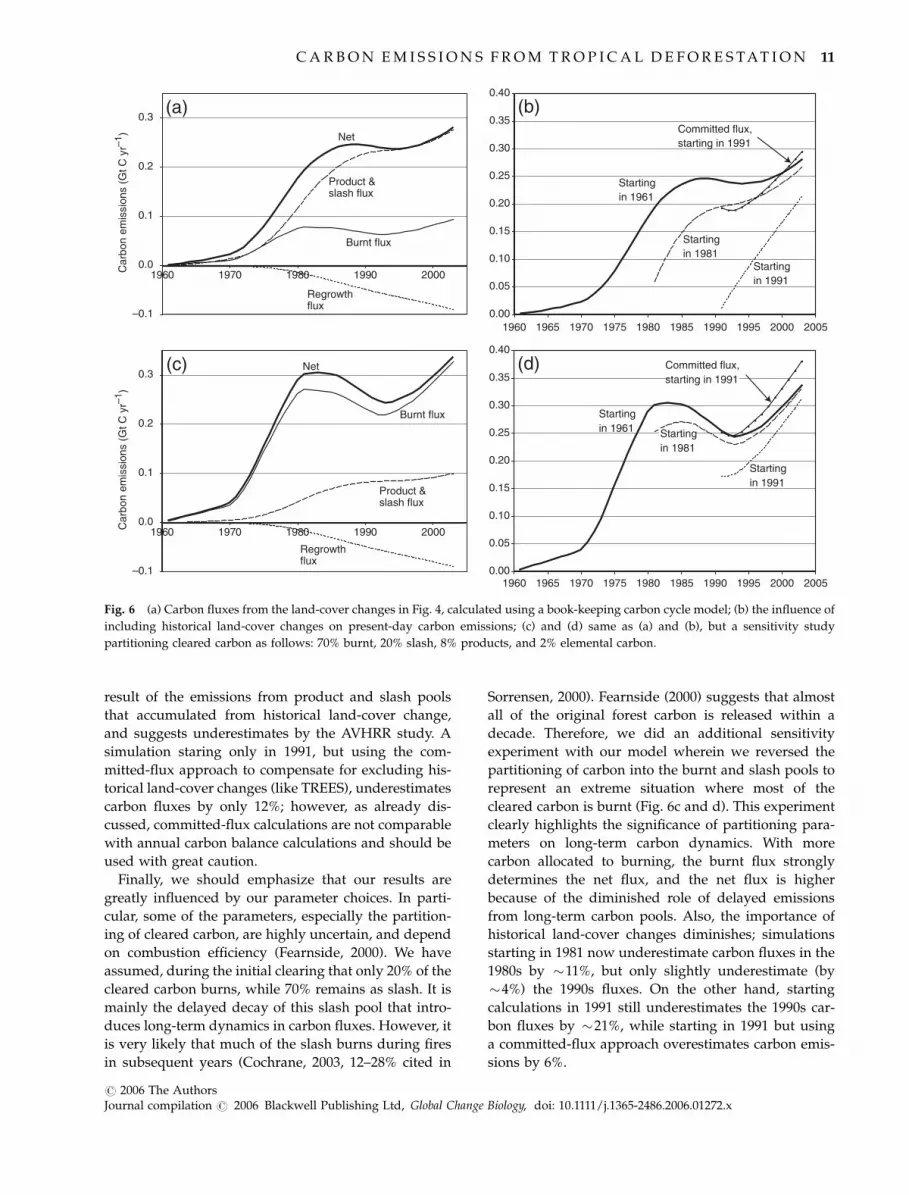
result of the emissions from product and slash poolsthat accumulated from historical land-cover change,and suggests underestimates by the AVHRR study. Asimulation staring only in 1991, but using the com-mitted-flux approach to compensate for excluding his-torical land-cover changes (like TREES), underestimatescarbon fluxes by only 12%; however, as already dis-cussed, committed-flux calculations are not comparablewith annual carbon balance calculations and should beused with great caution.Finally, we should emphasize that our results are
greatly influenced by our parameter choices. In parti-cular, some of the parameters, especially the partition-ing of cleared carbon, are highly uncertain, and dependon combustion efficiency (Fearnside, 2000). We haveassumed, during the initial clearing that only 20% of thecleared carbon burns, while 70% remains as slash. It ismainly the delayed decay of this slash pool that intro-duces long-term dynamics in carbon fluxes. However, itis very likely that much of the slash burns during firesin subsequent years (Cochrane, 2003, 12–28% cited in
Sorrensen, 2000). Fearnside (2000) suggests that almostall of the original forest carbon is released within adecade. Therefore, we did an additional sensitivityexperiment with our model wherein we reversed thepartitioning of carbon into the burnt and slash pools torepresent an extreme situation where most of thecleared carbon is burnt (Fig. 6c and d). This experimentclearly highlights the significance of partitioning para-meters on long-term carbon dynamics. With morecarbon allocated to burning, the burnt flux stronglydetermines the net flux, and the net flux is higherbecause of the diminished role of delayed emissionsfrom long-term carbon pools. Also, the importance ofhistorical land-cover changes diminishes; simulationsstarting in 1981 now underestimate carbon fluxes in the1980s by $11%, but only slightly underestimate (by$4%) the 1990s fluxes. On the other hand, startingcalculations in 1991 still underestimates the 1990s car-bon fluxes by $21%, while starting in 1991 but usinga committed-flux approach overestimates carbon emis-sions by 6%.
Car
bon
emis
sion
s (G
t C y
r–1)
Car
bon
emis
sion
s (G
t C y
r–1)
–0.1
0.0
0.1
0.2
0.3
1960 1970 1980 1990 2000
Product & slash flux
Regrowthflux
Net
(a)
Burnt flux
0.00
0.05
0.10
0.15
0.20
0.25
0.30
0.35
0.40
(b)
Startingin 1961
Startingin 1981
Startingin 1991
Committed flux,starting in 1991
–0.1
0.0
0.1
0.2
0.3
1960 1970 1980 1990 2000
Product & slash flux
Regrowthflux
Net(c)
Burnt flux
0.00
0.05
0.10
0.15
0.20
0.25
0.30
0.35
0.40
1960 1965 1970 1975 1980 1985 1990 1995 2000
(d)
Startingin 1961 Starting
in 1981
Startingin 1991
Committed flux,starting in 1991
2005
1960 1965 1970 1975 1980 1985 1990 1995 2000 2005
Fig. 6 (a) Carbon fluxes from the land-cover changes in Fig. 4, calculated using a book-keeping carbon cycle model; (b) the influence of
including historical land-cover changes on present-day carbon emissions; (c) and (d) same as (a) and (b), but a sensitivity study
partitioning cleared carbon as follows: 70% burnt, 20% slash, 8% products, and 2% elemental carbon.
C A R BON EM I S S I ON S F ROM TROP I CA L D E FOR E S TAT I ON 11
r 2006 The AuthorsJournal compilation r 2006 Blackwell Publishing Ltd, Global Change Biology, doi: 10.1111/j.1365-2486.2006.01272.x
Discussion and conclusions
In this paper, we suggest that five existing studies ofglobal emissions of carbon from land-cover change arenot directly comparable and recommend key considera-tions for future studies that could reduce uncertainty. Wepresent the various elements of a complete land coverand carbon budget scheme, and performed simulationsover legal Amazonia to illustrate the influence of theseelements. These simulations suggest that to accuratelyestimate carbon emissions from land-cover change, it isimportant to: (1) consider the full land-cover dynamicsduring and following deforestation; (2) explicitly includehistorical land-cover change for several decades; and (3)accurately estimate the fate of cleared carbon. Of course,it is also most critical to use the most reliable datasets ondeforestation rates and biomass, and to assess wheneverpossible the impact of uncertainties/errors in the inputdatasets on the resulting estimates (Houghton, 2003b,2005; Mayaux et al., 2005).Our analysis suggests that the CCMLP study has
potentially underestimated land-cover change carbonemissions because of its consideration of only net land-cover changes, while the AVHRR study has potentiallyunderestimated emissions because of not including long-term historical land-cover changes. The TREES studyalso neglected historical land-cover changes, but used a10-year committed flux estimate to compensate for ne-glecting historical land-cover change; but we haveshown here that the committed flux estimate is notdirectly comparable with an annual-balance estimate.While the H2003 study performed a complete analysisof the carbon budget, it may have overestimated carbonfluxes because the rates of deforestation in that study(taken from FAO FRA country surveys) were higher thanAVHRR, TREES, and FAO remote sensing surveys (FAO,2001b; DeFries & Achard, 2002; Houghton, 2003b;Mayaux et al., 2005), and potentially underestimatedfluxes because the coarse spatial resolution of the datamay only have captured net changes and not grosschanges in land cover. The F2000 estimate of equilibriumcommitted flux likely overestimates carbon fluxes be-cause it estimates commitment far into the future untilan equilibrium landscape is established; moreover, it alsouses the higher deforestation rates of the FAO FRA. Insummary, while the existing studies suggest bounds onthe estimates of carbon emissions from tropical defores-tation, a more accurate estimate will require furtherefforts to incorporate the suggested recommendations.
Acknowledgements
This work was supported by NASA’s Office of Earth Science(through Terrestrial Ecology (TE) Program Grant NAG5-13351).
We would like to thank Dr. Wolfgang Cramer and an anonymousreviewer for comments that significantly helped improve thismanuscript.
References
Achard F, Eva HD, Mayaux P et al. (2004) Improved estimates
of net carbon emissions from land cover change in the tropics
for the 1990s. Global Biogeochemical Cycles, 18, GB2008, doi:
2010.1029/2003GB002142.
Achard F, Eva HD, Stibig H-J et al. (2002) Determination of
deforestation rates of the world’s humid tropical forests.
Science, 297, 999–1002.
Agbu PA, James ME (1994) Goddard Distributed Active Archive
Center Publications. GCDG, Greenbelt, MD.
Brown S (1997) Estimating Biomass and Biomass Change of
Tropical Forests: A primer (FAO Forestry Paper – 134). Food
and Agriculture Organization, available online at http://
www.fao.org/docrep/W4095E/w4095e00.htm
Brown S, Lugo AE (1990) Tropical secondary forests. Journal of
Tropical Ecology, 6, 1–32.
Cardille JA, Foley JA (2003) Agricultural land-use change in
Brazilian Amazonia between 1980 and 1995: evidence from
integrated satellite and census data. Remote Sensing of Environ-
ment, 87, 551–562.
Caspersen JP, Pacala SW, Jenkins JC et al. (2000) Contributions of
land-use history to carbon accumulation in US forests. Science,
290, 1148–1151.
Cochrane MA (2003) Fire science for rainforests. Nature, 421,
913–919.
Cramer W, Bondeau A, Schaphoff S et al. (2004) Tropical forests
and the global carbon cycle: impacts of atmospheric CO2,
climate change and rate of deforestation. Philosophical Transac-
tions of the Royal Society of London B, 359, 331–343.
DeFries R, Achard F (2002) New estimates of tropical deforesta-
tion and terrestrial carbon fluxes: results of two complemen-
tary studies. LUCC Newsletter, 8, 7–9.
DeFries RS, Houghton RA, Hansen MC et al. (2002) Carbon
emissions from tropical deforestation and regrowth based on
satellite observations for the 1980s and 1990s. Proceedings of the
National Academy of Sciences of the United States of America, 99,
14256–14261.
Eva HD, Achard F, Stibig HJ et al. (2003) Response to comment
on ‘‘Determination of deforestation rates of the world’s humid
tropical forests’’. Science, 299, 1015b.
FAO (2001a) Food and Agricultural Organization of the United
Nations, Rome, 479 pp.
FAO (2001b) Food and Agriculture Organization, Rome, 15 pp.
FAO (2003) State of the World’s Forests 2003. Food and Agriculture
Organization, Rome, 151 pp.
FAO (2004) Food and Agriculture Organization of the United
Nations, Rome.
Fearnside P (1996) Amazonian deforestation and global warm-
ing: carbon stocks in vegetation replacing Brazil’s Amazon
forest. Forest Ecology and Management, 80, 21–34.
Fearnside PM (1982) Deforestation in the Brazilian Amazon:
how fast is it occurring. Interciencia, 7, 782–788.
Fearnside PM (1994) Biomassa das florestas amazonicas
brasileiras. In: Anais do Seminario Emissao e Sequestro de CO2,
12 N . RAMANKUT T Y et al.
r 2006 The AuthorsJournal compilation r 2006 Blackwell Publishing Ltd, Global Change Biology, doi: 10.1111/j.1365-2486.2006.01272.x

pp. 95–124, Companhia Vale do Rio Doce (CVRD), Rio de
Janeiro, Brazil.
Fearnside PM (1997) Greenhouse gases from deforestation in
Brazilian Amazonia: net committed emissions. Climate Change,
35, 321–360.
Fearnside PM (2000) Global warming and tropical land-use
change: greenhouse gas emissions from biomass burning,
decomposition and soils in forest conversion, shifting cultiva-
tion and secondary vegetation. Climatic Change, 46, 115–158.
Fearnside PM, LauranceWF (2003) Comment on ‘‘Determination
of deforestation rates of the world’s humid tropical forests’’.
Science, 229, 1015a.
Fearnside PM, Laurance WF (2004) Tropical deforestation and
greenhouse-gas emissions. Ecological Applications, 14, 982–986.
Grainger A (1996) An analysis of FAO’s tropical forest resource
assessment 1990. The Geographical Journal, 162, 73–79.
Hirsch AI, Little WS, Houghton RA et al. (2004) The net carbon
flux due to deforestation and forest re-growth in the Brazilian
Amazon: analysis using a process-based model. Global Change
Biology, 10, 908–924.
Houghton RA (1999) The annual net flux of carbon to the atmo-
sphere from changes in land use 1850–1990. Tellus, 51B, 298–313.
Houghton RA (2003a) Revised estimates of the annual net flux of
carbon to the atmosphere from changes in land use and land
management 1850–2000. Tellus Series B – Chemical and Physical
Meteorology, 55, 378–390.
Houghton RA (2003b) Why are estimates of the terrestrial carbon
balance so different? Global Change Biology, 9, 500–509.
Houghton RA (2005) Aboveground forest biomass and the global
carbon balance. Global Change Biology, 11, 945–958, doi:
10.1111/j.1365-2486.2005.00955.x.
Houghton RA, Boone RD, Melillo JM et al. (1985) Net flux of
carbon dioxide from tropical forests in 1980. Nature, 316,
617–620.
Houghton RA, Goodale CL (2004) Effects of land-use change on
the carbon balance of terrestrial ecosystems. In: Ecosystems and
Land Use Change (eds DeFries RS, Asner GP, Houghton RA),
pp. 85–98. American Geophysical Union, Washington, DC.
Houghton RA, Hobbie JE, Melillo JM et al. (1983) Changes in the
carbon content of terrestrial biota and soils between 1860 and
1980: a net release of CO2 to the atmosphere. Ecological Mono-
ngraphs, 53, 235–262.
Houghton RA, Lawrence KT, Hackler JL et al. (2001) The spatial
distribution of forest biomass in the Brazilian Amazon: a
comparison of estimates. Global Change Biology, 7, 731–746.
Houghton RA, Skole DL, Nobre CA et al. (2000) Annual fluxes or
carbon from deforestation and regrowth in the Brazilian
Amazon. Nature, 403, 301–304.
House JI, Prentice IC, Ramankutty N et al. (2003) Reconciling
apparent inconsistencies in estimates of terrestrial CO2 sources
and sinks. Tellus Series B – Chemical and Physical Meteorology, 55,
345–363.
INPE (2000) Monitoramento da Floresta Amazonica Brasileira por
Satelite, Projeto PRODES. Instituto Nacional de Pesquisas
Especiais, Sao Paulo, Brazil, available online at http://www.
obt.inpe.br/prodes/index.html
Jain AK, Yang X (2005) Modeling the effects of two different land
cover change data sets on the carbon stocks of plants and soils
in concert with CO2 and climate change. Global Biogeochemical
Cycles, 19, GB2015, doi: 2010.1029/2004GB002349.
Lepers E, Lambin EF, Janetos AC et al. (2005) A synthesis
of information on rapid land-cover change for the period
1981–2000. Bioscience, 55, 115–124.
Matthews E (2001)Understanding the FRA 2000, Forest Briefing No.
1. World Resources Institute, Washington, DC. 12 pp.
Mayaux P, Holmgren P, Achard F et al. (2005) Tropical forest
cover change in the 1990’s and options for future monitoring.
Philosophical Transactions of the Royal Society B: Biological
Sciences (Philosophical Transactions B), 360, 373–384.
McGuire AD, Sitch S, Clein JS et al. (2001) Carbon balance of the
terrestrial biosphere in the twentieth century: analyses of CO2,
climate and land use effects with four process-based ecosys-
tem models. Global Biogeochemical Cycles, 15, 183–206.
Murty D, Kirschbaum MUF, McMurtrie RE et al. (2002) Does
conversion of forest to agricultural land change soil carbon
and nitrogen? A review of the literature. Global Change Biology,
8, 105–123.
Pacala SW, Hurtt GC, Baker D et al. (2001) Consistent land- and
atmosphere-based US carbon sink estimates. Science, 292,
2316–2320.
Prentice IC, Farquhar G, Fashm M et al. (2001) The carbon cycle
and atmospheric carbon dioxide. In: Climate Change 2001: The
Scientific Basis. Contribution of Working Group I to the Third
Assessment Report of the Intergovernmental Panel on Climate
Change (eds Houghton JT, Ding Y, Griggs DJ et al.), pp. 183–
237. Cambridge University Press, Cambridge.
Ramankutty N, Foley JA (1999) Estimating historical changes in
global land cover: croplands from 1700 to 1992. Global Biogeo-
chemical Cycles, 13, 997–1027.
Sorrensen CL (2000) Linking smallholder land use and fire
activity: examining biomass burning in the Brazilian lower
Amazon. Forest Ecology and Management, 128, 11–25.
Steininger MK (2004) Net carbon fluxes from forest clearance and
regrowth in the Amazon. Ecological Applications, 14, S313–S322.
Tardin AT, Lee DCL, Santos RJR et al. (1980) Subprojeto Desma-
tarnento, Conveino IBDF/CNPq-INPE 1979. Instituto Nacional
de Pesquisas Espaciais (INPE), Sao Jose dos Campos, Sao
Paulo, 44 pp.
Appendix: model descriptions
Here, we provide the details on the land-cover transi-tion model and the book-keeping carbon cycle model.
Land-cover transition model
Let D(t), t5 1961, 1962, . . ., 2003 be the deforestationrates at time ‘t’ in million ha yr!1.
Let AC%t; t&;t'1961;1962;...;2003t'1;2;...;t!1961(1 be the cropland area
(Mhayr!1) at time ‘t’, age-cohort ‘t’,let AP%t; t&;t'1961;1962;...;2003
t'1;2;...;t!1961(1 be the pasture area
(Mhayr!1) at time ‘t’, age-cohort ‘t’, andlet ASF%t; t&;t'1961;1962;...;2003
t'1;2;...;t!1961(1 be the area of secondary
forest (Mhayr!1) at time ‘t’, age-cohort ‘t’.
C A R BON EM I S S I ON S F ROM TROP I CA L D E FOR E S TAT I ON 13
r 2006 The AuthorsJournal compilation r 2006 Blackwell Publishing Ltd, Global Change Biology, doi: 10.1111/j.1365-2486.2006.01272.x

A first-order Markov model of transition probabilitiesbetween land-cover classes can be specified as follows:
AC
AP
ASF
2
4
3
5t;t
'aC;C aP;C aSF;CaC;P aP;P aSF;PaC;SF aSF aSF;SF
2
4
3
5AC
AP
ASF
2
4
3
5t!1;t!1
;
where the matrix a contains the land-cover transitionprobabilities.However, a transition from one land-cover class to
another should reset the cohort age to 1, and therefore,the above form of the equation is applied as follows:First, the deforested land every year is partitioned
into the 1-year age classes as follows:
AC%t; 1& ' D%t& ) 0:347
AP%t; 1& ' D%t& ) 0:653
ASF%t; 1& ' 0:
Next, to the 1-year-age cohorts, we add the area thatresults from the transition from other land-coverclasses:
AC
AP
ASF
2
4
3
5t;1
'0:347D%t&0:653D%t&
0
2
4
3
5
(0 aP;C aSF;C
aC;P 0 aSF;PaC;SF aP;SF 0
2
4
3
5AC
AP
ASF
2
4
3
5t!1;t!1
:
Finally, for age cohorts older than 1 year, we estimatethe within-class transition of land-cover classes:
AC
AP
ASF
2
4
3
5t;t
'aC;C 0 00 aP;P 00 0 aSF;SF
2
4
3
5AC
AP
ASF
2
4
3
5t!1;t!1
;
for t5 2,3, . . ., t.Fearnside (1996) estimated land-cover transition
probabilities between six different land-cover classesfor the Amazon. Here, we adapted his model, butlumped it to consider only three land-cover classes.The transition probabilities for our three-class modelare
a '0:450 0:000 0:0630:468 0:895 0:1150:082 0:105 0:822
2
4
3
5:
The initial conditions for this model are
AC%0; 0& ' 0;AP%0; 0& ' 0;ASF%0; 0& ' 0:
From the results of this model, we can also calculatethe annual rate of reclearing of secondary vegetation as
ASF; clear%t; t& ' ASF%t! 1; t! 1&%aSF; C ( aSF;P&:
Book-keeping carbon cycle models
Estimates based on complete accounting of annual carbonbalance
Carbon stock in vegetation5Cveg5 177 tons-Cha!1
(Houghton et al., 2001).The biomass cleared is partitioned into biomass burnt
instantaneously (fburn), biomass left as slash on the site(fslash), biomass transferred to product pools (fprod), andbiomass that goes into elemental carbon (felem) as follows:
fburn ' 0:2; fslash ' 0:7; fprod ' 0:08; felem ' 0:02:
The various carbon fluxes include flux from instanta-neous burning (Cf, burn), flux from decay of product, slashand elemental carbon pools (Cf, decay), and flux due tocarbon uptake by regrowing secondary forests (Cf, regrowth).The biomass cleared every year is the sum of biomass
from deforestation and the biomass from cleared sec-ondary vegetation:
Bioclear%t& ' Biodefore%t& ( BioSF clear%t&GtCyr!1:
The biomass cleared from deforestation is
Biodefor%t& ' 0:001Cveg D%t& GtCyr!1:
where the factor ‘0.001’ converts units of D(t) fromMhayr!1 to billion ha yr!1.The biomass from recleared secondary vegetation is
BioSF clear%t& ' 0:001Xt
t'1
CSF%t1&ASF; clear%t; t&GtCyr!1;
where CSF, the biomass in secondary vegetation, iscalculated as follows:
CSF%t& 'Cveg0:7t=25GtC; if t * 25 years
Cveg%0:7( 0:3%t! 25&=50&GtC; if 25 < t * 75 years
CvegGtC; if t > 75 years:
8><
>:
Note that this biomass is calculated for age-cohortt!1 because the cleared biomass has the biomass of theprevious year.The burnt flux is calculated as follows:
Cf;burn%t& ' Bioclear%t& fburn GtCyr!1:
The annual transfer of carbon to the slash, product,and elemental carbon pools are
Cin; slash%t& 'Bioclear%t& fslash GtCyr!1;
Cin;prod%t& 'Bioclear%t& fslash GtCyr!1;
Cin; elem%t& 'Bioclear%t& felem GtC yr!1:
14 N . RAMANKUT T Y et al.
r 2006 The AuthorsJournal compilation r 2006 Blackwell Publishing Ltd, Global Change Biology, doi: 10.1111/j.1365-2486.2006.01272.x

The slash, product and elemental pools experienceexponential decay. Thus, the carbon flux dynamics ofthe slash, product, and elemental pools can be ex-pressed using the differential equation:
dC
dt' Cin ! lC;
where Cin is the transfer of carbon from deforestation,and l is the decay rate. Thus, the carbon dynamics forthe various pools can be calculated using
Cslash%t& 'Cslash%t! 1&%1! lslash& ( Cin;slash%t& GtC;
Cprod%t& 'Cprod%t! 1&%1! lprod& ( Cin;prod%t& GtC;
Celem%t& 'Celem%t! 1&%1! lelem& ( Celem;0%t& GtC;
and the fluxes of carbon from the decay of these pools iscalculated as
Cf;decay%t& ' lslash Cslash%t! 1& ( lprod Cprod%t! 1&
( lelem Celem%t! 1& GtCyr!1;
where lslash5 0.1, lprod5 0.1, and lelem5 0.001.Regrowing forests are assumed to recover 70% of
their original biomass in 25 years and the remaining30% over the next 50 years. The carbon flux from uptakeby regrowing forests is
Cf; regrowth%t& '
!P25
t'0ASF%t; t&Cveg 0:7=25 GtCyr!1; if t * 25 years
!h P25
t'0ASF%t; t&Cveg 0:7=25
(P75
t'26ASF%t; t& Cveg 0:3=50 GtCyr!1
i if 25 < t * 75 years
0 GtCyr!1; if t > 75 years:
8>>>>>>>>>>><
>>>>>>>>>>>:
Total net emissions from land-cover change is
Cf;net%t& ' Cf; burn%t& ( Cf;decay%t& ( Cf; regrowth%t&
GtCyr!1:
Note that the cropland and pasture area estimates arenot used in the carbon calculations. Only the area ofsecondary forest plays a role in carbon flux estimates. Thecropland and pasture areas represent very little biomasscompared with the forested landscapes, and therefore,not included here in our illustrative simulations.
Estimates ignoring regrowth flux or assuming only netdeforestation
Carbon flux estimates ignoring the regrowth flux canbe calculated using the same formulations as in A2.1,but using
Cf;net%t& ' Cf; burn%t& ( Cf;decay%t& GtCyr!1:
For carbon-flux estimates using net deforestationassumptions, we first calculate net deforestation ratesas follows:
Dnet%t& '
D%t& !Xt
t'1
AF%t; t& !Xt
t'1
ASF%t! 1; t! 1&
" #
Mhayr!1:
Then, we calculate carbon fluxes using the sameequations as in A2.1, but replacing D(t) with Dnet(t)and setting BioSF clear(t)5 0.
Estimates ignoring reclearing of fallow or secondary
Carbon flux estimates ignoring the reclearing of sec-ondary vegetation can be calculated using the sameformulation as in A2.1, but setting BioSF clear(t)5 0.
Estimates based on the committed flux approach
The committed flux calculations do not include anyhistorical information. Therefore, the slash, product,and elemental carbon pools do not accumulate carbon.Every year, a new cohort of carbon pools is establishedfrom the deforestation of that year, and the total area ofregrowth during that year is also calculated. Then, for a10-year committed-flux estimate, the fluxes from decaysof the various carbon pools, as well as from the re-growth of secondary forests are estimated for the next10 years.The burnt flux estimate is identical to the full-ac-
counting calculations:
Cf; burn%t& ' Bioclear%t& fburn Gt Cyr!1:
The annual transfer of carbon to the slash, product,and elemental carbon pools are
Cin;slash%t& 'Bioclear%t& fslash GtCyr!1;
Cin;prod%t& 'Bioclear%t& fprod GtCyr!1;
Cin; elem%t& 'Bioclear%t& felem GtC yr!1:
The slash, product and elemental pools experienceexponential decay. The decay of the slash, product, andelemental pools can be calculated for the next 10 yearsasFor t5 1, 2, . . ., 10 years,
Cslash%t; t& ' Cin;slash%t& e!lslash t GtC;
Cprod%t; t& ' Cin;prod%t& e!lprod t GtC;
Celem%t; t& ' Cin;elem%t& e!lelem t GtC;
CAR BON EM I S S I ON S F ROM TROP I CA L D E FOR E S TAT I ON 15
r 2006 The AuthorsJournal compilation r 2006 Blackwell Publishing Ltd, Global Change Biology, doi: 10.1111/j.1365-2486.2006.01272.x

and therefore, the total committed flux of carbon fromthe decay of these pools over the next 10 years can becalculated as
Cf;decay%t& ' Cin;slash%t&%1! e!10lslash& ( Cin;prod%t&%1! e!10lprod& ( Cin;elem%t&%1! e!10lelem&
GtCyr!1:
In the case of secondary forest regrowth, a committedflux calculation estimates the rate of regrowth, but doesnot account for the different age-classes of the regrow-ing forest. Each year, based on an estimate of total areaof regrowth, a new cohort of regrowing forest is estab-lished, and its carbon accumulation over the next 10years is estimated. Thus, the total amount of regrowthin each year is calculated as
Aregrowth%t& 'Xt
t'1
ASF%t; t& !Xt
t'1
ASF%t! 1; t! 1&
" #
Mhayr!1:
Regrowing forests recover 70% of their original bio-mass in 25 years. Thus, the total committed flux over thenext 10 years from carbon accumulation in regrowthcan be calculated as
Cf; regrowth%t& ' !0:001 Aregrowth%t&Cveg 0:7) 10=25
GtC yr!1:
Total net emissions from land-cover change is
Cf;net%t& ' Cf; burn%t& ( Cf;decay%t& ( Cf; regrowth%t&
GtCyr!1:
16 N . RAMANKUT T Y et al.
r 2006 The AuthorsJournal compilation r 2006 Blackwell Publishing Ltd, Global Change Biology, doi: 10.1111/j.1365-2486.2006.01272.x