draft scoping report - the duel coal project - SAHRIS
145
DRAFT SCOPING REPORT THE DUEL COAL PROJECT FOR LISTED ACTIVITIES ASSOCIATED WITH A MINING RIGHT APPLICATION SUBMITTED FOR ENVIRONMENTAL AUTHORIZATIONS IN TERMS OF THE NATIONAL ENVIRONMENTAL MANAGEMENT ACT, 1998 AND THE NATIONAL ENVIRONMENTAL MANAGEMENT WASTE ACT, 2008 IN RESPECT OF LISTED ACTIVITIES THAT HAVE BEEN TRIGGERED BY APPLICATIONS IN TERMS OF THE MINERAL AND PETROLEUM RESOURCES DEVELOPMENT ACT, 2002 (MPRDA) (AS AMENDED). NAME OF APPLICANT: Subiflex (Pty) Ltd TEL NO: 072 405 0535 / 082 076 6073 FAX NO: None EMAIL ADDRESS: [email protected] POSTAL ADDRESS: PO Box 11638, Bendor Park, Polokwane, 0713 PHYSICAL ADDRESS: 63 Compensatie Street, Polokwane, 0699 FILE REFERENCE NUMBER SAMRAD: To be Confirmed
-
Upload
khangminh22 -
Category
Documents
-
view
4 -
download
0
Transcript of draft scoping report - the duel coal project - SAHRIS
DRAFT SCOPING REPORT
THE DUEL COAL PROJECT
FOR LISTED ACTIVITIES ASSOCIATED WITH A MINING
RIGHT APPLICATION
SUBMITTED FOR ENVIRONMENTAL AUTHORIZATIONS IN TERMS OF THE NATIONAL
ENVIRONMENTAL MANAGEMENT ACT, 1998 AND THE NATIONAL ENVIRONMENTAL
MANAGEMENT WASTE ACT, 2008 IN RESPECT OF LISTED ACTIVITIES THAT HAVE
BEEN TRIGGERED BY APPLICATIONS IN TERMS OF THE MINERAL AND PETROLEUM
RESOURCES DEVELOPMENT ACT, 2002 (MPRDA) (AS AMENDED).
NAME OF APPLICANT: Subiflex (Pty) Ltd
TEL NO: 072 405 0535 / 082 076 6073
FAX NO: None
EMAIL ADDRESS: [email protected]
POSTAL ADDRESS: PO Box 11638, Bendor Park, Polokwane, 0713
PHYSICAL ADDRESS: 63 Compensatie Street, Polokwane, 0699
FILE REFERENCE NUMBER SAMRAD: To be Confirmed

ii | P a g e
IMPORTANT NOTICE
In terms of the Mineral and Petroleum Resources Development Act (Act 28 of 2002 as amended),
the Minister must grant a prospecting or mining right if among others the mining “will not result in
unacceptable pollution, ecological degradation or damage to the environment”.
Unless an Environmental Authorisation can be granted following the evaluation of an
Environmental Impact Assessment and an Environmental Management Programme report in terms
of the National Environmental Management Act (Act 107 of 1998) (NEMA), it cannot be concluded
that the said activities will not result in unacceptable pollution, ecological degradation or damage to
the environment.
In terms of section 16(3)(b) of the EIA Regulations, 2014, any report submitted as part of an
application must be prepared in a format that may be determined by the Competent Authority and
in terms of section 17 (1) (c) the competent Authority must check whether the application has taken
into account any minimum requirements applicable or instructions or guidance provided by the
competent authority to the submission of applications.
It is therefore an instruction that the prescribed reports required in respect of applications for an
environmental authorisation for listed activities triggered by an application for a right or permit are
submitted in the exact format of, and provide all the information required in terms of, this template.
Furthermore, please be advised that failure to submit the information required in the format
provided in this template will be regarded as a failure to meet the requirements of the Regulation
and will lead to the Environmental Authorisation being refused.
It is furthermore an instruction that the Environmental Assessment Practitioner (EAP) must
process and interpret his/her research and analysis and use the findings thereof to compile the
information required herein. (Unprocessed supporting information may be attached as
appendices). The EAP must ensure that the information required is placed correctly in the relevant
sections of the Report, in the order, and under the provided headings as set out below, and ensure
that the report is not cluttered with un-interpreted information and that it unambiguously represents
the interpretation of the applicant.

iii | P a g e
OBJECTIVE OF THE SCOPING PROCESS
1) The objective of the scoping process is to, through a consultative process—
(a) identify the relevant policies and legislation relevant to the activity;
(b) motivate the need and desirability of the proposed activity, including the need and desirability of the
activity in the context of the preferred location;
(c) identify and confirm the preferred activity and technology alternative through an impact and risk
assessment and ranking process;
(d) identify and confirm the preferred site, through a detailed site selection process, which includes an
impact and risk assessment process inclusive of cumulative impacts and a ranking process of all the
identified alternatives focusing on the geographical, physical, biological, social, economic, and
cultural aspects of the environment;
(e) identify the key issues to be addressed in the assessment phase;
(f) agree on the level of assessment to be undertaken, including the methodology to be applied, the
expertise required as well as the extent of further consultation to be undertaken to determine the
impacts and risks the activity will impose on the preferred site through the life of the activity,
including the nature, significance, consequence, extent, duration and probability of the impacts to
inform the location of the development footprint within the preferred site; and
(g) identify suitable measures to avoid, manage, or mitigate identified impacts and to determine the
extent of the residual risks that need to be managed and monitored.
_________
iv | P a g e
TABLE OF CONTENT
1 INTRODUCTION ....................................................................................................................... 1
2 ENVIRONMENTAL ASSESSMENT PRACTITIONER ........................................................ 3
3 DESCRIPTION OF THE PROPERTY .................................................................................... 4
4 LOCALITY MAP ........................................................................................................................ 5
5 DESCRIPTION OF THE SCOPE OF THE PROPOSED OVERALL ACTIVITY .............. 6
5.1 LISTED AND SPECIFIC ACTIVITIES ........................................................................................................... 6
5.2 DESCRIPTION OF THE ACTIVITIES TO BE UNDERTAKEN .........................................................................11
5.2.1 Mining Methodology .................................................................................................................................. 11
5.2.1.1 Open Pit Mining ......................................................................................................................................... 11
5.2.1.2 Underground Mining .................................................................................................................................. 13
5.2.1.3 LOM Schedule ............................................................................................................................................ 16
5.2.1.3.1 Open Pit ...................................................................................................................................................... 16
5.2.1.3.2 Underground LOM Schedule ...................................................................................................................... 17
5.2.1.3.3 Open pit and Underground combined LOM Schedule ............................................................................... 18
5.2.2 Coal Processing Facility .............................................................................................................................. 19
5.2.2.1 Raw Coal Handling...................................................................................................................................... 20
5.2.2.2 CHPP ........................................................................................................................................................... 21
5.2.2.2.1 Plant Feed................................................................................................................................................... 21
5.2.2.2.2 Desliming Circuit ........................................................................................................................................ 22
5.2.2.2.3 Pre-Scalp Dense Medium Circuit ................................................................................................................ 22
5.2.2.2.4 Coarse Product Dewatering ....................................................................................................................... 24
5.2.2.2.5 Density Control and Magnetite Recovery Circuit ....................................................................................... 24
5.2.2.2.6 Fine Coal Circuit .......................................................................................................................................... 25
5.2.2.2.7 Flotation Circuit .......................................................................................................................................... 26
5.2.2.2.8 Tailings Thickener ....................................................................................................................................... 27
5.2.2.2.9 Rejects and Tailings Dewatering Circuit ..................................................................................................... 27
5.2.2.2.10 Coarse Reject Handling .............................................................................................................................. 27
5.2.2.3 Reagent and Flocculant Supply .................................................................................................................. 27
5.2.2.3.1 Flotation Reagents ..................................................................................................................................... 27
5.2.2.3.2 Flocculant ................................................................................................................................................... 28
5.2.2.4 Product Handling ........................................................................................................................................ 28
5.2.2.5 Product Yields ............................................................................................................................................. 28
5.2.2.6 CHPP Services ............................................................................................................................................. 29
5.2.2.6.1 Air Services ................................................................................................................................................. 29
5.2.2.6.2 Reagents/Diesel System ............................................................................................................................. 29
5.2.2.6.3 Magnetite Bulk Storage .............................................................................................................................. 30
5.2.2.6.4 Flocculant Bulk Storage .............................................................................................................................. 30
5.2.2.6.5 Power System Demand .............................................................................................................................. 30
5.2.3 Infrastructure ............................................................................................................................................. 30

v | P a g e
5.2.4 Water Requirements .................................................................................................................................. 31
5.2.4.1 Fire System / Washdown / Dust Suppression Systems .............................................................................. 31
5.2.4.1.1 Fire Protection System ............................................................................................................................... 31
5.2.4.1.2 Washdown Water ...................................................................................................................................... 32
5.2.4.1.3 Dust Suppression ........................................................................................................................................ 32
5.2.4.2 Raw Water .................................................................................................................................................. 32
5.2.4.3 Potable Water ............................................................................................................................................ 33
5.2.4.4 Gland Seal Water ........................................................................................................................................ 33
5.2.4.5 Other Mining Activities .............................................................................................................................. 33
5.2.5 Mine Residue Management ....................................................................................................................... 33
5.2.5.1 Mining Waste ............................................................................................................................................. 33
5.2.5.2 Non-Mining Waste ..................................................................................................................................... 34
5.2.5.2.1 Sewage ....................................................................................................................................................... 34
5.2.5.2.2 General and Hazardous Waste ................................................................................................................... 36
5.2.6 Closure Planning and Rehabilitation .......................................................................................................... 36
5.2.6.1 Rehabilitation Objectives ........................................................................................................................... 36
5.2.6.2 Rehabilitation Plan ..................................................................................................................................... 37
6 POLICY AND LEGISLATIVE CONTEXT ............................................................................ 38
6.1 APPLICABLE LEGISLATION ....................................................................................................................38
6.2 APPROACH TO ENVIRONMENTAL AUTHORISATION AND STAKEHOLDER ENGAGEMENT......................39
6.3 LICENSING REQUIREMENTS ..................................................................................................................41
6.4 PERIOD FOR WHICH ENVIRONMENTAL AUTHORISATION IS REQUIRED ................................................41
7 NEED AND DESIRABILITY OF THE PROJECT .............................................................. 42
7.1 ECONOMIC BENEFITS ...........................................................................................................................42
7.2 SOCIAL AND LABOUR PLAN ..................................................................................................................42
7.2.1 Job Creation ............................................................................................................................................... 43
7.2.2 Workforce Development ............................................................................................................................ 43
7.2.3 Community Development .......................................................................................................................... 43
8 DESCRIPTION OF THE PROCESS FOLLOWED TO REACH THE PREFERRED SITE
44
8.1 DEVELOPMENT ALTERNATIVES CONSIDERED .......................................................................................44
8.2 DETAILS OF PUBLIC PARTICIPATION PROCESS FOLLOWED....................................................................45
8.2.1 IAP register ................................................................................................................................................. 45
8.2.2 Written Notice of the Application .............................................................................................................. 45
8.2.3 Advertisements and On-site Notifications ................................................................................................. 46
8.2.4 Availability of Project Documentation ....................................................................................................... 46
8.2.5 IAP Engagements and Meetings ................................................................................................................. 47

vi | P a g e
8.3 SUMMARY OF ISSUES RAISED BY IAPs ..................................................................................................49
8.4 ENVIRONMENTAL ATTRIBUTES ASSOCIATED WITH THE SITE ................................................................52
8.4.1 Baseline Environment ................................................................................................................................ 52
8.4.1.1 Conservation Characteristics of The Duel Project ...................................................................................... 52
8.4.1.1.1 Formal and Informal Protected Areas ........................................................................................................ 52
8.4.1.1.2 Important Bird Areas (IBA) ......................................................................................................................... 52
8.4.1.1.3 Importance according to the Mining and Biodiversity Guideline (2012) ................................................... 54
8.4.1.1.4 Importance according to the Limpopo Conservation Plan Version 2 ......................................................... 54
8.4.1.2 Biophysical Environment ............................................................................................................................ 56
8.4.1.2.1 Topography and Landscape Character ....................................................................................................... 56
8.4.1.2.2 Land Capability ........................................................................................................................................... 58
8.4.1.2.3 Biodiversity ................................................................................................................................................. 60
8.4.1.2.3.1 Vegetation .................................................................................................................................................. 60
8.4.1.2.3.2 Fauna .......................................................................................................................................................... 62
8.4.1.2.4 Surface Water ............................................................................................................................................ 63
8.4.1.2.5 Wetlands .................................................................................................................................................... 66
8.4.1.2.6 Surface and Groundwater Use ................................................................................................................... 68
8.4.1.2.7 Ambient Air Quality .................................................................................................................................... 70
8.4.1.2.8 Ambient Noise ............................................................................................................................................ 70
8.4.1.3 Cultural and Heritage Resources ................................................................................................................ 70
8.4.1.3.1 Literature Survey ........................................................................................................................................ 70
8.4.1.3.2 Survey Results ............................................................................................................................................ 72
8.4.1.3.2.1 Stone Age remains ..................................................................................................................................... 72
8.4.1.3.2.2 Iron Age ...................................................................................................................................................... 72
8.4.1.3.2.3 Intangible Heritage ..................................................................................................................................... 72
8.4.1.3.2.4 The built environment ................................................................................................................................ 72
8.4.1.3.2.5 Palaeontology ............................................................................................................................................. 72
8.4.1.3.2.6 Conclusions ................................................................................................................................................ 73
8.4.1.4 Socio-Economic Character ......................................................................................................................... 75
8.4.1.4.1 Towns and Settlements .............................................................................................................................. 76
8.4.1.4.1.1 Urban Settlements ..................................................................................................................................... 76
8.4.1.4.1.2 Rural Settlements ....................................................................................................................................... 76
8.4.1.4.2 Surface Ownership ..................................................................................................................................... 77
8.4.1.4.2.1 Mining Right Area ....................................................................................................................................... 77
8.4.1.4.2.2 Neighbouring Properties ............................................................................................................................ 78
8.4.1.5 Neighbouring Traditional Leadership and Communities............................................................................ 79
8.4.1.5.1 Makushu Traditional Leadership and Community ..................................................................................... 79
8.4.1.5.2 Mosholombe Traditional Leadership and Community ............................................................................... 79
8.4.1.5.3 NepfumembeTraditional Leadership and Community ............................................................................... 79
8.4.2 Description of Current Land Use ................................................................................................................ 80
8.4.2.1 Game Farming ............................................................................................................................................ 80
8.4.2.2 Irrigation ..................................................................................................................................................... 80
8.4.2.3 Communities .............................................................................................................................................. 80
8.4.2.4 Water ......................................................................................................................................................... 80
8.4.2.5 Monetary value of Current Activities ......................................................................................................... 81
8.4.2.6 Macro-Economic Analysis of Current Activities ......................................................................................... 82
8.4.2.6.1 Area 1 - The Duel ........................................................................................................................................ 82
8.4.2.6.2 Area 2 - 5 km Radius ................................................................................................................................... 82

vii | P a g e
8.4.2.6.3 Area 3 – 10 km Radius ................................................................................................................................ 83
8.4.2.6.4 Total All Areas ............................................................................................................................................ 83
8.4.3 Description of Specific Environmental Features and Infrastructure on the Site ........................................ 84
8.4.4 Environmental and Current Land Use Map ................................................................................................ 85
8.5 DESCRIPTION OF POTENTIAL IMPACTS .................................................................................................86
8.5.1 Soils, Land Use and Land Capability ........................................................................................................... 86
8.5.2 Biodiversity ................................................................................................................................................. 89
8.5.2.1 Flora ........................................................................................................................................................... 89
8.5.2.2 Fauna .......................................................................................................................................................... 90
8.5.2.3 Aquatic Systems ......................................................................................................................................... 90
8.5.3 Surface Water ............................................................................................................................................ 91
8.5.3.1 Impacts on Quantity ................................................................................................................................... 91
8.5.3.1.1 Impact on mean annual run-off to major rivers ......................................................................................... 91
8.5.3.1.2 Change to peak flow rates in the major rivers during flood conditions ..................................................... 92
8.5.3.1.3 Drying up of tributaries and establishment of new watercourse due to canalisation ............................... 92
8.5.3.2 Impacts on quality ...................................................................................................................................... 92
8.5.3.2.1 Increased sediment load in the major rivers .............................................................................................. 93
8.5.3.2.2 Impaired water quality due to pollutants discharged or dirty water runoff .............................................. 93
8.5.4 Groundwater .............................................................................................................................................. 94
8.5.4.1 Groundwater Inflows ................................................................................................................................. 94
8.5.4.2 Groundwater Contamination ..................................................................................................................... 95
8.5.5 Air Quality .................................................................................................................................................. 95
8.5.5.1 Construction Impacts ................................................................................................................................. 95
8.5.5.2 Operational Impacts ................................................................................................................................... 96
8.5.5.3 Rehabilitation Phase................................................................................................................................... 97
8.5.6 Ambient Noise ............................................................................................................................................ 97
8.5.6.1 Potential Noise Sources – Construction ..................................................................................................... 97
8.5.6.2 Potential Noise Sources – Operational....................................................................................................... 98
8.5.7 Blasting and Vibration ................................................................................................................................ 98
8.5.7.1 Possible area of influence .......................................................................................................................... 98
8.5.7.2 Anticipated Impacts ................................................................................................................................... 99
8.5.8 Visual Exposure and Visibility ................................................................................................................... 100
8.5.8.1 Viewshed Analysis .................................................................................................................................... 100
8.5.8.2 Night Time Lighting .................................................................................................................................. 102
8.5.9 Social Impact and Benefits ....................................................................................................................... 103
8.5.9.1 Social Impacts ........................................................................................................................................... 104
8.5.9.2 Social Benefits .......................................................................................................................................... 104
8.5.10 Cultural and Heritage Resources .............................................................................................................. 106
8.5.10.1 Heritage Impact Assessment (HIA) ........................................................................................................... 106
8.5.10.2 Palaeontological Desk-top Assessment .................................................................................................... 107
8.5.11 Cumulative Impact Assessment ............................................................................................................... 107
8.6 METHODOLOGY USED IN DETERMINING THE SIGNIFICANCE OF ENVIRONMENTAL IMPACTS ............ 109
8.7 POSITIVE AND NEGATIVE IMPACTS OF THE PROPOSED ACTIVITY AND ALTERNATIVES ....................... 113
8.8 POSSIBLE MITIGATION MEASURES THAT COULD BE APPLIED AND THE LEVEL OF RISK ....................... 113
8.9 THE OUTCOME OF THE SITE SELECTION MATRIX ................................................................................ 113

viii | P a g e
8.10 MOTIVATION WHERE NO ALTERNATIVE SITES WERE CONSIDERED .................................................... 113
8.11 STATEMENT MOTIVATING THE PREFERRED SITE ................................................................................ 113
9 PLAN OF STUDY FOR THE EIA PROCESS .................................................................... 114
9.1 DESCRIPTION OF ALTERNATIVES TO BE CONSIDERED ......................................................................... 114
9.2 DESCRIPTION OF ASPECTS TO BE ASSESSED DURING THE EIA PROCESS .............................................. 114
9.3 DESCRIPTION OF ASPECTS TO BE ASSESSED BY SPECIALISTS............................................................... 115
9.4 PROPOSED METHOD OF ASSESSING DURATION SIGNIFICANCE .......................................................... 117
9.4.1 Impact Significance .................................................................................................................................. 117
9.4.1.1 Nature and Status .................................................................................................................................... 117
9.4.1.2 Spatial Extent ........................................................................................................................................... 117
9.4.1.3 Duration ................................................................................................................................................... 117
9.4.1.4 Probability ................................................................................................................................................ 118
9.4.1.5 Intensity.................................................................................................................................................... 118
9.4.1.6 Ranking, Weighting and Scaling ............................................................................................................... 118
9.4.1.7 Impact significance without mitigation (WOM) ....................................................................................... 119
9.4.1.8 Effect of Significance on Decision‐makings .............................................................................................. 119
9.4.2 Mitigation ................................................................................................................................................. 120
9.4.2.1 Impact significance with mitigation measures (WM) ............................................................................... 121
9.4.2.2 Mitigation Efficiency (ME) ........................................................................................................................ 121
9.4.2.3 Significance Following Mitigation (SFM) .................................................................................................. 121
9.5 STAGES AT WHICH THE CA WILL BE CONSULTED ................................................................................ 122
9.6 PARTICULARS OF THE PUBLIC PARTICIPATION PLAN .......................................................................... 122
9.6.1 Methods of Public Participation ............................................................................................................... 122
9.6.2 Scoping Phase ........................................................................................................................................... 122
9.6.2.1 Comments and Responses on the Draft Scoping Report ......................................................................... 122
9.6.2.2 Notification of the Final Scoping Report .................................................................................................. 122
9.6.3 EIA Phase .................................................................................................................................................. 122
9.6.3.1 EIA Results Information Dissemination .................................................................................................... 122
9.6.3.2 Further IAP Engagement Sessions ............................................................................................................ 122
9.6.3.2.1 Authority Engagement ............................................................................................................................. 122
9.6.3.2.2 Traditional Leadership Engagement......................................................................................................... 123
9.6.3.3 Public Meeting ......................................................................................................................................... 123
9.6.3.4 Availability of the EIAR/EMPr ................................................................................................................... 123
9.6.4 Comments and Responses ....................................................................................................................... 123
9.7 MEASURES TO AVOID, REVERSE, MITIGATE OR MANAGE IDENTIFIED IMPACTS ................................. 124
10 OTHER INFORMATION REQUIRED BY THE COMPETENT AUTHORITY ........... 129
10.1 IMPACT ON THE SOCIO-ECONOMIC CONDITIONS OF ANY DIRECTLY AFFECTED PARTY ...................... 129
10.2 IMPACT ON ANY NATIONAL ESTATE ................................................................................................... 129

ix | P a g e
10.3 OTHER MATTERS REQUIRED IN TERMS OF SECTIONS 24(4)(A) AND (B) OF THE ACT ........................... 129
11 UNDERTAKING ................................................................................................................... 130
11.1 UNDERTAKING REGARDING CORRECTNESS OF INFORMATION .......................................................... 130
11.2 UNDERTAKING REGARDING LEVEL OF AGREEMENT ........................................................................... 130
12 APPENDICES ........................................................................................................................ 131
LIST OF TABLES
Table 1: Listed Activities associated with The Duel Coal Project, 2014 EIA Regulations (as amended in 2017) ............... 9
Table 2: IAP Notifications .................................................................................................................................................. 45
Table 3: Advertisements .................................................................................................................................................. 46
Table 4: On-Site Notices................................................................................................................................................... 46
Table 5: Public Documents Table ..................................................................................................................................... 46
Table 6: Engagement Session Table ................................................................................................................................. 47
Table 7: Comments and Response Summary ................................................................................................................... 49
Table 8: Land capability correlated with soil form........................................................................................................... 58
Table 9: Summary of the aquatic assessment results for site TD1 assessed January 2015 ............................................. 64
Table 10: Assigned REC Classes ........................................................................................................................................ 66
Table 11: Estimated Groundwater use ............................................................................................................................ 68
Table 12: Towns in the region and their distance from the planned project .................................................................. 76
Table 13: Settlementsand their distance from the planned project................................................................................ 76
Table 14: Surface ownership............................................................................................................................................ 77
Table 15: Neighbouring Properties .................................................................................................................................. 78
Table 16: Annual Turn Over of the Activities in the Project Area (2015 prices) .............................................................. 81
Table 17: Current Economic and Socio-Economic Parameters for The Duel (2015) ........................................................ 82
Table 18: Current Economic and Socio-Economic Parameters for Area 2 (2015) ........................................................... 82
Table 19: Current Economic and Socio-Economic Parameters for Area 3 (2015) ........................................................... 83
Table 20: Current Economic and Socio-Economic Parameters all areas (2015) .............................................................. 83
Table 21: Soil that will be impacted by the envisaged mining activities.......................................................................... 87
Table 22: Initial High-Level Impact Risk Matrix Summary ............................................................................................. 110
Table 23: Initial High-Level identification of Mitigation Measures ................................................................................ 124

x | P a g e
LIST OF FIGURES
Figure 1: Mineral Tenure associated with The Duel Coal Project ...................................................................................... 4
Figure 2: The Duel Coal Project location ............................................................................................................................ 5
Figure 3: Map indicating areas earmarked for mining and infrastructure ........................................................................ 7
Figure 4: Pit and Underground layout overlaid .................................................................................................................. 8
Figure 5: Listed Activities Map for The Duel Project (Listing Notices 1 & 2) .................................................................... 10
Figure 6: Typical Mining Sequence ................................................................................................................................... 11
Figure 7: Open pit mining cross section layout................................................................................................................. 12
Figure 8: Schematic drilling and blasting pattern ............................................................................................................. 13
Figure 9: 3D side view of Underground access for initial LW section ............................................................................... 13
Figure 10: 3D side view of Underground access via spiral ramp ...................................................................................... 14
Figure 11: Longwall mining layout .................................................................................................................................... 15
Figure 12: Longwall mining sequence .............................................................................................................................. 16
Figure 13: Open pit LOM Production Profile.................................................................................................................... 17
Figure 14: Underground LOM production profile ............................................................................................................. 17
Figure 15: Combined LOM production profile .................................................................................................................. 18
Figure 16: ROM and Saleable Product .............................................................................................................................. 18
Figure 17: CHPP layout..................................................................................................................................................... 19
Figure 18: Coal processing plant block flow diagram ....................................................................................................... 20
Figure 19: Raw coal handling system ............................................................................................................................... 21
Figure 20: Primary DMC circuit simplified flowsheet ...................................................................................................... 22
Figure 21: Secondary DMC circuit simplified flowsheet .................................................................................................. 23
Figure 22: Density control and magnetite mecovery simplified flowsheet ..................................................................... 24
Figure 23: Fine coal circuit simplified flowsheet .............................................................................................................. 25
Figure 24: Flotation circuit simplified flowsheet ............................................................................................................. 26
Figure 25: ROM, Product and Yield ................................................................................................................................... 29
Figure 26: Infrastructure arrangements for The Duel Coal Project ................................................................................. 31
Figure 27: Interim waste dump arrangement .................................................................................................................. 35
Figure 28: Final waste dump arrangement ....................................................................................................................... 35
Figure 29: EIA and Public Participation Process ................................................................................................................ 40
Figure 30: The Duel Coal Project in relation to formal and informal protected areas .................................................... 53
Figure 31: Important Bird Areas ...................................................................................................................................... 53
Figure 32: Importance in accordance with the Mining and Biodiversity Guideline (2012) ............................................. 54
Figure 33: Limpopo Critical Biodiversity Areas ................................................................................................................ 55
Figure 34: Landscape character of the study area, indicating the steep hills, which is the most prominent landscape
feature within the study area .................................................................................................................................. 56
Figure 35: General views of the study area and the surrounding region ........................................................................ 57
Figure 36: Land capability classes of the study area ........................................................................................................ 59
Figure 37: Conceptual illustration of the habitat units within the study area .................................................................. 60
Figure 38: Terrestrial sensitivity map for the study area in relation to proposed mining infrastructure ........................ 62
Figure 39: Localities of species observed that are of an increased conservational concern ........................................... 63
Figure 40: Quaternary catchments .................................................................................................................................. 64
Figure 41: Aquatic assessment monitoring point ............................................................................................................ 65
Figure 42: Locations of the wetland types in relation to the study area ......................................................................... 66
Figure 43: Wetland PES map ............................................................................................................................................ 67
Figure 44: Hydrocensus borehole and spring localities ................................................................................................... 69
Figure 45: TDS contour map ............................................................................................................................................ 69
Figure 46: Archaeological remains on The Duel Coal Project footprint ........................................................................... 74

xi | P a g e
Figure 47: Project in relation to the Makhado Local Municipal area and Ward 21 and 37 ............................................. 75
Figure 48: Settlements neighbouring and surrounding the MRA area ............................................................................ 77
Figure 49: Neighbouring properties ................................................................................................................................. 78
Figure 50: Neighbouring Landowners ............................................................................................................................... 79
Figure 51: Monetary Value of Current Activities (2015-terms) ....................................................................................... 81
Figure 52: Employment per Current Activity ................................................................................................................... 84
Figure 53: Sensitive Receptors ......................................................................................................................................... 85
Figure 54: Mechanism of goaf and impact on overlying strata ....................................................................................... 87
Figure 55: Map indicating the soil forms and areas that will be impacted by the envisaged mining activities .............. 88
Figure 56: Blasting area of interest .................................................................................................................................. 99
Figure 57: Combined viewshed for The Duel Coal Project............................................................................................. 101
Figure 58: Social impact zone map ................................................................................................................................ 105
Figure 59: Possible road diversion alignment ................................................................................................................ 105
Figure 60: Other coal mining projects in relation to The Duel Coal Project ................................................................... 108

xii | P a g e
GLOSSARY OF TERMS
TERM / ABBREVIATION
MEANING
AMD Acid Mine Drainage
AQA National Environmental Management: Air Quality Act 39 of 2004, as amended
Biome A broad ecological unit representing major life zones of large natural areas – defined mainly by vegetation structure and climate
CARA Conservation of Agricultural Resources Act 43 of 1983
CBA Cost Benefit Analysis
CRR Comments and Response Report
DAFF Department of Agriculture, Forestry and Fisheries
dBA Decibels
DEA Department of Environmental Affairs
DEMC Desired Ecological Management Class
DMR Department of Mineral Resources
DM Dense Medium
DMS Dense Medium Separator
DWS Department of Water and Sanitation
EC Electrical Conductivity
EIA Environmental Impact Assessment
EIAR Environmental Impact Assessment Report
EIS Ecological Importance and Sensitivity Classification
EMC Ecological Management Class
EMPr Environmental Management Programme
ESA Earlier Stone Age
ESP Exchangeable sodium percentage
FAII Fish Assemblage Integrity Index
GDP Gross Domestic Product
GPS Global Positioning system
HIA Heritage Impact Assessment
IAPs Interested and Affected Parties
IDPs Integrated Development Plans
IHAS Invertebrate Habitat Assessment System
IHIA Intermediate Habitat Integrity Assessment
ISP Internal Strategic Perspective

xiii | P a g e
TERM / ABBREVIATION
MEANING
IUCN International Union for Conservation of Nature and Natural Resources
IWUL Integrated Water Use Licence
IWWMP Integrated Water and Waste Management Plan
LCC Land Claims Commissioner
LEDET Limpopo Department of Economic Development, Evrironment and Tourism
LIHRA Limpopo Heritage Resources Agency
LM Local Municipality
LOM Life of Mine
LSA Late Stone Age
Mamsl Meters above mean sea level
MAE Mean Annual Evaporation
MAP Mean Annual Precipitation
MAR Mean Annual Run-off
MPRDA Mineral and Petroleum Resources Development Act 28 of 2002, as amended
MRA Mining Right Application
MSA Middle Stone Age
Mtpa Million Tonnes Per Annum
NBA National Biodiversity Assessment
NEMA National Environmental Management Act 107 of 1998, as amended
NEMBA National Environmental Management: Biodiversity Act 10 of 2004, as amended
NEMWA National Environmental Management: Waste Act 59 of 2008, as amended
NFA National Forest Act 84 of 1998
NFEPA National Freshwater Ecosystem Priority Areas
NHRA National Heritage Resources Act 25 of 1999
NWA National Water Act 36 of 2008, as amended
NWCS National Wetland Classification System
PEMC Present Ecological Management Class
PES Present Ecological State
PFD Process Flow Diagram
PRECIS Pretoria Computer Information Systems
QDS Quarter Degree Square
RDL Red Data List
RDM Resource Directed Measures
RE Risk estimation

xiv | P a g e
TERM / ABBREVIATION
MEANING
REC Recommended Ecological Category
RHP River Health Programme
ROM Run of Mine
SAM Social Accounting Matrix
SANBI South African National Biodiversity Institute
SAR Sodium Absorption Ration
SASS5 South African Scoring System version 5
SDF Spatial Development Framework
SEIA Socio-Economic Impact Assessment
SIA Social Impact Assessment
SSC Species of Special Concern
SUR Strict Unemployment Rate
TDS Total Dissolved Solids
TOPS Threatened or Protected Species
TWQR Target Water Quality Range
UNESCO United Nations Education, Science and Cultural Organizations
VIA Visual Impact Assessment
WHS World Heritage Site
WMA Water Management Area
WQO Water Quality Objective
WQT Water Quality Threshold
WZ Weathered Zone

1 | P a g e
1 INTRODUCTION
In terms of section 16 of the Mineral and Petroleum Resources Development Act (MPRDA), 2002 (Act 28 of
2002, as amended), a Prospecting Right (PR No: LP 1041 PR) was granted to Thandululo Coal Mining (Pty)
Ltd (Reg. No: 2007/000084/97) on 07 November 2007, on the farms Lotsieus 176 MT, Kranspoort 180 MT,
Nairobi 181 MT and The Duel 186 MT. The duration of this permission to explore was for 5 years after
which a renewal application can be submitted to the Department of Mineral Resources (DMR).
Under section 11 of the MPRDA, a company can transfer its Prospecting Right (PR) to another company
subject to Ministerial consent. On 30 October 2012 the Directors of Thandululo Coal Mining (Pty) Ltd
elected to cede the PR to Subiflex (Pty) Ltd (Reg. No: 2010/019233/07) (Subiflex). The execution of this
cession took place on 14 January 2013 and the Notarial Deed of Cession was registered with the Mineral
and Petroleum Titles Registration office in Pretoria on the 27th of May 2013. Subiflex is a subsidiary
company of Signet Coking Coal Limited in which Signet holds 74% and Oripfa Mining holds 26%. The latter
company is a Black Economic Empowered (BEE) entity as defined in the Black Economic Empowerment Act
of 2003.
The PR was due for renewal on 06 November 2012. Subiflex timeously submitted a renewal application,
which was accepted by DMR, and is awaiting the granting and execution thereof. Under the MPRDA a
company retains its license and can carry on with work until the DMR notifies the holder of its intention to
cancel the right. Up to date this has not happened, and the status quo prevails. The schematic below
demonstrates how The Duel Coal Project’s legal structure has been setup.

2 | P a g e
On 30 July 2015 Subiflex applied for a Mining Right for coal, pseudocoal and torbanite/oilshale in terms of
section 22 of the MPRDA and for Environmental Authorisation in terms of section 24 of the National
Environmental Management (NEMA) Act 107 of 1998 (as amended) and the Environmental Impact
Assessment (EIA) Regulations of 2014 (as amended in 2017), in respect of the Remaining Extent of the farm
The Duel 186 MT.
The DMR refused the Environmental Authorisation on 19 January 2017, because the Department of
Economic Development, Environment and Tourism (LEDET) did not support the granting of the
Environmental Authorisation for reasons which the DMR felt was not addressed sufficiently by the
applicant. Subiflex submitted an appeal to the Department of Environmental Affairs (DEA) on 8 February
2017, which appeal was dismissed by the Minister of Environmental Affairs on 23 February 2018.
Following consultation with Authorities, Subiflex was advised to re-submit its applications for a Mining
Right and Environmental Authorisation.
Considering the above, Subiflex appointed Jacana Environmentals cc (Jacana) to apply for Environmental
Authorisation for The Duel Coal Project, in line with the requirements of the NEMA: 2014 EIA Regulations.
It is important to note that the approach for The Duel Coal Project is to first apply for the Mining Right and
associated Environmental Authorisation. Once this process is completed and the applicant has conducted
further feasibility studies and detail designs in respect of its development, the applications for the Waste
Management Licence in terms of the National Environmental Management: Waste Act (NEMWA), 2008 (Act
59 of 2008) and the Water Use Licence in terms of the National Water Act (NWA), 1998 (Act 36 of 1998), as
amended, will be submitted to the relevant authorities.
This document serves as the Draft Scoping Report (DSR) and is available for comment by registered
Interested and Affected Parties (IAPs) and commenting authorities. The DSR is made available at the start
of the Public Participation Process to enable affective participation and inputs into the Environmental
Impact Assessment (EIA) process in the provided timeframes of the NEMA: 2014 EIA Regulations (as
amended in 2017).

3 | P a g e
2 ENVIRONMENTAL ASSESSMENT PRACTITIONER
Independent EAP Jacana Environmentals cc
Responsible person Marietjie Eksteen
Physical address 7 Landdros Mare Street, Polokwane
Postal Address PO Box 31675, Superbia, 0759
Telephone 015 291 4015
Facsimile 015 291 5035
E-mail [email protected]
Professional Affiliation Pr.Sci.Nat. at SA Council for Natural Science Professions
Reg No 400090/02
Curriculum Vitae Refer to Appendix 2
Marietjie Eksteen is the Managing Director of the consulting firm Jacana Environmentals cc, an
environmental consulting firm based in Polokwane. She is an environmental scientist with 28 years’
experience, her main fields of expertise being water quality management, mine water management,
environmental legal compliance and project management. Ms Eksteen is a registered Professional
Environmental Scientist (Pr.Sci.Nat.) at the South African Council for Natural Scientific Professions –
Registration No. 400090/02.
Since establishing Jacana Environmentals in 2006, she has been involved in a variety of mine-related
environmental projects serving clients such as Coal of Africa Limited, BHP Billiton Energy Coal SA, Xstrata
Coal SA and Optimum Coal. Prior to 2006 she was employed by Pulles Howard & De Lange Inc as an
environmental consultant for 2 years. Before consulting, Ms Eksteen was employed by BHP Billiton as a
mine environmental manager at their operations in Mpumalanga, as well as the Department of Water
Affairs where she was appointed as a water quality specialist for the mining industry. Her career started off
as a geophysicist at Genmin in 1990. Ms Eksteen obtained a Masters’ degree in Exploration Geophysics
(MSc) from the University of Pretoria in 1993. Her Curriculum Vitae is attached as Appendix 2.

4 | P a g e
3 DESCRIPTION OF THE PROPERTY
The farm The Duel 186 MT, subdivided into two parts of which the Mining Right application (MRA) only
covers the Remaining Extent portion, is a privately-owned farm used for game ranching. The areal extent of
the property 888.5039 ha and the current surface owner is the Clint Howes Family Trust.
Farm name The Duel 186 MT RE
Title Deed T101476/1998
Application area (ha) 888.5039
Magisterial district Vhembe District
Distance and direction from nearest town Tshipise, 20km north-east
Distance and direction from nearest rural settlement Makushu, 50m south-east
21-digit SG Code TOMT00000000018600000
Figure 1: Mineral Tenure associated with The Duel Coal Project

5 | P a g e
4 LOCALITY MAP
The proposed mine development is located 54 km north of Louis Trichardt (Makhado) in the Vhembe
District within the Limpopo Province. The MRA area is located roughly 12 km to the east of the N1 highway
and the R525 regional road is located around 6 km to the north, with various local gravel roads, mainly used
by local residents, visitors and workers, connecting the smaller settlements in the region. The Nzhelele
Nature Reserve is situated immediately to the east of the MRA area, with the Nzhelele Dam situated
roughly 4 km further to the east.
The land coverage in the vicinity and within The Duel Project area is mixed between rural settlement,
hunting and ecotourism. Some of the properties are also focused on mixed farming, with a mixture of
livestock, game and irrigated agriculture. Hunting, game trading and eco-tourism is an established socio-
economic driver in the area. There are several properties utilised for trophy (for local and foreign tourists)
and biltong hunting with ecotourism spin-off activities.
Figure 2: The Duel Coal Project location

6 | P a g e
5 DESCRIPTION OF THE SCOPE OF THE PROPOSED OVERALL ACTIVITY
5.1 LISTED AND SPECIFIC ACTIVITIES
The Duel Coal Project will be a combination of open pit and underground mining and has a potential Life-of-
Mine (LOM) of 24 years. The envisaged mining method for the open pit area is a conventional drill and
blast operation with truck and shovel, load and haul.
Underground mining operations will commence from Year 10 onwards for a period of 5 years. Access will
be from selected positions in the open pit and the coal will be mined through the long-wall methodology.
After underground activities have been completed, the access to the underground areas will be closed
followed by the final rehabilitation of the open pit.
The proposed infrastructure to be developed includes:
• Coal Handling Processing Plant (CHPP);
• Overburden Waste Dump;
• Temporary Discard Dump;
• Haul roads;
• Pollution Control Dams;
• Raw water storage facility and distribution systems;
• Access road; and
• Auxiliary infrastructure including a workshop and store, office and change house, electrical power
supply and security fencing.
The washed coal will be transported via road to a nearby siding. The final discard material from the plant
will be disposed of in the mined-out open pit. If the pit is unavailable due to existing mining activities, the
discard material will be placed on an interim surface discard dump, from where it will be reclaimed and
dumped into the mined-out open pit towards the end of the mine life as part of the rehabilitation of the
mining site.
Figure 3 illustrates the position of the proposed opencast and underground mining areas including
associated infrastructure.

7 | P a g e
Figure 3: Map indicating areas earmarked for mining and infrastructure

8 | P a g e
Figure 4: Pit and Underground layout overlaid

9 | P a g e
Table 1 lists the Listed Activities applicable to The Duel Coal Project, for which Environmental Authorisation
is required.
Table 1: Listed Activities associated with The Duel Coal Project, 2014 EIA Regulations (as amended in 2017)
ACTIVITY AERIAL EXTENT# LISTED ACTIVITY APPLICABLE NOTICE
Mining: open pit and underground (longwall) mining
200 ha X
GNR 983 – A12 GNR 983 – A19 GNR 984 – A15 GNR 984 – A17 GNR 985 – A12 GNR 985 – A14
Blasting 200 ha N/A -
CHPP and related infrastructure (including water management infrastructure)
75 ha X
GNR 983 – A9 GNR 983 – A10 GNR 983 – A12 GNR 983 – A13 GNR 983 – A19 GNR 984 – A6
GNR 984 – A15 GNR 984 – A16 GNR 984 – A17 GNR 985 – A2
GNR 985 – A12 GNR 985 – A14
Overburden waste dump Interim discard dump
280 ha X
GNR 983 – A12 GNR 983 – A19 GNR 984 – A6
GNR 984 – A15 GNR 985 – A12 GNR 985 – A14
Access / haul / service roads Deviation of D3672
Width > 8m X
GNR 983 – A12 GNR 983 – A19 GNR 983 – A24 GNR 985 – A4
GNR 985 – A14
Bulk hydrocarbon facilities > 80 m3
< 500 m3 X
GNR 983 – A14 GNR 985 – A10
Bulk power > 33 kV
< 275 kV X GNR 983 – A11
#Note: The final extent of the activities will only be confirmed once the further feasibility studies and detail
designs in respect of the development were concluded.

10 | P a g e
Figure 5: Listed Activities Map for The Duel Project (Listing Notices 1 & 2)

11 | P a g e
5.2 DESCRIPTION OF THE ACTIVITIES TO BE UNDERTAKEN
5.2.1 MINING METHODOLOGY
5.2.1.1 Open Pit Mining
The open pit will be mined through conventional open pit methods, namely truck and shovel. The process
for mining method involves stripping, drilling, blasting, loading and hauling of overburden to the waste
dump and ROM stockpile in the CHPP area.
The mine will operate 365 days per annum on a 24-hour basis with shifts rotating on 12-hour duration 7
days a week. The mining sequence in the open pit environment is illustrated in Figure 6.
Figure 6: Typical Mining Sequence
Open pit terminology is illustrated in Figure 7.
Stripping of Topsoil and Soft Material
Drilling and Blasting -Loading and Hauling
of Overburden
Drilling Blasting -Loading and Hauling
of Coal Seam
Drilling Blasting -Loading and Hauling
of Interburden
Drilling Blasting -Loading and Hauling
of Coal Seam
Rehabilitation

12 | P a g e
Figure 7: Open pit mining cross section layout
The height of the mining benches is usually determined according to physical characteristics of the
mineralisation. The decision regarding the bench height to be used is very much dependent on the ore
body and the distribution thereof in the host rock.
For the open pit operation at The Duel Coal Project, drilling and blasting would be performed on 10 m and
15 m high benches, the height will be driven by the lead and lag per elevation lift. The pit high wall areas
can be mined in 15 m benches whereas sections of the pit floor will be more suitable to a 10 m bench
height approach. Drilling would require drill rigs that could drill up to 15 m benches.
Diesel-powered truck and shovel operations, in combination with an effective drill and blast plan, are well
understood, highly flexible and have significant manufacturer support. At this stage of the project, a
standard drill, blast, truck shovel operation would be considered the lowest operating risk mining method,
in terms of both cost and productivity. As such, the diesel-powered heavy-duty truck and shovel operation
has been selected as the base case for this study. The loading conditions are expected to correspond closely
to a large-scale open pit site; a maximum pit depth of 270 m is envisaged.
Figure 8 illustrates a typical layout of how the overburden and interburden drilling and blasting would be
conducted.

13 | P a g e
Figure 8: Schematic drilling and blasting pattern
5.2.1.2 Underground Mining
The longwall mining method would be applied to all the possible UG reserves at The Duel Coal Project. The
UG Longwall (LW) mining has been split into an upper and lower section. The upper LW section will be
accessed directly from the pit high wall in year 10. A spiral ramp access will be initiated from the ramp
system in the South Western section of the pit. See Figure 9 and Figure 10 for the illustration.
Figure 9: 3D side view of Underground access for initial LW section

14 | P a g e
Figure 10: 3D side view of Underground access via spiral ramp
Development mining is where the underground roadways are constructed in preparation for longwall
mining. The roadways provide access for men, machinery, ventilation air, water, electricity, communication
systems and coal clearance conveyors.
Typically, five metres wide and three metres high, the roadways are constructed down the length of the
longwall panel which is usually over two kilometres long. Coal is cut by a continuous miner to form the
roadways and the roof is secured using steel mesh and roof bolts.
The main purpose of development mining is to form the rectangular blocks (longwall panels) that will be
removed by the longwall miner. At The Duel Coal Project the longwall panels are 190 metres wide and up
to 1.3 kilometres long. The coal seam is 130 metres below the surface at its shallowest point and 730
metres below the surface at the deepest point.
Once the roadways are established and infrastructure and services in place, the longwall is transported
down the roadways, piece by piece and installed ready for longwall mining.
Extracting the coal from a longwall panel begins once the longwall has been installed at the coal face. The
longwall shearer travels back and forth across the width of the longwall panel, cutting approximately one
metre of coal with each pass. The coal is transported from the cutting face to the CHPP via a network of
conveyors.
Large steel hydraulic supports temporarily maintain the roof. These provide a protected area in which our
employees can work safely. At The Duel Coal Project longwall automation would be implemented. The
automation creates safer zones, removing operators from dust, noise and fly rock, which ultimately
improves the productivity.
After the shearer moves across the coal face, the roof supports automatically lower and move forward in
preparation for the next cut. The roof that was being supported is then allowed to collapse into the space
where the coal has been removed (known as the goaf). This causes subsidence on the surface above the
longwall panels.
The process continues until the panel of coal has been mined, which would typically take about 8 months to
complete for a panel length of 900 m. The total combined length of the longwall panels amounts to
approximately 6.7 km and consist of 8 panels, the longest panel is 1.3 km and the shortest 0.25 km.

15 | P a g e
Once a panel is mined out the longwall miner is moved. The Duel optimised seam widths range from 2 to 5
m in thickness, due to the operating range of the available longwall equipment a range of between 2 to 4 m
can be maintained. All 5 m optimised material (minority) will be mined as a 4 m cut.
Refer to Figure 11 and Figure 12 that illustrate the proposed longwall mining layout and sequence.
Figure 11: Longwall mining layout

16 | P a g e
Figure 12: Longwall mining sequence
5.2.1.3 LOM Schedule
5.2.1.3.1 Open Pit
The schedule runs over a period of approximately 24 years at a ROM production rate of 2.4 Mtpa for the
first 14 years after which an increase of ROM to 3.6 Mtpa can be sustained by the remaining amount of
waste stripping required. A ramp-up period over the first two years of production has been accounted for.
A pre-strip year of 10.5 Mt of which 0.5 Mt ROM would be stockpiled has been planned. The second year
will gradually increase production to 75% of the full production output that would be realised from year 3.
The LOM production schedule with the relevant product types is illustrated in Figure 13.

17 | P a g e
Figure 13: Open pit LOM Production Profile
5.2.1.3.2 Underground LOM Schedule
The underground development starts in year 9 and production the year after in year 10, an average
production rate of 1.2 Mtpa can be maintained for years 10 to 13 with a ramp down in year 14. A total
Long wall advance of approximately 5800 m can be expected. Underground yields are higher that the open
pit as a selected mining cut can be mined. See Figure 14.
Figure 14: Underground LOM production profile
0.0
0.1
0.2
0.3
0.4
0.5
0.6
0.7
0.8
0.9
1.0
-
5
10
15
20
25
30
35
40
45
Y0 Y1 Y2 Y3 Y4 Y5 Y6 Y7 Y8 Y9 Y10Y11Y12Y13Y14Y15Y16Y17Y18Y19Y20Y21Y22Y23Y24
Pro
du
ct t
on
nes
(M
t)
Ton
nag
e (M
t)
Periods (Years)
ROM_Coal Waste Primary_product Secondary_product
0.0
0.1
0.2
0.3
0.4
0.5
0.6
0.7
0.8
0.9
1.0
0.0
0.2
0.4
0.6
0.8
1.0
1.2
1.4
Y0 Y1 Y2 Y3 Y4 Y5 Y6 Y7 Y8 Y9 Y10Y11Y12Y13Y14Y15Y16Y17Y18Y19Y20Y21Y22Y23Y24
Pro
du
ct t
on
nes
(M
t)
Ton
nag
e (M
t)
Periods (Years)
ROM_Coal Waste Development Primary_product Secondary_product

18 | P a g e
5.2.1.3.3 Open pit and Underground combined LOM Schedule
The addition of the underground production during year 9 to 15 proves to be very beneficial to the project
as a whole; the secondary product is almost doubled during the period of underground production. The
timing of the underground inclusion is a synergistic approach in that at the addition of the 1.2 Mtpa from
the underground in year 10 allows for the waste stripping to continue enabling the open pit to produce 3.6
Mtpa of Rom from year 15 onwards when the underground operation ramps down, and this without the
need for additional waste stripping to sustain the production towards the end of LOM. See Figure 15.
Figure 15: Combined LOM production profile
The coal ROM material and product tonnes over the LOM can be viewed in Figure 16. A combined saleable
product ranging between 0.4 and 0.8 Mtpa can be achieved.
Figure 16: ROM and Saleable Product
0.0
0.1
0.2
0.3
0.4
0.5
0.6
0.7
0.8
0.9
1.0
-
5
10
15
20
25
30
35
40
45
Y0 Y1 Y2 Y3 Y4 Y5 Y6 Y7 Y8 Y9
Y10
Y11
Y12
Y13
Y14
Y15
Y16
Y17
Y18
Y19
Y20
Y21
Y22
Y23
Y24
Pro
du
ct t
on
nes
(M
t)
Ton
nag
e (M
t)
Periods (Years)ROM_Coal Waste Total Material Primary_product Secondary_product
0.0
0.1
0.2
0.3
0.4
0.5
0.6
0.7
0.8
0.9
1.0
0.0
0.5
1.0
1.5
2.0
2.5
3.0
3.5
4.0
Y0 Y1 Y2 Y3 Y4 Y5 Y6 Y7 Y8 Y9
Y10
Y11
Y12
Y13
Y14
Y15
Y16
Y17
Y18
Y19
Y20
Y21
Y22
Y23
Y24
Pro
du
ct t
on
nes
(M
t)
RO
M (
Mt)
Periods (Years)
ROM vs Product Tonnes
ROM_Coal Primary_product Secondary_product

19 | P a g e
5.2.2 COAL PROCESSING FACILITY
The envisaged CHPP will be able to produce a primary and secondary product. The process plant layout is
shown in Figure 17.
Figure 17: CHPP layout
The typical process flow of the CHPP is illustrated in Figure 18. It shows the flow of material through the
plant from the raw coal state through to the product and reject.
The proposed CHPP circuit includes:
• Coarse coal processed in two stage dense medium cyclones in a high cut / low cut configuration.
• Fine coal processed in reflux classifier.
• Ultrafine coal in two-stages of column flotation.
• Coarse and fine coal dewatered using vibrating basket and scroll centrifuges.
• Flotation concentrate dewatered by horizontal belt filter to minimise loss of ultrafine coal.
• Tailings dewatered on belt filter presses.

20 | P a g e
Figure 18: Coal processing plant block flow diagram
5.2.2.1 Raw Coal Handling
The simplified raw coal handling system is shown in Figure 19. Haul trucks will deliver ROM coal from the
mine pit and dump on the raw coal stockpile. The ROM dump hopper will have a capacity of 70 t and be
sized to receive 992 front-end loader buckets.
Final ROM hopper reclaim rate and primary & secondary crushing capacity will be designed to provide
110% of the CHPP feed rate. The additional 10% capacity will provide “catch-up” capacity to fill the plant
feed surge bin. Therefore, the nominal equipment capacity of the feeder breaker and secondary/tertiary
sizers has been designed for 700 tph.
The feeder breaker will discharge onto the 1000 mm wide, 700 tph ROM coal conveyor and will be
conveyed to the two (2) stage sizing station. All ROM material will be sized through a combination of
secondary and tertiary sizers to the 50 mm nominal top-size for processing.
A belt weigher, tramp iron magnet and metal detector will be installed in the raw coal system. The magnet
and metal detector will protect the downstream sizing system from tramp metal.
Discharge from the sizing station will be directed to the 1000 mm wide, 700 tph surge bin feed conveyor
and elevated to the surge bin. The surge bin will have a capacity of 80 t. In combination with the ROM
dump hopper, this will provide approximately 15 minutes of plant feed surge capacity.
SEDGMAN © 2015
Raw Coal Feed System
DeslimingScreens
Coarse Coal Centrifuges
PrimaryDMCs
Product Drain
Screen
Secondary
DMCs
Coking Product
D&R Screen
Thermal Product
D&R Screen
Reject Drain
Screen
DeslimingCyclones
Reflux Classifier
Fine Coal Centrifuges
Coking Coal
Thermal Coal
Reject
FlotationHorizontal Belt Filter
Thickener
Desliming Screen
Coarse Coal
Product Dewatering
Fine Coal
Reject Dewatering
Flotation
Tailings
Tailings Dewatering
Rejects Dewatering

21 | P a g e
Discharge from the surge bin feeder will be received by the 1000 mm wide, 700 tph plant feed conveyor. A
belt weigher installed on the plant feed conveyor will be used to control the plant feed rate, and a cross-
belt sampler will be used to sample the plant feed prior to the CHPP.
Figure 19: Raw coal handling system
5.2.2.2 CHPP
The 600 tph CHPP will consist of a two (2) stage dense medium cyclone (DMC) circuit for processing coarse
coal, reflux classifiers for processing fine coal and flotation for processing the ultrafine fraction.
The CHPP will consist of modular construction with all equipment accessible by either mobile crane or
monorails. The modular design of the CHPP allows project expansion to occur with ease as additional
modules can be placed downstream without impact to existing operations.
5.2.2.2.1 Plant Feed
The CHPP is fed from the surge bin by a vibrating feeder which is controlled by a downstream belt weigher
on the plant feed conveyor that will discharge directly into the desliming screen feed box where it is
slurried with process water.
The raw coal slurry is then passed over the multi-slope desliming screen separating the plant feed into a
coarse oversize fraction passing over the screen and a mixed fine/ultrafine undersize fraction passing
through the screen. The coarse material then reports to the dense medium separation circuit whilst the
finer undersize material is further deslimed in the fines circuit.

22 | P a g e
5.2.2.2.2 Desliming Circuit
Plant feed coal will be slurried with primary reflux classifier product thickening cyclone overflow in the
desliming screen feed box and fed onto a 3.6 m x 6.1 m multi-slope desliming screen. The 1.2 mm (ww)
material and water will be collected in the desliming screen underpan and piped to the desliming cyclone
feed sump. Tramp screens in the screen underpan will prevent oversize material from entering the
desliming cyclone and fines circuits. The -50 / +1.2 mm (ww) material will discharge from the desliming
screen and be flushed by correct medium into the dense medium cyclone feed sump.
5.2.2.2.3 Pre-Scalp Dense Medium Circuit
The primary stage of the coarse circuit is shown in Figure 20.
Figure 20: Primary DMC circuit simplified flowsheet
The coarse fraction received from the desliming screen is sluiced with magnetite slurry at a controlled
density into the primary DMC wing tank. Coal and medium slurry will be pumped at a constant pressure
and flow rate into the ceramic lined single 1300 mm diameter DMC. The denser reject material will
discharge out the DMC via the cyclone spigot into the underflow collection box whilst the less dense
material will report to the overflow collection box via the cyclone vortex finder.
Heavier reject material collected from the cyclone will be directed into the primary reject drain & rinse feed
box where it will be distributed across the width of the 2.4 m x 4.8 m multi-slope reject screen. The initial
drain section of the screen will remove most of the correct medium slurry whilst the remaining adhering

23 | P a g e
medium will be rinsed off by a series of sprays in the rinse section. After washing, the solids will discharge
onto the rejects’ conveyor whilst the initial drained medium will return to correct medium sump and the
rinsed medium will report to the dilute medium sump for magnetite recovery.
Lighter middlings material collected in the overflow collection box will be directed to the primary product
drain and rinse screen feed box, to be discharged across the width of the 2.4 m x 4.8 m multi-slope
middlings screen to drain the free medium from the middlings material. The rinse section of this screen will
not contain sprays as the solids pass into a further density separation process in the secondary DMC circuit.
The drained medium from both screens will be directed to the correct medium sump whilst the rinse
section of the reject screen will be discharged into the dilute medium sump for concentration. Primary
product will overflow into a sluice box and be sluiced with medium at a lower density than the primary
process into the secondary wing tank.
Figure 21: Secondary DMC circuit simplified flowsheet
Coal and medium slurry will be pumped at a constant pressure and flow rate into a single 1000 mm
diameter DMC where coking coal will be discharged from the cyclone overflow, and thermal coal
discharged from the spigot. The coking coal will be collected by the secondary DMC overflow collection box
and directed to the coking screen feed box where it will be distributed across the partitioned multi-slope
screen. The thermal product will also be distributed across the partitioned multi-slope screen for recovery
of medium.
Coking product will overflow from the coking screen and be directed into a coarse coal centrifuge. The
product will be dewatered and discharged onto the coking coal product conveyor. The water discharged

24 | P a g e
will be directed back into the dilute medium sump. Thermal coal will either be directed to the thermal coal
conveyor or be sent to the liberation circuit for crushing and further processing.
5.2.2.2.4 Coarse Product Dewatering
Coarse product coal from the coking product drain and rinse screen section will report to one centrifuge for
product dewatering. The centrifuges will be of horizontal basket type and will discharge product directly
onto the coking product conveyor.
Coarse product coal from the thermal product coal drain and rinse screen section will report to one
horizontal basket centrifuge for dewatering. The product will discharge directly onto the thermal product
conveyor.
The centrifuge effluent from both the primary and secondary product centrifuges will drain to the
centrifuge effluent sump from where it will be pumped to the dilute medium sump for recovery of any
adhering magnetite.
5.2.2.2.5 Density Control and Magnetite Recovery Circuit
Two correct medium circuits exist in the CHPP in a high cut/low cut arrangement: the high-density circuit
passing through the primary DMC to remove the reject material first, and then the low-density circuit in the
secondary DMC to separate the coking and thermal coal products.
Each medium circuit will consist of overdense medium residing in the correct medium sump and injection
of clarified water into the suction of the correct medium pump to achieve the desired recirculating
separation density. The density is monitored on the correct medium pump discharge using a feedback loop
to control the amount of water injection.
Figure 22: Density control and magnetite mecovery simplified flowsheet

25 | P a g e
Correct medium from each circuit will be pumped to the relevant screen discharge launder where it will
flush discharging coal into the DMC feed sump. Medium is returned to the circuit through the drain and
rinse screens consisting of split underpan; the “drain” side and the “rinse” side. The drain side returns
correct medium to the DMC feed where any excess volume will then overflow to the correct medium sump.
The rinse section of the underpan directs any adhered medium to the dilute medium circuit where it is
pumped to the magnetic separators for dewatering. The concentrate then returns to the correct medium
sump whilst the effluent is used as screen spray water and desliming cyclone sump level water.
Magnetite will be manually batched up in the magnetite bulk storage sump prior to addition into the
appropriate correct medium sump.
5.2.2.2.6 Fine Coal Circuit
The mixed fine/ultrafine fraction from the desliming screen will discharge into the desliming cyclone feed
sump where it will be pumped to the desliming cyclone cluster. The desliming cyclones perform a size-
based separation resulting in two distinct size fractions; the fines fraction and the ultrafines fraction. The
fines will report to the cyclone underflow discharging to sieve bends. The sieve bends overflow will report
to the reflux classifier feed sump whilst the ultrafines will report to the cyclone overflow which together
with sieve bends underflow will discharge into the flotation feed sump.
The fines fraction will then be pumped to the reflux classifier for density-based separation. The separation
density will be controlled by a user entered set-point which determines the rate of tailings removal from
the unit. This density is measured by the pressure differential over a known height within the unit.
Figure 23: Fine coal circuit simplified flowsheet

26 | P a g e
Product produced from the reflux classifier will overflow from the unit to the reflux classifier product
thickening cyclone feed sump and then be pumped to a thickening cyclone cluster. The cyclone underflow
will report to the fine coal centrifuge and the overflow will go to the desliming screen feed box. Fine coal
product will discharge to the coking coal product conveyor and the centrifuge effluent will report to the
thickening cyclone feed sump.
5.2.2.2.7 Flotation Circuit
Collector reagent will be added to the flotation feed sump along with the ultra-fine material from the
deslime cyclone overflow and the liberation reflux classifier product sieve bend undersize material.
Ultrafine material will be processed in flotation cells in the configuration of primary cells feeding scavenger
cells. The ultrafine material will be pumped to the flotation cells from the flotation feed sump where
frother will be injected at the pump suction.
Primary flotation product will be collected in the flotation cell concentrate launder and discharged to the
horizontal vacuum belt filter. The primary reject will be discharged to the scavenger flotation cell. Froth
depth will be controlled by adjustment of the cell tailings valve. Similarly, the scavenger flotation cell will
collect product in the concentrate launder of the cell and discharge to the horizontal vacuum filter. The
reject from the scavenger cell will be directed to the tailings’ thickener.
Figure 24: Flotation circuit simplified flowsheet

27 | P a g e
Flotation product will be dewatered to approx. 25% total moisture before discharging to the coking coal
product conveyor. The filtrate will be collected and pumped to the flotation wash water sump where it will
be reused for the froth washing ring line. Flotation tailings will be discharged to the tailings’ thickener for
disposal.
Flotation reagents will be pumped from a localised tank facility, which is designed for refilling from bulk
tankers.
5.2.2.2.8 Tailings Thickener
The tailings thickener will be fed with fine coal rejects from flotation tailings, reject dewatering screen
underflow and the rejects dewatering filtrate sump.
Flocculant will be added to the tailings thickener feed to assist settling of the tailings prior to discharging
into the feed well of the thickener. Thickener overflow will report to the clarified water tank and will be
used as process water within the CHPP.
Thickened tailings collected and raked to the centre well will be dewatered through the belt press filters
and discharged onto the rejects’ conveyor for disposal.
5.2.2.2.9 Rejects and Tailings Dewatering Circuit
Fine reject material discharged into the fines effluent sump will be pumped to the thickening cyclones.
Thickened reject will be collected from the spigot of the cyclones and discharged onto the high frequency
screen. Fine dewatered rejects will discharge onto the rejects’ conveyor whilst the cyclone overflow and
screen effluent will report to the filtrate sump to be pumped to the tailings’ thickener.
Thickened tailings will be raked to the centre well of the thickener and pumped to the belt filter feed tank
where it will be agitated and then pumped to the belt press filters via a dedicated filter feed pump. Anionic
flocculant will be dosed into the discharge line of each filter feed pump, which will pump the filter feed
slurry into an agitation or conditioning tank (“agi-tank”) where cationic flocculant will be added prior to
feeding each belt filter.
Dewatered tailings filter cake will discharge onto the rejects bin feed conveyor for transfer to the rejects
bin. Filtrate from the filters will be collected in the tailings filtrate sump and pumped to the tailings’
thickener.
5.2.2.2.10 Coarse Reject Handling
Coarse reject will discharge within the CHPP onto the reject conveyor and transferred onto the reject bin
feed conveyor (both 800 mm wide, 450 tph). A ±1.0% accuracy weighscale will be located on the rejects bin
feed conveyor which will discharge into the 240 t reject bin. The reject bin is designed for loading CAT 793
trucks. The reject bin gate will be hydraulically operated.
5.2.2.3 Reagent and Flocculant Supply
5.2.2.3.1 Flotation Reagents

28 | P a g e
Flotation reagents will be stored in a reagent farm complete with all required dosing and transfer pumps in
accordance with the current South African codes (SANS 10086-1:2003, SANS 10087-3:2008) for storage of
the selected reagents. Flotation reagents will then be pumped to the appropriate delivery or injection
points in the CHPP.
The storage capacity for the Methyl Isobutyl Carbinol (MIBC) will be 50 days. No bulk storage of diesel is
required at the CHPP as this will be stored at the mining facilities. A standalone diesel tank with capacity for
25 days operation is included in the CHPP reagents farm.
5.2.2.3.2 Flocculant
Flocculant will be provided from a packaged powder-based flocculant preparation plant, which prepares
and doses anionic flocculant to the tailings’ thickener. The flocculant plant will be located adjacent to the
CHPP.
5.2.2.4 Product Handling
Thermal coal will be conveyed via 800 mm wide, 300 tph thermal product transfer conveyors to a thermal
product radial stacker for stockpiling. A weighscale and single-stage sample system will be installed on this
conveyor for coal quality management.
Coking coal will be conveyed via an 800 mm wide, 300 tph coking product conveyor to a coking product
radial stacker for stockpiling. A weighscale and single-stage sample system will be installed on this conveyor
for coal quality management.
A 30,000 t of stockpile area will be constructed. There will be enough space for dozer push-out to increase
storage capacity as needed.
Product reclaim will be by front end loader into the product transport trucks.
The stockpile base material and drainage system will be required to manage the thermal product when the
liberation circuit is in operation and the topsize reduces to 2 mm.
5.2.2.5 Product Yields
The CHPP will treat 2.4 Mtpa of ROM material for the first 9 years of the operation, in year 10 the UG adds
an additional 1.2 Mtpa, increasing the total capacity to 3.6 Mtpa. In year 14 when UG mining is depleted
the Open pit operation sustain the 3.6 Mtpa. Increased product tonnes are experienced during the UG
years and the last 4 years of open pit mining. The product yields are illustrated in the production graph in
Figure 25 and the average yield is 15%.

29 | P a g e
Figure 25: ROM, Product and Yield
5.2.2.6 CHPP Services
5.2.2.6.1 Air Services
Compressed air will be reticulated around the CHPP for use as plant and instrument air. Instrument air will
pass through a drier prior to reticulation.
5.2.2.6.2 Reagents/Diesel System
The reagents required to operate the flotation cell (diesel and MIBC) will be provided and stored in a
purpose-built facility (fuel farm). The fuel farm will consist of one (1) storage tank for collector and one (1)
storage tank for frother. Pumps and piping to transport the reagents from the storage tanks to the flotation
circuit will be supplied. The storage area and associated distribution networks are classified as hazardous
areas and will be designed and installed in accordance with South African Standards.
The reagent storage area will be designed with a 200 mm concrete slab with a 1:100 fall with sump for
rainfall run-off. As there is no requirement for a bund wall, allowance has been made for a small curb
(~150 mm) on the perimeter of the storage area to contain a full tanker volume of 20,000 L, e.g. should the
operator make wrong connection. The slab will drain to a collection sump where any spillages can be safely
cleaned up.
The separation distance between each tank is 1500 mm to allow for inspection of tanks i.e. for erecting
scaffolding.
The reagent pumps will each be installed in the pump bay of the tanks. Additional vents will be included in
the design to comply with hazardous area classification for flammable liquids.
Allowance has been made for 2 x unloading pumps; one dedicated pump for each reagent. They will each
be installed in the tank pump bay along with the respective dosing pump and mechanical (totaliser) meter
on each of the unloading pumps.
0
5
10
15
20
25
0.0
0.5
1.0
1.5
2.0
2.5
3.0
3.5
4.0
Y0 Y1 Y2 Y3 Y4 Y5 Y6 Y7 Y8 Y9 Y10 Y11 Y12 Y13 Y14 Y15 Y16 Y17 Y18 Y19 Y20 Y21 Y22 Y23 Y24
Yiel
d (
%)
RO
M (
Mt)
Periods (Years)
ROM vs Product Tonnes vs Yield
ROM_Coal Total product Total_yield

30 | P a g e
The truck unloading bay has a 1:100 fall with sump to capture any spills. This sump directs any spills to the
reagent slab for cleanup.
The reagent pipe route from the storage tanks to the plant is via the thickener on a cable tray.
5.2.2.6.3 Magnetite Bulk Storage
The magnetite pit will make provision for approximately 38 m³ of magnetite storage. Additional magnetite
will be stored within a designated chemical storage area (hardstand) to ensure the required amount of
magnetite is always available. Depending on the guaranteed logistic supply chain the size of this storage
area will provide for a minimum three months of dry storage.
5.2.2.6.4 Flocculant Bulk Storage
The flocculant system will cater for one (1) week’s online supply. The dry powder will be stored as required
in a designated chemical storage area and a minimum of three month of dry powder flocculant will be
stored in either 750 kg or 25 kg bags.
5.2.2.6.5 Power System Demand
The installed power for the CHPP is 5 MW, with a demand of 3.5 MW, estimated on the basis of a 600 tph
CHPP modules at 6500 hours per annum.
5.2.3 INFRASTRUCTURE
Musina is approximately 55 km north of The Duel Coal Project and is a regional centre providing modern
conveniences, including accommodation and services. The town is also a source of fuel and labour includes
a police station, a number of schools and a hospital. The town of Musina has a long history of mining, and
experienced staff and labour are expected to be sourced from this centre.
The Duel Coal Project is well situated with respect to the major infrastructural aspects of rail, road and
power. Power will be supplied by connection to the power grid. Accommodation will be provided on site.
Offices, a laboratory, workshops, stores and change houses will also be located on site.
The proposed infrastructure to be developed includes:
• Coal Handling Processing Plant (CHPP);
• Overburden Waste Dump;
• Temporary Discard Dump;
• Haul roads;
• Pollution Control Dams;
• Raw water storage facility and distribution systems;
• Access road; and
• Auxiliary infrastructure including a workshop and store, office and change house, electrical power
supply and security fencing.

31 | P a g e
Figure 26: Infrastructure arrangements for The Duel Coal Project
The washed coal will be transported via road to a nearby siding.
The final discard material from the plant will be disposed of in the mined-out open pit. If the pit is
unavailable due to existing mining activities, the discard material will be placed on an interim surface
discard dump, from where it will be reclaimed and dumped into the mined-out open pit towards the end of
the mine life as part of the rehabilitation of the mining site.
5.2.4 WATER REQUIREMENTS
5.2.4.1 Fire System / Washdown / Dust Suppression Systems
Fire, washdown and dust suppression reticulation systems will be provided around the CHPP. The source of
water for this system will come from the site CHPP raw water dam.
5.2.4.1.1 Fire Protection System
The fire protection system for the CHPP will be designed for early fire detection, emergency warning and
capability for pro-active response to an emergency fire situation.
The fire protection system will consist of the following:
• Fire water tank and pumping system (including back up diesel pump) by others.
• Fire water pipeline servicing the CHPP and materials handling facilities, CHPP control room site
offices, and workshop / stores facilities.

32 | P a g e
• Fire hydrants & hose reels appropriately spaced around the CHPP and CHPP office/workshop
facilities according to relevant South African Standards.
• Portable fire extinguishers consisting of dry chemical powder, carbon dioxide and wet chemical
types installed in designated areas of the site as per relevant South African Standards.
• Manual call points will be located at exits from all CHPP switchrooms being connected to a fire
indication panel (FIP); Manual call points will not be provided in the CHPP area.
• Sub-fire indicator panels with automatic detection and alarm system for fault detection in the CHPP
switchrooms. (Switchroom fire suppression systems are not a requirement under South African
Standards and are usually a requirement of the overall project insurance requirements. Fire
suppression has not been included in the CHPP switchroom however it can be retrofitted (at an
additional cost) in the future if required).
5.2.4.1.2 Washdown Water
• Washdown water will be provided in CHPP stations, bins and in the CHPP at each floor adjacent to
each set of stairs.
• Washdown water will be supplied from the same system (pump and tanks) that supply the CHPP
fire water system.
• Washdown water will generally be provided through 25 mm hoses in the CHPP stations and CHPP.
Additional hose connections and ball valves will be provided at other locations as necessary.
• Pressure requirements for washdown hoses will be the same as that for fire hoses and hydrants
(700kpa).
5.2.4.1.3 Dust Suppression
Dust suppression sprays will be provided at the ROM dump hopper and at appropriate transfer points in
the raw coal handling system.
Dust suppression is not provided for the product and rejects handling systems (as the conveyed material is
already wet) or on the raw and product coal stockpiles where mobile plant will be operating.
5.2.4.2 Raw Water
Raw water for the CHPP will be pumped to the nominated interface point at the CHPP.
The nominal water make-up requirement for the CHPP is 120 liter / ROM ton. This has been estimated on
the basis of a 600 tph CHPP modules at 6 500 hours per annum running tailings filters.
The CHPP will be designed to reuse various water streams to reduce the raw water demands. Gland seal
water, flocculant make up and filter press sprays will be sourced preferentially from the CHPP clarified
water to reduce raw water demand.
No specific water quality information has been available as part of the concept study. The raw water supply
has been assumed to be clean and generally have the following properties:
• pH 6.5 - 8.0
• Solids content:
o Dissolved: 1 000 ppm (mg/L)
o Suspended: 100 ppm (mg/L)

33 | P a g e
o 100% of +250 mesh (60 μm) particles removed.
• Maximum individual dissolved ions:
o Hardness (Ca+, Mg+) 200 ppm (mg/L) as CaCO3
o Calcium Carbonate (CaCO3) 10 ppm (mg/L)
o Sulphate (SO4-) 50 ppm (mg/L)
o Chloride (Cl-) 1 000 ppm (mg/L)
5.2.4.3 Potable Water
A potable water distribution system (tank and pump) will be provided at the CHPP and will also service the
CHPP service buildings (control room, office/workshop and ablutions facilities). The production and delivery
of potable water to the distribution tank will be provided as part of operations via water tanker.
5.2.4.4 Gland Seal Water
Gland seal water will be provided from the washdown water system or filtered clarified water. In-line
strainers will be used to protect seal damage from oversized particles in the gland water.
5.2.4.5 Other Mining Activities
In-pit water management will mainly consist of run-off control and temporary sumps at the lowest
elevation in the pit. A mobile trailer-mounted pit-dewatering pump will pump excess water to the mine
return water dam close to the plant to be used as processing water.
Haul road dust suppression will be handled through a basic dust management system using a water truck.
The same water truck operator would also in turn grade the roadways.
Drills will be fitted with effective water mist and dust-suppression systems, installed and maintained to the
manufacturer's specifications. Care will be taken to ensure that the dust extraction systems operate
effectively whenever drilling occurs. Dust suppression will be carried out in such a manner to ensure that
saline or polluted water is not sprayed onto areas of vegetation, areas undergoing rehabilitation or areas
and/or material designated for future rehabilitation.
5.2.5 MINE RESIDUE MANAGEMENT
5.2.5.1 Mining Waste
In-pit waste dumping will be utilised as far as practically possible, and the remaining waste to be
accommodated on surface near the pit exit.
An interim surface waste and discard dump that would accommodate approximately the first 15-20 years’
worth of waste mining was designed and placed as close as practically possible from the pit ramp exit. The
pit spans 1 800 m in length and 1 400 m in width and is 380 m deep and the surface area is approximately
200 ha. The surface waste dump has been nestled against a mountain ridge and is designed at a repose
angle of 30° from the lower lying valley to reach the top of the mountain ridge, the dump has been
designed in two stages as to minimise the visual impact. The design area is approximately of 1 200 m by 2
000 m and two stages of 75 m high.

34 | P a g e
During the active waste-tipping phase the waste dump is constructed at the material’s natural angle of
repose of approximately 35°. Then this must be contoured to 18 degrees to allow for slope stability and re-
vegetation. The waste dump will progress by tipping from a higher level against a window and progressively
pushing the waste out with a dozer. Waste dumps should be progressively rehabilitated with topsoil, where
possible. Low-grade and ore stockpile dumps will be constructed in close vicinity to the primary crusher
tipping point in order to minimise the reclamation costs.
Figure 27 illustrate the waste dump arrangement during steady state production towards the end of LOM
and Figure 28, the final arrangement at mine closure.
5.2.5.2 Non-Mining Waste
5.2.5.2.1 Sewage
The only sewage expected to be generated on the mine is from the ablution facilities and wash-rooms at
the plant area. It is envisaged that this sewage will be treated in a package plant, fed by gravity from the
various facilities.
The proposed sewage treatment works is to be of a semi-package plant design. The processes included in
the proposed plant are:
• Primary settling
• Anaerobic digestion
• Aerobic digestion
• Final settling
• Disinfection
The proposed plant has already been utilised on many mines and carries the approval of the DWS.

35 | P a g e
Figure 27: Interim waste dump arrangement
Figure 28: Final waste dump arrangement

36 | P a g e
5.2.5.2.2 General and Hazardous Waste
Upon approval of the project, a dedicated, approved (registered) waste contractor will be appointed by the
mine to manage the non-mining waste generation and safe disposal thereof. The following waste types will
be generated during the project:
• Domestic waste
• Hazardous waste, including used oil/diesel/greases
• Fluorescent tubes
• Glass and plastics
• Chemicals
• Medical waste
• Scrap metal
• Building rubble (construction & demolition activities)
• Used tyres
• Old explosives
The different waste streams will be segregated and disposed of in appropriate designated receptacles. All
waste will be disposed off-site at approved landfill sites. No landfill site will be established on The Duel site.
5.2.6 CLOSURE PLANNING AND REHABILITATION
The successful rehabilitation of impacted areas (soil, land capability and potential land use perspective) is
determined by several critically important factors, as follows:
• Soil compaction, organic carbon, fertility, suitable topsoiling materials and topsoiling depth;
• Sequence of horizons;
• Slope – must not exceed critical erosion slopes;
• Pollution – soluble pollutants, acid mine drainage and dust;
• Re-vegetation; and
• Climate.
These factors interact and have a large bearing on the ease with which roots colonise the soil. In areas
where plants thrive, there will consequently be a higher level of vegetative basal cover, and lower levels of
run-off and soil erosion. Any one of the aforementioned factors (either singly or in combination) may
jeopardize the successful rehabilitation of mine related facilities/features and will be taken into
consideration during the final rehabilitation planning.
5.2.6.1 Rehabilitation Objectives
The following preliminary objectives have been set for the successful rehabilitation of the disturbed areas
associated with the proposed The Duel Coal Project:
• Reclamation: To reclaim all mining related infrastructure from underground and seal the
underground operations when production ceases.
• Demolition: To demolish the surface structures where alternative use is not possible (agreed with
community) and rehabilitate the areas where required.

37 | P a g e
• Rehabilitation: To rehabilitate the open pit, remaining surface stockpiles and other disturbed areas
to a post-mining grazing capability class.
5.2.6.2 Rehabilitation Plan
To achieve the objectives, the following actions will be implemented when mining cease:
• Reclamation
o Reclaim all usable infrastructure from underground for recycling with the surface
infrastructure.
o Adits will be filled with non-combustible inert building rubble and terrace material.
• Demolition
o All buildings and steel structures will be demolished in a safe and environmentally
responsible manner.
o Material will be recycled as far as possible and use will be made of contractors specialising
in this field to dismantle the surface infrastructure and recycle the building material as far
as possible.
o Inert building rubble that cannot be recycled will be used to seal the underground adits.
o Other non-recyclable building material will be disposed of at a registered landfill site.
o All contaminated and carbonaceous material within the Infrastructure Area will be
removed and disposed off at an appropriate registered landfill site.
• Rehabilitation
o As far as practically possible, all areas will be designed to be free-draining as far as
practically possible and all clean surface runoff to be discharged into the natural
environment.
o Final destination scheduling will be developed during the Feasibility Phase. This schedule
will indicate the removal of materials from the open pit and utilise this material to ensure
an overall compliance of the rehabilitation objectives.
o All disturbed areas will be ripped to a minimum depth of 1m.
o Levelling, sloping and landscaping of the disturbed area.
o Topsoiling and re-vegetation according to the rehabilitation plan.
• Rehabilitation of remaining surface infrastructure
o Final sloping and landscaping of remaining surface dumps.
o Engineered capping of the remaining surface dumps to minimize water ingress and
spontaneous combustion.
o Stabilisation of any erosion in and around the remaining surface dumps.
o Construction of energy dissipating structures along steep slopes.
o Final topsoiling and re-vegetation of the remaining surface dumps according to the
rehabilitation plan.
Refer to Figure 28 for the envisaged final waste dump arrangements and rehabilitation topography after mining.

38 | P a g e
6 POLICY AND LEGISLATIVE CONTEXT
6.1 APPLICABLE LEGISLATION
The legal frameworks within which the mining development, transport options and associated
infrastructure aspects operate are complex and include many acts, associated regulations, standards,
principle, guidelines, conventions and treaties on an international, national, provincial and local level. The
main legal frameworks that require compliance in terms of Environmental and Water Use Authorisation
are:
• Act No. 28 of 2002: Mineral and Petroleum Resources Development Act (MPRDA), as amended
• Act No. 107 of 1998: National Environmental Management Act (NEMA), as amended
• Act No. 36 of 1998: National Water Act (NWA), as amended
• Act 25 of 2014: National Environmental Management Laws Amendment Act (NEMLAA)
Other legislative frameworks applicable to The Duel Coal Project include:
• Act No. 108 of 1996: The Constitution of South Africa
• Act No. 25 of 1999: National Heritage Resources Act (NHRA)
• Act No. 10 of 2004: National Environmental Management: Biodiversity Act (NEMBA)
• Act No. 43 of 1983: Conservation of Agricultural Resources Act (CARA)
• Act No. 84 of 1998: National Forests Act (NFA)
• Act No. 39 of 2004: National Environmental Management: Air Quality Act (AQA)
• Act No. 57 of 2003: National Environmental Management: Protected Areas Act
• Act No. 59 of 2008: National Environmental Management: Waste Act (NEMWA)
• Act No. 26 of 2014: National Environmental Management Act: Waste Amendment Act
• Act No. 101 of 1998: National Veld and Forest Fire Act
• Act No. 15 of 1973: Hazardous Substances Act
• GN No. 704 of 4 June 1999: Regulation on use of water for mining and related activities aimed at
the protection of water resources
• GN No. R. 982-986 of 4 December 2014: NEMA: EIA Regulations, as amended in 2017
• GN No. 718 of 3 July 2009 and R. 921 of 2013: NEMWA: Waste Management Activities
• GN No. 634 of 23 August 2013: NEMWA: Waste Classification and Management Regulations
• GN No. 248 of 31 March 2010: AQA: Atmospheric Emissions Activities
• GN No. R.152 of 2007: NEMBA: Threatened or Protected Species (TOPS) Regulations
• Act No. 7 of 2003: Limpopo Environmental Management Act (LEMA)
• Act No. 29 of 1996: Mine Health and Safety Act (MHSA)
• Act No. 125 of 1991: Physical Planning Act
• Act No. 16 of 2013: Spatial Planning and Land Use Management Act (SPLUMA)
• Act No. 16 of 2014: Special Economic Zones Act
• Act No. 117 of 1998: Municipal Structures Act
• Act No. 32 of 2000: Municipal Systems Act
• Act No. 67 of 1995: Development Facilitation Act (DFA)
• Act No. 9 of 1972: National Road Safety Act
• Act No. 93 of 1996: National Road Traffic Act

39 | P a g e
• Act No. 19 of 1998: Prevention of Illegal Eviction from and Unlawful Occupation of Land Act
• Act No. 3 of 1996: Restitution of Land Rights Act
• Act No. 112 of 1991: Amendment of the Upgrading of Land Tenure Rights Act
Strategies, guidelines and other documents of importance to this project (list not exhaustive) are:
• National Protected Areas Expansion Strategy, 2010 (NPAES)
• National List of Threatened Terrestrial Ecosystems for South Africa, 2011
• National Biodiversity Assessment, 2011 (NBA)
• Biodiversity Policy and Strategy for South Africa: Strategy on Buffer Zones for National Parks
published under General Notice 106 in Government Gazette 35020 of 8 February 2012
• The Mining and Biodiversity Guideline: Mainstreaming Biodiversity into the Mining Sector, 2013
• Implementation Manual for Freshwater Ecosystem Priority Areas, 2011
• Limpopo Conservation Plan Version 2, 2013
• Good Practice Guidance for Mining and Biodiversity: International Council on Mining and Metals
• Convention on Biological Diversity (1995)
• World Summit for Sustainable Development (2002)
• Important Bird Areas, BirdLife South Africa
6.2 APPROACH TO ENVIRONMENTAL AUTHORISATION AND STAKEHOLDER ENGAGEMENT
The enactment of the NEMLAA introduced the One Environmental System (OES) on 8 December 2014. In
terms of the OES every applicant who applies for a mining right in terms of Section 22 of the MPRDA must
conduct an Environmental Impact Assessment (EIA) and submit an Environmental Impact Assessment
Report (EIAR) and Management Programme Report (EMPr) in terms of the NEMA (amendments) and its EIA
regulations (2014), as amended in 2017.
Under the OES these reports are submitted to the DMR who is the lead agent for any mining and related
activities. The system requires all permitting applications to be conducted in parallel to facilitate integrated
decision making at Government level and the Environmental Authorisation application should therefore
ideally include the requirements of the NEMA, the NEMWA and others, as applicable.
It is important to note that the approach for The Duel Coal Project is to first apply for the mining right and
associated Environmental Authorisation in terms of the NEMA: 2014 regulations. Once this process is
completed and the applicant has conducted further feasibility studies and detail designs in respect of its
development, the applications for the Waste Management Licence in terms of NEMWA and the Water Use
Licence in terms of the NWA will be submitted to the relevant authorities.
The EIA Process requires three phases, the Pre-application Phase, the Scoping Phase and the EIA Phase.
• The Pre-application Phase entails the notification and registration of IAPs, as well as upfront
engagement with directly affected parties.
• Scoping is the first phase of the EIA Process. The objective of the Scoping Phase is to describe the
environment, identify potential information gaps and to formulate an appropriate Plan of Study to
ensure that the necessary information required for the EIA Phase is generated.

40 | P a g e
• This EIA Phase is a comprehensive, independent assessment of all identified and potential
environmental impacts, and normally includes a number of specialist studies. The aim of an EIA is
to ensure that the development occurs in a sustainable manner and to formulate ways for to
reduce or mitigate any negative impacts of the project whilst enhancing its benefits. The findings
and mitigation measures are recorded in the EMPr which becomes a legally binding document on
approval.
In parallel to the EIA process, a comprehensive Public Participation process will be conducted. This offers
stakeholders the opportunity to learn about the project, to raise issues that they are concerned about, and
to make suggestions for enhanced project benefits. The technical specialists and project team will evaluate
relevant issues and suggestions during the EIA process. The following diagram indicate the process, where
we are now ( ) and the steps to follow.
Figure 29: EIA and Public Participation Process

41 | P a g e
6.3 LICENSING REQUIREMENTS
The following preliminary licencing requirements have been identified:
Note: The list is not exhaustive and will be finalised during the EIA Phase as the specialist impact studies and
associated impact assessments become available.
6.4 PERIOD FOR WHICH ENVIRONMENTAL AUTHORISATION IS REQUIRED
Environmental Authorisation is required for a minimum of 20 years.
Legislation Comment Requirement
MPRDA Subiflex (Pty) Ltd to apply for a mining right. Submission of Mining Right Application (MRA) to Limpopo DMR
NEMA, EIA Regulations (2014)
A number of listed activities are applicable, the majority triggering the threshold limit for a Full EIA required in terms of GN984.
Application for Environmental Authorisation to Limpopo DMR
NEMWA, Waste Regulations (2013)
A number of waste management activities are triggered by the proposed development, including mining waste.
Application for Waste Management Licence to Limpopo DMR
NWA, S21 Licences will be required for a number of water uses.
IWULA and IWWMP for submission to Limpopo DWA
Forest Act Permits required for the destruction and/or relocation of protected tree species.
Permit application to DAFF if applicable
NEM:BA, TOPS regulations Permits required for the destruction and/or relocation of protected species.
Permit application to LEDET if applicable
NHRA Permits required for Phase 1B and Phase 2 studies.
Permit application to SAHRA if applicable

42 | P a g e
7 NEED AND DESIRABILITY OF THE PROJECT
7.1 ECONOMIC BENEFITS
The Duel Coal Project will develop a high-quality mineral resource with an estimated LOM of 24 years which
has the potential for huge economic benefits on local, provincial and national level in terms of employment
and the contribution to the Gross Domestic Product (GDP).
In South Africa the last producing hard coking coal mine is closing and in the process of rehabilitation. The
Tshikondeni Mine produced in the order of 316 000 tonnes of hard coking coal (HCC) and was the only HCC
producer in the country since 1984. Its recent closure spells the total shortage of local HCC for the metals
industry in South Africa. The largest coal mine in the southern hemisphere, Grootegeluk Colliery, produces
about 2.5 Mtpa of soft coking coal for the metals industry but this product does not form a replacement for
HCC. Production of the soft to semi-soft coking coal is low as the demand thereof is small.
The nearest HCC project to The Duel Coal Project is the neighbouring Makhado Project owned by MC
Mining (previously Coal of Africa Limited). The Makhado HCC specification also indicates that it would be a
good primary coal in a HCC blend, as demonstrated in blending tests at Arcelor Mittal's Vanderbijlpark Steel
Plant. The Duel Coal Project will be able to supply hard coking and thermal coal to the metallugical and
power-generation industry within relative proximity to the project.
In addition to the quantifiable economic benefits that will result from this development, there are also
several benefits that are not measurable in the same way, but that should be considered. These benefits
could include:
• Technology: Technology used on the mine will work towards improving knowledge on available
technologies and skills in using such technology. This may enable local communities to run their
own successful businesses in the future.
• Skills development: Local communities who may not have any marketable skills other than a basic
education will be able to acquire skills through employment on the mine. In addition to the
technical skills, there will be numerous roles imparting valuable management and leadership skills
as well.
• Asset base: The capital expenditure outlaid into the land in the area will result in an asset base
upon which future development can occur. In addition to this, the asset base adds value to the
municipality itself and provides a starting point for future developments.
• Local procurement and SMME opportunities: Local communities will be enabled and provided
with opportunities to participate in contracts and other new businesses that would become
available during the construction and operational phases.
• Equal employment opportunities and training and skills development opportunities associated
with the mine will improve.
7.2 SOCIAL AND LABOUR PLAN
Subiflex is committed to optimise opportunities in the local communities through the implementation of its
Social and Labour Plan (SLP). The SLP implementation will only commence once a decision has been made
by the DMR on the granting of the Mining Right.

43 | P a g e
7.2.1 JOB CREATION
The Duel Coal Project will create 346 permanent job opportunities at commencement, ramping up to 550
job opportunities in year 6 when underground mining will commence. Subiflex has set a target to ensure
that at least half of these opportunities are allocated to the local communities.
7.2.2 WORKFORCE DEVELOPMENT
As part of the SLP, Subiflex plans to implement a comprehensive workforce development plan through
adult basic education and training, core business training, artisan training, learnerships, bursaries and
internship programmes. These will be supported by career-path planning and mentorship. Subiflex has
committed these programmes over the first 5 years of mining with a total value of R 8.675 million:
• Core business and Artisan Training – creating an opportunity for candidates to complete various
training courses in Machine Operation, Truck Driving, Health and Safety, Human Resources,
Mechanics, Electricians, Fitting and Turning.
• To make available learnership opportunities in Engineering, Artisans, Machine Operation.
• To establish career-path plans for those candidates showing promise to fast track their
development and facilitate promotions.
• To make available bursaries in Mining, Mechanical & Electrical Engineering, Financial, Human
Resources and Geology study areas.
• To make available internship opportunities in Mechanical & Electrical Technicians, Health and
Safety and Financial positions.
7.2.3 COMMUNITY DEVELOPMENT
To further support local communities, Subiflex is proposing Community Development Projects focused on
education and small business development. Subiflex proposes the implementation of the following
projects over the first 5 years of mining with a total value of R 2.93 million:
• Infrastructure Project(s), as identified by the directly affected communities.
• School Needs Project in the schools located in the directly affected communities. The project will
focus on key needs in each school, which will be identified in consultation with the school
management.
• Enterprise Development Project amongst local business people focusing on the establishment,
training and mentoring of local companies in personnel transport, security and catering.

8 DESCRIPTION OF THE PROCESS FOLLOWED TO REACH THE PREFERRED SITE
8.1 DEVELOPMENT ALTERNATIVES CONSIDERED
Infrastructure to support The Duel Coal Project has been laid out and engineered to best suit the
topography and mining pit layouts, as well as the relatively small footprint of the farm, and is
described in Section 5 of this report.
No site location alternatives have been considered as mining can only be undertaken in areas where
economically mineable resources occur. This area was established through extensive prospecting
and geological modeling.
Apart from the No-Go Option, three alternatives were evaluated in respect of the mining
methodology, namely:
• Opencast only
• Combination opencast & underground
• Underground only
Selection of a mining method is always dictated by the ore-body or resource, although from an
environmental perspective, underground mining would be the most suitable as this would limit the
surface disturbance and impact on the biodiversity of the area. However, a large portion of the
resource will be lost due to the safety risks associated with mining of shallow resources.
Underground mining on its own would have sterilised many of the coal contained in the coal zones.
If only a single coal horizon is to be mined, it would have resulted in a very short LOM and be
uneconomical since the areal extent of the coal deposit is too small for economical extraction by this
drastically reduced production profile. A combined mining plan including both opencast and
underground mining was thus chosen to optimise the mineral resource utilisation.
Opencast allows for the in-pit disposal of the mine residue (discard and slurry filter cake) which is
positive in terms of groundwater quality management, visual impact (no residual surface dumps)
and the general biodiversity of the area.
The following alternative land use options have been identified and the viability of these alternative
land use options will be determined during the EIA Phase by utilising the collected site-specific data
to determine the comparative feasibility of the project and also the impact on local activities:
Commercial farming; Grazing; Eco-tourism; and Communal land.
The No-Go Option will also be investigated. The main consequence of the No-Go Option is the loss
of opportunity to develop a high-quality mineral resource with an estimated LOM of 24 years which
has the potential for huge economic benefits on local, provincial and national level in terms of
employment and the contribution to the GDP.
Other socio-economic benefits that will be lost include Skills development opportunities; Local
Economic Development projects (SLP); and Local procurement and SMME opportunities.

45 | P a g e
8.2 DETAILS OF PUBLIC PARTICIPATION PROCESS FOLLOWED
8.2.1 IAP REGISTER
A list of potential IAPs were compiled as part of the previous application in 2015 and updated during
February 2019. The register includes all relevant Government Departments and other agencies,
landowner, land claimants, neighbouring landowners and neighbouring Traditional Leadership and
communities and Environmental Interest groups/NGOs.
The IAP Register will be maintained and updated throughout the process as required by the NEMA:
2014 EIA Regulations (as amended). Please refer to Appendix 1-1 for a copy of the IAP Register as at
the availability of the draft Scoping Report.
8.2.2 WRITTEN NOTICE OF THE APPLICATION
The following written notifications (Appendix 1-2) were sent in the announcement of the project and
re-application for Environmental Authorisation:
Table 2: IAP Notifications
Stakeholder Group
Interested & Affected Party
Method of Notification Date of
Notification
Organs of State All relevant Authorities contained in the Authority Register
Notification Letter emailed
1 Feb 2019
Municipalities All District and Local Municipalities as contained in the IAP Register
Notification Letter emailed Notification Letter hand-delivered to Ward Councilor
1 Feb 2019 1 Feb 2019
Landowner, Lawful Occupier, Community
All landowners identified as contained in the Property Register
Advertisement placed / On-site notices Notification Letter emailed
1 Feb 2019 1 Feb 2019
Traditional Authorities / Leaders
Advertisement placed / On-site notices Notification Letter emailed / hand-delivery Mphephu meeting
1 Feb 2019 1 Feb 2019 4 Feb 2019
12 Feb 2019
Land Claimants / Communities
Advertisement placed / On-site notices Notification Letter emailed / hand-delivery Nemamilwe Trust meeting
1 Feb 2019 1 Feb 2019
12 Feb 2019
Other IAPs Environmental NGO’s / Conservation Organisations
Advertisement placed / On-site notices Notification Letter emailed
1 Feb 2019 1 Feb 2019
VMRSF Advertisement placed / On-site notices Notification Letter emailed
1 Feb 2019 1 Feb 2019
Other, as registered Advertisement placed / On-site notices Notification Letter emailed
1 Feb 2019 1 Feb 2019
The Announcement of the intent to submit a re-application was sent to all IAPs and contained the
following information:
• Details of the application or proposed application which is subjected to public participation;
• Explanation of the proposed project’s nature, location and planned activity;
• Stating the required regulated processes in terms of the relevant legislations;

46 | P a g e
• Stating where further information on the application can be obtained; and
• Stating the manner in which a person can become involved / register as an IAP.
8.2.3 ADVERTISEMENTS AND ON-SITE NOTIFICATIONS
The following advertisements (Appendix 1-3) were placed for announcing the project and re-
application:
Table 3: Advertisements
Type of Media Name of Media Distribution Date of placement
Newspaper Limpopo Mirror Limpopo Province 1 Feb 2019
The following on-site notifications (Appendix 1-4) were placed for announcing the project and re-
application:
Table 4: On-Site Notices
Location of Notice Name of Location Coordinate of Placement Date of placement
Project Property Boundary
Entrance to The Duel 22,759815°S; 30,048157°E 1 Feb 2019
Neighbouring Communities
Adjacent to Makushu Community
22,760952°S; 30,053895°E 31 Jan 2019
Adjacent to Mosholombe Community
22,761755°S; 30,060366°E 31 Jan 2019
Dzanani Shopping Centre 22,897642°S; 30,037721°E 31 Jan 2019
Municipality Makhado Local Municipality 23,0430088°S; 29,9070275°E 1 Feb 2019
Public Places Tshipise Garage & Shop 22,604406°S; 30,171108°E 31 Jan 2019
8.2.4 AVAILABILITY OF PROJECT DOCUMENTATION
The following documents were made available throughout the process:
Table 5: Public Documents Table
Document Timeframe Date of availability Date of comment
closure
Notification letter & Registration form
Ongoing throughout the process
1 Feb 2019 Not applicable
The Draft Scoping Report (DSR) 30 days 15 Feb 2019 15 March 2019

47 | P a g e
8.2.5 IAP ENGAGEMENTS AND MEETINGS
The following Engagements have been held and records are attached as follows:
• Notification of project re-application and request for registration attached as Appendix 1-2.
• Minutes of meetings with Mphephu Traditional Authority, the Nemamilwe Trust and One-
on-one Engagements attached as Appendix 1-5.
• Comments received from the previous process to date as contained in the CRR attached as
Appendix 1-6.
• Written submissions received on the re-application from organs-of state and/or other IAPs
attached as Appendix 1-7.
Table 6: Engagement Session Table
Party Type of Engagement Date of Engagement
AFFECTED PARTIES
Landowners
Project Landowners Notification of re-application (App1-2) 1 Feb 2019
Lawful occupier/s of the land
No occupants on property Not applicable Not applicable
Land Claimants
Land Claimants & DRDLR Notification of re-application (App1-2) One-on-One meeting (App1-5)
1 Feb 2019 12 Feb 2019
Municipality
Ward Councillors Notification of re-application (App1-2) One-on-one engagement (App 1-5)
1 Feb 2019 31 Jan 2019
District Municipality Notification of re-application (App1-2) 1 Feb 2019
Local Municipality Notification of re-application (App1-2) 1 Feb 2019
Traditional Leaders
No Traditional Authority on property
Not applicable Not applicable
Communities
No communities residing on property
Not applicable Not applicable
Organs of State
DMR Notification of re-application (App1-2) 1 Feb 2019
LEDET Notification of re-application (App1-2) 1 Feb 2019
DWS Notification of re-application (App1-2) 1 Feb 2019
DRDLR Notification of re-application (App1-2) 1 Feb 2019
Department of Agriculture Notification of re-application (App1-2) 1 Feb 2019
SAHRA / LIHRA Notification of re-application (App1-2) 1 Feb 2019
OTHER AFFECTED PARTIES
Adjacent landowners
Landowners adjacent to the project area
Notification of re-application (App1-2) 1 Feb 2019
Adjacent Traditional Leaders
Mphephu Traditional Authority Notification of re-application (App1-2) Meetings (App 1-5)
1 Feb 2019 4 Feb 2019 12 Feb 2019
Makushu, Mosholombe, Pfumembe & Nemamilwe Traditional Leaders
Notification of re-application (App1-2) One-on-One Engagements (App1-5)
1 Feb 2019 31 Jan 2019

48 | P a g e
Party Type of Engagement Date of Engagement
Adjacent communities
Makushu, Mosholombe, Pfumembe Communities
Notification of re-application (App1-2) On-site notices (App1-4)
1 Feb 2019 1 Feb 2019
INTERESTED PARTIES
VMRSF Notification of re-application (App1-2) 1 Feb 2019
All other parties on register Notification of re-application (App1-2) 1 Feb 2019

49 | P a g e
8.3 SUMMARY OF ISSUES RAISED BY IAPS
Table 7: Comments and Response Summary
Interested and Affected Parties Date comments received
Issues raised Response Consultation status (consensus, dispute, not finalised)
AFFECTED PARTIES
Landowners
Project Landowners
Lawful occupier/s of the land
No occupants on property Not applicable Not applicable Not applicable Not applicable
Land Claimants
Nemamilwe Trust X 1 Feb 2019 12 Feb 2019
In support of project
Consensus
Municipal Councillor
Ward Councillor X 31 Jan 2019 In support of the project Ongoing consultation
Invitations to meetings Consensus
Municipality
District Municipality X No comments
Local Municipality X No comments
Traditional Leaders
Property does not fall under a Traditional Authority
Not applicable
Communities
No communities residing on the Infrastructure Properties
Not applicable
Organs of State
DMR
LEDET X 30 Nov 2015
Area fall within the CBA 1 and 2, to include an ecological assessment
An ecological assessment was conducted for the 2015 application. The study will be reviewed and updated as part of this re-application.
Not finalised
DWS X 18 Jan 2016 Identification of water resource Storm water control measures to be implemented Monitoring boreholes upstream and downstream
The water requirements have been determined but further investigation is required to evaluate options.
Not finalised

50 | P a g e
Interested and Affected Parties Date comments received
Issues raised Response Consultation status (consensus, dispute, not finalised)
The groundwater and alternative water resource studies will be reviewed and updated as part of this re-application.
DRDLR X
Department of Agriculture X 4 Sept 2015 Is underground mining a possibility Post mining land use objective
The geology in the area is such and the coal depth is too shallow, to allow for complete underground mining. The current land use is grazing, and therefore the proposed post-mining land use would probably also be grazing. This will be addressed in more detail in the EIA Report.
Consensus
SAHRA / LIHRA X No comments
OTHER AFFECTED PARTIES
Adjacent landowners
Landowners adjacent to the project area
X 4 Feb 2019 Kuduland Conservancy – destination and method of transport of product (Siding)
The washed coal will be transported via road to a nearby siding. The destination is unknown at this stage and will be dependent on the market and any off-take agreements once mining commences.
Not finalised
Adjacent Traditional Leaders
Mphephu Traditional Authority X 4 Feb 2019 Mphephu has established a coordinating process for all new developments, so as to review benefits and ensure local communities benefit. Benefits must be presented to Mphephu before communities are engaged.
Meeting scheduled for 12 Feb 2019 Not finalised
Adjacent communities
Makushu, Mosholombe, Pfumembe X 11 April 2015 13 June 2015 5 Sept 2015
Support the mine development Resettlement of households that are close to mine area Concerned about graves that would need to move Benefits to the community: roads are a primary need
The EIA and specialist studies will determine what the impacts are and to what extent they can be mitigated to avoid relocation.
Not finalised
INTERESTED PARTIES
VMRSF X 17 Sept 2015 Cumulative impact of the project on the Vhembe As far as possible, and as far as Not finalised

51 | P a g e
Interested and Affected Parties Date comments received
Issues raised Response Consultation status (consensus, dispute, not finalised)
District, especially groundwater impacts information was available, the cumulative groundwater impacts are addressed in the groundwater specialist study. The groundwater study will be reviewed and updated as part of this re-application.
All other parties on register X
A detailed Comments and Response Report (CRR) is attached as Appendix 1-6. Copies of written submissions are included in Appendix 1-7.
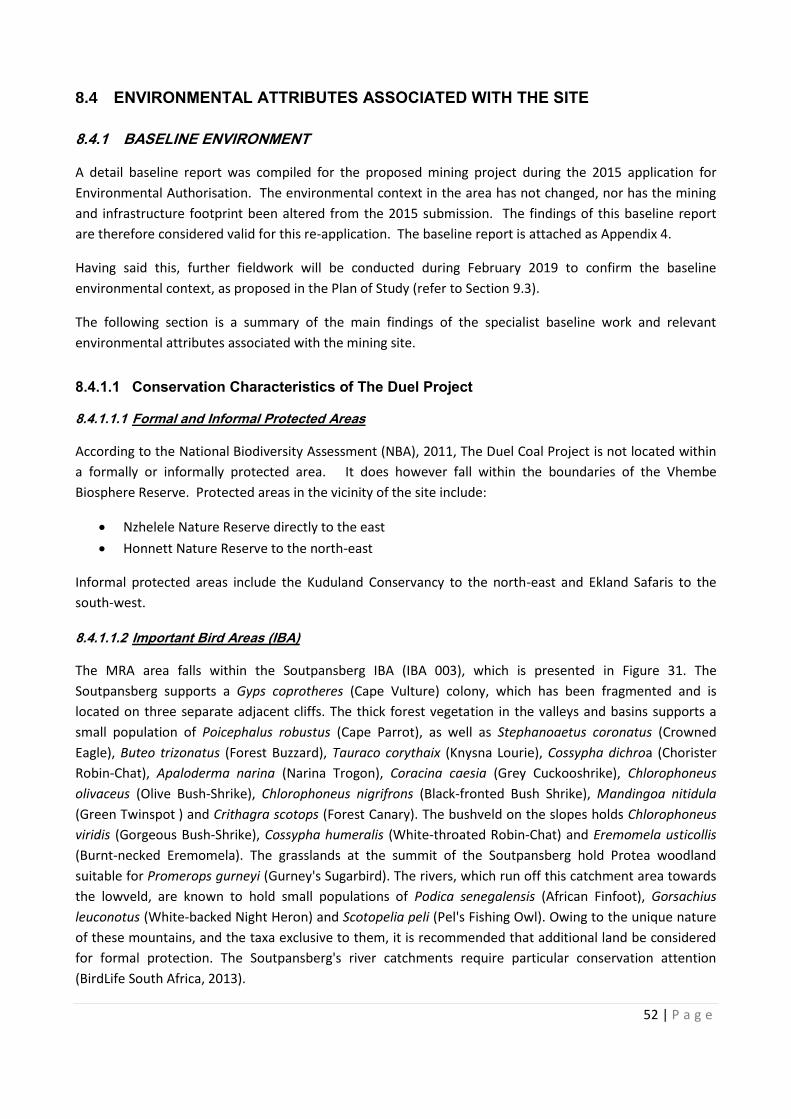
52 | P a g e
8.4 ENVIRONMENTAL ATTRIBUTES ASSOCIATED WITH THE SITE
8.4.1 BASELINE ENVIRONMENT
A detail baseline report was compiled for the proposed mining project during the 2015 application for
Environmental Authorisation. The environmental context in the area has not changed, nor has the mining
and infrastructure footprint been altered from the 2015 submission. The findings of this baseline report
are therefore considered valid for this re-application. The baseline report is attached as Appendix 4.
Having said this, further fieldwork will be conducted during February 2019 to confirm the baseline
environmental context, as proposed in the Plan of Study (refer to Section 9.3).
The following section is a summary of the main findings of the specialist baseline work and relevant
environmental attributes associated with the mining site.
8.4.1.1 Conservation Characteristics of The Duel Project
8.4.1.1.1 Formal and Informal Protected Areas
According to the National Biodiversity Assessment (NBA), 2011, The Duel Coal Project is not located within
a formally or informally protected area. It does however fall within the boundaries of the Vhembe
Biosphere Reserve. Protected areas in the vicinity of the site include:
• Nzhelele Nature Reserve directly to the east
• Honnett Nature Reserve to the north-east
Informal protected areas include the Kuduland Conservancy to the north-east and Ekland Safaris to the
south-west.
8.4.1.1.2 Important Bird Areas (IBA)
The MRA area falls within the Soutpansberg IBA (IBA 003), which is presented in Figure 31. The
Soutpansberg supports a Gyps coprotheres (Cape Vulture) colony, which has been fragmented and is
located on three separate adjacent cliffs. The thick forest vegetation in the valleys and basins supports a
small population of Poicephalus robustus (Cape Parrot), as well as Stephanoaetus coronatus (Crowned
Eagle), Buteo trizonatus (Forest Buzzard), Tauraco corythaix (Knysna Lourie), Cossypha dichroa (Chorister
Robin-Chat), Apaloderma narina (Narina Trogon), Coracina caesia (Grey Cuckooshrike), Chlorophoneus
olivaceus (Olive Bush-Shrike), Chlorophoneus nigrifrons (Black-fronted Bush Shrike), Mandingoa nitidula
(Green Twinspot ) and Crithagra scotops (Forest Canary). The bushveld on the slopes holds Chlorophoneus
viridis (Gorgeous Bush-Shrike), Cossypha humeralis (White-throated Robin-Chat) and Eremomela usticollis
(Burnt-necked Eremomela). The grasslands at the summit of the Soutpansberg hold Protea woodland
suitable for Promerops gurneyi (Gurney's Sugarbird). The rivers, which run off this catchment area towards
the lowveld, are known to hold small populations of Podica senegalensis (African Finfoot), Gorsachius
leuconotus (White-backed Night Heron) and Scotopelia peli (Pel's Fishing Owl). Owing to the unique nature
of these mountains, and the taxa exclusive to them, it is recommended that additional land be considered
for formal protection. The Soutpansberg's river catchments require particular conservation attention
(BirdLife South Africa, 2013).

53 | P a g e
Figure 30: The Duel Coal Project in relation to formal and informal protected areas
Figure 31: Important Bird Areas

54 | P a g e
8.4.1.1.3 Importance according to the Mining and Biodiversity Guideline (2012)
According to the Mining and Biodiversity Guideline most of the study area is located within an area
considered to be of Highest Biodiversity Importance (Figure 32). Highest Biodiversity Importance areas
include areas where mining is not legally prohibited, but where there is a very high risk that due to their
potential biodiversity significance and importance to ecosystem services (e.g. water flow regulation and
water provisioning) that mining projects will be significantly constrained or may not receive necessary
authorisations.
Figure 32: Importance in accordance with the Mining and Biodiversity Guideline (2012)
8.4.1.1.4 Importance according to the Limpopo Conservation Plan Version 2
The Limpopo Conservation Plan V2 was consulted in order to determine whether the study area falls within
any areas of conservation importance. From Figure 33, it is evident that the study area falls within a Critical
Biodiversity Area (CBA) 1 and 2. The following land-use guidelines and compatible land uses are proposed
for CBA 1 and 2 areas:
• CBA 1:
o Conservation and associated activities;
o Extensive game farming and eco-tourism operations with strict control on environmental
impacts and carrying capacities, where overall there is a net biodiversity gain;

55 | P a g e
o Extensive livestock production with strict control on environmental impacts and carrying
capacities;
o Required support infrastructure for the above activities; and
o Urban Open Space Systems.
• CBA 2:
o Current agricultural practices including arable agriculture, intensive and extensive animal
production, as well as game and ecotourism operations, so long as these are managed in a
way to ensure populations of threatened species are maintained and the ecological
processes which support them are not impacted.
o Any activities compatible with CBA1.
Figure 33: Limpopo Critical Biodiversity Areas

56 | P a g e
8.4.1.2 Biophysical Environment
8.4.1.2.1 Topography and Landscape Character
The study area is also located at the foot of the Soutpansberg Mountains in a low-gradient, plateau-like
surface, cut by irregular valleys and hills.
Vegetation, geology and topography, as well as cultural factors including land use, settlement patterns and
the manner in which humans have transformed their natural surroundings. According to Swanwick (2002),
landscape character may be defined as a distinct, recognisable and consistent pattern of elements in the
landscape that makes it unique and provides it with a particular sense of place. Individual “landscape
elements” that contribute to landscape character include hills, rolling plains, valleys, woods, trees, water
bodies, as well as buildings and roads. “Landscape features” are those elements that are prominent or eye-
catching.
Figure 34: Landscape character of the study area, indicating the steep hills, which is the most prominent landscape feature within the study area
Landscapes may be divided into landscape character types, which are defined as distinct types of landscape
that are relatively homogeneous in character. Such landscape character types are generic in nature and
may occur in different areas in different parts of the country, but wherever they occur, they share broadly
similar combinations of geology, topography, drainage patterns, vegetation, land use and settlement
patterns (Swanwick, 2002).

57 | P a g e
The landscape associated with the study area and its immediate surroundings exhibit a common,
discernible pattern, is considered to have broadly similar landforms, vegetation and settlement
configurations, and thus comprise a single landscape character type. This landscape character type can be
described as rural, mountainous, closed bushveld (Figure 34), with a number of prominent and eye-
catching features present in the form of steep hills and outcrops. Although the landscape character within
the larger region is relatively homogeneous, the landscape at a finer scale, associated with the study area
itself is considered to be diverse as a result of the variety of topographical features. Other prominent
landscape features in the region include Mutamba River immediately to the northwest of the study area
and the Nzehelele River and Nzehelele Dam towards the east.
General views of the landscape associated with the study area and surrounds are indicated in Figure 35.
Figure 35: General views of the study area and the surrounding region

58 | P a g e
8.4.1.2.2 Land Capability
Figure 36 depicts the land capability of the area. Table 8 correlates the land capability with certain soil
types and lists the hectares each land capability class comprise. The area is divided into six land capability
classes.
Table 8: Land capability correlated with soil form
Soil Type Land Capability Area (Ha)
Soil-Rock Complex 394.164299 Wilderness
Kimberly-Augrabies-Oakleaf-Mispah Complex 5.651457 Wetland
Mispah-Glenrosa-Rocky Augrabies Complex 69.879813 Grazing / Wilderness
Mispah/Glenrosa 53.759564 Grazing
Mispah/Rocky Hutton 22.50479 Grazing
Mispah/Rocky Augrabies 58.82174 Grazing
Rocky Brandvlei 4.047013 Grazing
Augrabies 153.38204 Medium Potential Arable Land
Mispah 17.926366 Grazing / Wilderness
Rocky Hutton 15.10727 Grazing
Rocky Hutton/Augrabies 23.072324 Grazing
Alluvial deposits-Oakleaf-Hutton-Augrabies Complex
9.835983 Riparian and Temporary Wetland
Hutton 57.040612 Medium Potential Arable Land

59 | P a g e
Figure 36: Land capability classes of the study area

60 | P a g e
8.4.1.2.3 Biodiversity
8.4.1.2.3.1 Vegetation
The project area falls within two vegetation types namely Musina Mopane Bushveld and Soutpansberg
Mountain Bushveld vegetation types (Mucina & Rutherford, 2006).
• The Musina Mopane Bushveld vegetation type is Least Threatened with a conservation target of
19%.
• The Soutpansberg Mountain Bushveld vegetation type is vulnerable with a conservation target of
24%.
Three main habitat units were identified during the assessment namely:
• Soutpansberg Mountain Bushveld;
• Wetland and Riparian habitat; and
• Mopane Woodland.
Figure 37 depicts the habitat units identified during the site assessment in relation to the study area.
Figure 37: Conceptual illustration of the habitat units within the study area
Alien floral invasion in the project area is low to very low and limited to isolated patches of disturbance
around roads and nearer to human settlements adjacent to the stud area. Alien and weed species

61 | P a g e
encountered on the property are to be removed in order to comply with existing legislation (amendments
to the regulations under the Conservation of Agricultural Resources Act, 1983 and Section 28 of the
National Environmental Management Act, 1998). Removal and control of invasive plant species should take
place throughout the pre-construction, construction, operational, and rehabilitation/ maintenance phases.
A moderate to high diversity of medicinal species is present, and it is highly likely that the local
communities rely on these medicinal species as relatively few medical facilities are present in the local area.
In addition, five medicinal tree species, namely Sclerocarya birrea subsp caffra, Adansonia digitata,
Lonchocarpus capassa, Combretum imberbe and Boscia albitrunca are protected under the NFA (1998).
Another medicinal species, namely Adenium multiflorum, is protected under the NEMBA TOPS list. Adenium
multiflorum and Adansonia digitata are also protected under the Limpopo Environmental Management Act
(Act 7 of 2003).
Thus, any detrimental impact on the medicinal species associated with the study area is likely to have an
impact on surrounding communities relying on such species for medicinal use.
Figure 38 conceptually illustrates the areas considered to be of increased ecological sensitivity in relation to
the proposed project. The areas are depicted according to their sensitivity in terms of faunal and floral
habitat integrity and their suitability to provide habitat to faunal and floral communities.
The wetland and riparian habitat unit provides niche habitat for a high diversity of floral and faunal species
and acts as a very important network of migratory corridors for faunal species. Thus, this habitat unit is
considered to be highly sensitive. As such, any impacts on the wetland and riparian systems associated with
the study area are likely to be significant on a local and regional scale.
The Soutpansberg Mountain Bushveld habitat unit has general high ecological functionality and overall high
levels of habitat integrity and is in a relatively undisturbed condition. The species composition of this
habitat unit is also representative of the vegetation type in which it occurs, and the vegetation type is
considered to be Vulnerable. Furthermore, this habitat unit contains several floral Species of
Conservational Concern (SCC). Thus, this habitat unit is considered to be highly sensitive.
The Mopane Woodland habitat unit has general moderate to high ecological functionality and levels of
habitat integrity and is in a relatively undisturbed condition. The species composition of this habitat unit is
also representative of the vegetation type in which it occurs, and the vegetation type is considered Least
Threatened. Furthermore, this habitat unit contains several floral SCC. Thus, this habitat unit is considered
to be moderately sensitive.

62 | P a g e
Figure 38: Terrestrial sensitivity map for the study area in relation to proposed mining infrastructure
8.4.1.2.3.2 Fauna
During the field assessment of the project area, the only species of conservational concern (SCC) that were
observed either directly or by signs thereof were that of Panthera pardus and Hyaena brunnea. The study
area in all likelihood forms part of these species home ranges, which will extend well beyond that of the
study area alone. The reduction in these species home ranges will could result in a loss of both foraging and
breeding potential, as well as place them in further competition with neighbouring rivals as they try to
compensate for the decrease in their own home range by extending into neighbouring home ranges.
Ceratogyrus darlingi is not listed as threatened as of yet, however baboon spiders as a species are under
threat as a result of habitat loss and collection for the pet trade. It is therefore recommended that the
precautionary principal be applied here, and consideration be given to rescue and relocation activities for
Ceratogyrus darlingi observed, as well as for any other individuals of this species within the project area.
The study area lies within the Soutpansberg IBA of which a large diversity of avifaunal species inhabits,
notably large raptors. Although no avifaunal SCC were observed at the time of the site assessment, the
neighbouring Nzhelele Nature Reserve has recorded several avifaunal SCC over the years, and as such these
species are presumed to also utilise and inhabit the neighbouring project area.
Overall the project area is considered to be of conservational value, as it provides suitable habitat for a
variety of faunal species, and the large trees and hill slopes provide suitable nesting sites for large raptors.
Furthermore, the abundance of prey species and intact nature of the vegetation enables medium to large

63 | P a g e
predators to utilise the project area effectively, helping to support predator populations outside of large
formally protected areas, and ensuring the genetic diversity of species overall is maintained.
Figure 39: Localities of species observed that are of an increased conservational concern
8.4.1.2.4 Surface Water
The Duel Coal Project is located in the Mutamba River basin, which is a tributary of the Nzhelele River. The
Nzhelele River, together with the Nwanedzi River, form the secondary catchment area A80, which has been
subdivided into nine quaternary sub-catchments (no tertiary sub-divisions were made). The Nzhelele River
has its confluence with the Limpopo River about 35 kilometres east of Musina. The Nzhelele Basin covers an
area of approximately 425 km2, which is 1% of the South African portion of the Limpopo Basin.
The Duel Coal Project area spans across the quaternary catchment A80F as defined in the WR2005 Study
(Middleton and Bailey, 2009) and shown Figure 40.

64 | P a g e
Figure 40: Quaternary catchments
An aquatic ecological assessment was undertaken at one point on the Mutamba River, just downstream of
The Duel Project area.
Based on the findings of the aquatic study the Mutamba River is seen to be a water stressed system,
characterized by seasonal flow variation compounded by water abstraction for agricultural purposes. The
desktop Ecological Importance and Sensitivity (EIS) and Present Ecological State (PES) assessment indicate a
PES classified as C, EI classified as “moderate”, ES as “high” and default EC as B. Indices employed, however,
yielded the following classifications:
Table 9: Summary of the aquatic assessment results for site TD1 assessed January 2015
IHAS IHIA
SASS5
MIRAI FRAI Dickens and Graham (2001)
Dallas (2007)
Adequate D E E/F D D
Definitions:- IHAS: Invertebrate Habitat Assessment System; IHIA: Intermediate Habitat Integrity Assessment; SASS5: South
Africa Scoring System 5; MIRAI: Macro-invertebrate Response Assessment Index; FRAI: Fish Response Assessment Index.

65 | P a g e
Upstream view of the TD1 site on the Mutamba River showing the inundated section upstream of the weir
Downstream view of the TD1 site showing the shallow laminar flow at the point
The current assessments indicate that conditions in the project area is deteriorated from what could be
expected based on the desktop assessment. The Mutamba River can thus be considered to be a system of
reduced EIS due to the limited provision of refugia and the limited support it provides to the aquatic
ecology of the area. The system is however deemed important in terms of the provision of services to the
terrestrial fauna of the area as well as fair significance from a socio-cultural point of view. It is deemed
essential that all effort is made to ensure that impacts on the Mutamba River as a result of the proposed
project are minimised.
Figure 41: Aquatic assessment monitoring point

66 | P a g e
8.4.1.2.5 Wetlands
Wetland habitat – land which is transitional between terrestrial and aquatic systems where the
The Mutamba River were defined as systems containing riparian habitat due to the presence of alluvial soil
as well as the presence of vegetation, with a composition and physical structure, distinct from adjacent
areas. Several smaller drainage lines within the study area also display these characteristics and were
therefore also defined as systems with riparian habitat. The catchment of some of the drainage lines are
however smaller and did not allow for the establishment of the defined riparian habitat characteristics and
were therefore considered non-riparian ephemeral drainage lines.
In summary, the rivers and smaller drainage lines were subdivided into riparian or non-riparian habitat. In
the sections that follow riparian habitat was assessed with use of the Vegetation Response Assessment
Index (VEGRAI), Wetland Function Assessment, Wetland EIS and Wetland IHIA.
The results obtained from the assessments indicate a relatively low level of transformation on all levels of
ecology. It is therefore recommended that the features be assigned the same REC as the PES Class
calculated. The EIS and REC values are presented in Table 10.
Table 10: Assigned REC Classes
Feature VEGRAI Ecostatus Wetland PES Classes EIS Class REC Class
Mutamba River B/C B/C B B
Smaller drainage lines B/C A/B B B
Figure 42: Locations of the wetland types in relation to the study area

67 | P a g e
Figure 43: Wetland PES map

68 | P a g e
8.4.1.2.6 Surface and Groundwater Use
There are no DWS registered dams in the Mutamba River catchment. Surface water is utilized for irrigation
from the lower reach of the Mutamba River. The water requirements of farmsteads, hunting and game
lodges, game and stock watering are mainly supplied from groundwater sources.
The closest irrigation occurs on the farms Skuitdrift and Mount Stuart, but these are outside the area of
consideration and obtain water from the Nzhelele irrigation scheme. Boreholes are used as backup in
drought when the surface water is not available.
The estimated existing groundwater abstraction for the above listed farms mainly from the secondary hard
rock aquifers is summarised in Table 11. Approximately 57 ML/annum is abstracted from groundwater
currently from the area making up the two-farm buffer zone around the MRA area.
Table 11: Estimated Groundwater use
Note: Groundwater use for the properties within a two-farm margin around the MRA area was considered. These include the
following: Telema, Gray, Nairobi, Kranspoort, Riet, Stayt, Nakab, Chase, Wildgoose, Phantom, van Deventer, Martha, Lukin, Salaita
and Kondoa.
Springs occur where the water table intersects the surface, usually along some structure. There are two
known springs at Pfumembe and a spring on Lukin. No springs occur on The Duel area.
The available water-level data indicated that some localized dewatering is evident at Makushu village
where low yielding boreholes are being dewatered. The areas of dewatering around these boreholes are of
limited extent. Apart from Makushu the water table is approximately in an undisturbed state.
House
hold and
Lodges
(m3/day)
Game and
stock
watering
(m3/day)
Cleared
Land
(Ha)
Irrigated
Land
(Ha)
Total
Estimated
groundwater
use ML
/annum Comments
Lukin
Salaita 9 3
The Duel(Remaining
Portion) 20 7
Nairobi 0 0
Wildgoose 577 MSPhantom 640 MS
Chase 576 MS
Van Deventer 641 MS
Stayt 183 MT
Nakab 184 MT
Riet 182 MT 3 3 - -
Kranspoort 0 0 - -
Mukushu 63 23
Phumembe 44 16
57
CoAL
A80F
Joshua nDambe
TOTAL 117 m3/day
Telema 190 MTA80CVi l lage water supply and private
boreholes
Water use for lodge, domestic and game
Maswiri Boerdery 2Water use for lodge, domestic and game.
Irrigation from Nzhelele scheme 830
- - 2 Water use for lodge, domestic and game
Cl int Howes 1 2 - - 1
Tony Zambakides 3 3 - - 2 Water use for domestic and game
Cattle watering
Quaternary Owner/Business Farms
Estimated Groundwater Use
Born Free Investments 3 3

69 | P a g e
Figure 44: Hydrocensus borehole and spring localities
The study area is characterized by poor groundwater quality typical of arid environments and of upper
Karoo strata with elevated salts. Groundwater sampling further indicates slightly elevated boron and
manganese with the higher molybdenum and lead due to the restriction of analysis.
Figure 45 shows total dissolved solids (TDS) distribution with contours on a geology background. The map
shows a relationship between the host strata and salt content with elevated TDS found in middle Karoo
strata and low TDS in Soutpansberg rocks.
Figure 45: TDS contour map

70 | P a g e
8.4.1.2.7 Ambient Air Quality
No baseline air quality data is available for the area; however, it is expected to fall within the relevant air
quality guidelines and standards for residential areas. Based on satellite imagery the following surrounding
sources of air pollution have been identified in the area:
• Domestic fuel burning
• Unpaved roads
• Agricultural
• Future mining activities (cumulative)
8.4.1.2.8 Ambient Noise
The existing noise climate of the study area was determined by means of a field inspection, survey
measurements and a continuous 24-hour measurement.
In general, the area was very quiet, and the only identifiable noise source was the gravel access roads. The
monitoring location (during the daytime), next to the road, was impacted by the traffic passing along the
gravel road. During the night, the noise level was very low and only bird calls were significant events,
especially just before sunset. During the night there were little to no noise.
The results of the long-term noise monitoring locations indicate that the area close to the gravel road is
more in line with a land use classification of Suburban districts with little road traffic, than the general Rural
classification. Away from the gravel road the land use classification fits within the ranges of the rural
classification (SANS 10103).
Based on the MRA locality the typical noise level rating (also referred to as the maximum allowable noise
level) for the area is classified Rural, unless specified otherwise at receiver. It should be noted once the
mine is in operation the land use zoning of the farm will be reclassified to Industrial within the boundaries
of the mine area.
8.4.1.3 Cultural and Heritage Resources
R&R Cultural Resources conducted a Phase 1 Heritage Impact Assessment (HIA) – refer to Appendix 3 for
the report. This report was submitted to SAHRA in 2015 in fulfillment of the requirements of the NHRA.
8.4.1.3.1 Literature Survey
In terms of Huffman’s (2007) distribution sequences of the Iron Age, the project area may contain the
remains of the under-mentioned culture historical groups:
Urewe Tradition, originating in the Great Lakes area of Central Africa, was a secondary dispersal centre for
eastern Bantu speakers. It represents the eastern stream of migration into South Africa.
• Kwale Branch:
o Mzonjanifacies (Broederstroom) AD 450 – 750 (Early Iron Age)
• Moloko (Sotho-Tswana) Branch (Late Iron Age)
o Icon facies AD 1300 – 1500: This pottery is associated with the first Sotho Tswana people
entering the country.

71 | P a g e
Kalundu Tradition, originating in the far North of Angola, was another secondary dispersal centre for
eastern Bantu speakers and represents the western stream of migration into South Africa.
• Benfica Sub-branch:
o Bambatafacies AD 150 – 650 (Early Iron Age)
• Happy Rest Sub-branch:
o Happy Rest facies AD 500 – 750 (Early Iron Age)
o Malapatifacies AD 750 – 1030 (Early Iron Age)
o Eilandfacies AD 1000 – 1300 (Middle Iron Age)
o Mapungubwefacies AD 1250 – 1300 (Middle Iron Age)
o Mutambafacies AD 1250 – 1450 (Middle Iron Age)
o Khamifacies AD 1430 – 1680 (Late Iron Age)
o Tavatshenafacies AD 1450 – 1600 (Later Iron Age)
o Letabafacies AD 1600 – 1840 (Later Iron Age)
The project area lies adjacent to the Makhado Colliery for which the heritage specialist had undertaken
heritage impact studies during the period 2008 - 2011. Numerous heritage sites and the presence of
heritage remains were recorded on the adjacent farms Windhoek 649 MS, Tanga 648 MS, Fripp 645 MS,
Lukin 643 MS and Salaita 188 MT. This varied from Stone Age, Iron Age and recent historical sites, including
pottery from the Mutambafacies AD 1250 – 1450 (Middle Iron Age), Tavatshenafacies AD 1450 – 1600
(Later Iron Age) and Letabafacies AD 1600 – 1840 (Later Iron Age).
In addition, a number of Venda related archaeological sites have been identified by Loubser (1991), while
doing research on Venda ethno-archaeology for his PhD during the mid-1980s. Loubser integrated oral
traditions, archaeology and ethnography to show that the Venda people originated locally and inhabited
the Zoutpansberg a century before the Singo conquest of the current ruling lineages. The archaeology
shows a local development of a Venda ceramic style (called Letaba) from the overlap between Shona and
Sotho styles and independently supports linguistic evidence that the Venda language is an amalgamation of
Shona and Sotho.
Loubser (1991) distinguishes five (5) settlement patterns in the Zoutpansberg area according to a
chronological order.
• The first and presumably the oldest is the central cattle pattern, where settlements have one or
several contiguous dung concentrations and the settlement is arranged around the dung
concentration.
• The second settlement pattern is the Zimbabwe pattern, characterized by regularly coursed-walls
arranged in tight semi-circles and irregular enclosures along the upper portion of the site. Dwelling
remains occur among the walls, but also extends well beyond the limits of the walls.
• Loubser also distinguishes the Dzata pattern, which is very similar to the Zimbabwe pattern, but are
characterised by short sections of walls that are semi-coursed and long sections of roughly stacked
walls. The semi-coursed walls occur either in isolation or as part of roughly stacked walls.
• The fourth is the Mutzheto pattern where settlements have stacked terraced walls (mutzheto).
The walls demarcate the main residential area and are arranged in interlinking terraced enclosures
along the upper portion of the settlement. Dwellings sometimes occur in a wide arc below the main
walled cluster. Mutzheto sites share features with both Zimbabwe and Dzata patterns.

72 | P a g e
• Lastly, from the 1830’s conquered chiefs were forced to abandon their Mutzheto settlements by
their victors and forced to settle on the open flats, the Dzanani pattern. This was also the case
after the Boers defeated the Ramabulana Singo in 1889. The subsequent re-settlement programme
under British rule from 1902 forced the Western Venda to settle on the plains. Thereafter western
Venda villages seldom included stone walling.
8.4.1.3.2 Survey Results
8.4.1.3.2.1 Stone Age remains
There is ample evidence for Stone Age remains in the affected area. Recordings 2 – 6 (refer to Figure 46)
represent some of these finds. Although Stone Age remains are scattered throughout most eroded areas,
no intact primary sites with high concentrations of material was found and no formal tools were observed.
The most prominent scattered material seems to be Middle Stone Age flakes. Isolated Earlier Stone Age
material is also present. No Later Stone Age material was noted. It is the contention of the HIA that no
further assessment is necessary. Significance: Low.
The terrain is not suitable for Rock Art as there are no large lose-standing boulders or rock overhangs which
facilitates rock art.
8.4.1.3.2.2 Iron Age
No Iron Age sites were recorded. A scattering of non-diagnostic potsherds was recorded at coordinates
S22º45’30.1” E30º02’06.9” (recording 1 in Figure 46) and surrounding area. This was probably the result of
agricultural activities in the past. Significance: Low
8.4.1.3.2.3 Intangible Heritage
No signs of ritual use or the presence of graves were noted in the project area. The area is used for the
collecting of natural resources such as wood, plants and clay by the Makhushu community. During the
ongoing social consultative process, local communities may come up with heritage issues concerning them
not yet addressed in the HIA.
8.4.1.3.2.4 The built environment
The built environment mainly consists of the Makushu village. The Duel Coal Project area contains no
original farmstead buildings. No threat exists for the built environment.
8.4.1.3.2.5 Palaeontology
Plant fossils have been observed in the project area. SAHRA has developed a Palaeontological Sensitivity
Map. The map is colour-coded with RED indicating a very high sensitivity. The project area falls within
SAHRA’s red category where the prescribed action is “…a field assessment and protocol for finds is
required”. A SAHRA recognized palaeontologist (Dr Barry Millsteed) conducted a desktop palaeontological
assessment of the project area, with the following results (refer to Appendix 3):
• The sediments of the Ecca Group (represented by the Madzaringwe and Mikambeni Formations in
the study area) are known to be fossiliferous and are known for containing an important
palaeontological heritage particularly in respect of plant macrofossils of the Glossopteris flora.
Fossils of this flora were identified within the Madzaringwe Formation of this region during the coal

73 | P a g e
exploration phase of the project. However, the occurrence of fossils within the geological record is
erratic in general and the chance of impacting upon most macrofossil types at any particular point
within the Ecca Group strata is moderate. It must be noted however, that where plant macrofossils
are present within a sequence (as they have been proven to be in the Madzaringwe Formation)
they are often in dense accumulations and the probability of a negative impact is accordingly
assessed as being moderate to probable.
• The rocks of the Tshidzi Formation have a low fossiliferous potential and underlie the coal-bearing
strata in most areas, and as such, are unlikely to be affected by most of the mining activities.
• The Fripp Formation usually consists of coarse-grained arenites and rudites and is generally
unfossiliferous. However, plant macrofossils belonging to the Dicroidium Flora have been identified
within the formation in the region. In general, the potential for any negative impact to the
palaeontological heritage contained within this unit is characterised as low.
• The Solitude and Clarens Formations are known to be fossiliferous and have historically yielded a
diverse fauna of dinosaurs, synapsid reptiles and mammals. These fossils tend not to be common,
but over such a large aerial extent as their outcrops within the project area, it is possible that fossil
materials will be present. The probability of any negative impacts occurring upon the fossil heritage
of these units is assessed as low. The rocks of these two formations will not be targeted for mining
and, thus, will only be potentially be affected by the construction of superficial infrastructure
elements.
• All the rock units constituting the Soutpansberg Group are unfossiliferous and, accordingly, the
potential for any negative impact on the palaeontological heritage is nil. The rocks of this
stratigraphic unit comprise most of the aerial extent of the project area and will not be targeted by
the mining activities. Therefore, the greater the amount of mine infrastructure elements that are
constructed on these bedrock areas, the lower the potential for the project to impact on the fossil
record will become.
8.4.1.3.2.6 Conclusions
Previously surveyed areas along the foothills of the Soutpansberg to the west of The Duel Coal Project have
yielded numerous heritage remains and archaeological sites. Notwithstanding this, the project area on The
Duel contains no definite archaeological sites, although scatterings of archaeological remains in the form of
Stone Age material and some potsherds were observed. The reason that no Iron Age sites were located
seems to be two-fold: firstly, the area is mostly mountainous and/or rocky and not suitable for past
settlement and secondly, the sandy soils where settlement may have been possible is highly eroded.
The palaeontological desk-top study concluded that there is a definite potential for a negative impact on
palaeontological heritage, with varying levels of significance.

74 | P a g e
Figure 46: Archaeological remains on The Duel Coal Project footprint

75 | P a g e
8.4.1.4 Socio-Economic Character
The project is located within the Makhado Local Municipal area, within the Vhembe District’s jurisdiction.
The project area falls within Ward 21 but is bordered by Ward 37 to the east and south. Ward 37 contains
the nearest settlements to the MRA area. Figure 47 indicates the boundaries of the Municipality and
relevant Wards.
Figure 47: Project in relation to the Makhado Local Municipal area and Ward 21 and 37

76 | P a g e
8.4.1.4.1 Towns and Settlements
8.4.1.4.1.1 Urban Settlements
The nearest formal urban settlement is the Louis Trichardt and Thohoyandou towns.
Table 12: Towns in the region and their distance from the planned project
TOWN DIRECTION DIRECT DISTANCE
Mopane North-West 21 km
Tshipise North-East 20 km
Louis Trichardt South-west 35 km
Musina North 40 km
Thohoyandou South-east 49 km
8.4.1.4.1.2 Rural Settlements
There are rural settlements in the surrounding environment of the MRA area.
Table 13: Settlementsand their distance from the planned project
SETTLEMENT DIRECTION DISTANCE
Makushu South-east 50 m
Mosholombe South-east 950 m
Pfumembe South-East 3 km
Musekwa (Ngundu) South-east 6 km
Maranikhwe East 8 km
Mudimeli/Fripp West 8.5 km
Maangaani South 9 km
The closest communities are the Makushu and Mosholombe communities. Refer to Figure 48 that indicates
their locations in relation to the proposed project.

77 | P a g e
Figure 48: Settlements neighbouring and surrounding the MRA area
8.4.1.4.2 Surface Ownership
8.4.1.4.2.1 Mining Right Area
The Remaining Extent of the farm The Duel 186 MT is a privately-owned farm used for game ranching. The
areal extent of the property 888.5039 ha and the current surface owner is the Clint Howes Family Trust.
Table 14: Surface ownership
Farm Name Farm no. Reg Div Portion Title deed nr Extent (ha) Surface owner
The Duel 186 MT RE T101476/1998 888.5039 Clint Howes Family Trust
The property is under Land Claim by the Nemamilwe Trust under Government Gazette 29397 published on
24 November 2006. The Research Report was completed, and the land claim accepted on 1 October 2010.
The land claim validation was completed and approved on 30 March 2016.

78 | P a g e
8.4.1.4.2.2 Neighbouring Properties
The following properties neighbour The Duel Project:
Table 15: Neighbouring Properties
PROPERTY NAME DIRECTION LANDOWNER LAND USE
The Duel 186 MT Portion 1 North-east Josias Nndwambi Livestock grazing
Gray 189 MT East Republic of South Africa
T337/1950VN
Communal Grazing
Nature Reserve
Telema 190 MT South-east Republic of South Africa
T337/1950VN
Communal Grazing
Rural Settlement
Kondoa 191 MT South Republic of South Africa
T337/1950VN Communal Grazing
Salaita 188 MT South-west Akkerland Boerderye
T79230/1998 Game farming and hunting
Martha 185 MT Portion 1 West Fumaria Holdings Game grazing
Martha 185 MT RE North-west Fumaria Holdings Game grazing
Nakab 184 MT North Clint Howes Family Trust Game farming & Private hunting
Figure 49: Neighbouring properties

79 | P a g e
Figure 50: Neighbouring Landowners
8.4.1.5 Neighbouring Traditional Leadership and Communities
8.4.1.5.1 Makushu Traditional Leadership and Community
The Makushu village is under the jurisdiction of the Mphephu Traditional Authority with a local Traditional
Leader. The village was established in 1980 and has been settled here for the last 30 years. The people of
Makushu originally come from the Musina area. There are currently approximately 250 households and a
population of 1,750 people.
8.4.1.5.2 Mosholombe Traditional Leadership and Community
The Mosholombe village is under the jurisdiction of the Mphephu Traditional Authority with a local
Traditional Leader. The village was established in 1980 and has been settled here for the last 30 years. The
people of Mosholombe originally come from the Pontdrift area. There are currently approximately 185
households and a population of 1,295 people.
8.4.1.5.3 NepfumembeTraditional Leadership and Community
The Pfumembe village is under the jurisdiction of the Mphephu Traditional Authority with a local
Traditional Leader. There are currently approximately 220 households and a population of 1,540 people.

80 | P a g e
8.4.2 DESCRIPTION OF CURRENT LAND USE
For some years now a certain land use pattern has developed in the project area, the area has changed
from a predominantly beef producing (cattle farming) area in the past to game farming with the related
activities.
Land use within The Duel and surrounding area is predominantly hunting and game farming. Game farms
within this area offer activities such as trophy and biltong hunting. Natural grazing within this area is used
for game ranching. Irrigation farming is concentrated in the northern part of the area along the banks of
the Nzhelele and Mutamba Rivers.
The three village communities of Makushu, Mosholombe and Pfumembe on the farm Telema 190 MT are
located within a 5 km radius of The Duel Coal Project. The village of Makushu borders the proposed mining
area and will be directly affected by the mining activities.
8.4.2.1 Game Farming
The land use in the area is predominantly game ranching. Some of the game farms accommodate game
lodges. Beef farming has over time been overtaken by game as the major land use activity and is presently
less than 10%. Game farming supports the value-added components of eco-tourism and also stimulates
the hunting industry.
8.4.2.2 Irrigation
Irrigation agriculture (mainly citrus) is practiced along the banks of the Nzhelele and Mutamba Rivers. The
farms Schuitdrift 179 MT and Mount Stuart 153 MT have intensive irrigated agricultural activities focused
along the river. On the Mount Stuart farms vegetables are also cultivated. Most of the irrigation water is
supplied by means of water canals from the Nzhelele Dam. The irrigation agricultural area is utilised for
predominantly export citrus production. Several packing houses for citrus are present in the Mount Stuart
Section area.
8.4.2.3 Communities
Traditional communities with traditional structures in place and some cattle, goats and chicken farming
activities are practiced. Because of the very low rainfall and a shortage of water very little garden and crop
production takes place. The unemployment rate in the Makhado Ward 37 which includes the Makushu and
Mosholombe villages is rather high.
8.4.2.4 Water
Water within the surrounding area of The Duel is scarce due to the dry climate. Water scarcity impacts
greatly on agriculture and therefore the type of land use. On farms where cultivation of crops occurs,
farmers rely on water from the Nzhelele Government Water Scheme and the abstraction of groundwater.
Groundwater for crop cultivation is mainly used for a back-up in emergency situations. A dominant form of
land use within the area is game farming where farmers rely on groundwater for their animals. Farms
situated near the confluence of the Nzhelele and Mutamba Rivers utilise this surface water supply for

81 | P a g e
irrigation of their crops. Greater evidence of cultivated land is therefore present around the Nzhelele and
Mutamba Rivers than on other portions of the study area.
8.4.2.5 Monetary value of Current Activities
Table 16 shows the total estimated annual value of the current activities in the project area in 2015-terms.
The figure shows that irrigation represents 42% of the monetary value of the current activities in the total
impacted area, hunting 23%, the hunting services 15%, accommodation 14% and game sales 6%.
The annual total value of the current activities is estimated at R62.71 million, with irrigation contributing
around R26.28 million (42%), and game farming the second largest contributor at R18.27 million (29%).
Table 16: Annual Turn Over of the Activities in the Project Area (2015 prices)
Farming Activity Annual Income (Rand mil.)
Area 1 Area 2 Area 3 Total
Game Farming – Animals (Turn Over) R 1.03 R 3.19 R 14.04 R 18.27
- Game Sales R 0.38 R 0.66 R 2.83 R 3.87
- Trophy Hunting R 0.33 R 1.34 R 6.62 R 8.29
- Biltong Hunting R 0.33 R 1.19 R 4.58 R 6.10
Hunting
- Professional Hunting Services (including game catching)
R 0.15 R 1.10 R 0.93 R 2.19
- Taxidermy R 0.46 R 1.53 R 5.34 R 7.34
- Accommodation R 0.00 R 4.63 R 4.00 R 8.63
Total R 0.62 R 7.27 R 10.27 R 18.16
Eco-Tourism R 0.00 R 0.00 R 0.00 R 0.00
Irrigation R 0.00 R 0.00 R 26.28 R 26.28
Grand Total R 1.65 R 10.46 R 50.59 R 62.71
Note: Area 1: The Duel Project area; Area 2 : 5 km radius; Area 3: 10 km radius.
Figure 51: Monetary Value of Current Activities (2015-terms)
Game Sales6%
Hunting23%
Hunting Services15%
Accommodation14%
Irrigation42%
Game Sales Hunting Hunting Services Accommodation Irrigation

82 | P a g e
8.4.2.6 Macro-Economic Analysis of Current Activities
8.4.2.6.1 Area 1 - The Duel
Table 17 presents the current economic and socio-economic parameters for The Duel in 2015-terms.
Table 17: Current Economic and Socio-Economic Parameters for The Duel (2015)
Farming Activity
Gross Domestic Product Employment Payments to Households
Direct R mil.
Indirect/ Induced
R mil.
Total R mil.
Direct Number
Indirect/ Induced Number
Total Number
Total R mil.
High/ Medium
R mil.
Low R mil.
Irrigation - - - - - - - - -
Game Farming 0.44 0.75 1.19 2 7 9 0.52 0.34 0.18
Hunting 0.37 0.36 0.73 - 1 1 0.34 0.23 0.11
Taxidermy, Gamecatching, etc.
0.26 0.26 0.52 1 1 2 0.16 0.12 0.04
Accommodation - - - - - - - - -
Total 1.06 1.37 2.43 3 9 12 1.03 0.69 0.33
The total GDP generated is estimated at a total of R2.43 million per annum and the direct at R1.06 per
annum. Only three direct employment opportunities are sustained by the farming activities on The Duel,
with a total of 12 if the indirect and induced is added. The total payments to households are R1.03 million
with R0.33 million, 32% to the low-income households.
8.4.2.6.2 Area 2 - 5 km Radius
Table 18 presents the current economic and socio-economic parameters for the area included in Area 2
(the 5 km radius area).
Table 18: Current Economic and Socio-Economic Parameters for Area 2 (2015)
Farming Activity
Gross Domestic Product Employment Payments to Households
Direct R mil.
Indirect/ Induced
R mil.
Total R mil.
Direct Number
Indirect/ Induced Number
Total Number
Total R mil.
High/ Medium
R mil.
Low R mil.
Irrigation - - - - - - - - -
Game Farming 0.79 1.15 1.94 7 9 16 1.29 1.29 -
Hunting 1.80 1.76 3.55 10 7 17 1.67 1.13 0.54
Taxidermy, Gamecatching, etc.
1.45 1.47 2.92 8 5 13 0.92 0.69 0.24
Accommodation 2.10 2.45 4.56 14 10 24 2.38 1.61 0.77
Total 6.15 6.82 12.97 38 31 69 6.26 4.71 1.55
The total GDP generated is estimated at a total of R12.97 million per annum and the direct at R6.15 per
annum. Only 38 direct employment opportunities are sustained by the farming activities, with a total of 69
if the indirect and induced is added. The total payments to households are R6.26 million with R1.55 million,
24.7% to the low-income households.

83 | P a g e
8.4.2.6.3 Area 3 – 10 km Radius
Table 19 presents the current economic and socio-economic parameters of the area included in Area 3 (the
10 km radius area).
Table 19: Current Economic and Socio-Economic Parameters for Area 3 (2015)
Farming Activity
Gross Domestic Product Employment Payments to Households
Direct R mil.
Indirect/ Induced
R mil.
Total R mil.
Direct Number
Indirect/ Induced Number
Total Number
Total R mil.
High/ Medium
R mil.
Low R mil.
Irrigation 15.18 12.80 27.97 266 61 327 13.03 10.96 2.07
Game Farming 13.62 3.65 17.28 23 19 42 2.45 1.93 0.52
Hunting 6.30 6.16 12.46 27 26 53 5.84 3.96 1.89
Taxidermy, Gamecatching, etc. 3.46 3.49 6.95 21 13 34 2.20 1.63 0.57
Accommodation 1.81 2.12 3.93 10 9 19 1.28 0.95 0.32
Total 40.38 28.21 68.59 346 128 474 24.80 19.44 5.37
The total GDP generated is estimated at a total of R68.59 million per annum and the direct at R40.38 per
annum. The two largest contributors to the direct GDP are irrigation with R15.18 million and game farming
R13.62 million. The contribution of irrigation to direct employment opportunitiesare 266 out of 346
sustained by the farming activities, with a total of 474 if the indirect and induced is added. The total
payments to households are R24.80 million with R5.37 million, 21.6% to the low-income households.
8.4.2.6.4 Total All Areas
The following table presents the total parameters for all three the areas.
Table 20: Current Economic and Socio-Economic Parameters all areas (2015)
Farming Activity
Gross Domestic Product Employment Payments to Households
Direct R mil.
Indirect/ Induced
R mil.
Total R mil.
Direct Number
Indirect/ Induced Number
Total Number
Total R mil.
High/ Medium
R mil.
Low R mil.
Irrigation 15.18 12.80 27.97 266 61 327 13.03 10.96 2.07
Game Farming 14.85 5.55 20.41 32 35 67 4.27 3.57 0.70
Hunting 8.46 8.27 16.74 36 34 70 7.85 5.32 2.53
Taxidermy, Gamecatching, etc.
5.18 5.21 10.39 31 19 50 3.29 2.44 0.85
Accommodation 3.92 4.57 8.49 23 19 42 3.66 2.56 1.09
Total 47.59 36.40 83.99 388 168 556 32.09 24.84 7.25
The total GDP generated is estimated at a total of R83.99 million per annum and the direct at R47.59 per
annum. The two largest contributors to the direct GDP are irrigation with a R15.18 million contribution,
followed by game farming with R14.85 million.

84 | P a g e
Figure 52: Employment per Current Activity
Irrigation represents 59% of the total employment, hunting 13%, game farming 12%, taxidermy and game
catching 9% and accommodation 7%.
The contribution of irrigation to direct employment opportunities are 266 out of 388 sustained by the
farming activities, with a total of 556 if the indirect and induced is added.
The total payments to households are R32.09 million with R7.25 million, 22.6% to the low-income
households.
8.4.3 DESCRIPTION OF SPECIFIC ENVIRONMENTAL FEATURES AND INFRASTRUCTURE ON THE SITE
All relevant environmental features are described in Section 8.4.1 above.
There are no original farmstead buildings on the project area. The nearest built environment consists of
the Makushu village to the south-east. The village is in very close proximity of the planned open pit and
several households fall within 500m of the open pit. The main issues of concern include blasting, noise and
dust impacts on these households. It is envisaged that a number of these households will need to be
relocated, depending on the zone of impact that will be determined during the EIA Phase.
The D3672 district road, linking the D745 with the D3671, runs through the mining area and will be mined
through. This road would need to be diverted, as indicated in Figure 59.
Irrigation59%
Game Farming12%
Hunting13%
Taxidermy, Gamecatching
.9%
Accomodation7%
TOTAL EMPLOYMENT

85 | P a g e
8.4.4 ENVIRONMENTAL AND CURRENT LAND USE MAP
The current land uses identified within a 2 km radius around the MRA area include:
• Community housing – Makushu and Mosholombe
• Subsistence arable (rain fed) land
• Grazing for livestock and game
• Nzhelele Nature Reserve
The current land uses in the regional environment (further than 2 km from the MRA area) include:
• Commercial Arable / Irrigated land (closest 4 km)
• Hunting Camps and Facilities (closest 3 km)
• Grazing for livestock and game
• Community housing (further than 2 km)
• Nzhelele Dam
Other environmental sensitive receptors within the area would be the local fauna and flora, surface water
resources and archaeological remains – refer to sensitivity maps shown in Figure 38, Figure 43 and Figure
46 for these aspects respectively.
Figure 53: Sensitive Receptors

86 | P a g e
8.5 DESCRIPTION OF POTENTIAL IMPACTS
The Scoping Phase assesses the potential impact that the construction, operational and decommissioning
phases of the proposed project could have on the surrounding environment. These are discussed below
and summarised in Table 22 together with its perceived significance and potential mitigation measures.
8.5.1 SOILS, LAND USE AND LAND CAPABILITY
Figure 55 relates the area to be impacted to the soil forms encountered on the surveyed area. The
proposed mining activities will severely impact medium potential arable soils that comprise deep soils of
the Augrabies and Hutton soil forms. A zone comprising riparian and temporary wet soils will be covered
by a discard dump. The envisaged opencast and underground mining activities will mainly impact shallow,
rocky soils of wilderness and grazing land capability. Table 21 summarises the impact.
The nature of the impact ofopencast mining on the soil environmentinclude the stripping and stockpiling of
topsoil (consisting of A and B soil horizons) and the compaction of soils during the construction of facilities
such as discard dumps, overburden stockpiles, pollution and run-off control dams and any other possible
footprint structures. Heavy machinery traffic on the soil surface and possible chemical pollution of soil
through polluted water or certain geological materials could constitute further impacts on soil.
Stripping and stockpiling of topsoil will result in:
• Loss of the original spatial distribution of natural soil forms and horizon sequences which cannot be
reconstructed similarly during rehabilitation.
• Loss of natural topography and drainage pattern.
• Loss of original soil depth and soil volume.
• Loss of original fertility and organic carbon content.
• Soil compaction from heavy machinery traffic during earthworks and rehabilitation will adversely
affect effective soil depth, structure and density, thus influencing the pedohydrology of the area
• Exposure of soils to weathering, compaction, erosion, and chemical alteration of nutrients,
particularly nitrogen.
• Exposure of the soils to acidic, neutral or alkaline mine drainage that may be high in sulphates and
heavy metals
Underground (longwall) mining would most probably result in subsidence due to goafing. A cross section
diagram in Figure 54 illustrates the mechanism of goaf and the impact on the overlying strata.
Sag subsidence is a gradual settling of the soil service and may also happen in open pit areas that have been
rehabilitated. These areas can hold water if the post mining or post subsidence topography lends itself
thereto. Water will seep into these areas if the subsidence intersects the water table or if surface runoff is
high. Very little can be done to combat subsidence in the mining environment. It is therefore evident that
both underground and open pit mining could severely impact the hydropedological functioning of the area.
Heavy machinery traffic on the soil surface during and after mining can lead to compaction and this could
adversely affect the land capability of the area. Fine sand and silt are more prone to compaction. The lower
lying soils of the area exhibit a loamy clay and silty clay texture while the soils of the Arcadia soil form are

87 | P a g e
high in clay content. Compaction and hardsetting of the soils are definite concerns. Compaction and hard
setting hampers root growth and root development surface runoff increases, but the area already exhibit
high surface runoff rates.
Figure 54: Mechanism of goaf and impact on overlying strata
Table 21: Soil that will be impacted by the envisaged mining activities
Soil Form Land Capability Area Impacted
Soil-Rock Complex Wilderness 206.592194
Mispah/Rocky Hutton Wilderness/ Grazing 22.292142
Mispah/Rocky Augrabies Grazing 58.392436
Rocky Brandvlei Grazing 3.824235
Augrabies Low to moderate arable 141.81012
Mispah Grazing 17.907239
Rocky Hutton Grazing 15.021693
Rocky Hutton/Augrabies Grazing 22.384629
Alluvial deposits - Oakleaf-Hutton-Augrabies Complex
Riparean/ temporary wet zone 9.670087
Hutton Low to moderate arable 56.900292
Total 554.795067

88 | P a g e
Figure 55: Map indicating the soil forms and areas that will be impacted by the envisaged mining activities

89 | P a g e
8.5.2 BIODIVERSITY
Several potential risks to the receiving environment by the proposed mining operation have been identified
and are presented in the sections below.
8.5.2.1 Flora
• Mining activities, especially the placement of infrastructure such as the open pit, discard dump and
plant, are likely to have a significant impact on sensitive habitat present in the study area, along
with communities of floral SCC which have been identified during the site assessment;
• Encroachment of infrastructure or construction or operational waste materials into sensitive
habitat units could occur and would affect the habitat integrity of these areas;
• Seepage from facilities such as residue dumps and pollution control facilities, general dirty water
areas as well as spillages of hydrocarbons, has the potential to contaminate the groundwater
environment which in turn can affect water quality in surface water sources in the area;
• Indiscriminate fires by construction personnel may lead to uncontrolled fires, impacting on floral
communities of the property;
• Ineffective monitoring of the burning regime could lead to either destruction of existing plant
communities or in the case of decreased burning frequency, dead organic matter build-up,
preventing establishment of healthy plant communities. This will lead to a decrease in the
availability of fodder for herbivores and may also pose a physical threat to the safety of fauna on
the property;
• Vehicles may impact upon sensitive habitat areas during construction, operation and rehabilitation,
resulting in a loss of habitat;
• Mining related activities may lead to destruction of habitat and overall loss of biodiversity through
expansion activities, road construction, waste facilities etc.;
• Dust generated by ineffective rehabilitation of exposed areas may impact on the floral
characteristics of the property;
• Construction and introduction of foreign material e.g. soils may lead to the further introduction of
alien invader species, impacting on the floral characteristics of the study area;
• Ineffective removal of alien invader species and exposed areas could lead to re-establishment of
invasive species, impacting on floral community rehabilitation efforts;
• Large scale mining activities such as open pit areas may lead to the loss of SCC floral taxa which rely
on specific areas in the landscape for survival; and
• Ineffective rehabilitation and monitoring of disturbed areas could lead to loss of species diversity.

90 | P a g e
8.5.2.2 Fauna
• The habitat found within the study area is an important component for the continued existence of
the faunal species within the study area. The loss of this habitat will result in a cascading effect
within the faunal food chain, resulting in a loss of faunal diversity and abundance within the study
area, and surrounding areas;
• Mining infrastructure and the dumping of construction and operational waste materials in the
surrounding habitat will push faunal species out of their current home ranges, resulting in an
increased competition for space and resources in the areas surrounding the study area, with the
inevitable resulting in a decrease of species abundance;
• Earthworks may lead to increased runoff and erosion resulting in a loss of faunal habitat;
• The proposed open pit mining operations and waste dump facilities will result in a significant loss of
faunal habitat for a wide range of species;
• Noise impacts from the blasting and mining operations are likely to result in an unnatural dispersal
pattern being seen amongst faunal species;
• Mining and associated activities may impact on the breeding cycles and rates of faunal species in
the study and surrounding areas, resulting in a long-term faunal diversity decrease;
• Poaching and trapping due to increased human activity in the area may lead to increased impacts
on the faunal resources of the area;
• Large scale mining activities in certain areas such as open pit areas may lead to the loss of Red Data
Listed (RDL) faunal taxa which rely on specific areas in the landscape for survival;
• Ineffective rehabilitation and monitoring of disturbed areas could lead to loss of species diversity;
and
• Vehicles may impact upon sensitive riparian areas during rehabilitation, resulting in a loss of
habitat.
8.5.2.3 Aquatic Systems
• The importance of a water resource, in ecological social or economic terms, acts as a modifying or
motivating determinant in the selection of the management class. Should the function of
surrounding wetland features not be managed or mitigated during the construction, operational
decommissioning phase of the mine, the ecoservices provision of the wetlands will be lost or
changed and the PES of the system will be lowered. This is particularly significant in terms of the
Mutamba River due the downstream importance of this system as well as the larger catchment it
forms part of;
• Encroachment of infrastructure or construction or operational waste materials into wetland areas
could occur and would affect the habitat integrity of these areas;
• Earthworks in the vicinity of wetland areas may lead to increased runoff and erosion and altered
runoff patterns as well as sedimentation of the local drainage systems;
• The proposed open pit mining operations as well as general surface earthworks have the potential
to impact on surface water volumes and habitat for riparian and instream fauna and flora;
• Coal mining is generally known for the generation of acidic and salt rich runoff and seepage. The
aquatic resources of the local area are naturally prone to high salt content and there is a risk that
the mining operations will lead to increased salinization of the systems as well as reducing pH

91 | P a g e
which could affect the aquatic ecology of the local drainage systems and in particular the Mutamba
River;
• In addition, disturbance of the area has the potential to lead to increased turbidity levels in the
area and possibly lead to increased concentrations of metal salts and other salts such as sulphates
which can be detrimental to the wetland and aquatic ecology of the region;
• Ineffective rehabilitation of wetland and riparian areas could cause siltation and changes in the
hydrological functioning of these areas;
• Ineffective rehabilitation and monitoring of disturbed areas could lead to loss of species diversity;
and
• Vehicles may impact upon sensitive riparian areas during rehabilitation, resulting in a loss of
habitat.
8.5.3 SURFACE WATER
The surface water impacts of the Project can be divided into two main groups, namely:
• Impacts on surface water quantity
• Impacts on surface water quality
It must be kept in mind that water quality is naturally linked to water quantity due to the fact that changes
in water quantity are likely to affect the dilution of pollutants. Please note that reference made to the
major rivers include the Mutamba and Nzhelele Rivers.
8.5.3.1 Impacts on Quantity
8.5.3.1.1 Impact on mean annual run-off to major rivers
Mean annual run-off (MAR) from the Project site into the major rivers is anticipated to be primarily affected
by the following:
• Direct rainfall in the open pits. Rain falling directly into the pits will collect in a sump at the bottom
of the pit/s and thus be polluted. This water may be recycled for use, or evaporated in dirty water
dams, thereby decreasing the MAR.
• Run-off from stockpiles. Rain falling directly onto the ‘dirty’ stockpiles will either seep into the
stockpile or run-off the sides of the stockpile. Any run-off or horizontal seepage from the stockpile
will be captured in control dams or a leaching system for water quality control reasons, and thus
subsequently be prevented to discharge to tributaries and into the major rivers.
• Concentration of flow when run-off is intercepted by canals. The canal system will intercept run-off
that would otherwise have flowed naturally over the ground surface until reaching a defined
watercourse. Vegetation and surface topography, particularly in flatter areas, would in the natural
state have encouraged interception and infiltration.
• Once water has been intercepted by a canal however, no further interception or infiltration is likely
until the canal discharges the flow into a watercourse. Even once discharged back into a
watercourse, the concentration of flow would still discourage interception and infiltration. There is
thus likely to be a marginal increase in MAR resulting from the construction of the canal system.

92 | P a g e
8.5.3.1.2 Change to peak flow rates in the major rivers during flood conditions
A substantial increase to the peak flow of flood events in the rivers could cause erosion and change in
channel character and dimensions, destroy riverine vegetation, alter bed roughness and cause eroded
sediment to be deposited downstream.
It is expected that Project activities will cause a change to peak flows in the receiving rivers downstream of
the Project site, due to the following factors:
• Change in surface coverage. Development of the Project area will change the surface coverage in
some areas from vegetated soil to buildings, hardened gravel roads, paved areas (parking), and
compacted earth. These new surface types will allow somewhat less infiltration into the soil,
resulting in more surface run-off following storms and consequently higher local peak flow rates.
• Capture of run-off. Capture of rainfall in the ‘dirty’ area would lower peak flow rates.
• Canalisation of run-off. Intercepting run-off from the hill-slopes above the opencast pits and
canalising the flow could reduce the amount of time that water would take to reach the major
rivers. This is due to the decreased friction on the water associated with concentrated flow in a
concrete-lined canal as opposed to sheet flow on the hill slopes, and the consequently lower flow
velocities. In technical terms, the time of concentration would be reduced, reducing the time of
concentration results in higher peak flow rates. This effect is dependent on the design of the
canalisation system, as increasing the length of flow paths, and implementing other detention
measures, could negate this effect.
8.5.3.1.3 Drying up of tributaries and establishment of new watercourse due to canalisation
A cut-off canal system is required to separate unpolluted (‘clean’) and polluted (‘dirty’) water, which is a
positive intervention. However, intercepting the tributaries that flow from the water divide across the
mining areas, and redirecting them via canals around the pits, will starve those same water courses of
water along their reach between the point of interception and the major rivers.
Furthermore, if the canals only extend as far as to route water around the outer edge of the opencast pits,
then concentrated volumes of water will be discharged at point locations on the hill slopes. Also, the soils
most susceptible for erosion are those where sandy topsoil overlies more clayey, usually structured subsoil.
When considered together, this information suggests that the soils on the hill slopes are particularly prone
to erosion. Hence rather than dispersing out over the surface, the concentrated flow at the canal discharge
points would erode gulleys into the soil and carry silt into the major rivers, impacting on water quality.
8.5.3.2 Impacts on quality
The philosophy supporting the following section of the report is that if all constituents in the cumulative
discharge from the Project site are within the applicable target water quality ranges, then the Project
activities will not contribute significantly to an unacceptable cumulative impact.
The converse of this statement is not necessarily true, as different activities within the catchment may
discharge different pollutants at different concentrations, and the dilution effect may mean that a
constituent that is out of the target water quality range in the cumulative discharge from the Project site is
within the target water quality range when the discharge is combined with the major rivers flow itself.

93 | P a g e
However, the Precautionary Principle requires that a conservative approach be taken, in this case to
account for possible discharge of pollutants by future activities in the river catchment, and therefore the
dilution effect of the major rivers cannot be relied upon.
8.5.3.2.1 Increased sediment load in the major rivers
In the natural state of the project site, vegetation cover causes friction to rainfall run-off, that reduces flow
velocities and consequently shear forces between the water and the ground surface, resulting in the
ground surface remaining intact and not being eroded away. If for any reason flow velocities are increased,
there is potential for increased erosion to occur.
Increased erosion means that the run-off contains a higher silt or sediment load, which is discharged to the
major rivers. A component of this sediment load is particles fine enough to remain in suspension, ‘clouding’
or ‘muddying’ the water.
The extent of this effect can be quantified by measuring a water quality parameter, viz. suspended solids. If
there are too many suspended solids in the water this can negatively affect biological life.
In addition, a changed sediment load could have similar morphological effects to the river as changing peak
flow rates, such as changes in channel character or dimensions and changes to bed roughness. All these
changes could potentially affect biological life.
The following activities are likely to cause an increase in flow velocities, or directly increase erosion:
• Stripping (vegetation clearance) of mining areas prior to excavation of pits;
• Construction of hard-standing areas that increase run-off volumes, including roads, buildings and
paved areas;
• Canalisation of run-off, particularly if canals do not discharge directly into the major rivers; and
• Construction activities that loosen the ground surface.
Furthermore, if run-off from the stockpiles is uncontrolled, such run-off would likely contain a high
sediment load due to the fine particles in the waste product resulting from the ore crushing process.
Numerous streams/drainage lines are disturbed by the proposed mining activities. The runoff volumes and
water quality of re-routed streams would not be materially affected, provided that scour of bed material is
prevented so as to minimise turbidity during flood conditions. Lining of the canals and/or energy dissipating
structures may be required at steep slopes.
It can thus be stated that without any mitigation measures, the sediment load in the major rivers will
increase as a result of mining activities associated with this Project.
8.5.3.2.2 Impaired water quality due to pollutants discharged or dirty water runoff
• Wastewater from the coal ore beneficiation process would contain pollutants in excess of the
target water quality ranges for the water uses of the receiving water body and discharge of this
would impact negatively on the surface water quality. A further consideration is the run-off of
pollutants from the process plant area following rainfall, due to the activities within that area.

94 | P a g e
• IIt is likely that run-off from the stockpiles will have a different chemical composition to natural
run- off. In this event it is best practice to keep ‘dirty’ water from stockpile run-off separate from
‘clean’ water from natural run-off.
• Overflow of water (decant), whether surface or ground, from the pits could release pollutants to
the surface water environment if geochemical testing indicates a possible acid mine drainage or
other water quality issue.
• Fuel or oil spills from vehicles could contaminate surface water resources. Leakages, spills or run-
off from vehicle wash bays, workshop facilities, fuel depots or storage facilities of potentially
polluting substances could contaminate surface water resources.
Unless proper measures are taken, polluted runoff will affect the streams and the major tributaries. The
following areas are considered to be polluted:
• Areas of carbonaceous materials mining and haulage including pits, haul roads, tips and loading
areas.
• Areas of carbonaceous materials storage such as coal stockpiles, carbonaceous materials stockpiles
and dumps, including discards and other carbonaceous spoils from the pit excavations.
• Plant areas.
• Areas of potential hydrocarbon pollution, such as fuelling areas, workshops and fuel or lubricant
storage areas.
Dirty water collection drains should be concrete lined to ensure minimal seepage into soils and aquifers.
Water from these drains is then led via silt traps into pollution control dams from where it is re-cycled for
re-use in the plant. The impact will be limited to a reduction in runoff, as discussed above.
The fuelling areas, workshops and fuel or lubricant storage areas should be concrete lined and bunded to
collect any hydro carbon spillage to re-cycle containers.
8.5.4 GROUNDWATER
Mining can impact on groundwater by the cone of dewatering that forms from removal of inflows into the
pit and underground mining area as it is deepened and by contamination of groundwater due to mining
activities
8.5.4.1 Groundwater Inflows
Groundwater in the study area is confined to the weathered rocks and structural breaks in the crust.
Outside and away from these systems and structures very little abstractable groundwater can be expected.
The mining method will be mainly open cast. The aquifer material will eventually be removed during the
mining process. Inflows will therefore occur from the floor and sidewalls of the pit and underground
workings. Other structures which may cause groundwater inflows are fault systems which transect the
planned mining area and possibly a few dykes. The low groundwater potential and the low recharge of the
area would suggest that inflows into the pit area will be low. Inflows will increase with depth until aquifer
penetration has occurred followed by a tapering-off of inflow as the storage within the higher
transmissivity zones are depleted.

95 | P a g e
8.5.4.2 Groundwater Contamination
Groundwater contamination due to mining occurs when the rock is broken up either by blasting or
excavation to expose a greater surface area of mineralized rock to water. The soluble elements in the rock
enter into the groundwater system. Coal deposits are usually accompanied by the presence of sulphide
minerals, most commonly pyrite (FeS2). Sulphides decompose when exposed to oxygen and water to form
sulphuric acid. The acidified water has an enhanced capacity to dissolve other elements in the rock.
Acidified water is undesirable in nature because aquatic life is sensitive to pH as well as possible toxic
elements in solution. This process is commonly known as acid mine drainage (AMD) or acid rock drainage
(ARD). Sources of pollution from coal mining include the following:
• Overburden and waste dumps
• Tailings and slimes dumps
• Return water dams, effluent and evaporation ponds
• Open pits
Preliminary investigations suggest that the groundwater in the region is saturated in calcium carbonate and
there are significant bodies of calcium carbonate in the solid phase. These would effectively neutralise Acid
Mine Drainage (AMD) and immobilise the metals leached from the discard minerals by AMD. The effluent
plume is saturated in gypsum, meaning a very high TDS and EC. The result will be Neutral Mine Drainage
(NMD). The extent of the formation of NMD will vary as a function of oxygen concentrations of water
coming into contact with the discards and the flow rates.
NMD is very difficult to treat. The formation of NMD should be minimised. Efforts to avoid NMD include:
• Careful blending of the sulphide minerals with acid-neutralising materials during mining and in
preparation for closure.
• Lining of the waste disposal sites, short-term and long-term. Capping to exclude oxygen attack of
the susceptible minerals in the discard materials.
8.5.5 AIR QUALITY
8.5.5.1 Construction Impacts
Construction is a source of dust emission which has a temporary impact on the local air quality.
Infrastructure and road construction are the two types of construction activity with high emission
potentials. The emissions associated during the construction of a building or road can be associated with
land clearing, drilling and blasting, ground excavation and depending on the level of activity, the specific
operation and the prevailing meteorological conditions. It has been noted that large quantities of the
emissions is generated due to the traffic movement of equipment across temporary roads and around the
construction site (USEPA, 1996).
The temporary nature of construction activities is what distinguishes it from other fugitive sources present
within the locality. Emissions from construction activities are expected to have a definitive start and end
period and will vary depending on the various construction phases. In contrast to other fugitive sources,
here the emissions occur in a steady state or follow a discernible pattern. The quantity of dust emissions
from construction activities is proportional to the area of land under construction (USEPA, 1996).

96 | P a g e
The impact on air quality and air pollution of fugitive dust is dependent on the quantity and drift potential
of the dust particles (USEPA, 1996). Large particles settle out near the source causing a local nuisance
problem. Fine particles can be dispersed over much greater distances. Fugitive dust may have significant
adverse impacts such as reduced visibility, soiling of buildings and materials, reduced growth and
production in vegetation and may affect sensitive areas and aesthetics. Fugitive dust can also adversely
affect human health.
The following components of the environment may be impacted upon during the project construction
phase:
• The ambient air quality
• Local residents, farms and neighbouring communities
• The surrounding environment and possible the fauna and flora.
Because of the relatively short-term nature of construction activities, some control measures are more cost
effective than others. Wet suppression and wind speed reduction are two common methods used to
control open dust sources at construction sites, because a source of water and material for wind barriers
tend to be readily available at a construction site. However, several other forms of dust control are
available.
8.5.5.2 Operational Impacts
A qualitative assessment of the operational impacts of the proposed project on the surrounding
environment is discussed in the section below.
In open pit mining, a massive overburden will have to be removed to reach the mineral deposits below.
This may require excavators, transporters, loaders and conveyors belts which will result in a massive
discharge of fine particulates from the overburden material. Similarly. normal operations will also require
excavation, transportation, loading, unloading, size reduction, stock piling, etc. All these activities will
generate particulate matter. Drilling and wind erosion over open and exposed surfaces are major sources of
fugitive dust emissions. The source and characteristic of fugitive emissions from dust mining operations
vary in each case, as do their impacts. Diesel trucks and equipment used in mining activities are also a
source of PM.
Exposures to PM emissions are associated with a range of serious respiratory and cardio vascular health
problems. The key effects associated with exposure to ambient particulate matter include premature
mortality, aggravation of respiratory disease, aggravated asthma, acute respiratory symptoms, chronic
bronchitis and decreased lung function.
Methane (CH4) is produced during coal formation. Trapped methane is released when the coal seams are
fractured. Methane released in this fashion will escape into the mine and will eventually escape into the
atmosphere. The amount of coal released during coal mining is dependant on a number of factors, the
most important being the coal rank, seam depth and method of mining. The higher the coal rank, the
higher the methane production will be (Irving and Tailakov, 2000). Underground coal mining releases more
methane than surface or open pit mining. It is because the gas content is higher in deeper seams. As a safe
measure and because of methane’s high explosive property, underground shafts usually have proper
ventilation and gasification systems in order to remove methane (Irving and Tailakov, 2000).

97 | P a g e
At surface mines, methane escapes from coal faces as well as coal rubble from blasting activities. CH4 may
be present in the overburden, which breaks down during the mining process. Emissions per ton of coal in
underground mines are higher than that of surface mining.
The EIA modelling will aim to deal with the potential air quality impacts which could result due to the
construction of the mining facilities and everyday mining operations. The details regarding the source
characteristics will be obtained from site layout plans and process specific information provided and a
questionnaire filled in by the client. Such information relates to the type of activities carried out on site as
well as equipment used.
8.5.5.3 Rehabilitation Phase
The rehabilitation of the mining pits will commence when there are no further plans to mine at the site.
The rehabilitation phase entails that backfilling of the mining shafts and open pit area starts and active
mitigation and rehabilitation measures are in place. There is however emission generation related to the
rehabilitation phase, including:
• Material handling (loading and unloading of hauling vehicles);
• Wheel generated dust from hauling vehicles (travelling from stockpile to open pit area); and
• Wind erosion.
8.5.6 AMBIENT NOISE
The baseline assessment of the region of the proposed project indicated that the region is very quiet. The
topography of the study area is mountainous with typical savannah and bushveld vegetation cover. In the
study area there are minimal noise generating sources, the major existing noise source being the access
gravel road. The small village of Makushu is located on the eastern border of the mining property and is
likely to be impacted by the new operations.
The impact expected to arise from this project can be divided into two phases, 1) Construction and 2)
Operational. During the construction of the project, the noise will be limited to daylight hours (~06:00 to
18:00) and is likely to be only local to the proposed plant site and open pit area. The noise generated can
easily be stopped and mitigated once found there is a nuisance associated with the activity.
The operational phase of the project will likely produce noise during blasting events, handling of ROM and
processing plant noises. The mine is likely to be active 24 hours a day, although the activity and intensity
will be less during the night.
8.5.6.1 Potential Noise Sources – Construction
The following activities are viewed as construction activities. These activities can be investigated separately
or combined for a process of period or scenario investigation.
• Earth Works: Site Clearing;
• Earth Works: Site levelling;
• Earth works: trench digging for laying of cables and service lines;
• Access road construction;

98 | P a g e
• Establishment and operating of site construction laydown area;
• Construction of buildings of any type (include the processing plant);
• Transportation of construction workers and material to and from site; and
• Construction camp.
8.5.6.2 Potential Noise Sources – Operational
The following activities are characteristic to operational procedures of a coal mine opencast and shaft
mining methods. These activities can be investigated individually, combined (for a process), time-period or
scenario investigation.
• ROM hauling and/or conveyor system
• Processing plant
• Crushing and screening
• Material handling
• Stockpiling
• Transportation of product and waste rock
• Offices, etc.
8.5.7 BLASTING AND VIBRATION
8.5.7.1 Possible area of influence
The project area was reviewed on scoping (desk top) level and some possible points of interest were
identified for possible influence.
The source area is expected to be mainly from open pit operations at the planned The Duel Coal Project.
The receiving environment is considered the area expected to be influenced directly adjacent to the project
area. The area of influence is not expected to exceed a distance range of 3500m radius around the final
open pit area.
Review of the area indicates a diverse area including the Makushu village towards the east, Musekwa
village towards the southeast, farming communities (including hunting, wildlife and cattle farming), the
Nzhelele Dam and roads. Figure 56 shows area of study with initial points of interest identified from aerial
photography and information supplied from the client.

99 | P a g e
Figure 56: Blasting area of interest
8.5.7.2 Anticipated Impacts
Blasting operations primary objective is breaking rock for excavation to access the medium of material to
be mine. The blasting operation has the potential to yield secondary effects such as ground vibration, air
blast, fly rock and fumes. These aspects could have a negative impact on the surrounding areas depending
on the levels generated. The potential impacts considered can be described as follows:
• Ground vibration: Levels greater than recommended limits may be damaging to structures.
Different structures will also have different permitted levels. Ground vibration may cause damage if
levels exceed the structures safe limit. People may experience ground vibration as perceptibleat
very low levels.
• Air blast: In most cases the effect of air blast is underestimated. High levels of air blast could cause
damage and normally windows are first to be damaged. Levels lower than required to induce
damage may rattle windows and large roof surfaces. These effects are generally mistaken as
ground vibration effect and leads to complaints. Rattling of doors and roofs is upsetting people.
• Fly Rock: Fly rock can be mitigated but possibility never eliminated. However, it can be managed
properly with relative ease. Control on fly rock will also control the effects of air blast. Fly rock is
greater concern when pit is located in close proximity of houses or structures or installations.
There are various structures, possibly schools and areas where people congregate within 500m from the pit
boundaries. These points of interest will be confirmed and evaluated.

100 | P a g e
8.5.8 VISUAL EXPOSURE AND VISIBILITY
Visual exposure refers to the geographic area from which the proposed project will be visible and is defined
by the degree of visibility of a proposed project from various receptors sites. Visibility, in turn, is
determined by distance between the components of a proposed project and the viewer.
Visual exposure is determined by the zone of visual influence or the “viewshed”. A viewshed is the
topographically defined area that includes all the major observation sites from where a proposed
development will be visible. The boundary of the viewshed tends to connect high points in the landscape
through following ridgelines and demarcates the zone of visual influence. The zone of visual influence
usually fades out beyond 5km distance and the further away from an observer the project is, the less visible
it would be. It is also important to note that the actual zone of visual influence of the proposed project may
be smaller than indicated because of screening by existing vegetation and infrastructure, which may
partially or totally obscure a view.
General visibility classes are indicated below:
Class Description
Highly visible Clearly noticeable within the observer’s view frame 0 to 5km
Moderately visible Recognisable feature within observer’s view frame 5 to 7.5km
Marginally visible Not particularly noticeable within observer’s view frame 7.5 to 10km
Hardly visible Practically not visible unless pointed out to observer 10 to 15km+
Three distance zones have been identified (BLM, 1984) based on visibility from travel routes and
observation points. These have been determined and confirmed through field verification:
• Foreground – Middleground - includes local and sub-regional areas visible from highways, rivers, or
other viewing locations which are less than 5 km away.
• Background – includes distant sub-regional areas visible past the foreground-middleground zone
and usually between 5 and 10 km away.
• Seldom seen – includes areas that are not part of the foreground-middle ground or the background
and that are generally hidden from view and is usually further than 10 km away.
8.5.8.1 Viewshed Analysis
The combined viewshed, including all proposed mining infrastructure with a vertical dimension, is indicated
in Figure 57. The heights utilised as input data are as follows:
• The plant area was calculated at 20m, which comprises the expected maximum height of individual
plant components;
• The interim waste dump has been designed in two levels, each 75m in height, thus obtaining a
maximum height of up to 150m in some places;
• The height of the interim discard dump was calculated at 70m above ground level; and
• The open pit was calculated at ground level.

101 | P a g e
Figure 57: Combined viewshed for The Duel Coal Project
From the viewshed analyses (which does not take into account vegetation and local topography), it is
evident that the proposed project, with specific reference to the proposed waste dump, will be highly
visible from within 5 km of the study area and visible from a number of locations such as settlements,
including Makushu, Mosholombe, Pfumembe, Mudimeli, Ngundu (Musekwa) and Maranikhwe towards the
east and west of the study area and from various game farms and lodges in the vicinity of the proposed
project. The project will not be highly visible from the south of the study area. The viewshed analyses
indicate that the project will be visible from beyond 10 km of the study area, including from several nature
reserves and other sensitive areas, particularly towards the east, north and west of the study area. It is
important to note that at a distance further than 10 km from a development, visual exposure and visibility
is expected to significantly decrease due to objects being difficult to distinguish from the background at
such significant distances.
From the analyses, it is further evident that the proposed waste dump stockpiles, and to a lesser degree,
the proposed discard dump and plant area, will contribute the most towards the expected visual impact,
while the visibility of the open pit areas will be much lower to this infrastructure being located at and below
ground level. The extensive combined viewshed (Figure 57) is mainly attributed to the cumulative height of
the waste dump and it is recommended that, as far as possible, the proposed mining infrastructure does
not extend above the central mountainous feature within the study area.
It is important to note that the visual impact from mining infrastructure is not expected to be permanent,
provided that effective rehabilitation of impacted areas takes place, as the waste and discard dumps will be
utilised as backfill within the open pit.

102 | P a g e
8.5.8.2 Night Time Lighting
Most of the study area is generally free from the effects of night lighting sources, with low-level light
sources coming from the adjacent Makushu settlement, and surrounding game farms and lodges. Other
current lighting sources in the region include that of users of local gravel roads in the vicinity of the study
area. The lighting environment of the study area is thus consistent with Environmental Zone E1 –
Intrinsically Dark Landscapes. Overall, there is little nighttime lighting currently significantly impacting on
the study area and the impact from the mining project and potential 24-hour mining operations is
therefore expected to be substantial in such a rural area during nighttime hours. The ILP (2011)
recommend that, in order to maintain the nighttime setting, lighting within the identified zone should have
minimal illumination into the sky as well as to adjacent viewpoints.
Two types of lighting are associated with the proposed project, namely stationary lighting sources and
vehicle mounted lighting sources. Stationary lights facing upward are significant contributors to light
pollution and causes sky glow and glare, while light facing in a horizontal direction can be visible for long
distances, lead to light trespass (light falling outside the desired area of illumination) and be disturbing to
viewers and vehicles. Sky glow refers to the nighttime brightening of skies, caused by the scattering and
redirecting of light in the atmosphere, by water droplets and dust in the air, back towards the ground. Such
stray light mostly comes from poorly designed and improperly aimed light, and from light reflected from
over-lit areas. This effect is very noticeable at night and in the early morning at mining operations (ASSA,
2012). Lighting from vehicles within rural areas will generally be more intrusive than in urban settings and,
therefore, will have a potentially greater impact due the general lack of existing ambient light.
The proposed project is expected to contribute to the effects of sky glow and artificial lighting in the region,
particularly as a result of stationary lighting sources, including lighting from the beneficiation plant facilities.
Generally, the impacts of vehicle mounted lighting sources in the areas will be confined to the local and
sub-regional setting (up to 10km from the study area) due to the effects of distance and intervening
undulating topography, existing settlements and vegetation which restrict the potential impact on views
from more distant regional points.
Based on the findings from both the desktop and the field assessments it is evident that the proposed
mining project is located within a region with steeply undulating, mountainous topography, with a number
of distinguishing landforms present. The VAC of the study area has been determined as being medium, with
largely intact, tall vegetation and high visual and topographical diversity being present within the extent of
the study area. The overall quality value and sense of place of the landscape is considered to be of some
significance.
Sensitive visual receptors include residents of local settlements (with particular reference to the Makushu
settlement bordering the study area), residents and visitors of lodges and game farms, as well as users of
local gravel roads within 5 km of the study area. Other sensitive receptors include potential visitors to the
Nzhelele Nature Reserve, who will also be significantly impacted by alteration of the visual environment.
Residents, workers and potential tourists to game farms and lodges in the region beyond 5 km of the study
area, as well as users of the N1and R525, are likely to be less affected due to screening of infrastructure by
vegetation and local topography. Beyond 10 km, the proposed project infrastructure is unlikely to be highly
visible, however night lighting and resultant skyglow, may be visible for significant distances.

103 | P a g e
Several potential risks to the receiving aesthetic and visual environment as a result of the proposed mining
operation have been identified, relating to impacts on visual character and sense of place, visual intrusion
and visual exposure and visibility. Tourism in the region may also potentially be impacted due to the
location of the study area immediately adjacent to the Nzhelele Nature Reserve and in close proximity to
the Nzhelele Dam. These impacts will be assessed in detail in the impact assessment phase of the project
and as far as possible mitigatory recommendations will be presented in line with the mitigation hierarchy as
advocated by the DMR (2013) in order to ensure informed decision making and improved sustainable
development in the area.
8.5.9 SOCIAL IMPACT AND BENEFITS
The preliminary socio-economic and cultural impacts and benefits are listed below:
• Demographic and Population Impacts
o Population growth pressures
o Influx of job seekers
o Changes in Settlement & Housing Patterns
• Health and Social Well-being
o Nuisance Impact caused by noise, dust and vibrations on neighbouring communities
o Safety and Risk Exposure: Increase in crime, increase in traffic
o Community health
• Quality of the living environment
o Quality and Aesthetic Value of physical environment
o Increased strain on infrastructure due to potential influx
o Quality and availability of housing
o Change processes and impacts related to daily movement patterns
• Socio-economic and Material Well-Being
o Participation of Local Communities in Employment Opportunities and Skills Development
o Participation of local business in procurement opportunities
o Participation of Local Communities in Bursary Programme
o Participation of Local Communities in Local Economic Development (LED) Initiatives
o Conversion of land use
• Family and Community Impacts
o Disruption of Social Networks
o Community relationships/networks
• Physical Impacts
o Displacement of households residing close to open pit operations
• Vulnerable Groups
o Displacement of poor households
o Gendered division of labour
o Impact on Disabled population
• Cumulative Socio-economic impacts
o Cumulative economic benefits such as employment, skills development, procurement,
economic growth, etc
o Cumulative socio-economic impacts as listed above

104 | P a g e
8.5.9.1 Social Impacts
Key issues relating to the social impact of the proposed project include:
• Community health and safety: Several issues have been identified, namely:
o Air borne pollutants, coal dust and diesel fumes
o Noise, blasting and vibration
o Potential increase of development diseases, i.e. HIV, TB, youth pregnancy
o Increase in crime (influx of people)
o Fly rock (blasting)
o Increased traffic (road safety)
o Impact on structures (craking of houses, etc due to vibration)
• Resettlement of Households and Services: The Makushu village is in very close proximity of the
planned open pit and several households fall within 500m of the open pit. The main issues of
concern include blasting, noise and dust impacts on these households. It is envisaged that a
number of these households will need to be relocated, depending on the zone of impact that will
be determined during the EIA Phase. Refer to Social impact zone map (Figure 58).
• Public access roads: The D3672, linking the D745 with the D3671, runs through the mining area
and will be mined through. This road would need to be diverted, as indicated in Figure 59.
These issues will be further investigated during the EIA Phase.
8.5.9.2 Social Benefits
Benefits (positive) of The Duel Coal Project include:
• Employment opportunities
• Skills development opportunities
• Local Economic Development projects
• Local procurement and SMME opportunities

105 | P a g e
Figure 58: Social impact zone map
Figure 59: Possible road diversion alignment

106 | P a g e
8.5.10 CULTURAL AND HERITAGE RESOURCES
8.5.10.1 Heritage Impact Assessment (HIA)
The HIA (Appendix 3) concluded that the project area on The Duel contains no definite archaeological sites,
although scatterings of archaeological remains in the form of Stone Age material and some potsherds were
observed. The reason that no Iron Age sites were located seems to be two-fold: firstly, the area is mostly
mountainous and/or rocky and not suitable for past settlement and secondly, the sandy soils where
settlement may have been possible is highly eroded.
• Significance criteria in terms of Section 3(3) of the National Heritage Resources Act
Significance Rating
1. The importance of the cultural heritage in the community or pattern of South Africa’s history (Historic and political significance)
Low
2. Possession of uncommon, rare or endangered aspects of South Africa’s natural or cultural heritage (Scientific significance).
None
3. Potential to yield information that will contribute to an understanding of South Africa’s natural or cultural heritage (Research/scientific significance)
Low: Stone Age
4. Importance in demonstrating the principal characteristics of a particular class of South Africa’s natural or cultural places or objects (Scientific significance)
None
5. Importance in exhibiting particular aesthetic characteristics valued by a community or cultural group (Aesthetic significance)
None
6. Importance in demonstrating a high degree of creative or technical achievement at a particular period (Scientific significance)
None
7. Strong or special association with a particular community or cultural group for social, cultural or spiritual reasons (Social significance)
Low
8. Strong or special association with the life and work of a person, group or organization of importance in the history of South Africa (Historic significance)
None
9. The significance of the site relating to the history of slavery in South Africa. None
• Section 38(3) (c): An assessment of the impact of the development on such heritage resources
The development will have a negligible effect on heritage remains.
• Section 38(3) (d): An evaluation of the impact of the development on heritage resources relative
to the sustainable economic benefits to be derived from the development
None of the recorded heritage remains within the direct mining area are uncommon, rare or unique. The
sustainable economic benefits outweigh the conservation benefits.
• Section 38(3) (e): The results of consultation with the communities affected by the proposed
development and other interested parties regarding the impact of the development on heritage
resources
Social consultative process is ongoing.
• Section 38(3)(f): If heritage resources will be adversely affected by the proposed development the
consideration of alternatives
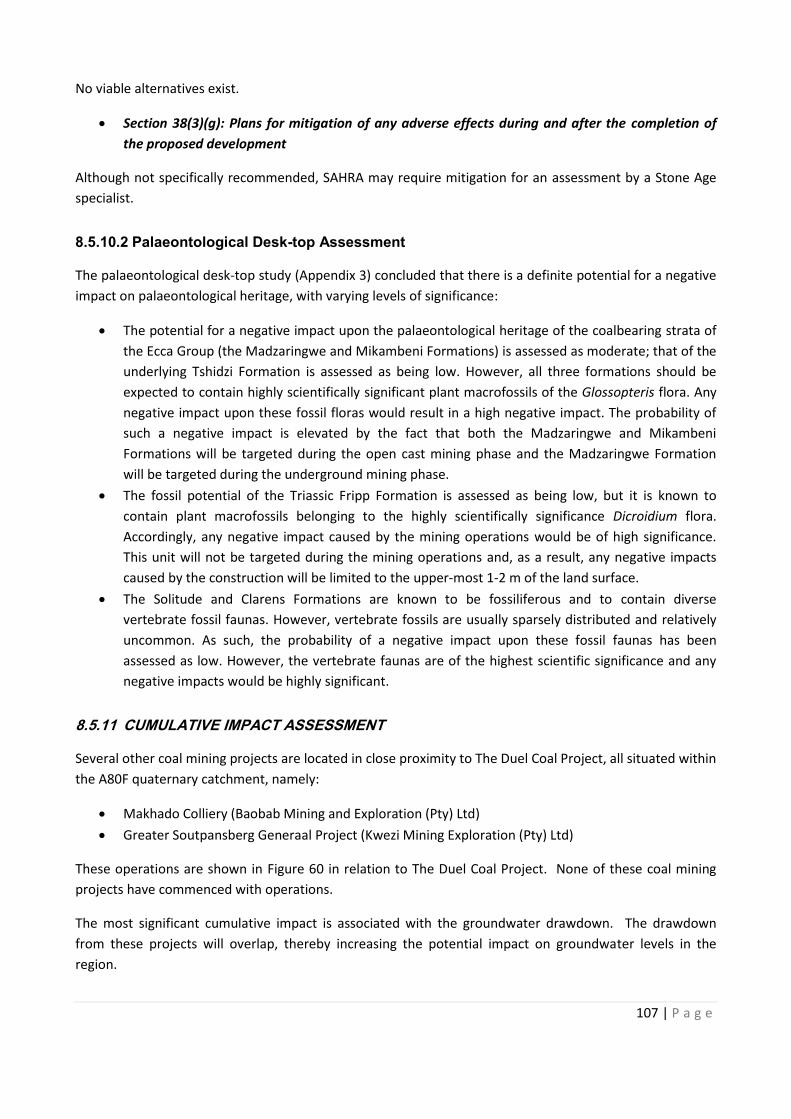
107 | P a g e
No viable alternatives exist.
• Section 38(3)(g): Plans for mitigation of any adverse effects during and after the completion of
the proposed development
Although not specifically recommended, SAHRA may require mitigation for an assessment by a Stone Age
specialist.
8.5.10.2 Palaeontological Desk-top Assessment
The palaeontological desk-top study (Appendix 3) concluded that there is a definite potential for a negative
impact on palaeontological heritage, with varying levels of significance:
• The potential for a negative impact upon the palaeontological heritage of the coalbearing strata of
the Ecca Group (the Madzaringwe and Mikambeni Formations) is assessed as moderate; that of the
underlying Tshidzi Formation is assessed as being low. However, all three formations should be
expected to contain highly scientifically significant plant macrofossils of the Glossopteris flora. Any
negative impact upon these fossil floras would result in a high negative impact. The probability of
such a negative impact is elevated by the fact that both the Madzaringwe and Mikambeni
Formations will be targeted during the open cast mining phase and the Madzaringwe Formation
will be targeted during the underground mining phase.
• The fossil potential of the Triassic Fripp Formation is assessed as being low, but it is known to
contain plant macrofossils belonging to the highly scientifically significance Dicroidium flora.
Accordingly, any negative impact caused by the mining operations would be of high significance.
This unit will not be targeted during the mining operations and, as a result, any negative impacts
caused by the construction will be limited to the upper-most 1-2 m of the land surface.
• The Solitude and Clarens Formations are known to be fossiliferous and to contain diverse
vertebrate fossil faunas. However, vertebrate fossils are usually sparsely distributed and relatively
uncommon. As such, the probability of a negative impact upon these fossil faunas has been
assessed as low. However, the vertebrate faunas are of the highest scientific significance and any
negative impacts would be highly significant.
8.5.11 CUMULATIVE IMPACT ASSESSMENT
Several other coal mining projects are located in close proximity to The Duel Coal Project, all situated within
the A80F quaternary catchment, namely:
• Makhado Colliery (Baobab Mining and Exploration (Pty) Ltd)
• Greater Soutpansberg Generaal Project (Kwezi Mining Exploration (Pty) Ltd)
These operations are shown in Figure 60 in relation to The Duel Coal Project. None of these coal mining
projects have commenced with operations.
The most significant cumulative impact is associated with the groundwater drawdown. The drawdown
from these projects will overlap, thereby increasing the potential impact on groundwater levels in the
region.

108 | P a g e
The Nzhelele River, and to a lesser degree the Mutamba River, are important systems providing potable
water as well as large volumes of irrigation water. Prior to any large scale mining these systems can already
be considered to be stressed from a water supply point of view. The proposed mining activities are likely
to contribute to the cumulative impact on the Mutamba River as well as the Nzhelele River. Any water
quality impacts from the proposed mining activities could further deteriorate the water quality, posing a
threat to the downstream water users.
The potential cumulative impact associated with The Duel Coal Project will be investigated during the EIA
Phase, and will include the impact on the following environmental aspects:
• Bulk water requirements and impact on stressed catchment water balance
• Vegetation clearance and protected fauna and flora species
• Land use / land capability
• Groundwater impact zone (quality and quantity)
• Surface water run-off (yield impact)
• Surface water quality impact on downstream users
Figure 60: Other coal mining projects in relation to The Duel Coal Project

109 | P a g e
The following cumulative socio-economic impacts need to be considered:
• Community health impacts
• Heritage and cultural impacts
• Increased regional economic development and job creation
• Regional community development and investment (SLP)
• Social Capital and Services
It is important to note that the cumulative impact will be quantified as far as possible based on available
information; however, not all information may be readily available due to possible confidentiality and the
level of technical detail. The cumulative impact may therefore not be determined to the same level as the
impacts associated with The Duel Project.
8.6 METHODOLOGY USED IN DETERMINING THE SIGNIFICANCE OF ENVIRONMENTAL IMPACTS
The Risk Assessment Methodology is described in Section 9.4 of this report.

110 | P a g e
Table 22: Initial High-Level Impact Risk Matrix Summary
Sensitive
Receptor
Environmental
Aspect Potential Impact
Nature of
Impact Duration Extent Probability Intensity
Weighting
Factor
Impact
Significance
Mitigation
Efficiency
Impact
Significance
Biophysical
Environment Soils
Loss of soil depth (volume), fertility and
organic carbon content. Negative Long Term Site specific
Highly
Probable Medium Medium
Low to
Medium Medium
Low to
Medium
Biophysical
Environment Soils
Surface subsidence due to underground
mining and/or pit subsidence impacting
on the hydropedological functioning of
the area.
Negative Long Term Local Probable Medium Medium to
High Medium Medium
Low to
Medium
Biophysical
Environment Fauna & Flora
Impact on sensitive floral and faunal
habitat & diversity Negative Long Term District Definite High High High
Low to
Medium
Medium to
High
Biophysical
Environment Fauna & Flora
Impact on species of conservation
concern Negative Long Term District Definite High High High
Low to
Medium
Medium to
High
Biophysical
Environment Fauna & Flora
Killing of animals and avifauna on the
roads, especially nocturnal animals/birds Negative Long Term Regional
Highly
Probable High High High
Low to
Medium
Medium to
High
Biophysical
Environment
Wetlands and
Aquatic Systems
Loss of wetland and riparian habitat and
ecological and socio-cultural service
provision
Negative Permanent Site specific Definite High High Medium to
High
Low to
Medium
Medium to
High
Biophysical
Environment
Wetlands and
Aquatic Systems
Loss of aquatic habitat, biodiversity and
sensitive taxa Negative Long Term Local
Highly
Probable High
Medium to
High Medium
Low to
Medium Medium
Biophysical
Environment Surface Water
Impedance of flood-lines and water
courses by placement of stockpiles,
infrastructure and mining pits
Negative Permanent Site specific Definite Very High Medium to
High
Medium to
High
Not
Efficient
Medium to
High
Biophysical
Environment Surface Water
Increased sediment loads due to
canalization of water, vegetation
clearance and compaction
Negative Long Term Regional Highly
Probable High High High Medium Medium
Biophysical
Environment Surface Water
Pollution as a result of leachate and
runoff from stockpiles Negative Long Term Regional
Highly
Probable High High High Medium Medium
Biophysical
Environment Surface Water
Pollution due to uncontrolled releases
from the mining footprint and
infrastructure areas
Negative Long Term Regional Highly
Probable High High High Medium Medium
Biophysical
Environment Surface Water
Pollution as a result of accidental
spillages of chemicals and hazardous
material.
Negative Long Term Local Highly
Probable High High
Medium to
High
Medium
to High
Low to
Medium

111 | P a g e
Sensitive
Receptor
Environmental
Aspect Potential Impact
Nature of
Impact Duration Extent Probability Intensity
Weighting
Factor
Impact
Significance
Mitigation
Efficiency
Impact
Significance
Biophysical
Environment Groundwater
Lowering of groundwater levels,
including cumulative dradown due to
other mine plans.
Negative Long Term Local Definite High High Medium to
High
Not
Efficient
Medium to
High
Biophysical
Environment Groundwater
Effect on groundwater quality due to
infiltration of poor quality water/
effluent from wet sources (PCDs, etc)
Negative Long Term Local Highly
Probable High
Medium to
High Medium Medium
Low to
Medium
Biophysical
Environment Groundwater
Effect on groundwater quality due to
poor quality leachate generated through
dry hazardous material / stockpiles
Negative Long Term Local Highly
Probable High
Medium to
High Medium Medium
Low to
Medium
Communities Land Use Relocation of households within 500 m
radius from open pits (blasting) Negative Permanent Site specific Definite High High
Medium to
High Medium Medium
Communities Air quality
Increased dust levels as a result of
construction and on-site hauling of
ROM.
Negative Long Term Local Definite High High Medium to
High Medium Medium
Communities Air quality Coal bed methane released from the
coal bed. Negative Long Term National
Highly
Probable High High High
Low to
Medium
Medium to
High
Communities Ambient noise
Potential for noise impact during
construction and mining in surrounding
communities.
Negative Short Term Local Definite Medium High Medium to
High
Medium
to High
Low to
Medium
Communities Blasting
Health, safety and nuisance impacts
related to blasting, including ground
vibration, air blast and fly rock
Negative Long Term Local Highly
Probable Very High High
Medium to
High Medium Medium
Communities Blasting Structural damage to houses and other
structures Negative Permanent Local
Highly
Probable Very High High High Medium Medium
Communities Visual Visual intrusion of mining activities,
impacting on the sense of place Negative Long Term District Definite High High High Medium Medium
Communities Visual Impact due to nighttime lighting Negative Long Term District Highly
Probable High High
Medium to
High Medium Medium
Communities Traffic Safety of other road users, increase in
traffic accidents Negative Long Term Regional Definite Very High High High
Medium
to High
Low to
Medium

112 | P a g e
Sensitive
Receptor
Environmental
Aspect Potential Impact
Nature of
Impact Duration Extent Probability Intensity
Weighting
Factor
Impact
Significance
Mitigation
Efficiency
Impact
Significance
Communities Social Increase in available employment opportunities locally
Positive Long Term Provincial Definite High Medium to
High Medium to
High Not
Efficient Medium to
High
Communities Social Increase in skills development programmes and therefore skill levels of the local communities
Positive Long Term Local Highly
Probable High
Medium to High
Medium Not
Efficient Medium
Communities Social Empowerment of local communities through equity participation
Positive Long Term Local Definite High Medium to
High Medium to
High Not
Efficient Medium to
High
Communities Social Empowerment of local business through procurement and capacity building
Positive Long Term Regional Highly
Probable High
Medium to High
Medium to High
Not Efficient
Medium to High
National
heritage
Cultural
Heritage
Impact on sub-surface heritage resources, including palaeontological heritage
Negative Long Term Site specific Highly
Probable High High
Medium to High
Medium Low to
Medium
Residual Impacts Land Use and
land capability Impact on ecosystem Negative Permanent Regional
Highly
Probable Very High High High
Low to
Medium
Medium to
High
Residual Impacts Land Use and
land capability Post-closure land use and land capability Negative Permanent Local
Highly
Probable Very High High High Medium Medium
Residual Impacts
Surface and
groundwater
resources
Deterioration of groundwater quality
within the back-filled open pit due to
neutral rock drainage reactions
Negative Permanent District Highly
Probable Very High High High
Low to
Medium
Medium to
High
Residual Impacts
Surface and
groundwater
resources
Decant into the shallow aquifer or on
surface at the lowest surface elevations
intersected by the pit
Negative Permanent Regional Highly
Probable Very High High High
Low to
Medium
Medium to
High

113 | P a g e
8.7 POSITIVE AND NEGATIVE IMPACTS OF THE PROPOSED ACTIVITY AND ALTERNATIVES
Not applicable as no alternative sites were investigated.
Table 22 lists the potential risks and benefits associated with the proposed mining activity as presented in
Section 8.5 of this report.
8.8 POSSIBLE MITIGATION MEASURES THAT COULD BE APPLIED AND THE LEVEL OF RISK
Refer to Table 22 that lists the potential risk associated with the proposed mining activity. Table 23 lists
possible mitigation measures that could be applied to reverse, reduce and mitigate the impacts. These will
be further investigated during the EIA Phase.
8.9 THE OUTCOME OF THE SITE SELECTION MATRIX
Not applicable as no alternative sites were investigated.
8.10 MOTIVATION WHERE NO ALTERNATIVE SITES WERE CONSIDERED
As indicated in Section 8.1 of this report, no alternatives site locations have been considered as mining can
only be undertaken in areas where economically mineable resources occur. The topography and relatively
small size of the property further limit the potential for alternative sites.
The only real alternative to the mine is the No-Go Option. The farm has been developed as a game farm.
The land belongs to a private company, is stocked with game and hunting is reserved for invited guests.
Based on the macro-economic analysis of the baseline activities, the total GDP generated by the existing
farm activities is estimated at a total of R2.43 million per annum and the direct at R1.06 per annum. Only
three direct employment opportunities are sustained by the farming activities on The Duel, with a total of
12 if the indirect and induced is added. The total payments to households are R1.03 million with R0.33
million, 32% to the low-income households.
The main consequence of the No-Go Option is the loss of opportunity to develop a high-quality mineral
resource with an estimated LOM of 24 years which has the potential for huge economic benefits on local,
provincial and national level in terms of employment and the contribution to the GDP.
Other socio-economic benefits that will be lost include:
• Skills development opportunities
• Local Economic Development projects (SLP)
• Local procurement and SMME opportunities
8.11 STATEMENT MOTIVATING THE PREFERRED SITE
Not applicable as no alternative sites were investigated.

114 | P a g e
9 PLAN OF STUDY FOR THE EIA PROCESS
9.1 DESCRIPTION OF ALTERNATIVES TO BE CONSIDERED
The following alternative land use options have been identified:
• Commercial farming: The northern and southern sections of the study area mainly comprise
shallow or rocky soils that fall into the wilderness and grazing land capability classes. However, the
mid-section of the site comprises deep soils of the Augrabies, Hutton and Brandvlei soil forms.
These are potentially low to medium potential arable land if irrigation water is available.
• Grazing: Grazing by both game and domestic animals (cattle, goats) is a viable alternative to
mining, however, this relates back to the No-Go Option which indicated substantial losses in
respect of economic benefits and employment.
• Eco-tourism: Improved accommodation and tourist activities (4x4 tracks, walking trails, bird
watching) could be a viable alternative to the existing game farming operation.
• Communal land: The area may be utilized by the land claimants for housing and subsistence
farming / grazing land.
The viability of these alternative land use options will be determined during the EIA Phase by utilising the
collected site-specific data to determine the comparative feasibility of the project and the impact on local
activities. A macro-economic study is aimed at determining the economic and socio-economic indicators
and assist in identifying the best alternative land use option.
The basic function of this specialist study would be to determine whether The Duel Coal Project will
enhance net societal welfare. At a broad level, investigating impacts on overall welfare requires
considering the efficiency, equity and sustainability of the project. Keeping these principles in mind, the
core concept applied by the economist when considering trade-offs is “opportunity cost” - the net benefit
that would have been yielded by the next best alternative. This is the net benefit that would have been
yielded by the next best alternative (for example, if farming is the next best alternative for a piece of land,
then the foregone benefit associated with it will be the opportunity cost of any other land use). It is vital
information if decision makers are to understand the trade-offs involved in projects. A key part of
considering opportunity costs is commonly to highlight the impacts of doing nothing i.e. the “no-go
alternative” or also referred to as the “economic baseline”.
9.2 DESCRIPTION OF ASPECTS TO BE ASSESSED DURING THE EIA PROCESS
The aspects that will be investigated during the EIA Phase are inclusive of all the mining and associated
activities and will include the following:
Main activities / processes Associated activities
Mining activities
• Open Pit
• Underground (longwall mining)
• District road diversion
• Drilling & blasting
• Explosives magazine
• Goafing (subsidence)
• Mine water management o In-pit and U/G sumps o pumping systems

115 | P a g e
Main activities / processes Associated activities
• Storm water management o clean water cut-off canals o dirty water stream diversions
• Dust suppressions
• Closure planning and rehabilitation
Processing plant & infrastructure • Access road / road diversion
• Process Infrastructure Area o ROM crushers o Plant stockpiles o Plant infrastructure o Silt traps / dirty water canals o Workshops o Wash-bay o Bulk hydrocarbon facilities
• Clean water storage tanks
• Dirty water holdings dams
• Offices & stores
• Stores
• Ablution facilities and change houses
• Potable water and sewage treatment plants
• Employee and contractor accommodation
On-site conveyance of ROM & product • Haul / service roads
• Conveyors
• River crossings / culverts
Mine residue / waste management • Waste (overburden) dump
• Discard dump dump
• Topsoil stockpiles
• Stormwater management and leachate control
• Waste management (general & hazardous)
Off-site product transport • Upgrading of gravel roads
• Implementation of calming / traffic safety measures
Bulk water & power • Pipelines
• Power lines
• Stream crossings
The impacts associated with the above activities will be investigated during the EIA Phase as far as
practically possible, and where the necessary technical information is available.
9.3 DESCRIPTION OF ASPECTS TO BE ASSESSED BY SPECIALISTS
The following specialist studies were commissioned for The Duel Coal Project during 2015 for the previous
application:
• Soils, Land Use and Land Capability Impact Assessment
• Biodiversity Impact Assessment, including Aquatic and Wetland Systems
• Surface water Impact Assessment
• Groundwater Impact Assessment

116 | P a g e
• Air Quality Impact Assessment (AQIA)
• Noise Impact Assessment (NIA)
• Blasting and Vibration Impact Assessment
• Heritage Impact Assessment (HIA)
• Palaeontological Desk-top Study
• Visual Impact Assessment (VIA)
• Social Impact Assessment (SIA)
• Macro-Economic Impact Assessment
The methods of assessment for the specialist studies (2015) are contained in the Plan of Study, attached as
Appendix 5.
This re-application comes some 4 years after the original specialist fieldwork was conducted. The
environmental context in the area has not changed significantly, nor has the mining and infrastructure
footprint been altered from the 2015 submission. The findings of the specialist reports are therefore
considered valid for this re-application and limited additional specialist work is planned for this re-
application.
However, during a pre-application meeting held with the DMR on 14 January 2019, the Competent
Authority requested that an evaluation be conducted to confirm that the environmental conditions are
similar to what was presented in the specialist reports and that the conclusions drawn at the time are still
relevant.
The following specialist reports will be therefore be reviewed to confirm the baseline environmental
context, based on further desk-top and fieldwork investigations planned for February 2019:
• Terrestrial (fauna & flora) assessment
• Freshwater (wetlands & aquatic) assessment
• Geohydrological assessment and bulk water options
• Heritage and Palaeontological impact assessment
• Social impact assessment
Since the mining and infrastructure layout and scheduling remain the same, the other specialist impact
assessments will not change in respect of the impact modelling and the 2015 specialist reports will
therefore be utilised without any further work, including soils, surface water (hydrology), air quality, noise,
visual, blasting and macro-economic.

117 | P a g e
9.4 PROPOSED METHOD OF ASSESSING DURATION SIGNIFICANCE
According to the NEMA Regulations, ‘significant impact means an impact that by its magnitude, duration,
intensity or probability of occurrence may have a notable effect on one or more aspects of the
environment’. In line with the Regulations, and based on the qualitative findings of the activities
undertaken, each potentially significant impact will be assesed with regard to:
• the nature and status of the impact;
• the extent and duration of the impact;
• the probability of the impact occurring;
• the effect of significance on decision‐makings;
• the weight of significance; and
• the mitigation efficiency.
9.4.1 IMPACT SIGNIFICANCE
9.4.1.1 Nature and Status
The ‘nature’ of the impact describes what is being affected and how. The ‘status’ is based on whether the
impact is positive, negative or neutral.
9.4.1.2 Spatial Extent
‘Spatial Extent’ defines the spatial or geographical scale of the impact.
Category Rate Descriptor
Site 1 Site of the proposed development
Local 2 Limited to site and/or immediate surrounds (500m zone of influence)
District 3 Makhado Municipal area
Region 4 Vhembe District, and direct neighbouring district
Provincial 5 Limpopo Province
National 6 South Africa
International 7 Beyond South African borders
9.4.1.3 Duration
‘Duration’ gives the temporal scale of the impact.
Category Rate Descriptor
Temporary 1 0 – 1 years
Short term 2 1 – 5 years
Medium term 3 5 – 15 years
Long term 4 Where the impact will cease after the operational life of the activity either because of natural process or by human intervention
Permanent 5 Where mitigation either by natural processes or by human intervention will not occur in such a way or in such a time span that the impact can be considered as transient

118 | P a g e
9.4.1.4 Probability
The ‘probability’ describes the likelihood of the impact actually occurring.
Category Rate Descriptor
Rare 1 Where the impact may occur in exceptional circumstances only
Improbable 2 Where the possibility of the impact materialising is very low either because of design or historic experience
Probable 3 Where there is a distinct possibility that the impact will occur
Highly probable 4 Where it is most likely that the impact will occur
Definite 5 Where the impact will occur regardless of any prevention measures
9.4.1.5 Intensity
‘Intensity’ defines whether the impact is destructive or benign, in other words the level of impact on the
environment.
Category Rate Descriptor
Insignificant 1 Where the impact affects the environment is such a way that natural, cultural and social functions and processes are not affected. Localised impact and a small percentage of the population is affected
Low 2 Where the impact affects the environment is such a way that natural, cultural and social functions and processes are affected to a limited extent
Medium 3 Where the affected environment is altered in terms of natural, cultural and social functions and processes continue albeit in a modified way
High 4 Where natural, cultural or social functions or processes are altered to the extent that they will temporarily or permanently cease
Very High 5 Where natural, cultural or social functions or processes are altered to the extent that they will permanently cease, and it is not possible to mitigate or remedy the impact
9.4.1.6 Ranking, Weighting and Scaling
The weight of significance defines the level or limit at which point an impact changes from low to medium
significance, or medium to high significance. The purpose of assigning such weights serves to highlight
those aspects that are considered the most critical to the various stakeholders and ensure that the element
of bias is taken into account. These weights are often determined by current societal values or alternatively
by scientific evidence (norms, etc.) that define what would be acceptable or unacceptable to society and
may be expressed in the form of legislated standards, guidelines or objectives.
The weighting factor provides a means whereby the impact assessor can successfully deal with the
complexities that exist between the different impacts and associated aspect criteria.

119 | P a g e
Spatial Extent Duration Intensity /
Severity Probability
Weighting factor
Significance Rating (SR -
WOM) Pre-
mitigation
Mitigation Efficiency
(ME)
Significance Rating (SR-
WM) Post
Mitigation
Site (1) Short term
(1) Insignificant
(1) Rare (1) Low (1) Low (0 – 19) High (0.2) Low (0 – 19)
Local (2) Short to Medium term (2)
Minor (2) Unlikely (2) Low to
Medium (2)
Low to Medium (20 –
39)
Medium to High (0.4)
Low to Medium (20 –
39) District (3)
Regional (4) Medium term (3)
Medium (3) Possible (3) Medium (3) Medium (40 –
59) Medium (0.6)
Medium (40 – 59)
Provincial (5) Long term (4)
High (4) Likely (4) Medium to
High (4) Medium to
High (60 – 79) Low to
Medium (0.8) Medium to
High (60 – 79) National (6)
International (7)
Permanent (5)
Very high (5)
Almost certain (5)
High (5) High (80 –
110) Low (1.0)
High (80 – 110)
9.4.1.7 Impact significance without mitigation (WOM)
Following the assignment of the necessary weights to the respective aspects, criteria are summed and
multiplied by their assigned weightings, resulting in a value for each impact (prior to the implementation of
mitigation measures).
Equation 1: Significance Rating (WOM) = (Extent + Intensity + Duration + Probability) x Weighting Factor
9.4.1.8 Effect of Significance on Decision‐makings
Significance is determined through a synthesis of impact characteristics as described in the above
paragraphs. It provides an indication of the importance of the impact in terms of both tangible and
intangible characteristics. The significance of the impact “without mitigation” is the prime determinant of
the nature and degree of mitigation required.
Rating Rate Descriptor
Negligible 0 The impact is non-existent or insignificant, is of no or little importance to decision making.
Low 1-19 The impact is limited in extent, even if the intensity is major; the probability of occurrence is low and the impact will not have a significant influence on decision making and is unlikely to require management intervention bearing significant costs.
Low to Medium
20 – 39
The impact is of importance, however, through the implementation of the correct mitigation measures such potential impacts can be reduced to acceptable levels. The impact and proposed mitigation measures can be considered in the decision-making process
Medium 40 – 59
The impact is significant to one or more affected stakeholder, and its intensity will be medium or high; but can be avoided or mitigated and therefore reduced to acceptable levels. The impact and mitigation proposed should have an influence on the decision.
Medium to High
60 -79 The impact is of major importance but through the implementation of the correct mitigation measures, the negative impacts will be reduced to acceptable levels.
High 80 – 110
The impact could render development options controversial or the entire project unacceptable if it cannot be reduced to acceptable levels; and/or the cost of management intervention will be a significant factor and must influence decision-making.

120 | P a g e
9.4.2 MITIGATION
“Mitigation” is a broad term that covers all components of the ‘mitigation hierarchy’ defined hereunder. It
involves selecting and implementing measures, amongst others, to conserve biodiversity and to protect,
the users of biodiversity and other affected stakeholders from potentially adverse impacts as a result of
mining or any other landuse. The aim is to prevent adverse impacts from occurring or, where this is
unavoidable, to limit their significance to an acceptable level. Offsetting of impacts is considered to be the
last option in the mitigation hierarchy for any project.
The mitigation hierarchy in general consists of the following in order of which impacts should be mitigated:
• Avoid/prevent impact: can be done through utilising alternative sites, technology and scale of
projects to prevent impacts. In some cases, if impacts are expected to be too high, the “no project”
option should also be considered, especially where it is expected that the lower levels of mitigation
will not be adequate to limit environmental damage and eco-service provision to suitable levels.
• Minimise (reduce) impact: can be done through utilisation of alternatives that will ensure that
impacts on biodiversity and ecoservices provision are reduced. Impact minimisation is considered
an essential part of any development project.
• Rehabilitate (restore) impact is applicable to areas where impact avoidance and minimisation are
unavoidable where an attempt to re-instate impacted areas and return them to conditions which
are ecologically similar to the pre-project condition or an agreed post project land use, for example
arable land. Rehabilitation can however not be considered as the primary mitigation toll as even
with significant resources and effort rehabilitation that usually does not lead to adequate
replication of the diversity and complexity of the natural system. Rehabilitation often only restores
ecological function to some degree to avoid ongoing negative impacts and to minimise aesthetic
damage to the setting of a project. Practical rehabilitation should consist of the following phases in
best practice:
o Structural rehabilitation which includes physical rehabilitation of areas by means of
earthworks, potential stabilisation of areas as well as any other activities required to
develop a long terms sustainable ecological structure;
o Functional rehabilitation which focuses on ensuring that the ecological functionality of the
ecological resources on the subject property supports the intended post closure land use.
In this regard special mention is made of the need to ensure the continued functioning and
integrity of wetland and riverine areas throughout and after the rehabilitation phase.
o Biodiversity reinstatement which focuses on ensuring that a reasonable level of biodiversity
is re-instated to a level that supports the local post closure land uses. In this regard special
mention is made of re-instating vegetation to levels which will allow the natural climax
vegetation community of community suitable for supporting the intended post closure land
use.
o Species reinstatement which focuses on the re-introduction of any ecologically important
species which may be important for socio-cultural reasons, ecosystem functioning reasons
and for conservation reasons. Species re-instatement need only occur if deemed necessary.
• Offset impact refers to compensating for latent or unavoidable negative impacts on biodiversity.
Offsetting should take place to address any impacts deemed to be unacceptable which cannot be
mitigated through the other mechanisms in the mitigation hierarchy. The objective of biodiversity

121 | P a g e
offsets should be to ensure no net loss of biodiversity. Biodiversity offsets can be a last resort to
compensate for residual negative impacts on biodiversity.
According to the DMR (2013) “Closure” refers to the process for ensuring that mining operations are closed
in an environmentally responsible manner, usually with the dual objectives of ensuring sustainable post-
mining land uses and remedying negative impacts on biodiversity and ecosystem services.
The significance of residual impacts should be identified on a regional as well as national scale when
considering biodiversity conservation initiatives. If the residual impacts lead to irreversible loss or
irreplaceable biodiversity the residual impacts should be of very high significance and when residual
impacts are considered to be of very high significance, offset initiatives are not considered an appropriate
way to deal with the magnitude and/or significance of the biodiversity loss. In the case of residual impacts
determined to have medium to high significance, an offset initiative may be investigated. If the residual
biodiversity impacts are considered of low significance no biodiversity offset is required.
9.4.2.1 Impact significance with mitigation measures (WM)
In order to gain a comprehensive understanding of the overall significance of the impact, after
implementation of the mitigation measures, it was necessary to re-evaluate the impact.
9.4.2.2 Mitigation Efficiency (ME)
The most effective means of deriving a quantitative value of mitigated impacts is to assign each significance
rating value (WOM) a mitigation effectiveness (ME) rating. The allocation of such a rating is a measure of
the efficiency and effectiveness, as identified through professional experience and empirical evidence of
how effectively the proposed mitigation measures will manage the impact. Thus, the lower the assigned
value the greater the effectiveness of the proposed mitigation measures and subsequently, the lower the
impacts with mitigation.
Equation 2: Significance Rating (WM) = Significance Rating (WOM) x Mitigation Efficiency (ME)
Mitigation Efficiency is rated out of 1 as follows:
Category Rate Descriptor
Not Efficient (Low) 1 Mitigation cannot make a difference to the impact
Low to Medium 0.8 Mitigation will minimize impact slightly
Medium 0.6 Mitigation will minimize impact to such an extent that it becomes within acceptable standards
Medium to High 0.4 Mitigation will minimize impact to such an extent that it is below acceptable standards
High 0.2 Mitigation will minimize impact to such an extent that it becomes insignificant
9.4.2.3 Significance Following Mitigation (SFM)
The significance of the impact after the mitigation measures are taken into consideration. The efficiency of
the mitigation measure determines the significance of the impact. The level of impact is therefore seen in
its entirety with all considerations considered.

122 | P a g e
9.5 STAGES AT WHICH THE CA WILL BE CONSULTED
The CA will be consulted after submission of the draft EIAR/EMPr and upon receipt of comments from
organs of state and registered IAPs.
9.6 PARTICULARS OF THE PUBLIC PARTICIPATION PLAN
9.6.1 METHODS OF PUBLIC PARTICIPATION
The following methods will be utilised throughout the Public Participation process, as required:
• Advertisements and Notices;
• Authority meetings;
• Traditional Authority and Community meetings;
• Public Meetings and/or Open Days;
• Community Forums and Group Presentations;
• One-on-One interviews / engagements;
• Electronic and email correspondence; and
• Other Methods.
9.6.2 SCOPING PHASE
9.6.2.1 Comments and Responses on the Draft Scoping Report
A CRR will be compiled from all the comments received on the draft Scoping Report. This report will be
included in the Final Scoping Report.
9.6.2.2 Notification of the Final Scoping Report
Registered IAPs will be notified of the availability of the final Scoping Report.
9.6.3 EIA PHASE
9.6.3.1 EIA Results Information Dissemination
The results from the specialist studies will be presented at a Public Meeting with translation into Venda.
9.6.3.2 Further IAP Engagement Sessions
9.6.3.2.1 Authority Engagement
The draft EIAR/EMPr will be provided to all relevant Departments (including District and Local Municipal
representatives) for their comments and inputs.

123 | P a g e
9.6.3.2.2 Traditional Leadership Engagement
Regular engagement with the Traditional Leadership of the affected communities will continue.
9.6.3.3 Public Meeting
A combined Community and Public Meeting will be held where all IAPs will be provided with an opportunity
to raise concerns, make comments and or suggestions to the EAP and the Applicant. The meeting will be
held within the Municipal area in proximity to the communities.
9.6.3.4 Availability of the EIAR/EMPr
The draft EIAR/EMPr will be made available for 30 calendar days. Notification will be sent to all registered
IAPs indicating where copies of the report can be accessed. Hard copies of the reports will be submitted to
relevant Authorities and will also be placed in the Public Places. The report will be available for download or
a Compact Disc can be posted on request. Provision will be made to facilitate access to the report by
communities.
9.6.4 COMMENTS AND RESPONSES
All comments received during the Scoping and EIA Phases will be included in the CRR for the project and
process. Responses to questions and comments will be provided in these reports, and where relevant,
inputs will be incorporated into the final EIAR/EMPr.

124 | P a g e
9.7 MEASURES TO AVOID, REVERSE, MITIGATE OR MANAGE IDENTIFIED IMPACTS
Table 23: Initial High-Level identification of Mitigation Measures
Activity Potential Impact Possible Mitigation Measures
Potential for Residual Risk
(Post-Mitigation Significance)
Mining and infrastructure
Loss of soil depth (volume), fertility and organic carbon content
• The available topsoil will be stripped prior to mining and placed directly (as far as practicably possible) on levelled spoils.
• All available topsoil areas will be seeded prior to the start of the rainy season.
• Soil analysis will be performed prior to seeding and the soil fertility rectified (if necessary) to facilitate vigorous growth.
• Organic fertilisers will be used as far as possible.
Low to Medium
Mining Surface subsidence due to underground mining and/or pit subsidence impacting on the hydropedological functioning of the area
• Maintain appropriate safety factors to prevent subsidence to surface.
• Compaction of overburden and discards placed in the bottom of the pits to limit the potential for subsidence on the rehabilitated open pits.
Low to Medium
Mining and infrastructure
Impact on sensitive floral and faunal habitat & diversity
• Development of Biodiversity Action Plan (BAP) prior to construction.
• In areas not impacted by the mining activities, the natural vegetation will be maintained by implementing the following: burning programmes; rotational grazing programmes; alien vegetation eradication programme; and restricting vehicle movement to existing roads.
• An alien floral control plan must be designed and implemented in order to monitor and control alien floral recruitment in disturbed areas.
• A reclamation plan will be implemented and updated on a regular basis.
• No collection of firewood, RDL/Protected or medicinal floral species must be allowed by mining personnel.
• Illegal access will be limited to prevent illegal hunting and snaring of fauna in the area.
• An environmental awareness campaign will be implemented, both internally and externally (local communities).
• Initiate an ecological offset initiative together with the relevant stakeholders.
Medium to High
Mining and infrastructure
Impact on species of conservation concern
• A protected and RDL floral relocation, monitoring and management plan will be designed and implemented by a suitably qualified specialist and should address all species which can be successfully rescued and relocated.
• Annual flora rescue operations will be undertaken during the growing season in the areas planned to be mined and/or disturbed within the next year.
• A rescue and relocation programme for fauna species will be developed and implemented with the assistance of specialists in this field.
• An environmental awareness campaign will be launched, both internally and externally (local communities).
Medium to High
ROM and product haulage
Killing of animals and avifauna on the roads, especially nocturnal animals/birds
• Maintaining vehicle speeds.
• Off-site hauling of product should be limited to between the hours of 06h00 to 20h00.
• Implementation of an Environmental Awareness Programme for trucking contractor.
Medium to High
Mining and infrastructure
Loss of wetland and riparian habitat and ecological and socio-cultural service provision
• No dumping of waste should take place within the riparian zone. If any spills occur, they should be immediately cleaned up.
• Implement alien vegetation control program within wetland areas with special mention of water loving tree species.
Medium to High

125 | P a g e
Activity Potential Impact Possible Mitigation Measures
Potential for Residual Risk
(Post-Mitigation Significance)
• Ongoing wetland monitoring to determine any deterioration in the Present Ecological State (PES) of the wetland systems.
• Biodiversity offset programmes should include wetland offsets where appropriate.
Mining and infrastructure
Loss of aquatic habitat, biodiversity and sensitive taxa
• Implementation of a biodiversity monitoring programme for early detection of potential impacts.
• Water quality and aquatic monitoring to assess the suitability of the water to support aquatic life.
Medium
Mining and infrastructure
Impedance of flood-lines and water courses by placement of stockpiles, infrastructure and mining pits
• Diversion of non-perennial streams around the open pits. Medium to High
Mining and infrastructure, storm water management
Increased sediment loads due to canalization of water, vegetation clearance and compaction
• Design and install appropriate outlet structures to retard flow velocity.
• Construct energy dissipating structures along steep slopes.
• Side slopes of earth berms / canals to be designed to 1:3 and protected & vegetated to prevent erosion.
• Final topsoiling and re-vegetation according to the rehabilitation plan.
• All available topsoil areas will be seeded prior to the start of the rainy season.
Medium
Mine residue facilities
Pollution as a result of leachate and runoff from stockpiles
• Appropriate geo-liners to be constructed for the stockpiles, depending on the waste classification of this material.
• Provision of berms and/or paddocks at overburden and discards stockpiles to contain runoff.
• Reuse of this water for dust suppression on and around the stockpile areas.
Medium
Mining and infrastructure
Pollution due to uncontrolled releases from the mining footprint and infrastructure areas
• No dirty water runoff will be permitted to reach the wetland and riverine resources during the entire life of mine.
• Separation of clean and dirty water through implementation of the SWMP.
• Directing and containment of dirty water runoff to PCDs and providing silt traps.
• Design dirty water management infrastructure for the 1:50 year flood event.
• HDPE liners to be implemented at PCDs.
Medium
Hazardous chemicals and waste
Pollution as a result of accidental spillages of chemicals and hazardous material
• Strict control of sewage water treatment must take place and the sewage system should form part of the mine’s closed process water system.
• Develop and implement hydrocarbon management procedure to prevent accidental spillages.
• Bulk facilities and chemical stores to be concrete lined and bunded to a capacity of 110%.
• Spillages must be cleaned up immediately in line with the Spill Management procedure.
Low to Medium
Mining Lowering of groundwater levels, uncluding cumulative drawdown due to other mine plans
• Implementation of a monitoring programme to confirm impact predictions.
• Compensate or provide alternative water supply to affected groundwater users.
Medium to High
Infrastructure area
Effect on groundwater quality due to infiltration of poor quality water/effluent from wet sources (PCDs, etc)
• Leachate to be captured and pumped to the processing facility for re-use.
• Dirty water dams (PCDs) to be plastic lined (HDPE) to prevent groundwater contamination.
• Dirty water canals in the infrastructure area to be concrete lined to prevent groundwater contamination.
• Monitoring boreholes will be installed in appropriately selected sites prior to commencement of mining to detect changes in water quality and water levels with time.
Low to Medium
Mine residue Effect on groundwater • Appropriate geo-liners to be constructed for the Low to Medium

126 | P a g e
Activity Potential Impact Possible Mitigation Measures
Potential for Residual Risk
(Post-Mitigation Significance)
facilities quality due to poor quality leachate generated through dry hazardous material / stockpiles
stockpiles, depending on the waste classification of this material.
• Discards stockpile and stockpiling of any other carbonaceous material will be designed with a competent liner with a leachate collection system.
• Stockpiles will be compacted to minimise infiltration.
Mining Blasting
Relocation of households and associated graves within 500 m radius from open pits (blasting)
• Resettle directly impacted households in line with the Resettlement, Compensation and Mitigation Strategy.
Medium
Mining Hauling of ROM
Increased dust levels as a result of construction and on-site hauling of ROM
• Set the speed limit for hauling vehicles and vehicles in general to 40 km/h and enforce the speed limits specified.
• Include speed-bumps to control the speed limits.
• Implement a program of wet-suppression of the unpaved roads with major vehicle activity.
Medium
Mining Coal bed methane released from the coal bed
• Ongoing methane monitoring to determine levels of methane released to the atmosphere.
Medium to High
Communities Potential for noise impact during construction and mining in surrounding communities
• Construction to be restricted from 06h00 to 18h00 with no activities (or at least no noisy construction activities) at night.
• Implement an extensive noise-monitoring programme within the community to determine the actual noise levels.
• Monitor and investigate all complaints from members of the community regarding irritation, trouble to sleep and lack of rest and calmness.
• Use of low-noise generation plant and equipment.
• All plant, equipment and vehicles are to be kept in good repair.
• At commissioning of the mine, noise monitoring guidelines are to be prepared and implemented. This should include a re-evaluation of individual noise component over the LOM.
Low to Medium
Blasting Health, safety and nuisance impacts related to blasting, including ground vibration, air blast and fly rock
• Implementation of Blasting Procedure and blast design guidelines.
• Resettle directly impacted households in line with the Resettlement, Compensation and Mitigation Strategy.
• All animals and people within 500m of a blast must be evacuated.
• All roads within 500m of a blast must be closed.
• Blasting time must be fixed and blasting notice boards setup at various routes around the project area that will inform the community blasting dates and times. A recommended good blasting time will be between 12:00 and 14:00.
• Implementation of permanent seismographs to monitor ground vibration and air blast of every blast to ensure adherence to blast designs.
Medium
Blasting Structural damage to houses and other structures
• Pre-blasting photographic inspections will be done on all houses and other structures prior to blasting within this distance.
• Monitor and investigate all complaints from members of the community.
Medium
Infrastructure Mine residue facilities
Visual intrusion of mining activities, impacting on the sense of place
• The development footprint and disturbed areas are to be kept as small as possible and the areas cleared of natural vegetation must be kept to a minimum.
• The height of infrastructure and stockpiles should be a low as possible.
• Infrastructure should not be placed on ridgelines, summits, or other locations where they would be silhouetted against the sky.
• Infrastructure such as stockpiles must be shaped and rounded to blend in with the surrounding undulating
Medium

127 | P a g e
Activity Potential Impact Possible Mitigation Measures
Potential for Residual Risk
(Post-Mitigation Significance)
landscape, especially along the skyline.
• Natural colours should be used in all instances and the use of highly reflective material should be avoided. Any metal surfaces should be painted to fit in with the natural environment in a colour that blends in effectively with the background. White structures are to be avoided as these will contrast significantly with the natural surroundings.
• In areas where screening topography and vegetation are absent, natural-looking constructed landforms and vegetative or architectural screening may be used to minimise visual impacts.
Lighting Impact due to nighttime lighting
• Outdoor lighting must be strictly controlled.
• High light masts should be avoided. Any high lighting masts should be covered to reduce the glow.
• Construction activities should be restricted to daylight hours as far as possible, in order to limit the need to bright floodlighting and the potential for skyglow.
• Lighting fixtures must be selected and placed so that they direct their light on the intended area only, to avoid light spill and offsite light trespass.
• Light sources must be shielded by physical barriers.
• The use of low-pressure sodium lamps, yellow LED lighting, or an equivalent reduces skyglow and wildlife impacts. Bluish-white lighting is more likely to cause glare and attract insects and is associated with other human physiological issues.
Medium
Product transport Increase in traffic
Safety of other road users, increase in traffic accidents
• All heavy vehicles must be restricted to designated routes and not permitted on other roads.
• As part of the development there will be road geometric improvements made to the road network. These upgrades are focused on improving the safety of the road and will hence have a positive impact on other road users.
Low to Medium
Social aspects Increase in available employment opportunities locally
• Source the maximum number of employees from the local area for temporary job opportunities.
• Implement skills development programmes in the areas where most job opportunities will be created, i.e. operators and drivers.
• Make available bursary opportunities to build skill capital in the region.
• Establish a database of local people with information on qualifications and skills, utilize this database to develop skills plans and recruit local people.
• Implement portable skills development programmes.
• Implementation of programmes to minimize and mitigate the impact of downscaling and retrenchment.
Positive
Social aspects Increase in skills development programmes and therefore skill levels of the local communities
Positive
Social aspects Empowerment of local communities through equity participation
• Development of strict guidelines in terms of representation and utilisation of equity funding.
• Consultation and Feedback on results on a regular basis.
Positive
Social aspects Empowerment of local business through procurement and capacity building
• Establish a database of local businesses, utilize this database to establish partnerships between local and larger service providers as well as locally preferred work packages.
• Consultation and Feedback on results on a regular basis
• Implementation of capacity building programmes to minimize and mitigate the impact of mine downscaling and closure.
Positive
Cultural Heritage Impact on sub-surface heritage resources, including palaeontological heritage
• Development of a Heritage Management Plan, including a Chance Find Protocol for palaeontological heritage.
• Field survey by qualified palaeontologist prior to commencement.
• Monitoring by qualified archaeologist and palaeontologist during construction activities.
Low to Medium

128 | P a g e
Activity Potential Impact Possible Mitigation Measures
Potential for Residual Risk
(Post-Mitigation Significance)
Residual Impacts Impact on ecosystem • Since effective mitigation through avoidance, impact minimisation and rehabilitation is deemed unlikely to adequately limit the impact on the receiving ecology, it is deemed important that an ecological offset initiative be initiated to contribute to the conservation of the area. In particular mention is made of initiatives focused on the purchase of land to create the ecological corridors linking the various areas currently functioning as conservation areas.
Medium to High
Residual Impacts Post-closure land use and land capability
• Define, in consultation with all IAPs, the final (post-closure) land use for the mining area, including mining areas, surface and water management infrastructure, mine residue facilities, etc.
• Develop a final land use plan and implementation programme as part of the closure plan, considering important issues such as ongoing operational and maintenance requirements and long-term responsibilities and ownership.
• Set final closure objectives and standards to ensure conformance to the final land use plan and the requirements of the IAPs and relevant environmental legislation.
• Develop a detailed closure plan five years prior to closure and obtain approval from the relevant authorities.
Medium
Residual Impacts Residual Impacts
• Deterioration of groundwater quality within the back-filled open pits due to acid rock drainage reactions
• Decant into the shallow aquifer or on surface at the lowest surface elevations intersected by the pits
• Deposit mine residue in the open pits as far as possible, thereby controlling the migration of high sulphate leachate.
• The horizons that are potentially acid generating will be placed at the bottom of the pit, where it will be submerged below the water table, preventing oxidation.
• Open pit areas will be rehabilitated and vegetated as soon as possible to reduce the oxidation and the potential generation of acid-mine drainage.
• Dedicated monitoring programme and modeling to quantify and verify post-closure water balance and decant water quality. Ongoing evaluation and reassessment of alternative options for the final water use and required associated water quality, together with the technologies required to achieve the required quality.
• The final land use will also be used to evaluate the post closure water management.
• Active involvement in any regional integrated water management plans developed in the area.
Medium to High
The mitigation measures will be further investigated during the EIA Phase, and a final list of mitigation
measures included in the EIAR/EMPr.

129 | P a g e
10 OTHER INFORMATION REQUIRED BY THE COMPETENT AUTHORITY
10.1 IMPACT ON THE SOCIO-ECONOMIC CONDITIONS OF ANY DIRECTLY AFFECTED PARTY
Refer to Section 8.5.9 of this report.
10.2 IMPACT ON ANY NATIONAL ESTATE
Refer to Section 8.5.10 of this report.
10.3 OTHER MATTERS REQUIRED IN TERMS OF SECTIONS 24(4)(A) AND (B) OF THE ACT
As indicated in Section 8.1 of this report, no alternatives site locations have been considered as mining can
only be undertaken in areas where economically mineable resources occur. The topography and relatively
small size of the property further limit the potential for alternative sites.
Infrastructure to support The Duel Coal Project has been laid out and engineered to best suit the
topography and mining pit layouts, as well as the relatively small footprint of the farm, and is described in
Section 5 of this report.
The only real alternative to the mine is the No-Go Option. The farm has been developed as a game farm.
The land belongs to a private company, is stocked with game and hunting is reserved for invited guests.
Based on the macro-economic analysis of the baseline activities, the total GDP generated by the existing
farm activities is estimated at a total of R2.43 million per annum and the direct at R1.06 per annum. Only
three direct employment opportunities are sustained by the farming activities on The Duel, with a total of
12 if the indirect and induced is added. The total payments to households are R1.03 million with R0.33
million, 32% to the low-income households.
The main consequence of the No-Go Option is the loss of opportunity to develop a high-quality mineral
resource with an estimated LOM of 24 years which has the potential for huge economic benefits on local,
provincial and national level in terms of employment and the contribution to the GDP.
Other socio-economic benefits that will be lost include:
• Skills development opportunities
• Local Economic Development projects (SLP)
• Local procurement and SMME opportunities

130 | P a g e
11 UNDERTAKING
11.1 UNDERTAKING REGARDING CORRECTNESS OF INFORMATION
I, Maria Catharina Eksteen, herewith undertake that the information provided in the foregoing
report is correct and that the comments and inputs from stakeholders and IAPs have been
correctly recorded in the report.
Signature of EAP
Date:
11.2 UNDERTAKING REGARDING LEVEL OF AGREEMENT
I, Maria Catharina Eksteen, herewith undertake that the information provided in the foregoing
report is correct and that the level of agreement with IAPs and stakeholders has been correctly
recorded and reported herein.
Signature of EAP
Date:

131 | P a g e
12 APPENDICES
Appendix 1: Public Participation Report and Records
Appendix 2: Curriculum Vitae of EAP
Appendix 3: Phase 1 Heritage Impact Assessment / Palaeontological Desk-top Study
Appendix 4: Baseline Environmental Report
Appendix 5: Plan of Study: Specialist Studies Methodology (2015)