
Infodemiology and Infoveillance: Scoping Review - Journal of ...
Upload
khangminh22Category
view
7download
0
Bara Consulting (Pty) Ltd.
PO Box 496
Cresta
2118
South Africa
Tel: +27 82 373 0796
Email: [email protected]
Company Registration Number
2013/099536/07
© Copyright Bara Consulting (Pty) Ltd
This document is for the use of Zulu Lithium (Private) Limited only and may not be transmitted to any other party, in whole or in part,
in any form without the written permission of Bara Consulting (Pty) Ltd
ZULU LITHIUM PROJECT
SCOPING STUDY
Report Prepared For:
Zulu Lithium (Private) Limited
Report Date:
13th November 2017
Report Number:
2017 - 136

REPORT DATA SHEET
Report Title:
Zulu Lithium Project – Scoping Study
Report Number:
2017-136
Report Effective Date:
13th November 2017
Client Name:
Zulu Lithium (Private) Limited (Zimbabwe)
Bara Consulting Project Manager:
A D Pooley
Contribution Engineers and Consultants:
N Kingaby E de Villiers P Roux
E J Baldrey A D du Plessis R Way
Contributing Sub-Contracting Companies
Middindi Consulting (Pty) Ltd.
Bara Consulting Report Review Consultant
C W Brown
Version Control
Report Version Version Date Project Manager Report Review
2017-136/00 6th November 2017 A D Pooley Draft
2017-136/01 13th November 2017 A D Pooley C W Brown

TABLE OF CONTENTS
1 EXECUTIVE SUMMARY . .. . . . . . . . . . . . . . . . . . . . . . . . . . . . . . . . . . . . . . . . . . . . . . . . . . . . . . . . . . . . . . . . . . 1
1.1 Project Overview and Financial Results ............................................................ 1
1.2 Summary and Conclusions ................................................................................ 2
1.3 Mineral Resource .............................................................................................. 3
1.4 Mining ............................................................................................................... 4
1.5 Metallurgy ......................................................................................................... 6
1.6 Mine Support Infrastructure ............................................................................. 9
1.7 Labour ............................................................................................................. 10
1.8 Environmental and Social ............................................................................... 10
1.8.1 Social ................................................................................................... 10
1.8.2 Biophysical .......................................................................................... 11
1.9 Lithium Market Survey .................................................................................... 11
1.10 Financial .......................................................................................................... 12
2 INTRODUCTION .. . . . . . . . . . . . . . . . . . . . . . . . . . . . . . . . . . . . . . . . . . . . . . . . . . . . . . . . . . . . . . . . . . . . . . . . . . . 12
2.1 Overview ......................................................................................................... 12
2.2 Project Location and Access ........................................................................... 13
2.3 Climate and Topography ................................................................................. 13
2.4 Scope of Work ................................................................................................. 15
2.5 Site Visit .......................................................................................................... 16
3 GEOLOGY AND RESOURCES . .. . . . . . . . . . . . . . . . . . . . . . . . . . . . . . . . . . . . . . . . . . . . . . . . . . . . . . . . . 16
3.1 Geological Overview ....................................................................................... 16
3.1.1 History of the Site ............................................................................... 17
3.1.2 Zulu Lithium Claims ............................................................................. 17
3.1.3 Exploration History ............................................................................. 23
3.1.4 Geological Setting and Mineralisation ................................................ 23
3.2 Mineral Resources .......................................................................................... 27
4 GEOTECHNICAL ASSESSMENT . .. . . . . . . . . . . . . . . . . . . . . . . . . . . . . . . . . . . . . . . . . . . . . . . . . . . . . . 28
4.1 Visual Inspections at Site ................................................................................ 28
4.2 Geotechnical Logging ...................................................................................... 29
4.2.1 Material Thickness .............................................................................. 30
4.2.2 Rock Quality Designation (RQD) ......................................................... 31
4.2.3 Mining Rock Mass Rating (MRMR) ..................................................... 33
4.3 Slope Engineering ........................................................................................... 42
4.3.1 Bench height ....................................................................................... 42
4.3.2 Bench Width ....................................................................................... 42

4.3.3 Overall Slope Angle ............................................................................. 42
4.3.4 Slope Configuration ............................................................................ 43
4.3.5 Slope Configuration with Geotechnical Berm .................................... 44
5 MINING .. . . . . . . . . . . . . . . . . . . . . . . . . . . . . . . . . . . . . . . . . . . . . . . . . . . . . . . . . . . . . . . . . . . . . . . . . . . . . . . . . . . . . 45
5.1 Resources Available for Mining and Production Rate Selection..................... 46
5.2 Pit Optimisation Study .................................................................................... 47
5.3 Open Pit Mining and Production Schedules ................................................... 54
5.4 Mining Equipment .......................................................................................... 56
5.5 Technical Services ........................................................................................... 56
6 MINERAL PROCESSING . .. . . . . . . . . . . . . . . . . . . . . . . . . . . . . . . . . . . . . . . . . . . . . . . . . . . . . . . . . . . . . . . . 57
6.1 Summary of Metallurgical Testwork ............................................................... 57
6.1.1 Testwork Performed and Results Achieved ........................................ 58
6.1.2 Analyses of Flotation Concentrates Produced .................................... 65
6.1.3 Selection of Process Route ................................................................. 66
6.1.4 Description of Process Route .............................................................. 67
6.1.5 Mass and Metal Balance of the Selected Process Route and
Projected Plant Recovery .................................................................... 72
6.1.6 Production of Feldspar, Quartz and Mica By-Products ...................... 77
6.1.7 Tailings Dam ........................................................................................ 78
6.2 Lithium Carbonate Production ....................................................................... 79
7 MINE SUPPORT INFRASTRUCTURE .. . . . . . . . . . . . . . . . . . . . . . . . . . . . . . . . . . . . . . . . . . . . . . . . . 82
7.1 Mine Support Infrastructure ........................................................................... 82
7.1.1 Roads .................................................................................................. 86
7.1.2 Water supply ....................................................................................... 86
7.1.3 Workshops .......................................................................................... 86
7.1.4 Offices ................................................................................................. 87
7.1.5 Change House Facilities ...................................................................... 87
7.1.6 Store and Store yard ........................................................................... 87
7.1.7 Sewage Treatment Plant and Reticulation ......................................... 87
7.1.8 Diesel Fuel Dispensing Bay.................................................................. 88
7.1.9 Explosives Magazine ........................................................................... 88
7.1.10 Accommodation Camp ..................................................................... 88
7.2 Sources of Water ............................................................................................ 88
7.3 Mine Water Circuit ......................................................................................... 89
7.4 Mine Water Balance ....................................................................................... 90
7.5 Water Supply Infrastructure ........................................................................... 92
7.6 Bulk Power Supply .......................................................................................... 93

7.7 Power Consumption ....................................................................................... 94
7.8 MV Reticulation .............................................................................................. 94
7.9 Communication and Controls ......................................................................... 96
8 LABOUR .. . . . . . . . . . . . . . . . . . . . . . . . . . . . . . . . . . . . . . . . . . . . . . . . . . . . . . . . . . . . . . . . . . . . . . . . . . . . . . . . . . . . . 96
8.1 Shift Cycle ....................................................................................................... 96
8.2 Labour Requirements ..................................................................................... 96
8.3 Sources of Labour ......................................................................................... 101
8.4 Cost of Labour ............................................................................................... 101
9 ENVIRONMENTAL AND SOCIAL STUDIES .. . . . . . . . . . . . . . . . . . . . . . . . . . . . . . . . . . . . . . . 101
9.1 Existing Biophysical Impacts ......................................................................... 102
9.1.1 Ground water .................................................................................... 102
9.1.2 Surface water .................................................................................... 102
9.1.3 Air quality .......................................................................................... 103
9.1.4 Biodiversity ....................................................................................... 103
9.1.5 Potential for social cumulative impacts ............................................ 103
9.2 Regulatory Setting ........................................................................................ 104
9.2.1 Legislation ......................................................................................... 104
9.2.2 Equator Principles ............................................................................. 105
9.2.3 Standards and Requirements ........................................................... 106
9.3 Description of the Biophysical Environment Likely to be Impacted by the
Mining Operations ....................................................................................... 106
9.3.1 Topography ....................................................................................... 106
9.3.2 Soil, Land Use and Capability ............................................................ 107
9.3.3 Biodiversity (Fauna and Flora) .......................................................... 108
9.3.4 Surface Water ................................................................................... 110
9.3.5 Groundwater..................................................................................... 113
9.3.6 Air Quality ......................................................................................... 114
9.3.7 Noise ................................................................................................. 116
9.3.8 Sensitive Landscapes ........................................................................ 116
9.4 Description of the Social Environment Likely to be Impacted by the
Mining Operations ....................................................................................... 117
9.4.1 Introduction ...................................................................................... 117
9.4.2 Methodology .................................................................................... 119
9.5 Conclusion and Recommendations .............................................................. 120
9.5.1 Social ................................................................................................. 120
9.5.2 Biophysical ........................................................................................ 120
9.5.3 Recommendation ............................................................................. 121

10 LITHIUM MARKET SURVEY . .. . . . . . . . . . . . . . . . . . . . . . . . . . . . . . . . . . . . . . . . . . . . . . . . . . . . . . . . . 122
10.1 Market Overview .......................................................................................... 122
10.2 Background Information ............................................................................... 124
10.2.1 Hard Rock ........................................................................................ 124
10.2.2 Brines .............................................................................................. 125
10.3 Global Supply and Demand........................................................................... 125
10.3.1 World Mine Production and Reserves ............................................ 125
10.4 African Lithium Projects ................................................................................ 127
10.4.1 Bikita Lithium Mine – Bikita Minerals ............................................. 127
10.4.2 Project Zulu – Premier African Minerals ......................................... 128
10.4.3 Arcadia Lithium Project – Prospect Resources ............................... 128
10.4.4 Botswana Lithium Brine Project – Lithium Consolidated Mineral
Exploration (LCME) ......................................................................... 128
10.4.5 Goulamina Lithium Project – Birimian ............................................ 128
10.4.6 Bougoni Lithium Project – Kodal Minerals ..................................... 129
10.4.7 Karibib Lithium Project – Auroch Minerals ..................................... 129
10.5 Lithium Market Conclusions ......................................................................... 129
11 F INANCIAL EVALUATION . . . . . . . . . . . . . . . . . . . . . . . . . . . . . . . . . . . . . . . . . . . . . . . . . . . . . . . . . . . . . 129
11.1 Basis of Evaluation ........................................................................................ 129
11.1.1 Base date of costing and terms ...................................................... 129
11.1.2 Estimating methodology ................................................................. 129
11.1.3 Estimate exclusions......................................................................... 130
11.2 Capital Cost ................................................................................................... 130
11.2.1 Definition of capital cost ................................................................. 130
11.2.2 Presentation of capital cost ............................................................ 130
11.3 Operating Cost .............................................................................................. 133
11.3.1 Definition of operating cost ............................................................ 133
11.3.2 Presentation of operating cost ....................................................... 133
11.4 Financial Analysis .......................................................................................... 135
11.4.1 Revenue .......................................................................................... 135
11.4.2 Royalty ............................................................................................ 136
11.4.3 Tax ................................................................................................... 137
11.4.4 Discounted cash flow analysis ........................................................ 137
11.4.1 Sensitivity analysis .......................................................................... 138
11.4.1 Lithium Carbonate Option .............................................................. 142
12 CONCLUSIONS AND RECOMMENDATIONS .. . . . . . . . . . . . . . . . . . . . . . . . . . . . . . . . . . . . 143
13 REFERENCES . .. . . . . . . . . . . . . . . . . . . . . . . . . . . . . . . . . . . . . . . . . . . . . . . . . . . . . . . . . . . . . . . . . . . . . . . . . . . . 144

LIST OF TABLES
Table 1-1 – Financial Analysis Results ........................................................................................ 1
Table 1-2 – Financial Analysis Results ........................................................................................ 2
Table 1-3 – Zulu Lithium Grade Tonnage Data ........................................................................... 4
Table 1-4 – Overall Slope Angle Summary, Zulu Project ............................................................ 5
Table 1-5 – Project Zulu LoM Production Schedule ................................................................... 6
Table 1-6 – Total Labour Complement ..................................................................................... 10
Table 1-7 – Summary of Capital Cost Concentrate Option ...................................................... 12
Table 1-8 – Summary of Operating Cost Concentrate Option ................................................. 12
Table 3-1 – List of Project Zulu Claim Blocks ............................................................................ 18
Table 3-2 – Zulu Lithium Grade Tonnage Data ......................................................................... 27
Table 4-1 – Geotechnical Boreholes Logged and Total Meterage ........................................... 29
Table 4-2 – Material Thickness per Borehole per Rock Type ................................................... 30
Table 4-3 – Average Domain Thickness for all Boreholes Logged ............................................ 31
Table 4-4 – RQD Classification for Rock Mass Quality .............................................................. 31
Table 4-5 – Determination of Rock Block Strength Ratings ..................................................... 35
Table 4-6 – Joint Condition Adjustments for One Joint Set...................................................... 36
Table 4-7 – Adjusted Joint Condition Ratings ........................................................................... 37
Table 4-8 – Joint Spacing Ratings ............................................................................................. 39
Table 4-9 – Derived In-Situ Rock Mass Rating Per Rock Type .................................................. 39
Table 4-10 – Adjustment Factors for Effects of Weathering .................................................... 40
Table 4-11 – Adjustment Factors for Effects of Blasting .......................................................... 40
Table 4-12 – Adjustment Factors for Water Condition ............................................................ 41
Table 4-13 – Adjustment Factors for Effects of Joint Orientation ............................................ 41
Table 4-14 – Calculated MRMR Values Per Rock Type ............................................................. 42
Table 4-15 – Derived Overall Slope Angles Related to Slope Height ........................................ 43
Table 4-16 – Overall Slope Angle Summary, Zulu Project ........................................................ 45
Table 5-1 – Zulu Project Paylimit Grade Calculation ................................................................ 46
Table 5-2 – Techno-Economic Dataset Used for Pit Optimisation Study ................................. 48
Table 5-3 – Optimisation Results Based on Techno-Economic Dataset Selected .................... 49
Table 5-4 – Project Zulu LoM Production Schedule ................................................................. 55
Table 5-5 – Zulu Project Fleet Requirements ........................................................................... 56
Table 6-1 – Chemical Analyses of the Three Ore Samples ....................................................... 59
Table 6-2 – Size Distribution of Head Sample .......................................................................... 60
Table 6-3 – Results of Sorting Tests .......................................................................................... 60

Table 6-4 – Flotation Results on Spodumene Sample Test F4 ................................................. 61
Table 6-5 – Petalite Flotation – Results of Test F15 ................................................................. 62
Table 6-6 – Results of Magnetic Separation Test ..................................................................... 63
Table 6-7 – Screening Results Prior to HLS ............................................................................... 64
Table 6-8 – Results of Heavy Liquid Separation Test – Lithium and Mineralogical Analyses ... 64
Table 6-9 – Results of Heavy Liquid Separation Test – Lithium And Mineralogical Analyses .. 65
Table 6-10 – Chemical Analyses of Flotation Concentrates ..................................................... 65
Table 6-11 – Mass and Lithium Metal Balance ......................................................................... 74
Table 6-12 – Tonnages and Analyses of Potential By-Products ............................................... 77
Table 6-13 – Tailings Storage Facility Design Parameters ........................................................ 78
Table 7-1 – Surface Infrastructure Legend ............................................................................... 85
Table 7-2 – Zulu Project Electrical Loads .................................................................................. 94
Table 8-1 – Total Labour Complement ..................................................................................... 96
Table 8-2 – Mine Management and Administration Labour Complement .............................. 97
Table 8-3 – Mine Operations Labour Complement .................................................................. 98
Table 8-4 – Technical Services Labour Complement ................................................................ 99
Table 8-5 – Processing Plant Labour Complement ................................................................... 99
Table 8-6 – Operational Support Labour Complement .......................................................... 100
Table 8-7 – Owner Labour Complement Pay Scales ............................................................... 101
Table 10-1 - Lithium World Mine Production and Reserves .................................................. 126
Table 10-2 - Lithium World Resources ................................................................................... 127
Table 11-1 - Summary of Capital Cost .................................................................................... 130
Table 11-2 - Summary of Surface Infrastructure Capital Cost ................................................ 131
Table 11-3 - Summary of Processing Plant Capital Cost ......................................................... 132
Table 11-4 - Summary of Operating Cost ............................................................................... 133
Table 11-5 - Summary of Processing Operating Cost ............................................................. 135
Table 11-6 - Average Concentrate Grade and Production Rates ........................................... 136
Table 11-7 - Concentrate Sales Pricing and Revenue ............................................................. 136
Table 11-8 - Royalty Costs ...................................................................................................... 136
Table 11-9 - Financial Analysis Results ................................................................................... 137
Table 11-10 - Sensitivity of Post-Tax NPV(10) with variance in Capex, Opex and Revenue .. 139
Table 11-11 - Sensitivity of Post-Tax IRR with variance in Capex, Opex and Revenue ........... 140
Table 11-12 - Sensitivity of Payback Period with variance in Capex, Opex and Revenue ...... 141
Table 11-13 – Petalite and Spodumene Pricing Sensitivity .................................................... 142
Table 11-14 - Financial Analysis Results ................................................................................. 143

LIST OF FIGURES
Figure 1.1 – Crushing and Dense Medium Separation Flowsheet ............................................. 8
Figure 1.2 – Milling and Flotation Flowsheet ............................................................................. 8
Figure 2.1 – Project Location in Zimbabwe .............................................................................. 14
Figure 2.2 – Regional Project Location Relative to Populous Areas ......................................... 14
Figure 2.3 – Road Access to the Zulu Lithium Project Site from Bulawayo .............................. 15
Figure 3.1 – Plan of Project Zulu Claim Blocks .......................................................................... 22
Figure 3.2 – Surface Geological Plan Showing Claim Blocks ..................................................... 24
Figure 3.3 – Zulu Lithium Grade Tonnage Curve ...................................................................... 28
Figure 4.1 – Joint orientations from outcrops and exposed sections, Zulu Project Site .......... 29
Figure 4.2 – Good Quality Core with High RQD Classification .................................................. 31
Figure 4.3 – Poor Quality Core with Low RQD Classification .................................................... 32
Figure 4.4 – RQD Classification with Depth .............................................................................. 32
Figure 4.5 – Procedure for evaluating IRMR and MRMR ......................................................... 33
Figure 4.6 – Rating Values for Rock Block Strength .................................................................. 34
Figure 4.7 – Estimation of Equivalent Rating for Joint Condition ............................................. 37
Figure 4.8 – Joint Spacing Distribution for Gneiss and Schist ................................................... 38
Figure 4.9 – Joint Spacing Distribution for Serpentinite And Pegmatite .................................. 38
Figure 4.10 – Rating for Open Joint Spacing ............................................................................. 39
Figure 4.11 – Hainnes and Terbrugge Empirical Chart for Slope Angle Determination ........... 43
Figure 4.12 – Slope Configurations for 115m and 95m Deep Pits ............................................ 44
Figure 4.13 – Slope Configurations for 75m and 60m Deep Pits .............................................. 44
Figure 4.14 – Slope Configurations Incorporating Geotechnical Berms in Slope ..................... 45
Figure 5.1 – Graph Showing Pit Shells Generated, Ore and Waste Tonnes and NPV@10% .... 50
Figure 5.2 – Plan of Pit Shell 35 Showing South and North Pits ............................................... 51
Figure 5.3 – Cross-section of South Pit ..................................................................................... 52
Figure 5.4 – Long-section of South Pit ...................................................................................... 52
Figure 5.5 – Cross-section of North Pit ..................................................................................... 53
Figure 5.6 – Long Section of North Pit ...................................................................................... 53
Figure 5.7 – Graphical Representation of Zulu Project LoM Production Profile ...................... 55
Figure 6.1 - Crushing and Dense Medium Separation Flowsheet ............................................ 70
Figure 6.2 - Milling and Flotation Flowsheet ............................................................................ 71
Figure 6.3 - Lithium Carbonate Plant Flowsheet ...................................................................... 81
Figure 7.1 – View of the Overall Site Layout ............................................................................ 83
Figure 7.2 – Surface Infrastructure Layout ............................................................................... 84

Figure 7.3 Proposed Water Source and Pipeline Route or Project Zulu .................................. 89
Figure 7.4 Proposed Mine Water Circuit .................................................................................. 89
Figure 7.5 Bulawayo Climate Data ............................................................................................ 90
Figure 7.6 Upper Insiza Reservoir Make-up Water Requirement ............................................ 91
Figure 7.7 TSF Evaporative Losses by Month ........................................................................... 92
Figure 7.8 TSF Water Storage by Month .................................................................................. 92
Figure 7.9 – Operating and Design Pressures for Bulk Water Supply Pipeline ......................... 93
Figure 7.10 – Zulu Mine MV Single Line Diagram ..................................................................... 95
Figure 9.1 – Surface Water Stream ........................................................................................ 102
Figure 9.2 – Project Area ........................................................................................................ 103
Figure 9.3 – Topography of Zimbabwe ................................................................................... 107
Figure 9.4 – Surface Water Stream ........................................................................................ 110
Figure 9.5 – Position of Stream Diversion .............................................................................. 112
Figure 9.6 – Community Borehole .......................................................................................... 114
Figure 10.1 - Lithium Concentrate Price Forecast .................................................................. 123
Figure 10.2 - Lithium Carbonate Price Forecast ..................................................................... 124
Figure 11.1 Summary of Operating Cost ............................................................................... 134
Figure 11.2 - Project Cash Flow .............................................................................................. 138
Figure 11.3 - Post Tax NPV(10) Sensitivity .............................................................................. 139
Figure 11.4 - Post Tax IRR Sensitivity ...................................................................................... 140
Figure 11.5 - Payback Period Sensitivity ................................................................................. 141
LIST OF APPENDECES
Appendix A: Site Visit Report
Appendix 2: Geological Overview
Appendix 3: Financial Model Summary

GLOSSARY OF TECHNICAL TERMS AND ABBREVIATIONS
Technical Terms
Airborne magnetic surveys Surveys flown by helicopter or fixed wing aircraft to measure the magnetic
susceptibility of rocks at or near the earth’s surface
Alkaline rocks Rocks containing an excess of sodium and/or potassium
Amphibolite A metamorphic rock comprised mainly of amphibole
amsl Elevation above mean sea level
Apatite A mineral Ca5(F,Cl)(PO4)3 found in igneous rocks which is a source of
phosphate and locally contains significant amounts of rare earth elements
Archean The third oldest of four geological eons in the history of the earth. It extends
from 2,500 million years back to approximately 3,800 million years
Baryte A mineral consisting of barium sulphate BaSO4
Basement The igneous and metamorphic crust of the earth, underlying sedimentary
deposits
Brecciated A body of rock that has been intensely fractured
Calcite A mineral consisting of calcium carbonate CaCO3
Carbonate A rock, usually of sedimentary origin, composed primarily of calcium,
magnesium or iron and CO3 or a mineral characterized by presence of the
carbonate ion (CO32-)
Carbonatite An igneous intrusive or extrusive rock that consists of more than 50%
carbonate minerals. Calcitic carbonatite is dominantly calcium carbonate,
dolomitic carbonatite is dominantly magnesium carbonate, ankeritic
carbonatite is dominantly iron carbonate
Channel sample A sample taken by cutting a shallow “channel’ across an outcrop surface
permitting a continuous sampling of the outcrop and providing assay results
that are representative of a specified width across the outcrop
Craton Large, ancient mass of the earth’s crust comprised of various crustal blocks
amalgamated by tectonic processes
Diamond Drilling Method of obtaining a cylindrical core of rock by drilling with a diamond
impregnated bit
Dolomite A carbonate mineral composed of calcium and magnesium carbonate,
CaMg(CO3)2; a rock predominantly comprised of this mineral is also referred to
as dolomite or dolostone
Dyke A tabular body of intrusive igneous rock, crosscutting the host strata at an
oblique angle
Eluvial geological deposits and soils that are derived by in situ weathering or
weathering plus gravitational movement
Fabric The orientation in space of the elements of which a rock is composed
Fault A fracture or fracture zone in the earth’s crust, along which displacement of
opposing sides has occurred
Fold A planar sequence of rocks or a feature bent about an axis
Ga Billion years
Gneiss A type of rock formed by high-grade regional metamorphic processes from

pre-existing formations that were originally either igneous or sedimentary
rocks. It is often foliated (composed of layers of sheet-like planar structures).
The foliations are characterized by alternating darker and lighter coloured
bands, called "gneissic banding".
GPS (global positioning system) A satellite-based navigation system that provides reliable location information
anywhere on Earth when there is an unobstructed line of sight to four or more
GPS satellites
Gneiss A foliated metamorphic rock that has a banded appearance
Grab samples Rock samples taken from outcrop in non-systematic manner
Hydrothermal Processes that involve heated water
Lepidolite A lithium mineral, (KLi2Al(Si4O10)(F,OH)2), pink to lavender coloured and often
very fine grained
Lithogeochemical Study involving the chemical composition of rocks
LOI Loss on ignition. The amount of volatile substances that are driven out of a
sample by heating, reported as part of an elemental or oxide analyses of a
rock or mineral
Ma Million years
Magnetometer An instrument for measuring the intensity of the earth’s magnetic field
Magnetic susceptibility The degree of magnetization of a material in response to an applied magnetic
field
Mafic Pertaining to or composed dominantly of magnesium and iron rock-forming
silicates. Typically synonymous with “dark minerals”
Metamorphism Changes to rocks and minerals generally as a result of changes in pressure
and/or temperature
Metasomatic A metamorphic change in the rock which involves the introduction of material
from another source
Pegmatite Extremely coarse-grained igneous rock formed mainly of feldspars and quartz
together with micas and other minerals. It has zonal structure.
Pentalite A lithium mineral, (LiAl(Si4O10)), occurring as snow white crystals up to 8 cm in
length.
Porphyritic Igneous rock containing larger crystals of one or more minerals in a
dominantly fine grained groundmass
Precambrian Informal name for the geological time periods that predate the Paleozoic
(older than ca. 545 million years)
Shear zone A tabular to sheet-like, planar or curvi-planar zone composed of rocks that are
more highly strained than rocks adjacent to the zone, typically zones of much
more intense foliation, deformation, and folding
Scheelite A calcium tungstate mineral with the chemical formula CaWO4.
Schist A crystalline metamorphic rock having a foliated or parallel fabric resulting
from the alignment of platy (micaceous) minerals
Serpentanite A rock composed of one or more serpentine group minerals, the name
originating from the similarity of the texture of the rock to that of the skin of a
snake. Minerals in this group are formed by serpentinization, a hydration and

metamorphic transformation of ultramafic rock from the Earth's mantle.
Sill A tabular intrusion that is parallel to the layering in the host rocks
Spodumene A lithium mineral, (LiAlSi2O6), this mineral forms white to pink coloured
subhedral crystals.
Supergene Process involving circulation of surface waters throughout an orebody, which
can result in remobilization and enrichment of metals and minerals
Strike Horizontal direction or trend of a geological structure, defined as the
intersection of a horizontal plane with the plane of the structure
Tantalite The mineral group tantalite [(Fe, Mn)Ta2O6] is the primary source of the
chemical element tantalum.
Tectonic Pertaining to the forces involved in, or the resulting structures of, movement
in the earth’s crust.
Trenching The process of digging shallow linear pits in the shallow overburden to provide
access to a more or less continuous section of bedrock
Abbreviations
a.m.s.l Above Mean Sea Level
Al2O3 Aluminium Trioxide
ANZAPLAN German based Dorfner Analysenzentrum und Anlagenplanungsgesellschaft
mbH (ANZAPLAN), a leading independent authority on lithium ores.
CaO Calcium Oxide
CaWO4 Scheelite - A calcium tungstate mineral
CIF Cost, insurance and freight (CIF) - A trade term requiring the seller to
arrange for the carriage of goods by sea to a port of destination
cm Centimetres
CO Carbon Dioxide
conc Concentrate
Cs Caesium
Cs2O Caesium Oxide
DCF Discount Cash Flow
DM Diesel Matter
DMS Dense Medium Separation
DRC Democratic Republic of Congo
ECSA Engineering Council of South Africa
EIA Environmental Impact Assessment
EMA Environmental Management Act
EP Equator Principles
EPLs Exploration and Prospecting License
ESIA Environmental and Social Impact Assessment
EV Electric Vehicle
Fe2O3 Iron (III) oxide
FEL Front End Loader

FSAIMM Fellow - Southern African Institute of Mining and Metallurgy
GECC Government Engineering Certificate of Competance
H.P High Pressure
HLS Heavy Liquid Separation
HOD Head of Department
HR Human Resources
IBP International Best Practice
ID Identification
IP Internet Protocol
IRMR In-situ Rock Mass Rating
IRR Internal Rate of Return
IRS Intact Rock Strength
ISO International Organization for Standardization
IT Information Technology
JORC Joint Ore Reserves Committee
K2O Potassium Oxide
KCl Potassium Chloride
kVA Unit of Apparent Power. kilo-Volt-Ampere
kW Unit of Power. kilo Watts
kWh Unit of Energy. Kilo Watt Hour
L/min Unit of Flow Rate. Litres per Minute
LCE Lithium Carbonate Equivalent
LCT Lithium-Caesium-Tantalum Pegmatites
LDV Light Duty Vehicle
Li Lithium
Li20 Lithium Oxide
Li2CO3 Lithium Carbonate
LOI Loss on Ignition
LoM Life of Mine
MgO Magnesium Oxide
MMA Mines and Minerals Act
MnO Manganese Oxide
MnO2 Manganese Dioxide
MPa Unit of Pressure. Mega Pascal
MRMR Mining Rock Mass Rating
MSU Mini-Substation Unit
Mt Unit of Mass, Million Tonnes
MV Medium Voltage
MVA Unit of Apparent Power. Mega-Volt-Ampere
Na Sodium
Na2O Sodium Oxide
NaCl Sodium Chloride
NGO Non-Governmental Organisation

NO2 Nitrogen Dioxide
NOx Oxides of Nitrogen (NO and NO2 are collectively known as NOx);
NPV Net Present Value
NPV10 Net Present Value, 10 per cent Discount Rate
p.a Per Annum
P2O5 Phosphorus Pentoxide
PM Project Manager
PVC Poly Vinyl Chloride
Rb2O Rubidium oxide
RoM Run of Mine
RQD Rock Quality Designation
RST Rhodesian Selection Trust Co. Ltd
SA South African
SAIEE The South African Institute Of Electrical Engineers
SAIMM The Southern African Institute of Mining and Metallurgy
SAMREC THE South African Code for the Reporting of Exploration Results, Mineral
Resources and Mineral Reserves
SANIRE South African National Institute of Rock Engineering.
SEM-EDS Scanning Electron Microscopy / Energy Dispersive X-Ray Spectroscopy
SF Safety Factor
SG Specific Gravity
SIA Social Impact Assessment
SiO2 Silicon Dioxide
SiO4 Silicate
SLD Single Line Diagram
SME Society for Mining, Metallurgy, and Exploration (SME)
SO2 Sulphur Dioxide
SOP Standard Operating Procedure
t/m3 Unit of Density, tonnes per cubic metre
Ta2O5 Tantalum pentoxide
TiO2 Titanium Dioxide
TSF Tailings Storage Facility
TSP Total Suspended Particulates
UCS Unconfined Compressive Strength
UHF/VHF Ultra-High Frequency, Very-High Frequency
UK United Kingdom
US United States of America
USD United States Dollars
UTM Universal Transverse Mercator Coordinate System
UV Utility Vehicle
ZETDC Zimbabwe Electricity Transmission and Distribution Company
ZINWA The Zimbabwe National Water Authority

2017-136 1 of 145
November 2017
1 EXECUTIVE SUMMARY
1.1 Project Overv iew and Financial Results Zulu Lithium (Private) Limited, a subsidiary of Premier African Minerals, holds various
prospecting licenses for lithium in the Matebeleland South Province of Zimbabwe
collectively known as the Zulu Lithium Project.
The company has been undertaking exploration activities on these licenses and based on
the data obtained from this drilling program has estimated a maiden mineral resource.
Zulu Lithium now wish to determine if the identified deposit has economic potential by
undertaking a scoping study considering all technical and economic aspects of the project.
Zulu Lithium have approached Bara Consulting to assist with the undertaking of this scoping
study.
In undertaking the scoping study, Bara considered all technical and economic aspects of the
project to enable a maiden project evaluation to be undertaken. The mining schedules,
process recoveries, proposed sales prices and the costs generated were input into a
financial evaluation for the project. Two evaluations were undertaken a lithium
concentrate (spodumene and petalite concentrates) sales option and a lithium carbonate
sales option. The results of these evaluations are shown below in Table 1.1 and Table 1.2.
Table 1-1 – Financial Analysis Results (Concentrate Sales Option)
Metric Value Unit Average Concentrate Sales Price 688.12 USD / t
Pre-Tax NPV10 127.32 USD' million Pre-Tax IRR 85.90 %
Post-Tax NPV10 91.53 USD’ million
Post-Tax IRR 65.00 %
Payback Period 2 years
Peak Funding Requirement - 38. 42 USD’ million
Operating Margin 27.70 %

2017-136 2 of 145
November 2017
Table 1-2 – Financial Analysis Results (Lithium Carbonate Option)
Metric Value Unit Li2CO3 Sales Price 15 000 USD / t Pre-Tax NPV10 718.94 USD million Pre-Tax IRR 80.40 % Post-Tax NPV10 524.42 USD million Post-Tax IRR 63.30 % Payback Period 2 years Peak Funding Requirement - 177.85 USD million Operating Margin 60.60 %
1.2 Summary and Conclusions The results of the scoping study shown that the Zulu Lithium Project has economic potential
and that it is worthy of further evaluation. Based on the scope of work undertaken, no
material technical risks or fatal flaws have been identified to date.
It is proposed that the following next steps be taken to further understand the project and
to reduce the risk profile:
o Undertake additional exploration drilling to increase level of confidence in the mineral
resource and to identify additional resources.
o Undertake additional metallurgical test work in parallel with exploration drilling work to
save time and cost during later study work as follows:
Conduct testwork using the process route selected, i.e. DMS followed by flotation
on the spodumene and mixed fractions resulting from the DMS separation. It will
also need to be established whether mica flotation is required prior to each
spodumene flotation step as a micaceous fraction was removed by DMS.
Conduct locked cycle test work for spodumene and petalite flotation to confirm
overall flotation recoveries and the influence on concentrate grade and recovery
when recirculating cleaner tailings.
Determine whether saleable mica and feldspar products can be produced from the
tailings streams from DMS and flotation.
Investigate whether the tailings dam return water can be re-used in the plant or
whether it will need to be treated prior to discharge to the environment. With the
wide variety of chemicals being added to the spodumene and petalite flotation
circuits, it may not be possible to re-use the tailings return water in either circuit.

2017-136 3 of 145
November 2017
o Undertake a more detailed geotechnical evaluation to include a geotechnical drilling
program at the pits identified and laboratory test work on cores recovered. Currently
scoping level work has been undertaken, further work will involve drilling cores for
laboratory test work (UCS, etc) and more detailed analysis focused on the areas where
mining will take place. It is recommended that this program run in parallel to the
exploration program to save costs and time in future study work.
o Undertake ground water study work to determine the quantity and quality of
groundwater in the area, this will be an important input into future study work.
o Once the mineral resource has been upgraded, initiate work on a feasibility study.
1.3 Miner al Resource The hard rock deposits found at Zulu can be classified as lithium pegmatites and subdivided
into the sub-types petalite pegmatite and spodumene (lepidolite) pegmatite. Certain,
higher differentiated pegmatites amongst them seem to have characteristics of LCT
pegmatites (lithium-caesium-tantalum). To date, five different lithium minerals have been
identified at the Zulu site as follows:
o Petalite (LiAl(Si4O10)), as snow white crystals up to 8 cm in length.
o Spodumene (LiAlSi2O6), at surface it is strongly weathered, in fresh samples from drill
cores or the exploration adit, this mineral forms white to pink coloured subhedral
crystals.
o Lepidolite (KLi2Al(Si4O10)(F,OH)2), pink to lavender coloured and often very fine grained.
o Eucryptite (LiAlSiO4) has been observed only once as white grains to 2 cm replacing
petalite.
o Holmquistite (Li2Mg3Al2)Si8O22(OH)2) a brownish to purple coloured lithium amphibole is
frequently found in wall rocks of lithium pegmatites; it’s formation is the result of
intense lithium metasomatism.
The primary minerals of interest are Petalite and Spodumene.
An electronic mineral resource model was provided by Zulu Lithium in Datamine® format,
the model file name is ‘zulu-resmod-sep17.dm’. This model was imported into the Deswik®
suite of mine design software and queried to determine the quantum and grade of the
resource. Table 1.3 below shows the tonnage and grade data of the deposit at various cut
off grades obtained from the geological model provided. All resources are currently at
inferred levels of confidence from a code compliance perspective.

2017-136 4 of 145
November 2017
The grade and tonnage model used in this study differs from the initial Maiden SAMREC
Compliant Inferred Mineral Resource Estimate of 20.1 million tonnes @ 1.06 % Li2O and 51
ppm Ta2O5 using a cut-off grade of 0.5% Li2O. Since this first resource estimate the
geological model has been changed as at least six new zones of lithium mineralisation have
been discovered. A part of the Main Zone is now attributed to the so-called New Zone.
Drilling in the New Zone is ongoing and will result in a massive increased overall tonnage.
Table 1-3 – Zulu Lithium Grade Tonnage Data
Cut Off Grade
(% Li20)
Deposit Tonnage
(t)
Average Grade
(% Li20)
0.0 50,430,222 0.38
0.1 27,462,033 0.67
0.2 23,374,436 0.76
0.3 20,191,534 0.84
0.4 17,584,924 0.94
0.5 15,189,479 1.01
0.6 12,794,706 1.09
0.7 10,632,280 1.18
0.8 9,337,615 1.23
0.9 8,122,527 1.29
1.4 Mining The deposit at the Zulu Project is massive, surface outcropping, steeply dipping to the east
with thicknesses ranging from approximately 5m to 30m. As such the only realistic method
of mining this deposit will be by open cast methods, no underground mining is considered
in this study.
A geotechnical assessment has been carried out which included use of public domain
information as well as logging of core at the project site. The resultant pit slope angle
proposed for this study are summarised in Table 1.4 below.

2017-136 5 of 145
November 2017
Table 1-4 – Overall Slope Angle Summary, Zulu Project
Slope height (m)
Average MRMR
Overall slope angle (°)
Without geotechnical berm
With geotechnical berm
55 59 58 - 75 59 57 - 95 59 55 53
115 59 53 52
A pit optimisation exercise was undertaken to determine the extent of open pit mining
possible, the Whittle® optimisation software was used with the mineral resource model
and a preliminary techno-economic dataset.
The results of the optimisation process show that Pit Shell 35 (of 84 pit shells generated)
has the highest NPV and was therefore selected for use in the generation of mining
schedules. Pit Shell 35 has the following attributes:
o Ore tonnes 13,749,000 t
o Average RoM grade: 0.90% Li2O
o Waste tonnes: 76,362,000 t
o Strip Ratio: 5.5 t waste to 1 t ore
o Pit Depth: 200m
o Pit Width: 350m
o Pit length: 650m
Mining will be by standard drill, blast, truck and shovel methods. Ore and waste will be
drilled and blasted in 10m benches. After blasting, the broken rock will be loaded into a
haul truck for transport to the plant ore stockpile of an appropriate waste dump area. The
plant will be situated to the south of the mining area while the waste dump areas will be
situated to the west of the pits.
Mining is planned to start in the shallow high grade areas of the deposit and will
preferentially mine high grade portions of the resource as it becomes available with the
deepening of the pits. Production rates are planned to be 1 million tpa of ore plus
associated waste. The average LoM strip ratio is 5.5 tonnes of waste per tonne of ore
although this varies significantly during the mine life. Modifying factors have been applied
to the mineral resource to emulate practical mining conditions and estimate the mining

2017-136 6 of 145
November 2017
inventory that will be delivered to the plant (run of mine or ROM production). Modifying
factors that have been applied are:
o Ore recovery of 95%.
o Dilution of 5%
The production schedule is shown in the Table 1.5 below.
Table 1-5 – Project Zulu LoM Production Schedule
Year Ore
Tonnes
Waste
Tonnes
Total Tonnes
Mined
Strip
Ratio
Li2O RoM
Grade
1 692,946 2,307,054 3,000,000 3.33 1.39%
2 1,000,000 3,328,669 4,328,669 3.33 1.26%
3 1,000,000 3,998,038 4,998,038 4.00 1.04%
4 1,000,000 4,570,436 5,570,436 4.57 1.05%
5 1,000,000 4,451,801 5,451,801 4.45 0.99%
6 1,000,000 8,157,290 9,157,290 8.16 0.77%
7 1,000,000 8,188,684 9,188,684 8.19 1.01%
8 920,470 7,079,530 8,000,000 7.69 0.88%
9 1,000,000 9,080,216 10,080,216 9.08 0.63%
10 1,000,000 1,859,864 2,859,864 1.86 0.80%
11 1,000,000 3,343,077 4,343,077 3.34 0.90%
12 1,000,000 7,319,865 8,319,865 7.32 0.71%
13 1,000,000 7,367,208 8,367,208 7.37 0.60%
14 1,000,000 3,759,535 4,759,535 3.76 0.64%
15 135,404 1,550,901 1,686,305 11.45 1.17%
Total 13,748,820 76,362,168 90,110,988 5.55 0.90%
1.5 Metal lurgy The company has undertaken significant metallurgical testwork through German based
Dorfner Analysenzentrum und Anlagenplanungsgesellschaft mbH (ANZAPLAN), a leading
independent authority on lithium ores. This testwork has been used as the basis for
proposing a process flow sheet and estimating recoveries. Testwork undertaken includes:
o Chemical analysis
o Sorting testwork
o Flotation testwork
o Magnetic separation testwork

2017-136 7 of 145
November 2017
o Heavy liquid separation testwork
Based on the results of this testwork a process flow sheet has been proposed which
includes:
o Crushing (3 stages)
o Dense Media Separation (DMS)
o Cyclone
o Milling
o Flotation
o Magnetic separation
The estimated total Li2O recovery from this process is 72.1%. Both Spodumene and Petalite
concentrates are produced with the split between the concentrates being 72% and 28%
respectively. The total mass pull from the run of mine or to concentrate is approximately
13.8% although this will vary depending on the varying grade of the RoM ore delivered to
the plant. The grade of the concentrates produced is:
o Spodumene concentrate > 6%
o Petalite concentrate ~ 4%
The proposed flow sheet is depicted in Figures 1.1 and 1.2 below.

2017-136 8 of 145
November 2017
Second Stage DMS Cyclone First Stage
DMS Cyclone
Secondary Cone
Crusher
TertiaryCone
Crusher
Jaw Crusher
Single DeckScreen
Double DeckScreen
- 0.5 mmFraction
> 2.6 SGSpodumene Fraction
Mica Fraction>2.5 <2.6 SG
< 2.5 SGPetalite Fraction
ROM feed
< 2.5 SGPetalite Fraction
Mica Fraction
>2.5 <2.6 SG
Drain and Rinse Screen
Drain and Rinse Screen
Dilute Medium
Dilute Medium
Drained Medium
Drained Medium
Figure 1.1 – Crushing and Dense Medium Separation Flowsheet
ClassifyingCyclone Desliming
Cyclone
Ball Mill
Spodumene Rougher Cells
Spodumene Cleaner Cells
Spodumene Slimes
Spodumene Tailings
Spodumene Concentrate
Desliming Cyclone
Classifying Cyclone
Ball Mill
- 0.5 mm Fraction
SpodumeneFraction
Petalite Fraction
MagneticSeparator
SpodumeneRougher Cells
SpodumeneCleaners
Spodumene Concentrate
Petalite Slimes
Magnetics
Petalite Rougher Cells
Petalite FirstBrine Cleaners
Petalite SecondBrine Cleaners
Petalite WaterCleaners
Petalite Tailings
Petalite WaterCleaner Tails
Petalite Concentrate
Figure 1.2 – Milling and Flotation Flowsheet

2017-136 9 of 145
November 2017
In addition to the production of a lithium concentrate the option of producing a lithium
carbonate was also considered. The lithium carbonate plant flowsheet consists of the
following processes: roasting the concentrate with lime and sodium sulphate, leaching of
the roaster product with water, impurity removal, recovery of sodium sulphate for
recirculation to the process, evaporation of the pregnant leach solution, precipitation of
crude lithium carbonate, filtration, dissolution of the crude lithium carbonate, ion exchange
to remove impurities, crystallisation of battery grade lithium carbonate, drying and
micronizing. The final lithium carbonate produced will contain 99.5% lithium carbonate,
the estimated efficiency of this plant is 86% lithium recovery.
This option entailed transportation of spodumene and petalite concentrates from the mine
site to a lithium carbonate plant in Bulawayo.
1.6 Mine Support Infrastruct ure All required infrastructure to support the proposed mining and processing plan has been
allowed for, this includes the following elements:
o Bulk power supply
o Bulk water supply
o Access roads to site
o Tailings dam facility
o Waste rock dumps
o Mine Infrastructure cluster including:
Site roads
Site water reticulation
Site Power reticulation
Workshops
Offices
Change house
Stores
Sewage treatment
Fuel and lube storage and disposal
Explosive magazine
Accommodation camp

2017-136 10 of 145
November 2017
1.7 Labour Labour has been estimated based on a 30 day per month operation. It is proposed that
mining and security are outsourced to a contractor while all other activities will be
undertaken by the owner. The labour complement estimate is shown in Table 1.6 below.
Table 1-6 – Total Labour Complement Department Employer Number Management and Administration Owner 50 Mining Contractor 146 Plant Owner 27 Plant Engineering Owner 62 Maintenance Owner 66 Security Contractor 19 Health and safety Contractor 4 Mine Technical Services Owner 19 Camp management and administration Contractor 59 Total 452
1.8 Environmental and Social An environmental and social scan was undertaken, which included a site visit, to identify
and fatal flaws and/or material issues at the site. The outcomes of this high level scan
were:
1.8.1 Social
Based on the proximity to local rural communities a number of potential issues could
emerge. The most significant of these relate to community relocation, in-migration of job
seekers and the location of housing for the mineworkers, contractors and their families.
A critical aspect in terms of social engineering is to design the project with closure related
issues as the primary driver. The outcome will determine the most appropriate strategies
to foster social sustainability by providing post-mining skills, health, water, transport, and
education services and facilities in such a way that the responsibility and social liability does
not lie with the mine for the maintenance of the social infrastructure on closure.
No fatal flaws have been determined, however a number of key issues would need to be
addressed during the ESIA phase of the project.

2017-136 11 of 145
November 2017
1.8.2 Biophysical
It is inevitable that mining activities will impact on the biophysical environment and these
relate primarily to ground and surface water impacts with specific regard to diversion,
pollution from tailings dams and rock dumps and cone drawdown.
The development of Project Zulu will consequently increase the potential impacts related to
these factors. It is therefore important to undertake the recommended specialist studies in
order to gain an understanding of the baseline conditions in relation to the potential
impacts and to provide mitigation and avoidance measures. A key determinant is to design
the operation with,
1. Mine closure as the key design determinant,
2. Preventing accumulation of impacts, and
3. Rehabilitation of facilities to provide a sustainable land use post-closure.
The most important issues to be assessed in the ESIA phase with regard to biophysical
impacts are:
1. The location and design of the tailings storage facility, rock dumps and the metallurgical
plant.
2. The diversion and management of surface water structures.
3. Ground and surface water management strategies to provide safe mining conditions,
prevent the loss of mining production due to water ingress, and pollution post closure.
No fatal flaws have been determined. However, in terms of closure, water pollution will
remain the key issue.
1.9 Lithium Market Survey A high level Lithium market survey was undertaken in order to assist in the selection of
prices for the lithium concentrate and lithium carbonate products that are being evaluated.
Based on the high level research undertaken the following commodity process have been
selected for this study work as a base case, sensitivity analysis will be undertaken on the
revenue stream of the project evaluation:
o Spodumene concentrate >6% - US$800/t
o Petalite concentrate ~4% - US$400/t
o Effective concentrate price based on split between Spodumene (72%) and Petalite
(28%) concentrates is approximately – US$688/t
o Lithium Carbonate 99.5% - US$15,000/t

2017-136 12 of 145
November 2017
1.10 Financial Capital and operating costs have been generated for the technical solution described
above, these costs are summarised in Tables 1.7 and 1.8 below.
Table 1-7 – Summary of Capital Cost Concentrate Option
Capital Costs Total
[USD'mill] Surface Infrastructure 14.95 Concentrate Processing Plant 24.36 Mining 2.50 Tailings Dam 5.60 Indirect Cost 2.37 Contingency 14.22 Total Capital Cost 64.01
Table 1-8 – Summary of Operating Cost Concentrate Option Area USD'mill USD / t ROM USD / t conc
Mining 270.33 19.66 169.82
Processing 244.97 17.82 153.88
Power/Water/Maintenance 95.15 6.92 59.77
General and Administration 27.50 2.00 17.27
Product Transportation 134.99 9.82 84.80
Total C1 Operating Cost 772.94 56.22 485.54
The operating and capital cost of the lithium carbonate plant was added to the concentrate
option costs to enable the evaluation of the lithium carbonate option. Operating costs
were estimated at 2,100 USD per tonne lithium carbonated (Li2CO3) produced and capital
costs were estimated at USD 130 million for the plant.
2 INTRODUCTION
2.1 Overview Zulu Lithium (Private) Limited, a subsidiary of Premier African Minerals (Prem), holds
various prospecting licenses for lithium in the Matebeleland South Province of Zimbabwe
collectively known as the Zulu Lithium Project.

2017-136 13 of 145
November 2017
The company has been undertaking exploration activities on these licenses and based on
the data obtained from this drilling program has estimated a maiden mineral resource.
Zulu Lithium now wish to determine if the identified deposit has economic potential by
undertaking a scoping study considering all technical and economic aspects of the project.
Zulu Lithium have approached Bara Consulting to assist with the undertaking of this scoping
study.
2.2 Project Location and Access The Zulu Lithium Project is located in the province of Matabeleland South, Zimbabwe
approximately 100km to the east north east of Bulawayo near the small village of Fort
Rixon.
Access to site is via the national road, designated as “A5”, toward the north east in the
direction of the town of Gweru. The national road is in good condition and it is understood
that it had recently been resurfaced. Access to the site from A5 was at the turnoff to Fort
Rixon, approximately 45km outside Bulawayo. The remaining approximately 50 km to the
site from this turn off is on graded dirt road, this road is in poor condition, particularly the
last 10 km before the reaching the site.
Figure 2.1 below shows the location of the site within Zimbabwe, while Figure 2.2 shows
the regional project location. Figure 2.3 shows the road access to the site from Bulawayo.
2.3 Climate and Topography Average temperatures in the area range from 8°C (night) and 23°C (day) during winter to
17°C (night) and 31°C (day) in summer. The dry season is from April to October with the
rainy season from November to March. The average annual rainfall is approximately 500
mm per annum.
The topography is dominated by a long ridge which represents the main pegmatite
occurrences along the contact with metasedimentary and serpentinitic lithologies. The area
east of this ridge is flat and dominated by subsistence farming. The landscape west of the
ridge is a bit more undulated. The ridge itself reaches a maximum height of 1411 m a.m.s.l.;
the fields are at an altitude of 1300 to 1330 m a.m.s.l.

2017-136 14 of 145
November 2017
Figure 2.1 – Project Location in Zimbabwe
Figure 2.2 – Regional Project Location Relative to Populous Areas

2017-136 15 of 145
November 2017
Figure 2.3 – Road Access to the Zulu Lithium Project Site from Bulawayo
2.4 Scope of Work Bara Consulting (Bara) have been appointed by Zulu Lithium Ltd to undertake a scoping
level evaluation of the Zulu Lithium Project in Zimbabwe. This study will consider all major
aspects of the project and will result in an economic evaluation being generated, this
evaluation will indicate the economic potential of the project and motivate future work.
The following aspects of the project formed the basis of the Bara scope of work:
o Site Visits
o Data review and assimilation.
o Geotechnical analysis and excavation design.
o Mining design.
o Production scheduling (open cast only).
o Process design.
o Process plant design.
o Mine services infrastructure design.
o Surface support Infrastructure design.
o Bulk supplies.
o Manpower determination.
o Environmental and social scan
o Lithium market survey
o Capital Cost estimates.
o Operating cost estimates.
o Project financial evaluation
o Reporting of work completed

2017-136 16 of 145
November 2017
2.5 Site Visit A site visit was undertaken by Bara Consulting between Monday 4th September and
Wednesday 6th September 2017 by the following consultants;
o A D Pooley – Project Manager and Mining Engineer
o Etienne de Villiers – Mechanical Engineer
o Peter Roux – Environmental Engineer
o Roy Shiri – Geotechnical Engineer
The primary objective of the visit was;
o Site orientation and information gathering
o Identification of possible location for infrastructure
o Determining availability of bulk water and power supply
o Determining environmental and social implications of the project
o Initial assessment of geotechnical characteristics of the core
In general, the site is easily accessible by the existing public road network, although some
upgrade of roads will be necessary should the project progress. The area around the site is
lightly populated with the flat lying areas around the deposit being used to grow crops
while the steeper ridge areas are light bush with some rocky outcrops. There are limited
homesteads close to the deposit itself with the villages in the area generally being several
kilometres away.
The site visit was formally recorded in a Note for Record titled ‘Site Visit Report’ Bara
document number 2017-136-NFR-001-RB issued to the Client on 26th September 2017. This
document has been attached as Appendix A to this report.
3 GEOLOGY AND RESOURCES
3.1 Geological Overview
The following description of the geological setting at the site is taken from a report
provided to Bara by Zulu Lithium. The report is titled “Summary Report on the Zulu Lithium
Pegmatites, Insiza, Matabeleland South, Zimbabwe” dated April 2016 and authored by
Wolfgang Hampel of Zulu Lithium, this note is attached as Appendix B. The sections in
italics denote direct quotes from this document.

2017-136 17 of 145
November 2017
3.1.1 History of the Site
The pegmatite was first pegged in 1955 by J.S. Willemse. Rhodesian Selection Trust Co. Ltd.
(“RST”) took an option on the claims and carried out an extensive drilling and excavation
programme. Though much development work was carried out, Rhodesian Selection Trust
declined to exercise their option on the claims. In 1961 and 1962 a small quantity of petalite
was mined by W. Burchett in partnership with J.S. Willemse. In 2010, after decades of no
activity, consulting geologist Richard B. Dollar registered the claims in his name
and subsequently carried out diamond drilling and trenching financed by PREM. In 2013,
Premier African Minerals (Zulu Lithium) exercised an option to acquire the claims.
3.1.2 Zulu Lithium Claims
The Zulu Lithium Project covers a surface of 3.5 km², a list of all Zulu claims with corner
points and their coordinates is given in Table 3.1 and shown in Figure 3.1. The authorisation,
permit or license to explore and/or mine the area is conferred on the holder by the mining
claim whereby the holder is granted exclusive rights. The claims are inspected annually in
accordance with the current fees which are set in accordance with the Mining (General)
(Amendment) Regulations, 2014 (No.18).

2017-136 18 of 145
November 2017
Table 3-1 – List of Project Zulu Claim Blocks
Name Reg No Corner UTM (E) UTM (N) Area in km²
Zulu A 11385 BM A
B
C
D
E
F
G
H
750901
751139
751354
751334
751305
751080
750852
750886
7782182
7782169
7782165
7781900
7781694
7781704
7781708
7781931
0.21
Zulu B 11386 BM A
B
C
D
E
F
G
H
750975
751204
751466
751431
751354
751139
750901
750941
7782683
7782668
7782662
7782452
7782165
7782169
7782182
7782427
0.24
Zulu C 11387 BM A
B
C
D
E
F
G
H
751018
751253
751520
751481
751466
751204
750975
751008
7783170
7783175
7783136
7782922
7782662
7782668
7782683
7782925
0.24
Zulu D 11388 BM A
B
C
D
E
F
G
H
I
751079
751317
751585
751538
751525
751520
751253
751018
751038
7783666
7783716
7783683
7783458
7783267
7783136
7783175
7783170
7783448
0.27

2017-136 19 of 145
November 2017
Table 3-1 – List of Project Zulu Claim Blocks
Name Reg No Corner UTM (E) UTM (N) Area in km²
Zulu E 11389 BM A
B
C
D
E
F
G
H
751136
751392
751647
751622
751585
751317
751079
751122
7784167
7784144
7784152
7783894
7783683
7783716
7783666
7783926
0.23
Zulu E1 15128 BM A
B
C
D
E
F
G
H
I
751095
751320
751548
751605
751647
751392
751136
751114
751107
7784657
7784694
7884741
7784456
7784152
7784144
7784167
7784417
7784494
0.27
Zulu E2 15129 BM A
B
C
D
E
F
G
H
751060
751288
751528
751550
751548
751320
751095
751077
7785153
7785156
7785192
7785000
7784741
7784694
7784657
7784902
0.22
Zulu East 21 15864 B A
B
C
D
E
F
G
H
751481
751736
751983
751966
751955
751687
751431
751466
7782922
7782910
7782908
7782689
7782421
7782429
7782452
7782662
0.24

2017-136 20 of 145
November 2017
Table 3-1 – List of Project Zulu Claim Blocks
Name Reg No Corner UTM (E) UTM (N) Area in km²
Zulu East 20 15863 BM A
B
C
D
E
F
G
H
I
751538
751777
752042
752013
751983
751736
751481
751520
751525
7783458
7783446
7783440
7783184
7782908
7782910
7782922
7783136
7783267
0.27
Zulu 26 13210 BM A
B
C
D
E
F
G
H
750344
750543
750746
750729
750707
750450
750246
750294
7783548
7783537
7783532
7783244
7782963
7782981
7783039
7783296
0.24
Zulu 27 13211 BM A
B
C
D
E
F
G
750792
751122
751079
751038
750889
750746
750766
7783987
7783926
7783666
7783448
7783485
7783532
7783751
0.15
Zulu NW 15129 BM A
B
C
D
E
F
G
H
I
750818
751107
751114
751136
751122
750792
750766
750746
750543
7784509
7884494
7784417
7784167
7783926
7783987
7783751
7783532
7783537
0.49

2017-136 21 of 145
November 2017
Table 3-1 – List of Project Zulu Claim Blocks
Name Reg No Corner UTM (E) UTM (N) Area in km²
J
K
L
M
N
750344
750354
750358
750361
750812
7783548
7783774
7784017
7784270
7784281
Zulu Central 45940 A
B
C
D
E
F
G
H
750746
750889
751038
751018
751008
750851
750707
750729
7783532
7783485
7783448
7783170
7782925
7782945
7782963
7783244
0.16
Zulu SE 15778 BM A
B
C
D
E
F
G
H
751431
751687
751665
751645
751628
751305
751334
751354
7782452
7782429
7782181
7781911
7781688
7781694
7781900
7782165
0.23

2017-136 22 of 145
November 2017
Figure 3.1 – Plan of Project Zulu Claim Blocks

2017-136 23 of 145
November 2017
3.1.3 Exploration History
RST drilled seven diamond drill holes (903 m) with an accompanying 14 trenches (totalling
1829 m) and drove a 37 m sampling adit into the main spodumene‐lepidolite pegmatite.
Further to that, 96 pits with a total depth of 378 m were sunk in areas unsuited to trenching.
In 2011, Richard Dollar drilled further six diamond drill holes (2236 m). More trenching was
carried out but the trenches had not been logged and sampled systematically.
In late 2015, PREM undertook a mini‐bulk sampling programme where three composite
samples, each weighing between 250 and 285 kg were taken in the respective pegmatites
zones (petalite, spodumenelepidolite at surface and in spodumene‐lepidolite in the
exploration adit). These samples are for metallurgical test work.
Parallel to this, 136 shallow pits were sunk into the eluvial cover overlying the
spodumene‐lepidolite pegmatites along the eastern side of the ridge. The pits were
excavated in order to evaluate the potential for eluvial tantalite concentrations in the
overburden.
Since 2016, PREM has drilled a further 43 diamond drill holes in the Main Zone and the New
Zone totalling 5990 metres.
3.1.4 Geological Sett ing and Mineralisation
Deposit Types
The hard rock deposits can be classified as lithium pegmatites and subdivided into the
sub‐types petalite pegmatite and spodumene (lepidolite) pegmatite. Certain, higher
differentiated pegmatites amongst them seem to have characteristics of LCT pegmatites
(lithium‐caesium‐tantalum). The occurrence of tantalite and scheelite in the overburden is a
typical eluvial enrichment as both minerals resist well to weathering.
Geological Overview
Figure 3.2 below shows a plan of the surface geology in the area covered by the claim
blocks. The northern two thirds of the zone where pegmatites appear has not yet been
studied in any detail.

2017-136 24 of 145
November 2017
Figure 3.2 – Surface Geological Plan Showing Claim Blocks
Country Rocks
The area is underlain by Archaean schists of the Bulawayan System, with serpentinites and
banded iron formations at the base in the east and metamorphosed volcanics and
sediments as one moves to the west. The ‘schist belt’ is tear drop shaped measuring 30 km
long and 19 km wide near the broad section at the top. Metamorphism is up to chlorite
facies. The eastern part of the concession is dominated by epidosites and gneissic granites.
The Zulu Pegmatites (from Arnett’s report, 1958):
According to Arnett’s report from 1958, two types of pegmatite are found:
1. A steep dipping group (6) of petalite‐feldspar‐quartz pegmatites containing petalite in
massive form; the feldspar is chiefly micro perthite (an intimate mixture of microcline
and albite). Minor amounts of molybdenite, sphalerite and native bismuth were also
found. This pegmatite group is exposed over approximately 122m length, having a
width of approximately 27m and has been exposed on surface by pits and trenches and

2017-136 25 of 145
November 2017
approximately 70 m underground by the intersection of a diamond drill hole No 3.
Assays of some of the mineralised sections of diamond drill core show and average Li2O
content of 1.5%.
2. A steep dipping massive spodumene‐lepidolite pegmatite indicated over a total strike
length of 367 m varying from 4.7m to 30m in width. The average Li2O content is 1.4%.
This pegmatite is exposed by several trenches on surface and three diamond drill holes
intersecting the pegmatite at approximately 70m depth.
Even at surface, the petalite pegmatites seem to be fresh and unweathered. The spodumene
of the other pegmatites is typically weathered at surface resulting in low(er) Li2O grades.
Fresh, nicely pink coloured spodumene is found from depths > 6m, e.g. in RST’s exploration
adit.
More drilling and field work by PREM has identified many more pegmatites. PREM
subdivides the concession in three distinct target zones:
o The Main Zone which covers ± Arnett’s pegmatites described above, although the
dimensions are considerably higher. The south‐western, predominantly petalite rich
zone is estimated to be at least 660 m long, the predominantly spodumene rich zone is
at least 1200 m long.
o The New Zone in the south‐east of the concession comprises 6 to 7 individual zones of
lithium bearing pegmatites striking W‐E to NW‐SE and dipping near vertically. Their
cumulative strike length is estimated to be in the order of 2600 m. Striking almost
perpendicular to the pegmatites of the Main Zone, these pegmatites are interpreted as
a second, younger generation of lithium pegmatites. The first drill holes drilled in this
zone indicate the presence of massive and more continuous pegmatites than in the
Main Zone. To date, the deepest lithium bearing pegmatites have been intersected at
vertical depths of over 220 m.
o The North Zone in the north‐western part of the concession is not yet well defined by
drilling and field work. Here spodumene and lepidolite bearing pegmatites strike almost
N‐S and dip near vertical.
Other than described by Arnett (1958), many pegmatites show a distinct zonation with a
typical quartz core, followed by a spodumene or petalite rich zone followed by an albite rich
zone which may be rich in tantalite.
Mineralogy
To date, five different lithium minerals have been identified:

2017-136 26 of 145
November 2017
o Petalite (LiAl(Si4O10)), as snow white crystals up to 8 cm in length.
o Spodumene (LiAlSi2O6), at surface it is strongly weathered, in fresh samples from drill
cores or the exploration adit, this mineral forms white to pink coloured subhedral
crystals. Locally, the spodumene has undergone intense sodium metasomatism,
resulting in the foration of so‐called “cymatolite”, a fine grained mixture of albite and
mica.
o Lepidolite (KLi2Al(Si4O10)(F,OH)2), pink to lavender coloured and often very fine grained.
o Eucryptite (LiAlSiO4) has been observed only once as white grains to 2 cm replacing
petalite.
o Holmquistite (Li2Mg3Al2)Si8O22(OH)2) a brownish to purple coloured lithium amphibole is
frequently found in wall rocks of lithium pegmatites; it’s formation is the result of
intense lithium metasomatism.
No other lithium minerals such as amblygonite (LiAl(PO4)F) are known from the Zulu
pegmatites.
The other two major constituents of the pegmatites are quartz (SiO2) and micro perthitic
feldspar, a mixture of microcline and albite.
Locally, tantalite‐Mn (MnTa2O6) is found as minute subhedral grains and crystals. According
to SEM‐EDS analyses, the tantalite is a rather pure manganese bearing endmember, with
no traces of uranium or thorium. Tiny scheelite (CaWO4) grains are found in the eluvial cover
and are probably originating from small veinlets along the contact between the pegmatites
and the serpentinitic and metasedimentary host rocks. Apatite (Ca5(PO4)3F)) is sometimes
found in the drill cores, easily recognizable by its golden yellow fluorescence under UV light.
Small euhedral crystals of spessartine (Mn32+Al2(SiO4)3) are found quite abundantly in the
pegmatites.
Arnett (1958) describes also green beryl (Be3Al2(Si6O18)) from the pegmatites. Along the
contact with the chrome bearing serpentinites, gem quality emeralds could have formed.
The geological setting with beryllium bearing pegmatites along chrome bearing lithologies
would be ideal for the formation of emeralds.
Pyrite and molybdenite occur abundantly in the pegmatites and their wall rocks. All other
minerals such as cassiterite, native lead and bismuth, sphalerite and chalcopyrite were only
observed in polished sections by Arnett (1958).

2017-136 27 of 145
November 2017
Pollucite ((Cs,Na)2(Al2Si4O12) ∙ 2H2O) has not yet been described from Zulu which may be due
to the fact that xenomorphous pollucite is practically not distinguishable from quartz in
hand specimens. Certain pegmatites seem to be richer in Cs2O but the caesium could also
form a constituent of the lepidolite and is not necessarily present as pollucite.
3.2 Miner al Resources An electronic mineral resource model was provided by Zulu Lithium in Datamine® format,
the model file name is ‘zulu-resmod-sep17.dm’. This model was imported into the Deswik®
suite of mine design software and queried to determine the quantum and grade of the
resource. Table 3.2 below shows the tonnage and grade data of the deposit at various cut
off grades, Figure 3.3 shows this information as a grade tonnage curve. All resources are
currently at Inferred levels of confidence from a code compliance perspective.
The grade and tonnage model used in this study differs from the initial Maiden SAMREC
Compliant Inferred Mineral Resource Estimate of 20.1 million tonnes @ 1.06 % Li2O and 51
ppm Ta2O5 using a cut-off grade of 0.5% Li2O. Since this first resource estimate the
geological model has been changed as at least six new zones of lithium mineralisation have
been discovered. A part of the Main Zone is now attributed to the so-called New Zone.
Drilling in the New Zone is ongoing and will result in a massive increased overall tonnage.
Table 3-2 – Zulu Lithium Grade Tonnage Data
Cut Off Grade
(% Li20)
Deposit Tonnage
(t)
Average Grade
(% Li20)
0.0 50,430,222 0.38
0.1 27,462,033 0.67
0.2 23,374,436 0.76
0.3 20,191,534 0.84
0.4 17,584,924 0.94
0.5 15,189,479 1.01
0.6 12,794,706 1.09
0.7 10,632,280 1.18
0.8 9,337,615 1.23
0.9 8,122,527 1.29

2017-136 28 of 145
November 2017
-
0.20
0.40
0.60
0.80
1.00
1.20
1.40
1.60
-
10,000,000
20,000,000
30,000,000
40,000,000
50,000,000
60,000,000
0.0 0.1 0.2 0.3 0.4 0.5 0.6 0.7 0.8 0.9 1.00
Aver
age
Gra
de %
Li2
O
Reso
urce
Ton
nage
Cut of Grade % Li2O
Tonnes Grade
Figure 3.3 – Zulu Lithium Grade Tonnage Curve
4 GEOTECHNICAL ASSESSMENT
A geotechnical assessment on the Zulu Lithium Project has been undertaken by Bara, this
assessment included inspection of surface outcrops and exposed surfaces as well as logging of
available drill core at the project site during the site visit of 4th to 8th September 2017. In addition,
during this site visit additional cores were logged at the RHA mine site near Hwange which is where
the Zulu drill core is stored. The scoping level geotechnical design undertaken has largely been
based on these site observations as well as some public domain information.
4.1 Visual Inspect ions at S ite Visual assessment of the outcrops and exposed surfaces on site indicated the presence of at
least two joint sets, with dip angles of approximately 60° and dipping to the north and to
the south. Figure 4.1 below shows these joint sets, also visible in the figure is a small adit
developed during historical exploration activities, date unknown.

2017-136 29 of 145
November 2017
During the site visit a drill core from one hole was also logged while it was being drilled
(borehole ZDD 27/2), the remainder of the core logging took place at the RHA mine site
(see following section).
Figure 4.1 – Joint orientations from outcrops and exposed sections, Zulu Project Site
4.2 Geotechnical Logging A total of six boreholes were geotechnically logged by Bara during the site visit. At the time
of the field investigation, the core had been transported from the site and stored for an
extended period of time, hence the quality of the core had deteriorated slightly. All the
available core was not orientated and had been split for sampling around the mineralized
zones, therefore the data acquired was deemed suitable for only a scoping level of study.
Table 4 1 lists the boreholes that were logged for the scoping level design.
Table 4-1 – Geotechnical Boreholes Logged and Total Meterage
Borehole ID Metres logged (m)
ZDD03 102.3
ZDD05 76.9
ZDD13 87.0
ZDD14 91.4
ZDD16 122.5
ZDD27/2 67.1
TOTAL 547.1

2017-136 30 of 145
November 2017
The geotechnical logging was conducted according to the Bara Standard Operating
Procedure (SOP) for geotechnical logging. The following parameters were recorded during
the logging process:
o Depth
o Description (rock type)
o Core recovery
o RQD (rock quality designation)
o Strength of intact rock (rock hardness)
o Weathering/alteration
o Discontinuity type
o Discontinuity frequency
o Dip angle of structure with respect to core axis
o Discontinuity condition
4.2.1 Material Thickness
The upper domains of the logged boreholes consisted of soils and weathered material.
These upper materials therefore constitute the weathered domain. Below the weathered
domain there is a fresh domain, comprising of un-weathered to slightly weathered
material. Table 4.2 below shows the material thicknesses per borehole and the average
material thickness over all logged boreholes is presented in Table 4.3. A weathered domain
thickness of 15 m was adopted in this study and is applied in the overall slope angle design.
Table 4-2 – Material Thickness per Borehole per Rock Type
Borehole ID
Domain Material Type Thickness
(m)
ZDD03 Weathered zone Soil & Gneiss 17.38 Fresh zone Gneiss & Pegmatite 84.96
ZDD05 Weathered zone Soil & Serpentinite 12.80 Fresh zone Serpentinite & Pegmatite 69.10
ZDD13 Weathered zone Soil & Gneiss 16.86 Fresh zone Gneiss & Pegmatite 112.47
ZDD14 Weathered zone Soil & Schist 11.59 Fresh zone Schist & Pegmatite 75.95
ZDD16 Weathered zone Soil & Schist 10.00 Fresh zone Gneiss & Pegmatite 81.35
ZDD27 Weathered zone Soil & Gneiss 16.08 Fresh zone Gneiss & Pegmatite 49.02

2017-136 31 of 145
November 2017
Table 4-3 – Average Domain Thickness for all
Boreholes Logged
Domain Average thickness (m)
Weathered zone 14.12 Fresh zone 78.81
4.2.2 Rock Quality Designat ion (RQD)
The RQD is a simple and qualitative method of describing rock mass quality from drill core.
It is the sum of pieces of solid core that are longer than 100 mm in length measured along
the centreline of the core divided by the run length, expressed as a percentage. Table 4.4
presents the RQD classification index used to classify drill core based on measured RQD
values.
Table 4-4 – RQD Classification for Rock Mass Quality
Rock mass quality RQD (%)
Very poor 0-25 Poor 25-50 Fair 50-75 Good 75-90 Excellent 90-100
Figure 4 2 and Figure 4 3 below show cores from the Zulu Site indicating Good to Excellent
rock quality and Poor rock quality respectively.
Figure 4.2 – Good Quality Core with High RQD Classification

2017-136 32 of 145
November 2017
Figure 4.3 – Poor Quality Core with Low RQD Classification
RQD classification per borehole with depth is presented in Figure 4.4 below. The graph
shows that for most boreholes, RQD values in the first 15 m are in the Poor category. As
depth increases, the RQD ranges in the Fair, to Good and Excellent for most boreholes.
0
20
40
60
80
100
120
140
0 25 50 75 100
Dep
th (
m)
RQD (%)
Rock Quality Designation
ZDD03 ZDD05 ZDD13 ZDD14 ZDD16 ZDD27
Very Poor Poor Fair Good Excellent
Figure 4.4 – RQD Classification with Depth

2017-136 33 of 145
November 2017
4.2.3 Mining Rock Mass Rating (MRMR)
Overall slope angles were derived from the Hainnes and Terbrugge chart, based on the rock
mass Mining Rock Mass Rating (MRMR). The MRMR was derived from applying adjustments
to the In-situ Rock Mass Rating (IRMR)as derived by Laubscher. The IRMR considers four
basic parameters:
o Intact rock strength, defined as the unconfined compressive strength (UCS) of the rock
sample;
o Rock block strength, defined as the strength of the rock blocks contained within the
rock mass;
o Blocky nature of the rock mass, which depends on the number of joints sets and their
spacings;
o Joint condition, defined in terms of a geotechnical description of the joints contained
within the rock mass.
Figure 4.5 shows the steps taken to determine IRMR and MRMR. The IRMR value is
established by adding the rating values for joint spacing, joint condition and the rock block
strength. The MRMR value is determined by adjusting the IRMR value to account for the
effects of weathering, joint orientation, mining induced stresses, blasting and water.
Figure 4.5 – Procedure for evaluating IRMR and MRMR

2017-136 34 of 145
November 2017
Rock Block Strength
The rock block strength represents the strength of the joint bound primary block of rock
adjusted for sample size and the presence of any non-continuous fractures and veins within
the block. The adjustment for sample size is such that the conversion from core or hand
specimen to rock block is 80 % of the intact rock strength value. If internal fractures and
veins are present, a further adjustment is made based on the number of veins per metre
and the Mohr’s hardness number of the vein infilling (ABS). In this work, an adjustment
factor of 1.0 for internal fractures and veins was done as a detailed assessment of veins and
internal fractures was not done during the geotechnical logging. For a concept level study,
an adjustment factor of 1.0 for veins and internal fractures is acceptable. The rating for rock
black strength ranges from zero to a maximum of 25. There was no available intact rock
strength data specific to the Zulu Project. As a result, IRS for the different domains at Zulu
were estimated using literature obtained values. Figure 4.6 shows the determination of the
Block Strength rating value for Serpentinite based on a block strength value of 144 MPa.
The rating values for block strength determined from block strength for the different
materials at Zulu are presented in Table 4.5.
Figure 4.6 – Rating Values for Rock Block Strength

2017-136 35 of 145
November 2017
Table 4-5 – Determination of Rock Block Strength Ratings
Rock type Intact Rock
Strength (MPa) Rock block adjustment ABS
Rock Block Strength (MPa)
Rock Block Strength Rating
Gneiss 224 0.8 1.0 179.2 25 Schist 166 0.8 1.0 132.8 23 Serpentinite 180 0.8 1.0 144 24 Pegmatite 178.5 0.8 1.0 142.8 24
Joint Condition
Adjustments for joint conditions are based on the relevant factors as listed in Table 4.6
below. The rating for joint condition has a maximum rating of 40 and is adjusted
downwards according to Table 4.6.

2017-136 36 of 145
November 2017
Table 4-6 – Joint Condition Adjustments for One Joint Set
Characteristics of the joints Adjustment
% of 40
A: Roughness at a large scale
Wavy-multidirectional 1.00
Wavy-unidirectional 0.95
Curved 0.90
Straight/slight undulations 0.85
B: Roughness at small scale (200 x 200 mm)
Rough-stepped/irregular 0.95
Smooth-stepped 0.90
Slickensided-stepped 0.85
Rough-undulating 0.80
Smooth-undulating 0.75
Slickensided-undulating 0.70
Rough-planar 0.65
Smooth-planar 0.60
Slickensided-planar 0.55
C: Alteration of the rock walls
The rock wall is altered and weaker than the filling 0.75
D: Gouge fillings
Gouge thickness <amplitude asperities of the rock wall 0.60
Gouge thickness > amplitude asperities of the rock wall 0.30
E: Cemented structures/filled joints (infill weaker than
rock wall)
Hardness of the infill: 0.95
5
4 0.90
3 0.85
2 0.80
1 0.75
Where there is more than one joint set, an equivalent rating from the joint sets with the
highest and lowest rating, the planar smooth joints and undulating rough joints in this case,
the relative rating of the worst to best joints was obtained based on the total number of

2017-136 37 of 145
November 2017
joints counted per rock type from the geotechnical logging. Using Figure 4.7, using the
percentage of the worst joints to the total joints, and the ratios of the highest to the lowest
joint condition ratings, an equivalent joint condition rating is obtained for two or more joint
sets. Table 4.7 shows the final joint condition ratings.
Figure 4.7 – Estimation of Equivalent Rating for Joint Condition
Table 4-7 – Adjusted Joint Condition Ratings
Rock type Total no. of joints Ratings Adjusted
rating Planar Smooth
Planar Rough
Undulating smooth
Undulating rough Highest Lowest
Relative rating
Worst joints (%)
Gneiss 18 43 44 62 32 24 75% 11% 31
Schist 8 0 51 15 32 24 75% 11% 31
Serpentinite 0 0 12 71 32 30 94% 14% 31
Pegmatite 0 1 23 21 32 26 81% 2% 32

2017-136 38 of 145
November 2017
Joint Spacings
The average joint spacing for each rock type was determined from geotechnical logging and
is presented in Figure 4.8 and Figure 4.9. The mode spacing for each distribution is used in
the determination of the joint spacing rating. The rating for joint spacing is determined for
open joints using the chart given in Figure 4.10, Table 4.8 lists the joint spacings derived for
each rock type and Zulu.
Figure 4.8 – Joint Spacing Distribution for Gneiss and Schist
Figure 4.9 – Joint Spacing Distribution for Serpentinite And Pegmatite

2017-136 39 of 145
November 2017
Figure 4.10 – Rating for Open Joint Spacing
Table 4-8 – Joint Spacing Ratings
Rock type Rating
Gneiss 23 Schist 26
Serpentinite 26 Pegmatite 23
The IRMR is obtained by adding the ratings for the block strength, joint spacing and joint
condition. Table 4 9 below shows the IRMR for the different rock types from the Zulu
Project.
Table 4-9 – Derived In-Situ Rock Mass Rating Per Rock Type
Rock type Block Strength
Joint Condition
Joint Spacing IRMR
Gneiss 25 31 23 79 Schist 23 31 23 78 Serpentinite 24 31 26 81 Pegmatite 24 32 23 79

2017-136 40 of 145
November 2017
The MRMR is obtained by applying rating of weathering, orientation, blasting, mining
induced stresses and water to the IRMR. Table 4 10 to Table 4 13 show the rating
adjustments that can be applied to the IRMR to derive the MRMR.
Table 4-10 – Adjustment Factors for Effects of Weathering
Time of exposure to weathering (years)
Degree of
weathering 0.5 1 2 3 4
No weathering
(fresh) 1.00 1.00 1.00 1.00 1.00
Slightly
weathered 0.88 0.90 0.92 0.94 0.96
Moderately
weathered 0.82 0.84 0.86 0.88 0.90
Highly
weathered 0.70 0.72 0.74 0.76 0.78
Completely
weathered 0.54 0.56 0.58 0.60 0.62
Residual soil
(saprolite) 0.30 0.32 0.34 0.36 0.38
Table 4-11 – Adjustment Factors for Effects of Blasting
Blasting technique Adjustment factor, A BLAST
Mechanical excavation/boring 1.00
Smooth-wall blasting 0.97
Good conventional blasting 0.94
Poor blasting 0.80

2017-136 41 of 145
November 2017
Table 4-12 – Adjustment Factors for Water Condition
Water condition Adjustment factor, A WATER
Moist 0.95-0.90
Water inflow 25-125 L/min, water
pressure 1-5MPa 0.90-0.80
Water inflows >125 L/min, water
pressure > 5 MPa 0.70-0.80
Table 4-13 – Adjustment Factors for Effects of Joint Orientation
No. joints
defining the
block
No. block faces
inclined from
vertical
JC Rating
0 to 15 16 to 30 31 to 40
3 3 0.70 0.80 0.95
2 0.80 0.90 0.95
4 4 0.70 0.80 0.90
3 0.75 0.80 0.95
2 0.85 0.90 0.95
5 5 0.70 0.75 0.80
4 0.75 0.80 0.85
3 0.80 0.85 0.90
2 0.85 0.90 0.95
1 0.90 0.95
Table 4 14 below shows the rating adjustments applied and the derived MRMR values for
the different rock classes at Zulu.

2017-136 42 of 145
November 2017
Table 4-14 – Calculated MRMR Values Per Rock Type
Rock type IRMR Adjustments
MRMR Weathering Blasting Orientation Water
Mining induced stresses
Gneiss 79 0.92 0.94 0.95 0.90 1.0 59
Schist 80 0.90 0.94 0.95 0.90 1.0 58
Serpentinite 81 0.92 0.94 0.95 0.90 1.0 60
Pegmatite 79 0.92 0.94 0.95 0.90 1.0 59
Average (Fresh material) 59
4.3 Slope Engineer ing The depth of the mineralized zones as observed from the logged core ranges from about
20 m to 100 m. Slope configurations were based on pit depths of 55 m, 75 m, 95 m and
115 m below surface. This corresponds to a weathered zone depth of 15 m, and fresh zone
depth of 40 m, 60 m, 80 m and 100 m.
4.3.1 Bench height
Mining equipment used to excavate the material determines the bench height. Currently,
most large mining operations adopt 10 to 15 metre bench heights, with 15 metres being
the most common. A maximum bench height of 10 m is suggested for the weathered zone,
and maximum bench height of 15 m for the fresh zone.
4.3.2 Bench Width
Minimum bench widths of 7.5 m are suggested based on the empirical relationships used to
optimise bench width for containment and catching failure volumes:
Bench Width (m)=0.2 × Bench Height + 4.5
recommended by the SME Mine Engineering Handbook (1992). Larger bench widths of 10
m are recommended between the weathered and fresh zones.
4.3.3 Overal l S lope Angle
The overall slope angles were determined using the empirical slope design chart proposed
by Hainnes and Terbrugge (1991). The design chart relates the height of the slope and the
Adjusted Mining Rock Mass Rating (MRMR) value of the material to a stable slope angle
(Figure 4 11). Overall slope angles are shown for slope heights ranging from 55 m to 115 m.

2017-136 43 of 145
November 2017
Figure 4.11 – Hainnes and Terbrugge Empirical Chart for Slope Angle Determination
Table 4.15 shows the overall slope angles related to pit depth for a safety factor of 1.5 as
derived from the Hainnes and Terbrugge chart.
Table 4-15 – Derived Overall Slope Angles Related to Slope Height
Conservative design for fresh material (SF=1.5)
Slope height (m) Average MRMR
Overall slope angle (°)
Calculated bench face angle (°)
55 59 58
85 75 59 57 95 59 55
115 59 53
4.3.4 Slope Configurat ion
The concept slope geometrical configurations derived for the Zulu Project are presented in
this section (Figure 4.12 and Figure 4.13). The configurations presented in this section do
not provide for a geotechnical berm for the 95 m and 115 m pit depth scenarios. Slope
configurations and overall slope angles that cater for the geotechnical berm after every
four benches will be presented in the next section.

2017-136 44 of 145
November 2017
Figure 4.12 – Slope Configurations for 115m and 95m Deep Pits
Figure 4.13 – Slope Configurations for 75m and 60m Deep Pits
4.3.5 Slope Configurat ion with Geotechnical Berm
For deeper pits, a geotechnical berm is left after typically four benches to create a stack.
The width of the berm is typically twice the calculated bench width. Placing of a
geotechnical berm results in a shallower overall slope angle, compared to slopes where
there are no berms. Placement of a ramp also results in a shallower overall slope angle.

2017-136 45 of 145
November 2017
Figure 4.14 below shows slope configurations for a 115 m and 95 m deep pit with
geotechnical berms included.
Figure 4.14 – Slope Configurations Incorporating Geotechnical Berms in Slope
Table 4.16 below shows the overall slope angles for the slopes with and without
geotechnical berms.
Table 4-16 – Overall Slope Angle Summary, Zulu Project
Slope height (m)
Average MRMR
Overall slope angle (°)
Without geotechnical berm
With geotechnical berm
55 59 58 - 75 59 57 - 95 59 55 53
115 59 53 52
5 MINING
The deposit at the Zulu Project is massive, surface outcropping, steeply dipping (approximately 65°)
to the east with thicknesses ranging from 5 m to 30 m. As such the only realistic method of mining
this deposit will be by open cast methods and no underground mining is considered in this study.

2017-136 46 of 145
November 2017
5.1 Resources Available for Mining and Production Rate Selection To determine the payable resource that should be mined and the rate at which it should be
mined a paylimit calculation was carried out and applied to the resource described
previously. This calculation determined that a paylimit of approximately 0.6 % Li2O should
be applied to the resource to determine the payable resource available. The paylimit
calculation is shown in Table 5.1 below.
Table 5-1 – Zulu Project Paylimit Grade Calculation
Estimated Costs (Preliminary Nos) Units Value
Mining cost per tonne Rock $/t 3.0
Strip Ratio (estimate) t waste to t ore 5.0
Mining Cost $/t milled 18.0
Engineering Cost $/t milled 2.0
Processing cost $/t milled 15.0
G&A cost $/t milled 2.0
Concentrate Transport Costs $/t Conc 50.0
Yield % 13.80%
Concentrate Transport Costs $/t milled 6.90
Total cost $/t milled 45.40
Paylimit Grade Estimate
Li2O Price $/t Li2O 11,319
Operating cost $/t milled 45.40
Recovered Grade % Li2O 0.40%
Plant recovery % 72%
RoM grade required % Li2O 0.56%
Dilution estimated % 5%
In-situ Paylimit Grade % Li2O 0.58% Notes:
1. The dataset used for the paylimit grade calculation and defined in the above table is a preliminary dataset
based on early stage work and final values used in the project evaluation may differ. 2. The Li2O price is a calculated price per tonne of pure Li2O, the calculation of this price is based on an
average concentrate price of US$633 per tonne and the average concentrate grade of 5.59% Li2O.
0.6 % Li2O was selected as a cut-off grade and when applied to the mineral resource
information demonstrated that approximately 12.8 million tonnes of payable resource at
an average grade of 1.09% Li2O was available to be mined.

2017-136 47 of 145
November 2017
Base on this tonnage a production rate of 1 million tonnes per annum (tpa) was proposed
as the production rate, this would give approximately a 15 year mine life including the
production build up ad tail off periods.
It is noted that this process was used to estimate payable mineral resource and to select a
production rate only. The actual resource mined from the electronic model provided was
determined by undertaking a pit optimisation study which is discussed in the following
section of this document.
5.2 Pit Opt imisat ion Study A pit optimisation was undertaken to determine the economic extent of mining in the Zulu
deposit. The Whittle® pit optimisation software was used to undertake this work.
The resource block model provided by Zulu Lithium was imported into the software and a
techno-economic data set was generated for input into the optimisation model, this data
set is shown in Table 5.2 below.

2017-136 48 of 145
November 2017
Table 5-2 – Techno-Economic Dataset Used for Pit Optimisation Study
Parameter Value Notes
Costs Factors
Mining Cost 3.00 US$ per tonne mined – contract mining
Engineering cost 2.00 US$ per tonne milled – site infrastructure maintenance
G&A Cost 2.00 US$ per tonne milled – Management and admin costs
Production transport costs 6.94 US$ per tonne milled – based on $50/ tonne of concentrate
Processing Cost 15.00 US$ per tonne milled – processing cost incl plant maintenance
Technical Factors
Dilution Factor % 5% benchmarked
Recovery Factor % 95% benchmarked
Target production rate 1 000 000 Ore tonnes per annum
Overall angle in weathered
material (0 to 30m) ◦
40 m
Overall angle in fresh
material (+30m) ◦
55 m
Bench heights maximum, m 10 m
Mining to be done in 2 x 5m
flitches
Ramp Gradient (%) 10 %
Ramp width 25 m
Process recovery 72.1% Estimated from testwork report
Density Factors
Waste 2.69 t/m3
Ore 2.69 t/m3
Revenue Factors
Price/Selling $/t 632.20 $ per tonne of concentrate
Price/Selling $/t 11 319 $ per tonne of Li2O
Discount Factor 10.0% Corporate Strategy for financing
Notes:
1. The dataset used for the pit optimisation and defined in the above table is a preliminary dataset based on early stage
work and final values used in the project evaluation may differ.
2. The Li2O price is a calculated price per tonne of pure Li2O, the calculation of this price is based on an average concentrate
price of US$633 per tonne and the average concentrate grade of 5.59% Li2O.
On running the geological block model through Whittle against the above techno-economic
criteria various pit shells were generated each representing a potential pit with an

2017-136 49 of 145
November 2017
associated NPV. Table 5.3 below shows the pits shells generated from the optimisation run,
Figure 5.1 shows the pit shells generated graphically.
Table 5-3 – Optimisation Results Based on Techno-Economic Dataset Selected
Pit Discounted Cash
flow $ Best Mined Tonnes
Recovered Li20 Best
Waste Tonnes Mined
LOM Best Concentrate Tonnes Best
Strip Ratio Best
1 12,020,032 142,609 1,485 164,036 0.14 26,565 1.15 2 23,183,215 287,433 2,983 541,065 0.29 53,363 1.88 3 43,753,707 590,860 5,965 1,378,173 0.59 106,708 2.33 4 59,373,550 825,161 8,415 2,381,246 0.83 150,537 2.89 5 70,009,324 1,010,577 10,197 3,056,548 1.01 182,415 3.02 6 101,417,061 1,627,255 15,605 5,264,290 1.63 279,159 3.24 7 115,940,569 1,995,557 18,506 6,348,496 2.00 331,055 3.18 8 127,827,086 2,330,471 20,924 7,277,847 2.33 374,311 3.12 9 138,003,019 2,628,805 23,194 8,453,575 2.63 414,919 3.22
10 158,305,088 3,219,123 28,074 11,680,309 3.22 502,218 3.63 11 162,755,086 3,382,788 29,240 12,350,533 3.38 523,077 3.65 12 168,288,661 3,626,158 30,823 13,166,964 3.63 551,395 3.63 13 180,920,343 4,206,538 34,761 15,763,443 4.21 621,843 3.75 14 191,494,889 4,678,137 38,207 18,517,070 4.68 683,488 3.96 15 193,415,877 4,804,922 38,928 18,879,865 4.80 696,386 3.93 16 219,140,980 6,450,266 49,843 27,948,632 6.45 891,646 4.33 17 222,887,190 6,794,827 51,745 29,105,075 6.79 925,671 4.28 18 223,593,759 6,867,275 52,140 29,358,117 6.87 932,737 4.28 19 224,091,938 6,942,479 52,468 29,460,428 6.94 938,605 4.24 20 227,219,484 7,183,464 54,235 31,645,778 7.18 970,215 4.41 21 227,803,814 7,263,962 54,598 31,828,896 7.26 976,708 4.38 22 229,022,888 7,357,645 55,361 32,953,767 7.36 990,358 4.48 23 230,170,560 7,491,809 56,163 33,849,860 7.49 1,004,705 4.52 24 230,884,879 7,565,541 56,733 34,763,334 7.57 1,014,902 4.59 25 242,886,213 10,245,366 71,844 53,363,908 10.25 1,285,224 5.21 26 243,695,584 10,452,503 72,944 54,684,691 10.45 1,304,902 5.23 27 243,736,640 10,464,193 73,004 54,756,391 10.46 1,305,975 5.23 28 244,438,160 10,698,338 74,250 56,413,298 10.70 1,328,265 5.27 29 245,159,640 10,974,715 75,781 58,660,128 10.97 1,355,653 5.35 30 246,656,872 11,669,567 79,327 63,705,704 11.67 1,419,088 5.46 31 248,847,232 13,301,809 86,424 71,687,450 13.30 1,546,047 5.39 32 248,952,741 13,395,020 86,847 72,239,839 13.40 1,553,614 5.39 33 249,086,917 13,564,066 87,543 73,036,503 13.56 1,566,064 5.38 34 249,093,445 13,601,632 87,759 73,475,067 13.60 1,569,928 5.40 35 249,179,627 13,748,820 88,938 76,362,166 13.75 1,591,020 5.55 36 249,163,137 14,302,972 91,826 81,793,210 14.30 1,642,683 5.72 37 249,145,415 14,372,737 92,098 82,148,419 14.37 1,647,549 5.72 38 249,113,534 14,429,757 92,402 82,774,659 14.43 1,652,987 5.74 39 249,070,174 14,489,691 92,599 82,981,020 14.49 1,656,512 5.73 40 248,852,521 14,733,869 93,462 84,111,411 14.73 1,671,950 5.71 41 248,756,469 14,817,722 93,810 84,726,958 14.82 1,678,175 5.72 42 248,739,031 14,828,455 93,863 84,842,655 14.83 1,679,123 5.72 43 248,673,935 14,866,021 94,024 85,170,926 14.87 1,682,004 5.73 44 248,635,909 14,875,622 94,052 85,233,955 14.88 1,682,504 5.73 45 248,609,747 14,889,038 94,103 85,328,139 14.89 1,683,417 5.73 46 248,447,539 14,966,853 94,363 85,769,486 14.97 1,688,068 5.73 47 247,135,318 15,482,042 96,480 90,610,048 15.48 1,725,939 5.85 48 246,319,823 15,771,836 97,811 94,062,008 15.77 1,749,750 5.96 49 244,356,242 16,401,064 100,799 102,196,768 16.40 1,803,202 6.23 50 244,302,876 16,419,847 100,864 102,342,075 16.42 1,804,365 6.23

2017-136 50 of 145
November 2017
Figure 5.1 – Graph Showing Pit Shells Generated, Ore and Waste Tonnes and NPV@10%
The optimisation results show that Pit Shell 35 results in the maximum NPV after which the NPV
value starts to drop. Based on the outcomes of the pit optimisation exercise Pit Shell Number 35
was selected as the basis for generation of mining schedules.
Pit Shell 35 is made up of two discrete pit shells along the strike of the orebody, South Pit and
North Pit, both of these pits are included into the mining schedule. Pit Shell 35 has the following
attributes:
o Ore tonnes 13,749,000 t
o Average RoM grade: 0.90% Li2O
o Waste tonnes: 76,362,000 t
o Strip Ratio: 5.6 t waste to 1 t ore
o Pit Depth: 200m
o Pit Width: 350m
o Pit length: 650m
Figure 5.2 below shows a plan of the two discrete pits (South Pit and North Pit) within Pit Shell 35.
Figures 5.3 to 5.6 show cross and long sections of the South and North pits.

2017-136 51 of 145
November 2017
Figure 5.2 – Plan of Pit Shell 35 Showing South and North Pits

2017-136 52 of 145
November 2017
Figure 5.3 – Cross-section of South Pit
Figure 5.4 – Long-section of South Pit

2017-136 53 of 145
November 2017
Figure 5.5 – Cross-section of North Pit
Figure 5.6 – Long Section of North Pit

2017-136 54 of 145
November 2017
5.3 Open P it Mining and Production Schedules Due to the level of study being undertaken, no detailed pit design has been undertaken and
the Pit Shell 35 generated from the optimisation study has been used as a basis for the
mine production schedules. An allowance has been made for the additional waste
expected at the pit design phase due to the design of ramps into the optimised pit shell.
This has been accounted for in the optimisation study by reducing the pit slope angles used
in the optimisation study from those recommended in the geotechnical evaluation.
Mining will be by standard drill, blast, truck and shovel methods. Ore and waste will be
drilled and blasted in 10 m high benches. After blasting the broken rock will be loaded into
a haul truck for transport to the plant ore stockpile of an appropriate waste dump area.
The plant will be situated to the south of the mining area while the waste dump areas will
be situated to the west of the pits. These areas are shown on the site plant contained in
Section 6 of this document.
Mining is planned to start in the shallow high grade areas of the deposit and will
preferentially mine high grade portions of the resource as it becomes available with the
deepening of the pits. Production rates are planned to be 1 million tpa of ore plus
associated waste. The average LoM strip ratio is 5.5 tonnes of waste per tonne of ore
although this varies significantly during the mine life. Modifying factors have been applied
to the mineral resource to emulate practical mining conditions and estimate the mining
inventory that will be delivered to the plant (run of mine or ROM production). Modifying
factors that have been applied are:
o Ore recovery of 95%.
o Dilution of 5%
The production schedule is shown below in Table 5.4, Figure 5.7 shows the production
profile graphically.

2017-136 55 of 145
November 2017
Table 5-4 – Project Zulu LoM Production Schedule
Year Ore
Tonnes
Waste
Tonnes
Total Tonnes
Mined
Strip
Ratio
Li2O RoM
Grade
1 692,946 2,307,054 3,000,000 3.33 1.39%
2 1,000,000 3,328,669 4,328,669 3.33 1.26%
3 1,000,000 3,998,038 4,998,038 4.00 1.04%
4 1,000,000 4,570,436 5,570,436 4.57 1.05%
5 1,000,000 4,451,801 5,451,801 4.45 0.99%
6 1,000,000 8,157,290 9,157,290 8.16 0.77%
7 1,000,000 8,188,684 9,188,684 8.19 1.01%
8 920,470 7,079,530 8,000,000 7.69 0.88%
9 1,000,000 9,080,216 10,080,216 9.08 0.63%
10 1,000,000 1,859,864 2,859,864 1.86 0.80%
11 1,000,000 3,343,077 4,343,077 3.34 0.90%
12 1,000,000 7,319,865 8,319,865 7.32 0.71%
13 1,000,000 7,367,208 8,367,208 7.37 0.60%
14 1,000,000 3,759,535 4,759,535 3.76 0.64%
15 135,404 1,550,901 1,686,305 11.45 1.17%
Total 13,748,820 76,362,168 90,110,988 5.55 0.90%
0.00%
0.20%
0.40%
0.60%
0.80%
1.00%
1.20%
1.40%
1.60%
-
2,000,000
4,000,000
6,000,000
8,000,000
10,000,000
12,000,000
1 2 3 4 5 6 7 8 9 10 11 12 13 14 15
Li2O
RoM
Gra
de (%
)
Tonn
es p
er Y
ear
Project Year
Ore Tonnes Waste Tonnes Li2O RoM Grade Figure 5.7 – Graphical Representation of Zulu Project LoM Production Profile

2017-136 56 of 145
November 2017
The level of study which has been undertaken to generate the above schedule is at scoping
levels of study. Additionally, it is specifically noted that the mineral resource which makes
up the mining inventory is all in the indicated category and as such the run of mine (RoM)
tonnages and grades reported in the above mining schedule do not constitute a mineral
reserve statement under the JORC or SAMREC codes.
5.4 Mining Equipment A list of required mining equipment has been identified based on the production rate
required to supply the processing plant with the correct quantities of ore.
High level productivity estimates have been proposed to calculate the size and quantity of
the primary equipment (excavator and dump trucks). The requirement for secondary
equipment was estimated based on experience from other similar operations. Table 5.5
shows the mining fleet requirement.
Table 5-5 – Zulu Project Fleet Requirements Equipment Type Manufacturer Model Quantity Excavator Komatsu PC-2000 2 Haul Trucks Caterpillar 777G 3 Drills Sandvik DP1500i 2 ROM Loader Caterpillar 994G 1 Water Cart Caterpillar 777G 1 Track Dozer Komatsu D475 1 Wheel Dozer Komatsu WD900 1 Grader Komatsu GD675 1 FEL Caterpillar 950H 1 Roller Bomag 8 Tonne 1 LDV Toyota Hilux 3 Ambulance Toyota Landcruiser 1 Service Vehicle Toyota Hilux 2 Tyre Handler Toyota 1 Flat Bed Toyota Hino 500 1 Fork Lift Manitao MI-X 100 D 1 Telehandler Manitao MT-X 1740 1 Diesel Tanker Toyota Hino 300 1 Mobilift Toma NG F15 1
5.5 Technical Services Mining Technical Services on the mine will consist of the following functions:
o Geology and grade control.
o Survey.

2017-136 57 of 145
November 2017
o Mine planning.
The geology department will provide grade control service to the mining production teams.
Prior to the mining of each flitch the ore/waste boundary will be clearly marked by the
geology department. Grade controllers will be on site at the point of loading at all times
during the loading of ore. Ore loading will only be done during daylight hours to ensure
that grade control is maintained.
On-site exploration and resource definition will also be undertaken by the site geological
team.
The survey department will conduct routine survey of the open pits, waste dumps,
stockpiles and tailings facilities in order to comply with legal requirements and to ensure
adequate control over the operations is maintained.
The mine planning function will ensure the optimal extraction of the orebody by providing
planning assistance and guidance to the mining production teams. Short and medium term
plans will be drawn up, evaluated and implemented to ensure that the long term strategic
plan of the mine is adhered to. The technical services function will monitor the mining of
the ore and waste volumes mined versus plan and reconcile concentrate produced against
concentrate called for from the geological models to ensure that grade control and grade
estimation is continually improved.
In addition to the onsite technical services geotechnical input into mining operations will be
contracted in as required.
6 MINERAL PROCESSING
6.1 Summary of Metal lurg ical Testwork The company has undertaken significant metallurgical testwork through German based
Dorfner Analysenzentrum und Anlagenplanungsgesellschaft mbH (ANZAPLAN), a leading
independent authority on lithium ores. This testwork has been used as the basis for
proposing a process flow sheet and estimating recoveries. Testwork undertaken includes:
o Chemical analysis
o Sorting testwork
o Flotation testwork

2017-136 58 of 145
November 2017
o Magnetic separation testwork
o Heavy liquid separation testwork
The results were reported by Dorfner Anzaplan in their report titled “Physical Processing of
Lithium Pegmatite Ore from the Zulu Pegmatite, Zimbabwe” dated 9 June 2017.
Three samples, labelled “Zulu Surface”, “Zulu Adit”, and “Zulu Petalite” were sent to
Dorfner Anzaplan for the testwork. The sample “Zulu Surface” was strongly altered. As a
result, it was decided by the client not to use this sample for any further testwork. For the
processing test work, a mixed sample of “Zulu Adit” and “Zulu Petalite” was prepared in a
ratio of 1:1. The combined sample had a grade of 1.1 % Li2O.
Spodumene (LiAlSi2O6) has a Li2O content of 8.0% and Petalite (LiAlSi4O10) has a Li2O
content of 4.9%. Spodumene concentrates containing 6% Li2O and petalite concentrates
containing +-4% Li2O are marketable.
Testwork was carried out using colour based sorting to separate the ore into spodumene
and petalite fractions, as these two minerals exhibit very different flotation properties. The
spodumene and petalite fractions were then milled and floated to produce spodumene and
petalite flotation concentrates. A magnetic separation step was used prior to the petalite
flotation to reduce the iron and manganese contents of the concentrates. Dense medium
separation (DMS) was then carried out on an ore sample as an alternative to sorting to
separate the sample into spodumene and petalite fractions.
6.1.1 Testwork Performed and Results Achieved
Chemical Analyses
The chemical analyses of the three samples are shown in Table 6.1.

2017-136 59 of 145
November 2017
Table 6-1 – Chemical Analyses of the Three Ore Samples
Sample ID Zulu Surface Zulu Adit Zulu Petalite
% Mass % Mass % Mass
Li2O 0.7 1.6 1.2
SiO2 72.0 74.3 73.8
Al2O3 17.0 16.5 16.4
Fe2O3 0.03 0.11 0.04
TiO2 0.01 0.01 0.01
K2O 3.10 1.87 2.84
Na2O 5.15 4.29 4.29
CaO 0.08 0.15 0.07
MgO <0.01 <0.01 <0.01
MnO 0.16 0.25 0.26
P2O5 <0.01 <0.01 <0.01
LOI 1.30 0.7 0.7 Note: LOI denotes the Loss on Ignition.
The Zulu Adit and Zulu Petalitite samples show similar chemical analyses, confirming that
combining the samples for testwork was a reasonable decision.
Sorting Testwork
Prior to the sorting testwork, the sample was crushed to -80 mm and screened into the size
fractions +25 mm, +8 -25 mm, +3 -8 mm and a -3 mm fines fraction. A two-stage optical
sorting process was carried out on the three size fractions +25 mm, +8 -25 mm and +3 -8
mm. From each size fraction, a spodumene rich fraction, an intermediate product and a
petalite rich fraction were generated.
Based on the result of the chemical and mineralogical analyses of all fractions carried out
after sensor based sorting, two samples were produced for further processing tests – a
spodumene rich fraction and a mixed ore fraction containing the intermediate product, the
petalite rich fraction and the 3mm fines fraction.
The sorting tests used colour as the sorting criterion. The particles in the spodumene rich
fraction were a purple / rose colour while the colours of the particles in the petalite rich
fraction were brownish to green and white.

2017-136 60 of 145
November 2017
The size distribution of the sample used for the sorting tests is shown in Table 6.2.
Table 6-2 – Size Distribution of Head Sample
Size Fraction % Mass
+ 25 mm 78.3
- 25 + 8 mm 12.3
- 8 + 3 mm 4.0
- 3 mm 5.4
The sorting results are shown in Table 6.3.
Table 6-3 – Results of Sorting Tests
Sample ID % Mass % Li2O % Li2O
Distr.
+ 25mm Fraction
Petalite 42.4 0.8 30.9
Intermediate 2.8 0.9 2.3
Spodumene 33.1 1.5 45.3
- 25 + 8 mm Fraction
Petalite 6.6 1.2 7.3
Intermediate 0.8 0.9 0.7
Spodumene 4.9 1.2 5.4
- 8 + 3 mm Fraction
Petalite 1.7 0.8 1.3
Intermediate 0.7 0.7 0.5
Spodumene 1.6 1.0 1.4
- 3 mm Fraction 5.4 1.0 4.9
Combined Products
Mixed sample (petalite
feed)
60.4 0.9 47.9
Spodumene feed 39.6 1.5 52.1

2017-136 61 of 145
November 2017
The mixed sample comprises the petalite and intermediate fractions and the fines.
Flotation Testwork
The spodumene feed sample and the mixed sample (petalite feed) were then subjected to
flotation testwork. Both samples were milled, classified and deslimed ahead of flotation.
In flotation of the spodumene sample, mica flotation was performed first, followed by
spodumene flotation. The spodumene flotation pulp was conditioned with sodium
hydroxide to assist in desliming the sample prior to the addition of collectors. The results of
the spodumene flotation test which gave the best results (test F4) are shown in Table 6.4.
Table 6-4 – Flotation Results on Spodumene Sample Test F4
Analyses Metal Distribution
% Mass % Li2O % Fe2O3 % Li2O % Fe2O3
Head (calculated) 100.0 1.5 0.08 100 100
Slimes 7.1 0.9 0.32 4.3 27.6
Mica concentrate 11.0 1.1 0.36 8.1 47.8
Spodumene flot feed 81.9 1.6 0.02 87.6 24.7
Spod. rougher conc. 22.9 5.5 0.08 83.7 21.1
Spod. rougher tails 59.0 0.1 <0.01 3.9 3.6
Spod. cleaner conc. 18.8 6.5 0.09 81.8 19.7
Spod. cleaner tail 4.1 0.7 0.03 1.9 1.5
For the mixed sample, mica flotation was first carried out, followed by spodumene flotation
to recover the residual amounts of spodumene, and finally petalite flotation. The main
mineral removed by mica flotation is muscovite.
The flotation reagents suites for spodumene and petalite flotation are very different.
During petalite flotation, six cleaning stages were required. The petalite rougher flotation is
carried out in a 10% KCl / brine solution, which is also used in the first four cleaning stages.
The pulp is first conditioned with hydrofluoric acid and then with collector. The purpose of
the hydrofluoric acid is to activate the petalite and to depress the feldspar. This reagent
suite was used to reject feldspar from the petalite concentrate. The final two cleaning
stages were carried out in water, to reject quartz.

2017-136 62 of 145
November 2017
In contrast to the spodumene ore sample, the mixed ore sample has higher iron oxide
concentrations (0.06 % in spodumene ore sample, 0.14 % in mixed ore sample). This led to
elevated iron and manganese concentrations in the spodumene concentrate derived from
the mixed ore sample. In one test high intensity magnetic separation was tested prior to
flotation to investigate the impact on the iron content of the spodumene flotation
concentrate. The iron content in the spodumene concentrate is an important quality
parameter for applications in the glass and ceramics industry.
The best petalite flotation results were achieved in test F15. The results for test F15 are
shown in Table 6.5.
In all tests (with the exception of test F14) a spodumene flotation stage was conducted
prior to petalite flotation. The advantage of spodumene flotation before petalite flotation is
that due to the mass reduction resulting from the spodumene flotation, the petalite grade
in the feed to petalite flotation is slightly enriched. This is of advantage as in contrast to
spodumene flotation, petalite flotation proved to be more challenging than spodumene
flotation during this testwork program.
Table 6-5 – Petalite Flotation – Results of Test F15
Analyses Metal Distribution
%
Mass
% Li2O %
Fe2O3
%
Na2O
% Li2O %
Fe2O3
%
Na2O
Head (calculated) 100 1.0 0.15 4.7 100 100 100
Slimes 6.0 0.8 0.54 4.3 4.5 21.6 5.6
Mica concentrate 8.5 1.0 0.69 3.2 8.0 39.0 5.8
Spodumene flot feed 85.4 1.1 0.07 4.8 87.5 39.4 88.6
Spod. rougher conc. 12.1 3.7 0.45 1.9 42.4 35.8 5.1
Spod. cleaner conc. 6.5 5.8 0.66 0.6 35.1 28.3 0.9
Spod. cleaner tail 5.6 1.4 0.2 3.5 7.3 7.5 4.2
Petalite flotation feed 73.7 0.7 <0.01 5.3 45.1 3.6 83.6
Petalite rougher conc. 39.0 1.1 <0.01 3.3 38.7 1.3 27.3
Petalite cleaner conc 6 4.8 3.9 <0.01 1.3 17.4 0.2 1.3
Pet. cleaner tail (brine) 27.8 0.7 <0.01 4.6 15.8 0.9 25.6
Pet. Cleaner tail (water) 6.5 0.7 <0.01 0.3 3.5 0.3 0.3

2017-136 63 of 145
November 2017
The reduction in feldspar content of the cleaner concentrate is indicated by the lower Na2O
content of this concentrate.
In test F16, in addition to a magnetic separation step being included, the hydrofluoric acid
addition to the brine cleaners was reduced. This had the effect of reducing feldspar
rejection to the cleaner tailings, resulting on a lower grade final concentrate being
produced (2.6% Li2O). The lithium flotation results in test F15 were superior to those
obtained in test F16.
A significant amount of Li2O reported to the combined cleaner tailing in the petalite
flotation tests. This is partially due to the need for a high upgrade ratio to produce the
required final concentrate grade. It is unlikely that most of this Li2O will be recovered in
locked cycle tests, resulting in a lower overall petalite recovery.
Magnetic Separation
A high intensity magnetic separation test was carried out on the feed to petalite flotation.
The results are shown on Table 6.6.
Table 6-6 – Results of Magnetic Separation Test
Analyses Metal Distribution
% Mass % Li2O %
Fe2O3
%
MnO
% LOI %
Li2O
%
Fe2O3
%
MnO
Head (calculated) 100 0.8 0.12 0.21 0.49 100 100 100
Slimes 4.5 0.8 0.51 0.21 1.40 4.5 18.8 4.6
Magnetics 3.4 1.0 1.03 4.69 1.70 4.3 28.8 77.7
Non-magnetics 92.0 0.8 0.07 0.04 0.40 91.2 52.4 17.7
The higher LOI in the slimes fraction is a result of elevated mica concentrations. A
significant amount of mica was also separated in the magnetic fraction, as shown by the
elevated LOI in the magnetic fraction. Magnetic separation is most efficient in removing
quantities of iron and manganese from the petalite flotation feed.
Various head, concentrate and tailings samples were analysed for niobium and tantalum.
The only sample in which high values were recorded was in the magnetics fraction from
magnetic separation. The niobium content was 957 ppm and tantalum 875 ppm.

2017-136 64 of 145
November 2017
Magnetic separation may not be required if the spodumene concentrate is produced for
shipment to a lithium carbonate plant to produce battery grade lithium. Magnetic
separation will only be required if the concentrate is being produced for the glass and
ceramic industries.
Heavy Liquid Separation
Heavy liquid separation (HLS) was carried out on a mixed sample of Zulu Adit and Zulu
Petalite ore. The mixed sample was crushed to – 5 mm, and then screened at 0.5 mm. The
– 5 + 0.5 mm fraction was used for the heavy liquid separation test.
The results of the screening operation are shown in Table 6.7.
Table 6-7 – Screening Results Prior to HLS
% Mass % Li2O % Li2O Distr.
Head (calculated) 100 1.1 100
- 5 + 0.5 mm fraction 75 1.0 69.8
- 0.5 mm fraction 25 1.3 30.2
Heavy liquid separation was carried out at specific gravities varying between 2.5 and 2.9.
The mineralogical analyses for the SG fractions >2.6, between 2.6 and 2.5, and <2.5 are
shown in Table 6.8.
Table 6-8 – Results of Heavy Liquid Separation Test – Lithium and
Mineralogical Analyses
SG Range % Mass % Li2O % Petalite % Spodumene
> 2.6 33.2 1.7 <1 19
2.5 / 2.6 58.1 0.2 3 <1
< 2.5 8.7 3.1 69 2
The analyses and metal distributions are shown in Table 6.9.

2017-136 65 of 145
November 2017
Table 6-9 – Results of Heavy Liquid Separation Test – Lithium And
Mineralogical Analyses
SG Range % Mass % Li2O % Petalite % Spodumene
> 2.6 33.2 1.7 <1 19
2.5 / 2.6 58.1 0.2 3 <1
< 2.5 8.7 3.1 69 2
6.1.2 Analyses of Flotat ion Concentrates Produced
The chemical analyses of the flotation concentrates produced are shown in Table 6.10.
Table 6-10 – Chemical Analyses of Flotation Concentrates
%
Li2O
%
Fe2O3
%
MnO
%
SiO2
%
Al2O3
%
K2O
%
Na2O
Spodumene conc. test F4 6.8 0.09 0.44 64.5 26.0 0.48 0.62
Spodumene conc. test F15 5.8 0.66 3.5 59.6 25.1 2.13 0.67
Spodumene conc. test F16 5.9 0.16 0.22 63.7 26.4 0.88 0.37
Petalite conc. test F15 3.9 <0.01 <0.01 77.0 16.7 0.88 1.28
%
Rb2O
%
TiO2
%
CaO
%
MgO
%
P2O5
%
LOI
Spodumene conc. test F4 0.08 <0.01 0.04 <0.01 <0.01 1.1
Spodumene conc. test F15 0.26 0.03 0.30 <0.01 0.06 1.9
Spodumene conc. test F16 0.09 0.02 0.30 <0.01 0.07 1.6
Petalite conc. test F15 0.07 <0.01 0.03 <0.01 <0.01 0.1
Spodumene concentrates used as a feedstock for conversion to lithium carbonate or
hydroxide typically contain a lithium oxide concentration of the order of 6 % Li2O. Lithium
carbonate is an intermediate product in the process route to produce battery grade lithium.
For the glass and ceramic industries, the iron oxide concentration in the flotation
concentrate is an important parameter. Typical low iron spodumene concentrates from
Australia utilised in the glass and ceramics industry contain values between 0.09 and 0.13 %
Fe2O3. Spodumene concentrates for glass applications are typically marketed with a Li2O
grades of above 5%.

2017-136 66 of 145
November 2017
Magnetic separation may not be required If the spodumene concentrate is produced for
shipment to a lithium carbonate plant to produce battery grade lithium. Magnetic
separation will only be required if the concentrate is being produced for the glass and
ceramic industries.
The highest concentrate grades and recoveries for spodumene concentrates were achieved
in test F4. The spodumene concentrate contained 6.5 % Li2O and 0.09 % Fe2O3, well within
the typical range of spodumene specifications for glass and ceramics as well as feedstock
for conversion to lithium carbonate.
For the mixed ore sample a spodumene concentrate containing 5.9 % Li2O was obtained at
an iron oxide content of 0.66 % Fe2O3. This is acceptable as a feed stock for lithium
carbonate production. Introducing a magnetic separation step (test F16) an iron oxide
content of 0.16 % Fe2O3 was achieved, which is slightly higher than the typical standard
glass specification for spodumene products.
The highest petalite concentrate results were achieved in test F15 with a Li2O grade of
3.9 %, which is in the range of acceptable petalite concentrate grades. The benefit of
petalite sourced from the Zulu deposit is the exceptionally low iron oxide content. The
3.9 % Li2O petalite concentrate contained less than 0.01 % Fe2O3, compared to typically
0.04 % in products destined for the glass and ceramics industry.
6.1.3 Select ion of Process Route
From the testwork carried out, it would appear that dense medium separation has
advantages over sorting as cleaner spodumene rich and petalite rich fractions are produced
by DMS than by sorting. This is a result of a micaceous fraction of intermediate SG being
produced which comprises 58.1 % by mass of the feed to the DMS, but contains only 12.2 %
of the Li2O in the DMS feed. This results in a higher Li2O head grade to petalite flotation,
which in turn results in less cleaner flotation stages being required for petalite flotation. As
indicated above, achieving a petalite flotation concentrate grade (+-4 % Li2O) which is
saleable proved to be a challenge in the testwork carried out, requiring 6 cleaner flotation
stages. Rejecting 58 % of the DMS feed will also result in the spodumene and petalite
flotation plant being significantly smaller than if this mica fraction was not rejected.
Based on the DMS results, it appears that it is possible to produce a spodumene rich
fraction which contains spodumene, quartz, feldspar and other non-lithium bearing silicates
and only minimal mica. This may obviate the need for a mica flotation step ahead of

2017-136 67 of 145
November 2017
spodumene flotation. Higher Li2O concentrate grades were achieved in the testwork when
mica was removed ahead of spodumene flotation.
Following DMS, the recommended process flow will be milling, classification and desliming
of the spodumene fraction, followed by flotation. The spodumene flotation concentrate
will be thickened and filtered prior to shipping. The mixed petalite fraction will be
subjected to milling, classification, desliming, magnetic separation, spodumene flotation
and petalite flotation. The concentrates will be thickened and filtered prior to shipping.
Magnetic separation may not be required If the spodumene concentrate is produced for
shipment to a lithium carbonate plant to produce battery grade lithium.
6.1.4 Descr iption of Process Route
The run-of-mine ore will be subjected to three stages of crushing. The primary crusher will
be a jaw crusher, followed by secondary and tertiary cone crushers.
The jaw crusher product will be fed to a single deck screen, with the screen oversize passing
to the secondary cone crusher. The screen undersize and the secondary crusher product
will be fed to a double deck screen. The bottom deck will have 0.5 mm apertures to remove
the fines fraction from the DMS feed. The top deck will have 5 mm apertures. The + 5 mm
fraction will be conveyed to the tertiary cone crusher and the tertiary crusher product will
be returned to the double deck screen. The – 5 mm + 0.5 mm fraction will be the feed to
the DMS, and the – 0.5 mm material will join the petalite fraction from the DMS.
The DMS feed is mixed with heavy medium of the correct SG and pumped to the first stage
DMS cyclone. This cyclone separates the higher SG spodumene fraction from the lower SG
mica and petalite fractions. The cyclone underflow containing the spodumene fraction
flows to a drain and rinse screen. Correct density medium is drained from the first section
of the screen and returned to the correct density medium tank. The remainder of the
medium is rinsed off of the spodumene ore particles and flows to the dilute medium tank.
The washed spodumene is the spodumene product. The density of the first stage cyclone
overflow fraction is adjusted and pumped to the second stage DMS cyclone where the mica
and petalite fractions are separated. The cyclone overflow (petalite) and underflow (mica)
flow to a 2 stream drain and rinse screen. Correct density medium is drained from the first
section of both streams and returned to the correct density medium tank. The remainder
of the medium is rinsed off of the particles and flows to the dilute medium tank. Dilute

2017-136 68 of 145
November 2017
medium passes to a magnetic separator to recover the medium, which is then made up to
the correct density. The washed mica and petalite fractions are the products of the DMS.
The mica fraction may be retained for possible upgrading to a saleable product.
Alternatively, this fraction will be conveyed to a waste dump.
The spodumene fraction is conveyed to the spodumene mill feed bin. The fraction is milled
in a ball mill and pumped to a cyclone for classification. The cyclone underflow is returned
to the ball mill and the cyclone overflow flows to a desliming cyclone. The desliming
cyclone underflow is flotation feed and the cyclone overflow slimes fraction flows to the
final tailings tank.
The spodumene flotation feed is conditioned with sodium hydroxide to assist in removing
the remaining slimes from the spodumene mineral surfaces, collectors are added and a
spodumene rougher concentrate floated. This rougher concentrate is cleaned to produce a
finished grade concentrate. The cleaner tails are returned to the flotation feed. The
flotation tailings may be upgradable to a saleable product. Alternatively, the tailings will be
pumped to the final tailings tank. The spodumene cleaner concentrate will be thickened
and filtered, prior to shipment.
The petalite fraction from DMS and the – 0.5 mm fines fraction from the crushing plant
double deck screen are conveyed to the petalite / mixed ore mill feed bin. This fraction is
milled in a ball mill and pumped to a cyclone for classification. The cyclone underflow is
returned to the ball mill and the overflow flows to a desliming cyclone. The desliming
cyclone underflow is petalite flotation feed and the cyclone overflow slimes fraction flows
to the final tailings tank.
High intensity magnetic separation will be carried out on the petalite flotation feed to
remove most of the iron and manganese containing minerals. The non-magnetics fraction
will be the flotation feed.
KCl and brine (NaCl) are added to the petalite flotation feed to make up a 10 % solution.
The flotation feed is then conditioned with hydrofluoric acid. The purpose of this reagent
suite is to assist in the rejection of feldspar from the petalite concentrate. Collectors are
added and a petalite rougher concentrate produced. A number of cleaning stages in 10 %
KCl / brine solution will be required to reject feldspar. The rougher flotation tailings from
petalite flotation and the KCl / brine cleaner tailings will be thickened to recover the KCL /

2017-136 69 of 145
November 2017
brine solution prior to final tailings thickening. The KCl / brine solution recovered in the
thickener overflow is returned to the flotation feed. The cleaner concentrate from KCl /
brine flotation will then be washed and directed to further cleaning stages using water as
the flotation medium to depress quartz. It is not known how many cleaning stages of KCl /
brine and water will be required. The testwork indicated that 4 stages of KCl / brine
cleaning and 2 with water would be required. With the addition of DMS to the flowsheet
the cleaning requirements may be lower as the majority of the mica has been removed by
the DMS and the petalite flotation head grade will be higher. The spodumene concentrate
will join the main spodumene concentrate and be thickened and filtered, prior to shipment.
The petalite concentrate will also be thickened and filtered.
The petalite flotation tailings may be upgradable to a saleable product. Alternatively, the
tailings will be pumped to the final tailings tank.
The final tailings will be thickened and pumped to the tailings dam. It is recommended that
investigations be carried out during the next phase of the project to determine whether the
tailings dam return water can be re-used in the plant or whether it will need to be treated
prior to discharge to the environment. With the wide variety of chemicals being added in
the spodumene and petalite flotation circuits, it may not be possible to re-use the tailings
return water in either flotation circuit.
The crushing and DMS flowsheet is shown in Figure 6.1 and the milling and flotation
flowsheet in Figure 6.2.

2017-136 70 of 145
November 2017
Second Stage DMS Cyclone First Stage
DMS Cyclone
Secondary Cone
Crusher
TertiaryCone
Crusher
Jaw Crusher
Single DeckScreen
Double DeckScreen
- 0.5 mmFraction
> 2.6 SGSpodumene Fraction
Mica Fraction>2.5 <2.6 SG
< 2.5 SGPetalite Fraction
ROM feed
< 2.5 SGPetalite Fraction
Mica Fraction
>2.5 <2.6 SG
Drain and Rinse Screen
Drain and Rinse Screen
Dilute Medium
Dilute Medium
Drained Medium
Drained Medium
Figure 6.1 - Crushing and Dense Medium Separation Flowsheet

2017-136 71 of 145
November 2017
ClassifyingCyclone Desliming
Cyclone
Ball Mill
Spodumene Rougher Cells
Spodumene Cleaner Cells
Spodumene Slimes
Spodumene Tailings
Spodumene Concentrate
Desliming Cyclone
Classifying Cyclone
Ball Mill
- 0.5 mm Fraction
SpodumeneFraction
Petalite Fraction
MagneticSeparator
SpodumeneRougher Cells
SpodumeneCleaners
Spodumene Concentrate
Petalite Slimes
Magnetics
Petalite Rougher Cells
Petalite FirstBrine Cleaners
Petalite SecondBrine Cleaners
Petalite WaterCleaners
Petalite Tailings
Petalite WaterCleaner Tails
Petalite Concentrate
Figure 6.2 - Milling and Flotation Flowsheet

2017-136 72 of 127128
November 2017
6.1.5 Mass and Metal Balance of the Selected Process Route and
Projected Plant Recovery
The mass and lithium metal balance has been calculated based on the results of the
testwork. However, the testwork made use of a sorting, milling and flotation flowsheet
whereas the proposed flowsheet utilises DMS followed by milling and flotation.
The mass and metal balance has been calculated using the results of the screening and DMS
operations to produce feed tonnages and lithium grades of the flows to spodumene and
petalite flotation. The magnetic separation test results were included in the petalite
flotation balance. The results of the optimum spodumene and petalite flotation tests were
modified to take account of the changed flowsheet.
The authors of the testwork report stated that as the flotation cleaner tailings were all
recirculated (with the exception of the petalite flotation first water cleaner, which cannot
be recirculated), most of the lithium in the cleaner tails should also be recoverable. This is
unlikely in practice, particularly in the case of the petalite cleaner flotation where 50 % of
the lithium in the rougher concentrate reported to the cleaner tailing. For the lithium
balance, it has been assumed that 67 % of the lithium contained in the spodumene cleaner
tailings will be recovered into the final cleaner concentrate and 50 % for the petalite
cleaner tailings. It is recommended that locked cycle tests be carried out in the future to
firm up on overall recovery figures.
The Li2O head grades to spodumene and petalite flotation in the proposed flowsheet will be
higher than the equivalent head grades in the flowsheet used for the testwork, using
sorting. This is a result of a mica fraction being produced by the DMS, which will reduce the
percentage mass directed to spodumene and petalite flotation, and therefore increasing
the Li2O grades. This will result in less cleaning stages being required for the DMS –
flotation route, which should increase the overall recovery. This will need to be confirmed
by metallurgical testwork.
Based on the proposed flowsheet, the combined spodumene and petalite concentrates will
be 13.9 % by mass of the run-of-mine feed to the plant, the average concentrate grade will
be 5.59 % Li2O and the overall lithium recovery will be 72.1 %.
The mass and metal balance is shown in Table 6.11.

2017-136 73 of 127128
November 2017
It should be noted that the figures in the mass and metal balance have been calculated
based on the head grades of the samples used for the testwork. The mine plan shows an
average life-of-mine head grade of 0.90 % Li2O. Over the life–of-mine the head grade will
vary above and below the average figure. As a result, the tonnages of the spodumene and
petalite flotation concentrates produced will vary from year to year. The figures in the
mass and metal balance do not relate to the figures in the financial model, which are based
on the planned head grades from year to year.
In conclusion, the grades of the spodumene and petalite concentrates predicted to be
produced are 6.24% and 3.9% Li2O respectively. These are commercial grade concentrates
containing low impurity levels and hence are considered to be high quality concentrates. In
particular the low iron content, of the petalite concentrate, at less than 0.01%, should be
noted which is desirable in concentrates of this nature.

2017-136 74 of 127128
November 2017
Table 6-11 – Mass and Lithium Metal Balance Sample Grades Distributions Metal Units
Tons per annum
(t) Tons Li2O
p.a. %
mass %
Li2O %
Fe2O3 %
K2O %
Li2O % Li
Plant Feed 1 000 000 10 750.00 100.0 1.08 100.0 1.075 Screening at 5mm: + 5mm 750 000 7 500.00 75.0 1.00 69.8 0.750 - 5mm 250 000 3 250.00 25.0 1.30 30.2 0.325 DMS: (feed + 5mm): 750 000 7 500.00 100.0 1.00 100.0 1.000 > SG 2.6 (spodumene rich) 249 000 4 462.50 33.2 1.79 0.59 59.5 0.595 < SG 2.6 < 2.5 (mica rich) 435 750 915.00 58.1 0.21 12.2 0.122 < SG 2.5 (petalite rich) 65 250 2 122.50 8.7 3.25 28.3 0.283 Flotation - Spodumene fraction: > SG 2.6 (spodumene rich) 249 000 4 462.50 100.0 1.79 0.08 100.0 1.792 Slimes 17 679 159.11 7.1 0.90 0.32 3.6 0.064 Spodumene flotation feed 231 321 4 303.39 92.9 1.86 96.4 1.728 Spodumene rougher conc. 74 760 4 111.80 30.0 5.50 92.1 1.651 Cleaner conc 61 822 4 018.46 24.8 6.50 90.0 1.614 Spodumene cleaner tails 12 938 93.34 5.2 0.72 2.1 0.037 Recovery from cleaner tail (67%) 962 62.54 0.4 6.50 1.4 0.025 Spodumene final conc. 62 785 4 081.00 25.2 6.50 0.09 91.5 1.639 Spodumene flot tails 168 536 222.39 67.7 0.13 0.01 5.0 0.089 Spodumene flot tails (incl. slimes) 186 215 381.50 74.8 0.20 8.5 0.153
Flotation - Petalite fraction: %
MnO2 <SG 2.5 plus -5mm 315 250 5 372.50 100.0 1.70 0.15 100.0 1.704

2017-136 75 of 127128
November 2017
Slimes 18 915 151.32 6.0 0.80 0.54 2.8 0.048 Magnetic separation 10 719 183.29 3.4 1.71 1.03 4.69 3.4 0.058 Feed to spodumene flotation 285 617 5 037.89 90.6 1.76 0.07 0.04 93.8 1.598
Tons per annum Tons Li2O
p.a. % mass % Li2O %
Fe2O3 % K2O % Li2O Li Cleaner conc. 32 673 1 895.05 10.4 5.80 0.16 0.22 37.6 0.601 Spodumene cleaner tails 30 317 394.13 9.6 1.30 0.14 7.8 0.125 Recovery from cleaner tail (67%) 4 553 264.07 1.4 5.80 4.9 0.084 Spodumene final conc. 37 226 2 159.12 11.8 5.80 42.5 0.685 Spodumene flot tails to petalite flotation 248 390 2 878.78 78.8 1.16 51.2 0.913 Petalite cleaner conc. 24 088 939.43 7.6 3.90 18.6 0.298 Petalite cleaner tails 95 832 1 149.99 30.4 1.20 22.8 0.365 Recovery from cleaner tail (50%) 14 743 574.99 4.7 3.90 11.4 0.182 Petalite final conc. 38 831 1 514.42 12.3 3.90 30.1 0.480 Petalite flot tails 209 559 1 364.36 66.5 0.65 21.2 0.433 Petalite flot tails (incl. slimes + mag conc.) 239 193 1 698.96 75.9 0.71 27.4 0.539 Products: % K2O Spodumene fraction, spodumene conc. 62 785 4 081.00 6.3 6.50 0.09 38.0 0.408 Petalite fraction, spodumene conc. 37 226 2 159.12 3.7 5.80 0.16 0.22 20.1 0.216 Combined spodumene concentrates 100 011 6 240.11 10.0 6.24 0.12 58.0 0.624 Petalite conc. 38 831 1 514.42 3.9 3.90 <0.01 14.1 0.151 Total products 138 842 7 754.53 13.9 5.59 72.1 0.775 Reject fractions: % K2O < SG 2.6 < 2.5 (mica rich) 435 750 915.00 43.6 0.21 0.59 8.5 0.092

2017-136 76 of 127128
November 2017
Spodumene flot slimes 17 679 159.11 1.8 0.90 0.32 1.5 0.016 Spodumene flot tails 168 536 222.39 16.9 0.13 0.01 2.1 0.022 Petalite flot slimes 18 915 151.32 1.9 0.80 0.54 % MnO2 1.4 0.015 Magnetic separation 10 719 183.29 1.1 1.71 1.03 4.69 1.7 0.018 Petalite flot tails 209 559 1 364.36 21.0 0.65 0.01 12.7 0.136 Total reject streams 861 158 2 995.47 86.1 0.35 27.9 0.300 Totals 1 000 000 10 750.00 100.0 100.0 1.075

2017-136 77 of 127128
November 2017
6.1.6 Production of Feldspar, Quartz and Mica By-Products
The spodumene and petalite flotation tailings contain low iron oxide concentrations of the
order of 0.01 %. Production of high quality, low iron feldspar and quartz by-products for
glass and ceramics applications may be feasible.
It is also possible that the micaceous fraction from DMS could be subjected to further
treatment which may produce a saleable product. This would need to be confirmed by
further testwork.
The specifications for non-metallic minerals such as feldspar, quartz and mica are generally
determined by the purchaser, and will depend upon the end use of these minerals.
Similarly, the prices to be obtained for these minerals are very dependent on the exact
market that the minerals are being supplied to.
The annual tonnages produced of these three potential by-products, based on the mass
and metal balance figures, are shown in Table 6.12.
Table 6-12 – Tonnages and Analyses of Potential By-Products
By-Product Tonnes per
annum
% Li2O % Fe2O3 % Na2O
Mica fraction from DMS 435 750 0.21 not done not done
Spodumene flotation tails 168 536 0.13 0.01 not done
Petalite flotation tails 209 559 0.65 0.01 7.7
The above tonnages are the calculated tonnages originating from the plant feed of 1 million
tons per annum and on the results of the testwork. It would also be possible to exclude the
respective cleaner tailings from these flotation tailings fractions if these tails were to be
used to produce saleable non-metallic mineral products. The cleaner tailings would tend to
contain higher concentrations of impurities than the flotation tailings. It is recommended
that comprehensive chemical and mineralogical analyses be carried out on these samples
to determine the scope for producing potential by-products and to provide an indication of
a process route to produce clean by-products.
It is also recommended that a market survey be carried out to determine whether there is a
market for such products in the region. These by-products would have to be marketed
relatively near to the point of production as they are low value commodities, and transport
costs could be of the same order as the value of the products.

2017-136 78 of 127128
November 2017
6.1.7 Tail ings Dam
The tailings storage facility (TSF) design parameters are shown in Table 6.13.
Table 6-13 – Tailings Storage Facility Design Parameters
Parameter Units Value
ROM tonnes to plant per annum tonnes 1 000 000
Proportion of ROM tonnes reporting to tailings % 86.5
Tonnes deposited on TSF per annum tonnes 865 000
Deposition life of TSF years 15
In situ specific gravity of deposited tailings 1.45
Overall slope of TSF wall degrees 19
Maximum height of TSF metres 25
Maximum rate of rise of TSF metres/annum 1.7
Rainfall – 1 in a 100 year storm mm 150
The tonnage of tailings deposited includes three streams, the minus 5 mm reject fraction
from the DMS (37,000 tons per month), the spodumene flotation tailings (16,000 tons per
month) and the petalite flotation tailings (20,000 tons per month). At this stage of the
study, it has been assumed that these three streams will all be deposited on the tailings
dam.
Based on these parameters, the total footprint of the TSF will be 68 hectares. This includes
the footprints of the return water dam and the storm water dam.
The tailings dam is proposed to be a conventional ring dyke constructed using the day wall
method. An earth starter wall will be constructed from locally available material. Toe,
blanket and herringbone drains will be provided to improve the long term stability of the
dam as well as to reduce infiltration into the sub-soils. A clay liner will also be provided.
Tailings will be fed into the day wall area via a ring main distribution system. The slime
fraction of the tailings will overflow the day paddocks into the central deposition area of
the tailings dam. At night, the tailings will be deposited into the central area of the tailings
dam.
Process water will be decanted off of the facility by means of a gravity penstock to a return
water dam. The return water dam will be lined. A silt trap will be provided upstream of the

2017-136 79 of 127128
November 2017
return water dam to prevent the return water dam from silting up. The size of the return
water dam has been calculated to allow for the quantity of rainwater falling on the tailings
dam in a 1 in a 100 year storm over a 24 hour period, assumed to be a 150mm storm. A
return water pumping station will be constructed.
Due to the nature of the flotation reagents used for petalite flotation, it may not be
possible to return all of the tailings dam water to the plant for re-use. The tailings water
from spodumene flotation is re-usable, but not the water from petalite flotation. It may be
worth considering having separate sections in the tailings dam for spodumene and petalite
tailings, to allow the spodumene tailings water to be returned to the plant. These options
will be considered during the pre-feasibility study.
A storm water dam will be provided. Into this dam all of the rainwater that falls on the side
slopes of the tailings dam, on the outer spillage paddocks and onto the road that surrounds
the facility will flow. Water from the storm water dam will be pumped into the return
water dam.
6.2 Lithium Car bonate Production As an alternative to producing lithium concentrates destined for the glass and ceramics
markets, the concentrates could also be despatched to a lithium carbonate plant for
conversion to lithium carbonate, and then to lithium metal for use in the lithium battery
industry.
In the case of concentrates for conversion to lithium carbonate, the iron content of the
concentrates is not as important as it is for the glass and ceramic industry. As a result, the
magnetic separation step could be omitted from the mineral processing flowsheet. This
would have the effect of reducing the capital cost of the mineral processing plant. The
effect on the plant operating cost will be minimal.
Not discarding the magnetics fraction from magnetic separation would result in the overall
Li2O recovery increasing to 74.7%. The tonnage of Li2O concentrates produced would
increase to 144,477 tons per annum.
The Lithium Carbonate plant flowsheet consists of the following processes: roasting the
concentrate with lime and sodium sulphate, leaching of the roaster product with water,
impurity removal, recovery of sodium sulphate for recirculation to the process, evaporation
of the pregnant leach solution, precipitation of crude lithium carbonate, filtration,

2017-136 80 of 127128
November 2017
dissolution of the crude lithium carbonate, ion exchange to remove impurities,
crystallisation of battery grade lithium carbonate, drying and micronizing. The final lithium
carbonate produced will contain 99.5% lithium carbonate, the estimated efficiency of this
plant is 86 % Lithium recovery.
The flowsheet of a typical lithium carbonate plant is shown in Figure 6.3.

2017-136 81 of 127128
November 2017
SodiumSulphate
Crystallisation
Drying and Micronising
Lithium Concentrate
Stockpile
Roaster
Hydrated Lime
Sodium Sulphate
WaterLeach
Filtration
Residue
ImpurityRemoval
SodiumCarbonate
CalciumHydroxide
Filtration
CentrifugeMelter
AnhydrousSodium Sulphate
CrystallisationCentrifuge
Lithium Carbonate Solution
Lithium CarbonateSolution
Evaporator
SodiumCarbonate
Impure LithiumCarbonate
Precipitation
CentrifugeLithium
CarbonateDissolution
CO2
Ion Exchange
Hydrochloric Acid
SodiumHydroxide
Centrifuge
Battery GradeLithium
CarbonatePrecipitation
Battery GradeLithium
CarbonateStockpile
Figure 6.3 - Lithium Carbonate Plant Flowsheet

2017-136 82 of 127128
November 2017
The 144,499 tons of lithium concentrate to be fed to the lithium carbonate plant contains
5.56 % Li2O, which is 8,027 tons of Li2O, equivalent to 3,729 tons of lithium. The overall
recovery in the lithium carbonate plant is indicated to be 86 %. The lithium recovery will
therefore be 3,207 tons lithium, equivalent to 17,151 tons of 99.5 % lithium carbonate. It
should be noted that these figures are based on figures from the mass and metal balance,
not on the figures in the financial model.
Based on information contained in the Bara Consulting database, an order-of-magnitude
estimate for the capital and operating costs of the lithium carbonate plant are $130M for
capex and an operating cost of $2,100 per ton of lithium carbonate equivalent produced. It
should be noted that these costs only relate to the production of lithium carbonate, not of
battery grade lithium.
7 MINE SUPPORT INFRASTRUCTURE
7.1 Mine Support Infrastruct ure The surface infrastructure has been located in a triangular shaped area to the south of the
mining operation, with access via an existing dirt road. A minimum amount of terracing will
be required, and the natural fall of the ground was considered for the placement of sewer
lines and the sewage treatment works. Access to the mine site is via an existing secondary
road that runs past the southern side of the Southern pit and a security gate with access
control is located close to the entrance to the mine site. The workshops, offices and mine
substation will be enclosed, as required, with a nominal 1.8 metre high diamond mesh type
fence with an access gate. A view of the overall mine site with the two open pits and the
500 metre blast radius outline, is shown in Figure 7.1. The proposed layout of the surface
infrastructure is shown in Figure 7.2, with a corresponding legend in Table 7.1 .

2017-136 83 of 127128
November 2017
TSF68 ha
EXISTINGROAD
PROPOSEDSURFACEINFRASTRUCTURE
WRD45 ha
Figure 7.1 – View of the Overall Site Layout

2017-136 84 of 145
November 2017
Figure 7.2 – Surface Infrastructure Layout

2017-136 85 of 145
November 2017
Table 7-1 – Surface Infrastructure Legend
No. Description
1 Security Office at Main Gate
2 Parking Area
3 Office Block
4 Emulsion Silos
5 General Engineering Workshop
6 Overhead Crane
7 Lubrication Station
8 Diesel/Re-Fuelling Station
9 Compressor
10 Fire Water Tank
11 Tyre Storage
12 Tyre Cages
13 Raw Water Tanks
14 Substation
15 Water Treatment Plant
16 Dirty Water Collection Sump
17 Haul Truck Wash Bay with H.P. Pump
18 Haul Truck Workshop
19 Support Vehicle Workshops
20 Support Vehicle Re-Fuelling and Lubrication
21 First Aid Room
22 Support Vehicle Wash Bay
23 Change House
24 Accommodation Units
25 Canteen
26 General Laydown Area
27 Storage Yard
28 Generator sets
29 Return Road
30 Traffic Control
31 Control Room
32 Potable Water Tank
33 Oil/Water Separator Sump

2017-136 86 of 145
November 2017
Table 7-1 – Surface Infrastructure Legend
No. Description
34 Wash Bay Sump
35 Main Store
36 Laundry
37 Future Office Block
38 Diesel Storage
The associated detail of the infrastructure that has been allowed for, is as follows:
7.1.1 Roads
The existing secondary road will have a turn-off to provide vehicular access to the surface
structures and open pit areas around the mine site. A nine metre wide haul road will be
provided for transporting ore from the open pit to the waste rock dump and maintenance
facilities and a six metre general service road provides access to the mine offices and camp.
The existing 50 km length of dirt road to the mine site will be upgraded.
7.1.2 Water supply
The mine water supply will be provided by the bulk supply pipeline covered elsewhere in
the document. This supply will include a take-off to feed a set of raw water storage tank
which in turn will incorporate a feed to a purification plant where potable quality water will
be produced. This potable water will be stored in a tank to supply the various facilities,
including a changehouse, offices, workshops, the accommodation camp and any other
buildings requiring water. A borehole has been allowed for to provide an initial quantity of
potable water as a preliminary supply during the construction phase and possibly to serve
as a standby supply, if required. The quality of any possible borehole supply is unknown
and may require the up-front installation of the water treatment plant.
7.1.3 Workshops
Workshop facilities have been provided for in the form of steel structures and twelve metre
long marine containers with steel roof trussing. The planned facilities will cater for the
proposed fleet detailed in the mining section of this report.
The following services and repair facilities will be catered for by the workshops provided:
o Electrical equipment repairs.
o Mechanical equipment repairs.

2017-136 87 of 145
November 2017
o Boilermaking and welding.
o Surface vehicle fleet repairs.
o Loader fleet repairs.
o Haul truck repairs.
o Support fleet and other equipment repairs.
These facilities will be used for the day-to-day maintenance and repair activities. Provision
has been made for equipment and tools, to carry out on-mine repairs, with major repair
items being returned to the equipment manufacturers or other specialist off-site repair
facilities for attention. A vehicle washing facility and a hydrocarbon recovery installation
has also been allowed for.
7.1.4 Off ices
Suitable offices have been planned for senior, junior and clerical staff, to suit the
administration and operating staff requirements. The office buildings will be constructed
using locally sourced building materials and will be furnished with office equipment and air
conditioning where required. The electrical connections, communication lines and
plumbing has also been included. An equipped first aid medical station is located near the
accommodation camp.
7.1.5 Change House Faci l it ies
An industrial type change house facility has been provided for the relevant employees with
separate facilities for female staff. A laundry facility, equipped with commercial washing
and drying equipment has been provided for.
7.1.6 Store and Store yard
A medium sized store and store yard has been provided for the receipt and handling of
goods, materials and equipment spares. The main building will consist of a steel structure,
with office space, shelving and racking. The yard will accommodate the storage of larger
outdoor items.
7.1.7 Sewage Treatment Plant and Ret iculation
Raw sewage from the change houses, offices, workshop area, process plant and
accommodation camp will flow under gravity to a modular type sewage treatment plant
located to the south-eastern side of the allocated area. Generally, sewer pipes will be PVC
types, buried below ground and connected via manholes and inspection eyes for cleaning
and conducting routine maintenance. Provision has been made for a sludge drying pond.

2017-136 88 of 145
November 2017
7.1.8 Diesel Fuel Dispensing Bay
A diesel fuel storage and dispensing facility with bunded walls, has been provided to supply
fuel for the mine vehicle fleet. It has been assumed that the diesel storage tanks and
dispensing system will be supplied by the appointed fuel supplier, on a negotiated contract
basis and at no cost to the mine.
7.1.9 Explosives Magazine
Provision has been made for the construction of a small fuse magazine, with the emulsion
type explosives storage tanks and dispensing system being supplied and installed by the
contracted explosives supplier, at no cost to the mine.
7.1.10 Accommodation Camp
An accommodation camp, with provision for 54, single type housing units and a full catering
facility has been provided. This camp is intended to accommodate senior management and
supervisory staff only, with an allowance for an additional messing facility that will provide
feeding of all staff in the form of one meal per day. The facility will provide for general
after hour recreation for camp residents only.
Cooking equipment is intended to be gas fired with freezers, refrigerators and other
catering equipment being conventional electrically powered.
7.2 Sources of Water Although numerous sources of water were identified during the course of the project, the
Upper Insiza Reservoir located near Fort Rixon presented the least risk in terms of the
availability of water for the operation. The Upper Insiza Reservoir is located approximately
24 km from the site on the road used to access the site from the A5 national road. It is
proposed that a pipeline be installed along this route, to supply water to the operation.
The relative locations of the reservoir and the site are shown in Figure 7.3 as well as the
proposed pipeline route.

2017-136 89 of 145
November 2017
Figure 7.3 Proposed Water Source and Pipeline Route or Project Zulu
7.3 Mine Water C ircuit Project Zulu will have an open water circuit. Due to the nature of the flotation reagents
used for petalite flotation, it may not be possible to return all of the tailings dam water to
the plant for re-use. The tailings water from spodumene flotation is re-usable, but not the
water from petalite flotation. It may be worth considering having separate sections in the
tailings dam for spodumene and petalite tailings, to allow the spodumene tailings water to
be returned to the plant, however this has not been considered at this stage of the mine
water circuit design, nor the mine water balance.
The proposed mine water circuit is presented in Figure 7.4
Figure 7.4 Proposed Mine Water Circuit

2017-136 90 of 145
November 2017
7.4 Mine Water Balance A mine water balance model was formulated based on the proposed water circuit
presented in Figure 7.4.
The mine water balance made use of public domain climate data for Bulawayo from the
internet. This data is summarised in Figure 7.5.
Figure 7.5 Bulawayo Climate Data
In addition to the climatic data presented above, the following assumptions have been
considered for the mine water balance;
o Ground water from the open pit is assumed to be 1Ml/day (No ground water
information is available at this stage)
o Seepage losses from the open pit are considered zero, however losses from the waste
rock dump runoff is considered to be 15 per cent
o The processing plant requires 1.5 tonnes of water per tonne of rock, equating to
approximately 200 m³/hr.
o No water is returned from the tailings dam to the processing plant.
o The tailings dam is lined and no seepage losses are incurred, however interstitial losses
of 5 per cent are incurred as a result of water lockup.
o The tailings dam is sufficiently designed for water storage and evaporation occurs from
the dam.

2017-136 91 of 145
November 2017
The results of the mine water balance show that Project Zulu will most likely be a dry
operation and will be in water deficit through the life of mine. This is evident by the water
requirement from the Upper Insiza Reservoir throughout the year, presented in Figure 7.6.
Figure 7.6 Upper Insiza Reservoir Make-up Water Requirement
The results also show that a significant quantity of water will need to be evaporated from
the tailings dam as a result of no water being returned from the dam to the processing
plant. The evaporative losses required, presented in Figure 7.7, are achievable with the TSF
footprint at 68 hectares. This is evident from the quantity of water stored on the TSF
assuming a 65 per cent pond area (Figure 7.8)

2017-136 92 of 145
November 2017
Figure 7.7 TSF Evaporative Losses by Month
Figure 7.8 TSF Water Storage by Month
7.5 Water Supply Infrastruct ure Raw water will be supplied to the mine site from the Upper Insiza Reservoir by means of a
high lift pump station and a steel pipeline. The flow requirement has been assumed to be
the full requirement from the processing plant, approximately 200 m³/hr. The total head,
based on elevation data gathered from Google Earth and calculated frictional losses, is 242
metres. Based on these requirements, a pump station installation of approximately 132 kW

2017-136 93 of 145
November 2017
will be required to transfer the water from the reservoir to the mine thought a 250 mm
nominal diameter pipeline. The characteristics of the elevation profile along the pipeline
route result in the last 10 km of the 24 km route of the pipeline being gravity flow.
Operating pressure analysis of the pipeline shows that the first 10 km of the pipeline be
250 mm 8 mm wall thickness pipe, with the rest of the route at 6 mm wall thickness. Figure
7.9 below shows the varying pressure along the length of the water supply pipe and the
design pressure used in this study.
Figure 7.9 – Operating and Design Pressures for Bulk Water Supply Pipeline
7.6 Bulk Power Supply A bulk power supply with a rated capacity of 4 MVA is required to supply the Zulu mining
operation. The calculation of the maximum demand is included in Table 7.2, which details
the major load points. The Zimbabwe Electricity Transmission & Distribution Company
(ZETDC) has indicated that sufficient capacity exists within the area, in order to supply the
operation. However, at the time of writing the position of supply point had not been
identified. To this end the study has assumed and costed a 25 km, 11 kV overhead line
feeding the mine.
A separate supply point is required for the bulk water supply transfer pump station at the
Upper Insiza Reservoir. A 200 kVA transformer will be required to cater for the transfer
pump station. It has been assumed that a suitably rated 11 kV supply is available within one
km of the pump station.

2017-136 94 of 145
November 2017
Table 7-2 – Zulu Project Electrical Loads
Description Connected
Power (kW)
Absorbed
Power (kW)
Metallurgical Plant 4 019 3 014
Camp 531 398
Surface Infrastructure 826 620
Bulk Water Reticulation 140 112
TSF Return Pump Station 91 91
Total 5 610 4 230
Diversity Factor 75%
Maximum Power (kW) 3 170
Power Factor 0.9
Maximum Demand (kVA) 3 600
Bulk Water Supply – Upper Insiza Reservoir
Description Connected
Power (kW)
Absorbed
Power (kW)
Pump Station 270 135
7.7 Power Consumption Annual power consumption for peak production is calculated at 30 368 000 kWh, and
includes the mine site and the bulk water supply pump station. Electrical energy charges
for a firm supply, from ZETDC, were given at US$ 0.14/kWh, however information provided
is that charges of US$ 0.10/ kWh may be realised through negotiations with the supply
authority.
7.8 MV Reticulat ion Site MV reticulation will be at 11kV, supplying the load points via cables and overhead lines.
Figure 7.10 shows the mine main substation single line diagram (SLD). A brief description of
each of the feeders is as follows:
o Feeder 1 – Supplies the camp facility and bulk water reticulation requirements. The
camp will be equipped with a 630 kVA mini-substation unit (MSU). The feeder will also
supply the bulk water reticulation requirements with a 200 kVA transformer.
o Feeder 2 – Surface infrastructure including; workshops, offices, change house, stores,
sewage treatment plant and first aid facility. A 1000 kVA MSU will be installed to cater

2017-136 95 of 145
November 2017
for the loads. In addition, the feeder will supply the tailings facility return water pump
station, via an overhead line.
o Feeder 3 – Metallurgical plant supply.
o Feeder 4 – Spare.
o Incomer 2 – A 1000 kVA diesel generator has been included to supply the mine
emergency power requirements during main supply outages.
Figure 7.10 – Zulu Mine MV Single Line Diagram

2017-136 96 of 145
November 2017
7.9 Communication and Contr ols The production communication systems will consist of a UHF/VHF radio system, antennas
on surface will provide coverage for the surface infrastructure, mining and metallurgical
plant.
The non-production communication will be an IP telephone system connecting into an
Ethernet backbone system. The backbone system will be based on single mode fibre
infrastructure connecting the offices, control rooms, metallurgical plant and the camp.
Access control will be provided at the mine and camp access points and will be connected
to the fibre Ethernet system to the control room.
8 LABOUR
8.1 Shift Cycle The shift cycle for project Zulu has been based on a continuous shift cycle structure with
crew rotation. Plant and mining operations will take place over a 24 hour per day, seven
days per week cycle in order to improve machine and equipment utilisation and reduce
overall unit capital and operating costs. Management and technical services personnel will
however work on a 5-day week basis.
8.2 Labour Requirements The labour complement for project Zulu has been determined from first principles. The
total labour complement, presented in Table 8.1, is estimated at 452 people and will
comprise a mixture of owner labour with contractors.
Table 8-1 – Total Labour Complement Department Employer Number Management and Administration Owner 50 Mining Contractor 146 Plant Owner 27 Plant Engineering Owner 62 Maintenance Owner 66 Security Contractor 19 Health and safety Contractor 4 Mine Technical Services Owner 19 Camp management and administration Contractor 59 Total 452

2017-136 97 of 145
November 2017
The mine management and administration complement, presented in Table 8.2, is
responsible for the oversight and management of the processing and mining operations.
The complement includes managers, human resources, financial, procurement and logistics
personnel. The complement will work directly for the mine operator and of the 50
personnel, 10 will be accommodated in the on-site camp.
Table 8-2 – Mine Management and Administration Labour Complement
Position Cat. No / Shift
Shift cycle Total
Camp Accom.
Camp total
Contractor or Owner
General Manager EU 1 1 1 Y 1 Owner Engineering Manager EL 1 1 1 Y 1 Owner Metallurgical Manager EL 1 1 1 Y 1 Owner Finance and Admin Manager EL 1 1 1 Y 1 Owner Receptionist/Secretary BU 1 1 1 N 0 Owner Cost Accountant DL 1 1 1 Y 1 Owner Payroll CU 1 1 1 Y 1 Owner Financial clerk BU 2 1 2 N 0 Owner Cost Controller CU 1 1 1 Y 1 Owner HR and Liaison Superintendent CU 1 1 1 Y 1 Owner HR and Liaison Officer CL 1 1 1 N 0 Owner Personal Records Clerk BU 2 1 2 N 0 Owner Time and Attendance Clerk BU 1 1 1 N 0 Owner Payroll Clerk BU 1 1 1 N 0 Owner Procurement Officer CU 1 1 1 Y 1 Owner Buyer CL 2 1 2 N 0 Owner IT systems CU 1 1 1 Y 1 Owner Storeman CL 1 1 1 N 0 Owner Store Issuers BU 1 3 3 N 0 Owner Drivers - Flat bed and LDV BU 2 3 6 N 0 Owner Drivers - Telehandler BU 1 3 3 N 0 Owner Drivers - Mobilift Crane BU 1 3 3 N 0 Owner Fuel issuers BU 2 3 6 N 0 Owner Cleaner A 2 3 6 N 0 Owner Gardeners A 2 1 2 N 0 Owner Total 32 50 10
The mine labour complement, presented in Table 8.3, is responsible for the, delivering ore
to the ROM stock pile, at the nameplate production rate of 1,000,000 tonnes per annum.
The mine labour complement will be outsourced to a mining contractor. It is estimated

2017-136 98 of 145
November 2017
that the contractor will employ 146 people and it expected that some of the personnel to
be accommodated in the on-site camp.
Table 8-3 – Mine Operations Labour Complement
Position Cat No / Shift
Shift cycle
Tot. Camp
Accom. Camp total
Contractor or Owner
Mining Manager DU 1 1 1 Y 1 Contractor Mining operations Supervisor DL 1 3 3 Y 3 Contractor Mine General Supervisor CU 0 2 0 Y 0 Contractor Production Supervisor - shift CU 3 3 9 Y 9 Contractor Mine Trainer CU 2 1 2 Y 2 Contractor Engineering foreman CL 1 3 3 N 0 Contractor Mine reporting clerks BL 2 3 6 N 0 Contractor Excavator Operator BU 2 3 6 N 0 Contractor Truck Operator BU 7 3 21 N 0 Contractor Drill operator BU 2 3 6 N 0 Contractor Drill assistant BL 2 3 6 N 0 Contractor Blasting supervisor CL 1 3 3 N 0 Contractor Charging crew BL 4 3 12 N 0 Contractor Dozer Operator BU 2 3 6 N 0 Contractor Grader Operator BU 1 2 2 N 0 Contractor Water Tanker Driver BU 1 2 2 N 0 Contractor Diesel Tanker Driver BU 1 2 2 N 0 Contractor Artisans CL 6 2 12 N 0 Contractor Assistant Artisans BU 6 2 12 N 0 Contractor Front end loader - ROM Loading BU 1 2 2 N 0 Contractor Other auxiliary BL 5 3 15 N 0 Contractor Pump attendants - Various BL 4 3 12 N 0 Contractor Safety Officer CU 1 3 3 Y 3 Contractor Total 56 146 18
Mine technical services, presented in Table 8.4, is responsible for the planning, sampling
and survey of the mine. It is anticipated that the team would comprise 19 people.

2017-136 99 of 145
November 2017
Table 8-4 – Technical Services Labour Complement
Position Cat No / Shift
Shift cycle Tot.
Camp Accom.
Camp total
Contractor or Owner
Tech Services Manager DL 1 1 1 Y 1 Owner Mine Geologists CU 1 1 1 Y 1 Owner Geological Samplers/spotters BU 1 2 2 N 0 Owner Senior Mine Surveyor CL 1 2 2 N 0 Owner Mine Survey Team BL 3 3 9 N 0 Owner Planner CL 2 2 4 N 0 Owner Total 9 19 2
The processing plant will be operated by the owner and the complement is presented in
Table 8.5. It is estimated that 89 people are required to operate the plant at the nameplate
capacity of 1,000,000 tonnes per annum run of mine.
Table 8-5 – Processing Plant Labour Complement
Position Cat No / Shift
Shift cycle
Tot. Camp Accom.
Camp total
Contractor or Owner
Production Superintendent DL 1 1 1 Y 1 Owner Metallurgist / Met Accountant CU 1 1 1 Y 1 Owner Metallurgical Foreman CU 1 1 1 Y 1 Owner Lab Technician CL 2 1 2 N 0 Owner Lab Assistant BU 4 1 4 N 0 Owner Safety Officer CL 1 1 1 N 0 Owner Day shift operator BU 2 1 2 N 0 Owner Shift Reliefs BU 6 1 6 N 0 Owner Shift Foreman CL 1 4 4 N 0 Owner Plant Operator BU 3 4 12 N 0 Owner Plant Attendants BU 5 4 20 N 0 Owner Loader driver BU 1 4 4 N 0 Owner Tailings Dam Operators BU 4 1 4 N 0 Owner Plant Engineer DL 1 1 1 Y 1 Owner Engineering Foremen CU 1 1 1 Y 1 Owner Boilermaker CL 3 1 3 N 0 Owner Electrician CL 3 1 3 N 0 Owner Fitter CL 3 1 3 N 0 Owner Instrument Technician CL 2 1 2 N 0 Owner Engineering Aide BU 12 1 12 N 0 Owner Fork Lift Driver BU 1 1 1 N 0 Owner Stores Clerk BU 1 1 1 N 0 Owner Total 59 89 5

2017-136 100 of 145
November 2017
In addition to the mine and plant personnel, operational support labour is required in terms
of maintenance of shared infrastructure, site security, health and safety and camp
administration. This complement, presented in Table 8.6, is estimated at 148 people, and
will be provided by the owner.
Table 8-6 – Operational Support Labour Complement
Position Cat No / Shift
Shift cycle Tot.
Camp Accom.
Camp total
Contractor or Owner
Maintenance Maintenance Superintendent DL 1 1 1 Y 1 Owner Engineering foreman CL 1 3 3 N 0 Owner Maintenance planner(training) BU 1 2 2 N 0 Owner Maintenance leading hand shift BU 1 2 2 N 0 Owner Mine Maintenance clerk BU 1 3 3 N 0 Owner Auto electrician CL 1 1 1 N 0 Owner Electrician CL 2 3 6 N 0 Owner Welder CL 1 2 2 N 0 Owner Boilermaker CL 2 2 4 N 0 Owner Fitters Shift CL 2 3 6 N 0 Owner Assistants BL 7 3 21 N 0 Owner Store keeper BU 1 3 3 N 0 Owner Change house workers BL 3 3 9 N 0 Owner Sewage plant BL 1 3 3 N 0 Owner Camp administration Camp manager DL 1 1 1 Y 1 Contractor Deputy camp manager CU 1 2 2 Y 2 Contractor Cook BL 3 3 9 N 0 Contractor Housekeeping and laundry A 3 3 9 N 0 Contractor Maintenance BL 2 2 4 N 0 Contractor Gardeners/farming A 2 1 2 N 0 Contractor Assistant cooks A 4 2 8 N 0 Contractor Waiters A 4 3 12 N 0 Contractor Bar attendants and services staff A 4 3 12 N 0 Contractor Security Security Chief DL 1 1 1 Y 1 Contractor Senior Security Officer CU 1 3 3 Y 3 Contractor Security Officers CL 1 3 3 N 0 Contractor Security guards BL 4 3 12 N 0 Contractor Health and safety Doctor DU 1 1 1 Y 1 Contractor Nurse CL 1 3 3 N 0 Contractor Total 58 148 9

2017-136 101 of 145
November 2017
8.3 Sources of Labour It is envisaged that semi-skilled labour will be available from the surrounding areas and
villages. On site accommodation has therefore not been provided to these workers.
Management and skilled workers have been accommodated in the camp. Currently it has
not been determined whether the management and skilled labour force will comprise ex-
pat or local labour.
8.4 Cost of Labour Labour cost for the mine owner personnel has been determined by applying pay scales,
presented in Table 8.7, to the overall complement. The overall cost for owner labour is
calculated at approximately USD 2.0 per tonne of ore.
Table 8-7 – Owner Labour Complement Pay Scales
Job Description Category Cost to
Company ($/ month)
General Labour A 200 Semi-skilled assistant BL 250 Operator, driver, receptionist, clerk BU 400 Artisan CL 1 000 Shift boss, Foreman CU 1 500 Superintendent, geologist DL 2 500 Head of department DU 10 000 Senior HOD, relief PM EL 12 000 General/ Project Manager EU 15 000
9 ENVIRONMENTAL AND SOCIAL STUDIES
A high-level review of the environmental and social issues at Project Zulu was undertaken, the
following aspects were considered:
o Identify any immediate and obvious fatal flaws.
o At a high-level determine the issues that may influence engineering design.
o To determine key issues for assessment during the Environmental and Social Impact
Assessment (ESIA).

2017-136 102 of 145
November 2017
9.1 Exist ing Biophysical Impacts
9.1.1 Ground water
At present, it appears that the ground water within the project area is not directly impacted
by any external factors such as mining and industry. Certain agricultural practices may have
an influence on ground water quality in the form of organic loading.
9.1.2 Surface water
Surface water in the area is currently impacted by subsistence farming practices and usage
by local communities and livestock. The annual small streams in the project vicinity appear
to be organically polluted through increased levels of sulphates and nitrates. Figure 9.1
show a photograph of the stream running north south to the west of the exploration area.
Figure 9.1 – Surface Water Stream

2017-136 103 of 145
November 2017
9.1.3 Air quality
The air quality in the project area can be described as good. However, during certain times
of the year burning of savannah grassland does occur that results in smoke impacts.
9.1.4 Biodiversity
The biodiversity and ecosystem functioning of the project as in general compromised by
subsistence farming and uncontrolled bush clearing for the planting of maize. Natural
habitat on the ridges and interface between the lower slopes and the flat ground adjoining
a ridge appear to be in relatively good condition. Figure 9.2 shows a general view of the
exploration area.
Figure 9.2 – Project Area
9.1.5 Potential for soc ial cumulat ive impacts
The construction and development of a new mining operation with the possible creation of
jobs will lead to high levels of expectation and possibly result in an influx of job-seekers.
This has the potential of creating numerous social problems for the area and will have
implications on the operation of the mine. A social impact assessment will need to be
completed in order to understand the influences and will directly facilitate the mine in the
management of its workforce, including issues related to housing and feeding schemes.

2017-136 104 of 145
November 2017
9.2 Regulatory Sett ing
9.2.1 Legis lat ion
Zimbabwe has a varied legislative framework related to mining, mineral processing and the
environment. The legislation provides a basis to ensure that mining activities are carried
out in a manner as to minimise damage to the environment.
Environmental Management Act (EMA) (Chapter 20:27)
The Environmental Management Act was passed in 2003 and seeks to bring Zimbabwean
environmental legislation in line with International Best Practice (IBP). The act provides for
the sustainable management of natural resources, protection of the environment, and
prevention of pollution, which includes water pollution and environmental degradation.
In terms of section 97 of the Act, an Environmental Impact Assessment (EIA) must be
conducted before any prescribed activity is carried out. Schedule 1 of the Act provides a list
of activities that require an EIA to be undertaken. This list includes mining activities.
Mines and Minerals Act (MMA) (Chapter 21:05)
The Mines and Minerals Act and accompanying regulations including various publications
by the Ministry of Mines form the legislative and policy framework guidelines for all mining
related activities in Zimbabwe. Indications from government are that the act will be
revised.
The MMA aims to consolidate all laws relating to mines and minerals in Zimbabwe. It
covers all the issues governing acquisition and registration of mining rights, prospecting,
underground extensions, mining leases, rights and claims of landowners, abandonment and
forfeiture, royalties and the acquisition of land by holders of mining leases.
Water Act (Chapter 20:24)
The Water Act (now the ZINWA Act) is the law that regulates planning, development and
allocation of water resources and the control of pollution of surface and ground water
systems. It is based on the premise that all water other than private water is vested in the
state and its use, apart for primary purposes, requires that a water right be granted to the
user. It also contains provisions that ensure that water resource management is consistent
with broader environmental procedures. The discharge of effluent or waste into any water

2017-136 105 of 145
November 2017
body is regulated by permits, which are issued with conditions in accordance with
prescribed standards.
Forest Act (Chapter 19:05)
This act regulates the clearing of forests, focussing mainly on those areas that provide a
habitat for endangered species.
Parks and Wildlife Act (Chapter 20:14)
This act generally seeks to protect wildlife that may be affected by poaching.
Public Health Act (Chapter 15:09)
This act regulates the following:
o The control of infectious diseases;
o The provision of suitable water supplies;
o Pollution of water resources;
o Provision of sanitary facilities;
o Control of sexually transmitted diseases.
9.2.2 Equator Princip les
Should the project require institutional funding in all likelihood the Equator principles
would apply. The following is a brief description.
The Equator Principles (EP) is a financial industry benchmark for determining, assessing and
managing social & environmental risk in project financing. A number of banks, exchanges
and organizations worldwide have adopted the Principles as requirements to be
undertaken for funding. Furthermore, certain funding institutions have not formally
adopted the Principles, but require clients to be compliant with them in order to qualify for
loans.
The Equator Principles require an EIA to address the following:
o Assessment of baseline environmental and social conditions;
o Requirements under host country laws and regulations, applicable international
treaties and agreements;
o Sustainable development and use of renewable natural resources;
o Protection of human health, cultural properties and biodiversity, including endangered
species and sensitive ecosystems;
o Use of dangerous substances;

2017-136 106 of 145
November 2017
o Major hazards;
o Occupational health and safety;
o Fire prevention and safety;
o Socioeconomic impacts;
o Land acquisition and land use;
o Impacts on indigenous peoples and communities;
o Cumulative impacts of existing projects, the proposed project, and anticipated future
projects;
o Participation of affected parties in the design, review and implementation of the
project;
o Consideration of feasible environmentally and socially preferable alternatives;
o Efficient production, delivery and use of energy, and
o Pollution prevention and waste minimization, pollution controls, and solids and
chemical waste management.
9.2.3 Standards and Requirements
Zulu Lithium will as a minimum requirement develop the Zulu Project in compliance with
the requirements and standards as regulated by the Zimbabwean legislation. Depending on
the source of funding and the requirements of the funders, the Equator Principles, World
Bank, and International Best Practice related to mining may then apply.
9.3 Description of the Biophysical Env ironment Like ly to be Impacted by the Mining Operat ions
9.3.1 Topography
In a broader sense, topography is concerned with local detail, including not only relief but
also vegetative and man-made features, and even local history and culture. Topography
specifically involves the recording of relief or terrain, the three-dimensional quality of the
surface, and the identification of specific landforms. Figure 9.3 shows a high level plan of
the topography of Zimbabwe.

2017-136 107 of 145
November 2017
Figure 9.3 – Topography of Zimbabwe
The surrounding natural relief has not been altered through the development of an open
pit and placement of tailings dams and mining infrastructure. The topographical profile and
landform will be permanently altered by the development of a mining project however.
Influence on the project
Due to the effect on the topography, on completion of mining operations the following may
be required:
o The closure plan may require the shaping and contouring of the ridgeline.
o This aspect may increase the cost of rehabilitation.
o It is not expected to have an immediate effect on project economics or engineering
9.3.2 Soi l, Land Use and Capabi l ity
Historical land use
The Zulu Project is located in an agricultural setting. The current land use is primarily
subsistence farming of cattle and maize.

2017-136 108 of 145
November 2017
Existing structures
The most important structures influencing soil capability and future land uses are the
presence of adhoc community houses, the establishment of maize paddocks through
indiscriminate bush clearing.
Influence on the project
The development and presence of tailings dams, rock dumps and open pit will have an
impact on future land use post closure however at this stage it is not expected to influence
project economics or engineering.
9.3.3 Biodiversity (Fauna and Flora)
Biodiversity is defined as “the variability among living organisms from all sources and the
ecological complexes of which they are a part of”:
o It covers the pattern and process of living organisms and ecosystems.
o It covers the genetic diversity within a species (within populations or strains of the
same species), the diversity of different species (plant and animal species, micro-
organisms), and the diversity of ecosystems (e.g. different ecosystems on land,
freshwater ecosystems, marine ecosystems).
o It can focus on a spectrum of spatial scales, from localized small sites in an urban
environment, to catchments and regional landscapes, to global level.
o The diversity of life in an ecosystem helps the ecosystem to cope with, and recover
after disturbance. As a general rule, biodiversity gives resilience to ecosystems.
Impact assessment is carried out to enable us to ‘look before we leap’ into development.
Its purpose is both to influence the policy-making and/or planning process, and to inform
decision making on development proposals. Its aims to anticipate and prevent, minimize
and/or manage, potentially significant negative impacts of development that may:
o Cost money to rectify in future;
o Pose risks to lives, livelihoods or health of current and future generations; and
o Result in irreplaceable loss of resources and reduced options for future wellbeing.
o It also helps to seek out opportunities to optimize potential benefits of development.
Human activities can be direct drivers of change to biodiversity and ecosystem services,
either by causing changes in the natural environment, or as a result of social and micro-
economic changes that are known to affect the natural environment. In addition, human
activities can be indirect drivers of change through changes in social, cultural and economic

2017-136 109 of 145
November 2017
policies or practices. Of particular importance with regard to human activities impacting on
biodiversity are the following points:
o Conversion of natural habitat is the main cause of loss of biodiversity worldwide.
o Alien organisms, once introduced, can invade local ecosystems, ousting the indigenous
plants and/or animals and changing these ecosystems. Invasion of natural or semi-
natural habitats by alien organisms is the second biggest culprit responsible for loss of
biodiversity and degradation of ecosystems.
o The fragmentation of natural habitats interferes with ecological processes at a
landscape scale, isolates living communities, and can lead both to loss of biodiversity
and a reduction in the viability of ecosystems in the long term.
Potential drivers of change as a result of the Zulu Project:
Direct drivers of change may include the following:
o Housing, mining footprint and infrastructure development invariably results in clearing
of natural vegetation, potential changes in drainage patterns, and destruction of
habitat.
o The clearing of vegetation could in itself destabilize soils, change local water balances,
encourage the spread of alien organisms, or result in the loss of pollinators that are
important for local crop production.
o Infrastructural and solid waste development often results in water pollution that affects
a range of organisms and ecosystems, and may change the quality or quantity of
available water.
o Damming, diversion and disturbance or extraction of surface water within a catchment
can drastically reduce the water available to downstream users and ecosystems. The
reduced water flows can in turn result in changes in water quality, and changes in the
structure, composition and processes in fresh water ecosystems. Of particular
importance is the destruction of the functional integrity of the local catchment from
mining activities and pollution from tailings structures.
o Mining induced cone drawdown and dewatering, and pumping of groundwater can lead
to a drop in the water table, in turn leading to drying up of boreholes.
o Development in remote areas may open up previously inaccessible natural resources to
people, introducing an entirely new set of demands on the affected ecosystems.
Sustainable use of biodiversity means that harvests of renewable natural resources can be
maintained over time, that essential life-support systems can be maintained over time, and
that ecosystem services are essential for securing sustainable livelihoods.

2017-136 110 of 145
November 2017
Influence on the project
The biodiversity of the area has experienced continuous decay through subsistence farming
practices and the influx of people into the rural setting. The project will have an impact on
the immediate biodiversity footprint of the area however at this stage it is not expected to
influence project economics or engineering.
9.3.4 Surface Water
The single greatest threat to surface water at Project Zulu is stream diversion and pollution
through point and non-point sources. The close proximity of the stream shown in Figure 9.4
to the open pit and mine infrastructure such as the plant, tailings and rock dumps will more
than likely result in some form of pollution impact. An added risk is during high rainfall
events that flooding occurs.
Figure 9.4 – Surface Water Stream
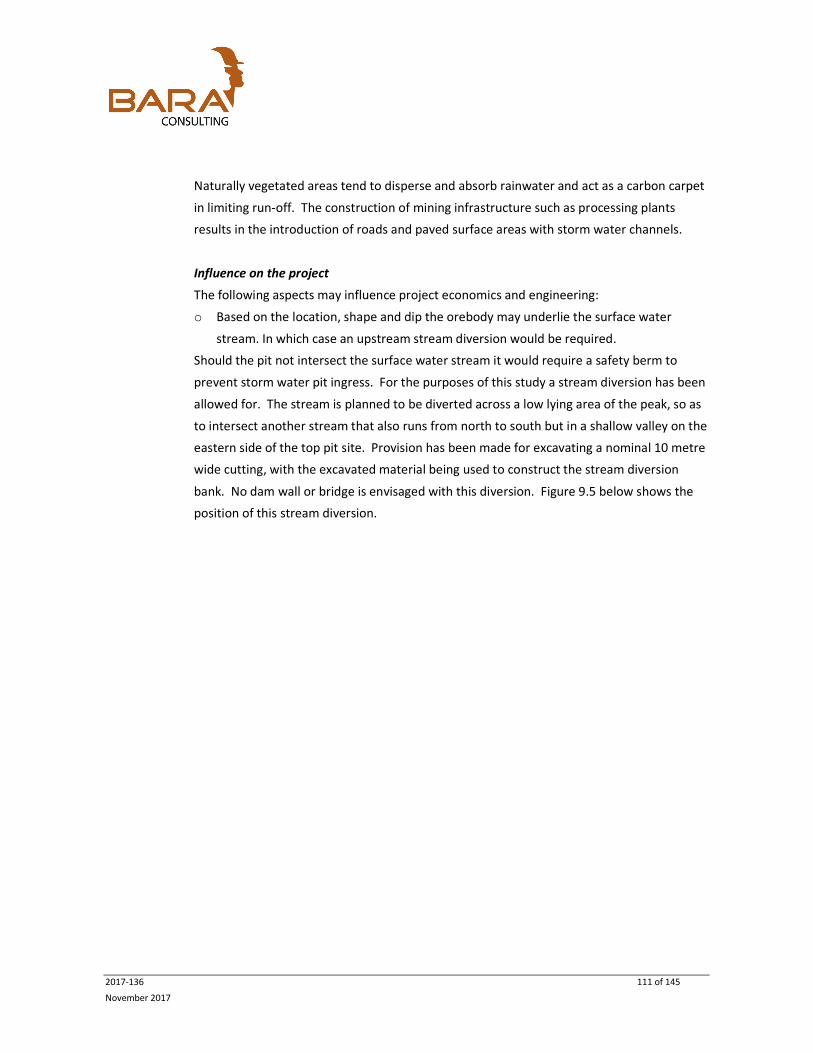
2017-136 111 of 145
November 2017
Naturally vegetated areas tend to disperse and absorb rainwater and act as a carbon carpet
in limiting run-off. The construction of mining infrastructure such as processing plants
results in the introduction of roads and paved surface areas with storm water channels.
Influence on the project
The following aspects may influence project economics and engineering:
o Based on the location, shape and dip the orebody may underlie the surface water
stream. In which case an upstream stream diversion would be required.
Should the pit not intersect the surface water stream it would require a safety berm to
prevent storm water pit ingress. For the purposes of this study a stream diversion has been
allowed for. The stream is planned to be diverted across a low lying area of the peak, so as
to intersect another stream that also runs from north to south but in a shallow valley on the
eastern side of the top pit site. Provision has been made for excavating a nominal 10 metre
wide cutting, with the excavated material being used to construct the stream diversion
bank. No dam wall or bridge is envisaged with this diversion. Figure 9.5 below shows the
position of this stream diversion.

2017-136 112 of 145
November 2017
Figure 9.5 – Position of Stream Diversion
The red line represents the existing stream that requires diversion into the stream running
parallel, in the same north-south direction, on the eastern side of the hill (blue line). The
green line represents the planned diversion across the hilly area. The position of the pits
and infrastructure cluster are also indicated on this figure.
A surface water specialist study is recommended in order to determine the overall
catchment parameters in relation to the placement of surface infrastructure such as the

2017-136 113 of 145
November 2017
new processing plant, tailings dam and rock dump. The study will determine drainage flood
lines for 1:100 and 1:50 year flood events. Of significant importance is the fact the open pit
may intersect the drainage line. The management of the potential flow with regard to
ingress into the pit will be important. The study will guide the construction of either a
diversion or protection berms and the management of surface flow including storm water
management of the tailings facilities to prevent mine “dirty water” being released into the
environment.
9.3.5 Groundwater
At present no underground or open pit mining operations are being undertaken. Currently
both the surface and ground water regimes of the broader project area are not negatively
impacted through any mining activities.
Influence on the project
The following aspects may influence project economics and engineering:
o Cone drawdown due to dewatering activities has the potential to lower the water table
and thereby alter the overall water table in area. This may result in boreholes drying up
or having to be drilled deeper to access water for the community (Figure 9.6).
o The volume of water reporting to working faces will need to be removed in order to
provide for safe working conditions. The potential volumes are critical for mine design
with regard to the required pumping systems.

2017-136 114 of 145
November 2017
Figure 9.6 – Community Borehole
An understanding of the ground water regime will be necessary in order to determine the
availability of water, and the potential for cone drawdown and ingress during open pit
operations. Hydrogeological drilling should be carried out with the objective of generating
hydrogeological (groundwater related) information.
9.3.6 Air Quality
At present the area does not experience deteriorated air quality. Air emissions at mines and
associated processing plants originate from a variety of different sources. These can
conveniently be grouped into mining operation, processing plant and haul road emissions.
Mining operations, which include activities such as land clearance, drilling, blasting,
excavation, material tipping and material transfer (haul truck, conveyor belts), crushing and
screening, account for most particulate emissions.

2017-136 115 of 145
November 2017
Potential impacts
The following emission sources were identified as possible sources of air emissions:
o Drilling and blasting operations;
o Excavation using bulldozers and front-end loaders;
o Material transfer into haul trucks;
o Hauling of ore (wheel entrainment);
o Material transfer into crusher;
o Crushing, screening and material transfer onto conveyor belt;
o Vehicle dust entrainment due to hauling of topsoil & spoils (overburden);
o Wind erosion of:
Exposed mining areas;
Topsoil stockpiles; and
Spoils (overburden) stockpiles;
o Transfer of ore from haul truck at processing plant;
o Vehicle dust entrainment due to road between mining area and process plant; and
o Tailings disposal area.
The most significant pollutants associated with the mine would include:
o Airborne Particulates:
Inhalable particulates, with aerodynamic diameters less than or equal to micron
(PM10) from all mining sources;
Total suspended particulates (TSP), which includes all particle sizes (generally only
up to about 100 µgm) from all mining sources; and
Diesel particulate matter (DM), being emitted from haul trucks and earthmoving
equipment.
o Gases from vehicles and blasting operations, including:
Oxides of nitrogen (NO and NO2, collectively known as NOx);
Sulphur dioxide (SO2);
Carbon monoxide (CO); and
Organic compounds, the most significant including benzene, formaldehyde, and
1,3-butadiene. (Petrol engines emit significantly more volatile organic emissions,
such as toluene, xylene, ethylbenzene, and many more, in addition to these organic
compounds.)

2017-136 116 of 145
November 2017
Influence on the project
The development and presence of tailings dams, rock dumps and open pit will have an
impact on the air quality in the area however at this stage it is not expected to influence
project economics or engineering. The ESIA that will be undertaken for the project should
include and air quality specialist study in order to determine the impacts on the local
communities and biophysical environment.
9.3.7 Noise
The word “noise” is generally used to describe sound that a listener finds disturbing,
annoying, offensive, or, in the extreme case, physically painful. There are six characteristics
of sound that generally describe noise, as a listener perceives it: intensity, frequency,
duration, loudness, annoyance, and offensiveness. Of these six characteristics, intensity,
frequency, and duration can be measured. Loudness (i.e., perceived sound intensity),
annoyance, and offensiveness are subjective and will vary widely with the perception of the
listener.
Due to proximity the local communities will experience mining related noise impacts such
as blasting, trucking noise, reverse hooters and plant operations.
Influence on the project
The development of Project Zulu will create noise that may influence communities in close
proximity however at this stage it is not expected to influence project economics or
engineering. The ESIA that will be undertaken for project should include a noise specialist
study in order to determine the impacts on the local communities and biophysical
environment.
9.3.8 Sensit ive Landscapes
Wetlands, rivers, ridges and quaternary catchments, and cultural resources are regarded as
ecologically sensitive for a variety of reasons and therefore must be protected from impacts
related to mining, development, and road, railway, powerline and pipeline crossings.
Ridges
o Ridges form biodiversity hotspots providing resources needed for survival, reproduction
and movement. They are also ideal refuges for wildlife in disturbed landscapes. This is
particularly significant at Project Zulu as the floodplains and savannah are compromised
through subsistence farming and bush clearing.

2017-136 117 of 145
November 2017
o Ridges provide vital habitat for many threatened, rare and endemic species of fauna
and flora.
o Ridges, and the interface between the lower slopes and the flat ground adjoining a
ridge, provide an important habitat required for the completion of the life cycles of
many invertebrates, many of which provide essential ecosystem services (e.g.
pollination).
o Ridges form naturally existing corridors that can functionally interconnect isolated
natural areas and therefore play an important role in wildlife dispersal.
o Other ecological processes associated with ridges, which are important for the
maintenance and generation of biodiversity, include evolutionary processes,
hydrological processes and pollination.
Influence on the project
A portion of the ridge at Project Zulu will be permanently destroyed due to mining
activities, however at this stage it is not expected to influence project economics or
engineering. The ESIA that will be undertaken for project should include a detailed post-
closure rehabilitation plan of the ridgeline in order to blend with the current topographical
profile.
9.4 Description of the Social Environment Likely to be Impacted by the Mining Operat ions
9.4.1 Introduct ion
Social Impact Assessment includes the processes of identifying, analysing and ranking the
intended and unintended social consequences, both positive and negative, of planned
interventions (policies, programs, plans, projects) and any social change processes invoked
by those interventions. Its primary purpose is to bring about a more sustainable and
equitable biophysical and human environment.
In the context of the broader socioeconomic and political environment of Zimbabwe the
ability for Project Zulu to acquire the “social license” to mine will be of strategic
importance. Therefore, the design, execution, management and implementation of the
social and human resources policies will be guided by and remain centrally focused on this
principle.

2017-136 118 of 145
November 2017
The Social Impact Assessment forms part of the Environmental Impact Assessment, and in
particular is guided by the objectives of Zimbabwe’ Environmental Management Act, which
are to ensure that:
o Every person shall have a right to:
A clean environment that is not harmful to health;
Access to environmental information; and
Protect the environment for the benefit of present and future generations and to
participate in the implementation of the promulgation of reasonable legislative,
policy and other measures that:
Prevent pollution and environmental degradation; and
Secure ecologically sustainable management and use of natural resources while
promoting justifiable economic and social development.
The requirements of The Equator Principles, should they apply which, for the purposes of
Social Impact Assessment (SIA) require that it address:
o An assessment of baseline social conditions,
o Requirements under host country laws and regulations, applicable international
treaties and agreements,
o Protection of human health and cultural properties,
o Socio-economic impacts,
o Land acquisition and land use,
o Impacts on indigenous peoples and communities,
o Cumulative impacts of existing projects, the proposed project, and anticipated future
projects,
o Participation of affected parties in the design, review and implementation of the
project,
o Consideration of feasible environmentally and socially preferable alternatives, and
o Consultation, in a structured and culturally appropriate way, with project affected
groups, including indigenous peoples and local NGOs.
The critical items are primarily aligned to the concept of designing for closure and the
principals of sustainable development. In essence, the general ethos of mining for closure
is captured by integrated mine planning, where a mine closure plan should be an integral
part of a project life cycle and be designed to ensure that:
o Future public health and safety are not compromised;
o Environmental resources are not subject to physical and chemical deterioration;
o The after-use of the site is beneficial and sustainable in the long term;

2017-136 119 of 145
November 2017
o Any adverse socio-economic impacts are minimised; and
o All socio-economic benefits are maximised.
It is also held that all this needs to be achieved so that future public health and safety are
not compromised; environmental resources are not subject to physical and chemical
deterioration in the long term; and that the after-use of the site is beneficial and
sustainable in the long term.
9.4.2 Methodology
A project proponent must ensure that parties who are interested in and/or likely to be
affected by the proposed project are fully informed and consulted. Ideally these activities
are conducted before major planning decisions are made.
An SIA cannot dictate to a project proponent the way in which the project is developed, and
it is not intended to do so. It is undertaken before development activities start, and it
methodically examines the range of socio-economic and cultural contexts of any
community, institution, organisation or individuals that could be impacted by the proposed
development. It comprehensively identifies potential negative impacts and benefits, and in
so doing can influence the planning process by presenting project proponents with
alternative development possibilities and a sound basis for their decisions.
From a social perspective, effective closure planning involves bringing together the views,
concerns, aspirations, efforts and knowledge of various stakeholders to achieve outcomes
that are beneficial to the mine and the affected communities. Even though the process of
engagement may not result in full consensus on closure outcomes, the process will be
considered to have been successful if it leads to fully informed decisions. The process of
engagement with stakeholders should be undertaken throughout the life of mine.
To achieve lasting benefits at local and regional level, the views of external stakeholders
will need to be understood. Consequently, the mining operation will need to be able to
support the benefits they intend to deliver. This involves identifying external stakeholders
and engaging them to foster a two-way understanding of what the mutually beneficial
outcomes will be.
A structured risk/opportunity assessment process, which focuses on social as well as health
and safety risks should be conducted in order to:
o Minimize the negative consequences of mining and closure;

2017-136 120 of 145
November 2017
o Maximize the positive benefits of mining and closure;
o Minimize the likelihood that closure goals will not be met; and
o Maximize the likelihood that opportunities for lasting benefits will be captured.
Influence on the project
o In all likelihood the residents of approximately six community houses would need to be
relocated. It is understood that this community is aware of the possibility that would
need to move. However, this aspect may influence the project should they refuse or
require compensation, which at this stage is unknown.
o Obtaining the social license to mine does come with economic risk in terms of
compensation.
9.5 Conclusion and Recommendat ions
9.5.1 Social
Based on the proximity to local rural communities a number of potential issues could
emerge. The most significant of these relate to community relocation, in-migration of job
seekers and the location of housing for the mineworkers, contractors and their families.
A critical aspect in terms of social engineering is to design the project with closure related
issues as the primary driver. The outcome will determine the most appropriate strategies
to foster social sustainability by providing post-mining skills, health, water, transport, and
education services and facilities in such a way that the responsibility and social liability does
not lie with the mine for the maintenance of the social infrastructure on closure.
No fatal flaws have been determined, however a number of key issues would need to be
addressed during the ESIA phase of the project.
9.5.2 Biophysical
It is inevitable that mining activities will impact on the biophysical environment and these
relate primarily to ground and surface water impacts with specific regard to diversion,
pollution from tailings dams and rock dumps and cone drawdown.
The development of Project Zulu will consequently increase the potential impacts related to
these factors. It is therefore important to undertake the recommended specialist studies in
order to gain an understanding of the baseline conditions in relation to the potential

2017-136 121 of 145
November 2017
impacts and to provide mitigation and avoidance measures. A key determinant is to design
the operation with,
1. Mine closure as the key design determinant,
2. Preventing accumulation of impacts, and
3. Rehabilitation of facilities to provide a sustainable land use post-closure.
The most important issues to be assessed in the ESIA phase with regard to biophysical
impacts are:
1. The location and design of the tailings storage facility, rock dumps and the metallurgical
plant.
2. The diversion and management of surface water structures.
3. Ground and surface water management strategies to provide safe mining conditions,
prevent the loss of mining production due to water ingress, and pollution post closure.
No fatal flaws have been determined. However, in terms of closure, water pollution will
remain the key issue.
9.5.3 Recommendat ion
In order to provide information as part of the mine design and should the PEA confirm the
project, the following specialist studies are recommended as part of the ESIA process:
1. A detailed social assessment be undertaken, which will focus on skills availability, living
conditions, reliance on mining activities, school going children, employment rates,
services capacity, capacity to absorb in-migration, crime, medical services, availability
of housing and land, employment levels, and issues related to poverty. Discussion with
local and regional government structures to provide project information, closure
objectives, synergies, and skills development potential.
2. A detailed ground water study to determine a complete understanding of the aquifer
and water related conditions that will influence the mining operations in order to
design facilities for safe mining conditions, to prevent operational pollution and
pollution on closure.
3. A detailed surface water study to understand the catchment parameters that will
influence the mining operation in order to design effective storm water and mine dirty
water management systems. The principle intention will be the prevention of
operational pollution and future pollution post closure.
4. Biodiversity specialist study to ensure the fair and equitable sharing of benefits arising
from the use of biodiversity that is in-line with sustainable development. To determine
where the negative impacts of the development will lead to an increase in vulnerability

2017-136 122 of 145
November 2017
of poor people, and/or where society as a whole is left worse off with regard to
ecosystem services as a result of the development.
5. An air quality study to determine the cumulative impact that will occur as a result of
mining activities and emissions from processes and tailings facilities.
6. A noise assessment is proposed in order to determine the impact on receptors on the
area as high levels of mining noise increases community activism and resistance.
7. A heritage/archaeological assessment to determine the presence of historical features
and the ‘sense of place” of the area.
8. Undertake consultation with key stakeholders such as municipalities and local
government structures and include local communities, chiefs and community leaders to
determine the baseline conditions and potential project impacts.
10 LITHIUM MARKET SURVEY
The following section details findings of public domain research on the lithium market. The
following aspects have been considered in the study:
o Global supply and demand
o Lithium uses
o Forecasts of demand and pricing
o African lithium projects.
10.1 Market Overv iew Future growth of the lithium market is being driven by the globally expanding electric
vehicle (EV) market, with the lithium-ion battery offering the best power supply solution.
Traditional lithium markets include; glass, ceramics, medicine, mobile technology and
lubricating grease, growth within these markets is expected to be stable in the foreseeable
future.
Investment house reports, published in 2016, expect lithium demand to at least triple by
2025, from the 184 kt lithium carbonate equivalent (LCE) production of 2015, primarily
driven by the EV and energy storage markets, using lithium-ion batteries. However, the
research differs as to whether the global supply will be in surplus or deficit. Deutsche Bank
expects the current production deficit to continue up until 2017 with surplus production
occurring from 2018 to 2025. Swiss Resource Capital expects the supply deficit to continue
beyond 2025.

2017-136 123 of 145
November 2017
Figures 10.1 and 10.2 provide graphs of the forecasted lithium concentrate (6%) and lithium
carbonate (99.5%) prices from various market sources. It is noted that the figures provided
were published during 2016 and there have been significant governmental policy changes
regarding EVs in the interim. Many countries have indicated plans to discontinue new sales
on cars with internal combustion engines, the time frames of these targets vary for each
country with the following list provided for information:
o United Kingdom – 2040
o France – 2040
o Germany – 2030
o India – 2020
o China – No published time frame
This has the potential to accelerate the EV growth program and place additional demand on
the lithium market.
Figure 10.1 - Lithium Concentrate Price Forecast

2017-136 124 of 145
November 2017
Figure 10.2 - Lithium Carbonate Price Forecast
The current (September 2017) spot price for 6% spodumene is provided at US$ 870 to
US$ 935/tonne, from Industrial Minerals, CIF China. This price is higher that the forecasted
prices listed.
10.2 Background Information Lithium is commercially extracted from two sources; hard rock and brines.
10.2.1 Hard Rock
Granite pegmatite ore bodies are the hard rock source of lithium. Lithium minerals
occurring in granite pegmatites include:
o Spodumene
o Apatite
o Lepidolite
o Tourmaline
o Amblygonite
Spodumene is the most commonly occurring lithium hard rock mineral, historically being
the number one source of lithium.

2017-136 125 of 145
November 2017
10.2.2 Brines
Lithium brine deposits are accumulations of saline ground water enriched with dissolved
lithium. Processing is done by means of evaporation ponds, achieving concentrations of
between 1 and 2 % which are suitable for end user input.
Brine extraction is viewed as the main source of lithium going forward. Brine produces
lithium chloride directly, however the process has a long production time frame, eighteen
months to three years. Brines are more widespread, typically larger in resource scale and
have lower production costs than hard rock sources.
Research is ongoing into the refinement of lithium brines, companies are currently
exploring methods of refining lithium brine without the use of evaporation. If successful,
this would become a game changer for the lithium market. More brine deposits would
become economical and existing operations could change production methods to capitalise
on cheaper processing costs.
10.3 Global Supply and Demand Lithium is used for a wide range of products including; lubricating grease, glass fabrication,
ceramic glazes, medicine, mobile phones and automotive batteries. With the anticipated
boom of the electric vehicle market the growth in battery sales is expected to significantly
ramp up lithium demand. The sections below provide key information from the public
domain information reviewed.
10.3.1 World Mine Product ion and Reserves
According to the U.S. Geological Survey, Mineral Commodity Summaries lithium production
increased by an estimated 12 % in 2016 following an increase in demand from battery
applications. The following information is taken from their report:
“Lithium supply security has become a top priority for technology companies in the United
States and Asia. Strategic alliances and joint ventures between technology companies and
exploration companies continue to be established to ensure a reliable, diversified supply of
lithium for battery suppliers and vehicle manufacturers. Brine operations were under
development in Argentina, Bolivia, Chile, China, and the United States; spodumene mining
operations were under development in Australia, Canada, China, and Finland; a jadarite
mining operation was under development in Serbia; and a lithium‐clay mining operation
was under development in Mexico. Additional exploration for lithium continued, with
numerous claims having been leased or staked worldwide.” Source U.S. Geological Survey,
Mineral Commodity Summaries, January 2017.

2017-136 126 of 145
November 2017
Table 10.1 provides the information on the global lithium production and reserves and
Table 10.2 provides the global resource estimates.
Table 10-1 - Lithium World Mine Production and Reserves
Location Mine Production Reserves (t)
2015 2016
United States Withheld Withheld 38,000
Argentina 3,600 5,700 2,000,000
Australia 14,100 14,300 1,600,000
Brazil 200 200 48,000
Chile 10,500 12,000 7,500,000
China 2,000 2,000 3,200,000
Portugal 200 200 60,000
Zimbabwe 900 900 23,000
World Total (Excludes
US production)
31,500 35,000 14,000,000
Source U.S. Geological Survey, Mineral Commodity Summaries, January 2017.

2017-136 127 of 145
November 2017
Table 10-2 - Lithium World Resources
(Major Producing Countries)
Location Resources (t)
United States 6,900,000
Argentina ̴9,000,000
Bolivia ̴9,000,000
Australia >2,000,000
Chile >7,500,000
China ̴7,000,000
Canada 2̴,000,000
DRC ̴1,000,000
Russia ̴1,000,000
Serbia ̴1,000,000
Brazil ̴200,000
Mexico ̴200,000
Austria >100,000
Zimbabwe >100,000
Total World Resource ̴47,000,000
Source U.S. Geological Survey, Mineral Commodity Summaries,
January 2017.
10.4 Afr ican Lithium Projects The following lithium projects have been identified in Africa:
10.4.1 Bikita Lithium Mine – Bik ita Minerals
Location: Masvingo, Zimbabwe
The operation has a peak production capacity of 50 ktpa, with planned production rate
increase to 80 ktpa following plant upgrades and geological exploration.
“The Bikita mine has reserves amounting to 10.8 million tonnes of lithium ore grading 1.4%
lithium thus resulting 0.15 million tonnes of lithium – Wikipedia”

2017-136 128 of 145
November 2017
10.4.2 Project Zulu – Premier Afr ican Minerals
Location: Zimbabwe, 80km from Buluwayo
The project is currently at study level with drilling program ongoing. Information available is
as follows:
“The Zulu Project has substantial resources. Following a successful 2,500 metres diamond
drilling programme between September 2016 and February 2017, Premier published a
Maiden SAMREC compliant Inferred Mineral Resource Estimate of 20.1 million tonnes
grading 1.06% Li2O and 51 ppm Ta2O5 using a cut‐off grade of 0.5% Li2O. The Mineral
Resource Estimate contains 526,000 tonnes of Lithium Carbonate Equivalent (“LCE”) and
1,025 tonnes of Tantalum Pentoxide. The Mineral Resource Estimate covers only 35% of
Zulu’s known 3.5km surface strike length and the drilling continues to upgrade and expand
this Mineral Resource Estimate as the deposit remains open at depth and along strike.”
Source https://www.premierafricanminerals.com/zimbabwe/zulu-project.
10.4.3 Arcadia Lit hium Pr oject – Prospect Resources
Location: Zimbabwe, Harare
“Globally significant hard rock lithium resource and has been aggressively developed
focussing on near term production of petalite and spodumene concentrates.”
July 2017 information: Maiden ore reserve of 15.8 million tonnes, grading 1.34% lithium
oxide and 125 parts per million tantalum pentoxide. Prospect Resources anticipate the
project will be developed into a 1,2 million tonne a year mining and processing operation.
(Separate article 20/01/2017 – 36million ton resource at 1.17% Li2O.)
10.4.4 Botswana Lith ium Br ine Project – Lithium Consolidated Mineral
Exploration (LCME)
Location: Makgadikgadi Pans in north eastern Botswana
6 Prospecting licences and 2 exploration license applications over a total area of 5680 km2.
Brines containing lithium from the Sua Pan, the largest pan in the system, have been
documented in historical reports to have grades up to 0.224 g/l.
10.4.5 Goulamina L ith ium Project – Bir imian
Location: Bougouni Region of southern Mali
The Project hosts a spodumene (lithium) pegmatite deposit at Goulamina with a published
Mineral Resource (compliant with JORC 2012 Reporting Guidelines) of 32.9 Mt @ 1.37%
Li2O (0.4% Li2O cut-off, 451,000t contained Li2O).
Pre-feasibility study level.

2017-136 129 of 145
November 2017
10.4.6 Bougoni L ith ium Project – Kodal Minerals
Location: Southern Mali
July 2017 Information
Exploration phase select drill results: intersection of 7 m at 1.52% lithium oxide (Li2O) from
79 m.
10.4.7 Kar ibib Lithium Project – Auroch Minerals
Location: Namibia
Exclusive prospecting licenses in same region as Helikon and Rubikon – historic lithium
producing mines. Auroch has applied for a further five EPLs in the Erongo region of Namibia
which expands the potential for the Company to identify a commercial lithium resource.
10.5 Lithium Market Conclusions Based on the high level research undertaken the following commodity prices have been
selected for this study work as a base case. In addition, sensitivity analysis will be
undertaken on the revenue stream of the project evaluation:
o Spodumene concentrate > 6% - US$800/t
o Petalite concentrate ~4% - US$400/t
o Effective concentrate price based on split between Spodumene (72%) and Petalite
(28%) concentrates is approximately – US$688/t
o Lithium Carbonate 99.5% - US$15,000/t
11 FINANCIAL EVALUATION
11.1 Basis of Evaluat ion
11.1.1 Base date of costing and t er ms
The capital and operating costs, as well as the financial analysis presented in this chapter
have a base date of October 2017. The costs are presented in United States Dollars and
presented in real terms, exclusive of escalation and inflation.
11.1.2 Estimat ing methodology
The capital and operating cost estimates have been determined through the application of
database costs and estimated costs. A majority of these costs were obtained from recent
work undertaken through similar projects. The once the overall capital and operating was

2017-136 130 of 145
November 2017
calculated, the costs are scheduled at a high level in order to determine the cost spend over
the life of the project.
11.1.3 Estimate exc lus ions
The following costs were excluded from the capital cost estimate;
o Mine closure and rehabilitation cost.
o Head office costs and marketing fees.
o Import duties.
11.2 Capit al Cost
11.2.1 Def in it ion of capital cost
Build capital cost has been defined as the cost of all infrastructure and constructions within
the mine site. Build capital costs therefore comprise:
o The cost of the processing plant, which includes all infrastructure related to processing
the ROM ore.
o The cost of a tailings dam.
o The cost of mobilisation of the mining contractor.
o The cost of the surface infrastructure, which includes all services, infrastructure and
facilities used for the joint operation of the mine and process plant and the
accommodation camp.
o Indirect project costs, such as engineering costs, freight and contingency.
11.2.2 Presentat ion of capital cost
A summary of the capital costs incurred by the project is presented in Table 11-1.
Table 11-1 - Summary of Capital Cost
Capital Costs Total
[USD'mill] Surface Infrastructure 14.95 Concentrate Processing Plant 24.36 Mining 2.50 Tailings Dam 5.60 Indirect Cost 2.37 Contingency @ 30% 14.22 Total Capital Cost 64.01

2017-136 131 of 145
November 2017
Surface infrastructure cost, at USD 15.0 million, includes all services, infrastructure and
facilities used for the joint operation of the mine and process plant. Surface infrastructure
cost also includes provision for an accommodation camp. Surface infrastructure
commissioning is incurred in the years proceeding mine production. Detail of surface
infrastructure expenditure is presented in Table 11.2. The costs have been estimated from
the Bara cost database.
Table 11-2 - Summary of Surface Infrastructure Capital Cost
Area Total [USD’mill]
Surface Preparation 0.89 Camp Accommodation (Including feeding for 495 staff) 2.50 Surface Offices 0.30 Surface Workshop Building 0.29 Surface Stores Building 0.20 First Aid Facility 0.05 Explosive magazine 0.04 Sewage Treatment Plant 0.15 General Surface Infrastructure and Industrial Change house 0.55 ISO 14001 Compliance 0.05 Surface Workshop Tools 0.10 Design and Drawing 0.22 Vehicles 1.28 Bulk Power Supply 2.73 Bulk Water Supply 2.71 Road Upgrade 2.39 River Diversion 0.39 Tailings Return Water Facility Pump Station 0.12 Total 14.95
The processing plant capital cost, totalling USD 24.4 million, comprises the supply,
installation and commissioning costs of the infrastructure required to process ROM ore to
the spodumene and petalite concentrates. The entire plant is constructed and
commissioned at the start of the project, before production commences. A breakdown of
the capital cost is presented in Table 11.3.
The capital cost for the various sections of the plant has been determined using cost
information from the Bara database. These costs were then factorised according to the

2017-136 132 of 145
November 2017
tonnage throughput of each particular section, using tonnages from the mass balance. In
some cases, budget level equipment costs were obtained from equipment suppliers. These
costs were then factorised to allow for the additional equipment and costs in that particular
section of the plant. Allowances were added for civils and earthworks, installation and
transport. These factors were also obtained from the Bara database and were based on
figures provided by certain suppliers for individual section costs.
Table 11-3 - Summary of Processing Plant Capital Cost
Area Total
[USD’mill] Crushing 3.56 DMS 1.94 Ball milling- spodumene 1.12 Spodumene flotation 0.67 Reagent storage and make-up 0.15 Magnetic separation 0.68 Ball Milling - petalite 1.60 Petalite flotation 1.36 Thickeners -final tails and petalite flotation 1.45 Thickeners - spodumene and petalite concentrates 1.44 Filters - frame and plate 2.67 Water reticulation and pumping 0.63 Tailings pumps and pipelines 0.63 Laboratory 0.18 Earthworks and civils 15% of eqpt 2.71 Installation 15% of eqpt 2.71 Transport equipment to site 3% 0.54 Front end loader 0.30 Total 24.36
Mining contractor mobilisation and demobilisation costs have been capitalised. The initial
contractor mobilisation cost has been estimated at USD 1.5 million. This cost is incurred in
the first year of mining. A second contractor will be engaged to assist with additional waste
pushbacks over a four year period from years 6 to year 9. The mobilisation of this
contractor is estimated to cost USD 0.5 million and the cost is incurred at year 6. Finally,
demobilisation cost, expended at the end of the project is estimated at USD 0.5 million,
resulting in a total capitalised mining cost of USD 2.5 million.
A provision has been included for construction and commissioning of a tailings dam. This
cost is approximated at USD 5.6 million.

2017-136 133 of 145
November 2017
A provision has been included for indirect costs such as engineering design fees and
ongoing capital. This has been estimated at 5 per cent of the capital bill and equates to
USD 2.37 million. Similarly, a contingency allowance of 30 per cent of capital was included
at USD 14.22 million.
11.3 Operating Cost
11.3.1 Def in it ion of operating cost
Operating cost has been defined as the cost of all ongoing mining, processing and
operational activities. Operating costs defined in this section are C1 cash costs only, and
therefore comprise:
o The cost of contract mining the ore from the open pit mine, including the cost of all
man power and consumables.
o The cost of processing the ore to saleable products, including the cost of man power
and consumables.
o The cost of and bulk supply of power and water.
o The cost of maintaining the surface and underground infrastructure.
o The cost of transporting the concentrates to the point of sale.
11.3.2 Presentat ion of operating cost
A summary of the operating costs incurred by each option is presented in Table 11.4. The
operating cost is presented in USD per ROM tonne and USD per tonne concentrate.
Table 11-4 - Summary of Operating Cost Area USD'mill USD / t ROM USD / t conc.
Mining 270.33 19.66 169.82
Processing 244.97 17.82 153.88
Power/Water/Maintenance 95.15 6.92 59.77
General and Administration 27.50 2.00 17.27
Product Transportation 134.99 9.82 84.80
Total C1 Operating Cost 772.94 56.22 485.54

2017-136 134 of 145
November 2017
Figure 11.1 Summary of Operating Cost
The mining operating cost is the cost of contract mining, including mining consumables,
labour and mechanised equipment. Mining costs have been estimated at USD 3.0 per
tonne of rock mined and has been obtained from the Bara cost database and is based on
recent work done for open pit operations in Southern Africa. Where appropriate
adjustments have been made to the database cost to account for differences in fuel price.
The processing operating summary is presented in Table 11.5. The costs for crushing,
dense medium separation, milling and flotation and reagents are based on information
from the Bara Consulting database. The costs of the laboratory, tailings dam and other
costs are included these figures. The installed and operating power figures were estimated
from the equipment installed. These figures are an installed power of 4019 kW and an
operating power of 3014 kW. The plant utilisation factor has been estimated at 75 % and
the plant operating time 85%. The plant reagent cost has been estimated from those on
other projects. The reagent cost is significantly higher when compared to non-lithium
projects. The proposed flotation plant is complex and exhibits high reagent consumptions,
particularly in the petalite flotation. The cost of the potassium chloride and sodium
chloride added to enable petalite flotation to be carried out in a brine solution is significant.
The cost of labour for the processing plant has been determined through current in country
labour rates which were applied to the estimated labour schedule for the processing plant.
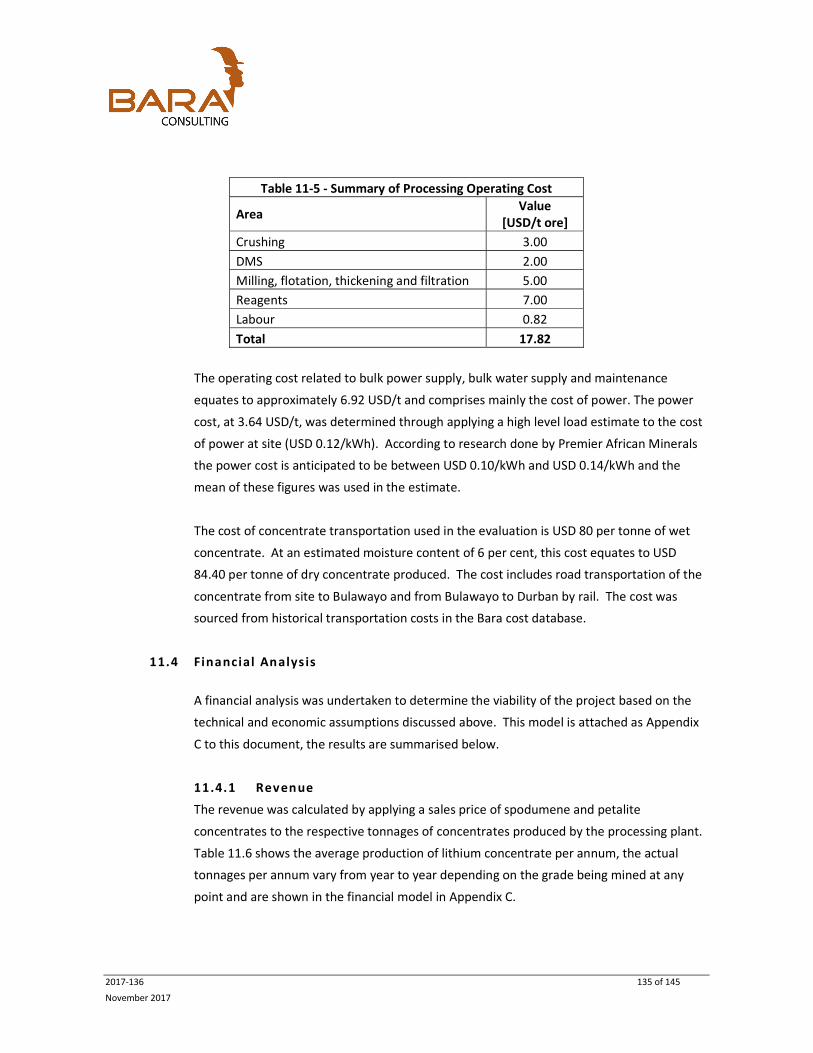
2017-136 135 of 145
November 2017
Table 11-5 - Summary of Processing Operating Cost
Area Value [USD/t ore]
Crushing 3.00 DMS 2.00 Milling, flotation, thickening and filtration 5.00 Reagents 7.00 Labour 0.82 Total 17.82
The operating cost related to bulk power supply, bulk water supply and maintenance
equates to approximately 6.92 USD/t and comprises mainly the cost of power. The power
cost, at 3.64 USD/t, was determined through applying a high level load estimate to the cost
of power at site (USD 0.12/kWh). According to research done by Premier African Minerals
the power cost is anticipated to be between USD 0.10/kWh and USD 0.14/kWh and the
mean of these figures was used in the estimate.
The cost of concentrate transportation used in the evaluation is USD 80 per tonne of wet
concentrate. At an estimated moisture content of 6 per cent, this cost equates to USD
84.40 per tonne of dry concentrate produced. The cost includes road transportation of the
concentrate from site to Bulawayo and from Bulawayo to Durban by rail. The cost was
sourced from historical transportation costs in the Bara cost database.
11.4 Financial Analys is
A financial analysis was undertaken to determine the viability of the project based on the
technical and economic assumptions discussed above. This model is attached as Appendix
C to this document, the results are summarised below.
11.4.1 Revenue
The revenue was calculated by applying a sales price of spodumene and petalite
concentrates to the respective tonnages of concentrates produced by the processing plant.
Table 11.6 shows the average production of lithium concentrate per annum, the actual
tonnages per annum vary from year to year depending on the grade being mined at any
point and are shown in the financial model in Appendix C.

2017-136 136 of 145
November 2017
The sales pricing was based on the information presented in the Marketing section of this
document. Table 11.7 presents the sales pricing used in the financial evaluation for the
calculation of revenue and the total revenue generated over the life of the project.
Table 11-6 - Average Concentrate Grade and Production Rates
Description Value Unit
Spodumene Concentrate Grade 6.24 %
Spodumene Concentrate Tonnes 83 768 tonnes /yr
Petalite Concentrate Grade 3.90 %
Petalite Concentrate Tonnes 32 528 tonnes / yr
Average Concentrate Grade 5.59 %
Total Concentrate Tonnes (Dry) 116 296 tonnes /yr
Table 11-7 - Concentrate Sales Pricing and Revenue Description Value Unit Product Pricing Spodumene Concentrate 800.00 USD / t Petalite Concentrate 400.00 USD / t
Revenue Spodumene Concentrate 917 328 825 USD Petalite Concentrate 178 104 173 USD Total Revenue 1 095 432 998 USD
11.4.2 Royalty
Royalty costs are based on standard calculations and conform to Zimbabwean guidelines. A
royalty cost of 2 percent of the revenue, less transport costs, was applied to the financial
evaluation. Royalty payments equate to USD 17.4 million over the life of mine, as
presented in Table 11.8.
Table 11-8 - Royalty Costs Description Value Unit Gross Value of Sales 960.44 USD’ million Royalty Rate 2.0 % Royalty Paid 19.21 USD’ million

2017-136 137 of 145
November 2017
11.4.3 Tax
Taxation calculations are based on standard calculations and conform to Zimbabwean
guidelines. The capital cost for the plant and machinery was deducted as a capital
allowance. A deductibility rate of 25 per cent to determine the tax depreciation as per the
guidelines. A tax rate of 25 per cent was applied to taxable income to determine the tax
owed.
11.4.4 Discounted cash f low analys is
A discount cash flow analysis (DCF) was performed to determine the financial feasibility of
the project. A summary of the DCF is presented in Table 11.9. The discounted cashflow is a
real terms model.
Table 11-9 - Financial Analysis Results Metric Value Unit Average Concentrate Sales Price 688.12 USD / t
Pre-Tax NPV10 127.32 USD’ millions
Pre-Tax IRR 85.9 %
Post-Tax NPV10 91.53 USD’ millions
Post-Tax IRR 65.0 %
Payback Period 2 years
Peak Funding Requirement - 38.42 USD’ millions
Operating Margin 27.7 %
The DCF analysis shows the project has a post-tax IRR of 65.0 percent and a NPV of USD
91.5 million at a discount rate of 10 percent. The payback period is 2 years, shown by the
point of break-even cumulative cash flow in Figure 11.2. The peak funding required to
realise the project is USD 38.4 million, as shown by the minimum cumulative cash flow in
Figure 11.2.

2017-136 138 of 145
November 2017
Figure 11.2 - Project Cash Flow
11.4.1 Sensitiv ity analys is
A sensitivity analysis was performed in order to determine the economic robustness of
the project. The analysis determined that the project is most sensitive to changes in
revenue for both NPV and IRR. A change in revenue could be affected by a variation in any
of the following factors, or a combination of these factors:
o In-situ grade
o Plant recovery
o Product price
The sensitivity of post-tax NPV is presented in Figure 11.3 and tabled in Table 11-10 while
the sensitivity of post-tax IRR is presented in Figure 11.4 and tabled in Table 11-11. The
sensitivity of payback period is presented in Figure 11.5 and tabled in Table 11-12.

2017-136 139 of 145
November 2017
Figure 11.3 - Post Tax NPV(10) Sensitivity
Table 11-10 - Sensitivity of Post-Tax NPV(10) with variance in Capex, Opex and Revenue Variance Capex Opex Revenue
-30% 105 189 055 175 160 616 -31 959 281 -20% 100 636 347 147 326 423 9 547 978 -10% 96 083 639 119 426 890 50 626 860 0% 91 530 931 91 530 931 91 530 931
10% 86 978 224 63 501 861 132 278 327 20% 82 425 516 35 401 894 173 061 459 30% 77 872 808 7 424 177 213 785 619

2017-136 140 of 145
November 2017
Figure 11.4 - Post Tax IRR Sensitivity
Table 11-11 - Sensitivity of Post-Tax IRR with variance in Capex, Opex and Revenue Variance Capex Opex Revenue
-30% 101.0 92.4 - -20% 85.9 83.6 22.1 -10% 74.3 74.5 46.2 0% 65.0 65.0 65.0
10% 57.4 54.6 82.3 20% 51.1 42.9 99.2 30% 45.8 26.5 115.7

2017-136 141 of 145
November 2017
Figure 11.5 - Payback Period Sensitivity
Table 11-12 - Sensitivity of Payback Period with variance in Capex, Opex and Revenue Variance Capex Opex Revenue
-30% 101.0 92.4 - -20% 85.9 83.6 22.1 -10% 74.3 74.5 46.2 0% 65.0 65.0 65.0
10% 57.4 54.6 82.3 20% 51.1 42.9 99.2 30% 45.8 26.5 115.7

2017-136 142 of 145
November 2017
Sensitivity analysis results for changes Petalite and Spodumene Concentrate pricing is
presented in Table 11-13.
Table 11-13 – Petalite and Spodumene Pricing Sensitivity
Petalite Price
Post Tax NPV Post Tax IRR Payback Period
[USD / t] [USD’million] [%] [years] 100.00 41.62 41.74 2.00 200.00 58.24 49.89 2.00 300.00 74.91 57.60 2.00 400.00 91.53 64.97 2.00 500.00 108.12 72.12 2.00 600.00 124.66 79.14 2.00 700.00 141.25 86.06 2.00
Spodumene
Price Post Tax NPV Post Tax IRR Payback Period
[USD / t] [USD’million] [%] [years] 600.00 5.74 18.60 3 700.00 48.71 45.28 2 800.00 91.53 64.97 2 900.00 134.19 83.13 2
1 000.00 176.88 100.72 2 1 100.00 219.50 118.04 2
11.4.1 Lit hium Carbonate Option
In addition to considering the sale of spodumene and petalite concentrates, a secondary
option of selling lithium carbonate was evaluated. The option entailed transportation of
spodumene and petalite concentrates from the mine site to a lithium carbonate plant in
Bulawayo.
The operating and capital cost of the lithium carbonate plant was added to the evaluation.
Operating costs were estimated at 2,100 USD per tonne Li2CO3 and capital costs were
estimated at USD 130 million for the plant.
An 86 per cent recovery on lithium from the concentrates was included, as discussed in
the metallurgical section of this report.

2017-136 143 of 145
November 2017
The sales pricing for Lithium Carbonate used in the evaluation is USD 15,000 per tonne
Li2CO3.
The results of this option are summarised in Table 11.14 below.
Table 11-14 - Financial Analysis Results (Lithium Carbonate Option)
Metric Value Unit Li2CO3 Sales Price 15 000 USD / t
Pre-Tax NPV10 718.94 USD’ million
Pre-Tax IRR 80.4 %
Post-Tax NPV10 534.06 USD’ million
Post-Tax IRR 69.1 %
Payback Period 2 years
Peak Funding Requirement - 177.85 USD’ million
Operating Margin 60.6 %
The evaluation result shows a considerable improvement in the post-tax IRR and NPV for
the lithium carbonate option. This is primarily due to an increase in operating margin. The
improvement does however come at the expense of a much higher funding requirement,
brought by the inclusion of the lithium carbonate plant.
12 CONCLUSIONS AND RECOMMENDATIONS
The results of the scoping study have shown that the Zulu Lithium Project has economic potential
and that it is worthy of further evaluation. Based on the scope of work undertaken, no material
technical risks or fatal flaws have been identified to date.
It is proposed that the following next steps be taken to further understand the project and to
reduce the risk profile:
o Undertake additional exploration drilling to increase level of confidence in the mineral resource
and to identify additional resources.
o Undertake additional metallurgical test work in parallel with exploration drilling work to save
time and cost during later study work as follows:
Conduct testwork using the process route selected, i.e. DMS followed by flotation on the
spodumene and mixed fractions resulting from the DMS separation. It will also need to be

2017-136 144 of 145
November 2017
established whether mica flotation is required prior to each spodumene flotation step as a
micaceous fraction was removed by DMS.
Conduct locked cycle test work for spodumene and petalite flotation to confirm overall
flotation recoveries and the influence on concentrate grade and recovery when
recirculating cleaner tailings.
Determine whether saleable mica and feldspar products can be produced from the tailings
streams from DMS and flotation.
Investigate whether the tailings dam return water can be re-used in the plant or whether it
will need to be treated prior to discharge to the environment. With the wide variety of
chemicals being added to the spodumene and petalite flotation circuits, it may not be
possible to re-use the tailings return water in either circuit.
o Undertake a more detailed geotechnical evaluation to include a geotechnical drilling program
at the pits identified and laboratory test work on cores recovered. Currently scoping level work
has been undertaken, further work will involve drilling cores for laboratory test work (UCS, etc)
and more detailed analysis focused on the areas where mining will take place. It is
recommended that this program run in parallel to the exploration program to save costs and
time in future study work.
o Undertake ground water study work to determine the quantity and quality of groundwater in
the area, this will be an important input into future study work.
o Initiate ESIA baseline studies.
o Once the mineral resource has been upgraded, initiate work on a feasibility study.
13 REFERENCES
1.) 2017-136-NFR-001-RB – Site Visit Report – Bara Consulting – September 2017
2.) Summary Report on the Zulu Lithium Pegmatites, Insiza District, Matabeleland South,
Zimbabwe – Premier African Minerals – April 2016
3.) U.S. Geological Survey, Mineral Commodity Summaries, January 2017
4.) Deutsche Bank – Lithium 101 Market Report – May 2016
5.) Macquarie Wealth Management Global Lithium Report – 31 May 2016
6.) Swiss Resource Capital Lithium Report –2016
7.) Website research:

2017-136 145 of 145
November 2017
a. Investing News Network
b. Mining.com
c. Wikipedia
d. Premier African Minerals
e. Prospect resources
f. Lithium Consolidated Mineral Exploration (LCME)
g. Birimian
h. Kodal Minerals
i. Auroch Minerals

2017-136
November 2017
Qualified Person Certificate

2017-136
November 2017
CERTIFICATE OF COMPETENT PERSON
I, Andrew David Pooley, consent to the filing of this scoping study report and do hereby certify that:
1. I am currently employed as Managing Director and Principal Consultant by:
Bara Consulting (Pty) Ltd.
1st Floor, Cresta Corner
Judges Avenue
Cresta
Johannesburg
South Africa
2. I hold the following qualifications and affiliations:
a. Honors Degree in Mining Engineering from Nottingham University in the UK (B.Eng. (Hons)).
b. Registered as a Professional Engineer (Pr. Eng.) with the Engineering Council for South
Africa (ECSA).
c. Fellow in good standing of the Southern African Institute of Mining and Metallurgy
(FSAIMM).
3. I have been involved in the mining industry for 23 years in various roles including production,
project development and consulting. I consider myself by reason of my education, my affiliations
and my experience to be a Competent Person as defined in the definitions of the SAMREC Code.
4. I confirm that I have not had any prior involvement with this property except for the undertaking of
scoping level studies.
5. I have visited the site from the 4th to the 6th September 2017.
6. I have undertaken an internal review of the Zulu Lithium Project Scoping Study report.
7. I am independent of the issuer as defined in the SAMREC Code.
8. I have read the SAMREC Code 2016 edition.
6th November 2017
……………………………. …………………….
Andrew David Pooley Date
B.Eng. (Hons), Pr. Eng. FSAIMM
Engineers Involved in Zulu Lithium Scoping Study

2017-136
November 2017
Nicholas Kingaby – Mining Engineer
Higher National Diploma Mining (Technicon Witwatersrand)
Mine Manager Certificate of Competency Metalliferous Mines (South Africa)
Member SAIMM
Roy Shiri – Geotechnical Engineer
B.Sc (Hons) Engineering and Environmental Geology (University of Zimbabwe)
M.Sc (Physics) (University of the Witwatesrand Johannesburg)
Graduate Diploma in Engineering – Advanced Mechanics of Solids (University of the Witwatesrand)
SA Chamber of Mines -Strata Control Certificate
SA Chamber of Mines-Rock Engineering Certificate
Associate SAIMM
Associate SANIRE
Richard Way – Metallurgical Engineer
B.Sc Chemistry (University of London)
Diploma of Imperial Collage (Mineral Processing)
M.Sc Mineral Process Design (Imperial Collage)
Fellow SAIMM
Member South African Mine Metallurgical Managers Association
Allan du Plessis – Mine Infrastructure Engineer
Higher National Diploma Electrical Engineering
GECC Electrical Engineering Certificate
GECC Mechanical Engineering Certificate
Professional Certified Engineer Engineering Council of South Africa
Etienne de Villiers – Mine Infrastructure Engineer
B. Eng Mechanical Engineering (University of Stellenbosch)
Edward Baldrey – Electrical Engineer
B.SC Electrical Engineering (University of Natal)
Registered Professional Engineer, Engineering Council of South Africa
Member SAIEE

2017-136
November 2017
Appendix A – Bara Consulting Site Visit Report

2017-136
November 2017
Appendix B – Zulu Project Geological Report

2017-136
November 2017
Appendix C – Financial Models Summary Sheets
Copyright © 2022 FDOKUMEN