
WAP Scoping Study_v12_final - Goyder Institute
73
Water allocation planning and water quality improvement scoping study – Discussion paper Jim Cox, Michelle Bald, Mike Burch, David Chittleborough, Susan Cuddy, David Deane, Nigel Fleming, Jacqueline Frizenschaf, Graham Green, Rehanna Halfyard, Kate Holland, Rai Kookana, Grant Lomman, Danni Oliver, David Rassam, Chris Saint, Kumar Savadamuthu, Mark Skewes, Mardi van der Weilen, Jason VanLaarhoven, John van Leeuwen Goyder Institute for Water Research Technical Report Series No. 13/8 www.goyderinstitute.org
-
Upload
khangminh22 -
Category
Documents
-
view
2 -
download
0
Transcript of WAP Scoping Study_v12_final - Goyder Institute

Water allocation planning and water quality improvement
scoping study – Discussion paper
Jim Cox, Michelle Bald, Mike Burch, David Chittleborough, Susan Cuddy, David Deane, Nigel
Fleming, Jacqueline Frizenschaf, Graham Green, Rehanna Halfyard, Kate Holland, Rai
Kookana, Grant Lomman, Danni Oliver, David Rassam, Chris Saint, Kumar Savadamuthu,
Mark Skewes, Mardi van der Weilen, Jason VanLaarhoven, John van Leeuwen
Goyder Institute for Water Research
Technical Report Series No. 13/8
www.goyderinstitute.org

Goyder Institute for Water Research Technical Report Series ISSN:
The Goyder Institute for Water Research
Government through the Department for Environment, Water and Natural Resourc
CSIRO, Flinders University, the University of Adelaide and the University of South Australia.
The Institute will enhance the South Australian Government’s capacity to develop and
deliver science-based policy solutions in water management. It brings tog
scientists and researchers across Australia to provide expert and independent scientific
advice to inform good government water policy and identify future threats and
opportunities to water security.
Enquires should be addressed to:
Citation
Cox J, Bald M, Burch M, Chittleborough
G, Halfyard R, Holland K, Kookana
K, Skewes M, van der Weilen
planning and water quality improvement scoping study
for Water Research Technical Report Series No.
Copyright
© 2013 CSIRO To the extent permitted by law, all rights are reserved and no part of this
publication covered by copyright may be reproduced or co
except with the written permission of
Disclaimer
The Participants advise that the information contained in this publication comprises general
statements based on scientific research and does not warrant or represent
completeness of any information or material in this publication.
Goyder Institute for Water Research Technical Report Series ISSN:
for Water Research is a partnership between the South Australia
Government through the Department for Environment, Water and Natural Resourc
CSIRO, Flinders University, the University of Adelaide and the University of South Australia.
The Institute will enhance the South Australian Government’s capacity to develop and
based policy solutions in water management. It brings tog
scientists and researchers across Australia to provide expert and independent scientific
advice to inform good government water policy and identify future threats and
opportunities to water security.
Goyder Institute for Water Research
Level 1, Torrens Building
220 Victoria Square, Adelaide, SA, 5000
tel: 08-8303 8952
e-mail: [email protected]
, Chittleborough D, Cuddy S, Deane D, Fleming N, F
, Kookana R, Lomman G, Oliver D, Rassam D, Saint
M, VanLaarhoven J, van Leeuwen J. (2013) Water allocation
planning and water quality improvement scoping study – Discussion paper
for Water Research Technical Report Series No. 13/8, Adelaide, South Australia
To the extent permitted by law, all rights are reserved and no part of this
publication covered by copyright may be reproduced or copied in any form or by any means
except with the written permission of CSIRO.
The Participants advise that the information contained in this publication comprises general
statements based on scientific research and does not warrant or represent
completeness of any information or material in this publication.
Goyder Institute for Water Research Technical Report Series ISSN: 1839-2725
between the South Australian
Government through the Department for Environment, Water and Natural Resources,
CSIRO, Flinders University, the University of Adelaide and the University of South Australia.
The Institute will enhance the South Australian Government’s capacity to develop and
based policy solutions in water management. It brings together the best
scientists and researchers across Australia to provide expert and independent scientific
advice to inform good government water policy and identify future threats and
Frizenschaf J, Green
, Saint C, Savadamuthu
Water allocation
r, Goyder Institute
, Adelaide, South Australia
To the extent permitted by law, all rights are reserved and no part of this
pied in any form or by any means
The Participants advise that the information contained in this publication comprises general
statements based on scientific research and does not warrant or represent the

1
Contents
Acknowledgements...................................................................................................................... 4
Acronyms .................................................................................................................................... 5
Abstract ....................................................................................................................................... 6
Aims of this report ....................................................................................................................... 7
Summary of the major water allocation policy issues .................................................................... 8
The need for water allocation planning ...................................................................................... 10
Current Water Allocation Plans for the Mount Lofty Ranges ........................................................ 11
Eastern Mount Lofty Ranges ............................................................................................................................ 11
Barossa ............................................................................................................................................................. 12
Western Mount Lofty Ranges .......................................................................................................................... 12
McLaren Vale .................................................................................................................................................... 12
Adelaide Plains ................................................................................................................................................. 13
Government policy driving water allocation planning ................................................................. 14
The Water Act .................................................................................................................................................. 14
Natural Resource Management Act ................................................................................................................. 15
Water for Good Plan ........................................................................................................................................ 16
Water allocation planning process .............................................................................................. 16
Hydro-ecology of the Mount Lofty Ranges ...................................................................................................... 16
Spatial variability of hydrological processes and flow regimes within catchments and their implications on
water allocation planning ................................................................................................................................. 19
Hydrological parameters needed for water allocation planning ..................................................................... 19
Catchment water balance models for water allocation planning .................................................................... 20
Hydrological pathways in the Mount Lofty Ranges .......................................................................................... 22
Low flow hydrology .......................................................................................................................................... 23
Evidence based water allocation planning .................................................................................. 29
Water allocation planning processes ............................................................................................................... 29
Western Australia ........................................................................................................................................ 29 New South Wales ......................................................................................................................................... 30 Evaluation criteria ........................................................................................................................................ 30
Risk in the context of water allocation planning .............................................................................................. 31
Risk identification and assessment .............................................................................................................. 31 Risk evaluation ............................................................................................................................................. 31 Evidence ....................................................................................................................................................... 32 Knowledge management ............................................................................................................................. 32 Water planning tools ................................................................................................................................... 32 Model parameterisation .............................................................................................................................. 33
Use of workflow technology to underpin water allocation planning tools ...................................................... 33
Water quality improvement planning processes ......................................................................... 36
Water quality risk assessment ......................................................................................................................... 37
Tier 1: Simplest assessment ......................................................................................................................... 38 Tier 2: Exceedance probability characterisation .......................................................................................... 38 Tier 3: Time to event models ...................................................................................................................... 39 Tier 4: More complex loss functions ........................................................................................................... 40
Major land use implications for water allocation planning in the Mount Lofty Ranges ................. 42
Spatial inventory of Mount Lofty Ranges irrigation ......................................................................................... 43
Salts in the landscape due to irrigation ............................................................................................................ 46
Innovative techniques and technologies to improve irrigation efficiency and productivity ............................ 47
Existing monitoring and data collection ...................................................................................... 50
eFlows project .................................................................................................................................................. 50

2
Verification of Water Allocation Science Program (VWASP) ............................................................................ 50
Future research directions .......................................................................................................... 52
Research issues ................................................................................................................................................ 52
Embedding eco-hydrological understanding into the development of Water Allocation Plans ...................... 52
Key outcomes .............................................................................................................................................. 53 Summary of data collection requirements to develop hydro-ecology for water planning ......................... 55
Issues with current hydrological parameters and models used for water allocation planning ....................... 55
Low flow hydrology .......................................................................................................................................... 56
Methodology ............................................................................................................................................... 57 Outcomes/Outputs ...................................................................................................................................... 57
Water quality improvement program .............................................................................................................. 58
Effect of non-stationarity on low flows ............................................................................................................ 58
Risk management framework implementation ............................................................................................... 59
Conclusions ............................................................................................................................... 61
References ................................................................................................................................. 62
Appendix A - Issues identified at Goyder Institute workshops and subsequent correspondence ... 67
Issue 1: Understanding the water balance/hydrological processes ................................................................. 67
Issue 2: Developing a set of defensible environmental thresholds ................................................................. 68
Issue 3: Developing new tools and technologies ............................................................................................. 69
Issue 4: Moving from expert opinion to verified outcomes at all scales .......................................................... 69
Issue 5: Ensuring policy and governance is consistent ..................................................................................... 70
Issue 6: Socio-economics and community engagement .................................................................................. 70

3
Figures
Figure 1. Summary of major water allocation planning and water quality issues .................................................. 8
Figure 2. Map showing the five water allocation planning areas in the Mount Lofty Ranges (from Australian
Government National Water Commission). ......................................................................................................... 11
Figure 3. Key planning and operational processes likely to require risk management for water planning and
management in South Australia (DEWNR staff) ................................................................................................... 15
Figure 4. Draft schematic for a knowledge system/library which will enable transparent evaluation of the
environmental implications of changes in hydrology due to water allocation planning decisions ...................... 17
Figure 5. Map showing the 8 distinct hydrologic regions for the MLR Source.IMS model ................................... 21
Figure 6. Inferred surface–groundwater interaction locations (Green and Stewart, 2008) ................................. 25
Figure 7. Rainfall-runoff relationships from 1975–2010; Scott Creek, MLR ......................................................... 26
Figure 8. 7-Day minimum annual flow; Scott Creek, MLR .................................................................................... 27
Figure 9. An example of a workflow showing a schematic of the processes (on the top) and as implemented in
tWB (on the bottom) ............................................................................................................................................ 34
Figure 10. Schematic of a ‘science business’ workflow ........................................................................................ 35
Figure 11. Tier 1 assessment of the Total Suspended Solids data from Lenswood from 2006–2010. The mean is
indicated by the black line and the environmental trigger value (50 mg/L) is indicated by the dashed line. The
environmental trigger value identified is the guideline from NSW as there is no guideline for SA
(ANZECC/ARMCANZ, 2000). Data has been provided by SA Water. .................................................................... 38
Figure 12. Lognormal distribution functions fitted to observations of TSS in Cox Creek and Lenswood sub-
catchments showing the observations (black dots), empirical distribution function (blue line), the best fitting
lognormal distribution (red line) and uncertainty bounds around this distribution derived by bootstrapping.
Data has been provided by SA Water. .................................................................................................................. 39
Figure 13. Crop water requirement, rainfall and residual irrigation requirement for citrus in Climate Zone
WMLR5 (from data generated by M. Skewes for Lamble (2008)) ........................................................................ 43
Figure 14. Surface (l) and Groundwater (r) Management Zones within the Western MLR PWRA, management
zones where estimated extraction exceeds Sustainable Extraction Limit are shown in brown (DfW, 2010a,
2010b) ................................................................................................................................................................... 45
Figure 15. Schematic of water allocation planning research needs ..................................................................... 52
Tables
Table 1. Quality indicators for scientific evidence (Table 1, Pollard et al (2008)) ................................................ 32
Table 2. A selection of data fields in the DfW MLR irrigation extraction point database .................................... 44
4
ACKNOWLEDGEMENTS
This work was commissioned by the Goyder Institute for Water Research.
We thank Michael Acreman (Centre for Ecology and Hydrology, Wallingford, UK) and Vinod
Phogat (SARDI) for their detailed reviews.
We thank the many state government staff who contributed indirectly to this document.
Key staff, both authors and non-authors, who are the key contacts responsible for the on-
going development of both the policy and research for specific issues within the scoping
study include:
• Government policy driving water allocation planning: Michelle Bald, Kumar
Savadamuthu, Jason vanLaarhoven, David Deane (DEWNR); Mardi vanderWielen
(DEWNR-SAMDBNRMB); Rehanna Halfyard (DEWNR-AMLRNRMB)
• Catchment water balance models for water allocation planning: Mark Alcorn, Kumar
Savadamuthu (DEWNR)
• Catchment water balance models for water quality improvement planning: Shaun
Thomas, Ying He, Andrew Solomon (EPA); Jacqueline Frizenschaf (SA Water); Nigel
Fleming, Jim Cox (SARDI)
• Evidence based water allocation planning and risk in the context of water allocation
planning: Mardi vanderWielen (DEWNR-SAMDBNRMB), Susan Cuddy (CSIRO)
• Use of workflow technology to underpin water allocation planning tools: Susan
Cuddy (CSIRO)
• Water quality research and water quality risk assessment: Danni Oliver, Keith Hayes
CSIRO); Jim Cox, Nigel Fleming (SARDI); Shaun Thomas (EPA); Jacqueline Frizenschaf
(SA Water); John vanLeeuwen (Uni SA)
• Irrigation research: Mark Skewes, Vinod Phogat, Jim Cox (SARDI)
• Eco-hydrological monitoring and data collection: eFlows, Steve Gatti (AMLRNRMB),
Jacqueline Frizenschaf (SA Water); VWASP, Rehanna Halfyard (AMLRNRMB); eastern
MLR monitoring program, Mardi vanderWielen (SAMDBNRMB); general: Jason Nicol,
David Schmarr, Dale McNeil (SARDI), Sally Maxwell (DEWNR)
• Embedding eco-hydrological understanding into the development of Water
Allocation Plans: Jason vanLaarhoven, Sally Maxwell (DEWNR); Mardi
vanderWielen (DEWNR-SAMDBNRMB); Jason Nicol, David Schmarr (SARDI)
• Low flow hydrology, non-stationarity of flows, groundwater interaction: Graham
Green (DEWNR); Nick Potter, Matt Gilfedder, David Rassam (CSIRO)

5
ACRONYMS
AMLRNRMB – Adelaide and Mount Lofty Ranges Natural Resources Management Board
COAG – Council of Australian Governments
DEWNR – Department of Environment, Water and Natural Resources
DfW – Department for Water (now DEWNR)
EMLR – Eastern Mount Lofty Ranges
EPA – Environmental Protection Agency (South Australia)
EWPs – Environmental Water Provisions
EWRs – Environmental Water Requirements
MDBA – Murray Darling Basin Authority
MLR – Mount Lofty Ranges
NWC – National Water Commission
NWI – National Water Initiative
PWA – Prescribed Well Area
PWRA – Prescribed Water Resource Area
SAMDBNRMB – South Australian Murray Darling Basin Natural Resources Management
Board
SDLs – Sustainable Diversion Limits
SEL – Sustainable Extraction Limit
SWMZ – Surface Water Management Zones
TFR – Threshold Flow Rate
VWASP – Verification of Water Allocation Science Program
WAPs – Water Allocation Plans
WQIPs – Water Quality Improvement Plans
6
ABSTRACT
A key outcome of the Goyder Institute’s Annual Research & Development Plan Roadmap:
I.1. Water Allocation Planning and Water Quality Improvement Programme’s is equitable
water sharing in multi-use catchments. Research projects identified within this roadmap
included projects: I.1.2 Landscape, hydro-ecology and water quality; I.1.3 Next generation
irrigation; and I.1.4 Evidence based water allocation planning, all of which impact on water
allocation plans.
This scoping study (Project I.1.1) was approved by the Goyder Institute to identify the
research knowledge gaps within these research projects that would improve the current
water allocation planning process. Four major research themes were identified as requiring
investment in order to improve water allocation planning in the Mt Lofty Ranges, South
Australia. These research themes are:
i) Better understanding of the hydrological processes, in particular rapid
assessment of those parts of the landscape where groundwater contributes
substantially to stream flow;
ii) Development of robust hydro-ecological thresholds based on better
understanding of hydro-ecological processes particularly under low flow
situations;
iii) The importance of land use, topography and other landform attributes on water
quality, particularly as it effects ecology in low flow situations; and
iv) Improvements and alignment of the current hydrological models and risk
frameworks that are used within the water allocation planning process.
This scoping study is simply a compilation of ideas related to these research themes and
based on a series of brainstorming workshops. It is compilation of ideas for research from
groups of researchers and policy staff with an interest in water allocation planning. From the
information in this scoping study, a detailed research proposal was developed and
submitted to the Goyder Research Advisory Committee and Board for funding. The detailed
research proposal (Project I.1.4) is not included in this document.

7
AIMS OF THIS REPORT
One of the Goyder Institute’s [http://goyderinstitute.org/] Annual Research & Development
Plan Roadmaps is I.1. Water Allocation Planning and Water Quality Improvement
Programme. Within this roadmap were listed a number of potential projects including: I.1.2
Landscape, hydro-ecology and water quality; I.1.3 Next generation irrigation; and I.1.4
Evidence based water allocation planning. There were aspects of research within each of
these projects thought to assist in improving the current water allocation planning process.
A group of researchers embarked on reviews of these research areas through a series of
workshops and meetings. The aim was to scope out the highest priority research needed to
improve the process of water allocation planning in South Australia, with the Mt Lofty
Ranges as the initial test bed. Some of these issues were scoped into clear research projects
(but not prioritised) whereas other issues were only listed and required further debate.
The information provided within this Scoping Study (I.1.1) was then used to develop a
detailed research proposal which was submitted to the Goyder Research Advisory
Committee and Board for funding (Project I.1.4). The latter process and outcome is not
discussed in this report.

8
SUMMARY OF THE MAJOR WATER ALLOCATION POLICY ISSUES
A series of workshops have been held to discuss water related issues which various state
government departments see as crucial to the development of water policy, specifically in
the Mount Lofty Ranges (MLR) but also relevant to other parts of the state. These meetings
have helped form the Goyder Institute for Water Research’s Water Allocation Plans (WAPs)
and Water Quality Improvement Programme (WQIP) roadmap.
Appendix 1 is a compilation of all issues that have been raised at the workshops and has
attempted to place those issues into six broad categories, with no attempt to prioritise the
issues. The list is long but highlights the many issues associated with water allocation
planning in the MLR within the state agencies involved. Nevertheless the mutual issues are
now clear and shown in Figure 1.
Figure 1. Summary of major water allocation planning and water quality issues
3. New tools and
technologies to assist
with water allocation
planning e.g. a library of
hydro-ecology metrics.
2. Rapid assessment of
the water balance and
clear understanding of
hydrological processes
under varying climate,
soils and land-use at
various scales (temporal
and spatial).
1. A set of defensible
environmental
thresholds (to determine
environmental water
requirements and
develop water allocation
plans).
6. A process for including
socio-economics in
water policy decisions
and keeping
communities engaged in
an open and transparent
way.
5. A process for ensuring
policy and governance is
consistent across all
issues relating to water
allocation planning.
4. Improve hydro-
ecological relationships
using field based
monitoring at the point,
reach and catchment
scale.
Water Allocation Planning Decision Support System
Water Allocation Planning Assessment and Risk Framework
Issue: Are we using best practice. Can it be improved?

9
The top issues that have emerged as requiring research (specific to water allocation
planning) are:
• Review and development of existing hydro-ecological response curves and thresholds
• Effect of catchment non-stationarity on catchment modelling predictions
• Can water quality ‘hot-spots’ be predicted from available datasets (e.g. landuse, soil
type, geomorphology) and drainage volumes?
• Can a framework be developed to improve the WAP process by aligning modelling and
assessment with risk management principles?
• Do we have defensible hydrology and hydro-ecology models
• How do we incorporate water quality and climate change variability into future WAPs?
• Are we using appropriate hydrological and ecological metrics to measure ecosystem
responses?

10
THE NEED FOR WATER ALLOCATION PLANNING
Water allocation planning provides for the allocation and use of water, and for the transfer
of and other dealings with water allocations. It is essential to protect the economic, social
and environmental needs for future generations and to provide secure and equitable access
to water for all users. The Goyder roadmap chose the MLR as the primary site for the
development of a framework for WAPs and WQIPs based on the high level of existing data,
modelling and complexity of environmental and socio-economic issues within the
catchments of the MLR.
The MLR are vitally important socially, economically and ecologically to South Australia. The
MLR catchments provide significant water resources and there are a range of stakeholders
using the resource, including the general community (water for the environment and
recreational activities), agriculture landholders (e.g. water for intensive horticulture),
secondary industries, and potable water suppliers and consumers.
The water resources of the MLR were prescribed in 2005. Local natural resource
management boards are required to prepare a WAP for prescribed resources, which sets
sustainable limits for allocation of water and provides for ongoing water management (Van
Laarhoven and van der Wielen, 2009). This requirement and recognition of the need for
increased environmental flows for the MLR culminated in the release of the draft WAP for
the western MLR in 2010 (AMLRNRMB, 2010a, 2010b) and the eastern MLR in 2011
(SAMDBNRMB, 2011).
The draft WAPs have endeavoured to take into account the needs of all water users and
balance environmental, social and economic needs for water by stakeholders and the wider
community. Environmental water requirements (EWRs) are defined as ‘the water regime
needed to sustain the ecological values of ecosystems, including their processes and
biological diversity, at a low level of risk’ (DWLBC, 2006). EWRs were described at the biotic
functional group level (e.g. fish, macroinvertebrates and water dependent plants) by
determining the flow-dependent ecological processes required to support each group, and
the water regime required to support those processes (VanLaarhoven and van der Wielen,
2009).
In the current WAPs, water quality is not considered an issue if the flow regime is deemed
adequate. However, during certain times of the year, under low flow regimes, this may not
be the situation.

11
CURRENT WATER ALLOCATION PLANS FOR THE MOUNT LOFTY RANGES
The MLR comprises five WAP areas (Figure 2):
• Eastern MLR (within the South Australian Murray Darling Basin Natural Resource
Management Board (SAMDBNRMB) region)
• Barossa (within the Adelaide and Mount Lofty Ranges Natural Resource Management
Board (AMLRNRMB) region)
• Western MLR (AMLRNRMB region)
• McLaren Vale (Prescribed Wells Area (groundwater only) - a sub-region of the western
MLR) (AMLRNRMB region)
• Adelaide Plains (incorporating Northern and Central Adelaide Plains) (AMLRNRMB
region).
Figure 2. Map showing the five water allocation planning areas in the Mount Lofty Ranges (from
Australian Government National Water Commission).
Eastern Mount Lofty Ranges
The Eastern MLR Prescribed Water Resource Area (PWRA) includes the Angas Bremer
Prescribed Wells Area (PWA) and occupies an area of 2845 km2. The area lies within the
Murray-Darling Basin. The Eastern MLR PWRA extends from the Milendella Creek catchment
in the north to Currency Creek catchment in the south, and contains sixteen surface water
catchments. Eleven of the catchments have watercourses that drain from the eastern side

12
of the MLR to the River Murray and Lake Alexandrina (e.g. Bremer, Angas and Finniss
Rivers).
Land use in the Eastern MLR is dominated by grazing and cropping which account for 77% of
the total area. Other land uses include irrigated horticulture and pasture production (7%),
conservation and natural environments including residual native cover (5%), intensive uses,
which includes urban areas, mining, industrial and manufacturing land uses (5%) and
forestry (less than 2%) (SAMDBNRMB, 2011). There are wetlands of national significance
within the region (e.g. the Fleurieu Peninsula Swamps which are home to listed endangered
species such as the Southern Brown Bandicoot and the Southern Emu Wren). There are
numerous permanent pools and springs throughout the Eastern MLR. These pools/springs
are considered environmental assets as they provide critical refuges over the summer
months for water-dependent species (e.g. southern pygmy perch and river blackfish). Some
of these pools are fed by groundwater.
Barossa
The Barossa PWRA (AMLRNRMB, 2009) covers an area of approximately 520 km2. It
incorporates the North Para River and tributaries, the Greenock Creek catchment, and
groundwater aquifers. Additional to the surface watercourse and underground water
covered by the PWRA, a number of alternative water sources are used to support the
irrigation industry.
Western Mount Lofty Ranges
A draft WAP has been developed for the western MLR including the Little Para Proclaimed
Watercourse. This includes the surface water and watercourses in the McLaren Vale
Prescribed Wells Area, but not the underground waters which are managed in accordance
with the WAP for the McLaren Vale PWA, that accounts for the needs of groundwater
dependent ecosystems as well as other users.
The Prescribed Area covers an area of approximately 2,750 km2 and includes:
• the Central Hills and Fleurieu Peninsula Catchments;
• surface water resources of the Willunga Basin;
• the Little Para River between a point upstream of the Little Para Reservoir near Upper
Hermitage and Port Wakefield Road; and
• the Gawler River, River Torrens/Karrawirra Parri and the Onkaparinga River as they cross
the Adelaide Plains.
McLaren Vale
The McLaren Vale PWA covers an area of approximately 320 square kilometres, with the
Onkaparinga River forming part of the northern boundary, while much of the south-eastern
boundary follows the ridge of the Sellicks Range. The McLaren Vale PWA comprises
underground water resources contained within the sediments of the Willunga Embayment,
the fractured basement rocks underlying the Willunga Embayment and the fractured
basements rocks present east of the Willunga Fault. The water allocation plan for this area
was adopted in 2007.

13
Adelaide Plains
An Adelaide Plains WAP is currently being developed to incorporate both the Northern
Adelaide Plains (approximately 800 km2 where groundwater is predominantly used for
pasture and horticulture, with irrigated crops including vegetables, vines, almonds and
olives) and the Central Adelaide PWAs.

14
GOVERNMENT POLICY DRIVING WATER ALLOCATION PLANNING
The Water Act
Water allocation planning is directed by legislation at the national and state levels. The
principal Council of Australian Governments (COAG) water policy agreement is the 2004
National Water Initiative (NWI) (COAG, 2004), which is Australia’s enduring blueprint for
water reform. The NWI is a key driver for the development of water management policy and
practices in South Australia. The Water Act, 2007 (Commonwealth Government) requires
WAPs to include the following: identification of risks to water resources and strategies to
manage those risks; management objectives and outcomes; long term average quantities of
water that can be taken on a sustainable basis from water resource plan areas; an
environmental watering plan and a water quality and salinity management plan; and rules
about trading of water rights in relation to water resources.
Subclause 22 of the Water Act, 2007 ensures that while the water resource plan is to
provide for the integrated management of water resources, it will not directly regulate land
use or planning in relation to land, the management of natural resources (other than water
resources) or the control of pollution, which are to continue to be regulated by the States.
The South Australian Government has taken a risk-based approach to water planning (Figure
3), which provides guidelines that clearly articulate the steps, procedures and tools to
incorporate the principles and processes articulated in the ‘Risk Management Framework
for Water Planning and Management’ (the Risk Management Framework) for the water
allocation planning process (DEWNR, 2012a). It also provides minimum requirements in
terms of process and documentation for each step. The Department (DEWNR, 2012b) states
that the risk management framework must include the risks to the availability of the water
resources that arise from the following:
(a) the taking and use of water (including through interception activities)
(b) the effects of climate change
(c) changes to land use
(d) limitations on the state of knowledge, on the basis of which estimates about matters
relating to the Basin water resources are made.

15
Figure 3. Key planning and operational processes likely to require risk management for water
planning and management in South Australia (DEWNR staff)
Natural Resource Management Act
One of the mechanisms for managing water resources in South Australia is through
‘Prescription’ under Section 125 of the Natural Resources Management Act, 2004 (South
Australia). Following prescription there is a requirement for the development of:
1) a report that assesses the water needs of ecosystems that depend on the resource prior
to issuing a licenses to existing users (Section 164N (4)); and
2) a WAP which sets out policies for the future use of the water resource which must
balance the water needs of ecosystems against social and economic considerations (Section
76).
To bring transparency to this process, the ability to articulate the consequences and
opportunities (social, economic and environmental) of particular policy decisions is
required. This might be facilitated by the use of predictive models that describe the causal
links between hydrology (surface and groundwater) and ecological outcomes, as well as an
understanding of socio-economic systems and the impacts of changes to water availability.
The following focuses on the need for the transparent accountability in water planning
affecting the environment.
Below are excerpts from the Natural Resources Management Act summarising a subset of
policy needs for an understanding of hydro-ecology processes and relationships to assist
with the development of WAPs:
• 76 (4) (a) (i) A WAP must include an assessment of the quantity and quality of water
needed by the ecosystems that depend on the water resource and the times at which,
or the periods during which, those ecosystems will need that water;
• 76 (4) (b) (i) A WAP must set out principles associated with the determination of water
access entitlements and for the taking and use of water so that an equitable balance is
achieved between environmental, social and economic needs for the water;
• 76 (4) (b) (ii) A WAP must set out principles associated with the determination of water
access entitlements and for the taking and use of water so that the rate of the taking
and use of the water is sustainable;

16
• 76 (4) (d) A WAP must assess the capacity of the resource to meet the demands for
water on a continuing basis and provide for regular monitoring of the capacity of the
resource to meet those demands;
• 164N (3) (a) (b) If at the expiration of the prescribed period, the aggregate of water
access entitlements assigned to existing users… exceeds, in the opinion of the Minister,
the capacity of the resource, the Minister may reduce each water access entitlement
proportionately; or reduce each water access entitlement pursuant to a scheme set out
in the regulations; and
• 164N (4) Before determining the capacity of the resource, the Minister must prepare a
report assessing the need for water of ecosystems that depend on the resource for
water.
Currently there is very limited capacity for evidence-based response to policy needs on a
state wide basis and consequently actions arising from policy can be from qualitative
assessments and unverified opinion. Any future research must assist policy makers to make
informed and reliable decisions when developing WAPs, in accordance with the legislative
needs, as stated above.
Water for Good Plan
The EPA is the lead agency, working with DEWNR and SA Water, on delivering Action 49 of
the Water for Good Plan (SA Government). The action is to prepare a WQIP for the MLR
using the National Water Quality Management Strategy (Commonwealth Government),
building on previous work in South Australia to determine environmental values and water
quality objectives.
WATER ALLOCATION PLANNING PROCESS
The development of WAPs requires quantitative understanding of a number of variables.
These include the effects of surface and groundwater processes, hydro-ecology, climate
variability, and land-use change on flow and water quality as relevant to water dependent
ecosystems.
Hydro-ecology of the Mount Lofty Ranges
Environmental accountability is an explicit requirement in formal water planning in South
Australia through the Prescription and Water Allocation Planning Process. This requirement
has historically been largely opaque or poorly represented. Recent WAPs (western MLR,
eastern MLR, and Marne and Eyre Peninsula) have attempted to address this issue by
development of a process through which environmental risk (relative or absolute) can be
evaluated as a function of changes in the flow regime. This work has generated a series of
hypotheses which relate flow to ecological response (i.e. hydro-ecological models). Many of
these hypotheses are taxa based (fish and macro-invertebrates), and are expected to be
transferrable within and between catchments.
It is proposed to use the eastern and western MLR as a test bed for proposed research
needs, with the understanding that findings will contribute to a knowledge system of
ecological and hydrological indicators and metrics, hydro-ecological models, and
17
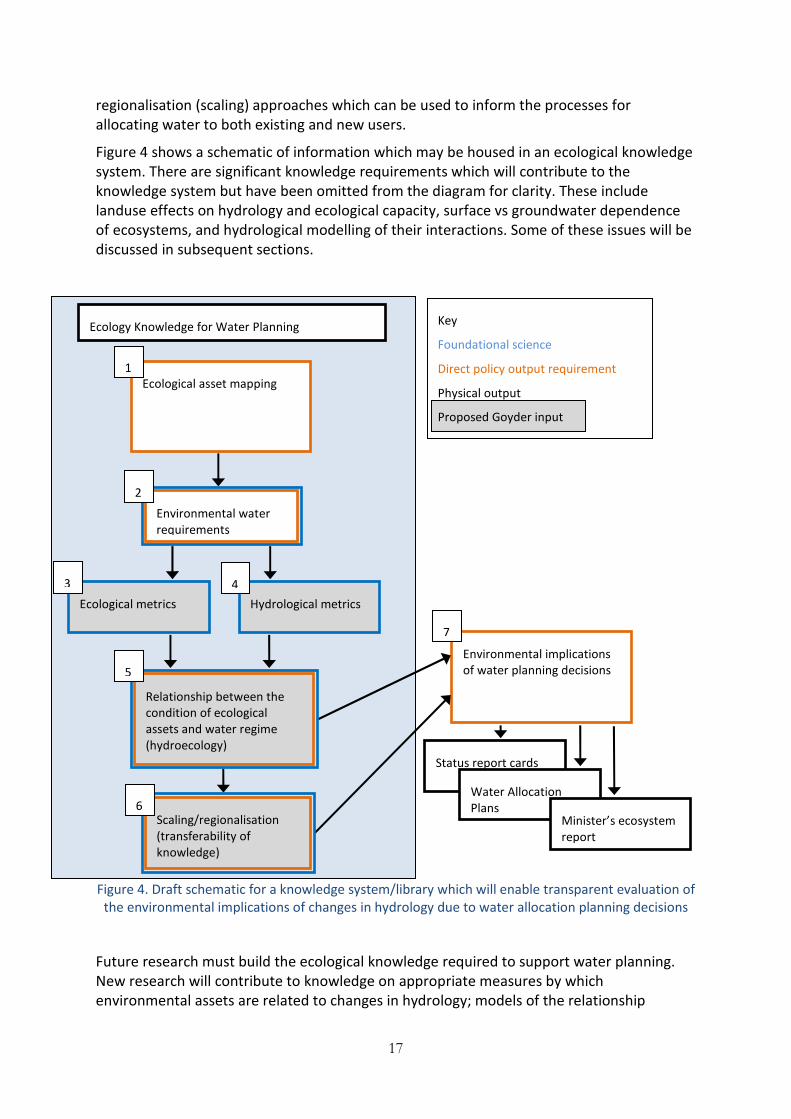
regionalisation (scaling) approaches which can be used to inform the processes for
allocating water to both existing and new users.
Figure 4 shows a schematic of information which may be housed in an ecological knowledge
system. There are significant knowledge requirements which will contribute to the
knowledge system but have been omitted from the diagram for clarity. These include
landuse effects on hydrology and ecological capacity, surface vs groundwater dependence
of ecosystems, and hydrological modelling of their interactions. Some of these issues will be
discussed in subsequent sections.
Figure 4. Draft schematic for a knowledge system/library which will enable transparent evaluation of
the environmental implications of changes in hydrology due to water allocation planning decisions
Future research must build the ecological knowledge required to support water planning.
New research will contribute to knowledge on appropriate measures by which
environmental assets are related to changes in hydrology; models of the relationship
Key
Foundational science
Direct policy output requirement
Physical output
Proposed Goyder input
Ecological asset mapping
Environmental implications
of water planning decisions
Hydrological metrics Ecological metrics
Status report cards
Ecology Knowledge for Water Planning
Environmental water
requirements
Water Allocation
Plans Minister’s ecosystem
report
1
2
3 4
7
Scaling/regionalisation
(transferability of
knowledge)
Relationship between the
condition of ecological
assets and water regime
(hydroecology)
5
6

18
between changes in environmental assets and changes in hydrology; and methods and
knowledge pertaining to the transferability of models.
When adequately populated, it is envisaged that this knowledge system will help: 1) the
assignment of likely EWRs; and 2) predict environmental implications of changes in the
water regime for areas lacking specific EWR assessments. The knowledge system will also
act as a database for ongoing learning and refinement of DEWNR’s understanding of the
relationship between the aquatic environment and changes in hydrology.
Specific outputs of new research will greatly increase: 1) our ability to provide transparent
information on environmental components of the DEWNR status report cards; 2) our ability
to inform the Minister of the implications of issuing licenses to existing users; and 3)
leadership on environmental accountability in the development of new WAPs and in the
review of existing plans (e.g. draft eastern MLR).
Embedding eco-hydrological understanding into the development of WAPs has led to the
development of processes which allow the environmental implications of changes in the
flow regime to be transparently tested and documented. This process has recently been
developed, following work conducted by DEWNR, the SAMDBNRMB, the AMLRNRMB (and
the Eyre Peninsula NRM Board). These are ‘first generation’ studies in South Australia and
there is still a need to validate the methodologies used, and there is significant scope for
refinement. A major review (see Future Research Directions) would provide a basis for
specific research topics to refine or re-align existing processes to transparently inform the
environmental implications of applying different water management policies for all existing
and new WAPs in the SA.
A hydro-ecological Decision Support Tool has been developed by DFW (now DEWNR) and
the SAMDBNRMB and used for the preparation of the current draft western and eastern
MLR WAPs (VanLaarhoven and van der Wielen, 2009; VanLaarhoven, 2010). This tool works
via three steps: Firstly, EWRs are calculated from site ecological characteristics. Secondly,
hydrological metrics are calculated from the EWRs. Thirdly, these metrics are up-scaled
using reach geomorphology and habitat characterisation. In this way, site-derived EWRs can
be up-scaled to the watercourses in the MLR.
Within the western MLR, but notionally separate from the previous EWR work, is a project
which aims to quantify the environmental benefit of flow releases from three metropolitan
reservoirs (discussed in more detail in a section on Monitoring to Improve WAPs). The
approach being developed for this work needs to be included in any review process. A
review for the Southern Basins and Musgrave WAPs on Eyre Peninsula has refined
knowledge on the EWRs for groundwater dependent ecosystems in the area. It has
developed a method by which changes in groundwater regime can be linked to risks to
water dependent vegetation (Doeg et al. 2012).
There are many gauging stations across the MLR which are collecting flow data suitable for
analysis, so this is a well-established resource. Time series of ecological data are limited to
fish (collected by the SAMDBNRMB) and macroinvertebrates (AusRivAS). In addition, there
are a number of consolidated monitoring sites currently being installed by the AMLRNRMB.
At these sites, time series of ecological and hydrological data will be collected concurrently
(over the two years of the project) to allow relationships to be developed.

19
It is expected that the review process will lead to research topics which fall into four
knowledge areas which inform water planning policy (outlined in research plans in the
Future Research Directions section). Research conducted in these areas will greatly increase
the capacity of water managers to transparently inform the water planning process
regarding environmental accountability for water.
It is envisaged that the research will populate a library of hydro-ecological models to be
developed over time. With an understanding of the significance of ecological indicators
(Figure 4– Item 1) these relationships can be extended to other areas which are biologically
similar. This will allow broader application of likely environmental implications of changes in
flow regime to areas where there is limited information.
Spatial variability of hydrological processes and flow regimes within
catchments and their implications on water allocation planning
Spatial variability questions the reliability of the current methods for apportioning/re-
distribution/scaling-up of flow regimes (daily/sub-daily- flow hydrographs, flow
frequency/duration curves) within catchments.
Catchment outflows, usually measured at catchment outlets and quantified as annual flows,
are generally apportioned to sub-catchments and management zones within them for water
allocation planning purposes. This is undertaken using numerous well established
procedures, most of them based on the variability of rainfall, land forms and land use within
the catchment. However, apportioning of flow regimes that are derived from daily and sub-
daily flows, from a larger scale (basin, catchment) to smaller scales (sub-catchment,
management zones) is much more challenging. Better understanding of the spatial
variability of hydrological processes i.e., runoff generation, flow routing and baseflow
contribution, to name a few, within a catchment is critical while apportioning (or
extrapolating or scaling-up) flow regimes. This is critical in cases where data collection and
modelling is undertaken on a larger scale and water allocation planning is undertaken at a
smaller scale.
Hydrological parameters needed for water allocation planning
Two of the main parameters in most WAPs in the state are Sustainable Extraction Limits
(SELs) and Threshold Flows Rates (TFRs). Broadly, SELs are the maximum volume of water
that can be sustainably taken out of the system. This is generally quantified by mean annual
flows. TFRs are the flow rates that are critical to the water dependent ecosystems (i.e. the
very low flows, usually baseflow, that are critical for the ecosystem to survive – as opposed
to EWRs which are the water regimes needed to sustain the ecological values of ecosystems
at a low level of risk).
The spatial scale at which the SELs are defined is at the Surface Water Management Zones
(SWMZ), which are drainage areas within sub-catchments. The TFRs are applicable to
individual licensed farm dams and water course extractions. Data for the above are derived
from rainfall-runoff models calibrated at sub-catchment scale and extrapolated to a finer
SWMZ / property scale. While the spatial variation of rainfall and farm dams (major blocking
dam) are represented (distributed) in the models, other catchment parameters are lumped
i.e., catchment parameters remain the same for all the modelled catchment nodes within a
sub-catchment.

20
As mentioned earlier, while this method of apportioning might result in reasonable
estimates of the total quantity of flow, how reliable is it to apportion/re-distribute/scale-up
flow regimes (daily/sub-daily - flow hydrographs, flow frequency/duration curves)? This in
turn raises other important issues including whether the current eco-hydrological datasets
and the modelling platforms (discussed in the next section) are sufficient e.g. do the
available models have the capacity for modelling future climate change/non-stationarity
scenarios (see the later section on future research directions).
Catchment water balance models for water allocation planning
Historically, various nationally and internationally developed catchment hydrology models
and modelling platforms have been used across Australia, in different government/private
agencies, universities and research organisations. In South Australia WaterCress was used as
the primary surface water modelling platform to build hydrological models for catchments
in the MLR and other regions in the state. These models were also used as a critical tool in
calculating the SELs within the current draft WAPs (eastern and western MLR).
A nationally recognised platform for catchment modelling with standards and guidelines for
modelling was not available until eWater CRC was established with one of its primary
objectives being to fill this void. eWater CRC catchment modelling tools had previously been
developed for the MLR using precursors to the Source.IMS (i.e. EMSS and E2). Models had
been developed for the Bremer River, the Middle River, the Rocky River, the South Para
catchments and the entire MLR. The original MLR model was calibrated and validated
against recorded stream flow data at 20 locations through the MLR region. Based on the
calibration results, the MLR watershed was divided into 8 hydrological regions (Figure 5). A
full MLR Source.IMS model has only recently been constructed. A total of 180 sub-
catchments have been delineated to represent the MLR watershed extending over an area
of approximately 1600 km2.

21
Figure 5. Map showing the 8 distinct hydrologic regions for the MLR Source.IMS model
Land use data has been classified into 14 different functional units (e.g. broadscale
agriculture, managed forest and wetlands). Event mean and dry weather concentrations
(EMCs and DWCs) have been assigned to each of the functional units to determine loads
(such as sediment) as well as flow (Fleming et al., 2010).
The effectiveness of the existing SIMHYD rainfall runoff parameters (used in Source.IMS) to
effectively predict runoff volumes has been mixed for the flow gauges so far examined. To
overcome this, PEST (a model-independent parameter estimation program) has been run
successfully within some of the MLR catchments. It has been found that at larger scales
there is major overestimation of runoff volumes (using SILO rainfall data) during the wetter
months of the year in the MLR, although generally good agreement is found between SILO
and local rainfall in the drier months. It is likely that the impact of the generalised nature of
22
gridded SILO rainfall (overlooking local effects of climate and topography) is reduced during
the drier months. This pattern was also found in some smaller sub-catchments.
The effectiveness of the existing SIMHYD rainfall runoff parameters to predict runoff
volumes in the MLR is therefore mixed, with some showing an overestimation of flows well
beyond the accepted bounds of model error, indicating that the MLR Source.IMS model
needs to be re-calibrated. The key tasks required to improve the model for use as a tool for
simulating flow and loads in the MLR include:
• Re-calibration of the MLR model using PEST with SILO and local data to best match
observed flows
• Run scenarios with new hydrology including impacts of climate change to generate
climate inputs
• Assess farm dam capacity
• Link with groundwater model
• Improve predictions at various scales.
These issues are discussed in more detail in the section on future research directions.
Hydrological pathways in the Mount Lofty Ranges
The hydrological processes that need to be understood in order to manage water effectively
in the MLR can be summarised into three components:
• Understanding the various pathways into which rainfall is partitioned and via which it
moves through the landscape – specifically to identify where are the important pools
• Understanding how the different human uses of water alter the storage and movement
of water through those pathways, e.g. do farm dams intercept groundwater-surface
expression or rainfall-runoff – these may need to be managed differently
• Understanding the chemical and biological processes that occur as a result of water
being present in the predicted/observed quantities in the different pathways, and how
variability in the pathway flux expresses in ecosystems or water quality variations (this
will be discussed in a separate section below).
Developing a better understanding of these issues will enable reasonably informed
predictions (or policies) about what any scenario of interest might mean. There is no need
to know everything about every pathway (this is impossible), but we do need to know how
important each is temporally and spatially.
Current understanding of how the component processes work at site scale, or in a
qualitative sense how things may change (using such models as Source.IMS or WaterCress
as previously discussed), is adequate. Many of the issues that need research relate to
moving from relative to absolute risk levels, and to scaling these processes up to reflect
sensible management areas for policy creation. The major gaps in our understanding of how
the MLR behaves hydrologically include:
• At what point (water flow and quality) is there a fundamental shift in ecological
character (e.g. structure, diversity, richness), which may or may not mean a loss of
ecosystem function in terms of the ability to provide ecosystem services

23
• How does spatial variability affect fluxes via these processes, and how can we
incorporate property scale variations into what needs to amount to regional scale
planning
• Lag times in ecological and hydro-geological response, which may be
obscuring/buffering observed patterns.
Thus the major research questions include:
• How much do we know about the range of possible water movement pathways, how
these vary across physiographic gradients in the MLR and how their volumetric
importance changes as a result?
o We have some confidence in catchment scale water balances (discussed above),
but comparisons are needed between measured water balance components (e.g.
gauged surface water output, groundwater recharge) and whole of catchment
scale expectations, to identify where the water accounting doesn’t match.
• How does development affect the pathways for water movement?
o For example, Marne River refugia have been drying over recent years, coincident
with both surface water and groundwater development in this region, are either
of these more important than the other in the loss of refugia? How has the
drought affected this? New studies are needed, as well as re-interpretation of
old data to tease apart the relative impacts of surface water and groundwater
development on flow regimes in the MLR.
• What is the range of ecological conditions expected for the range of water availability
for important biota or communities (focussing on the duration of flow, the duration of
lentic refugia, and the spatial distribution of these)?
o For example we know there are some perennial reaches; these are fairly rare but
of high ecological value. Are there any studies indicating what biological
communities are indicative of perennial or intermittent systems (so we can tell
what we might lose if a transition from perennial to intermittent occurs)? If the
“cease to flow” at a site is prolonged as a result of a given development, at what
point will the biota transition from a perennial/intermittent, seasonally
synchronous and relatively functionally diverse (i.e. resilient) community to an
ephemeral, opportunistic, bullet proof, low diversity community?
Low flow hydrology
The low flow state is a critical part of the flow regime for water dependent ecosystems,
maintaining permanent pools and wetlands that act as refuges for aquatic and semi-aquatic
species over the drier months. A number of studies have shown that changes in streamflow
regime have been observed in a number of catchments in Australia, and the most noticeable
changes are in low flows, resulting in catchments changing from perennial to ephemeral.
These changes in flow regime reflect hydrologic non-stationarity of the catchments. Low
flow periods are a challenge to water managers, who must balance competing demands for
water.
The low flow hydrograph at any point in a river is usually assumed to represent the integral
of all upstream local groundwater outflow hydrographs taken along the river channels all
the way to the headwaters (Brutsaert and Nieber, 1977). Land use change, climate change,
and the subsequent increased demand for groundwater resources have led to non-

24
stationarity of low flows, which is associated with changes in groundwater storage
(Brutsaert, 2008). It has long been established that the surface and groundwater systems in
the MLR are connected. Groundwater discharge from shallow aquifers into catchment
surface waters represents the major part of the total flow volume in most rivers
(Wittenberg, 2003). Drought conditions place an enormous stress on stream flows as well as
recharge to groundwater aquifers. The consequence of the latter places more demand on
groundwater, thus resulting in further declines in discharge to streams. The exchange
between groundwater and rivers is a key component influencing not only river discharge but
also water quality, geomorphic evolution, riparian zone character and composition, and
ecosystem structure (Sophocleous, 2010).
There are a limited number of studies that have focussed on surface–groundwater
interactions in the MLR (e.g. Harrington, 2004; Green and Stewart, 2008; Banks et al., 2009;
Banks, 2010; Reid et al., 2009). Green and Stewart (2008) have assessed where streams are
classified as ‘gaining’ or ‘losing’ (Figure 6). As demonstrated in Figure 6, the connection
between the surface and the groundwater systems varies significantly across a catchment
(spatially). However, for the purpose of modelling, river reaches upstream of a gauge are
considered to be either predominantly gaining or losing. Across the temporal scale, non-
stationarity means that the type of connection may change (e.g., from gaining to losing).
The modelling should provide an overall insight into the interaction between the surface
and the groundwater systems by identifying the groundwater component to surface flow
and how this component can potentially vary due to climate/land use change and increased
groundwater development.
A typical flow regime for the MLR was presented by VanLaarhoven and van der Wielen
(2009). The low flow season is characterised by relatively constant low flow rates and cease-
to-flow events. The high flow season is characterised by higher, more permanent baseflow
as catchments wet up under more rainfall. The two key aspects driving local hydrology are
climate and the presence of significant groundwater inflow. Groundwater levels within the
fractured rock aquifers of the MLR are largely dependent on rainfall; with observed levels in
the eastern MLR reaching their lowest point in 2004 due to below average rainfall (CSIRO,
2007). Groundwater extraction is also known to significantly lower stream flow. For
example, CSIRO (2007) reported a reduction in stream flow of 7 GL/year for the eastern MLR
as a result of groundwater development.

25
Figure 6. Inferred surface–groundwater interaction locations (Green and Stewart, 2008)

26
Systems for management of water throughout the developed world have been designed
and operated under the assumption of stationarity. The latter term means that natural
systems fluctuate within an unchanging envelop of variability. In a modelling sense, this
means that the statistical properties of hydrologic variables are constant over time. In
addition to the effects of climate and land use changes, non-stationarity of low flows is also
associated with increases in groundwater extractions, such processes are not accounted for
in traditional river models. However, the recently developed ‘Source’ suite of models
explicitly account for groundwater processes (Welsh et al., 2012; Rassam, 2011; Gilfedder et
al., 2012). Models that neglect the phenomenon of non-stationarity produce inferior flow
predictions, especially during dry periods and especially in areas of extensive groundwater
developments where the impacts of groundwater extraction are yet to be realised. This
issue is highly relevant to water resource management from quantity and quality point of
views; one should keep in mind that the availability of water during dry periods is most
critical to the ecology.
The phenomenon of non-stationarity is demonstrated here for Scott Creek in the MLR.
Analysis of long-term flow and rainfall records shows a significant change in the flow regime
for the period 2002–2010 when compared to earlier periods (Figure 7). There was a
significant change in the low-flow regime in the last decade, when the 7-day minimum
annual flow significantly decreased (Figure 8). A comparison of low flows between the
periods 1970–1991 and 1992–2010 showed that the 90th percentile flow decreased by 27%.
This example demonstrates that accounting for the phenomenon of non-stationarity
improves the predictive capacity of river and catchment models, especially under low flow
conditions. The non-stationarity observed in the Scott Creek catchment occurred despite
negligible changes to landuse or groundwater extraction in the catchment, which indicates
that the reduction in stream flow was a consequence of reduced rainfall.
Figure 7. Rainfall-runoff relationships from 1975–2010; Scott Creek, MLR
R² = 0.6968
R² = 0.8443
R² = 0.6044
0
1000
2000
3000
4000
5000
6000
7000
8000
9000
10000
400 500 600 700 800 900 1000 1100 1200
Tota
l ann
ual d
isch
arge
(ML
)
Total annual rainfall (mm)
1970-1991
1992-2001
2002-2010
Scott Creek, MLR

27
Figure 8. 7-Day minimum annual flow; Scott Creek, MLR
Research is needed, using a combination of existing field data and modelling approaches, to
develop an understanding of the consequences of changes in water resource allocations and
climate on low flow in MLR catchments. This will inform the WAP’s of sensitive areas where
water dependent ecosystems are reliant on low flow, including streams receiving
groundwater discharges from fractured rock aquifers, and groundwater dependent
ecosystems (the latter is discussed in more detail in its own section). The research should
focus on the surface water resource, taking full account of the groundwater component of
flow. That is, groundwater processes are explicitly taken into consideration to assess their
interaction with surface flows. It is recommended that study sites be selected based on the
following criteria: (1) availability of good quality gauge data; (2) prior knowledge of
conceptual models for groundwater flow, landform type, SW-GW connectivity and
groundwater interaction with rivers; (3) other supporting data such as hydraulic properties
of the vadoze zone, water quality and isotopes. Hence, it is advantageous to select sites
where studies have been conducted in the past. This is why the Scott Creek catchment was
used here to illustrate the phenomenon of non-stationarity. Catchment selection also needs
to include catchments where changes to land use and groundwater extraction have
occurred in the past. The choice of the test catchment should align with the Goyder Climate
Change Project; in this project, the Onkaparinga catchment was selected as the primary case
study location as recommended by the Goyder Institute RAC. This catchment includes the
Willunga Basin Super Science Site, which is funded though the Commonwealth
Government’s Super Science program. This site is particularly suitable for groundwater
modelling, while other areas in the Onkaparinga catchment will be the focus of the surface
water modelling in the application test bed (Goyder Climate Change Project; Task 4).
The research needs to assess low flows with emphasis on its spatial and temporal variability.
It also needs to assess the impacts of land use change and/or climate change and/or
groundwater extraction on low flows (i.e., identify the phenomenon of non-stationarity of
flow); this task may be achieved by adopting a river model that accounts for groundwater
processes (such as: GW-Lag (Gilfedder et al., 2012); Source Rivers (Welsh et al., 2012) and
(Rassam, 2011). Links should be established with the Goyder Climate Change Project, which
can provide the necessary input data for the climate change scenarios (Goyder Climate
0
0.05
0.1
0.15
0.2
0.25
0.3
0.35
0.4
1975 1980 1985 1990 1995 2000 2005 2010
7-D
ay m
inim
um a
nnua
l flo
w (
ML
/day
)
Year
Scott Creek, MLR

28
Change Project; Task 3); such links should achieve efficient progress and minimizes
duplication (e.g., in rainfall-runoff modelling, Task 4 of Goyder Climate Change Project).
Details of the methodology and tasks required are in the section on future research
directions.

29
EVIDENCE BASED WATER ALLOCATION PLANNING
This chapter firstly looks at water allocation processes in two other states and the criteria
that have been established by the Australian Government to assess the status of water
allocation planning within Australia. Then the chapter looks at aspects of the risk
management framework in the context of water allocation planning. The chapter concludes
with a description of how components of the risk management process can be implemented
as a scientific workflow, rather than as a more traditionally designed decision support tool.
Water allocation planning processes
By way of examples of current water allocation planning processes, Western Australian
(DOW, 2011) and New South Wales (DIPNR, 2004) processes are overviewed in this section.
These are included as examples of how other states have or are responding to the
requirements mandated under the National Water Initiative.
Western Australia
The objective of the WAP process in WA is to determine how much water can be licensed
for abstraction and how much water is left in the system. ‘Standard’ allocation plans are
developed where abstraction is between 30 and 70% of the available resource, and
‘intensive’ allocation plans where abstraction is greater than 70%. Plans are evaluated
annually, though the Guide document does not detail the process for initiating revision
during the lifetime of a plan. Steps are:
A. Assess information
• understand the resource
• understand how much water needs to be left in the system
• understand water demand and trends
• identify stakeholder participation
B. Set objectives and allocation limits
• set water supply, resource integrity, environmental requirements and input from
stakeholders objectives
• decide on environmental water
• calculate a resource yield
• decide allocation limits
• stakeholder participation
C. Define the management approach
• develop plan policies
• develop plan monitoring program
• stakeholder participation
D. Release plan
E. Plan implementation and evaluation

30
New South Wales
This example for NSW is for the Murrumbidgee Water Sharing Plan, which has been recently
updated. Most of the 11 objectives of this Plan are generic and seek to provide
for/protect/sustain/restore ecological processes, watering regimes, populations and
diversity of indigenous species, native title and basic landholder rights, town water supply,
commercial consumptive use, recreational requirements and end-of-system needs. The
specific allocation objective is to maximise early season general security allocations. The
steps are:
1. Establish the flow relationships of the river and ecological processes (construct a
hydrological model to analyse options for river management, based on historical flow
records);
2. Provide water for the environment (establish key environmental features and devise
flow related rules to provide water to sustain or improve those features);
3. Provide water for basic landholder rights (estimated total requirements for stock &
domestic and native title rights);
4. Determine access licence requirements (assess total share volumes of all access licences
and rules for granting of any additional access licences);
5. Set limits on water for extraction and share that between different water users (set
extraction limit on an average yearly basis and the rules for managing to those limits,
and specify how the water that is available will be shared between all access licences);
6. Provide flexibility for access licence holders (set rules on how water accounts are to be
managed and define the trading arrangements);
7. Provide clear licensed rights (translate steps 5 & 6 into mandatory conditions on
individual access licences and approvals, specify system operation rule, and if and how a
plan rule can be amended);
8. Monitor plan (review implementation yearly and audit performance every 5 years).
Evaluation criteria
The National Water Commission (NWC) has compiled a set of 12 assessment criteria, based
on the critical elements of water planning contained in the National Water Initiative, and
against which plans within each State are critiqued biennially. The first report card was
published in 2011 (NWC, 2011). The report card criteria are (expressed here as a set of
questions related to the plan and the plan area):
1. Is there a plan in place?
2. Does the plan include key assessments?
3. Does the plan address overuse and is there a pathway to sustainable extraction?
4. Does the plan include clearly identified and measurable outcomes?
5. Does the plan facilitate trade?
6. Is interception appropriately considered and integrated into the plan?
7. Does the plan include/address surface water and groundwater connectivity as
appropriate?
8. Does the plan contain accountable environmental water management arrangements?
9. Is there adequate monitoring occurring, and are there compliance and enforcement
mechanisms in place?

31
10. Does the plan deal appropriately with climate change and extremes in inflows or
recharge?
11. Is stakeholder engagement in the planning process adequate?
12. Have identified outcomes been achieved during the reporting period?
Within each of these criteria, there are sub-questions which make it very clear what needs
to be considered and incorporated into the development or revision of water allocation
plans. Risk is explicitly mentioned in a number of places in the sub-questions in relation to
assessing:
• risks to the water resource
• whether monitoring arrangements are put in place to address the identified risks
• risks to the water resources arising directly from interception activities (existing or
potential).
Risk in the context of water allocation planning
Risk identification and assessment
The multiple benefits, costs and trade-offs inherent in water allocation planning require
careful consideration as to how risk and its consequences are predicted and quantified. The
complexity can be overwhelming if the risk assessment is not confined to an agreed set of
objectives, based on an agreed set of values and desired outcomes. How to assess slow-
moving, chronic risk (e.g. rising salinity, increasing temperature and reduced rainfall) against
periodic or single event risk (e.g. 1-in-100 year flood) is not a trivial issue. The evidence base
on which to build responsive, adaptive management is small.
Chapter 9 of the proposed Basin Plan for the Murray Darling Basin (MDBA, 2011) sets out a
risk identification and assessment methodology that conforms to ISO31000:2009 (Standards
Australia, 2009). Importantly, it emphasises the need to have regard to current and future
significant risks. It is prescriptive in suggesting that (all) risks must be listed in the water
resource plan and each risk must be assessed. We would assert that not only is this
impossible, the undue emphasis on understanding and characterising the problem space
can come at the cost of learning by doing and exploring the solution and/or opportunity
space. Importantly, the analysis should cover hazard risk, opportunity, barriers and
resources.
Risk evaluation
Whereas risk assessment attempts to be objective (and repeatable), evaluation is based on
values, risk profiles and priorities and the significance of the risk to the government, to the
plan, and to stakeholder groups. Evaluation determines whether the assessment of likely (or
unlikely) consequences is accepted. As previously stated, behavioural studies suggest that
explicit inclusion of uncertainty leads to conservative behaviour, which may result in missed
opportunities. The ability to maximise opportunities at the cost of incurring negative
consequences may require risk-taking that is difficult for government agencies to undertake
in the public arena, but which could be undertaken by non-government organisations that
are willing and able to act radically (but not rashly).
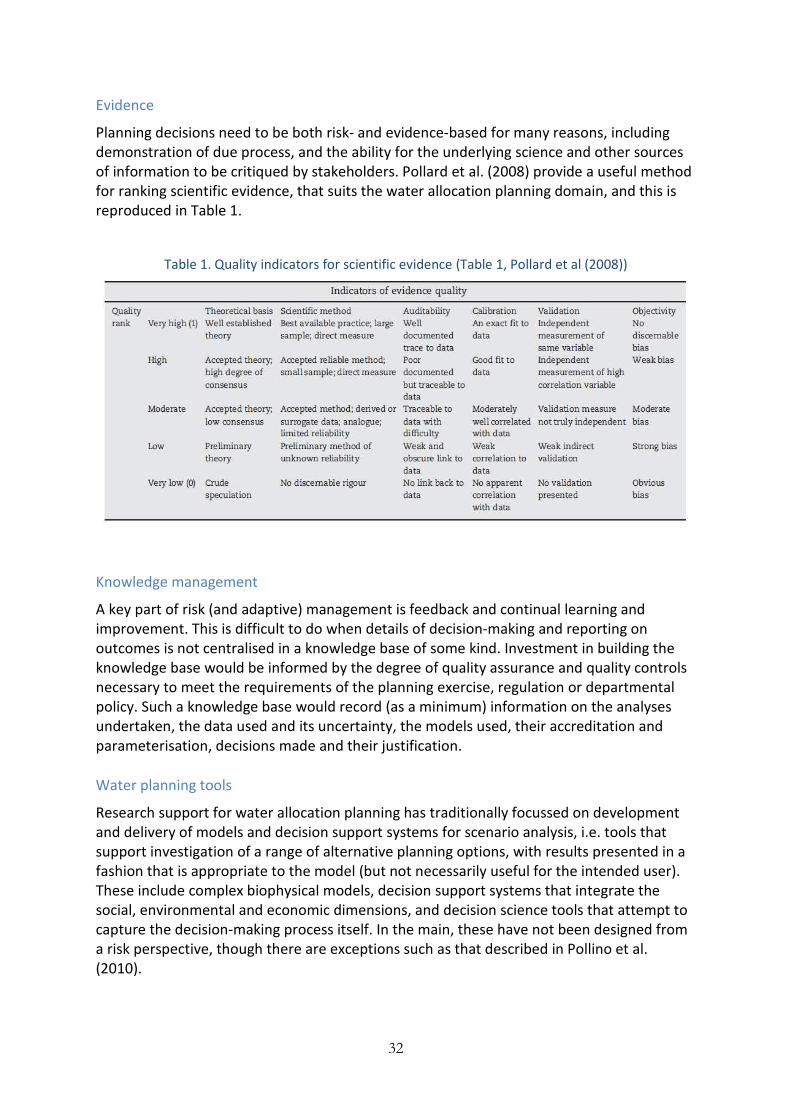
32
Evidence
Planning decisions need to be both risk- and evidence-based for many reasons, including
demonstration of due process, and the ability for the underlying science and other sources
of information to be critiqued by stakeholders. Pollard et al. (2008) provide a useful method
for ranking scientific evidence, that suits the water allocation planning domain, and this is
reproduced in Table 1.
Table 1. Quality indicators for scientific evidence (Table 1, Pollard et al (2008))
Knowledge management
A key part of risk (and adaptive) management is feedback and continual learning and
improvement. This is difficult to do when details of decision-making and reporting on
outcomes is not centralised in a knowledge base of some kind. Investment in building the
knowledge base would be informed by the degree of quality assurance and quality controls
necessary to meet the requirements of the planning exercise, regulation or departmental
policy. Such a knowledge base would record (as a minimum) information on the analyses
undertaken, the data used and its uncertainty, the models used, their accreditation and
parameterisation, decisions made and their justification.
Water planning tools
Research support for water allocation planning has traditionally focussed on development
and delivery of models and decision support systems for scenario analysis, i.e. tools that
support investigation of a range of alternative planning options, with results presented in a
fashion that is appropriate to the model (but not necessarily useful for the intended user).
These include complex biophysical models, decision support systems that integrate the
social, environmental and economic dimensions, and decision science tools that attempt to
capture the decision-making process itself. In the main, these have not been designed from
a risk perspective, though there are exceptions such as that described in Pollino et al.
(2010).

33
The sustainable diversion limits (SDLs) within the MLR will be managed in a similar way to
the Murray Darling Basin Plan’s diversion limit CAP, i.e.:
• a register of debits and credits will be kept
• each year the annual take will be declared, to ensure compliance (this will be done using
models)
• if a limit is exceeded in a year, then the model will be rerun over the long-term to verify
if there is a problem
• if there is a problem, new management strategies will be put in place, based on revised
modelling.
Estimates of extractions may also be based on modelling where observed information is not
available. There is no mention of how to deal with model uncertainty in this process.
The NWC and other organisations have invested in the identification and development of
tools for water allocation planning, and these are described in various NWC reports. Our
preference is for building tools that have generic applicability but which can be tailored to
meet the individual needs of each planning process, either through module re-use,
extensibility functionality, and/or through ease of use. Within this context, shell tools are
useful as they provide a consistent interface and environment.
Some tools that meet these criteria are Bayesian networks and models such as eWater’s
SOURCE (which is in fact a modelling environment in its own right due to its ability to
incorporate new models written using its Expression Editors). Importantly, both of these
tools incorporate and implement conceptualisations of the plan area – in Bayesian networks
it is captured as a set of nodes (concepts) and links; in Source, it is captured as a schema of
the river system, incorporating the concepts of rules, connectivity, demands, etc.
Causal mapping and/or influence diagramming tools are also useful for conceptualising the
plan area, particularly if they incorporate some intelligence in being able to build adjacency
(association of direct links) and reachability (i.e. influence) that describe (quantitatively or
qualitatively) the strength of causal links. Later in this chapter we introduce scientific
workflow technologies as being another appropriate tool.
Model parameterisation
The guiding principles on which objectives are established should carry through to model
parameterisation and setting of model analyses. For example, stakeholders might be highly
risk adverse, in which case conservative parameterisation is required. Such guidelines are in
fact useful for the model composers and analysts and ensure consistency in approach. In
addition, all assumptions and presumptions should be available for interrogation, and
results should be analysed based on the agreed guiding principles.
Use of workflow technology to underpin water allocation planning tools
Current practices in hydrological and water allocation modelling exhibit a heavy reliance on
individuals and manual steps – leading to lack of resilience, poor use of valuable skills, and
increased risk of non-reproducible errors. Information is dispersed depending on the culture
of the modelling team. There is a heterogeneity of toolsets and capabilities with islands of
specialisation (e.g. R, Excel, Perl, Matlab, Python, Fortran, C#) with manual transmission in
between. There are divergent and non-conforming data formats and idiosyncratic access

arrangements; and basic traceability is reliant on ‘off
exists at all). Adoption of a technology to support the rapid construction a
integrated modelling and reporting systems within an environment governed by business
rules and protocols would seem sensible. Scientific workflow software, as a technology for
composing and executing chains of scientific processes, appears
CSIRO has made an investment in developing the Hydrologists Workbench (now known as
‘the WorkBench’ – tWB) (Cuddy
hydrological and environmental modelling domains (
Figure 9. An example of a workflow showing a schema
implemented in tWB (on the bottom)
By their very nature, workflows sit well within planning pr
developers (those who write workflow components) and workflow composers (those who
build workflows from existing components) to think through the whole process, rather than
just the models. While business workflow technologie
scientific workflows are an emerging technology. Are they very different? Business
workflows tend to automate business processes that are well understood, strictly governed
and stable. Scientific workflow technology is d
transformation of data flows. In the applied domain of water resource management, which
operates within a strongly legislated and mandated environment, we think of ‘science
business’ workflows in which scientific and busi
10).
34
arrangements; and basic traceability is reliant on ‘off-line’ documentation (if documentation
exists at all). Adoption of a technology to support the rapid construction a
integrated modelling and reporting systems within an environment governed by business
rules and protocols would seem sensible. Scientific workflow software, as a technology for
composing and executing chains of scientific processes, appears to meet this need
CSIRO has made an investment in developing the Hydrologists Workbench (now known as
tWB) (Cuddy and Fitch, 2010) as a scientific workflow tool for the
hydrological and environmental modelling domains (Figure 9).
. An example of a workflow showing a schematic of the processes (on the top) and as
implemented in tWB (on the bottom)
By their very nature, workflows sit well within planning processes as they force workflow
(those who write workflow components) and workflow composers (those who
build workflows from existing components) to think through the whole process, rather than
the models. While business workflow technologies have been around for a long time,
scientific workflows are an emerging technology. Are they very different? Business
workflows tend to automate business processes that are well understood, strictly governed
and stable. Scientific workflow technology is designed to support exploration and
transformation of data flows. In the applied domain of water resource management, which
operates within a strongly legislated and mandated environment, we think of ‘science
business’ workflows in which scientific and business workflows are deeply enmeshed (
line’ documentation (if documentation
exists at all). Adoption of a technology to support the rapid construction and execution of
integrated modelling and reporting systems within an environment governed by business
rules and protocols would seem sensible. Scientific workflow software, as a technology for
to meet this need, and
CSIRO has made an investment in developing the Hydrologists Workbench (now known as
, 2010) as a scientific workflow tool for the
of the processes (on the top) and as
ocesses as they force workflow
(those who write workflow components) and workflow composers (those who
build workflows from existing components) to think through the whole process, rather than
s have been around for a long time,
scientific workflows are an emerging technology. Are they very different? Business
workflows tend to automate business processes that are well understood, strictly governed
esigned to support exploration and
transformation of data flows. In the applied domain of water resource management, which
operates within a strongly legislated and mandated environment, we think of ‘science
ness workflows are deeply enmeshed (Figure

35
Figure 10. Schematic of a ‘science business’ workflow
Workflows, incorporating a SOURCE model and other hydrological river system models
(IQQM, REALM), have already been developed by CSIRO to test the utility of tWB for
building a water allocation planning framework.
One of the strengths of using tWB is its support for provenance tracking, i.e. it has the
functionality to track and store model configurations and settings, model runs and any other
data that are tagged as being ‘storable’. The commercial software that tWB uses is a
Microsoft Research product called Trident. Trident interfaces with MS Word 7 to provide a
powerful documentation and workflow distribution packaging system.

36
WATER QUALITY IMPROVEMENT PLANNING PROCESSES
In the current WAPs, water quality is considered to be addressed when water volume is not
limited, i.e. water quality is not an issue if the flow regime is adequate. However, this may
not necessarily be the case, particularly during certain times of the year under low flow
regimes (usually periods of groundwater contribution). Furthermore, a number of studies
have shown changes in streamflow regime in several catchments in Australia, to the extent
that for the same rainfall less runoff is generated. This potentially could result in increased
concentrations of contaminants in water moving into streams due to decreased dilution
effect. In order to target any mitigation strategies and extend any monitoring programs it is
important to determine, spatially and temporally, those sub-catchments of the MLR that
currently pose the greatest risk based on water quality.
The current WAP proposes that during low flow conditions water be diverted from
upstream storage locations. Specific questions with regard to water quality that have arisen
from this proposal are:
• Can mapping surface water quality through the MLR, both temporally and spatially,
improve the process for selecting which sub-catchments (and when) water will be
diverted from?
• Are periods of low flow only an issue for health of aquatic ecosystems? Are there other
times of the year (e.g. after first flush events) when water diversions could improve
water quality in order to minimise impact on aquatic ecosystems (and impact on other
stakeholders such as providers of potable water supply, agriculturalists etc.)?
• Could improved water quality through water diversions be used to identify locations
from which to procure water that is more fit for purpose, and thus lead to cost savings?
Over many years there has been a large amount of surface water quality data collected in
the MLR, measuring various parameters including basic physico-chemical variables such as
turbidity, dissolved oxygen, electrical conductivity, pH and temperature (e.g. Schmarr and
McNeil 2010; SA Water, unpublished) as well as more investigation–specific parameters
such as dissolved organic carbon (Nelson et al., 1990; Varcoe et al., 2010) and nutrient and
pesticide concentrations (Oliver et al., 2012; Cox et al., 2012). These data are held by
different agencies and in various publications, and need to be collated and further
interrogated to identify locations and times in those regions when water quality becomes an
issue.
Source Catchment modelling through the eWater CRC has commenced this process
(discussed above), and has incorporated some water quality parameters (TP, TN and TSS)
into a decision support tool to assist with the assessment of the impacts of changes in land
use and land management, changes to government policy, and climate change on water
quality in MLR (Thomas et al., 2010). In the Source Catchment modelling, event mean
concentration (EMC) and dry weather concentration (DWC) values are used to parameterise
and validate the Source Catchments Model developed for the MLR Applications project
(Fleming et al., 2010). Fleming et al. (2010) has analysed total nitrogen (TN), total
phosphorus (TP) and total suspended sediment (TSS) data from six primary land uses and 15
composite sampler sites in the MLR. They have calculated event mean concentrations (EMC)
for TN, TP and TSS and related these to land uses in the sub-catchments. Data from primary
land use sites and weekly composite sampler sites were used. In the model simulations EMC

37
values for each site were determined over the whole monitoring period as detailed in
Fleming et al. (2010).
These data should be examined in more detail to determine temporal as well as spatial
variation in TN, TP and TSS (as well as other relevant water quality parameters e.g. alkalinity,
salinity) in the MLR, in order to identify seasonal changes in water quality. The data would
be interrogated to identify exceedance of the Australian environmental guideline values for
a range of water quality parameters for freshwater aquatic ecosystems (ANZECC/ARMCANZ,
2000). The ANZECC environmental guideline values are proposed to be used as the
threshold values because these trigger values have been derived for a wide range of
stressors (contaminants) and inherent within the Guidelines is the understanding that if the
trigger value is not exceeded the risk of an impact is low and conversely if the trigger value
is exceeded there is some risk of an impact to occur, particularly an adverse biological
impact (ANZECC/ARMCANZ, 2000).
An intention of the WAP process is to divert or return water under low flow conditions.
Furthermore, one of the stakeholders in the MLR, SA Water, manages eight water supply
reservoirs distributed across the MLR. SA Water will receive a water licence for its water use
and one of the conditions on the licence will be a requirement to release water from
reservoirs for environmental flows (AMLRNRMB, 2010b). A series of trials by the
AMLRNRMB will provide an initial basis for prioritising the proposed return of water from
reservoirs and dams to MLR catchments by identifying where and when water should be
returned to the system. This will also provide a basis for determining water quality under
low-flow regimes, which will link in with the current WAP that has identified allocation of
water based upon volume. In addition it will provide guidance for identifying where
potential mitigation strategies should be targeted in the future. Finally, the identification of
sub-catchments as ‘hot-spots’ will allow any modelling of potential impacts of climate
change, and associated decreased overland flow, to focus in more detail on regions that are
of higher risk of decreased water quality. It will also be used to inform any monitoring
program as to where to focus monitoring and what parameters to measure.
Water quality risk assessment
A tiered assessment approach will identify hydrologically-isolated sub-catchments where
the guideline values for these water quality parameters were exceeded as well as when, and
for how long, the exceedances occurred. Using a GIS platform, ‘hot spots’ in the MLR will be
identified based on sub-catchments and designated time periods throughout the year. This
will also be linked to land use, soil type, terrain, and drainage volumes to further refine the
identification of ‘hot spots’ and by inference allow an assessment of risk of exceedance of
these water quality parameters in sub-catchments where currently no monitoring data
exists. The ranking of sub-catchments by this risk assessment would also provide support for
the current Water Quality Improvement program and the SA Government’s Water for Good
policy.
The tiered risk assessment approach will involve four tiers which are detailed below with
some mock examples of the type of output that would be delivered.

38
Tier 1: Simplest assessment
This is the simplest assessment. It compares mean concentrations of pollutant time series
with water quality limits and identifies the probability that mean pollutant concentrations
exceed water quality guidelines using the standard error of the mean. Tier 1 uses a simple
assessment that compares the sampling distribution of the mean to the relevant water
quality guideline for each of the pollutants assessed. Relative risk is measured in at least
two ways with this approach: (a) by calculating the ratio of the pollutant mean and water
quality guideline (equivalent to the PEC/PNEC ratio), or (b) by using a very simple loss
function: mathematically an indicator function which returns the value 1 if you are above
the water quality guideline and 0 otherwise. Relative risk in the latter becomes 0 for all
observations below the water quality guideline and 1 x the area of distribution function
above the guideline, where the distribution function is given the sampling distribution of the
mean. For a relative, low tier risk assessment, both of these approaches are defensible and
may prove adequate screening tools.
An example of this tiered assessment for TSS data for Lenswood and Cox Creek is given in
Figure 11.
Figure 11. Tier 1 assessment of the Total Suspended Solids data from Lenswood from 2006–2010.
The mean is indicated by the black line and the environmental trigger value (50 mg/L) is indicated by
the dashed line. The environmental trigger value identified is the guideline from NSW as there is no
guideline for SA (ANZECC/ARMCANZ, 2000). Data has been provided by SA Water.
Tier 2: Exceedance probability characterisation
Tier 2 provides a more realistic assessment of chronic and acute exposure scenarios. This
tier characterises acute and chronic exposure in two ways:
• For those pollutants where high frequency time series data is available an Extreme Value
distribution is fitted to each pollutant, either via a Peak over threshold approach and
0
50
100
150
200
250
300
350
400
450
4/01/2006 4/01/2007 4/01/2008 4/01/2009 4/01/2010 4/01/2011
TS
S (
mg
/L)
Date
Lenswood TSS (mg/L) 2006-2010
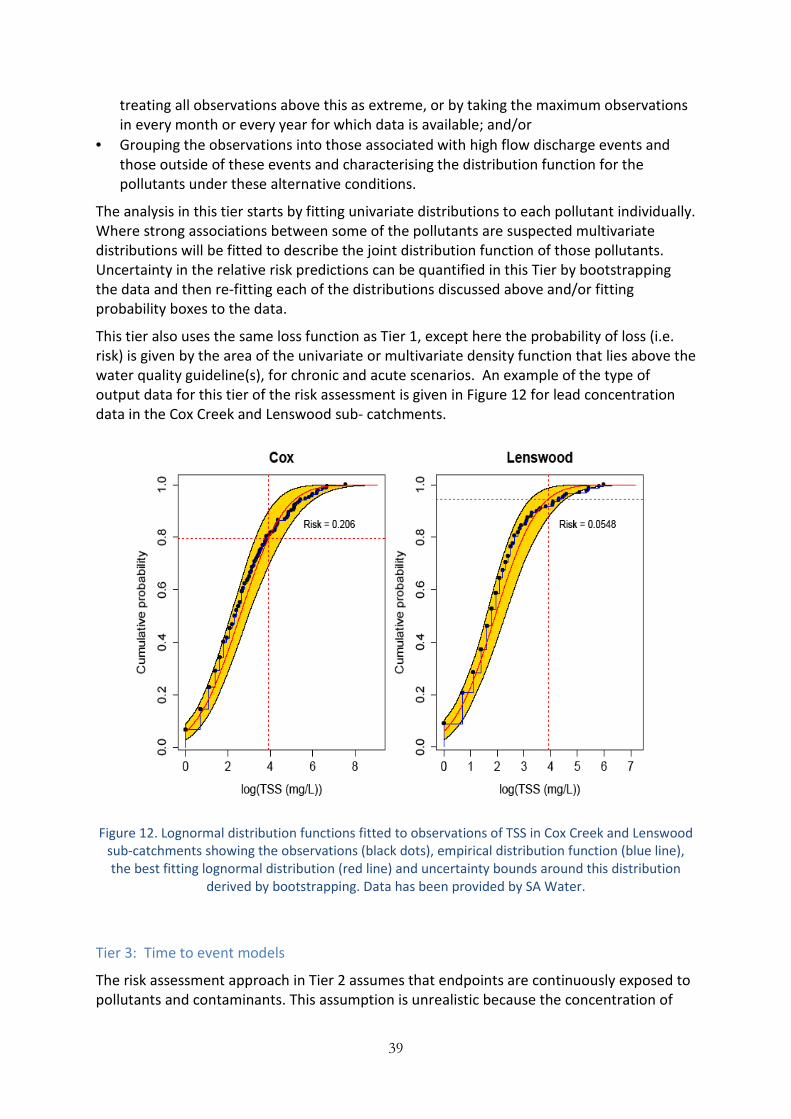
39
treating all observations above this as extreme, or by taking the maximum observations
in every month or every year for which data is available; and/or
• Grouping the observations into those associated with high flow discharge events and
those outside of these events and characterising the distribution function for the
pollutants under these alternative conditions.
The analysis in this tier starts by fitting univariate distributions to each pollutant individually.
Where strong associations between some of the pollutants are suspected multivariate
distributions will be fitted to describe the joint distribution function of those pollutants.
Uncertainty in the relative risk predictions can be quantified in this Tier by bootstrapping
the data and then re-fitting each of the distributions discussed above and/or fitting
probability boxes to the data.
This tier also uses the same loss function as Tier 1, except here the probability of loss (i.e.
risk) is given by the area of the univariate or multivariate density function that lies above the
water quality guideline(s), for chronic and acute scenarios. An example of the type of
output data for this tier of the risk assessment is given in Figure 12 for lead concentration
data in the Cox Creek and Lenswood sub- catchments.
Figure 12. Lognormal distribution functions fitted to observations of TSS in Cox Creek and Lenswood
sub-catchments showing the observations (black dots), empirical distribution function (blue line),
the best fitting lognormal distribution (red line) and uncertainty bounds around this distribution
derived by bootstrapping. Data has been provided by SA Water.
Tier 3: Time to event models
The risk assessment approach in Tier 2 assumes that endpoints are continuously exposed to
pollutants and contaminants. This assumption is unrealistic because the concentration of

40
water-borne pollutants is strongly influenced by complex dispersion processes including
sedimentation, transformation and biological uptake. Tier 3 addresses this issue by dividing
the exposure period into short periods of time (bins) within which the variation in pollutant
concentration can be considered negligible or very small. A concentration-time curve is
developed by accumulating the actual time that the pollutant concentration lies within a
specific bin. Relative risk in Tier 3 is measured by the accumulated time in all concentration
bins that exceed the relevant water quality guideline – the area under the pollutant’s
concentration-time curve for concentrations that exceed the water quality guideline.
It is important to recognise, however, that this approach is only possible for pollutants that
have been continuously observed, and that the minimum width of the time bins is
determined by the temporal resolution of the observations – i.e. the bin width can be no
smaller than the resolution (per second, per minute, per day) of the observations. The utility
of this approach diminishes quickly as the resolution of the observation deteriorates (per
week, per month, per year) and may not therefore be applicable to all pollutants in all
locations.
Tier 4: More complex loss functions
Tier 4 attempts to improve upon the simple assessments in Tiers 1, 2 and 3. Tier 4 further
develops the risk calculation by changing the loss function. Importantly, Tier 4 is able to
utilise the exposure calculations of Tiers 2 and/or 3 and does not need to repeat the
calculations and model fits discussed above in order to incorporate a more complex loss
function. Moving to a more complex loss function, however, is contingent on an exposure-
response model, based ideally on field or laboratory, time-to-event observations. This
information, combined with the time-variable exposure models of Tier 3, allows an
absolute, rather than relative, risk calculation.
The loss functions in Tier 4 explicitly attempt to link water quality parameters to ecological
response at the either the individual species or community level. The application of this tier
is contingent on the availability of empirical derived relationship between pollutants and
ecological response. Survey data by Schmarr and McNeil (2010) of fish abundance and
diversity and water quality (dissolved oxygen, electrical conductivity, pH and temperature)
at 13 sampling sites along the Onkaparinga River may be useful for deriving loss functions
for Tier 4 of the risk assessment but this will depend upon the number of observations.
In this risk assessment additional water quality parameters (e.g. temperature, pesticides
etc.) will be considered in addition to those modelled by Fleming et al. (2010) (i.e. TP, TN
and TSS).
The proposed tiered risk assessment approach is considered a more robust approach
because:
• It is a data-driven, probabilistic risk assessment that is transparent, less susceptible to
heuristic bias and provides a suitable basis for cumulative risk assessment.
• It uses a ratio-scale risk metric that importantly provides managers with a risk estimate
that does indicate by how much catchment A is higher than catchment B, and hence, if
the assessment is accurate, how much more risk mitigation investment might be
appropriate in catchment A over catchment B.
• The probabilistic foundation allows the application of tried and trusted uncertainty

41
analysis techniques (see for example Morgan and Henrion, 1990; Frey and Burmaster,
1999) that can help guide future resource allocation and also clearly identify the impacts
of data gaps on risk outcomes.
Specific outputs from this study will be:
• A systematic, evidence-based approach for ranking sub-catchments in the MLR on the
basis of water quality;
• A process for identifying which sub-catchments in the MLR would be suitable and
conversely which would not be suitable or present a water quality risk if water is
diverted during periods of low flow; and
• A GIS map of the MLR catchments that would link land use, soil type, hydrology and
terrain with “hot-spots” for different water quality parameters and, by inference, allow
the assessment of the water quality in other sub-catchments that are currently not
monitored.
This will allow for evidence to support policy outcomes by incorporating:
• A systematic, transparent, evidence-based process for determining the allocation of
resources in the MLR that incorporates water quality in planning decisions which are
fundamental to South Australian Government’s Water for Good document and the
South Australian EPA’s Water Quality Improvement program; and
• A process for making informed decisions to target future monitoring in the MLR sub-
catchments and for determining priority water quality parameters to be monitored (i.e.
are there sufficiently strong relationships between various parameters that would allow
certain parameters to act as surrogates for other parameters).

42
MAJOR LAND USE IMPLICATIONS FOR WATER ALLOCATION PLANNING IN THE
MOUNT LOFTY RANGES
A major land use that affects both the quantity and quality of water in the MLR is irrigated
agriculture. Thus, we need to be mindful of the development of sustainable irrigation
communities and sustainable irrigation systems in a context of potentially decreasing
availability of water resources and deteriorating water quality. Irrigated agricultural
production in the MLR is coming under increasing pressure from changing water quality,
increased temperatures, increased salinity of irrigated soils, demands for water for the
environment, urban development and demands for increasing agricultural and forestry
production. In turn these pressures are forcing irrigators to look for ways to increase water
use efficiency.
Irrigated agriculture is a significant presence in the MLR, both in terms of its socio-economic
contribution to the region, and its share of water use. According to the respective WAPs
(AMLRNRMB, 2010a, 2010b; SAMDBNRMB, 2011) the combined area of irrigated crops in
the Eastern and Western MLR PWA is approximately 28,000 ha. Major crop types are
pasture (including lucerne), grapevines, fruit trees, and vegetables.
Water for irrigating these crops is drawn from a range of sources. In the western MLR PWA
there are 11,500 wells, 13,000 dams and 250 watercourse extraction points (AMLRNRMB,
2010a), although many of these are associated with stock and domestic, industrial or
commercial use rather than irrigation.
The published estimate of water demand for irrigation within the eastern MLR PWA is
around 45 GL/annum, made up of 13 GL taken from surface water (dams) and watercourses,
and 32 GL taken from groundwater (SAMDBNRMB, 2011). This compares to an estimated
Total Resource Capacity for the EMLR of 188 GL/y, made up of 108 GL/y of surface water
resources, and 80 GL/y of groundwater resources. Published figures of resource capacity
and irrigation water demand are not available for the western MLR PWA.
The total water requirement is distributed unevenly across the region, with location of
irrigated crops determined by factors such as access to good quality water, topography,
mesoclimate, land ownership and zoning. In addition, different crop types require different
amounts of water, with the result that intensive plantings of one crop may be of little
consequence due to the low amounts of water extracted, but similar levels of other crops
may be extremely significant, as a result of their larger water requirements.
In addition, water requirement occurs unevenly across the year, with peak requirements for
most crops occurring during the summer months, generally coinciding with low rainfall,
whilst winter crop requirements are substantially or fully met by rainfall, as requirements
are lower and rainfall is higher (Figure 13). This temporal variation in water extraction for
irrigation can create problems in its own right, as the annual requirement may be within the
annual capacity of the resource, but the concentration of extraction into a short time frame
may lead to issues, such as excessive short term drawdown in groundwater systems,
especially where there is a geographic concentration of wells and the aquifer has low
transmissivity or is located over a local groundwater flow system. The higher discharge than
recharge of water would lead to water table drawdown and subsequent extraction of water
from lower aquifer may deteriorate the water quality. Hence a comprehensive groundwater

43
quality monitoring programme should be put in place for sustainable use of this vital
resource.
In addition to these causes of spatial and temporal variability in water extraction, the type
of irrigation system used, as well as its age, condition and management, can significantly
influence the percentage of water extracted that is used by the crop, known as field
application efficiency (Barrett, Purcell and Associates Pty. Ltd., 1999). Poor field application
efficiency can result in the need to extract far more water than would otherwise be
required, and can also lead to environmental damage through waterlogging, salinisation,
sodication and leaching of nutrients from agricultural land into natural ecosystems. Further,
poor irrigation management has the greatest potential to result in low field application
efficiency (Skewes, 1997).
Figure 13. Crop water requirement, rainfall and residual irrigation requirement for citrus in Climate
Zone WMLR5 (from data generated by M. Skewes for Lamble (2008))
Spatial inventory of Mount Lofty Ranges irrigation
The discussion above highlights the fact that there is a need for more detailed data on water
extraction, quality and application in the MLR than is currently available, in order to identify
and address potential water allocation planning issues related to the use of water for
irrigation. In particular, spatial data assists in identifying locations where high water
extraction and application is likely, due to the density of development and the crop types
planted. These same factors may also be associated with potential for high nutrient
leaching, or with salinisation or sodication of soils due to varying efficiency of water
application. Potential access to other sources of water (e.g. recycled water) should also be
examined.
More importantly, the use of a GIS platform opens up the potential to overlay irrigation
water extraction and use data onto some of the data sets and modelling outputs discussed

44
in previous sections, where these data or model outputs are stored in a spatial form. This
will greatly facilitate the identification of potential trouble spots within the MLR, and can
assist in directing research, extension and regulation activities to address potential issues
early, before too much damage is done to the resource.
DfW currently holds a GIS database recording details associated with each licensed irrigation
extraction point within the MLR. A selection of data fields included in the database is
outlined in Table 2. It is proposed to interrogate this database in order to perform a spatial
inventory of irrigation across the MLR.
The spatial inventory will identify the location, water source, and assorted other information
associated with every extraction point across the MLR. This data will be used to develop
secondary data sets identifying important indicators such as the geographical location of
extraction ‘hot-spots’, and clusters of crop types generally irrigated by system types
associated with lower application efficiency (e.g. pastures, which are generally irrigated with
big gun irrigators, which tend to achieve lower field application efficiency than micro-
sprinkler and drip irrigation). This would also help to identify the areas where groundwater
or recycled water has been used for irrigation which can be utilised for evaluating the extent
of use of these waters and devising spatial and temporal monitoring strategy for water
quality.
Table 2. A selection of data fields in the DfW MLR irrigation extraction point database
Field name Data description
Licence No. Water licence number
Water Source Bore/dam/watercourse/roof runoff/flood diversion
Water Source
ID/Size
Well number/Dam capacity
Easting Water source location easting
Northing Water source location northing
Source Use Irrigation/stock/domestic/industrial/commercial
Crop Type Irrigated crop type category(s)
Irrigated Area Hectares of crop(s) irrigated
TCR Allocation Calculated allocation volume for total area of crop(s)
Volume Allocated volume(s) for industrial/commercial activity(s)
Total Allocation Sum of volumes for various uses
Cross-referencing these data with GIS data sets identifying geographic water availability,
water quality and environmental risk will facilitate the targeting of programs to improve
irrigation efficiency, with the aim of reducing the impact of irrigation on the water resources
and water dependent ecosystems of the MLR.

Figure 14. Surface (l) and Groundwater (r) Management Zones within th
management zones where estimated extraction exceeds Sustainable Extraction Limit are shown in
As an example of the type of data that may be generated by this process,
Surface and Groundwater Management Zones where estimated extraction exceeds the
Sustainable Extraction Limit for the zone in
illustrates the potential of overlaying different GIS data sets to generate composite data.
With the GIS information contained in the database
at much finer scale that this, alt
and may differ between indicators.
Data arising from the spatial inventory may also be further manipulated to produce
additional outcomes. For example, irrigation has two potential subsurface impact
rising water tables: (1) the likelihood of water logging and soil salinisation, and (2) increased
groundwater discharge to nearby rivers.
• Irrigation leads to the development of groundwater mounds that have the potential to
result in water logging and salinisation.
developed by the CRC for Irrigation Futures
be used to predict the water table rise that occurs as a result of increased deep drainage
beneath an individual irrigation patch and a mosaic of irrigation patches.
• The rise in groundwater levels due to increases in deep drainage beneath new irrigation
areas can enhance groundwater discharge to adjacent rivers.
change the baseflow regime of rivers and, if the groundwater is saline or high in ot
constituents, can lead to changes in
salinization if used inappropriately.
45
Surface (l) and Groundwater (r) Management Zones within the Western MLR PWRA,
management zones where estimated extraction exceeds Sustainable Extraction Limit are shown in
brown (DfW, 2010a, 2010b)
an example of the type of data that may be generated by this process,
Surface and Groundwater Management Zones where estimated extraction exceeds the
Sustainable Extraction Limit for the zone in question (brown shading). This example
illustrates the potential of overlaying different GIS data sets to generate composite data.
With the GIS information contained in the database described above, data
at much finer scale that this, although the most appropriate scale is yet to be determined,
and may differ between indicators.
Data arising from the spatial inventory may also be further manipulated to produce
For example, irrigation has two potential subsurface impact
rising water tables: (1) the likelihood of water logging and soil salinisation, and (2) increased
groundwater discharge to nearby rivers.
Irrigation leads to the development of groundwater mounds that have the potential to
and salinisation. Analytical modelling approaches similar to those
developed by the CRC for Irrigation Futures (Cook et al., 2008; Paydar et al., 2011
be used to predict the water table rise that occurs as a result of increased deep drainage
beneath an individual irrigation patch and a mosaic of irrigation patches.
e rise in groundwater levels due to increases in deep drainage beneath new irrigation
areas can enhance groundwater discharge to adjacent rivers. This has the potential to
change the baseflow regime of rivers and, if the groundwater is saline or high in ot
constituents, can lead to changes in surface water quality and can lead to soil
salinization if used inappropriately. The analytical solutions of Knight et al.
e Western MLR PWRA,
management zones where estimated extraction exceeds Sustainable Extraction Limit are shown in
an example of the type of data that may be generated by this process, Figure 14 indicates
Surface and Groundwater Management Zones where estimated extraction exceeds the
question (brown shading). This example
illustrates the potential of overlaying different GIS data sets to generate composite data.
, data can be generated
hough the most appropriate scale is yet to be determined,
Data arising from the spatial inventory may also be further manipulated to produce
For example, irrigation has two potential subsurface impacts due to
rising water tables: (1) the likelihood of water logging and soil salinisation, and (2) increased
Irrigation leads to the development of groundwater mounds that have the potential to
Analytical modelling approaches similar to those
Paydar et al., 2011) can
be used to predict the water table rise that occurs as a result of increased deep drainage
beneath an individual irrigation patch and a mosaic of irrigation patches.
e rise in groundwater levels due to increases in deep drainage beneath new irrigation
This has the potential to
change the baseflow regime of rivers and, if the groundwater is saline or high in other
and can lead to soil
et al. (2005) and

46
Rassam et al. (2004, 2005) can be used to predict the effect of deep drainage increases
from irrigation development scenarios on the groundwater flux to adjacent rivers.
Salts in the landscape due to irrigation
All water contains salts, the amount and specific ions depending on the source of the water.
Rainwater is very low in salts, but not completely pure. Surface water sources are usually
somewhat more salty than rainwater, having picked up salts in their movement across the
landscape. Groundwater is generally the most saline water source, and variation between
aquifers at different depths beneath the same surface location is quite common.
The roots of most plants are able to exclude salts and take up only pure water, plus those
ions which the plants require (nutrients). As a result, as soil water is removed and transpired
by the crop, salts remain in the soil and over time the concentration of salts increases. If
these salts are not leached out of the root-zone, the root-zone becomes progressively more
saline, causing crop decline and eventual death. The process of irrigation-induced salts
deposition in the soil is known as secondary salinisation. This process is very slow under
rain-fed cropping, but accelerates rapidly as the salinity of the applied water increases
under irrigated cropping. If the irrigation water contains higher proportion of carbonates
and bicarbonates of sodium, their consequent deposition in the soil leads to soil
sodification. The excess sodium lead to clogging of interstitial spaces between particles by
dispersing clay and swelling and slaking of aggregates which in turn block pore spaces in
between particles and virtually lead to sealing the soil and affecting the water transmission
properties drastically. Endemic soil sodicity and wastewater irrigation sodicity are common
features of many of the irrigation sites in Australia (Muyen et al., 2011). The reclamation of
these soils and waters require addition of gypsum depending on the severity of the
problem. Simple softwares can be developed to assist the irrigators for calculation of
gypsum requirement of their soil and irrigation waters on the basis of ESP of soil and, SAR
and RSC of irrigation waters. The presence of other specific ions like B, F and Se in irrigation
water induces specific ion toxicity even if they are present in very low amount (1ppm) in
irrigation water. Hence a proper monitoring programme of irrigation water with respect to
quality parameters is important to check their presence and strengthening the water
allocation planning for sustainable farming.
Leaching is the flushing of salt from the root-zone by the application of additional water
over and above the water holding capacity of the root-zone. This additional water carries
salts with it as it moves past the bottom of the root-zone. This is a benefit to the crop, but
results in the salts moving into the landscape. The geography and hydrology of the
landscape will determine the potential impact of salts on the landscape.
Impacts of salts on the landscape, therefore, are a function of water source (salinity), crop
type (amount of water, and therefore salts, applied), and location in the landscape (slope,
subsoil permeability, presence of shallow aquifers etc.). All of these criteria can be
evaluated using the spatial inventory discussed above, to determine the salinity risk posed
to the landscape from the range of irrigation licences across the MLR.

47
Innovative techniques and technologies to improve irrigation efficiency and
productivity
The spatial inventory outlined above will assist in targeting programs to improve irrigation
efficiency and productivity, and reduce the environmental impacts of irrigation, to those
regions in most need or where the greatest benefits are likely to be realised.
Depending on the outcomes of the spatial inventory, an Innovative Techniques and
Technologies program would work with groups of irrigators based on regional or industry
linkages, to research, develop and extend suitable irrigation innovations, in order to
improve the efficiency of irrigation, with the aim of not only reducing the impacts of water
extraction from water sources and application of water to the landscape, but also to
improve the viability of the irrigated cropping enterprises being undertaken within the MLR.
Precision modelling on factual data on various crops and irrigation systems would help in
fine tuning the irrigation and fertigation scheduling of crops thereby would help in
controlling the deep drainage and fertilizer leaching to the groundwater.
Potential innovations that could be applied to irrigated agriculture in the MLR include:
• Subsidised irrigation system evaluations, and recommendations for improvements to
increase field application efficiency across the range of irrigation system types, with the
aim of reducing water extraction, and the impacts of runoff and deep drainage;
• Promotion and subsidisation of irrigation system upgrades, including to subsurface drip
irrigation (where crop type allows), to improve field application efficiency and reduce
evaporative losses, thus reducing extraction volume and pumping costs, and
ameliorating the impacts of water quality on crops;
• Appropriate soil water and/or crop water stress monitoring and precision modelling
technologies to improve irrigation scheduling, in turn improving crop productivity and
quality, and reducing deep drainage and leaching of nutrients;
• Development of fertigation and water quality usage guidelines for some of the more
common high input crops (fruits and vegetables), incorporating soil water and soil
solution monitoring to assist in management of nutrient applications for improved
productivity whilst avoiding damage to the landscape from escaped nutrients.
• Modifications to crop architecture (including row orientation and canopy management)
and the use of ‘sunscreen’ products to reduce crop stress and heat damage during
heatwaves, modify orchard evapotranspiration, and increase production and quality of
crops;
• Inter-row soil management practices to improve soil parameters such as increased
organic carbon to enhance retention of moisture retention and nutrients within the soil.
The uptake of some of these innovative irrigation techniques and technologies will be
accomplished through the provision of subsidies and support services. However, some
innovations require further investigation and development before they will be suitable for
immediate uptake in the MLR. The development process for these techniques and
technologies will follow a 3 step progression:
• Research: Potential innovations must be thoroughly researched before being
introduced, to avoid unforseen adverse outcomes, or poor uptake due to real or
perceived technical issues. In some cases this research will be desktop studies, but some

48
on-ground research trials may be required, in order to validate results from other
locations under MLR conditions.
o Fertigation trials are proposed in a range of commonly grown fruit and vegetable
crops, to assess crop nutrient uptake across the growing season, and evaluate
crop response and nutrient escape under different water and nutrient
application scenarios. This will be modelled on work conducted in the Riverland
on almonds and citrus (Skewes and Mahadevan, 2011; Skewes et. al., 2011a;
Phogat et al., 2011; Phogat et al., 2012a to e; Treeby et al., 2012a,b).
o For certain other fruit crops (including apples and vines), research trials are
proposed to evaluate the use of soil water and plant stress monitoring to
manage low irrigation inputs for improved product quality, giving a double
benefit of reduced water use and increased crop value. Although the principals
of regulated deficit irrigation are well understood in vines in drier areas of South
Australia, irrigation in the MLR has been less closely managed as a rule, and this
project would address the knowledge gaps for this region.
• Development: Research trials are useful for demonstrating differences between
treatments. However, it is important that any innovation is developed beyond the
research plot, into a management system suitable for implementation by irrigators. The
second stage will be to work closely with a few progressive irrigators to assist them in
implementing the innovations on their own properties. A close working relationship with
these irrigators will be necessary, in order to work through the inevitable issues that will
arise when research trial results are transferred to a working property, where resources
are limited, and priorities vary. The ultimate aim is that innovations will become an
integral part of the operations of the property, so that outside support is no longer
required.
o For example, the fertigation trials established above will be progressively turned
over to the control of the property owners/managers, with initial support and
guidance to assist them to become familiar with the technology and the
information it provides.
o Similarly, the reduced irrigation monitoring trials outlined above will be
progressively passed into the control of owners/managers, allowing them to
adapt them to their own management systems.
• Extension: Extension programs sometimes rely wholly on technical information transfer.
However, for best uptake it is essential that people see others successfully implementing
innovations. The development sites established above will become focal points for
extension activities, in the form of written case studies, on-site field days, and grower
discussion and comparison groups (benchmarking). Additional support, in the form of
subsidies for purchase of equipment, or support in establishment of management
systems, may be required during this phase.
o For example, the fertigation trials established above will become demonstration
sites, to act as a focus for extension activities around fertigation. In addition the
results of the trials will be developed into guidelines for fertigating fruit and
vegetable crops in the MLR, as previously carried out for Almond crops in the
Riverland (Skewes et. al., 2011b; Skewes et. al., 2011c).
o In the same way, the proposed soil water and plant stress monitoring trials
would become a focus for extension activities in the relevant crops.

49
o Irrigation water quality monitoring programme and development of water
quality guidelines for major crops can serve as a farmer’s advisory service for the
region where farmers can get first hand information about the use of ground
water for irrigation.

50
EXISTING MONITORING AND DATA COLLECTION
There have been a number of hydro-ecological studies (e.g. Schmarr and McNeil et al. 2010)
and hydro-chemical studies (e.g. Oliver et al., 2012; Cox et al., 2012) in the MLR. There are
currently a few research projects looking at the relationship between land use and
hydrochemistry (Leeuwen per comm.). Currently there are two major monitoring programs
including: i) the eFlows project (a framework for providing environmental water from
western MLR storages developed by AMLRNRMB, SA Water and DfW (Doeg et al., 2012)),
and ii) the Verification of Water Allocation Science Program (VWASP) (SKM, 2012).
eFlows project
In 2006, a total of 15GL/yr was approved for trial releases of Environmental Water
Provisions (EWPs) below SA Water supply reservoirs in the western MLR.
The environmental water was to support aquatic ecological processes along river reaches
downstream of four in-stream weirs for which trial release patterns and monitoring
protocols were developed:
• The South Para River between the Barossa Diversion Weir and Gawler
• The Torrens River between Gumeracha Weir and Kangaroo Creek Reservoir
• The Torrens River between Gorge Weir and Torrens Lake
• The Onkaparinga River between Clarendon Weir and the estuary.
The trial to determine environmental responses to the flows commenced in late June 2006,
but was halted in October 2006 with the declaration of drought conditions in the Mount
Lofty Ranges. Now water has become available the trials have re-commenced with up to
16.74 GL/yr being available for trial releases.
Hydrological (flow conditions) and ecological (aquatic animals and plants) data are being
collected to inform the development of hydro-ecological relationships. The overall
ecological objectives to be achieved by the trial include:
• To deliver an EWP flow regime that maximises the probability of achieving self
sustaining populations of biota that currently exist within the area. This involves
improving environmental assets where they are in poor condition, and maintaining
assets where they are in good condition;
• Where possible, the EWP will promote conditions for the support of environmental
assets that have been lost (i.e. they are currently absent, but are predicted to have been
present prior to water resource development);
• The EWP flow regime will reduce the likelihood of future degradation of assets, and
increase their resilience to future drought conditions (including any temporary reduction
in the EWP);
• To determine local environmental objectives and release patterns to support these (e.g.
to achieve a self sustaining population of Flathead gudgeon with higher abundances
than currently present in the South Para River).
Verification of Water Allocation Science Program (VWASP)
In 2010, the AMLRNRMB commissioned Australian Water Environments (AWE) to undertake
an investigation into the monitoring requirements of each of the WAPs in the AMLRNRMB

51
region and in turn highlight the key monitoring locations for the board to focus its priorities
in order to satisfy these requirements. A long-term ongoing monitoring program is needed
to provide an indication of the performance of each WAP whilst enabling a determination of
the capacity and health of the resource.
As part of the brief AWE were instructed to identify locations which could potentially be
used to monitor the health of water dependant ecosystems in order to determine if the
EWPs were providing the correct amount of water to sustain the water-dependent
ecosystems at an acceptable level of risk. The sites were chosen on the basis of an existing
gauging station and the presence of historical macro-invertebrate sampling with the
intention of expanding the monitoring to include ecological indicators.
After discussions with DfW, the Board decided to amend its ‘super site’ monitoring plan to
take on the ethos of the VWASP project that was currently being tested within the MLR
(pers comm. Jason VanLaarhoven) and expand the project to cover the AMLRNRMB region.
In 2011, the Board engaged a consultant to undertake a site selection and verification
project based on the criteria developed by DfW (which included parameters such as:
presence of ecological responders, the ability to be gauged and the optional presence of
possible GW-SW interaction). A GIS analysis was first undertaken to identify potential
reaches and then a field verification exercise was undertaken to finally recommend 13 sites
(with at least one site in each WAP region) for the project’s implementation. It is anticipated
that a few of the 13 priority sites will also be candidates for monitoring the effects of low
flow bypasses.
The next stage of the project is now being developed which will include a baseline data
collection and the installation of required infrastructure. The plan is to have this project
support and augment the monitoring of some of the 13 sites.

52
FUTURE RESEARCH DIRECTIONS
Research issues
The research issues that have arisen from the series of workshops run to develop this
Scoping Study are summarised in Figure 15. Some consensus has already been reached on
the priority issues, which are discussed below in more detail (in no specific order).
Figure 15. Schematic of water allocation planning research needs
Embedding eco-hydrological understanding into the development of Water
Allocation Plans
A review of the hydro-ecological functions embedded within the current process for
developing WAPs is required. A broad (unranked) list of topics that should be included in the
review are:
• Indicators for which EWRs and metrics have been documented
o Within the existing work, have the most appropriate environmental ‘responders’
been chosen to represent EWRs?
• Hydrological and ecological metrics used for derivation of relationships
o Within the existing work, have appropriate hydrological and ecological metrics
been chosen to represent real conditions?
• Derivation of hydro-ecological relationship
Water Allocation Planning
• Sustainable diversion limits
• Hydrological modelling
• Water intercepting activities
• Interception and extraction
• Watercourse diversions
• Plantation forestry
• Risk mitigation strategies
• Diversion or taking rules
• Extraction limits
• Low flow bypasses
• Buffer zones
Water use scenarios
• Spatial and temporal patterns
• Management zones
• High flows, low flows
• Seasonal variability
• Climate change
Hydrological impacts
• Hydrological metrics
• Water quality
• Hydroecological relationships
• Ecological modelling
Ecological impacts
• Wetlands
• Fleurieu Swamps
• Central Hills
• Plains (reservoir releases)
• Watercourses
• GDEs
Socio economic impacts
• Urban
• Agricultural
• Industrial
• Recreational
• Drinking water
Monitoring, Evaluation, Reporting and Improvement (MERI)
• Surface water monitoring
• Groundwater monitoring
• Environmental condition monitoring
• Community monitoring
1. Risk based WAP
a. Risk management framework implementation
b. Low flow hydrology
c. Hydroecological relationships
d. eWater Source model platform migration
2. Water quality improvement programme
a. Water quality risk assessment
b. Spatial analysis of water quality data
3. Next generation irrigation technology
a. Spatial inventory of MLR irrigation
b. Precision irrigation case studies
c. Salinity and recycled water

53
o Are the methodologies that have been used to generate an understanding of the
ecological implications of changes in flow regime appropriate for policy
development?
• Determination of thresholds
o Are the methods used to determine ecological thresholds appropriate?
• Spatial up-scaling approach for EWRs (derivation of reach types and management zones)
o Are the regionalisation approaches undertaken to develop EWRs appropriate?
(i.e. conceptually mapping biota to habitats, and habitats to reach types based
on geomorphology and hydrology).
Key outcomes
1. Validation of existing processes for demonstrating environmental implications of
changes in the water regime due to water resource development; and/or
2. understanding and documentation of priority research required to refine/change the
existing process.
In addition to the review, four alternative research plans are proposed.
Research plan A – What taxonomic indicators (e.g. fish, macro-invertebrates, vegetation)
best show a measureable response to changes in hydrology (i.e. on which biological or
physical water dependent components should EWRs be based in order to derive a
relationship with changes in the water regime or water quality)?
Historically, this choice has been limited by available time-series data (fish and macro-
invertebrates) – a review is required to determine if these indicators are the most
appropriate to demonstrate relationships to the water regime, or if other indicators are
better suited. This will influence future (or modify current) data collection programs.
It is envisaged that this will: 1) facilitate the collection of appropriate ecological knowledge;
and 2) enable the extension of knowledge on the environmental implications of changes in
the flow regime to biologically similar areas across the state.
Research plan outline:
• National/International literature review
• Identification of responding indicators (likely to be biotic) for:
o Perennial, seasonal and ephemeral systems
o Surface and groundwater systems.
Research plan B – What easily measurable hydrological and ecological metrics can be used
to best show a relationship between ecological risk and change in flow regime?
Research plan A outlines which biotic or abiotic components of the environment will best
reflect a response to alterations in flow regime. Research plan B defines which measurable
components of those indicators reflect that hydroecological relationship (e.g. Fish -
recruitment success, disease proportion, population diversity; Macroinvertebrates -
population diversity, presence of particular trait preferring taxa; Vegetation - vigor,
germination, growth, function).

54
This task will also identify hydrological metrics to which changes in the ecological metrics
are responsive (e.g. frequency and duration of percentile flows). This will aid in decision
making in 1) targeting ecological monitoring and evaluation programs to provide
appropriate data to infer relationships to hydrology; and 2) developing appropriate
hydrological modelling to inform relationships. While there is no direct requirement for
Policy to access this knowledge, it is a critical piece of foundational science for the later
stages of the process outlined in a knowledge system for water planning (Figure 4).
Research plan outline:
• Review of the literature
• Review/analysis of existing data
• Expert panel workshop
• Data collection to validate recommended metrics
• Analysis of new data collected (based on outcomes of initial review – Years 2-3).
Research plan C – What is the nature of the relationship between hydrological metrics and
ecological metrics?
There is a requirement for the development of a methodology to relate (measured or
predicted) changes in flow regime (measured as hydrological metrics) to ecological
condition or risk (ecological metrics), including a methodology to inform decisions on likely
threshold levels. This knowledge is required to transparently inform the implications of
issuing licenses to existing users, set sustainable limits of development in WAPs, and
document the status of water resources within DfW status report cards.
It is envisaged that a library of hydroecological models be developed over time, and that
with an understanding of the presence of ecological indicators (Figure 3 – Item 1) these
relationships can be extended to other biologically similar areas (see research topic 4)
allowing the inference of likely environmental implications of changes in flow regime
brought about through water resource development or climate change based on learnings
from the Goyder Climate Change Projections for South Australia Project.
Without significant data, it will be difficult to determine threshold levels of ecological
change. It may be appropriate that a risk management approach be taken to inform
thresholds, accompanied by a monitoring methodology to validate and refine them.
Research plan outline:
• Develop conceptual models on the relationship between hydrology and ecological
response
• Use existing data to quantitatively populate and validate relationships
• Collect and review/analyse new data to validate relationship (Years 2-3)
• Document non-hydrological influences on relationships that may mask the influence of
hydrology (e.g. predator/prey interactions, land use, habitat availability, water quality).
Research plan D – How can hydro-ecological information developed at specific sites be
extended across whole prescribed areas, and transferred between them?
There is a strong requirement to develop the ability to transfer hydro-ecological knowledge
both between and within Prescribed Water Resource Areas (PWRAs).

55
PWRAs are required to develop a statement of EWRs, which is able to inform the
environmental implications of water resource development for the entirety of the
prescribed area, whereas the development of hydroecological models is generally based on
site specific data. The knowledge generated from these models must be able to be extended
across the whole of the prescribed area. The ability to extend the knowledge between
PWRAs is also a desired outcome of the Goyder research project.
A process has been developed and used within the MLR which conceptually maps biota
across the entire region. This allows the regionalisation of EWRs and the results of
hydroecological modelling. Further research into this will be guided through the review
process outlined in Task 1. As yet, no studies have explicitly attempted to provide an
understanding of the validity of extending knowledge from hydroecological models between
PWRAs.
Research plan outline:
• Review/refine conceptual models for transferability
• Review/analyse available data
• Output: Methodology to test the transferability (conceptual or data driven) of
hydroecological models.
Summary of data collection requirements to develop hydro-ecology for water planning
• A number of sites in the EMLR have 10 years of time series fish monitoring data.
• AusRivAS macro-invertebrate data is available from numerous sites across the MLR.
• Within the MLR there are at least 12 sites where time-series biological
(macroinvertebrates, fish and vegetation) and hydrological (temporal flow) data are (or
soon will be) being collected. Many of these sites are part of the VWASP monitoring
program currently being implemented by the AMLRNRMB. These sites are currently
limited to a single monitoring point each. This limits understanding of the possible
ecological responses to changes in hydrology.
• It is proposed that data collection at a subset of these monitoring sites be extended to
the immediate area (extra ~10 sites for each chosen existing monitoring site) to gain a
better understanding of the ecological processes that are influencing responses.
• Data collection at these sites will reflect the outcomes of Research plans 1-3.
• Further hydrological monitoring will increase understanding of the hydrological
processes influencing the ecology at these sites - it is proposed that a number of
targeted water level logger staffs (above those installed as part of the VWASP program)
be installed across each chosen sub-region associated with the sites chosen for
ecological data collection.
• Water quality may be a metric by which response can be inferred and should be
considered when installing monitoring infrastructure.
Issues with current hydrological parameters and models used for water
allocation planning
Four major hydrological issues have arisen from this review, all requiring prioritisation and
discussion as to the need to include them within a new research portfolio:

56
• Issue 1 - As mentioned previously, while the current method of apportioning catchment
flow might result in reasonable estimates of the total quantity of flow (as measured at a
gauging station), how reliable is it to apportion/re-distribute/scale-up flow regimes
(daily/sub-daily - flow hydrographs, flow frequency/duration curves)? This in turn raises
other important issues including whether the current eco-hydrological datasets and the
modelling platforms are sufficient.
• Issue 2 - Do the current conceptual catchment water-balance model platforms (with
Functional Units as in source.IMS) have the capacity to answer the question in Issue 1? Is
further conceptual understanding required to extend the existing model platforms? Can
further conceptual understanding be achieved with the current data sets or do we need
to collect data at finer resolution?
• Issue 3 - Do the current modelling platforms (WaterCress, source.IMS, others) have the
capacity to represent an integrated catchment system (catchments -rural, urban, rivers,
floodplains) with multiple functionality (various supply & demand, water quality and
EWR parameters)? And, do they have the capacity for modelling future climate
change/non-stationarity scenarios?
• Issue 4 – How are modelling parameters estimated and how do they affect the overall
planning process?
Low flow hydrology
Research is needed, using a combination of existing field data and modelling approaches, to
develop an understanding of the consequences of changes in water resource allocations and
climate on low flow in MLR catchments. This will inform the WAPs of sensitive areas where
water dependent ecosystems are reliant on low flow, including streams receiving
groundwater discharges from fractured rock aquifers, and groundwater dependent
ecosystems (the latter is discussed in more detail in its own section). The research should
focus on the surface water resource, taking full account of the groundwater component of
flow. That is, groundwater processes are explicitly taken into consideration to assess their
interaction with surface flows. It is recommended that study sites be selected based on the
following criteria: (1) availability of good quality gauge data; (2) prior knowledge of
conceptual models for groundwater flow, landform type, SW-GW connectivity and
groundwater interaction with rivers; (3) other supporting data such as water quality and
isotopes. Hence, it is advantageous to select sites where studies have been conducted in the
past. This is why the Scott Creek catchment was used (above) to illustrate the phenomenon
of nonstationarity. Catchment selection also needs to include catchments where changes to
land use and groundwater extraction have occurred in the past. The choice of the test
catchment should align with the Goyder Climate Change Project; in this project, the
Onkaparinga catchment was selected as the primary case study location as recommended
by the Goyder Institute RAC. This catchment includes the Willunga Basin Super Science Site
(WBSSS), which is funded though the Commonwealth Government’s Super Science program.
WBSSS is particularly suitable for groundwater modelling, while other areas in the
Onkaparinga catchment will be the focus of the surface water modelling in the application
test bed (Goyder Climate Change Project; Task 4).
The research needs to assess low flows with emphasis on its spatial and temporal variability.
It also needs to assess the impacts of land use change and/or climate change and/or
groundwater extraction on low flows (i.e., identify the phenomenon of nonstationarity of

57
flow); this task may be achieved by adopting a river model that accounts for groundwater
processes (such as: GW-Lag (Gilfedder et al., 2012); Source Rivers (Welsh et al., 2012) and
(Rassam, 2011)). Links should be established with the Goyder Climate Change Project, which
can provide the necessary input data for the climate change scenarios (Goyder Climate
Change Project; Task 3); such links should achieve efficient progress and minimizes
duplication (e.g., in rainfall-runoff modelling, Task 4 of Goyder Climate Change Project).
Methodology
This task is comprised of three major sub-tasks:
1. Collation and review of existing data knowledge: The SA government, CSIRO and
Geoscience Australia have carried out considerable groundwater investigations in
the MLR over the last 10 years. These have been carried out in many of the major
catchments (i.e. Angas-Bremer, Marne, Onkaparinga etc). This sub-task will collate
and review all of this data and knowledge, and use it to develop the best
understanding of the groundwater processes affecting low flow in the different
hydro-geological settings.
2. Identify spatial and temporal trends in low flow: Using the data and knowledge
collated in sub-task 1, historic spatial and temporal trends in low flow will be
determined for all hydro-geological settings where sufficient information exists. This
will provide a basis for assessing likely future trends that may occur as a result of
changes in groundwater recharge and discharge.
3. Predict/project future trends in low flow: Using the understanding of the historical
trends in low flow determined in sub-task 2, and existing modelling tools (e.g.
eWater’s PERFECT-GW lag model, which has been recently used to assess low flow
impacts in a NSW catchment due to possible increases in groundwater extractions),
projections of likely future trends in low flow due to changes in groundwater
recharge and discharge will be made for all hydro-geological settings where
sufficient information exists. The changes in groundwater recharge and discharge
considered will be those arising from activities such as the expansion/changes of
human activities such as farm forestry, groundwater extraction and farm dams, and
the hydrological impacts of climate variability and climate change.
Outcomes/Outputs
• Determination of the spatial and temporal trends in low flow in MLR catchments
(where sufficient data exists)
• Methodology to quantify the effects of a change in groundwater recharge and
discharge (due to forestry, farm dams, groundwater extraction, climate variability
and climate change) on low flow in the MLR using existing modelling tools
• Improved quantitative understanding of the linkage between changes in climate,
water resource allocations and low flow, and its relevance to water dependent
ecosystems in the MLR.

58
Water quality improvement program
This task will involve three main stages, namely a collation of water quality data, a tiered
risk assessment and an assessment on a GIS platform to relate the risk assessment to
subcatchments that are currently not monitored.
Specifically it will involve the following:
• A collation of available water quality data in a consistent/standardised format for the
Mt Lofty Ranges from different State agencies, Universities and CSIRO.
• A tiered risk assessment that provides a systematic, transparent and quantitative
ranking of sub-catchments in the Mt Lofty Ranges for a range of water quality
parameters (including but not limited to TSS, TN, TP, EC).
• A temporal evaluation of when and for how long water quality parameters exceed
ANZECC guidelines.
• An assessment, on a GIS platform, of various environmental/landscape features (e.g.
landuse, soil type, terrain, etc.) of subcatchments in the Mt Lofty Ranges ranked on
degree of risk for specific water quality parameters (i.e. stressors).
• An assessment of the likelihood of unmonitored subcatchments posing a risk for
specific water quality parameters based on linkages established from the spatial
analysis.
• This will allow for evidence to support policy outcomes by incorporating a
systematic, transparent, evidence-based process for determining the allocation of
resources in the MLR that incorporates water quality in planning decisions;
• A process for making informed decisions to target future monitoring in the MLR sub-
catchments and for determining priority water quality parameters to be monitored
(i.e. are there sufficiently strong relationships between various parameters that
would allow certain parameters to act as surrogates for other parameters).
Effect of non-stationarity on low flows
The research should focus on the surface water resource, taking full account of the
groundwater component of flow, i.e. groundwater processes are explicitly taken into
consideration to assess their interaction with surface flows. Some or all of the following
issues need to be addressed: (1) assessment of low flow with emphasis on its spatial and
temporal variability; (2) assessment of the impacts of land use change and/or climate
change and/or groundwater extraction on low flows (i.e., identify the phenomenon of non-
stationarity of flow). This task may be achieved by adopting a river model that accounts for
groundwater processes (such as: GW-Lag (Gilfedder et al., 2012); Source Rivers (Welsh et al.,
2012) and (Rassam, 2011)). This work should tie in with the Goyder Climate Change Project.
Study sites: it is recommended that study sites be selected based on the following criteria:
(1) availability of good quality gauge data; (2) prior knowledge of conceptual models for
groundwater flow, landform type, SW-GW connectivity and groundwater interaction with
rivers; (3) other supporting data such as water quality and isotopes. Hence, it is
advantageous to select sites where studies have been conducted in the past. This is why the
Scott Creek catchment was used to illustrate the phenomenon of nonstationarity.
Catchment selection also needs to include catchments where changes to land use and
groundwater extraction have occurred in the past.

59
Depending on resource availability, the research may be extended to cover aspects related
to groundwater management.
Risk management framework implementation
The Department for Water has already held several stakeholder workshops to trial and tailor
the use of ISO 31000:2009 for water allocation planning, with considerable success. The
concept of risk as being positive as well as negative has not yet been fully introduced, due to
its departure from the traditional treatment of risk as something to be minimised or
avoided. Four components to the R&D are proposed:
Component 1: Strategies for building understanding of risk as ‘the effect of uncertainty on
objectives’ need to be devised and trialled with a range of internal (agency) and external
(community) stakeholder groups. In particular the issue of scale needs to be addressed (i.e.
how does risk ‘scale up’?)
The uncertainty management strategies described in Raadgever et al. (2011) appear to have
practical utility and should be adapted for Australian water allocation planning exercises.
Component 2: Methods for categorising uncertainty management strategies should be
adapted and tested for their utility in the identification and assessment of risk.
The foundation of risk assessment is the development of a shared conceptual model that
captures enough of the causal structure of the system to allow objectives and consequences
to be described. There are many tools available to do this, but pragmatism suggests that a
small suite of methods/tools be trialled for adoption to provide consistency when dealing
with stakeholders, to provide an updateable platform for capturing improved understanding
of the system dynamics, and to reduce overheads within agencies running the water
allocation planning and implementation processes. The systematisation of language and its
use is a cost-effective and highly efficient way to reduce uncertainty and overheads.
Component 3: A small set of suitable tools/methods/approaches to support system
conceptualisation, that operate at different points along the scale/complexity continuum
and that match up with the requirements of the planning exercise are required. This
component will include the development and implementation of consistent sets of
vocabulary to describe concepts, causes, effects, outcomes, consequences and values, so as
to reduce uncertainty (and conflict) arising from misunderstandings and different world
views.
As with conceptualisation, there is a need to identify a small suite of methods/tools that can
be used in most cases to assist with the identification of risk, the assessment of the
consequences of that risk, and the determination of what is the ‘expected’ outcome,
perturbed by the effects of uncertainty. The development of Decision Support Systems is
not recommended as these are costly to specify, design and implement; are inherently
‘black box’, regardless of attempts to expose the internal model base and integrating
engines; and often have complex user interfaces to cater for the complexity of questions
that can be asked of them, and the combinations of results to be presented by them. Rather
the development of a set of component tools that can be combined into ‘workflows’ that
can answer the questions set by the objectives is recommended. These workflow
components can be existing models and or methods that the agency uses, or that

60
stakeholders are comfortable with. Expertise can then be built in-house to construct these
workflows, parts (‘workflow fragments’) of which are reusable in other configurations.
This approach can be trialled by building a case study from scratch to assess how current
modelling approaches align with risk management principles. It may be that the models
themselves require little modification, and effort needs to be focussed on how objectives
and options (scenarios) are described, and on the presentation and interpretation of likely
outcomes against objectives.
Component 4: A set of ‘template’ workflows to assess a range (and mix) of water allocation
planning objectives needs to be developed. The specifications for these workflows would
form part of the risk management process.

61
CONCLUSIONS
The major research tasks required to assist water allocation planning in the MLR are:
i) Better understanding of the hydrological processes, in particular rapid
assessment of those parts of the landscape where groundwater contributes
substantially to stream flow
ii) Development of robust hydro-ecological thresholds based on better
understanding of hydro-ecological processes particularly under low flow
situations
iii) The importance of land use, topography and other landform attributes on water
quality, particularly as it effects ecology in low flow situations
iv) Improvements and alignment of the current hydrological models and risk
frameworks that are used within the water allocation planning process
v) Groundwater contribution.
These tasks need now to be debated and prioritised into project I.1.4 for funding by the
Goyder Institute.

62
REFERENCES
AMLRNRMB (Adelaide and Mount Lofty Ranges Natural Resources Management Board) (2009). Draft
Water Allocation Plan: Barossa PWRA.
AMLRNRMB (Adelaide and Mount Lofty Ranges Natural Resources Management Board). (2010a).
Draft Water Allocation Plan: Western Mount Lofty Ranges (pp. 203). Adelaide, South Australia.
http://www.amlrnrm.sa.gov.au/Plans/Waterallocationplans/WesternMtLoftyRangesWAP.aspx
AMLRNRMB (Adelaide and Mount Lofty Ranges Natural Resources Management Board) (2010b).
Your guide to understanding the Western Mount Lofty Ranges Draft Water Allocation Plan.
ANZECC/ARMCANZ (Australian and New Zealand Environment Conservation Council/Agriculture and
Resource Management Council of Australia and New Zealand) (2000). Australian and New
Zealand Guidelines for Fresh and Marine Water Quality
http://www.environment.gov.au/water/publications/quality/nwqms-guidelines-4-vol1.html.
Banks, E.W. (2010). Groundwater–surface water interactions in the Cox, Lenswood and Kersbrook
Creek Catchments, Western Mount Lofty Ranges, South Australia, DWLBC Report 2010/19,
Government of South Australia, through Department of Water, Land and Biodiversity
Conservation, Adelaide.
Banks, E.W., C. T. Simmons, Love, A.J., Cranswick, R., Werner, A.D., Bestland, E.A., Wood, M., and
Wilson, T. (2009). Fractured bedrock and saprolite hydrogeologic controls on
groundwater/surface-water interaction: a conceptual model (Australia). Hydrogeology Journal
17(8): 1969-1989.
Barrett Purcell and Associates Pty. Ltd. (1999). Determining a Framework, Terms and Definitions for
Water Use Efficiency in Irrigation. In B. P. a. A. P. Ltd. (Ed.), (pp. 26). Narrabri, NSW, Australia:
Land & Water Resources Research & Development Corporation.
Brutsaert, W. (2008). Long-term groundwater storage trends estimated from streamflow records:
Climatic perspective. Water Resources Research 44(2): W02409.
Brutsaert, W. and Nieber, J. L. (1977). Regionalized drought flow hydrographs from a mature
glaciated plateau. Water Resources Research 13(3): 637-643.
COAG (Council of Australian Governments) (2004). Intergovernmental Agreement on a National
Water Initiative, Commonwealth of Australia, Canberra
Cook, F. J., Xevi, E., Knight, J. H., Paydar, Z., and Bristow, K. L. (2008). Analysis of Biophysical
Processes with Regard to Advantages and Disadvantages of Irrigation Mosaics. CRC for Irrigation
Futures Technical Report No. 07/08 and CSIRO Land and Water Science Report 14/08. Canberra.
Cox, J.W., Oliver, D.P., Fleming, N., and Anderson J.S. (2012). Off-site transport of nutrients from
three land uses in the Mt. Lofty Ranges, South Australia. Agricultural Water Management 106:
50-59.
CSIRO (2007). Water availability in the Eastern Mount Lofty Ranges. A report to the Australian
Government from the CSIRO Murray-Darling Basin Sustainable Yields Project, Australia, pp, 104.
Cuddy, S.M. and Fitch, P. (2010) Hydrologists WorkBench –a hydrological domain workflow toolkit.
In: Proc of International Congress of the International Environmental Modelling and Simulation
Society (iEMSs), eds (D.A. Swayne, W. Yang, A.A. Voinov, A. Rizzoli and T. Filatova,
http://www.iemsss.org/iemss2010/index.php?n=MainProceedings.
DfW (Department for Water). (2010a). Map - Groundwater Demand in the WMLR PWRA Retrieved
29 March, 2012, from http://www.amlrnrm.sa.gov.au/LinkClick.aspx?fileticket=-
YVHSxiYVU4%3d&tabid=835&mid=3229.

63
DfW (Department for Water). (2010b). Map - Surface Water Demand in the WMLR PWRA Retrieved
29 March, 2012, from
http://www.amlrnrm.sa.gov.au/LinkClick.aspx?fileticket=7LK9TDIF9Co%3d&tabid=835&mid=322
9.
DEWNR (Department of Environment, Water and Natural Resources). (2012a). Risk management
framework for water planning and management.
https://www.waterconnect.sa.gov.au/WaterManagement/WaterPlanning/Documents/Risk%20M
anagement%20Framework.pdf
DEWNR (Department of Environment, Water and Natural Resources). (2012b). Risk management
policy and guidelines for water allocation plans.
https://www.waterconnect.sa.gov.au/WaterManagement/WaterPlanning/Documents/Risk%20M
anagement%20Guidelines%20for%20WAPs.pdf
DIPNR (Department of Infrastructure, Planning and Natural Resources (now NSW Office of Water))
(2004, updated July 2011) A guide to the Water Sharing Plan for the Murrumbidgee Regulated
River Water Source,
http://www.legislation.nsw.gov.au/maintop/view/inforce/subordleg+1038+2002+cd+0+N.
Doeg, T., Muller, K., Nicol, J. and Vanlaarhoven, J. (2012). Environmental Water Requirements of
Groundwater Dependent Ecosystems in the Musgrave and Southern Basins Prescribed Wells
Areas on the Eyre Peninsula, DFW Technical Report 2012/16, Government of South Australia,
through Department for Water, Adelaide
DOW (Department of Water). (2011). Water allocation planning in Western Australia—a guide to our
process, Government of Western Australia.
DWLBC (Department of Water, Land and Biodiversity Conservation). (2006). State natural resources
management plan. Government of South Australia, Adelaide.
Fleming, N.K., Cox, J.W., He, Y., Thomas, S. and Frizenschaf, J. (2010). Analysis of total suspended
sediment and total nutrient concentration data in the Mount Lofty ranges to derive event mean
concentrations. eWater Cooperative Research Centre Technical Report, August 2010.
Frey, H. C. and Burmaster, D. E. (1999). Methods for characterizing variability and uncertainty:
Comparison of bootstrap simulation and likelihood-based approaches. Risk Analysis, 19(1): 109-
130.
Gilfedder, M., Rassam, D.W., Stenson, M.P., Jolly, I.D., Walker, G.R. and Littleboy, M. (2012).
Incorporating land-use changes and surface-groundwater interactions in a simple catchment
water yield model. Environmental Modelling & Software 38: 62–73.
Green, G. and Stewart, S. (2008). Interactions between groundwater and surface water systems in
the Eastern Mount Lofty Ranges, DWLBC Report 2008/27, Department of Water, Land and
Biodiversity Conservation, Government of South Australia.
Harrington, G.A. (2004). Hydrogeological investigation of the Mount Lofty Ranges, Progress Report 4:
Groundwater–surface water interactions in the Scott Creek, Marne River and Tookayerta Creek
Catchments. Report DWLBC 2004/11. SA Department of Water, Land and Biodiversity
Conservation, Adelaide.
Knight, J. H., Gilfedder, M., and Walker, G. R. (2005). Impacts of irrigation and dryland development
on groundwater discharge to rivers – a unit response approach to cumulative impacts analysis.
Journal of Hydrology 303: 79-91.
Lamble, P. (2008). Mount Lofty Ranges - Allocation of Water to Existing Users (pp. 87). Sydney: GHD
Pty Ltd.

64
Morgan, M. G. and Henrion, M. (1990), Uncertainty: A guide to dealing with uncertainty in
quantitative risk and policy analysis. Cambridge University Press, Cambridge, England.
Nelson, P.N., Cotsaris, E., Oades, J.M. and Bursill, D.B. (1990). Influence of soil clay content on
dissolved organic matter in stream waters. Australian Journal of Marine and Freshwater Research
41, 761-774.
MDBA (Murray-Darling Basin Authority) (2011). Proposed Basin Plan. Murray-Darling Basin
Authority, Canberra.
Muyen, Z., Moore, G.A. and Wrigley, R.J. (2011). Soil salinity and sodicity effects of wastewater
irrigation in South East Australia. Agricultural Water management 99: 33-41.
NWC (National Water Commission). (2011). National Water Planning Report Card 2011, December
2011, ISBN 978-1-921853-48-7.
Oliver, D.P., Anderson, J.S., Kookana, R.S., Cox, J.W., Fleming, N., Waller, N. and Smith, L.H. (2012).
Off-site transport of pesticides from two horticultural landuses in the Mt. Lofty Ranges, South
Australia. Agricultural Water Management 106: 60-69.
Paydar, Z., Cook, F. J., Xevi, E., and Bristow, K. L. (2011). An overview of irrigation mosaics. Irrigation
and Drainage 60: 454-463.
Phogat, V., Skewes, M., Cox, J.W., Alam, J. and Grigson, G. (2011). Minimising drainage and nitrate
losses under navel orange. Presented in Citrus Australia National Conference, Oct. 23-26, 2011,
Barrosa Valley, Adelaide. pp 20.
Phogat, V., Mahadevan, M., Skewes, M. and Cox, J.W. (2012a). Modelling soil water and salt
dynamics under pulsed and continuous surface drip irrigation of almond and implications of
system design. Irrigation Science 30: 315-333.
Phogat, V. Mahadevan, M., Skewes M. and Cox, J.W. (2012b). Simulation of seasonal plant water
uptake of an almond tree under sustained deficit irrigation. Presented (oral) in Irrigation Australia
National Conference, 26th -28th June, 2012, Adelaide Convention Centre, Adelaide, Australia.
Phogat, V., Skewes, M., Cox, J.W., Alam, J., Grigson, G. and Simunek, J. (2012c). Evaluation of water
movement and nitrate dynamics in a lysimeter planted with an orange tree. Ag. Water Manage.
(submitted).
Phogat, V., Skewes M., Cox, J.W. and Mahadevan, M. (2012d). Modelling the impact of pulsing of
drip irrigation on the water and salinity dynamics in soil in relation to water uptake by an almond
tree. Accepted (full paper) to be presented in 4th International Conference on Sustainable
Irrigation and Drainage: Management, Technologies and Policies, Organised by University of
South Australia and Wessex Institute of Technology, UK, 11 – 13 December, 2012, Adelaide,
Australia.
Phogat, V., Skewes, M., Mahadevan, M. and Cox, J.W. (2012e). Simulation of soil plant system
response to pulsed drip irrigation of an almond tree under sustained stress conditions. Ag. Water
Mgmt. (submitted).
Pollard, S.J.T., Davies, G.J. Coley, F. and Lemon, M. (2008). Better environmental decision making —
Recent progress and trends, Science of the Total Environment 400 (2008), pp. 20–31.
Pollino, .CA., Dyer, F. Herron, N. Harrison, E. and White, A. (2010). Risk assessment of water
resources for the Murray Darling Basin, iCAM Centre, The Australian National University,
Canberra.
Raadgever, G.T., Dieperink, C. Driessen, P.P.J. Smit, A.A.H. and van Rijswick, H.F.M.W. (2011).
Uncertainty management strategies: Lessons from the regional implementation of the Water
Framework Directive in the Netherlands. Environmental Science and Policy 14 (2011): 64–75.
65
Rassam, D., Walker, G. R., and Knight, J. H. (2004). Applicability of the Unit Response Equation to
assess salinity impacts of irrigation development in the Mallee region. CSIRO Land and Water
Technical Report No 35/04. Canberra.
Rassam, D., Walker, G. R., and Knight, J. H. (2005). Applicability of the unit response equation to
assess salinity impacts of irrigation development in the Mallee region: supplementary analyses.
Report for Water for a Healthy Country Flagship, CSIRO. Townsville.
Rassam, D.W. (2011). A conceptual framework for incorporating surface-groundwater interactions
into a river operation-planning model. Environmental Modelling and Software 26: 1554-1567.
Reid M.A., Cheng X., Banks E.W., Jankowski J., Jolly I., Kumar P., Lovell D.M., Mitchell M., Mudd G.M.,
Richardson S., Silburn M. and Werner A.D. (2009). Catalogue of conceptual models for
groundwater–stream interaction. eWater Technical Report. eWater Cooperative Research
Centre, Canberra.
SAMDBNRMB (South Australian Murray-Darling Basin Natural Resources Management Board)
(2011). Draft Water Allocation Plan for the Eastern Mount Lofty Ranges Prescribed Water
Resources Area (pp. 238). Adelaide, South Australia.
Schmarr, D. and McNeil, D. (2010). Ecological responses to environmental water provision in the
Onkaparinga River. SARDI Publication F2010/000637-1. SARDI Research Report Series No 52.
September 2010.
Skewes, M. A. (1997). Technology vs management skill - the challenge of efficient irrigation. Paper
presented at the Striking the Balance: Irrigation and the Environment - the 44th Annual ANCID
Conference and Study Tour, Deniliquin, NSW.
Skewes, M. A., and Mahadevan, M. (2011). Project ABA 4432 - Minimising Environmental Footprints
from Irrigated Almonds by Using New Methods & Tools - Final Report to the Almond Board of
Australia. Loxton, South Australia: SARDI.
Skewes, M. A., Mahadevan, M., and Brown, B. (2011a). Soil Solution Monitoring to Assist Precision
Irrigation in Almonds. Paper presented at the 2011 Irrigation: New Horizons Fresh Ideas,
Launceston, Tasmania. http://www.irrigation.org.au/assets/pages/3433448E-1708-51EB-
A67DA85111F901E1/Soil%20Solution%20Monitoring%20to%20Assist%20Precision%20Irrigation
%20in%20Almonds.pdf.
Skewes, M. A., Mahadevan, M., Rosenzweig, B., and Brown, B. (2011b). Balancing Nutrient Input and
Output: CT Trial Results All About Almonds Factsheet. Berri, South Australia: Almond Board of
Australia.
Skewes, M. A., Mahadevan, M., Rosenzweig, B., and Brown, B. (2011c). Timing Nutrient Inputs for
Best Effect: CT Trial Results All About Almonds Factsheet. Berri, South Australia: Almond Board of
Australia.
SKM (2012). VWASP Site Selection and Verification SKM (prepared for the AMLRNRMB, April 2012).
Sophocleous, M. (2010). Review: groundwater management practices, challenges, and innovations in
the High Plains aquifer, USA—lessons and recommended actions. Hydrogeology Journal, 18(3):
559-575.
Standards Australia. (2009). AS/NZS ISO 31000:2009 Risk management—principles and guidelines.
Standards Australia, 24pp.
Thomas, S., He, Y., and Fleming, N. (2010). Progress report on the Mount Lofty Ranges source
catchments application project. eWater Cooperative Research Centre Technical Report, October
2010.
66
Treeby, M., Falivene, S., Phogat, V. and Skewes, M. (2012a). Knowledge and tools to manage
fertigation technologies in highly productive citrus orchards for minimal environmental footprint.
Final Report to National Program for Sustainable Irrigation.
http://npsi.gov.au/files/products/national-program-sustainable-irrigation/npsi0612/npsi0612-
knowledge-and-tools-manage-fertigation-te.pdf.
Treeby, M., Falivene, S., Phogat, V. and Skewes, M. (2012b). Guidelines for Fertigating Citrus
Orchards Managing fertigation systems to achieve good productivity and avoiding fertiliser
wastage and loss. ISBN 1921025352, Sustainable Irrigaiton, management update, NPSI Product
Number NPSI 05-12. http://npsi.gov.au/files/products/national-program-sustainable-
irrigation/npsi3012/npsi3012-guidelines-fertigating-citrus-orchards.pdf.
VanLaarhoven, J. (2010) Environmentally sustainable extraction limits for the western Mount Lofty
Ranges prescribed water resources area. Department for Water Technical Report DFW 2010/01
September 2010.
VanLaarhoven, J.M. and van der Wielen, M. (2009). Environmental water requirements for the
Mount Lofty Ranges prescribed water resources areas. DWLBC Report 2009/29, Department of
Water, Land and Biodiversity Conservation and South Australian Murray-Darling Basin NRM
Board, Adelaide.
Varcoe, J., van Leeuwen, J.A., Chittleborough, D.J., Cox, J.W., Smernik, R.J., and Heitz, A. (2010).
Changes in water quality following gypsum application to catchment soils of the Mount Lofty
Ranges, South Australia. Organic Geochemistry 41: 116-123.
Welsh, W., Vaze, J., Dutta, D., Rassam, D., Rahman, J., Jolly, I., Wallbrink, P., Podger, G., Bethune, M.,
Hardy, M., Teng, J., and Lerat, J. (2012). An integrated modelling framework for regulated river
systems. Environmental Modelling and Software, In Press.
Wittenberg, H. (2003). Effects of season and man-made changes on baseflow and flow recession:
case studies. Hydrological Processes, 17(11): 2113-2123.

67
APPENDIX A - ISSUES IDENTIFIED AT GOYDER INSTITUTE WORKSHOPS AND
SUBSEQUENT CORRESPONDENCE
Issue 1: Understanding the water balance/hydrological processes
• Impacts of changes to catchment hydrology with and without farm dams (DfW);
• Consideration about volume of water allocated to different beneficial users but also the
water quality delivered as the water quality requirements of different users may vary
(SA Water);
• The need for more hydrological data (DfW);
• Need to clarify metrics being used to describe water extraction for softwood and
hardwood production (PIRSA);
• What is the balance of influence in the catchments from agricultural land-use and urban
development (PIRSA);
• What are the land-use implications on water balance (and quality)? (PIRSA/SA Water)
• What are the water security trade-offs between impacts of forestry and bores
(agricultural water use) vs. water for environmental flow (SA Water);
• How much groundwater is used for irrigation and implications of seawater intrusion (SA
Water);
• Implications of climate change for EWRs and WAPs (DfW; SA Water);
• How do we reduce the risk of both over-allocation and under-allocation in WAPs (DfW);
• After periods of drought why don’t the rainfall-runoff relationships hold (DfW);
• Certainty about the ecological expression and process dynamics will change for a given
water availability and water quality scenario (DfW);
• Need to quantify groundwater discharges to a greater degree (DfW);
• How do we incorporate water quality and climate change variability into future WAPs
(DfW);
• The need to quantify hydro-ecological relationships and refine specific hypotheses
(DfW);
• The effect of land-use on water quality is a high priority due to implications for the
treatment cost of water for potable supply (SA Water);
• What are the implications of climate change predictions on environmental water
requirements (SA Water);
• Need to recognise links between hydro-ecological relationships (SA Water);
• Suspended sediments is a water quality issue that needs to be considered (EPA);
• Implications of land use change on water balance and water quality in the MLR (General
comment);
• Policies that take into account socio ecological decisions (SA Water);
• Gaps – rainfall runoff patterns during low flows, soil moisture index?, linkage to climate
change project (SA Water);
• Summary review of existing ecological–hydrological investigations nationally and locally
(SA Water);
• Assessment of variability in the different processes of how water moves through the
MLR landscape and the drivers (SA Water);

68
• Link to existing research – MLR catchment to coast process for hydro-ecology (SA
Water);
• Test-best for eFlows below storages (e.g. Onkaparinga, south Para, Torrens,) and VWASP
project above storages (SA Water);
• Connection to coast is missing from Goyder projects (SA Water);
• Summary of key water quality issues for different users (stakeholders) in MLR (SA
Water);
• Research on pollutant transport under different land-use and climate scenarios –
statistics needed to back up cause and effect relationships (SA Water);
• Water quality/flow/landscape relationships for key parameters (pathogens, NOM,
nutrients) (SA Water);
• What is the relationship between driver metrics and the aspects of hydrology able to be
influenced through WAP policy options (DfW);
• Permanent pools/water quality/physical behaviour /nutrient etc. behaviours–thresholds
(DfW).
Issue 2: Developing a set of defensible environmental thresholds
• Peer review and refinement of current hydrological and hydro-ecological relationships
underpinning EWRs and ecologically sustainable extraction limits under WAPs. Flow
related basis for ecological processes and effects of implementing low flow bypasses on
catchment responses (DfW);
• Replacement of risk thresholds with response curves (DfW);
• For which environmental components should we determine EWRs? (DfW);
• How do we determine EWRs (bottom up-top down) (DfW);
• How do we spatially and temporally assign EWRs (DfW);
• What environmental responders are most appropriate and best reflect a relationship to
changing flow regime (DfW);
• What metrics best represent responder relationships to the flow regime (e.g. fish
population numbers , size classes etc) (DfW);
• What metrics best represent driver relationships to ecological relevant responders (e.g.
flow regime or water quality etc) (DfW);
• What is the relationship between driver and responder metrics (DfW);
• How do we reconcile differences in the hydro-ecological relationships for varying
environmental responders (DfW);
• How do we determine appropriate ecological objectives e.g. minimal, sustaining,
optimal thresholds (DfW);
• What economic responders are most appropriate and best reflect relationships to a
change in flow regime (DfW);
• What metrics best represent responder relationships to the flow regime
(e.g. $’s, volume of water-use) (DfW);
• What metrics best represent driver relationships to economically relate to responders
(e.g. flow regime) (DfW);
• What is the relationship between driver and responder metrics (i.e. hydro-economic
models) (DfW);

69
• How do we reconcile differences in hydro-economic relationships for varying economic
responders (DfW);
• What is the relationship between driver metrics and the aspects of hydrology able to be
influenced by WAP policy options (e.g. extraction limits, dam capacity limits, low flow
bypasses) (DfW);
• Development of better ecological and hydrological understanding on which the hydro-
ecological relationships are based (DfW);
• Integration of water quality into EWR process (DfW);
• Are we using appropriate ecological metrics to measure ecosystem responses (DfW);
• Are we using appropriate hydrological metrics to measure ecosystem responses (DfW).
Issue 3: Developing new tools and technologies
• International Lit review of best practice water allocation planning (SA Water);
• State library of metric indicators that can be used across the state and tailored to
different regions (DfW).
• Is there a tool available for comparing all the different policies related to water
allocation? (SA Water);
• Are the environmental flow baselines still valid and can outcomes be demonstrated? (SA
Water);
• How do we implement environmental water flows under WAP’s? (SA Water);
• Practical tools need to be useful for local government representatives (EPA);
• Methods to determine hydro-ecologic relationships (e.g. testing of eco-hydrology
modelling tools, Bayesian statistics) (SA Water);
• Use eWater Source platform to test cause and affect relationships (SA Water);
• Are there affordable technologies for water use metering and monitoring for SME’s?
(AMLRNRM Board);
• Effective integration of non linearity into the DSS tool (DfW).
Issue 4: Moving from expert opinion to verified outcomes at all scales
• How can we test the expert opinion on which environmental water requirements (EWR)
are based, and how does this expert opinion apply at various scales? (SAMDBNRMB);
• How can we move from expert opinion to verified outcomes? (DfW);
• Recognise the trade-offs between science and tightness in policy (DfW);
• Do the generic conceptual models underpinning WAPs apply in other regions of the
state? (DENR);
• More complex WAPs with reach by reach allocations need to be better developed
(DfW);
• Integration of more landscape processes into WAPs (DfW);
• How influential are soil type and landscape on groundwater baseflow and catchment
flow regime behaviour (incorporate Bayesian networks) (DfW);
• Need to recognise many of the NRM issues dealing with cross cutting themes (e.g.
thresholds for key species) (DENR).
70
Issue 5: Ensuring policy and governance is consistent
• WAP’s need to be consistent with water quality improvement plans (EPA);
• Review of water quality improvement plan status (SA Water/EPA);
• What are the possible links with local government (EPA);
• Do planning rules allow the MLR to be a water catchment? (e.g. septic tanks) (EPA);
• Risk relative to cost when making trade-off decisions (EPA);
• Review of existing frameworks (SA Water);
• Interpretation and implementation of water quality legislation in the WAP’s (SA Water);
• Implications (including social and economic–triple bottom line) of low flow bypasses on
water quality (SA Water/DfW);
• Are there clawback mechanisms within the WAP? (SA Water/DfW);
• The impacts of volumetric water allocation on water quality must be included within the
WAP DSS framework (and cost implications) (SA Water/DfW);
• Which landscape features are most beneficial in delivering water quality outcomes? (SA
Water);
• Are there synergies between flow provisions and water quality? (SA Water);
• Do environmental flows need to be delivered at a certain water quality? (SA Water);
• Issues around quality control for data sets used to make decisions on EWR and as
incorporated into the WAP’s/ need for the calibration documentation of the datasets
collated and used in this project (SA Water).
• Comparison of eWater CRC modelling package vs. WaterCress vs. raster models and
others (SA Water/DfW);
• Sensitivity of model output (SA Water);
• What objective do we use for EWR’s? (what constitutes a low level of risk?) (DfW).
Issue 6: Socio-economics and community engagement
• What environmental trade-offs are we willing to accept? (DfW);
• How do we quantify the benefits from EWR’s to support trade-off decision and aid
community engagement? (SAMDBNRMB/DENR);
• Be transparent with community about why decisions are made (DfW);
• More effective understanding of socio-economic implications of WAP’s (DfW);
• How do we determine appropriate economic objectives? – what are our decision points?
(DfW);
• Need to consider links with energy and pumping re-use water (PIRSA);
• What is the cost of lost agricultural production compared with other benefits when
implementing plans? (AMLRNRM Board);
• Need data to underpin trade-offs, especially low flow by-pass (PIRSA);
• What are the natural resource management implication of preserving one area and
using another? (PIRSA);
• Cost benefit analysis across all users (SA Water);
• Can agriculture move to other areas in the state? (PIRSA);
• How to we consider socio-economic decisions in decision making processes (allocation
of water to different stakeholders) (DfW).

The Goyder Institute for Water Research is a partnership between the South Australian Government through the Department for Environment,
Water and Natural Resources, CSIRO, Flinders University, the University of Adelaide and the University of South Australia.