
environmental scoping report proposed agriculture project for ...
Upload
khangminh22Category
view
3download
0
January 2013
Project Code 2011BE02
India CCS Scoping Study:
Final Report
Prepared for
The Global CCS Institute

ii
© The Energy and Resources Institute 2013
Suggested format for citation
T E R I. 2013
India CCS Scoping Study:Final Report
New Delhi: The Energy and Resources Institute. 42pp.
[Project Report No. 2011BE02]
For more information
Project Monitoring Cell
T E R I Tel. 2468 2100 or 2468 2111
Darbari Seth Block E-mail [email protected]
IHC Complex, Lodhi Road Fax 2468 2144 or 2468 2145
New Delhi – 110 003 Web www.teriin.org
India India +91 • Delhi (0)11

iii
Table of Contents
1. INTRODUCTION ..................................................................................................................... 1
2. COUNTRY BACKGROUND ...................................................................................................... 1
3. CO2 SOURCES ......................................................................................................................... 7
4. CURRENT CCS ACTIVITY IN INDIA ..................................................................................... 15
5. ECONOMIC ANALYSIS .......................................................................................................... 19
6. POLICY & LEGISLATION REVIEW ......................................................................................... 26
7. CAPACITY ASSESSMENT ...................................................................................................... 27
8. BARRIERS TO CCS IMPLEMENTATION IN INDIA ................................................................ 31
9. CAPACITY DEVELOPMENT NEEDS ....................................................................................... 32
REFERENCES ............................................................................................................................ 35

iv

v
List of tables
TABLE 1: INDIA’S FOSSIL FUELS PRODUCTION, CONSUMPTION AND RESERVES ................... 6
TABLE 2: LIST OF UMPPS AWARDED ....................................................................................... 9
TABLE 3: LIST OF UMPPS FOR WHICH SPVS INCORPORATED .............................................. 9
TABLE 4: OWNERSHIP, LOCATION AND CAPACITY OF EXISTING PETROLEUM REFINERIES IN
INDIA ................................................................................................................................. 11
TABLE 5: LIST OF INTEGRATED STEEL PLANTS IN INDIA IN 2008 .......................................... 14
TABLE 6: LIST OF DST PROJECTS RELATED TO CCS .............................................................. 15
TABLE 7: ASSUMPTIONS AND TECHNICAL SPECIFICATIONS CONSIDERED FOR THE BASE CASE
POWER PLANT .................................................................................................................... 20
TABLE 8: ASSUMPTIONS RELATED TO CARBON DIOXIDE CAPTURE, TRANSPORT AND STORAGE
........................................................................................................................................... 21
TABLE 9: COST FIGURES CONSIDERED IN CASE 1 .................................................................. 22
TABLE 10: CASE 1 FINANCIAL ASSUMPTIONS......................................................................... 23
TABLE 11: LCOE FOR CASE 1 .................................................................................................. 23
TABLE 12: DIFFERENCES BETWEEN CASE 1 AND CASE 2, WITH EXPLANATIONS .................. 23
TABLE 13: LCOE FOR CASE 2 .................................................................................................. 24
TABLE 14: DIFFERENCES BETWEEN CASE 2 AND CASE 3, WITH EXPLANATIONS ................... 24
TABLE 15: COST OF ELECTRICITY FOR CASE 3 ....................................................................... 25

vi
List of figures
FIGURE 1: SECTORAL BREAK-UP OF INDIA’S CO2 EMISSIONS ................................................. 2
FIGURE 2: BREAK-UP OF EMISSIONS FROM ENERGY SECTOR .................................................. 2
FIGURE 3: BREAK-UP OF EMISSIONS FROM INDUSTRIAL SECTOR ........................................... 3
FIGURE 4(A): REGIONAL DISTRIBUTION OF CO2 EMISSIONS IN INDIA IN 2000, ALONG WITH
PROJECTED SCENARIOS FOR 2010 ...................................................................................... 4
FIGURE 4(B): PROJECTED DISTRIBUTION OF CO2 EMISSIONS IN INDIA IN 2020 AND 2030 ... 5
FIGURE 5: INDIA’S INSTALLED ELECTRICITY GENERATION BY TYPE ...................................... 8
FIGURE 6: INDIA’S ACTUAL ELECTRICITY GENERATION IN 2010-11 FOR DIFFERENT FUEL TYPES
FOR PLANTS WITH CAPACITY GREATER THAN 25 MW. ..................................................... 8
FIGURE 7: INSTALLED COAL-BASED POWER PLANT CAPACITY OF MAJOR PLAYERS ............. 10
FIGURE 8: INDIA’S CRUDE OIL PRODUCTION AND CONSUMPTION HISTORY ...................... 11
FIGURE 9: INDIAN CEMENT INDUSTRY: INSTALLED CAPACITY AND MARKET SHARE OF MAJOR
PLAYERS IN 2009 ................................................................................................................ 13
FIGURE 10: COMPARISON OF THE LEVELISED COST OF ELECTRICITY (LCOE) AND THE
INCREASE IN LCOE FOR THE DIFFERENT CASES .............................................................. 25

1
India CCS Scoping Study: Final Report
1. Introduction
Carbon Capture and Storage (CCS) refers to “the separation of CO2 from industrial and energy-related sources, transport to a storage location and long-term isolation from the atmosphere” [1]. It is one among the portfolio of measures being considered for reducing
Greenhouse Gas (GHG) emissions with a view to mitigating climate change. While no single measure may alone be sufficient for climate change mitigation, CCS, along with energy efficiency improvements, renewable energy, enhancement of biological sinks, and other
measures, may be able to achieve the emissions reductions needed to achieve climate stabilisation.
The present report has been prepared as a part of a scoping study for CCS in India carried
out by The Energy and Resources Institute (TERI), with support from the Global CCS Institute. The study was conducted to identify the potential role for CCS in India’s GHG
mitigation strategies through an examination of issues, opportunities and barriers to the
deployment of CCS. The conclusions of the report should help in drawing a roadmap for CCS implementation in India.
2. Country background
Located in Southern Asia, India is geographically the world’s seventh largest country, with a
total area of 3,287,263 sq. km [2]. It is home to more than 1.2 billion people [3], which makes it the world’s second most populous country, and the largest democracy. India’s economy
has witnessed rapid growth over the past two decades; however, due to the large population, poverty eradication remains a massive challenge. Improvement of the standards of living of the population is an avowed objective of the Indian Government, with sustained
economic growth being seen as the key means towards this end.
India’s economy: Prior to 1991, India’s economy was based on socialist policies, characterised by predominant public ownership of industries, extensive regulation, and
protectionism, which resulted in a slow economic growth rate. The year 1991 saw liberalisation of India’s economy, resulting in reduced regulation, the end of several public monopolies, reduced tariffs and interest rates, and an atmosphere more conducive to foreign
investment [4] [5] [6] [7]. Subsequently, the country’s economy has seen much higher growth rates, averaging over 6.5% annually since 2003 [8]. While India’s economy has traditionally been agrarian, the services sector has seen tremendous growth in recent years, now
accounting for more than half of India’s GDP [8]. Agriculture, however, continues to supply employment to half the country’s workforce, and since high food inflation is one of the major worries of India’s policy makers, the sector continues to receive subsidies for fuel and
fertiliser. India’s industrial sector is fairly well developed, and has both public and private players in key sectors such as steel, cement, fertilisers, petrochemicals, etc.
Present and future CO2 emissions: India’s total GHG emissions in 2007, inclusive of land
use, land-use change and forestry(LULUCF), were 1727.71 million tonnes of CO2equivalent, and gross CO2 emissions were 1497.03 million tonnes. The CO2 generation per capita was 1.3 tonnes/capita when not considering LULUCF [9].
Around 66% of India’s gross CO2 emissions came from the energy sector in 2007, with electricity generation alone accounting for almost 48% of the gross emissions. The industrial sector accounted for most of the remaining CO2 emissions, with 27% of the total emissions.

India CCS Scoping Study: Final Report
2
Figure1:Sectoral break-up of India’s CO2 emissions [9]
Figure2:Break-up of emissions from energy sector [9]

India CCS Scoping Study: Final Report
3
Figure 3:Break-up of emissions from industrial sector [9]
It is interesting to note that ammonia production accounts for a very small portion of India’s
industrial sector emissions, due partly to an existing utilisation of CO2. This may be attributed to the fact that urea is the main nitrogenous fertiliser manufactured in India, and in the natural gas-based plants that dominate urea production, CO2 available from the
process streams is actually inadequate for urea production. This shortfall is compensated either by substituting naphtha for a portion of the natural gas or recovering some CO2from the fuel combustion flue gas stream. This means that the net emissions from the Indian urea
sector are only 0.7 MT CO2/MT urea, which are much less than the world average of 0.95 MT CO2/MT urea [10].
The regional distribution of major CO2 emission sources in the year 2000, along with
theprojected scenarios in 2010, 2020 and 2030 are shown in Figure 4 [11]. The circles in the figure show emissions from Large Point Sources, while the shaded areas denote emissions from area sources.

India CCS Scoping Study: Final Report
4
Figure 4(a): Regional distribution of CO2 emissions in India in 2000, along with projected scenarios for 2010 [11]

India CCS Scoping Study: Final Report
5
Figure 4(b): Projected distribution of CO2 emissions in India in 2020 and 2030 [11]
India CCS Scoping Study: Final Report
6
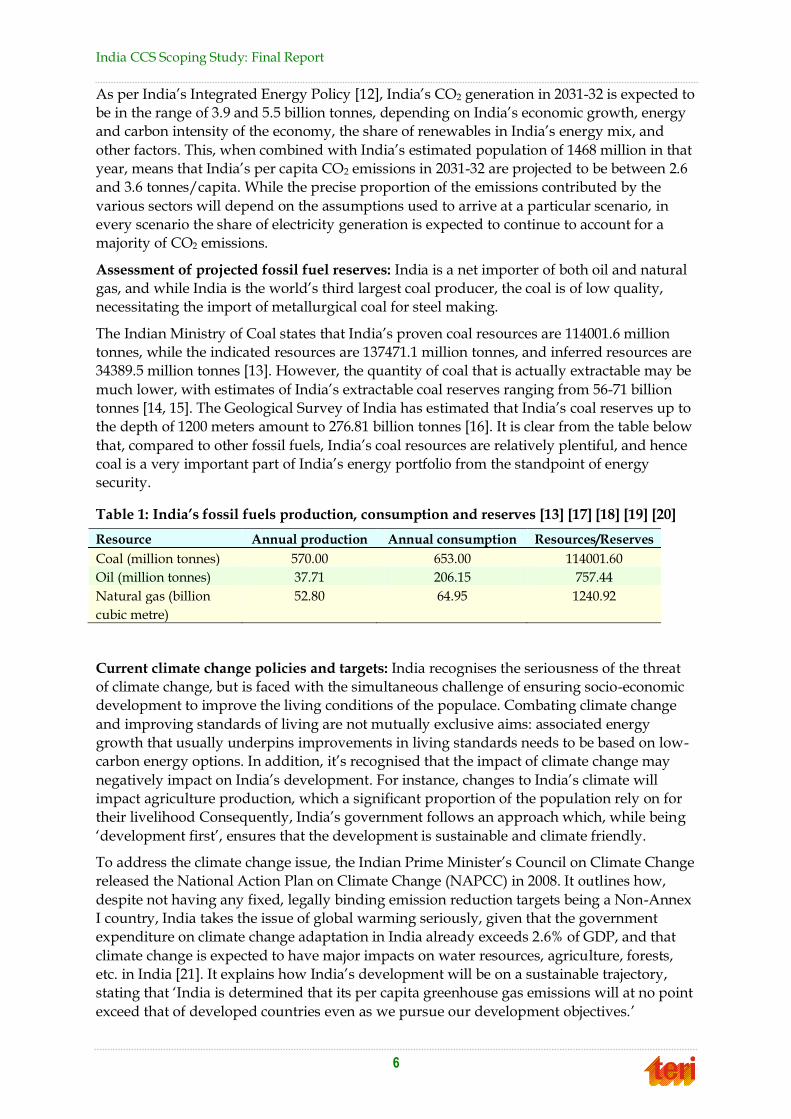
As per India’s Integrated Energy Policy [12], India’s CO2 generation in 2031-32 is expected to be in the range of 3.9 and 5.5 billion tonnes, depending on India’s economic growth, energy and carbon intensity of the economy, the share of renewables in India’s energy mix, and
other factors. This, when combined with India’s estimated population of 1468 million in that
year, means that India’s per capita CO2 emissions in 2031-32 are projected to be between 2.6 and 3.6 tonnes/capita. While the precise proportion of the emissions contributed by the
various sectors will depend on the assumptions used to arrive at a particular scenario, in every scenario the share of electricity generation is expected to continue to account for a majority of CO2 emissions.
Assessment of projected fossil fuel reserves: India is a net importer of both oil and natural
gas, and while India is the world’s third largest coal producer, the coal is of low quality, necessitating the import of metallurgical coal for steel making.
The Indian Ministry of Coal states that India’s proven coal resources are 114001.6 million tonnes, while the indicated resources are 137471.1 million tonnes, and inferred resources are 34389.5 million tonnes [13]. However, the quantity of coal that is actually extractable may be
much lower, with estimates of India’s extractable coal reserves ranging from 56-71 billion tonnes [14, 15]. The Geological Survey of India has estimated that India’s coal reserves up to the depth of 1200 meters amount to 276.81 billion tonnes [16]. It is clear from the table below
that, compared to other fossil fuels, India’s coal resources are relatively plentiful, and hence coal is a very important part of India’s energy portfolio from the standpoint of energy security.
Table 1: India’s fossil fuels production, consumption and reserves [13] [17] [18] [19] [20]
Resource Annual production Annual consumption Resources/Reserves
Coal (million tonnes) 570.00 653.00 114001.60
Oil (million tonnes) 37.71 206.15 757.44
Natural gas (billion
cubic metre)
52.80 64.95 1240.92
Current climate change policies and targets: India recognises the seriousness of the threat of climate change, but is faced with the simultaneous challenge of ensuring socio-economic development to improve the living conditions of the populace. Combating climate change
and improving standards of living are not mutually exclusive aims: associated energy growth that usually underpins improvements in living standards needs to be based on low-carbon energy options. In addition, it’s recognised that the impact of climate change may
negatively impact on India’s development. For instance, changes to India’s climate will impact agriculture production, which a significant proportion of the population rely on for their livelihood Consequently, India’s government follows an approach which, while being
‘development first’, ensures that the development is sustainable and climate friendly.
To address the climate change issue, the Indian Prime Minister’s Council on Climate Change released the National Action Plan on Climate Change (NAPCC) in 2008. It outlines how,
despite not having any fixed, legally binding emission reduction targets being a Non-Annex I country, India takes the issue of global warming seriously, given that the government expenditure on climate change adaptation in India already exceeds 2.6% of GDP, and that
climate change is expected to have major impacts on water resources, agriculture, forests, etc. in India [21]. It explains how India’s development will be on a sustainable trajectory, stating that ‘India is determined that its per capita greenhouse gas emissions will at no point
exceed that of developed countries even as we pursue our development objectives.’

India CCS Scoping Study: Final Report
7
Accordingly, eight national missions for managing climate change have been set up, which are the National Solar Mission, the National Mission for Enhanced Energy Efficiency, the
National Mission on Sustainable Habitat, the National Water Mission, the National Mission
for Sustaining the Himalayan Ecosystem, the National Mission for a "Green India", the National Mission for Sustainable Agriculture and the National Mission on Strategic
Knowledge for Climate Change. The Principal Scientific Advisor has announced the Government’s interest in adding a ninth ‘Clean Coal Technologies’ mission that would include CCS.
An important portion of the NAPCC deals with GHG mitigation in India’s power sector. It
points out that various measures for reducing GHG emissions from power plants, such as increasing the efficiency of existing power plants, using clean coal technologies, and
switching to fuels other than coal where possible, must be viewed as being complementary and not mutually exclusive. CCS is held in the NAPCC report to not being feasible at present, and concerns have been raised about the cost as well permanence of the CO2
storage.
The National Mission for Enhanced Energy Efficiency, mentioned above, incorporates a ‘Perform Achieve and Trade’ scheme, which is a market-based mechanism aimed at
improving energy efficiency in selected sectors [22]. Presently, nine industrial sectors have been selected under this scheme- thermal power plants, fertiliser, cement, pulp and paper, textiles, chlor-alkali, steel, aluminium and railways. An industrial player reducing its
Specific Energy Consumption (SEC) below the set target will be provided with Energy Saving Certificates (ESCerts), which it will able to sell to a different player unable to meet its target. The scheme is intended to stimulate energy efficiency improvements which may
reduce the energy cost of industries by over 5%.
3. CO2 sources
As stated in the previous section, power generation is the single largest source of CO2
emissions in India, with the cement and the iron and steel industries the next biggest contributors.
Power generation: India’s installed electricity generation capacity reached 210.9 GW in
November2012 [23]. The share of the different resources in India’s installed capacity is given
below.

India CCS Scoping Study: Final Report
8
Figure 5: India’s installed electricity generation by type [23]
Figure 6:India’s actual electricity generation in 2010-11 for different fuel types for plants with
capacity greater than 25 MW.
(Note: Numbers in yellow represent percentage of total electricity generation by particular fuel and numbers
in white are Billion Units generated [24])
As can be seen in Figure 6, India’s actual electricity production is even more dependent on thermal power plants, since hydroelectricity and wind power generally operate at much
lower plant load factors than thermal power plants, owing to their dependence on seasonal
variations in water level and in wind speeds respectively.
Coal is expected to remain the mainstay of India’s power sector in the near future too, with most of the 100 GW of power capacity addition planned in the 12th Five Year Plan period
Nuclear 2.3%
Hydro 18.6%
Non-hydro renewable
12.3%
Coal 57.3%
Gas 9.0%
Diesel 0.6%
Thermal 66%
India CCS Scoping Study: Final Report
9
(2012-17) based on coal based power. However, future capacity addition is expected to increasingly be based on super-critical technology, with 50% of the capacity in the 12th plan
period targeted to be through super-critical units, and all coal based plants in the 13th plan
period to be super-critical units [25].
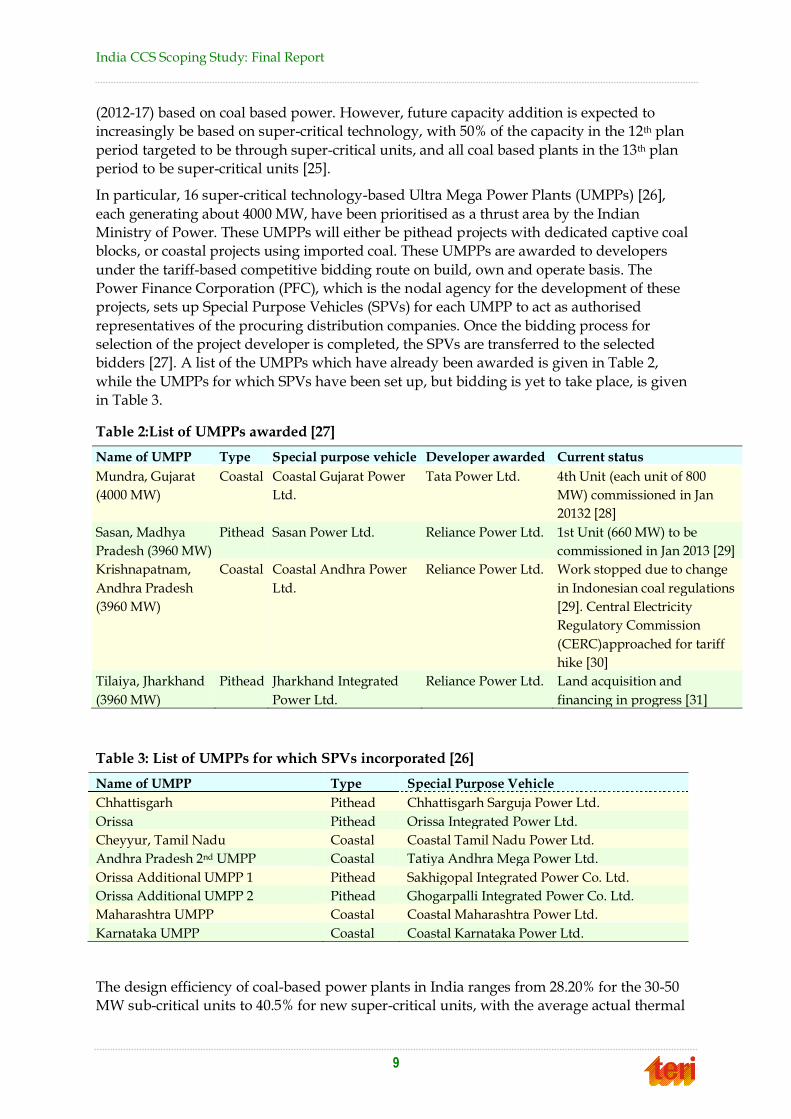
In particular, 16 super-critical technology-based Ultra Mega Power Plants (UMPPs) [26],
each generating about 4000 MW, have been prioritised as a thrust area by the Indian Ministry of Power. These UMPPs will either be pithead projects with dedicated captive coal blocks, or coastal projects using imported coal. These UMPPs are awarded to developers
under the tariff-based competitive bidding route on build, own and operate basis. The
Power Finance Corporation (PFC), which is the nodal agency for the development of these projects, sets up Special Purpose Vehicles (SPVs) for each UMPP to act as authorised
representatives of the procuring distribution companies. Once the bidding process for selection of the project developer is completed, the SPVs are transferred to the selected bidders [27]. A list of the UMPPs which have already been awarded is given in Table 2,
while the UMPPs for which SPVs have been set up, but bidding is yet to take place, is given
in Table 3.
Table 2:List of UMPPs awarded [27]
Name of UMPP Type Special purpose vehicle Developer awarded Current status
Mundra, Gujarat
(4000 MW)
Coastal Coastal Gujarat Power
Ltd.
Tata Power Ltd. 4th Unit (each unit of 800
MW) commissioned in Jan
20132 [28]
Sasan, Madhya
Pradesh (3960 MW)
Pithead Sasan Power Ltd. Reliance Power Ltd. 1st Unit (660 MW) to be
commissioned in Jan 2013 [29]
Krishnapatnam,
Andhra Pradesh
(3960 MW)
Coastal Coastal Andhra Power
Ltd.
Reliance Power Ltd. Work stopped due to change
in Indonesian coal regulations
[29]. Central Electricity
Regulatory Commission
(CERC)approached for tariff
hike [30]
Tilaiya, Jharkhand
(3960 MW)
Pithead Jharkhand Integrated
Power Ltd.
Reliance Power Ltd. Land acquisition and
financing in progress [31]
Table 3: List of UMPPs for which SPVs incorporated [26]
Name of UMPP Type Special Purpose Vehicle
Chhattisgarh Pithead Chhattisgarh Sarguja Power Ltd.
Orissa Pithead Orissa Integrated Power Ltd.
Cheyyur, Tamil Nadu Coastal Coastal Tamil Nadu Power Ltd.
Andhra Pradesh 2nd UMPP Coastal Tatiya Andhra Mega Power Ltd.
Orissa Additional UMPP 1 Pithead Sakhigopal Integrated Power Co. Ltd.
Orissa Additional UMPP 2 Pithead Ghogarpalli Integrated Power Co. Ltd.
Maharashtra UMPP Coastal Coastal Maharashtra Power Ltd.
Karnataka UMPP Coastal Coastal Karnataka Power Ltd.
The design efficiency of coal-based power plants in India ranges from 28.20% for the 30-50 MW sub-critical units to 40.5% for new super-critical units, with the average actual thermal

India CCS Scoping Study: Final Report
10
efficiency of the plants being 32.70% in 2008-09 [32]. The specific emissions from Indian coal-fired power plants are around 1.07 kg/kWh [33].
Gas-fired power plants account for about 9% of India’s installed power capacity, with the
plants achieving an average net efficiency of 41.9% [10]. While the share of natural gas in India’s power generation may rise in the future, gas supply problems may impact expansion
plans.
A large share of the thermal power production in the country is being undertaken either by Central Government utilities like NTPC Ltd. and DVC, or State Government utilities like
APGenco and Mahagenco. Increasingly, though, private players like Tata Power, Reliance Power, JSW Energy, Adani Power and LancoInfratech. are beginning to make a mark in this sector. The installed coal-based power plant capacity of major players is given in Figure 7.
Figure 7:Installed coal-based power plant capacity of major players ([34] to [51])
[WBPDCL: West Bengal Power Development Corporation; APGENCO: Andhra Pradesh Power Generation Corporation Limited; DVC: Damodar Valley Corporation; GSECL: Gujarat State Electricity Corporation Ltd.; MAHAGENCO: Maharashtra State Power Generation Co. Ltd.; MPPGENCO: Madhya Pradesh Power Generating Co. Ltd.; UPRVUNL: Uttar Pradesh RajyaVidyutUtpadan Nigam Ltd.; TANGEDCO: Tamil Nadu Generation and Distribution Corporation Ltd.; RRVUNL: Rajasthan RajyaVidyutUtpadan Nigam Ltd.; PSEB: Punjab State Electricity Board; HPGCL: Haryana Power Generation Corporation Ltd.; NLC: Neyveli Lignite Corporation; KPCL: Karnataka Power Corporation Ltd.; CSEB: Chhattisgarh State Electricity Board].
Oil and gas production:India has recoverable crude oil reserves of 757.44 million tonnes [19].
This is inadequate to meet India’s growing energy needs, with the result that the gap between domestic oil production and consumption has steadily been rising (Figure 8). This shortfall is met by imports, with 2.2 million barrels per day imported in 2010.

India CCS Scoping Study: Final Report
11
Figure8:India’s crude oil production and consumption history [19]
On the domestic oil production front, the largest player is the state-owned ONGC Ltd. In the
downstream sector, the government-run Oil Marketing Companies (OMCs) like Indian Oil,
Hindustan Petroleum and Bharat Petroleum dominate the refinery and distribution segment. India’s oil refining capacity is 193.39 MTPA [52], distributed across 21 refineries, of
which 17 are in the public sector. The list of the Indian refineries is given in Table 4. Petroleum refining itself accounts for only around 1 million tonnes of CO2 emissions per annum [9].
Table 4:Ownership, location and capacity of existing petroleum refineries in India [53]
Sr.
No.
Name of the company Refinery location Capacity
(MMTPA)
1. Indian Oil Corporation Limited (IOCL) Guwahati, Assam 1.00
2. Indian Oil Corporation Limited (IOCL) Barauni, Bihar 6.00
3. Indian Oil Corporation Limited (IOCL) Koyali, Gujarat 13.70
4. Indian Oil Corporation Limited (IOCL) Haldia, West Bengal 7.50
5. Indian Oil Corporation Limited (IOCL) Mathura, Uttar Pradesh 8.00
6. Indian Oil Corporation Limited (IOCL) Digboi, Assam 0.65
7. Indian Oil Corporation Limited (IOCL) Panipat, Haryana 15.00
8. Indian Oil Corporation Limited (IOCL) Bongaigaon, Assam 2.35
Total IOCL 54.2
9. Hindustan Petroleum Corporation Limited
(HPCL)
Mumbai, Maharashtra 6.50
10. Hindustan Petroleum Corporation Limited
(HPCL)
Visakhapatnam, Andhra
Pradesh
8.30
11. Bharat Petroleum Corporation Limited (BPCL) Mumbai, Maharashtra 12.00
12. Bharat Petroleum Corporation Limited (BPCL) Kochi, Kerala 9.50
13. Chennai Petroleum Corporation Limited (CPCL) Manali, Tamil Nadu 10.50
14. Chennai Petroleum Corporation Limited (CPCL) Nagapattnam, Tamil Nadu 1.00
15. Numaligarh Refinery Ltd. (NRL) Numaligarh, Assam 3.00
16. Mangalore Refinery & Petroleum Ltd. (MRPL) Mangalore, Karnataka 11.82

India CCS Scoping Study: Final Report
12
Sr.
No.
Name of the company Refinery location Capacity
(MMTPA)
17. Tatipaka Refinery (ONGC) Tatipaka, Andhra Pradesh 0.066
Total public sector 116.886
18. Bharat Petroleum Corporation Limited & Oman
Oil Company, joint venture
Bina, Madhya Pradesh 6.00
19. Reliance Industries Limited (RIL) Jamnagar, Gujarat 33.00
20. Reliance Petroleum Limited Jamnagar, Gujarat 27.00
21. Essar Oil Limited (EOL) Jamnagar, Gujarat 10.50
Grand Total 193.386
Most of India’s crude oil reserves are either located offshore in the west of the country, or onshore in the northeast, with substantial reserves also existing in the Bay of Bengal and in
the western state of Rajasthan [20].
India’s natural gas reserves were estimated to be 1241 billion cubic metres in 2010 [19]. Consumption outstrips production, with 2010 figures of 65 billion cubic metres for annual
consumption and 51 billion cubic metres for annual production [20]. Presently, the power and fertiliser sectors together account for nearly three quarters of India’s natural gas consumption, and demand in the power sector is expected to grow in the future. The state-
owned entities ONGC and GAIL dominate production and transmission, respectively.
Given the predominance of the Public Sector Units (PSUs) in India’s oil and gas sector, it is clear that they are among the most important stakeholders for CCS implementation in the
country, especially since this sector is significant not just as a source of CO2 emissions, but possibly also as a sink, via Enhanced Oil Recovery (EOR).
Cement:Cement is one of the most important raw materials in any construction activity, and
hence plays an important role in the infrastructure development of any country. It is manufactured by blending different raw materials like lime, silica, alumina and iron and firing them at a high temperature. Depending on how the raw material is handled before
feeding to the cement kiln, the cement production process can be categorised as being wet, semi-dry or dry, with the dry process being the most energy efficient.
India’s strong economic growth in the recent past has coincided with an infrastructure
boom in the country, leading to the cement industry recording aCompound Annual Growth Rate(CAGR) of 8.1% over the last decade [54], which in absolute terms reflects the addition of 100 million tonnes capacity addition between 1999 and 2009 [55]. Today, the Indian
cement industry is the second largest in the world, with an installed capacity of 323 million tonnes. The installed capacity and annual production in 2009 for the major cement
manufacturers in India are shown in Figure 9.

India CCS Scoping Study: Final Report
13
Figure 9:Indian cement industry: Installed capacity and market share of major players in 2009
[55]
In terms of regional distribution, there is an imbalance in cement production in the country,
with more than 80% of the production coming from the states of Andhra Pradesh, Rajasthan, Madhya Pradesh, Gujarat, Tamil Nadu, Maharashtra, Karnataka and Chhattisgarh. This imbalance can be attributed to the fact that, world-wide, the location of cement plants is
generally determined [56] by proximity to the source of the principal raw material, limestone, with availability of the secondary raw materials like clay and gypsum, as well as
fuel, being the other guiding factors.
The Indian cement industry is one of the most energy efficient in the world, with the clinker plants having the lowest final energy use (3.1 GJ/tonne of clinker), and the specific electricity consumption also being the lowest in the world (~ 90 GJ/t for grinding) [57].
Alongside other improvements in technology and energy management, an important factor
in this achievement is the fact that the industry started moving from the wet to the dry process for cement manufacture decades ago, with the result that the proportion of the dry
process has increased from 1% of cement production in 1960 to 97% in 2008, as against a decline in the share of the wet process from 94% to 2% in the same period [58].
One of the outcomes of the high energy efficiency of the Indian cement industry is the fact
that average CO2 emissions for the sector are among the lowest in the world, at 0.68 MT
CO2/ MT cement, as compared to a global average of 0.84 MT CO2/ MT cement [10]. The sheer volume of cement production, however, means that the industry emitted 129.92 MT of
CO2in 2007, a figure that may increase substantially in the future, given India’s aim of increasing cement manufacturing capacity to 479 million tonnes by 2017 [59].
One salient feature of the Indian cement industry is that large plants, having capacity of
over 1 MTPA, account for the lion’s share of cement production in the country (88% of total production in 2009) [55]. This may be important from the perspective of CCS deployment, since economies of scale dictate that deployment of new technologies is often more cost
effective for larger plants.

India CCS Scoping Study: Final Report
14
Iron and steel:The Indian iron and steel industry was deregulated as part of India’s economic reforms programme in 1992. Subsequently, the industry has grown rapidly, and
today India is the 4th largest producer of crude steel and the largest producer of sponge iron
in the world. In 2009-10, India’s production of pig iron was 5.88 million tonnes, while that of sponge iron was 24.33 million tonnes [60]. Total finished steel production in the same year
was 60.62 million tonnes, which can be contrasted with a production of 14 million tonnes in 1991 [61]. This rapid growth rate is expected to be sustained in the near future, with the Working Group on Steel for India’s 12th Five Year Plan projecting that India’s crude steel
capacity is likely to be 140 million tonnes in 2016-17 [60].
The Indian iron and steel industry has both public sector companies, like Steel Authority of India Limited (SAIL) and RashtriyaIspat Nigam Limited (RINL), and private sector firms
such as Tata Steel, Essar Steel, Jindal Steel and Power, etc. On the basis of production routes, the Indian steel industry can be divided into integrated producers, such as SAIL and Tata Steel, who convert iron ore into steel, and secondary producers, which are mainly Small and
Medium Enterprises (SMEs) operating mini-mills, which make steel from scrap or sponge
iron. The list of integrated steel plants in India in 2008 is given in Table 5.
Table 5:List of Integrated steel plants in India in 2008 [10]
Plant Capacity Specific CO2emissions MT
CO2/ ton of crude steel
SAIL, Bhilai 3.925 2.82
SAIL, Durgapur 1.802 2.64
SAIL, Rourkela 1.900 3.16
SAIL, Bokaro 4.360 3.03
SAIL, Burnpur 0.500 5.50
RINL, Vishakapatnam 2.910 3.18
Tata Steel, Jamshedpur 5.00 2.04
JSW, Bellary 3.800 2.50
Essar, Hazira 4.600 1.55
Ispat, Dolvi 3.000 2.45
JSPL, Raigarh 2.400 -
Noteworthy aspects of India’s steel industry include:
i. The average CO2 emissions intensity of Indian steel plants, at 2.4 tonnes of CO2 per tonne
finished steel, is considerably higher than the global average of 1.8 t CO2/t steel. This can largely be attributed to the following factors [62] [10]:
ii. In India, 38% of the hot metal production is from mini-blast furnaces, which typically
have 20-30% higher emissions than regular blast furnaces. This is important because the blast furnace is the major source of emissions in the iron and steel industry.
iii. The consumption of reducing agents like coke in blast furnaces in India is 36% above
world standards.
iv. Sponge iron production is predominantly coal-based, due to greater local availability.
v. The high emissions intensity Electric Induction Furnace (EIF) route accounts for 30% of
India’s crude steel production.

India CCS Scoping Study: Final Report
15
vi. The high energy consumption discontinuous casting process accounts for 30% of India’s crude steel production.
vii. The facts that Indian steel plants use high ash coking and non-coking coal and the iron
ore mined in India is high in silica and alumina content, also partly account for the high consumption of energy.
The fact that the emissions intensity of India’s iron and steel sector is much higher than world standards means that CCS may be an attractive option for bringing this figure down to more acceptable levels.
4. Current CCS activity in India
Most Indian Research and Development (R&D) activities related to CCS occur under the Department of Science and Technology (DST) of the Indian Ministry of Science and
Technology. The DST set up the National Program on Carbon Sequestration (NPCS)
Research in 2007, with a view to competing with other countries in this area with respect to both pure/applied research and industrial applications. Four thrust areas of research were
identified under this programme, viz. CO2 Sequestration through Micro algae Bio-fixation Techniques; Carbon Capture Process Development; Policy development Studies; and Network Terrestrial Agro-forestry Sequestration Modelling [63]. An indicative list of
projects relevant to CCS approved by the Inter-Sectoral Science & Technology Advisory
Committee (IS-STAC) of the DST is given in Table 6.
Table 6:List of DST projects related to CCS (References from [64] to [68])
Sr.
No.
Project title Organisation Year
approved
Duration
(years)
1. Modelling and simulation of
Carbon Recycling Technology
though conversion of CO2 into
useful multi-purpose fuel
Rajiv Gandhi Technological
University, Bhopal
2007-08 3
2. Pilot Bio-reactor using biological
and chemical carbon dioxide
sequestration (Integrated Biological
and Chemical CO2 sequestration)
National Environmental
Engineering Research Institute
(NEERI), Nagpur
2007-08 3
3. Sequestration of carbon dioxide
(CO2) into geological environment
(Gas Hydrate): Laboratory Studies
National Geophysical Research
Institute (NGRI), Hyderabad
2007-08 3
4. Development and Characterization
of porous Solid Adsorbents for
sequestration of Carbon Dioxide
(CO2) (Metal Silicates for pre-
combustion High Temperature CO2
Removal (IGCC Conditions)
National Chemical Laboratory
(NCL), Pune
2007-08 3
5. Experimental and simulation
studies on CO2 sequestration using
solar/ chemical methods
Centre for Energy and
Environment Science and
Technology(CEESAT), NIT,
Tiruchirapalli
2007-08 3
6. Analysis of Carbon Capture and
storage (CCS) technology in the
Integrated Research and
Action for Development
2007-08 2

India CCS Scoping Study: Final Report
16
Sr.
No.
Project title Organisation Year
approved
Duration
(years)
context of Indian Power Sector (IRADe), New Delhi
7. Predicting Soil Carbon changes
under different bio-climatic systems
in India
National Bureau of Soil Survey
and Land Use Planning,
Nagpur
2007-08 3
8. Improving carbon and nitrogen
sequestration: A Transgenic
approach to lower greenhouse gas
Institute of Himalayan Bio-
resources Technology,
Palampur, Himachal Pradesh
2007-08 3
9. Carbon Di-oxide Sequestration
through Culture of Medically useful
Micro-algae in Photo-bio-reactor
linked to Gas outlets of Industries
Department of Botany, Andhra
University, Vishakhapatnam
2008-09 3
10. CO2 Sequestration using Micro
algae – Efficient use of CO2 from
bio-hydrogen production facility
AMM MurugappaChettiar
Research Center, Chennai
2008-09 3
11. Carbon Sequestration by higher
plants and algae at elevated carbon
di-oxide
Jawaharlal Nehru University
and Dehi University, Delhi
2008-09 3
12. Carbon Di-oxide Sequestration
Potential of Agro Forestry System
under Irrigated and Rain fed
Conditions
Director, National Research
Center for Agro-forestry,
Jhansi
2008-09 3
13. Mycorrhizal Symbiosis to Promote
Carbon Sequestration for
Sustainable Fertility and
Environment Safety
Department of Soil Sciences &
Agriculture Chemistry,
Tamilnadu Agriculture
University, Coimbatore
2008-09 3
14. Mechanism and the dynamics of
carbon storage in the Sundarban
Mangrove
University of Calcutta, Kolkata
2009-10 3
15. Marine cyanobacteria a promising
candidate for carbon-dioxide
sequestration with multiple
utilization
Bharathidasan University,
Tiruchirappalli
2009-10 3
16. Carbon sequestration potential in
wetlands of Vedaraniam, south east
coast of India
Bharathidasan University,
Tiruchirappalli
2009-10 3
17. Carbon Sequestration through
Afforestation for Mitigating CO2
emission from Thermal Power
Station
Jadavpur University, Kolkata 2009-10 3
18. Chemo-photosynthetic conversion
of carbon dioxide into algal biomass
with biotech potentials
Department of Biotechnology
School of Life Sciences, North
Maharashtra University
2009-10 3
19. Monitoring of Carbon sequestration
through Micro propagating
Bamboo Plantation in Himalayan
region
G.B.U.A.&T. Ag. Research
Station, Nainital, Uttrakhand
2009-10 3
20. Development of carbon composites Indian Institute of Chemical 2010-11 3

India CCS Scoping Study: Final Report
17
Sr.
No.
Project title Organisation Year
approved
Duration
(years)
Materials for CO2 capture Technology, Hyderabad
21. Development of screening criteria
for saline aquifers and other
geological sinks
Global Hydro geological
Solutions, New Delhi
2010-11 3
22. Aqueous mineral carbonation of
silicates and mineral trapping of
CO2 in the tholeiite- picrite
assemblage of Thakurvadi
Formation, Deccan Basalt Volcanic
Province, India: Geological, stable
isotope and Experimental studies
National Geophysics Research
Institute, Hyderabad
2010-11 3
23. Carbon sequestration by mineral
carbonation in cement kiln dust
Indian Institute of Technology,
New Delhi
2010-11 3
24. Evolution of RuBisCohypermorphs
for enhanced CO2 sequestration and
its utilization for polymer products
Bharathidasan University,
Tiruchirapalli
2010-11 3
25. Mineral CO2 sequestration by
carbonation of industrial; Alkaline
solid residues
Anna University , Chennai 2011-12 3
26. Study On Carbon Stock and
Response Of Estuarine
Phytoplankton To Iron Fertilization
University of Calcutta, Kolkata 2011-12 3
27. CO2 sequestration studies on
volcano-sedimentary succession of
the eastern Deccan volcanic
province
University of Delhi, Delhi 2011-12 3
28. Carbon dioxide sequestration using
anoxic microbial consortium for the
production of methane fuel and
oxygenic microbial consortium for
bioconversion of methane to
methanol
K S Rangasamy College of Arts
and Science, Tiruchengode
2011-12 3
29. A Bioelectrochemical system for
sequestration of carbon dioxide
Dr DYY Patil Biotechnology
And Bioinformatics Institute,
Pune
2011-12 3
The annual reports of the DST provide information about the work that has been conducted under various projects over the previous year. For instance, information on the projects 1, 3,
11 and 12listed in the preceding table is available in the 2009-10 annual report [69], on projects 5,7, 8, 9, 12 and 14 in the 2010-11 annual report [70], and on projects 2, 5, 10, 13, 14, 19 and 24 in the 2011-12 annual report [71].
In addition, under the Agreement of Cooperation in Science & Technology concluded between Government of India and the Government of Norway, the DST and the Research Council of Norway (RCN) have started a programme for joint funding of Indian-Norwegian
joint research projects in Climate research, including CCS [72]. ONGC Ltd. was in the process of setting up a pilot experimental EOR project in Gujarat, with CO2 from the gas

India CCS Scoping Study: Final Report
18
processing plant at Hazira to be supplied to the Ankleshwar oil field. The plan was to produce a high purity gas stream from the offshore Hazira plant, which processes 40
MMSCMD of sour gas per day, using amine absorption followed by H2S removal,
dehydrate and compress the gas at Hazira, before transporting it via pipelines to the depleted onshore reservoir at Ankleshwar, where it would be recompressed and injected for
enhanced recovery of crude oil [73]. However, ONGC is reportedly re-thinking this project owing to its cost.
The state-owned National Aluminium Company (NALCO) plans to set up a carbon capture
unit at its coal-fired plant at Angul, Orissa state [74]. Nalco has earmarked an area of 0.18
acre for the project to adopt an advanced and innovative technology by engaging the firm M/s Indo-Can Technology Solutions (ICTS), a pioneer in the area of bio-technology
solutions, for providing technical consultancy and rendering necessary services to guide Nalco for successful completion of the project within 18 months [75]. Under this project, algae will be grown in shallow ponds and CO2 produced from the thermal power plant will
be tapped and introduced in the pond. The algae may be used for production of bio-fuel,
poultry and cattle feed, aquaculture feed, pharmaceutical products, etc. The government-owned NTPC Ltd., which is India’s largest power company, has also been conducting some
research on CCS. In particular, as part of the Carbon Sequestration Leadership Forum (CSLF), it has partnered the National Geophysical Research Laboratory India (NGRI) and the Battelle Pacific North-West National Laboratory, USA, to evaluate the Deccan basalt
formation in India as a potential long-term CO2 storage option [76] [77]. In addition, NTPC
also organised a national workshop on CCS in collaboration with the Ministry of Power in September 2011.
The Department of Chemical Engineering of the Indian Institute of Technology Bombay (IITB) has been carrying out a study for Cyanobacteria which can be developed as an excellent microbial cell factory that can harvest solar energy and convert atmospheric CO2 to
useful products. The department is involved in the construction of the genetic regulatory networks of cyanobacteria and using them to predict and optimise carbon sequestration and biofuel production [78].
Also, the department is carrying out a study for carbon sequestration using carbon dioxide absorption in aqueous mineral suspensions as a collaborative project with Washington University at St Louis [79]. IITB is also a part of Consortium for Clean Coal Utilization with
WUStL where they are working on the following projects: Development of a Microalgal System for Carbon Dioxide Sequestration; Carbon Dioxide Capture and Conversion in Different Modalities (Conventional and Oxy-Coal) of Coal Combustion Systems; Carbon
Dioxide Capture and Conversion in Different Modalities (Conventional and Oxy-Coal) of Coal Combustion Systems; Mechanisms and Kinetics of Multiphase Fluid-formation Mineral Reactions in CO2 Geologic Sequestration [80].
Bharat Heavy Electrical Ltd. (BHEL), the state-owned engineering and manufacturing enterprise, and APGENCO, the power generating company of Andhra Pradesh, are setting up a 125 MW demonstration IGCC plant in Andhra Pradesh [81]. While not directly related
to CCS, given that IGCC is one of the cheapest options for carbon capture, but is difficult to implement for Indian coal, it may be said that this development can eventually lead to the
deployment of pre-combustion capture technology in the power sector in India.
In addition to setting up India’s first IGCC plant, BHEL is also coordinating with Indira Gandhi Centre for Atomic Research (IGCAR) and NTPC to design, develop and build ultra super-critical boilers [82], which will be an addition to the supercritical technology boilers

India CCS Scoping Study: Final Report
19
that it already manufactures. BHEL is also collaborating with TREC-STEP (Tiruchi Regional Engineering College – Science and Technology Entrepreneurs Park) to implement a set of
initiatives in CCT and CCS, as part of a three year EU funded project [83].
TREC-STEP, in collaboration with Ernst and Young, also organised an EU-funded 2-day training programme on ‘Introduction to CCS and CCT’ in December 2011, and a 3-day ‘Skill
Leverage Programme on CCT-CCS Technologies’ in January 2012.
Indian Institute of Petroleum (IIP) has been working on developing new adsorbents for post-combustion CO2 capture. In this regard, they have set up a three column Pressure
Swing Adsorption/Vacuum Swing Adsorption unit in their laboratory in Dehradun. In this column, adsorbents are being tested under flue gas conditions as available in power plants. The work is being carried out in collaboration with IIT Bombay, which handles the
simulation and process design aspects, NTPC, which deals with power plant operation, and Central Salt & Marine Chemicals Research Institute (CSMCRI) and National
Environmental Engineering Institute (NEERI), who are responsible for adsorbent
development [84].
Private players in the power sector, like Tata Power and Reliance Power, have also been contemplating CCS seriously, but issues such as regulatory approval and storage challenges
appear to have prevented any large scale demonstration activities from taking off.
5. Economic analysis
As was noted in Section 3, the majority of India’s emissions come from the power sector, and
the development of gigawatt scale power plants in recent years means that the large scale concentrated emission sources that are most suitable for CCS deployment are predominantly in the power sector. Hence, CCS deployment in the power sector will have a significant
impact on CO2 emission reductions, and therefore, it is this sector that has been considered
for economic analysis in this study.
Literature review: While there have been a number of studies conducted regarding the cost
of both CCS retrofit and built-in capture, the fact that these studies have used widely divergent assumptions regarding plant and other costs, year of installation, capture technology used, type of storage sink, and other parameters, means that it is often not possible
to compare the results of the studies meaningfully. After an extensive literature review, the study that was found to be the most suitable for gathering the basic inputs required for the economic analysis carried out was the one conducted by Mott MacDonald (MM) in 2008 [85].
The various parameters and assumptions considered in this study were supplemented by other references and the results arrived at are presented as Case 1 below. This analysis was further refined based on consultation with NTPC Ltd. and other stakeholders, and the
findings used to create the Case 2. Finally, the results were compared with those arrived at using the GCCSI figures given in [86], and which are presented in Case 3.
In each case, the Levelised Cost of Electricity (LCOE) in Rs/kWh was calculated using the
formula:
LCOE = (Ccap+CO&M)*a/h + CTS + Cfuel
WhereCcap = Specific capital cost (Rs/kW)
CO&M = Specific operating and maintenance cost (Rs/kW)
a = annuity factor, as calculated by the formula

India CCS Scoping Study: Final Report
20
a = I*(1+I)n/((1+I)n-1)
I = Interest rate (%)
n = Depreciation period (years)
CTS = Specific transport and storage cost (Rs/kWh)
Cfuel = Specific fuel cost (Rs/kWh)
h = Annual hours of operation
Case 1:
As stated above, Case 1 was developed largely using the assumptions and figures given in [84], supplemented by other references.
The assumptions and technical specifications considered for the base case power plant are
given in Table 7.
Table 7:Assumptions and technical specifications considered for the base case power
plant
Item Value Units Explanation/reference
Plant type Supercritical, capture
ready
Plant size 4000 MW CCS implementation is expected to be more cost
effective for larger power plants, and 4000 MW
plants are among the largest presently in operation.
This plant is assumed to have 5 units of 800 MW
each.
Plant life 40 Years [85]
Plant start year 2015 -
CCS start year 2020 Since CCS technology is expected to take a few
years to mature, it is postulated that the carbon
capture will be retrofitted to the plant after 5 years
of operation.
Location Indian coast for
imported coal/pithead
for Indian coal
Most large scale power plants are being planned
either near a captive coal mine or along the coast
where coal import is possible.
PLF 90% -
Net power 3720 MW Assuming auxiliary power consumption of 7%, as
given in [87].
CCS
operational life
35 Years -
Specific CO2
emissions
1 kg/kWh As given in Section 3, specific emissions from
Indian coal fired plants are 1.07 kg/kWh. Being
more efficient than conventional plants, emissions
from supercritical units are expected to be lower.
Plant heat rate 8899.2 MJ/MWh Net heat rate taken from [88]
Calorific value
of coal used
5350 kCal/kg Gross calorific value taken from [88]
Fuel cost 120 USD/t For imported coal, as per [89], with a transport cost
of 39 $/t as per [90]
65 USD/t For Indian coal, as per [91], with a transport cost of
39 $/t as per [90]

India CCS Scoping Study: Final Report
21
Given it is assumed that the plan is capture ready, it is important to state the definition of capture ready considered, since the description differs considerably in literature. Here, the
following definition given in [85] has been considered.
“A CO2 capture ready power plant is a plant which is initially not fitted with CO2 abatement
technology but which subsequently can be fitted with a technology to capture the gas when regulatory
or economic drivers are in place to drive this. “
Further, it would have the following characteristics:
Prior to capture, the plant requires low additional expenditure (e.g. 1% additional
capital costs) and has no significant performance penalties compared to the standard industry plant options;
The plant can be converted to capture with no more than standard major maintenance
outages, taking the maximum possible advantage of the then available best technology, and with minimal additional expenditure beyond the cost of the capture equipment
itself;
After conversion to capture, the plant operates with comparable performance (in terms of heat integration) as if the base plant and the capture equipment had been designed and built as a single unit;
It offers a feasible route to CO2 storage, for which the planning horizon and any required
regulatory changes, to overcome current barriers, are understood.
A very comprehensive definition of CCS Ready that was created with the input of many
international stakeholders can be found at [92].
Since carbon capture is an energy intensive process, net power output will be significantly reduced when compared to the base case scenario. To compensate for this, an additional unit
of 800 MW has been considered to be added, so that the net power output remains reasonably constant. Technical assumptions related to CCS implementation are given in Table 8.
The cost figures for the base plant, as well as for carbon capture, storage and monitoring, are listed in Table 9.
The financial assumptions used for Case 1 are given in Table 10.
A key measure of the affordability of CCS is the increase in the Levelised Cost of Electricity (LCOE) entailed. The values arrived at in Case 1are given in Table 11.
Table 8:Assumptions related to carbon dioxide capture, transport and storage
Item Value Units Explanation/reference
Gross power
output
4800 MW Due to addition of an 800 MW unit.
Net power output 3930 MW Based on auxiliary energy consumption data
from [85].
Heat rate for
retrofitted plant
11836 MJ/MWh For 33% capture penalty.
CO2 capture rate 90% [85]
Capture
technology
Monoethanolamine (MEA)
based post combustion
capture
MEA based capture is the most developed
method of carbon capture, and post
combustion capture is the most suitable for

India CCS Scoping Study: Final Report
22
Item Value Units Explanation/reference
retrofitting.
Amount of CO2
captured/stored
34 MT per
annum
-
Pipeline
specifications
42" pipeline on-shore, with
booster stations every
100km, 24" pipelines
offshore
[85]
Pipeline onshore
distance
200 Km -
Pipeline offshore
distance
50 Km -
Storage site Saline aquifers Although storage data is in general uncertain
for India, [93] indicates that saline aquifer
potential may be the highest, and hence has
been considered.
Injection
specifications
12 injection wells each with
8000 t CO2/day capacity
Modified from [85] based on higher storage
requirements for this study.
Table 9: Cost figures considered in Case 1
Item Value Units Explanation/reference
Base plant capital cost 4000 USD mn [27]
Capture capital cost 2438 USD mn Value given in [85] adjusted for the larger unit size and
lower base plant capital cost in present case.
Transport capital cost 90 USD mn Adapted from [85] based on the pipeline lengths
considered as per Table 8. Since [85] indicates overall
capital costs for transport and storage, the ratio of capital
costs mentioned in [94] has been used to split the costs.
Storage capital cost 170 USD mn Storage capital cost arrived at in the same way as the
transport capital cost, and then increased by 20% to
account for the larger injection rate in the present study
as compared to [85].
Monitoring capital cost 26 USD mn Costs given in [95] extrapolated to injection levels of
present study.
Fixed O&M for base
plant
72.45 USD mn/y [87]
Variable O&M for base
plant
3.40 USD/MWh [87]
Fixed O&M for capture
equipment retrofitted
plant
94.19
USD mn/y Increase in O&M costs taken to be 30%, in line with [85]
Variable O&M for
capture equipment
retrofitted plant
4.42
USD/MWh Increase in O&M costs taken to be 30%, in line with [85]
Operating cost for
transport and storage
2 USD mn/y Taken as average of costs for coastal power plants as
listed in [85].
Monitoring operating
cost
154 USD mn Calculated similar to monitoring capital cost.

India CCS Scoping Study: Final Report
23
Table 10:Case 1 financial assumptions
Item Value Units Explanation/Reference
Debt: equity ratio 80 : 20
Loan amount 3200 USD mn
Repayment period 15 Years
Interest rate 7.05% [96]
Exchange rate 1 USD = 50 INR
Table 11:LCOE for Case 1
Item Imported coal Indian coal
LCOE without capture (Rs/kWh) 2.95 1.85
LCOE with capture (Rs/kWh) 4.02 2.56
LCOE with CCS (Rs/kWh) 4.04 2.59
LCOE with CCS and monitoring (Rs/kWh) 4.06 2.61
Increase in LCOE due to CCS and monitoring 38% 41%
Further, based on the suggestions received from different stakeholders, including NTPC Ltd., a number of changes were made in the assumptions and cost figures, leading to Case 2
described below.
Case 2:
The differences between the assumptions and figures taken in Case 1 and 2 are summarised
in Table 12.
In addition, it was suggested that the land costs should also be explicitly considered under
the capital costs. However, as calculated from the figures given in [99], land costs for a
gigawatt scale power plant are around USD 7 million, the inclusion of which in the capital costs does not affect the calculations significantly. Hence this figure has been neglected.
Using these assumptions, the LCOE values arrived at are given in Table 13.
Table 12:Differences between Case 1 and Case 2, with explanations
Item Case 1 Case 2 Unit Explanation
Base plant capital
costs
4000 4800 USD mn Stakeholders stated that the capital cost, while site-
specific, should in general be around USD 1.2
million/MW.
Capture capital
costs
2438 3005 USD mn Stakeholders pointed out that the capture capital cost
should not be a function of the base plant capital cost,
and instead absolute values should be taken. Since the
revised base plant capital was similar to that in [85], the
capital cost of CCS equipment given there was
adopted, with adjustment for the larger unit size.
Plant load factor 90% 85% As per CERC norms [97].
Plant life 40 25 years As per stakeholder consultation.
Base plant net heat
rate
8899.2 10136 MJ/MWh CERC norms state a heat rate of 2425 kCal/kWh [97],
and this value has been used for Case 2. This figure
was also used to recalculate the gross heat rate after

India CCS Scoping Study: Final Report
24
Item Case 1 Case 2 Unit Explanation
capture assuming the same 33% capture penalty as
earlier.
Interest rate 7.05% 13% According to a stakeholder, the debt interest rate
taken in Case 1 was unrealistically low, and a figure of
around 13% was suggested.
Debt equity ratio 80/20 70/30 As per tariff policy, Government of India [98].
Calorific value of
Indian coal
5350 3500 kCal/kg According to a stakeholder, from their experience, the
calorific value of the coal available domestically at 65
USD/t is around 3500 kCal/kg.
Table 13:LCOE for Case 2
Item Imported coal Indian coal
LCOE without capture (Rs/kWh) 3.97 3.50
LCOE with capture (Rs/kWh) 5.52 4.90
LCOE with CCS (Rs/kWh) 5.58 4.95
LCOE with CCS and monitoring (Rs/kWh) 5.61 4.99
Increase in LCOE due to CCS and
monitoring
41% 42%
In percentage terms, the increase in LCOE is not very different from Case 1. However, in
absolute terms, the rise in LCOE is higher due to the increase in the base case LCOE.
Case 3:
The results arrived at in the above two cases were cross-checked by substituting values from
[81]. The differences with respect to Case 2 are summarised in Table 14.Using these
assumptions, the LCOE values arrived at are given in Table 15.
Table 14:Differences between Case 2 and Case 3, with explanations
Item Case 2 Case 3 Unit Explanation
Capture capital costs 3005 3350 USD mn The capture equipment cost in [86] for a base plant size
of 580 MW is USD 418 mn, and capture material cost is
USD 15 mn. This has been extrapolated to a plant size
of 3960 MW using an extrapolation factor of 0.8, which
is higher than the 0.6 factor generally used for scaling
up economics, due to CCS technology not being
demonstrated at a large scale, and hence possibly not
scaling up as smoothly as established technologies. The
location specific factors mentioned in [86] have been
used to estimate costs for an Indian scenario. The cost of
the extra unit has been taken by dividing the capital
cost of the base plant by the number of units (6).
Plant size 4000 3960 MW In this case, a power plant with 6 units of 660 MW, with
the addition of another 660 MW unit to compensate for
the capture penalty, was considered. This is consistent
with changes in UMPP norms as mentioned in [28].
Gross power output
with CCS
4800 4620 MW Same as above.

India CCS Scoping Study: Final Report
25
Item Case 2 Case 3 Unit Explanation
Net power output
without CCS
3720 3755 MW The auxiliary power consumption considered is lower
in [86], even for the base power plant without capture
equipment installed.
Net power output
with CCS
3930 3805 MW The auxiliary power consumption with CCS considered
is lower in [86].
Base plant net heat
rate
9000 9200 MJ/MWh As given in [86].
Capture equipment
net heat rate
11970 13220 MJ/MWh As given in [86].
Calorific value of
Indian coal
3500 3014 kCal/kg As given in [86].
Cost of Indian coal 65 56 USD/t As calculated from [86].
Amount of CO2 to be
captured/stored
34 32.8 MTPA Reduction in amount of CO2 captured occurs due to
reduction in plant size.
Table 15:Cost of electricity for Case 3
Item Imported
coal
Indian coal
LCOE without capture (Rs/kWh) 3.73 3.31
LCOE with capture (Rs/kWh) 5.39 4.78
LCOE with CCS (Rs/kWh) 5.44 4.84
LCOE with CCS and monitoring
(Rs/kWh)
5.48 4.87
Increase in LCOE due to CCS and
monitoring
47% 47%
Figure 10: Comparison of the Levelised Cost of Electricity (LCOE) and the increase in LCOE for
the different cases

India CCS Scoping Study: Final Report
26
From these three cases, it can be concluded that the increase in the LCOE is roughly 38-47%. However, it may be noted that the analysis has been carried out for a large sized plant, and
CCS technology is yet to be demonstrated at such scales. A deployment on a smaller plant
will probably lead to a greater increase in the electricity costs owing to reduced economies of scale. Costs will also vary depending on the type of transport and storage mechanism
actually used for the plant in question.
Cost of CO2 avoided:The cost of CO2 avoided is another way in which the relative economic viabilities of various climate change mitigation technologies can be compared.
There are a number of formulae available in literature for computing this cost, and the
numbers arrived at by applying different methods for the same technology are not necessarily equivalent. In this report, the definition given in [100] has been used to calculate
the cost of CO2 avoided for Case 2 mentioned above. Here, the cost of CO2 avoided is defined as the difference in Cost of Electricity (COE) divided by the difference in CO2 emitted per MWh. By this definition, and using the values mentioned above for Case 2, the
cost of avoided CO2works out to be $34.4 /t and $31.2/t for imported and domestic coal
respectively.
6. Policy &legislation review
Legislation that may govern CCS activities is limited mostly to the following sectors:
Oil and gas
Indian Petroleum Act, 1934: Rules for production and transportation of petroleum
products. It can be applied for transportation of compressed CO2.
The Oilfields (Regulation and Development) Act, 1948 (53 of 1948): Royalties in respect of mineral oils. It can be applied for EOR.
The Petroleum Mineral Pipelines (Acquisition of Right of User in Land) Act, 1962: Provides for the acquisition of user in land for laying pipelines for the transport of petroleum and minerals and for matters connected therewith. This law may be applied
for transportation of compressed CO2 to storage sites.
The Oil Industry (Development) Act, 1974: An act to provide for the establishment of a Board for the development of oil industry and for that purpose to levy a duty of excise
on crude oil and natural gas and for matters connected therewith. It can be modified for levying a duty of excise on crude oil and natural gas produced during EOR.
Petroleum and Natural Gas Rules, 1959: An act to provide petroleum exploration license
and mining leases. This law will for development of sites for EOR and EGR.
Directorate General of Hydrocarbon (DGH) under Ministry of Petroleum and Natural
Gas, Government of India is looking after development of Coal Bed Methane
production.
Transport
The Petroleum Mineral Pipelines (Acquisition of Right of User in Land) Act, 1962: Provides
for the acquisition of user in land for laying pipelines for the transport of petroleum and
minerals and for matters connected therewith. This law may be applied for transportation of compressed CO2 to storage sites.

India CCS Scoping Study: Final Report
27
Groundwater
Water (Prevention and Control of Pollution) Act 1974 enacted by Ministry of Environment
and Forest, GOI provide for the prevention and control of water pollution, and for the
maintaining or restoring of wholesomeness of water in the country [101]. This Act levies and collects cess on water consumed by persons operating and carrying on certain types of
industrial activities. This cess is collected with a view to augmenting the resources of the Central Board and the State Boards for the prevention and control of water pollution constituted under the Water (Prevention and Control of Pollution) Act, 1974. CCS has
environmental impacts in terms of chances of groundwater contamination and this act could
be suitably modified to include contamination of groundwater in case there is any leakage of stored CO2.
Environmental impact assessment
Amending the Environmental Protection Act, 1986 is likely to be the most effective way to facilitate demonstration projects and may be done on a project-specific basis before broader
amendments can be established. Since CO2 may need to be transported across states and be stored in a region different to the point of collection, regional coordination groups will need to be established to address issues related to CO2 transport and storage.Retrofitting of CO2
capture capability to existing power plants may be done under the Environment Impact Assessment Notification S.O.60 (E) (under the provisions of the Environment (Protection) Act 1986) and the applicant must submit an application to the Secretary of the Ministry of
Environment and Forests, New Delhi to obtain environmental clearance.
Financing and investment
Given the higher initial investment as well as operating costs, CDM (Clean Development
Mechanism) and carbon markets in their present form may not be sufficient to support and promote CCS. Ideally, policy for financing and investment should be such that the
additional energy penalty due to retrofitting of the power plant for CCS is partly or wholly
covered by earnings from CDM/carbon markets. Towards this, while multilateral financing institutions like the World Bank, International Monetary Fund, and the Asian Development Bank may take a lead in developing specific financial packages and instruments, those
countries that are technologically advanced in CCS should come forward in supporting, including capacity development, initial CCS projects in India.
7. Capacity assessment
India’s position in GCCSI CCS Development Lifecycle:
The CCS Development Lifecycle developed by the Global CCS Instituteis a tool that can be used to locate a country’s present position with respect to CCS development and plot a
roadmap towards CCS deployment. It is shown in Figure 11. It has been recognised that a country may operate simultaneously in multiple parts of the lifecycle, because different aspects related to CCS may develop to different extents at different rates.[102]
Figure 11: GCCSI CCS development lifecycle
India CCS Scoping Study: Final Report
28
The work done during this study suggests that India lies mostly in Stage 1, since the potential of CCS as a method for emissions reduction in India is fairly well known. There are
elements of Stage 2 - putting CCS on policy agenda - being undertaken. For instance, there is
some awareness within policy makers of CCS, and good awareness of the technology as a mitigation option within industry. There are forums where governments and business
leaders are discussing the potential of CCS for India. However, in general, the disposition towards CCS is not positive. The primary barriers to CCS implementation in India and the capacity development needs in this regard are mentioned in the following sections.
Since CCS is a cross-cutting activity, there are a multitude of stakeholders involved. The
important ones among these are listed below.
Government bodies:
Most applications of CCS are large-scale efforts involving infrastructure sector like power, cement and steel. It is therefore quite understandable that there are a number of government bodies whose involvement will be required for any decision-making related to CCS.
Planning Commission of India: The Planning Commission is a Central Government body responsible for formulating the 5 Year Plans. It is tasked with devising plans for the most effective and balanced utilisation of resources and determining priorities for their allocation.
Ministry of Science and Technology (Department of Science and Technology): The Ministry of Science and Technology is the Central Government ministry charged with
formulating and administrating the rules and regulations related to science and technology
development in the country. From a CCS standpoint, the Climate Change Programme of the Department of Science and Technology (DST), which is one of the three departments under the ministry, is of particular importance. The activities related to CCS that the DST has been
pursuing have been mentioned in Section 4.
Ministry of Environment & Forests: The Ministry of Environment & Forests is the country’s nodal agency overseeing India’s environmental and forestry policies and programmes. The
Environmental Impact Assessment Division of the ministry is responsible providing environmental clearances to different types of projects, including mining, coal washeries, and thermal power plants, cement industry, onshore and offshore oil and gas exploration,
etc.
Ministry of Power: The Indian Ministry of Power is responsible for the administration and enactment of legislation regarding thermal and hydro power generation, transmission and
distribution.
Ministry of Petroleum & Natural Gas: The Ministry of Petroleum & Natural Gas is responsible for the regulation of the exploration, production, distribution and marketing,
and import and export of oil and natural gas in India.
Ministry of Coal: The Ministry of Coal has the overall responsibility for deciding strategies and policies with respect to exploration and development of coal and lignite reserves in the
country.
Ministry of Steel: The Ministry of Steel coordinates the policies for and facilitates the development of the iron and steel industry in the country.
Ministry of Commerce and Industry (Department of Industrial Policy and Promotion):
The Department of Industrial Policy and Promotion is one of the two departments under the Indian Ministry of Commerce and Industry, and is tasked with formulating and

India CCS Scoping Study: Final Report
29
implementing policies and strategies for industrial development in conformity with national objectives and development needs. Industries like cement, glass, leather, rubber goods, salt,
wood-based, etc. fall under its purview.
Ministry of Mines: The Ministry of Mines is responsible for the survey and exploration of all minerals other than petroleum, natural gas and atomic minerals. From a CCS standpoint,
it is important to consider that this ministry is responsible for the administration and management of the Geological Survey of India (GSI). The GSI is the primary provider of basic earth science information in India, and its role would be indispensible during surveys
conducted for assessment of underground storage potential.
Ministry of Water Resources: The Ministry of Water Resources is responsible for the development and regulation of water resources in the country. It is in-charge of the Central
Ground Water Board, which is the apex national agency for assessment, exploration, monitoring and regulation of ground water resources in India.
Central Electricity Regulatory Commission (CERC): The Central Electricity Regulatory
Commission is the key regulator of the Indian power sector. Its primary function is to regulate the tariff of power generating companies in India, with a view to promoting competition, efficiency and economy in the Indian power markets.
Central Electricity Authority (CEA): The Central Electricity Authority is a statutory body that advises the Indian Government on matters relating to the national electricity policy,
specifies the technical standards for power plants, specifies the grid standards for
transmission lines, records data relating to the generation, transmission, trading, distribution and utilisation of electricity, and discharges other important functions related to the Indian power sector.
National Remote Sensing Centre (NRSC): The National Remote Sensing Centre, Hyderabad, is a centre of the Indian Space Research Organisation (ISRO), responsible for
aerial and satellite remote sensing data. This agency will also be important during surveys
for assessing underground storage potential in India.
National Geophysical Research Institute (NGRI): In addition to the work related to CCS that NGRI has been carrying out, as mentioned in Section 4 of the report, NGRI’s importance
as a CCS stakeholder lies in the fact that the institute plays a pivotal role in the exploration
of minerals, hydrocarbons and groundwater resources in the country, and will thus be a major player in storage site assessment surveys.
Petroleum Sector:
The petroleum sector is important for CCS implementation, both as a CO2 source, due to emissions arising from the sweetening of sour natural gas and during petroleum refining,
and as a potential CO2 storage option, either via the Enhanced Oil or Gas Recovery route, or via simple storage in depleted oil and gas reservoirs. In India, the state-owned companies remain the most important players, although certain private entities are beginning to make
their mark.
ONGC Ltd.: ONGC is the only fully integrated petroleum company in India, operating along the entire hydrocarbon value chain [103]. It holds the largest share of hydrocarbon
reserves acreage in India, and contributes over 79% of India’s oil and gas production. Its activities related to CCS have been mentioned in Section 4.
OIL India Ltd.: OIL India Ltd. is an Indian Public Sector Unit (PSU) engaged in exploration,
development and production of crude oil and natural gas, transport of crude oil and

India CCS Scoping Study: Final Report
30
production of Liquefied Petroleum Gas (LPG) [104]. Presently, OIL has over 1 lakh sq km of Petroleum Exploration Licence/Mining Licence areas for its exploration and production
activities, and also owns and operates 1,432 km of cross-country crude oil pipelines [105]. On
the production side, OIL produced 3.586 Million Metric Tonnes (MMT) of crude oil in 2010-11, along with 2352.71 Million Metric Standard Cubic Metres (MMSCUM) of natural gas and
45,010 tonnes of LPG [106].
GAIL India Ltd.: GAIL is a state-owned entity that is the largest natural gas processing, distribution and marketing company in India. GAIL presently has the capacity to transport
220 MMSCMD of natural gas through its transmission network [107]. On the processing
front, GAIL operates the Pata refinery, which manufactures polymers, Liquefied Petroleum Gas, propane, and other products from natural gas.
Reliance Industries Ltd: Reliance Industries Ltd. (RIL) is a private entity which produces crude oil and natural gas from a number of oil fields, such as the KG-D6 field, the Panna-Mukta field and the Tapti field. In addition, RIL also owns three Coal Bed Methane blocks
from which production is yet to commence [108]. RIL also owns the Jamnagar Manufacturing Division, which is the largest grass-roots refinery complex in the world [109].
Power Sector:
The power sector, as has been stated in Section 3, is by far the largest source of stationary emissions, and hence power companies are among the most important stakeholders for CCS
in India.
NTPC Ltd.: NTPC is India’s largest power company, with 33,150 MW of operational thermal power [33], and 1328 MW of hydro power being built [110]. The company operates 17.75% of India’s total national capacity, and generates 27.4% of India’s total electricity. In recent years,
NTPC has made attempts at business diversification, with forays into consultancy, power trading, ash utilisation and coal mining. It is also expanding its renewable energy portfolio,
with an aim of 28% of its generation capacity being non fossil fuel based by 2032 [111].
APGENCO: APGENCO is the power generating company of the state of Andhra Pradesh, and is a state-government enterprise. With an installed thermal power capacity of 4593 MW [35], it is one of the largest public sector power producers in the country. In addition, the fact
that it is setting up India’s first large scale IGCC plant, as mentioned in Section 4, makes it an
important stakeholder from the CCS point of view.
Tata Power: Tata Power is an integrated power company in the private sector, with a total
installed generation capacity of 5297 MW [43], and a presence in transmission, distribution and trading. It is responsible for developing the Mundra UMPP.
Reliance Power: Reliance Power is setting up a number of thermal and hydroelectric power
projects in India, and in particular, has been awarded the development of three UMPPs. In all, Reliance Power is building 29280 MW of coal based power, 9880 MW of gas based power and 4620 MW of hydroelectricity [40] [112] [113].
Adani Power:Adani Power is setting up 16500 MW of thermal power in India, with the 4620 MW Mundra plant, the 3300 MW Tiroda plant and the 3300 MW Bhadreshwar plant being the largest units [41].
Bharat Heavy Electrical Ltd.: Bharat Heavy Electrical Ltd. (BHEL) is a public sector organisation which is one of the largest engineering and manufacturing companies in the country. BHEL has a share of 62% in India’s total installed power generating capacity [114].

India CCS Scoping Study: Final Report
31
BHEL is also one of the main players in India’s move towards more efficient power generation technologies.
Steel Sector:
Steel Authority of India Limited: The public sector unit Steel Authority of India Limited (SAIL) is the second largest India-based steel producer, manufacturing 13.6 million tonnes of
crude steel in 2010 [115]. It operates five integrated steel mills in India, and produces both basic and special steels.
Tata Steel: Tata Steel is the largest India-based steel maker; however, a majority of its total
steel production comes from its overseas subsidiaries [116]. In India, its most important unit is the integrated steel plant in Jamshedpur, which is India’s oldest and largest steel plant. Tata Steel is a member of the Carbon Capture & Storage Association, as well as of the Ultra–
Low Carbon Dioxide Steelmaking initiative (ULCOS) [116], which is a consortium of 48 European companies and organisations from 15 European countries undertaking an R&D initiative to drastically reduce CO2 emissions from steel making [117].
Cement Sector:
The major players in the cement sector are indicated in Figure 9.
8. Barriers to CCS implementation in India
The following have been raised by some Indian stakeholders as being the principal barriers for CCS deployment in India.
Worldwide, CCS is still in the demonstration phase. It is only once a degree of
confidence has been gained in the technology via large-scale deployment internationally that it can be considered seriously for India.
One major barrier to CCS deployment in India is the lack of accurate geological storage
site data, since before capture technology can be installed in power plants or other sources, the location, capacity, permeability, and other characteristics of the sinks must be known.
The issue of CCS drastically increasing the cost of electricity while reducing net power output is often cited as being one of the biggest barriers to acceptability of CCS in India.
CCS deployment is held to run counter to India’s ambitious goals for electrification,
especially given the present electricity deficit and energy situation in the country.
Enhanced Oil Recovery (EOR) is worldwide one of the most attractive options for CO2
storage, since the cost of storing the CO2 is offset by the revenues accrued by the hard-to-
extract oil that can be recovered from depleted oil fields by this procedure. In the Indian
scenario, however, it has been stated by stakeholders in the petroleum sector that there are few oil fields which are sufficiently depleted for EOR to be required at present;
further, since EOR is dependent on the miscibility characteristics of the oil with the extracting fluid, it may not be suitable in all cases.
Clarity is needed on how CCS implementation via retrofit of capture equipment to
existing plants will change the Terms of Reference of the plant. In particular, the fresh
environment clearances required, if any, need to be spelt out and standardised.
Access to funding from financing agencies such as the World Bank, Asian Development
Bank, etc. might require further governance requirements in addition to the existing

India CCS Scoping Study: Final Report
32
requirements e.g. around monitoring, measure and verification. These may be dependent on CCS-specific clearances being available from the Ministry of Power
and/or other Government bodies, in addition to the existing clearances required.
Deployment of CCS on a large scale requires specialised manpower and suitable infrastructure, which may not be available in India at present.
Monitoring the stored CO2 to assure against leakage is essential if the central purpose of CCS implementation is to be fulfilled. Ensuring rigorous monitoring is needed over long time scales and techniques developed internationally in this area need to be introduced
to Indian stakeholders.
Legal issues related to land acquisition; ground water contamination, CO2 leakage, etc. need to be addressed before any large scale transport and storage of CO2 can be
permitted.
9. Capacity development needs
Broadly, the following capacity development needs related to CCS require to be addressed
so as to create an enabling environment for CCS deployment in India.
1. Knowledgebuilding and capacity development of policy makers and regulators
While at the decision-making levels some knowledge regarding CCS does exist, there is a
need to go deeper in to the nuances of different elements of CCS and the associated benefits and risks. While the present study has attempted to inform the relevant stakeholders in this regard, more systematic and sustained work needs to be done if India is to be truly
considered a country in the 2nd stage of the CCS Development Lifecycle.
This capacity development could be done by organising events specifically targeting policy makers in the relevant sectors, such as electricity, oil & gas, and environment, etc.
Regulations and policies in place elsewhere globally, along with progress in CCS related activities in other parts of the world, may be highlighted so as to provide context and direction to these discussions.
2. Capacity development for storage site assessment, development, operation and
monitoring and verification
It is widely accepted that assessment of potential storage sites is one of the biggest hurdles to
CCS deployment in India. To remedy this, two-pronged approach may be considered, namely, (i) the training of geologists in the advanced assessment techniques and (ii) the involvement of Indian agencies in the potential assessment work being carried out
elsewhere. If necessary, the global players may be involved in this exercise right from the beginning.
Once the appropriate storage sites have been identified, arrangements will need to be made
to make these sites suitable for CO2 injection and storage. These may involve, for instance, knowledge of advanced drilling techniques, or capacity to assess permeability data, etc. and therefore, expertise in these areas. This may be done by training existing operators in the
petroleum and natural gas sectors to the specific needs of CCS operation, including
monitoring and verification.

India CCS Scoping Study: Final Report
33
3. Technology sharing and transfer
CCS technology is still in the demonstration phase, and it is important that India is not left
behind in this area. While there is a considerable amount of work already underway
domestically, there may still be a need for research collaborations and knowledge sharing and transfer. These areas of research include development of new adsorbents, better process
integration of capture equipment, and conversion of CO2 to useful products, among others.
4. Capacity development of Financial Institutions
The financial evaluation of CCS projects will necessitate capacity development of banks and
other financial institutions, since the norms and practices differ from those applied for normal power plants and industries. In this regard, informing Indian financial institutions about global practices may be a step forward, enabling them to them adapt these to Indian
requirements.
5. Public Engagement
Public acceptance is vital before any CCS project can be implemented, with consensus
required especially on the storage side. Various civil society groups are involved in different aspects of public interest, and inclusion of these groups in discussions related to CCS at an early stage may facilitate better acceptability of CCS technologies.
6. Knowledge sharing among different CCS groups
CCS being a cross cutting activity involving several components and myriad stakeholders, it is vital that knowledge sharing between the different CCS groups is done on a regular basis.
This will improve the quality of information available to all parties, enabling the emergence of a more accurate picture and more informed decision making at all levels. Web based `virtual’ platform could be one of the options for this.
10. Conclusions and recommendations
India has been moving along a trajectory of high economic growth for last few years, a vital pre-requisite for fulfilling its goal of `inclusive growth’. While recently its growth rate has
become more modest, energy remains the key driver of country’s growth engine; not only from the point of view of the economic perspective, but more importantly for accelerating its
social development. Given that India has vast coal reserves it is natural that coalis the largest
constituent – at 40% - in its primary energy mix. As far as electricity is concerned, India has an installed capacity of over 207 GW, of which about 66% is thermal power generation and majority of this comes from coal. Still, India faces peak electricity shortage to the tune of
10%. In addition, over 289 million people do not have access to electricity. This has implications on all other development parameters including poverty alleviation, health, food
security, and education. Therefore, India’s top development priority is to provide electricity
to all at affordable prices.
However, even though coal is expected to dominate India’s primary energy in the foreseeable future, it is exploring all the possible means of reducing the resultant GHG
emissions. For instance, future capacity is expected to increasingly be based on super-critical technology, with 50% of the capacity in the 12th plan period targeted to be through super-
critical units, and all coal based plants in the 13th plan period to be super-critical units. It
may be noted that on the emissions front, however, even with 8-9% GDP growth every year for the next decade or two, India’s per capita emissions are likely to be well below developed country averages.

India CCS Scoping Study: Final Report
34
Nonetheless, India supports global efforts at R&D into CCS technologies. However, there are stakeholder concerns pertaining to the capital and operating costs; the energy penalties;
and safety and integrity of potential storage; and the social acceptance of CCS. The high cost
of electricity and reduced net electricity generation with CCS challenges the country’s goal of `electricity to all and at affordable prices’. But given its wide applicability, the role of CCS
is not limited to power generation alone but extends to other industrial sectors as well, including utilization of captured CO2 for Enhanced Oil Recovery (EOR), manufacture of cement substitutes, algal biofuel, fertiliser manufacture, and mineralization. Indeed, the role
of CCS as a potential climate change mitigation option for India needs to be explored
further, so that issues raised in this report could be suitably addressed. The following section outlines suggested approach for addressing these issues.
As discussed elsewhere in this report, for CCS to be considered as a viable mitigation option in India, a major challenge is the lack of reliable storage data. The relevant Indian institutions and organisations need to work together for the preparation of an accurate
geological storage map for India, utilising recognised assessment criteria. This storage
mapping should incorporate the different storage options such as saline aquifers, basalt rocks, and depleted oil fields (on-shore and off-shore). Finally, a matching of sources and
sinks and cost optimisation in this regard will need to be carried out.
The overall cost of capturing and storing CO2 has not been quantified accurately for an Indian scenario so far, and hence a Life Cycle Analysis (LCA) of the entire system needs
to be conducted.
The whole issue of financial risks and legal liabilities in case of CO2 leakage from the storage site needs to be addressed appropriately.
R&D in the areas of improved capture systems, more efficient retrofit, and plant integration should be undertaken for increasing CCS acceptability.
Similarly, from the point of view of (a) carbon, capture, utilisation and storage,
includingdeveloping value-added products using CO2; detailed studies and local R&D-anddemonstrations could be supported.
To facilitate better interaction with the global CCS community, it may be worthwhile to
devise a mechanism – or tap into existing mechanisms - for knowledge and experience
sharing among different actors viz. the technology develops/suppliers, global practitioners of CCS, and potential users, research community, as well as decision-
makers from India on different aspects of CCS on a regular basis. Such interactions would also be helpful from the policy planning perspective.
Sustained efforts are required towards capacity development of different stakeholders,
including sensitisation of the policy makers and the regulators about the latest
developments in this field.
Public acceptance of CCS being central to its successful deployment, workshops and
seminars disseminating information about this technology may be conducted to increase mass awareness.

India CCS Scoping Study: Final Report
35
References
1. Intergovernmental Panel on Climate Change (IPCC), 2005. Special Report on Carbon
Dioxide Capture and Storage. Intergovernmental Panel on Climate Change.
2. National Informatics Centre, Government of India. India at a Glance. Available at: <http://india.gov.in/knowindia/profile.php?id=2> [Accessed 17 April 2012].
3. Office of the Registrar General & Census Commissioner, Government of India, 2011. Provisional Population Totals Paper 1 of 2011 India- Chapter 3. Office of the Registrar General & Census Commissioner, Government of India. Available at:
<http://www.censusindia.gov.in/2011-prov-
results/data_files/india/Final%20PPT%202011_chapter3.pdf> [Accessed 17 April 2012].
4. National Informatics Centre, Government of India. Indian Economy: Economic Indicators
from 1991. Available at: <http://business.gov.in/indian_economy/eco_indicators.php> [Accessed 15 February
2012].
5. Ahuja S., et al., 2006. Economic Reform in India: Task Force Report. University of Chicago. 6. Organisation for Economic Co-operation and Development, 2007. Policy Brief: Economic
Survey of India, 2007. Organisation for Economic Co-operation and Development. 7. Poddar T. and Yi E., 2007. India’s Rising Growth Potential. Goldman Sachs. 8. Planning Commission, Government of India. Data for use of Deputy Chairman, Planning
Commission. Planning Commission, Government of India. Available at:
<http://planningcommission.nic.in/data/datatable/index.php?data=datatab> [Accessed 17 April 2012].
9. Ministry of Environment and Forests, Government of India, 2010. India: Greenhouse Gas
Emissions 2007. Ministry of Environment and Forests, Government of India. 10. Centre for Science and Environment, 2009. Challenge of the New Balance. Centre for
Science and Environment 11. Garg A. and Shukla P.R., 2009. Coal and energy security for India: Role of carbon
dioxide (CO2) capture and storage (CCS), Energy, 34, pp. 1032-1041.
12. Planning Commission, Government of India, 2006. Integrated Energy Policy: Report of the
Expert Committee. Planning Commission, Government of India. 13. Ministry of Coal, Government of India. Inventory of Coal Resources of India. Available at:
<http://www.coal.nic.in/reserve2.htm> [Accessed March 3, 2012]. 14. Batra R.K. and Chand S.K., 2011. Policy Brief: India’s coal reserves are vastly overstated.
The Energy and Resources Institute.
15. World Energy Council, 2010. 2010 Survey of Energy Resources. World Energy Council. 16. Ministry of Coal, Government of India, 2011. Annual Report 2010-11. Ministry of Coal,
Government of India.
17. Ministry of Petroleum & Natural Gas, Government of India, 2011. Indian Petroleum &
Natural Gas Statistics- 2010-11. Ministry of Petroleum & Natural Gas, Government of India.
18. BP p.l.c., 2011. 2011 BP Statistical Review of World Energy. BP p.l.c. 19. Ministry of Petroleum & Natural Gas, Government of India, 2011. Basic Statistics on
Indian Petroleum & Natural Gas- 2010-11. Ministry of Petroleum & Natural Gas,
Government of India. 20. Energy Information Administration, Department of Energy, USA, 2011. Country
Analysis Briefs: India. Energy Information Administration, Department of Energy, USA.

India CCS Scoping Study: Final Report
36
21. Prime Minister’s Council on Climate Change, Government of India. National Action
Plan on Climate Change. Prime Minister’s Council on Climate Change, Government of
India.
22. Kumar S., 2011. India’s own emissions trading scheme. The Hindu Business Line, December 18, 2011. Available at:
<http://www.thehindubusinessline.com/opinion/article2726531.ece>. [Accessed 23 May 2012].
23. Central Electricity Authority, Government of India, 2012. Monthly Report on Installed
Capacity- November 2012. Central Electricity Authority, Government of India.
24. Central Electricity Authority, Government of India, 2011. Operation performance of
generating stations in the country during the year 2010-11: An Overview. Central Electricity
Authority, Government of India. 25. Press Information Bureau, Government of India, 2010. Power Minister’s Address at EEC
2010. Available at: <http://pib.nic.in/newsite/erelease.aspx?relid=66577>. [Accessed
19 April 2012].
26. Power Finance Corporation. Ultra Mega Power Projects (UMPP). Available at: < http://www.pfcindia.com/Content/UltraMegaPower.aspx>. [Accessed 25 March
2012]. 27. Ministry of Power, Government of India. Ultra Mega Power Projects (UMPP). Available
at: <http://www.powermin.nic.in/JSP_SERVLETS/internal.jsp>. [Accessed 21 March
2012].
28. Vora R., 2013. Tata Power synchronises unit 4 of Mundra UMPP. Business Standard,
January 7, 2013. Available at: <http://www.business-standard.com/india/news/tata-
power-synchronizes-unit-4mundra-umpp/201782/on>. [Accessed 10 January 2013]. 29. Central Electricity Authority, Government of India. Brief Status of Progress of Activities
for UMPPs. Available at:
<http://www.cea.nic.in/reports/articles/thermal/progress_report_sasan_mundra_kr
ishnapatnam.pdf>. [Accessed 10 April 2012]. 30. KSEB Officers’ Association, 2012. Krishnapatnam UMPP – Reliance arm approaches CERC
for tariff hike. Available at: <http://www.kseboa.org/news/krishnapatnam-umpp-reliance-arm-approaches-cerc-for-tariff-hike-26112521.html>. [Accessed 26 November 2012].
31. Reliance Power Ltd., 2012. Corporate Presentation. Available at:
<http://www.reliancepower.co.in/108/21_101.pdf>. [Accessed 10 April 2012]. 32. Razdan A., 2011. Driving efficiency in power sector: route to a sustainable future. Live
Mint, July 26, 2011. Available at: <http://www.livemint.com/2011/07/26003403/Driving-efficiency-in-power-se.html>. [Accessed 9 March 2012].
33. Central Electricity Authority, Government of India, 2011. CO2 Baseline Database for the
Indian Power Sector: User Guide. Central Electricity Authority, Government of India. 34. NTPC Ltd. Installed Capacity. Available at:
<http://www.ntpc.co.in/index.php?option=com_content&view=article&id=96&Itemid=175&lang=en>. [Accessed 23July 2012].
35. APGENCO. Operational Performance. Available at:
<http://www.apgenco.gov.in/inner.asp?frm=Performance_thermal>. [Accessed
23July 2012]. 36. Damodar Valley Corporation. Plants. Available at:
<http://www.dvcindia.org/powerplants.htm>. [Accessed 23July 2012].

India CCS Scoping Study: Final Report
37
37. Gujarat State Electricity Corporation Ltd. Company Profile. Available at: < http://www.gsecl.in/profile.php#>. [Accessed 23July 2012].
38. Mahagenco. Installed Capacity. Available at:
<http://www.mahagenco.in/INSTALLED-CAPACITY-01.shtm>. [Accessed 23July 2012].
39. MP Power Generating Company Ltd. Installed Capacity at a glance. Available at: <http://mppgenco.nic.in/mpgenco-install-detail.htm#>. [Accessed 23July 2012].
40. West Bengal Power Development Corporation Ltd. Power Scenario. Available at:
<http://www.wbpdcl.co.in/sildeshow.php>. [Accessed 22 March 2012].
41. Adani Power Ltd. Power Generation. Available at: <http://www.adanipower.com/Business/PowerGeneration.html>. [Accessed 23July
2012]. 42. Reliance Power Ltd. Coal Based Projects. Available at:
<http://www.reliancepower.co.in/business_areas/power_projects/coal_based_projec
ts.htm>. [Accessed 23July 2012].
43. The Tata Power Company Ltd., 2012. Tata Power's generation capacity crosses 6,000MW,
with synchronisation of 800MW sized Unit 2 of 4,000MW Mundra Ultra Mega Power Project.
Available at: <http://m.tata.com/article.aspx?var1=v6tGKr347xg=>. [Accessed 23 July 2012].
44. Uttar Pradesh RajyaVidyutUtpadan Nigam Ltd. Our Vision. Available at:
<http://www.uprvunl.org/#>. [Accessed 31July 2012].
45. Tamil Nadu Generation and Distribution Corporation Ltd. Generation. Available at: <http://www.tangedco.gov.in/template1.php?tempno=1&cid=0&subcid=184>.
[Accessed 31July 2012]. 46. Rajasthan RajyaVidyutUtpadan Nigam Ltd. Present Installed Capacity. Available at:
<http://www.rvunl.com/Installed%20capacity_RVUN.php>. [Accessed 31 July 2012].
47. PSPCL. Existing Thermal Projects. Available at:
<http://www.pspcl.in/docs/existing_thermal_projects.htm>. [Accessed 31 July 2012]. 48. Haryana Power Generation Corporation Ltd. Installed Capacity. Available at:
<http://www.hpgcl.gov.in/personal_17.hp>. [Accessed 31 July 2012]. 49. Karnataka Power Corporation Ltd. KPCL Power Projects. Available at:
<http://www.karnatakapower.com/projects.asp>. [Accessed 31 July, 2012].
50. Chhattisgarh State Power Generation Company Ltd. Current Installed Capacity.
Available at: <http://www.cseb.gov.in/cspgcl/statistics/installed_capacity.htm>. [Accessed 31 July 2012].
51. Neyveli Lignite Corporation Ltd. Proactive Disclosure under RTI Act 2005. Neyveli Lignite Corporation Ltd. Available at: <http://www.nlcindia.com/rti/rti_pro_dis_eng.pdf>. [Accessed 10 April 2012].
52. Ministry of Finance, Government of India, 2012. Economic Survey of India 2011-12-
Chapter 11. Ministry of Finance, Government of India. 53. Ministry of Petroleum & Natural Gas, Government of India. Refineries in India. Ministry
of Petroleum & Natural Gas, Government of India. Available at: <http://petroleum.nic.in/refinery.pdf>. [Accessed 23 April 2012].
54. Confederation of Indian Industry. Cement Industry in India: Trade Perspectives.
Confederation of Indian Industry. Available at:
<http://newsletters.cii.in/newsletters/mailer/trade_talk/pdf/Cement%20Industry%20in%20India-%20Trade%20Perspectives.pdf>. [Accessed 13 December 2011].

India CCS Scoping Study: Final Report
38
55. Department Related Parliamentary Standing Committee on Commerce, Parliament of India, 2011. Ninety Fifth Report on Performance of Cement Industry. Department Related
Parliamentary Standing Committee on Commerce, Parliament of India.
56. British Geological Survey, 2005. Cement Raw Materials. British Geological Survey. Available at: <www.bgs.ac.uk/downloads/start.cfm?id=1408>. [Accessed 21 March
2012]. 57. United Nations Industrial Development Organisation, 2010. Global Industrial Energy
Efficiency Benchmarking. United Nations Industrial Development Organisation.
58. Saxena A., 2010. Best Practices & Technologies for Energy Efficiency in Indian Cement
Industry. National Council for Cement and Building Materials. Available at: <http://www.iea.org/work/2010/india_bee/saxena.pdf>. [Accessed 21 March 2012].
59. Press Trust of India, 2012. India’s cement-making capacity pegged at 479 MT by 2017. The Economic Times, 8 January.
60. Ministry of Steel, Government of India. An Overview of Steel Sector. Available at:
<http://steel.nic.in/overview.htm>. [Accessed 22 March 2012].
61. Corporate Catalyst India, 2012. Iron and Steel Industry in India. Corporate Catalyst India. Available at: <http://www.cci.in/pdf/surveys_reports/iron-steel-industry.pdf>.
[Accessed 22 March 2012]. 62. GIZ, 2011. Steel industry in India: Potential and technologies for reduction of CO2 emissions.
GIZ. Available at: <http://www.hrdp-net.in/live/hrdpmp/hrdpmaster/hrdp-
asem/content/e18092/e21298/e25159/e40403/eventReport40420/Presentation-
GIZsteelindustryworkshopreport_Corr1_EditedNP-100112-2.pdf>. [Accessed 22 March 2012].
63. Department of Science and Technology, Government of India. Joint Technology Projects
under STAC/IS-STAC. Available at: <http://www.dst.gov.in/about_us/ar07-08/tech-dru-prg.htm#stac>. [Accessed 28 March 2012].
64. Inter-Sectoral Science & Technology Advisory Committee, Department of Science and
Technology, Government of India. Inter-Sectoral Science & Technology Advisory
Committee Project List (2007-08). Available at: <http://www.dst.gov.in/scientific-
programme/projectlist/2007-08/is-stac-07-08.pdf>. [Accessed 28 March 2012]. 65. Inter-Sectoral Science & Technology Advisory Committee, Department of Science and
Technology, Government of India. STAC/IS-STAC & PROBE Pilot Program Project List
2008-09. Available at: <http://www.dst.gov.in/scientific-
programme/projectlist/2008-09/isstac08-09.pdf>. [Accessed 28 March 2012]. 66. Inter-Sectoral Science & Technology Advisory Committee, Department of Science and
Technology, Government of India. IS-STAC Projects Funded 2009-10. Available at: <http://www.dst.gov.in/scientific-programme/projectlist/2009-10/isstac09-10.pdf>. [Accessed 28 March 2012].
67. Inter-Sectoral Science & Technology Advisory Committee, Department of Science and
Technology, Government of India. IS-STAC Projects Funded 2010-11. Available at: <http://www.dst.gov.in/scientific-programme/projectlist/2010-11/isstac10-11.pdf>.
[Accessed 28 March 2012]. 68. Inter-Sectoral Science & Technology Advisory Committee, Department of Science and
Technology, Government of India. IS-STAC Projects Funded 2011-12. Available at:
<http://www.dst.gov.in/scientific-programme/projectlist/2011-12/isstac11-12.pdf>.
[Accessed 28 March 2012]. 69. Department of Science and Technology, Ministry of Science and Technology,
Government of India, 2010. Annual Report 2009-10. Ministry of Science and Technology,

India CCS Scoping Study: Final Report
39
Government of India. Available at <http://www.dst.gov.in/about_us/ar09-10/annual_report_2009-10.pdf>
70. Department of Science and Technology, Ministry of Science and Technology,
Government of India, 2011. Annual Report 2010-11. Ministry of Science and Technology, Government of India. Available at <http://www.dst.gov.in/about_us/ar10-
11/PDF/DST%20Annual%20Report%202010-11.pdf> 71. Department of Science and Technology, Ministry of Science and Technology,
Government of India, 2012. Annual Report 2011-12. Ministry of Science and Technology,
Government of India. Available at <http://www.dst.gov.in/about_us/ar11-
12/PDF/DST_Annual_Report_2011-12.pdf> 72. Royal Norwegian Embassy. New programme to promote Indo-Norwegian research
cooperation. Available at: <http://www.norwayemb.org.in/News_and_events/Education--Research/New-programme-to-promote-Indo-Norwegian-research-cooperation/>. [Accessed 20 April
2012].
73. Chakraborty A B, 2008. CO2 Capture and Storage: ONGC’s Perspective and Plan. ONGC. Available at:
<http://www.irade.org/ccs/session%207B/11.%20Mr%20A%20B%20Chakraborty.ppt>. [Accessed 30 March 2012].
74. IANS, 2010. Using algae to trap carbon dioxide, Orissa show how. Sify Finance.
Available at: <http://www.sify.com/finance/using-algae-to-trap-carbon-dioxide-
orissa-show-how-news-default-kjgmubgiehd.html>. [Accessed 28 March 2012]. 75. Orissa Diary, 2011. Orissa-based PSU Nalco to set up Pilot Project on Carbon
Sequestration in its Power Plant. Orissa Diary. Available at: <http://www.orissadiary.com/ShowBussinessNews.asp?id=25424>. [Accessed 28 March 2012].
76. Sonde R.R. Demonstration of capture, injection and geological Sequestration (storage) in Flood
Basalt Formation of India. NTPC. Available at: <http://www.cslforum.org/publications/documents/Basalt_Formation.pdf>.
[Accessed 30 March 2012]. 77. Goel M., Charan S.N. and Bhandari A.K., 2008. CO2 Sequestration: Recent Indian
Research, Glimpses of Geoscience Research in India. Available at:
<http://www.iypeinsa.org/updates-09/art-11.pdf>. [Accessed 19 March 2012].
78. Chemical Engineering, IIT Bombay. Solar Bio-fuel and Carbon Sequestration with
Cyanobacteria: Role of Genetic Networks. Available at:
<http://www.che.iitb.ac.in/online/phdtatopic/solar-bio-fuel-and-carbon-sequestration-cyanobacteria-role-genetic-networks>. [Accessed 28 March 2012].
79. Chemical Engineering, IIT Bombay. Carbon sequestration using carbon dioxide absorption
in aqueous mineral suspensions. Available at:
<http://www.che.iitb.ac.in/online/phdtatopic/carbon%C2%A0sequestration%C2%A0using%C2%A0carbon%C2%A0dioxide%C2%A0absorption%C2%A0in%C2%A0aqueo
us%C2%A0mineral%C2%A0-suspensions>. [Accessed 28 March 2012]. 80. Consortium for Clean Coal Utilization, Washington University in St. Louis. Ongoing
Research Projects. Available at: <http://cccu.wustl.edu/research-proj.php>. [Accessed
28 March 2012].
81. Bharat Heavy Electricals Ltd. Press Release: BHEL Takes Over BHPV; Signs MoU with
APGenco for setting up Nation's biggest 125 MW Clean Coal Power Plant. Available at: <
http://www.bhel.com/press_release/press_pop.php?press_id=270>. [Accessed 28 March 2012].

India CCS Scoping Study: Final Report
40
82. PTI, 2012. ‘India to build Ultra Supercritical Thermal Power Plant’. The Economic Times, February 27, 2012. Available at <http://articles.economictimes.indiatimes.com/2012-
02-27/news/31104416_1_power-plant-carbon-dioxide-ntpc >. [Accessed 2 November
2012]. 83. The Hindu, 2011. EU-funded clean coal project for thermal power sector. The Hindu.
Available at: <http://www.thehindu.com/news/cities/Tiruchirapalli/article2737672.ece>. [Accessed 30 March 2012].
84. Garg M.O. Carbon Capture & Storage/Use (Research Priorities for CCS). CSIR- Indian
Institute of Petroleum, Dehradun. Presented at Carbon Capture and Storage Workshop organised by Ministry of Power, Government of India in New Delhi on September 27,
2011. 85. Mott MacDonald, 2008. CO2 Capture-Ready UMPPs, India. Mott MacDonald. 86. Global CCS Institute, 2011. Economic Assessment of Carbon Capture and Storage
Technolgies: 2011 update. Global CCS Institute.
87. Mott MacDonald, 2007. UMPP Risk Analysis. Mott MacDonald. 88. Coastal Gujarat Power Limited, 2007. Environmental Assessment Report-India: Mundra
Ultra Mega Power Project. Coastal Gujarat Power Limited. 89. Wulandari F., 2012. Indonesia cuts price of thermal coal to the lowest in 16 months.
BloombergBusinessweek, April 5, 2012. Available at:
<http://mobile.bloomberg.com/news/2012-04-05/indonesia-cuts-price-of-thermal-
coal-to-the-lowest-in-16-months?category=>. [Accessed 16 April 2012]. 90. Chikkatur A.P., 2008. Coal Initiative Reports: A Resource and Technology Assessment of Coal
Utilization in India. Pew Center on Global Climate Change 91. Coal India Limited, 2012. New pricing of non coking coal based on GCV with effect from
00:00 Hour of 1.1.2012. Available at:
<http://coalindia.in/Documents/Revised_2nd_Ver_Coal_Price_for_uploading_31011
2.pdf>. [Accessed 16 April 2012]. 92. Global CCS Institute, 2010. Defining CCS Ready: An Approach to AnInternational
Definition. Available at <http://www.globalccsinstitute.com/publications/defining-ccs-ready-approach-international-definition>.
93. Holloway et al., 2009. An assessment of the CO2storagepotential of the Indian
subcontinent. Energy Procedia, 1 (1), pp. 2607-2613.
94. Global CCS Institute. Strategic Analysis of the Global Status of Carbon Capture and Storage-
Report 2: Economic Assessment of Carbon Capture and Storage Technologies. Global CCS
Institute. 95. Benson S.M., 2004. Monitoring Protocols and Life-Cycle Costs for Geologic Storage of Carbon
Dioxide. Carbon Sequestration Leadership Forum. Available at:
<http://www.cslforum.org/publications/documents/Melbourne/benson_sally_wed
_Pal_AB_0915.pdf >. [Accessed 12 March 2012]. 96. Misra R., 2011. Competitive Power Procurement: Guidelines and Recent Experience.
Presented at ‘4th Capacity Building Programme for Officers of Electricity Regulatory Commissions, 18-23 July, 2011’. Available at: < http://www.iitk.ac.in/ime/anoops/for11/PPTs/14%20-
%20Mr.%20Rajat%20Mishra%20-%20Competitive%20Power%20Procurement.pdf >.
[Accessed 26 March 2012]. 97. National Power Training Institute. Tariff determination methodology for thermal power
plant. Available at:

India CCS Scoping Study: Final Report
41
<http://www.npti.in/Download/Distribution/Tariff%20Determination%20-%20Write%20up.pdf>. [Accessed 23 July, 2012].
98. Ministry of Power, Government of India. Tariff Policy. Available at:
<http://www.mahadiscom.com/consumer/national%20tariff%20policy.pdf>. [Accessed 23 July, 2012].
99. Prasad M. Water, land issues stall Orissa UMPP. Projectmonitor. Available at: <http://www.projectsmonitor.com/detailnews.asp?newsid=15629>. [Accessed 10 May 2012].
100. Rubin E.S., Chen C. and Rao A.B., 2007. Cost and performance of fossil fuel power
plants with CO2 capture and storage, Energy Policy, 35, pp. 4444-4454. 101. Ministry of Environment and Forests, Government of India. Water Pollution. Available
at: <http://moef.nic.in/modules/rules-and-regulations/water-pollution/>. [Accessed 28 March 2012].
102. Global CCS Institute, 2012, Global Status of CCS 2012, Global CCS Institute
103. ONGC Ltd. Profile. Available at: <http://www.ongcindia.com/profile_new.asp>.
[Accessed 27 March 2012]. 104. OIL India Ltd. Expression of Interest (EOI) for Subscription Services on Exploration and
Production Database of Petroliferous Basins of the world. Available at: <http://www.oil-india.com/pdf/tenders/EOI/DOC_OILCCOEOICOE072011.pdf>. [Accessed 23 May 2012].
105. OIL India Ltd. Pipelines. Available at: <http://www.oil-india.com/Pipelines.aspx>.
[Accessed 23 May 2012]. 106. OIL India Ltd. Performance. Available at: <http://www.oil-
india.com/Performance.aspx>. [Accessed 23 May 2012]. 107. GAIL (India) Ltd. GAIL gets MOU excellence award for the second consecutive year.
Available at: <http://www.gailonline.com/final_site/pressrelease_feb01_12.html>.
[Accessed 30 March 2012].
108. Reliance Industries Ltd. Growth through Energy Security for India. Available at: <http://www.ril.com/html/business/exploration_production.html>. [Accessed 30
March 2012]. 109. Reliance Industries Ltd. Jamnagar. Available at:
<http://www.ril.com/html/aboutus/manufact_jamnagar.html>. [Accessed 30 March
2012].
110. NTPC Ltd. Hydro Based Power Projects (Under Implementation). Available at: <http://www.ntpc.co.in/index.php?option=com_content&view=article&id=35&Itemi
d=85&lang=en>. [Accessed 30 March 2012]. 111. NTPC Ltd. Overview. Available at:
<http://www.ntpc.co.in/index.php?option=com_content&view=article&id=42&Itemi
d=75&lang=en>. [Accessed 30 March 2012].
112. Reliance Power Ltd. Gas Based Projects. Available at: <http://www.reliancepower.co.in/business_areas/power_projects/gas_based_projec
ts.htm>. [Accessed 30 March 2012]. 113. Reliance Power Ltd. Gas Based Projects. Available at:
<http://www.reliancepower.co.in/business_areas/power_projects/hydroelectricity_
projects.htm>. [Accessed 30 March 2012].
114. Bharat Heavy Electricals Ltd. About us. Available at: < http://www.bhel.com/about.php>. [Accessed 30 March 2012].

India CCS Scoping Study: Final Report
42
115. World Steel Association, 2010. Top steel producers. World Steel Association. Available at: <http://www.worldsteel.org/statistics/top-producers.html>. [Accessed 12 December
2011].
116. Tata Steel. Tata Steel. Available at: <http://www.ccsassociation.org/about-us/our-members/tata-steel/>. [Accessed 30 March 2012].
117. ULCOS. Overview. Available at: <http://www.ulcos.org/en/about_ulcos/home.php>. [Accessed 30 April 2012].

India CCS Scoping Study: Final Report
2
Climate change caused by the excessive industrial emissions of greenhouse gases (GHGs) is one of the gravest challenges facing our planet today. Studies have shown that there is no single option for combating this problem, but rather, a portfolio of measures, such as the increased use of renewable energy, improved energy efficiency, etc. will be needed.
Carbon Capture and Sequestration (CCS) is one among these measures, being a collection of technologies that may be able to reduce GHG concentrations beyond what would be possible using other options alone. CCS involves the capture of carbon dioxide (CO), the principal GHG, from concentrated emission sources, and then transporting it to and storing it perpetually in underground geological formations, used oil wells, or other secure locations. However, several challenges must be overcome before large-scale CCS deployment becomes practical, including establishing the technical feasibility of long-term geological CO2 storage, assessing the economics of capture, transport and storage of CO2, sensitising the political leadership, industry, and the common man to the potential of this technology, etc.
The Australia-based Global CCS Institute has been working collaboratively with other organisations across the world to address issues related to CCS. Since CCS technology is still in its infancy in India, TERI, in association with the Global CCS Institute, conducted a scoping study to identify the potential role of CCS in India’s GHG mitigation strategies, and outline key considerations from a policy making perspective in this regard. The present report presents the outcomes of this study, outlining the key issues from an Indian perspective, and recommending the way forward.
Copyright © 2022 FDOKUMEN