Download PDF - eScholarship
48
Lawrence Berkeley National Laboratory Recent Work Title High-Resolution Imaging of Unstained Polymer Materials Permalink https://escholarship.org/uc/item/5t1351wc Journal ACS Applied Polymer Materials, 3(6) ISSN 2637-6105 Authors Jiang, X Balsara, NP Publication Date 2021-06-11 DOI 10.1021/acsapm.1c00217 Peer reviewed eScholarship.org Powered by the California Digital Library University of California
-
Upload
khangminh22 -
Category
Documents
-
view
0 -
download
0
Transcript of Download PDF - eScholarship

Lawrence Berkeley National LaboratoryRecent Work
TitleHigh-Resolution Imaging of Unstained Polymer Materials
Permalinkhttps://escholarship.org/uc/item/5t1351wc
JournalACS Applied Polymer Materials, 3(6)
ISSN2637-6105
AuthorsJiang, XBalsara, NP
Publication Date2021-06-11
DOI10.1021/acsapm.1c00217 Peer reviewed
eScholarship.org Powered by the California Digital LibraryUniversity of California

High-Resolution Imaging of Unstained Polymer Materials
Xi Jiang 1*, Nitash P. Balsara1,2*
1. Materials Sciences Division, Lawrence Berkeley National Laboratory, Berkeley, CA 94720,
USA
2. Department of Chemical and Biomolecular Engineering, University of California, Berkeley,
CA 94720, USA
*Corresponding author: [email protected]; [email protected]
ORCID:
Xi Jiang, https://orcid.org/0000-0002-9589-7513
Nitash P. Balsara, https://orcid.org/0000-0002-0106-5565
Keywords: transmission electron microscopy, four-dimensional scanning transmission electron
microscopy, cryogenic, low-dose imaging, unstained

Abstract
Electron microscopy has played an important role in polymer characterization.
Traditionally, electron diffraction is used to study crystalline polymers while transmission
electron microscopy is used to study microphase separation in stained block copolymers and
other multiphase systems. We describe developments that eliminate the barrier between these
two approaches – it is now possible to image polymer crystals with atomic resolution. The
focus of this review is on high-resolution imaging (30 Å and smaller) of unstained polymers.
Recent advances in hardware allow for capturing numerous (as many as 105) low-dose images
from an unperturbed specimen; beam damage is a significant barrier to high-resolution electron
microscopy of polymers. Machine-learning-based software is then used to sort and average the
images to retrieve pristine structural information from a collection of noisy images.
Acknowledging the heterogeneity in polymer samples prior to averaging is essential. Molecular
conformations in a wide range of amphiphilic block copolymers, polymerized ionic liquids and
conjugated polymers, can be gleaned from two-dimensional projections (2D), three-dimensional
(3D) tomograms, and four-dimensional (4D) scanning transmission electron microscopy (STEM)
datasets where 2D diffraction patterns are taken as a function of position. Some methods such as
phase contrast STEM have been used to image closely related materials such as metal-organic
frameworks but not polymers. With improvements in hardware and software, such methods may
soon be applied to polymers. Our goal is to provide a comprehensive understanding of the
strategies toward the high-resolution imaging of radiation sensitive polymer materials at different
length scales.

1. Introduction
The morphology of polymer materials depends on chemical structure of the monomer, the
presence of side-chains in the monomer and the nature of the bonds that connect the monomers.
Determining the location of the atoms that make up a polymer chain is important as they govern
the properties of polymer materials; however, we seldom have direct knowledge of their
location. The main purpose of this review is to summarize recent advances in the field of
electron microscopy that have the potential to significantly improve the resolution of images
obtained from polymer samples.
In conventional synthetic polymers, chain molecules exist in two states: crystalline and
amorphous. Homopolymers in the crystalline state adopt folded two-dimensional (2D) lamellar
crystals that are arranged in three-dimensional (3D) spherulites.1 In block copolymers
comprising two or more blocks of chemically distinct repeating units, the morphologies obtained
are more complex due to the additional factors related to thermodynamic interactions between
different monomers.2. Spontaneous microphase separation of the blocks results in the formation
of 2D and 3D nanostructures, such as lamellae, cylinders, gyroid and helices, on the 2 to 100
nanometer length scales.3-12 The chains in each of the microphases can be either crystalline or
amorphous. A fundamental challenge in polymer science is to design nanoarchitectures
assembled from polymers with precisely controlled structures and properties. Information of
chain conformations is therefore desired at the atomic length scale.
Ernst Ruska developed the first electron microscope (EM) which enabled both direct imaging
in position space and electron diffraction in reciprocal space.13 The resolution was unprecedented
as the wavelength of electron beams (typically 0.002 nm) is much shorter than X-rays (typically
0.15 nm). In a landmark study in 1938, Storks demonstrated that electron diffraction could be

used to characterize crystalline polymer materials.14 In 1950s, Keller and coworkers studied the
folded chain configurations and lattice structure of polyethylene (PE) single crystals using
transmission electron microscopy (TEM) imaging and diffraction.15-18 Since then, electron
diffraction has led to the determination of crystal structure of numerous other homopolymers
such as polyethylene oxide (PEO), and polypropylene (PP), and block copolymers such as
polyethylene oxide-b-polystyrene (PEO-b-PS).19-34
It is challenging to obtain structural information of polymers due to their limited stability
under electron beam radiation. Keller and coworkers realized the importance of radiation
damage, noting that the diffraction signatures of crystalline order in PE crystals disappeared as
the electron dose increased.21, 35 In 1971, Glaeser studied radiation damage in crystalline
biological materials.36 Included in this study were measurements of the intensities of the Bragg
reflections in the electron diffraction patterns that led to a quantitative understanding of the
relationship between radiation damage and spatial resolution. Since then, numerous papers have
been written on the subject of radiation damage in biological materials.37-38 The Glaeser method
has been also widely used to study radiation damage in polymer materials.26, 37, 39-45 The extent of
radiation damage in both crystalline and amorphous polymer, based on the work of Keller and
coworkers, was summarized by Grubb.46 A fraction of the incident beam of high energy electrons
is scattered as it interacts with the polymer specimen (which is usually thin for transmission
electron microscopy (TEM)). While the scattered electrons can be the result of inelastic or
elastic scattering events, the inelastic-to-elastic scattering ratio is governed by atomic number Z
(experimentally scales as 20/Z).47 In the polymer materials comprising light elements, the
scattered electrons are mainly inelastic and it is these electrons that are primarily responsible for
radiation damage; they induce plasmon excitation and subsequent ionization.47 Signatures of the

early stage of radiation damage, namely loss of diffraction patterns, give way to mass loss and
the appearance of bubbles due to beam-induced chemical reactions as the accumulated electron
dose increases. An example of such a reaction is formation of hydrogen gas in hydrocarbon
polymers. In order to prevent radiation damage in typical aliphatic polymers, the accumulated
electron dose deposited on the field of view, where an image is acquired, must be between 5 to
30 e/Å2.22-23, 48-51 Aromatic polymers show higher tolerance of electron dose relative to aliphatic
polymers due to the delocalization of electrons. 37, 52-54 In addition, the tolerance of radiation
damage of aromatic polymers can be increased by using a graphene supporting film 55 or adding
an antioxidant.45 More details about the dependence of radiation damage on temperature, dose
rate, acceleration voltage and the specificity of damage to different polymers can be found
elsewhere.56 Nevertheless, some form of beam damage must be endured if larger doses are used
in an attempt to increase signal-to-noise.
Electron diffraction has historically been the standard approach for studying the structure
of crystalline polymers. In the same field of view, scattered waves from a large number of unit
cells in that field interfere constructively to give strong diffraction patterns which can be
interpreted in terms of the underlying unit cell; staining is unnecessary. In contrast, the
microphase separated structures in most of block copolymers cannot be directly observed by
bright field TEM due to the lack of contrast in amorphous regions. Andrews and coworkers first
demonstrated the staining of a rubbery phase in a polymer using osmium tetroxide in 1964.57-58
This protocol was further developed by Kato to image the thin sections of acrylonitrile-
butadiene-styrene (ABS) resin where the amorphous unsaturated polybutadiene domains were
positively stained by osmium tetroxide.59-60 Other staining agents, such as ruthenium tetroxide,
iodine, and lead acetate, were used to stain the other targeted polymers. Ruthenium tetroxide has

been widely used to stain polymers that contain ether, alcohol, aromatic, and amine functional
groups.61 Iodine is used to stain the pyridine rings, through the formation of a pyridinium salt.62-63
Lead acetate can increase the electron density of ion-containing hydrophilic blocks after ion
exchange.64-65 Most synthetic crystalline polymers are, strictly speaking, semicrystalline. In
other words, the crystalline unit cells coexist with amorphous domains. These amorphous
domains can be selectively stained by osmium tetroxide and ruthenium tetroxide in polyolefins
and polyamides to reveal a more complete description of 2D and 3D morphologies.66-70 The
direct staining of the objects of interest is referred to as positive staining. Negative staining
agents such as uranyl acetate or uranyl formate are used to increase electron scattering from the
background around the objects of interest, thereby enhancing the signal-to-noise ratio of the
image. This method has been widely used to examine the morphology of self-assembled
structures in solution – the structures are deposited on a substrate, dried, and collapsed.71-72
Staining has become a standard protocol for TEM imaging of polymers. In addition to
increasing contrast between phases comprising light elements, staining agents, which invariably
contain heavy elements, reduce electron beam damage. However, the introduction of
compounds that are not in the material of interest and the processes by which they are introduced
can lead to the introduction of artifacts. Ruthenium tetroxide, for example, is often introduced
by placing polymers in the vicinity of aqueous solutions. Water vapor can swell domains that
are hydrophilic, e.g., poly(ethylene oxide). Care must be taken to ensure that the staining agent
does not aggregate in one part of the sample (e.g., the surface). If the local concentration of the
staining agent becomes high enough, it could diffuse into domains that are not the target of the
staining process.68, 73 Negative staining can produce artifacts such as aggregation, flattening and

stacking of structures.74-75 What is more important, however, is the loss of high-resolution
structural information and the absence of the natural state in the stained specimens.
The two major problems, radiation damage and low contrast, must be addressed when the
high-resolution images of polymers are desired. Cryogenic transmission electron microscopy
(cryo-TEM), which was initially developed by the structural biology community, is a powerful
tool to retrieve the high-resolution information of radiation sensitive materials.76-78 In this
approach, many (of order 105) images of the sample with low signal-to-noise ratio (SNR) are
obtained at liquid nitrogen temperatures to reduce beam damage. Sophisticated machine-
learning-based algorithms are used to align, filter, and average the images to obtain a high-
resolution image that represents the specimen in its natural state.79-80 More recently, the
resolution of cryo-TEM was significantly improved by the introduction of direct electron
detectors and novel image processing algorithms.81-82 The high detective quantum efficiency
(DQE) of direct electron detectors enables fast and automated image recording that give dose-
fractionated frames in a movie which allows for the correction of beam-induced movement of
monomers (and atoms) in the specimen.83 The nature of the image contrast in a bright field TEM
micrograph can be described by the “weak-phase object” approximation when a thin specimen
comprising soft materials is imaged. In this approximation, the relationship between the electron
density contrast in a specimen and the image is described by a linear transfer function. The
contrast transfer function (CTF) is introduced to relate the electron density variation in the
specimen to the image in Fourier space. This function depends on spatial frequency, s, as shown
in Eq 1.
CTF (s )=sin {2 π [Cs4 λ3 s4
−∆ Z2 λ s2]+φ} (Eq 1)

The first term in the square brackets accounts for spherical aberration of the microscope
and Cs is an instrument-related constant, while the second term accounts for defocus and ∆ Z
represents the defocus value. λ is the wavelength of incident electrons. The last term φ
represents the additional phase shift induced by phase plate. More details can be found in
Chapter 3 and 4 in ref 47 and ref 84. When a micrograph is obtained using cryo-TEM without
aberration correction, an appropriate amount of defocus, ∆ Z , is applied to increase contrast and
change the CTF to retrieve phase information.84-85 Images of nanotubes, nanoparticles and
vesicles can be misinterpreted due to the presence of Fresnel fringes that arise due to the applied
defocus.86 However, low spatial frequency signals can be recovered without applying defocus. A
phase plate can be introduced at back focal plane of the objective lens to introduce a phase shift,
φ ,, ideally a π/2 phase shift, between the incident and scattered electrons. Either a Zernike phase
plate or a Volta phase plate can be used.87 Zernike phase plate has been used to observe the
unstained polystyrene-b-polyisoprene block copolymer samples. The image obtained from the
unstained sample exhibited similar resolution as that obtained from the OsO4 stained sample.88
The Volta phase plate operates due to beam-induced electrostatic charging of the surface of a
continuous thin carbon film at high temperature (about 200oC). It boosted phase contrast in
images of biological materials and carbon nanotubes.89-94 By improving contrast and SNR, these
approaches have the potential to improve our interpretation of structures in polymer materials
which, like biological systems, are radiation-sensitive weak phase objects. A laser phase plate for
in-focus phase contrast TEM, where the phase shift is controlled by a high-intensity continuous-
wave laser beam, has been demonstrated to successfully provide a more stable and tunable phase
shift by eliminating electrostatic charging and unwanted electron scattering.95-96

2D projections of a thin polymer specimen sometimes don’t contain enough information
to determine the 3D structure unambiguously. For example, considerable effort was necessary
determine the 3D structure of the gyroid phase in block copolymers from 2D projections that
often resembled “wagon-wheels”.11-12, 97-98 Cylinders oriented in the plane of the specimen are
difficult to distinguish from lamellae with normals oriented in the specimen plane. 99
There are three established approaches for 3D reconstruction:109
(1) The first method is electron tomography (ET). 2-D projections of the titled specimen
are acquired at different tilt angles. The projections are aligned to a reference projection using
fiducial markers or patches in the images that contain trackable features. Fourier transforms of
projections are aligned to a central transform and the composite 3D Fourier transform is back
projected to position space to obtain a 3D reconstruction of the specimen.100 Different algorithms
have been developed for the 3D tomographic reconstruction including weighted back projection,
algebraic reconstruction, and iterative reconstruction.101 ET has been used to characterize
microphase separation under different imaging modes such as cryogenic electron tomography
(Cryo-ET) and STEM electron tomography (STEM-ET). These approaches have been
summarized by Jinnai et al.,102 Nudelman and Patterson et al.,103-104 , Bals et al.105, Midgley and
Weyland.106
(2) The second method is electron crystallography when atomic resolution imaging of a
thin crystalline specimen is desired. It was developed initially by Henderson and Unwin,107 to
reconstruct the 3D structure of vitrified crystalline protein membranes by cryo-TEM, based on
the DeRosier and Klug’s principle.108 The method comprises either aligning the Bragg
reflections in electron diffraction patterns or images obtained from tilted specimens. More details

can be found in ref 47. This method has enabled atomic resolution of protein crystals and helices
in microtubules.109-111
(3) The third method is single particle analysis (SPA). Multiple 2D projections are
acquired from vitrified specimens comprising identical objects with random orientations (e.g.
virus or proteins in vitreous ice). The location of each object in images is first identified. Then
small segments of the image that contain one object are sorted into different classes according to
the orientations of object and averaged using sophisticated algorithms.112-113 The averaged images
in each class are then back projected onto a 3D electron density map for further refinement of
structure. Single particle analysis has been used to characterize polymer materials. The analysis
has enabled identifying the heterogeneity in specimens (different classes), and resolving
structures from the nanometer to Angstrom length scales, using 2-D projections79-80, 114-116 and 3D
reconstructions.117-119
It should be obvious that applying modern electron microscopy imaging techniques with
the goal of obtaining atomic scale images requires working with unstained samples. In this
review, we focus on the recent progress on structures formed by unstained polymers on different
length-scales. The characteristics of the specific systems covered in this review are listed in
Table 1, and sorted by resolution. The first two columns show the materials and the structures
formed by these materials. This is followed by a listing of imaging and processing methods,
imaging conditions, and resolution for each material. Table 1 also shows structural information
retrieved from processed or reconstructed images.
We use the materials in Table 1 to answer three questions: (1) How can we accurately
resolve the structures in the unstained polymers? (2) What information can we obtain from the
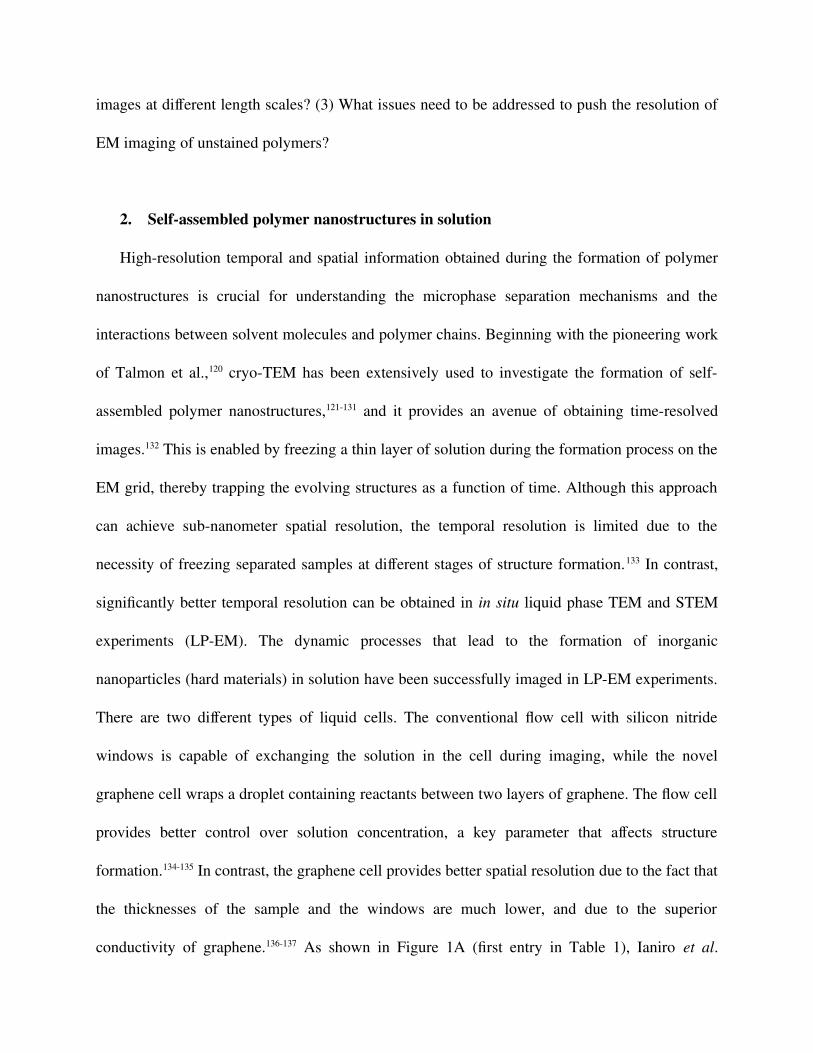
images at different length scales? (3) What issues need to be addressed to push the resolution of
EM imaging of unstained polymers?
2. Self-assembled polymer nanostructures in solution
High-resolution temporal and spatial information obtained during the formation of polymer
nanostructures is crucial for understanding the microphase separation mechanisms and the
interactions between solvent molecules and polymer chains. Beginning with the pioneering work
of Talmon et al.,120 cryo-TEM has been extensively used to investigate the formation of self-
assembled polymer nanostructures,121-131 and it provides an avenue of obtaining time-resolved
images.132 This is enabled by freezing a thin layer of solution during the formation process on the
EM grid, thereby trapping the evolving structures as a function of time. Although this approach
can achieve sub-nanometer spatial resolution, the temporal resolution is limited due to the
necessity of freezing separated samples at different stages of structure formation.133 In contrast,
significantly better temporal resolution can be obtained in in situ liquid phase TEM and STEM
experiments (LP-EM). The dynamic processes that lead to the formation of inorganic
nanoparticles (hard materials) in solution have been successfully imaged in LP-EM experiments.
There are two different types of liquid cells. The conventional flow cell with silicon nitride
windows is capable of exchanging the solution in the cell during imaging, while the novel
graphene cell wraps a droplet containing reactants between two layers of graphene. The flow cell
provides better control over solution concentration, a key parameter that affects structure
formation.134-135 In contrast, the graphene cell provides better spatial resolution due to the fact that
the thicknesses of the sample and the windows are much lower, and due to the superior
conductivity of graphene.136-137 As shown in Figure 1A (first entry in Table 1), Ianiro et al.
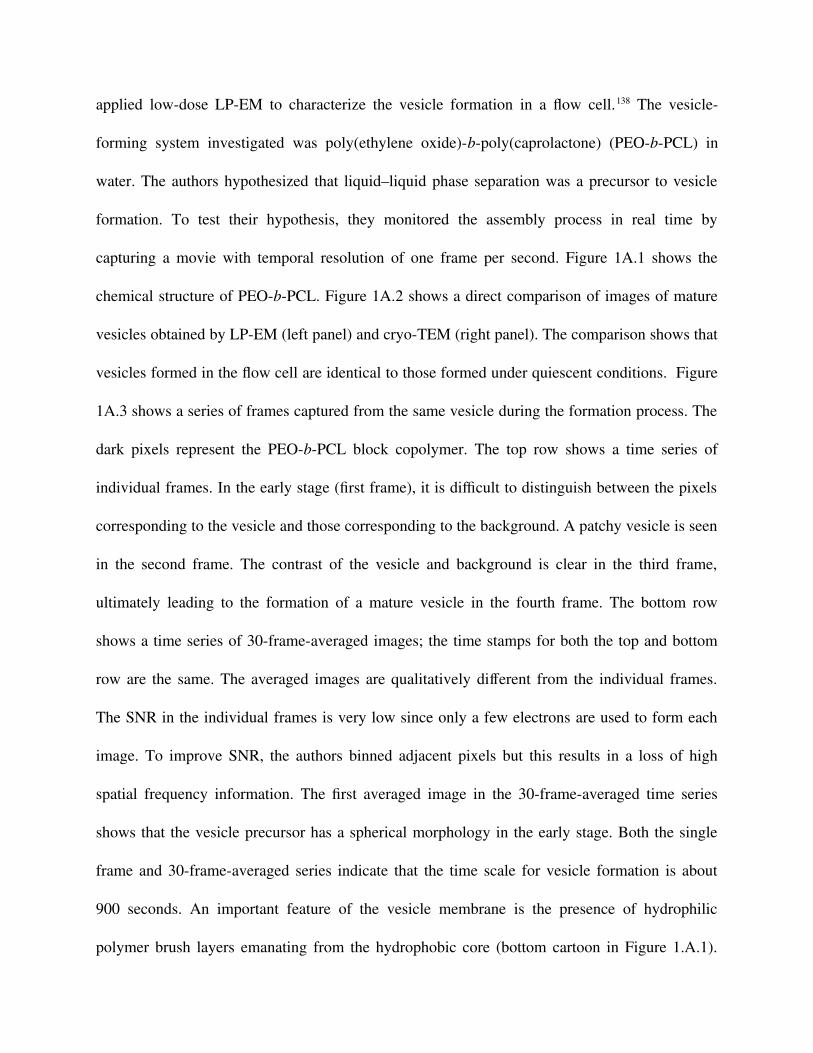
applied low-dose LP-EM to characterize the vesicle formation in a flow cell.138 The vesicle-
forming system investigated was poly(ethylene oxide)-b-poly(caprolactone) (PEO-b-PCL) in
water. The authors hypothesized that liquid–liquid phase separation was a precursor to vesicle
formation. To test their hypothesis, they monitored the assembly process in real time by
capturing a movie with temporal resolution of one frame per second. Figure 1A.1 shows the
chemical structure of PEO-b-PCL. Figure 1A.2 shows a direct comparison of images of mature
vesicles obtained by LP-EM (left panel) and cryo-TEM (right panel). The comparison shows that
vesicles formed in the flow cell are identical to those formed under quiescent conditions. Figure
1A.3 shows a series of frames captured from the same vesicle during the formation process. The
dark pixels represent the PEO-b-PCL block copolymer. The top row shows a time series of
individual frames. In the early stage (first frame), it is difficult to distinguish between the pixels
corresponding to the vesicle and those corresponding to the background. A patchy vesicle is seen
in the second frame. The contrast of the vesicle and background is clear in the third frame,
ultimately leading to the formation of a mature vesicle in the fourth frame. The bottom row
shows a time series of 30-frame-averaged images; the time stamps for both the top and bottom
row are the same. The averaged images are qualitatively different from the individual frames.
The SNR in the individual frames is very low since only a few electrons are used to form each
image. To improve SNR, the authors binned adjacent pixels but this results in a loss of high
spatial frequency information. The first averaged image in the 30-frame-averaged time series
shows that the vesicle precursor has a spherical morphology in the early stage. Both the single
frame and 30-frame-averaged series indicate that the time scale for vesicle formation is about
900 seconds. An important feature of the vesicle membrane is the presence of hydrophilic
polymer brush layers emanating from the hydrophobic core (bottom cartoon in Figure 1.A.1).

The resolution (about 140 Å) in this study is not sufficient to resolve this feature. Nevertheless,
the dynamic process involved in vesicle formation were effectively captured by averaged low-
dose in situ EM of unstained polymers with sufficiently high temporal and spatial resolution.
The structure of vesicles is relatively simple, when compared to other self-assembled
structures due to its spherical symmetry. Micelles are another common class of self-assembled
structures formed by amphiphilic block copolymers in solution.139-140 Structural inhomogeneity
and overlap of random orientations of micelles in solution hinder the accurate interpretation of
2D projections from cryo-TEM. In such cases, the 3D reconstructed tomograms obtained by
cryo-ET are of great importance. Zhang et al. studied the structure of micelles comprising
polymerized ionic liquids using cryo-TEM and cryo-ET as shown in Figure 1B (second entry in
Table 1).141 The poly(ionic liquids), which have a hydrophilic backbone with heterocyclic cations
and alkylbromide anions, are shown in the top row of Figure 1B.1. The alkyl chain length was
varied from C12 to C16. These polymers form micelles in water as shown in the bottom part of
Figure 1B.1. However, the alkyl backbones and charged side chains form separate microphases
within the micelle. 2D projections of the micelles obtained with different alkyl side chains are
shown in Figures 1B.2 to 4. The dark domains represent the electron dense hydrophilic portion
of the side chains which contain bromine (or iodine) atoms. The improved resolution (about 30
Å) relative to Figure 1A enables the distinction of hydrophilic and hydrophobic phases in
micelles. However, the overall shape of micelles cannot be discerned from the 2D projections,
especially in Figures 1B.2 and 1B.4. The slices from tomograms of micelles shown in Figures
1B.5 and 1B.6 reveal the overall “wasp-like” or “onion-like” shapes of the micelles, depending
on side-chain length. How the internal layers connect to the surface of the micelle can be seen in
Figure 1B.5; this cannot be determined from 2D projections.

Structures of crystalline polymers depend strongly on the processing conditions. Poly(3-
hexylthiophene), P3HT, is a widely studied semicrystalline polymer. The π−π stacking of the
conjugated backbone induces the crystallization of P3HT chains in solid films obtained by
solution processing using organic solvents. Energy filtered TEM has been successfully used to
image P3HT phases in unstained solid films relevant to devices.43, 142-143 It is, however, important
to characterize the state of P3HT crystals in solution. Wirix et al. used cryo-ET to study the
nature of crystalline P3HT ribbons in organic solvents (third entry in Table 1).144 The structure
and proposed packing scheme of P3HT molecules are shown in Figure 1C.1. It is noteworthy
that the solvents used in this work, toluene and 1,2-dichlorobenzene (oDCB), are toxic. The
standard process used to vitrify aqueous samples was modified and carried out in a fume hood to
enable these experiments. The cryo-TEM 2D projection and the 3D reconstructed tomogram of a
crystalline P3HT ribbon are shown in Figures 1C.2 and 3, respectively. The dark regions
represent the electron dense backbones. The spacing between two dark regions is 1.7 nm which
is the spacing between two backbones perpendicular to the plane of the ribbon. A slice from the
tomogram shown in Figure 1C.4 shows a cross-section of a ribbon. Surprisingly, the tomogram
contains straight and parallel lines representing the crystalline P3HT chains with curved and
disordered P3HT chains emanating from the crystalline core. The cartoon in Figure 1C.5 depicts
the ordered core and the disordered edges in a P3HT ribbon. Information about the disordered
regions of the ribbons can only be observed in solution wherein the natural state is preserved in
spite of high-resolution imaging; the resolution obtained in this study was 1.7 nm.
It should be clear that staining is not an option for any of the characterization studies covered
in Figure 1. The same holds true for all of the examples covered in this review.

3. Heterogeneity of self-assembled polymer structures in solution
Inferences of molecular conformations in self-assembled structures require accurate
determination of their shape and size. Cryo-TEM and cryo-ET imaging have been used to
determine membrane geometries of vesicles formed by phospholipids and block copolymers.145-
147 However, heterogeneities within the membrane must be resolved before anticipative analysis
of the molecular conformation is possible. This is accomplished by sorting and averaging local
structures.
Polypeptoids are bio-inspired polymers comprising repeating N-substituted glycine
monomer units. They are similar to polypeptides except for the fact that the side chain is
appended to the nitrogen atom rather than the α-carbon.148 Jiang et al. studied the membrane
structure of self-assembled vesicles formed by sequence-defined amphiphilic, poly-N-(2-
ethyl)hexylglycine-block-poly-N-phosphonomethylglycine (pNeh-b-pNpm) polypeptoid block
copolymers in water (fourth entry in Table 1).149 Figure 2A.1 shows the chemical structure of
pNeh-b-pNpm. The morphology of the vesicles was characterized by low-dose cryo-TEM with
contrast generated by defocus as shown in Figure 2A.2. Small boxes extracted from the vesicle
membrane micrographs were sorted and averaged to quantify membrane heterogeneity. The
algorithm used was a modified version of the algorithm used for single particle analysis
developed by the structural biology community. The difference between averaging performed on
this sample versus that described in Figure 1A is the use of sorting; the average in Figure 1A
corresponds to a simple juxtaposition of frames obtained from the same structure. The left panel
in Figure 2A.3 shows the spatial distribution of different classes superposed on the vesicle.
Averaged images in Figure 2A.3 show two classes (1a, 1b and 2) with different membrane
thicknesses in the right panel. The colors of box outlines, blue and aqua, indicate different
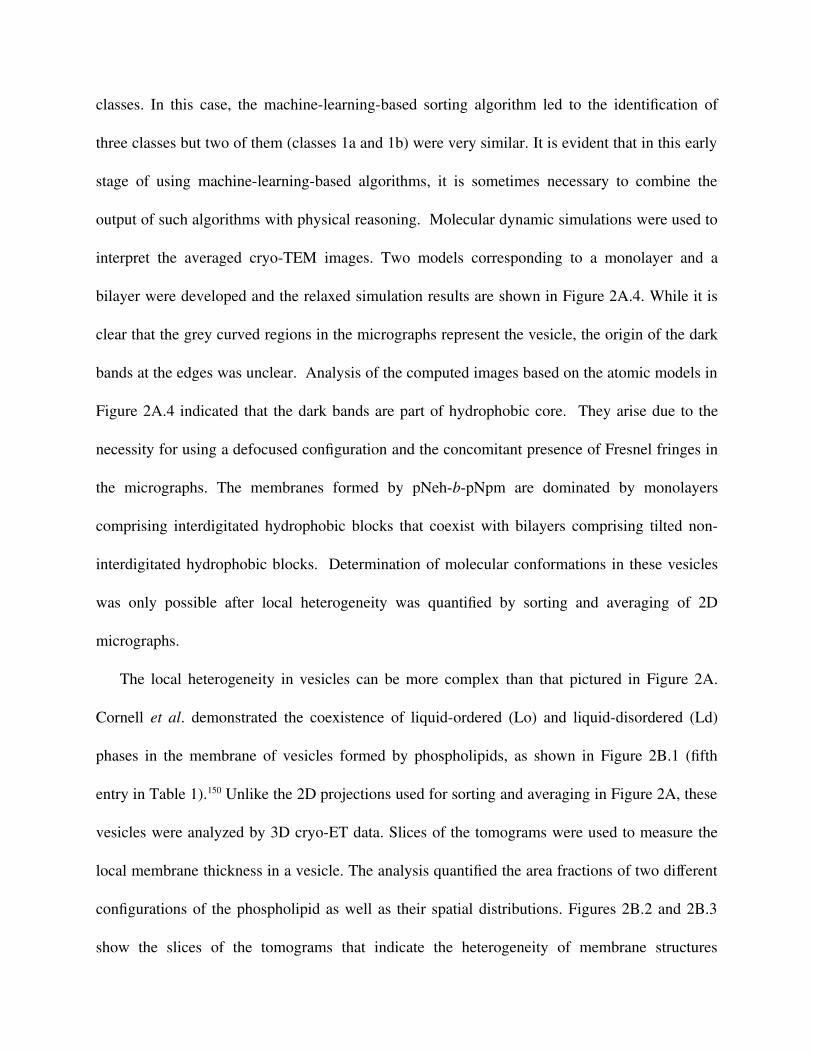
classes. In this case, the machine-learning-based sorting algorithm led to the identification of
three classes but two of them (classes 1a and 1b) were very similar. It is evident that in this early
stage of using machine-learning-based algorithms, it is sometimes necessary to combine the
output of such algorithms with physical reasoning. Molecular dynamic simulations were used to
interpret the averaged cryo-TEM images. Two models corresponding to a monolayer and a
bilayer were developed and the relaxed simulation results are shown in Figure 2A.4. While it is
clear that the grey curved regions in the micrographs represent the vesicle, the origin of the dark
bands at the edges was unclear. Analysis of the computed images based on the atomic models in
Figure 2A.4 indicated that the dark bands are part of hydrophobic core. They arise due to the
necessity for using a defocused configuration and the concomitant presence of Fresnel fringes in
the micrographs. The membranes formed by pNeh-b-pNpm are dominated by monolayers
comprising interdigitated hydrophobic blocks that coexist with bilayers comprising tilted non-
interdigitated hydrophobic blocks. Determination of molecular conformations in these vesicles
was only possible after local heterogeneity was quantified by sorting and averaging of 2D
micrographs.
The local heterogeneity in vesicles can be more complex than that pictured in Figure 2A.
Cornell et al. demonstrated the coexistence of liquid-ordered (Lo) and liquid-disordered (Ld)
phases in the membrane of vesicles formed by phospholipids, as shown in Figure 2B.1 (fifth
entry in Table 1).150 Unlike the 2D projections used for sorting and averaging in Figure 2A, these
vesicles were analyzed by 3D cryo-ET data. Slices of the tomograms were used to measure the
local membrane thickness in a vesicle. The analysis quantified the area fractions of two different
configurations of the phospholipid as well as their spatial distributions. Figures 2B.2 and 2B.3
show the slices of the tomograms that indicate the heterogeneity of membrane structures

consisting of Lo (red) and Ld (blue) phases in a single vesicle, respectively. The graphs
associated with these figures quantify the local variation of membrane thickness as a function of
position.
This local structural information about the arrangement of molecules in the membrane is
valuable for the investigation of membrane formation theories. Electron microscopy is ideally
suited for obtaining this information relative to other characterization methods.
Messmer et al. applied cryo-TEM and cryo-ET to elucidate the molecular conformations of
dendronized amphiphilic polymers (DPs) in micelles (sixth entry in Table 1).151 Figure 2C.1
shows the micelle structure obtained from molecular dynamics (MD) simulations. The micelle
comprises a thick hydrophilic shell formed by dendritic side chains and a thin hydrophobic spine
formed by the core of dendrimer. Figure 2C.2 shows a cryo-TEM image of micelles in vitreous
ice with inverted contrast. Projections of micelles selected for analysis in this particular image
are shown in red. A large number of images, similar to Figure 2C.2, were analyzed using the
single particle approach. The results of this analysis are shown in Figure 2C.3. Here we see 11
distinct classes with varying degrees of curvature. Messmer et al. also collected cryo-ET data
and used the single particle approach for data analysis. The classes obtained by cryo-ET shown
in Figure 2C.4 are indistinguishable from those obtained by cryo-TEM shown in Figure 2C.3.
The local curvature of one of the cryo-ET classes are shown on the expanded scale in Figure
2C.5. The curved backbones in the micelles seen by electron microscopy cannot be properly
explained by MD simulations. Acknowledging such discrepancies is an important first step for
improving our understanding of the inter-atomic interactions that govern nanostructure
formation; unfortunately, such discrepancies are rarely reported in literature.

4. Imaging crystalline soft materials at the atomic scale
High-resolution imaging at the atomic scale has the potential to reveal the geometry of
crystalline unit cells, polymorphs, and grain boundaries in semicrystalline polymers. It should be
evident that characterizing heterogeneity is essential for imaging on this length scale. TEM is
routinely used to image two classes of materials with atomic resolution: hard crystalline
materials such as metals by direct imaging and biological macromolecules such as proteins by
sorting and averaging. In this section, we will discuss the cryo-TEM imaging of crystalline
structures in two kinds of well-ordered synthetic soft materials: metal-organic frameworks and
polypeptoids.
Metal-organic frameworks (MOFs) are highly porous materials whose physical and chemical
properties can be tuned at the atomic level by engineering the coordination of metal ions and
organic linkers.152-153 The organic linkers found in MOFs are similar to those found in synthetic
polymers. MOFs have been used as polymerization catalysts and fillers in polymer
nanocomposites.154-155 In addition, novel hybrid materials have been obtained by covalently
bonding polymer chains to MOFs. 156-159
X-ray diffraction (XRD) and micro electron diffraction (Micro-ED) conducted on crystals
can be used to determine averaged crystal structure of MOF particles but the information about
the phase difference between scattered beams from the constituent atoms is lost.160-161 The
presence of organic linkers results in the radiation sensitivity and low-dose TEM imaging is
essential for preserving phase information. Patterson et al. studied the structure of neat MOF
crystals and MOF-protein complexes using in situ LP-EM and ex situ low-dose cryo-TEM. They
achieved a resolution of 13 Å using 5 e/Å2 per image in the cryo-TEM study.162-163 In a
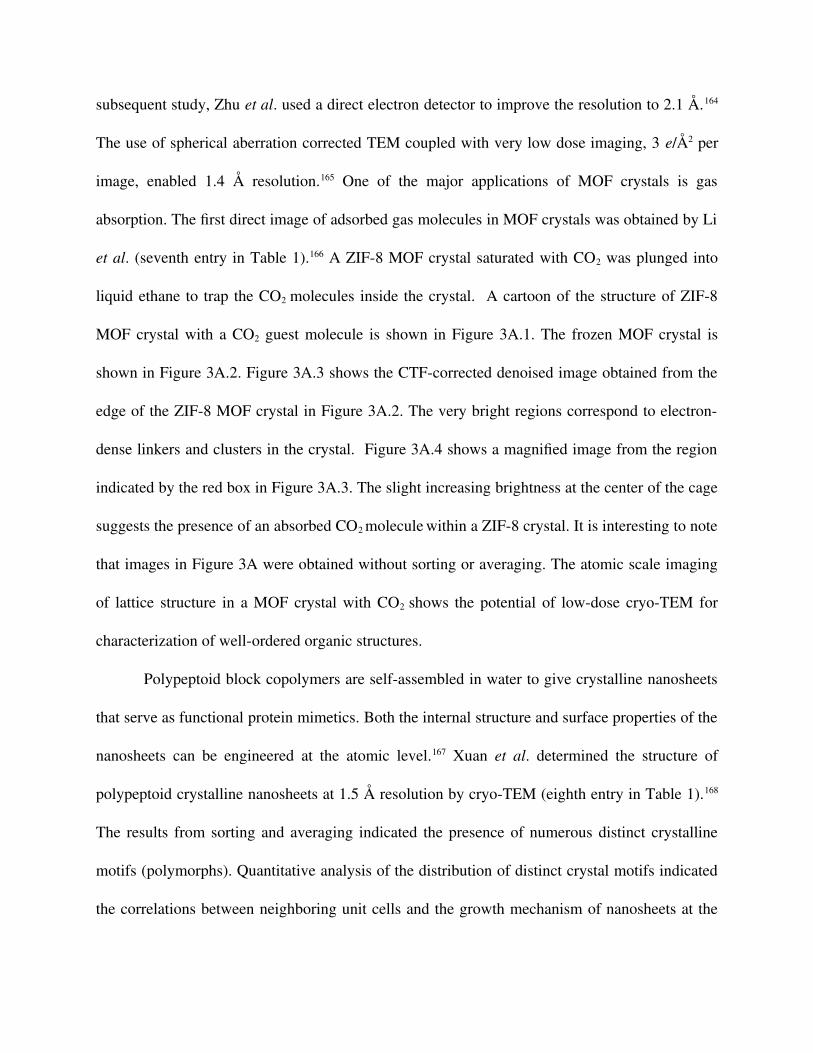
subsequent study, Zhu et al. used a direct electron detector to improve the resolution to 2.1 Å.164
The use of spherical aberration corrected TEM coupled with very low dose imaging, 3 e/Å2 per
image, enabled 1.4 Å resolution.165 One of the major applications of MOF crystals is gas
absorption. The first direct image of adsorbed gas molecules in MOF crystals was obtained by Li
et al. (seventh entry in Table 1).166 A ZIF-8 MOF crystal saturated with CO2 was plunged into
liquid ethane to trap the CO2 molecules inside the crystal. A cartoon of the structure of ZIF-8
MOF crystal with a CO2 guest molecule is shown in Figure 3A.1. The frozen MOF crystal is
shown in Figure 3A.2. Figure 3A.3 shows the CTF-corrected denoised image obtained from the
edge of the ZIF-8 MOF crystal in Figure 3A.2. The very bright regions correspond to electron-
dense linkers and clusters in the crystal. Figure 3A.4 shows a magnified image from the region
indicated by the red box in Figure 3A.3. The slight increasing brightness at the center of the cage
suggests the presence of an absorbed CO2 molecule within a ZIF-8 crystal. It is interesting to note
that images in Figure 3A were obtained without sorting or averaging. The atomic scale imaging
of lattice structure in a MOF crystal with CO2 shows the potential of low-dose cryo-TEM for
characterization of well-ordered organic structures.
Polypeptoid block copolymers are self-assembled in water to give crystalline nanosheets
that serve as functional protein mimetics. Both the internal structure and surface properties of the
nanosheets can be engineered at the atomic level.167 Xuan et al. determined the structure of
polypeptoid crystalline nanosheets at 1.5 Å resolution by cryo-TEM (eighth entry in Table 1).168
The results from sorting and averaging indicated the presence of numerous distinct crystalline
motifs (polymorphs). Quantitative analysis of the distribution of distinct crystal motifs indicated
the correlations between neighboring unit cells and the growth mechanism of nanosheets at the

atomic level.169-170 Other studies on semicrystalline polymers such as poly(paraxylylene)25 and
syndiotactic polystyrene,171 have also suggested the presence of structural heterogeneity.
When the crystal is homogenous, averaging the identical crystal motifs significantly
increases resolution. Figure 3B.1 shows the chemical structure of a amphiphilic polypeptoid
with the hydrophilic poly(N-2-(2-(2-methoxyethoxy)ethoxy)ethylglycine) block and N-2-
phenylethylglycine hydrophobic block with bromine atoms at the para position of phenyl rings
(pNte-b-pNBrpe). The averaged cryo-TEM image of the crystalline nanosheets is shown in
Figure 3B.2. Figure 3B.3 shows an MD simulation of a pNBrpe crystal. The peptoid chain
backbones are orthogonal to the a-c plane shown in the Figure 3B.3. The correspondence
between the averaged image and MD simulations is striking. The brightest feature in Figure 3B.2
represents the glycine backbone, while the two arms emanating the backbone represent the
phenyl side chains. Each phenyl chain terminates in a grey spherical dot that represents the
bromine atom. The Fourier transform of the image in Figure 3B.2, shown in Figure 3B.4,
indicates resolution at 1.5 Å. This study shows the application of cryo-TEM and averaging
method in the characterization of polymer crystals. The atomic details seen in Figure 3B.2 cannot
be access by conventional scattering and imaging techniques.
5. Additional information-rich high-resolution imaging techniques
In the field of material science, STEM plays an important role in structure and property
characterization. In contrast to the parallel beam used in TEM, a convergent beam is used to scan
over the specimen and the transmitted electrons scattered at defined angles are recorded by
annular detectors.172 The contrast in the image obtained by conventional (high-angle) annular
dark field STEM, (HA)ADF-STEM, is proportional to the square of the atomic number Z in a

thin specimen. HAADF-STEM and ADF-STEM are thus ideally suited for studying thin films of
metal and semiconductors. There are, however, a few examples where these techniques have
been used to study polymer thin films.88, 173-181 The presence of light elements in these systems
complicates the interpretation of scattering signals.
As compared to conventional STEM, TEM with direct electron detectors is more dose-
efficient for phase contrast imaging, and polymers are extremely beam sensitive.182 A recent
breakthrough in the field of STEM imaging of polymers was enabled by the development of
ultra-fast direct electron detectors and new algorithms for analyzing data. This approach is called
four-dimensional STEM (4DSTEM). It uses a focused electron beam that is rastered across the
sample and a diffraction pattern is acquired at each scan position. The dataset thus acquired
contains a large number of individual convergent beam electron diffraction (CBED) patterns.
This dataset provides comprehensive information regarding structure,183 orientation,184 localized
lattice strain,185 and other material properties.186 4DSTEM has been used to visualize the
crystalline orientation in semicrystalline polymers187-188 and peptide nanocrystals.189 In addition to
the amplitude information of the structure factor in the diffraction pattern, the phase information
can be retrieved by reconstructing the information in CBED patterns by using integrated
differential phase contrast (iDPC) and ptychography methods.190,191
Panova et al. studied the arrangement of organic semiconductor molecules (short polymer
chain) using low-dose cryogenic 4DSTEM (ninth entry in Table 1).188 The study covered
reciprocal space up to 3.7 Å using 100 Å steps in position space. The chemical structure of the
molecule, poly[2,5-bis(3-tetradecylthiophen-2-yl) thieno[3,2-b]thiophene] (PBTTT), is shown
in Figure 4A.1. Thin films of this polymer were studied, as-cast and after annealing. By
identifying the diffraction spots in the CBED disk, the orientations of polymer backbones were

determined at each real space probe location. Figure 4A.2 shows the orientation maps of the as-
cast (left panel) and annealed (right panel) PBTTT thin films. The colors represent different
orientations as defined by the inset color ring. Figure 4A.3 shows the backbone orientation maps
of the as-cast (left panel) and annealed (right panel) PBTTT thin films, respectively. It is evident
that grains with long-range order appear only after annealing. This study shows how structure–
property relationships can be visualized in unstained polymers by exploiting techniques that were
originally developed for hard materials.
An iDPC-STEM image is reconstructed by measuring the momentum changes of the
electrons recorded on a segmented or a pixelated detector. The image contrast is proportional to
the atomic number Z in a thin specimen.192,193 While iDPC-STEM is often used to study dose-
tolerant hard materials, recent advances have enabled visualizing light elements such as
hydrogen and lithium atoms in crystalline solids.193,194 This feature of iDPC-STEM could benefit
the characterization of morphologies and structures in unstained polymers over a large range of
length scales. More recently, Inamoto et al. demonstrated iDPC imaging of phase-separated
structures in a poly (3-hexylthiophene) (P3HT) and [6,6]-phenyl-C61-butyric acid methyl ester
(PCBM) blend without staining.195 iDPC imaging increases the contrast between different
components in the blend relative to conventional STEM. They also showed the iDPC-STEM
tomography reconstruction of unstained acrylonitrile-butadiene-styrene (ABS) copolymer
blended with an inorganic filler. The spatial distribution of the filler was visualized at the
micrometer scale.196
Shen et al. determined the structure of a MIL-101 MOF crystal using low-dose spherical
aberration corrected iDPC-STEM imaging at room temperature with accumulated dose up to 40
e/Å2 (tenth entry in Table 1).197 Figure 4B.1 shows the chemical structure of a MIL-101 MOF

crystal which contains Cr clusters and organic linkers. Figure 4B.2 shows an iDPC-STEM image
of a MIL-101 MOF crystal. The bright regions represent the electron dense linkers and metal
clusters. The corresponding Fourier transform of this image is shown in Figure 4B.3, where the
reflections at 1.8 Å are clearly observed. The magnified high-resolution image obtained by
averaging 30 iDPC-STEM images is show in the top panel in Figure 4B.4. The red and blue
circles indicate the presence of two types of cages with 29 and 34 Å sizes. This is in good
agreement with the atomic model shown in the bottom panel of Figure 4B.4. The direct
visualization of local structures allows for better understanding of the node-linker coordination
and the structure-property relations in MOFs. The local structures, including the surfaces,
interfaces and defects in MOF crystals, were also revealed by low-dose HRTEM and low-dose
STEM imaging. Li et al. studied MIL-101 MOF crystals using both low-dose iDPC-STEM and
low-dose HRTEM.198 As compared with the HRTEM image, the iDPC-STEM image exhibited
slightly lower resolution but stronger contrast. The ability to image organic linkers in MOFs
suggests the possibility of using iDPC-STEM to image polymers that only contain light
elements.
Machine-learning, which was used in several studies that were discussed above, will
undoubtedly play an increasingly significant role in electron microscopy. Modern direct electron
detectors and imaging techniques generate large data sets such as dose-fractionation movies,
tomograms, and diffraction pattern stacks. In the past, these data sets were analyzed using
reference-free machine-learning algorithms. However, machine-learning-based methods,
wherein algorithms are trained using large data sets are becoming increasingly popular. These
methods use artificial neural networks for processing images in both position and reciprocal
space. They have been used to track the symmetry and atomic positions in 2D systems such as

graphene and quantum materials,199-200 increase signal-to-noise ratio,201 identify the location of
protein molecules in vitrified suspensions,202 determine molecular conformations from discrete
images,203 segregate tomogram into separate phases,204-205 and to quantify the shape and size of
nanoparticles in a polymer composite.206 The application of machine-learning-based image
analysis is still rare in polymer science. One reason is the lack of databases that contain prior
knowledge of structures formed by specific or similar polymers. Another reason is the presence
of intrinsic heterogeneity in the structures formed by synthetic polymers on the atomic and
nanometer length scales. Establishing appropriate databases will provide a foundation for
utilizing the recent advances in high-resolution electron microscopy for characterization of
synthetic polymers.
6. Conclusion
Electron microscopy is a powerful and versatile tool for the characterization of polymer
nanostructures. Recent advances in hardware and software have enabled high-resolution imaging
of unstained polymers. Low-dose imaging preserves the natural state of the specimen, but sorting
and averaging independent images is essential for high-resolution. Based on the analysis of
structural information in 2D projections, 3D tomograms and 4DSTEM datasets, structures
formed by microphase separation or crystallization can be characterized at the nanoscale and, in
some cases, at the atomic-scale. Time-resolved imaging can reveal the dynamics of complex
processes such as vesicle formation. High spatial resolution imaging of local structures can
reveal molecular conformations of amphiphilic block copolymers in self-assembled
nanostructures including micelles. Atomic-scale imaging of polypeptoid and MOF crystals may
open the door to atomically defined 2D and 3D nanostructures.

This review begins with a description of TEM results. We first present images obtained by
simple averaging of low-dose 2D images of a block copolymer vesicle, resulting in images
resolved at 140 Å (system 1). This is followed by a more sophisticated averaging of micelles
formed by polymerized ionic liquids in water based on 3D tomograms, demonstrating improved
resolution of 30 Å (system 2). Higher resolution (1.7 Å) was obtained in a solution of P3HT
chains, wherein the crystalline core of nanowires was distinguished from amorphous structures
on the fringes (systems 3). Heterogeneity on the 10 Å length scale within individual vesicles
was studied in both diblock copolymers and lipid vesicles using sorting and averaging (systems 4
and 5). Micelles formed by dendronized polymers also exhibited heterogeneity, and a similar
approach led to images of individual classes (system 6). Direct imaging of a MOF crystal under
low-dose conditions enabled approaching the atomic-scale (system 7) in spite of the presence of
organic linkers due to the presence of excellent long-range order. In contrast, sorting and
averaging algorithms were necessary to obtain 1.5 Å resolution of a polypeptoid crystal (system
8). The review ends with a discussion of results obtained by STEM imaging techniques. We
discuss the emerging technique of 4DSTEM, where images of a conjugated polymer (system 9)
are created by collecting 2D diffraction data as a function of position (in 2D space). This is
followed by the image of a MOF crystal obtained by iDPC-STEM (system 10), a technique that
has not yet been applied to the high-resolution imaging of polymers.
New developments in related fields have the potential to further improve high-resolution
imaging of unstained polymers. For example, Volta phase plates207 and ultra-stable supporting
grids208 have not yet been used for imaging polymers. Ultra-fast tomography wherein projections
are obtained on a direct electron detector while the sample is continuously tilted can reduce beam
damage.209-210 Low-dose 4DSTEM has the potential to directly image the nanoscale morphology

of polymer systems with atomic resolution. All these approaches will benefit from recently
developed high speed pixelated direct electron detectors.211
Conflicts of interest:
The authors declare no competing financial interest.
Acknowledgements:
Funding for this work was provided by the Soft Matter Electron Microscopy Program
(KC11BN), supported by the Office of Science, Office of Basic Energy Science, US Department
of Energy, under Contract DE-AC02-05CH11231. Work at the Molecular Foundry was
supported by the Office of Science, Office of Basic Energy Sciences, of the U.S. Department of
Energy under Contract No. DE-AC02-05CH11231. We gratefully acknowledge the help
provided from many discussions with Dr. Robert M. Glaeser and Dr. Bong-Gyoon Han at the
Lawrence Berkeley National Laboratory.

Table 1. Summary of examples with microphase separated or crystalline structuresMaterials Morphology Post-processing Imaging
methodContrast Accumulative
electron dose(e Å-2)
Resolution(Å)
Retrievedinformation
Figures
(1) Diblock copolymer Vesicle Simple averaging In-situ liquidcell TEM
Phase 0.006 e Å-2 perimage
140 Dynamicmorphological changes
Figure 1A,ref 138
(2) Poly(ionic liquid) Micelle Tomographic 3Dreconstruction
Cryo-ET Phase 100 e Å-2 for tiltseries
30 Morphological changesand chain
conformation
Figure 1B,ref 141
(3) Conjugatedpolymer P3HT
Crystallinenanowire
Tomographic 3Dreconstruction
Cryo-ET Phase 2000 e Å-2 for tiltseries2
17 Ordered anddisordered regions in
nanowire
Figure 1C,ref 144
(4) Diblockcopolypeptoid
Vesicle Sorting and averaging Cryo-TEM CTF corrected phase 30 e Å-2 per image 10 Membrane structure,chain conformationand inhomogeneity
Figure 2A,ref 149
(5) Lipid Vesicle Tomographic 3Dreconstruction
and sorting
Cryo-TEM CTF corrected phase 74-100 e Å-2 fortilt series
10 Membrane structure,chain conformationand inhomogeneity
Figure 2B,ref 150
(6) Dendronizedpolymers
Micelle Single particle 3Dreconstruction
Cryo-ET CTF corrected phase 180 e Å-2 for tiltseries
10 Backboneconformation
Figure 2C,ref 151
(7) MOF, ZIF-8 3D crystal Direct imaging Cryo-TEM CTF corrected phase 6.8 e Å-2 perimage
1.8 Lattice structure Figure 3A,ref 166
(8) Polypeptoid blockcopolymer
Crystallinenanosheet
Averaging Cryo-TEM CTF corrected phase 20 e Å-2 per image 1.5 Latticestructure ,backbone
and side chain packing
Figure 3B,ref 168
(9) Conjugatedpolymer PBTTT
Microphaseseparation
Reconstructed diffractions Cryo 4D-STEM Diffraction 100 e Å-2 perdiffraction
3.7 Orientation of crystals,the degree of
crystallinity and grainboundary
Figure 4A,ref 188
(10) MOF, MIL-101 3D crystal Averaging iDPC-STEM Reconstructed phase 1 40 e Å-2 per image 1.8 Lattice structure Figure 4B,ref 197
1. The phase is reconstructed based on the method reported in ref 193.2. Aromatic molecules are less radiation sensitive than aliphatic molecules. Detailed discussion can be found in ref 37 and ref 52.

Figure 1. A. (1) The chemical structure of PEO-b-PCL and a schematic of the vesicle structure.
(2) A comparison of a mature vesicle imaged by LP-EM (left) and cryo-TEM (right). (3) A
comparison of an individual frame time series (top row) with a 30-frame-averaged time series
(bottom row). Reproduced from ref 138 with permission. Copyright 2019 Springer Nature. B. (1)
The chemical structures of the poly(ionic liquids) and a schematic of micelles comprising a
microphase separated lamellar structure. Cryo-TEM images of micelles formed by poly(ionic
liquids) with different alkyl side chains: (2) poly(TILM-C12I), (3) poly(TILM-C14Br), (4)
poly(TILM-C16Br). Central tomographic slices along the x-y plane of the tomograms of (5)

poly(TILM-C12Br) and (6) poly(TILM-C16Br) micelles. 3D visualizations are shown in the
right panels. Reproduced from ref 141 with permission. Copyright 2016 American Chemical
Society. C. (1) Model of molecule arrangement within a P3HT nanowire. The yellow bars
represent polymer backbone. (2) Cryo-TEM image of a P3HT nanowire vitrified in oDCB. Dark
spheres are colloid gold nanoparticles used for the purpose of alignment. (3) The 3D visualized
tomogram of the nanowire in 2. (4) Slice shows the x-z direction in the tomogram of the
nanowire in 2. (5) A schematic depicts the ordered core and the disordered edges in 4.
Reproduced from ref 144 with permission. Copyright 2014 American Chemical Society.
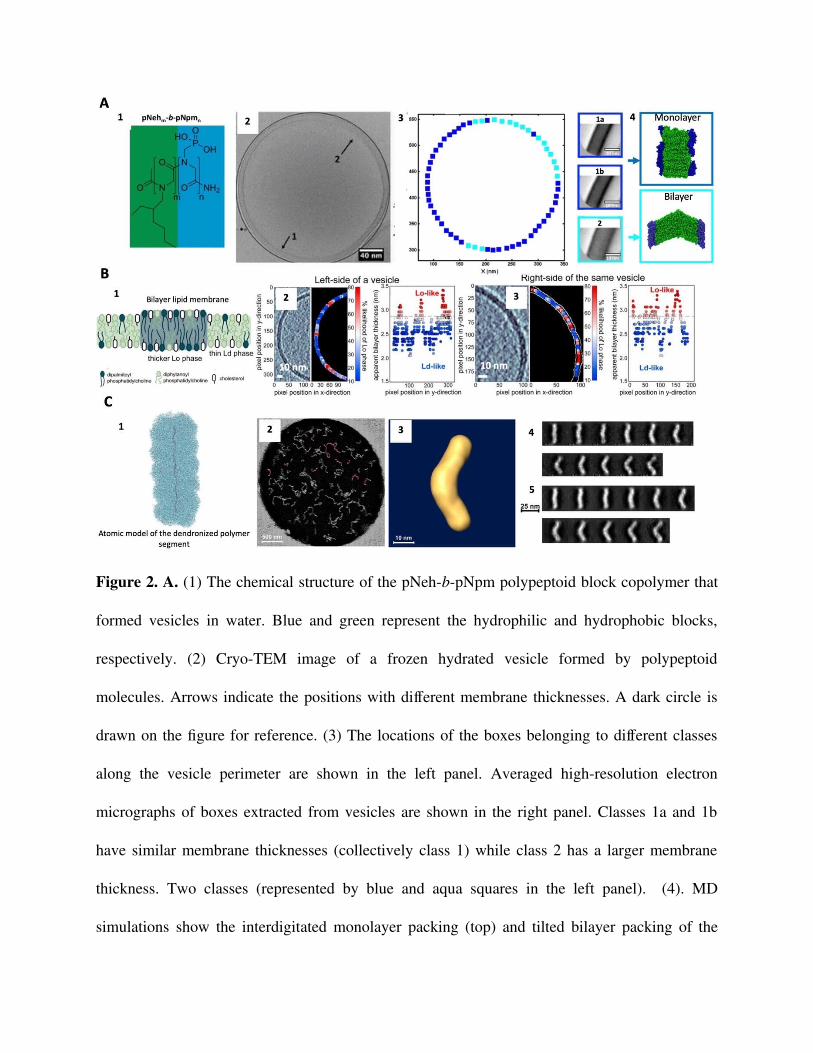
Figure 2. A. (1) The chemical structure of the pNeh-b-pNpm polypeptoid block copolymer that
formed vesicles in water. Blue and green represent the hydrophilic and hydrophobic blocks,
respectively. (2) Cryo-TEM image of a frozen hydrated vesicle formed by polypeptoid
molecules. Arrows indicate the positions with different membrane thicknesses. A dark circle is
drawn on the figure for reference. (3) The locations of the boxes belonging to different classes
along the vesicle perimeter are shown in the left panel. Averaged high-resolution electron
micrographs of boxes extracted from vesicles are shown in the right panel. Classes 1a and 1b
have similar membrane thicknesses (collectively class 1) while class 2 has a larger membrane
thickness. Two classes (represented by blue and aqua squares in the left panel). (4). MD
simulations show the interdigitated monolayer packing (top) and tilted bilayer packing of the

pNeh-b-pNpm molecules in the membrane (bottom). The blue boxes in (3) represent the
monolayer while the aqua boxes in (3) represent the bilayer. Reproduced from ref 149 with
permission. Copyright 2018 American Chemical Society. B. (1). A schematic of a lipid
membrane with coexisting liquid-ordered (Lo) and liquid-disordered (Ld) phases. The Lo phase
is thicker than the Ld phase. Locations of Lo and Ld phases in the membrane of a vesicle are
identified by analyzing the tomogram slices in the left panel in (2) Colors represent the
likelihood (from 0 to 100%) that each location corresponds to the thicker, Lo, phase instead of
the thinner, Ld, phase. A horizontal dashed line in the right panel shows the apparent bilayer
thickness for which there is a 50% likelihood of being in the Lo phase. The analysis on the right
side of the same vesicle is shown in (3) Reproduced from ref 150 with permission. Copyright
2020 National Academy of Sciences. C. (1) The structure of a micelle comprising short
dendronized polymers (DPs) obtained from MD simulations. (2) Cryo-TEM image of micelles in
vitrified 1,4-dioxane (inverted contrast). Micelles used for 3D reconstruction shown in red. (3)
The 3D morphology of a segment of a micelle reconstructed from 896 different segments of the
micelles colored in red in (2). The segments in this example correspond to boxes in (1).
Averaged images of different classes of the micelle segment shown in (3) representing different
viewing angles by 2D cryo-TEM (4) and projection of 3D cryo-ET (5). Reproduced from ref 151
with permission. Copyright 2019 American Chemical Society.

Figure 3. A. (1) Simulated structure of a ZIF-8 MOF crystal with DFT-predicted binding site of
CO2 (simplified as a red sphere) along the [111] projection. (2) Cryo-TEM image of a CO 2-filled
ZIF-8 MOF crystal (outlined by white dashed lines) along the [111] projection. (3) CTF-
corrected image of the red boxed region from (2). Bright regions correspond to electron dense
metal clusters and organic linkers. (4) Magnified image of a single unit cell from (3). The grey
region at the center of the unit cell (indicated by red arrow) corresponds to an adsorbed CO2
molecule. Reproduced from ref 166 with permission. Copyright 2019. Elsevier Inc. B. (1) The
chemical structure of a polypeptoid diblock copolymer (pNeh-b-pNBrpe) with Br atoms. (2)
Averaged cryo-TEM image of nanosheets formed by pNeh-b-pNBrpe in water. The Br atoms are
are seen as grey dots at the end of the side chains; the brightest regions represent the glycine
backbone. (3) Top view of the simulated nanosheet in water. A portion of the simulation box is
superposed on the the cryo-TEM image shown in (2). (4) A Fourier transform of the image in

(2). Reflections are visible up to 1.5 Å (top row). Reproduced from ref 168 with permission.
Copyright 2019. National Academy of Sciences of the United States of America.
Figure 4. A. (1). The chemical structure of a PBTTT molecule. (2). Reconstruction maps show
the orientation of crystals in the as-cast (left) and annealed (right) PBTTT thin films,
respectively. (3). Reconstruction maps show the flowline of backbones in the as-cast (left) and
annealed (right) PBTTT thin films, respectively. Reproduced from ref 188 with permission.
Copyright 2019 Springer Nature. B. (1) The framework model of a MIL-101 MOF crystal. (2)
An iDPC-STEM image of a MIL-101 MOF crystal. (3) The corresponding Fourier transform of
the image shown in (2) with reflections up to 1.8 Å. (4) The averaged iDPC-STEM image of a
MIL-101 MOF crystal. (top) and the atomic model (bottom). The red and blue circles indicate

two types of cages with 29 and 34 Å sizes, respectively. Reproduced from ref 197 with
permission. Copyright 2020 Springer Nature.
References:
1. Wunderlich, B., Macromolecular Physics. Rensselaer Polytechnic Institute, Troy, New York: 1976.2. Leibler, L., Theory of Microphase Separation in Block Copolymers. Macromolecules 1980, 13, 1602-1617.3. Feng, X. Y.; Burke, C. J.; Zhuo, M. J.; Guo, H.; Yang, K. Q.; Reddy, A.; Prasad, I.; Ho, R. M.; Avgeropoulos, A.; Grason, G. M.; Thomas, E. L., Seeing mesoatomic distortions in soft-matter crystals of a double-gyroid block copolymer. Nature 2019, 575, 175-175.4. Cochran, E. W.; Garcia-Cervera, C. J.; Fredrickson, G. H., Stability of the gyroid phase in diblock copolymers at strong segregation. Macromolecules 2006, 39, 2449-2451.5. Bates, F. S.; Maurer, W. W.; Lipic, P. M.; Hillmyer, M. A.; Almdal, K.; Mortensen, K.; Fredrickson, G. H.; Lodge, T. P., Polymeric bicontinuous microemulsions. Phys Rev Lett 1997, 79, 849-852.6. Matsen, M. W.; Bates, F. S., Unifying weak- and strong-segregation block copolymer theories. Macromolecules 1996, 29, 1091-1098.7. Hajduk, D. A.; Harper, P. E.; Gruner, S. M.; Honeker, C. C.; Kim, G.; Thomas, E. L.; Fetters, L. J., The Gyroid - a New Equilibrium Morphology in Weakly Segregated Diblock Copolymers. Macromolecules 1994, 27, 4063-4075.8. Tan, K. W.; Wiesner, U., Block Copolymer Self-Assembly Directed Hierarchically Structured Materials from Nonequilibrium Transient Laser Heating. Macromolecules 2019, 52, 395-409.9. Bates, F. S.; Fredrickson, G. H., Block copolymers - Designer soft materials. Phys Today 1999, 52, 32-38.10. Bates, F. S., Polymer-Polymer Phase-Behavior. Science 1991, 251, 898-905.11. Jinnai, H.; Nishikawa, Y.; Spontak, R. J.; Smith, S. D.; Agard, D. A.; Hashimoto, T., Direct measurement of interfacial curvature distributions in a bicontinuous block copolymer morphology. Phys Rev Lett 2000, 84, 518-521.12. Thomas, E. L.; Anderson, D. M.; Henkee, C. S.; Hoffman, D., Periodic Area-Minimizing Surfaces in Block Copolymers. Nature 1988, 334, 598-601.13. Ruska, E., The Development of the Electron-Microscope and of Electron-Microscopy. Rev Mod Phys 1987, 59, 627-638.14. Storks, K. H., An electron diffraction examination of some linear high polymers. J Am Chem Soc 1938, 60, 1753-1761.15. Agar, A. W.; Frank, F. C.; Keller, A., Crystallinity Effects in the Electron Microscopy of Polyethylene. Philos Mag 1959, 4, 32-55.

16. Cooper, A. C.; Keller, A.; Waring, J. R. S., Texture of Some Crystalline Synthetic Polymers by Electron Microscopy. J Polym Sci 1953, 11, 215-220.17. Keller, A.; Oconnor, A., Study of Single Crystals and Their Associations in Polymers. Discuss Faraday Soc 1958, 114-121.18. Keller, A.; Keller, A.; Engleman, R., Electron Microscope-Electron Diffraction Investigations of the Crystalline Texture of Polyamides. J Polym Sci 1959, 36, 361-387.19. Sauer, J. A.; Morrow, D. R.; Richards.Gc, Morphology of Solution-Grown PolypropyleneCrystal Aggregates. J Appl Phys 1965, 36, 3017-3021.20. Dlugosz, J.; Keller, A.; Pedemont.E, Electron Microscope Evidence of a Macroscopic Single Crystal from a 3-Block Copolymer. Kolloid Z Z Polym 1970, 242, 1125-1130.21. Grubb, D. T.; Groves, G. W.; Keller, A., Origin of Contrast Effects in Electron-Microscopy of Polymers .1. Polyethylene Single-Crystals. J Mater Sci 1972, 7, 131-141.22. Moss, B.; Dorset, D. L.; Wittmann, J. C.; Lotz, B., Electron Crystallography of Epitaxially Grown Paraffin. J Polym Sci Pol Phys 1984, 22, 1919-1929.23. Dorset, D. L., Crystal-Structure of Lamellar Paraffin Eutectics. Macromolecules 1986, 19, 2965-2973.24. Dorset, D. L., Direct Structure-Analysis of a Paraffin Solid-Solution. P Natl Acad Sci USA 1990, 87, 8541-8544.25. Pradere, P.; Thomas, E. L., Image-Processing of Partially Periodic Lattice Images of Polymers - the Study of Crystal Defects. Ultramicroscopy 1990, 32, 149-168.26. Martin, D. C.; Thomas, E. L., Experimental High-Resolution Electron-Microscopy of Polymers. Polymer 1995, 36, 1743-1759.27. Wittmann, J. C.; Lotz, B., Polymer Decoration - the Orientation of Polymer Folds as Revealed by the Crystallization of Polymer Vapors. J Polym Sci Pol Phys 1985, 23, 205-226.28. Tosaka, M.; Tsuji, M.; Kohjiya, S.; Cartier, L.; Lotz, B., Crystallization of syndiotactic polystyrene in beta-form. 4. Crystal structure of melt-grown modification. Macromolecules 1999,32, 4905-4911.29. Zhu, L.; Cheng, S. Z. D.; Calhoun, B. H.; Ge, Q.; Quirk, R. P.; Thomas, E. L.; Hsiao, B. S.; Yeh, F. J.; Lotz, B., Crystallization temperature-dependent crystal orientations within nanoscale confined lamellae of a self-assembled crystalline-amorphous diblock copolymer. J Am Chem Soc 2000, 122, 5957-5967.30. Huang, P.; Zhu, L.; Cheng, S. Z. D.; Ge, Q.; Quirk, R. P.; Thomas, E. L.; Lotz, B.; Hsiao,B. S.; Liu, L. Z.; Yeh, F. J., Crystal orientation changes in two-dimensionally confined nanocylinders in a poly(ethylene oxide)-b-polystyrene/polystyrene blend. Macromolecules 2001,34, 6649-6657.31. Zhu, L.; Cheng, S. Z. D.; Calhoun, B. H.; Ge, Q.; Quirk, R. P.; Thomas, E. L.; Hsiao, B. S.; Yeh, F.; Lotz, B., Phase structures and morphologies determined by self-organization, vitrification, and crystallization: confined crystallization in an ordered lamellar phase of PEO-b-PS diblock copolymer. Polymer 2001, 42, 5829-5839.32. Lotz, B.; Miyoshi, T.; Cheng, S. Z. D., 50th Anniversary Perspective: Polymer Crystals and Crystallization: Personal Journeys in a Challenging Research Field. Macromolecules 2017, 50, 5995-6025.33. Handlin, D. L.; Thomas, E. L.; Macknight, W. J., Critical-Evaluation of Electron-Microscopy of Ionomers. Macromolecules 1981, 14, 795-801.

34. Pradere, P.; Thomas, E. L., 3-Dimensional Model for Twinning in Polymer Single-Crystals with Inclined Chains. Philos Mag A 1989, 60, 177-203.35. Sadler, D. M.; Keller, A., Polyethylene Crystals with Dislocation Networks - Their Origin Structure and Relevance to Polymer Crystallization .2. Kolloid Z Z Polym 1970, 242, 1081-&.36. Glaeser, R. M., Limitations to Significant Information in Biological Electron Microscopy as a Result of Radiation Damage. J Ultra Mol Struct R 1971, 36, 466-&.37. Egerton, R. F.; Li, P.; Malac, M., Radiation damage in the TEM and SEM. Micron 2004, 35, 399-409.38. Glaeser, R. M., Retrospective: Radiation damage and its associated "Information Limitations". Journal of structural biology 2008, 163, 271-276.39. Leijten, Z. J. W. A.; Keizer, A. D. A.; de With, G.; Friedrich, H., Quantitative Analysis ofElectron Beam Damage in Organic Thin Films. J Phys Chem C 2017, 121, 10552-10561.40. Koshino, M.; Masunaga, Y. H.; Nemoto, T.; Kurata, H.; Isoda, S., Radiation damage analysis of 7,7,8,8,-tetracyanoquinodimethane (TCNQ) and 2,3,5,6,-tetrafluoro-7,7,8,8,-tetracyanoquinodimethane (F(4)TCNQ) by electron diffraction and electron energy loss spectroscopy. Micron 2005, 36, 271-279.41. Hayashida, M.; Kawasaki, T.; Kimura, Y.; Takai, Y., Estimation of suitable condition for observing copper-phthalocyanine crystalline film by transmission electron microscopy. Nucl Instrum Meth B 2006, 248, 273-278.42. Eggeman, A. S.; Illig, S.; Troisi, A.; Sirringhaus, H.; Midgley, P. A., Measurement of molecular motion in organic semiconductors by thermal diffuse electron scattering. Nat Mater 2013, 12, 1044-1048.43. Guo, C. H.; Allen, F. I.; Lee, Y.; Le, T. P.; Song, C.; Ciston, J.; Minor, A. M.; Gomez, E. D., Probing Local Electronic Transitions in Organic Semiconductors through Energy-Loss Spectrum Imaging in the Transmission Electron Microscope. Adv Funct Mater 2015, 25, 6071-6076.44. Kuei, B.; Bator, C.; Gomez, E. D., Imaging 0.36 nm Lattice Planes in Conjugated Polymers by Minimizing Beam Damage. Macromolecules 2020, 53, 8296-8302.45. Kuei, B.; Gomez, E. D., Pushing the limits of high-resolution polymer microscopy using antioxidants. Nat Commun 2021, 12, 153.46. Grubb, D. T., Review Radiation-Damage and Electron-Microscopy of Organic Polymers.J Mater Sci 1974, 9, 1715-1736.47. Glaeser, R. M., Downing, K., Chiu, W., DeRosier, D., Frank, J., Electron crystallographyof biological macromolecules. Oxford University Press: Oxford ; New York, 2007.48. Giorgio, S.; Kern, R., High-Resolution Electron-Microscopy of Polyethylene and ParaffinCrystals - Stability in the Electron-Beam. J Polym Sci Pol Phys 1984, 22, 1931-1951.49. Dorset, D. L.; Zemlin, F., Direct Phase Determination in Electron Crystallography - the Crystal-Structure of an Normal-Paraffin. Ultramicroscopy 1990, 33, 227-236.50. Dorset, D. L.; Zhang, W. P., Electron Crystallography at Atomic Resolution - the Structure of the Odd-Chain Paraffin Normal-Tritriacontane. J Electron Micr Tech 1991, 18, 142-147.

51. Glaeser, R. M.; McMullan, G.; Faruqi, A. R.; Henderson, R., Images of paraffin monolayer crystals with perfect contrast: minimization of beam-induced specimen motion. Ultramicroscopy 2011, 111, 90-100.52. Glaeser, R. M., Chapter Two - Specimen Behavior in the Electron Beam. In Methods in Enzymology, Crowther, R. A., Ed. Academic Press: 2016, 579, 19-50.53. Fryer, J. R., Radiation-Damage in Organic Crystalline Films. Ultramicroscopy 1984, 14, 227-236.54. Egerton, R. F., Control of radiation damage in the TEM. Ultramicroscopy 2013, 127, 100-108.55. Janicek, B.; Kharel, P.; Bae, S. h.; Huang, P., Quantifying the Protection Factor of Graphene Substrates for Atomic-scale Imaging of Organic Crystals. Microsc Microanal 2020, 26, 786-787.56. Kuei, B.; Aplan, M. P.; Litofsky, J. H.; Gomez, E. D., New opportunities in transmission electron microscopy of polymers. Mat Sci Eng R 2020, 139.57. Andrews, E. H.; Gee, G., Crystalline morphology in thin films of natural rubber II. Crystallization under strain. Proceedings of the Royal Society of London. Series A. Mathematicaland Physical Sciences 1964, 277, 562-570.58. Andrews, E. H.; Stubbs, J. M., A NEW FREEZING HEAD FOR THE ULTRAMICROTOMY OF RUBBERS. Journal of the Royal Microscopical Society 1964, 82, 221-223.59. KATO, K., Electron Microscopy of ABS Plastics. Journal of electron microscopy 1965, 14, 220-221.60. Kato, K., Osmium Tetroxide Fixation of Rubber Latices. Journal of electron microscopy 1965, 14, 219-220.61. Swartzendruber, D. C.; Burnett, I. H.; Wertz, P. W.; Madison, K. C.; Squier, C. A., Osmium-Tetroxide and Ruthenium Tetroxide Are Complementary Reagents for the Preparation of Epidermal Samples for Transmission Electron-Microscopy. J Invest Dermatol 1995, 104, 417-420.62. Ruokolainen, J.; Tanner, J.; Ikkala, O.; ten Brinke, G.; Thomas, E. L., Direct imaging of self-organized Comb copolymer-like systems obtained by hydrogen bonding: Poly(4-vinylpyridine)-4-nonadecylphenol. Macromolecules 1998, 31, 3532-3536.63. Boyde, A.; Mccorkell, F. A.; Taylor, G. K.; Bomphrey, R. J.; Doube, M., Iodine Vapor Staining for Atomic Number Contrast in Backscattered Electron and X-Ray Imaging. Microsc Res Techniq 2014, 77, 1044-1051.64. Hayat, M. A., 4 - Positive Staining. In Basic Techniques for Transmission Electron Microscopy, Hayat, M. A., Ed. Academic Press: 1986, 182-231.65. Mineart, K. P.; Jiang, X.; Jinnai, H.; Takahara, A.; Spontak, R. J., Morphological Investigation of Midblock-Sulfonated Block Ionomers Prepared from Solvents Differing in Polarity. Macromolecular rapid communications 2015, 36, 432-438.66. Michler, G. H.; Naumann, I., Elektronenmikroskopische Untersuchungen von Polyethylenen. III. Bestimmung der Lamellendicken. Acta Polymerica 1982, 33, 399-407.67. Haubruge, H. G.; Jonas, A. M.; Legras, R., Staining of poly(ethylene terephthalate) by ruthenium tetroxide. Polymer 2003, 44, 3229-3234.

68. Michler, G. H., Contrast Enhancement. In Electron Microscopy of Polymers, Michler, G. H., Ed. Springer Berlin Heidelberg: Berlin, Heidelberg, 2008, 241-260.69. Yakovlev, S.; Fiscus, D.; Brant, P.; Butler, J.; Bucknall, D. G.; Downing, K. H., Mechanism of stress induced crystallization of polyethylene. Polymer 2019, 175, 25-31.70. Loo, Y. L.; Register, R. A.; Adamson, D. H., Direct imaging of polyethylene crystallites within block copolymer microdomains. J Polym Sci Pol Phys 2000, 38, 2564-2570.71. Franken, L. E.; Boekema, E. J.; Stuart, M. C. A., Transmission Electron Microscopy as a Tool for the Characterization of Soft Materials: Application and Interpretation. Adv Sci 2017, 4, 1600476.72. Friedrich, H.; Frederik, P. M.; de With, G.; Sommerdijk, N. A. J. M., Imaging of Self-Assembled Structures: Interpretation of TEM and Cryo-TEM Images. Angew Chem Int Edit 2010, 49, 7850-7858.73. Trent, J. S., Ruthenium Tetraoxide Staining of Polymers - New Preparative Methods for Electron-Microscopy. Macromolecules 1984, 17, 2930-2931.74. Melchior, V.; Hollingshead, C. J.; Cahoon, M. E., Stacking in Lipid Vesicle Tubulin Mixtures Is an Artifact of Negative Staining. J Cell Biol 1980, 86, 881-884.75. De Carlo, S.; Harris, J. R., Negative staining and cryo-negative staining of macromolecules and viruses for TEM. Micron 2011, 42, 117-131.76. Method of the Year 2015. Nat Methods 2016, 13, 1-1.77. Eisenstein, M., The field that came in from the cold. Nat Methods 2016, 13, 19-22.78. Glaeser, R. M., How good can cryo-EM become? Nat Methods 2016, 13, 28-32.79. Cheng, Y. F., Single-Particle Cryo-EM at Crystallographic Resolution. Cell 2015, 161, 450-457.80. Scheres, S. H. W., Processing of Structurally Heterogeneous Cryo-EM Data in RELION. Resolution Revolution: Recent Advances in Cryoem 2016, 579, 125-157.81. Milazzo, A. C.; Cheng, A.; Moeller, A.; Lyumkis, D.; Jacovetty, E.; Polukas, J.; Ellisman, M. H.; Xuong, N. H.; Carragher, B.; Potter, C. S., Initial evaluation of a direct detection device detector for single particle cryo-electron microscopy. Journal of structural biology 2011, 176, 404-8.82. Bammes, B. E.; Rochat, R. H.; Jakana, J.; Chen, D. H.; Chiu, W., Direct electron detection yields cryo-EM reconstructions at resolutions beyond 3/4 Nyquist frequency. Journal of structural biology 2012, 177, 589-601.83. Zheng, S. Q.; Palovcak, E.; Armache, J. P.; Verba, K. A.; Cheng, Y. F.; Agard, D. A., MotionCor2: anisotropic correction of beam-induced motion for improved cryo-electron microscopy. Nat Methods 2017, 14, 331-332.84. Rohou, A.; Grigorieff, N., CTFFIND4: Fast and accurate defocus estimation from electron micrographs. Journal of structural biology 2015, 192, 216-21.85. Zhang, K., Gctf: Real-time CTF determination and correction. Journal of structural biology 2016, 193, 1-12.86. Williams, D. B.; Carter, C. B., Phase-Contrast Images. In Transmission Electron Microscopy: A Textbook for Materials Science, Williams, D. B.; Carter, C. B., Eds. Springer US:Boston, MA, 2009.

87. Danev, R.; Buijsse, B.; Khoshouei, M.; Plitzko, J. M.; Baumeister, W., Volta potential phase plate for in-focus phase contrast transmission electron microscopy. Proc Natl Acad Sci U SA 2014, 111, 15635-40.88. Tosaka, M.; Danev, R.; Nagayama, K., Application of phase contrast transmission microscopic methods to polymer materials. Macromolecules 2005, 38, 7884-7886.89. Fukuda, Y.; Laugks, U.; Lucic, V.; Baumeister, W.; Danev, R., Electron cryotomographyof vitrified cells with a Volta phase plate. Journal of structural biology 2015, 190, 143-154.90. Danev, R.; Baumeister, W., Cryo-EM single particle analysis with the Volta phase plate. Elife 2016, 5, e13046.91. Danev, R.; Tegunov, D.; Baumeister, W., Using the Volta phase plate with defocus for cryo-EM single particle analysis. Elife 2017, 6, e23006.92. Fan, X.; Zhao, L. Y.; Liu, C.; Zhang, J. C.; Fan, K. L.; Yan, X. Y.; Peng, H. L.; Lei, J. L.;Wang, H. W., Near-Atomic Resolution Structure Determination in Over-Focus with Volta Phase Plate by Cs-Corrected Cryo-EM. Structure 2017, 25, 1623-1630.93. Khoshouei, M.; Radjainia, M.; Baumeister, W.; Danev, R., Cryo-EM structure of haemoglobin at 3.2 angstrom determined with the Volta phase plate. Nat Commun 2017, 8.94. Pretzsch, R.; Dries, M.; Hettler, S.; Spiecker, M.; Obermair, M.; Gerthsen, D., Investigation of hole-free phase plate performance in transmission electron microscopy under different operation conditions by experiments and simulations. Adv Struct Chem Imag 2019, 5, 5.95. Schwartz, O.; Axelrod, J. J.; Glaeser, R. M.; Muller, H., Laser-Based Zernike Plate for Phase Contrast Transmission Electron Microscopy. Biophys J 2018, 114, 160a-160a.96. Schwartz, O.; Axelrod, J. J.; Campbell, S. L.; Turnbaugh, C.; Glaeser, R. M.; Muller, H., Laser phase plate for transmission electron microscopy. Nat Methods 2019, 16, 1016-1020.97. Shefelbine, T. A.; Vigild, M. E.; Matsen, M. W.; Hajduk, D. A.; Hillmyer, M. A.; Cussler, E. L.; Bates, F. S., Core-shell gyroid morphology in a poly(isoprene-block-styrene-block-dimethylsiloxane) triblock copolymer. J Am Chem Soc 1999, 121, 8457-8465.98. Mareau, V. H.; Akasaka, S.; Osaka, T.; Hasegawa, H., Direct visualization of the perforated layer/gyroid grain boundary in a polystyrene-block-polyisoprene/polystyrene blend byelectron tomography. Macromolecules 2007, 40, 9032-9039.99. Spontak, R. J.; Williams, M. C.; Agard, D. A., Three-dimensional study of cylindrical morphology in a styrene-butadiene-styrene block copolymer. Polymer 1988, 29, 387-395.100. Frank, J., Electron Tomography: Methods for Three-Dimensional Visualization of Structures in the Cell. 2nd Edition ed.; Springer, Albany, NY: 2006.101. Kak, A. C.; Slaney, M., Principles of Computerized Tomographic Imaging. Society for Industrial and Applied Mathematics: 2001.102. Jinnai, H.; Spontak, R. J.; Nishi, T., Transmission Electron Microtomography and Polymer Nanostructures. Macromolecules 2010, 43, 1675-1688.103. Nudelman, F.; de With, G.; Sommerdijk, N. A. J. M., Cryo-electron tomography: 3-dimensional imaging of soft matter. Soft Matter 2011, 7, 17-24.104. Patterson, J. P.; Xu, Y. F.; Moradi, M. A.; Sommerdijk, N. A. J. M.; Friedrich, H., CryoTEM as an Advanced Analytical Tool for Materials Chemists. Accounts Chem Res 2017, 50, 1495-1501.105. Bals, S.; Van Aert, S.; Van Tendeloo, G., High resolution electron tomography. Curr Opin Solid St M 2013, 17, 107-114.

106. Midgley, P. A.; Weyland, M., 3D electron microscopy in the physical sciences: the development of Z-contrast and EFTEM tomography. Ultramicroscopy 2003, 96, 413-431.107. Henderson, R.; Unwin, P. N., Three-dimensional model of purple membrane obtained by electron microscopy. Nature 1975, 257, 28-32.108. De Rosier, D. J.; Klug, A., Reconstruction of Three Dimensional Structures from Electron Micrographs. Nature 1968, 217, 130-134.109. Amos, L. A.; Henderson, R.; Unwin, P. N., Three-dimensional structure determination byelectron microscopy of two-dimensional crystals. Prog Biophys Mol Biol 1982, 39, 183-231.110. Walz, T.; Grigorieff, N., Electron crystallography of two-dimensional crystals of membrane proteins. Journal of structural biology 1998, 121, 142-161.111. Downing, K. H.; Nogales, E., Cryoelectron Microscopy Applications in the Study of Tubulin Structure, Microtubule Architecture, Dynamics and Assemblies, and Interaction of Microtubules with Motors. Methods in Enzymology, Vol 483: Cryo-Em, Part C: Analyses, Interpretation, and Case Studies 2010, 483, 121-142.112. Frank, J., Three-dimensional electron microscopy of macromolecular assemblies : visualization of biological molecules in their native state. 2nd ed.; Oxford University Press: NewYork, 2006.113. Scheres, S. H., A Bayesian view on cryo-EM structure determination. J Mol Biol 2012, 415, 406-18.114. Bai, X. C.; McMullan, G.; Scheres, S. H. W., How cryo-EM is revolutionizing structural biology. Trends Biochem Sci 2015, 40, 49-57.115. Cheng, Y.; Grigorieff, N.; Penczek, P. A.; Walz, T., A Primer to Single-Particle Cryo-Electron Microscopy. Cell 2015, 161, 438-449.116. Lafleur, R. P. M.; Herziger, S.; Schoenmakers, S. M. C.; Keizer, A. D. A.; Jahzerah, J.; Thota, B. N. S.; Su, L.; Bomans, P. H. H.; Sommerdijk, N. A. J. M.; Palmans, A. R. A.; Haag, R.; Friedrich, H.; Bottcher, C.; Meijer, E. W., Supramolecular Double Helices from Small C-3-Symmetrical Molecules Aggregated in Water. J Am Chem Soc 2020, 142, 17644-17652.117. Sui, H. X.; Downing, K. H., Molecular architecture of axonemal microtubule doublets revealed by cryo-electron tomography. Nature 2006, 442, 475-478.118. Bharat, T. A. M.; Russo, C. J.; Lowe, J.; Passmore, L. A.; Scheres, S. H. W., Advances inSingle-Particle Electron Cryomicroscopy Structure Determination applied to Sub-tomogram Averaging. Structure 2015, 23, 1743-1753.119. Zhang, P. J., Advances in cryo-electron tomography and subtomogram averaging and classification. Curr Opin Struc Biol 2019, 58, 249-258.120. Talmon, Y.; Davis, H. T.; Scriven, L. E.; Thomas, E. L., Cold-Stage Microscopy System for Fast-Frozen Liquids. Rev Sci Instrum 1979, 50, 698-704.121. Wolf, L.; Hoffmann, H.; Talmon, Y.; Teshigawara, T.; Watanabe, K., Cryo-TEM imaging of a novel microemulsion system of silicone oil with an anionic/nonionic surfactant mixture. Soft Matter 2010, 6, 5367-5374.122. Cui, H.; Hodgdon, T. K.; Kaler, E. W.; Abezgauz, L.; Danino, D.; Lubovsky, M.; Talmon, Y.; Pochan, D. J., Elucidating the assembled structure of amphiphiles in solution via cryogenic transmission electron microscopy. Soft Matter 2007, 3, 945-955.

123. Bang, J.; Jain, S. M.; Li, Z. B.; Lodge, T. P.; Pedersen, J. S.; Kesselman, E.; Talmon, Y., Sphere, cylinder, and vesicle nanoaggregates in poly (styrene-b-isoprene) diblock copolymer solutions. Macromolecules 2006, 39, 1199-1208.124. Kesselman, E.; Talmon, Y.; Bang, J.; Abbas, S.; Li, Z. B.; Lodge, T. P., Cryogenic transmission electron microscopy imaging of vesicles formed by a polystyrene-polyisoprene diblock copolymer. Macromolecules 2005, 38, 6779-6781.125. Won, Y. Y.; Brannan, A. K.; Davis, H. T.; Bates, F. S., Cryogenic transmission electron microscopy (cryo-TEM) of micelles and vesicles formed in water by polyethylene oxide)-based block copolymers. J Phys Chem B 2002, 106, 3354-3364.126. Discher, B. M.; Won, Y. Y.; Ege, D. S.; Lee, J. C. M.; Bates, F. S.; Discher, D. E.; Hammer, D. A., Polymersomes: Tough vesicles made from diblock copolymers. Science 1999, 284, 1143-1146.127. Wittemann, A.; Drechsler, M.; Talmon, Y.; Ballauff, M., High elongation of polyelectrolyte chains in the osmotic limit of spherical polyelectrolyte brushes: A study by cryogenic transmission electron microscopy. J Am Chem Soc 2005, 127, 9688-9689.128. Bellare, J. R.; Davis, H. T.; Scriven, L. E.; Talmon, Y., Controlled Environment Vitrification System - an Improved Sample Preparation Technique. J Electron Micr Tech 1988, 10, 87-111.129. Talmon, Y.; Adrian, M.; Dubochet, J., Electron-Beam Radiation-Damage to Organic Inclusions in Vitreous, Cubic, and Hexagonal Ice. Journal of microscopy 1986, 141, 375-384.130. Talmon, Y.; Narkis, M.; Silverstein, M., Electron-Beam Radiation-Damage to Organic Inclusions in Ice as an Analytical Tool for Polymer Science. J Electron Micr Tech 1985, 2, 589-596.131. Talmon, Y.; Evans, D. F.; Ninham, B. W., Spontaneous Vesicles Formed from Hydroxide Surfactants - Evidence from Electron-Microscopy. Science 1983, 221, 1047-1048.132. Frank, J., Time-resolved cryo-electron microscopy: Recent progress. Journal of structural biology 2017, 200, 303-306.133. Dandey, V. P.; Budell, W. C.; Wei, H.; Bobe, D.; Maruthi, K.; Kopylov, M.; Eng, E. T.; Kahn, P. A.; Hinshaw, J. E.; Kundu, N.; Nimigean, C. M.; Fan, C.; Sukomon, N.; Darst, S. A.; Saecker, R. M.; Chen, J.; Malone, B.; Potter, C. S.; Carragher, B., Time-resolved cryo-EM using Spotiton. Nat Methods 2020, 17, 897-900.134. Ross, F. M., Opportunities and challenges in liquid cell electron microscopy. Science 2015, 350, aaa9886.135. Wu, H. L.; Friedrich, H.; Patterson, J. P.; Sommerdijk, N. A. J. M.; de Jonge, N., Liquid-Phase Electron Microscopy for Soft Matter Science and Biology. Adv Mater 2020, 32, 2001582.136. Cho, H.; Jones, M. R.; Nguyen, S. C.; Hauwiller, M. R.; Zettl, A.; Alivisatos, A. P., The Use of Graphene and Its Derivatives for Liquid-Phase Transmission Electron Microscopy of Radiation-Sensitive Specimens. Nano Lett 2017, 17, 414-420.137. Park, J.; Koo, K.; Noh, N.; Chang, J. H.; Cheong, J. Y.; Dae, K. S.; Park, J. S.; Ji, S.; Kim, I.-D.; Yuk, J. M., Graphene Liquid Cell Electron Microscopy: Progress, Applications, and Perspectives. ACS nano 2021, 15, 288-308.138. Ianiro, A.; Wu, H. L.; van Rijt, M. M. J.; Vena, M. P.; Keizer, A. D. A.; Esteves, A. C. C.; Tuinier, R.; Friedrich, H.; Sommerdijk, N. A. J. M.; Patterson, J. P., Liquid-liquid phase separation during amphiphilic self-assembly. Nat Chem 2019, 11, 320-328.

139. Blanazs, A.; Armes, S. P.; Ryan, A. J., Self-Assembled Block Copolymer Aggregates: From Micelles to Vesicles and their Biological Applications. Macromolecular rapid communications 2009, 30, 267-277.140. Tritschler, U.; Pearce, S.; Gwyther, J.; Whittell, G. R.; Manners, I., 50th Anniversary Perspective: Functional Nanoparticles from the Solution Self-Assembly of Block Copolymers. Macromolecules 2017, 50, 3439-3463.141. Zhang, W. Y.; Kochovski, Z.; Lu, Y.; Schmidt, B. V. K. J.; Antonietti, M.; Yuan, J. Y., Internal Morphology-Controllable Self-Assembly in Poly(lonic Liquid) Nanoparticles. ACS nano2016, 10, 7731-7737.142. Drummy, L. F.; Davis, R. J.; Moore, D. L.; Durstock, M.; Vaia, R. A.; Hsu, J. W. P., Molecular-Scale and Nanoscale Morphology of P3HT:PCBM Bulk Heterojunctions: Energy-Filtered TEM and Low-Dose HREM. Chemistry of Materials 2011, 23, 907-912.143. Vakhshouri, K.; Kozub, D. R.; Wang, C. C.; Salleo, A.; Gomez, E. D., Effect of Miscibility and Percolation on Electron Transport in Amorphous Poly(3-Hexylthiophene)/Phenyl-C-61-Butyric Acid Methyl Ester Blends. Phys Rev Lett 2012, 108.144. Wirix, M. J. M.; Bomans, P. H. H.; Friedrich, H.; Sommerdijk, N. A. J. M.; de With, G., Three-Dimensional Structure of P3HT Assemblies in Organic Solvents Revealed by Cryo-TEM. Nano Lett 2014, 14, 2033-2038.145. Tahara, Y.; Fujiyoshi, Y., A New Method to Measure Bilayer Thickness - Cryoelectron Microscopy of Frozen-Hydrated Liposomes and Image Simulation. Micron 1994, 25, 141-149.146. Wang, L. G.; Bose, P. S.; Sigworth, F. J., Using cryo-EM to measure the dipole potential of a lipid membrane. P Natl Acad Sci USA 2006, 103, 18528-18533.147. Bermudez, H.; Hammer, D. A.; Discher, D. E., Effect of bilayer thickness on membrane bending rigidity. Langmuir 2004, 20, 540-543.148. Sun, J.; Zuckermann, R. N., Peptoid Polymers: A Highly Designable Bioinspired Material. ACS nano 2013, 7, 4715-4732.149. Jiang, X.; Spencer, R. K.; Sun, J.; Ophus, C.; Zuckermann, R. N.; Downing, K. H.; Balsara, N. P., Resolving the Morphology of Peptoid Vesicles at the 1 nm Length Scale Using Cryogenic Electron Microscopy. J Phys Chem B 2019, 123, 1195-1205.150. Cornell, C. E.; Mileant, A.; Thakkar, N.; Lee, K. K.; Keller, S. L., Direct imaging of liquid domains in membranes by cryo-electron tomography. P Natl Acad Sci USA 2020, 117, 19713-19719.151. Messmer, D.; Bottcher, C.; Yu, H.; Halperin, A.; Binder, K.; Kroger, M.; Schlutert, A. D., 3D Conformations of Thick Synthetic Polymer Chains Observed by Cryogenic Electron Microscopy. ACS nano 2019, 13, 3466-3473.152. Farha, O. K.; Eryazici, I.; Jeong, N. C.; Hauser, B. G.; Wilmer, C. E.; Sarjeant, A. A.; Snurr, R. Q.; Nguyen, S. T.; Yazaydin, A. O.; Hupp, J. T., Metal-Organic Framework Materials with Ultrahigh Surface Areas: Is the Sky the Limit? J Am Chem Soc 2012, 134, 15016-15021.153. Zhou, H. C.; Long, J. R.; Yaghi, O. M., Introduction to Metal-Organic Frameworks. Chem Rev 2012, 112, 673-674.154. Goetjen, T. A.; Liu, J.; Wu, Y. F.; Sui, J. Y.; Zhang, X.; Hupp, J. T.; Farha, O. K., Metal-organic framework (MOF) materials as polymerization catalysts: a review and recent advances. Chem Commun 2020, 56, 10409-10418.

155. Wang, H. L.; He, S. F.; Qin, X. D.; Li, C. E.; Li, T., Interfacial Engineering in Metal-Organic Framework-Based Mixed Matrix Membranes Using Covalently Grafted Polyimide Brushes. J Am Chem Soc 2018, 140, 17203-17210.156. Kalaj, M.; Bentz, K. C.; Ayala, S.; Palomba, J. M.; Barcus, K. S.; Katayama, Y.; Cohen, S. M., MOF-Polymer Hybrid Materials: From Simple Composites to Tailored Architectures. Chem Rev 2020, 120, 8267-8302.157. Gu, Y. W.; Huang, M. J.; Zhang, W. X.; Pearson, M. A.; Johnson, J. A., PolyMOF Nanoparticles: Dual Roles of a Multivalent polyMOF Ligand in Size Control and Surface Functionalization. Angew Chem Int Edit 2019, 58, 16676-16681.158. MacLeod, M. J.; Johnson, J. A., Block co-polyMOFs: assembly of polymer-polyMOF hybrids via iterative exponential growth and "click" chemistry. Polym Chem-Uk 2017, 8, 4488-4493.159. Wang, Y. F.; Zhong, M. J.; Park, J. V.; Zhukhovitskiy, A. V.; Shi, W. C.; Johnson, J. A., Block Co-PolyMOCs by Stepwise Self-Assembly. J Am Chem Soc 2016, 138, 10708-10715.160. Wang, Q.; Astruc, D., State of the Art and Prospects in Metal-Organic Framework (MOF)-Based and MOF-Derived Nanocatalysis. Chem Rev 2020, 120, 1438-1511.161. Banihashemi, F.; Bu, G.; Thaker, A.; Williams, D.; Lin, J. Y. S.; Nannenga, B. L., Beam-sensitive metal-organic framework structure determination by microcrystal electron diffraction. Ultramicroscopy 2020, 216, 113048.162. Patterson, J. P.; Abellan, P.; Denny, M. S.; Park, C.; Browning, N. D.; Cohen, S. M.; Evans, J. E.; Gianneschi, N. C., Observing the Growth of Metal-Organic Frameworks by in Situ Liquid Cell Transmission Electron Microscopy. J Am Chem Soc 2015, 137, 7322-7328.163. Ogata, A. F.; Rakowski, A. M.; Carpenter, B. P.; Fishman, D. A.; Merham, J. G.; Hurst, P. J.; Patterson, J. P., Direct Observation of Amorphous Precursor Phases in the Nucleation of Protein-Metal-Organic Frameworks. J Am Chem Soc 2020, 142, 1433-1442.164. Zhu, Y. H.; Ciston, J.; Zheng, B.; Miao, X. H.; Czarnik, C.; Pan, Y. C.; Sougrat, R.; Lai, Z. P.; Hsiung, C. E.; Yao, K. X.; Pinnau, I.; Pan, M.; Han, Y., Unravelling surface and interfacialstructures of a metal-organic framework by transmission electron microscopy. Nat Mater 2017, 16, 532-536.165. Zhang, D. L.; Zhu, Y. H.; Liu, L. M.; Ying, X. R.; Hsiung, C. E.; Sougrat, R.; Li, K.; Han, Y., Atomic-resolution transmission electron microscopy of electron beam-sensitive crystalline materials. Science 2018, 359, 675-679.166. Li, Y. Z.; Wang, K. C.; Zhou, W. J.; Li, Y. B.; Vila, R.; Huang, W.; Wang, H. X.; Chen, G. X.; Wu, G. H.; Tsao, Y. C.; Wang, H. S.; Sinclair, R.; Chiu, W.; Cui, Y., Cryo-EM Structures of Atomic Surfaces and Host-Guest Chemistry in Metal-Organic Frameworks (vol 1, pg 428, 2019). Matter 2020, 2, 1064-1064.167. Nam, K. T.; Shelby, S. A.; Choi, P. H.; Marciel, A. B.; Chen, R.; Tan, L.; Chu, T. K.; Mesch, R. A.; Lee, B. C.; Connolly, M. D.; Kisielowski, C.; Zuckermann, R. N., Free-floating ultrathin two-dimensional crystals from sequence-specific peptoid polymers. Nat Mater 2010, 9, 454-460.168. Xuan, S. T.; Jiang, X.; Spencer, R. K.; Li, N. K.; Prendergast, D.; Balsara, N. P.; Zuckermann, R. N., Atomic-level engineering and imaging of polypeptoid crystal lattices. P NatlAcad Sci USA 2019, 116, 22491-22499.

169. Jiang, X.; Xuan, S. T.; Kundu, J.; Prendergast, D.; Zuckermann, R. N.; Balsara, N. P., Effect of processing and end groups on the crystal structure of polypeptoids studied by cryogenicelectron microscopy at atomic length scales. Soft Matter 2019, 15, 4723-4736.170. Jiang, X.; Greer, D. R.; Kundu, J.; Ophus, C.; Minor, A. M.; Prendergast, D.; Zuckermann, R. N.; Balsara, N. P.; Downing, K. H., Imaging Unstained Synthetic Polymer Crystals and Defects on Atomic Length Scales Using Cryogenic Electron Microscopy. Macromolecules 2018, 51, 7794-7799.171. Pradere, P.; Thomas, E. L., Antiphase Boundaries and Ordering Defects in Syndiotactic Polystyrene Crystals. Macromolecules 1990, 23, 4954-4958.172. Pennycook, S. J. N., P.D., Scanning Transmission Electron MicroscopyImaging and Analysis. Springer, New York, NY: 2011.173. Benetatos, N. M.; Smith, B. W.; Heiney, P. A.; Winey, K. I., Toward Reconciling STEM and SAXS Data from Ionomers by Investigating Gold Nanoparticles. Macromolecules 2005, 38, 9251-9257.174. Zhou, N. C.; Chan, C. D.; Winey, K. I., Reconciling STEM and X-ray scattering data to determine the nanoscale ionic aggregate morphology in sulfonated polystyrene ionomers. Macromolecules 2008, 41, 6134-6140.175. Loos, J.; Sourty, E.; Lu, K. B.; de With, G.; van Bavel, S., Imaging Polymer Systems with High-Angle Annular Dark Field Scanning Transmission Electron Microscopy (HAADF-STEM). Macromolecules 2009, 42, 2581-2586.176. Yakovlev, S.; Wang, X.; Ercius, P.; Balsara, N. P.; Downing, K. H., Direct Imaging of Nanoscale Acidic Clusters in a Polymer Electrolyte Membrane. J Am Chem Soc 2011, 133, 20700-20703.177. Aso, R.; Kurata, H.; Namikoshi, T.; Hashimoto, T.; Kuo, S.-W.; Chang, F.-C.; Hasegawa,H.; Tsujimoto, M.; Takano, M.; Isoda, S., Quantitative Imaging of Tg in Block Copolymers by Low-Angle Annular Dark-Field Scanning Transmission Electron Microscopy. Macromolecules 2013, 46, 8589-8595.178. Yakovlev, S.; Downing, K. H., Visualization of clusters in polymer electrolyte membranes by electron microscopy. Phys Chem Chem Phys 2013, 15, 1052-1064.179. Jinnai, H.; Higuchi, T.; Zhuge, X. D.; Kumamoto, A.; Batenburg, K. J.; Ikuhara, Y., Three-Dimensional Visualization and Characterization of Polymeric Self-Assemblies by Transmission Electron Microtomography. Accounts Chem Res 2017, 50, 1293-1302.180. Takacs, C. J.; Treat, N. D.; Kramer, S.; Chen, Z. H.; Facchetti, A.; Chabinyc, M. L.; Heeger, A. J., Remarkable Order of a High-Performance Polymer. Nano Lett 2013, 13, 2522-2527.181. Leijten, Z. J. W. A.; Wirix, M. J. M.; Lazar, S.; Verhoeven, W.; Luiten, O. J.; de With, G.; Friedrich, H., Nanoscale chemical analysis of beam-sensitive polymeric materials by cryogenic electron microscopy. J Polym Sci 2021. 1-11.182. Glaeser, R. M., Invited Review Article: Methods for imaging weak-phase objects in electron microscopy. Rev Sci Instrum 2013, 84, 111101.183. Ophus, C.; Ercius, P.; Huijben, M.; Ciston, J., Non-spectroscopic composition measurements of SrTiO3-La0.7Sr0.3MnO3 multilayers using scanning convergent beam electrondiffraction. Appl Phys Lett 2017, 110, 063102.

184. Gammer, C.; Ozdol, V. B.; Liebscher, C. H.; Minor, A. M., Diffraction contrast imaging using virtual apertures. Ultramicroscopy 2015, 155, 1-10.185. Ozdol, V. B.; Gammer, C.; Jin, X. G.; Ercius, P.; Ophus, C.; Ciston, J.; Minor, A. M., Strain mapping at nanometer resolution using advanced nano-beam electron diffraction. Appl Phys Lett 2015, 106, 253107.186. Nellist, P. D.; Mccallum, B. C.; Rodenburg, J. M., Resolution Beyond the Information Limit in Transmission Electron-Microscopy. Nature 1995, 374, 630-632.187. Panova, O.; Chen, X. C.; Bustillo, K. C.; Ophus, C.; Bhatt, M. P.; Balsara, N.; Minor, A. M., Orientation mapping of semicrystalline polymers using scanning electron nanobeam diffraction. Micron 2016, 88, 30-36.188. Panova, O.; Ophus, C.; Takacs, C. J.; Bustillo, K. C.; Balhorn, L.; Salleo, A.; Balsara, N.;Minor, A. M., Diffraction imaging of nanocrystalline structures in organic semiconductor molecular thin films. Nat Mater 2019, 18, 860-865.189. Gallagher-Jones, M.; Ophus, C.; Bustillo, K. C.; Boyer, D. R.; Panova, O.; Glynn, C.; Zee, C. T.; Ciston, J.; Mancia, K. C.; Minor, A. M.; Rodriguez, J. A., Nanoscale mosaicity revealed in peptide microcrystals by scanning electron nanodiffraction. Communications Biology2019, 2, 26.190. Ophus, C., Four-Dimensional Scanning Transmission Electron Microscopy (4D-STEM): From Scanning Nanodiffraction to Ptychography and Beyond. Microsc Microanal 2019, 25, 563-582.191. Savitzky, B. H.; Hughes, L. A.; Zeltmann, S. E.; Brown, H. G.; Zhao, S.; Pelz, P. M.; Barnard, E. S.; Donohue, J.; Rangel DaCosta, L.; Pekin, T. C.; Kennedy, E.; Janish, M. T.; Schneider, M. M.; Herring, P.; Gopal, C.; Anapolsky, A.; Ercius, P.; Scott, M.; Ciston, J.; Minor,A. M.; Ophus, C., py4DSTEM: a software package for multimodal analysis of four-dimensional scanning transmission electron microscopy datasets. arXiv e-prints 2020, arXiv:2003.09523.192. de Graaf, S.; Momand, J.; Mitterbauer, C.; Lazar, S.; Kooi, B. J., Resolving hydrogen atoms at metal-metal hydride interfaces. Science Advances 2020, 6, eaay4312.193. Lazic, I.; Bosch, E. G. T.; Lazar, S., Phase contrast STEM for thin samples: Integrated differential phase contrast. Ultramicroscopy 2016, 160, 265-280.194. Lubk, A.; Zweck, J., Differential phase contrast: An integral perspective. Phys Rev A 2015, 91, 023805195. Inamoto, S.; Shimomura, S.; Otsuka, Y., Electrostatic potential imaging of phase-separated structures in organic materials via differential phase contrast scanning transmission electron microscopy. Microscopy-Jpn 2020, 69, 304-311.196. Inamoto, S.; Yoshida, A.; Otsuka, Y., Three-dimensional Analysis of Non-stained Polymer Alloy Using Differential Phase Contrast-STEM Tomography. Microsc Microanal 2019,25, 1826-1827.197. Shen, B. Y.; Chen, X.; Shen, K.; Xiong, H.; Wei, F., Imaging the node-linker coordination in the bulk and local structures of metal-organic frameworks. Nat Commun 2020, 11, 2692198. Li, X. H.; Wang, J. J.; Liu, X.; Liu, L. M.; Cha, D.; Zheng, X. L.; Yousef, A. A.; Song, K. P.; Zhu, Y. H.; Zhang, D. L.; Han, Y., Direct Imaging of Tunable Crystal Surface Structures of MOF MIL-101 Using High-Resolution Electron Microscopy. J Am Chem Soc 2019, 141, 12021-12028.

199. Ziatdinov, S. V. K. a. O. D. a. S. J. a. M., Machine learning of chemical transformations in the Si-graphene system from atomically resolved images via variational autoencoder. arXiv 2020, 2006.10267.200. Maksov, A.; Dyck, O.; Wang, K.; Xiao, K.; Geohegan, D. B.; Sumpter, B. G.; Vasudevan, R. K.; Jesse, S.; Kalinin, S. V.; Ziatdinov, M., Deep learning analysis of defect and phase evolution during electron beam-induced transformations in WS2. Npj Comput Mater 2019,5, 12.201. Palovcak, E.; Asarnow, D.; Campbell, M. G.; Yu, Z. L.; Cheng, Y. F., Enhancing the signal-to-noise ratio and generating contrast for cryo-EM images with convolutional neural networks. Iucrj 2020, 7, 1142-1150.202. Zhu, Y. N.; Ouyang, Q.; Mao, Y. D., A deep convolutional neural network approach to single-particle recognition in cryo-electron microscopy. Bmc Bioinformatics 2017, 18, 384.203. Matsumoto, S.; Ishida, S.; Araki, M.; Kato, T.; Terayama, K.; Okuno, Y., Extraction of protein dynamics information from cryo-EM maps using deep learning. Nat Mach Intell 2021, 3, 153-160.204. Chen, M.; Dai, W.; Sun, S. Y.; Jonasch, D.; He, C. Y.; Schmid, M. F.; Chiu, W.; Ludtke, S. J., Convolutional neural networks for automated annotation of cellular cryo-electron tomograms. Nat Methods 2017, 14, 983-985.205. Altantzis, T.; Lobato, I.; De Backer, A.; Beche, A.; Zhang, Y.; Basak, S.; Porcu, M.; Xu, Q.; Sanchez-Iglesias, A.; Liz-Marzan, L. M.; Van Tendeloo, G.; Van Aert, S.; Bals, S., Three-Dimensional Quantification of the Facet Evolution of Pt Nanoparticles in a Variable Gaseous Environment. Nano Lett 2019, 19, 477-481.206. Qu, E. Z.; Jimenez, A. M.; Kumar, S. K.; Zhang, K., Quantifying Nanoparticle Assembly States in a Polymer Matrix through Deep Learning. Macromolecules 2021, 54, 3034-3040.207. Malac, M.; Hettler, S.; Hayashida, M.; Kano, E.; Egerton, R. F.; Beleggia, M., Phase plates in the transmission electron microscope: operating principles and applications. Microscopy-Jpn 2021, 70, 75-115.208. Russo, C. J.; Passmore, L. A., Ultrastable gold substrates for electron cryomicroscopy. Science 2014, 346, 1377-1380.209. Chreifi, G.; Chen, S. Y.; Metskas, L. A.; Mastronarde, D.; Jensen, G. J., Cryo-Electron Tomography, Faster: Development of a Fast-Incremental Tilting Scheme for Rapid Tomogram Acquisition. Biophys J 2019, 116, 575a-575a.210. Albrecht, W.; Bals, S., Fast Electron Tomography for Nanomaterials. The Journal of Physical Chemistry C 2020, 124, 27276-27286.211. Jiang, Y.; Chen, Z.; Hang, Y. M.; Deb, P.; Gao, H.; Xie, S. E.; Purohit, P.; Tate, M. W.; Park, J.; Gruner, S. M.; Elser, V.; Muller, D. A., Electron ptychography of 2D materials to deep sub-angstrom resolution. Nature 2018, 559, 343-349.
Table of Content