Domestic NEED 2021 Annex C: Comparisons with other sources
25
Domestic NEED 2021 Annex C: Comparisons with other Sources 24 June 2021 National Statistics This document provides a comparative analysis and commentary assessing how representative the National Energy Efficiency Data-Framework (NEED) is of the domestic dwelling stock in England and Wales. In all cases, the NEED data are broadly consistent with the other sources available for comparison. • The regional distribution of properties in NEED is representative and comparable to estimates of the number of households and the dwelling stock, with London showing the largest variation at around 1 per cent. • NEED domestic gas and electricity consumption is aligned with data published in the Subnational domestic consumption publication and the Energy Consumption UK (ECUK) publication. Mean domestic gas consumption is 13,300 kWh in NEED, 13,500 kWh in the Subnational Gas statistics 1 , and 13,300 kWh in ECUK 2 . • The composition of Valuation Office Agency (VOA) and Experian property attribute data contained in NEED is aligned with estimates published in the latest English Housing Survey (EHS) statistics. Overall, there is good alignment with some variations between VOA and NEED as a result of lower address matching rates for flats. 1 The NEED and Subnational consumption statistics have slightly different values due to differences in what are considered valid data for each publication. For more information, please see Table 4 below. 2 Gas consumption for the United Kingdom is taken from ECUK while the number of gas customers in Great Britain is taken from the Domestic Energy Price statistics (table QEP 2.3.5), and the number of gas customers in Northern Ireland is taken from the utility regulator’s quarterly transparency reports.
-
Upload
khangminh22 -
Category
Documents
-
view
2 -
download
0
Transcript of Domestic NEED 2021 Annex C: Comparisons with other sources

Domestic NEED 2021 Annex C: Comparisons with other Sources 24 June 2021 National Statistics
This document provides a comparative analysis and commentary assessing how representative the National Energy Efficiency Data-Framework (NEED) is of the domestic dwelling stock in England and Wales. In all cases, the NEED data are broadly consistent with the other sources available for comparison.
• The regional distribution of properties in NEED is representative and comparable to estimates of the number of households and the dwelling stock, with London showing the largest variation at around 1 per cent.
• NEED domestic gas and electricity consumption is aligned with data published in the Subnational domestic consumption publication and the Energy Consumption UK (ECUK) publication. Mean domestic gas consumption is 13,300 kWh in NEED, 13,500 kWh in the Subnational Gas statistics1, and 13,300 kWh in ECUK2.
• The composition of Valuation Office Agency (VOA) and Experian property attribute data contained in NEED is aligned with estimates published in the latest English Housing Survey (EHS) statistics. Overall, there is good alignment with some variations between VOA and NEED as a result of lower address matching rates for flats.
1 The NEED and Subnational consumption statistics have slightly different values due to differences in what are considered valid data for each publication. For more information, please see Table 4 below. 2 Gas consumption for the United Kingdom is taken from ECUK while the number of gas customers in Great Britain is taken from the Domestic Energy Price statistics (table QEP 2.3.5), and the number of gas customers in Northern Ireland is taken from the utility regulator’s quarterly transparency reports.

Domestic NEED 2021 Annex C: Comparisons with other sources
2
Contents Introduction _______________________________________________________________ 3
Address matching and sample creation __________________________________________ 5
Consumption data __________________________________________________________ 7
Gas consumption data _____________________________________________________ 7
Data collection _________________________________________________________ 7
Data validation _________________________________________________________ 8
Comparison with other sources _____________________________________________ 8
Electricity consumption data _________________________________________________ 9
Data collection _________________________________________________________ 9
Data validation ________________________________________________________ 11
Comparison with other sources ____________________________________________ 12
Conclusion ___________________________________________________________ 12
Valuation Office Agency Data ________________________________________________ 14
Introduction ___________________________________________________________ 14
Coverage ____________________________________________________________ 15
Summary of data and comparison with other sources __________________________ 15
Conclusion ___________________________________________________________ 17
Experian data _____________________________________________________________ 18
Household income _____________________________________________________ 18
Tenure_______________________________________________________________ 20
Number of adult occupants _______________________________________________ 21
Energy efficiency measures data ______________________________________________ 22
The Energy Company Obligation and Green Deal _____________________________ 22
Homes Energy Efficiency Database ________________________________________ 23
Central Feed-in Tariff Register ____________________________________________ 24
Gas Safe Boiler Installations ______________________________________________ 24

Domestic NEED 2021 Annex C: Comparisons with other sources
3
Introduction The domestic National Energy Efficiency Data-Framework (NEED) is based on data from various sources linked together using a Unique Property Reference Number (UPRN). This document provides information on the quality assurance of data used in the production of analysis using NEED. This comparison with other sources covers properties in England and Wales only. This is due to the availability of comprehensive data sources in England and Wales that allows for the range of comparisons included in this document. This publication is updated and reviewed alongside each NEED publication. For more information on NEED, please see the NEED publication page.
Address Matching Identifying properties using Unique Property Record Numbers (UPRN) is central to the NEED framework. BEIS matches the address information from different datasets to a UPRN. For example, using address information provided by energy suppliers, metered energy consumption is matched to a property using its UPRN. Household attributes such as the number of bedrooms in a property (supplied by Experian) are also linked using the UPRN. With over 25m domestic properties in England and Wales, some properties have conflicting information, and it is not always possible to match to a UPRN. In other cases, incorrect property information may be matched to a meter, though these are a minority of cases. The UPRNs contained in NEED underwent a thorough revision prior to the NEED 2021 publication based on a new address matching algorithm. The new address matching algorithm is estimated to have an error rate of around 1% for domestic addresses compared to around 4 to 5% based on the previous algorithm used.
Outputs from England and Wales Domestic NEED are based on all UPRNs contained in the VOA Council Tax Database that have been successfully matched, via their UPRN, to gas and electricity meter data. Figure 1 shows the distribution of properties in 2021 NEED compared with the latest ONS English regional household and Welsh Government household estimates, and MHCLG English regional and Welsh Government estimates of the housing stock. The overall distribution of properties in NEED is aligned with ONS household estimates, with the largest discrepancy being in London at around 1 percentage point. This is largely due to loss of records from the address matching process, which is disproportionately high in London due to the higher proportion of flats, for which the address matching process has a lower match rate. In comparison with estimates of the dwelling stock the picture is broadly the same, with overall alignment between NEED across regions, and the largest discrepancy being seen in London.

Domestic NEED 2021 Annex C: Comparisons with other sources
4
Figure 1: The composition of Domestic NEED compared with the Council Tax Database (VOA), and other sources, England and Wales
Table 1 summarises the strengths and weaknesses of each of the main data sources used for the June 2021 NEED publication. These strengths and weaknesses should be kept in mind when interpreting NEED statistics.
Table 1: Strengths and weaknesses of data in NEED
Data source Coverage Strengths Weaknesses Consumption data • Great Britain • Good coverage of almost all
properties. • Data provided by energy
suppliers. • Gas data is weather-corrected.
• Based on meter readings. Estimates are used in place of actuals where a meter is not read.
• Gas and electricity years do not cover the calendar year (or the same period as each other).
Valuation Office Agency (VOA)
• Covers every property in England and Wales.
• Excellent coverage. More than 99% of properties in the NEED sample for all variables.
• No Scotland data. • Some attributes data may not be up
to date. Experian • Data available for
each household in Great Britain.
• Best source of data for property level household characteristics.
• Modelled data with varying accuracy at the property level.
HEED/Ofgem/energy efficiency datasets (including ECO, Green Deal)
• Covers households in the UK.
• Datasets contain data of energy efficiency measures, installed under government schemes.
• Only covers measures installed through government schemes; does not include measures installed by the householder or house builder.
Central Feed-In-Tariff Register (FITS)
• Covers every property in Great Britain.
• Excellent coverage, containing good quality address information.
• Does not include auto-generation outside of FITS.
• The FITS ended in March 2019. Gas Safe Boiler Installations
• Covers every property in Great Britain.
• Excellent coverage, contains information on all boiler installations in Great Britain.

Domestic NEED 2021 Annex C: Comparisons with other sources
5
Address matching and sample creation The NEED dataset compiled for the 2021 publication is comprised of data sets covering different time periods: gas and electricity consumption data covers 2019, VOA property data extracted in early 2020, ONS UPRN directory data was extracted in February 2021 and Experian data covers 2020 household characteristics.
Prior to 2019, a stratified random sample of approximately one in five records was selected from the complete property attribute dataset held by VOA. The resulting sample contained approximately 4 million records. From 2019, NEED has utilised all properties contained in the VOA Council Tax Database.
Table 2: How the samples of properties used in the 2019 NEED domestic energy consumption estimates for England and Wales are arrived at
Number of Properties
Percentage of the starting population
Gas Electric Either Gas Electric Either Step 1: All domestic properties (VOA database) 26.3 26.3 26.3 100% 100% 100%
Step 2: Matching meter points (all Domestic NEED 2021) 20.3 24.0 24.5 77% 91% 93%
Step 3: Removing invalid consumption for 2019 18.5 22.8 23.7 70% 87% 90%
Step 4: Removing cases with missing attributes 18.3 22.5 23.4 70% 86% 89%
Step 5: Removing uncommon property types 18.2 22.4 23.3 69% 85% 89%
Final 18.2 22.4 23.3 69% 85% 89%
Table 2 shows the number of properties used for the latest (2019) consumption estimates for England and Wales. More details on the five steps set out in Table 2 can be found in Annex D: Methodology Note. After processing the data, a total of 18.2 million properties were used for gas (70% of all domestic properties) and 22.4 million properties were used for electricity (86% of all domestic properties).
The lower number of properties used for the 2019 gas estimates than for the 2019 electricity is due to a lower proportion of domestic properties with a meter matched them for gas (78%) than electricity (92%). This is to be expected as a proportion of domestic properties are not connected to the gas grid.
The Consumption data section of this document is based on 18.2 million properties for gas and 22.4 million properties for electricity. All subsequent sections of this document (which look at attributes of the properties used for the 2019 estimates) are based on the 23.3 million properties which had either gas or electricity estimates in the 2019 consumption year.
To create NEED, the addresses corresponding to each record in a given dataset are matched to addresses in AddressBase (Ordnance Survey’s database of all addresses in Great Britain). This is to retrieve the Unique Property Reference Number (UPRN) that Ordnance Survey have assigned to the address. This process is referred to as “address matching”. Once the records

Domestic NEED 2021 Annex C: Comparisons with other sources
6
in each dataset have been address-matched, the various datasets can be matched to each other using the UPRN. Table 3 shows the proportion of records in each dataset which could be matched to AddressBase.
Table 3: Address matching rates for data sources Used for England and Wales in Domestic NEED
Data source Match rate
Matched using BEIS address matching algorithm
Meter point electricity (all meters) 91% Meter point electricity (profile classes 1-2) 94% Meter point gas (all meters) Meter point gas (less than 50,000 kWh)
92% 94%
Central Feed-in Tariff Register 95% ECO measures 95% HEED 94% Green Deal measures 90% Gas safe 91%
Data sources with UPRNs included
VOA (property attributes) 99% Experian (household characteristics) 95%

Domestic NEED 2021 Annex C: Comparisons with other sources
7
Consumption data UK Government has collected and published energy consumption data in the Digest of UK Energy Statistics since 1948. A time series on how energy has been used, including data back to 1970, is also published in Energy Consumption in the UK. Data at individual meter point level (which makes up the consumption part of NEED) were first obtained in 2004 in order to produce local area estimates of consumption—this work was awarded a Royal Statistical Society Award for innovation in 2010. These meter point consumption data cover both gas and electricity consumption for all homes and businesses within England, Scotland and Wales. Property-level data are not available for other heating fuels such as oil, wood or coal. The electricity and gas data are from energy suppliers' administrative systems and cover all domestic and non-domestic meters in England, Wales and Scotland, which is 31.3 million consuming electricity meters and 24.4 million consuming gas meters in 2019. Consumption data based on these meter level readings are published by BEIS down to postcode level for both electricity and gas data. This section provides more detail on the gas and electricity consumption data used in NEED.
Gas consumption data
Data collection
BEIS obtains annualised consumption estimates for all gas meters in Great Britain. All meter-point data for 2019 came from Xoserve, the data service provider responsible for the collation and aggregation of gas consumption. BEIS is provided with annualised estimates of consumption for all the Meter Point Reference Numbers (MPRNs) in Great Britain based on an Annual Quantity (AQ). The latter is an estimate of annualised consumption using consumption recorded between two meter readings at least six months apart. The estimate is then adjusted using a weather correction factor. The AQ for each MPRN represents consumption relating to the gas period —for 2019 this covers consumption from mid-May 2019 through to mid-May 2020.
The data are provided with permission from the owners of the Local Distribution Zones (LDZ) network (these are the four major gas transporters in Great Britain – National Grid, Scotia, Wales and West Utilities and Northern Gas Networks) and with agreement from the gas suppliers.
There is currently no reliable way to distinguish between gas used by domestic customers and that used by industry/commerce. NEED uses domestic council tax information to define which customers are domestic. BEIS’ Sub-national consumption publication instead uses the gas industry cut off of 73,200 kWh, with customers using less than this cut-off value assumed to be domestic. It means that there are significant number of businesses (estimated to be approximately 2 million3) misallocated in the sub-national estimates. BEIS is looking to resolve this issue, but this does not affect NEED data.
3 This figure is an approximation based on the difference between the number of non-domestic meters recorded in electricity and gas data in the Sub-national Consumption publication, accounting for the proportion of properties with electric meters which are off the gas grid.

Domestic NEED 2021 Annex C: Comparisons with other sources
8
Data validation
Gas consumption in the majority (99.2 per cent) of VOA classified domestic properties is below 50,000 kWh and the relatively small number of properties with consumption greater than this have been excluded. This should reduce the likelihood of including non-domestic properties or domestic properties with invalid consumption in the analysis. At the lower end of the consumption figures distribution, there is a cluster of values less than 100 kWh. In 2019, 1.1 per cent of gas consumption records in NEED fell into this category. These have also been excluded from all analysis, as they are likely to be properties with gas supplies which are not used, unoccupied new build properties or where there has previously been an overestimate of the gas consumed at a property. In addition, meter readings thought to be estimated have been excluded from the data before analysis was undertaken. These estimated meter readings take two forms. For any given year, an estimate is assumed if a property has a gas consumption value identical to the previous year. There are also a small number of cases which are suspected to be estimated readings used by suppliers (i.e., estimates based on typical consumption for certain property types, sizes, etc). Here, a particular value for consumption appeared in the data more often than would be expected given the frequency of similar consumption values. Comparison with other sources
To check that the sample used for analysis is consistent with the other estimates of domestic consumption published by BEIS and to lend confidence in use of the data, the mean consumption for NEED4 has been compared with the data published by BEIS in ECUK and the sub-national consumption statistics. Figure 2 shows that when looking at gas consumption for 2019, the mean is similar for the published sub-national statistics5 and NEED at 13,500 kWh and 13,300 kWh respectively (when rounded to the nearest 100 kWh). While the subnational estimate is based on the meter readings alone (with a maximum reading as per the gas industry cut-off of 73,200 kWh being classed as domestic), for the NEED estimates gas meters are matched to properties in the VOA’s database of domestic properties, providing a more reliable way of isolating domestic properties. Figure 2 also illustrates that for 2008 to 2015 there is some variation when comparing the mean consumption in NEED with that presented in ECUK, however from 2016 to 2019 both NEED and ECUK are very similar. For the years before 2016, gas consumption data in the NEED sample cannot be exactly reconciled with ECUK for a number of reasons:
• the consumption data in ECUK are based on a calendar year whereas the gas consumption data in NEED cover October to September for years 2008 to 2015.
• there are differences in the weather correction method used for ECUK and that for the meter point consumption data.
• the consumption data in ECUK cover the United Kingdom, whereas NEED covers England and Wales only.
• the different sources of data used for these publications: ECUK estimates are based on aggregate estimates of energy supplied, while NEED is based on end use consumption from gas meters.
4 The consumption estimates for England and Wales cover England only for 2005 to 2010, and England and Wales from 2011 to 2019. 5 For more information, see Table 4 below, and Annex D: Methodology Note.

Domestic NEED 2021 Annex C: Comparisons with other sources
9
• ECUK data are based on the number of customers. This differs from the number of meter points since it is possible for a single property to have more than one meter installed.
Figure 2: Comparison of estimates of mean gas consumption (kWh) per property
Electricity consumption data
Data collection
Data are collected with the full co-operation of the electricity industry. Annualised consumption data are generated by the data aggregators who work on behalf of electricity suppliers to collate and aggregate electricity consumption levels for each customer meter or Meter Point Administration Number (MPAN). In addition to this, address information for each meter is obtained from the Electricity Central Online Enquiry Service (ECOES).
The electricity consumption data are generated for both Non-Half Hourly (NHH) meters (domestic and small/medium commercial/industrial customers) and for Half Hourly (HH) meters (larger commercial/industrial customers). There are around 30.9 million NHH meters and approximately 0.3 million HH meters in Great Britain. For the NHH data, annualised estimates are based on either an Annualised Advance (AA) or Estimated Annual Consumption (EAC). The AA is an estimate of annualised consumption based on consumption recorded between two meter readings. In comparison, an EAC is used where two meter readings are not available, and an estimate of annualised consumption is produced by the energy company using historical information. These data provide a good approximation of annualised consumption, but do not exactly cover the calendar year. For example, 2019 annualised consumption estimates cover the period from 31st January 2019 up to 30th January 2020. For the half hourly meter consumption estimates, data aggregators produce a report for each MPAN for the relevant calendar year.

Domestic NEED 2021 Annex C: Comparisons with other sources
10

Domestic NEED 2021 Annex C: Comparisons with other sources
11
BEIS publishes estimates of domestic and non-domestic consumption with aggregate and average consumption figures provided for each local authority. The domestic consumption is based on NHH meters with profiles 1 and 2 (these are the standard domestic and economy 7 meters respectively). Non-domestic consumption is based on NHH meters with profiles 3 to 8 and all HH meters6. However, it should be noted that these assumptions differ from those used in NEED, where the additional data available mean it is more appropriate to use a slightly different approach to ensuring a property is domestic and has valid consumption. This is described in more detail in the data validation section below.
Data validation
There are differences in the consumption records included in the sub-national consumption publications and those used in NEED.
Electricity consumption in the majority of VOA classified domestic properties (99.6 per cent) is below 25,000 kWh. The relatively small number of properties with consumption greater than this have been excluded from NEED, in order to avoid biasing estimates. This should reduce the likelihood of including non-domestic properties or domestic properties with invalid consumption in the analysis.
At the lower end of the distribution, there is a further cluster of values (1.7 per cent) including negatives with consumption up to 100 kWh. These have been excluded from all analysis, as they are likely to represent properties with electricity supplies which are not used (or new build properties which are not yet occupied). Unlike in sub-national consumption statistics, all negative meter readings are also excluded7, which raises the overall mean of NEED electric data.
In addition, suspected estimated values have been excluded from the data before analysis was undertaken. These take two forms. For any given year, if a property has a consumption value identical to the previous year it is assumed to be an estimate. There are also a small number of values which are suspected to be estimated readings used by suppliers. As for the gas estimations, these were assumed on the basis of values that appear in the data more often than would be expected given the frequency of similar consumption values.
The impact of removing these records is small. It causes the mean for NEED to be slightly lower than if these filters were not applied, due to the elimination of a relatively small number of records with a high consumption. The median remains almost the same.
6 Non-domestic consumption also includes any nominally domestic meters with consumption of more than 100,000 kWh in a year or meters with consumption between 50,000 and 100,000 kWh with address information which suggests non-domestic use. 7 As data are based on billed consumption, it is possible that a negative reading is valid if an estimated reading provided in a previous year was too high, as at the aggregate level the effect of this will cancel out. However, these reading are not considered valid in NEED.

Domestic NEED 2021 Annex C: Comparisons with other sources
12
Comparison with other sources
To assess the consistency of the analysis sample with the other estimates of domestic consumption published by BEIS—and therefore increase confidence in use of the data—mean electricity consumption for NEED8 was compared with the data published by BEIS in ECUK and in sub-national consumption statistics. Figure 3 below shows that the mean electricity consumption is similar for all three sources being compared. When looking at consumption in 2019, the difference between the mean electricity consumption in NEED and ECUK is just under 100 kWh (2.4 per cent). The 2019 sub-national electricity consumption mean is just under two per cent lower than that of NEED. This is due to NEED excluding meters where consumption is more than 25,000 and less than 100 kWh, whereas these meters are included in the sub-national analysis.
Figure 3: Comparison of estimates of mean electricity consumption (kWh) per property
Conclusion
The consumption data are a rich source of data which form the core of NEED. Table 4 summarises the approaches taken towards using the meter point consumption data in domestic NEED and BEIS’ sub-national estimates. The differences lead to small discrepancies in mean consumption but provide confidence in the analysis carried out by NEED, including in relation to the impact of installing energy efficiency measures. The comparisons carried out against other data sources confirm that the consumption estimates based on NEED are consistent with other sources.
8 The NEED sample covers England only for 2005 to 2010, and England and Wales between 2011 and 2019.

Domestic NEED 2021 Annex C: Comparisons with other sources
13
Table 4: Differences in domestic consumption data9,10 NEED data Sub-national consumption estimates
The property must be included as a domestic property in the Valuation Office Agency property attribute dataset to be included in the domestic NEED analysis.
Domestic properties are based on consumption for gas (less than 73,200 kWh) and profile class for electricity (profiles 1 and 2 are domestic).
Gas consumption between 100 kWh and 50,000 kWh.
Gas consumption below 73,200 kWh.
Electricity consumption between 100 kWh and 25,000 kWh.
Electricity consumption below 100,000 kWh and profile class 1 or 2 (including negative readings).
Data matched to other sources via a unique property reference number (UPRN) at property level.
Data assigned to a Lower Super Output Area.
Suspected estimated readings removed.
9 Electricity consumption of between 50,000 and 100,000 kWh is reviewed and if it is considered to have a non-domestic address then it is also excluded from the sub-national domestic estimates. 10 This means that for the sub-national consumption statistics some properties can be assigned accurately if the street is identified even if the exact property is not known.

Domestic NEED 2021 Annex C: Comparisons with other sources
14
Valuation Office Agency Data
Introduction
The Valuation Office Agency (VOA) is the central Government agency responsible for valuing homes in England and Wales for council tax purposes11. The VOA has had responsibility for valuing properties for council tax purposes since it was first introduced in 1993 and, before then, for the earlier system of domestic rates. Property attribute data was originally introduced in the 1970s in order to provide a simple system for understanding the main features and attributes of a property.
In order to maintain accurate and fair lists of council tax bandings, the VOA needs to keep the information it holds about properties up to date. It does this in a number of ways, including:
• Obtaining information from the local authority when a home is extended or altered to the extent that planning permission is required;
• Using voluntary questionnaires to enable the occupier to confirm information about a property;
• Obtaining other sources of freely available and publicly published information. For example, a contract with Calnea Analytics to access the Residata website which contains details of properties marketed through mouseprice.com since 2007;
• In addition, the VOA will sometimes ask to visit a property when the information it needs cannot be ascertained from other sources. This can be at the occupier’s request; for example, when they have challenged the council tax banding of their property and wish the VOA to carry out a review.
There are 16 individual property attributes collected, four of which are used in NEED analysis:
• property type • property age • floor area (m2) • number of bedrooms
11 It does not set the level of council tax nor collect the money, which is the task of local government.

Domestic NEED 2021 Annex C: Comparisons with other sources
15
Coverage
Table 5 below shows the categories of data used in the analysis for each of the VOA variables (categories are those published in the English Housing Survey). In most cases, VOA has more detailed data; the VOA categories have been grouped into the categories used for the purposes of the NEED analysis and presentation of results. Full details of the breakdowns included in the VOA dataset are available on the VOA website.
Table 5: VOA property attribute data categories used in NEED
Property age Property type Number of bedrooms
Floor area (m2)
Pre-1919 Detached 1 1-50
1919-44 Semi-detached 2 51-100
1945-64 End terrace 3 101-150
1965-82 Mid terrace 4 151-200
1983-92 Bungalow 5 or more Greater than 200
1993-99 Purpose-built flat
Post 1999 Converted flat
Summary of data and comparison with other sources
This section shows how NEED compares with the distribution of the data in the full VOA property attribute database and with the English Housing Survey (EHS). The EHS will vary compared with the VOA data as it is a sample survey and only covers England, whereas VOA data and NEED cover England and Wales. However, it still provides context to validate the NEED data. Figures 4 to 6 show the proportion of properties in each category for three of the VOA variables used in NEED. EHS calculate different floor area categories which make meaningful comparison between sources difficult. The most notable variations between NEED and other data sources are seen for flats and for one- and three-bedroom properties. There is also some variation between fuel type. For example, there are proportionally fewer one-bedroom gas properties than three-bedroom gas properties. This is likely to reflect difficulties in address matching flats, but also an indication that flats are more likely to use electricity as the main heating fuel.

Domestic NEED 2021 Annex C: Comparisons with other sources
16
Figure 4: Comparison of distributions – number of bedrooms
Figure 5: Comparison of distributions – property type

Domestic NEED 2021 Annex C: Comparisons with other sources
17
Figure 6: Comparisons of distributions – property age
Conclusion
The NEED data shows similar distributions of property attributes compared to the VOA administrative dataset and the EHS sample survey data. There are some differences for flats and smaller properties which should be considered when interpreting analysis based on NEED.
Domestic NEED 2021 Annex C: Comparisons with other sources
18
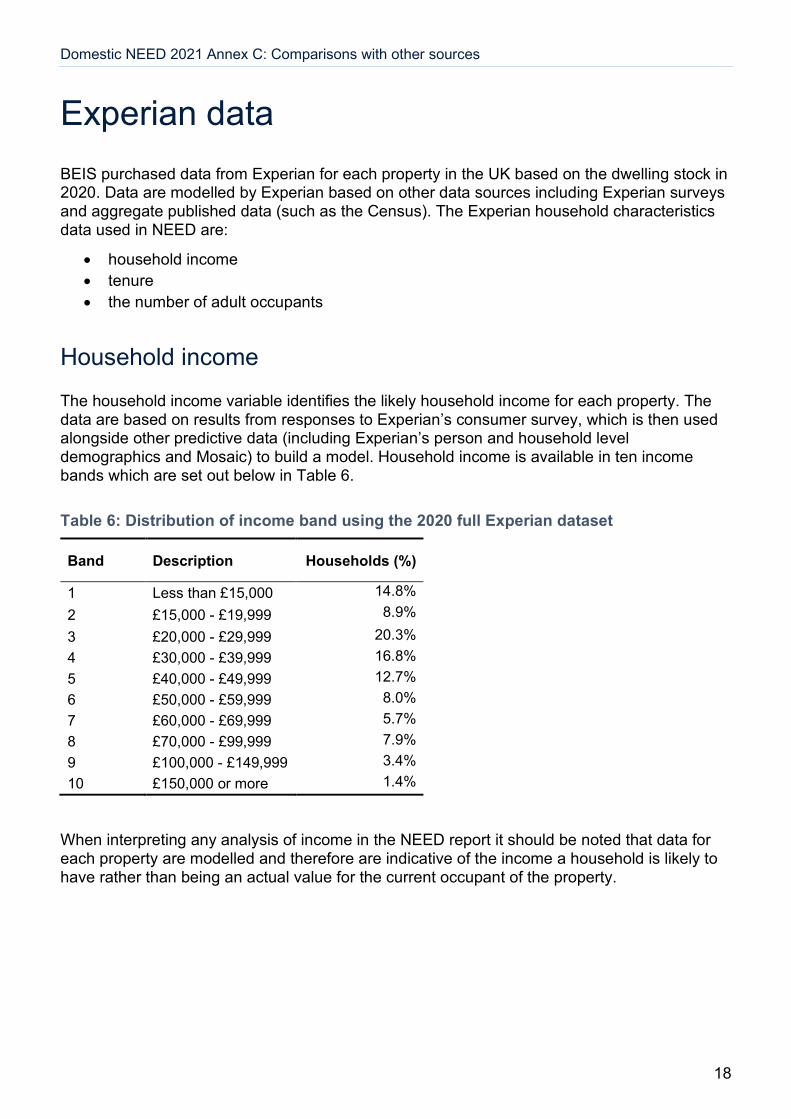
Experian data BEIS purchased data from Experian for each property in the UK based on the dwelling stock in 2020. Data are modelled by Experian based on other data sources including Experian surveys and aggregate published data (such as the Census). The Experian household characteristics data used in NEED are:
• household income • tenure • the number of adult occupants
Household income
The household income variable identifies the likely household income for each property. The data are based on results from responses to Experian’s consumer survey, which is then used alongside other predictive data (including Experian’s person and household level demographics and Mosaic) to build a model. Household income is available in ten income bands which are set out below in Table 6. Table 6: Distribution of income band using the 2020 full Experian dataset
Band Description Households (%)
1 Less than £15,000 14.8% 2 £15,000 - £19,999 8.9% 3 £20,000 - £29,999 20.3% 4 £30,000 - £39,999 16.8% 5 £40,000 - £49,999 12.7% 6 £50,000 - £59,999 8.0% 7 £60,000 - £69,999 5.7% 8 £70,000 - £99,999 7.9% 9 £100,000 - £149,999 3.4% 10 £150,000 or more 1.4%
When interpreting any analysis of income in the NEED report it should be noted that data for each property are modelled and therefore are indicative of the income a household is likely to have rather than being an actual value for the current occupant of the property.

Domestic NEED 2021 Annex C: Comparisons with other sources
19
Based on Experian’s assessment of the data, 25 per cent of properties are in the correct category and 58 per cent of properties are assigned to within one band of the correct category. Figure 7 shows how the distribution of income for the Experian dataset and NEED compares with the income reported by the EHS for 2019-20. Note that some of the income categories from the Experian data have been grouped together to allow comparison with the categories used in the EHS. Figure 7 shows that Experian appears to be under-assigning properties to the lowest income band and over-assigning them at the higher income bands, compared to the EHS data. This is consistent with BEIS’ understanding that the Experian income data is less reliable at the extremes. However, it should also be noted that the EHS is a survey and therefore subject to variation. Income is a self-reported variable and therefore likely to be less reliable compared to the EHS property variables which are based on a physical survey on the property carried out by a trained surveyor. Figure 7: Comparison of distributions – household income band

Domestic NEED 2021 Annex C: Comparisons with other sources
20
Tenure
Tenure data from Experian allocates each household in the UK to one of three categories; owner occupied, council/housing association or privately rented. The data are based on responses to Experian’s lifestyle survey which are then used to predict the status of all households. As with the household income variable, a model is used to predict the tenure for each property.
Figure 8 shows how the Experian data compares with the NEED gas and electric samples and EHS at the national level12. It shows that the proportion of properties assigned to each tenure category is similar for all sources. It appears that the Experian dataset as a whole and NEED allocates too many properties to the owner-occupied category and too few to privately rented. This is likely to be linked to the loss of flats resulting from the address matching process.
Figure 8: Comparison of distributions – tenure
12 Note that the Experian full dataset covers the UK, the NEED sample covers England and Wales, and the EHS covers England only.

Domestic NEED 2021 Annex C: Comparisons with other sources
21
Number of adult occupants
The number of adults variable gives the number of adults over 18 living in a household. Experian takes the number of adults information from its Consumer View database. Figure 9 shows how the data in the gas and electric NEED samples compare with other sources. The variation in the distribution is likely to be because the EHS estimates are based on household size whilst the Experian data is based on the number of occupants aged 18 and over. This means a household with two adults and two children would be classified as two in the Experian data and four in the EHS. Therefore, there are more properties with one or two occupants in the Experian data and more properties with three or more in the EHS.
While the Experian data are valuable since they provide an understanding of the properties in NEED and how consumption and impact of energy efficiency measures vary for different types of households, it is important that interpretation of results relating to income, tenure and number of adult occupants is kept within the context of the limitations of the data.
Figure 9: Comparison of distributions – number of adults

Domestic NEED 2021 Annex C: Comparisons with other sources
22
Energy efficiency measures data
The Energy Company Obligation and Green Deal
The Energy Company Obligation (ECO) and Green Deal (GD) are Government energy efficiency schemes which began operating in 2013. They replaced the previous schemes: Carbon Emissions Reduction Target, Community Energy Saving Programme and Warm Front. Their aim is to encourage the uptake of energy efficiency measures so that the efficiency of the building stock is improved. The current ECO3 scheme will last three and a half years, having started in December 2018 and will run until March 2022.
The geographical coverage of ECO and GD statistics varies across the schemes as follows:
• ECO: Great Britain • GD Plans: Great Britain • Green Deal Home Improvement Fund England and Wales • GD Communities: England (selected LAs)
The types of energy efficiency measures that can be installed under ECO include:
• External and Internal Solid and Cavity Wall Insulation (including Party Wall Cavity Wall Insulation)
• Loft Insulation • Flat Roof Insulation • Park Home Insulation • Room-in-Roof Insulation • Underfloor Insulation • Solid Floor Insulation • Window Glazing • Energy Efficient Doors • Boilers (new and replacements) • Electric Storage Heaters (new and replacements) • District Heating Systems • Heating Controls (Conventional and Smart), Smart Thermostats and Thermostatic
Radiator Valves • Solar PV
For a full list of measures that can be installed under ECO3, see the Ofgem ECO3 measures table. Information on installations from ECO and GD are currently used in NEED’s ‘Impact of measures installed’ analyses to inform energy savings from energy efficiency measure installations.

Domestic NEED 2021 Annex C: Comparisons with other sources
23
Uncertainty and bias
The data sources listed in this document are all subject to a range of data quality checks employed by both data providers and BEIS to ensure that data are as fit for purpose as possible13. Energy efficiency measures that are installed outside of Government schemes would not be captured in the estimates published. This can occur when measures are financed through another route such as savings, payment from a landlord, housing association or Local Authority.
Homes Energy Efficiency Database
The Homes Energy Efficiency Database (HEED) is a national database developed by the Energy Savings Trust (EST). It was set up to help monitor and target carbon reduction and fuel poverty work. It contains details of energy efficiency and micro-generation installations such as cavity wall insulation and solar hot water. HEED also includes data about property attributes (such as property age and type) and heating systems. However due to coverage and quality these data are not used in NEED.
Data have been recorded in HEED since 1995 until 2013 including activity reported from Government programmes, such as the Energy Efficiency Commitment (EEC) and the Carbon Emissions Reduction Target (CERT), and activity reported by trade associations such as CORGI (Gas Safe) and FENSA. Approximately 50 per cent of UK homes have a record in HEED. However, there may not be complete information for each of these records. For example, if a measure has been installed through a Government scheme, then there may be information on the measure installed but no information on what other energy efficiency measures the property has if they were not installed through a Government scheme. Because the majority of measures recorded in HEED are measures installed through Government schemes which are aimed at particular segments of the population, the types of properties receiving measures are not representative of the populace or of the housing stock as a whole. HEED includes a high proportion of the measures reported by suppliers to Ofgem. As no information is known about the specific properties receiving measures reported by Ofgem it is not possible to determine whether there is any bias in the HEED data, but the good coverage of HEED means that any bias should be small. Coverage of current installations extracted from ECO is comparable to previous schemes such as CERT. Over the four-year period that CERT was active, Ofgem reported that 55,000 (around 14,000 per year) properties had solid wall insulation installed. This compares with 42,000 installations (around 14,000 per year) recorded in NEED using the ECO data between 2015 and 2017.
13 Details on the checks that are carried out are included in the ‘Data quality of data sources’ section of the Annex D: Methodology Note which accompanies the statistical releases.

Domestic NEED 2021 Annex C: Comparisons with other sources
24
When considering the quality of HEED data included in NEED it should also be noted that the installation dates associated with records are of varying quality. This is particularly so for earlier installations of solid wall insulation where it is not possible to distinguish when between 2005 and 2008 measures were installed.
Central Feed-in Tariff Register
The Central Feed-in Tariff Register (CFR) is an electronic, web-based system used to manage the Feed-in Tariff (FIT) scheme that Ofgem administers on behalf of BEIS. Extracts from the CFR are provided to BEIS on a monthly basis, and serve as the basis of a number of statistical publications on the FIT scheme. The CFR contains installation-level data on every microgeneration installation that is registered for and receives feed-in tariffs. The scheme ended for new entrants in April 2019 and the data used in this publication are from the March 2019 extract.
Coverage and comparison with other sources
The FIT installation data recorded in the CFR include:
• geographical location • technology type (e.g., wind, solar) • installed capacity • type of installation (i.e., domestic, community, or commercial)
Gas Safe Boiler Installations
Gas Safe are the organisation that maintains the registration of all legally installed gas appliances and replaced CORGI as the gas registration body in 2009. Boiler installation data is provided to BEIS annually and contains information on the type of boiler installed and property address information that can link the installation to a UPRN. BEIS cross checks new boiler installations at a property to only include the most recent installation. Gas Safe data includes installations up to March 2020; this does not cover the full gas year for 2019 and should be borne in mind when interpreting the impact of measures data for the current year.
Coverage and comparison with other sources
Gas Safe is the most comprehensive register of boiler installations and records as it is mandatory for all boiler installations to be registered in England and Wales. It therefore offers a more complete view of new boiler installations, rather than only looking at those installed through government schemes. Gas Safe boiler installations are recorded against 38 per cent of properties contained in NEED (for England and Wales), whereas ECO registered boiler installations are recorded against only 2 per cent of properties.

© Crown copyright 2021
This publication is licensed under the terms of the Open Government Licence v3.0 except where otherwise stated. To view this licence, visit nationalarchives.gov.uk/doc/open-government-licence/version/3 or write to the Information Policy Team, The National Archives, Kew, London TW9 4DU, or email: [email protected].
Where we have identified any third-party copyright information you will need to obtain permission from the copyright holders concerned.
This publication is available from: www.gov.uk/government/collections/national-energy-efficiency-data-need-framework
If you need a version of this document in a more accessible format, please email [email protected]. Please tell us what format you need. It will help us if you say what assistive technology you use.