
Annex 5.5 Bat survey report
114
Bracklyn Wind Farm Annex 5.5: Bat Survey Report Bracklyn Wind Farm Limited Galetech Energy Services Clondargan, Stradone, Co. Cavan Ireland Telephone +353 49 555 5050 www.galetechenergy.com
-
Upload
khangminh22 -
Category
Documents
-
view
6 -
download
0
Transcript of Annex 5.5 Bat survey report

Bracklyn Wind Farm
Annex 5.5:
Bat Survey Report
Bracklyn Wind Farm Limited
Galetech Energy Services
Clondargan, Stradone, Co. Cavan Ireland
Telephone +353 49 555 5050
www.galetechenergy.com

BAT SURVEY REPORT TO INFORM THE PROPOSED
BRACKLYN WIND FARM, CO. WESTMEATH
Results of the 2020 active bat season and habitat suitability assessments
Report prepared by Woodrow Sustainable Solutions Ltd.
Report by:
Woodrow Sustainable Solutions Ltd.,
Upper Offices,
Ballisodare Centre,
Station Road,
Ballisodare,
Co Sligo,
F91 PE04.
T: +353 (0) 0719140542
Email: [email protected]
May 2021

DOCUMENT CONTROL
Document Bat Survey Report for Proposed Wind Farm, Bracklyn, Co. Westmeath.
Client Bracklyn Wind Farm Limited
Prepared by
Woodrow Sustainable Solutions Ltd., Upper
Offices, Ballisodare Centre, Station Road,
Ballisodare Co Sligo, F91 PE04.
Report Compiled by
Rachel Irwin (Assistant Ecologist)
Oisín O Sullivan (Graduate Ecologist)
Aoife Moroney (Graduate Ecologist)
Will Woodrow (Director)
Checked Internally Will Woodrow (Director)
Approved by Will Woodrow (Director)
Status / Version / Date Final issue / 14.09.2021

STATEMENT OF AUTHORITY
Bat surveys conducted at the proposed Bracklyn Wind Farm Site over 2020 and 2021 were
undertaken by staff from Woodrow Sustainable Solutions Ltd (Woodrow), including: Rachel Irwin,
Kristi Leydon, Aoife Moroney, Nicole Fleming, Róisín NigFhloinn, Oisín O’Sullivan, Declan Manley,
Daelyn Purcell and Mike Trewby. Manual verification of bat sonograms, data analysis using Ecobat
and reporting, was undertaken by Oisín O’Sullivan, Aoife Moroney and Rachel Irwin; with input and
supervision from Will Woodrow. The report was compiled by Oisín O’Sullivan, Aoife Moroney and
Rachel Irwin, with final review and approval undertaken by Will Woodrow.
Will is a Director and Principal Ecologist at Woodrow Sustainable Solutions Ltd. and is an
experienced ecologist with over 30 years of experience in ecological surveys and impact assessment.
He has an authoritative understanding of bat ecology in relation to wind farm proposals. Will’s
qualifications include M.Sc. – European Environmental Policy and Regulation, Lancaster University,
1994, and M.Sc. (Arch) – Advanced Environmental and Energy Studies. University of East London,
2006. Will is a Chartered Ecologist and a full member of the Chartered Institute of Ecology and
Environmental Management (CIEEM). As such, he is required to abide by a strict code of professional
conduct in all aspects of his work.
Rachel Irwin, is a graduate ecologist at Woodrow and has spent two seasons coordinating the
company’s bat surveys under the direction of Will Woodrow. Over this time she has developed
considerable experience in Potential Roost Feature (PRF) surveys for bats, emergence/re-entry roost
surveys, activity transects and deployment of static bat detectors for numerous large wind farms sites
in both the Republic of Ireland and Northern Ireland; as well as other developments including quarries
and smaller residential projects. Rachel has also developed expertise in conducting roost searches of
buildings, bridges and trees under the supervision of licenced members of Woodrow staff - Róisín
NigFhloinn and Will Woodrow. During her time at Woodrow, Rachel has become accomplished at
manual identification of bat sonograms utilising Kaleidoscope and BatExplorer. Towards the end of
each active bat season, she was responsible for compiling bat reports. She also assists senior
members of staff with reporting for Ecological Impact Assessment (EcIA), Biodiversity Chapters for
Environmental Impact Assessment Reports (EIAR) and to inform the Appropriate Assessment (AA)
process. She is a Qualifying member of the CIEEM.
Oisín O’Sullivan is a graduate ecologist with Woodrow. Oisín has completed a B.Sc. in Ecology and
Environmental Biology at University College Cork. His final year thesis involved bat surveys of urban
habitats in Cork City. His work as a graduate ecologist with Woodrow is focused on bat data analysis
including bat call identification and bat roost/habitat suitability surveys. Oisín has developed a high
level of proficiency with Kaleidoscope, Ecobat and BatExplorer, the analysis software used to assess
bat calls and activity. Oisín also possess marine and freshwater habitat survey skills from his time
studying at UCC. Since joining Woodrow, Oisín has contributed to the writing of multiple bat activity
reports. Oisín is a Qualifying member of CIEEM.
Aoife Moroney is a Graduate Ecologist with Woodrow. She has completed a B.Sc. in Engineering at
University College Dublin and M.Sc. in Environmental Engineering (specialising in Environmental
Management) at the Technical University of Denmark and the Royal Institute of Technology, Sweden.
She is currently undertaking a Post-graduate Certificate in Ecological Survey Techniques at the
University of Oxford. She has also been involved with multiple conservation and research projects in
southern Africa. Aoife has developed a high level of proficiency with Kaleidoscope, Ecobat and
BatExplorer, the analysis software used to assess bat calls and activity. She is the process of
applying for membership of the CIEEM.

CONTENTS
1 Introduction ................................................................................................................................... 1 1.1 Protected status of bats in Ireland .......................................................................................... 1 1.2 Requirements for impact assessment ..................................................................................... 1 1.3 Outline of the scope of works .................................................................................................. 1 1.4 Layout of report ....................................................................................................................... 2 1.5 Limitations and issues pertinent to interpretation of bat survey results .................................. 5
2 Methodology ................................................................................................................................. 9 2.1 Desk study and site investigation ............................................................................................ 9 2.2 Roost assessment surveys ................................................................................................... 10 2.3 Bat activity surveys – roost emergence/re-entry surveys ..................................................... 10 2.4 Bat activity surveys – walked/driven transects ...................................................................... 11 2.5 Static bat detector surveys .................................................................................................... 13 2.6 Monitoring climatic of conditions ........................................................................................... 13 2.7 Calibration and testing of recording equipment .................................................................... 14 2.8 Analysis ................................................................................................................................. 14
3 Survey results ............................................................................................................................. 20 3.1 Desk based study .................................................................................................................. 20 3.2 Bat habitat suitability assessment ......................................................................................... 20 3.3 Transect survey reports 2020 & 2021 ................................................................................... 28 3.4 Static detector surveys .......................................................................................................... 37 3.5 Permanent static at height .................................................................................................... 54
4 Baseline conditions.................................................................................................................... 59 4.1 Habitat availability and roost suitability ................................................................................. 59 4.2 Summary of static deployment data ...................................................................................... 60 4.3 Species activity within the Wind Farm Site ........................................................................... 61 4.4 Bat activity associated with proposed turbine locations ........................................................ 64 4.5 Association of bat activity with features ................................................................................ 68
5 Assessment of potential impacts ............................................................................................. 70 5.1 Ecological evaluation of bat species ..................................................................................... 70 5.2 Valuing bat populations ......................................................................................................... 72 5.3 Risk Assessment ................................................................................................................... 74 5.4 Impact on bats ....................................................................................................................... 77 5.5 Construction phase: potential direct impacts on bats ........................................................... 77 5.6 Construction phase: potential secondary impacts on bats ................................................... 78 5.7 Operational phase: Potential direct impacts on bats ............................................................ 78 5.8 Operational phase: Potential secondary impacts on bats ..................................................... 81
6 Recommendations and Mitigation ............................................................................................ 82 6.1 Mitigation to avoid potential direct impacts on tree roosting bats ......................................... 82 6.2 Mitigation to avoid collision or barotrauma ............................................................................ 84 6.3 Mitigation to avoid potential secondary impacts on bat foraging / commuting habitat .......... 86 6.4 Post-construction monitoring ................................................................................................. 87
7 Conclusions ................................................................................................................................ 91
8 References .................................................................................................................................. 92
Appendix 1 ........................................................................................................................................... 94
- Static detector locations ............................................................................................................ 94
Appendix 2 ........................................................................................................................................... 96
- Maps showing bat feature buffers & proposed felling areas ................................................. 96
Appendix 3 ......................................................................................................................................... 102
- Felling areas for bat feature buffers & proposed re-planting scheme ................................ 102
Appendix 4 ......................................................................................................................................... 106
- Emergence and re-entry survey locations ............................................................................. 106

LIST OF TABLES
Table 1 – Dusk transect survey dates, timing & weather conditions for 2020 ....................................................... 12 Table 2 – Static bat detector deployment dates, locations & features covered during 2020 ................................. 19 Table 3 – Summary of bat habitat and roost suitability .......................................................................................... 22 Table 4 – BCI Roost Data within 10 km of the Site ............................................................................................... 23 Table 5 – Number of bat passes recorded throughout transect surveys ............................................................... 31 Table 6 – Bat activity levels associated with bat passes per hour (bp/h) .............................................................. 37 Table 7 – Categories for bat activity levels associated with bat passes per hour (bp/h) ....................................... 37 Table 8 – Bat activity levels categorised by percentile scores .............................................................................. 37 Table 9 – Summary table showing key metrics for each species recorded. .......................................................... 38 Table 10 – Number of nights of activity for each species in each activity band ..................................................... 38 Table 11 – Deployment locations and species with High or Moderate-High activity levels ................................... 39 Table 12 – Bat activity (bp/h) recorded by static detectors in 2020 ....................................................................... 40 Table 13 – Summary of bat passes per hour entire survey seasons..................................................................... 61 Table 14 – Summary of bat activity recorded by static detectors in 2020 ............................................................. 64 Table 15 – Conservation status of bat species in Ireland (Marnell et al. 2009) ..................................................... 71 Table 16 – Level of collision risk to individual bats from wind turbines .................................................................. 71 Table 17 – Level of potential vulnerability of bat populations in Ireland ................................................................ 71 Table 18 – Scoring system for valuing sites and foraging areas/ commuting routes for bats ................................ 73 Table 19 – Stage 2: Overall risk assessment matrix ............................................................................................. 75 Table 20 – Summary of impact assessment ......................................................................................................... 76 Table 21 – Optimal season for works at different roost types ............................................................................... 83 Table 22 – Turbine tower buffering distances for a range of feature heights ........................................................ 85
LIST OF FIGURES
Figure 1 – Bracklyn Wind Farm showing potential Zone of Influence (ZoI) on bats ................................................ 3 Figure 2 – Proposed grid connection and end masts with 30m potential ZoI for bats ............................................. 4 Figure 3a – Transect routes and emergence/re-entry survey locations ................................................................ 16 Figure 4 – Deployment locations for all static bat detectors and weather station in 2020 ..................................... 18 Figure 5a – Roost suitability assessment within the Wind Farm Site .................................................................... 24 Figure 6 – Coverage and bat registrations for dusk transect: 08-Jun-2020 ........................................................... 32 Figure 7 – Coverage and bat registrations for emergence surveys and dusk transect: 05-Aug-2020 ................... 33 Figure 8 – Coverage and bat registrations for emergence surveys and dusk transect: 02-Sep-2020 ................... 34 Figure 9a – Coverage and bat registrations for dawn transect and re-entry surveys: 03-Sep-2020 ..................... 35 Figure 10 – Indicative proximity of deployment locations to potential roosts in spring 2020 ................................. 42 Figure 11 – Indicative proximity of deployment locations to potential roosts in summer 2020 .............................. 44 Figure 12 – Indicative proximity of deployment locations to potential roosts in autumn 2020 ............................... 47 Figure 13 – Total bp/h for each species by static bat detectors for spring 2020 ................................................... 48 Figure 14 – Spring deployment – Mean hourly temperature, wind speed and rainfall ........................................... 49 Figure 15 – D.04 - Bat passes over time: 21-May to 08-Jun-2020 (Unit near T4) ................................................. 49 Figure 16 – Total bp/h recorded for each species by static bat detectors for summer 2020 ................................. 50 Figure 17 – Summer deployment – Mean hourly temperature, wind speed and rainfall........................................ 51 Figure 18 – D.06 - Bat passes over time: 23-Jun to 07-Jul-2020 (Unit near T6) ................................................... 51 Figure 19 – Total bp/h recorded for each species by static bat detectors for autumn 2020 .................................. 52 Figure 20 – Autumn deployment – Mean hourly temperature, wind speed and rainfall ......................................... 53 Figure 21 – D.02 - Bat passes over time: 25-Aug to 05 Sep-2020 (Unit near T2) ................................................. 53 Figure 22 – Total bat passes at continuously recording static - mic height 2 m .................................................... 56 Figure 23 – Total bat passes at continuously recording static - mic height 50 m .................................................. 56 Figure 24 – Leisler’s bat activity at 50m and 2m relative to weather conditions .................................................... 57 Figure 25 – Leisler's bat activity at 50m and 2m relative to weather conditions .................................................... 57 Figure 26 – Common pipistrelle activity at 50m and 2m relative to weather conditions ........................................ 58 Figure 27 – Soprano pipistrelle activity relative at 50m and 2m relative to weather conditions ............................. 58 Figure 28 - Pipistrelle spp. activity levels at the three detectors not positioned on linear features ........................ 69 Figure 29 – Equation to calculate turbine tower buffers ........................................................................................ 84 Figure 30 – Range for turbine-feature buffers, as calculated in Table 22 .............................................................. 90 Figure 31 – Felling at substation ......................................................................................................................... 102 Figure 32 – Felling and replanting at T4 .............................................................................................................. 102 Figure 33 – Felling at T5 ..................................................................................................................................... 103 Figure 34 – Felling at T6 ..................................................................................................................................... 103 Figure 35 – Felling at T7 ..................................................................................................................................... 104 Figure 36 – Felling at T10 with area of bog woodland not to be felled ................................................................ 104 Figure 37 – Felling at T11 ................................................................................................................................... 105

Bracklyn Wind Farm
Annex 5.5: Bat Survey Report 1
1 INTRODUCTION
1.1 Protected status of bats in Ireland
Bats are protected by law in the Republic of Ireland under the Wildlife Act 1976 and subsequent
amendments (2000 and 2010). Under the Wildlife Act, it is an offence to intentionally disturb, injure or
kill a bat or disturb its resting place. Under this legislation it is unlawful to destroy, alter or disturb
known bat roosts without an appropriate derogation licence, as issued by the National Parks and
Wildlife Service (NPWS).
All bat species fall under Annex IV of the EU Habitats Directive (1992), whereby member states have
a burden of responsibility to protect bats and their resting places wherever they occur. The EU
Habitats Directive has been transposed into Irish law with the European Communities (Birds and
Natural Habitats) Regulations 2011. The lesser horseshoe bat (Rhinolophus hipposideros), which
occurs only in Counties Cork, Kerry, Limerick, Clare, Mayo and Galway in the Republic of Ireland, is
listed in Annex II of the EU Habitats Directive 1992. The level of protection offered to the lesser
horseshoe bat effectively means that areas important for this species are designated as Special
Areas of Conservation (SACs). For remaining bats, the EU requires that they are strictly protected.
Among Ireland’s obligations under the Habitats Directive, is the obligation to ‘maintain favourable
conservation status’ of Annex-listed species.
Ireland has ratified two international conventions, which afford protection to bats amongst other fauna.
These are known as the ‘Bern’ and ‘Bonn’ Conventions. The Convention on the Conservation of
European Wildlife and Natural Habitats (Bern Convention 1982) exists to conserve all species and
their habitats, including bats. The Convention on the Conservation of Migratory Species of Wild
Animals (Bonn Convention 1979, enacted 1983) was instigated to protect migrant species across all
European boundaries, which covers certain species of bat.
1.2 Requirements for impact assessment
In order to comply with the requirements of the EU Habitats Directive 1992 and the EC Habitats
Regulations 2011, wind farm applications in Ireland need to be assessed as to their potential impact
on bat populations. To inform the impact assessment at the proposed Bracklyn Wind Farm Site (‘the
proposed development site’) a range of bat surveys were undertaken including a desk-based study
and field surveys. As of 2019, the appropriate methodological approach for assessing bat population
on proposed Wind Farm Sites is Bats and Onshore Wind Turbines: Survey, Assessment and
Mitigation (SNH et al., 2019) 1.
1.3 Outline of the scope of works
This report considers the proposed Bracklyn Wind Farm (‘the proposed development’), providing
details on the methodologies and results of bat surveys undertaken to investigate the bat usage and
habitat suitability of the Wind Farm Site (including substation) and grid connection route. For the
purpose of this report, the term ‘Wind Farm Site’ will be used to refer to the turbine array, substation
and associated access tracks; while the term ‘grid connection route’ will be used to refer to the
proposed route of the underground electricity line and proposed end masts.
The Wind Farm Site consists of a nine-turbine proposal located within the townland of Bracklin, Co.
Westmeath. The Wind Farm Site lies 4 to 5 km (depending on proposed turbine location) south of
1 Scottish Natural Heritage, Natural England, Natural Resources Wales, Renewable UK, Scottish Power Renewables,
Ecotricity Ltd, University of Exeter & Bat Conservation Trust (2019). Bats and Onshore Wind Turbines: Survey, Assessment
and Mitigation.

Bracklyn Wind Farm
Annex 5.5: Bat Survey Report 2
Devlin village, and c. 14 km north-east from the nearest point of Mullingar. Figure 1 shows the
locations of the proposed turbines with a 300 m buffer applied to illustrate the potential Zone of
Influence for bats, where survey effort was focused. The electricity substation and other infrastructure
associated with the Wind Farm Site is buffered by 30 m to illustrate the potential Zone of Influence for
bats. Figure 2 shows the proposed grid connection route with a 30m buffer applied to depict the
potential Zone of Influence, which was assessed for potential bat habitat suitability. The grid
connection route, exits the Wind Farm Site at T10 and will be laid underground, running east, initially
through Bracklin before entering the townland of Coolronan in Co. Meath, where it will be connected
to the proposed end masts and the Mullingar-Corduff 110kV overhead transmission line.
In compliance with SNH et al. (2019) guidelines, static bat recording equipment was deployed on
three occasions in 2020 at selected locations representative of the proposed turbine layout for the
Wind Farm Site. The three deployments, each lasting a minimum of 10 nights, covered the spring,
summer and autumn active season for bats and were undertaken in conjunction with continuous
monitoring of climatic conditions on the site to ensure recording windows were inline within compliant
weather parameters. A continuously recording static bat detector was deployed on the on-site
temporary meteorological mast, with 2 microphones, for the duration of the 2020 season and provided
comparative data on bat activity at height (50 m) and at ground level (2 m). To supplement data
collected from static bat detectors, manual roost emergence/re-entry surveys and bat activity
transects were undertaken and observations provide context to inform how bats utilise the Wind Farm
Site. In addition, an assessment of potential bat roost features within the Wind Farm Site and grid
connection route was completed, along with roost emergence/re-entry surveys and bat activity
transects.
At the time of the conducting this assessment the following information regarding turbine specification
was provided:
• Turbine make-model: Vestas V162
• Turbine tip heights: 185 m
• Rotor diameter: 162 m (blade length of 81 m)
• Hub height: 104 m (rotor swept height = 23 m)
Please note that although turbine make and model are specified here, the bat data collected and can
be adjusted for alternative turbine dimensions, as well as changes to site layout such as micro-siting
of turbines. The impact assessment outlined in the following sections has been conducted by applying
a range of turbine set-ups, including the most extreme (worst-case) scenario in turbine specifications,
i.e. largest, lowest to ground level rotor swept areas; and as such will be consistent with a
precautionary approach.
1.4 Layout of report
This report was written to be included as a technical appendix to Chapter 5 – Biodiversity of the EIAR
and provides details of methodologies and survey effort for the suite of bat surveys conducted for the
proposed development, including tabulated results, maps and charts, as well as reports from roost
suitability surveys, bat activity surveys and seasonal static bat detector surveys. These surveys allow
for the baseline bat populations and habitat suitability of the proposed development to be described
and to allow fora robust impact assessment to be conducted.

Bracklyn Wind Farm
Annex 5.5: Bat Survey Report 3
Figure 1 – Bracklyn Wind Farm showing potential Zone of Influence (ZoI) on bats

Bracklyn Wind Farm
Annex 5.5: Bat Survey Report 4
Figure 2 – Proposed grid connection and end masts with 30m potential ZoI for bats

Bracklyn Wind Farm
Annex 5.5: Bat Survey Report 5
1.5 Limitations and issues pertinent to interpretation of bat survey
results
In the case of bat surveys, survey limitations often relate to weather conditions at the time of the
surveying and equipment failing in the field, for example microphones can be damaged by livestock or
can lose sensitivity when exposed to prolonged episodes of heavy rainfall.
The sections below provide details for any potential limitations to the bat surveys. Overall, it is
considered that the combined survey approach and coverage over the 2020 survey season, with
additional surveying conducted in 2021 to cover the route to the grid connection, provides robust data
from which a full insight into the use of the proposed development site by bats can be obtained. As
such, this information can be used to assess any potential impacts of the proposed development on
the local bat population. Given the survey methodologies used to ensure full coverage of proposed
development site across the bat activity season 2020, it is considered that the data obtained
complies, in full, with the recommend guidelines set out within Bats and Onshore Wind Turbines:
Survey, Assessment and Mitigation (SNH et al., 2019).
1.5.1 Coverage
It is considered that static bat detector coverage of the Wind Farm Site for bat activity in 2020 was in
line with the SNH et al. (2019) guidelines. Due to reasons relating to access and habitat structure, bat
equipment could not always be setup at exact proposed turbine locations, e.g. when proposed turbine
locations are in dense conifer plantations. While this was not considered to limit the robustness of the
data set, it is important to acknowledge the deployment locations in relation to the turbines, as this
has implications for interpretation of bat activity. For instance, deploying units away from proposed
turbine locations within plantations and along the edge of habitat features is likely to lead to more bats
being registered, which may not be a true reflection of activity at a given turbine location.
Appendix 2 provides a series of aerial images, one for each proposed turbine location, and illustrates
the deployment locations relative to the turbines. To distinguish between locations where bat
recording equipment was deployed and the proposed turbine locations, different numbering systems
have been used for these features throughout this report, numbers preceded by ‘T’ refer to turbine
locations and those with a ‘D’ refer to static bat detector deployment locations.
For clarity, the relationship between turbine and deployment locations is reviewed in the following
points. In summary, the majority of deployment locations (those covering T4, T5, T6, T7, and T11)
were positioned within 81m of the turbine tower and as such are considered to be monitoring airspace
within the rotor swept area. The deployment locations covering T1 was just beyond the 81m mark (c.
90m). For T2, T3 and T10 the separation distance was slightly wider (c. 120m, 300m and c.130m
respectively).
Units at T4, T5, T6, T7, T10 and T11 were all deployed within or on the edge of commercial plantation
as a result of the turbine location or other issues, such as livestock interference. Units at T2 and T3
was also placed along linear features. It is important to note that these deployments are unlikely to be
representative of habitat conditions once turbines are built and vegetation clearance around the
turbines is likely to alter how bats utilise the area. The placement of these detectors along high quality
foraging interfaces results in very high levels of activity being recorded. It is very important to note that
the levels of bat activity recorded by static bat detectors deployed at proposed turbine locations are
not representative of the actual number of bats. Bat activity generally considered as the number of bat
pass over time, with a bat pass defined as a species presence within a 15 second sound file. For
example, a small number of bats (1 or 2 bats) consistently foraging at a given location will register
high levels activity.
During the design phase of the proposed development, two turbines were omitted (T8 and T9) as
embedded mitigation in order to avoid impacts on ecological constraints, among other reasons. –
D.09 was originally set up to cover the proposed T9 which was subsequently omitted and this unit

Bracklyn Wind Farm
Annex 5.5: Bat Survey Report 6
now provides useful context of activity levels at other locations adjacent to the proposed development.
D.08 was positioned in the open field adjacent to D.11 to provide context data from a more open
environment lacking linear features. The use of the D.08 context detector helps to provide a clearer
insight into the level of activity at turbine locations for which detectors could not be deployed at the
precisely proposed turbine location. The additional data gathered by these context detectors is
considered to have also ensured the data is compliant with SNH et al. (2019) guidelines, notably
offsetting any equipment failures that are a normal aspect of bat surveys involving the deployment of
high specification electrical equipment in the field.
1.5.2 Equipment
Deployments of static bat detectors covering involved the use of two types of Wildlife Acoustic Song
Meters (SMs), including SM2s and SM4s. Table 2 lists the types of models of static detectors used for
each deployment. In summary, during the spring survey, five locations were covered by Wildlife
Acoustics Song Meters 2s (SM2s), D.01, D.02, D.08, D.11, D.06; while the remaining six locations
were covered by Wildlife Acoustics Song Meter 4sSM4s. For the summer deployment, only two SM4s
were used, at D.02 and D.06, while all other deployments comprised SM2s. During the autumn, six
SM2s were deployed at D.02, D.05, D.06, D.07, D.09 and D.11 with the other five locations covered
by SM4s.
Equipment failure/technical issues over the course of the three deployments in 2020 was experienced
by four static detectors, comprising:
• The spring deployment at D.01, where the data recorded was corrupted and bat calls were
unable to be identified.
• The spring deployment at D.03, where only two calls were recorded over 18 nights. This is
considered likely to be as a result of an equipment failure due to the higher levels of activity
observed in the summer and autumn seasons at this deployment location.
• The spring deployment at D.07 where the static bat detectors suffered a microphone failure
and failed to record any bat passes. However, D.07 has been sufficiently covered during the
summer and autumn deployments.
• The autumn deployment at D.06, where the static bat detectors suffered a software failure on
the fifth night of recording, during a 10-night deployment.
It is considered that these four deployment locations were sufficiently covered during the other
deployments (including continually recording bat detector at the meteorological mast), and patterns in
bat activity were well documented. As such, these surveys robustly inform any conclusions being
made regarding levels of bat activity at the Wind Farm Site and this limitation is not considered to
affect the overall results. Detectors with less than 10 night’s data were still included in the analysis as
a measure of bat passes per hour is used, rather than total bat passes. This means that data can be
compared irrespective of number of nights they record for.
A continuously recording static detector was deployed on a temporary meteorological mast from 23
June 2020 onwards to record bat activity at ground level (2 m) and at height (c. 50 m). This static
detector recorded until 05 October 2020. Battery failure resulted in no data being recorded for five
nights (04 September 2020 to 08 September 2020); however, this does not affect the robustness of
this data set.
Despite equipment failures at three deployment location in the spring and one deployment locations in
autumn it is considered that both seasonal deployments provide sufficient baseline data to facilitate a
robust assessment of potential impacts of the proposed development. This is achieved through the
supplementary data collected with context detectors. For the other remaining detectors, recording was
achieved throughout deployment (which included recording up to 18 nights per deployment).

Bracklyn Wind Farm
Annex 5.5: Bat Survey Report 7
1.5.3 Weather
In Ireland, good survey conditions for static monitoring sessions are difficult to guarantee; as weather
forecasts and conditions can change dramatically over the nights that static detectors are left out.
However, deployment periods can be considered as capturing data that is representative of the real
situation and provide useful insight into the sporadic and opportunistic use of more open sites by bats;
for instance, foraging bats may be less inclined to venture onto open bog on nights when prevailing
weather conditions, e.g., higher wind speeds, make flying more energetically costly or supresses
activity levels of flying invertebrates upon which bats prey. A primary value of static detectors
deployed in conjunction with a weather station is the ability to compare relative density of use across
a site at a time when all variables (such as weather) are the same, rather than just recording during
optimal weather conditions for bats.
To comply with SNH et al. (2019) guidelines, the duration of each deployment period should last a
minimum of 10 nights within compliant weather parameters. Compliant weather conditions are defined
as: temperatures at ≥ 8°C at dusk, maximum ground level wind speed of 5 m/s (11 mph) and no, or
only very light, periodic overnight rainfall. A Davis Vantage Vue weather station was deployed to
provide real time data transfer, allowing the weather station to be fully monitored throughout the
deployment periods, and to avoid the need for deployment of a second (back-up) weather station.
During the summer period, D.07 recorded the shortest number of nights (11), three of which were
non-compliant as a result of heavy rainfall. As a result, D.07 was not in compliance with the SNH
guidelines. However, as a further precaution to capture 10-nights of records within compliant weather
conditions, deployment periods were generally extended beyond 10 nights, unless recorded weather
conditions demonstrated compliance. The non-compliance of D.07 in this period is offset by the
additional data provided by other detectors recording in excess of 10 nights during this period. Table
2 provides deployment dates and the durations for recording. Weather data (temperature, wind speed
and rainfall) are summarised for each seasonal deployment in Figure 14, Figure 17 and Figure 20.
Aside from the four units which experienced technical limitations and the single unit that experienced
weather limitations during a single season, it is considered that a minimum of 10 nights within
compliant weather parameters was collected by all the remaining units, with many recording for
significantly longer than 10 nights. It is also considered that with many units recording for a period of
longer than 10 compliant nights in similar habitats, along with the presence of the unit continuously
recording at the met station and supplementary context units, that this still allows for the robust
analysis of baseline bat activity for the site as a whole, despite the non-compliance of D.07 in
Summer.
1.5.4 Data analysis
When sound files are processed through the Kaleidoscope software, many bat calls are identified as
‘noise’ files for a variety of reasons such as nearby sound interference or a call being distant and
therefore faint. The manual verification of bat call identifications on these data logs included the
examining of noise files and identifying bat calls where possible. This results in a higher number of bat
passes being identified during this approach compared to approaches that may be undertaken at
other sites (i.e. those that that declare bat calls within ‘noise’ files to be sub-optimal and therefore
excluded from analysis or those that use the Kaleidoscope setting to delete ‘noise’ files as part of the
analysis settings). For this Wind Farm Site in particular, a large amount of bat call data was generated
from noise files. This methodology could be a distorting factor in the use of the Ecobat software
analysis tool, as the methods used by other independent contributors to their database cannot be
ascertained. There is therefore potential for an inflation of the median activity results from Ecobat
which is based on the comparison of this site to other datasets originating from other operators.
The software analysis provided by Ecobat gives several options for the definition of a bat pass for
datasets. The pass definition most suited to the data generated at the Wind Farm Site was a
“Registration” which defines a bat pass as a species presence within a 15 second sound file. This

Bracklyn Wind Farm
Annex 5.5: Bat Survey Report 8
means that, unlike the use of bat passes per hour and Kepel et al. (2011) for analysis, Ecobat does
not take into account multiple individuals of the same species within the same 15 second sound file.
It is also important to consider Ecobat median percentiles in the context of nights to which data was
compared to. In the data presented in this report, for each recorded species at each detector there is
a figure given for “reference range” (Table 11). The reference range refers to the number of nights of
similar geographic location, equipment used and time of year to which this data was compared. The
level of accuracy is therefore liable to vary between species. This difference in accuracy between
species and location can be seen in the 95% confidence intervals presented in Table 8 and Table 11.
It is important to note that species which are often detected less frequently, for example brown-long
eared bats and Nathusius’ pipistrelles, are given larger 95% confidence intervals having been
compared to less datasets. Ecobat also does not use zero data nights of recording, meaning only
nights on which bats are recorded are compared to the Ecobat database. These two factors could
result in an inflated level of bat activity being produced with analysis through Ecobat.
One limitation that exists with the use of Kepel et al. (2011) categorisations is that the outputs are less
scalable than that of Ecobat. While Ecobat works off median percentiles, the use of Kepel et al.
examines activity band ranges classifying the bat passes per hour. Once a level of activity passes the
threshold for ‘High’ activity, it is possible to lose a sense of scale for the activity level. For example,
both 10 and 150+ bat passes per hour are considered to be the same level of activity.
For this reason, both of these methods of analysis are used in this report in order to mitigate the
limitations posed by each system. While Kepel et al. (2011) classifications lack scalability, the results
are uninfluenced by the results of third-party surveys and take into account zero data nights. While
Ecobat can be influenced by third party surveys and zero data nights, through the use of median
percentiles, the results are much more contextual in terms of scale and the potential wealth of data
gathered in surveys external to this study.
The particular value of Ecobat is that it is intended to put the recorded bat activity levels at a given site
into a wider context of other sites that have been surveyed. This allows a comparative analysis of
activity across different sites, thus putting the surveyed site in a wider, regional, context. However, the
level of information within Ecobat is limited for Ireland (it currently stands at equivalent to around 11
times the amount of data collected for this proposal in entirety), and the proportion of open upland
sites (likely to have lower activity levels) and forested lowland sites (likely to have higher activity
levels) is unknown. For this reason, interpretation of the Ecobat percentiles should be undertaken
under caution and in full understanding of this limitation.
1.5.5 Other considerations
Walked or driven transects are no longer always a requirement under the SNH et al. (2019)
guidelines. Transects were undertaken by Woodrow for the Wind Farm Site, which covered the
summer and autumn survey seasons in 2020 and spring in 2021, when the grid connection route was
surveyed. It is considered that manual bat activity surveys, such as these, provide valuable contextual
data in addition to the information that is recorded on static bat detectors. A total of four dusk
transects combined with roost emergence surveys were conducted, as well as two dawn transects
combined with roost re-entry survey, to enhance the understanding of the general bat activity across
the Wind Farm Site. Further roost emergence were undertaken in spring 2021, which were combined
with transect surveys covering the grid connection route

Bracklyn Wind Farm
Annex 5.5: Bat Survey Report 9
2 METHODOLOGY
Pre-planning surveys for bats at proposed Wind Farm Sites aim to identify the species occurring
within the proposed development site and provide an understanding of how local bat populations
utilise the area in terms of density of use for foraging, roosting (maternity and hibernation) and social
interactions. This information allows for the identification and assessment of the potential impacts the
proposed development is likely to have and for appropriate avoidance and/or mitigation measures to
be implemented as part of the design phase of the project
Bat surveys were conducted by Woodrow Sustainable Solutions Ltd. at Bracklyn over the 2020 active
bat season, with additional coverage undertaken in spring 2021, to ensure compliance with the most
recently published guidelines pertaining to surveying, impact assessment and mitigation for bats at
onshore wind turbines (SNH et al. 2019). This guidance document supersedes previous guidelines
(Collins, 20162 updating Hundt, 20123 & BCI, 20124) and requires a site-by-site approach to survey
design, with the only prescriptive element being the positioning, number and duration of static bat
detector deployments, as well as the strongly recommended continual monitoring of site-specific
weather data on rainfall, temperature and wind speeds.
The guidelines require as a minimum, three deployments of static detectors aimed at covering spring
(April to May), summer (June to mid-August) and autumn (mid-August to October), each with a
minimum deployment period of 10 nights (within compliant weather parameters). Seasonal
deployments of static detectors are set out at all potential turbine locations for proposals comprising
ten or less turbines, with a third of any additional locations also covered up to a maximum of 40
detectors. Compliant weather conditions are defined as: temperatures at ≥ 8°C at dusk, maximum
ground level wind speed of 5 m/s (11 miles/hr) and no, or only very light, periodic rainfall.
Additional requirements of the SNH et al. (2019) guidelines include swarming surveys and winter
roost inspections if potential hibernation roosts are identified. Transect and/or vantage point surveys
are seen as methods used to complement the static detector surveys, with applicability being
discretionary and site-specific.
2.1 Desk study and site investigation
A desk-based review of habitat availability in the environs of the proposed development, and the
available bat data was used to inform the scope of the bat surveys required. As recommended by
both BCI (2012) 5 and SNH et al. (2019) the area covered by the desk-based review was extended to
10 km surrounding the Wind Farm Site. The desk-based study included:
• Reviewing distances from closest Natura 2000 sites designated for bats (only bat SACs in
Ireland are for lesser horseshoe bat Rhinolophus hipposideros) - the area of interest (in Co.
Westmeath/ Meath) is outside the range for lesser horseshoe bat in Ireland.
• Examining aerial imagery and 6-inch maps to identify potential bat foraging and roosting
habitats
• Lundy et al. (2011) 6 provides a high-level assessment of potential habitat suitability for
different species of bat occurring in Ireland.
2 Collins, J. (ed.) (2016) Bat Surveys for Professional Ecologists: Good Practice Guidelines (3rd edition). The Bat Conservation
Trust, London.
3 Hundt, L. (2012). Bat Surveys: Good Practice Guidelines. 2nd Edition. BCT – Bat Conservation Trust, London.
4 Bat Conservation Ireland (2012) Wind Turbine/Wind Farm Development Bat Survey Guidelines, Version 2.8, December 2012.
Bat Conservation Ireland
5 Bat Conservation Ireland (2012) Wind Turbine/Wind Farm Development Bat Survey Guidelines, Version 2.8, December 2012.
6 Lundy, M.G., Aughney, T., Montgomery, W.I., & Roche, N., (2011) Landscape conservation for Irish bats
& species specific roosting characteristics. Bat Conservation Ireland.

Bracklyn Wind Farm
Annex 5.5: Bat Survey Report 10
• Review of data received from BCI within 10 km of the Wind Farm Site and the results of
Biodiversity Maps report for the 10-km squares covering the site [N55 & N65], including
species recorded and known roosting sites.
2.2 Roost assessment surveys
The most recent guidelines (SNH et al., 2019) recommend that “features that could support maternity
roosts and significant hibernation and/or swarming sites (both of which may attract bats from
numerous colonies from a large catchment) within 200 m plus rotor radius of the boundary of the
proposed development should be subject to further investigation”.
Turbine specification, as well as locations, are regularly altered during the design phase of projects
and as a precaution Woodrow always conduct roost assessment surveys within 300 m of the potential
build area. Sections of the access tracks falling beyond the 300m zone of influence around turbines
and the grid connection route have been assessed out to 30 m, to account for the maximum extent of
potential disturbance from construction works. Wide reaching roost and foraging habitat assessment
of the Wind Farm Site were undertaken during March 2020, as part of a site scoping exercise. These
assessments were refined over subsequent site visits and the final assessments were conducted over
May 2021, which re-assessed the finalised site layout, including the on-site substation and grid
connection route.
Surveyors utilised the assessment criteria described in Collins (2016) – see Page 35, Table 4.1,
which provides guidelines for assessing potential suitability of habitat features as bat roosts and for
foraging bats. This allows surveyors to assign features, a ‘negligible’, ‘low’, ‘moderate’ or ‘high’ status
in terms of their potential for bats, i.e., the presence of Potential Roost Features (PRFs). Based on the
features present and the location of the trees or other structure, the potential use of the feature can
also be considered, and classified (as in Hundt, 2012):
• Maternity (breeding roost)
• Summer / transitional (to include transitional, occasional, satellite, night and day roosts)
• Hibernation roost
Surveyors initially employed non-invasive external and internal inspection techniques for any building
encountered, and trees were assessed from the ground. All turbine locations were evaluated and an
area of 300 m around turbines was assessed for bat roost potential - see Figure 1. Based on the
young age of trees, a lack of suitable Potential Roost Features (PRFs), and species composition
(mostly Sitka spruce), it can be safely assumed that the trees within most of the plantations covering
the Wind Farm Site did not have the capacity to support roosting bats.
If deemed appropriate, full building/tree inspections can be undertaken under licence from NPWS and
would include inspecting any potential hibernation roosts. Only one full building inspection was
required at a derelict cottage adjacent to the access track entering the Wind Farm Site to the north.
No potential winter (hibernation) roosts were identified in the Zone of Influence and therefore no
further inspections were required.
Based on the findings of the roost assessment surveys, features classed as having moderate to high
suitability for bats and/ or demonstrating likely occupancy, (e.g. bat dropping found), were targeted for
further bat activity surveys, including dusk emergence/dawn re-entry surveys.
2.3 Bat activity surveys – roost emergence/re-entry surveys
As summarised in Table 1, several dusk emergence/dawn re-entry surveys were completed, typically
prior to or after undertaking walkover (transect) surveys of the site. Transect and dusk
emergence/dawn re-entry surveys undertaken using professional Elekon Batlogger M bat detectors to
collect geo-referenced records of bat activity, which were then analysed using BatExplorer.

Bracklyn Wind Farm
Annex 5.5: Bat Survey Report 11
Four emergence surveys at potential roost sites were conducted on 05-Aug-2020 and 02-Sep-2020
(considered to have ‘Low’ to ‘High’ PRF suitability based on Collins, 2016 guidelines) prior to
undertaking dusk transects, while another emergence survey was conducted on 24-Aug-2020 and a
further two locations were covered on the 10-May-2021, covering the following locations highlighted in
Figure 3a:
• 05-Aug-2020 (21:00 to 21:51) – derelict cottage in the northern section of the Wind Farm Site,
located at 1,113m from the closest turbine [53.581583, -7.095333]
• 05-Aug-2020 (21:00 to 21:50) – mature beech in the southern section of the Wind Farm Site,
located at c. 387m from the closest turbine [53.565833, -7.083167
• 24-Aug-2020 (20:12 to 22:10) – crypt in the north – western section of the Wind Farm Site,
located c. 392m from the closest proposed turbine [53.575971, -7.087565
• 02-Sept-2020 (20:00 to 21:00) – ‘T’ shaped treeline with occasional ‘moderate’ to ‘low’ PRF
suitability in the middle section of the Wind Farm Site, located c. 213mfrom the closest
proposed turbine [53.576148, -7.080718 through to 53.574039, -7.076673]
• 02-Sept-2020 (20:00 to 21:00) – semi-mature woodland located in the eastern section of the
Wind Farm Site, located c. 268m from closest proposed turbine [53.570121, -7.072124
through to 53.569904, -7.069152]
• 10-May-2021 (21:00 to 22:44) – treeline SW of T4 [53.564755, -7.077551]
• 10-May-2021 (20:54 to 22:30) – treeline SW of T5 [53.562488, -7.084000]
Four re-entry surveys at potential roost sites (considered to have ‘Low’ to ‘Moderate’ PRF suitability
based on Collins, 2016 guidelines) were conducted during the 2020 active season, covering the
following locations which are highlighted in Figure 3a:
• 06-Aug-2020 (04:30 to 05:30) – derelict cottage in the northern section of the Wind Farm Site,
located at 1,113m from the closest turbine [53.581583, -7.095333]
• 06-Aug-2020 (04:30 to 05:30) – semi-mature birch in the northern section of the Wind Farm
Site south-west of derelict cottage, located at c. 387m from the closest turbine [53.581578, -
7.095522] – see Figure 5a
• 03-Sept-2020 (05:40 to 06:55) – ‘T’ shaped treeline with occasional ‘moderate’ to ‘low’ PRF
suitability in the middle section of the Wind Farm Site, located c. 213m from the closest
proposed turbine [53.576148, -7.080718 through to 53.574039, -7.076673]
• 03-Sept-2020 (05:40 to 06:55) – semi-mature woodland located in the eastern section of the
Wind Farm Site, located c. 268m from closest proposed turbine [53.570121, -7.072124
through to 53.569904, -7.069152]
2.4 Bat activity surveys – walked/driven transects
Under SNH et al. (2019), the application of transect surveys is discretionary, with survey requirements
designed on a site-by-site basis. Transects are complementary to data collected from static bat
detectors; and are important for identifying flight lines and for gaining understanding of bat abundance
within the survey area. Driven transects can provide useful information on the wider landscape in the
vicinity of the proposed development site. If driven transects are undertaken, it is important that
appropriate microphones are used and are directed above the vehicle. It is also important to remain at
a constant low speed (< 10 km/h). Point counts (of a fixed duration) can be incorporated into
transects to survey specific features to provide information on comparative density of use.
Transects were completed on four dates in 2020, including dawn surveys, with the latter three
transects split into two to allow survey teams to cover various sections of the site robustly. Survey
dates and weather conditions for transects conducted are provided in Table 1 and Figure 3a
illustrates the transect routes undertaken within the wind farm site. The grid connection route was
covered during an additional transect on 10-May-2021 - see Figure 3b.
Field records were made of bat species encountered, number of bat passes, activity (where known:
e.g. foraging, commuting, advertising), travelling direction and approximate height (where known).

Bracklyn Wind Farm
Annex 5.5: Bat Survey Report 12
Temperature and wind speed were measured at intervals throughout the survey. Batloggers recorded
temperature throughout the surveys.
Table 1 – Dusk transect survey dates, timing & weather conditions for 2020 Date Start
time End time
Survey type - coverage (surveyors) Weather Conditions Distance from nearest Turbine
08-Jun-2020
Sunset 21:56
21:30 00:00 Dusk transect - Walked transect covering T1 to T8 (R. Irwin, plus-one)
Wind: Force 1 NW Cloud: 7 oktas Dry Temp: 15°C
n/a
05-Aug-2020
Sunset 21:17
21:00 21:50 Emergence survey - At a derelict cottage in the north of the site. One surveyor facing the south side of the cottage and one facing the east side. (R. NigFhloinn & A. Moroney)
Wind: Force 1 SW Cloud: 7 oktas Dry Temp: 19°C
1,113m from T1
21:00 21:50 Emergence survey - At a mature beech tree in the south of the site, close to T4 (J. Kohlstruck & N. Fleming)
Wind: Force 1 SW Cloud: 7 oktas Dry Temp: 19°C
387m from T3
21:50 23:35 Dusk transect - Driven transect from derelict cottage along road to farm entrance. Walked transect east of site, covering T3, T7, T9 and T10. (R. NigFhloinn & A. Moroney)
Wind: Force 1 SW Cloud: 7 oktas Dry Temp: 19°C
n/a
21:50 23:50 Dusk transect - Walked transect in west of site, covering T2 - T5 (J. Kohlstruck & N. Fleming)
Wind: Force 1 SW Cloud: 7 oktas Dry Temp: 19°C
n/a
06-Aug-2020
Sunrise 05:53
04:20 06:13 Re-entry survey - At derelict cottage in the north of the site. Surveyors facing south, east and north sides of the cottage (R. NigFhloinn, A. Moroney, J. Kohlstruck & Nicole Fleming)
Wind: Force 1 SE Cloud: 1 oktas Dry Temp: 11°C
1,113m from T1
25-Aug-2020
Sunset 20:32
20:12 22:10 Emergence survey - At a crypt located in the north of the site within a small cluster of yew, beech and elder trees (R. Irwin)
Wind: Force 3 SW Cloud: 8 oktas Dry Temp: 13°C
392m from T2
02-Sep-2020
Sunset 20:17
20:00 21:00 Emergence survey - In a clearing between conifer plantation and broadleaved woodland located next to T7. One surveyor facing west and one east (A. Moroney & D. Manley)
Wind: Force 3 SW Cloud: 8 oktas Drizzle Temp: 20°C
268m from T7
20:00 21:00 Emergence survey - At a mature treeline close to T6 and T7. One surveyor facing the south-east of the treeline and one surveyor the north-west (N. Fleming & D. Purcell)
Wind: Force 3 SW Cloud: 8 oktas Drizzle Temp: 20°C
285m from T1
21:00 22:30 Dusk transect – Walked transect around east of site, covering T3, T4, T7, T8 and T10. (A. Moroney & D. Manley)
Wind: Force 3 SW Cloud: 8 oktas Light rain Temp: 18°C
n/a
21:00 22:00 Dusk transect – Walked/driven transect in east and north-east of site covering T1 – T6 (N. Fleming & D. Purcell)
Wind: Force 3 SW Cloud: 8 oktas Light rain Temp: 18°C
n/a
03-Sep-2020
Sunrise 06:42
04:45 05:45 Dawn transect - Walked transect around east of site, covering T3, T4, T7, T8 and T10. (A. Moroney & D. Manley)
Wind: Force 3 SW Cloud: 7 oktas Dry Temp: 14°C
n/a
04:45 05:45 Dawn transect - Walked/driven transect in east and north-east of site covering T1 – T6 (N. Fleming & D. Purcell)
Wind: Force 3 SW Cloud: 7 oktas Dry Temp: 14°C
n/a
05:45 07:00 Re-entry survey - In a clearing between conifer plantation and broadleaved woodland located next to T7. One surveyor facing west and one east (A. Moroney & D. Manley)
Wind: Force 3 SW Cloud: 7 oktas Dry Temp: 14°C
268m from T7
05:45 07:00 Re-entry survey - At a mature treeline close to T6 and T7. One surveyor facing the south-east of the treeline and one surveyor the north-west (N. Fleming & D. Purcell)
Wind: Force 3 SW Cloud: 7 oktas Dry Temp: 14°C
354m from T6
10-May-2021
Sunset 21:15
21:00 22:48 Emergence survey – At tree SW of T5 (A. Moroney)
Wind: Force 1 SW Cloud: 8 oktas Occ. light drizzle Temp: 11-10°C
43m from T5
20:54 22:33 Emergence survey – At treeline SW of T4 (O. O’Sullivan)
123m from T4
23:34 00:08 Dusk transect – driven transect of grid connection route (O. O’Sullivan & A. Moroney)
Wind: Force 1-2 W Cloud: 8 oktas Occ. drizzle Temp: 10-9°C
n/a

Bracklyn Wind Farm
Annex 5.5: Bat Survey Report 13
2.5 Static bat detector surveys
Static detector surveys were undertaken using Wildlife Acoustic Song Meters (SM2 and SM4) across
three deployments covering spring, summer and autumn. Static bat detectors were deployed to
record the types of bat species present and to provide an overview of how bat activity is broadly
distributed over the site and specifically at selected turbine locations.
Dates, distance from associated turbine and positions of static detectors are provided in Table 2. The
location of all static detectors for each month is shown in Figure 4. Two of the detectors deployed,
D.08 and D.09, were done so in order to give further context to other deployments. D.08 was paired
with D.011 in a position approximately 100 metres away but unlike D.11, D.08 was not deployed
adjacent to a linear feature. D.09 was deployed along a treeline in a bog woodland which leads to a
bog pool (Bracklin Lough). This approach was followed to give context for bat activity on the site in the
presence of these features, which are positively associated with bats. The same locations were used
for all three seasonal deployments.
2.5.1 Permanent static at height
In addition to three seasonal deployments of static bat detectors, a continuously recording static was
setup on the temporary meteorological mast from 23-Jun-2020 to the end of the active bat season
(October 2020). A microphone was erected at height (c. 50m) and was paired with a microphone at
2m to provide a comparative analysis of activity at both of these levels, which is shown in Plate A.
2.6 Monitoring climatic of conditions
Monitoring of climatic conditions was undertaken through the deployment of an on-site fully
automated weather station with 3G connectivity (Davis Vantage Vue wireless integrated sensor suite
weather station). The deployment location of the weather station is shown in Figure 4, and Plate B
provides a picture of the equipment used. The weather station generates data on a real-time basis,
allowing functionality to be checked on a daily basis during the survey season and for action to be
taken if the station failed, or there were concerns regarding the data. This obviated the need for a
second (backup) weather station. The weather station collected the full range of weather data,
including temperature, wind speed and rainfall, which allows surveyors to determine whether
deployment nights were compliant with the prescribed weather parameters (≥ 8°C at dusk, max.
ground level wind speed of 5m/s and minimal rainfall).
Deployment periods can then be adjusted to ensure 10 nights of compliant data are captured. In
addition, site specific weather data can be useful for investigating the recorded patterns of site usage
by bats.
Plate A – Recording at height Plate B – Weather station

Bracklyn Wind Farm
Annex 5.5: Bat Survey Report 14
2.7 Calibration and testing of recording equipment
Calibration and testing of recording equipment is required by the SNH et al. (2019) guidelines. As a
standard operating procedure Woodrow have a stringent schedule of testing all bat recording
equipment prior to and during deployment in the field. Checks are logged in excel, providing an audit
trail to ensure that all data can be relied upon to form a robust data set. Unique numbering of static
detectors, SD cards and microphones allows for reverse checking, if any issues arise, e.g. following a
microphone failure. Checks undertaken include pre-deployment device setting and battery checks,
and post- and pre- deployment microphone sensitivity checks.
As detailed in the section on survey limitations, failure of bat recording equipment was limited to D.01,
D.03, D.07 in spring and D.06 failed during the fifth night of the summer deployment.
2.8 Analysis
For data collected using SM2s and SM4s, analysis of sound recordings was undertaken using
Kaleidoscope software to confirm species (or genus for Myotis species7) and exact number of bat
passes for each deployment. For data collected using the Batloggers, analysis of sound recordings
was undertaken using BatExplorer software. Russ (2012) 8 and Middleton et al. (2014) 9 were used to
aid in identification of bat calls during data analysis.
All sounds files were run through auto-identification and then manual verification was undertaken by
Woodrow operatives. Any sound files identified as noise were manually checked, as these can hide
bats calls, especially if calls are faint, e.g. if there are high levels of other background noise such as
rustling leaves during windy conditions or during periods of light rainfall. Recordings where more than
one bat or more than one species was registered were split into separate passes. The number of
passes generated were considered synonymous with Registrations, as defined by Ecobat, which is
considered to be species presence within a 15 second sound file. SNH et al. (2019) guidelines
recommend using the online tool Ecobat (managed by the UK Mammal Society) to allow for a
measure of relative bat activity using a ranking system by comparing the data collected with bat
survey information collected from similar areas during similar times of year. Through correspondence
with the UK Mammal Society, it was discovered that Ecobat creates an aggregate of pass rates for
pipistrelles classified to genus level, which results in a consistently high activity rate for the genus. In
order to avoid confusion by showing duplicate information with inflated median levels of pipistrelle
activity, the proportionally small number of calls which could only be classified to a genus level for
pipistrelles were not included in the presentation of Ecobat analysis results.
Up until recently, the reference system used by Ecobat was strongly oriented on UK bat populations
and it was not clear whether reference data sets were relevant to Ireland. Comparative Irish data sets
are now considered to have surpassed thresholds to allow for more robust assessments. Ecobat
allows users to upload activity data and compare it to results within a reference range filtered by
geographic location, time of year and the make of bat detector used. This generates robust reports
tailored for a dataset’s specific location, timeframe and equipment. The continued use of Ecobat
improves its future accuracy, as the data from each survey uploaded adds to their reference database
(Lintott et al. 201710).
The activity levels were also examined in terms of bat passes per hour (bp/h). This is effectively bat
contacts per hour and is worked out on the basis of the time that the static bat detectors operated
during the deployment period (set to record from half an hour before sunset to half an hour after
7 Bats should be identified to species, or where these cannot be separated with confidence, to species group e.g. Myotis spp.
(SNH 2019)
8 Russ, J. (2012) British Bat Calls: A Guide to Species Identification.
9 Middleton N., Fround A. & French K (2014) Social Calls of the Bats of Britain and Ireland.
10 Lintott, P.R., Davison, S., van Breda, J., Kubasiewicz, L., Dowse, D., Daisley, J., Haddy, E. & Mathews, F. (2018). Ecobat:
An online resource to facilitate transparent, evidence‐based interpretation of bat activity data. Ecology and evolution, 8(2),
pp.935-941

Bracklyn Wind Farm
Annex 5.5: Bat Survey Report 15
sunrise). In order to provide additional context for what constitutes significant levels of activity the bp/h
data has been presented taking account of a Polish study by Kepel et al. (2011)11 (sourced from ‘A
Review of the Impacts of Wind Energy Developments on Biodiversity’). The study sought to attribute
significance levels to bat activity recorded during wind farm surveys.
11 Kepel, A., Ciechanowski, M., Jaros, R. (2011). How to assess the potential impact of wind turbines on bats using bat activity
surveys? A case study from Poland, XII European Bat Research Symposium, August 22-26, 2011, Vilinusm Lithuania.

Bracklyn Wind Farm
Annex 5.5: Bat Survey Report 16
Figure 3a – Transect routes and emergence/re-entry survey locations

Bracklyn Wind Farm
Annex 5.5: Bat Survey Report 17
Figure 3b – Transect route surveyed along grid connection route

Bracklyn Wind Farm
Annex 5.5: Bat Survey Report 18
Figure 4 – Deployment locations for all static bat detectors and weather station in 2020

Bracklyn Wind Farm
Annex 5.5: Bat Survey Report 19
Table 2 – Static bat detector deployment dates, locations & features covered during 2020
Map ID
Associated turbine
Unit location (Lat.-Long.)
Associate feature / habitats
Spring deployment date: 21-May-2020
Summer deployment date: 23-Jun-2020
Autumn deployment date: 25-Aug-2020
Unit code
Running time (mins)
Unit code
Running time (mins)
Unit code
Running time
(mins)
D.01 T1 53.577931 -7.078460
Open: In cattle grazed field of improved grassland, c. 190m away from closest habitat feature
WSS-001
Unit Fail WSS-025
15 nights (7,754)
WSS-038
15 nights (10,149)
D.02 T2 53.573443 -7.081799
Feature: Along earth bank with low elder hedgerow and mature beech trees, which divides two arable fields
WSS-019
14 Nights (7,113)
WSS-016
14 nights (7,183)
WSS-011
11 nights (7,553)
D.03 T3 53.568278 -7.084910
Feature: Within arable fields at end of hedgerow/ treeline dominated by bramble, elder scrub and young ash trees
WSS-024
18 Nights (9,058)
WSS-023
15 nights (7,754)
WSS-034
15 nights (10149)
D.04 T4 53.565561 -7.077094
Feature: Along treeline/ hedgerow with drain, which divides young ash plantation from improved grassland
WSS-032
18 Nights (9,058)
WSS-286
15 nights (7,754)
WSS-051
15 nights (10,149)
D.05 T5 53.562787 -7.082454
Feature: Along treeline/ hedgerow, which divides conifer plantation from improved grassland
WSS-029
18 Nights (9,058)
WSS-031
15 nights (7,754)
WSS-016
11 nights (7,863)
D.06 T6 53.575515
-7.073446 Feature: In forestry ride/ access track through conifer plantation - track being extended during spring deployment
WSS-022
11 Nights (5,651)
WSS-020
14 nights (7,298)
WSS-019
4.5 nights (2,745)
D.07 T7 53.571794 -7.06914
Feature: In forestry ride with broadleaves and drain between two blocks of conifer plantation
WSS-009
18 Nights (9,058)
WSS-037
11 nights (5,520)
WSS-010
11 nights (7,692)
D.10 T10 53.573686 -7.057399
Feature: In small clearing (3 x 5m) at edge of commercial plantation where semi-natural woodland starts
WSS-026
18 Nights (9,058)
WSS-028
15 nights (7,754)
WSS-060
11 nights (7,790)
D.11 T11 53.568657 -7.061872
Feature: Along edge of conifer plantation adjacent to field of improved grassland
WSS-011
14 Nights (7,602)
WSS-039
15 nights (7,754)
WSS-006
9 nights (6,798)
D.08 T11 -
context 53.568776 -7.063344
Open: In field of improved grassland surrounded by plantation, located c. 90m from edge of plantation and paired with D.11 for context
WSS-014
16 Nights (8,284)
WSS-036
15 nights (7,754)
WSS-032
15 nights (10,149)
D.09 Bog pool 53.564728 -7.071805
Feature: Along treeline of bog woodland leading to bog pool within area of remnant raised bog
WSS-033
18 Nights (9,058)
WSS-027
15 nights (7,754)
WSS-007
13 nights (9,028)
D.12 Temporary met. mast
53.569886 -7.076360
Deployment at height Open: Two microphones. One was deployed at ground level and the other at height (c. 50m), the closest features being c. 50m away
WSS-017
Continuous deployment 23-Jun-2020 to 05-Oct-2020

Bracklyn Wind Farm
Annex 5.5: Bat Survey Report 20
3 SURVEY RESULTS
This section, provides the detailed results for bat surveys conducted during the 2020 survey period,
as well as additional habitat assessment surveys, roost inspection and transects conducted in
February 2021 and May 2021. These survey results are summarised in Section 4.
Appendix 1, Appendix 2 and Appendix 4 provide additional context with plates illustrating
deployment locations, locations at which emergence and re-entry surveys were conducted and bat
detectors in situ.
3.1 Desk based study
A data request was submitted to Bat Conservation Ireland (BCI) for known roost records in the
general area. A total of 13 bat records were provided, including four roosts records, none of which are
located within the proposed development site. The closest previously document bat roost is a brown
long-eared bat roost located c. 5 km from the proposed development site. This bat roost data is list in
Table 4 with distances from site provided, and Table 4 also indicates that six species have been
recorded in the environs of the proposed development site, including:
• Common pipistrelle Pipistrellus pipistrellus
• Soprano pipistrelle Pipistrellus pygmaeus
• Leisler’s bat Nyctalus leisleri
• Brown long-eared bat Plecotus auritus
• Daubenton’s bat Myotis daubentonii
• Natterer’s bat Myotis nattereri
The only Natura 2000 sites designated for bats in Ireland are for lesser horseshoe bats (Rhinolophus
hipposideros). The area of interest in Co. Westmeath/Co. Meath is outside the range for this species;
and with the closest Special Areas of Conservation (SACs) being in Co. Mayo, there are no
designated sites within the 15 km Zone of Influence of the proposed development.
3.2 Bat habitat suitability assessment
Based on Lundy et al., (2011), the overall suitability for the 5x5 km square encompassing the Wind
Farm Site has been scored as holding moderate suitability for all bat species combined. For individual
species it was ranked as high for common and soprano pipistrelles, moderate to high for Leisler’s bat
and brown long-eared bats; and moderate for Myotis species, with the exception of whiskered bat
which was ranked as low. Suitability for Nathusius’ pipistrelle was also ranked as low.
The habitat within the Wind Farm Site is comprised of relatively distinct blocks of tillage, improved
grassland, conifer/ash plantation, semi-natural broadleaf woodland and bog woodland. The proposed
turbine location for T1 is located in improved grassland, while T2 and T3 are located in fields of arable
crop. The rest of the proposed turbines; T4, T5, T6, T7, T10, and T11 are located in commercial
forestry plantations. Sheltered foraging opportunities for bats are provided within the forestry rides,
between blocks of plantations and along forestry tracks. The plantations surrounding the proposed
turbine locations for are bordered by semi-natural woodland, including bog woodland and mature
broadleaf woodland, with some of the woodland adjacent to the plantation surrounding T5 considered
to be long-established woodland. The edge effects created by differing ages of woodland is likely to
create foraging opportunities. There are also treelines and hedgerows in relatively close proximity to
proposed turbine locations at T4, T5 and T7, which provided potential connectivity through the mosaic
of habitats within the site. Many of these treelines consist of semi-mature to mature broadleaf trees. A
summary of foraging features is presented in Table 3.

Bracklyn Wind Farm
Annex 5.5: Bat Survey Report 21
Two structures were identified as having ‘moderate’ to ‘high’ PRF suitability, which included a crypt (c.
350m from T2) and a derelict cottage (adjacent to the entrance track); however, both structures fall
beyond the 300m Zone of Influence (ZoI) of proposed turbine locations and no PRFs classified as
‘high’ suitability were identified within the ZoI. Various trees and treelines were identified as having
‘low’ to ‘moderate’ PRF suitability within the 300m ZoI.Error! Reference source not found. Figure 5a
shows the following potential roost features classified as ‘low’ to ‘moderate’ and ‘moderate’ suitability
which lie within the ZoI of proposed turbine locations;
• Broadleaf ‘T’ shaped treeline [running from 53.576420, -7.081712 to 53.573974, -7.076562
and 53.575479, -7.078370 to 53.574613, -7.079647] with ivy clad, mature trees containing
some features such as knot holes and broken limbs. This treeline was assessed as having
‘low’ to ‘moderate’ potential roost potential and is within the ZoI of both the proposed turbines
T01 and T02 (North of T02 and South of T01).
• Broadleaf treeline [running from 53.573719, -7.078923 to 53.572190, -7.076906] containing
several mature ivy clad trees. This treeline was assessed as having ‘low’ to ‘moderate’ roost
potential a small portion of this treeline lies within the eastern side of the ZoI of T02.
• Mixed scattered group of semi-mature to mature broadleaf trees along field margin. This
scattered treeline runs from [53.564264, -7.078872 to 53.564914, -7.077349]. This was
assessed as having a ‘low’ to ‘moderate’ roost potential and lies within the ZoI of the
proposed turbines T05 and T04.
• Three mature beech trees with knot and rot holes in close proximity to each other, to the
southwest of T05 at [53.561817, -7.084478]. These trees were assessed to have ‘moderate’
roost potential.
• Semi-mature broadleaf trees with dense ivy coverage running from [53.562550, -7.083995 to
53.561635, -7.080380]. This treeline lies to the south of T05 and is also within the turbine
swept area of the proposed turbine and was assessed to have ‘low’ to ‘moderate’ roost
potential.
• Semi-mature ash and hawthorn treeline with dense ivy cover to the north of T05, running from
[53.562992, -7.083727 to 53.562425, -7.079892]. This treeline was classified as having ‘low’
to ‘moderate’ roost potential and lies within the ZoI and rotor swept area of T05.
• Semi-mature beech plantation with some other native species present to the north-west of
T05 with its approximate centre at [53.563164, -7.084724]. Trees in the plantation had many
rot holes, rotten limbs and dense ivy cover. This plantation was determined to be of ‘low’ to
‘moderate’ roost suitability.
• Standing dead trees at [53.574555, -7.067328], to the east of T06 were determined to be of
‘low’ to ‘moderate’ roost suitability.
• Treeline of semi-mature ash trees with dense ivy cover running from [53.572843, -7.069157
to 53.573082, -7.062627]. This treeline has some of its length in the Northeastern sector of
the ZoI of T07 and the western sector of the ZoI for T10 and was assessed to have ‘low’ to
‘moderate’ roost potential.
• Mature birch treeline with dense ivy [running from 53.567178, -7.061913 to 53.567178, -
7.061913]. This treeline is assessed as having ‘low’ to ‘moderate’ roost potential and lies
within the ZoI of proposed turbine T11
Figure 5b shows the locations of PRFs along the grid connection route, including several mature trees
with deadwood that were class as having moderate to high PRFs, and a bridge that was classed as
supporting high PRFs.

Bracklyn Wind Farm
Annex 5.5: Bat Survey Report 22
Table 4 details the BCI roosts that have been recorded within 10 km of this site. Specific BCI roost
locations are confidential to afford protection to bat roosts, and as such are not shown within this
report – however, these can be made available on request.
Table 3 – Summary of bat habitat and roost suitability
Turbine Foraging features and assessment of vegetation removal required for turbine buffer (c.100m)
Roost potential within c. 300m of turbines of low to moderate or higher suitability
T1
In an open improved grassland with low foraging potential. There is no vegetation requiring removal within 100m. There is however, a strong linear feature in the form of bog woodland a little over 100m to the West of T1
Within 300m to the south of T1 is the 'T' shaped treeline of mature broadleaf trees classed as being of low to moderate roost potential
T2
Located in an open arable crop field. The nearest feature is a treeline to its southeast of potential commuting value to bats commuting between areas of woodland in this habitat mosaic. However, this feature is 120m from the proposed turbine location and would not need to be removed to achieve a 100m buffer.
Within 300m to the northeast of T2 is the 'T' shaped treeline of mature broadleaf trees. Within 300m to the east of T2 is a broadleaf treeline with several mature trees with dense ivy. This treeline was classed as having low to moderate roost potential.
T3
In an open arable crop field. The nearest feature is a weak linear feature in the form of a semi-mature treeline to the north.
There were no potential roost features found classed as low to moderate or higher within 300m of the proposed location for T3.
T4
Located in commercial ash plantation with three strong linear features in the form of mature broadleaf treelines. These tree lines have a strong level of connectivity to the mosaic of bog, semi-natural and broadleaf woodland to the East, South and Southwest of the proposed location of T4
There was a scattered treeline of semi-mature to mature broadleaf trees along a field margin assessed as having low to moderate roost potential within 300m of the proposed turbine location.
T5
Located in a conifer plantation, with semi-mature broadleaf treelines of good foraging potential within the plantation to the north and south of the proposed turbine location.
The two semi-mature treelines to the north and south and within c. 80m of the proposed location for T5 were assessed to be of low to moderate roost potential. Three mature beech trees to the southwest of T5 within 300m of the proposed location and assessed as being of moderate potential
T6
Located in a forestry ride of a conifer plantation. The forestry ride provides a strong linear feature for foraging bats.
Standing dead trees within 300m to the east of T6 were determined to be of low to moderate roost potential.
T7
Located in a forestry ride of a conifer plantation. The forestry ride provides a strong linear feature for foraging bats. There is a drainage feature to the north of the proposed location. To the south of the proposed location for T7 was bog woodland. The border between bog woodland and conifer plantation provides a linear feature of strong foraging potential.
Within 300m, to the northeast of T7 was a semi-mature ash treeline assessed as having low to moderate roost potential.
T10
Located in an area of ongoing felling of conifer plantation T10 is bordered in all directions within 100m by bog woodland except to the west southwest. The ongoing felling creates strong linear features of bog woodland to clear fell which has high foraging potential for bats.
A very small portion of semi-mature treeline, assessed as being of low to moderate roost potential lies within 300m of T10.
T11
Located along a conifer plantation bordering improved grassland, which provides a strong foraging linear feature.
Within 300, to the South of T11 is a mature beech treeline with dense ivy cover assessed as being of low to moderate roost potential.
Substation
The majority of footprint is within conifer plantation with small sections impinging into older woodland and a treeline offering strong linear features above the plantation
The footprint impinges on a broadleaf treeline and small woodland with several mature trees with dense ivy - classed as having mainly low with the occasional moderate PRFs
Grid connection
Route passes through a range of different habitats, largely following strong linear features along the road and occasionally along the stream/drain.
Along route several mature trees with deadwood that were class as having moderate to high PRFs. There were several structures including buildings and bridges that supported moderate to high PRFs.

Bracklyn Wind Farm
Annex 5.5: Bat Survey Report 23
Table 4 – BCI Roost Data within 10 km of the Site
BCI roost data within 10km of the proposed Wind Farm Site
Roost Data - Roost Surveys
Name Distance from Site Species observed
Private c. 6.9km Plecotus auritus
Private c. 10.7km Pipistrellus pygmaeus
Private c. 7.8km Plecotus auritus
Private c. 5km Plecotus auritus
Roost Data - Transect Surveys
Name Distance from Site Species
DArcys Bridge Transect c. 3.7km Myotis daubentonii; Nyctalus leisleri; Unidentified bat
DArcys Bridge Transect c. 7.5km Myotis daubentonii; Unidentified bat
Ad-hoc Observations
Survey Distance from Site Species Date
BATLAS 2010 c. 8.9km Myotis daubentonii 11/10/2009
Unid Survey c. 8.9km Plecotus auritus 17/07/2005
Unid Survey c. 6.9km Nyctalus leisleri; Pipistrellus pipistrellus (45kHz)
27/06/2007
Unid Survey c. 8.5km
Pipistrellus pipistrellus (45kHz); Pipistrellus pygmaeus; Plecotus auritus
20/05/2003
Unid Survey c. 8.6km
Myotis natterreri; Nyctalus leisleri; Pipistrellus pipistrellus (45kHz); Pipistrellus pygmaeus
26/03/2012
Unid Survey c. 7.3km
Nyctalus leisleri; Pipistrellus pipistrellus (45kHz); Pipistrellus pygmaeus; Plecotus auritus
06/09/2007
EIS Survey c. 9km
Myotis daubentonii; Pipistrellus pipistrellus (45kHz); Pipistrellus pygmaeus
23/06/2002

Bracklyn Wind Farm
Annex 5.5: Bat Survey Report 24
Figure 5a – Roost suitability assessment within the Wind Farm Site

Bracklyn Wind Farm
Annex 5.5: Bat Survey Report 25
Figure 5b – Roost suitability assessment along the grid connection route
Bridge

Bracklyn Wind Farm
Annex 5.5: Bat Survey Report 26
3.2.1 Emergence and re-entry surveys
Throughout the duration of the 2020 active bat season, three visits were made to the Wind Farm Site
to carry out dusk/dawn transects and emergence/re-entry surveys. Five emergence surveys were
conducted on 05-Aug-2020, 24-Aug-2020 and 02-Sept-2020 and three re-entry surveys were
conducted on 06-Aug-2020 and 03-Sept-2020. A further two emergence surveys were undertaken in
spring 2021, on 10-May-2021
Sample pictures of these locations can be found in Appendix 4
Visit 1:
A dusk emergence was conducted on the 05-Aug-2020 followed by a dawn re-entry on the 06-Aug-
2020 at a mature beech [53.5658212, -7.0847226], derelict cottage [53.5815833, -7.0953263] and
semi-mature tree directly south-west of the cottage. Both locations were covered by two surveyors.
The mature beech lies approximately 387m and 398m away from T3 and T5, respectively, as seen in
Figure 3a. The derelict cottage is located over a kilometre away from T1, which was closest proposed
turbine location. This structure lies adjacent to the proposed entrance track for the proposed wind
farm.
Date: 05-Aug-2020 Sunset: 21:17 Start: 21:00 Duration: 50 mins
At mature beech: No bats were recorded or observed throughout the duration of the emergence
survey.
At derelict cottage: No bats were observed emerging from the cottage itself. The first bat, a Leisler’s
bat, was recorded at 21:18 foraging above the cottage. It appeared to have come from east of the
surveyors’ location. Four Leisler’s bats in total were observed foraging above the house, often
simultaneously, throughout the duration of the emergence survey. At 21:38, the first soprano
pipistrelle was observed to have commuted into the area through a forestry ride adjacent to the
cottage. It was estimated that more than 20 soprano pipistrelles were commuting through the
surrounding woodland. It is possible that these movements and numbers were indicative of dispersal
from a roost in the wider area.
Date: 06-Aug-20 Sunrise: 05:53 Start: 04:20 Duration: 2 hours
A re-entry survey was conducted at the derelict cottage on 06-Aug-20020 to investigate a potential
soprano pipistrelle tree roost nearby, as speculated by the surveyors on the previous night’s survey.
While no bats were observed using roosting features on the surrounding trees, one soprano pipistrelle
was observed entering the west side of the derelict cottage through a crack between the roof tiles and
wall at 05:24. This confirmed the building as being a small soprano pipistrelle roost. Two common
pipistrelles were also seen foraging at 04:36 and 04:40.
The roost activity survey was followed up with a building inspection, conducted by a licenced
operative from Woodrow. However, this proved inconclusive in giving an indication of the level of
occupation, as the whole structure could not be accessed (the roof space in particular). For the parts
of the building examined fully there was limited evidence of bat activity (e.g. droppings).
Visit 2:
Date: 24-Aug-2020 Sunset: 20:32 Start: 20:12 Duration: 2 hours
A dusk emergence was conducted on the 24-Aug-2020 at the crypt located within a small woodland
[53.576017, -7.087546]. No bats were observed emerging; however, bats were observed to forage
within and around the small woodland in limited numbers. The first bat recorded was a common
pipistrelle at 21:52. This bat was observed to come from a westerly direction, and continued to forage
in and around the woodland until approximately 22:01 when it flew west again. The surveyors noted
high winds during the survey, which may have influenced the low activity levels observed.

Bracklyn Wind Farm
Annex 5.5: Bat Survey Report 27
Visit 3:
A dusk emergence was conducted by four surveyors on the 02-Sept-2020 followed by a dawn re-
entry on 03-Sept-2020. Two surveyors covered opposite sides of the treeline running west to south-
east located at [53.575438, -7.078272], while two surveyors covered the broadleaf woodland and
conifer plantation at [53.569987, -7.072285]. The woodland is 268m from the nearest proposed
turbine location, at T7, while the treeline lies approximately 300m south-east and south-west of T1
and T5 respectively.
Date: 02-Sept-2020 Sunset: 21:17 Start: 21:00 Duration: 1 hour
At woodland: No bats were observed exiting or entering any roosting features within the trees
targeted for the roost watch. The first bat recorded was a soprano pipistrelle at 20:39. The surveyors
noted two potential bats commuting at 20:46, which correspond to two soprano pipistrelles recorded
on the detector around this time. Only two further passes were detected during the survey, both
soprano pipistrelles, at 20:56.
At treeline: Though a total of 325 bat passes were recorded throughout the survey, no definitive roost
was identified as an active roost. The first bat recorded was a soprano pipistrelle at 20:22. This
included soprano pipistrelle, common pipistrelle, Nathusius’ pipistrelle, brown long-eared bat and
Leisler’s bat. Soprano pipistrelle was the most frequently recorded species with almost 90% of the
passes and is strongly suggestive of a soprano pipistrelle roost in the wider area.
Date: 03-Sept-2020 Sunrise: 06:42 Start: 05:40 Duration: 1.25 hours
At woodland: No bats were observed foraging, commuting or entering any roosting features during the
dawn re-entry survey between the broadleaf woodland and conifer plantation. Only one bat, a
soprano pipistrelle, was recorded throughout the duration of the survey. This occurred at 06:04.
At treeline: As in the dusk survey, a high level of bat activity was observed along the treeline. Multiple
soprano pipistrelle bats were noted by the surveyors to be foraging within the area. The detector also
recorded passes from common pipistrelle, Nathusius’ pipistrelle, brown long-eared bat and Leisler’s
bat.
Visit 4:
Date: 10-May-2021 Sunset: 21:15 Start: 21:00/20:53 Duration: 1.8/1.6 hours
A dusk emergence was conducted by two surveyors on the 10-May-2021, with one surveyor covering
three trees at the northeastern tip of a treeline 123m from T4 and the other covering a tree within a
treeline 43m from T5.
T4 treeline: The first bat recorded at this survey location was recorded at 21:38 but was not seen
emerging from a tree. Between 21:38 and 21:42 another soprano pipistrelle and an unidentified bat
(emitted no call, potentially a brown long-eared bat) were seen and recorded commuting from south to
north and south to north east through the treeline. Between 21:45 and 22:00, 8 common pipistrelles, 2
soprano pipistrelles and a Leisler’s bat calls were recorded but the bats were not seen emerging from
the trees. Visual confirmation of these bats entering or leaving the area as conditions could not be
made as it had become very dark under the foliage of the treeline and visibility past the immediate
roosts was poor. Faint common pipistrelle calls were recorded between 22:00 and 22:03. Another
common pipistrelle commuting from south to north was recorded at 22:05. Between 22:09 and 22:18
between 3 and 4 common and soprano pipistrelles were recorded foraging in the treeline. No bats
were seen emerging from the features on the three north most trees of the treeline.
T5 treeline: The first bat recorded during this emergence survey passed at 21:41 and was a soprano
pipistrelle noted to be faint and therefore distant. A Leisler’s bat was heard but not seen at 21:42. Two
pipistrelles of unidentified species were recorded commuting west to east at 21:51 and 21:57 along
the treeline.

Bracklyn Wind Farm
Annex 5.5: Bat Survey Report 28
A Leisler’s bat was recorded without visual confirmation again at 22:02 and 22:06 noted to be faint
and likely a distant bat. Further faint common pipistrelle calls were recorded at 22:15 and 22:13. A
soprano pipistrelle was recorded commuting west to east along the treeline at 22:24. Between 22:26
and 22:37 faint soprano pipistrelle, common pipistrelle and Leisler’s bat calls were recorded. At 22:44
a common pipistrelle was recorded foraging along the nearby conifer plantation edge.
3.2.2 Winter Roost Inspection Surveys
New SNH Guidelines (SNH, 2019) recommend that winter roost surveys should also be carried out for
any potential hibernation roost within 200 m plus rotor radius of developable area.
However, no potentially suitable significant hibernation roosts were identified within the 200 m plus
rotor radius of the turbine layout, as such, no winter roost inspections were required on Wind Farm
Site. Likewise, no suitable features were identified within the potential Zone of Influence of the
proposed grid connection route and substation location.
3.3 Transect survey reports 2020 & 2021
For the 2020 active bat season, four transects, three dusk and one dawn transect were undertaken on
four dates including 08-Jun-2020, 05-Aug-2020, 02-Sept-2020 and 03-Sept-2020, with the aim of
covering the site during the summer and autumn periods. The following sections provide transect
survey reports for the four transects conducted. The distribution of bats recorded along transects are
displayed in Figure 6, Figure 7, Figure 8, Figure 9a and Figure 9b.
A single transect was conducted in 2021 on the 10-May-2021. This transect covered the proposed
grid connection route for the Wind Farm Site. This consisted a driven transect along the grid
connection route The results for all transects, obtained using Elekon Batlogger M bat detectors, are
presented in Table 5.

Bracklyn Wind Farm
Annex 5.5: Bat Survey Report 29
Visit 1:
Date: 08-Jun-2020 Sunset: 21:56 Start: 21:40 Duration: 1.25 hours
During the first transect visit, two surveyors simultaneously recorded activity at different locations
throughout the site, using a Batlogger.
A total of 51 bat passes were recorded during the transect conducted by Surveyor 1; while total of 27
bat passes were recorded during the transect conducted by Surveyor 2 (see Table 5). During this
summer visit, two bat species were recorded by both surveyors, common pipistrelle and soprano
pipistrelle. Similar to the static results, common pipistrelle and soprano pipistrelle bats were the most
active species across the Wind Farm Site, with the most dominant species being common pipistrelle.
Figure 6 shows the distribution of bat records across the Wind Farm Site recorded during the June
transect. This illustrates that bat activity was strongly associated with habitat features, including
treelines and hedgerows along field boundaries and at the edge of the bog, as well as
conifer/broadleaf forestry plantations. Higher activity was noted in the southern section of the site
during the June transect; however, it was noted during the survey that smoke from a nearby forest fire
was quite thick in parts of the site. Thus, the apparent higher levels of activity in the southern part of
the site may be as a result of decreased smoke in this section of the site.
Visit 2:
Date: 05-Aug-2020 Sunset: 21:17 Start: 21:50 Duration: 1.75/2 hours
During the second transect visit, four surveyors covered the site in pairs using Batloggers. An
emergence survey was conducted prior to walking the transect routes – recording time and bat
passes were excluded in the analysis of the transect and reported on within the results section for
roost emergence survey in Section 3.2.1.
A total of 288 bat passes were recorded during the August transect survey conducted by Surveyor 1
and 2 within the Northern and Eastern sections of the Site (see Table 5). During this visit common
pipistrelle (236 passes) and soprano pipistrelle (46 passes) were the most active across the site. A
small number of Leisler’s bat (2 passes), Myotis species (2 passes), Nathusius’ pipistrelle (1 pass)
and brown long-eared bat (1 pass) were also recorded. A total of 232 bat passes were recorded
during the August transect conducted by Surveyor 3 and 4 within the southern and western sections
of the Wind Farm Site. Common pipistrelle activity dominated the records with 152 passes recorded.
Soprano pipistrelle bat activity was also high at 76 passes. Again, only small numbers of Leisler’s bat
(1 pass), Myotis species (1 pass) and brown long-eared bat (2 passes) were recorded.
Like the June transect, high levels of activity were recorded along treelines and within the plantations
and broadleaf woodland. As can be seen in Figure 7, little to no activity was recorded in open fields
or along roads with no features, such as hedgerows or treelines.
Visit 3:
Dawn and dusk transect surveys were carried out during the third visit. For both transects, four
surveyors covered the site in pairs. As such, data is displayed from only two prominent Batloggers to
avoid multiplication. Emergence surveys were conducted prior to walking the dusk transect routes
and re-entry surveys were conducted following the dawn transects. Recording time and bat passes
were excluded in the analysis of the transect and reported on within the results section for roost
emergence survey in Section 3.2.1.
Activity in the September transect, like the August transect, was associated with treelines, hedgerows
and plantations. High numbers of common pipistrelle were recorded along the treeline ‘T’ shaped
treeline near D.02 which was determined a valuable commuting and foraging corridor for bats.
Furthermore, higher levels of activity were recorded along the plantation at the edge of the agricultural
field to the east of the Site, where large numbers of common and soprano pipistrelles were recorded
foraging during both the dusk and dawn surveys.

Bracklyn Wind Farm
Annex 5.5: Bat Survey Report 30
Date: 02-Sept-2020 Sunset: 20:17 Start: 21:00 Duration: 1.5 hours
As shown in Table 5, a total of 162 bat passes were recorded during 95 minutes of survey time for the
September dusk transect conducted by Surveyor 1 and 2 within the northern and eastern sections of
the Wind Farm Site. A total of 28 bat passes were recorded during 94 minutes of survey time for the
September dusk transect conducted by Surveyor 3 and 4 within the southern and western section of
the Wind Farm Site. During the autumn dusk visit, three bat species were recorded by Surveyor 1
and 2, with common pipistrelle dominating the records (100 passes) followed by soprano pipistrelle
(47 passes). Leisler’s bats were also recorded foraging in three separate locations along the transect
route. Within the southern and western section of the Site, soprano pipistrelle passes were highest
(17 passes) followed by common pipistrelle (11).
Date: 03-Sept-2020 Sunrise: 06:42 Start: 04:45 Duration: 1 hour
As shown in Table 5, a total of 92 bat passes were recorded during the dawn transect conducted by
Surveyor 1 and 2, while a total of 120 bat passes were recorded by Surveyor 3 and 4. As in the dusk
transect, common pipistrelle bat passes dominated the registrations during the transect conducted by
Surveyor 1 and 2 with 51 passes, while soprano pipistrelle bat passes also remained high with 32
passes. 4 Leisler’s bat passes and 5 brown long-eared bat passes were also recorded. Surveyors 3
and 4 recorded a total of 71 soprano pipistrelle passes and 45 common pipistrelle passes. One
Nathusius’ pipistrelle was also recorded in this section of the Wind Farm Site. Leisler’s bat and brown
long-eared bats were present in very small numbers along the transect route, 2 and 1 passes
respectively.
Visit 4
A driven transect with the user of a single detector was conducted along the grid connection route.
This was undertaken to provide a species list assess the use of habitat features along the grid
connection route by bats.
Date: 10-May-2020 Sunset: 21:15 Start: 23:34 Duration: 0.5 hour
Displayed in Table 5,. only 13 bats were recorded during the transect all of which were common
pipistrelles. None of the calls recorded contained feeding buzzes making it more likely the linear
features along this road are used for commuting by a small number of bats and are not used
intensively for foraging.

Bracklyn Wind Farm
Annex 5.5: Bat Survey Report 31
Table 5 – Number of bat passes recorded throughout transect surveys
Species
Transect 1 – Dusk 08-Jun-2020
Transect 2 – Dusk 05-Aug-2020
Transect 3 – Dusk 02-Sep-2020
Transect 3 – Dawn 03-Sep-2020
Transect 4 – Dusk
Substation Route
10-May-2021
Surveyor 1
Surveyor 2
Surveyor 1 & 2
Surveyor 3 & 4
Surveyor 1 & 2
Surveyor 3 & 4
Surveyor 1 & 2
Surveyor 3 & 4
Surveyor 1
Common pipistrelle
45 24 236 152 100 11 51 45 13
Soprano pipistrelle
6 3 46 76 47 17 32 71 0
Nathusius’ pipistrelle
0 0 1 0 0 0 0 1 0
Leisler’s bat
0 0 2 1 15 0 4 2 0
Myotis species
0 0 2 1 0 0 0 0 0
Brown long-eared bat
0 0 1 2 0 0 5 1 0
Total 51 27 288 232 162 28 92 120 13

Bracklyn Wind Farm
Annex 5.5: Bat Survey Report 32
Figure 6 – Coverage and bat registrations for dusk transect: 08-Jun-2020

Bracklyn Wind Farm
Annex 5.5: Bat Survey Report 33
Figure 7 – Coverage and bat registrations for emergence surveys and dusk transect: 05-Aug-2020

Bracklyn Wind Farm
Annex 5.5: Bat Survey Report 34
Figure 8 – Coverage and bat registrations for emergence surveys and dusk transect: 02-Sep-2020

Bracklyn Wind Farm
Annex 5.5: Bat Survey Report 35
Figure 9a – Coverage and bat registrations for dawn transect and re-entry surveys: 03-Sep-2020

Bracklyn Wind Farm
Annex 5.5: Bat Survey Report 36
Figure 9b - Coverage and bat registrations for dusk emergence surveys and transect for grid route: 10-May-2021

Bracklyn Wind Farm
Annex 5.5: Bat Survey Report 37
3.4 Static detector surveys
In compliance with SNH (2019) guidelines, static bat detectors were deployed three times over the
2020 active season at or adjacent to the nine proposed turbine locations and two context locations at
Bracklyn Wind Farm – see Table 2 and Figure 4. Weather conditions during the three deployment
periods were proven to be compliant with SNH (2019) requirements, that is, 10 nights above
thresholds for minimum dusk temperature (8°C) and below thresholds for overnight for rainfall.
Bat activity, based on bat passes per hour was assessed using activity levels as adapted from Kepel
et al. (2011). Table 6 shows the levels attributed to ‘Low’, ‘Medium’ and ‘High’ activity. For the
purpose of wind farms in Ireland, the activity levels of the Kepel et al. (2011) have been adapted to
‘High’, ‘Medium’, and ‘Low’ activity levels in an Irish context. These are illustrated in Table 7.
Table 6 – Bat activity levels associated with bat passes per hour (bp/h) - sourced from A Review of the Impacts of Wind Energy Developments on Biodiversity Kepel et al. (2011)
Bat activity Nyctalus species Pipistrellus species All bat species
Low 2.5 2.5 3.0
Medium 4.3 4.1 6.0
High 8.6 8.0 12.0
Table 7 – Categories for bat activity levels associated with bat passes per hour (bp/h) Adapted from Kepel et al. (2011).
Attributed bat activity level
Nyctalus species Pipistrelle species All bats
Low 0 to 3.5 0 to 3.5 0 to 4.0
Medium 3.6 to 6.5 3.6 to 6.5 4.1 to 10.0
High > 6.5 >6.5 > 10.0
Further context for activity levels was provided through the analysis of the data with Ecobat. The
percentiles generated by Ecobat for specific nights of bat activity allow for the objective classification
of bat activity as ‘Low’, ‘Moderate’ or ‘High’. As Ecobat uses median percentile data it is less
influenced by large variance in the data as averages such as bp/h can be. Table 8 shows the levels of
bat activity categories by Ecobat percentile scores, which is suggested by SNH et al. (2019) for use in
the assessment of risk to local bat population from wind farm developments
Table 8 – Bat activity levels categorised by percentile scores Source: SNH et al. (2019)
Ecobat Percentile Bat Activity Level
81 - 100 High
61 - 80 Moderate-High
41 - 60 Moderate
21 - 40 Moderate-Low
0 - 20 Low
The following sections detail the results from static monitoring surveys for each of the three seasonal
deployments. The bp/h from the static bat detector surveys are tabulated in Table 12 and show the
relative levels of bat activity for each unit across all three deployments.
Figures are provided for each deployment illustrating the location of each static detector with pie
charts, which are sized in relation to levels of bat activity recorded (labelled with the total number of
bp/h), with the divisions representing the percentage of bp/h recorded for each species present – See
Figure 13, Figure 16 and Figure 19 for spring, summer and autumn deployments respectively.

Bracklyn Wind Farm
Annex 5.5: Bat Survey Report 38
Likewise, weather data for the three deployment periods has been extracted and is shown graphically
in Figure 14, Figure 17 and Figure 20 for spring, summer and autumn deployments respectively.
Weather data in these figures is displayed alongside data from a single unit deployed over the same
period to illustrate the relationship between bat activity and weather conditions.
This initial analysis examines the data for the site as a whole examining all values taken across all the
detectors over the duration of all three deployments to provide site-wide median activity levels for bats
in the Wind Farm Site. The median activity levels on a site-wide basis, as analysed and categorised
by Ecobat, showed common pipistrelles to have a ‘High’ level of activity, soprano pipistrelles have
‘Moderate/High’ level of activity and Leisler’s bats have a ‘Moderate’ level activity. The remaining
species; Nathusius’ pipistrelle, brown long-eared bats and Myotis species had ‘Moderate/Low’ levels
of activity. These overall activity levels are summarised in Table 9.
Table 10 shows that while overall activity levels were ‘Moderate/Low’ for Myotis species and brown
long-eared bats, Myotis species had 30 nights of ‘Moderate/High’ to ‘High’ activity while brown long-
eared bats had 5 nights of moderate/high to high activity. Table 10 also shows that the activity levels
for Nathusius’ pipistrelles did not at any point exceed moderate/high levels of activity, an activity level
which was only measured on two nights for the species. Table 11 shows which locations and seasons
recorded localised and seasonal periods of moderate/high and high activity for species active at these
levels.
Table 9 – Summary table showing key metrics for each species recorded.
Species Median
Percentile 95% Confidence
Intervals Max
Percentile Nights
Recorded Median Activity Levels
Myotis species 39 47.5 - 69.5 82 215 Moderate/Low
Leisler's bat 52 56.5 - 76 95 314 Moderate
Nathusius' pipistrelle 23 21 - 45 77 32 Moderate/Low
Common pipistrelle 83 87 - 95.5 99 362 High
Soprano pipistrelle 70 75 - 95.5 100 319 Moderate/High
Brown long-eared bat 23 29 - 45 85 105 Moderate/Low
Table 10 – Number of nights of activity for each species in each activity band Note: This is relative to the sum of nights recorded across all detectors, n = 471
Species/Species Group
Nights of activity
High Moderate/
High Moderate
Low/ Moderate
Low Total nights
recorded
Myotis species 3 27 73 72 40 215
Leisler's bat 36 85 99 62 32 314
Nathusius' pipistrelle 0 2 4 11 15 32
Common pipistrelle 196 69 45 21 31 362
Soprano pipistrelle 117 89 55 37 21 319
Brown long-eared bat 2 3 26 39 35 105

Bracklyn Wind Farm
Annex 5.5: Bat Survey Report 39
Table 11 – Deployment locations and species with High or Moderate-High activity levels
Season Location Species Median
Percentile
95% Confidence
Intervals
Max. Percentile
Nights recorded
Reference
Range12
(nights)
Sp
rin
g
D.02 Common pipistrelle 78 59.5 - 84.0 95 13 4,019
D.04
Leisler's bat 62 58.0 - 67.5 78 17 3,561
Common pipistrelle 93 83.0 - 94.5 99 18 4,019
Soprano pipistrelle 71 64.5 - 79.5 91 18 3,565
D.05
Leisler's bat 70 62.5 - 73.0 86 17 3,561
Common pipistrelle 88 76.0 - 90.5 96 17 4,019
Soprano pipistrelle 68 60.0 - 76.0 90 18 3,565
D.06 Common pipistrelle 92 85.0 - 93.0 94 12 3,830
Soprano pipistrelle 73 53.5 - 78.5 85 11 3,390
D.09
Leisler's bat 86 74.0 - 88.5 95 18 3,561
Common pipistrelle 94 73.0 - 95.0 98 17 4,019
Soprano pipistrelle 70 53.5 - 76.0 86 17 3,565
D.10 Leisler's bat 68 53.5 - 73.0 84 15 3,561
Common pipistrelle 90 58.5 - 91.0 97 17 4,019
D.11 Common pipistrelle 76 66.0 - 83.5 96 14 4,019
Su
mm
er
D.01 Common pipistrelle 65 40.5 - 76.0 87 13 5,592
D.02 Common pipistrelle 91 56.5 - 95.0 99 12 5,588
Soprano pipistrelle 88 64.0 - 92.0 99 13 5,292
D.03 Common pipistrelle 79 42.0 - 82.5 88 11 5,583
D.04
Common pipistrelle 81 48.5 - 90.0 96 13 5,589
Soprano pipistrelle 70 43.0 - 80.0 87 9 5,291
Brown long-eared bat 65 33.0 - 80.0 80 5 1,978
D.05 Common pipistrelle 63 59.0 - 65.0 65 3 5,588
D.06 Common pipistrelle 87 71.5 - 96.5 99 14 5,561
Soprano pipistrelle 86 68.0 - 92.0 97 14 5,265
D.07
Myotis species 61 38.5 - 79.5 81 7 3,367
Common pipistrelle 95 81.0 - 97.5 98 6 5,581
Soprano pipistrelle 79 47.0 - 89.5 95 8 5,289
D.09 Leisler's bat 70 39.5 - 83.0 90 12 4,877
Soprano pipistrelle 63 16.0 - 70.0 77 9 5,295
D.10 Common pipistrelle 70 41.5 - 84.5 97 11 5,586
D.11 Common pipistrelle 78 24.5 - 90.0 91 7 5,572
Au
tum
n
D.02 Common pipistrelle 84 77.5 - 91.5 97 11 4,718
Soprano pipistrelle 86 75.0 - 89.0 96 12 4,856
D.03 Common pipistrelle 81 63.5 - 85.0 93 15 4,718
Soprano pipistrelle 77 59.5 - 81.5 91 15 4,856
D.04
Leisler's bat 62 50.0 - 68.0 83 15 3,568
Common pipistrelle 94 79.5 - 96.5 99 15 4,718
Soprano pipistrelle 93 79.0 - 95.5 100 14 4,856
D.05 Common pipistrelle 92 70.5 - 97.5 99 11 4,718
Soprano pipistrelle 94 87.5 - 94.0 97 11 4,856
D.06 Common pipistrelle 98 95.5 - 98.0 98 5 4,718
Soprano pipistrelle 99 96.5 - 99.0 99 5 4,856
D.07 Common pipistrelle 93 86.5 - 96.0 98 11 4,718
Soprano pipistrelle 98 87.0 - 99.0 100 11 4,856
D.08 Common pipistrelle 72 52.0 - 83.0 98 14 4,718
Soprano pipistrelle 62 46.5 - 76.5 97 15 4,856
D.09 Soprano pipistrelle 64 52.0 - 70.0 75 10 4,856
D.10 Common pipistrelle 95 89.5 - 97.0 99 11 4,718
Soprano pipistrelle 92 87.5 - 94.0 97 11 4,856
D.11 Common pipistrelle 89 70.0 - 91.0 93 10 4,718
Soprano pipistrelle 76 60.0 - 84.5 91 10 4,856
12 Reference range refers to the number of nights of similar geographic location, equipment used and time of year to which these data were compared.

Bracklyn Wind Farm
Annex 5.5: Bat Survey Report 40
Table 12 – Bat activity (bp/h) recorded by static detectors in 2020 Colour coded to reflect levels of bat activity (green – Low, gold – Medium, brown – High )– Under each species the first column shows the total number of bat passes and the second column shows bat passes/hour (bp/h)
Deployment date
Unit ID
Type Map ID
Turb. No.
Nights Minutes Leisler's bat Passes – bp/h
Soprano pipistrelle Passes - bp/h
Common pipistrelle Passes - bp/h
Nathusius' pipistrelle Passes - bp/h
Pipistrelle sp. Passes - bp/h
Myotis species Passes - bp/h
Brown long-eared bat Passes - bp/h
Total Passes - bp/h
Sp
rin
g
21
-Ma
y-2
020
001 SM2 D.01 T1 18 Failed 0 0.00 0 0.00 0 0.00 0 0.00 0 0.00 0 0.00 0 0.00 0 0.00
019 SM2 D.02 T2 14 7,112 107 0.90 158 1.33 918 7.74 2 0.02 0 0.00 14 0.12 2 0.02 1,201 10.13
024 SM2 D.03 T3 18 9,058 0 0.00 0 0.00 2 0.01 0 0.00 0 0.00 0 0.00 0 0.00 2 0.01
032 SM4 D.04 T4 18 9,058 397 2.63 934 6.19 5,680 37.63 83 0.55 0 0.00 159 1.05 18 0.12 7,271 48.16
029 SM4 D.05 T5 18 9,058 543 3.60 977 6.47 3,599 23.84 13 0.09 0 0.00 306 2.03 70 0.46 5,508 36.49
022 SM2 D.06 T6 11 5,651 107 1.14 468 4.97 3,638 38.63 0.00 3 0.03 32 0.34 0 0.00 4,248 45.11
009 SM2 D.07 T7 18 9,058 0 0.00 0 0.00 0 0.00 0 0.00 0 0.00 0 0.00 0 0.00 0 0.00
026 SM4 D.10 T10 18 9,058 479 3.17 176 1.17 3,772 24.99 1 0.01 0 0.00 57 0.38 9 0.06 4,494 29.77
011 SM2 D.11 T11 15 7,601 290 2.29 220 1.73 1,472 11.62 1 0.01 2 0.02 40 0.32 1 0.01 2,026 15.99
014 SM2 D.08 Context 16 8,284 57 0.41 14 0.1 137 0.99 0 0.00 1 0.01 0 0.00 0 0.00 209 1.51
033 SM4 D.09 Context 18 9,058 2,164 14.33 780 5.17 5,873 38.90 25 0.17 0 0.00 38 0.25 6 0.04 8,891 58.90
Su
mm
er
23
-Ju
n-2
02
0
025 SM4 D.01 T1 15 7,754 36 0.28 145 1.12 336 2.60 0 0.00 0 0.00 2 0.02 0 0.00 519 4.02
016 SM2 D.02 T2 14 7,183 161 1.34 2,127 17.77 2,989 24.97 0 0.00 0 0.00 38 0.32 41 0.34 5,356 44.74
023 SM2 D.03 T3 15 7,754 67 0.52 140 1.08 390 3.02 0 0.00 0 0.00 15 0.12 12 0.09 624 4.83
286 SM4 D.04 T4 15 7,754 87 0.67 268 2.07 1,303 10.08 0 0.00 0 0.00 48 0.37 62 0.48 1,770 13.70
031 SM4 D.05 T5 15 7,754 0 0.00 3 0.02 38 0.29 0 0.00 0 0.00 0 0.00 0 0.00 41 0.32
020 SM2 D.06 T6 14 7,298 38 0.31 1,982 16.30 3,861 31.74 0 0.00 961 7.90 6 0.05 4 0.03 6,852 56.33
037 SM4 D.07 T7 11 5,520 50 0.54 507 5.51 1,784 19.39 0 0.00 0 0.00 168 1.83 2 0.02 2,511 27.29
028 SM4 D.10 T10 15 7,754 95 0.74 155 1.20 1,425 11.03 0 0.00 0.00 9 0.07 7 0.05 1,691 13.08
039 SM4 D.11 T11 15 7,754 1 0.01 23 0.18 344 2.66 0 0.00 0 0.00 0 0.00 0 0.00 368 2.85
036 SM4 D.08 Context 15 7,754 35 0.27 0 0.00 33 0.26 0 0.00 0 0.00 0 0.00 5 0.04 73 0.56
027 SM4 D.09 Context 15 7,754 496 3.84 142 1.10 555 4.29 0 0.00 0.00 12 0.09 20 0.15 1,225 9.48
Au
tum
n
25
-Aug
-20
20
038 SM4 D.01 T1 15 10,148 20 0.12 64 0.38 90 0.53 0 0.00 0 0.00 4 0.02 7 0.04 185 1.09
011 SM2 D.02 T2 11 7,552 96 0.76 819 6.51 1,305 10.37 0 0.00 0 0.00 39 0.31 30 0.24 2,289 18.19
034 SM4 D.03 T3 15 10,148 142 0.84 407 2.41 555 3.28 0 0.00 0 0.00 32 0.19 17 0.10 1,153 6.82
051 SM4 D.04 T4 15 10,148 149 0.88 4,626 27.35 4,847 28.66 0 0.00 0 0.00 82 0.48 14 0.08 9,718 57.46
016 SM2 D.05 T5 11 7,863 24 0.18 1,694 12.93 4,201 32.06 0 0.00 0 0.00 20 0.15 7 0.05 5,946 45.37
019 SM2 D.06 T6 4 2,745 37 0.81 3,405 74.44 2,209 48.29 0 0.00 0 0.00 7 0.15 0 0.00 5,658 123.69
010 SM2 D.07 T7 11 7,692 90 0.70 6,436 50.20 2,686 20.95 0 0.00 0 0.00 89 0.69 1 0.01 9,302 72.56
060 SM4 D.10 T10 11 7,790 80 0.62 1,543 11.88 4,084 31.46 0 0.00 0 0.00 92 0.71 3 0.02 5,802 44.69
006 SM2 D.11 T11 9 6,798 97 0.86 307 2.71 773 6.82 0 0.00 0 0.00 14 0.12 4 0.04 1,195 10.55
032 SM4 D.08 Context 15 10,148 265 1.57 673 3.98 784 4.64 1 0.01 0 0.00 27 0.16 12 0.07 1,762 10.42
007 SM2 D.09 Context 13 9,028 75 0.50 85 0.56 53 0.35 1 0.01 1 0.01 4 0.03 0 0.00 219 1.46

Bracklyn Wind Farm
Annex 5.5: Bat Survey Report 41
3.4.1 Static monitoring results for spring deployment (21 May – 06 June 2020)
Static bat detectors were deployed for a total of up to 18 nights adjacent to or at the nine proposed
turbine locations, with an additional two context locations also covered – see Figure 4. Seven out of
the eleven static detectors recorded for the full 18 nights, while the other four recorded from 11 to 16
nights. All are considered to be in compliance with SNH guidelines. Table 12 shows the number of
bat passes recorded on each detector over the survey period as well as the bp/h.
Weather data for the spring deployment shows compliance with SNH et al. (2019) guidelines of
temperatures >8°C at dusk and wind speeds <5 m/s (18 km/h) and little or no rain, for 17 out of the 18
nights deployed (see Figure 14). Due to a system failure after set up on the 21-May-2020, weather
data was not collected on this date. However, following this, sufficient data was collected for good
weather days demonstrating compliance with the guidelines. Wind speeds remained below 5 m/s
(18 km/h) during night time hours for the entirety of the deployment period, while evening
temperatures were consistently above 8°C at dusk. There was relatively little rain recorded during
night-time periods, although some rain was recorded during daylight hours.
Table 12 shows that common pipistrelle bp/h species totals were considered ‘High’ for seven out of
the eleven static locations: D.02; D.04; D.05; D.06; D.10; D.11; and D.09, the context unit located
within a bog woodland leading to the lake. The highest level of aggregate bp/h for spring was
58.9 bp/h which was recorded at D.09. The bp/h for Leisler’s bats was considered ‘High’ at D.09,
while soprano pipistrelle bp/h was considered ‘Medium’. Soprano pipistrelle bp/h was also considered
‘Medium’ for D.04, D.05, and, D.06.
Figure 13 illustrates the distribution of bat passes recorded at all the deployment location over the
spring deployment period. Common pipistrelles and soprano pipistrelles accounted for over 75% of
the calls during spring with the exception of D.08 and D.09, the two context detectors. At these
detectors, Leisler’s bats accounted for approximately 25% of the recorded activity. During the spring
deployment, the highest level of total bat activity (58.9 bp/h) was recorded at D.09 while the highest
bat activity associated with a turbine location was that of D.04 (48.2 bp/h) which was deployed along
a treeline adjacent to T4. Figure 15 shows the activity patterns of species at D.04 over the course of
the deployment. Common and soprano pipistrelles at D.04 were most active at the start of the
deployment with activity levels decreasing during the 28-May to the 1-Jun-2020 period then
increasing again after this date. This time period coincided with a decrease in minimum nightly
temperatures, and also marks when Nathusius’ pipistrelles stopped showing activity at this location.
In terms of aggregated bat passes for all species (Table 12), total bp/h were considered ‘High’ for
D.04, D.05, D.06, D.10, D.11 and at D.09, the context unit within the bog woodland leading to the
lake. D.03 and D.08 had ‘Low’ levels of aggregate bat passes per hour.
Ecobat analysis for the spring deployment showed that several locations had ‘Moderate/High’ and
‘High’ activity levels, as seen in Table 11. Common pipistrelles had ‘Moderate/High’ activity levels at
D.02 and D.011 and ‘High’ activity levels at D.04, D.05, D.06, D.09 and D.10. Soprano pipistrelles had
‘Moderate/High’ activity levels at D.04, D.05, D.06, and D.09. Leisler’s bat had ‘Moderate/High’ levels
of activity at D.04, D.05 and D.10, and ‘High’ activity levels at D.09.
One of the analysis outputs provided by Ecobat assesses the potential proximity of roosts based on
the bat activity recorded relative to sunset. Figure 10 shows bat activity relative to the time of sunset
across the spring deployment with species specific emergence times represented by grey bars, which
if significantly covered suggest proximity to a roost (Russ, 2012). Figure 10 indicates that some
common pipistrelles, soprano pipistrelles and Leisler’s bats recorded by D.06 may have been
dispersing from a roost in the wider area. The Ecobat report suggested the same regarding soprano
pipistrelles and D.05. However, considering the wooded (and generally dark) nature of the area, it is
also possible that bats were foraging earlier than others in the Ecobat dataset.

Bracklyn Wind Farm
Annex 5.5: Bat Survey Report 42
Figure 10 – Indicative proximity of deployment locations to potential roosts in spring 2020
3.4.2 Static monitoring results for summer deployment (23 June – 8 July 2020)
Static bat detectors were deployed for a total of up to 15 nights adjacent to or at the nine proposed
turbine locations with an additional two context locations also covered – see Figure 4. Though three
of the detectors recorded for less than 15 nights, all recorded for more than 10 nights and are thus
considered compliant with SNH guidelines. Table 12 shows the number of bat passes recorded on
each detector over the survey period, as well as bat passes per hour (bp/h). Figure 16 illustrates the
distribution of bat passes recorded at all the deployment location over the summer deployment period.
Figure 18 details the high activity levels seen over the summer deployment period at D.06.
Weather data for the summer (July) deployment showed compliance with SNH guidelines of
temperatures >8oC at dusk and moderate wind speeds and little or no rain, on most nights.
Occasional heavy rainfall of up to 5.2 mm was recorded on three of the deployment nights, 28-Jun-
2020, 06 and 07-Jul-2020. Evening temperatures were above 8oC at dusk throughout the deployment
period.
As detailed in Table 12, similar to the spring deployment, common pipistrelle species totals were
considered ‘High’ for six out of the eleven deployment locations, with the highest levels of activity
recorded at D.06 (31.74 bp/h). Bat passes per hour (bp/h) for common pipistrelle species were
considered ‘Medium’ at D.09 (4.29 bp/h) during summer, which was lower than the ‘High’ spring
activity (38.9 bp/h). In further contrast to the spring deployment, common pipistrelle species activity
for D.05 was considered ‘Low’. Soprano pipistrelle species totals were considered ‘Medium’ to ‘High’
at three turbine locations: D.02; D.06; and D.07. Leisler’s bat activity was low across all detectors
except for D.09 at which a ‘Medium’ activity level of was recorded (3.84 bp/h). Activity levels were
recorded as ‘Low’ for Myotis species and brown long-eared bats with all bp/h values being lower than
1 bp/h with the exception of Myotis species activity at D.07 which was still classified as ‘Low’ (1.83
bp/h). At D.06 there was also ‘High’ activity of pipistrelle species for which a distinction between
soprano and common pipistrelle could not be made, accounting for 961 passes.
In terms of total aggregated bat passes for all species, total bp/h were considered ‘High’ for five static
detectors deployed at D.02, D.04, D.06, D.07 and D.10. Medium levels of bat activity in terms of total
aggregated bat passes were recorded at D.01, D.03 and D.09, the context unit located within the bog
woodland leading to the lake. Overall, there was a notably lower level of bat activity recorded during

Bracklyn Wind Farm
Annex 5.5: Bat Survey Report 43
the summer deployment in comparison to the spring deployment (165.50 bp/h and 246.07 bp/h,
respectively).
Common pipistrelles were the most active species recorded during the summer deployment with
common pipistrelle bat species registrations occupying nearly 70% of the total bat registrations (as
illustrated in Figure 16). The data from the static detector D.06, near the proposed location for T6 is
presented above as the location where the highest level of activity was recorded during this
deployment period (56.33 bp/h). D.05 recorded a ‘Low’ level of activity (0.32 bp/h) which is in stark
contrast to the ‘High’ levels recorded in spring and autumn. D.08 and D.11 both recorded ‘Low’ levels
of bat activity, though activity was substantially lower at D.08 than D.11 (0.56 bp/h and 2.85 bp/h,
respectively).
Heavy rainfall occurred during two periods during the summer deployment: 27-Jun-2020, and 06 to
07-Jul-2020. Examining D.06 as a sample location for the impact of this weather on bat activity found
the; total bat passes were reduced during the 27-Jun-2020. Though rainfall for the majority of 28 and
29-Jun-2020 remained below 1 mm, no Myotis species, brown long-eared bats nor Leisler’s bats
being recorded during this period. Furthermore, very low numbers of common and soprano
pipistrelles were recorded during this time period. Reduced numbers of bat passes were also
observed during the heavy rain that occurred during the night of the 06-Jul-2020. However, with the
exception of D.07 (which was mentioned in the section covering weather related limitations) all
detectors recorded an adequate number of nights within compliant weather parameters, having
recorded for ≥14 nights to offset the three nights of heavy rainfall.
Ecobat was used to find the areas of ‘Moderate/High’ and ‘High’ activity levels for each species
(Table 11). It was found that common pipistrelle median activity was ‘Moderate/High’ for D.01, D.03,
D.05, D.10, D.11 and ‘High’ for D.02, D.04, D.06, D.07. Soprano pipistrelle median activity was
‘Moderate/High’ at D.04, D.07, D.09 and ‘High’ at D.02, and D.06. ‘Moderate/High’ median activity
levels were measured for Leisler’s bats at D.09, brown long-eared bats at D.04 and Myotis species. at
D.07. Overall summer was the period of the lowest activity in terms of both bat passes per hour and
median percentile levels (Table 12 and Table 9)
The potential proximity of roosts based on emergence times of bat species was also analysed with
the use of Ecobat. Figure 11 shows that some common pipistrelles, soprano pipistrelles and Leisler’s
bats recorded by D.04 and D.06, and Leisler’s bats recorded by D.09 may have been dispersing from
a roost in the wider area.

Bracklyn Wind Farm
Annex 5.5: Bat Survey Report 44
Figure 11 – Indicative proximity of deployment locations to potential roosts in summer 2020

Bracklyn Wind Farm
Annex 5.5: Bat Survey Report 45
3.4.3 Static monitoring results for autumn deployment (25 August – 9 September 2020)
Static bat detectors were deployed for a total of up to 15 nights adjacent to or at the nine proposed
turbine locations including the two context locations – see Figure 4. Table 12 shows the number of
bat passes recorded on each detector over the survey period as well as bat passes per hour. Four of
the detectors recorded for the duration of the 15 nights while five recorded for between 11 and 13
nights. D11 stopped recording during the 10th night. Only one detector, D.06, was considerably below
the compliance time. However, as analysis was conducted using a standardised measurement of bat
passes per hour, the results of this detector were still included and analysed. Figure 19 displays the
location of each detector and the total number of bat passes per hour recorded. Figure 21 details the
bat activity levels across the deployment period the static detector deployed along a hedgerow
adjacent to T2 (D.02).
Weather data for the September deployment also is compliant with the SNH Guidelines of
temperatures >8°C at dusk and moderate wind speeds and little or no rain, on all nights. Wind
speeds remained below acceptable levels while evening temperatures were above 8°C at dusk on all
evenings. There was relatively little rainfall recorded during night time periods, although some light
rain was recorded on seven nights. Figure 20 displays weather data recorded throughout the
deployment period.
As detailed in Table 12, common pipistrelle species totals were considered ‘High’ for eight out of the
eleven deployment locations: D.02; D.04; D.05; D.06; D.07; D,08; D.10; and D.11. Common pipistrelle
activity was lower at D.02 during the autumn deployment than the summer deployment. In contrast,
common pipistrelle registrations were significantly higher at D.05 during the autumn deployment than
during the summer deployment. The autumn deployment recorded the highest number of soprano
pipistrelle registrations, with six detectors recording ‘High’ levels of bat activity, with a further two
recording ‘Medium’ levels of activity. All other species totals aside from pipistrelles were considered
‘Low’ during the autumn deployment. Units at D.01 and D.09 recorded considerably lower bat passes
(1.09 bp/h and 1.46 bp/h) compared to all the other deployment locations. ‘High’ activity was recorded
at D.08, which is located in an open field (98 m from the nearest linear feature) and had recorded
‘Low’ activity over the previous two deployments.
Common and soprano pipistrelles made up the majority of the calls consisting of 50% and 46% of
total calls respectively. As was recorded during the summer deployment, D.06 was once again the
location where the highest number of bat passes were recorded (123.69 bp/h). D.08 recorded a ‘High’
level of activity (10.42 bp/h), while D.09 recorded a ‘Low’ level of activity (1.46 bp/h). These results
are quite different from the previous two deployments during which D.09 recorded ‘High’ and
‘Moderate’ activity and D.08 only recorded ‘Low’ activity.
In terms of total aggregated bat passes, all static locations recorded ‘High’ or ‘Medium’ levels of
activity with the exception of D.01 and D.09. Bat passes at the aforementioned locations observed a
gradual decrease from the spring deployment to the autumn. In contrast to the spring and summer
deployments, there was a similar level of common and soprano pipistrelle activity (193 bp/h and
187 bp/h respectively). Social calls were also noted frequently during this deployment period. Autumn
had the highest total bp/h out of all the seasonal deployments (451 bp/h).
Ecobat was used to find the areas of ‘Moderate/High’ and ‘High’ activity levels (Table 11) for each
species. It found that common pipistrelles had ‘High’ median activity levels at D.02, D.03, D.04, D.05,
D.06, D.07, D.10, D.11 and ‘Moderate/High’ median activity levels at D.08. Soprano pipistrelles had
‘High’ median activity levels at D.02, D.04, D.05, D.06, D.07, D.10 and ‘Moderate/High’ median
activity levels at D.03, D.08 and D.09. Leisler’s bats had ‘Moderate/High’ median activity levels at
D.04.

Bracklyn Wind Farm
Annex 5.5: Bat Survey Report 46
Ecobat analysis of species-specific emergence times found that soprano and common pipistrelles
recorded by D.05 and D.06 may have been dispersing from roosts in the wider area. The same can
be said of brown long-eared in relation to D.05 and soprano pipistrelle in relation to D.07 (Figure 12).

Bracklyn Wind Farm
Annex 5.5: Bat Survey Report 47
Figure 12 – Indicative proximity of deployment locations to potential roosts in autumn 2020

Bracklyn Wind Farm
Annex 5.5: Bat Survey Report 48
Figure 13 – Total bp/h for each species by static bat detectors for spring 2020

Bracklyn Wind Farm
Annex 5.5: Bat Survey Report 49
Figure 14 – Spring deployment – Mean hourly temperature, wind speed and rainfall
Figure 15 – D.04 - Bat passes over time: 21-May to 08-Jun-2020 (Unit near T4)
0
0.5
1
1.5
2
2.5
0
5
10
15
20
25
301
3
18
23
04
09
14
19
00
05
10
15
20
01
06
11
16
21
02
07
12
17
22
03
08
13
18
23
04
09
14
19
00
05
10
15
20
01
06
11
16
21
02
07
12
17
22
03
08
13
18
23
04
09
14
19
00
05
10
15
20
01
06
11
16
21
02
07
12
17
22
03
08
13
18
23
04
09
14
19
00
05
10
15
20
22-May
23-May 24-May 25-May 26-May 27-May 28-May 29-May 30-May 31-May 01-Jun 02-Jun 03-Jun 04-Jun 05-Jun 06-Jun 07-Jun 08-Jun
Rai
n (
mm
)
Tem
p (
oC
) an
d W
ind
spee
d (
km/h
)
Date and Time
Sum of Rain - mm Sum of Temp - °C Sum of Wind Speed - mph
0
50
100
150
200
250
300
21
23 2 4
23 1 3
22 0 2 4
22 0 2
22 0 2 4
23 1 3
22 0 2 4
23 1 3
22 0 2 4
23 1 3
22 0 2 4
22 0 2 4
22 0 3
22 0 2 4
23 1 3
22 1
23 1 3
22 0 2
21-May
22-May 23-May 24-May 25-May 26-May 27-May 28-May 29-May 30-May 31-May 01-Jun 02-Jun 03-Jun 04-Jun 05-Jun 06-Jun 07-Jun 08-Jun
May Jun
Myotis Nyctalus leisleri Pipistrellus nathusii Pipistrellus pipistrellus Pipistrellus pygmaeus Plecotus auritus

Bracklyn Wind Farm
Annex 5.5: Bat Survey Report 50
Figure 16 – Total bp/h recorded for each species by static bat detectors for summer 2020
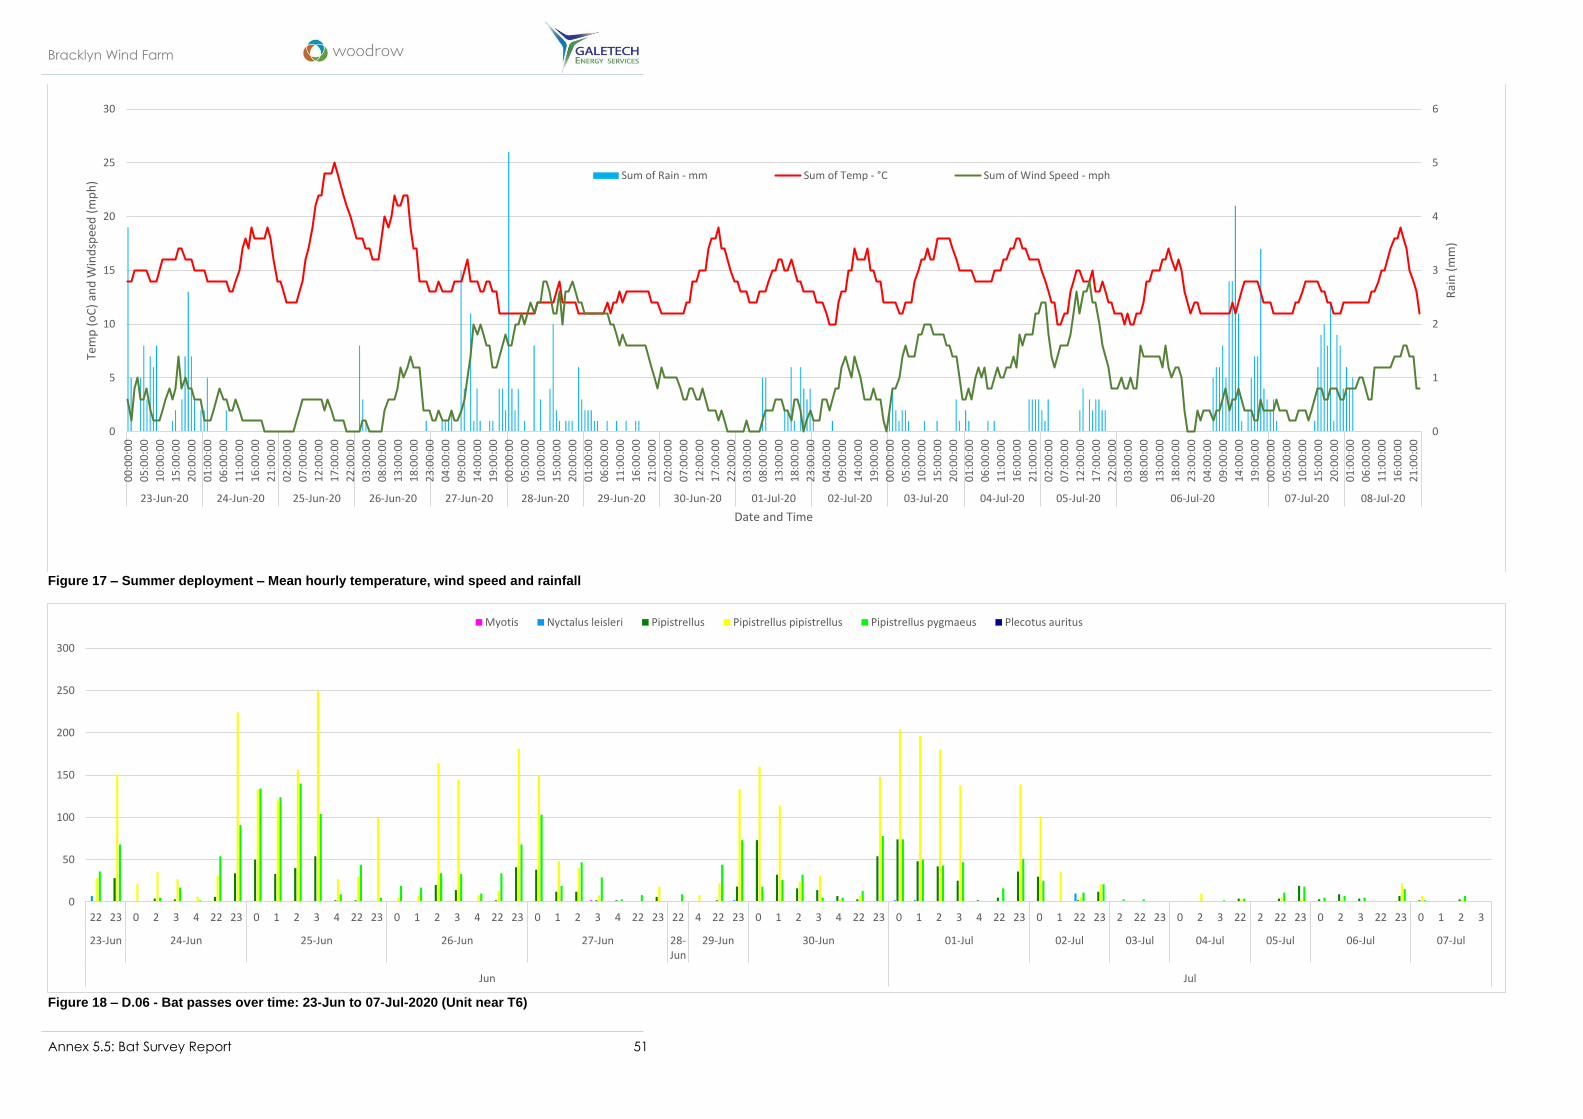
Bracklyn Wind Farm
Annex 5.5: Bat Survey Report 51
Figure 17 – Summer deployment – Mean hourly temperature, wind speed and rainfall
Figure 18 – D.06 - Bat passes over time: 23-Jun to 07-Jul-2020 (Unit near T6)
0
1
2
3
4
5
6
0
5
10
15
20
25
30
00
:00
:00
05
:00
:00
10
:00
:00
15
:00
:00
20
:00
:00
01
:00
:00
06
:00
:00
11
:00
:00
16
:00
:00
21
:00
:00
02
:00
:00
07
:00
:00
12
:00
:00
17
:00
:00
22
:00
:00
03
:00
:00
08
:00
:00
13
:00
:00
18
:00
:00
23
:00
:00
04
:00
:00
09
:00
:00
14
:00
:00
19
:00
:00
00
:00
:00
05
:00
:00
10
:00
:00
15
:00
:00
20
:00
:00
01
:00
:00
06
:00
:00
11
:00
:00
16
:00
:00
21
:00
:00
02
:00
:00
07
:00
:00
12
:00
:00
17
:00
:00
22
:00
:00
03
:00
:00
08
:00
:00
13
:00
:00
18
:00
:00
23
:00
:00
04
:00
:00
09
:00
:00
14
:00
:00
19
:00
:00
00
:00
:00
05
:00
:00
10
:00
:00
15
:00
:00
20
:00
:00
01
:00
:00
06
:00
:00
11
:00
:00
16
:00
:00
21
:00
:00
02
:00
:00
07
:00
:00
12
:00
:00
17
:00
:00
22
:00
:00
03
:00
:00
08
:00
:00
13
:00
:00
18
:00
:00
23
:00
:00
04
:00
:00
09
:00
:00
14
:00
:00
19
:00
:00
00
:00
:00
05
:00
:00
10
:00
:00
15
:00
:00
20
:00
:00
01
:00
:00
06
:00
:00
11
:00
:00
16
:00
:00
21
:00
:00
23-Jun-20 24-Jun-20 25-Jun-20 26-Jun-20 27-Jun-20 28-Jun-20 29-Jun-20 30-Jun-20 01-Jul-20 02-Jul-20 03-Jul-20 04-Jul-20 05-Jul-20 06-Jul-20 07-Jul-20 08-Jul-20
Rai
n (
mm
)
Tem
p (
oC
) an
d W
ind
spee
d (
mp
h)
Date and Time
Sum of Rain - mm Sum of Temp - °C Sum of Wind Speed - mph
0
50
100
150
200
250
300
22 23 0 2 3 4 22 23 0 1 2 3 4 22 23 0 1 2 3 4 22 23 0 1 2 3 4 22 23 22 4 22 23 0 1 2 3 4 22 23 0 1 2 3 4 22 23 0 1 22 23 2 22 23 0 2 3 22 2 22 23 0 2 3 22 23 0 1 2 3
23-Jun 24-Jun 25-Jun 26-Jun 27-Jun 28-Jun
29-Jun 30-Jun 01-Jul 02-Jul 03-Jul 04-Jul 05-Jul 06-Jul 07-Jul
Jun Jul
Myotis Nyctalus leisleri Pipistrellus Pipistrellus pipistrellus Pipistrellus pygmaeus Plecotus auritus

Bracklyn Wind Farm
Annex 5.5: Bat Survey Report 52
Figure 19 – Total bp/h recorded for each species by static bat detectors for autumn 2020

Bracklyn Wind Farm
Annex 5.5: Bat Survey Report 53
Figure 20 – Autumn deployment – Mean hourly temperature, wind speed and rainfall
Figure 21 – D.02 - Bat passes over time: 25-Aug to 05 Sep-2020 (Unit near T2)
0
1
2
3
4
5
6
7
8
9
0
5
10
15
20
250
0:0
0:0
0
05
:00
:00
10
:00
:00
15
:00
:00
20
:00
:00
01
:00
:00
06
:00
:00
11
:00
:00
16
:00
:00
21
:00
:00
02
:00
:00
07
:00
:00
12
:00
:00
17
:00
:00
22
:00
:00
03
:00
:00
08
:00
:00
13
:00
:00
18
:00
:00
23
:00
:00
04
:00
:00
09
:00
:00
14
:00
:00
19
:00
:00
00
:00
:00
05
:00
:00
10
:00
:00
15
:00
:00
20
:00
:00
01
:00
:00
06
:00
:00
11
:00
:00
16
:00
:00
21
:00
:00
02
:00
:00
07
:00
:00
12
:00
:00
17
:00
:00
22
:00
:00
03
:00
:00
08
:00
:00
13
:00
:00
18
:00
:00
23
:00
:00
04
:00
:00
09
:00
:00
14
:00
:00
19
:00
:00
00
:00
:00
05
:00
:00
10
:00
:00
15
:00
:00
20
:00
:00
01
:00
:00
06
:00
:00
11
:00
:00
16
:00
:00
21
:00
:00
02
:00
:00
07
:00
:00
12
:00
:00
17
:00
:00
22
:00
:00
03
:00
:00
08
:00
:00
13
:00
:00
18
:00
:00
23
:00
:00
04
:00
:00
09
:00
:00
14
:00
:00
19
:00
:00
00
:00
:00
05
:00
:00
10
:00
:00
15
:00
:00
20
:00
:00
01
:00
:00
06
:00
:00
24-Aug-20 25-Aug-20 26-Aug-20 27-Aug-20 28-Aug-20 29-Aug-20 30-Aug-20 31-Aug-20 01-Sep-20 02-Sep-20 03-Sep-20 04-Sep-20 05-Sep-20 06-Sep-20 07-Sep-20 08-Sep-20 09-Sep-20
Rai
n (
mm
)
Tem
p (
oC
) an
d W
ind
spee
d (
km/h
)
Date and Time
Sum of Rain - mm Sum of Temp - °C Sum of Wind Speed - mph
0
50
100
150
200
250
300
22 2 3 4 5 21 22 23 0 1 2 3 4 5 6 21 22 23 0 1 4 5 21 22 23 0 4 5 21 22 23 0 1 2 3 4 5 20 21 22 23 0 1 2 3 4 5 20 21 22 23 0 1 2 3 4 5 6 20 21 22 23 0 1 2 3 4 5 20 21 22 23 0 1 2 3 4 5 6 20 21 22 23 0 1 2 3 4 5 6 20 21 22 23 1 2 3 4 5 6 20 21 22 23
25-Aug 26-Aug 27-Aug 28-Aug 29-Aug 30-Aug 31-Aug 01-Sep 02-Sep 03-Sep 04-Sep 05-Sep
Aug Sep
Myotis Nyctalus leisleri Pipistrellus pipistrellus Pipistrellus pygmaeus Plecotus auritus

Bracklyn Wind Farm
Annex 5.5: Bat Survey Report 54
3.5 Permanent static at height
For the 2020 active bat season, a continuously recording static was erected on a temporary
meteorological mast located at 53.569920, -7.076079 on 23-Jun-2020. Data was continuously
recorded from microphones located at 2 m and at height, approximately 50 m, throughout the survey
season until 05-Oct-2020, with the exception of the nights of the 04 to 08 Sep-2020 due to battery
failure. This allowed for comparative analysis between bat activity at various heights within the site.
The following section provides details on the data collected from this continuously recording static.
Figure 22 and Figure 23 shows the level of activity of each bat species recorded throughout the
deployment period. The implication of these results on proposed mitigation are discussed further in
Section 6.2.2.
3.5.1 Overview
Throughout the deployment period, a total of 1,074 Leisler’s bat passes were recorded at 50m, while
a total of 904 Leisler’s bat passes were recorded from the microphone erected at 2 m. A total of 535
common pipistrelle bat passes were recorded at 2 m, significantly more than recorded at 50m where
130 passes were recorded. Similarly, a total of 874 soprano pipistrelle bat passes were recorded from
the static throughout the deployment period, with only 34 of these recorded at 50m. Following this
trend, a total of 46 brown long-eared bat passes were recorded at 2 m, while only 3 passes were
recorded from the microphone erected at 50m. A total of 151 Myotis species bat passes were
recorded at 2 m, while no Myotis species bat passes were recorded from the microphone erected at
50m. Only a single Nathusius’ pipistrelle pass was detected and was recorded on 16-Sep-2020 from
the mic at 2 m.
The results demonstrate a varied level of bat activity at 2 m compared to at 50m on the Site. A higher
level of Leisler’s bat activity was recorded at 50m than at 2 m. Leisler’s bats are a high-flying species
that often forage in open areas above tree level and as such are most at risk of collision causing
fatality from wind farm developments. Pipistrelle species are often cited as being at high risk of
collision with wind turbines. However, the results demonstrate a higher usage of the Wind Farm Site
by these species at ground level than above tree height. Contrary to expectations, 3 brown long-eared
bat passes were recorded at height. This is an unexpected finding (and not echoed by results in other
locations) as this species tends to forage within closed canopy or close to features, and is known to
rarely commute above tree level across open habitat, similar to that of the met mast.
Examining these results, along with the weather conditions with which they occur, provides a clear
picture for the prerequisite conditions during which species are likely to be active at 50m. Overall,
3801 bat passes were recorded on the permanent unit, 1295 of which were recorded at 50m. Of
these, 1295 passes recorded at 50m, 1243 were recorded at windspeeds below 3 m/s while 1270
were recorded below 3.5 m/s leaving only 25 records of bat passes active at 50m at windspeeds
above this level. The three most active species at height were Leisler’s bat, common pipistrelle, and
soprano pipistrelle are examined in further detail. This latter point is important in ascertaining the
potential collision risk resulting from turbines (which cut-in at wind speeds above 3m/s) and potential
curtailment or increases in cut-in speed (eg to 3.5m/s) in appropriate conditions (see Section 6.2.2).
3.5.2 Leisler’s bat The species most frequently recorded at height were Leisler’s bats with a total of 1074 passes being recorded over this survey period. There was an anomalously high peak in Leisler’s bat activity on the 31-Aug-2020 at both 2m and 50m detectors (Figure 24), which may have resulted from intense feeding by a single bat, or a small number of bats and could have been related to recent cereal harvesting in the area combined with still, mild condtions. For the purposes of examining the relation of this species activity at height to weather, this night was removed for a less distorted view of activity levels and a significant pattern emerged (Figure 25).

Bracklyn Wind Farm
Annex 5.5: Bat Survey Report 55
Leisler’s bat activity at 50m is limited by windspeed. Periods of windspeed greater than 6mph
(9.65km/h) such as 28-Jun-2020 to 29-Jun-2020 or 01-Sep-2020 to the 11-Sep-2020 had activity
lower than 5 passes per night. This is contrasted by increases of activity at height during periods of
low wind speeds, particularly from 05-Aug-2020 to 19-Aug-2020 during which wind speed did not
exceed 3mph (4.83km/h). During this period activity increased at both 2m and at 50m. However,
relative to nights of higher windspeed the increase in activity was proportionally much greater at
height than at 2m with nightly passes increasing by between 2 and 5 times the number of passes on
nights with windspeeds above 3mph (4.83km/h). This higher level of activity also coincides with the
peak temperature of the recording period for this detector (approximately 17C) though activity at
height remained high at lower temperatures provided wind speed remained low (09-Aug-2020 to 11-
Aug-2020 in Figure 25).
3.5.3 Common pipistrelles
Common pipistrelles were the second most active species at height and their activity relative to height
and weather conditions is shown in Figure 26. A much lower number of common pipistrelles were
recorded at height than Leisler’s bat, with only 130 recorded in total. Common pipistrelles were also
highly active on the 31-Aug-2020 and once again this is considered to be an outlier in terms of
species activity relative to wind and in the case of common pipistrelles in particular the particularly
high activity that night was at 2m. Common pipistrelle activity at 50m is exclusively limited to
windspeeds equal to or below 3.5 mph (5.63km/h), with the exception of a single pass at height in
5.4mph (8.69km/h). The time at which they were most active at height matched that of Leisler’s bats,
between 05-Aug-2020 and 19-Aug-2020 when wind speeds remained consistently low. However,
even during times of reduced windspeed common pipistrelles were much more active at 2m than at
50m.
3.5.4 Soprano pipistrelle
Soprano pipistrelles were not highly active at height with only a total of 34 passes being recorded
across at height during this long-term recording period. Their activity relative to height and weather
conditions is shown in Figure 27. This species was much more sensitive to increased windspeed and
with only one pass recorded above 2.3mph (3.7km/h). Soprano pipistrelles were active during the
same time period of low windspeed as the previous two species (09-Aug-2020 to 19-Aug-2020 in
Figure 27). However, at no point did activity for this species exceed 7 passes at 50m during this time
period.

Bracklyn Wind Farm
Annex 5.5: Bat Survey Report 56
Figure 22 – Total bat passes at continuously recording static - mic height 2 m
Figure 23 – Total bat passes at continuously recording static - mic height 50 m SPECIES CODES MYSP Myotis species PIPPIP Common pipistrelle PIPPYG Soprano pipistrelle PIPINAT Nathusius’ pipistrelle PLEAUR Brown long-eared bat NYCLEI Leisler’s bat
151
535
840
146
904
0
200
400
600
800
1000
MYSP PIPPIP PIPPYG PIPNAT PLEAUR NYCLEI
Nu
mb
er o
f b
at p
asse
s
Species
130
343
1074
0
200
400
600
800
1000
PIPPIP PIPPYG PLEAUR NYCLEI
Nu
mb
er o
f b
at p
asse
s
Species

Bracklyn Wind Farm
Annex 5.5: Bat Survey Report 57
Figure 24 – Leisler’s bat activity at 50m and 2m relative to weather conditions
Figure 25 – Leisler's bat activity at 50m and 2m relative to weather conditions
- excluding 31-Aug-2020
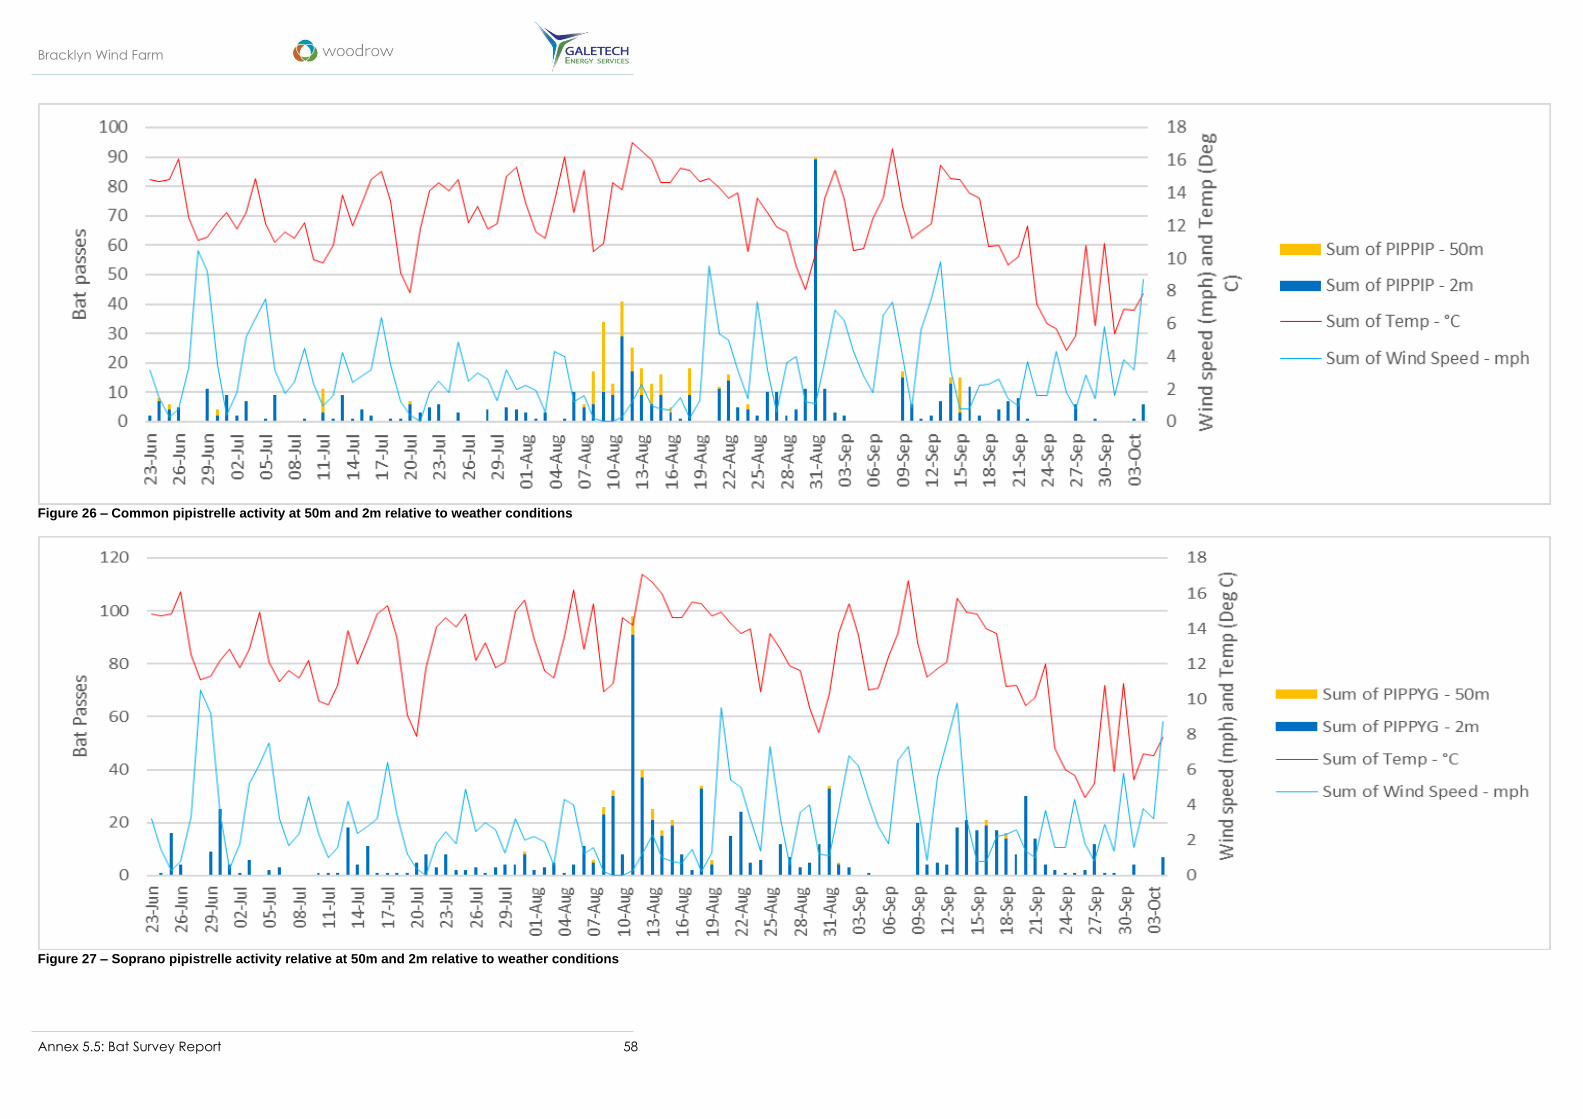
Bracklyn Wind Farm
Annex 5.5: Bat Survey Report 58
Figure 26 – Common pipistrelle activity at 50m and 2m relative to weather conditions
Figure 27 – Soprano pipistrelle activity relative at 50m and 2m relative to weather conditions

Bracklyn Wind Farm
Annex 5.5: Bat Survey Report 59
4 BASELINE CONDITIONS
The bat surveys at the proposed site for Bracklyn Wind Farm, undertaken as site investigations for
potential roost features (PRFs), surveys at potential roosts, walked transects and the use of static bat
detectors between May and September, provide robust information to facilitate an understanding of
bat how populations utilise the study area. This section summarises the main findings of bat surveys
conducted in 2020.
4.1 Habitat availability and roost suitability
The habitat within the Wind Farm Site consists of a mosaic of open fields, conifer plantation, semi-
mature to mature broadleaf treelines, and bog woodland. Bat usage of the Wind Farm Site is
generally associated with habitat features such as shrub, plantations, old growth woodlands, treelines
and hedgerows, which is to be expected given that these are areas where greater foraging
opportunities for bats would be predicted.
The proposed locations for T1, T2 and T3 are situated in open fields, whereas, T5, T6, T7, T10, and
T11 are situated within conifer plantation while the proposed location for T4 is within young ash
plantation. The commercial plantations containing the proposed turbine locations of T4 and T5 are
themselves in proximity to broadleaf woodland with broadleaf treelines passing through parts of the
commercial broadleaf and conifer plantations respectively. This creates linear features through the
conifer plantations along which bats can commute and forage. Linear features such as forestry rides,
in which D.06 and D.07 where deployed, provide what is likely to be sheltered areas where bats can
glean flying invertebrate prey and capitalise on high insect biomass and levels of activity. The
proposed locations for T10 and T11 are in proximity to bog woodland. In the absence of conifer
plantation, the interface between open area and this bog woodland would likely be an area of
significant bat activity.
There were few potential roost features (PRFs) identified as moderate to high PRF during preliminary
habitat suitability assessments and only one with moderate PRF within the potential ZoI of T5 (see
Table 3). Emergence times recorded during static deployments at D.04, D.05, D.06, D.07 suggest
potential for roosts to exist in the wider area.
One of the few roost features classed as moderate was a group of three mature beech c. 150m
southwest of the proposed location for T5. In addition, a standing dead scots pine outside the 300m
ZoI for T7 was classed as moderate (see Figure 5).
Two roosts features were assessed to have high suitability, the crypt and a mature beech tree.
However, emergence and re-entry surveys did not suggest the presence of roosts at these locations.
The derelict cottage, adjacent to the proposed site entrance to the northwest of the Wind Farm Site,
was assessed as being of moderate-high roost potential, though emergence and re-entry surveys
only recorded a single soprano pipistrelle flying over the roof of the building.

Bracklyn Wind Farm
Annex 5.5: Bat Survey Report 60
4.2 Summary of static deployment data
Taking an overview of the static deployment results a number of patterns can be discerned, notably:
• Total bat passes per hour for the majority of static deployments in 2020 were classed as ‘High’ or
‘Medium’ using the classification system devised by Kepel et al. (2011) – see Table 12. Activity
levels were classed as ‘Low’ for units deployed at D.03 and D.08 during the spring deployment,
D.05, D.11 and D.08 during the summer deployment and D.01 and D.09 during the autumn
deployment. All other static detectors recorded ‘High’ or ‘Medium’ levels of total aggregated bat
passes as follows:
Spring deployment
- D.02, D.04, D.05, D.06, D.10, D.11 and D.09 recorded ‘High’ activity for total bat passes per
hour.
Summer deployment
- D.01, D.03 and D.09 recorded ‘Medium’ activity for total bat passes per hour
- D.02, D.04, D.06, D.07 and D.10 recorded ‘High’ activity for total bat passes for all species
Autumn deployment
- D.03 recorded ‘Medium’ activity total bat passes per hour.
- D.02, D.04, D.05, D.06, D.07, D.08, D.10 and D.11 recorded ‘High’ activity for total bat
passes per hour.
• As summarised in Table 9 an analysis of median percentile activity levels as classed by SNH et
al. (2019) on a site wide basis across all three deployments found median activity levels for each
species as follows:
- High for common pipistrelles
- Moderate/High for soprano pipistrelles
- Moderate for Leisler’s bats
- Moderate/Low for Myotis species, Nathusius’ pipistrelle, and brown long-eared bats
- No species recorded was found to have Low median activity levels
• There was a decrease in recorded activity during the summer deployment for all bat species, with
bat passes dropping by 38% from spring to summer and rising by 48% from summer to autumn.
• The highest levels of bat activity were noted at D.06 situated in an open plantation ride during the
autumn deployment.
• While overall median activity for the majority of bat species was ‘Moderate’ or ‘Moderate/Low’,
the maximum percentile values in Table 10 and Table 11 show that with the exception of
Nathusius’ pipistrelles all species exhibited nights of high median activity levels. Nathusius’
pipistrelles on their 2 nights of highest activity on this site reached activity level classed as
‘Moderate/High’.
• Bat activity was recorded within the survey area for a variety of species with common pipistrelle,
soprano pipistrelle, Leisler’s bat and to a lesser extent brown long-eared bat, Nathusius’
pipistrelle and Myotis species being represented in the results.
• The majority of bat activity within the Wind Farm Site was produced by common and soprano
pipistrelles and associated with edge of forestry plantations, treelines and shrub.
• D.02, D.03, D.04, D.05, D.06, D.07, D.10 and D.11 are all placed in proximity to linear features
such as treelines (Figure 4). An important comparison is to be made between D.08 and D.11
which were only approximately 98 metres apart but experienced wide differences in terms of
activity levels. The overall low activity at D.08 (98m from feature) and the generally high activity
at D.11 (placed at the linear feature) illustrates the potential reduction in bat activity that can be
achieved with an adequate turbine buffer and limiting collision risk.
• A summary of monthly activity levels according to Kepel et al. (2011) given in Table 13.

Bracklyn Wind Farm
Annex 5.5: Bat Survey Report 61
Table 13 – Summary of bat passes per hour entire survey seasons (green – Low, gold – Medium, brown – High)
4.3 Species activity within the Wind Farm Site
During the 2020 season, bat activity was recorded within the survey area for a minimum of six
species, including common pipistrelle, soprano pipistrelle, Leisler’s bat, Myotis species, brown long-
eared bat and Nathusius' pipistrelle. The majority of bat activity was attributed to soprano pipistrelle,
common pipistrelle and Leisler’s bat. Soprano and common pipistrelles were recorded in all months
during transect and static surveys and were the most commonly encountered species for static
surveys during all of the seasonal deployments.
4.3.1 Pipistrelle species
Common and soprano pipistrelles were recorded throughout the survey area and in all deployments in
2020. For these two dominant pipistrelle species the highest levels of activity were detected at D.04
during the spring deployment, D.06 during the summer deployment and D.07 during the autumn
deployment. The results of the static and transect data show that both common and soprano
pipistrelles were strongly associated with the edge of forestry plantations, treelines and shrub.
The occurrence of common pipistrelle bats was higher than that of soprano pipistrelles in both the
spring and summer deployments. Over the autumn there was greater parity between activity levels for
common and soprano pipistrelles. The only detector location to record consistently ‘Low’ activity
levels across all deployments were D.01 and D.03. The ‘Low’ activity at D.01 was considered a result
of the deployments locations in an open field. The ‘Low’ activity recorded at D.03, located at the end
of a linear feature, was likely to be the result of poor connectivity to habitats associated with bats
(Figure 4). In contrast the treeline on which D.04 was located is a linear feature that exhibits strong
connectivity to the surrounding habitats and showed consistent ‘High’ levels of pipistrelle activity.
On a site wide basis across all the seasonal deployments, common pipistrelle median percentile
activity levels were classified as ‘High’ (83), while soprano pipistrelle median percentile activity levels
were classified as ‘Moderate/High’ (70) (see Table 9). However, examination of specific pipistrelle
‘hotspots’ within the Wind Farm Site found that many detector locations, including: D.02, D.04, D.06,
D.07, D.09 and D.10 experienced activity in the 90 percentile or higher. It is also worth noting that in
autumn, the maximum median percentile recorded in relation to a single night of activity recorded for
soprano pipistrelles at D.04 and D.07 was 100. Full data is provided in Table 11.
According to Lundy et al. (2010) Nathusius’ pipistrelles are potentially experiencing increased
availability of suitable habitats and therefore the species’ range throughout Europe may be
expanding. The range of Nathusius’ pipistrelles is influenced by their positive association to high
average minimum temperatures, urbanisation, waterbodies, the absence of peat/heathland and
woodland, in this order of importance.
Deployment Leisler's bat Soprano pipistrelle
Common pipistrelle
Nathusius' pipistrelle
Pipistrelle species
Myotis species
Brown long-eared bat
Total
Spring May/Jun 2020 (n = 1534 hrs)
4144 2.7 bp/h
3727 2.73 bp/h
25091 16.35 bp/h
125 0.08 bp/h
0 0.00 bp/h
646 0.42 bp/h
106 0.07 bp/h
33850 22.06 bp/h
Summer Jun/Jul 2020
(n = 1413 hrs)
1066 0.75 bp/h
5492 3.89 bp/h
13058 9.24 bp/h
0 0.00 bp/h
961 0.68 bp/h
298 0.21 bp/h
153 0.11 bp/h
21030 14.88 bp/h
Autumn Aug/Sep 2020 (n = 1443 hrs)
1075 0.75 bp/h
20059 13.91 bp/h
21587 14.96 bp/h
2 0.00 bp/h
1 0.00 bp/h
410 0.28 bp/h
95 0.07 bp/h
43229 29.97 bp/h
Total (n = 4390 hrs)
6286 1.43 bp/h
29278 6.67 bp/h
59736 13.6 bp/h
127 0.03 bp/h
962 0.21 bp/h
1354 0.31 bp/h
354 0.08 bp/h
98109 22.34 bp/h

Bracklyn Wind Farm
Annex 5.5: Bat Survey Report 62
Nathusius’ pipistrelle bat activity recorded during static detector surveys was ‘Low’, with only 125
passes recorded throughout the three seasonal deployments, all of which were recorded during the
spring deployment, with the exception of 2 passes recorded in autumn (Table 9). There were spikes
in activity during the spring deployment with two nights of ‘Moderate/High’ activity (Table 10). The
highest levels of activity occurred at D.04, D.05 and D.09. These detectors were all aligned along a
strongly connected habitat features containing natural woodland and a bog lake (Figure 4). The
absence of this species over the summer deployment and near absence in the autumn deployments
is likely to be the result of the migratory pattern exhibited by Nathusius’ pipistrelles, which involves
migration to Western Europe in autumn and winter and migration to Eastern Europe in late spring
(Russ 200113).
The continuously recording static detector, with a microphone deployed at height on the temporary
met mast, recorded 1,376 pipistrelle passes at 2m) compared to 164 at 50m. A higher number of
common pipistrelles than soprano pipistrelles were recorded at 2m and at 50m height (common
pipistrelle passes at 50m comprised 19.5% of the recorded passes at that location for the species,
while soprano pipistrelle passes at 50m comprised 3.9% of the recorded passes at that location for
the species. This implies that common pipistrelles are more likely to fly at rotor height. The
relationship of the activity at 50m to weather conditions, turbine rotor operation, and potential collision,
has been explored in Section 3.5.3 and Section 3.5.4.
4.3.2 Leisler’s bat
The third most commonly recorded species, after common and soprano pipistrelles, during all
seasonal deployments was Leisler’s bat. Registrations of Leisler’s bats were higher during the spring
deployment (28.48bp/h across all detectors). Unlike pipistrelles, Leisler’s bat activity was not
influenced as heavily by the presence of linear features, being recorded at ‘Low’, but consistent rates
across all detectors with the exceptions of ‘Medium’ and ‘High’ activity at D.05 and D.09 in spring and
‘Medium’ activity at D.09 during summer. Units deployed at D.09 located within the bog woodland
leading to the lake recorded the highest levels of Leisler’s activity during the spring and summer
deployments, but was surpassed by D.08 during the autumn deployment. The ‘High’ activity at D.09
during the spring and summer relative to autumn is likely to be a result of increased insect activity at
the bog lake habitat making it an attractive foraging habitat.
‘High’ median activity levels were documented once for Leisler’s bats, at D.09 during the spring.
‘Moderate/High’ levels of Leisler’s bat activity were recorded at D.04, D.05, and D.10 during the
spring, at D.09 during summer and at D.04 during autumn. Levels of Leisler’s bat activity during
transects was relatively low.
The continuously recording static detector with a microphone deployed at height recorded similar
levels of Leisler’s flying at height (50m) and at 2m (1,074 and 904 passes respectively). This
highlights the higher level of potential collision risk for this species. The relationship of the activity at
50m to weather conditions, turbine rotor operation, and potential collision, has been explored in
Section 3.5.2.
4.3.3 Myotis species
Bat passes per hour (bp/h) recorded for Myotis species during static detector surveys was classified
as ‘Low’ at all deployment locations and across all deployment seasons. Summer and autumn Myotis
species activity levels were a similar (< 2.5 bp/h for all statics). Myotis species activity across all
detectors was at its highest level during the spring deployment (4.48 bp/h). There was a total of 739
bat passes recorded during all static detector surveys and no passes recorded during transect
surveys. Although the bp/h activity levels were classed as low throughout the survey period for
13 Russ, J.M., Hutson, A.M., Montgomery, W.I., Racey, P.A. and Speakman, J.R., (2001.) The status of Nathusius' pipistrelle
(Pipistrellus nathusii Keyserling & Blasius, 1839) in the British Isles. Journal of Zoology, 254(1), pp.91-100.

Bracklyn Wind Farm
Annex 5.5: Bat Survey Report 63
Myotis species activity levels were slightly higher at D.04 and D.05 during the spring; and at D.07
during the summer; and at D.04, D.07 and D.10 during the autumn.
In terms of median activity levels, D.07 recorded a median activity level of ‘Moderate/High’ for Myotis
species during the summer. This slightly higher activity level documented on more than one occasion
is likely to be due to the proximity to a drainage ditch to the north which would provide good foraging
habitat for Myotis species
During the 2020 bat survey season, Myotis species were recorded throughout the Wind Farm Site in
small numbers at all the turbine locations.
4.3.4 Brown long-eared bat
It is acknowledged that accurately monitoring brown long-eared activity can prove quite difficult as this
species is known to make low amplitude calls and frequently forage using their eyes or ears rather
than echolocation (Collins 201614; Russ 2012). As a result, brown long-eared bats are frequently
underrepresented in surveys which rely on the use of bat detectors.
Activity levels recorded for brown long-eared bat were the second lowest for all the bat species
occurring within the Wind Farm Site (after Nathusius’ pipistrelle), with no bat passes recorded during
transect surveys and only a total of 184 bat passes recorded over the three 2020 seasonal
deployments.
However, it is important to note these findings suggest that they can occasionally be active at a height
of 50m as detected by the static unit deploying a microphone at height (Figure 23). Though brown
long-eared bat activity was detected at height, it was at very low levels with only three calls being
recorded, two of these calls occurred within a one-minute window and are therefore likely to have
originated from the same individual bat. The third call occurred at a separate time and date. While
the recording of three call registrations constitutes a very low level of activity, it is important to
highlight this behaviour, as it demonstrates brown long-eared bats behaving contrary to the species’
documented foraging and commuting patterns. It is unlikely that this level of activity within the collision
risk zone would heighten the level of collision risk for this species.
Levels of brown long-eared bat activity remained ‘Low’, but consistent across all detectors on all
seasonal deployments, with a slight decrease in activity during the autumn deployment. D.05 detected
the highest levels of activity in spring (0.46 bp/h). D.04, which was deployed in similar surroundings
and in relatively close proximity to D.05, recorded the highest levels of activity in summer (0.48 bp/h).
In autumn the highest level of brown long-eared bat activity was recorded at D.02 (0.24 bp/h).
On a site-wide basis, brown long-eared bat median activity was assessed to be ‘Moderate/Low’.
However, the slightly higher level of activity at D.04 was classified as ‘Moderate/High’ upon analysis
of the median activity percentiles. D.04 is positioned on a treeline with high connectivity to broadleaf
woodland to the south and southwest; and is likely to provide high commuting and foraging value to
brown long-eared bats.
14 Collins, J. (ed.) (2016) Bat Surveys for Professional Ecologists: Good Practice Guidelines (3rd edn). The Bat Conservation
Trust, London. ISBN-13 978-1-872745-96-1
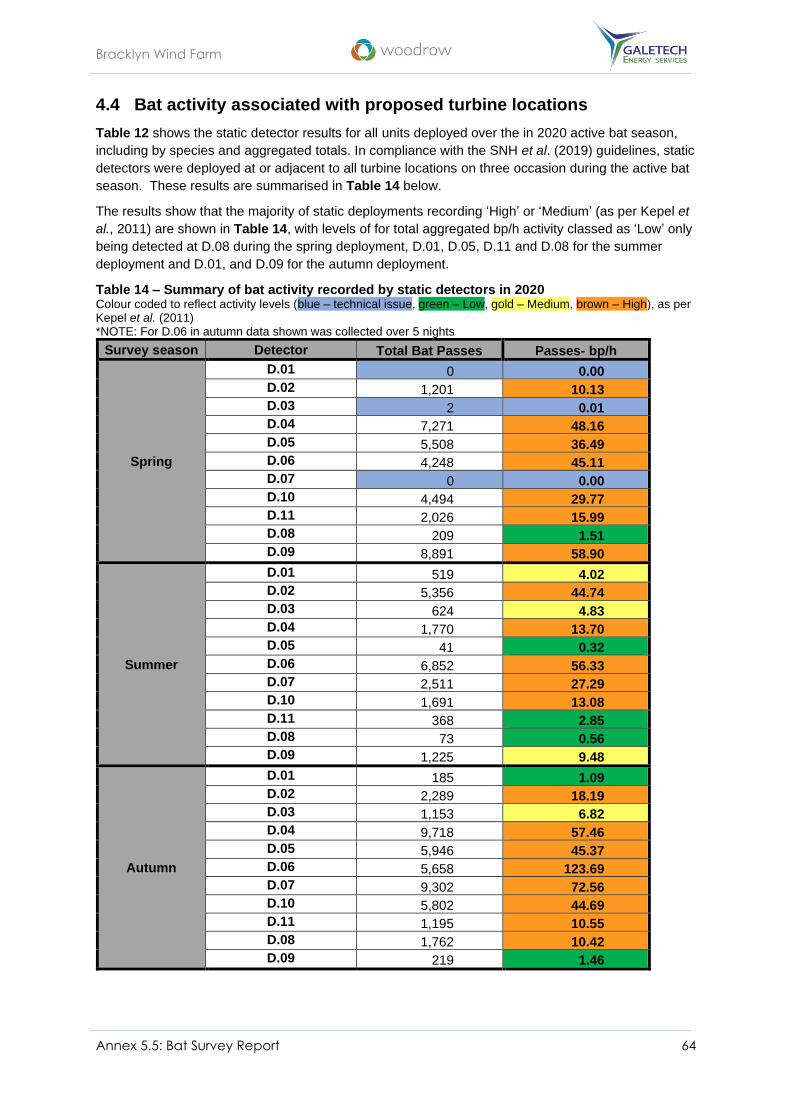
Bracklyn Wind Farm
Annex 5.5: Bat Survey Report 64
4.4 Bat activity associated with proposed turbine locations
Table 12 shows the static detector results for all units deployed over the in 2020 active bat season,
including by species and aggregated totals. In compliance with the SNH et al. (2019) guidelines, static
detectors were deployed at or adjacent to all turbine locations on three occasion during the active bat
season. These results are summarised in Table 14 below.
The results show that the majority of static deployments recording ‘High’ or ‘Medium’ (as per Kepel et
al., 2011) are shown in Table 14, with levels of for total aggregated bp/h activity classed as ‘Low’ only
being detected at D.08 during the spring deployment, D.01, D.05, D.11 and D.08 for the summer
deployment and D.01, and D.09 for the autumn deployment.
Table 14 – Summary of bat activity recorded by static detectors in 2020 Colour coded to reflect activity levels (blue – technical issue, green – Low, gold – Medium, brown – High), as per Kepel et al. (2011) *NOTE: For D.06 in autumn data shown was collected over 5 nights
Survey season Detector Total Bat Passes Passes- bp/h
Spring
D.01 0 0.00
D.02 1,201 10.13
D.03 2 0.01
D.04 7,271 48.16
D.05 5,508 36.49
D.06 4,248 45.11
D.07 0 0.00
D.10 4,494 29.77
D.11 2,026 15.99
D.08 209 1.51
D.09 8,891 58.90
Summer
D.01 519 4.02
D.02 5,356 44.74
D.03 624 4.83
D.04 1,770 13.70
D.05 41 0.32
D.06 6,852 56.33
D.07 2,511 27.29
D.10 1,691 13.08
D.11 368 2.85
D.08 73 0.56
D.09 1,225 9.48
Autumn
D.01 185 1.09
D.02 2,289 18.19
D.03 1,153 6.82
D.04 9,718 57.46
D.05 5,946 45.37
D.06 5,658 123.69
D.07 9,302 72.56
D.10 5,802 44.69
D.11 1,195 10.55
D.08 1,762 10.42
D.09 219 1.46

Bracklyn Wind Farm
Annex 5.5: Bat Survey Report 65
4.4.1 Bat activity at T1
The main factor determining bat activity recorded within the Wind Farm Site is considered to be
strongly correlated with proximity of deployment locations to habitat features. The unit deployed to
cover T1 was placed in an open arable crop field at the map ID D.01, approximately 190 m from the
nearest habitat feature. This detector provides a good frame of reference for the levels of activity to be
expected in the absence of features and plantation woodland. The detector at D.01 recorded
‘Medium’ aggregated bat activity in summer and ‘Low’ activity in autumn (Table 12). Although the
spring deployment covering T1 failed, the context detector D.08 was in a very similar habitat setting,
being located in an open field of improved grassland c. 98 m from the nearest habitat feature. D.08
recorded ‘Low’ activity levels for spring and summer; but recorded much higher activity levels in
autumn. Based on similar open habitat characteristics, it is considered that spring bat activity at T1
would be line with the low levels of activity recorded at D.08.
It has been documented that soprano pipistrelles, Leisler’s bat and Nathusius’ pipistrelle are not as
active around linear features from July to October as they are from April to June, which is likely to be
as a result of migration and changing seasonal food sources (Kelm et al. 201415). However, Kelm et
al. (2014) did not document this behaviour in common pipistrelles. An autumn increase in activity was
not detected at D.01 (as was seen at D.08 and D.12 at ground level) and is considered to be linked to
the more open landscape surrounding D.01 and therefore likely to offer poorer foraging opportunities
for bats.
D.01 recorded a bat activity classed as ‘Medium’ (Kepel et al., 2011) during the summer. This trend
was driven by common pipistrelle activity with their median activity percentile being the most active
species at this location, classed as ‘High/Moderate’ for the summer period. However, relative to the
other proposed turbine locations, this deployment location generated the third lowest total bp/h activity
for the summer deployment.
4.4.2 Bat activity at T2 and T3
Both detectors D.02 and D.03 were placed 120 m and 288 m respectively from proposed turbine
locations T2 and T3. They were both placed along linear features which were separating arable crop
fields, while the proposed detector locations were within the adjacent open fields. Though these
detectors were placed in similar habitats D.02 recorded ‘High’ levels of activity for all three
deployments, while D.03 recorded ‘Medium’ levels of activity for the two deployments on which it was
active, summer and autumn.
The difference in bat activity measured between these two detectors is likely a result of the different
levels of connectivity to other treelines and woodlands. The hedgerow on which D.03 was positioned
is quite isolated from any other habitat features (Figure 4). In contrast the bank/hedgerow/open
treeline on which D.02 was located was strongly connected to nearby woodlands; and in particular to
two treelines assessed to be of moderate/low roost potential, both of which were within 300m ZoI from
T2 (Figure 1 and Figure 5). The emergence and re-entry survey conducted along these treelines in
Aug-2002, recorded high levels of activity (Figure 7), and it is considered that bats potentially
commuting from roosts along the hedgerow/treeline on which D.02 was deployed may contribute to
activity at this location.
Given that the proposed turbine location for T2 and T3 are some distance away from the habitat
features on which D.02 and D.03 were positioned; ‘Medium’ and ‘High’ activity levels are considered
unlikely to be representative of the levels of bat activity that the more open location of the proposed
turbine would generate. The lower activity recorded by D.01 and D.08 are likely to provide a more
accurate representation of bat activity at T2 and T3, as they are in fields and are also an approximate
15 Kelm, D.H., Lenski, J., Kelm, V., Toelch, U. and Dziock, F., 2014. Seasonal bat activity in relation to distance to hedgerows
in an agricultural landscape in central Europe and implications for wind energy development. Acta Chiropterologica, 16(1),
pp.65-73

Bracklyn Wind Farm
Annex 5.5: Bat Survey Report 66
distance of 100-200m from the nearest habitat feature. Both of these detectors recorded much lower
activity. However, unlike D.01, D.08 experienced a surge in activity in autumn (classified as ‘High’)
which could be a result of being slightly closer to a linear feature than D.01.
4.4.3 Bat activity at T4
D.04 was positioned within 53m of the proposed location of T4. D.04 recorded ‘High’ activity levels for
all three deployments (Table 11, Table 12). Though the proposed turbine location is in an area of
young ash plantation, which was considered to offer limited foraging opportunities for bats, the
surrounding treelines are potentially of high value to commuting bats. This is supported by the
neighbouring static location (D.09) also recording ‘High’ levels of bp/h activity in spring and ‘Medium’
levels of bp/h activity in summer.
The habitat features of treelines and a bog pool which are in close proximity of D.09 provide good
foraging conditions for bats and this is reflected in the measured activity levels. The treelines
surrounding the proposed location of T4 provide connectivity of broadleaf woodland to the south and
west of its location, and to the bog pool and its surrounding woodland to its east. Though the mature
beech tree to the west of D.04’s location was assessed to have high roost potential, an emergence
and re-entry survey found it not to comprise a roost. However, an analysis of species-specific
emergence times does suggest that there may be potential common pipistrelle, soprano pipistrelle
and Leisler’s bat roosts in the wider area (see Figure 11).
4.4.4 Bat activity at T5
D.05 was located on a treeline separating a conifer plantation from a field of improved grassland. The
proposed location of T5 is 58m to the south of D.05 in the middle of the conifer plantation. The reason
D.05 recorded some of the highest levels of activity in spring and autumn is a result of this conifer
plantation being surrounded to the west, south and east by broadleaf woodland and also has two
broadleaf, scrubby treelines running through the area (refer to Table 3). Emergence times suggest
the proximity of a soprano roost in spring (see Figure 10) and a soprano and common pipistrelle roost
in autumn (see Figure 12).
Given that the conifer plantation, with the two broadleaf treelines within it, is a proposed area for
felling, the bat activity is not representative of the situation that will exist when the proposed turbines
are constructed. The best representative for bat activity in this area (post-felling) is likely to be D.08,
which experienced very ‘Low’ levels of bat activity in spring and summer, though this detector did
record a surge in ‘High’ activity for autumn (Table 12). However, D.08 is not a perfect analogue as the
proposed felling area of conifer plantation, in some cases, does not create a uniform buffer from the
turbine in all directions as large as 98m (D.08’s distance from a linear feature). Using D.08 as an
analogue also informs that activity levels will likely remain high in autumn regardless of the open area
created through felling.
4.4.5 Bat activity at T6 and T7
D.06 was the location which recorded the highest levels of bat activity for summer and autumn (even
though it only recorded for half the duration of the autumn deployment). It was the location of the third
highest bat activity during spring. A possible reason this location showed such high levels of activity is
that the linear gap in conifer plantation created by the forestry ride. The evidence from this survey
suggests this habitat provided a highly valuable foraging area for bats, particularly common and
soprano pipistrelles. Though outside 300m ZoI the treeline to the southwest of the proposed turbine
location for T6 could have been a potential driver in the high activity levels recorded by D.06. Though
roost surveys found that there were potential roosts within 300m of the proposed location of T6, the
species-specific emergence times recorded by D.06 suggest that there may be potential Leisler’s bat
roost(s) in the wider area (see Figure 10 and Figure 11). The call emergence times of common and
soprano pipistrelles also suggest a potential roost in the wider area (see Figure 10, Figure 11,
Figure 12). Evidence from the transect surveys suggest a there is a likely active roost within the ‘T’

Bracklyn Wind Farm
Annex 5.5: Bat Survey Report 67
shaped treeline some 290m to the southwest of D.06 (and 355m southwest of the proposed T6
location), in particular during the autumn transect survey (see Figure 7 and Figure 9). It is likely that
emergence from a roost in this area to forage in the forestry ride near D.06 is producing the trend of
early emergence times and activity at D.06.
D.07 was located in a very similar location to D.06 and also recorded very high levels of activity.
However, the emergence times recorded for D.07 do not suggest many species roosting nearby, with
the exception of a potential soprano pipistrelle roost being nearby during the autumn deployment (see
Figure 12)
It is worth noting that the Ecobat median activity percentiles for common pipistrelle and soprano
pipistrelle in autumn at D.06 were 98 and 99 respectively (Table 11). This places the activity levels
seen at this location in the top 2% and top 1% activity levels for each of these species documented
within 200km of their respective locations and during similar times of the year on Ecobats database.
For D.07 in autumn the median activity percentiles recorded for common and soprano pipistrelles
were 93 and 98 respectively. However, as mentioned in Section 1.5.4 these figures represent
potentially inflated numbers as a result of thorough species identification in noise files and external
influences of the Ecobat analysis software.
Both of these static detectors are located in forestry rides within conifer plantations, which are areas
of proposed felling and as such does not represent the habitat that will be in place once the turbine at
T6 has been erected, due to the need for key-holing. It is likely that the closest analogue to D.06 and
D.07 in terms of distance to a linear feature will be D.08, which recorded very ‘Low’ bat activity during
spring and summer and ‘High’ activity in autumn. However, D.08 is not a perfect analogue as the
proposed felling area of conifer plantation in some cases does not create a uniform buffer from the
turbine in all directions as large as 98m (D.08’s distance from a linear feature). Using D.08 as an
analogue also informs that activity levels will likely remain high in autumn regardless of the open area
created through felling.
4.4.6 Bat activity at T10
The detector location for D.10 was 127m to the northeast from the proposed location for T10. It was
also placed in an area of conifer plantation which was in the process of being felled over the duration
of this survey period. Though all deployments recorded ‘High’ bp/h levels there is an increase from
spring to summer and a further increase from summer to autumn. The woodland adjacent to this
clearing was classed as a bog woodland. The broadleaf treeline created through the felling of this
conifer plantation provided a linear feature of high potential for foraging bats. This was reflected in the
‘High’ activity levels seen for total bat species bp/h (Table 12). The presence of a nearby stream to
the north of D.10 also contributed to the ‘High’ activity levels acting as a strong commuting and
foraging feature.
During spring activity for Leisler’s bat in this location was classed to be in a ‘Moderate/High’ percentile
standing out from the site-wide evaluation that Leisler’s bat activity was classed as ‘Moderate’.
Common pipistrelle and soprano pipistrelle activity were classed as high in autumn with their activity
being in the 95 and 92 percentiles respectively (Table 11). The ongoing felling was a likely driver in
the increased activity levels seen in autumn, as the removal of conifer woodland created strong linear
features for foraging bats along the periphery of the surrounding bog woodland.
4.4.7 Bat activity at T11
Bat activity in terms of bp/h was classed as ‘High’ in spring and autumn and ‘Low’ in summer for D.11
(Table 12). Common pipistrelles were recorded to have activity in a ‘Moderate/High’ percentile level
for spring and summer and a ‘High’ percentile level in autumn. This trend is not unique to this location
and marks an overall seasonal trend in bat activity. Though only 98m to the west of D.11, D.08
recorded much lower activity than D.11 in spring and summer and almost the same levels of activity in

Bracklyn Wind Farm
Annex 5.5: Bat Survey Report 68
autumn. The ‘High’ activity in autumn at D.08 is potentially driven by the documented lower reliance of
some bat species on linear features in the July – October period (Kelm et al. 2014).
Given that the conifer plantation along which D.11 was placed is an area of proposed felling the
recorded activity does not represent the situation that will exist post-felling. Activity levels recorded at
D.08 provide some context for what to expect in this situation. However, as was the case with T6 and
T7, D.08 is not a perfect analogue for bat activity levels post-felling, as current proposed felling plans
are not forming a uniform buffer of similar distance to that of D.08 to a linear feature. Using D.08 as
an analogue for post felling conditions also highlights that activity levels will likely remain high in
autumn regardless of the open area created through felling.
4.5 Association of bat activity with features
The results of both transect and static surveys conducted in 2020 and 2021 clearly show the strong
association between bat passes and habitat features (Figure 13; Figure 16; Figure 19). For the 2020
static surveys, single units were deployed to monitor bat activity at turbine locations. Units deployed
along forestry edges (such as D.04), which were strong habitat features within the site, recorded
significantly higher levels of bat activity whereas the other units were deployed to cover turbines in
relatively open habitats, (such as D.01) recorded significantly lower levels of bat activity. For the most
part, the majority of statice locations which saw consistent ‘Moderate/High’ and ‘High’ activity levels
were those mentioned in Section 1.5.1 as being either along linear features such as treelines or
along edge features such as the interface of conifer to native woodland and conifer plantation to open
field (Table 11).
The emergence and transect surveys conducted on 10-May-2021, while not recording the presence of
any roosts recorded the use of broadleaf treelines for commuting bats, as detailed in Section 3.2.1.
Possibly the best example of the preferences shown by bats for habitat features versus open habitat;
as paired units, D.08 and D.11 were deployed at T11, with one covering a feature and the other
covering the adjacent open area. D.08 was 98m from the feature while D.11 was placed on the
feature. With the exception of autumn there is a clear difference in activity levels between these two
detectors (Table 12). The context detector D.09 also clarifies the relationship between linear features,
seasonality and bat activity. D.09 saw the highest level of common pipistrelle activity and the highest
overall activity in spring (Table 12) likely as a result of its position along a commuting path to the high-
quality foraging area of the bog pool. It also saw a sharp decrease in activity from spring to summer to
autumn.
Given the contrasting patterns seen at D.08 and D.09, bats, particularly pipistrelles, become less
reliant on linear features and will forage in the open. However, the increase in pipistrelle activity in
open habitats in autumn is not uniform across the site. While activity at D.08 increased it decreased at
D.01 and the D.12 ground level detector (Figure 28). The difference in activity levels based on
proximity to linear features is of particular importance given that the majority of detectors on this site
were placed along features.

Bracklyn Wind Farm
Annex 5.5: Bat Survey Report 69
While the data presented shows high levels of activity, it is important to note that the baseline data for
bat activity on the site is heavily influenced by linear features at which activity was recorded. The
baselines at the three detectors which were not placed along linear features provide an insight into
the activity levels which are likely to be emulated following felling around the turbines, and potential
removal of linear features and replacement of them outside the turbine risk zone.
Figure 28 - Pipistrelle spp. activity levels at the three detectors not positioned on linear features
0
0.5
1
1.5
2
2.5
3
3.5
4
4.5
5
D.08 D.01 D.08 D.12 D.01 D.08 D.12
Spring Summer Autumn
Bat
pas
ses
per
ho
ur
(bp
/h)
Season & Location
Pipistrellus Pipistrellus pipistrellus Pipistrellus pygmaeus

Bracklyn Wind Farm
Annex 5.5: Bat Survey Report 70
5 ASSESSMENT OF POTENTIAL IMPACTS
5.1 Ecological evaluation of bat species
Bats are protected by law in the Republic of Ireland under the Wildlife Act 1976 and subsequent
amendments (2000 and 2010). Under the Wildlife Act, it is an offence to intentionally disturb, injure or
kill a bat or disturb its resting place. Under this legislation it is unlawful to destroy, alter or disturb
known bat roosts without an appropriate derogation licence, as issued by the National Parks and
Wildlife Service (NPWS).
All bat species fall under Annex IV of the EU Habitats Directive (1992), whereby member states have
a burden of responsibility to protect bats and their resting places wherever they occur. The EU
Habitats Directive has been transposed into Irish law with the European Communities (Birds and
Natural Habitats) Regulations 2011. In order to comply with the requirements of these regulations
wind farm applications in Ireland need to be assessed as to their potential impact on bat populations.
In order to undertake an assessment of the potential impact of the proposal on bats, it is important to
take into account not only what bat species and numbers are present on the site, but also how
susceptible those species are to impacts from wind turbines and how susceptible populations of the
species occurring are to the impacts in an Irish context.
SNH et al. (2019) provides guidelines for conducting risk assessment for bat species occurring on
wind farms; however, it is not fully clear how the assessment methodology relates to Irish bat
populations. Therefore, the assessment of the Bracklyn Wind Farm Site draws on several sources to
emulate the SNH guidance, including Marnell et al. (2009)16 and Wray et al. (2010)17 for the bat
population assessments in Ireland (see Table 15). For collision risk of bat species to wind turbines,
(see Table 16) SNH et al. (2019) is used, which updates previous species risk assessment published
in Natural England (NE, 2014)18.
As listed in Table 15, on an all-Ireland basis, Leisler’s bats are considered to be Near Threatened,
while all other species are categorised as Least Concern (Marnell et al., 2009).
As shown in Table 16, Leisler’s bats and Nathusius’ pipistrelles are considered as high risk of direct
impacts from with wind turbines, as they regularly fly in the open and at heights, which may put them
at risk of collision or barotrauma from turbines. The SNH et al. (2019) guidelines consider both
common and soprano pipistrelles to be at high risk of direct impacts from wind turbines; based on a
study investigating bat collisions at Wind Farm Sites across the UK (Mathews et al, 2016), which
found both these species to be amongst the most commonly recorded casualties during searches of
turbines. The SNH et al. (2019) guidelines update Natural England guidance, which had classified
common and soprano pipistrelle as medium risk species (NE, 2014), based on flight behaviours of
common and soprano pipistrelles that habitually fly low and close to landscape features, such as
hedgerows. Myotis species and brown long-eared bats are considered as low risk based on behaviour
and foraging techniques of these species.
Based on population status in Ireland and risk level in relation to adverse interactions with turbines, it
is important to ascertain, which bat populations may be threatened due to impacts from wind turbines,
and this assessment is shown in Table 17. On the basis of this information, it is clear that particular
attention should be paid to Leisler’s bats and Nathusius’ pipistrelles, which are believed to be
16 Marnell, F., Kingston, N. & Looney, D. (2009). Ireland Red List No. 3: Terrestrial Mammals, National Parks and Wildlife
Service, Department of the Environment, Heritage and Local Government, Dublin, Ireland.
17 Wray, S., Wells, D., Long, E. & Mitchell-Jones, T. (2010) Framework for valuing bats in Ecological Impact Assessment,
CIEEM journal. Edition 70. Pg. 23 – 25. December 2010.
18 Natural England (2014). Bats and onshore wind turbines: Interim Guidance 3rd Ed. Natural England Technical Information
Note TIN051, Natural England, Peterborough.

Bracklyn Wind Farm
Annex 5.5: Bat Survey Report 71
susceptible to impacts from wind turbines and have populations of high population vulnerability, in the
context of wind turbine developments in Ireland. Leisler’s bats are generally considered to forage
habitually at height in more open landscapes and are less associated with habitat features than other
bat species. Nathusius’ pipistrelles are known to be migratory and may fly at height during migration.
For this assessment we adhere to SNH et al. (2019) guidance, under which common and soprano
pipistrelles are considered to have medium population vulnerability to wind farm developments in
Ireland due to behaviour in relation to turbines. Whiskered bats are also classed as moderately
vulnerable, due scarcity in Ireland. Brown long-eared bats and the two other Irish Myotis species
(Daubenton's bat and Natterer's bat) are considered to have low vulnerability to wind farm
developments in Ireland.
Table 15 – Conservation status of bat species in Ireland (Marnell et al. 2009)
Species
Rarity in Ireland Wray et al. (2010)
Irish status (Marnell et al., 2009)
Daubenton’s bat
Myotis daubentonii
Rarer
(Frequent/widespread) Least concern
Whiskered bat
Myotis mystacinus
Rarest
(Scarce/widespread) Least concern
Natterer’s bat
Myotis nattereri
Rarer
(Scarce/widespread) Least concern
Leisler’s bat
Nyctalus leisleri
Rarer
(Frequent/widespread) Near threatened
Common pipistrelle
Pipistrellus pipistrellus
Common
(Widespread) Least concern
Soprano pipistrelle
Pipistrellus pygmaeus
Common
(Widespread) Least concern
Nathusius’pipistrelle
Pipistrellus nathusii
Rarer
(Rare/restricted) Least concern
Brown long-eared bat
Plecotus auritus
Rarer
(Frequent/widespread) Least concern
Table 16 – Level of collision risk to individual bats from wind turbines Sources: Adapted from Natural England (2014) & SNH et al. (2019)
Collision risk
Low risk Medium risk High risk
Myotis species Brown long-eared bat
Common pipistrelle (NE, 2014) Soprano pipistrelle (NE, 2014)
Leisler’s bat Nathusius’ pipistrelle Common pipistrelle (SNH, 2019) Soprano pipistrelle (SNH, 2019)
Table 17 – Level of potential vulnerability of bat populations in Ireland Sources: Adapted from Wray et al. (2010), Natural England (2014) & SNH et al. (2019) Population vulnerability: Yellow = low Beige = medium Red = high
Ireland Collision risk
Low risk Medium risk High risk
Rela
tiv
e a
bu
nd
an
ce
Common species
Common pipistrelle Soprano pipistrelle
(NE, 2014)
Common pipistrelle Soprano pipistrelle
(SNH et al., 2019)
Rarer species Daubenton's bat Natterer's bat Brown long-eared bat
Leisler’s bat Nathusius’ pipistrelle
Rarest species Whiskered bat

Bracklyn Wind Farm
Annex 5.5: Bat Survey Report 72
5.2 Valuing bat populations
The nature conservation value of a receptor is based upon a geographic hierarchy of importance.
The following categories are used to inform the assessment of impacts:
International: sites, habitats and species populations of international or European importance;
National: sites, habitats & species populations of national importance;
Regional: sites, habitats & species populations of importance in a regional (NW) context;
County: sites, habitats & species populations of importance in a county context;
Local: sites, habitats & species populations of importance in a parish or district context;
Low: sites, habitats & species populations of less than local importance, still of some value.
Approaches to attributing nature conservation value to species have been developed for bats (see
Wray et al. 2010). The approach to scoring foraging habitat and commuting features is summarised in
Table 18.
Using the criteria set out in Table 18 and based on the baseline data collected during surveys, it is
considered that the study area scored:
• 4 for roosts/ potential roosts nearby
• 5 for foraging habitat characteristics
• The following for number of bats
- 20 for number of bats for common pipistrelle and soprano pipistrelle
- 10 to 20 for number of bats for Leisler’s bat
- 10 for number of bats for Myotis species, Nathusius’ pipistrelle and brown long-eared bat
This equates to species specific scores of:
• 31 for common pipistrelles and soprano pipistrelles. This ranks the Wind Farm Site as holding
foraging populations of these species that are of Regional Importance.
• 24 to 34 for Leisler’s bat. This ranks the Wind Farm Site as holding foraging populations of this
species of County to Regional Importance
• 24 for Myotis species (Daubenton’s bat and Natterer’s bat), Nathusius’ pipistrelle and brown long-
eared bats. This ranks the Wind Farm Site as being of County Importance
• 39 for Myotis species (Whiskered bat if occurring*). This ranks the Wind Farm Site as being of
Regional Importance
*Note: Whiskered bats are considered to occur locally in small numbers across Ireland and it is
acknowledged that it is a species that can go undetected during surveys (McAney, 2006)19. There
were no records received from BCI within 10-km of the site and there are no records for Co.
Westmeath/Co. Meath published on NBDC Biodiversity Maps. The closest locations of Whiskered
bat occurrence are over 20 km from the proposed development. The species could potentially
occur on a site like Bracklyn Wind Farm; however, expected occurrence would be considered
unlikely, and as the risk of collision for Myotis species is considered low further consideration is
only given to this species within its Genus (i.e. as Myotis species).
With the exception of Nathusius’ pipistrelle (and whiskered bat if it occurred), the bat species
recorded utilising the Wind Farm Site are generally considered common and widespread in an
19 McAney, K. (2006) A conservation plan for Irish vesper bats. Irish Wildlife Manuals, No. 20. National Parks and Wildlife
Service, Department of Environment, Heritage and Local Government, Dublin, Ireland.
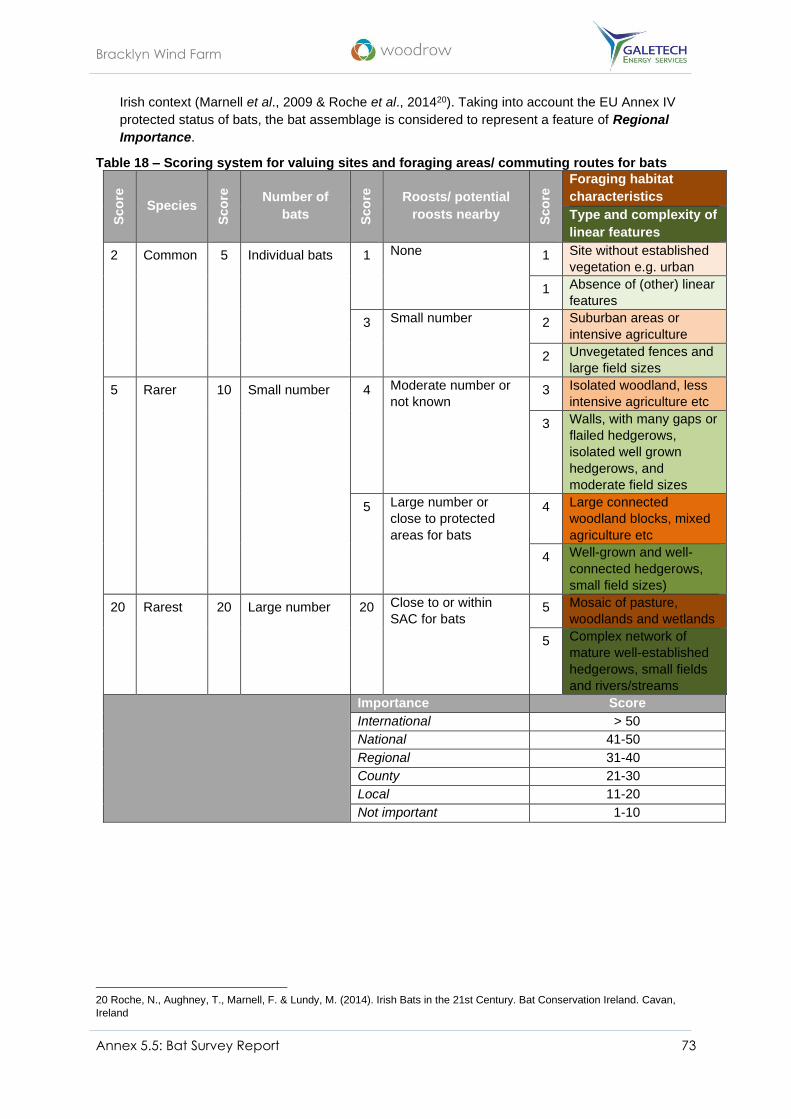
Bracklyn Wind Farm
Annex 5.5: Bat Survey Report 73
Irish context (Marnell et al., 2009 & Roche et al., 201420). Taking into account the EU Annex IV
protected status of bats, the bat assemblage is considered to represent a feature of Regional
Importance.
Table 18 – Scoring system for valuing sites and foraging areas/ commuting routes for bats
Sco
re
Species
Sco
re
Number of
bats
Sco
re
Roosts/ potential
roosts nearby
Sco
re Foraging habitat
characteristics
Type and complexity of
linear features
2 Common 5 Individual bats 1 None 1 Site without established
vegetation e.g. urban
1 Absence of (other) linear
features
3 Small number 2 Suburban areas or
intensive agriculture
2 Unvegetated fences and
large field sizes
5 Rarer 10 Small number 4 Moderate number or
not known 3 Isolated woodland, less
intensive agriculture etc
3 Walls, with many gaps or
flailed hedgerows,
isolated well grown
hedgerows, and
moderate field sizes
5 Large number or
close to protected
areas for bats
4 Large connected
woodland blocks, mixed
agriculture etc
4 Well-grown and well-
connected hedgerows,
small field sizes)
20 Rarest 20 Large number 20 Close to or within
SAC for bats 5 Mosaic of pasture,
woodlands and wetlands
5 Complex network of
mature well-established
hedgerows, small fields
and rivers/streams
Importance Score
International > 50
National 41-50
Regional 31-40
County 21-30
Local 11-20
Not important 1-10
20 Roche, N., Aughney, T., Marnell, F. & Lundy, M. (2014). Irish Bats in the 21st Century. Bat Conservation Ireland. Cavan,
Ireland

Bracklyn Wind Farm
Annex 5.5: Bat Survey Report 74
5.3 Risk Assessment
The following sections provide a preliminary assessment of the potential impacts on bats during two
phases of the project, including construction phase impacts and operational phase impacts. The
results of the definitive impact assessment will be provided within Chapter 5 (Biodiversity) of the
Environmental Impact Assessment Report (EIAR) for the proposed development, which will also
assess the potential impacts during a decommissioning phase.
The results from bat survey conducted over the active season of 2020 show a level of activity that
would be expected at a site with connecting patches of scrub, small plantations, bog woodland,
defunct hedgerows, broadleaf woodlands and treelines. An initial (Stage 1) potential risk assessment
for the Bracklyn Wind Farm Site was carried out using the risk assessment matrix provided in SNH et
al. (2019) – Table 3a. For habitat risk, Moderate was entered into the matrix as the Wind Farm Site
was assessed to have:
• Buildings trees or other structures with moderate-high potential as roost sites on or near the
site.
• Habitat could be used extensively by foraging bats.
• Site is connected to the wider landscape by linear features such as scrub, tree lines and
streams.
For project size, the Medium category was selected as this is the best fits the proposed Bracklyn
Wind Farm. These two parameters returned a site risk score of 3, which is considered a medium site
risk.
The next of step of the risk assessment (Stage 2) uses a second matrix (Table 3b in SNH et al., 2019)
to derive an overall risk assessment based on the activity level of high collision risk species, which in
this instance are Leisler’s bat, common pipistrelle, soprano pipistrelle, and Nathusius’ pipistrelle. The
Stage 2 - risk assessment matrix is reproduced in Table 19 and for each of the four high collision risk
species the activity score is multiplied by the site risk score, which as stated above was determined to
be 3 – medium risk site. Active levels are derived from Ecobat; however, consideration is also given to
activity levels derived from Kepel et al. (2011) and both are summarised in the following bullet points:
• Based on Kepel et al. (2011), activity recorded by the majority of static deployments was high
on a site wide basis for common pipistrelle and soprano pipistrelle activity. Activity for
Leisler’s bat was low with occasional high activity at specific deployment locations during
specific deployments. Activity for Myotis species, brown long-eared bats and Nathusius’ bats
was considered low throughout the survey.
• Based on the SNH et al. (2019) activity categories used to describe the percentile outputs
generated by Ecobat, the overall levels of bat activity for the turbine location surveyed and
across all three seasonal deployments in 2020 found high levels of activity for common
pipistrelles, moderate/high levels of activity for soprano pipistrelles, moderate levels of
activity for Leisler’s bats and moderate/low levels for Myotis species, brown long-eared bats
and Nathusius’ pipistrelles. As detailed in Table 10 and Table 11 specific deployment
locations in specific seasons and specific nights were flagged as generating high or
moderate/ high levels of bat activity.

Bracklyn Wind Farm
Annex 5.5: Bat Survey Report 75
Table 19 – Stage 2: Overall risk assessment matrix Source: SNH et al. (2019)
Potential
site risk
level
Ecobat activity category (or equivalent justified categorisation)
0
Nil
1
Low
2
Low-
moderate
3
Moderate
4
Moderate-
high
5
High
1 Lowest 0 1 2 3 4 5
2 Low 0 2 4 6 8 10
3 Medium 0 3 6 9 12 15
4 High 0 4 8 12 15 18
5 Highest 0 5 10 15 20 25
For common pipistrelles, categorised by Ecobat as having high activity levels, the Stage 2 risk
assessment matrix returns a score of 15 – high risk.
For soprano pipistrelles, categorised by Ecobat as having moderate/high activity levels, the Stage 2
risk assessment matrix returns a score of 12 – medium risk.
For Leisler’s bat, categorised by Ecobat as having moderate activity levels, the Stage 2 risk
assessment returns a score of 9 – medium risk.
For Nathusius’ pipistrelles, categorised by Ecobat as having moderate/low activity levels, the Stage
2 risk assessment returns a score of 6 – medium risk.
To account for seasonal or localised peaks in activity SNH et al. (2019) note the importance of also
assessing the highest levels of activity recorded for each of the high collision risk species within the
Wind Farm Site.
Common pipistrelles, soprano pipistrelles and Leisler’s bat were all scored as having local and
seasonal high activity levels, which returns a Stage 2 risk assessment matrix maximum score of 15 –
high risk.
The outputs of the overall risk assessment are then considered in the context of any potential impacts
at the population level for species assessed having high population vulnerability (see Table 17),
which in Irish context are Leisler’s bat and Nathusius’ pipistrelle.
Table 20 provides a summary of bat population vulnerability to wind farm impacts (see Table 17),
species activity recorded at the Bracklyn Wind Farm Site (low, medium, high based on Kepel et al.,
2011 and high, moderate-high based on SNH et al., 2019) and the regional importance attached to
bat populations found to occur at the Bracklyn Wind Farm Site (locally to internationally important
based on Wray et al, 2010 – see Table 18).

Bracklyn Wind Farm
Annex 5.5: Bat Survey Report 76
Table 20 – Summary of impact assessment Including bat population vulnerability to wind farm impacts, species activity recorded and the regional importance attached to bat populations found to occur at the Bracklyn Wind Farm Site
Species
Population vulnerability wind farms
impacts
Activity levels at Bracklyn WF
Based on Kepel et al. (2011) Range in bp/h is shown for all the
static bat detectors deployed
Activity levels at Bracklyn WF
Ecobat
Population Importance at Bracklyn WF
(Scoring based on Wray et al., 2010)
Leisler’s
bat
High Low at most turbine locations,
except:
High: D.09 in spr.
Medium: T5 in spr.
Medium: D.09 in sum.
Range of bat passes/ hour
2020: 0.007 to 14.33
Abundance: Possibly
occurring sporadically in
moderate number
Moderate - Median Activity
Levels
High 36 of 215 nights
Moderate-high
85 of 215 nights
T4, T5, (spr)
County to Regional
(24 to 34)
Risk Assessment
9 to 15
Medium to High
Nathusius’
pipistrelle
High Low
Notes: Sporadic - activity
Range of bat passes/ hour
2020: 0.007 to 0.25 bp/h
Abundance: Small numbers
Moderate-low - Median
Activity Levels
Moderate/High 2 of 32
nights
Moderate
10/80 nights
County
(24)
Risk Assessment
6
Medium
Soprano
pipistrelle
Medium High at most turbine locations
in aut
Medium at most turbine
locations in spr
Low at most turbine locations
in summer
Range of bat passes/ hour
2020: 0.010 to 50.20 bp/h
Abundance: Large number of
bats with highly seasonal
activity
Moderate/High - Median
Activity Levels
High 117 of 319 nights
T2, T6 (sum)
T2, T4, T5, T6, T7, T10 (aut)
Moderate-high
89 of 319 nights
T4, T5, T6, T9 (spr)
T1, T4, T7 (sum)
T2, T3, T4, T11 (aut)
Regional
(31)
Risk Assessment
12 to 15
High
Common
pipistrelle
Medium High at most turbine locations
across all seasons:
Range of bat passes/ hour
2020: 0.008 to 33.30 bp/h
Abundance: Large number of
bats
High - Median Activity
Levels
High 196 of 362
T5, T6, T10 (spr)
T2, T4, T6, T7 (sum)
T2, T3, T4, T5, T6, T7, T10
(aut)
Moderate-high
69 of 362 nights
T2, T11 (spr)
T1, T3, T5, T10 (sum)
T8 (aut)
Regional
(31)
Risk Assessment
15
Medium to High
Myotis
species
Low Low
Range of bat passes/ hour
2020: 0.015 to 2.03 bp/h
Abundance: Small numbers (1
to 5 bats)
Moderate-low - Median
Activity Levels
Moderate-high
27 of 215 nights
T7 (sum)
County to Regional
(24 to 39)
Risk Assessment
N/A
Brown
long-eared
bat
Low Low
Range of bat passes/ hour
2020: 0.006 to 0.40 bp/h
Abundance: Small numbers
Moderate-low - Median
Activity Levels
High
2 of 105
Moderate-high
3 of 105 nights
T4 (sum)
County
(24)
Risk Assessment
N/A

Bracklyn Wind Farm
Annex 5.5: Bat Survey Report 77
5.4 Impact on bats
Wind turbines and associated infrastructure present a number of potential impacts to bats, namely:
1. Damage of or disturbance to roost sites during construction
2. Loss or fragmentation of habitat
3. Collision with rotor blades and barotrauma
4. Displacement or disturbance of commuting or migration routes
The first two of these are most relevant to the construction phase of the project, while the latter two
relate to potential impacts in the operational phase. The following sections provide an assessment of
the potential impacts on bats during the two phases of the project, including construction phase
impacts and operational phase impacts.
Overall, for the turbine location surveyed and across all three seasonal deployments the results from
bat surveys conducted over the 2020 active season found that Myotis spp., brown long-eared bats
and Nathusius’ pipistrelles were active at low to moderate levels, Leisler’s bats were active at
moderate levels, soprano pipistrelles were active at moderate to high levels and common pipistrelles
were active at high levels.
No hibernation or maternity roosts were identified within the turbine envelope; however, given the
levels of activity and emergence time data within the survey area and the wooded nature of the area,
roosts are considered likely to occur in the wider area. The activity data also suggests that there are
high quality foraging areas along linear features such as the stream on site, tracks within the conifer
plantations and along their interface with mature native woodland and clearings.
5.5 Construction phase: potential direct impacts on bats
In terms of the zone of influence for construction works, potential for direct effects to occur were
assessed within 20m of the proposed site infrastructure, including temporary features (site compound,
deposition areas) and for the grid connection route this was reduced to a 5m corridor along the route.
This assessment area is referred to as the works/construction corridor within this report.
Loss of a roost site resulting from demolition or disturbance during construction would be considered
as a significant negative impact of a proposed development. Potential direct impacts on bats resulting
from wind farm construction include vegetation removal, resulting in a loss of potential roost sites in
mature trees or the removal/modification to existing buildings on the Wind Farm Site. The potential for
any vegetation/building removal or modification to impact on roost site along the grid connection route
and at the substation also needs to be considered. The areas which have already been scheduled to
be felled for these purposes are shown in Appendix 2 and Appendix 3.
The assessment of low to negligible potential for roost sites within conifer plantation affected by
vegetation clearance with the exception of T5, which was assessed to have two treelines of low to
moderate roost potential within an area of proposed felling (Figure 5). Proposed felling is to consist of
the following:
• The removal or surgery of broadleaf treelines for the construction of the access track
• The removal of conifer plantation to the southwest of T1 to create an entrance track
• The removal of the bank/hedgerow/ open treeline near T2
• The removal of semi-mature broadleaf treeline and conifer plantation at T5
• The removal of semi-mature broadleaf treeline and young ash plantation at T4
• The removal of conifer and mixed broadleaf plantation surrounding T6, T7, T10, and T11
Though roost surveys classed these conifer plantations as having low to negligible roost potential,
Ecobat emergence time analysis suggests that there are potential roosts in the wider area

Bracklyn Wind Farm
Annex 5.5: Bat Survey Report 78
surrounding D.04, D.05, D.06, D.07. Of these potential roosts, those in the wider area surrounding
D.04 and D.06 could be maternity roosts if present. Given that the results of the roost surveys
conducted concluded that roosting is limited to semi-mature to mature broadleaf, the felling conducted
on conifer plantation and mixed broadleaf plantation is considered to have a negligible impact on bat
roosts. The felling areas around T4 and T5 do contain broadleaf treelines. The broadleaf treeline
within the felling area of T4 was classed as having low roost potential. The broadleaf treeline within
the felling area for T5 contains two trees of moderate roost potential. While these trees do contain
some suitable roost features, given our understanding of species composition within the site, and
particularly those areas, in the event those treelines are in use, they are in use by the two most
common species, common and soprano pipistrelles. Using Wray et al. 2010 to assess the value of
roost types, the presence of any potential roosts within the felling areas are of Local importance.
Therefore, the removal of these treelines in the absence of mitigation are considered to be
Significant at the Local level.
5.6 Construction phase: potential secondary impacts on bats
Potential secondary impacts on bats resulting from construction works are limited to the loss of
foraging and commuting habitats/features utilised by bats. Disturbance of roosting and foraging bats
through lighting impacts was considered; however, it is understood that there will be no night-time
working at the site and as such no additional lighting will be required during the construction phase of
the works. In addition, the species utilising this site most – Leisler’s bat, soprano pipistrelle and
common pipistrelle – are less sensitive to light pollution than the less commonly recorded species –
brown long-eared bats and Myotis species.
The proposed development site holds a number of defunct hedgerows, treelines, shelter belts and
small patches of woodland that are known to be used by foraging and commuting bats. This survey
shows that the linear features within conifer plantations are highly active foraging grounds for bats.
Vegetation removal as a result of the proposed felling detailed in the previous section will also impact
on bat foraging patterns within the site, particularly given the high levels of activity seen in these
conifer plantations. However, currently felling plans within the site in many cases do not disrupt the
continuation of linear features for commuting. The only location in which is the removal of treeline
considered to disrupt connectivity within the site is the removal of broadleaf treeline at T4.
In the absence of mitigation, vegetation removal has the potential secondary impacts of the proposal
upon bats are considered, without mitigation, to be Significant at the County scale.
5.7 Operational phase: Potential direct impacts on bats
Both direct collision with rotor blades and barotrauma (injuries to internal air cavities and blood
vessels caused by sudden change in air pressure behind a moving blade), have been found to
directly impacts bats (e.g. Cryan & Barclay, 2009,21 Rydell et al., 2010,22, Cryan et al. 2014,23 &
Mathews et al., 201624). The evaluation of Irish bat species likely to be at risk from collision and
barotrauma is detailed in Table 17; and is in part related to the likelihood of different species flying at
rotor blade height in an open landscape. The SNH et al. (2019) guidance incorporates the 50 m set-
21 Cryan, P. & Barclay, R (2009). Causes of Bat Fatalities at Wind Turbines: Hypotheses and Predictions. Journal of
Mammalogy 90, 1330-1340
22 Rydell, J., L. Bach, M. J. Dubourg-Savage, M. Green, L. Rodrigues & A. Hedenström. (2010). Bat mortality at wind turbines
in northwestern Europe. Acta Chiropterologica 12:261-274.
23 Cryan, P. M., P. M. Gorresen, C. D. Hein, M. R. Schirmacher, R. H. Diehl, M. M. Huso, D. T. Hayman, P. D. Fricker, F. J.
Bonaccorso & Johnson D. H. (2014). Behavior of bats at wind turbines. Proceedings of the National Academy of Sciences
111:15126-15131.
24 Mathews, F. Richardson, S. Lintott, P. & Hosken, P. (2016). Understanding the Risk to European Protected Species (bats)
at Onshore Wind Turbine Sites to inform Risk Management. Final Report from University of Exeter University for RenewableUK
and the UK Department of Energy & Climate Change (DECC)

Bracklyn Wind Farm
Annex 5.5: Bat Survey Report 79
back distance between the rotor swept area and habitat features (such as forestry edge and treelines/
hedgerows), which was originally published in the Natural England guidance. However, this guidance
mainly applies to certain species, such as common and soprano pipistrelles, which are known to
follow linear habitat features when foraging or commuting. It is not relevant to areas where linear
features are absent or sites where Leisler’s bat activity is high, since this species is just as likely to fly
over open terrain as along habitat features.
Different bat species have different foraging behaviours and ecological requirements, infrastructure
such as wind turbines may affect different species in different ways. Each bat species recorded at the
Wind Farm Site is considered in the following sections. It is important to note that the probability of
impact is lower for those turbines located away from habitat features. In open habitat, the probability
of such an impact is considered less likely. However, where turbines are located within close
proximity to features such as hedgerows and treelines (notably T4, T5, T6, T7, T10 and T11), there is
potential for a greater occurrence of bats within the rotor-swept area, resulting in increased potential
for impact. The current proposed areas of felling (Appendix 2
Maps showing bat feature could also create linear feature in close proximity to the turbine blades
creating a risk of higher activity than previously recorded. There was a difference in documented
activity at D.10 as across deployments as felling had already begun in the surrounding conifer
plantation. In the area which had been felled the detector, placed along the newly created linear
feature, recorded higher levels of activity post-felling.
5.7.1 Operational phase: Potential direct impacts on common and soprano pipistrelles
As listed in Table 17, both common pipistrelle and soprano pipistrelle are considered to be of high risk
of injury or mortality from turbines, resulting from either barotrauma (injuries to internal air cavities and
blood vessels caused by sudden change in air pressure behind a moving blade) or collision, based on
the behaviour and foraging techniques of this species. Both species typically show an affinity to
habitat features such as woodland/plantation edge, scrub, treelines and hedgerows; however,
pipistrelles are also known to forage more regularly in open habitat. Some of the proposed
infrastructure at the site is close to features that are used by these species for foraging/ commuting. A
study (Mathews et al., 2016) monitoring bat fatalities at wind farms around the UK found that these
two species of pipistrelle were amongst the casualties most commonly recorded during turbine
searches.
As summarised in Table 20, common and soprano pipistrelles are widespread and common
throughout Ireland; however due to flight behaviour, population vulnerability to wind farm
developments for both species is classed as Medium (Table 17). Overall common pipistrelle activity
was classed as high and soprano pipistrelle activity was classed as ‘Moderate/High’ with ‘High’
seasonal activity, which gives a risk assessment of high.
Some of the proposed infrastructure at the site is close to features that are used by these species for
foraging, notably turbines in the eastern part of the site, that are proposed adjacent to treelines.
Recorded levels of these species occurring at turbine locations were considered to be high at T2. T4,
T5, T6, T7, T10 and T11, with high levels of common pipistrelle activity being recorded in either
spring, summer or autumn deployments at these locations.
Without mitigation, potential impacts of the operational phase upon common pipistrelle and soprano
pipistrelle are considered to be Significant at the Regional level.
5.7.2 Operational phase: Potential impacts on Nathusius’ pipistrelle
As listed in Table 17, Nathusius’ pipistrelles are considered as high risk of injury or mortality from
wind turbines resulting from either barotrauma or collision; as this species regularly flies in the open
and at heights. Nathusius’ pipistrelles are strong flyers and known to be migratory in parts of their

Bracklyn Wind Farm
Annex 5.5: Bat Survey Report 80
European range and may fly at height during migration. A review of turbine related bat fatalities in
Europe (Rydell et al., 2010) found that 13% of the casualties were Nathusius’ pipistrelles.
As summarised in Table 20, Nathusius’ pipistrelles are classed as having high population vulnerability
to wind farm developments due the assumed vulnerability of the population and flight behaviour. It is
acknowledged that there is limited population assessment data available for this species in Ireland;
however, indications are that the range and frequency with which this species are recorded is
increasing. In an Irish context, the apparent range expansion could be an apparition caused by
increased survey effort and improved survey techniques. Nathusius’ pipistrelles activity was classed
as ‘Low’ according to Kepel et al. (2011) (Table 12) or ‘Moderate/ Low’ according to SNH et al. (2019)
(Table 9) with an increased level of activity in spring (Table 10; Table 12), which gives an overall risk
assessment of medium for this species in the context of the Wind Farm Site. Even when considering
seasonal or localised risk the assessment remains medium.
Without mitigation, potential impacts of the operational phase on Nathusius’ pipistrelles are
considered to be Significant at the County level.
5.7.3 Operational phase: Potential direct impacts on Leisler’s bat
As listed in Table 17, Leisler’s bats are considered as being at high risk of impact from wind turbines,
based on species behaviour and foraging techniques, in terms of both the likelihood of barotrauma or
collision. Leisler’s bats are strong and fast in flight, regularly foraging over, or taking direct flights
across, open habitats at heights within the collision risk zone for wind turbines. A study (Mathews et
al., 2016) monitoring bat fatalities at wind farms around the UK found that common noctule bats
(Nyctalus noctula), were amongst the casualties most commonly recorded during turbine searches
(along with common and soprano pipistrelles). Common noctule bats are not known to occur in
Ireland; however, it is a similar species to Leisler’s bats (lesser noctule bats) in terms flight behaviour,
and therefore similar levels of collision-risk would be predicated. Leisler’s bats are very sparsely
distributed in England and Wales, and only occasionally recorded in Scotland; and this explains why it
was not encountered during turbine searches based in the UK. Leisler’s bat is listed as Near
Threatened on the Irish Red List of Terrestrial Mammals (Marnell et al. 2009).
Levels of Leisler’s bat activity were notably higher in Spring. According to median activity levels D.05,
D.09, and D.10 recorded moderate/high Leisler’s activity in spring. Using bp/h and Kepel et al. (2011)
for analysis only context detector D.09 recorded ‘High’ levels during the spring deployment and
‘Medium;’ levels during the summer deployment. It is likely that these patterns are consistent with a
spring flux in activity with bats that then move to a different area.
Without mitigation, potential impacts of the operational phase upon Leisler’s bat are considered to be
Significant at the County to Regional level.
5.7.4 Operational phase: Potential direct impacts on Myotis species
As listed in Table 17, bats of the genus Myotis are considered as being at low risk of impact from
wind turbines based on species behaviour and foraging techniques. A study (Mathews et al., 2016)
monitoring bat fatalities at wind farms around the UK found a single carcass of a Myotis bat during the
searches (a Natterer’s bat - Myotis nattereri). Myotis species in the UK are rarely recorded fly at
heights above the canopy (20 to 30 m) and tend to prefer a more cluttered habitat due to their short
range, high frequency echolocation characteristics. Furthermore, their relatively slow flight speed
allows them to manoeuvre well and therefore have the agility to avoid collision events (Mathews et al.,
2016 & Rydell et al., 2010). Because of the behaviour exhibited by these species, the probability of
direct operational impact is Unlikely
As summarised in Table 20, overall Myotis bat activity was classed as ‘Low’ (Kepel et al., 2011) or
‘Moderate/ Low’ (SNH et al., 2019) and population vulnerability to windfarm developments for all three
Myotis species regularly occurring in Ireland is classed as Low. Therefore, no overall collision risk
assessment is required for this Genus.

Bracklyn Wind Farm
Annex 5.5: Bat Survey Report 81
Even without further mitigation, potential impacts of the operational phase upon Myotis species are
considered to be Not Significant.
5.7.5 Operational phase: Potential direct impacts on brown long-eared bat
As summarised in Table 17, brown long-eared bats are considered as being at low risk of impact from
wind turbines. A study (Mathews et al., 2016) monitoring bat fatalities at wind farms around the UK
found a single brown long-eared bat carcass during the searches. The static detector recording at
height (50m) recorded two brown long-eared bat at this height, which is unusual for this species.
Typically, this species flies at low height and close to vegetation. However, this behaviour is highly
anomalous for this species and the presence of 1 or 2 individuals does not reflect the risk posed to
the species population as a whole. The standard mode of flight behaviour exhibited by this species
results in the probability of an impact from wind turbines to be Unlikely.
As summarised in Table 20, overall brown long-eared bat activity was classed as ‘Low’ (Kepel et al.,
2011) or ‘Moderate/ Low’ (SNH et al., 2019) and population vulnerability to windfarm developments
for this species is classed as Low. Therefore, no overall collision risk assessment is required for this
species.
Even without further mitigation, potential impacts of the operational phase upon brown long-eared bat
are considered to be Not Significant.
5.8 Operational phase: Potential secondary impacts on bats
Disturbance of roosting bats and disturbance of foraging bats though lighting impacts during the
operational was considered to be Unlikely, as the installation of additional lighting proposed will be
minimal. However, there will be additional security lighting on the substation and the site generally
supports relatively high levels of bat activity. The species utilising this area most – Leisler’s bat,
soprano pipistrelle and common pipistrelle – are less sensitive to light pollution than the less
commonly recorded species – brown long-eared bats and Myotis species.

Bracklyn Wind Farm
Annex 5.5: Bat Survey Report 82
6 RECOMMENDATIONS AND MITIGATION
The likely significant effects of the proposed development on bats have been assessed and in the
absence of mitigation the following significant effects were identified:
• During the construction phase the likely direct impacts on bats roosting near turbine locations
are areas of proposed felling was considered Significant at the Local scale.
• During the construction phase the likely secondary impacts on foraging/commuting bats due
to the removal of vegetation was considered Significant at the Regional scale.
• During the operational phase the likely direct impacts on foraging/ commuting bats from
collision or barotrauma due to the location of wind turbines was considered to be:
- Significant at the Regional level for common and soprano pipistrelles.
- Significant at the County to Regional level for Leisler’s bat.
- Significant at the County level for Nathusius’ pipistrelle.
- Not significant for other less-susceptible species recorded, i.e. Myotis species and brown
long-eared bats
Mitigation measures have been identified and discussed for the following potential effects:
1. Avoidance of potential direct impacts to tree roosting bats
2. Avoidance of potential secondary impacts on bat foraging/ commuting habitat
3. Avoidance of wind turbine collision or barotrauma events for bats
This section also discusses the options for the provision of compensatory/replacement habitat and
any requirements for post-construction monitoring.
6.1 Mitigation to avoid potential direct impacts on tree roosting bats
Throughout the proposed development site, vegetation removal will be required to facilitate
construction of wind farm infrastructure, mainly for access tracks and the provision of turbine
foundations and areas of hardstanding. Several treelines have been identified as supporting potential
roost features (PRFs) classed as low to moderate, with the occasional high PRF. While no roosts
were identified during the 2020 active season, roost surveys were not exhaustive and there is a risk
the any trees identified as supporting PRF, which are earmarked for removal during construction,
could become occupied prior to works commencing. Given the types of features identified within the
proposed works corridor, mainly ivy clad trees with the occasional potentially suitable holes/cracks, it
is anticipated that occupancy of any PFR will be limited to transitional roosts, e.g. autumn mating
roosts. It is also considered that the surrounding area holds a number of structures offering higher
suitability for the formation of significant maternity and hibernation roosts, e.g. Bracklyn House.
Noting that areas within the site, including within potential felling areas, hold PRFs that could
potentially support bats in the future, pre-construction roost surveys will be an important component of
the species protection plan. For any trees found to be occupied by roosting bats prior to construction,
an exclusion zone will be implemented to prevent disturbance during times of occupancy. Table 21
provides restrictive periods for different types of roosts, and therefore by extension restrictive periods
for construction works, during which the exclusion zone for construction work would be applicable.
The extent of the exclusion zone can be up to 30 m for any notably disruptive works such as pile-
driving; however, the mitigation measure should be proportional to the disturbance levels emanating
from the construction activity.
Under the Wildlife Act, it is an offence to intentionally disturb, injure or kill a bat or disturb its resting
place. Under this legislation it is unlawful to destroy, alter or disturb known bat roosts without an

Bracklyn Wind Farm
Annex 5.5: Bat Survey Report 83
appropriate derogation licence, as issued by the National Parks and Wildlife Service (NPWS). Pre-
construction surveys will inform the application of a derogation license from NPWS to undertake
appropriate mitigation actions as required to ensure the conservation of bats, if found to be utilising
roosts within the construction corridor. Reporting of pre-construction bat surveys will be required to
demonstrate due diligence regarding avoidance of disturbance to potential bat roosts.
Given the types of features identified within the works corridor, mainly ivy clad trees with the
occasional potentially suitable holes/cracks, it is anticipated that occupancy of any PRF, if any, will be
limited to transitional roosts, e.g. autumn mating roosts.
While acknowledging the limited likelihood of the treelines where vegetation removal/cutting is
proposed to facilitate wind farm infrastructure; the mature trees identified as supporting PRFs will
require further pre-construction roost surveys and assessment in acknowledgement that they have
the potential to be utilised by bats in the future. The following locations have been highlighted as
requiring this:
• ‘T’ shaped treeline
• Beech Treeline to the southwest of T4
• Treelines on either side of T5
• Treeline to the southeast of T11
• Treeline to the northwest of T7
Pre-construction/ pre-vegetation removal bat roost surveys will include the following elements:
1. Areas listed above which are earmarked for vegetation removal will be thoroughly re-
assessed for PRFs. Surveys will be conducted by an appropriately experienced ecologist.
2. Any trees supporting PRFs will be targeted with further surveys, including emergence/re-entry
surveys and/or roost inspections (using endoscopes and thermal imaging cameras) to
determine occupancy of any moderate to high PRFs identified.
3. If any bat roosts are identified, further assessment will be required to determine the type of
roost (e.g. maternity, hibernation, mating, transitional), species using the roost and the level of
occupancy.
4. For any roost sites occupied these surveys will inform the application of a derogation license
from NPWS to undertake appropriate mitigation actions as required to ensure the
conservation of bats. These could include measures to exclude bats from potential roost
holes prior to vegetation removal and provision of alternative roost sites.
5. Reporting of pre-construction bat surveys will be required to demonstrate due diligence
regarding avoidance of disturbance to potential bat roosts.
Table 21 – Optimal season for works at different roost types Source: Kelleher & Marnell (2006)25
Bat usage of site Optimum period for carrying out works (some variation between species)
Maternity 01-Oct to 01-May
Summer (not a proven maternity site) 01-Sep to 01-May
Hibernation 01-May to 01-Oct
Mating/swarming 01-Nov to 01-Aug
25 Kelleher, C. & Marnell, F. (2006) Bat Mitigation Guidelines for Ireland. Irish Wildlife Manuals, No. 25. National Parks and
Wildlife Service, Department of Environment, Heritage and Local Government, Dublin, Ireland

Bracklyn Wind Farm
Annex 5.5: Bat Survey Report 84
6.2 Mitigation to avoid collision or barotrauma
6.2.1 Mitigation by avoidance
The main mitigation measure here is avoidance. This relates to the design of the wind farm
infrastructure to implement a minimum of 50 m separation distance from habitat features used by bats
and the tips of turbine blades; as recommended by the Natural England (2014) 26 guidelines, which
have been adopted by SNH et al. (2019) 27. The equation used to calculate stand-offs is reproduced in
Figure 29. The specification for the proposed turbines (Vestas V162) provides for a tip height of 185m
comprising a blade length of 81m (rotor diameter of 162m) and a hub height of 104m. The SNH
turbine buffer equation can be calculated for a range of feature heights using these dimensions, see
Table 22.
Based on the turbine dimensions specified, bat features buffers for low (3m) and high (30m) feature
heights will range from between 83m and 108m, respectively.
Figure 29 – Equation to calculate turbine tower buffers - required to maintain 50 m standoffs - blade tip to habitat feature
26 Natural England (2014). Bats and onshore wind turbines: Interim Guidance 3rd Ed. Natural England Technical Information
Note TIN051, Natural England, Peterborough
27 Scottish Natural Heritage, Natural England, Natural Resources Wales, Renewable UK, Scottish Power Renewables,
Ecotricity Ltd, University of Exeter & Bat Conservation Trust (2019). Bats and Onshore Wind Turbines: Survey, Assessment
and Mitigation.
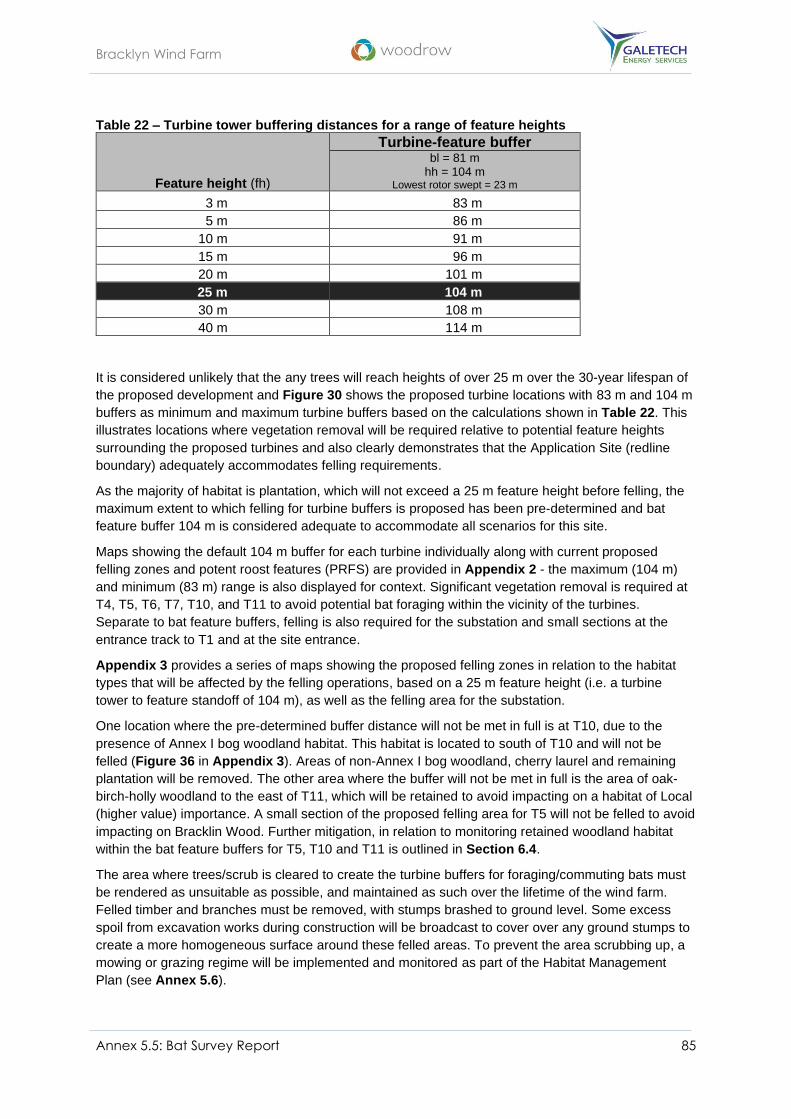
Bracklyn Wind Farm
Annex 5.5: Bat Survey Report 85
Table 22 – Turbine tower buffering distances for a range of feature heights
Feature height (fh)
Turbine-feature buffer bl = 81 m
hh = 104 m Lowest rotor swept = 23 m
3 m 83 m
5 m 86 m
10 m 91 m
15 m 96 m
20 m 101 m
25 m 104 m
30 m 108 m
40 m 114 m
It is considered unlikely that the any trees will reach heights of over 25 m over the 30-year lifespan of
the proposed development and Figure 30 shows the proposed turbine locations with 83 m and 104 m
buffers as minimum and maximum turbine buffers based on the calculations shown in Table 22. This
illustrates locations where vegetation removal will be required relative to potential feature heights
surrounding the proposed turbines and also clearly demonstrates that the Application Site (redline
boundary) adequately accommodates felling requirements.
As the majority of habitat is plantation, which will not exceed a 25 m feature height before felling, the
maximum extent to which felling for turbine buffers is proposed has been pre-determined and bat
feature buffer 104 m is considered adequate to accommodate all scenarios for this site.
Maps showing the default 104 m buffer for each turbine individually along with current proposed
felling zones and potent roost features (PRFS) are provided in Appendix 2 - the maximum (104 m)
and minimum (83 m) range is also displayed for context. Significant vegetation removal is required at
T4, T5, T6, T7, T10, and T11 to avoid potential bat foraging within the vicinity of the turbines.
Separate to bat feature buffers, felling is also required for the substation and small sections at the
entrance track to T1 and at the site entrance.
Appendix 3 provides a series of maps showing the proposed felling zones in relation to the habitat
types that will be affected by the felling operations, based on a 25 m feature height (i.e. a turbine
tower to feature standoff of 104 m), as well as the felling area for the substation.
One location where the pre-determined buffer distance will not be met in full is at T10, due to the
presence of Annex I bog woodland habitat. This habitat is located to south of T10 and will not be
felled (Figure 36 in Appendix 3). Areas of non-Annex I bog woodland, cherry laurel and remaining
plantation will be removed. The other area where the buffer will not be met in full is the area of oak-
birch-holly woodland to the east of T11, which will be retained to avoid impacting on a habitat of Local
(higher value) importance. A small section of the proposed felling area for T5 will not be felled to avoid
impacting on Bracklin Wood. Further mitigation, in relation to monitoring retained woodland habitat
within the bat feature buffers for T5, T10 and T11 is outlined in Section 6.4.
The area where trees/scrub is cleared to create the turbine buffers for foraging/commuting bats must
be rendered as unsuitable as possible, and maintained as such over the lifetime of the wind farm.
Felled timber and branches must be removed, with stumps brashed to ground level. Some excess
spoil from excavation works during construction will be broadcast to cover over any ground stumps to
create a more homogeneous surface around these felled areas. To prevent the area scrubbing up, a
mowing or grazing regime will be implemented and monitored as part of the Habitat Management
Plan (see Annex 5.6).

Bracklyn Wind Farm
Annex 5.5: Bat Survey Report 86
6.2.2 Mitigation by curtailment
It is anticipated that implementing bat feature buffers (as detailed in Section 6.2.1) will limit bat
activity in the vicinity of turbines and will be effective in reducing the potential for collision risk.
However, SNH et al. (2019) acknowledge that it is difficult to predict how bat behaviour will change
post-construction and this supported by Richardson et al. (2021) studying turbine mediated bat
fatalities at 23 wind farm sites across the UK. Therefore, further mitigation informed by post-
construction monitoring may be required.
One such option is smart curtailment, whereby turbines identified in high-risk locations by post-
construction monitoring are feathered to run at < 2rpm, while optimal flight conditions for bats occurs.
Smart curtailment has the potential to limit collision risk for Leisler’s bat, in particular, as this species’
feeding behaviour is often associated with open areas and therefore may be less responsive to
mitigation involving vegetation removal around turbines (although, as detailed in Section 3.5,
recorded Leisler’s bat activity on the site was generally low, with more activity recorded during spring,
at the proposed locations of T4 and T5).
Any requirement for smart curtailment, and the parameters that would influence it, must be guided by
a coherent and comprehensive post-construction monitoring methodology, which will clarify the bat
usage of the site at turbine locations post-construction, the likely relationship with temporal and
weather parameters, and will identify any potential collisions (noting the difficulties highlighted above
in predicting how bat usage of the site may change post-construction). However, the pre-construction
surveys, including surveys at height and the measurement of weather parameters, do allow for the
identification of relationships between bat usage and weather parameters, that will demonstrate how
an effective smart curtailment approach, specific to individual turbines, can be implemented. These
include:
• 96.7% of recorded Leisler’s bat passes at 50m were at wind speeds of under 7m/s (at 50m)
• 97.9% of recorded Leisler’s bat passes at 50m were temperatures of over 8°C (at 50m)
• 96.0% of recorded Leisler’s bat passes occurred at times of zero precipitation
• Recorded Leisler’s bat activity on the site was generally low, with more activity recorded
during spring, at the proposed locations of T4 and T5 (which may be related to Leisler’s bats
feeding over forestry prior to setting up maternity roosts for example)
Information such as that detailed above, together with information on temporal usage of the site at
specific turbine locations post-construction (including usage over the season and over night-time
periods within specific seasons), can be utilised to provide a highly effective mitigation approach by
smart curtailment by implementing curtailment during the periods and environmental parameters that
are known to be preferred by at risk-species.
6.3 Mitigation to avoid potential secondary impacts on bat foraging /
commuting habitat
Several locations have been identified where, vegetation removal has the potential to impact on
foraging and commuting bats, with the following areas highlighted as locations where the impact will
be negative, including:
• The loss of conifer plantation at T5, T6, T7, T10 and T11
• The loss of ash plantation at T4 and T6.
• The removal of broadleaf treelines at T4, T5 and T11
Project design has attempted to avoid the removal of treelines, hedgerows and woodland habitats
utilised by bats. To compensate for any unavoidable loss of bat commuting/foraging habitat there will
be an equivalent area identified as compensatory habitat.

Bracklyn Wind Farm
Annex 5.5: Bat Survey Report 87
Compensation should aim to maximise future woodland, hedgerow and treeline ecological function by
specifying an appropriate species mix and replacement locations to maximise connectivity. In the
latter case, full consideration must be taken of bat usage of the site. It is proposed that compensatory
planting of hedgerow/treeline habitat is undertaken in order to maintain connectivity between the
woodland surrounding T4 and T5 (particularly the beech woodland to the southwest of T4) to the
woodland and bog pool in the east of the site, which D.09 showed was of high foraging value.
Connectivity between the mature beech treeline to the southwest of T4 and the treeline of semi
mature beech tracking north from T4 should also be maintained. Maintaining this connectivity would
involve the planting of hedgerow/treeline habitat in the field to the east of T4/north of T5.
This replanting, given adequate buffer distance from the turbine, would complement the mitigation for
collision and barotrauma by acting as linear features along which bats commute, reducing their
likelihood of commuting through the buffer zone. The removal of vegetation to implement turbine
buffers is not anticipated to significantly reduce the edge effects that create habitat features utilised by
bats and may actually increase this, in combination with compensatory planting leading to an
enhancement of the foraging features within the Application Site.
One area in which the current felling plan is likely to impact habitat connectivity within the site is at T4.
Compliance to SNH buffer guidelines will require the removal of semi-mature broadleaf treelines
which provide commuting pathways connecting the south west and east of the site. A proposed re-
planting plan for this location is outlined in Figure 32 of Appendix 3. This proposed re-planting of
broadleaf treeline seeks to maintain the connectivity provided by treelines around T4 between the
south and eastern parts of the site. The proposed replanting would also require the retention of a
linear feature to the south of the turbine in the form of young ash plantation edge or re-planted
broadleaf. Given the distance from the turbine, trees to the south of the turbine location must be
managed and kept below 20m in height while the trees to the west and northwest of the turbine
location must be managed and kept below 30m in height.
6.4 Post-construction monitoring
Based on the levels of pre-construction bat activity and the proposed extent of felling, post-
construction monitoring at selected turbines will be required. Although the extent to which bats are
affected by collisions with turbines is not fully understood, measures, including vegetation removal will
reduce the potential for bat collisions or barotrauma occurring once the proposed wind farm is
operational. A post-construction monitoring plan for bats should be adopted, with consideration given
to turbines where the recommended 50m separation buffer from blade tip to habitat features falls
close to the turbines, notably relevant to T4, T5, T6, T7, T10 and T11, where high levels of pipistrelle
bat activity were recorded.
Post-construction monitoring should include monitoring using static bat detectors, as well as a bat
fatality search methodology. This will provide further information on the bat usage of the site at turbine
locations post-construction and will also provide information on collisions. This information will
indicate whether mitigation measures are effective. Any need for remedial measures will then be
assessed, successful remedial measures have included increasing of cut-in speeds during specific
weather conditions (low wind speeds and high night time temperatures) during the spring and autumn
months (‘smart curtailment’, as outline in Section 6.2.2).
As outlined in Section 6.2.1 the minimum separation distance for bat feature buffer, as required by
SNH guidelines, will not be met at T5, T10 and T11, due to the presence of important habitat, that will
be retained within the buffers. Enhanced post-construction monitoring is to be conducted along the
broadleaf woodland habitat edge in order to investigate bat use of the feature and inform any need for
further felling to reduce feature height (without impacting integrity of the habitat). Alternatively, or in
combination with extending felling areas, development of a curtailment plan may be required if there

Bracklyn Wind Farm
Annex 5.5: Bat Survey Report 88
are seasonal/weather driven peaks in bat activity along the habitat edges retained within the bat
feature buffers.
6.4.1 Monitoring intervals
Bats and Onshore Wind Turbines: Survey, Assessment and Mitigation (SNH 2019) state “In order to
evaluate the success of the curtailment regime, a minimum of 3 years of monitoring should take place
during which time casualty searches and acoustic monitoring should take place concurrently”.
A 3-year monitoring programme is recommended for bats, with monitoring in years 1, 2, and 3, post-
construction.
Note: Start dates for monitoring years should be in line with either the start of the breeding season or
non-breeding season; and it is acceptable for the post-construction – monitoring year 1 to commence
prior to the final close-out of construction, as long as the turbine is erected and turning, i.e. posing a
collision risk.
6.4.2 Survey area for bat monitoring
The bat survey area for post-construction phase monitoring is defined as the turbine locations
identified as holding a risk to bats. On the basis of existing information, this is considered to be T4,
T5, T6, T7, T10 and T11, with a particular emphasis on T10 and the interface of buffer zone to bog
woodland habitat.
6.4.3 Activity surveys
SNH (2019) recommends that post-construction methodologies for activity surveys should mirror
those required for the pre-construction period. Activity surveys will include deployment of static
detectors at a minimum of 3 deployments per active season, for a minimum of 10 nights per
deployment. This will include one deployment between early May and mid-June, 1 deployment
between mid-June and the end of August, and 1 deployment between early September and the end of
October.
6.4.4 Collision monitoring
Turbine searches are implemented to detect any fatalities (and possibly injured animals) due to
collisions with turbines. Currently, there are no standardised methodologies for monitoring of wind
farm collisions in Ireland and there will need to be a monitoring plan agreed with the planning
authority. A post-construction bat monitoring plan must include detailed methodology for conducting
turbine searches with consideration given to the following:
• Frequency and seasonality turbine searches - monitoring should be undertaken at times identified
as presenting the greatest risk of collision, which in this case, is spring to autumn (the active bat
season).
• Timing of searches - searches commencing at dawn may limit scavenging of any causalities from
the preceding night/ day; and while nocturnal scavengers like foxes will be active during the night, it
is important to sample this period effectively.
• Type of search team employed - Trained wildlife detection dogs have been shown to be significantly
more effective than humans in detecting fatalities from collision, especially in detection of smaller
carcasses and where long/ dense vegetation limits visibility of the ground (Mathews et al. 2013).
• Size of search areas around turbines - A search area of r = 65 m is often selected, as studies
monitoring collision have found that the core radius around turbines, where the majority of collision
casualties fall, is within 50 m of turbines (Arnett 2006) and this is also an appropriately sized search
area that can be effectively searched by an appropriately trained sniffer dog in a single time period.
• Weather conditions - Climatic conditions, such as humidity are known to affect detectability of scent
particles by sniffer dogs and conditions prior to the search day will determine the likelihood of

Bracklyn Wind Farm
Annex 5.5: Bat Survey Report 89
collisions occurring and it is important to try and sample periods when collisions are more likely and
avoid those when collision risk is lower. Whenever possible, searches should not be undertaken on
days following prolonged calm periods and when this is unavoidable, e.g. due to scheduling issues a
note will accompany the search data.
• H&S considerations - searches will only be conducted within the weather parameters dictating
access into the site and to the turbines – specifically excluding periods of high wind speeds, when a
lighting-strike risk alert has been issued, during periods of dense snow cover and when turbines are
iced.
• Survey routes - Including transect intervals and how the route covered will be recorded (GPS, the
ViewRanger app or similar)
• Duration of searches – Typically, for a search area of r = 65 m human search effort should last for a
minimum of 1 hour per turbine (lone-surveyor) or a minimum of 40 minutes per turbine for a single
dog team. A single dog is unlikely to be able to search more than 4 turbines per day, as senses
become over stimulated and dogs lose interest especially when no carcases are located and
become fatigued.
• Information recorded – The following information should be recorded: - Search method (dog/human), turbine identification number, time of dawn/sunrise, start time and
search duration for each turbine, route taken using a GPS, ViewRanger App. or equivalent. - For any remains (including feather spots) a grid reference will be taken and the distance to the
closest turbine recorded. The remains will be photographed in situ and described. Once
photographed, all the remains will be bagged for identification and if collision is suspected as
the cause of death, the carcass will be sent for autopsy.
- Any signs or observations scavenging species in the environs
- A list of other species encountered
- Weather conditions during the search
- An assessment of flight conditions preceding the search day will be made.
- At regular intervals over the survey year, the search area around each turbine will be described
in terms of vegetation cover and easy of searching.
• Determination of scavenging rates – Baited trip cams can be deployed over a given survey year to
determine what scavengers are active on the site and how quickly carcasses are removed.
• Determination of surveyor detection rates – All survey teams will have detection rates tested and
scored using a standardised methodology.

Bracklyn Wind Farm
Annex 5.5: Bat Survey Report 90
Figure 30 – Range for turbine-feature buffers, as calculated in Table 22

Bracklyn Wind Farm
Annex 5.5: Bat Survey Report 91
7 CONCLUSIONS
A survey of, and impact assessment for, the bat population on the Wind Farm Site was conducted
and found, in the absence of mitigation there is potential for significant effects on the following
features that are considered to be of County to Regional importance, including:
• During the construction phase the potential for direct impacts on bats roosting in trees located
along the assess track and in areas near proposed turbine locations to be Significant at a
Local scale.
• During the construction phase the potential for secondary impacts on foraging and commuting
bats due to the removal of vegetation was considered Significant at a County scale.
• During the operational phase the potential direct impacts on foraging/commuting bats –
collision or barotrauma to common and soprano pipistrelles considered Significant at a
Regional scale, to Leisler’s bat considered Significant at a County to Regional scale, and to
Nathusius’ pipistrelles Significant at a County scale.
Mitigation measures have been proposed including:
• The development of a species protection plan to identify any active tree roosts within the
works corridor, including grid connection route prior the commencement of construction
works; and will include the application for a derogation licence for NPWS, to conduct any
species protection works, operations, or procedures as required.
• Implementing bat feature buffers, which involving removal of vegetation around turbines to
maintain a minimum separation distance of 50m between blade tip and feature. The likely
effectiveness of this can be seen when comparing relative activity levels at D.08 and D.11.
• Compensatory habitat for foraging/commuting bats to replace “like-for-like” within the
proposed development site and maintain overall connectivity. This will be detailed in the
Habitat Management Plan for the proposed development.
• A full suite of post-construction bat surveys, as detailed in SNH et al. (2019) designed to
monitor the efficacy of bat feature buffers and inform requirements for further remedial
measures, such as increasing of cut-in speeds at specific turbine locations experiencing
elevated periods of bat activity at height due specific weather conditions.
It is considered that the proposed measures, if implemented as recommended and in full, will mitigate
entirely for any potential impacts on foraging, commuting, or roosting bats at the proposed Bracklyn
Wind Farm and will result in an overall residual impact on bats the utilising the Wind Farm Site of Low
Significance. The EIAR – Biodiversity Chapter provides the definitive impact assessment and
specific details on the application of appropriate mitigation measures.

Bracklyn Wind Farm
Annex 5.5: Bat Survey Report 92
8 REFERENCES
Arnett, E.B., 2006. A preliminary evaluation on the use of dogs to recover bat fatalities at wind energy
facilities. Wildlife Society Bulletin, 34(5), pp.1440-1445.
Collins, J. (ed.) (2016) Bat Surveys for Professional Ecologists: Good Practice Guidelines (3rd edn).
The Bat Conservation Trust, London. ISBN-13 978-1-872745-96-1
Cryan, P. & Barclay, R (2009). Causes of Bat Fatalities at Wind Turbines: Hypotheses and
Predictions. Journal of Mammalogy 90, 1330-1340
Cryan, P. M., P. M. Gorresen, C. D. Hein, M. R. Schirmacher, R. H. Diehl, M. M. Huso, D. T. Hayman,
P. D. Fricker, F. J. Bonaccorso & Johnson D. H. (2014). Behavior of bats at wind turbines.
Proceedings of the National Academy of Sciences 111:15126-15131.
Bat Conservation Ireland (2012) Wind Turbine/Wind Farm Development Bat Survey Guidelines,
Version 2.8, December 2012.
European Community Habitats Directive (92/43/EEC) – The Habitats Directive.
European Communities (Birds and Natural Habitats) Regulations 2011.
Hundt L. (2012) Bat Surveys: Good Practice Guidelines, 2nd edition, Bat Conservation Trust ISBN-13:
9781872745985 [Namely Chapter 10 - ‘Surveying proposed onshore wind turbine developments’]
Kelleher, C. & Marnell, F. (2006) Bat Mitigation Guidelines for Ireland. Irish Wildlife Manuals, No. 25.
National Parks and Wildlife Service, Department of Environment, Heritage and Local Government,
Dublin, Ireland
Kelm, D.H., Lenski, J., Kelm, V., Toelch, U. and Dziock, F., 2014. Seasonal bat activity in relation to
distance to hedgerows in an agricultural landscape in central Europe and implications for wind energy
development. Acta Chiropterologica, 16(1), pp.65-73.
Kepel, A., Ciechanowski, M., Jaros, R. (2011). How to assess the potential impact of wind turbines on
bats using bat activity surveys? A case study from Poland, XII European Bat Research Symposium,
August 22-26, 2011, Vilinusm Lithuania.
Lintott, P.R., Davison, S., van Breda, J., Kubasiewicz, L., Dowse, D., Daisley, J., Haddy, E. &
Mathews, F. (2018). Ecobat: An online resource to facilitate transparent, evidence‐based
interpretation of bat activity data. Ecology and evolution, 8(2), pp.935-941
Lundy, M., Montgomery, I. and Russ, J., 2010. Climate change‐linked range expansion of Nathusius’
pipistrelle bat, Pipistrellus nathusii (Keyserling & Blasius, 1839). Journal of Biogeography, 37(12),
pp.2232-2242.
Lundy, M.G., Aughney, T., Montgomery, W.I., & Roche, N., (2011) Landscape conservation for Irish
bats & species specific roosting characteristics. Bat Conservation Ireland.
Marnell, F., Kingston, N. & Looney, D. (2009) Ireland Red List No. 3: Terrestrial Mammals, National
Parks and Wildlife Service, Department of the Environment, Heritage and Local Government, Dublin,
Ireland.
Mathews, F. Richardson, S. Lintott, P. & Hosken, P. (2016). Understanding the Risk to European
Protected Species (bats) at Onshore Wind Turbine Sites to inform Risk Management. Final Report
from University of Exeter University for RenewableUK and the UK Department of Energy & Climate
Change (DECC)
McAney, K. (2006) A conservation plan for Irish vesper bats. Irish Wildlife Manuals, No. 20. NPWS,
Department of Environment, Heritage and Local Government, Dublin, Ireland.
Middleton N., Fround A. & French K (2014) Social Calls of the Bats of Britain and Ireland.

Bracklyn Wind Farm
Annex 5.5: Bat Survey Report 93
Natural England (2014). Bats and onshore wind turbines: Interim Guidance 3rd Ed. Natural England
Technical Information Note TIN051, Natural England, Peterborough.
Richardson, S.M., Lintott, P.R., Hosken, D.J., Economou, T. & Mathews, F. (2021). Peaks in bat
activity at turbines and the implications for mitigating the impact of wind energy developments on
bats. Scientific Reports 11
Roche, N., Aughney, T., Marnell, F. & Lundy, M. (2014). Irish Bats in the 21st Century. Bat
Conservation Ireland. Cavan, Ireland
Russ, J.M., Hutson, A.M., Montgomery, W.I., Racey, P.A. and Speakman, J.R., (2001.) The status of
Nathusius' pipistrelle (Pipistrellus nathusii Keyserling & Blasius, 1839) in the British Isles. Journal of
Zoology, 254(1), pp.91-100.
Russ, J. (2012) British Bat Calls: A Guide to Species Identification.
Russ, J., Briggs, P. & Wembridge, D. (2008) The Bats and Roadside Mammals Survey 2008. Final
Report on Fourth Year of Study. The Bat Conservation Trust and People’s Trust for Endangered
Species, London.
Rydell, J., L. Bach, M. J. Dubourg-Savage, M. Green, L. Rodrigues & A. Hedenström. (2010). Bat
mortality at wind turbines in northwestern Europe. Acta Chiropterologica 12:261-274.
SNH (2019) Bats and Onshore Wind Turbines: Survey, Assessment and Mitigation.
Wildlife Act 1976 (as amended).
Wray, S., Wells, D., Long, E. & Mitchell-Jones, T (December 2010). Valuing Bats in Ecological Impact
Assessment, CIEEM In-Practice p 23-25.

Bracklyn Wind Farm
Annex 5.5: Bat Survey Report 94
APPENDIX 1
- STATIC DETECTOR LOCATIONS
Plate 1 – D.01
Plate 2 – D.02
Plate 3 – D.03
Plate 4 – D.04
Plate 5 – D.05
Plate 6 – D.06

Bracklyn Wind Farm
Annex 5.5: Bat Survey Report 95
Plate 7 – D.07
Plate 8 – D.08
Plate 9 – D.09
Plate 10 – D.10
Plate 11 – D.11
Plate 12 – Continuous recording at height

Bracklyn Wind Farm
Annex 5.5: Bat Survey Report 96
APPENDIX 2
- MAPS SHOWING BAT FEATURE BUFFERS & PROPOSED
FELLING AREAS

Bracklyn Wind Farm
Annex 5.5: Bat Survey Report 97

Bracklyn Wind Farm
Annex 5.5: Bat Survey Report 98

Bracklyn Wind Farm
Annex 5.5: Bat Survey Report 99
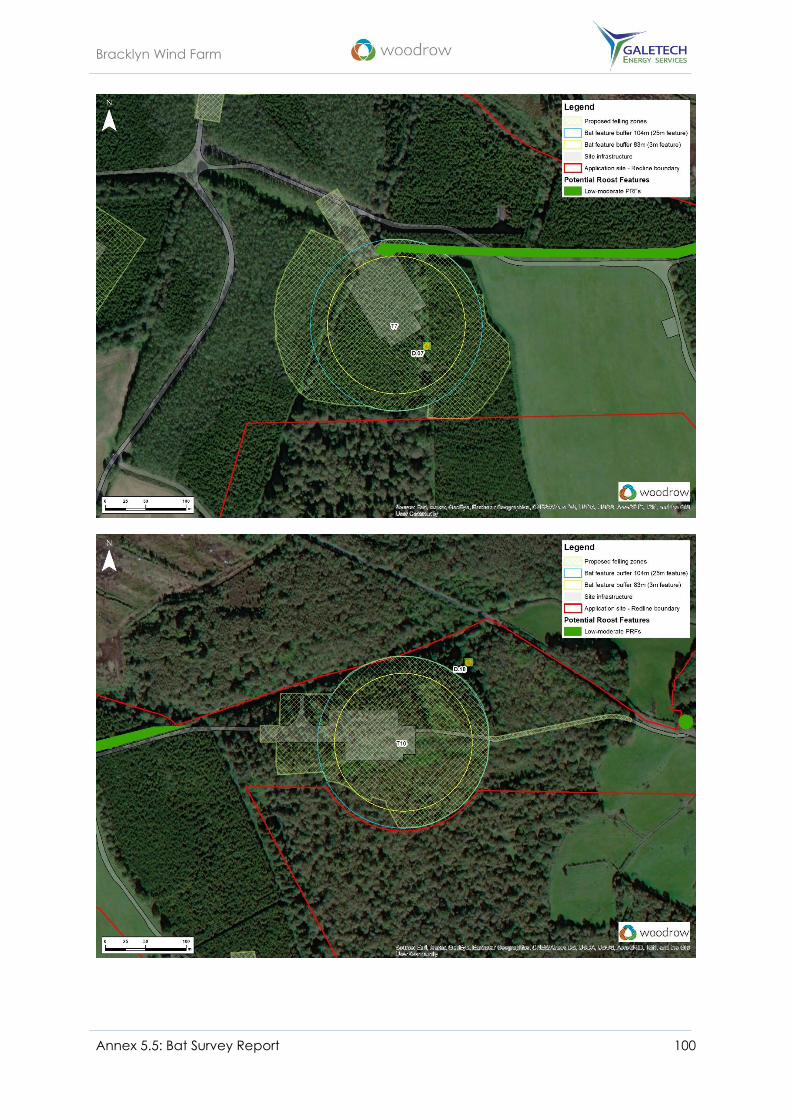
Bracklyn Wind Farm
Annex 5.5: Bat Survey Report 100

Bracklyn Wind Farm
Annex 5.5: Bat Survey Report 101

Bracklyn Wind Farm
Annex 5.5: Bat Survey Report 102
APPENDIX 3
- FELLING AREAS FOR BAT FEATURE BUFFERS & PROPOSED
RE-PLANTING SCHEME
Buffers generated using three different feature heights, with 104 m hub height & 162 m rotor diameter
Figure 31 – Felling at substation
Figure 32 – Felling and replanting at T4

Bracklyn Wind Farm
Annex 5.5: Bat Survey Report 103
Figure 33 – Felling at T5
Figure 34 – Felling at T6

Bracklyn Wind Farm
Annex 5.5: Bat Survey Report 104
Figure 35 – Felling at T7
Figure 36 – Felling at T10 with area of bog woodland not to be felled

Bracklyn Wind Farm
Annex 5.5: Bat Survey Report 105
Figure 37 – Felling at T11

Bracklyn Wind Farm
Annex 5.5: Bat Survey Report 106
APPENDIX 4
- EMERGENCE AND RE-ENTRY SURVEY LOCATIONS
Plate 13 – Derelict cottage
Plate 14 – Mature beech
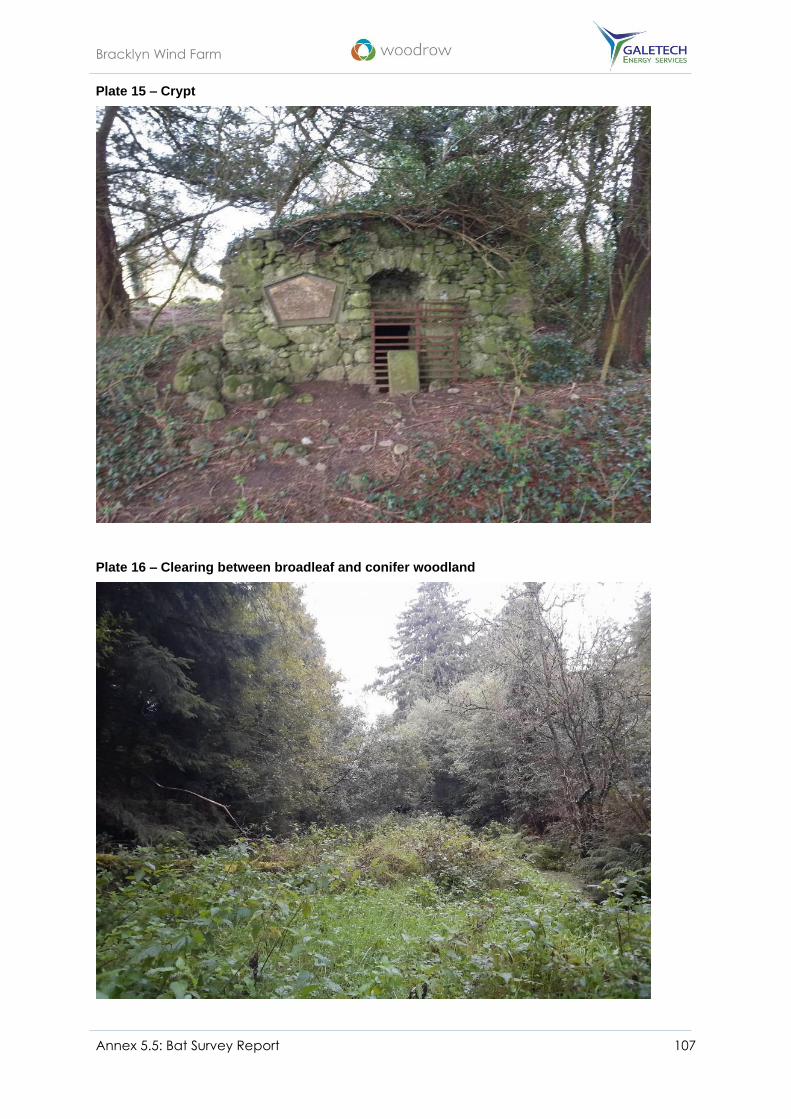
Bracklyn Wind Farm
Annex 5.5: Bat Survey Report 107
Plate 15 – Crypt
Plate 16 – Clearing between broadleaf and conifer woodland
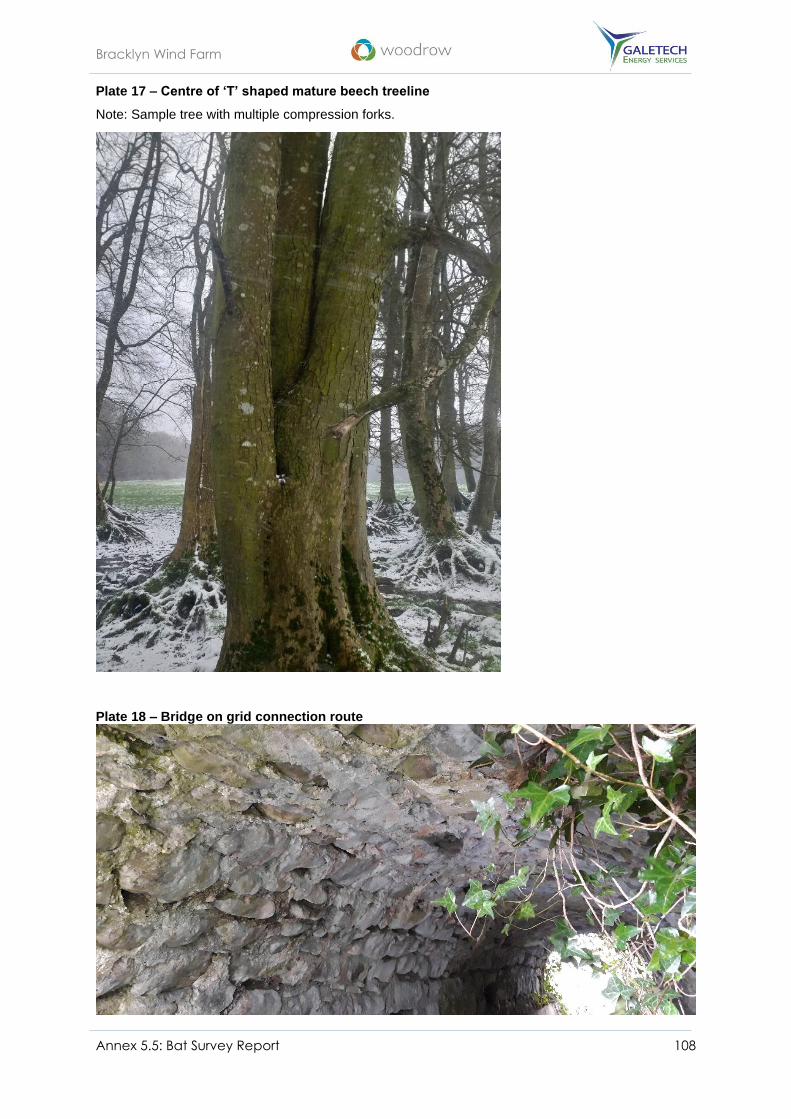
Bracklyn Wind Farm
Annex 5.5: Bat Survey Report 108
Plate 17 – Centre of ‘T’ shaped mature beech treeline
Note: Sample tree with multiple compression forks.
Plate 18 – Bridge on grid connection route