UNSCEAR 1988 Report - Annex B
107
SOURCES, EFFECTS AND RISKS OF IONIZING RADIATION United Nations Scientific Committee on the Effects of Atomic Radiation 1988 Report to the General Assembly, with annexes UNITED NATIONS New York, 1988
-
Upload
khangminh22 -
Category
Documents
-
view
3 -
download
0
Transcript of UNSCEAR 1988 Report - Annex B

SOURCES, EFFECTS AND RISKS
OF IONIZING RADIATION United Nations Scientific Committee on the Effects
of Atomic Radiation 1988 Report to the General Assembly, with annexes
UNITED NATIONS New York, 1988

NOTE
The report of the Committee without its annexes appears as Official Records of the General Assembly, Forty-third Session, Supplement No. 45 (A/43/45).
The designations employed and the presentation of material in this publication do not imply the expression of any opinion whatsoever on the part of the Secretariat of the United Nations concerning the legal status of any country, territory, city or area. or of its authorities, or concerning the delimitation of its frontiers o r boundaries.
UNITED NATIONS PUBLICATION Sales No. E.88.IX.7 ISBN 92-1- 142143-8
09000P

ANNEX B
Exposures from nuclear power production
C O N T E N T S
Paragraphs
INTRODUCTION ....................... 1-20
1 . .MINING AND MILLING ........ 21-37
A . Effluents .................... 22-30
B . Local and regional collective dose ................ commitments 3 1-32
....... C . Occupational exposures 33-37
I1 . URANILhI FUEL FABRICATION 38-49
. .................... A Effluents 42-44
B . Local and regional collective dose ................ commitments 45-16
. . . . . . . . C Occupational exposures 47-49
Ill . REACTOR OPERATION . . . . . . . .A . Effluents ...................
1 . Fission noble gases ....... 2 . ?ictivation gases .......... .; . Tritium ................. 4 . Carbon-I4 .............. 5 . Iodine . . . . . . . . . . . . . . . . . . 6 . Particulates in airborne
effluents . . . . . . . . . . . . . . . . - . Liquid effluents ..........
B . Local and regional collective dose commitments . . . . . . . . . . . . . . . . I . Fission noble gases . . . . . . . 2 . .Activation gases . . . . . . . . . . 3 . Tritium .................
. . . . . . . . . . . . . . . 4 Carbon-I4 5 . Iodine .................. 6 . Particulates in airborne
effluents ................ 7 . Liquid effluents ..........
C . Occupational exposures .......
Paragraphs
........... . D Solid ~ a s t e disposal 122- 145 .... . 1 Solid waste production 122- 128
2 . Solid waste disposal facili- ..................... ties 129-135
3 . Collective dose commit- ................... ments 136-145
......... IV . FUEL REPROCESSING 146-178
. .................... A Effluents 148-161
B . Local and regional collective dose ................ commitments 162- 170
. .............. I Krypton-85 163 .... . 2 Tritium and carbon-I? 164-165
I . .......... 3 . Other atmospheric releases 166 4 Liquid effluents 167- 170
....... . C Occupational exposures 17 1- 172
. ........... D Solid waste disposal 173-178
V . COLLECTIVE DOSE COMMIT- SIENTS FROM GLOBALLY DIS-
..... PERSED RADIONUCLIDES 179-190
. .................. .\ Krypton-85 182
. ..................... B Tritium 183-184
. .................. C Carbon-14 185-187
. .................. D Iodine-129 188-190
................... . VI TRANSPORT 191-193
. .................... VII SUMMARY 194-198
Pages
............................... Tables 163
............................ References 234

Introduction
1. The generation of electric energy by nuclear reactors has increased since the Committee's assess- ment of doses from radioactive materials released during nuclear fuel cycle operations, as reported in Annex F of the UNSCEAR 1982 Report [UI]. The total world installed nuclear electricity generating capacity at the end of 1987 was 298 G W from 417 units in 26 countries [I l l . This represents an approximate doubling of nuclear capacity since the UNSCEAR 1982 Report. as rnay be seen from Figure I. Kuclear power was responsible for some 16% of the tvorld's electricity generated in 1987, and currently some 120 reactors are under construction with an electrical capacity of 101 G W [I l l . Projections for world nuclear generating capacity for the year 2000 are still somewhat speculative, but the figure seems likely to be in the range of 400-500 G W [12], somewhat less than earlier expectations but still representing a further expansion of 30-60% from currently installed capacity.
2. The number of power reactors operating at the end of 1987, their type and generating capacities for each country of the tvorid is shown in Table 1. The reactor types include the pressurized water moderated and cooled reactor (PWR). the boiling tvater moderated and cooled reactor (BWR), the gas cooled reactors ( G C R ) of the Magnox and advanced gas cooled (AGR), graphite moderated type, the light tirater cooled graphite moderated reactor (LWGR), the heavy water moderated and cooled reactor (HWR),
and the fast breeder reactor (FBR). The installed capacity per caput is also given in Table 1: it is highest in Sweden at 1.14 kW per caput and ranges from about 0. I to over 0.8 kW per caput in other developed countries. The average installed capacity per person at about 0.14 kW represents an increase of 100Ci; over the equivalent figure (0.07 kW) reported in the UNSCEAR 1982 Report. Table 3 shows the amounts and percentage of electricity generated in countries by nuclear power in 1987 [I2]. The highest use of nuclear reactors for electricity generation was in France (70Si ) and Belgium (66%).
3. The nuclear fuel cycle includes the mining and milling of uraniunl ores. conversion to nuclear f t~el material, which usually includes the enrichment of the isotopic content of 235U and fabrication of fuel elements; the production of energy in the nuclear reactor; the storage of irradiated fuel, or its reproccss- ing with the recycling of the fissile and fertile materials recovered, and the storage and disposal of radioactive wastes. Almost all of the artificial radionuclides associated with the nuclear fuel cycle are present in the irradiated nuclear fuel, although some neutron activation of structural and cladding materials takes place. The majority of irradiated fuel elements are currently stored; when reprocessing takes place, the highly active liquid wastes containing fission products and transuranium elements are stored in tanks isolated from the environment until the) can be solidified. Solid wastes. arising at each stage of the fuel cycle. are mainly stored, although some wastes are disposed of.
YEAR
Flgure I. The installed nuclear electric energy capaclty on 31 December between 1979and 1987. [Il, 12, 13, 14, 15, 16, Ul]

In routine operation of nuclear installations, small quantities of radioactive materials are released in effluents. which disperse in the environment and result in low-level exposures of the public.
4. The interest of the Committee is in assessing the radiation doses to individual members of the public from releases of radioactive materials and also the doses to workers from normal operation of the nuclear fuel cycle. Exposures of the public from high- level wastes, which arise in fuel reprocessing, have not been assessed by the Committee. as these wastes are still in storage. The majority of irradiated fuel is not being reprocessed. Preliminary estimates are made of the exposures in the future resulting from current disposals of radioactive solid wastes. The significant release of radioactive materials and the exposures to workers and the public that resulted from the accident at the Chernobyl nuclear power reactor are discussed in detail in Annex D, "Exposures from the Chernobyl accident", and Annex G "Early effects in man of high doses of radiation".
5. The quantities of radionuclides in effluents from nuclear facilities are usually reported and available to the Committee. reflecting the operational history of each plant, including periods of abnormal operation and maintenance shut-down. In this Annex the Com- mittee reviews discharge data for the six-year period 1980-1985 and estimates average releases per unit of electric energy generated for each major power reactor type. Because the data for 1985 are incomplete. normalized releases are presented for the quinquennium 1980-1984. These normalized releases d o not apply. of course, to any one plant but are deemed to be representative of current nuclear power generation. Future practices may lead to discharge levels con- siderably different from the normalized values presented here, which include new and old plants: therefore, any extrapolation to the future must be undertaken with caution.
15. Because of the system of controls applied to environmental releases from nuclear power installa- tions. doses to individual members of the public correspond to low levels of individual risk. The doses to the most exposed individuals vary widely from installation to installation and from one location to another, and the level of individual dose generally decreases rapidly with distance from a given source. In this Annex a n indication is given of the range of individual doses associated with each type of installa- tion. T o evaluate the total impact of radionuclides released at each stage of the fuel cycle, results are presented in terms of the collective effective dose equivalent commitment per unit quantity of electric energy produced, expressed as man Sv per G W a.
7. The collective dose commitment from nuclear power production is considered in four population groups: the occupationally exposed; the local popula- tion, being those within about 100 kilometres of the site; the regional population, those within about a 1,000 kilometres of the site; a n d the remaining world population. Each stage of the nuclear fuel cycle is treated separately. and the occupational, local and
regional dose commitments are evaluated. The contri- butions from nuclides that, because of a combination of long radioactive half-lives and rapid dispersal in the environment, become globally dispersed and irradiate the world population are then discussed for the fuel cycle as a whole.
8. Collective dose commitments to local and regional populations must be estimated by environmental n~odelling, as the activity concentrations resulting from effluents from nuclear fuel cycle operations are very low both in environmental samples and in the general population. Monitoring of activity concentra- tions due to effluent releases has concentrated on areas immediately surrounding nuclear facilities to ensure compliance with relevant regulations. T o esti- mate collective dose commitments it was decided in the UNSCEAR 1987- Report to establish a model facility at a representative site for each stage of the fuel cycle; mining and milling, fuel fabrication. reactor operation and reprocessing. The envirorlnlent receiving the normalized releases from each model facility was chosen to represent broad averages containing typical features of existing sites and reflecting the most common environn~ental pathways. Such generaliza- tions gave dose commitments indicative of the impact of the overall nuclear power programme though not applicable to any one site. In the UNSCEAR 1982 Report, the collective doses were evaluated for reported discharges at the three operating commercial repro- cessing plants at Sellafield in the United Kingdom and Cap de la Hague and blarcoule in France.
9. The methods used by the Committee for estimating the disoersion of radionuclides released to the atmo- sphere o r hydrosphere and the resulting doses to indi- viduals were described in Annex A of the UNSCEAR 1982 Report. The Committee considers that, in general. these methods and the model facilities and represen- tative sites used in the UNSCEAR 1982 Report are still valid for assessing the current impact of discharges from the fuel cycle. Therefore, in this Annex, the collective effective dose equivalent commitments are obtained by scaling the dosimetric results from the UN SCEAR 1982 Report, allowing for different releases of the various radionuclides involved. The Committee has decided to treat the reprocessing contribution differently in this Report. The hypothetical model facility is not used, but rather, in order to reflect the actual dose contributions made. the normalized dose commitments from the fraction of fuel reprocessed is added to the contributions from the rest of the fuel cycle.
10. Very long-lived nuclides pose a special problem. One example is (half-life: 1.6 10' a), while another is radon gas, which emanates from mill tailings containing I3OTh (half-life: 8 10' a) and '.''U (half-life: 4.5 lo9 a). Assessments of human exposures over such periods of time are clearly hypothetical and the relevance of the results is doubtful. Dose commitments assessed for the purpose of calculating maximum dose rates in the future involve integration over the period of practice leading to the release of the radioactive material. This approach is taken in this Annex for effluents. For the solid waste disposal assessment, it is

in general only possible to assess the collective effective dose equivalent commitment.
11. There have been a number of attempts to generate rigorous definitions of the waste categories generally referred to as low-, intermediate- and high- level wastes [I 131. Although precise definitions have been agreed for particular purposes, the schemes pro- posed have not been universally satisfactory. None the less, the general characteristics of the three waste types are reasonably well established.
12. High-level wastes (HLW) are primarily the spent fuel elements or the solidified Lvaste products from reprocessing. They have high activity concentrations of both actinides and fission products and are significantly heat-generating. As file1 elements are a significant potential source of fissile material, they will usually be stored in the short-to-medium term rather than disposed of. Occasionally, other waste streams with high activity concentrations are also regarded as HLW, but the quantities of activity in them are relatively small.
13. Intermediate-level wastes (ILW) are defined to some extent by exclusion from the other two cate- gories: t h e contain either actinides or long-lived beta/gamma emitters in quantities that are not negli- gible o r substantial activity concentrations of shorter- lived beta/gamma enlitters and are not significantly heat-generating.
14. Low-level wastes (LLW) contain primarily reason- ably short-lived beta/gamnia emitters in low-to- moderate activity concentrations. They may contain actinides or long-lived beta/gamma emitters but only in very small quantities.
15. There will be other categories of materials that are uncontaminated, even though they were generated a t a nuclear site or are of such a low level of activity concentration that they can be exempted from the requirements for storage and disposal as radioactive waste. The rationale for such exemption is that the radiological impact of uncontrolled disposal of these materials is insignificant [I14. N7]. These wastes are not considered part of this study. as their potential for radiological impact is by definition very lo\\ in comparison with that from the other waste categories.
16. In this preliminary assessment of doses fro111 disposed wastes. only LLW and some categories of ILW are considered to be disposed of by shallow land burial. All other Ivastes are stored under conditions such that the doses to members of the public are essentially zero. and doses to occupational workers are included in those assessed for other operations at the same sites.
17. The Committee presented detailed comprehensive revie~vs of occupational exposures. including those from the nuclear fuel cycle, in both the UNSCEAR 1977 Report [U2] and the UNSCEAR 1982 [GI] Report. In this Annes the data on occupational
exposures throughout the nuclear fuel cycle are brought up to date.
18. With regard to assessing occuparional exposures, the relationship between measurements of external irradiation made in radiation fields by film, thermo- luminescent or other personal dosimeters and the absorbed doses in the tissues and organs of the body was discussed in the UNSCEAR 1982 Report. The Committee adopted the convention that all numerical results reported by monitoring services represent the average absorbed dose in the whole body, recognizing that these are almost always readings from the dosimeters that are r e ~ o r t e d . without consideration of the relationships to the absorbed doses in organs and tissues of the body. In this Annex the Committee adopts a similar convention; but to simplify com- parisons, and because most exposures are to penetrat- ing gamma-radiation, the numerical result is taken to represent the effective dose equivalent, Exposures of uranium miners to radon and its daurrhters are also - expressed in terms of effective dose equivalent.
19. The characteristics of occupational dose distri- butions identified by the Committee as of interest were: ( a ) the annual average effective dose equivalent Hefh which is related to the average level of individual risk: this average has generally been calculated for all individuals monitored in a given occupational group; (b) the annual collective effective dose equii.alent, Serf, which is related to the impact of the practice: (c) the collective effective dose equivalent distriburion ratio, defined as the ratio of' the annual collective effective dose equivalent delivered at annual effective dose equivalents exceeding 15 mSv to the total collective effective dose equivalent. This is related to the proportion of workers exposed to higher levels of individual risk. These characteristics may be obtained for any form of the dose distribution, ~vhether or not it exhibits a log-normal o r other defined response over a n part of thc effective dose equivalent range. The collcctivc cffectivr dose equivalent i h usually calculated from collated dosimetry results using the definition
where N , is the number of individuals in the effective dose equivalent range i for tvhich HCil., is the mean annual effective dose equivalent. The annual average effective dose equivalent, R,,,-, is giiten by
where N is the total number of ivorkers monitored.
20. The normalized measure of the impact of the various components of the nuclear fuel cycle is the collective effec~ive dose equivalent per unit electric energy generated. This is calculated as an average o \e r a complete power programme o r over several years to avoid anomalies such as those connected with the shut-down of reactors for maintenance. The results for doses from occupational exposures and to the local. regional, and global populations exposed as a result of effluent discharges to the environment may be taken to be a relative measure of the health impact of nuclear power production.

I. MINING AND MILLING
21. Uranium mining operations involve the removal from the ground of large quantities of ore containing uranium and its daughter products at concentrations between a tenth and a few per cent U,O,. These concentrations are several thousand times the concen- tration of these nuclides in the rest of the natural terrestrial environment. Uranium is mainly mined using underground or open-pit techniques, other methods such as heap leaching accounting for only a few per cent of the world production. The quantities produced during the period 1980-1984 are given in Table 3. Milling operations involve the processing of these large quantities of ore to extract the uranium in a partially refined form, often known as yellow-cake. This is further refined. converted and enriched, iS necessary. before fabrication into fuel elements. Uranium mills tend to be located near mines to minimize transporta- tion. The number of mills operating is related to uranium demand.
A. EFFLUENTS
22. The predominant gaseous effluent from active uranium mines is ?::Rn in the ventilation air from underground mines or released into the pit from surface mines. In a study covering 27 mines [J2] this accounted for 9 7 4 of the radon released. A recent study [N5] has also shown that for some surface mines. especially where a large volume of overburden has to be removed to expose the ore, waste rock piles formed a source of radon of a magnitude con~parable to that of the pit. Release rates per unit inass of ore were estimated in the UNSCEAR 1982 Report at about 1 GBq I - I from underground mines and about 0. I GBq t-' from surface mines. In general, however, the ore from underground mines was estimated to have about 10 times the uranium concentration of that from surface mines; the normalized radon emission was thus taken for both types to be 1 GHq t - I of ore for I%, uranium oxide in the ore. Particulates in airborne dust contain ""1 and its daugh~ers and sometimes "'Th and its daughters.
23. The results of measurements o r estimates of either total radon emission rates o r normalized radon emission from a number of mines are given in Table 4. The data for underground mines relate to the ventila- tion air from the shaft, those for surface mines. to the mine pit. The results support retention of an overall normalized radon emission of I GBq t-' of ore for Iq uranium oxide in the ore.
23. The uranium requlrements per unit elcctrlc energ) generated vary someu.hat between current designs of thermal reactors: but the heavy metal requlrements are generall) in the range of 150-250 t (GW' a ) I . The grade of ore mined at present is usually betueen 0.1 a n d 1% U:O,. Taking a typical value for underground mines from the United States of 0.2% [El], the normalized radon releases are about 70 TBq (GU' a)-' . This is the same value that was estin~ated in the UNSCEAR 1982 Report.
25. The processing of uranium at the mill was described in the UNSCEAR 1982 Report, as were the broad characteristics of the tailings piles, where most of the activity not extracted as usable uranium resides. This activity is predominantly ?j0T'h and its daughters. There are airborne emissions during operation of a mill. mainly of :?:Rn together with :3wU. :jOTh. 22bRa and ?I0Pb. The ranges of airborne release rates for a typical mill estimated in the UNSCEAR 1982 Report are shown in Table 5.
26. During operation of a mine. there are stockpiles of ore and piles of sub-ore. overburden and waste rock. After closure there will typically be a pile of overburden, possibly covered by sub-ore, in case processing of this becomes economically viable in the future. These also act as sources of airborne emissions. principally of Z22Rn. An estimate of the radon emana- tion rate from waste rock per 1% ore grade in the United States is 100 Bq m-Z s-' [N4]. The number of inactive mines in the United States was estimated to be about 1,250 surface and 2,000 underground in 1980 [H9]. Some useful measurements have been made of radon emanation rates under d n conditions over a wide range of ore grades in the Northern Territory of Australia [L2. M5]. These suggest that a radon exhalation rate of 50 Bq m-I s-I per 1% ore grade is widely applicable: this figure is equivalent to 0.5 Bq m-' s-I per Bq g-I.
27. Extraction of uranium during milling is clearly made as con~plete a s possible but cannot reach 100%. Typically, the residual tailings from the mill will contain from 0.001 to 0.01% U,O,. depending on the grade of ore and the extraction process. Tailings are discharged from mills into impoundmenrs, the charac- teristics of which depend on the local climate and geology [TI]. From the point of view of estimating effluents, the major differences are whether the tailings pile is wet or d r j and whether i t has been covered. All tailings piles act as sources of airborne releases, although if they are completely covered by water, the rates can be e\tremely I O N . Estimates of radon emanation for a number of typical mill tailings areas and impoundments are shown in Table 6. Most of these are taken from an extensive study by the Nuclear Energy Agency (NEA) [NS]. The radon exhalation rate per unit area and specific activity of ?IbRa was estimated in the UNSCEAR 1982 Report at about 1 Bq m-: s-I per Bq g-I of ??"Ra in the tailings, although it Has noted that the rate could vary from effectively zero to an order of magnitude higher than the above figure. I t has been suggested that a more realistic figure \vould be 0.2-0.5 Bq m-' s-I per Bq g-' [S12]. For comparison, 0.015 U,O, ore contains approxi- mately I Bq g-' of "bRa. Detailed measurements have been carried out on seven tailings dams in South Africa [A7]. giving a mean radon exhalation rate of 0.4 Bq n ~ - : s- ' per Bq g-I for a radium concentration ranging from 0.2 to 0.7 Bq g-I. Measurements on tailings in the Elliot Lake area of Canada [B26] sho\ved a range from 0.2 to 7.6 Bq m-' s-I per Bq g-I. Experimental investigations on t u o types of bare dry tailings in Australia [S13] showed exhalation rates from 0.3 to 0.7 Bq m-2 s-I per Bq g-I; these were reduced by a factor of 3 for 1 m dry cover and by more than a factor of I O for 1 m moist cover.

28. In considering the longer-term impact of effluents from tailings piles. i t must be assumed that activity concentrations from uranium nuclides remain prac- tically constant indefinitely, due to their long half- lives. The rest of the activity in the tailings is dominated by :'OTh, which has a half-life of 80,000 a. The radionuclides in the decay chain from Z30Th with the greatest radiological significance are '26Ra, which can be leached out by water access, 2'0Pb and 222Rn, which can escape into the air.
29. At present, tailings have tended to be kept in open. uncontained piles or behind engineered dams or dikes with solid or water cover. I t is- likely, however. that some further engineering will be carried out to minimize the release of radionuclides from the aban- doned piles. Such techniques were analysed in the NEA study [N5] for a number of sites. The radon flux density varied by factors of more than lo6. dependent on the treatment assumed, showing that this is clearly a crucial parameter in the assessment of the impact of tailings piles. The options assumed for one typical site in an arid region and the relative radon flux densities assumed to result are shown in Table 7. Similar reductions in radon emission have been found using covers of various types [H 101. Assuming some reason- ably impermeable cover is used, the radon exhalation rate from a typical tailings pile is taken to be 10"q m-' a-I. This is less than the figure assumed for emanation from the unstabilized material stockpiled around working mines and comparable with the value expected to be achieved in the United States [E4]. The cover is assumed to provide some protection against erosion. s o that the radon exhalation rate remains essentially constant with time. Otherwise. an increase of u p to double the initial rate of emanation from a bare pile could have been expected over a period of about lo4 years [N5]. As can be seen from the results of the UNSCEAR 1977 and UNSCEAR 1982 Reports, these are critical assumptions in determining the overall impact of the fuel cycle.
30. Mine and mill sites in dry areas give rise to effectively no liquid effluents. For those in wet climates. however, run-off water will contain radio- nuclides and may need trealrnent before release into watercourses. The most important radionuclide in liquid effluents is 226Ra. and typical releases at wet sites were estimated in the UNSCEAR 1982 Report to be 1 GBq (GW a)-'. A review by Kaufmann [K5] suggests values of the order of 0.1 GBq ( G W a)-' , given normal procedures for water treatment.
B. LOCAL AND REGIONAL COLLECTIVE DOSE COMMITMENTS
31. In the dose estimation procedure used in the UNSCEAR 1982 Report, the typical characteristics of a mine and mill site in terms of population density, rainfall, farming, etc. were first established. The population densities used were 3 k m 2 for 0-100 km and 25 km-' for 100-2.000 km. A deposition velocity of
rn s-I was taken for particulate releases. The collective dose for radon release was then calculated using an atmospheric dispersion model with charac-
trristics typical of a semi-arid area and an effective release height of 10 m. The atmospheric dispersion model was described in the UNSCEAR 1982 Report and in the original reference [CI]. The resultant collective effective dose equivalent commitments per unit activity released are shown in Table 8. with the exception of the figure for radon. This has been reduced for the reasons discussed in Annex A which have led to a reduction in the dosimetric coefficient for outdoor air from 17 to 9 nSv h-' per Bq m-'. These figures have been used in this Annex to estimate the normalized collective effective dose equivalent conlmitnlents from current atmospheric releases which is about 0.3 man Sv ( G W a)-'. The doses from liquid effluents are negligible by comparison.
32. Using the figure estimated for the ini~ial rate of exhalation of radon from a typical tailing pile leads to an annual release of about 1 TBq ha-'. The propuc- tion of a mine generates about 1 ha ( G W a)- ' ' of tailings, so the releases during a period of five years, corresponding to the duration taken for the current discharge, would add a normalized collective effective dose equivalent commitment of 0. I man Sv (GW a)-'. The rate of release as a function of' time is assumed to be constant, and given the very long duration of the source. the normalized collective effective dose equi- valent commitment is proportional to the duration considered reasonable for assuming the release. Taking this period to be lo4 years for the sake of illustration, the result is an estimated 150 man Sv (GW a)-'. An alternative perspective on this component can be obtained by assessing the truncated collective effective dose equivalent commitments up to different times. Some examples of the results of such calculations for the various coverings described in Table 7 are shown in Table 9, taken from the same study [N5].
C. OCCUPATIONAL EXPOSURES
33. The main source of radiation exposure of under- ground uranium miners is radon and its daughters. The annual average exposure of underground miners was taken to be 1.5 WLM in the UNSCEAR 1982 Report; this was converted to an annual effective dose equivalent of about 13 mSv. Surface miners have a lower exposure to radon and daughters, with annual doses estimated to be about 3-4 mSv, but they and underground miners are exposed through inhalation of dust containing uranium and its daughters. Both underground and surface miners are also exposed to some external gamma radiation. The estimate of annual doses for underground miners was rather broad in the UNSCEAR 1982 Report, 1-10 mSv; that for surface miners was taken to be 1-2 mSv. Where the authors have not carried out their own conversions, use has been made of the conversion coefficients given by the International Commission on Radiological Protection [I121 between committed effective dose equivalent and time integrated equilibrium equivalent radon daughter concentration in air of 17 nSv h-' per Bq m-' o r 10 mSv WLM-I, where 1 WLM is one working month (170 ha) of exposure to a potential alpha-energy concentration of 2.08 lo-' J m-' [IIO].

34. Exposure of uranium miners to radon and daughters has been monitored by a combination of measurement of levels in air at a variety of places through the mine and estimates of the time spent by miners in those places. In recent years, however, there has been considerable development work on dosi- meters suitable for monitoring of radon daughter exposures for individual underground uranium miners. Some recent results for underground uranium miners are shown in Table 10. The United States data for 1980, assumed to be primarily for underground miners. are from a very general summary prepared by the Environmental Protection Agency [E3]; those for 198 1 and 1982 relate only to the mines in New Mexico [SS]. The data for Canada (A41 include exposures at the uranium mills associated with the mines. Data can be clearly separated into underground and a surface mine for the Canadian mines, and the results for the surface mine at Key Lake [A41 are shown in Table 11. A comparison between mine company records and exposures based on measurements by inspectors for 1979 and 1980 in the United States showed reasonable agreement [C7]. In this study the annual average effective dose equivalent to underground workers in 61 mines from exposure to radon and daughters was estimated to be in the range of 18-29 mSv, depending on the assumptions made in deducing the personnel exposures from the measurements in working areas. This is somewhat higher than the estimates given in Table 10.
35. Information on gamma exposures to workers in both underground and open pit mines in Canada [A41 shows annual average effective dose equivalents ranging from 0.1 to 3.4 mSv for the years 198 1-1983. Some underground mines showed average gamma doses as low as for surface mines, but the major underground mines employing more than 80% of the work-force had an annual average effective dose equivalent of 3 mSv. An estimate of 3 mSv as the annual average effective dose equivalent from inhalation of dust has also been made for the Ranger surface mine in Australia [A8].
36. Taking all the above information into account, the average annual effective dose equivalent to under- ground uranium miners from both external exposure and radon daughter exposure is 10-12 mSv; that for surface miners is lower, possibly around 5 mSv. Given the predominance of underground miners. an overall annual average of 10 mSv seems a reasonable estimate for the early 1980s. Taking the productivity to be 3 t a-! of natural uranium per miner and a natural uranium requirement of about 200 t (GW a)-'. the normalized collective effective dose equivalent would be 0.7 man Sv ( G W a)- ' . This is comparable to the estimate in the UNSCEAR 1982 Report of 0.9 man Sv (GW a)- ' , which was rounded up to I man Sv (GW a)-'.
37. Recent data on doses received by 3.000 workers at uranium mills in the United States show an annual average effective dose equivalent of 2.7 mSv [E3]. The external average effective dose equivalent to 13 1 workers a t the Nabarlek mill in Australia during the period 198 1-1982 was 1.5 mSv [M9] and at the Ranger mill during the period 1985-1986 as low as 0.9 mSv [A8].
The contribution from workers at mills to the collec- tive effective dose equivalent per unit electric energy generated is so small that in the UNSCEAR 1982 Report it was not included as a separate item. This situation does not appear to have changed.
11. URANIUM FUEL FABRICATION
38. The uranium ore concentrate produced at the mills is further processed and purified and converted to uranium tetrafluoride (UF,), and then to uranium hexafluoride (UF,), if it is to be enriched in the isotope 215U. before being converted into uranium oxide or metal and fabricated into fuel elements. Natural uranium, containing 0.7% :3SU, is used in graphite o r heavy water moderated reactors. Enrich- ments of 2-5% are required for light ivater reactors (LWRs) and advanced gas cooled reactors (AGRs).
39. T o produce natural uranium metal fuel, the uranium tetrafluoride is compressed with shredded magnesium and heated. and the resulting reduced uranium is cast into rods that are machined and inserted into cans. Natural uranium oxide is sintered into pellets and clad in zirconium alloy for HWR fuel pins. For LWR and AGR fuel, the UF, is converted into the gaseous form UF,. The first type of enrich- ment piant to be developed con~n~ercially employed the gaseous diffusion process. In this, the UF, diffuses through a porous membrane, the lighter compound containing 235U and 'j4U diffusing more rapidly than the heavier compound containing 238U. Partial separa- tion occurs, but in practice many stages of such membranes are required in series to provide a cascade.
40. The pumping power required to mo\-e the UF, through the cascade requires a large amount of electric energy. The alternative gas centrifuge process consumes only about 5% of the electric energy demanded by the diffusion process. The gas centrifuge process is based on the separation effect on a mixture of UF, isotopes in a strong centrifugal field in a rotating cylinder, suitably combined with the cascading effect of counter-current circulation. More separation is attained in one centrifuge stage than one diffusion stage but. as the mass flow is less, a series-parallel configuration is required.
41. T o fabricate LWR fuel the enriched UF, is converted to the oxide (UO,) powder, which is granulated, sintered and pressed into pellets. These are inserted into tubes (cladding) that are sealed after being filled with pellets. For LWR fuel cans zirconium alloy is used, while for AGRs stainless steel cans are adopted. After the enrichment process, large quanti- ties of depleted uranium remain, containing about 0.3% or more 'I". This uranium would become a source of public exposure were it to be disposed of, but currently it is stored for possible use in breeder reactors and for other purposes. The solid wastes arising during operation of the uranium fuel fabrica- tion facilities will contain the same radionuclides as those at uranium mines and mills, but will be trivial in quantity by comparison. It does not, therefore, seem worth while to assess their impact separately.

A. EFFLUENTS B. LOCAL A N D REGIONAL COLLECTIVE DOSE COMMITMENTS
42. Emissions of radionuclides from the conversion, enrichment and fuel fabrication processes are generally small. Most of the uranium compounds are solid and are easily removed from airborne effluent streams, while settling tanks are used to reduce liquid effluent discharges. Few data published in the United States o r Europe give discharge rates of radionuclides from these fuel cycle facilities. The Committee concluded in the UNSCEAR 1982 Report that discharges lipere small and estimated releases from model facilities producing LU'R fuel. In the United Kingdom, reported discharges are given in terms of total alpha, total beta activity and masses of uranium (Table 12). and some isotopic breakdown can be obtained [G2] for centri- fuge enrichment plant effluents. Most of the beta- discharges are from the short-lived :'"Pa (half-life: 1.17 min) which is separated with "'Th (half-life: 24.1 dl. Canadian data-are also available for effluents from a conversion plant [A4, LI] with their isotopic composition [XII]. There are small releases of "Tc reported from the British enrichment plant. indicating some recycling of reprocessed uranium, but these releases are atypical and no dose assessment has been made.
43. The data presented in Table I? have been used to obtain the effluent releases which are applied to the same model facility sited on a river as tias used in the UNSCEAR 1982 Report. The normalized releases are based on an LWR cycle uranium requirement of 150 t (GW a)- ' and an HLVR cycle requiren~ent of 170 I
( G W a)- ' . The results are given in Table 13 for atmospheric and aquatic effluents. The conversion plant figures are based on data from Canada [MZ]. as are those for fabrication. since these relate to fresh- water discharges in contrast to the British figures. which relate to marine discharges. The values quoted in Table 13 are typical figures taken from those calculated for the five Canadian fabrication plants, based on a fuel cycle requirement of 170 t IGW a)-'. The discharges of L34Th are obtained by assuming that this radionuclide is in equilibrium with ?"U.
44. The results in Table 13. which were derived from reported discharges, can be compared H ith the effluents from the model facilities quoted in the UNSCE.AR 1982 Report. which were based mainly on the notional results produced by the Environmental Protection Agency [E2]. The results using present data suggest that for conversion, atmospheric releases are generally about twice those quoted prc\ iously for uranium and thorium isotopes, white aq~la t ic releases as reported are about 10% of those assumed previously, and in the case of IZbRa are only 1'3 of that in the Environmental Protection Agency model facility assumed pre~~iously. Atmospheric releases from enrichment are about one half of those quoted in the UNSCEAR 1982 Report: liquid effluents are only a few per cent of the Committee's previous estimates. For fuel fabrication. based on a weighted average of natural and enriched fuels, the atmospheric and aquatic releases are again about one half the previously assumed values.
45. The Committee concluded in the UNSCEAR 1982 Report that releases to the atmosphere provided the major exposure to the population (over 90%) from fuel conversion, enrichment and fabrication processes. To obtain an order of magnitude assessment of the collective dose commitments, the Committee specified a model facility with a constant population density of 25 km-2 out to 2.000 km. This was chosen to be representative of North America and Europe, and collective dose commitments were derived for inhala- tion from the plume, ingestion of foodstuffs conta- minated by activity deposited from the plume and by external irradiation from the activity deposited on the ground. The same results have been used here. but the collective effective dose equivalent commitments have been scaled for the normalized releases derived in Table 13; the resultant doses are given in Table 14. The most significant pathway of exposure coniinues to be inhalation of particulate activity, with radon daughters contributing about 15% of the dose.
46. In summary, the normalized collective effective dose equivalent commitment due to uranium fuel fabrication is estimated to be 2.8 10-j man Sv ( G W a)-'. The main contribution arises froni inhalation of the isotopes of uranium. The figure is similar to that derived in the UNSCEAR 1982 Report [2.0 10-'man Sv ( G W a)-']. Individual doses in the vicinity of fuel fabrication facilities are estimated to be less than 50 mSv per year for members of the public [B I . B2, B3. BX. B 16, 13291.
C. OCCUPATIONAL EXPOSURES
37. The annual average effective dose equivalents to workers in fuel fabrication plants were found in the UNSCEAR 1982 Report to be generally low. ranging from 0.3 to 3 mSv. The annual collective effective dose equi\~alcnt distribution ratio (see paragraph 19) \vas also in general small. often approaching zero. Data on the number of workers employed and the correspond- ing annual average individual and collective effective dose equivalents are given for some countries in Table 15. These are not always complete for a c o u n t r - for any particular year and could include workers not strictly employed in fuel fabrication. For example. the data from the United States [N2] are quoted as corresponding to fabrication and reprocessing. but i t has been assumed that the contribution from repro- cessing in the years 1980 and 1981 tvas negligible: the data for the United Kingdom [H8, RI?] include exposures during enrichment. Annual average doses to fuel fabrication workers have remained lour, in the range of 1-2 mSv. The collective effective dose equi- valent distribution ratio t i ) r Uni~cd Stales u.orkers. \vhich was 0.12 in 1980, decreased to 0.09 in 1981 [N2]: that for British \vorkers was 0 in 1982 and 0.02 in 1983 [ B 121; that for Japanese workers \\'as 0 in the period 198 1 - 1984 [TI 21.
48. Some data on the external doses from the fabrication of plutonium fuel at the PNC works in

Japan have been published [A5]. These are shown in Table 16. During the period 1977-1982 the total amount of fuel fabricated was 37.6 t for an advanced HWR and 1.2 t for an FBR. From 1980 to 1982. it was necessary to process reactor grade plutonium recovered from high burn-up fuel, and this led to an increase in both average and collective doses to the work-force.
49. The estimates of normalized collective effective dose equivalent in the UNSCEAR 1982 Report were considerably reduced from previous estimates; the overall figure estimated to be 1 man Sv (G\i: a)-'. More recent estimates are shown in Table 15. The normalized collective effective dose equivalents for Canada and the United Kingdom were obtained by directly relating the collective dose in a year to the electric energy generated in the year [I3. 14. 15. 161. as seems appropriate for nuclear power programmes in an approximatel> equilibrium situation. For the United Stares the same assumption is made as in the UNSCEAR 1982 Report; 604; of the fuel Fabricated is for United States nuclear power stations. For Japan. figures for 1981-1984 are used [J3], and these have been tentatively related to the total electric energy generated in the corresponding years by nuclear power. Giving appropriate weight to more recent data, a n overall average of 0.5 man Sv ( G W a)-I now seems more appropriate.
111. REACTOR OPERATION
50. Nearl! all the electric energy generated by nuclear power is produced in thermal reactors in which the fast neutrons produced by the fission process are slowed down to thermal energies by use of a moderator. The most common materials still used for moderators are light ivater. heavy water and graphite. The choice of moderator and coolant. light o r heavy water or carbon dioxide gas. greatly affects the design. size and heat reniotal system of the reactor.
51. The uranium fuel is contained in discrete pins, both to prevent leakage of the radioactive fission products into the coolant circuit and to improve neutron economy by reducing parasitic neutron captures in the resonance neutron energy region of '-'WU. The heat generated in the fuel pins by the slowing down of the fission fragments is removed by forced con\.ection. the most usual coolants being light o r heal! \yarer or carbon dioxide gas. In the case of fast reactors. the neutrons are not modcrated and induce fissions \vith energies close to those at which they are produced. The usual heat removal system is liquid sodium. which is a good heat transfer medium and does not greatly moderate the neutrons.
.I\. EFFLUENTS
52. During the production of power by a nuclear reactor. radioactive fission products are formed within the fuel, and neutron activation produces radioactive
components in structural and cladding materials. Radionuclides are formed in the coolant circuit because the coolant becomes activated, because of the diffusion of fission product elements with radioactive isotopes from the small fraction of the fuel with defective cladding, and because of the corrosion of structural and cladding materials anywhere in the coolant circuit which leads to particles being carried through the core and becoming activated. All reactors have treatment systems for the removal of radio- nuclides from gaseous and liquid wastes. which arise from leakage out of the core or from clean-up of the coolant.
53. The quantities of different radioactive materials discharged~from reactors depend on the reactor type. its design and the specific waste treatment plant installed. Radionuclides discharged to atmosphere include fission noble gases (krypton and xenon), activation gases ( I T , IbN, '%, 41Ar). tritium. iodine and particulates. Radionuclides released into the aquatic environment in liquid effluents usually include tritium, fission products and activated corrosion products. The discharge data for the years 1980-1985 are presented in this section, and the annual normalized releases are evaluated for each reactor type and averaged over all reactors of each type as TBq ( G W a)-' . Normalized results are not presented for individual sites because releases in any one year may reflect a need for maintenance or irregular procedures which are the culmination of a number of vears of previous operation. The total releases of radionuclides between 1980 and 1984 have been normalized by dividing by the total electric energy generated ( G W a ) over the same period. These normalized releases are used to assess collective dose commitments because the 1985 data were incomplete. Generally, the nor- malized releases for 1985 from the ~ a r t i a l data lead to lower values than for the previous five years. although the 1980-1985 averages are mostly within 10% of the 1980- 1984 averages.
1. Fission noble gases
54. At least nine identified radioactive isotopes of krypton and 1 1 of xenon are formed during fission. htosr have half-lives of minutes or seconds and decay before they migrate significantly in the fuel. A fraction of the noble gas inventory of the fuel pins diffuses to the fret: space between the fuel and the cladding, leading to a build-up of gas pressure. The presence of noble gases in the coolant circuit is generally an indication of fuel cladding failure.
55. Table 17 lists tlie reported discharges of noble gases irom PWRs. The releases span many orders of magnitude partly because of the design of newer plants and partly because of the need for irregular operations and maintenance. Thus, the normalized releases presented are averaged over all PWR electric energy production from 1980 to 1984. Short-lived noble gases only appear in PWR effluents because of leakages in the primary water pressure circuit. Gaseous wastes can also arise from the condenser exhaust on the steam circuit and from blow-downs or contain-

ment purges. These wastes are usually held under pressure in delay tanks to allow decay of short-lived isotopes before release. The isotopic composition of noble gases released from PWRs in the United States in 1982 is shown in Table 18. Comprehensive data are available for each year from United States reactors; and data available from other countries are similar to those from the United States. The data for the United States for 1982 are therefore assumed to be represen- tative of the isotopic con~posit ion of releases between 1980 and 1984 and are used for dose estimation.
56. Data for 1985 are incomplere and the releases are not inclgded in the nornlalized set. The normalized releases seem to have remained fairly steady over the five-year period 1980-1984, but the average of 218 -t 40 TBq (GW a)- ' appears to be about half of the value reported previously by the Committee [430 TBq ( G W a)-']. Xenon-1 33 accounted for 75% of the discharge and Ij5Xe for 13%. In the UNSCEAR 1982 Report the comparable figures were 85% and 5%. respectively. Some of the reduction in discharges is thought to be due to better fuel can performance. which would account for the lower releases to cooling water. The other feature is the inclusion of' neuer reactors wilh lower levels of discharge.
57. Reported discharges of noble gases from BUrRs are shown in Table 19. The releases vary by six orders of magnitude, although the average releases continue to have been reduced from previous years. The normalized releases are shown in Table 19 for all BWRs from 1980 to 1985. The main source of noble gas release from BWRs is gases in the steam circuit that are continuously removed by the main condenser air-ejector system. The isotopic composition depends on the hold-up time, which is usually less than for PWRs, thus allowing more short-lived isotopes to be released. Table 20 gives the radionuclide composition of noble gas releases from. United States BWRs in 1982, which is similar to that of reactors in other countries. These figures again are taken to be repre- sentative of BWR releases in all countries during the period 1980- 1983 and are used for dose assessment.
58. For BWRs the average discharge rate for noble gases during the five-year period 1980-1984 is 2,150 f 520 TBq (GW a)-! compared with 8.800 TBq (GW a)-' reported in the UNSCEAR 1977 Report for 1975-1979. This reduction seems to have been achieved because of significant reductions in releases from those reactors that previously had the highest dis- charge rates. The normalized release for 1985 is significantly lower (460 TBq (GW a)-!), partly because of the missing data but mainly because of very large reductions in discharges from the largest previous sources (Browns Ferry and Brunswick). The isotopic composition shown in Table 20 reveals that most of the activity consists of 68Kr (half-life: 2.8 h), IJ3Xe (half-life: 5.3 d), I3'Xe (half-life: 9.2 h) and 'j6Xe (half- life: 17 min) in almost equal quantities.
59. In GCRs, noble gas releases are insignificant compared with activation gases. Magnox reactors, AGRs, LWGRs and HWRs utilize on-load refuelling and, in the event of fuel element failure, fuel rods can
be replaced. Releases of noble gases from HWRs a n d LWGRs are given in Table 21. Normalized release for HWRs has been 212 + 48 TBq (GW a)-' . similar to that for PWRs. The highest figures are for LWGRs at 5,470 + 1.370 TBq (GW a)-I, about three times the figures for BWRs. The available discharge data indicate that FBRs have lower releases of noble gases: measurements at BN-350. an FBR in the USSR. indicate 65-130 TBq ( G W a)-' [P6].
2. Activation gases
60. Although GCRs d o not generally release fission noble gases, several gases are formed during gas cooled reactor operation. These are primarily "Ar. formed by activation of the stable argon in air. and ''S produced from sulphur and chlorine impurities in the graphite core. The discharge data for "Ar are reported in Table 22. For " S . measurements were made in the United Kingdom at Hinkley B, Oldbury and Wyifa [HI , H2], and discharges have consistently averaged 0.2 TBq (GW a)-I with only about 20% variation around the mean.
61. The quantity of "Ar (half-life: 1.8 h ) released depends upon the detailed design of the reactor. For early Magnox reactors having steel pressure vessels, the principal source of 41Ar is the activation of stable argon in the air used as cooling air around the outside of the pressure vessel. For advanced reactors with prestressed concrete pressure vessels, the principal source of "Ar is leakage of the coolant CO,, which contains small amounts of air, to the atmosphere. The normalized releases from AGRs are 5-15'2 of the values for Magnox reactors. The average normalized release from GCRs is 2,320 + 220 TBq (GW a)-I compared to 3,240 TBq (GW a)-I in the UNSCEAR 1982 Report. The reduction is due to the proportion of power now generated by AGRs and addition of French data. For BN-350, the Soviet FBR, normalized 'IAr releases average 470 TBq ( G W a)-! [K4. P6].
62. Nitrogen-16 (half-life: 7 s) causes direct external radiation at nuclear power plants. The photons pro- duced in its decay have energies of 6.1 and 7.1 MeV. In BWRs, the I6N generated in the coolant water is transferred in the steam to the turbine buildings. Direct radiation from gas ducts in steel pressure vessel gas cooled reactors produces the major dose to individuals close to those sites.
3. Tritium
63. In LWRs tritium arises from ternary fission in the nuclear fuel and from the neutron activation of lithium and boron isotopes dissolved in, or in contact with. the primary coolant. The Committee assessed in the UNSCEAR 1982 Report the tritium production rate from ternary fission as 0.75 PBq (GW a)-'. Tritium generation from activation reactions in PWRs seems to result mainly from boron, which is used for reactivity control, in the coolant, whereas in BWRs it results mainly from boron in control rods. In GCRs it is the result of lithium impurities in the graphite and

the presence of water vapour in the core. For HWRs it is principally the result of the activation of the deuterium moderator and coolant. The activation production rate only exceeds that from ternary fission in HWRs, where the activation rate was previously estimated by the Committee to be 30 times higher at about 25 PBq (GW a)-'.
64. Table 23 presents the tritium releases to the atmosphere for 1980-1985 for PWRs. BWRs and HWRs. For PWRs the normalized release over the five-year period 1980- 1984 is 5.9 f 2.4 TBq (GM' a)-' and no particular trend is apparent over this period. The corresponding figure was 7.8 TBq ( G W a)-' for 1975- 1979. The BWR releases normalized for the same period average 3.4 + 1.6 TBq ( G W a)-', compared with 3.4 TBq (GM' a)-' for 1975-1979. The decrease in annual BWR normalized releases from 1980 to 1984 seems primarily attributable to reductions from the Dresden nuclear plant alone. while the higher figure for 1985 is due to Hatch 1. These figures indicate that about 1% of the tritium produced in the fuel of LWRs finds its way into the coolant and then enters airborne effluent streams. For HWRs the production of tritium in the moderator is the most probable source of tritium releases, which averaged 670 f 190 TBq (GW a)-' for 1980-1984, as compared with 540 TBq (GW a)-' for 1975-1979. For some HWRs. however, the coolant may be the main source of tritium production. There is little release of tritium to the atmosphere from Magnox gas cooled reactors mainly because humidriers remove water vapour from the gas circuit. There is some release of tritium to the atmosphere from AGRs, and the normalized release is 5.4 f 0.9 TBq (GW a)-' , similar to LWR releases.
65. From Table 24 it can be seen that releases of tritium to the hydrosphere from PWRs have been fairly constant over the past five years, and the 1980- 1984 normalized average is 27 2 1.8 TBq (GW a)-', with the figure for 1985 similar. This compares to the 38 TBq (GW a)-' obtained for 1975- 1979. The compar- able figures for BWRs are 2.1 f 0.5 TBq (GW a)- ' for 1980-1984, which is 50% higher than the 1.4TBq ( G W a)-' for 1975-1979 and no trend is apparent. For GCRs the normalized release to surface waters is 96 f 13 TBq (GW a)-', which contrasts with 25 TBq (GW a)-' for 1975-1979. There appears to have been a significant increase in tritium releases from GCRs over the past five years. HWR releases in liquid effluent streams averaged 290 2 68 TBq (GW a)-' for 1980-1984, compared with 35OTBq ( G W a)-I for 1975-1979. LWGRs have low liquid releases at 1.7 TBq (G W a)-'.
66. Thus, about 0.3% of BWR tritium production appears in liquid effluents, with a similar amount going to the atmosphere. For PWRs about 3% of the tritium produced is in liquid effluents. about five times more than that going to the atmosphere. For HWRs liquid effluents are about one half those discharged to the atmosphere.
67. For PWRs and LWGRs in the USSR the atmospheric releases of tritium are reported to average 7.4 TBq (GW a)-' and 1.9 TBq ( G W a)-I, respectively,
[B6, V4]. similar to other PWRs and AGRs. The liquid discharges amount to about 5 TBq ( G W a)-' and 1 TBq (GW a)-' for PWRs and LWGRs, respec- tively [B6, P6. V4]. Measurements indicated that on average 90% of the atmospheric releases of tritium was in oxide form [B6]. Practical experience a t the Novovoronezh APS (PWR) showed that it is possible to reduce the tritium concentration in the coolant water by 50% [B7].
68. Discharges of ''C are of interest because of its long half-life (5.730 a) and contribution to collective dose commitments. Estimates of "C production in fuels depend o n the nitrogen level in the fuel can, although some is produced from reactions o n oxygen in oxide fuels. The Committee concluded in the UNSCEAR 1982 Report that the normalized produc- tion rate within fuel for PWRs. BWRs. GCRs a n d HWRs was close to I TBq (GW a)-'. Little of this is released into the reactor coolant circuits, it appears to be released during reprocessing [BI, B2, B3, 88. B16, B291. Carbon-14 is produced in the moderators of all reactors, production in H WRs being perhaps 100 times greater than in LWRs or GCRs, because of the ''0 (n, a) 14C reaction in the greater mass of oxygen in the moderator, and there is a consequential release.
69. The National Council on Radiation Protection and Measurements (NCRP) [NI] has estimated the production rate of I4C in PWRs to be between 2 and 3 TBq (GW a)- ' , and for BWRs 3-4 TBq (GW a)-'. arising in both cases mainly in stainless steel a n d zirconium alloy. For the estimation of release rates to the environment, NCRP assumes that the "C formed in the hardware remains there. but that the fraction formed in dissolved nitrogen in the cooling water is totally released. The NCRP estimate for PM'Rs is 370 GBq ( G W a)- ' and for BWRs 220 GBq ( G W a)-L. The NCRP estimate of the release of "C to the environment for FBRs is essentially zero a t the reactor.
70. Environmental discharges of I4C are not routinely reported for all reactors. The data summarized in Table 25 are from a series of measurements made in Argentina, the Federal Republic of Germany, Finland, and USSR. For BWRs it appears that essentially all the "C appears a s carbon dioxide, and the normalized release rate for 1980- 1984 is 330 f 1 10 GBq ( G W a)-'. significantly less than the Committee's estimate in the UNSCEAR 1982 Report of 520 GBq (GW a)-'. Fo r PWRs in the Federal Republic of Germany [Wl], Finland [B17] and the USSR [RI], the data indicate a release rate of 345 f 80 GBq (GW a)-', which is signi- ficantly higher than the figure of 220 GBq ( G W a)-' given in the UNSCEAR 1982 Report. For PWRs only about 5 5 0 % of the emission appears as CO,. It now appears that normalized I4C releases from PWRs and BWRs are similar.
71. In recent measurements at three LWRs in the United States [K2], two PWRs emitted an average of 390 GBq (GW a)-'. The source of I4C was different a t

the two sites: the first had 42% arising from venting of gas decay tanks, 35% from auxiliary building ventila- tion and 32% from containment venting: the second had emissions resulting primarily from pressure relief venting and purging of the containment air, with only 7% from venting of gas decay tanks. For the BWR, the discharge rate was 460 GBq (GW a)-' with 97% of the release via the off-gas discharge, which was 95% I4CO,. For the PWR 94% of the discharge was "CH,. The I4C content of liquid and solid wastes was less than 5% of the aerial discharge for all reactors.
72. Measurements at LWGRs in the USSR gave average releases of 1.3 TBq (GW a)-I [RI]. In the United Kingdom, reported releases were 0.74 TBq (G W a)-' from Magnox reactors and 1.9 TBq (G W a)-' from AGRs. Weighted by energy production, the normalized IJC release for GCRs is 1.1 TBq (GW a)-I [H8]. The main source of IT releases from GCRs is the leakage of the primary coolant, at a rate typically of a few per cent per day, which contains radionuclides released to the coolant by corrosion of the graphite moderator.
73. For HWRs it has been reported that a significant fraction of the inventory formed in the moderator can be released to atmosphere. Measurements at Atucha I [B 18, 031, however, for 1983-1985 have indicated that releases are significantly lower than previously calcu- lated for 1980-1982. The five-year normalized release is 6.3 + 3.3 TBq (GW a)-', whereas the Committee had estimated 17 TBq (GW a)-' in the UNSCEAR 1982 Report. The form is again variable, between 40 and 80% being reported as CO,. In Argentina, regular monitoring of discharges of lJC has continued for several years so that more reliable estimates can be made.
5. Iodine
74. The volatile element iodine is produced by the fission process, the isotopes of radiological interest being "'1 (half-life: 1.6 10' a), "'1 (half-life: 8.04 d), l3'I (half-life: 2.3 h) . 'j31 (half-life: 21 h). :"I (half-life: 53 m) and 'j51 (half-life: 6.6 h). Because. apart from Iz9I, the iodine isotopes have such short half-lives, equilibrium activity concentrations in the fuel are reached quickly and releases depend on the number of fuel cladding failures and the coolant leakage rate. Iodine has been studied for many years in view of its mobility in the environment and selective thyroid irradiation. Because of its long half-life, I z Y I is of interest in evaluating collective dose commitments; however, its release from reactors is very small and often not reported. Most of Iz9I in fuel is released during reprocessing, from which i t makes a greater contribution than from reactor operation.
75. Table 26 gives the reported atmospheric dis- charges of I3'I from operating reactors in various countries for 1980-1985. There are considerable diffe- rences in the absolute quantities; these appear to be attributable to differences in the ages of the plants and in the waste treatment designs. There does not appear to be any trend in PWR releases, but BWR normalized data show a sharp downward trend.
76. The annual normalized discharges of 13'1 from PWRs were 1.75 + 0.33 GBq (GW a)-' for 1980-1984, not significantly changed when compared with 1.9 GBq (GW a)-I for 1975-1979. The I3'I releases from BWRs for 1980-1984 have averaged 9.3 F 4.9 GBq (GW a)-I compared with l 3 ' I releases of 40 GBq (GW a)-' for 1975-1979. This reduction was because the few reac- tors that had large releases are currently releasing far less. The results for HWRs indicate releases of 0.23 f 0.08 GBq (GW a)-I. From early GCRs, which utilize on-load refuelling, releases were negligible, and releases from AGRs were 1.4 2 1.1 GBq (GW a)-L. LWGRs released 8 0 2 40 GBq (GW a)-I [All, and measurements indicated that 60% of the iodine in the reactor off-gases was in organic form, 40% inorganic and about 1% particulate [B9, D 1, S6].
77. The isotopic composition of iodine releases from LWRs in the United States in 1982 is shown in Table 27 [T5]. The isotopic conlposition was taken to be representative of reactor operations in all countries and was used as the basis for dose calculations. For PWRs about 25% of the discharge is accounted for by " I 1 and 75% by ')'I, compared with the figures reported by the Committee in the UNSCEAR 1982 Report of 30% accounted for by 13'I. For BWRs, 1 3 ' 1
releases represented about 7% of the discharges. with I3jI and ' jSI contributing 28% and 65%, respectively. This compares with less than 10% previously reported for and 30% and 60% for l3jI and 'j51, respectively. For LWGRs, 24% is accounted for by I3'I, 43% by I3'I and 33% by l J S I [B21]. It might be concluded that there was little change in the isotopic composition in the periods 1975-1979 and 1980-1984.
6. Particulates in airborne effluents
78. Radionuclides in particulate form can arise directly or as decay products of fission noble gases or may arise from corrosion of materials in the primary coolant circuit. Aerosols are generated because of primary circuit leaks or because of maintenance work on active components removed from the priman circuit. The air in all areas where aerosols might arise is continually purged and the plenum activity is filtered by high efficiency particulate (HEPA) filters. Results of recent measurements on particle size distributions indicate a mean aerodynamic diameter of l pm for fission products and IOpm for activation products [B4]. Measurements at LWGRs in the USSR have indicated mean aerodynamic diameters of 0.1-0.4 pm for particulates: for I 3 ' I and "Cr, 30-30q were particulates with a mean aerodynamic diameter of less than 0.1 { r r n [BIO. C?].
79. Releases of particulate activity to the atmosphere are s~lmmarized in Table 28 for reactors around rhe world. The quantities are extremely low. and the nuclide composition appears to be uniqlre to each operating plant; i t depends on the particular impurities in cladding and structural materials. coolant chemistry and fuel failure modes. The isotopic conlposition of the release from a plant can vary from year to year, because of different operational and maintenance needs. Consequently, the range of nuclides reported in

atmospheric discharges is extremely large, several tens of nuclides often being reported from one plant. No single nuclide can be identified as contributing the majority of the activity released for any one type of reactor. Radionuclides identified include 'Be, "Na. s lCr, '4Mn, '9Fe, "Co, 5 a C ~ , 6 0 C ~ , 63Ni, 65Zn, 76A~ , "Rb, gqSr, 90Sr, 9LSr. 9'Zr, 97Zr. 95Nb. 99Mo, 9 9 m T ~ , 1 0 3 ~ ~ . 1 0 5 ~ ~ . 1 0 6 ~ ~ l O 8 m ~ ~ , IlomAg, '"Sn. 'I5Cd. '22Sb, l24Sb, l25Sb l:3mSn 1Z3nlTe, 134Cs, 137CS, 13YCe, LJOBa,
IJ0La. 14'Ce, I4'Ce and lR2Ta.
80. For PWRs the normalized release was 4.5 f 2.9 GBq (GW a)-' for 1980-1984, compared with 2.2 GBq (GW a)-' for 1974-1979. For BWRs, the average release was 43 f 24 GBq (GW a)-', compared with 53 GBq (GM7a)-I for 1974-1979. For HWRs the data yield 0.04 * 0.016 GBq (GW a)-'. similar to the 0.044 GBq (GW a)-! normalized release reported previously, while for LWGRs the average release appears to have been 15.7+ 16.2 GBq (GW a)-'. There were no figures previously for LWGRs. nor were there any for GCRs. which now average 1.4 f 0.8 GBq (GW a)-'.
7. Liquid effluents
81. The sources of radionuclides other than tritium in liquid effluents are essentially the same as those described for particulate releases to the atmosphere. The reported levels of discharge are equally variable. the magnitude and isotopic composition depending upon the design and operating practice of the reactor. impurity levels and trace quantities of material in structural and cladding components. Table 29 sum- marizes reported liquid effluent discharges from reac- tors around the world. In Table 30 the isotopic composition of liquid discharges from power reactors in the United States in 1982 is presented. and in Table 31. that for GCRs in the United Kingdom is given. also in 1982.
82. The normalized release levels based on the reported discharges for each reactor type using reported figures for electric energy generated between 1980 and 1984 can be summarized from Table 29 and contrasted with the figures given in the UNSCEAR 1982 Report.
PWR: 132?49GBq(GWa)-I. compared with 180 GBq (GW a)-!
BWR: 115 i- 47 GBq (GW a)-', compared with 290 GBq (GQ' a)-'
GCR: 4.520 + 1.790 GBq (G W a)-'. compared with 4.800 GBq (GU' a)-I
HIVR: 25.7 I 8.7 GBq (GW a)-', compared with 470 GBq (GW a)- '
The normalized releases for PWRs betitreen 1980 and 1984 are similar to previous years although there has been an increasing trend. while BWR releases are less. Canadian HWRs were previously reported as giving discharges of about 50 GBq (GW a)-l. while the higher figures for the GCRs reflect the fact that discharges are made, with the exception of Traws- fynydd. to the marine environment. I t appears from the above results that aquatic discharges from BWRs have been reduced by a factor of 2.5. In the UNSCEAR 1982 Report, the Committee found that
PWR releases had been reduced by a factor of about 2 and BWR releases by a factor of 10 from the figures given in its UNSCEAR 1977 Report. These reductions do not seem to have been attributable to the removal of any single nuclide but are applicable to all nuclides in the release.
83. The isotopic composition of liquid effluents from United States reactors in 1982 is shown in Table 30. About 20% of the normalized PWR discharge is due to 5BCo and almost 20% to '"I, while "'Cs accounts for about 11%. In the BWRs about 30% of the release is due to 60Co and about 13% to I3'Cs. the other nuclides with significant contributions being "Na and b'Zn; "'I contributed about 3%. These figures repre- sent small changes from those in the UNSCEAR 1982 Report. with some reduction in the percentages of caesium.
84. For GCRs. 409% of the discharges to the aquatic environment are due to I3'Cs and the ratio of "'Cs to "'Cs is 0.22. compared with 0.6 for PWRs and 0.5 for BWRs. which reflects differences in fuel burn-up. About 16% of GCR releases is due to 3SS. and POSr accounts for about 6%.
85. There is a wide range of activation products and fission products reported in liquid effluent discharges, and the isotopic composition varies even between reactors of the same type. The normalized figures are used. however, to make an estimate of the collective doses due to liquid effluent discharges.
B. LOCAL AND REGIONAL COLLECTIVE DOSE COMMITMENTS
86. National authorities usually require environmental monitoring programmes in the vicinity of a nuclear power plant to be carried out by the operator, another competent agency or both. In general, activity concen- trations of radioactive materials from effluent dis- charges are loo low to be measurable except close to the immediate point of discharge. Dose estimates for the population, therefore. rely on modelling the environmental transfer and transport of radioactive materials.
87. In the UNSCEAR 1982 Report, rhe Committee established a model site that was most representative of areas of northern Europe and north-eastern United States, since those areas contain a large proportion of the power-producing reactors. Agricultural produc- tion patterns and population distributions typical of those areas were also established. The cumulati\~e population within 2.000 km of the site is about 2.5 lo8, giving an average population density of 20 km-2. Within 50 km of the site, the population density was taken to be 400 km-2 in order to to reflect current siting practice. The objective of the Committee remains unchanged to give a representative value of the collective dose commitments per unit of electric energy generated by nuclear power stations and to reflect the levels of dose received by the most exposed individuals. The results do not apply to any one reactor or any one location, and the collective dose

commitments should not be applied to a given reactor with known discharge data to obtain estimates of health detriment.
1. Fission noble gases
88. Using the normalized releases for PWRs from Table 17 for noble gas atmospheric releases and the radionuclide composition from Table 18, the normal- ized collective effective dose equivalent commitments averaged between 1980 and 1984 were calculated for the model PWR facility and are shown in Table 32. The normalized release term from Table 17 is 218 TBq ( G W a)-' , and the radionuclides that contribute signi- ficantly to the collective effective dose are 'j3Xe and 13'Xe. The in-growth of daughter products. e.g., &%b from %r, has been included in the dose calculations, which are those presented in the UNSCEAR 1982 Report, but scaled for the different normalized release and isotopic composition.
89. The normalized collective effective dose equi- valent commitment amounts to 2.6 10-' man Sv ( G W a)-' compared with the Committee's assessment of 3.2 man Sv (GW a)-', which was given in Annex F of the UNSCEAR 1982 Report. This reflects the reduction in discharges with little difference in the distribution of radionuclide composition. About 64% of the total collective dose is now due to '33Xe (80% in 1982) and 28% to IsSXe ( I 1% in 1982). As in the UNSCEAR 1982 Report, some 90% of the collective dose commitment is accumulated within 500 km. There is little contribution from the inhalation of radioactive daughter products, and the dose estimates. as before, include an allowance for the shielding from buildings and the fraction of time spent indoors.
90. For the quinquennium 1980-1984. Table 19 shows the normalized releases from B WRs to be 2.150 TBq (GW a)-', compared with the value of 8,800 TBq (GW a)-' given in the UNSCEAR 1982 Report. Taking the relative isotopic composition from Table 20. the normalized collective effective dose equivalent commit- ment is given in Table 33 as 0.56 man Sv (GW a)-' . compared with the Committee's estimate in the UNSCEAR 1982 Report of 1.9 man Sv ( G W a)- ' . The main isotope contributing to the collective dose is "Kr (half-life: 2.8 h) accounting for about 57%. somewhat more than in 1982. Most of the remainder of the collective dose arises from '3SXe (16%), 138Xe (9%) and 13>Xe (8%), in somewhat smaller proportions than in the UNSCEAR 1982 Report.
91. The in-growth of '"b (half-life: 15.4 min) from "Kr and '38Cs (half-life: 32.2 min) from decays are included in the dose estimation, and the collective doses include a contribution from the inhalation of the a8Rb and '3sCs radioisotopes. The spatial distri- bution of the normalized collective effective dose equivalent commitment is biased towards the source, with more than 80% of the dose accumulated within 50 km and nearly 50% within 10 km. This behaviour is caused by the dominance of 88Kr, which decays with a half-life corresponding to about 40 km distance travelled.
92. The normalized release of noble gases f rom HWRs is 212 TBq ( G W a)" (Table 21), and assuming the same relative isotopic composition as PWRs, the normalized collective dose commitment is 0.024 man Sv (GW a)-', while for LWGRs a normalized release of 5.470 TBq (GW a)-' (Table 21) and the assumption of an isotopic composition similar to that of BWRs yield a normalized collective effective dose equivalent com- mitment of 0.72 man Sv (GW a)-'.
93. In summary, the normalized collective effective dose equivalent commitment from noble gas releases is 0.20 man Sv (GM1 a)-' , based on the five-year (1980-1984) weighting of electricity generated by PWRs, BWRs, HWRs and LWGRs. The Committee gave a figure of 0.63 man Sv (GW a)-' in the UNSCEAR 1982 Report, so that an average reduction of dose from noble gas effluents of about a factor of 3 has been found owing to reductions in reported discharge levels, mainly from BWRs. The annual average effective dose equivalent to the most exposed individuals in hypothetical critical groups has been calculated at IOjlSv for the model BWR and more than 10 times lower for rhe PWR site, taking a n average distance of about 1 km from the site. Many reactors give lower doses, although for some early BWRs, the doses could be about 10 times higher.
2. Activation gases
94. The primary activation product of interest for gaseous releases is 4'Ar. Because of its short half-lifc (1.83 h), it contributes most of its collective dose within a few tens of kilometres of the release point, although the exact result depends on the close-in population density. The normalized release of "Ar from GCRs (Table 22) between 1980 and 1984 is 2,320 TBq ( G W a)-' , and the associated collective effective dose equivalent commitment is 0.78 man Sv ( G W a ) - ' , compared with the estimate in the UNSCEAR 1982 Report of 0.95 man Sv (GW a)-' . The reduction is due to the fact that new AGRs are producing electricity with much lower 4'Ar discharges than GCRs. The weighted collective effecrive dose equivalent commitment, allowing for the fraction of electricity generated by GCRs, is 0.039 man Sv (GW a)-' , significantly lower than the value given in the UNSCEAR 1982 Report of 0.1 man Sv ( G W a)-'. Because of reporting procedures, "Ar releases for LWRs are included in noble gas data as shown in Tables 18 and 20.
95. The consequences of the release of j5S from GCRs have been studied in detail. The isotope is released in the form of carbonyl sulphide (COS), which has a low deposition velocity and a slow reaction rate in air. The major route of human exposure is via milk, and the Committee estimated 2.2 lo-' man Sv GBq-' in the UNSCEAR 1982 Report. so that, using the nornlalized release of 200 GBq ( G W a)-', the normalized collective effective dose equivalent commitment is 0.044 man Sv (GW a)-' and the contribution weighted for GCR electricity production is 2.4 10-3 man Sv (GW a)-', compared with 3.8 man Sv (GW a)-' in the UNSCEAR 1982 Report.

3. Tritium
96. The collective effective dose equivalent commit- ment to the local and regional population was evaluated in the UNSCEAR 1982 Report on the basis of a specific activity model. For atmospheric releases the Committee obtained 1.5 lo-' man Sv TBq-' by inhalation and 9 lo-' man Sv TBq-' by ingestion to give a total of 0.0 11 man Sv TBq-' released.
97. Normalized tritium atmospheric releases for the quinquennium 1980- 1984 from PWRs are 5.9 TBq (GW a)-' (paragraph 64). giving 0.065 man Sv (GW a)-'; BWR releases of 3.4 TBq (GW a)-' give 0.037 man Sv (GW a)-': HWR releases of 670 TBq (GW a)-' give 7.4 man Sv (GW a)-' for atmospheric releases. Releases from GCRs and LWGRs are comparable with PWRs and give similar dose contributions. In summary, weighted by the amount of electricity generated by reactor type, the normalized collective effective dose equivalent commitment for atmospheric releases of tritium is 0.53 man Sv (GW a)- ' , compared with the Committee's estimate given in the UNSCE.4R 1982 Report of 0.46 man Sv (GW a)-'. For the model site used by the Committee, the annual individual effective dose equivalent for critical groups would be less than 1pSv from LWR atmospheric 'H releases, while the HWR dose would be 50 pSv per year.
98. For tritium in liquid effluents, the river model used by the Committee gave a collective effective dose equivalent commitment of 8.1 lo-' man Sv TBq-', on the assumption that the river is used as a source of drinking water. Using the normalized discharges for 1980-1984 for PWRs, BWRs, HWRs, GCRs and LWGRs from paragraph 65. the normalized collective effective dose equivalent commitments were calculated and are shown in Table 34. The normalized dose weighted by the proportion of electricity generated by each reactor type is 0.033 man Sv (GW a)-', which compares with the estcmate of 0.04 man Sv ( G W a)-' given in the LrNSCEAR 1982 Report. The doses from aquatic discharges are therefore about 16 times lower than for atmospheric effluents per unit electric energy generated, similar to the difference of a factor of 10 reported in the UNSCEAR 1982 Report.
99. The local and regional collective doses attribut- able to l4C releases from reactors represent only a small proportion of the total dose commitments. The main significance of "C stems from its entry into the carbon cycle and the resulting global dispersion. leading to long-term irradiation, which is considered in chapter V. The first pass local and regional collective dose commitment was previously assessed by the Committee using the specific activity approach which was also used for tritium. The Committee also assumed in the UNSCEAR 1982 Report that the form of release of 'T was COz. The normalized local and regional collective effective dose equivalent commit- ment per unit release previously determined by the Committee was 1.8 man Sv TBq-I for ingestion and 0.0003 man Sv TBq-' for inhalation following release to the atmosphere. The normalized doses per unit electric
energy generatedare shown in Table 35 and are based on the normalized releases taken from Table 25.
100. The normalized collective doses ranged from 0.59 man Sv (GW a)-' for BWRs t o over 11 man Sv (GW a)-' for HWRs. The weighted average, allowing for the proporrion of electricity generated by each reactor type, was 1.6 man Sv (GW a)-' to the local and regional population. This is about one half of the estimate of 2.8 man Sv (GW a) - ] given in the UNSCEAR 1982 Report, largely because of lower reported HWR releases. For the model site the annual effective dose equivalents to most exposed individuals was 3 pSv for PWRs and BWRs, 10 /IS\' for GCRs, about 70 pSv for H WRs and about 13 1tSv for LWGRs.
5. Iodine
101. Releases of radioactive iodine from nuclear power plants are small, and there is little contribution to the local and regional collective effective dose equivalent commitment. Because of its long radio- active half-life. 1291 enters the global cycle for iodine and has the potential to irradiate the global popula- tion for tens of millions of years. The release of '"I contributes only to the local and regional collective doses, but its assessment is complicated by the chemical form in which the iodine is released, i.e., elemental, organic o r particulate. Elemental iodine readily deposits on vegetation and enters terrestrial food chains. The deposition of organic iodine is usually less than 1% of that for elemental iodine per unit time integrated air concentration. In this Annex. as in the UNSCEAR 1982 Reporl, the Committee assumes that 75% of the iodine released is in organic form and 25% in elemental form.
102. In the dose evaluation used in the UNSCEAR 1982 Report, the collective effective dose equivalent com- mitment per unit release of '''1 was 4.0 man Sv GBq-'. Taking the releases of ''II from Table 26, the normalized collective doses for "'I per unit of electric energy generated were calculated and are shown in Table 36. Results for the other iodine isotopes are found by scaling from the results in the UNSCEAR I982 Report, allowing for the change in isotopic composition. The PWR figures are about 10% lower than in the UNSCEAR 1982 Report, while the BWR results are about 25% of those found previously. For both BWR and LWGR reactors the short-lived '"I and 'j51 make significant additions to the dose. The weighted average, taking into account the proportion of elec- tricity generated by each reactor type, is 3.3 man Sv (GW a)-'. Representative effective doses to individuals about 1 km from the model site are about 0.5 pSv per year for PWR releases and 4 pSv per year for the B WR releases. As in the UNSCEAR 1982 Report, 90% of the collective dose contribution is estimated to come from the milk pathway.
6. Particulates in airborne effluents
103. As noted in paragraph 79, the quantities of radionuclides in particulate releases to the atmosphere may vary greatly, even if releases from reactors of the

same type o r those from the same reactor from year to year are compared. Furthermore, there are several tens of radionuclides identified in the releases. The solution previously adopted by the Committee for estimating doses was to assume that the normalized releases are composed of equal amounts of activity concentration from a range of nuclides most fre- quently reported in atmospheric discharges.
104. Dosimetric calculations allowed for transfer through foodchains to man as well as external irradiation from deposited radionuclides and inhala- tion from the dispersing plume of activity. Allowance was made for uptake by roots of growing vegetation. The full environmental modelling and resultant doses were described in the UNSCEAR 1982 Report. The nuclides considered were "Cr, 54Mn, 59Fe, ' T o , "OCo, h'Zn. a9Sr, 9%r, 95Zr, 95Nb, IZ4Sb, l3'Cs, 136"6Cs, ]3713?Cs, 140Ba, !"La, :4!Ce and I4'Ce.
105. The collective effective dose equivalent commit- ments per GBq release of the isotopic mixture is taken from the UNSCEAR 1982 Report to be 5.4 lo-' man Sv (GBq)-I. with nearly two thirds coming from external radiation from deposited activity and one third from ingestion. The collective doses per unit energy generated have been calculated using the normalized releases from Table 28 and arc shown in Table 37, from tvhich it can be seen that the most important pathway is the external dose received from activity deposited on the ground, followed b) the dose from ingested food- stuffs. The normalized doses cover three orders of magnitude. with HWRs giving the louest figure of 0.00022 man Sv (G\V a)-I and RWRs the highest value of 0.23 man Sv (GW a)-I. The doses can be compared with the previous figure of 0.012 man Sv (Gki' a)-! for PN'Rs, about one half of the current estimate. For BM'Rs the previous figure of 0.29 man Sv (GiV a)-! was slightly higher than the present value. GCR figures are significantly lower than before (0.007 man Sv (GW a)- ' compared with 0.012 man Sv (GU' a)-').
106. Some 9 5 5 of the collective effective dose equi- valent commitment from ground deposits is delivered within 50 years of the deposition and the major nuclides contributing are '"Cs and 60Co. For ingestion, 'OSr, 'j4Cs and I3'Cs all contribute equally by three path- ways: grain, vegetables and meat. The normalized col- lective effective dose equivalent commitment, weighted for the proportion of electricity produced by each reactor type. is 0.08 man Sv ( G W a)- ' , essentially the same as the estimate of 0.1 man Sv (GM' a ) - [ In the UNSCEAR 1981 Report. Individual effective dose equivalents from the normalized releases at the end of a plant's operating lifetime range from about 0.01 jtSv a t 1 km from the model BWR to 1.000 times less for H WRs.
7. Liquid effluents
107. Aquatic releases are made into freshu.ater o r marine environments. For releases of radionuclides into rivers or lakes. the pathways of exposure were previously taken by the Committee to be drinking water, irrigation leading to transfer to foodstuffs. and
external radiation from sediments. For discharges to marine environments it is usually sufficient to consider the ingestion of ocean fish and crustacea. In the UNSCEAR 1982 Report pathways such as swimming in contaminated waters o r consumption of unusual food items were considered to contribute little to the collective dose commitment.
108. The Committee has recognized the difficulty in assigning values to parameters in assessing the conse- quences of liquid effluents. in particular. water utiliza- tion and flow rates for rivers. fish production rates and sedimentation rates. The assessments based on the model used in the UNSCEAR 1982 Report, therefore, must be regarded as merely giving a representative value of nuclear power impact and should not be applied to discharges from a specific site to estimate collective doses from that site.
109. The normalized releases for PWRs, BWRs. GCRs. HWRs and LWGRs for 1980-1984 were summarized in paragraph 82, and the isotopic com- position for these discharges were assumed to be those of United States reactors shown in Table 30 and those of United Kingdom reactors in Table 31. Collective effective dose equivalent commitments were evaluated assuming the discharges took place to freshwater and to marine environments. The results are shown in Tables 38 and 39.
110. The normalized collective effective dose equi- valent con~nlitment for releases lrom the PWR to fresh water was 1.6 man Sv (GW a)-', compared with the finding of 1 lo-' man Sv (GW a)-! in the UNSCEAR 1982 Report. Drinking water accounted for about 80% of the total and l"I was the major contributing nuclide (70% of the dose). For BWRs the normalized collec~ive effective dose equivalent is 6.6 lo-' man Sv (GW a)-' , compared with the assess- ment of 2.8 man Sv ( G W a)-! in the UNSCEAR 1982 Report. The reduction is the result of an overall decrease of discharge, as well as a greater reduction in the more significant radiological nuclides. About 75% of the dose was from drinking water, and 60Co. I3'I, 1 i - 1 ~ ~ and I3'Cs contributed almost equally to this
dose. No results were provided for GCRs since these were coastal-sited. The collective dose from these radionuclides normalized for the amount of electricity generated were 1 . 1 10-3 man Sv (GW a)-! for PWR and BWR releases to the model river.
1 1 1 . For PWR releases to salt water the normalized results are shown in Table 39. The collective effective dose equivalent commitment was 3.6 lo-' man Sv (GW a)- ' , about one half the value found in the UNSCEAR 1982 Report. The fish and mollusc path- \+lays were both equally important, although the most important nuclide was different for each pathway: "'Cs for fish and 60Co for m o l l u ~ c ~ .
112. For RWR releases to the marine environment. the normalized collective effective dose equivalent commitment was 3.8 lo-' man Sv (GW a)-L. compared with the figure of 4.2 lo-* man Sv (GW a)-' given in the UNSCEAR 1982 Report. The major contribution. was, as before, from "Zn, which concentrates in

molluscs, and therefore the marine results differed markedly from those for fresh water. For GCR releases the normalized collective effective dose equi- valent commitment was 0.19 man Sv ( G W a)-', essentially the same value found in the UNSCEAR 1982 Report. The majority of the dose arose from discharges of I3'Cs. The weighted normalized collective effective dose equivalent commitment, allowing fo r the respective electricity generation was 0.025 man Sv ( G W a)-'.
113. Again. it should be emphasized that the figures given in Tables 38 and 39 are representative of the generation of unit quantity of electric energy and should not be applied to a specific site where particular releases and specific environmental path- ways exist that have not been considered here and might lead to significant differences in collective dose contributions. The normalized collective effective dose equivalent commitment due to aquatic discharges has been estimated to be 0.013 man Sv (GW a)-', assuming that one half the discharges are made to fresh water and one half to the marine environment.
C. OCCUPATIONAL EXPOSURES
114. As was noted in the UNSCEAR 1982 Report. more data on occupational exposure to radiation are reported for reactor operation than for any other area. There are difficulties in normalizing data on occupa- tional exposure to the electric energy generated, particularly for water reactors, as most of the doses are incurred during maintenance when no energy is produced. Normalized results are therefore only use- fully derived over several years for a number of reactors. Average annual effective dose equivalents to reactor workers were estimated to be similar in the UNSCEAR 1977 and 1982 Reports and ranged from 3 to 8 mSv. During the same period. however. there was a large increase in the number of workers per reactor in the United States. The trend in the normalized collective effective dose equivalent was downwards, but oilerall the best estimate for LWRs was taken in the UKSCE.AR 1982 Report t o be 10 man Sv ( G W a)-' , the same as in the UNSCEAR 1977 Report.
115. .AS can be seen from Table 1, PWRs and BWRs have been installed in many countries, although installed capacity in 1987 was still dominated by rhe United States. Recent data on occupational exposure and normalized collective effective dose equivalents are given in Table 40 for PWRs and BWRs. For some countries, the data are comprehensive and published regularly by the appropriate authorities. For other countries, data are not available for all years o r all the units installed. hone the less, the data are sufficient to give a reasonably comprehensive indication of the situation world wide, as substantial numbers of LWRs enter the middle phase of their predicted operating lifetimes. In general. the data on electricity generated were taken from the summaries produced by the International Atomic Energy Agency (IAEA) [I3. 14. 15, 161, if not otherwise given in the references for a particular country.
116. A comprehensive survey of data on LWRs in Western Europe has been carried out [B33]. The data cannot be added to Tables 40 o r 41, as the reactors were not identified specifically by country. The nor- malized collective effective dose equivalent for 23 PWRs dropped from about 6 man Sv ( G W a)-' in 1980-1981 to 4 man Sv ( G W a)-' in 1984. The comparable figures for 17 BWRs were more variable but were in the range of 3-6 man Sv (GW a)-'. A particular study on PWRs has also been carried out by Lochord and Benedittini [L5]. A distinct difference is emerging between PWRs and BWRs in the annual collective dose per reactor and per unit electric energy generated for reactors of similar electrical capacity. This trend, which is illus- trated in Table 41 for PWRs and BWRs from the United States and Japan, becomes more apparent as the reactors enter the second decade of their operating life and has been reported in the Federal Republic of Germany [E7]. Japan [19. T121, Sweden [P7] and the United States [N3]. The collective western European data, however, d o not support the conclusion [B33]. The collective dose can be higher in BWRs than in PWRs by up to a factor of 2, possibly because more maintenance work has to be performed in radiation areas on BWRs, especially around the turbines.
117. It appears that the significant trend towards increasing numbers of workers per reactor, which was noted in the UNSCEAR 1982 Report, especially in the United States, levelled off in the early 1980s. This aspect has been studied in detail by the Nuclear Regulatory Commission [N3]. who showed that although the number of workers per reactor doubled from 600 to 1,200 over the period 1975-1980, it remained constant at the higher figure during the period 1980-1983. The collective effective dose equi- valent distribution ratio (see paragraph 19) was assessed separately for PWRs and BWRs [N3]. For both types of reactors the average values of the ratios for the years 1981-1983 were in the range of 0.4-0.6. Annual average doses have been quoted for the years 1980-1982 at three PWRs in the USSR [V2, V3]. The values range from 4-8 mSv and provide detailed support for the overall average figure of 5.6 mSv given by Varobyov [Vl] and used in Table 40. For the Novovoronezh PWR [V5], however. the normalized collective effective dose equivalent in 1980 of 3.1 man Sv (GW a)-', based on an annual collective effective dose equivalent of 4.0 man Sv and an electric energy generated of 1.3 G W a [All was somewhat lower than the overall figure of I I man Sv (GW a)-' used in Table 40 [Vl]. Data on doses to personnel at LWGRs in the USSR have been reported at some reactors [P4, B151. For the two reactor units at Kolskaya. the collective dose in 1980 of 2.3 man Sv was typical of earlier years: the normalized collective dose of 1.9 man Sv ( G W a)- ' for 1980 was some\vhat lower than the average value of 2.5 man Sv (GW a)-' for 1977-1980. The annual average dose to personnel was about 5 mSv over that period. The data for Japan in Tables 40 and 41 were compiled mainly from detailed statistics supplied by Kumatori [K 11 and Terasima [TI 21.
118. Recent data for HWRs in Canada are shown in Table 42 [A4]. The values include internal doses from

exposure to tritium. The electric energy generated was obtained from IAE.4 tabulations [I3, 14, 15, 161. The results for Canada show considerably higher collective effective dose equivalent per unit energy generated than would be obtained by considering only the two largest power plants that produce the bulk of the energy. The lifetime collective effective dose equivalent generated by the Atucha 1 HWR in Argentina has been estimated at 27 man Sv (GW a)-' [P8].
119. Most of the GCRs in the world are in the United Kingdom. Comprehensive data on them [HI, H2, H3. H4. P5, W2] are shown in Table 42. The step change in the number of workers after 1980 is because the figures prior to 1981 did not include workers not directly employed by the Central Electricity Generating Board. The collective effective dose equivalent distri- bution ratio has been low: less than 0.01 in 1984 [P5]. The GCR in Japan is of a similar design to the early GCRs in the United Kingdom [Kl]; that in the United States is a small high temperature gas cooled reactor [B27, N3], so the doses from it are not directly comparable to the others.
120. Collective doses to personnel at the Dounreay establishment in the United Kingdom concerned with operation of the prototype FBR were 0.15 man Sv in 1984 and 0.29 man Sv in 1985 [U3]. Most of this collective dose resulted from charge machine refurbish- ing and irradiated fuel cell entries. Although many aspects of the design and operation of FBRs were reviewed at a recent symposium [I 1 I], no data on occupational exposures were reported. The Committee would welcome more information on this aspect, especially from prototype and nearly commercial-scale reactors.
121. Despite the lack of data from some countries and for some years. there is enough information from the countries for which each reactor type is installed in large numbers to make a reasonable estimate of the normalized occupation dose for the quinquennium 1980- 1984 for the major reactors. These estimates, which are based on the data in Tables 40 and 42, are given in Table 43. Bearing in mind the world-wide predominance of LWRs, the overall estimate must be heavily weighted by the estimate for this reactor type, but a figure of 10 man Sv (GW a)-' does not appear unreasonable.
D. SOLID WASTE DISPOSAL
1. Solid waste production
122. During operation of a power station, solid wastes are generated in a number of ways. In LWRs the main cause is treatment of the circulating water, giving rise to spent ion exchange resins, filter sludges and evaporator concentrates. Although these are originally wet wastes and may be stored in this form at the site, they are generally solidified before disposal. A similar type of waste arises from purification of the water in spent fuel storage ponds at reactors. Even though fuel elements are eventually removed for long- term storage or reprocessing, provision is made for
short-term storage at reactors for initial decay heat removal. In addition, waste may include some struc- tural components from the core or fuel, such as the outer fuel element structures from GCR and AGR fuel elements.
123. The radionuclides present in the above wastes are fission products, activation products and actinides, the particular radionuclides, quantities and relative activities being dependent on the reactor type, the state of the fuel cladding, the levels of corrosion. etc. In most cases these wastes will be the bulk of what is normally classified as intermediate-level wastes (ILW), i.e., wastes containing substantial activity concentra- tions but not significantly heat generating.
124. The other main cause of solid wastes during operation is the protective material of various kinds used around the station. Much of this is burnable and considerable volume reduction can be achieved by incineration and compaction. The radionuclide com- position is even more variable than for the wet wastes and the activity concentrations are small to zero. These wastes are generally classified as low-level \vastes (LLW).
125. In order to characterize the wastes for analysis of the impact of disposal, it is necessary to determine the volumes and the activity concentrations with identification of the relative quantities of important radionuclides, especially long-lived radionuclides and any actinides.
126. There were a number of studies in the mid- 1970s on the quantities of wastes produced at LWRs [B30, M7, M8]. The results, summarized in Table 44, have been extracted from a review carried out by the Environmental Protection Agency of the United Stares [E5]. More recent reviews have been carried out in the United States by the Nuclear Regulatory Conlmission [N8, N9] and by the United States Department of Energy [D4]. as well as in other countries using LWRs or planning to do so [NIO]. On the basis of these studies, the quantities of conditioned wastes arising from LWRs per unit energy generated are assumed to be as shown in Table 45. These are only approximate; variations of up to an order of magnitude are possible in particular circumstances, depending on the type of treatment or conditioning used.
127. The assumed radionuclide compositions for the wastes in Table 45 are shown in Table 46. These are based primarily on the analyses reported in the United States [N8, N9, E6] and the United Kingdom [PIO].
128. The quantities and activity concentrations of operating wastes of HWRs derived from data given for Canadian CANDU reactors [B31] are assumed to be as shown in Table 47. The quantities of wastes from operational GCRs have recently been reviewed [F3], and the results are also summarized in Table 47. The main differences in radionuclide composition from the LWR wastes are the higher alpha activity of the Magnox reactor sludges and the graphite debris containing 14C. Although there are significant dif- ferences between reported inventories for Magnox

reactors and AGRs [PI21 and LWRs, the composition in Table 46 is taken for this preliminary study, given the predominance of LWRs.
2. Solid Haste disposal facilities
129. A large proportion of the LLW produced at all facilities during operation can be disposed of by burial at a shallow depth. Burial facilities range from simple trenches or pits containing untreated wastes and capped with soil. to concrete structures containing conditioned wastes and capped with weather-resistant materials. These will be referred to as trenches and engineered disposal facilities.
130. Considerable quantities of LLW have been disposed of in such facilities throughout the past few decades. Many of the earlier disposal sites were not used for disposal of wastes from the generation of nuclear power. except perhaps for some research and development aspects. For example, there are 14 sites in the United States operated by the United States Department of Energy for the disposal of wastes generated from certain defence research activities. Some major closed and currently operating LLW burial sites are shown in Table 48 [C8, C9, N9]. These have accepted wastes from a range of operations [H 15, M 101.
131. Typical simple trenchs are about 10 m deep and 25 m wide and could be from 100 to 200 m in length, depending on the site. They are covered by about 1 m of compacted soil. The waste is not conditioned except to render the material non-combustible where necessary. This is similar to the minimum engineered trench specified by Pinner [Pl l ] and the base case of the Nuclear Regulatory Commission of the United States [N9]. Some major routes by which radionuclides will be released from such a trench will be into rainwater percolating through the trench and into ground water. There will be considerable differences between the behaviour of elements that form easily soluble com- pounds, such as iodine, and those that do not, such as uranium. as well as a marked dependence on the environmental and hydrological conditions of the site.
132. On the basis of knowledge of the chemical behaviour of the elements of which there are impor- tant radionuclides, the release behaviour of the wastes can be classified into three groups [PI I]. I t is also assumed that. since LLW is usually disposed of in trenches without packaging, radionuclides begin to be released into water as soon as the site is closed. The reference site is assumed to be above the water table in reasonably permeable, weathered material that has an underlying less permeable rock. In a site with these characteristics. water filtering through the waste will tend to move down through the unsaturated zone until i t reaches the water table and the impermeable boundary where i t moves downslope. I t is assumed to reach a stream at a distance of 2,000 m from the site.
133. Some categories of ILW containing radionuclides with longer half-lives or at activity concentrations too great for disposal in simple trenches have been
disposed of in engineered shallow disposal facilities. A typical facility is an excavation about 20 m deep and 25 m wide lined with 1 m of concrete. Such facilities are filled with concreted wastes to about one half their depth. the interstices being filled with concrete and finished with layers of concrete and clay to form an impervious cap. The canisters and concrete around the wastes will prevent rain or ground-water access for a considerable time, which is taken to be 100 years. After this time it is assumed that all radionuclides are released into percolating water at a constant fractional rate of lo-: a-l.
134. As a result of the greater depth of emplacement. i t is likely that engineered facilities would be positioned below the water table. I t is also sensible to locate the facilities in materials with good sorption properties, so the reference site is assumed to bc in clay. M a n clay outcrops are associated with harder, more permeable rocks leading to artesian conditions, i.e.. rising ground water. The trench would interfere with this locally so that the eventual flow pattern assumed for the reference site is that water infiltrating the trench from above will tend to move downward, then upwards and outwards, eventually entering streams at a distance of about 1.000 m on either side of the site [PIO].
135. An alternative method of disposal for packaged solid wastes is to dump them into a sea-bed at considerable depth. Although such disposals were carried out for many years, they ceased in 1982 under a temporary moratorium. The amounts of wastes disposed of to this date in the north-east Atlantic have been summarized by NEA [N6] and are given in Table 49. I t is not possible to assign the wastes to a particular power programme. and i t is known that some of the major radionuclides, such as "C. arose as wastes in the form for sea dumping largely from the preparation of radiopharmaceuticals.
3. Collective dose commitments
136. After closure of a burial facility. there will be a period during which control over the site is maintained. This does not necessarily preclude the transport of radionuclides released from the wastes into percolating ground water but could reasonably be relied upon to prevent major human intrusion into the site, such as for building purposes. Thus, during the controlled period, taken to be 100 years. only release by water contact is considered; other pathways are assessed after this period. The major pathways possibly leading to exposure are shown in Figure 11.
137. The actual transport of radionuclides with ground water, after release from the waste, the container and any surrounding engineered structures, will be very dependent on the hydrogeologic charac- teristics of the site. Considerable effort is being devoted to the development of calculational techniques capable of handling detailed knowledge of particular sites. For this study a more general approach is appropriate, such as the one adopted in other generic appraisals of shallow land burial [PIO, N9. N 101.

E x t e r n a l i r r a d i a t i o n
I I n h a l a t i o n
Crops
Farming I n g e s t i o n
Animals i Marine , '[I Seas 14 pathways 1
r Groundwater I
Figure 11. General release and transport mechanism and pathways from shallow burial facilities.
Contact by water
138. The simplest representation of ground water flow velocity. caused only by the natural hydraulic gradient. is that given by Darcy's law:
Soi 1
where V, is the ground water flow velocity, K, is the hydraulic conductiiity. k, is the hydraulic gradient and i L is the kinetic porosity. This is the basis for several transport codes, such as FEFLON'. which is used in the Nordic study [N 101, GEOS. which is used by the Yational Radiological Protection Hoard of the United Kingdom [H12]. and that used by the Nuclear Regulatory Commission of the United States [N9]. I t is adapted to radionuclide transport through a porous medium by including a retardation factor or distri- bution coefficient.
I Surface water
139. Generic assessments have also been carried out using a somewhat more realistic two-dimensional model, NAMMU [R4]. to calculate the pressure head distributions and, hence. flowpaths and velocities in saturated porous media. This has been applied to migration through undisturbed clay and to movement in the surface soil layer [PIO]. Whatever calculational method is used, the general result is that those nuclides with small retardation factors o r distribution coefficients, such as tritium, I4C, 99Tc and '291, move at a velocity close to that of the ground water. whereas nuclides with large retardation factors o r distribution coefficients. such as 23sU. '36U and 2'9Pu. move very slowly. The values for some important radionuclides are intermediate. Values adopted in three major studies [H12, N9. NlO] are reasonably consistent.
140. The output from the radionuclide transport calculations is the rate of input of activity into either the nearest stream, as described for the generic site, o r via ground water into soil that could be used for farming. b7ater could also be abstracted via a well. In calculating doses i t is assumed that the water forms a source of drinking water for humans and animals. It is also assumed that fish from the stream are caught and eaten. The river model is a compartment type. with each compartment rspresenting a homogeneous fresh- water body and incorporating adsorption on to and resuspension of sediment particles [I 151. The flow rate of the river is taken to be 6 lo6 m' a-'. The eventual transfer from rivers via estuaries to the sea is also included, In assessing doses from drinking water. it is assumed that suspended sediments are removed by filtration. Collective doses from streams and wells are assessed on the assumption that 0.2% of the flow rate and 1% of the abstraction rate are actually ingested.
1-11. If the land is used for farming. this will give rise . to a large number of exposure pathu.ays. The conta- mination can result from transfer directly upbvards through the soil from ground water or via streams and rivers through irrigation. The calculation of collective doses requires an esrimate of the total quantities of each foodstuff consumed. shown in Table 50. together with average values for activity concentrations obtained from the radionuclide transport models.
142. The collective dose equivalent rates per unit activity as a function of time after release from an engineered facility via all the pathways are shown for a number of important radionuclides in Tables 51, 52

and 53. for three major time periods of interest. In general, farming and water consumption pathways both contribute significantly to the collective dose.
143. The results of applying the specified models are shown in Tables 54 and 55 for the shallow earth trench and the engineered trench. respectively. The results are presented per unit activity in the trench and show the collective effective dose equivalent commit- ment and the maximum collective effective dose equivalent rate. Also shown is the time at which the specified percentage of the maximum collective effec- tive dose equivalent rate is reached [S 151.
144. Using the estimated volume for LLW from Table 45 of 200 m3 (GW a)-I at an activity concentra- tion of 1 GBq m-' as appropriate for PWRs and assum- ing the radionuclide composition given in Table 46. it can be seen from Table 54 that the normalized collective effective dose equivalent commitment from burial of these relatively short-lived wastes is less than 10-lo man St' (GW a)-'. Only if long-lived radio- nuclides were present could there be a collective dose of any significance; if this proportion were taken to be one thousandth of the quantity present in ILW, as shown in Table 46, the normalized collective effective dose equivalent commitment would be about
man Sv (GU' a)-'.
135. Taking the estimated volume for ILL\' from Table 35 of 50 m' (GLV a)-' at an activity concentra- tion of 100 GBq m-'. again. as appropriate for PWRs, and combining this with the data from Table 55 for the radionuclides specified to be present in Table 46, the normalized collective effective dose equivalent commitment from disposal of ILW in a model engineered trench is 0.5 man Sv (GI\' a)-'. The main contribution is from the 0.1% by activity of lJC assumed to be present in the waste. The contribution by radionuclide is shown in Table 56.
I . FUEL REPROCESSING
146. At the fuel reprocessing stage of the nuclear fuel cycle, the elements uranium and plutonium in the irradiated nuclear fuel are recovered to be used again in fission reactors. Spent fuel elements are stored under water. which provides both biological shielding and cooling. while waiting to be reprocessed. Fuel elements are usually left until the short-lived "'I has decayed to a low level. normally a minimum of four o r five months. Since one reprocessing plant can serve large numbers of nuclear reactors. the quantities of nuclides passing through the plant that are significant from the point of view of health will be high in absolute terms. Careful design limits discharges, how- ever, so that releases per unit of electricity generated by the fuel passing through the plant, i.e.. (GW a)-], may be relatively small.
147. The only commercial operating reprocessing plants are at Sellafield (formerly Windscale) in the United Kingdom and Cap de la Hague and Marcoule in France. The capacity at Sellafield is 2,000 t a-I
(heavy metal) and that of Cap de la Hague is 900 t a-' oxide fuel. while the plant at Marcoule processes u p to 400 t a-I of GCR metal fuel. The annual throughput of irradiated fuel from civilian power programmes in these three reprocessing plants is currently equivalent to about 8 G W a of electric energy, representing about 5% of the reported annual nuclear electric energy production (189 G W a. Table 2). Thus, the majority of irradiated fuel, which arises from LWRs, is not reprocessed but is stored pending future policy deci- sions as to whether to dispose or reprocess. A summary of the attitudes of countries with power reactors towards reprocessing is given in Table 57. while in Table 58 national programmes for commercial reprocessing are given [C3].
A. EFFLUENTS
148. The design and operation of reprocessing plants to avoid releases of large amounts of radioactive material is complex. The gaseous and volatile fission product elements (iodine. tritium, carbon, krypton. ruthenium, technetium. xenon and caesium) are largely separated from the fuel when it is dissolved in nitric acid. The dissolver off-gas is treated for nitric acid recovery and iodine removal before being mixed with the off-gases from other stages in the process. The \lessel off-gases are treated by caustic scrubbing, drying and filtering through high efficiency filtration systems before being discharged to the atmosphere. The aqueous wastes containing almost all the fission products and transuranic elements are concentrated by evaporation and stored in double containment stainless steel tanks before they are treated further.
149. The radionuclides of principal concern in re- processing effluents are the long-lived nuclides: 'H. 14C. 8 5 ~ ~ . 1291 , IJJCs, "'CS and isotopes of trans-
uranium elements. Table 59 lists the reported dis- charges to the atmosphere. and Table 60 those in aquatic releases, from Sellafield, Cap de la Hague and Marcoule for 1980-1985. The amount of activity in the effluents depends upon the specific waste treatment and processing design of the plant. as well as the type of fuel processed, its irradiation history and storage time prior to reprocessing. Table 61 gives the isotopic composition of liquid effluent discharges from the Sellafield and Cap de la Hague plants in greater detail for the years 1980-1985. Atmospheric release data and liquid discharge data for Marcoule are not available beyond 1980.
150. The throughput of fuel at both Sellafield and Cap de la Hague has been calculated on the basis of "Kr reported discharges and on the assessment of the L5Kr generation in different reactor fuel cycles made in the UNSCEAR 1982 Report. In that Report, the Committee has used production rates of 14 PBq (GWr a)-I for GCRs and 11.5 PBq (GW a)-' for PWRs. These figures make assumptions about fuel bum-up and reactor thermal efficiency that are not likely to have changed significantly since the UNSCEAR 1982 Report. On this basis. the electric energy production of the annual throughput of fuel at Sellafield has varied between 1.7 G W a and 3.7 G W a, while for

Cap de la Hague the range has been 2.4 to 6.1 GW a. For Marcoule, there are little data on atmospheric dis- charges. although the electric energy of annual fuel throughput for 1980 has been estimated at 1.4 G b ' a.
151. For tritium, the Committee used in the UNSCEAR 1982 Report a production rate in LWR fuel of 0.75 PBq (GW a)-I and, assuming this applies to GCR fuel, the inventory passing through Sellafield has varied between 1.3 PBq ( 1985) and 2.8 PBq (1981). In 1981, atmospheric discharges of 3H were 0.46 PBq and liquid discharges 2 PBq, giving 2.46 PBq, compared with the estimated throughput of 2.8 PBq. Thus, i t appears that nearly all the tritium in irradiated fuel is released in reprocessing and about 20% is released to the atmosphere. This is identical to the percentage estima~ed in the UNSCEAR 1982 Report. The reniain- ing tritium may be immobilized in cladding wastes. For Cap de la Hague the normalized releases of tritium have been 0.26 PBq (GW a)-' of which only about 1% is in reported atmospheric releases and thus it seems that only about one third of the throughput is released.
152. The results of routine measurements of I4C atmospheric discharges from the Sellafield reprocessing plant are given in Table 59. The normalized production rate of I'C in GCR fuel was estimated in the UNSCEAR 1982 Report at 3.2 TBq (GWr a)-'. Atmo- spheric discharges from Sellafield therefore seem to account for essentially the whole of the estimated throughput of I4C between 1980 and 1985. For the French reprocessing plants, 14C discharges are not reported. In the UNSCEAR 1982 Report, the Com- mittee estimated the I4C content of LWR fuel to be 0.66 TBq (GW a)-'. of which about 75% was assumed emitted to the atmosphere, but in view of the Sellafield data. all I4C can be considered released to the atmosphere for the dose assessment.
153. The 13'1 content of irradiated nuclear fuel varies, depending upon the cooling time and the final power level of the fuel discharge. The "'I normalized content of LWR fuel cooled for six months is estimated at 2.8 TBq (GW a)-I, falling by a factor of 2.000 for a cooling period of nine months. Since irradiated fuel is generally cooled for at least a year prior to reprocessing, "'I discharges are very small. For 1980-1985. Sellafield atmospheric releases of l 3 I l
(Table 59) gave normalized values of 19 GBq (GW a)-I; the corresponding figure for 1975- 1979 was 1.7 GBq (GW a)-'. the increase being due to a high release figure in 1981.
154. The quantity of "'1 in fuel depends upon burn- up and is assessed at 37-74 GBq (GW a)-I. Atmo- spheric discharges of "'I, as well as liquid effluent amounts, have been reported for Sellafield and Cap de la Hague but not for Marcoule. The normalized atmospheric release is 3.7 GBq (GW a)-I for Sellafield and 4.9 GBq (GW a)-' for Cap de la Hague for the period 1980-1985, which is about twice the value given in the UNSCEAR 1982 Report. Liquid effluents averaged about 30 to 60 GBq (GW a)-! at each plant over the same period, compared with 40 GBq (GW a)-'
previously reported. I t seems likely that all the 12q1 in the fuel is released with a few per cent going to the atmosphere.
155. Atmospheric releases of aerosols are summarized in Table 59. The normalized alpha releases from Sellafield are 0.2 GBq (GW a)-I, of which more than 75% is due to plutonium isotopes [BI, B2. B3. B8. B16], the remainder being accounted for by 24'.4m and 242Cm. This figure is one half that reported in the UNSCEAR 1982 Report. The alpha-aerosol results are available from France for Cap de la Hague and are some 30 times lower. For atmospheric beta releases. the largest component from Sellafield is I3'Cs, although since 198 1 the levels have been reduced. The normalized release is 63 GBq (GW a)-', compared with 88 GBq (GW a)-I for 1975-1979. For Cap de la Hague the normalized release is 0.04 GBq (GW a)-' for beta- aerosols. and no isotopic breakdown is available. The reduction in aerosol releases in recent years from Sellafield is the result of improvements in the Magnox cladding silo stores, including the installation of inert gas blankets and filtration systems.
156. The liquid effluents discharged from Sellafield. Cap de la Hague and Marcoule are given in Table 60 for total alpha, total beta, 'H. '"Sr, Io6Ru and I3'Cs. There is a yearly isotopic breakdown for the French plant at Cap de la Hague but not for Marcoule. The isotopic compositions of Sellafield and Cap de la Hague discharges are given in Table 61 for 1980-1985.
157. The normalized alpha release from Sellafield to the sea is 8.0 + 5.2 TBq (GU' a)-', compared with an average of 25 TBq (GW a)-' between 1975 and 1979. For Marcoule and Cap de la Hague the figures are 0.063 and 0.16 TBq ( G b l a)-!. while for the previous period they were 0.016 and 0.24 TBq (GU' a)-I. Most of the Sellafield alpha activity was 239"2'0P~, and the level of alpha discharge has been reduced by a factor of 6 over the reporting period.
158. For liquid discharges of beta activity the normalized releases from Sellafield, Cap de la Hague and Marcoule are 0.97, 0.24 and 0.027 PBq (GW a)-!, respectively. compared with 3.7, 0.52 and 0.04 PBq (GW a)-' for 1975-1979. The isotopic composition of the effluents varies between the sites: 55-70% of the Sellafield discharge is attributable to 13'Cs, whereas 40% of the Cap de la Hague discharge is attributable to Io6Ru. Tile "'Cs levels from Sellafield were reduced by a factor of 9 over the review period. although the '06Ru levels remained constant at about 400 TBq (GW a)-' until 1985. After 'H. Io6Ru is the main isotope released from Cap de la Hague; the lWRu discharges are comparable to those of the Sellafield plant.
9 Monitoring of the marine environment is under- taken by regulatory authorities to ensure compliance with authorized discharges and to ensure that doses to exposed populations are at the levels predicted. The results of monitoring around the United Kingdom in the vicinity of all operating nuclear plants have been published by Hunt [H5, H6, H7]. The most significant

results arise from discharges of the Sellafield plant. Measurements of activity in fish and shellfish in 1983 are shown in Tables 62 and 63 for various locations around the United Kingdom. In order to interpret these results, consumption data are required to assess intakes of radionuclides.
160. Aarkrog [A21 has summarized bio-indicator studies in Nordic waters to identify levels of radio- active contamination. The marine bio-indicators are the blue mussel (Mytilus edulis) and bladder wrack (Fucus vesiculosus). which are sensitive to contamina- tion from nuclear fallout and from Sellafield dis- charges and nuclear power plants in Sweden. Finland and the rest of coastal northern Europe. Discharges from Sellafield have been traced from the lrish Sea. along the western Norwegian coast, down along eastern Greenland and then western Greenland. The transit time from the lrish Sea is measured to be four years and the activity concentration is diluted by a factor of 100.
161. The measured concentrations of "'Cs in sea water decrease from the highest levels of 1.000 Bq kg-' near Sellafield to 8-10 Bq kg-' in the Baltic Sea, 1-2 Bq kg-' near Greenland and less than I Bq kg-' near Iceland. Levels of 99Tc from Sellafield discharges closely follow those of I3'Cs. Measurements of plutonium show enhanced levels primarily in British and lrish coastal waters. although very low levels have recently been detected in areas further from the coast.
B. LOCAL AND REGIONAL COLLECTIVE DOSE COMMITMENTS
162. The evaluation of the collective dose commit- ments from reprocessing nuclear fuel requires a study of the local and regional effects and of the global consequences of the releases. Estimates of the local and regional collective dose commitments are given in this section and the global contribution is provided in chapter V. The collective dose commitments are evaluated for the normalized discharges from Sellafield and Cap de la Hague by scaling the normalized results given in the UNSCEAR 1982 Report. As there are only three reprocessing plants operating with signi- ficant commercial throughput of fuel, the collective effective dose equivalent commitments per unit of electric energy generated are weighted by the fraction of fuel reprocessed to provide the current contribution from all operating reactors. In the UNSCEAR 1982 Report. the Committee gave typical discharge figures for notionzl new designs of reprocessing plant. This has not been repeated in this Report since all fuel may not be reprocessed. The weighted average. therefore. reflects actual exposures from the nuclear fuel cycle as currently operated.
163. The averaged 8'Kr normalized discharge from Sellafield between 1980 and 1985 was 14 PBq (GW a)-' (Table 59), and the collective effective dose equi-
valent commitment obtained by the Committee in the UNSCEAR 1982 Report was 0.0074 man Sv (PBq)-I. Thus. the normalized local and regional collective effective dose equivalent commitment is 0.1 man Sv (GW a)-'. The normalized discharge from Cap de la Hague is 11 PBq (GW a)-'. giving 0.08 man Sv (GW a)-'. The average annual electric energy generated in recent years has been over 160 GW a, and an annual amount of fuel equivalent to 8 GW a was reprocessed. Thus, the normalized collective effective dose equivalent commitment from is 0.005 man Sv (GW a)-' electric energy generated.
2. Tritium and carbon-14
164. The Committee used in the UNSCEAR 1982 Report specific activity models to estimate collective doses from 'H and 14C discharges. The dose resulting from the release of tritium to the atmosphere was estimated in that Report at 0.0027 man Sv TBq-I for the Sellafield site. some four times lower than the value for the reactor site, due to differences in site, population density and meteorological conditions. Releases from Sellafield to the atmosphere averaged I20 TBq (GW a)-' (Table 59), giving a collective effective dose equivalent commitment of 0.32 man Sv (GM' a)-', 85% of which was from ingestion. For Cap de la Hague the normalized release of 3.5 TBq (GW a)-' gives a collective effective dose equivalent commitment of 0.01 man Sv. Releases to the regional marine environment were estimated in 1982 to lead to lower dose commitments. Using the value derived in the UNSCEAR 1982 Report of 1.8 lo-' man Sv PBq-I released to oceans and the average release to the sea of 579 TBq (G W a)-' for 1980-1 985 from Sellafield (Table 60) leads to a collective dose commitment of 1 lo-' man Sv (Gw a)-'. The total normalized collective effective dose equivalent commitment weighted by the relative energy of fuel reprocessed at Sellafield and Cap de la Hague is 0.15 man Sv (G W a)-', essentially the same figure that was given in the UNSCEAR 1982 Report. Again, allowing for the fraction of fuel reprocessed. the weighted normalized collective effec- tive dose equivalent commitment is 0.007 man Sv (GW a)-'.
165. For "C releases to the atmosphere, the Com- mittee estimated the collective effective dose equivalent commitment at 0.4 man Sv TBq-I, with essentially the same value per TBq released to the aquatic environ- ment. Averaged atmospheric releases from Sellafield are reported to be 3.5 TBq (GW a)-', giving a normalized collective effective dose equivalent commitment of 1.4 man Sv (GW a)-', compared with 0.69 man Sv (GW a)-' quoted in 1982. The difference is accounted for by the reported discharges to the atmosphere being double the values reported in 1975-1979. It would appear that the total throughput of I4C at Sellafield is now accounted for in atmospheric releases. For Cap de la Hague. the assumed release of 0.66 TBq (GW a)-' gives a normalized collective effective dose equivalent commitment of 0.3 man Sv (GW a)-'. Weighted for the fraction of fuel reprocessed. the contribution is 0.04 man Sv (GW a)-'.

3. Other atmospheric releases 170. The collective effective dose equivalent com- mitment weighted for the relative amount of electricity
166. Of the other nuclides released to the atmosphere. Iz9I becomes globally dispersed and makes a contri- bution to the collective dose commitment over a prolonged period, while the remainder contribute only to the local and regional collective dose commitment. A summary is given in Table 64. The total, averaging over Sellafield and Cap de la Hague, amounts to 1.3 man Sv (GW a)-', compared with the assessment of 3 man Sv (GW a)-' for atmospheric releases made in the UNSCEAR 1982 Report. Some 65% of the dose is now due to ''C discharges, which are reported to be twice the previous levels and which counteract reduc- tions in discharges of other nuclides, particularly actinides. Weighted by the proportion of electric energy generated, the normalized collective effective dose equitralent commitment from atmospheric releases during reprocessing is 0.07 man Sv ( G W a)-'.
1. Liquid effluents
167. The results are presented in Table 65 for the normalized collecti\~e effective dose equivalent commit- ments for marine discharges from reprocessing at Sellafield and Cap de la Hague. The environmental dosimetric models are appropriate for the specific coastal waters of northern Europe and were fully described in the UNSCEAR 1982 Report. They assume that consumed fish, molluscs and crustacea are the important food pathways to man.
168. For Sellafield, normalized liquid discharges for 1980-1985 were reduced by a factor of 3 since the period 1975-1979. The collective effective dose equi- valent commitment per TBq for marine discharges from Sellafield found by the Committee in the UNSCEAR 1982 Report was 0.068 man Sv for "'Cs. 0.034 man Sv for 'ObRu and 0.025 man Sv for alpha- emitters. The principal route of exposure is I3'Cs in consumed fish, as before. and for 1980-1985 the caesium contribution is some 85% of the total collective dose. The normalized collective effective dose equivalent commitment for 1980-1985 from liquid discharge from Sellafield is 44 man Sv (GM' a) - ' . the estimate made in the UNSCEAR 1983 Report being 124 man Sv ( G W a)- ' , If data for 1985 alone are taken, the normalized release gives a collective effective dose equivalent commitment of 25 man Sv (GU' a)-' . reflecting the lower discharges after the installation of a new plant to remove radioactive substances from effluent streams.
169. In the case of Cap de la Hague, discharges also seem t o have been reduced. The Committee's models used in the UNSCEAR 1982 Report gave dose conversion factors per TBq released from Cap de la Hague of 0. I man Sv for '06Ru. 0.09 man Sv for "'Cs and 0.4 man Sv for alpha-emitters. The normalized collective effective dose equivalent commitment shown in Table 65 is 1 1 man Sv ( G W a)-' , which compares with the figure of 53 man Sv ( G W a)- ' given in the UNSCEAR 1982 Report. The majority of the dose arises from the discharge of lobRu.
produced by the fuel reprocessed at each plant is thus 25 man Sv ( G W a)- ' and, after allowing for the proportion of fuel reprocessed commercially. the normalized contribution is 1.2 man Sv (GW a)-'. Annual committed effective dose equivalents to the critical group of winkle eaters close to the Sellafield site were reported to be 0.5 mSv in 1985 [B29]. The doses are reduced as discharge levels fall.
C. OCCUPATIONAL EXPOSURES
171. I t was noted in the UNSCEAR 1982 Report that experience of fuel reprocessing is limited to a few countries and that plant design and historical operating conditions may not represent the best current potential for new plants. This view is supported by a recent review of the trends in the annual collective and the maximum individual occupational doses in a number of reprocessing plants [B22]. The review covered not only the large operating reprocessing plants at Cap de la Hague and Sellafield. but also the pilot plants WAK at Karlsruhe, Federal Republic of Germany. the Eurochemie plant at Mol. Belgium, the PNC plant at Tokai Mura in Japan, and the Idaho and Savannah River plants in the United States. Although recognizing the differences in sizes and design age of the various plants and that some of them reprocess fuel for military as well as civilian purposes. a downward trend in average doses was observed starting during the period 197 1 - 1973 and ending during the period 1980- 1982. The annual average effective dose equi- valent dropped from 4-15 mSv in the early 1970s to 2-4 mSv early in the 1980s. Data since the UNSCEAR 1982 Report are summarized in Table 66 for Japan and the United Kingdom [AS. 813. B23. 828. H8]. The data for Japan refer only to the PNC plant at Tokai Mura. An estimate of 0.5 man Sv has been made of the neutron collective dose equivalent at Sellafield in 1982 [B24]. Data for Cap de la Hague and Marcoule from 1973 to 1985 are given in Table 67. taken mainly from the recent comprehensive re\,ie\v by Henry [H 131. This also shou's annual average effective dose equivalents of about 2 mSv in the period 1982- 1985 at both establishments.
172. In the UNSCEAR 1982 Report the normalized collective effective dose equivalents for the plants at \tlindscale (now Sellafield). United Kingdom. and Cap de la Hague, France. were estimated to be 18 and 6 man Sv (GW a)- ' , respectively. Some revised estimates for the United Kingdom are given in Table 66. based on ' X r discharges related to energy throughput and a fuel content of 14 PBq (GU' a)- ' . The normalized value for Cap de la Hague is reported to have fallen from 6 man Sv ( G W a)-' in 1975 to I man Sv (GW a)-' in 1985 despite a large increase in reprocessed fuel throughput over this period [BZZ]. This is in agreement with the data given in the report of a working group [C6] for a period leading up to 1981 and supplemented in a report to the Sizewell B public inquiry in the United Kingdom [ZI] with data for 1982 and 1983. These estimates are in agreement with the detailed results for Cap de la Hague reported by Henry [HI31 and given

in Table 67. The Table shows that the normalized collective effective dose equivalent dropped steadily from 2.2 to 0.9 man Sv (GW a)-' throughout the period 1980-1985. The difference of nearly an order of magnitude between the normalized values for the two major installations makes it difficult to make a clear estimate. It seems, however, that the estimate in the UNSCEAR 1977 Report of the global collective effective dose equivalent per unit electric energy generated is, at 10 man Sv (GW a)-I, too high. Based on the trends reported for Cap de la Hague, the estimate for Marcoule in 1980. the experience in Japan. and taking into account the predictions for the new plant at Sellafield, a better estimate for the whole of the 1980s is about 5 man Sv (GW a)-]. When allowance is made for the proportion of fuel repro- cessed commercially, the normalized contribution from occupational exposure is 0.25 man Sv ( G W a)-l.
D. SOLID WASTE DISPOSAL
173. The solid wastes that are generated in the handling, processing and disposal of spent fuels are of two broad categories. Most of the activity in the spent fuel is separated during reprocessing and, after a period of storage as a liquid. will be solidified for eventual disposal as high-level waste (HLW), generating significant decay heat. During the reprocessing opera- tion considerable amounts of solid low-level wastes (LLW) and solid intermediate-level wastes (ILW) are produced, some streams of the latter being charac- terized by an appreciable content of actinides. If the spent fuel is not reprocessed but stored and prepared for disposal, there will be almost no ILW or LLW. But the packaged spent fuel is then treated as HLW: it conrains the actinides that would have been separated for re-use by the reprocessing operation. Since neither spent fuel nor vitrified HLW have been disposed of. they are not considered in this assessment of current operations.
174. Production of other solid wastes in reprocessing plants has been highly dependent on the operational characteristics of the particular plant. In particular, much of the waste produced at the Sellafield plant in the United Kingdom is attributable to the degradation of Magnos fuel in underwater storage and should not be taken to be indicative for other plants now o r in the future.
175. Production of ILW from the British Magnox reprocessing programme has been estimated [TI I ] at 47,000 m' from the reprocessing of 30.000 t uranium metal. The activity content is estimated to be about 2 10'" Bq alpha and 2 10" Bq beta/gamma ac t~ \ i tg at 1990. Taking an average fuel requirement for Magnox reactors of 200 t (GW a)-I. these correspond to the quantities shown in Table 68. Comparing with the alpha inventory of the fuel throughput, calculated to be 6.700 TBq (GW a)-' at six months and 3,800 TBq (GW a)-; at 20 years [G5], the fraction of alpha activity throughput lost to the ILW is about 0.02-0.03. Similarly, taking the beta/gamma inventory of the fuel throughput to be 2.4 106 TBq (GW a)-' at six months and 1.7 loS TBq (GW a)-' at 20 years [G5]. the fraction of beta/gamma throughput lost to the
ILW is about 0.005-0.05. These will be very sensitive to reprocessing chemical conditions for some nuclides. especially ?"Np. The generation of ILW from the proposed oxide fuel reprocessing plant for AGR fuel was also estimated by Taylor [TI I ] to be 11000 m' from the reprocessing of 600 t uranium metal in the thermal oxide reprocessing plant (THORP). The activity content is 6 lo i5 Bq alpha and 5 1O1%q beta/ gamma activity, assuming a cooling period of five years. The average fuel requirement of the AGR is taken to be 30 t (GW a)-) to give the quantities in Table 68. Again. comparing with the alpha and beta/ gamma inventories of the fuel throughput at five years, calculated to be 3,100 and 2.5 10' TBq (GW a)-', respectively [G5], the fractions of activity throughput lost to the ILW are 0.01 for alpha and 0.1 for beta/gamma activities.
176. The annual rate of waste generation at Marcoule has been reported [B32] to be about 2,000-3,000 drums containing a total of about 4 TBq alpha and 4,000 TBq beta/gamma activity. Assuming the annual fuel through- put of the facility to be 0.4 G W a and the drum capacity to be 0.2 m3 gives the quantities shown in Table 68.
177. An alternative method of estimating the activity content of other solid wastes is to assess it directly as a fraction of the throughput of radionuclides in the fuel. This approach has been used by the United States Department of Energy [D4] to give the results in Table 69. The quantities are comparable with those estimated by Hill et al. [HI I] but considerably less than those estimated for an operating plant, as shown in Table 68. The difference is about two orders of magnitude for alpha emitters and nearer to three orders of magnitude for beta/gamma emitters.
178. T o give some estimate of the consequences of disposal of such wasres. it is assumed thal the alpha lvastes are entirely 2 ' q P ~ and the be tdgamma wastes entirely I3'Cs, and a typical normalized production from Table 68 is taken to be 100 TBq (GWr a)-I for alpha wastes and 10.000 TBq (GW a)-I for beta/ gamma wastes. Using the model for a typical ILW engineered disposal trench from section 1II.D. and the values for collective effective dose equivalent com- mitment per unit activity disposed of from Table 55, the normalized collective effective dose equivalent commitment would be 1 man Sv (GW a)-I. This is reduced to 0.05 man Sv (GLV a)-' when account is taken of the proportion of fuel reprocessed commer- cially. Lower losses from throughput to the ILW and LLW wasre streams as estimated in paragraph 176 would significantly reduce this estimate; greater losses of the very long-lived radionuclides I4C and "91 would significantly increase it.
V. COLLECTIVE DOSE COM\IITR.IEIVTS FROM GLOBALLY DISPERSED
RADIONUCLIDES
179. The nuclides giving rise to a global collecrive dose commitment are sufficiently long-lived and migrate

through the environment, thus achieving widespread distribution. Those of interest are 'H. ''C. BsKr and I z 9 I . The environmental transfer of 'H. "C and 8sKr is becoming fairly well established. and reliable estimates of collective dose commitments were made by the Committee in the UNSCEAR 1982 Report. Other long-lived nuclides. such as 2 3 q P ~ , are far less mobile in the environment and therefore become less dis- persed after deposition on to soils or sediments, following release into the local region.
180. The very long-lived nuclides, such as '291, pose a special problem because of the uncertainty in predict- ing population size, dietary habits and environmental pathways over periods of tens of millions of years. Therefore. little use can be made of these collective dose commitments for decision-making purposes. The incomplete collective dose commitment, however. is useful to demonstrate the time distribution of the dose commitment and to estimate the per caput doses arising per year from a finite duration of a practice. In the following paragraphs, complete and incomplete dose commitments are given for the globally dispersed nuclides up to a maximum of lo6 a. The collective dose commitments per unit release were taken from the UNSCEAR 1982 Report of the Committee and scaled for the normalized releases derived for 1980-1984 discharges.
181. In the UNSCEAR 1982 Report, a model repro- cessing facility was described and all reactor fuel was assumed to be reprocessed. In this Report, the collective doses assessed for reprocessing plant reported discharges are weighted by the fraction of the energy value of the total nuclear fuel that is reprocessed, namely 5% (paragraph 147). The weighted contribu- tion is added to any contribution from reactor operation to reflect the current normalized exposures.
182. Since krypton is an inert gas, it disperses throughout the atmosphere and achieves a uniform concentration in about two years. The Committee, in the UNSCEAR 1982 Report. estimated the collective effective dose equivalent commitment from B5Kr to be 0.17 man Sv PBq-', assuming a world population of 4 lo9. This must be scaled up to 0.2 man Sv PBq-I for the world population of 4.6 lo9 during the period 1980-1985. All the dose commitment is delivered within the first 50 years after release. Paragraph 150 gave normalized production of 8SKr as 11.5 PBq (GW a)-' for LWRs and 14 PBq (GW a)-' for GCRs. leading to 2.3 man Sv (GW a)-' and 2.8 man Sv (GW a)-' collective effective dose equivalent commit- ment, respectively. Contributions to the collective effective dose equivalent commitment come almost equally from whole-body gamma-radiation and from beta-irradiation of the skin. Weighting this collective dose by the fraction of fuel currently reprocessed (0.05) leads to 0.12 man Sv (GW a)-'. The incomplete collective dose commitments are shown in Table 70. which indicates that half of the dose from "Kr is delivered in the first 10 years after discharge.
B. TRITIUM
183. The models used by the Committee in the UNSCEAR 1982 Report gave a collective effective dose equivalent commitment of 2.8 man Sv per TBq released. Because of the short half-life of tritium, this applies to the world population at the time of release. For the 1980-1985 world population of 4.6 lo9, the dose factor is increased to 3.2 man Sv per TBq. Releases to the atmosphere and hydrosphere were not distinguished, since the exchange of water between the atmosphere and circulating waters of the globe is rapid. and the models assume immediate mixing and exchange with the hydrogen content of the circulating water.
184. The normalized release of tritium to the atmo- sphere from reactor operations, weighted by electricity production, is 46 TBq (GW a)-', while for liquid discharges the data give 40 TBq (GW a)-'. .4veraged over Sellafield and Cap de la Hague. aquatic and atmospheric releases from reprocessing add up to about 600 TBq (GW a)-', and since only 5% of the fuel is reprocessed, this adds 30 TBq (GW a)-' to the reactor releases of 86 TBq (GW a)-'. The total collec- tive effective dose equivalent commitment amounts to 0.004 man Sv (GW a)-'. The incomplete collective dose commitments shown in Table 70 indicate that essentially all of the dose is received in the first few years after discharge. The local and regional contribu- tion from tritium releases from reactor operation and the fractional reprocessing contribution amount to about 0.6 man Sv (GW a)-', which is a factor of over 100 greater than the global contribution.
185. The Committee used in the UNSCEAR 1982 Report a relatively complex compartment model to assess the environmental distribution and behaviour of I4C. This model allows for two hemispheres, each comprising humus, circulating carbon, surface ocean and deep ocean. The circulating carbon represents the carbon in the troposphere and those sectors of the terrestrial biosphere subject to rapid growth and decomposition. Humus represents the carbon content of the terrestrial biosphere which circulates more slou.ly. Carbon- 14 releases are assumed to be instantaneously mixed in the compartment to which release occurs. The results produced by this model are similar to those produced by more complex models; the main area of uncertainty is the rate of transfer of "C to the deep ocean, from where it is less available.
186. The resulting collective effective dose equivalent commitment is 67 man Sv TBq-I released, averaged over both aquatic and atmospheric releases and assuming a future global population of 10l0. Normalized releases from reprocessing plants are averaged over the reported figures for Sellafield (Table 59) and calculated throughput for Cap de la Hague (para- graph 152). Measurements appear to show that all the throughput is measured in airborne effluents, and i t is assumed that little is discharged to the sea. The normalized release is 3.5 TBq (GW a)-I from Sellafield

(Table 59): Cap de la Hague is assumed to give rise to releases of 0.66 TBq (GW a)-'. The collective effective dose equivalent commitment for Sellafield is thus 234 man Sv (GW a)-' and 44 man Sv ( G W a)-[ for Cap de la Hague. Since about 5% of the annual energy equivalent of fuel is reprocessed, the weighted figure averaged over the two sites is 6 man Sv (GW a)-', the remaining fuel being stored and not giving rise to effluent releases of I4C.
187. HWR releases are about 7.3 TBq (GW a)-' of ''C from reactor operations (Table 25). while those from LWGRs and GCRs are about 1 . 1 TBq (GW a)-' (paragraph 72). LWR releases at about 0.3 TBq ( G W a)-' (paragraph 70) are small in comparison. The normalized collective effective dose equivalent commit- ment from HWR operation is therefore 490 man Sk ( G W a)-'. This is nearly a factor of 3 lower than the estimate given in the UNSCEAR 1982 Report, and is entirely due t o lower reported discharge figures. About 6% of total nuclear generated electric energy arises from HWRs and about 10% from LWGRs and GCRs, so the electricity production weighted contri- bution to collective dose is 32 man Sv (GW a)-' from HWRs and an additional 7.7 man Sv (GW a)-' from GCRs and LWGRs. Although LWR releases arc lower, because of their larger electric production, LWRs add 17 man Sv (GW a)-'. In summary. the present practices of reactor operation and reprocessing lead to a total collective effective dose equivalen~ commitment of 6 man Sv (reprocessing) plus 57 man Sv (from HWR, LWR, LWGR and GCR operation), i.e., 63 man Sv (GW a)-'. This commitment is received over some 10000 years, while the temporal distribution is shown in Table 70 to be 3% in 10 years, 10% in 100 years and 19% in 1.000 years.
D. IODINE- 129
188. When released to the atmosphere. iodine, because of its environmental mobility, becomes rapidly incor- porated into foodstuffs ingested by individuals. The highest concentrations of iodine occur in sea water and, as with "C. the greatest uncertainties surround the transfer of Iz9I to deep oceans and any sedimenta- tion that may remove activity from any biological chain.
189. Assuming again a future global population of loL0, the Committee used a collective effective dose equivalent commitment of 1.4 lo4 man Sv TBq-' released [UI]; of this, some 0.003% is delivered within 100 years of release. 0.03% in 10,000 years. 5% in lob years. thus leaving 95% of the collective dose to be delivered from 1 million years after release, most of i t coming between 10 million and 40 million years. For this report incomplete dose commitments to lo6 years are used so that the value of Iz9I is 700 man Sv TBq-'.
190. The normalized releases from Sellafield and Cap de la Hague from 1980-1985 averaged about 40 GBq (GW a)-' to the sea and 4 GBq (GW a)-' to the the atmosphere, giving a total of 44 GBq (GW a)-'. which, when weighted for the fraction of fuel that is reprocessed, gives 2.2 GBq (GW a)-'. The correspond-
ing incomplete collective effective dose conlmitment to 10,000 years is 1.5 man Sv (GW a)-'. The incomplete value to lo4 vears is 0.0093 man Sv (GW a)-' and for 100 years 0.0008 man Sv (GW a)-'. as shown in Table 70.
VI. TRANSPORT
191. Materials of various types are transported between the installations involved in the entire fuel cycle. The amounts and distances depend on the number of facilities and the degree to which different facilities are located together. An estimate is given in Table 71 of the transport needs in a complete nuclear fuel cycle; this has been adapted from the report of the International Fuel Cycle Evaluation (INFCE) [I 151. In general, mills are located together with mines, and tailings are disposed of close by, so that there is no significant requirement for transport of \,cry large quantities of ore or wastes. The other major transport requirements shown in Table 71 can not be eliminated by co-location. as other factors will dominate the siting requirements. IAEA has continued to work towards a full assessment of the radiological impact of transport and have recently published the preliminary findings of a technical committee [P13]. The general conclusion was that, although the data available were incomplete, the indications were that exposures result- ing from normal transport operations were low both for workers and members of the public.
192. The estimates made during the course of the IAEA study of occupational collective doses from the transport of fuel cycle materials were a recognized cautious estimate of 19 man Sv for the United States as a projection for 1985 [Nl I] and a more realistic estimate of 0.14 man Sv for the United Kingdom in 198 1 [GI]. Estimates of less than 0.01 man Sv were made for selected operations in France, Italy and Sweden, but these could not be normalized to energy production. Using the energy production figures for the appropriate years gives normalized collective effective dose equivalents of 0.5 man Sv ( G W a)-' for the United States and 0.04 man Sv ( G W a)-! for the United Kingdom. Noting that the United States assessment was pessimistic, but that the United Kingdom assessment did not include the transport associated with uranium mining and milling. an overall estimate of 0.2 man Sv (GW a)-' is probably reasonable.
193. Doses to members of the public were also estimated as part of the work of the IAEA committee. based again on submissions from the United States and the United Kingdom. The estimate for the United States was 19 man Sv for 1985 [N 1 I], the same as that for occupational exposure, whereas that for the United Kingdom was several orders of magnitude lower, at 0.001 man Sv for 1981 [GI]. No estimates were available for other countries. Based mainly on the more realistic British assessment, it seems reason- able to conclude that public exposure from transport is less than occupational exposure and to adopt a n estimate for the normalized collective effective dose equivalent of 0.1 man Sv (GW a)-'.

VII. SUMMARY
194. In the UNSCEAR 1982 Report the Committee carried out a thorough assessment of the exposures to the public from nuclear power production. In this Report the same basic assumptions and environmental transport models are used to carry out a revised assessment based on discharge data for the quin- quennium 1980- 1984. Some aspects of waste disposal have been treated here in more detail, especially the long-term impact of uranium mill tailings and the disposal of solid low- and intermediate-level wastes by burial on land. The contribution from reprocessing is based more closely on the results being obtained at operating plants rather than on the notional plant used in the previous report. Occupational exposures from the various stages in the fuel cycle are reviewed in this Annex in association with the other exposures from released radioactive materials.
195. .4 summary of the local and regional normalized collective effective dose equivalent commitments from the nuclear fuel cycle is shown in Table 72. The total of 4 man Sv (GW a)-' is essentially the same figure as that derived in the UNSCEAR 1982 Report if the contribution from uranium mine tailings is excluded, although in this Annex reprocessing is added explicitly, whereas a notional plant was used for the UNSCEAR 1982 Report. Contributions other than radon arise mainly from routine atmospheric releases from reac- tors and the liquid discharges from reprocessing. Effectively, all of these dose commitments are received within one to two years of discharge.
196. The normalized collective effective dose equi- valent commitments from the long-term releases from solid waste disposal are shown in Table 73. T h e dominant contribution, as was recognized in the UNSCEAR 1982 Report, is from mine and mill tailings. The numerical estimate is roughly proportional to the length of time for which release of radon is assumed to occur. The estimate of 150 man Sv ( G W a)- ' corresponds to 10000 years for a tailings pile with a reasonable co\nering. The estimate for disposals of LLW and ILW are for the release from the disposal sites for all time. but a large proportion of the dose is received within about 10"ears from the date of disposal. This applies also for the globally dispersed radionuclides shown in Table 73. as these are domi- nated in terms of the normalized contribution by ''C.
197. The contributions of the various stages of the fuel cycle to occupational doses are summarized in Table 74. The dominant contribution is from reactor operation, itself based mainly on recent experience with LWRs in the United States but with considerable data from many other countries.
198. The per caput doses from existing nuclear power production are estimated from the contribu- tions to collective dose commitment in the short term. This collective dose commitment is from local and regional collective doses and from occupational ex- posure. i.e.. 4 and 12 man Sv (GW a)-'. respectively (Tables 72 and 74). Assuming a global population of 5 lo9, the per caput dose would be 3 nSv ( G W a)-'. The energy production from nuclear power in 1987 is about 190 G W a (Table 2). so that the annual per caput dose is estimated to be 0.6 uSv.

l d b l e 1
World nuclear qeneratlng CdDaCltV. 1981 (Net capaclty In glgnwdtts and number ot unlts In pdrentheSe5)
1 1 1 1
Reactor type installed Country Total cdpaclty
CaDaCtty per capur PWR BWR GCR H M LWGR f 8R ( t i )
Argent lna 0.94 (2) 0.94 0.031 Belglum 5.49 (7) 5.49 0.55 Bra211 0.63 (1) 0.63 0.001 Bulgzrla 2.59 ( 5 ) 2.59 6-79 Cdnada 12.10 (18) 12.10 0.41 Chlna (Talwan Provtnce) 1.81 (2) 3.10 (4) 4.92 0.75 Czechorlovak la 3.20 (8) 3.20 0.21 Flnland 0.89 (2) 1.47 (2) 2.31 0.41 France 46.46 (46) 2.01 ( 4 ) 1.43 (2) 49.80 0.90 German Omcrallc Rep. :.69 (5) 1.69 0.10 Germny. federal Rep.of 11.13 (11) 6.89 (7) 0.30 (7) 0.02 (I) 18.95 0.31 nunga ry 1.65 (4) 1,65 0.15 lndla 0.30 (2) 0.85 (4) 1 . I5 0 002 Italy 0.26 (I) 0.86 (1) 1.12 0.02 Japan 11.91 (16) 14.64 (19) 0.16 (1) 0.15 (1) 26.90 0.22 Netherlands 0.45 (1) 0.06 (I) 0.51 0.04 Patlstan 0.13 (1) 0.13 0.001 Republlc of Korea 4.75 (6) 0.63 (1) 5.38 0.13 South Atrtca 1.84 (2) 1 .@4 0.05 Spat n 4.68 ( 6 ) 1.31 (2) 0.48 ( I ) 6.53 0.16 Sweden 2.63 (3) 6.83 (9) 9.46 1.14 Switzerland 1.62 (3) 1.31 (2) 2.93 0.45 USSR 16.87 (25) 0.05 (I) 15.98 (21) 0.10 (3) 33.60 0.12 Untted Klngdom 9.90 (36) 0.09 (1) 0.2 (I) 10.21 0.18 Unlted States 63.57 (70) 29.1 (35) 0.33 (1: 92.98 0.38 Yugosldvla 0.63 (I) 0.63 0.03
Totdl 183.63 (225) 68.02 (85) 13.01 (45) 14.68 (28) 15.98 (27) 2.38 (7) 297.93 0.14 (411)
l a b l e 2
llectrlclty generated by nuclear power. 1987 1 1 1 1
Country Llectrlc Percentage energy o f total
generated electrlclty (GW a) generated
-
Unlted States 51 - 9 France 28.7 USSR 21.3 Japan 20.8 Germany. Federal
Repubilc of 14. l Canada 8.32 Sweden 7.35 Unlted Klngdom 5.58 Belg\um 4.52 Spa 1 n 4.51 Republlc of Korea 4 .21 Chlna (Taluan Province) 3.58 Sultzerland 2.48 Czechoslovakia 2.36 Flnland 2.11 Bulgaria 1.31 German Democratic Rep. 1.18 Hungary 1.18 South Afrlca 0.71 Argentlna 0.68 1 nd la 0.54 Yugoslavla 0.49 Netherlands 0.39 Brazll 0.10 Paklrtan 0.03 Italy 0.01
Total 189
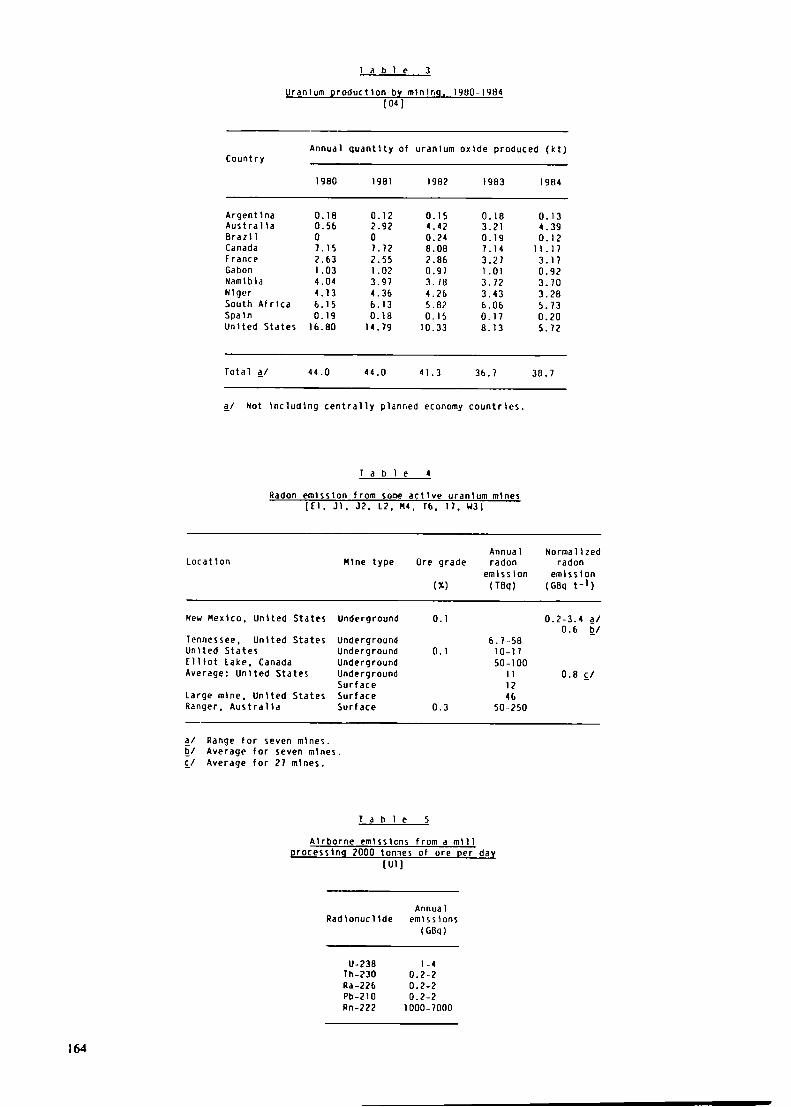
T a b l e 3
Uranium ~ r o d u c t l o n by mln lnq. 1980-1984 [ 04 I
Annual a u a n t l t y of uranlum ox lde produced ( k t ) Country
1980 1981 1982 I983 1984
Argent lna 0.18 0.12 0.15 0.18 0.13 A u s t r a l l a 0.56 2.92 4.42 3.21 4.39 B r a z l l 0 0 0.24 0.19 0.12 Canada 7.15 1.72 8.08 7.14 11.17 France 2.63 2.55 2.86 3.27 3.17 Gabon 1.03 1.02 0.91 l . O l 0.92 Namlbla 4.04 3.97 3.78 3.72 3.70 N lger 4.13 4.36 4.26 3.43 3.28 South A f r i c a 6.15 6.13 1.82 6.06 5.73 Spaln 0.19 0.18 0.15 0.17 0.20 U n l t e d S ta tes 16.80 14.79 10.33 8.13 5.72
T o t a l a/ 44.0 44.0 41.3 36.7 38.7
a/ Not l n c l u d t n g c e n t r a l l y planned economy c o u n t r i e s .
T a b l e 4
Radon emlss lon f rom sone a c t l v e uranlum mlnes [ E l . J1. JZ. LZ. M4. 16. 17. U3]
Loca t lon Annual Norma l l red
n l n e t y p e Ore grade radon radon emlss lon emlss lon
( X ) (18~1) (G8q t - l )
New Uexlco. U n l t e d S ta tes Underground 0.1
Tennessee, U n l t e d S ta tes Underground Un l ted S t a t e s Underground 0.1 I l l l o t Lake. Canada Underground Average: U n l t e d S ta tes Underground
Sur face Large mlne. U n l t e d S ta tes Sur face Ranger. A u s t r a l l a Sur face 0.3
a/ Range f o r seven mlnes. b/ Average f o r seven mlnes. C/ Average f o r 27 mlnes.
T a h l e 5
A l rborne ernlsslans from a m l l l p r o c e s s l n q 2000 tonnes o f o re per day
l Ul I
Annua 1 Rad lonuc l lde ernisslons
(GW)

T a b l e 6
Radon emanatlon from uranlum mill talllnqs piles [BPS. 834. C10, H14. L1, NS. R2. R3]
Radon emanatlon Annua 1
Locat ion Talllngs rate per Area radon management unlt area emanat Ion
- 2 -1 (Bq m s (ha) (TBq)
Argent lna Chubut (1984) Malargue (1984) Malargue (1985) Cordoba ( 1985) Salta a/ (1984) St. Rafael (1983)
Austral la Rum Jungle Uncovered 1.3 3 0 13
3 m capplng < 0.07 3 0 < 0.7
Canada llllot Lake Vegetated 1.2-4.0 400 300
Unvegetated 3.5
indla Jaduguda Uncovered 1.1 12 4
Unlted States (Temperate) Uncovered 10 40 120
1 m clay 0.3 4 0 4 (Seml-arld) Uncovered 10 9 0 300
Impermeable dam 0.1 9 0 3 Salt Lake City Uncovered 18
Covered 7 Ambrosla Lake 4
a/ This mlne and mlll 1s at an altltude of ZOO0 m.
T a b l e 7
Optlons for treatment o f uranium mlll talllnqs piles and relatlve effects on radon release rates
[ N5 I
Predlcted radon exhalatlon rate at 1000 years
Optlon relatlve to base case a/ Inltlal value
(0) Bare talllngs pile 1.4 ( 1 ) 1 m top cover of silt/sand 0.73 (2) 3 m top cover o f sllt/sand 0.58 (3) 1 m top cover of clay 0.45 (4) As ( 1 ) ulth eroslon protectlon b/ 0.29 (5) As (2) ulth erosion protectlon b/ 0.039 (6) As (3) ulth eroslon protectlon h/ 0.0027 (7) Bare talllngs below ground level
covered ulth 3 m clay-shale 2.7 10-7 (8) As (7) ulth rock surround and
gravel capptng 2.5 10-7
a/ Base case Is the bare talllngs plle. - b/ Crushed rock around exterlor slopes and a gravel cap
over the top surface.

T a b l e 8
Collectlve effective dose eaulvalent comnltments - per unlt actlvlty released
In alrhorne releasel from uranluln 111lnes ant1 nil 11s
Normallzed collectlve Radlonucllde effectlvc dose
equlval~nt comnltment [man Sv (18q)-l]
T a b l e 9
Truncated collectlve dose comnltments from radionuclides released from talllnqs plles g/
[NSI
Truncated collectlve effectlve dose equivalent comnitment (man Sv)
Management scenarlo 100 years 1000 years 5000 years 10000 years
Reglon Contl- Reglon Contl- Reglon Contl- Reglon Contl- nent nent nent nent
Base case 4 6 Optlon 1 12 OptIon 2 2.8 Optlon 3 0.6 Optlon 4 12 Optlon 5 1.6 Optlon 6 0.1
g/ Treatment options are llsted ln Table 7. The base case ls the bare talllngs plle. The collectlve effectlve dose eaulvalent comnltments from optlons (7) and (8) are less than 0.01 man Sv.

T a b l e 10
Occupational exposures o f underground uranlum mlners lA4. E l l . 837. f 3 . S8. 22)
Annual r o l l e r t l v e Annua 1 Number o t workers et t e c t l v e dose average
monl t o r e d e q u i v a l e n t (man Sv) e f t e c t l v e dose
Country Year equ lva len t t a m Radon E x t e r n a l Radon and I t s a/
exposed exposed r a d l a t l o n daugh te rs (mSv)
f rance
Canada 1980 7 124 - b/ 4 0 5 b/ 1981 6140 6837 7.0 k/ 58 10 b/ 1982 7160 6159 18.7 5 1 11 1983 6290 4428 18.0 40 12 1984 5850 3970 15.6 33 11 1985 5810 3930 12.5 29 10 1980 1609 6. 2 2 5 23 c/ 1981 1380 4.7 I8 21 c/ 1982 1301 5.6 19 23 L/ 1983 1281 1281 5.0 16 25 E/ 1984 1384 1384 4.6 15 19 c/ 1985 1388 138e 4.8 13 I 8 c/
U n l t e d S t a t e s 1980 7600 7556, 27.0 68 12 1981 3790 27 7 d_/ 1987 21 20 1 4 7 d_/
a/ Average f o r those exposed t o gamna-radtat lon p l u s average t o r those exposed t o radon and I t s daughters, except where noted. T h l r procedure mlght l ead t o an overes t ima te .
b/ There was no m o n l t o r l n g f o r e x t e r n a l r a d l a t l o n I n 1980; da ta t o r 1981 a r e n o t f o r a complete year .
c/ Include: t h e t o l l o u l n g va lues o t annual c o l l e c t l v e e f f e c t i v e dose e q u l v a l e n t (man Sv) f rom m i n e r a l dus t . f o r which a convers lon o f 34 Bq m ~ v - I was taken : 1980. 6.0; 1981. 5.6; 1982. 5.4; 1983. 10.5; 1984. b.4; 1985. 7.7.
d/ Radon and daughter exposure o n l y .
Hadon and radon dauqhter exposures -- - of Canadldn and Australian sur face uranlum mlners
1414. AH. r 9 ]
Annua 1 Annua 1 Number cf t o 1 l e c t l v e average
Country Year workers c t t e c t l v e e f t e c t l v e monitored dose dose
equ lva len t e q u l v a l e n t (man Sv) (msv)
Canada lYBU 1981 1982 1983 1984 1985
A u s t r a l l d Nabar lek 1981/82 Ranger 1985/86
$ 1 Less t han 0.05 mSv.

T a b l e 12
Effluent dlscharqes from selected fuel converslon. enrtchment and fabrlcatlon plants. 1980-1985
LA^. 01. 82. 83. Be. 616. 829. 11. n71
Llqu\d dlschdrge: (GBq) Locatlon and nucllde
Unlted Klngdom Capenhurst (enrlchment)
U-234 0.64 U-235 0.03 U-238 0.64 Th-234 0.65 Tc-99 1 I
Sprlngllelds (converslon. fabrlcatlon) Uranlc alpha 900 Urantc beta 131000
Canada (fabrlcatlon) (average values per year) Port Hope Uranlum 0.09 Toronto Uranlum 3.9 Peterborough Uranlum 0.002 Varennes Urantum 0 Monc ton Uran l um < 58
Atrnospherlc dlscharqes (GBq) Locatlon and nucllde
Unlted Klngdom Capenhurst (enrlchment)
U-234 0.15 0.26 0.20 0.35 0.05 0.003 U-235 0.01 0.01 0.01 0.02 0.002 0.0001 U-238 0.15 0.26 0.20 0.35 0.05 0.003 Th-234 0.15 0.27 0.20 0.36 0.05 0.003
Sprlngflelds (converslon. fabrlcatlon) Uranlc alpha 10.0 2.0 2.0 1 .O 1.0 1 .O Uranlc beta 10.0 2.0 2.0 1.0 1.0 1.0
Canada (fabrlcatlon) (average values per year) Port Hope Uranlum 0.002 Toronto Uranlum 0.004 Peterborough Uranlum 0.0002 Varennes Uranlum 0 Monc ton Uranlum 4 8
T a b l e I3
Normallzed effluent dlscharqes from model fuel converslon, enrlchment and fabrlcatlon facllttles
[Mas (~ud)-l I
Atmosphere Aquatlc Radlo- nuc l lde
Convcrslon Cnrlchment fabrlcatl~n Converslon Cnrlchment Fabrlcatlon

T a b l e 14
Normallzed collectlve effectlve dose equlvalent comnltment from the model fuel fabrlcatlon faclllty
Normal \zed collect lve effectlve dose
equlvalent comnltment (10-3 man Sv (GW a)-)]
Rddlonucllde
Inhalatlon Deposlted actlvlty
Total (rounded) 2.6 0.2
T a b l e 15
Occupational exporure trom urar~lum tuel fabrlcatlon [A4, 812. U23. H8. 13. 14. 15. 16. 116. 53. NZ. PI41
Annua 1 Annual Normal \zed collectlve average collectlve
Country Year Number of eifectlve effectlve effectlve workers dose dose dose
monltored equlvalent equlvalent equlvalent (man Sv) (mSv) [man Sv (GW a)-]]
Argentlna 1981 1982
Canada
Japan
United Klngdom
Unlted States 1980 5900 1 1 . 1 1 1.9 0.23 1981 5942 9.40 1 .b 0.18

T a b l e 16
Occupatlonal external exposures from plutonium fuel fabrlcatlon. 1977-1982 Ins1
Annual Annual collective average
Country Year Number of effectlve effectlve workers dose dose
monltored equlvalent equlvalent (man SV) ( m ~ v )
Japan 1911 114 0.9 0.13 1918 134 0.8 0.10 1979 225 I .O 0.23 1980 198 1.1 0.33 1981 200 2.5 0.50 1982 266 2.2 0.58
T a b l e 17
Noble ases dlscharqed In alrborne effluents from PWRs. 1980-1985 [AI. h6, 85, 819, 0396. C4. FI. F4, 53. KI. 51. 52. 53, 55, 59, 510. T3, 14, 15, 18. 19, 1101
Electrlclty Actlvlty (TBq) Start-up generatlng
Country and reactor year capaclty (GW) 1980 1981 1982 1983 1984 1985
Belglum Doe1 1.2.3 1974/75 Tlhange 1.2 1975
France Blayals 1.2.3.4 Bugey 2,3,4.5 Chtnon 81.B2 cnooz Cruas 1.2.3.4 Damplerre 1.2.3.4 Fessenheim 1.2 Gravellnes 1-6 Paluel 1.2 St. Laurent 81.2 Trlcastln 1.2.3.4
Germany. Federal Rep. Blblls A.B Grafenrhelnfeld Neckarwestheim Obrlghelm Stade Unterweser Grohnde Phlllppsburg 2
Italy Trlno
Japan Genkal 1.2 1975/81 Ikata 1.2 1977/82 Ylhama 1.2.3 1970/72/76 Oh1 1,2 1979 Sendal 1.2 1984 Takahama 1.2 1974/75
Netherlands Borssele 1973
Sweden Rlnghals 2 197 5 Rlnghals 3 1980 RInghals 4 1982

Table 17. contlnued --
tlectrlclty Actlvlty (T8q) Start-up generatlng
Country and reactor year capaclty ( GW) 1980 1981 1982 1983 1984 1985
USSR Armenlan 1.2 Kalinln 1 Kola 1.2 Kola 3 Nlkolaev 1 Novovoronezh 1.2 Novovoronezh 3,4 Novovoronezh 5 Rovno 1.2 Zapororhe 1
United States Arkansas One-l Arkansas One-2 Beaver Valley Calvert Cliffs 1.2 Crystal RIver Davls 8esse Olablo Canyon Donald C. Cook 1,2 farley 1 Farley 2 fort Calhoun H.8. Robinson Haddam Neck lndlan Point 1,2 Indian Polnt 3 Kewaunee Halne Yankee McGulre 1.2 Hillstone Pt. 2 tiur t h A r m Dcunee Pa I isades Yolnt Beach 1.2 Pralrle Island I,? R.E. Glnnd Rancho Seco 1 Salem 1 Salem 2 San Unof re 1 '
San Onofre 2,3 Sequoyah St. Lucle 1 St. Lucie 2 Surry 1,2 Three llle lsland 1 Three 'ile lsland 2 TrI 2/EPICOR Trojan Turkey Point 'dlrgll C. Sumner "olf Greek Yankee Rode ZIon 1.2
Total annual electrtc energy generated (GW a)
Normallzed actlvlty [r8q (Gw a)-I]
Average normallled actlvlty, 1980-1984 [ T B ~ (LW a)-lj

T a b l e I8
Isoto~lc com~osltlon, of noble gar dlrcharger from PURs ln the Unlted States. 1982
[T51
Reactor Start-up year
Arkansas One-l Arkansas One-2 Beaver Valley 1 Calvert Cllffs 1.2 Crystal Rlver Oavl5-Besse 1 Oonald Cook 1.2 farley 1 Farley 2 Fort Calhoun I H.8. Robinson Haddam Neck Indlan Polnt 1.2 Indlan Point 3 Keuaunee nalne Yankee &Gut re Millstone 2 Horth Anna 1.2 Oconee 1,2.3 Pal lsades Polnt Beach 1.2 Pralrle Island 1.2 R.E. Glnna Rancho Seco 1 Salem I Salem 2 San Onofre I San Onofre 2.3 Sequoyah 1.2 St. Lucle 1 Surry 1.2 Three Hlle Island 1 Three Mlle island 2 TMI Z/EPICOR Trojan Turkey Polnt 3.4 Vlrgll C. Sumner Ydntee Roue Zlon 1.2
Electrlc Actlvlty (Tea) energy
generated (CU a) Ar-41 Kr-85m Kr-85 Kr-81 Kr-88 Xe-13lm Xe-133m Xe-133 Xe-135m Xe-135 Xe-138
0.424 - 0.006 0.168 - 0.001 0.285 0.289 111.333 - 3.978 - 0.435 - 0.815 0.653 - 0.002 1 .I90 0.720 336.404 - 25.226 - 0.307 - 0.093 - 0.086 0.028 4.621 0.004 0.009 - 1.182 0.010 2.039 - 1.001 0.021 2.520 0.859 290.742 - 2.923 - 0.561 5.439 1.180 50.690 0.141 0.451 21.241 1.910 176.585 2.819 12.841 15.133 0.367 - 0.234 - 0.090 0.030 18.901 0.059 0.385 0.158 1.409 0.051 0.231 0.801 0.134 0.096 0.437 0.522 119.120 - 2.205 - 0.595 0.433 6.438 0.958 6.882 6.882 0.633 1.432 335.069 0.052 895.403 0.981 0.605 1.084 0.002 0.718 0.201 0.074 0.060 0.238 119.311 - 9.253 - 0.397 0.237 0.010 0.422 0.004 0.007 0.181 0.071 11.707 0.001 0.164 0.005 0.257 0.296 0.005 0.006 - 0.002 0.014 0.327 5.588 - 0.247 - 0.518 0.001 0.042 3.811 0.013 0.031 0.046 0.240 22.388 0.008 1.269 0.011 0.508 - 0.651 5.476 2.113 0.688 2.287 2.309 289.346 0.158 6.957 0.002 0.164 - 0.275 0.514 0.005 0.015 0.122 0.662 90.661 0,006 2.802 0.002 0.436 0.262 - 0.154 - 0,001 0.151 - 0.095 - 0.516 - 0.254 0.056 3.569 - 0.267 - 0.491 17.464 0.298 0.154 - 0.271 36.1120.012 6.586 - 0.572 0.080 5 . 6 2.938 3.474 5.581 0.032 2.017 289.984 3.152 41.904 0.751 0.736 0.008 0.032 0.566 0.007 0.015 0.418 0.597 178.164 0.013 6.841 0.006 1.221 0.004 0.367 16.293 0.010 - 6.439 6.550 851.126 - 13.211 - 0.382 9.250 0.011 0.154 0.011 0.016 0.088 0.008 272.321 0.037 0.073 - 0.720 0.273 1.806 2.586 1.465 3.226 0.012 0.3IO 15.811 0.899 7.920 2.409 0.887 0.004 0.085 0.207 0.035 0.049 0.084 0.088 19.580 0.010 0.155 0.005 0.275 0.002 0.001 0.581 0.004 0.004 0.629 0.235 70.300 0.047 0.525 0.005 0.384 0.028 0.142 0.139 0.040 0.018 0.002 0.336 51.430 - 2.542 - 0.467 0.001 0.015 0.021 - 0.009 - 0.001 8.329 0.283 0.047 - 0.906 - 0.011 - 0.043 41.159 - 0.003 - 0.058 - 0.001 0.500 - 0.005 2.623 - 0.058 - 0.014 0.025 0.001 - 0.001 - 0.001 0.215 0.002 0.009 - 0.560 0.548 0.622 0.055 - 0.44 3.811 195.738 - 10.954 - 0.773 1.228 11.507 2.087 1.289 12.987 ll.410 4.700 147.435 3.959 55.130 4.136 1.251 0.149 0.670 2.472 0.012 0.125 - 3.885 751.100 - 20.646 -
- 18.056 - - 15.762 - 0.548 0.011 0.082 0.269 0.061 0.016 0.196 0.205 28.864 0.247 1.758 0.138 0.868 1.706 0.282 0.622 0.074 0.286 1.913 2.605 128.900 0.172 4.144 0.034 0.022 - 5.180 - 0.101 0.079 0.068 0.013 0.80 0.126 0.087 0.031 1.985 1.735 1.102 0.154 1.125 2.316 0.944 0.480 48.470 1.188 0.153 13.507 477.514 2.224 10.408 0.095
Total annual electrlc energy generated (GI a) 21.042
Hormallzed actlvlty Iraq ( w a)-ll

T a b l e 19
noble ares dischar ed In alrborne effluents from BURS. 1980-1985 [85. 82O.'rl. 33, K1. z1. S2. 53. S5. S9. 510. T3. 14. 15. T8. 79. Ti01
Electrlclty Actlvlty (189) Start-up generating
Country and reactor year capaclty (Gu) I980 1981 1982 1983 1984 1985
F lnland Olklluoto
Germany. Federal Rep. of Brunsbittel 1976 0.770 6.1 25.1 23.4 1.9 30.0 19.0 Gundrermlngen 1984 2.49 0.16 0.021 Isar 1977 0.870 28.0 20.0 13.0 22.0 26.0 27 .O Krumnel 1983 1.26 0.0008 0.15 0.95 Phlllppsburg 1 1979 0.864 21.0 0.2 17.0 28.0 5.3 0.035 Wirgassen 1971 0.640 290.0 118.0 17 .O 23.0 43.0 1 1 -0
Italy Caorso
Japan fukushlma 1-1.2
3.4.5.6 fukushlma 11-1.2 Hamaoka 1.2 Onagawa Shlmane Tokal 1 1 - 1 Tsuruga 1
Netherlands Oodevaard 1968 0.052 74.4 38.4 38.5 23-68 24.79
Sweden Barreback 1 1975 0.59 2.1 400.39 662.43 70.1 0.71 0.16 Barreback 2 1976 0.59 2.3 1.702 1.405 7.297 0.90 0.29 Forsmark 1 1980 0.90 0 0.40 11.89 0.22 1.941 71 Forsmark 2 I981 0.90 0 0.147 11.5 23.38 232 Oskarshamn 1 1970 0.46 5247 3696.12 1417.02 870 680 533 Oskarshamn 2.3 1974/85 1.65 309 421.22 110 53.51 45 47.6 Rlnghals 1 1974 0.75 2800 15000 20000 1500 1040 1280
USSR VK - 50
Unlted States 819 Rock Polnt 1963 Browns Ferry 1973/77 Brunswlck 1975/77 Cooper 1974 Oresden 1 1960 Dresden 2.3 1971/72 Duane Arnold 1 1975 Fltzpatrlck I975 Grand Gulf 1982 Hatch 1 1975 Hatch 2 1979 Humbolt Bay 1963 Lacrosse 1969 Lasalle 1982 Millstone 1 1971 Montlcello 1971 Nlne Mlle Polnt 1969 Oyster Creek 1969 Peach Bottom 1974 Pllgrtm I972 Quad Cltles 1973 Susquehanna 1983 Vermont Yankee 1912
Total annual electrlc energy generated (GW a)
Normallzed actlvlty [Tap (Gw a ) - 1 )
Average normallzed actlvlty. 1980-1984 [TBq (Gh' a)-)] 2150 i 523

T a b l e 20
I s o t o p l c c o m ~ o s l t l o n o f n o b l e pas d l scharqed f rom BURS I n t h e U n l t e d S ta tes . 1982 [ i s 1
t l e c t r l c A c t l v l t y (T8q) S t a r t - u p energy
Reac to r year genera ted (GW a ) Ar-41 Kr-83m Kr-85m Kr -85 Kr -87 Kr-88 Kr-89 K r - 9 0
B l g Rock P o l n t 1963 0.041 7.067 8.140 - 33.485 22.829 19.980 22.422 Browns F e r r y 1973/77 1.964 418.100 - 950.900 492.100 355.940 2471.600 - Brunswlck 1975/77 0.551 703.000 - 777.000 - 1883.300 1842.600 - Cooper 1974 0.602 16.983 53.280 0.718 78.070 111.000 0.699 - Dresden 1 1960 Dresden 2.3 1971 1.029 19.462 0.008 6.068 48.100 - Duane Arno ld 1975 0.260 0.013 - 0.035 0.002 0.006 0.032 - f l t z p a t r l c k 1975 0.566 11.803 - 425.500 0.024 714.000 880.600 - Ha tch 1 1975 0.329 2.479 - 27.084 - 1.746 10.138 - Ha tch 2 1979 0.426 1 .702 - 0.178 - 1.173 0.833 - Humbolt Bay 1963 Lac rosse 1968 0.016 6.993 - 6.845 15.133 - L a s a l l e 1982 0.053 Millstone 1 1971 0.465 6.179 - 16.169 9.731 - M o n t l c e l l o 1971 0.276 0.581 0.592 24.383 3.104 1.739 56.610 1 .894 N l n e H t l e P o l n t 1969 0.129 O y s t e r Creek 1969 0.229 36.149 - 122.840 120.990 - Peach Bot tom 1974 1.519 2.875 - 0.335 0.836 0.001 P l l g r l m 1972 0.375 62.160 0.002 11.618 68.450 - Ouad C l t l e s 1973 0.947 32.042 - 9.324 41.440 - Susquehanna 1 1983 0.037 0.021 1.177 1.136 - Vermont Yankee 1972 0.476 0.463 0.002 2.201 1.416 -
T o t a l annual e l e c t r l c energy genera ted (GW a) 10.293
Norma l i zed a c t l v l t y [ T B ~ (GW a ) - ) ] 110.505 2.334 234.114 50.268 315.598 548.947 7.511 2.3b3
Reac to r
E l e c t r l c A c t l v l t y (TBq) S t a r t - u p energy
year genera ted (GW a) Xe-13lm Xe-133m Xe-133 Xe-135m Xe-135 Xe-137 Xe-138 Xe-139
B l g Rock P o l n t Browns F e r r y B r u n s u l c k Cooper Dresden 1 Oresden 2.3 Duane A r n o l d F l t z p a t r l c k Ha tch 1 Hatch 2 Humbolt Bay L a c r o s r c L a s a l l t r M l l l s t o n e 1 M o n t l c e l l o N l n e U l l e P o l n t O y s t e r Creek Peach Oottom P l l g r t m Ouad C I t l e s Susquehanna I Vermont Yankee
T o t a l annual e l e c t r l c energy genera ted (GW a) 10.293
Norma l l zed a c t l v l t y [TRq (GW a ) - ) ]

T a b l e 21
Noble aases dlscharqed In alrborne etfluents from HWRs and LWGRs. 1980-1985 [Al, 819, 836, Ll]
Electrlclty Actlvlty (TBq) Start-up generat lng
Country and reactor year capaclty (GW) 1980 I981 1982 1983 1984 1985
Argent lna Atucha 1 1974 0.335 250 46 19 47 4.7 5.5 tmba1.i~ 1983 0.0 0.0 0.0 0.0 40.9 156
Cdndaa Bruce A 1976/79 2.96 830 61 0 510 670 600 800 Bruce B 1984 0.75 29.0 106 Gentllly 1983 0.685 10.1 25.9 121 Plckerlng A 197 1 /73 2.91 240.0 250 270 350 170 190 Pickrrlng 8 1983/80 1.03 137.0 170 270 Point Lepreau 1983 0.630 0.1 3.9 0.0 0.8
lut'll annual electric energy generated (GW a) 4.531 4.810 4.665 5.752 5.837 7.37
Average normalized activity. 1980-1984 [ ! R q ( G w a)-)]
USSH Chernobyl 1.2 1977/78 2.00 10400 14900 8940 7360 Chernobyl 3.4 1981/83 2.00 - 1770 2 190 Iqnallno 1 1983 1.50 Kur5k 1 . Z 1976/79 2.00 4130 9490 64 10 5830 8300 6600 Leningrad 1.2 1973/75 2.00 - 4700 6200 6300 5600 5200 Lentngrad 3.4 1979/81 2.00 - 1400 3000 4100 4000 2600 :molcnrk 1 i982 1 .OO - 2030 2b00 2500
Total annual electrtc energy generated (Gu a) 3.172 3.017 3.583 4.355 3.5 3.5
Average normallrt*d activity. 1980-1984 1784 ( t k a)-11

T a b l e 22
Actlvatlon qases dlrcharged In airborne eFfluents from GCRs. 1980-1985 181. 82. 83. 816. 829. Fl. F4. HI. H2, H3. H 4 , 53, K1, P5, P9. 511)
Electrlclty Actlvlty (TBq) Start-up generatlng
Country and reactor year capaclty (GW) 1980 198 1 1982 1983 1984 1985
France Chinon 2.3 Bugey 1 St. Laurent A1.2
Italy Latina
Japan Tokal
Unlted Klngdom Berkeley Braduell Chapelcross Oungeness A Oungeness 8 Hartlepool Heysham Hlnkley Polnt A HInkley Polnt 8 Hunterston A Hunterston 8 Oldbury Sizeuell Trausfynydd Wylfa
Total dnnud 1 electrlc energy generated (GW a)
Normalized actlvlty [ T ~ Q (GW a)-)]
Average normallzed actlvlty, 1980-1984 [TBq ( K i a)-I]
T a b l e 23
Trltlum discharged In airborne effluents from reactors. 1980-1985 [85. 817, 818, D3, F1. HI, H2. H3. H4. K1. 11. P5, P9. S1. 52. 53, 55,
Actlvlty (TBq) Country and reactor
Belgium Ooel 1-3 0.1
f Inland Lovl lsa 3.5 3.0 11.0
France Chooz Blayalr 1.2

Table 23, continued
Actlvlty (TBq) Country and reactor
Germany. Federal Rep. of Blblis A.8 4.6 2.5 Grafenrhelnfeld 0.00015 Grohnde Neckaruesthelm 1.9 0.60 Obrlghelm @. 3 0.20 Phll lppsburg 2 Stade 1.6 0.70 Unterueser 0.4 0.40
Netherlands Borssele 0.63 0.68 0.40 0.59 0.59
Unlted States Arkansas 1 4.773 Arkansas 2 0.075 Beaver Valley 0.176 Callauay Calvert Cllffs 1.2 1.032 Crystal Rlver 0.784 Oavls-Besse 0.220 Dlablo Canyon Donald C Cook 1.2 0.041 Farley 1 22.681 farley 2 fort Calhoun 0.048 H.B. Robinson 0.225 Haddam Neck 2.313 Indlan Pojnt 1,2 0.407 Indlan Polnt 3 0.182 Kewaunee 0.770 Halne Yankee 0.117 HcGulre Hlllstone Pt. 2 31.450 North Anna 2.076 Oconee 0.395 Pal l sddes 0.190 Polnt Beach 1,2 24.161 Pralrle Island 3.193 R.C. Glnna 1.465 Rancho Seco 6.549 Salem 1 Salem 2 San Onofre 1 1.365 San Onofre 2.3 Sequoyah 1 St. Lucle 1 13.801 St. Lucle 2 Surry 1.2 0.677 Three rille lsland 1 0.670 Three Hlle lsland 2 14.578 THI ?/EPICOR 21.616 Trojan 0.551 Turkey Polnt 3.4 0.043 V l r g l l C Sumner Wolf Creek Yankee Roue 0.054 Zlon 1.2
Total annual electrlc energy generated(GWa) 22.29 26.18 28.46 28.99 32.75 24.19
Normallzed actlvlty [Teq (Gw a)-l] 7.453 3.310 4.740 9.215 4.702 1.9
Average normallzed actlvlty. 1980-1984 [TBq (GW a)-I] 5.9 c 2.4

Table 23. continued
kctlvlty (T8q) Country and reactor
rlnland Olklluoto
Germany. Federal Brunrbuttel Gundremnlngen Isar Krumnel Phlllppsburg 1 wiirgassen
Italy Caorso
4e?ner lands Oodeuaard
United States Big Rock Point Browns Ferry arunswlck Cooper Dresden 2,3 Duane Arnold Fltzpatrlck Grand Gulf Hatch 1 Hatch 2 Humbolt Bay Lacrosse Ldsd l le Hlllstone 1 Yont lcel lo kine Pile Polnt Oyrter Creek Peach Bottom Ptlgr lm Quad Cltles Susquehannd Vermont Yankee g'iP-2
Rep. of 0.01
3.1
0.02 0. 6
Total annual electrtc energy generated ( G W a) 11.76 9.245 12.28 11.91 12.50 15.94
Normallzed activity [TBq ( G w a)-]] 5.984 3.671 2.881 2.791 I. 6 5 9 6.249
Average norillallzed actlvlty, 1980-1984 [TBq (GW a)-)] 3.4 k 1.6

Table 23. con t inued
A c t l v l t y (TBq) Country and r e a c t o r
H W R S
Argen t ina Atucha 240 710 300 630 200 250 Embdlse 7.33 29.5
Canacla Bruce A 1554 3404 151 1 3700 2553 I500 Bruce B 3 99 G e n t i l l y 0.69 14 53.2 P l c k e r i n g A 660 59 2 666 629 430 390 P l c k e r l n g B 25 4 6 144 P o l n t Lepreau 25 68 110
T o t a l annual e l e c t r i c energy g e n e r a t e d ( G W a ) 4.531 4.810 4.665 5.152 6.408 7.370
r iorrnal ized a c t l v l t y [Teq (GU a ) - ] 1 541.5 874.5 532.3 871.0 518.3 348.9
Average f iormal ized a c t l v l t y . 1980-1984 [ l B q (GW a ) - 1 ) 670 t 190
G C R :
I t a l y L a t i n a 0.07 0.07 0.90
Un i ted Klngdorn Hunterston A 2 .2 2 .0 1 .6 1.4 Hunterston 0 2.2 4.1 3.4 4.6 Oldbury 0.5 1 .6 0.3 1.1 S i zedel l Tra.:f ynydd 3.7 Wyl ta
l o t a l annual e1ecrr ;c energy generated (GW a ) 1.346 1.252 1.41 1.39 1.45 0.379
t iormal lzed a c t i v i t y [TBq (Gw a ) - 1 ) 6.44 6.21 4.40 5.10 4.76 1.135
Average norm11zeG a c t l v l t y . 1980-1984 [ r e p (CM a ) - I ] 5.4 t 0.9

Trltlum dlscharqed In llauld effluents from reactors. 1980-1985 [as. 86. 87. B17.818. 829. 03. F4. HI. HZ. H3. H4, KI, LI, PI. PS, P9.
51. 52. S3. 55. 59. 510. 511. T3. T4. T5. T8. 19. 1101
Actlvlty (TBq) Country and reactor
Belglum Doe1 1,2 24.8 T l hange 12.4
f Inland Lovllsa 1.2 3.7
f rance Blayals 1.2.3,4 8ugey 2.3.4.5 5 3 Chlnon 81 .2 Chooz 110 Cruas 1.2.3.4 Damplerre 1.2.3.4 7 fessenhelm 1.2 28 Gravellnes 1.2.3.4 4 Paluel I,2 St. Laurent 01.2 - Trlcastln 1,2.3.4 10
Germany. federal Rep. of Blblls A,B 35 Grafenrhelnfeld Grohnde Nectarwesthelm 3 Obr lghelm 3.3 Phl l lppsburg 2 Stade 2.3 Unter~eser 8.8
Italy Trlno 37.4
Netherlands Borssele
Sweden Rlnghals 2 13 Rlnghals 3 0.7 Rlnghals 4
USSR Armenlan 1.9
Unlted States Arkansas 1 Arkansas 2 Bedver Valley Callauay Calvert Cllffs I Crystal Rlver Davls Besse Olablo Canyon Donald Cook 1,2 Farley 1 Farley 2 Fort Calhoun Fort St. Vraln Grand Gulf H.8. Roblnson Haddam Neck Indlan Polnt 1,2 Indlan Polnt 3 Kewaunee Ualne Yankee UcGuire Millstone Pt. 2 North Anna Oconee

Table 24. continued
A c t l v l t y (TBq) Country and r e a c t o r
Pal isades 2.764 10.286 P o l n t Beach 1.2 28.157 24.124 P r a l r i e I s l a n d 20.091 20.794 R.E. Glnna 5.920 8.880 Rancho Seco 0.0005 3.089 Salem 1 18.241 Salem 2 31.191 San Onofre 1 38.110 10.989 San Onofre 2.3 Sequoya S t . Luc le 1 10.064 12.025 St . Luc le 2 Sur ry 1,2 14.245 19.647 Three M i l e I s l a n d 1 1.206 0.263 Three M l l e I s l a n d 2 0.000022 0.0014 T ro jan 4.588 3.811 Turkey P o l n t 27.713 7.215 V l r g i l C . Sumner - WaterFord Wolf Creek Yankee Rove 2.161 3.811 Zlon 1 .2 27.565 32.190
T o t a l annual e l e c t r l c energy g e n e r a t e d ( G W a ) 29.69 40.55 44.97 53.09 61.74 57.84
Normalized a c t l v l t y [T8q (GW a ) - ' ] 29.43 28.40 25.60 23.42 25.95 25.00
Average norma l l zed a c t l v l t y , 1980-1984 [TBq (Gw a ) - ) ] 27.0 i 1.8

Table 24, continued
Actlvlty (TBq) Country and reactor
1980 198 1 1982 I983 1984 1985
8 W K s
f Inland Olk l luoto 0.58 0.84 0.17 0.82 1 .O I .2
Germany. Federal Rep. of Brunrbittel 0.09 0.8 1.9 1 . I 2.6 0.87 Gundremnlngen - 0.41 1.2 Isar 8.8 10.1 14.6 3.1 1.8 0.47 Krumnel 0.043 0.59 0.16 Phrllppsburg I 0.4 0.05 0.8 1.7 2.0 0.90 Wurgassen 2.1 1.9 1 0.43 0.79 0.71
Italy Caorso 0.2 0.1 9.4
Netherlands Dodevdard 0.6 0.5 0.3 0.22 0.15
Suedrn Barseback 1 ,2 0.79 0.75 0.52 0.68 1 .O 0.58 forsmark 1.2 0.14 1.2 1.1 1 .0 1.2 1.4 Oskarshamn 1.2 0.97 0.6 17.56 0.71 0.54 0.63 Ringhdls 1 1.7 1 .8 1.9 1 .0 0.7 0.525
Untted Stater 8jg Rock Point 0.229 O I L 0.110 0.821 0.041 0.047 Brodns Ferry 0.807 0.884 1.18 1.18 I .23 Brunrulck 0.474 0.836 1.806 3.85 1.25 0.25 Cooper 0.324 0.309 0.336 0.281 0.266 Dresden 2,3 0.294 0.224 0.05 0.00005 1.45 0.28 Duane Arnold - 0.00000008 0.00000005 0.0013 Fltzpatrlck 0.104 0.152 0.024 0.101 0.116 0.11 Hatch 1 0.525 0.429 3.811 3.50 2.97 1.45 Hatch 2 0.396 0.343 1.362 1.26 0.788 0.67 Humboldt Bay 0.0036 0.006 0.002 0.002 0.0006 0.04 Lacrosse 2.664 2.864 2.190 4.59 4.63 4.74 Lasalle 0.034 0.157 0.041 0.014 Millstone 1 l .Ol 0.097 0.229 0.310 0.317 !4ontlcello 0.00002 0.0000001 0.000 t d l n ~ nlle Polnt 0.187 0.215 0.292 Oyster Creek 5.698 0.988 0.183 0.324 0.381 Pmch Bottom 1.38 1.362 0.877 0.747 1.32 PI lgr lm 1.48 1.262 0.219 0.577 0.544 0.16 Ound Cltles 0.381 0.44 0.289 0.144 0.201 0.13 5u:quehanna 0.032 0.332 0.414 Vermont Yankee 0.111 0.259 kHP 0.02 0.055
Total annual electrlc energy generated (GWa) 14.17 14.77 15.85 15.78 16.80 18.0
liormallzed actlvtty [TBq (GW a)-I] 2.227 1 .864 7 . 8 1 1 1 .UOl 1.58 l .Ol
Average normalized actlvlty. 1980-1984 [Taq (Gw a)-]] 2.1 i 0.5

Table 24, contlnued
Actlvlty (T8q) Country and reactor
f rdnre Mugey 1 1 14 1 Chlnon A2.3 4 4 2 St. Laurent Al .Z 16 1 1
Italy Latlna 0.03 0.3 0.5
Unlted Kingdom Berkeley Bradwell Chapelcross Oungenelr A Oungeness 8 Hartlepool Heysman Hlnkley Polnt A Hinkley Polnt 8 Hunterston A Hunter:ton 8 Oldbury Sl leuel 1 Trawsfynydd b4ylta
Total annual electrlc energy generated (GW a) 3.868 4.847 5.382 5.885 6.223 5.738
Normallzed activity [T8q (GW a)-1) 81.5 83.3 95.7 103.7 116.4 86.75
Average normallzed actlvlty. 1980-1984 [TBq (GW a)-1 ] 96 i 13
USSR Chernobyl 3.5 Kursk 2.0
Total annual electrlc energy generated (Gu a) 0.317 0.308 0.356 0.376 0.580
Normallzed actlvlty 1r8q ( ~ w a)-'] 1.734
H H R s
Argent lna Atucha 290 410 310 240 410 370 lmbalse 3.48 16.1
Canada Bruce A 888 740 962 1600 604 1060 Bruce B 0.6 21.5 Gentllly 0.4 8.0 0.05 0.78 14 30.7 I'lckerlng A 48 1 276 3 70 3 70 330 330 Plckerlng 0 44 330 380 Polnt Lepreau 9.1 68 24
Total annual electrlc energy generated (CW a) 4.531 4.810 4.665 5.752 6.408 7.370
Normallled actlvlty Ires (GW a)-11 365.e 796.3 351.4 212.6 234.6 296.1
Average normdllzed actlvlty, 1980-1984 [Teq (GU a)-]] 290 t 68

T a b l e 25
Carbon-14 d l r c h a r g e d f rom r e a c t o r s . 1980-1985 [ E l l . 03. R1. W l ]
A c t l v l t y (GBq) Country and r e a c t o r
P W R s a_/
F l n l a n d L o v i i s a 1
Germany, Federa l Rep. o f B l b l l s A B l b l l s 8 G r a f e n r h e l n f e l d Grohnde Neckarwesthelm 11 ( 9 6 ) Obr lghelm 2 2 P h l l l p p s b u r g 2 Stade 41 ( 7 8 ) Unterweser 2 6
USSR Arrnenlan 400-500 400-500 400-500 400-500 400-500 Kola 3 780 780 780 780 Ko la 4 5 10 Novovoronezh 3 140 140 140 140 140 Novovoronezh 4 140-540 140-540 140-540 140-540 140-540
To ta l annual e l e c t r l c energy genera ted (GW a) 3.654 4.186 7.285 7.020 7.270 7.856
Normal lzed a c t l v l t y [GBq (GW a ) - l ] 329 482 29 7 333 283 3 9
Average norrnal lzed a c t l v l t y . 1980-1984 [GBq (GW a ) - l ] 345 i 80
F l n l a n d TVO 1
Germany. f e d e r a l Rep. o f B r u n s b i i t t e l 30 240 80 0 . 9 240 2 60 Gundremnlngen 300 770 l s a r 180 4.8 340 310 320 Krumnel 550 190 P h l l l p p s b u r g 1 6.3 9 1 200 220 250 Wirgassen 270 270 88 15 280 360
T o t a l annual e l e c t r l c energy generated (GW a) 1.195 1.521 1.275 1.880 3.106 4.117
Normal ized a c t l v l t y [ G B q ( G W a ) - l ] 251.2 457.7 206.9 295.7 434.6 455.8
Average n o r m a l l z e d a c t l v l t y . 1980-1984 [GBq (GW a ) - ) J 330 i 110

Table 25. continued
Actlvlty (GBq) Country and reactor
Argentina Atucha 2300 2700 1800 590 4 50 370
Total annual electrlc energy generated (GW a) 0.2488 0.3021 0.2001 0.2668 0.195 0.1678
HormdIized activtty [GBq(Gwa)-l] 9244 8938 8996 2195 2308 8166
Average normallzed actlvity. 1980-1984 [GBq (GW a)-]] b336 t 3333
USSR Chernoby 1 Ignallno 1 Kursk 1.2.3 Lenlngrad 1.2.3.4 Smolensk 1
Average normallzed actlvlty. 1980-1983 [ 66s (GW a) - 1 ) 1300
a/ Carbon dloxlde. carbon monoxide and hydrocarbon bound values In parentheses.

T a b l e 26
Iodine-131 discharaed In airborne effluents from reactors. 1980-1985 [Al. 85, 817, 818. 819. 836. Dl, f1. HI. H2, H3. H4, 33. K1, L1, P5. P9. 51. S2. 53. 5 5 . 59. S10. Sll. 13. 74. 15, 18. T9. 1101
Activity (GBq) Country and reactor
F Inland Lovi isa 0.002
Germany. Federal Rep. 8lblis A,B Grafenrhelnfeld Grohnde tdeckarues thelm Obrlghelm Phllippsburg 2 Stade Unterverer
Japan Genkai lkata M I h a m 00 I Senda i Takahama
Sueden Ringhals 2 0.01 Rlnghals 3 RInghals 4
USSR Armenlan 1.2 7.8 Kola 1.2 0.257 Hikolaev 1 ~ ovovoronezh 1 .2 14 Novovoronezh 3.4 0.424 Novovoronezh 5 lcovno 1.2
Unlted States Arkansas One-l Arkansas One-2 Beaver Valley Cal laday Calvert ClItts 1.2 Crystal CIver Davls Besse Dlablo Canyon Donald Cook 1.2 Farley 1 Farley 2 Fort Calhoun I H.8. Roblnson Haddain Neck Indlan Point 1,2 Indlan Polnt 3 Kewaunee Maine Yankee McGulre Ulllstone Pt. 2 North Anna Oconee Pal lsades Polnt Beach 1.2 Prairie island 1.2 R.E. Glnna

Table 26, con t lnued
A c t l v l t y (G8q) Country and r e a c t o r
Rancho Seco 0.2557 0.1421 0.0142 0.075 0.870 0.237 Salem 1 0.1447 0.3445 0.1332 0.892 0.0191 0.407 Salem 2 0.0020 0.0309 0.0958 0.009 0.047 0.017 San Onofre 1 0.0086 0.0884 . 0.0001 0.0003 San Onotre 2.3 0.0006 5.77 15.10 16.40 Sequoyah 0.0015 0.0296 0.0367 0.025 0.186 St. L u c l e 1.2 1.1951 2.1645 10.1750 3.73 20.05 4.81 Sur ry 1.2 0.5994 1.6650 2.1127 2.76 27.90 Three H l l e I s l a n d 1 - 0.0 0.0 Three H l l e I s l a n d 2 - 0.0 0.0 THI 2/CPICOR 0.0 0.0 T r o j a n 0.4218 1.3949 0.2035 0.068 0.143 Turkey P o i n t 3.4 1.9203 1.0360 8.1030 5.75 1 -01 V l r g l l C. Sumner - 0.0008 0.00007 Wolf Creek 0.002 Yankee Roue 0.0023 0.0062 0.0111 0.114 0.231 Zlon I , ? 0.0220 0.1905 0.2409 0.189 0.177
T o t a l annual e l e c t r l c energy generated ( G W a) 29.34 32.90 36.79 41.09 44.94 35.65
Hormallzed a c t l v l t y LGBq (GW a ) - ] ] I .54 1.91 1.63 1 -37 2.31 1.07
Average n o r m a l l r e d a c t l v l t y . 1980-1984 [G8q (GU a ) -1 ] 1.75 t 0.33

Table 26, continued
A c t l v l t y (GBq) Country and r e a c t o r
1980 1981
F in land O l k l l u o t o 0.0042
Germany, Federa l Rep. of 8 r u n s b u t t e l 0 .04 Gundremnlngen I s a r 0 . 0 8 Krumnel Ph l l lppsburg 1 Wijrgassen 2.2
I t a l y Caorso 0.01
Japan Fukushlma I , 1-6 1 . 9 Fukushima 11. 1.2 - Hamaoka 1 . 2 0.010 Shlmane n/d Tokai 2 0.067 Tsuruga 0.027
Netherlands Oodewaard 0.09
Sweden Barseback 1 0.06 Barseback 2 0.02 Forstnark 1 0.02 Forsmark 2 Forsmark 3 Oskarsharnn 1 0 . 4 Oskarsharnn 2.3 0 . 3 Rlnghals 1 1 .4
Unlted S t a t e s 819 Rock Po ln t 0.0396 Browns Fer ry 2.4346 Brunswlck 9.91 60 Cooper 0.6321 Dresden 1 0 .1343 Dresden 2.3 130.6100 Duane Arnold 1.6576 F l t z p a t r l c k 2.8379 Grand Gulf Hatch 1 47.3600 Hatch 2 0.5328 Humboldt Bay Lacrosse 0.1617 L a s a l l e U l l l s t o n e 1 7.9180 H o n t l c e l l o 0.751 1 NIne U l l e Po ln t 0 .4403 Oyster Creek 34.9650 Peach Bottom 1.0878 P l lg r lm 3.2486 Quad C l t l e s 12.2470 Susquehanna Vermont Yankee 0.4107 WNP-2
Total annual e l e c t r l c energy genera ted (GW a ) 17 .33 17.63 19.19 18.63 19.97 29.18
Normallzed a c t l v l t y [ G B q ( G W a ) - l ] 15.23 9.690 8.316 9.044 4 .230 0.824
Average normalized a c t l v l t y . 1980-1984 [GBq ( G W a ) - l ] 9 . 3 i 4.9

Table 26, continued
Actlvlty (Gap) Country and reactor
Argent lna Atucha 1 Emba 1 se
Canada Bruce A 0.130 0.104 1 .I84 0.359 2.801 0.05 Bruce 8 0.004 0.052 Gentllly Plckerlng A 0.155 0.063 0.070 0.070 0.13 0.056 Plckerlng 8 - 0.0 0.151 0.040 Polnt Lepreau 0.0096 0.0 0.0042
Total annual electrlc energy generated (GW a) 4.531 4.810 4.586 5.645 5.729 7.006
Normallzed actlvlty IGBo (W a)-l I 0.1070 0.1220 0.2776 0.1027 0.5378 0.1461
Average normallzed actlvlty. 1980-1984 [ G ~ Q (GW a)-I] 0.23 i 0.08
USSR Chernobyl 1.2.3 189 300 118 41.4 Kursk 1,2,3 25.7 28.8 112 45.1 4 0 4 7 Smolensk 1 72.1 Lenlngrad 1.2.3.4 - I20 110 7 4 8 9 4 0
Total annual electrlc energy generated(GWa) 3.112 3.077 3.583 4.355 3.5 3.5
Normallzed actlvlty [GBq (GW a)-]] 67.69 150.0 94.89 53.27 36.86 24.86
Average normallzed actlvlty. 1980-1984 [ G ~ Q (Gw a)-)] 80 t 40

Table 26, con t lnued
A c t l v l t y (GBq) Country and r e a c t o r
G C R s
France Bugey 1 Chlnon 2.3 S t . L a u r e n t A1 .2
I t a l y L a t l n a 0.003 0.0001 0.002
Japan Tokal 1
Unl ted Klngdorn Berke ley Braduel 1 Chapelcross Dungeners A Oungeness 8 1.7 1.8 1.9 H a r t l e p o o l - 0.11 0.22 0.2 Heysharn 0.89 1.22 0.9 H l n k l e y P o l n t A H l n k l e y P o i n t 8 0.518 0.481 0.481 0.518 0.407 0.4 H u n t e r s t o n A H u n t e r s t o n B 0.37 Oldbury S l z e u e l l Trausf ynydd wy 1 f a
To ta l annual e l e c t r l c energy genera ted (GW a ) 0.8215 0.8899 0.8811 1.363 2.372 1.647
Normal lzed a c t l v l t y [GBq (GW a ) - 1 ] 0.64 0.55 0.9 1 3.21 1.86 2.07
Average n o r m a l l z e d a c t i v i t y . 1980-1984 [Gas ( G W a ) - ] ] 1.4 t 1 .1

T a b l e 27
Isotoplc composltlon of lodlne dlscharged from reactors In the Unlted States. 1982
IT51
Actlvlty (G8q) Reactor
1 - 1 31 1-132 1-133 1-134 1-135
P W R s
Arkansas 1 Arkansas 2 Beaver Valley Calvert Cllffs 1.2 Crystal Rlver Oavls-Besse Donald Cook 1.2 Farley 1 Farley 2 fort Calhoun H.8. Roblnson Haddam Neck Indlan Polnt 1.2 lndlan Polnt 3 Kewaunee Ualne Yankee UcGulre Millstone Pt. 2 North Anna Oconee Pall sades Polnt Beach 1.2 Pralrle Island 1.2 R.E. Glnna Rancho Seco Salem I Salem 2 San Onofre 1 San Onofre 2,3 Sequoyah St. luc le Surry 1,2 Three nlle lsland 1 lhree Ulle Island 2 Trojan Turkey Polnt Vlrgll C. Sumner Yankee Rove Zlon 1.2
Total annual electrlc energy generated (GW a) 21.042
Normallzed actlvlty [ c a ~ ccw a)-1 j 2.60 0.05 6.50 o.oC067 0.41

Table 2 7 . c o n t l n u r d
A c t l v l t y (GBq) Reactor
1-131 1-13? 1-133 1-134 1-135
B l g Rock P o l n t 0.0929 0.7400 0.8695 1.5429 1.7723 Browns F e r r y 3.9590 1 .a241 2.1053 Brunswlck 32.7450 4.0330 148.3700 6.1340 83.9900 Cooper 4.1440 1.0693 4.0330 Dresden 1 0.0002 0.0001 0.0796 Dresden 2.3 21.4970 120.6200 202.0200 Duane A r n o l d 0.2068 0.3508 0.3052 f l t z p a t r l c k 16.0580 68.4500 82 .a300 Hatch 1 6.5490 1.5318 16.2430 Hatch 2 2.5012 0.5217 0.0263 Humbolt Bay Lacrosse 0.1075 0.0892 0.0537 L a r a l l e H l l l s t o n e 1 3.6702 16.0210 32.5910 H o n t l c e l l o 2.6936 3.1487 1.7279 Nlne n l l e P o l n t 0.0792 0.2875 0.3774 Oyster Creek 32.5600 137.2700 216.4500 Peach Bo t tom 1.1174 28.3050 17.6860 P l l g r l m 0.8732 - 3,3929 3.9590 Quad C l t l e s 10.6560 46.9900 743.7000 Susquehanna Vermont Yankee 0.0053 0.0357 0.7141
To ta l annual e l e c t r l c energy genera ted (GW a ) 10.29
Normal ized a c t l v l t y [ G B q (GW a ) - ] ] 13.56 0.46 56.27 0.80 137.03

T a b l e 28
Partlculates dlscharqed In alrborne effluents from reactors. 1980-1985 [Al, 85, 89. 817, 818. 819. 836. 03, fl. f4, HI, HZ. H3, H4. 33, K1, L1,
P5. P9. S1. 52. 53, 55. 59, S10, 511. T3. T 4 . T5, 18. 19. 1101
Actlvlty (G8q) Country and reactor
1980 I981 I982 1983 1984 1985
Finland Lovll sa
France a_/ Blayals 1,2.3.4 Bugey 2.3.4.5 Chlnon 81.2 Chooz Cruas 1.2.3.4 Damplerre 1.2.3.4 Fessenhetm 1,2 Gravellnes 1-6 Paluel 1.2 St. Laurent 81.2 Trlcastln 1,2.3.4
Germany, federal Rep. Btblts A.8 Grafenrhelnfeld Neckaruesthelm Obrlghelm Stade Unterueser
Netherlands Borssele
Suedrn Rlnghals 2 Rlnghals 3 Rlnghals 4
USSR Armenlan 1.2 Kallnln 1 Kola 1.2 Kola 3.4 Nlkolaev 1.2 Novovoronezh 1.2 Novovoronezh 3,4 Novovoronezh 5 Rovno 1 .2 Zaporozhe 1
Unlted States Arkansas 1 Arkansas 2 Beaver Valley Callauay Calvert Cllffs 1.2 Crystal Rlver Davls 8esse Olablo Canyon Donald Cook 1.2 farley I farley 2 fort Calhoun H.B. Roblnson Haddam Neck Indlan Polnt 1 lndlan Polnt 3 Keuaunee Maine Yankee McGulre Ulllstone Pt. 2 North Anna Oconee Pal lsades Polnt Beach 1.2

Table 28. continued
A c t l v l t y (GBq) Country and r e a c t o r
1980 1981 1902 1983 1984 1985
P r a i r i e I s l a n d 0.003 0.003 0.001 0.0012 0.0031 0.0148 R . E . Cinna 0.204 0.176 0.471 0.0008 O.OUjO2 Rancho Seco 0.113 0.030 0.959 0.0083 0.0046 0.0559 Salem 1 7 . a ~ 17.564 0.157 1.55 0.000 2.889 Salem 2 0.703 0.048 1.30 0.152 3.294 San Ono f re 1 31.108 0.348 0.00009 0.0001 San Onofre 2.3 0.001 0.0027 O.bJI 2.263 Lequoyah 0.094 0.451 4.515 0.657b 0.59r l 5:. L u c i e 1 1.099 0.681 5.180 0.0019 0.0OSU 51. L u c l e 2 0. 0002 Sur ry 1 .7 0.085 0.751 L.092 7.21 I .05 Three n i l e I s l a n d 1 0.011 0.019 U.OOb 0.0024 U.00000005 l h r e e H i l e I s l a n d 2 0.021 0.001 0.002 0.000009 0.GO02 ? # I 2/EPICOR 0 000006 6.600 l r o j d n 0.507 1.443 0.333 0.0901 0.0588 Turkey P o i n t 0.b88 0.052 0.037 0.0692 172.06 V i r g i l C . Sumner - 0.001 0.0003 wol f Creek 0.0472 Yankee Rove 0.001 0 .002 0.010 15.95 114.71 Zion 1.2 0.689 0.272 2.930 0.813 2.065
i o t a 1 annua l e l e c t r l c energy genera ted ( G W a ) 29.10 39.35 41.77 49.81 56.54 53.82
Normal ized a c t t v l t y [GBq ( G W a ) - I ] 2.514 2.703 1.306 8.40 7 .80 l .Ol
Average n o r m a l l r e d activity. 1980-1984 [GBq (Gd a ) - ] ] 4.5 r 2.9

Table 2 8 . continued
A c t l v l t y (GBq) Country and reactor
Flnland Olklluoto 0.511
Germany. Federal Rep. of Brunsbuttel 0.47 Isar 0.64 Krumnel Phll lppsburg 1 0.14 Wirrgassen 1 .6
Netherlands Dodewaard 0.074
Sweden Barseback 1 0.43 Barseback 2 0.11 Forsmark 1 0.03 Forsmark 2.3 - Oskarshamn 1 0.031 Oskarshamn 2 0.025 Rlnghals 1 0.26
Unlted States 8lg Rock Polnt Browns Ferry Brunswick Cooper Dresden 1 Dresden 2.3 Duane Arnold Fltzpatrlck Grand Gulf Hatch 1 Hatch 2 Humboldt Bay Lacrosse Lasalle Ulllstone 1 Uonticello Nine Hlle Polnt Oyster Creek Peach Bottom Pllgrlm Ouad Cltles Susquehanna Vermont Yankee WN P 2
T o t d l annual electrlc energy generated (GW a) 13.99 14.53 15.15 15.25 16.29 16.40
Norindlired actlvlty [G8q(GWa)-I] 28.13 26.72 23.14 76.59 61.99 15.85
Avrrdgr normdliied activity. 1980-1904 [GBq (GW ,)-I] 43.3 : 24.4

Table 28. con t lnued
A c t l v l t y (GBq) Country and r e a c t o r
France 8ugey 1 0.8 0.5 0.4 0.3 0.3 0.2 Chlnon 2.3 0.3 0.1 0.3 0.3 0.2 0.1 S t . l a u r e n t A1.2 7.4 1.7 1 .O 0.0 1.2 1.2
U n l t e d Kingdom B e r k e l e y 0.111 0.037 0.037 0.037 0.037 0.02 Bradue l 1 0.037 0.037 0.031 0.074 0.185 0.09 Oungeness A 0.037 0.037 0.333 0.296 0.259 0.24 Oungeness 0 0.111 0.111 0.12 H a r t l e p o o l 0.37 0.037 0.03 Heysham 0.37 0.185 0.04 H l n k l e y P o l n t A 0.333 0.296 0.296 0.333 0.296 0.34 H l n k l e y P o l n t B 0.925 1.132 0.629 0.518 0.518 0.51 H u n t e r s t o n A 0.074 0.037 0.037 0.031 0.037 H u n t e r s t o n 8 2.96 2.59 0.74 0.74 0.740 O ldbury 0.140 0.333 0.185 0.148 0.111 0.23 S l z e w e l l 0.37 0.333 0.222 0.444 0.296 0.51 l r a u s f y n y d d 0.296 0.407 0.37 0.333 0.370 0.51 Wy l fa 0.296 0.259 0.111 0.074 0.074 0.14
To ta l annual e l e c t r l c energy g e n e r a t e d ( G W a ) 3.868 4.847 5.382 5.985 6.223 5.738
N o r m a l l i e d a c t l v l t y [GBq (GW a ) - ' ] 2.86 1.61 0.87 0.79 0.80 0.74
Average norma l l zed a c t l v l t y . 1980-1984 [GBq (GW a ) - I ] 1.39 t 0.79
USSR Chernobyl 1,2 9.3 Kursk 1.2 140 120 140 Len lng rad 1.2.3.4 6.5 8.6 10 6.8 9.4 Smolenks 1 1.61 -
T o t a l annual e l e c t r l c energy genera ted (GW a ) 3.172 3.077 3.583 4.355 3.5 3.5
N o r m a l l i e d a c t l v l t y [GBq (GW a ) - l ] 2.93 2.11 2.40 34.81 36.22 42.60
Average n o r m a l l z e d a c t t v i t y . 1980-1984 [ G B ~ (GW a ) - ] ] 15.69 t 1b.19

Table 28, continued
A c t l v l t y (GBq) Country and r e a c t o r
1980 1981 1982 1983 1984 1985
H W R s
Argent l na Atucha 1 0.016 0.014 0.0074 0.0086 0.0046 0.022
Canada Bruce A 0.056 0.093 0.100 0.048 0.060 0.044 Bruce B 0.117 0.210 G e n t l l l y P i c k e r i o g A 0.118 0.170 0.089 0.020 0.022 0.027 P l c k e r l n g 0 0.012 0.013 P o i n t Lepreau
T o t a l annual e l e c t r i c energy generated (GW a ) 4.283 4.508 4.386 4.742 4.964 5.956
Normal lzed a c t l v l t y [GBq (Gw a ) - ' ] 0.0406 0.0584 0.0431 0.0143 0.0425 0.0531
Average norma l l zed a c t l v l t y . 1980-1984 [ G B ~ (GW a ) - ) ] 0.040 k 0.016
a/ Reported d a t a f o r France l n c l u d e r halogens w l t h p a r t l c u l a t e s .

T a b l e 29
Llauld releases excludlnq trltlum from reactors. 1980-1985 (85. 89. 816. 817, B18. 879. C4, F1. fa. HI. HZ. H3. H4, J3. K1, LI, PI. P5,
P9, 51. 52. 53. 55.59. 510, 511, 13, T4. 15. T8. 19, 110, V5J
A c t l v l t y (GBq) Country and reactor
ilnland Lovl i:a 17.819 2.757 13.474 22.318 20.463 18.167
Belglum Doel 1.2,3 98.0 57.0 33.0 T I hange 56.0 294.0 21.5
France Blayais l,2 Buqey 2.3.4.5 566 Chinon B. 1 ,2 Chuoz 9 Cruds 1-4 Dampierre 1-4 59 Fessenheim 1.2 262 Grave:lnes 1-4 148 Paluel 1.2 it. Laurent 81.2 - Irlcastln 1-4 17
ter-any. Federal Rep. ot Biblls A.8 11.1 Grafrnrhelnfeld Grohnde tdeckarwes thetm 0.3 Obrlyhelm 3.0 Philippsburg 2 Stade 3.0 Unterweser 1.8
Italy Trlno
Japan Genkal 1.2 n/d n/d n/d n/d n/d n/d Ikata 1.2 0.01 1 0.0026 0.0004 n/d n/d n/d riharna 1,2.3 0.17 0.1 0.1 0.096 0.04 0.034 001 1.2 0.06 0.20 0.024 0.071 0.03 6.021 Senda 1 n/d n /d n/d Takahama I,? 0.052 0.02 0.0078 0.0014 0.009 0.0081
Neth~rlands Borssele 4.44 7.03 12.58 7.03 22.2
Sweden Rlnghals 2 I20 78.7 57.7 69.0 153.2 47.72 Rinyhals 3 0.1 22.2 11.4 41. I 106.2 21 .09 RInghals 4 2.1 36.0 47.2 59.02
USSR Armen l an 0.039 Hovovoronerh 5 0.16
United States Arkansas 1 126.540 Arkanias 2 152.810 Beaver Valley 3.848 Callaway Calvert Cllffs I,? 167.610 Crystal River 5.402 Davis Besse 7.659 Dtablo Canyon Donald Cook 1 .2 50.690 farley 1 2.287 Farlry 2 F o r t Calhoun 1 18.648 H.8. Robinson 13.246 Haddan Neck 10.212 indian Polnt I .2 46.620

Table 29, con t inued --
A c t l v l t y (GBq) Country and r e a c t o r -
l n d l a n F o l n t 3 107.300 Kewaunee 22.829 Halne Yankee 10.989 HcGulre H l l l s t o n e I J t . 2 103.970 Nor th Annd 38.850 Oconee 56.980 P d l i:ades 0.323 Po in t Bedrh 1.7 23.273 P r a l r l e I s l a n d 0.488 R . E . Gtnnd 0.725 Rancho Secn 0.140 5alem I 98.050 Salem ? 36.593 San Onofre 1 414.400 San Onoire 2.3 Sequoyah St . Luc ie 1 67.320 St. Luc ie 2 Sur ry 1,2 142.450 Three M i l e I s l a n d 1 6.771 Three H l l e ]:land 2 0.001 T ro jan 29.119 l u r k e y P o l n t 25.086 V l r g i l C . S u r r m c r - Wolf Creek Yankee Roue 0.647 Zlon 1,2 17.538
T o t a l annual e l e c t r l c enprgy generated (GW a ) 35.50 40.55 44.97 53.09 6 1 . 7 4 57.02
Normaltzed a c t l v t t y [GBQ ( G W a ) - l ] 92.10 111.5 82.87 214.7 160.9 102.7
Average norma l i zed a c t l v l t y , 1980-1984 [GBq (GH a ) - ] ] 132.4 t 49.5

Table 29, con t lnued
A c t l v l t y (GBq) Country and r e a c t o r
1980 1981 1982 1983 1984 1985
Germany. Federa l Rep. of Brunsbu t te l 9 . 6 Gundremnlngen I s a r 5 .9 Krumnel Ph l l lppsburg 1 4.1 Wijrgassen 10
I t a l y Caorso 0.44
Japan Fukushima I
1 .2 .3 ,4 .5 ,6 1 . 9 Fukushlma 11-1 .2 - Hamaoka 1.2 2.6 Onagawa Shlmane 0.037 Tokal 11-1 0.31 Tsuruga 0.28
Netherlands Dodewaard 1 7 . 7 6
Sweden 8arseback 1 .2 57.4 Forsmark 1 , 2 0.25 Oskarshamn l .2 99 Rlnghals 1 9 9
Unlted S t a t e s Blg Rock Po ln t Browns Fer ry Brunswtck Cooper Dresden 1 Dresden 2.3 F l t z p a t r l c k Grand Gulf Hatch 1 Hatch 2 Humboldt Bay Lacrosse L a s a l l e Llmerlck U l l l s t o n e 1 U o n t l c e l l o Nlne U l l e Po ln t Oyster Creek Peach Bottom P l l g r l m Ouad C l t l e s Susquehanna Vermont Yankee WNP 2
Total annual e l e c t r l c energy genera ted (GW a ) 19.05 19.64 21.92 21.35 23.45 23.57
Normalized a c t l v l t y [GBq (GW a ) - l ] 78.23 71.31 175.3 95.86 156 .5 40.9
Average normallzed a c t l v l t y . 1980-1984 [GBq (GW a ) - ] ] 115 i 47

Table 29. c o n t l n u e d
A c t l v t t y (Gap) Country and r e a c t o r
1980 1981 1982 1983 1984 1985
France 8ugey 1 118 70 4 0 Chlnon A1,2 3 8 17 19 S t . Laurent A1.2 407 237 200
l t a l y Lat l na 59.2 86.2 162.8
Japan Tokal 1 0.31 0.22 0.23 0.14 0.12 0.1
U n l t e d Klngdom Berkeley 2190 1321 662 667.1 366.3 290 Bradwel l 1443 1735 98 1 962 817.1 1510 Chapelcross 322 1776 4144 307 1 481 2000 Oungeness A 629 714 840 864.2 1750.1 2190 Oungeness 8 7.4 51.8 174 H a r t l e p o o l 7.4 118.4 218 Heysham 7.4 59.2 60 H l n k l e y P o l n t A 5106 3367 2660 1306.1 2249.6 3720 H lnk ley P o l n t 8 141 100 44.4 812 928.7 840 Hunterston A 13500 8436 8695 281 2 2664 Hunterston 8 1554 2160 301 6 2653 331 9 Oldbury 1406 2290 1994 2620 1713.1 1210 S l z e u e l l 1924 1143 1036 658 889.1 1010 Travsfynydd 5 18 281 485 350.9 370 430 Wyl fa 7 4 51.8 111 78.3 96.2 4 8
T o t a l annual e l e c t r l c energy g e n e r a t e d ( G W a ) 3.868 4.847 5.382 5.885 6.223 5.738
Normal lzed a c t l v l t y [G8q (GW a ) - ) ] 7609 4890 4632 2901 2582 2406
Average norma l l zed a c t l v l t y . 1980-1984 [G8q (GW a ) - ) ] 4520 t 1790
Argent l na Atucha 1 81 5 1 37 5 1 51 5 1 Ernbalse 25.9 1.91
Canada Bruce A 163 8 1 78 7 4 72 - Bruce 8 7 7 G e n t l l l y 2 2 0.6 4 1 9.7 P l c k e r l n g A 13 8 18 22 2 7 32 P l c k e r l n g 8 11 27 9 P o l n t Lepreau 18.71 13.10 1.6
To ta l annual e l e c t r l c energy generated (GW a ) 4.283 4.508 4.386 5.283 5.729 7.310
Normallzed a c t l v l t y [GBq (GW a ) - ) ] 41.10 19.74 21.89 23.79 22.21 14.86
Average norma l l zed a c t l v t t y . 1980-1984 [GBq (GW a ) - 1 ) 25.7 .t 8.7
n/d = Discharge n o t d e t e c t e d .

T a b l e 3 0
Radlonucllde comosltlon of llauld releases excludtnp trltlum from reactors in the Unlted States. 1982
( 1 5 1
Actlvlty (TBq)
Reactor 1-131 1-13? 1-133 1-134 1-135 Ma-24 Cr-51 Hn-54 Mn-56 Co-57 Co-58
AfkdnSdS I ArkanSdS 7 Beaver Valley Calvert Cll!ts I,? Crystal klver Oonalc Cook 1.2 Farley 1 Farley 2 fort Calhoun H.8. Roblnson tiaddarn Neck Indldn Polnt 1.2 lndlan Polnt 3 Kedaunee nalne Yankee Mctulre 4lllstone Pt. 2 North Anna Oconee Palisades Poict Beach 1.2 Pralrle Island R.C. Glnna Rancho Zeco Salem 1 Salem 2 San Onofre 1 San Onofre 2 , 3 Sequoyah St. Lucle 5urry 1.2 lhrer nlle 1:ldnd 1 Three 4i le Illand 2 Trojan Turkey Polnt Vlrgll C. Sumner Yankee Rode Zlon 1 Zion 2
Total annual electrlc energy generated (GW J ) 21.042

Table 30, contlnued
Reactor
Actlvlty (TBq)
fe-59 Co-60 211-65 Sr-89 Sr-90 Zr-95 Zr-97 Nb-95 Nb-97 no-99 Tc-9910
ATkdtlSdS 1 Arkansas 2 Beaver Valley Calvert Cllfts 1,2 Crystal Rlver Oonald Cook 1.2 Farley 1 Farley 2 Fort Calhoun H.B. Roblnron Haddam Neck Indlan Polnt 1.2 lndlan Polnt 3 Kewaunee Walne Yankee McGulre Mtllstone Pt. 2 North Anna Oconee Pallsades Polnt Beach 1.2 Pralrte Island R.E. Glnnd Rancho Seco Salem 1 Salem 2 San Onofre 1 Oan Onotre 2,3 Seauoyah St. Lucle Surry 1.2 Three ulle Island 1 Three Wlle Island 2 Trojan Turkey Polnt Vlrgll C. S u m e r Yankee Roue Zlon 1 Zlon 2
Total annual electrlc energy generated (Gil a) 21 -042
Normallzed actlvlty [GBq (GW a)-I] 0.50 19.09 0.11 1.26 0.23 1.24 0.04 1.30 0.34 0.47 0.09

Table 30. contlnued
Actlvlty (TBq)
Reactor Ru-103 Ru-106 Ag-1 lOm Sb-124 Sb-125 Cs-134 Cs-136 Cs-137 Ba/La-I40 Ce-141 Ce-I44
Arkansas 1 1.380 1.680 6.031 - 9.250 0.009 21.090 1.883 2.264 Arkansas 2 2.083 0.596 0.577 - 32.190 0.291 59.940 2.364 0.573 Beaver Valley 0.008 - 0.156 - 0.259 - CalvertCllffsl.2 0.299 0.940 8.066 1.854 10.064 16.317 - 29.711 0.906 Crystal Rlver 0.001 - 0.176 0.073 0.178 0.303 0.009 0.407 0.165 0.071 0.459 Donald took I .2 0.503 0.714 - 6.734 0.474 13.246 - Farley 1 0.010 0.001 0.020 - 0.072 0.005 0.180 0.047 0.124 Farley 2 0.002 0.002 0.008 - 0.073 0.015 0.101 0.021 0.078 Fort Calhoun 0.015 - 0.088 - 0.851 0.102 1.912 0.261 0.134 - H.8. Roblnson 0.004 - 0.031 - 0.222 - Haddam Neck 0.001 0.109 - 0.002 0.183 0.078 - 0.455 - 0.024 lndlan Polnt 1.2 0.265 - 2.812 9.139 1.025 20.498 3.848 0.655 - Indldn Polnt 3 0.096 0.014 0.206 0.107 4.403 0.290 0.060 1.428 0.240 0.033 0.014 Keudunee 5.476 1.066 0.692 0.422 - 1.650 - Malne Yankee 0.170 - 0.090 - 1.273 - UcGu l re 0.147 1.232 - 0.017 - 0.012 Ulllstone Pt. 2 0.814 3.271 0.026 0.110 32.338 1.388 46.990 0.022 0.241 North Anna 0.236 - 1.787 0.065 - 2.642 0.004 5.254 0.030 0.028 0.103 Oconee 0.336 0.331 - 0.057 11.063 0.011 17.353 0.165 0.231 Palisades 0.035 0.640 - 1.384 - Polnt Beach 1.2 0.001 0.123 0.002 - 0.026 7.992 0.110 11.544 0.094 0.011 0.004 Pralrle Island R.E. Glnna 0.001 - 0.433 - 0.792 12.284 Rancho Seco 0.356 0.011 0.692 0.005 Salem 1 0.026 - 0.174 0.295 0.252 1.462 - 2.179 0.271 0.050 - Salem 2 0.145 0.374 0.377 1 .876 0.021 2.827 0.249 0.026 - San Onof re 1 0.024 0.020 - 7.215 - 20.017 - San Onofre 2,3 0.002 - 1.088 - 0.006 1.561 Sequoyah 0.012 0.010 0.367 0.226 - 0.733 0.019 3.482 - 0.607 St. Lucle 0.659 2.157 1.869 6.660 0.108 11.729 0.092 0.002 0.314 Surry 1.2 2.087 2.446 72.150 1.872 107.300 0.210 Three Ulle Island 1 - 0.019 0.305 - 1.532 - Three Mlle Island 2 - 0.001 - Trojan 1.221 0.012 0.100 0.084 0.906 0.925 - 1.624 2.757 0.352 1.502 Turkey Polnt 0.262 0.374 0.662 1.132 0.123 2.250 0.032 Vlrgtl C. Sumner Yankee Roue 0.001 - 0.002 0.001 - 0.017 - 0.038 0.004 0.002 0.009 Zlon 1 2.231 0.414 0.381 0.451 0.014 1.658 0.164 Zlon 2 2.164 1.709 - 0.588 0.001 0.698 -
Total annual electrlc energy generated (GY a) 21.042
Normallzed actlvlty [GBq(GUa)-I] 0.26 0.20 1.60 0.62 1.21 10.23 0.27 17.86 1.23 0.06 0.37

Table 30. continued
Actlvlty (Tap)
Rear tor 1-131 1-132 1-133 1-134 1-135 Na-24 Cr-51 Mn-54 Mn-56 Co-57 Co-58
819 Rock Polnt 0.012 2.168 - 0.071 Browns Ferry 8.325 - 2.451 - 0.559 3.885 3.885 3.497 10.471 - 0.644 Brunswlck 4.255 0.011 0.736 2.135 0.056 1.565 20.202 10.582 0.002 - I .388 Cooper 5.143 - 0.536 9.842 14.578 0.002 - 8.806 Dresden 1 Dresden 2.3 0.008 0.084 - Ouane Arnold Fltzpatrlck 0.033 - 0.038 - 0.005 0.063 0.102 2.501 - 1 -088 Hatch 1 2.956 0.004 0.282 - 0.008 0.182 0.548 0.313 - 0.085 Hatch 2 0.777 0.001 0.074 - 0.002 0.206 0.437 0.045 0.001 - 0.027 Humboldt Bay 0.005 - Lacrosse 0.400 0.020 0.255 0.004 0.059 2.316 28.416 0.004 0.111 15.466 Lasalle 0.214 0.175 0.659 - 0.267 Mlllstone 1 5.402 - 1.054 - 0.381 0.048 1.158 1.469 - 0.189 Montlcello Nlne Ulle Polnt Oyster Creek 0.003 0.477 - 0.001 Peach Bottom 5.476 0.235 8.695 0.045 2.782 131.720 9.176 0.235 0.116 - 4.884 Pllgrlm 0.002 - 0.245 1.502 - 0.199 Quad Cltles 0.429 - 0.892 - 0.44 0.335 0.181 4.292 - 0.075 Suspuehanna 0.064 - 0.018 - 0.307 2.830 0.149 0.028 - 0.892 Vermont Yankee
Total annual electrlc energy generated (GW a) 10.29
Normallzed actlvlty I G ~ Q / ( G ~ a)] 3.23 0.03 1.42 0.21 0.42 13.52 4.97 6.90 1.03 0.01 3.31
Actlvlty ( T B q )
Reactor Fe-59 to-60 Zn-b5 Sr-89 Sr-90 Zr-95 Zr-97 Nb-95 Wb-97 Mo-99 Tc-99m
Blg Rock Polnt 1.099 1.869 0.064 0.009 0.145 - Browns Ferry 6.771 54.760 27.232 0.385 0.228 0.971 - 0.977 - 0.326 0.315 Brunsulck 1.029 25.271 0.111 0.433 0.444 0.003 0.007 - O.bb2 0.033 0.400 Cooper 0.448 65.490 1.395 7.437 0.264 1.251 - 1.487 0.492 Dresden 1 Dresden 2.3 0.474 - 0.014 0.003 - Ouane Arnold Fltzpatrlck 0.128 13.542 0.363 0.021 0.007 0.002 - 0.005 0.001 Hatch 1 0.032 0.521 3.533 0.174 0.014 0.041 - 0.083 0.001 0.555 0.681 Hatch 2 0.003 0.356 1.010 0.024 - 0.038 0.001 0.057 0.008 0.025 0.062 Humboldt Bay 0.836 - 0.014 - Lacrosse 7.289 98.420 3.034 0.001 0.312 0.211 - 3.504 - 0.242 0.533 Lasalle 0.006 0.107 0.076 0.002 0.004 - 0.003 0.015 Mlllstone 1 0.246 5.661 0.013 0.165 0.051 - 0.011 - 0.028 0.195 Mont\cello Nlne Mlle Polnt 0.078 - Oyster Creek 2.505 - Peach Bottom 24.013 72.520 0.403 0.022 - 8.288 - 0.356 2.257 Pllgrlm 0.021 13.283 0.206 0.096 0.026 0.044 - 0.002 - Ouad Cltles 0.001 2.072 0.051 0.053 0.021 0.009 - 2.886 - 0.165 0.216 Sus~uehanna 0.143 0.055 0.157 0.005 0.003 - 0.304 0.799 Vermont Yankee
Total annual electrtc energy generated (GW a) 10.29
Normallzed actlvlty 1.67 30.16 10.6 0.9 0.15 0.25 0.00 1.54 0.07 0.34 0.58 [GBu (GW a)-1 ]

Table 30. continued
A c t l v l t y (Tag)
Reactor Ru-103 Ag-llOm Sb-124 Cs-134 Cs-136 Cs-137 Ba/La-140 Ce-144 Np-239
B l g Rock PoInt 0.053 0.063 - 2.151 0.007 Brown: f e r r y 5.920 0.470 5.735 0.511 8.029 0.407 Brunsulck 0.011 0.012 - 5.143 0.040 6.438 2.161 0.308 Cooper 2.401 0.108 28.151 0.332 32.782 1.661 Dresden 1 Dresden 2,3 0.024 0.001 0.096 - Duane Arnold r l t z ~ a t r l c k 0.020 2.024 - 2.575 0.067 0.001 0.696 Hatch 1 0.005 0.003 3.312 2.864 4.884 0.031 0.219 0.015 Hatch 2 0.014 - 0.777 0.027 1.236 0.002 0.007 0.001 Humooldt Bay 0.685 - 11.063 - 1acros:e 1.543 - 4.255 - 37.000 - 4.329 0.607 Ldra l l e Millstone 1 0.020 - 2.246 0.026 23.865 0.366 - non t l c e l l o N ine M i l e Po ln t Oyster Creek 0.004 - 0.004 0.001 Peach Bottom 0.003 0.001 - 16.835 - 24.013 1.099 0.810 P l l g r l m 0.030 - 0.607 - 4.736 0.003 0.001 - Quad C l t t e r 0.003 0.021 0.001 0.124 0.012 1.654 0.284 0.027 Susquehanna 0.001 0.262 - 0.065 - 0.365 0.105 Vermont Yankee
T o t a l dnnual e l e c t r l c energy generated (GW a ) 10.29
Normal lzed a c t l v l t y ! G B ~ ( ~ d a) -11 0.15 0 .82 0.06 6.61 0.59 13.29 2.88 0.51 0.25

T a b l e 31
Radlonuclide composition of liauld releases excludlnq trltlurn from GCRs ln the United Klnqdorn. 1982
IH31
-- Actlvlty (GBq)
Reactor
5-35 C a - 4 5 nn-54 Fe-55 Co-60 Sr-89 Sr-90
Berkeley Brdduell Chayelcro:: Oungenetr A Hinkley A H i n k l e 8 liunterston A Hunterrton 8 Oldbur y S i z r u ~ l l Traistynydd wylta
1 0 1 ~ 1 annual electrlc energy gerirrated (Gw a) 4.19
Hormdlized dctlvlty [GBq (GW a)-]] 821.0 27.41 3.60 29.84 18.13 2.08 292.9
- - - - - - -
Actlvlty (GBq) Reactor
Ru-I06 Lb-125 Cs-134 Cs-137 Ce-144 Pm-I4 1
U e r k ~ l ~ y Brddwr I 1 Chapel( ro:s Dungene:: A Hiniley A Iilnkley U Hunterqton A Hunterston 8 Oldbury ; I ~ e i e i l 1rdd:t ynydd ciylta
Total drinual elzctrlc energy generated (GW a) 4.19

T a b l e 32
Normal lzed l o c a l and r e q l o n a l c o l l e c t ~ v ~ ~ f f e c t l v e dose e q u l v a l e n t comnltment
f rom nob le Oases re leased from the model PWR s l t e
hormal lzed c o l l e c t l v e Rad lonuc l lde e f f e c t l v e dose
equ lva len t comnltment
[ l o - ' m a n Sv (GW a ) - I ]
Ar -4 1 Kr-85m Kr-85 Kr -81 Kr-88 Xe-13lm Xe- 133m Xe-133 xe-135m Xe-135 Xe-138
T o t a l 251
T a b l e 33
Normal l z e d l o c a l and r e q l o n a l c o t l e c t l v e e f f e c t l v e dose e q u l v a l e n t comnltment
f rom nob le oases re leased f rom t h e model 0WR s l t e
N o r m a l ~ z e d c o l l e c t l v e Radlonuc 1 l d e effective dose
e q u l v a l e n t comnltment
[man sv (GH a ) - ' ]
Ar-41 0.02 Kr-85m 0.014 Kr-85 0.0008 Kr-87 0.024 Kr-88 0 .32 Xe-13lm 0.004 xe-133 0.042 Xe-135111 0.004 xe-135 0.090 Xe-138 0.052
-
T o t a l 0.56
T a b l e 34
Normal lzed l o c a l and r e q i o n a l c o l l e c t l v e e f f e c t l v e dose e q u l v a l e n t c o m l t m e n t s
t r o m t r l t l u m re leased t o t h e hydrosphere
Normal (zed Collective a c t l v l t y e f f e c t i v e
Reactor r e l e a s e dose e q u i v a l e n t t y p e comnl tment
1 ( 1 8 s (GU a) ' 1 [man sv (GW a ) - ' ]
PWR 27 BUR 2.1 HWR 290 GCR 97 LWGR 1.7
Welghted average 0.033 man Sv (GW a ) - '

T a b l e 35
Normallzed local and reqlonal collectlve effectlve dose equlvalent comnltments
from carbon-14 released to the atmosphere
Norma I l zed Collective actlvlty effectlve
Reactor release dose equivalent type comnl tment
[ G ~ Q (GW ?)-I] [man Sv (GW a)-']
PWU 345 8WR 330 HWR 6336 GCR 1100 LWGR 1300
Welghted average 1.6 man Sv (GW a)-'
T a b l e 3b
Normall zed local dnd reqlorial collectlve effectlve dose eaulvalent comnltments
from releases of lodlne
Collectlve effectlve dose e~ulvalent comnltment
Normal l zed [man sv (GW a)-'] Reactor lodlne-131 t Y P ~ actlvlty
Iodlne-131 Other lodlne Total
IGBQ (w a)-') isotopes
FUR 1.7 0.54 0.04 lo-3 0.58
8WR 9.3 3.61 lo-3 I.? 1 0 ‘ ~ 4.8
GCR 1.4 0.54 0.18 0.72
HWU 0.73 0.089 0.013 0.12
LWGR 80 30 10 40
Average welghted collectlve dore: 3.3 man Sv (GW a)-'
T a b l e 37
Normallzed local and req:onal collectlve effectlve dose equlvalent comitments
from particulates released to atmosphere from reactors
Collectlve Collectlve effectlve dose equlvalent comltment
dose per unlt man sv (GW a)-'] Pathway actlvlty
( man sv ~ 8q-I) PWR BUR HWR GCR LWGR
Olrect cloud 0.001 0.005 0.043 0.00004 0.0015 0.016 Inhalation 0.12 0.48 5.7 0.005 0.15 2.0 lngestlon 2.0 9 87 0.08 2.4 33.6 Ground-deposlts 3.3 14.8 143 0.13 4.2 5 6 Resuspenslon 0.004 0.018 0.17 0.0002 0.005 0.08
Total
Average welghted collectlve dose: 15 man Sv (W a)-'

T a b l e 38
Normallzed collective effectlve dose epulvalent comnltments for radlonuclldes In Ilgu!d effluents from reactors
dlscharoed to the model rlver
Collectlve effectlve dose equlvalent comltment
man sv (GW a)-'] Norma 1 1 zed
Reactor Radlo- released type nucllde actlvlty P a t h w a y
Orlnkln~ water Flsh External
PWR 1-131 30 9.3 0.67 Co-58 3 3 0.11 0.03 0.0003 Co-60 2 0 0.93 0.07 0.001 Sr-90 0.22 0.23 0.01 Cs-134 10 1.33 0.83 0.002 Cs-137 18 1.67 1.03 0.01
Total: 16.3 13.63 2.64 0.02
BWR 1-131 3 1 .O 0.01 Co-58 3 0.02 0.003 Co-60 30 1.4 0.1 0.01 Sr -90 0.2 0.2 0.01 CS-134 a 1.0 0.6 0.002 Cs-137 15 1.2 0.8 0.01
Total: 6.6 5 I .6 0.02

T a b l e 39
Normallred collectlve effectlve dose euulvalent comnltments for radlonuclldes In lluuld effluents from reactors
discharged to coastal waters
Collectlve effectlve dose eaulvalent comnltment [lo-4 man Sv (W a)-]]
Norm 1 1 zed Reactor Radlo- released type nuclide actlvlty P a t h w a y
[GBU (GW a)-]] ~ t s h Crustacea M O ~ ~ U S C S
PWR Co-58 33 Co-60 20 Ag-llOm 0.2 CS - 134 10 Cs-137 18
Total: 35.1 16.8 1 - 6 4 17.30
BUR Zn-65 10 15 1 320 CO-58 3 0.02 0.01 0.12 Co-60 30 5 1.8 13 Ag-1 lOm 0.2 0.3 0.1 5 Cs-134 8 4 0.08 1 Cs-137 1 5 8 0.15 1
Total: 375 32 3 340
GCR Co-60 20 3 1 10 Sr-90 360 10 3 20 Ru-106 50 5 1 4 0 Sb-125 4 0 7 0.2 0.4 Cs-134 500 150 4 30 Cs-131 2500 1300 27 180 Ce-144 150 1.5 7.5 7 5
Total: 1875 1476 44 355

T a b l e 40
Occupational exposures a t LWRs [AS. 85. 813. 835. E8. E9, 13. 14, 15. 16, 17, K1. M3. N2. N3. P2.
P3. P7, 51. 52, S 3 . 5 5 , 514, S16, T12. V l ]
Annual Annual Normal lzed Country. Number c o l l e c t i v e Number o f Energy average c o l l e c t i v e r e a c t o r t y p e o f e f f e c t l v e workers genera ted e f f e c t t v e e f f e c t l v e and year u n l t s dose mon i to red l n t h e dose dose
e q u l v a l e n t year e q u l v a l e n t e q u l v a l e n t [man Sv
(man Sv) (GW a) (mSv) (GU a ) - ] ]
F i n l a n d ( 2 PWRs. 2 BURS) 1980 4 2.1 0.48 1981 4 1.4 1.57 0.9 1982 4 3.3 1900 1.80 1.7 1.8 1983 4 2.3 2600 1.90 0.9 1.2 1984 4 3.2 I 8 0 0 l .8 1985 4 2.2 1500 1.4
France (PWR) 1980 1981 1982 1983 1984 1985
Japan ( r a t i o PWRs : BWRs - 1 t o 1) 1980 2 4 134 72000 9.1 1.9 15 1981 2 4 136 88000 9.3 1.6 14 1982 27 116 82000 11.6 1.4 10 1983 2 7 112 87000 11.9 1.3 9.4 1984 30 117 102000 13.6 1.2 8.6 1985 3 1 11 3 1 18000 14.5 1 .O 7.8
Nether lands ( 1 PWR; 1 BUR) 1980 2 2.7 790 0.45 3.5 5.9 1981 2 6.4 1350 0.39 4.7 16 1982 2 8.9 1560 0.42 5.7 21 1983 2 7.8 1400 0.39 5.6 20 1984 1 (PWR) 5.2 1040 5.0
Sweden ( 3 PWRs; 9 BWRs t n 1985) 1981 9 13 4200 4.3 3.2 3.0 1982 10 9.6 3800 4.3 2.5 2.2 1983 10 14.7 4800 4.6 3.1 3.2 I984 10 11.6 4600 5 . R 2.5 2.0 1985 12 11.0 5300 6.5 2.1 1.7
S w i t z e r l a n d ( 2 PWRs; 2 BURS) 1980 4 8.9 1900 4.6 1981 4 9.1 2050 I .6 4.4 5.5
USSR (PWR) 1980s
Un i ted S t a t e s ( R a t i o PURs : BURS - 2 t o 1 ) 1980 68 538 80300 2 9 6.7 18 1981 7 0 54 1 82200 3 1 6.6 17 1982 74 522 84400 3 3 6.2 16 1983 75 565 85600 33 6.6 17 1984 7 8 552 98100 3 7 5.6 I 5

T a b l e 41
Collective occupatlonal exposures at PURs and BURS In the Unlted States and Japan
[835. TI?]
Country and
reactor Year type
Unlted States ( fJWR 1980
1981 1982 1983 1984
Annual collectlve effectlve
dose equlvalent
(man Sv)
Annual Energy collectlve
Number of generated effectlve reactors ln the dose
year equlvalent per reactor
( W a ) (manSv)
Norm 1 1 zed collectlve effectlve
dose equlvalent [man Sv (W a)-11
Japan ( W R ) 1980 25.1 13 4.0 1.9 6.3
1981 28.4 13 4.3 2.2 6.6 1982 29.2 13 5.4 2.2 5.4 1983 32.4 13 5.8 2.5 5.6 1984 34.9 15 5.9 2.3 5.9 1985 36.4 15 6.7 2.4 5.5

T a b l e 42
Occupatlonal exposures at HWRs and GCRs [ A d . 815. 018. HI. HZ. H3. H4. 13. 14. 15. 16.1
17. K1. N3. P5. P8. P14. 112. W2]
Annua 1 Annual Normallzed Country. Number collectlve Number of Energy average collectlve reactor type of effective workers generated effective effective and year unlts dose monltored In the dose dose
equivalent year equlvalent equlvalent [man Sv
(man Sv) (GW a) (mSv) (W a)-l]
Argentlna (HWR) 1983 2 5.0 980 0.34 5 13 1984 2 3.6 1000 0.44 4 6 1985 2 6.4 860 0.72 8 9 1986 2 13 18
Canada (HWR) 1980 12 19.1 6780 4.34 2.8 4.4
Japan (GCR) 1980 1 . 1.1 1981 1 0.8 1982 1 0.8 1983 1 0.8 1984 1 1 .O 1985 1 1.4
USSR (LYGR) 1980 2 2.3 - 0.41
United Kingdom (GCR) 1980 22 23.0 11100 3.33 2.1 7.1 1981 2 7 22.6 17400 3.48 1.3 6.5 1982 22 19.9 17700 4.28 1.1 4.6 1983 25 18.7 19800 4.57 0.9 4.1 1984 25 19.1 20300 5.00 0.9 3.8
Unlted States (GCR) 1980 1 0.03 5 8 0.08 0.05 0.4 1981 1 0.01 31 0.09 0.03 0.1 1982 1 0.04 2 2 0.07 0.02 0.1 1983 1 0.01 48 0.09 0.02 0.1
Nor~llled occupational exposures at reactors tor tne aulnquennium 1980-1984
Collectlve eftectlve Reactor dose equlvalent per type unlt energy generated
[man sv (GW a)-']
L W R HWR GCR HTGR LWGR

T a b l e 44
Estimated tvplcal volumes and actlvltles of condltloned solld wastes from LWRs In the 1970s
IESI
Reactor type [H7] [ME] [ti301 [ E S ]
3 Annual volume ( m )
BWR 1000 1500 1000 1000-2000 PWR 600 1100 400 200- 500
Annual activlty (TBq) BUR a/ a/ 150 110 PWR a/ &/ 7 0 20-55
a/ Not estimated
T a b l e 45
Estlmated volumes and actlvltv concentrations of condltloned sol:d wastes from LWRs
Reactor type ILU LLW
Volume per unit energy generated [m3 ( G W a)-']
PWR 5 0 200 BUR 100 500
Actlvlty concentratlon
PWR BUR
T a b l e 46
Estlmated typlcal radlonucllde composltlon of condltloned solld wastes from LWRs after about ten years o f intertm storage
Actlvtty percentage
Radlonucllde
&/ These radionucl ides have daughters that wlll be In equll lbrlum. Only the percentage of the parent 1s reported.
b/ The radionucllde wlll bulld up as plutonium-241 decays. -

T a b l e 47
Es t lmd ted t y p l c a l volumes and a c t t v l t y concentrations o f c o n d l t l o n e d s o l l d wastes From HWRs and GCRs
(831. f 3 ]
- - - - -
Reactor t y p e ILW LLW
Volume p e r u n l t energy generated
[m3 (GW a ) - ' ] HWR 50 250 GCR 20 1000
A c t l v l t y c o n c e n t r a t i o n
(GBq i 3 ) HWR a/ 100 1 GCR 1000 10
a/ E x c l u d l n g t r l t t u m .
T a b l e 48
Some major c losed and operating s h a l l o u b u r l a l s i t e s [Ca. C9. HIS. N9)
Approx imate Country and s l t e S t a r t e d S t a t u s t o t a l
operat ton c a c a c ? t y
U n l t e d S ta tes Bea t t y , Nevada 1962 Maxey F l a t s . Kentucky 1962 West V a l l e y . New York 1963 R lch land . Washlngton 1965 S h e f f i e l d . I l l l n o l s 1967 B a r n u e l l . South C a r o l l n a 1971
Unt t e d Klngdom Dr lgg . Cumbrla 1971
France Cen t re de l a Manche 1969
open c l o s e d c l o s e d open c l o s e d open
open
open
T a b l e 49
Sumnarv o f reco rded disposals o f packaqed s o l l d waste t n t o t h e no r th -eas t Atlantic. 1949-1982
IN61
Gross u e l g h t ( t ) 142 000 Alpha a c t t v l t y ( TBq) 680 Beta/gamna a c t t v t t y (TBq) 38 000 T r l t i u m a_/ (T8q) I 5 000
a/ Recorded s e p a r a t e l y t o r 1975-1982; Inc luded i n beta/gamna a c t l v l t y f o r e a r l l e r years.

T a b l e 50
Arsumptlons f o r assessment of l n d l v l d u a l and c o l l e c t l v e doses f o r re leases from l a n d r e p o s l t o r l e s
[ ~4 I
Maxlmum Uaxlmum food y l e l d f o o d s t u f f annual annual o r pathway exposure consumption
Terrestrial Uar lne ( h ) ( k g ) ( k g km-2) ( kg )
O r l n k l n g wa te r 0.6 a_/
Freshwater f l s h 20
Beef Cow 1 l ver M l l k Mutton Sheep 1 l v e r Green vegetables Gra I n Root vegetables
Uar lne f l s h Crustacea mol luscs Seaweed
Beach occupancy b/ 1000 f l s h l n g gear exposure 880 fa rm p l o u g h l n g 300 Other l n h a l a t l o n 8760
a/ m3. b/ I n h a l a t l o n r a t e : 1 d h-1.
T a b l e 51
C o l l e c t l v e dose e g u l v a l e n t r a t e pe r u n l t a c t l v l t y a t c l o s u r e I n an enqlneered f a c l l l t r
as a f u n c t l o n o f t ime f rom 100 t o 2.000 years
C o l l e c t l v e dose e q u l v a l e n t r a t e
per u n l t a c t l v l t
c l o r u r e I Tlme a f t e r [man Sv (TBq a ) - ]

l a b l e 52
Collectlve dose equivalent rate per unlt actlvlty at closure In an engineered taclltty
as a functlon of tlme from 10.000 to 250.000 years
Collectlve dose equlvalent rate
per unlt actlvlt
closure r Tlme after [man Sv (TBq a)- ]
(years) 2 4 1 ~ u &/ 2 4 1 ~ m &/
a/ Most of the dose Is dellvered by 2 3 7 ~ p daughter.
T a b l e 53
Collectlve dose eaulvalent rate ver unlt acttvltf at closure In an enulneered faclllty
as a functlon of tlme from 100.000 to 2.000.000 years
Collectlve dose equivalent rate
per unlt actlvlt
closure 1 Time after [man Sv (T6q a)- ]
(years) 2 3 5 ~ 3/ 2 3 9 ~ u g/
-
a/ Host of the dose Is From the daughters 2 3 l ~ a and 2 2 7 ~ ~ .

T a b l e 54 - Collective effectlve dose equlvalent rate and comnltrnent
for disposal o f 1 TBq of each radlonucl~de bV shallow burlal (LLUL
Maxlmurn Tline at whlch the speclfled percentage of Collective collective the maxlmum collective effectlve dose
Radlo- effective effectlve equlvalent rate 1s reached nucl lde dose dose
equlvalent equlvalent comnl tment rate 1% 10% 100% 10% 1 X (man Sv) (man Sv a-l)
a/ Global clrculatlon. b/ Collectlve effectlve dose equlvalent rate less than 10-l2 man Sv a-l, -
or collectlve dose comnltment less than 10-lO man Sv.

T a b l e 55
Collectlve effectlve dose eaulvalent rate and comnltment for dlsposal o f 1 TBq of each radlonucllde by enqlneered trench ( I L W L
Maximum Tlme at which the speclfled percentage ot Collecttve coilectlve the rnaxlmum collective effective d o ~ e
Radlo- effective effective equtvalent rate 1 s reached nucllde dose dose
equivalent equlvalent comnl tment rate 1% 1 OX 100% 10% 1% (man Sv) (man Sv a-l)
g/ Global clrculatlon. b/ Collectlve effectlve dose equlvalent rate less than 10-12 man Sv a-l.
or collecttve effective dose equlvalent comnltment less than 10-10 man Sv.

T a b l e 56
Normallzed collectlve etfecttve dose equlvalent comnltment trom d l s ~ o s a l of lntermedlate-level waste ln a tyD\cal englneered trench
Normallred Normallzed collectlve Radlonucllde actlvlty effective dose
concentratton equlvalent comnltment a / - (10q (GW a)-]] [man Sv (W a)-)]
a/ Only those radlonuclldes are shown for uhlch the collectlve effectlve dose equlvalent comnltment per unit actlvtty exceeds 10-10 man Sv (lEiq)-l.
T a b l e 51
Attltudes towards reprocesslnq In countries wlth nuclear power statlons above 3 0 W
Optlons for dlsposal of spent fuel
Geologic burlal of unreprocessed
spent fuel
Reprocessing and burlal of solldtfled hlgh-level waste
belng consldered by:
Countrles Countrles reprocesslnq contracted for Uncomnl tted
reprocess lng rervlces
Canada France 8elglum Argent lna a_/ f lnland Germany. Fed-Rep. c/ Germany, Fed.Rep. Bulgaria b_/ Sweden Indla Italy Chlna ( Talwan Prov.) Sultzerland Japan Japan Czechoslovakia b/ Unlted States USSR netherlands Flnland b /
Unlted Klngdom Sweden German ~em.~ep.L/ Swltzerland Hungary b
Paklstan a_/ Republlc of Korea Spa l n Yugoslavia
a/ Pllot-scale reprocesslnq plants reported under construction. - b l Spent fuel o f Soviet orlgtn ultimately to be returned t o the USSR. g/ Plant reported to be under malntenance.

T a b l e 5 8
Natlonal programnes for reprocesslnq spent fuel from comnerclal nuclear power qeneratlon
Country Reprocessing capac lty and plans
Belglum The Eurochemlc plant at no1 (annual capaclty: 6 0 tonnes of uranlum) was operated between 1966 and 1974: It was then closed on t h e grounds that lt was uneconomic. A declrion on recormencement of operatlons and the posslblllty o f lncreaslng capaclty ls expected t o be made. Belglum has contracted ulth france for reprocesslng of about 54 tonnes of uranlum ln fuel.
Canada Research supportlng vltrtflcatlon development.
France The UP1 plant at Marcoule (annual capaclty: 1,200 tonnes of uranlum) has been operated slnce 1958 and the UP2 plant at Cap d e la Hague (annual capaclty: 9 0 0 tonnes of uranlum) slnce 1967 for natural uranlum gas-graphlte fuel. Folloulng adaptatlon, the U P 2 plant began In 1976 reprocesslng LWR fuel at a nomlnal annual capaclty of 100 tonnes of uranlum. The capaclty of the UP2 plant 1s belng progresslvely expanded. and a n e w plant, UP2-800 (annual capaclty: 8 0 0 tonnes o f uranlum) Is scheduled to begln operatlon by 1989. A thlrd plant, UP3A (annual capaclty: 8 0 0 tonnes of uranlum) began operatlon in 1987. A dupllcate plant. UP38. Is a l s o under conslderatlon. France has lnternatlonal reprocesslng contracts lnvolvlng a total of about 6,000 tonnes of uranium LWR fuel.
Finland Spent fuel of Sovlet orlgln Is t o be returned t o that country for reprocesslng.
German Oemocratlc Spent fuel Is t o be returned to the USSR for reprocesslng- Republ lc
Germany. Federal The experlmental WAK plant (annual capaclty: 3 5 tonnes of uranium) at Karlsruhe. Republtc o f operattonal slnce 1971, was reported closed In Hay 1 9 8 0 due t o repalrs.
Constructton of a plant at Wackersdorf In Bavarla (annual capaclty: 3 5 0 tonnes of uranlum) has been announced . A total of 1,700 tonnes of uranlum of spent LWR fuel Is contracted for reprocesslng In France.
Janan
Netherlands
Sweden
Sultzerland
USSR
The plant at Trombay for reprocesrlng natural uranlum metal fuel became operatlonal In 1965 (annual capaclty: 6 0 tonnes of uranlurn). The Tarapur plant for reprocesslnq HWR and LWR Fuel became operational In 1977 (annual capaclty: 100 tonnes of uranlum). It ls belleved that a thlrd plant for spent oxlde fuel from HWRs will t o b e operatlonal In the late 1980s at Kalpakkam (annual capaclty: 1 0 0 tonnes of uranlum).
2 0 tonnes of LWR fuel has been contracted for reprocesslnq ln the Unlted Klngdom. The Eurex pllot plant at Saluggla has a n annual capaclty of about 10-20 tonnes of uranlum in LWR fuel and ls used For research and development in reprocesslng.
A small demonstration reprocesslng plant at Tokai Mura has been reprocesslnq LWR fuel lntermlttently slnce 1977 (annual capaclty: 2 1 0 tonnes of uranium). A c o m e r c l a l plant For reprocesrlng LWR fuel (annual capaclty: 8 0 0 tonnes of uranlum) Is scheduled t o begin operatlon In 1990. Japan has contracted for reprocessing 1.600 tonnes of uranium in LWR fuel In france and 160 tonnes o f uranlum ln the Unlted Klngdom. Japan has also renewed a contract f o r reprocesslng 5 0 0 tonnes of uranlum In gas-graphlte fuel tn the Unlted Klngdom.
1 2 0 tonnes of uranlum has been contracted for reprocessing In France.
727 and 1 4 0 tonnes of uranlum In LWR Fuel have been contracted for reprocesslng ln France and the Unlted Klngdom, respectlvely. The majorlty of Suedlsh spent fuel (6.000 tonnes) 1s t o bp stored In Sweden for up t o 2 0 years pendlng a decislon on Its disposal.
4 7 0 tonnes of uranlum has been contracted for reprocesslng In France.
Spent fuel reprocesrlng ls being carrled out on a pllot scale; no data a r e avallable on the capacltles or locatlons of Sovlet reprocessing plants. It is understood, however, that spent fuel of Sovlet orlgln produced In countrles of the Councll for Mutual Economlc Assistance (e.g. Bulgarla. Czechorlovakla. German Oemocratlc Republlc. kungary) 1s scheduled for return t o the USSR. The USSR has a l s o negotlated for the return of spent fuel of Sovlet orlgln from Flnland.

Table 58. conttnued
Country Reprocesslng capaclty and plans
Unlted Klngdom The 8204 plant (annual capacity: 1.000 tonnes of uranlum] reprocessed natural uranlum gas-graphite fuel ln the 1950s and early 1960s. Ihe 8205 plant (annual capaclty: 2.000 tonnes o f uranium) has reprocessed thls fuel since 1964 and ls scheduled to undergo renovation. The 0204 plant, after modlflcatlon. reprocessed LWR fuel between 1968 and 1973. A thermal oxlde reprocesrlng plant (THORP) (annual capactty: 1.200 tonnes of uranlum) 1s under constructton and expected to begln reprocesslng LWR fuel by 1990. The Unlted Klngdom has lnternatlonal contracts for reprocesslng about 3.100 tonnes of uranlum In spent fuel.
Unlted States The plant at West Valley. New York, (annual capaclty: 300 tonnes of uranlum) operated Intermittently from 1966 untll 11s closure in 1972. Oue to maintenance problems, a novel plant at Morris. Illlnols. (annual capaclty: 300 tonnes of uranlum) never began operatlon. Reprocesslng of comnerctal nuclear power Fuel was deferred IndefInltely In 1977. Constructlon was halted on a plant at Barnwell. South Carolina. whlch could requlre an addltlonal 1 800 mllllon to complete (annual capactty: 1,500 tonnes of uranlum). Its operatlon In the 1990s has been suggested.

T a b l e 59
Radlonuclldes dlscharqed ln alrborne effluents from fuel reprocesrlnq plants. 1980-1985 [el, 82. 83. 87. aa, 816. 829, F I . F ~ I
Actlvlty (Tag)
Year Electric energy Partlculate release
H-3 C-14 Kr-85
Total Total alpha beta
Normallzed actlvlty. 1980-1985 [TBq (GW a)-11
Normallzed actlvlty. 1980- 1985 [ T b q ( G w a)-)]
Normdllzed actlvlty. 1980 [TEq (Gw a)-11
Sellafleld. Unlted Klngdom
Cap d e la Hague. France
Marcoule. France

Table 59. continued
Electrlc Year energy Isotoptc cornpositlon of partlculate acttvlty (total beta)
Normallzed actlvlty. 1980-1985 [Tea (GW a)-] ]
Sellafleld, Unlted Klngdom
Normallzed actlvlty. 1980-1985 [TBq (Gw a)-']
Cap d e la Hague. France

T a b l e 60
Radlonuclldes dlscharqed ln ltauld effluents from fuel reprocesslna plants. 1980-1985 [el. 82. 83. 88. 816. 829. c5. fi. r4. G ~ I
-- -
Actlvlty (TBq)
Year Total beta
Total (other H-3 Sr-90 Ru-106 Cs-137 alpha than H-3)
Sellafleld. Unlted Klngdom
Normallzed actlvlty. 1980-1985
[TBq (GW a)-'] 8.0 9 69 579 17.9 (t5.2) (t550) (i35) (*49)
Cap de la Hague (France)
Normallzed actlvlty, 1980-1985
[TBq ( W a)-']] 0.1 256.9 285.6 18.97
Marcoule, France
Normallzed actlvlty. 1980
[TEq ( G w a)-'] 1 0.063 27 294 3.3

T a b l e 61
Isotoplc composltlon of effluents from the Sellafleld and Cao de la Hague reorocesslng plants. 1980-1985
[El, 02, 83, 08, 016, 029, f4]
Actlvlty (TBq)
Radlonucllde
Sellafleld. United Kingdom
5-35 1 .O 0.51 0.8 30.0 0.7 0.8 Hn-54 < 0.063 < 0.095 < 0.1 < 0.2 < 0.2 < 0.2 fe-55 1.1 1.2 0.9 1 .I 0.9 0.7 to-60 0.78 0.74 1.1 1.7 1.3 2.3 Nl-63 0.41 0.53 0.5 1 .I 1.5 0.4 Zn-65 0.033 < 0.034 < 0.04 < 0.04 < 0.03 < 0.06 Sr-89 12 1 1 < 13 < 8.5 < 3.0 < 1.8 Sr -90 352 280 319 204 72 5 2 Zr-95 60 130 212 21 1 162 I8 Nb-95 100 200 304 385 31 2 28 TC -99 57 5.8 3. 6 4.4 4.3 1.9 Ru-103 4.6 1 1 1 7 19 8.4 1 .6 Ru-106 340 530 419 553 348 8 1 Ag-llOm 0.044 0.14 0.1 < 0.1 < 0.1 < 0.1 Sb-125 2 1 2 6 2 3 I8 12 1 1 1-129 < 0.14 < 0.19 < 0.1 < 0.2 < 0.1 < 0.1
Cs-134 240 170 138 89 3 5 30 Cs-137 3000 2400 2000 1200 434 325 Ce-144 3 7 17 2 2 2 4 9 < 5 Pm-147 86 3 2 3 2 25 7 7 5.9 Eu-152 4.7 3.5 < 0.6 < 0.2 < 0.2 < 0.1 Eu-154 2.0 1.6 < 1.0 < 0.5 < 0.3 0.1 Eu-155 4.2 2.6 < 1.2 < 0.6 < 0.3 0.2 Uranium (kg) 4861 4499 601 1 2602 2037 2447 Np-237 0.67 0.41 0.3 0.3 0.3 0.2 Pu-238 6.9 5.0 4.7 2.9 2.6 0.8 Pu-239/240 20 I5 l i, 8.7 8.3 2.6 Pu-241 728 600 485 33 1 345 8 1 Am- 2 4 1 8.3 8.8 5.4 2.2 2.3 I .b Crn-242 0.33 0.19 0.28 0.4 0.1 < 0.1 Crn-243/244 0.19 0.11 0.14 0.1 0.1 < 0.1
Electrlc energy from fuel reprocessed (GW a) 2.21 3.71 3.14 2.96 2.65 1.70
Cap de la Hague. France
Electrlc energy from fuel reprocessed ( G W a) 2.65 3.11 4.50 4.50 2.35 6.11

T a b l e 62
l o t a l beta/qamna a c t l v l t y I n t l s h f rom the l r l s h Sea and t h e Nor th Sea. 1983
[ H7 I
Mean a c t l v l t y
Sarnpllng a rea / l a n d l n g p o l n t s
Number o f c o n c e n t r a t l o n ( w e t ) 8q k g - ' Sample sampl l n g
observa t lons To ta l b e t a 134-C5 131-Cs
S e l l a f l e l d s h o r e l l n e area Cod f l o u n d e r
S e l l a f l e l d o f f s h o r e a rea P l a l c e Dab Skate W h i t i n g Cod
Ravenglass a/ Cod P l a i c e
Nor the rn N o r t h Sea P l a l c e Cod Haddock Sal t h e
M ld -Nor th Sea P l a i c e Cod Haddock H e r r l n g W h l t l n g
Southern N o r t h Sea P l a i c e Cod W h i t i n g Her r l n g
I c e l a n d a rea Cod Haddock P l a l c e
a/ Landlng p o l n t . n /d = no t de tec ted .
T a b l e 63
T r a n s u r a n l c a c t l v l t y I n f l s h and shellfish f r o m t h e l r l s h Sea and N o r t h Sea. I983 [ H7 I
Number o f Mean a c t l v l t y concentration ( v e t ) . Bq kg- ' Sampl tng a rea / Sample sampl l n g l a n d l n g p o t n t s observations
238pU 239,740pu 241 pu 2 4 1 b 2 4 2 ~ ~ 2 4 3 , 2 4 4 ~ ~
S e l l a t l e l d s h o r e l l n e a rea Cod I 0.0047 0.025 0.020 0.00044 0.0001 1 Crabs 3 0.71 2.9 80 7.3 0.097 0.051 L o b s t e r s 3 0.54 2.2 63 14 0.059 0.067 Wlnk les 2 6 .6 2 7 110 37 0.45 0.17
S e l l a f i e l d o f f s h o r e a rea P l a l c e 1 0.0085 0.034 0.038 n/d n / d Cod 1 0.0057 0.026 0.030 0.00081 n / d Ska te 1 0.011 0.044 0.045 0.00054 0.00027 Whelks 1 1.7 7.3 15 n /d n / d
Ravenglass a/ Cock les 1 14 54 75 1.5 0.47 Uusse ls 2 9.9 4 1 1000 55 0.45 0.75 P l a l c e 1 0.011 0.043 0.048 0.0017 0.00014 Cod 1 0.0040 0.016 0.015 0.00088 0.00026
N o r t h e r n N o r t h Sea Cod 1 0.00067 0.0038 0.0051 n/d 0.00002 Nephrops 1 0.0019 0.0092 0.0074 0.00077 0.00008
M ld -Nor th Sea Nephrops 1 0.00075 0.0033 0.0025 n/d n / d Mussels 1 0.0035 0.019 0.0045 n/d n / d
Sou thern N o r t h Sea Mussels 1 0.00071 0.0042 0.0013 n/d n / d Cock les 1 0.0023 0.013 0.0054 n/d n / d
I c e l a n d a rea Cod 1 O.OC0063 0.00077 0.00032 n /d n /d
a/ Land lng p o l n t . - n/d = Not de tec ted .
228

Normallzed lccal and reulonal collectlve effectlve dose epulvalent c o m l t n ~ e n t r from atrnospherlc releases from fuel reprocesslnq
at Sellafleld and Cap d e la Hasue
Normal lzed Normalized actlvlty collectlve effectlve dose
1980-1985 eaulvalent comnltment
i T B q ( ~ . l ' [man sv (GW~)"] Pathway
Sellafleld La Hague Sellafleld La Hague
Inhalation H-3 120 3.5
Pu-239 0.00006 0.000002
Total
Total
- 1 Welghted total 1.3 man Sv (GW a)
T a b l e 65
Normallzed local and reglonal collectlve effectlve dose eaulvalent c o m l t m e n t s
from aauatlc discharqes from Sellafleld and Cap d e la Hague
Norrnallzed collectlve effectlve dose equlvalent
comnl tment
[man sv (GM a)-'] Pathway
Sellafleld L a H a g u e
Mollusc and crustacea Ru-106 4.7 9.9 Sr -90 1 0.23 Pu-239-240 0.2 0.06
Total 4 4 11

T a b l e 6 6
Occupational exposures at reprocesslns plants ln the Unlted Klngdom and Japan
[A5. 812. 823. 828. HE]
Country
Collectlve Annua 1 Annual effective
collectlve average dose equlvalent Year N u m b e r o f effective effective comnl tment
workers dose dose per unlt energy monltored equivalent equlvalent generated
( m n Sv) (mSv) l m a n S v ( G W a ) - ' 1
Japan 1980 740 0.60 0.8 1 .O 1981 940 0.54 0.7 1.1 1982 1170 0.71 0. 6 1.3
Unlted Klngdom 1980 5200 43 8.2 19.4 1981 5400 3 9 7.1 10.4 1982 5600 38 6.7 12.1 1983 5300 37 1 .O 12.6 1984 5600 3 6 6.7 13.4 1985 5600 32 5.6 18.9
Occuoatlonal exposures at Cap de la Halue and Uarcoule. France. 1973-1985 [Cb. H13, ZI]
Annua 1 Annual Normallzed collectlve average collectlve
Number of effectlve effect\ve effectlve Year workers dose dose dose
monltored equlvalent equlvalent equtvalent (man Sv) (mSv) [man Sv
(GW a)-1]
Cap de la Hague
Karcoule
a/ No estimate avallable.

T a b l e 6 8
Solld Intermediate-level waste productlon at operating reprocesslnq plants
[Tll. 8321
Actlvlty per unlt ener y generated -9 [TBq ( G W a ) I
Plant ILW production
-3 [m ( m a)-'] Alpha B e t a / g a m
Sellaf leld Magnox 300 Sellafleld AGR 5 0 Marcoule 1000
T a b l e 69
Fractlon o f the fuel throughput of a reprocesslnq plant estimated to arlse as low- or lntermedlate-level vaste
lo41
Volume fractlon of fuel throughput for radlonuclides generated
Waste category i m3 (GWa)-'1 Sr/Cs Ru/Ce Pu Am Cm
Fuel residues. hulls
and hardware 20 5 1 0 - 4 5 1 0 - 4 5 1 ~ - 4 5 1 0 - 4 5 1 ~ - 4
Non-combustlblewaste 15 lo-6 lo-6 Compressible and
combustible wastes 7 0 lo-b lo-b
Concentrated llqulds
and particulate 6
solldlfled wastes
T a b l e 7 0
Normallzed collective effective dose eaulvalent comnltrnent, truncated to different times for globally dispersed nuclides,
welghted for the fractlon of fuel reprocessed
Years - - .
Radlo- nucllde
10 100 1000 10.000 1.000.000

T a b l e 71
Transport needs In the nuclear fuel cycle for generatlon of 1 GW a electrical enerqy
by a LWR uslng plutonlum recycle [ I l l
Material Amount From (tonnes)
Uranlum ore Uranlum yellow-cake
Fuel elements Spent Fuel Recovered f l ss l le
materlals Hlgh-level waste Other solld wastes
60000 Mlne ~ l l l 170 nlll Reflnery/enrlchment/
fuel fabrlcatlon 37 Fuel fabrlcatlon Reactors 37 Reactors Storage/reprocesslng 25 Reprocesslng Converslon/enr\chment/
fuel fabrication 10 Reprocessing Waste reposltory
1000 All facllltles Dlsposal sltes
T a b l e 72
Normallzed exposure of members of the publlc from radionuclldes In effluents From the nuclear fuel cycle.
local and regional populattons
Operat lon and main radlonucllde
Normalized collectlve effective dose
equivalent comnltment [man Sv (GW a)-']
Mining Radon
Milling Uranlum, thorlum, radium Radon
Mine and mlll tailings piles (releases over Five years) Radon.
Fuel fabrlcatlon Uran l um
Reactor operation Atmospheric
Noble gases Actlvatlon gases Tritium Carbon-1 4 Iodlnes Particulates (Cs. Ru. Co)
Aquatlc Trltlum Others (Cs. Ru. Co)
Reprocesslng Atmospheric
Trltlum Krypton-85 Carbon-14 Caeslum-137 Iodlne-129 Alpha-emitters
Marlne Caeslurn-134.137 Ruthenium-106 Stront lum-90 Alpha-emltters
Transportatlon 0.1
Total ( rounded) 4

T a b l e 73
Normallzed exposure! of members of the ~ u b l l c from solld waste d l s ~ o ~ a l and globally dlspersed
radlonuclldes in effluents from the nuclear fuel cycle
Source
Norma 1 l zed collectlve effectlve
dose equlvalent comnl tment
[man sv (GW a)-']
Mlne and mlll talllngs 150 4
(releases over 10 years) and fuel fabrlcatlon
Reactor operatlon LLW dlsposal 0.00005 ILW dlsposal 0.5
Reprocesslng solld waste dlsposal 0.05 Globally dlspersed radlonuclldes 6 3
Total (rounded) 200
T a b l e 74
Normallzed occupational exposures from the nuclear fuel cycle
Operatlon
Normal l zed collectlve effectlve
dose equlvalen:
[man sv (GW a)-']
Uranlum minlng and mllllng 0.7 fuel fabrlcatlon 0.5 Reactor operat \on 10 Reprocessing 0.25 Transportatton 0.2
Total (rounded) 12

Aleksandrov, A.P., A.S. Kochenov, E.V. Kulov et al. Atomic Power in the USSR. .Atomic Energy 54: 243-249 (1983). Aarkrog. A. Bioindicator studies in Nordic waters, safety research in energy production. Riso National Laboratory. 1985.
Ashmore, J.P. Nuclear fuel cycle statistics for Canada. 1980-1985. Personal communication from the Radia- tion Protection Bureau, Ontario. Canada (1987).
Aso. R., K. hliyabe. H. Ishiguro et al. Occupational radiation exposure of the preprocessing plant a t the plutonium fuel fabrication facilities at Tokai works. p. 804-807 in: Proceedings of the 6th Congress of the International Radiation Protection Association. Berlin (Federal Republic of Germany), 1984.
Achkasov, S.K.. V.V. Badyaev, Y.A. Egorov et aI. Complex experimental and calculated studies of gaseous releases from APS into the environment. p. 136-140 in: APS Radiation Safety and Protection (Y. A. Egorov, ed.) (Val. 8). Energoatomizdat, hfoscow, 1984 (in Russian).
As. D. Van, A. Grundling, S. Redding et al. An assessment of the population dose due to radon-222 from mine tailings on the Witwatersrand. p. 254-257 in: Radiation-Risk-Protection. Proceedings of the 6th International Congress of the International Radiation Protection Association, Berlin (Federal Republic of Germany), 1984.
.4ury, R. Occupational exposure at the Ranger uranium mine, Australia. Personal communication (19863.
British Nuclear Fuels Limited. Annual report on radioactive discharges and monitoring of the environ- ment 1980. BNFL (1981).
British Nuclear Fuels Limited. .4nnual report on radioactive discharges and monitoring of the environ- ment 1981. BNFL (1982).
British Nuclear Fuels Limited. Annual report on radioactive discharges and monitoring of the environ- ment 1982. BNFL (1983).
Becker, K.H., A. Reineking, H.G. Scheibel et al. Measurements of activity size distributions of radio- active aerosols from a nuclear power plant. p. 936-939 in: Proceedings of the 6th Congress of the Inter- national Radiation Protection Association. Berlin Federal Republic of Germany), 1984.
Baas, J.L. Discharge and occupational data for nuclear stations in Netherlands. Private communica- tion from the Xlinisterie van Volkshuisvesting, Ruimtelijke Ordening en hlilienbeheer, 1986.
Badyaev. V.\.'., Y.A. Egorov, G.N. Krasnoznen et al. Tritium in technological systems of Chernobyl APS. p. 58-60 in: APS Radiation Safety and Protection. (Y..4. Egorov, ed.) (Vol. 8). Energoatomizdat. ,Lloscow, 1984 (in Russian).
Badyaev, V.V., Y.A. Egorov, \:.L. Korobeinikov et al. The description of radioactive releases and discharges of Chernobyl APS during the period of putting into operation and the results of the dispersion into the environment. p. 85-93 in: APS Radiation Safety and Protection (Vol. 9). (Y.A. Egorov, cd.). Energo- atomizdat, Moscow, 1985 (in Russian).
Badyaev, V.V., G.N. Krasnoznen, B.1. Ogorodnikov et al. Research of aerosol dispersion compounds in RBMK APS's. p. 282-285 in: APS Radiation Safer! and Protection (Vol. 9). (Y.A. Egorov. ed.). Energo- atornizdat. Moscow, 1985 (in Russian).
Bernhard, S., J.F. Pineau, A. Rannou et al. 1983: One year of individual dosimetry in French mines. Proceedings of the Conference on Occupational Radiation Safety in Mining. Toronto. 1984.
British Nuclear Fuels PLC. Annual report on occu- pational safety 1983. BNF (1984).
Blomqvist, L. Annual collective doses in Finnish nuclear power plants 1980- 1984. Personal communi- cation (1987).
Blanchard. R.L.. D.M. Montgomery, H.E. Kolde et al. Supplementary radiological measurements at the Maxey Flats Radioactive R'asle Burial Site 1976-1977. EPA/520/5-78-011 (1978).
Beskrestnov, N.V., E.S. Vasilgev, V.F. Kozlov st al. Radiation doses incurred by the personnel of nuclear power plants with WWER-40 reactors. p. 41-14 in: .4PS Radiation Safety and Protection (Vol. 7). (Y.A. Egorov, ed.). Energoatomizdat. hloscotv. 1984 (in Russian).
British Nuclear Fuels PLC. Annual report on radio- active discharges and monitoring of the environment 1984. BNF (1985).
Blomqvist, L. Personal communication on Finnish reactor discharges 1980-85. ( 1987). Beninson, D. Argentinian data on discharges and occupational exposures for .4tucha and Embalse reactors. Personal communication (19861.
Beskrestnov, N.V., N.G. Guse\: and 1.S. Safonov. Radiation releases from APS and the principles of their standardization. (in press).
Baklanov, S.G., 4.V. Vasilitchuk, V.hi. Etcherkin el al. Investigation of environment radiation in the region of APS with VK-50. p. 154-162 in: XPS Radiation Safety and Protection (Y.A. Egorov. ed.) (Vol. 8). Energoatomizdat. Mosco\v, 1984 (in Russian).
Babaev, N.S., V.F. Dernin, L..4. Ilyin et al. Nuclear Energy. Man and Environment (X.P. Aleksandrov, ed.). E~lergoatomizdat, Moscow, 19Y4. Becker, K. External radiation exposure in reprocessing plants. Radial. Prot. Dosim. 15(1): 3-8 (1986).
British Nuclear Fuels PLC. Annual report on occupa- tional safety 1984. BNF (1985).
Babenko, X.G., B ~ ~ ~ ~ ~ ~ , , I.G. ~ ~ ~ ~ b ~ i ~ i k ~ ~ et B24 Rartlett, D.T. Occupational exposure to neutron a]. The decrease of tritium releases into the environ- radiation in England, Scotland and Wales. NRPB- ment during the o~era t ion of APS. D. 64-66 in: APS M 134 (1986). Radiation gafety and Protection. (s:A. Egorov, ed.) B25 Bernhardt D.E., F.B. Johns and R.F. Kaufmann. (Vol. 8). Energoaiomizdat. Moscow, 1984 (in Russian). Radon exhalation from uranium m~l l tailings piles.
British Nuclear Fuels Limited. Annual report on ORP/LV-75-7(A) (1975).
radioactive discharges and monitoring of the environ- B26 Bigu, J . , M. Grenier, N.K. Dave et al. Study of radon ment 1983. BNFL (1984). flux and other radiation variables from uranium mine

tailings areas. Uranium 1: 257-277. tlsevler, Amster- dam, 1984.
Brey, H.L. and H.G. Olson. Fort St. Vrain experience. Nucl. Energy 22(2): 117-121 (1983). British Nuclear Fuels Limited. Annual report on occupational safety 1985. BNFL (1986). British Nuclear Fuels Limited. Annual report on radioactive discharges and monitoring of the environ- ment 1985. BNFL (1986).
Bell. M.J. Sources of reactor wastes, their characteris- tics and amounts. Radwaste Management Workshop. Oak Ridge National Laboratory. 1977.
Bourns. W.T. Development of techniques for radwaste systems in CANDU power stations. in: Proceedings of the Symposium on On-site Management of Power Reactor Wastes, Zurich. OECD-NEA (1979).
Bastien Thiry, H., J.P. Laurent and J.L. Ricaud. French experience and projects for the treatment and packaging of radioactive wastes from reprocessing facilities. p. 219-237 in: Radioactive Waste Manage- ment STI/PUB/649 IAEA, Vienna, 1984.
Brookes, 1.R. and T. Eng. Occupational radiation dose statistics from light water power reactors operating in Western Europe. Commission of the European Com- munities. EUR 10971 (1987).
Beninson. D. Radon emanation rates measured in mill tailings of Argentina. Personal communication (1987).
Brooks, B.G. Occupational radiation exposure at commercial nuclear power reactors, 1984. NUREG- 0713, Vol. 6 (1988).
Byldakov, L.A. and 0. Pavlo\sky. The current state of nuclear power plant radiation safety in the USSR. in: Proceedings of a CMEA Conference in Varna, Bulgaria, 1988. (in Russian).
Bernhard, S., G. Kraemer, J. Le Gacet al. Organisation et rtsultats de la surveillance radiologique du per- sonnel des mines d'uranium en France. Technical Committee on technologicai aspects of the extraction of Uranium. IAEA, Montpellier. France (1987).
Commission of the European Communities. Metho- dology for evaluating the radiological consequences of radioactive effluents released in normal operation. CEC V/3865/79 (1979).
Cherny. S.S. and V.P. Grigirov. Radioactive aerosols in the Chernobyl NPP ventilation systems. Atomic Energy 53: 338 (1982).
Costello, J.M. Current state of the art in hieh level radioactive waste disposal. At. Energy Aust. ?7(1-4): 17-40 (1984).
Celeri, J-J. Discharges from French PWR power plants: treatment and control. Nuclear Europe 4: 14-16 (1985).
Calmet, D. and P.M. Guegueciat. Behaviour of radio- nuclides released into coastal waters (R.J. Pentreath. ed.). IAEA TECDOC 329. IAEA, Vienna, 1985. Castaing, R. et ai. Rapport du groupe de travaille sur la gestion des combustibles irradiks. Minisdre de la Recherche et de I'lndustrie. Paris, 1982.
Cooper, W.E. A comparison of radon-daughter exposures calculated for U.S. underground uranium miners based on MSHA and company records. p. 292-295 in: Radiation Hazards in Mining. (M. Gornez, ed.). Society of Mining, New York, 1982.
Clancy, J.J. Data base for radioactive waste manage- ment. Vol. I, Review of Low-Level Radioactive Waste Disposal History. NUREG/CR-1759 (198 1).
Commissariat a I'Energie Atomique. The "Centre de la Manche". ANDRA, Paris (1981). Ciallella. H.E. et al. Radon emanation measurements from uranium ore tailings in Argentina. p. 373-376 in: Radiation Protection Practice. Proceedings of the
7th International Congress of IRPA. Sydney. Australia, 1988.
Didenko, L.G. and A.G. Fatkin. 1-131 phgsics- chemical forms in gaseous-aerosol releases from Beloyarskaya APS. p. 146-148 in: APS Radiation Safety and Protection (Vol. 9). (Y.A. Egorov, ed.). Energoatomizdat, Moscow. 1985 (in Russian).
Dichev, G.. G. Hitov, R. Fisher et al. Radiation safety of the serial APS with VVER-440. p. 15-13 in: Proceedings of the International Conference of CMEA, Vilnius (USSR). May 1982 (Vol. 9). Energoatomizdat, Moscow, 1983 (in Russian).
Department of the Environment. Annual survey of radioactive discharges in Great Britain 1980. ( 198 1 ).
Department of Energy, United States. Final en\-iron- mental impact statement on radioactive lvaste. DOE/ EIS-0046F ( 1980).
Environmental Protection Agency. Potentia! health and environmental hazards of uranium mine wastes. A report to the Congress of the United States. EPA/l-6-83-007 (1983).
Environmental Protection Agency. Radiological impact caused by emissions of radionuclides to air in the United States. EPA-520/7-79-006 (1979).
Environmental Protection Agency. Occupational exposure to ionizing radiation in the United States. EPA 520/ 1-84-005 (1984).
Environmental Protection .4gency. United States. Environmental standards for uranium and thorium mill tailings at licensed commercial processing sites. 40 CRF. Part 192. Federal Register 48 No. 196: 459263594? (1983).
Environmental Protection Agency, United States. An analysis of low-level solid radioactive waste from LWRs through 1975.ORP-TAD-77-2 (1977). Environmental Protection Agency, United State;. Characterization of selected I~\\~-level radioactive waste generated by four commercial light-watcr reactors. ORP-TAD-77-3 (1977).
Eckeri, H., G. Drexler and G. Wcimrr. The system of operational radiation protection monitoring in the Federal Republic of Germany. Proceedings of Per- sonnel Radiation Dosimetry Symposium, Knoxville, Tennessee. USA 119841. . . Electricit6 de France. Rapport d'acrivitt 1985: Secu- rite et radioprotection. Service de la Production Thermique (1985).
Frazer. G. A summary of reactor effluent data within the European Economic Community. Private com- munication (1985). Faircough, M.P.. D.C. Moore and B.J. Tymons. An Estimate of Conditional Waste Arisings to the Years 2000 and 2010 for the Department of Energy Power Generation Scenarios. DOE/R W/84-133 (1 984).
French Ministry of Industry. Discharges from reactors and reprocessing plants 1980-1985. ( 1988). Gelder, R., J.S. Hughes, J.H. Mairs et a]. Radiation exposure resulting from the normal transport of radioactive materials within the United Kingdom. NRPB-R155 (1984).
Griffith, D. Isotopic composition of effluents from a centrifuge enrichment plant, PNF Capenhurst. Per- sonal communication (1985). Gaiko. V.B., N.A. Korablev, E.N. Solovyov et al. Discharge of C-14 at an APS with RBMK-1000. Atomic Energy 59: 144-145 (1985).
Guegueniat, P., R. Gandon, Y. Baron et ai. Utilisation de radionucliides anificiels ('"Sb, '"Cs, 134134C~) pour l'observation des diplacements de masses d'eau en Xianche et a I'entrte de la Mer du Nord. Repon of the Laboratoire de RadioCcologie Marine de Cap de la Hague. CEA/I PSN/DERS/SERE ( 1987).

Goodill, D.R. and B.J. Tymons. Radionuclide com- positions of spent fuel and high level waste from commercial nuclear reactors. Report by UKAEA to UKDOE DOE/RUr/83 11 2 (1984).
Heap, G.F. and .A. Short. Report on radioactive discharges, associated environmental monitoring and personal radiation doses resulting from operation of Central Electricity Generating Board nuclear sites in 1980. CEGB report NHS/R 163/81 ( 1981).
Heap, G.F. and A. Short. Report on radioactive discharges, associated environn~ental monitoring and personal radiktion doses resulting from operation of Central Electricity Generating Board nuclear sites in 1981. CEGB report NHS/R 169/82 (1982).
Heap, G.F. and .4, Short. Report on radioactive discharges. associated environmental monitoring and personal radiation doses resl~lring from operation of Central Electricity Generating Board nuclear sites during 1982. CEGB report NHS/R182/83 (1983).
Heap, G.F. and A. Short. Report on radioactive discharges, associated environmental monitoring and personal radiation doses resulting from operation of Central Electricity Generating Board nuclear sites during 1983. CEGB report NHS/R188/84 (1984).
Hunt, G.J. Radioactivity in surface and coastal waters of the British Isles 1981. Ministry of Agri- culrure, Fisheries and Food. Aquatic Environment hlonitoring Report 9 (1983).
Hunt, G.J. Radioactivity in surface and coasral waters of the British lsles 1982. Ministry of Agri- culture. Fisheries and Food. Aquatic Environment hionitoring Report 11 ( 1981).
Hunt, G.J. Radioactivity in surface and coastal waters of the British lsles 1983. Ministry of Agri- culture. Fisheries and Food. Aquatic Environment Monitoring Report 12 (1985).
Hughes, J.S. and G.C. Roberts. The radiation exposure of the UK population- 1984 review. NRBP- R173 (1984).
Hans. J.hi., G.E. Eadie and hl.F. O'Comeli. Environ- ment condition and impact of inactive uranium mines. p: 163-175 in: Radiation Hazards in Mining. (M. Gomez, ed.). Society of Mining, New York. 1982.
Hartley, J.N., G.W. Gee, H.D. Freeman et al. Uranium mill tailings remedial action project (Uh,lTRAP)-cover and liner technology develop- ment project, p. 429-448 in: Management of Wastes from Uranium hlining and Milling. IAEA, Vienna. 1982.
Hill, O.F., .A.M. Platt and J.V. Robinson. Kuclear Fact Book. PNL-4239-Ed 2 (1983).
Hill, M.D. and P.D. Grimwood. Preliminary assess- mentof'the radiological protection aspects of disposal of high-level waste in geologic formations. NRPB- R69 ( 1978).
Henry, P. Exposition professionelle dans les usines de retraitement. Radioprotection 2 l(3): 213-229 ( 1986).
Harrington. T. Rehabilitation of Rum Jungle. Australia mine tailings. Personal communication (1986). Holcomb. \tl.F. Inventory (1962-1978) and projec- tions (to 2C00) of shallow land burial of radioactive wastes at commercial sites: an update. Nucl. Safety 2 l(3): 380-388 ( 1980).
International Atomic Energy Agency. Nuclear Power Reactors in the World. IAEA, Vienna, 1988.
International Atomic Energy Agency. Nuclear Power: Status and Trends. IAEA, Vienna, 1987.
International Atomic Energy Agency. Operating experience with nuclear power stations in Member States in 1980. IAEA, Vienna, 1982.
International .4tomic Energy Agency. Operating experience with nuclear pourer stations in hiember Slates in 1981. IAEA, Vienna. 1983.
International Atomic Energy Agenc!. Operating experience with nuclear power stations in Member States in 1982. IAEA. Vienna. 1984.
International Atomic Energy Agency. Operating experience with nuclear power srations in Xiember States in 1983. IAEA. Vienna, 1985.
Imahori, A. Occupational radiation exposure at nuclear power plants in Japan and the United States. Nucl. Saf. 24: 829-835 (1983).
Imahori, A. Occupational radiation exposure at nuclear power plants in Japan. p. 266-269 in: Radiation- Risk-Protection. Proceedings of the 6th International Congress of the International Radiation Protection Association. Berlin (Federal Republic o i Germany). 1984. International Con~mission on Radiological Protrc- tion. Limits for Inhalation of Radon Daughters b! Workers. ICRP publication 32. Ann. ICRP 6. KO. I ( 198 1).
International Atomic Energy Agency. Fast Breeder Reactors: Experience and Trends. Proceedings of a Symposium. IAEA, Vienna (1986).
International Commission on Radiological Protec- tion. Radiation Protection of Workerb in hlincs. ICRP publication 17. Ann. ICRP 16. No. 1 (1986).
International Atomic Energy .Agency. Underground disposal of radioactii~e waste: Basic guidance. Safety Series No. 54 (198 1).
International Commission on Radiological Protec- tion. Radiation Protection Principles for the Disposal of Solid Radioactive Waste. ICRP Publication 16. Annals of the ICRP. 1986.
International Fuel Cycle Evaluation (INFCE). Waste Management and Disposal: Report of M'orl:ing Group 7. IAEA, Vienna, 1980.
Ichikawa, R. Occupational exposure data for uranium fuel fabrication in Japan. Personal comn~unication ( 1987).
Jackson. P.O. et al. Radon-222 emissions in vcntila- tion air exhausted from underground uranium mines. PNL-2888 and NUREG/CR-0627 (1979).
Jackson, P.O., J.A. Glissmeyer, W.I. Enderlin et al. Radon-222 emission in ventilation air exhausted from underground uranium mines. p: 779-786 in: Radialion Hazards in Mining. (M. Gomez, ed.). Society of Mining, New York. 1982.
Japan Nuclear Safety Con~mission. Monthly Reports. No. 50 (1982). No. 60 (1983). No. 72 (1984), No. 81 (1985). (in Japanese).
Kumatori. T. Effluent releases from reactors in Japan. Japanese Institute of Radiological Sciences. Personal communication ( 1986).
Kunz, C. Carbon-14 discharge at three light-lvater reactors. Health Phys. 49: 25-35 (1985).
Khitov, G., G. Dichev, G . Stefanov et al. Dose loads on the personnel due to external and internal radiation during Kozlodui NPP operation. In: Ensur- ing Radiation Safety in Nuclear Power Plant Opera- tion. Book 2, CMEA Scientific and Technical Council on Radiation Safety (1983) (in Russian).
Kazachkovski, O.D., A.G. Meshkov, F.hl. Slitenkov et al. Growth and experience in the operating of fast reactors in the USSR. Atomic Energy 54: 262-269 (1983). Kaufmann, R.F. Role of the aqueous pathway in environmental contamination from uranium mining. p. 1004-1013 in: Radiation Hazards in Mining. (M. Gornez, ed.). Society of Mining, New York, 1982.

Letourneau. E.G. Data on effluent releases from nuclear fuel cycle activities in Canada. Personal communication (1985).
Leach. \'.A., K.H. Lokan and L.J. Martin. A study of radiation parameters at Nabarlek uranium mine. ARL/TR-OZg ( 1980).
Little. C.A. and D.E. Fields. Simulations of long- term health risk from shallou. land burial of lo*-level radioactive waste. CONF-820933-8 (1982).
Lawson, G. and G.M. Smith. BIOS: A model to predict radionuclide transfer and doses to man following releases from geological repositories for radioactive wastes. N RPB-R 169 ( 1985).
Lochard. J. and h.1. Benedittini. Expositions profes- sionelles dans Ics reactors j. cau pressurisie: compari- son internationale de quelques indicateurs globaux entre 1975 et 1985. CEPN rapport no. 103 (1987).
Slargulova. T.K. Atomic energy: today and tomorrou. Energia 4: 18-2 I (1985). (in Russian).
Meyrrhof, D.P. Isotopic composition of effluents from Canadian conversion plants. Department of Health and Welfare of Canada. Personal comniuni- cation. ( 1985).
Alaruyama. T.. T. Kumamoto. Y. Noda et al. Collecti\-e eiiecti\.e dose equivalent, population doses and risk estinlatcs from occupational exposure in Japan. 1983. Proceedings of Symposium on Personnel Radiation Dosirnctr). ORNL ( 1985). Slacharen, J.F. Environmental Assessment of the Proposed Elliot Lake Uranium hlines Expansion. Vol. I. Background information. J.F. Macharen Ltd.. 1977.
Mason, C.L.. G. Elliot and T.H. Gan. 4 study of radon emanation from waste rock at northern terntory uranium mines. .4RL/TR-014 (1982).
hlairs, J.H. A review of the radiation exposure of transport personnel during the radioactive u8aste sea disposal operations from 1977 to 1982. DOE/R%'/ 85-078 ( 1985).
Mann. B.J.. S.M. Goldberg and W.D. Hendricka. Low-level solid radioactive waste in the nuciear fuel cycle. Trans. Am. h'ucl. Soc. Winter meeting I 1975).
Mullxkey. T.B., T.L. Jentz and J.M. Connelly. A survey and evaluation of handling and disposing of solid low-level nuclear fuel cycle wastes. A I F/SES P- 008ES ( 1976).
Marshman, I.W. Summarised results from a radiation monitoring programme at an Austr n I . [an uran~ltrn ore processing plant. p. 105 in: Hadlation Prorect~on in Australia (1983).
MacKenzie. D.R.. J.F. Smolley. C.R. Kempf er al. Evaluation of the radioactive i n \ , e n t o ~ in. and rstimi~rion of isotopic release from. the waste in eigh~ trenches at the Sheffield low-level waste burial site. NUREG/CR-3865 and BNL-NURE(3-51792 (1985).
National Council on Radiation Protection and %lea- surements. Carbon-14 in the en\oironment. NCRP report So. 81 (1985).
Nuclear Regulatory Commission. Occupational Kadia- tion Exposure: Thirteenth and Fourteenth Annual reports. 1980 and 1981. NUREG-0714. 1'01s. 2 and 3 ( 1983).
Nuclear Regulatory Commission. Occupational radia- tion eaposure at commercial nuclear power reactors 1983. NUREG-0713. Vol. 5 (1985).
Nielson. K.K.. R.W. Perkins. L.C. Schwendiman et al. Prediction of the net radon emission from a model open pit uranium mine. PNL-2888 and SUREG/CR-0627 (1979). Nuclear Energy Agency. Long-term radiological aspects of management of wastes from uranium mining and milling. OECD/NEA (1984).
Nuclear Energy Agenc). Revieu of the continued suitability of the dumping slte for radioacti\,c waste in the North-East Atlantic. OECD/SEA (1985).
National Radiological Protection Board. United King- dom. Small radiation doses to members of the public. ASP-: (1985).
Kuclear Regulatory Commission. United States. Draft environmental impact statement on 10 CFR Pan 61 "Licensing requirements for land disposal of rad~o- active waste". NUREG-0782 (198 1).
Nuclear Regulatory Commission. United States. Final environmental impac: statement on 10 CFR Pan 61 "Licens~ng requirements for land disposal of radio- active waste". NUREG-0935 (19821.
Nordic Liaison Committee for Atomic Energ!. Nordic study on reactor waste. NKA/.A0(81)5 ( 198 1 ).
Suclear Kegulatory Commission. Un~ted States. Final entrironmental starement on [he transportation of radioactive material by air and other modes. NUREG- 0170 (1977). Organisation for Economic Co-operalion and Devel- opment. Summary of nuclear po\ver and fuel cvcle data on OECD member countries. OECD/NE.4 ( 1986).
Organisation for Economic Co-operation and Devei- opment. Uranium: Resources, Production and Demand. Joint Repon by the OECD and IAEA. OECD/NEA (1981).
Oliveira. A..4.. J.C. Gomez and C.E. Nollmann. Carbon-I4 sampling and measurement in gaseous releases from the Atucha I nuclear pou.er plant. p. 932-935 in: Proceedings of the 6th Congress of the International Radiation Protection Association. Berlin (Federal Republic of Germany). 1984.
Organisation for Economic Co-operat~on and Devel- opment. Uranium: resources. production and demand. OECD/NEA ( 1986). Pavlovski. 0.A.. D.1. Gusev. V.D. Stepanova et al. Radiation to population from the USSR APS liquid releases. p. 4 1-47 in: Proceedings o f t he International Conference of ChlEA, Vilnius (USSR). May 1983 (Vol. 5). Moscow, Enerpoatomizdal. 1983 (in Russian ).
Pretre. S. Dosimetrie der beruflich strahlcnexponierten Personen in der Schweiz. Bundesamt for Gesund- heitsuesen. Switzerland, 19I1.
Pretrc. S. Dosimetrieder hcruflich strahlcnexponierten Personet1 in der Schweiz. Bundesamt for Gesund- heltsuesen. Switzerland. 1982.
Parkhomenko. G.51.. X1.S. Yegorola. A.51. \;orob)ov et al. Radiation situation and working conditions at nuclear power plants equipped with W'WER-440 and P\\'K reactors, p. 3-10 in: .4PS Radiation Safety and Protection (Y.A. Egorov. ed.) (Vol. 2). Energo- atomizdat, bloscow. 1983 (in Russian).
Pepper. R.B., G.F. Heap and A. Short. Report on radioactive discharges. associated environmental monitoring and personal radiation doses resulting from operation of Central Electricity Generating Board nuclear sites during 1984. CEGB HS/R194/85 (1985). Pa\rlovski. O.A.. E.hl. Purim and D.S. Yurchenko. Radiation safety of population during experience APS with liquid-metal fast reactor. p. 120-123 in: APS Radiation Safety and Protection (Y.A. Egorov. ed.) (Vol. 9). Energoatomizdat, Moscow. 1985 (in Russian ). Persson. R.A. and L. Malmqvist. Ten yean experience of occupational exposure at Swedish LN'Rs. p. 215-218 in: Proceedings of the 6th International Congress of the International Radiation Protection Association. Berlin (Federal Republic of Germany). 1984.

F.ll.ra,)s. F . .\. Curti and 0. Agatiello. Anal!.;!% 01' ~ r . - z u p ~ t ~ , ~ n ~ l e\posure in a natural-uranium hea\!- t\ater rezctirr, p. 219-222 in: Proceedings of the 6th lnterna\~onal Congress of the International Radi- arion Protection Association. Berlin (Federal Repu- blic of Germany), 1984. Pepper. R.B., G.F. Heap and A. Short. Report on radioactive discharges, associated en\'ironmental n~onitoring and radiation doses resulting from opera- tions of CEGB nuclear sites during 1985. CEGB/ HS/K208/86 ( 1986). Pinner. A.V.. C.R. Hemming and h1.D. Hill. An assessment of the radiological protection aspects of shallow land burial of radioactive wastes. NRPB- R161 (1984). Pinner. A\'. and h1.D. Hill. Radtological protection aspects of shallou land burial of PWR operating wastes. NRPB-R 138 ( 1983).
Pinoer. .4 .V, and J.P. Maple. Analysis of the sensitivity of the radiological impact of shallow land burial of radioactive wastes from the engineered barriers used in burial facilities. EUR- (to be published). Pettersson. B.G. Chairman's report of the Technical Committee on the .Assessment of the Radiological Impact from the Transport of Radioactive Materials. TC-556, TECDOC-398, IAEA. Vienna. 1986.
Palacios, E.. C. Arias and T. Escribano. Tendencias de las dosis ocupacionales en el programa nuclear ,Argentina. Presented at International Conference on Radiological Protection in Kuclear Energy, IXEA. Sydney. Australia. 18-22 April 1988. Rublevski, V.P. .1PS with VVER-440 as a source of carbon- I4 discharge. p. 15 1- 154 in: Proceedings of the International Conference of CMEA. Vilnius (USSR), %lay 1982 (\'ol. 5). \loscoii.. Energoatomizdat, 1983 (in Russian). Raghavayya. M.. A.H. Khan, N. Padmanabhan et al. Exhalation of Rn-722 L'rom soil: some aspects of variations. p. 583-591 in: Natural Radiation Environ- ment. Proceedings of the Second Special Symposium on Natural Radiation Environment. Bombay, 1981. Wiley Eastern Ltd.. 1982. Ropers. V.C.. R.F. Overmyer. fi.St. Putzig et al. Characterization of uranium tailings cover materials ibr radon nut reduct~on. NUREG/CR-I081 ( 1980). Rae. S. and P.C. Robinson. SAhlhfL!. ,-Z f m t e element program for coupled heat and round\vater flow problems. AERE-R9610 ( 1979).
Swedish State Radiological Protection Institute. Nuclear industry activity releases and gamma exposures. K81-I? ( 1981) (in Swedish).
Swedish State Radiological Protection Inbtitute. Nuclear industry activity releases and gamma exposures. KXZ-09 ( 1981) (in Swedish). Swedish State Radiological Protection Institute. Nuclear industry activity release.; and gamma exposures. K83-09 ( 1983) (in Swedish).
Scottish Development Department. Statistical Bulletin. Radioactive waste disposals lrom nuclear sitcs in Scotland 1980-1983. Salo. A. Releases from operating reactors and occupational doses in Fillland. 1-innish Centre i o r Rad~ational Kuclear Safet!. Personal con~mun~cat ion ( 1986). Sobolev. \.'.A. and \'.D. Tolstych. Some results o i thc investigations of I isotopes in several physics-chemical forms. p. 273-279 in: Radiation Safety Protection (Vol. 9). ()'..A. Egorot, ed.). Energoatomlzdat, hioscow. 1985 (in Russian).
Saakov. E.S.. A.A. Avetisyan and K.I. Pyuskyulyan. Release of Co-60. Ag-l lOm. htn-54 and their concen- trations in the vicinity of the Armenian nuclear power station. Atomic Energy 56: 278-280 ( 19841.
Sarnet. J.M., M.V. Morgan and C.R. Key. Studies of uranium mines in New Mexico. Proceedings of the Conference on Occupational Radia~ion Safety in blining. Toronto, 1984.
Stieve, F.E. Releases from power reactors in FRG (1980-85). Personal communication (1986)
Swedish State Radiological Protection Institute. Nuclear industry activity releases and gamma exposures. K84-06 ( 1984) (in Swedish).
Scottish Development Department. Statistical Bulletin. Radioactive waste disposal in Scotland: 1980-1983.
Schiager, K.J. Disposal of uranium mill tailings. p. 149-162 in: Radioactive \C'aste. Proceedings of the 2 1st Annual Meeting of National Council on Radiation Protection and Measurements, April 1985. NCRP Proceedings No. 7 (1986).
Strong. K.P., D.M. Levins and A.G. Fane. Radon diffusion through uranium tailings and earth cover. p. 713-719 in: Radiation Hazards in Mining. (M. Gomez, ed.). Society of Mining. New York. 1982.
Swedish State Radiological Protection Institute. Nuclear industry activity releases and gamma exposures. K85-09 ( 1985) (in Swedish).
Smith, G.M., H.W. Fearn. C.E. Delow et 31. Calcula- tions of the radiological impact of disposal of unit activity of selected radionuclides. UKDOE/RW/ 86- 136 ( 1986).
Swedish State Radiological Protection Institute. Nuclear industry releases and gamma exposures. KH4-06 (1984) (in Swedish). Tanner, A.B. Radon migration in the ground. A supplementary review. United States Geological Survey Open File report 78.1050 (1978).
The USSR in Figures in 1984. F~nansy i Statistika. Moscow. 1985 (in Russian).
Tichler. J and C. Benkowitz. Radioactive materials released from nuclear power plants. Annual report 1980 (Vol. I ) NUREG/CR-2907 and BSL-NUREG- 5l58l (1981). Tichler. J and C. Renkowitz. Radioactive materials released from nuclear power plants. Annual report 1981 (Vol. 2) NUREG/CR-2907 and BNL-NUREG- 51581 (1982).
Tichler, .I and C. Benkowitz. Radioactive materials released from nuclear power plants. Annual report 1982 (Vol. 3). NUREG/CR-2907 and BNL-SUREG- 51581 (1983).
Tennessee Valley Authority. Department of the Interior. Draft en\eironmental impact statements. Dalton Pass, Crowpoint and Edgement uranium mines. ( 1978/ 1979).
Travis. C.C., A.P. Watson. L.M. XlcDousell-Boyer et at. A radiological assessment oC radon-222 released from uranium mills and other natural and techno- logically enhanced sources. NUREG/CR-0573 ( 1979).
Tichler, J . and C. Bcnknuitz. Radioactive materials released rrom nuclear power plants. Annual report 1982 (Vol. 4). ?iUREG/CR-2907 and BNL-NUREG- 51581 (1984). 7'1chlcr. J and C. Renkowitz. Radioactive matrr~als released from nuclear power plants. Annual report I984 (Vol. 5). NUREG/CR-2907 and BNL-KUREG- 51581 (1985).
Tichler. J . Draft report on U.S. reactor discharges in 1985. Brookhaven National Laboratory, 1987.
Taylor. H. .4 . and J.W. Kennedy. The management of radioactive wastes arising from fucl reprocessing plants in the United Kingdom. p. 249-257 in: Radioactive Waste Management. IAEA. Vienna, 1984.

Terasima, T. Data on occupational esposcres in Japanese operating pouter reactors. 1980-1985. Per- sonal communication (1987).
United Nations. ionizing Radiation. Sources and Biological Effects. United Nations Scientific Com- mittee o n the Effects of .Atomic Radiation 1982 report t o the General Assembly. with annexes. United Sat ions sales publication E.82.IX.S (1982).
United Nations. Sources and Effects of Ionizing Radiatnn. United Nations Scientific Committee on the Effects of Atomic Radiation 1977 report to the General Assembly. with annexes. United Sations sales publication E.77.IS. 1 ( 1977).
United K~ngdom Atomic Energy Authorit?. Repon o n radiological protection and occupational health for the year 1985. AHRhI-R5 ( 1986).
Organisation for Economic Co-operation and Devel- opment. Uranium: resources, production and demand. OECD/NEA 1 1986).
Vorobyotr. E.I.. L..A. Ilyin, \'.D. Turovski et al. XPS radiation safety in the USSR. Atomic E n e r g 54: 277-285 ( 1982).
i'arovin, 1..4.. A.P. Epr r i r~ , h1.P. Lrnanets ct (11. Results of ten years of operational experience oi Leningrad :IPS. Atomic Energy 55: 349-353 (198?).
Vorobyov. E.I. APS radiation safety. A t o m ~ c Energy 56: 374-380 ( 1984).
V4 Vorobyov. E.I.. L.A. Ilyin. A.S. Belitski et al. Radiation protection when handling APS radioacti \e wastes. Atomic Energy 58: 1 13- 116 ( 1985).
' 5 Verkhovrrsky. N.X.. V.P. Ivannikov. \'.F. Kozlov et al. The radiation situation during rhe period o i putting into operation the fifth block of the S ~ \ ~ o v o r o n e z h APS. Atomic Energy 53: 372-275 ( 1982).
' I Winkelmann, I . and K. \'ogl. hleasurrment of specific radionuclides in gaseous effluents f r ~ m nuclear power plants and their cont r ibut~on to radiation exposure. p. 875-878 in: Proceedings of the bth International Congress of International Radiation Protection Association. Berlin (Federal Republic of Germany). 1984.
2 U'aliace. N.G. Hunterston data for 1980-19X4. Per- sonal communication (1985).
2 Woods, D.A. Radon emanation from the Ranger uranlum mine. Australia. Personal communication ( 1987).
Z1 Zerbib. J.C. Dosimrtric performances of different groups of lighc water reactors. TULA/P/6. Evidence lo UK Sizewell 'R' Public Inquiry (1984).
Z? Zettwoog. P. La radioprotection dans les mines d'uranium: experience et politique en France. in: Proceedings of the 11th Annual Symposium of the Uranium Institute. London (1986).