CO 2 emission trading within the European Union and Annex B countries: the cement industry case
16
Energy Policy 34 (2006) 72–87 CO 2 emission trading within the European Union and Annex B countries: the cement industry case La´szlo´Szabo´ , Ignacio Hidalgo, Juan Carlos Ciscar, Antonio Soria Joint Research Centre, Institute for Prospective Technological Studies (IPTS), European Commission EXPO Building, Isla de la Cartuja, E-41092 Seville, Spain Available online 31 July 2004 Abstract The cement industry is the third largest carbon emitting industrial sector in the EU. This article presents the foreseeable technological evolution of the cement industry under business as usual circumstances, and examines the effects on the sector of carbon trading. For those purposes a global dynamic simulation model of the cement industry (CEMSIM) has been developed. The model is composed of a series of interconnected modules on cement consumption and production, international trade and capacity planning. This study quantifies the benefits achieved from emission trading in different markets (EU15, EU27 and Annex B), derived both from the revenues of emission trading, and from the lower compliance costs. The magnitude of the potential carbon leakage effect is also assessed. r 2004 Elsevier Ltd. All rights reserved. Keywords: Cement industry; CO 2 ; Emission trading; Simulation model 1. Introduction Emission trading is one of the international flexible mechanisms of the Kyoto Protocol on climate change to reduce greenhouse gas emissions in a cost-efficient way. Overall compliance costs of meeting a given carbon reduction target are lower under an international emission market than in the case of segmented or isolated markets. The European Union is to set up a carbon emission market for the power and energy- intensive industrial sectors (such as steel, cement, and pulp and paper) in 2005, 1 i.e. 3 years before the start of the commitment period of the Kyoto Protocol (2008–2012). This will be the first multi-country carbon emission market in the world. This article presents a global simulation model (CEMSIM—Cement Simulation Model) 2 to quantita- tively analyse the future development of the cement sector and the impacts of different carbon trading schemes on it. The cement industry is one of the largest energy consuming sectors. Indeed, the building material sector—whose emissions are dominated by the cement production—is the third largest CO 2 emitting industrial sector world-wide and in the European Union. 3 According to the importance of the cement industry many studies in the literature have dealt with its future ARTICLE IN PRESS www.elsevier.com/locate/enpol 0301-4215/$ - see front matter r 2004 Elsevier Ltd. All rights reserved. doi:10.1016/j.enpol.2004.06.003 Corresponding author. Tel.: +34-954-488-236; fax: +34-954-488- 279. E-mail address: [email protected] (L. Szabo´). 1 Directive 2003/87/EC, 13 October 2003 (European Commission, 2003a). See also European Commission (2000b, 2003b). 2 The cement industry model has been prepared with the aim to complete the POLES energy model (Prospective Outlook for the Long- term Energy System, (European Commission, 1996)), which is a partial equilibrium model of the world energy system. Besides the compre- hensive energy supply and transformation modules, the POLES model has a module on the large energy-intensive industries (such as iron and steel, etc.). These modules are under revision in order to attain more detail on the carbon emission trade amongst the sectors covered by the EU proposal. The steel module has been the first to be reviewed (Hidalgo et al., 2003). 3 According to the 1990 emission levels (Capros et al., 2001).
Transcript of CO 2 emission trading within the European Union and Annex B countries: the cement industry case
ARTICLE IN PRESS
0301-4215/$ - se
doi:10.1016/j.en
�Correspond279.
E-mail addr1Directive 20
2003a). See also
Energy Policy 34 (2006) 72–87
www.elsevier.com/locate/enpol
CO2 emission trading within the European Union and Annex Bcountries: the cement industry case
Laszlo Szabo�, Ignacio Hidalgo, Juan Carlos Ciscar, Antonio Soria
Joint Research Centre, Institute for Prospective Technological Studies (IPTS), European Commission EXPO Building,
Isla de la Cartuja, E-41092 Seville, Spain
Available online 31 July 2004
Abstract
The cement industry is the third largest carbon emitting industrial sector in the EU. This article presents the foreseeable
technological evolution of the cement industry under business as usual circumstances, and examines the effects on the sector of
carbon trading. For those purposes a global dynamic simulation model of the cement industry (CEMSIM) has been developed. The
model is composed of a series of interconnected modules on cement consumption and production, international trade and capacity
planning. This study quantifies the benefits achieved from emission trading in different markets (EU15, EU27 and Annex B), derived
both from the revenues of emission trading, and from the lower compliance costs. The magnitude of the potential carbon leakage
effect is also assessed.
r 2004 Elsevier Ltd. All rights reserved.
Keywords: Cement industry; CO2; Emission trading; Simulation model
2The cement industry model has been prepared with the aim to
complete the POLES energy model (Prospective Outlook for the Long-
1. Introduction
Emission trading is one of the international flexiblemechanisms of the Kyoto Protocol on climate change toreduce greenhouse gas emissions in a cost-efficient way.Overall compliance costs of meeting a given carbonreduction target are lower under an internationalemission market than in the case of segmented orisolated markets. The European Union is to set up acarbon emission market for the power and energy-intensive industrial sectors (such as steel, cement, andpulp and paper) in 2005,1 i.e. 3 years before the start ofthe commitment period of the Kyoto Protocol(2008–2012). This will be the first multi-country carbonemission market in the world.
e front matter r 2004 Elsevier Ltd. All rights reserved.
pol.2004.06.003
ing author. Tel.: +34-954-488-236; fax: +34-954-488-
ess: [email protected] (L. Szabo).
03/87/EC, 13 October 2003 (European Commission,
European Commission (2000b, 2003b).
This article presents a global simulation model(CEMSIM—Cement Simulation Model)2 to quantita-tively analyse the future development of the cementsector and the impacts of different carbon tradingschemes on it. The cement industry is one of the largestenergy consuming sectors. Indeed, the building materialsector—whose emissions are dominated by the cementproduction—is the third largest CO2 emitting industrialsector world-wide and in the European Union.3
According to the importance of the cement industrymany studies in the literature have dealt with its future
term Energy System, (European Commission, 1996)), which is a partial
equilibrium model of the world energy system. Besides the compre-
hensive energy supply and transformation modules, the POLES model
has a module on the large energy-intensive industries (such as iron and
steel, etc.). These modules are under revision in order to attain more
detail on the carbon emission trade amongst the sectors covered by the
EU proposal. The steel module has been the first to be reviewed
(Hidalgo et al., 2003).3According to the 1990 emission levels (Capros et al., 2001).
ARTICLE IN PRESS
Table 1
Share of cement production and consumption in 1997
Regions Production
(%)
Consumption
(%)
Per capita
consumption
(kg)
EU15 11.3 10.9 446
Rest of Europe 5.5 4.8 363
FSU 2.6 2.8 137
Africa 4.2 4.6 91
North America 6.1 6.8 348
Latin America 7.5 7.2 271
China 33.2 32.9 404
L. Szabo et al. / Energy Policy 34 (2006) 72–87 73
prospects. The IEA Greenhouse Gas R & D Programmestudy (see International Energy Agency (IEA), 1999) hasglobal coverage and assesses the development of thesector in the 2020 horizon. Its main focus is on the CO2
reduction potential of the sector, examining the energyefficiency improvement options. Its main finding is thatunder a business as usual scenario global emissions fromthe industry almost double in the 1995–2020 period.They conclude that assuming considerable technologicalimprovements, the increase in carbon emissions could belimited to 35%.Two other references of the literature are country-
specific, focusing on large cement consuming regions ofthe world. Worrell et al. (2000) describe the energyefficiency improvement potentials in the US cementindustry, based on a detailed national technologydatabase. These authors set up an energy conservationcurve, and estimate an 11% energy saving potential forthe country. Liu et al. (1995) follow a different approachfor China and estimate a 30% energy intensityimprovement potential. Their results are based on threedifferent scenarios concerning the technology andefficiency of the new plants.Rotman and Kelmanzky (1997) estimated a function
of cement demand in Argentina using regressionanalysis. They conclude that income, the constructionprice index, and cement consumption lagged one periodare significant variables. According to their findings theincome and lagged consumption are the most importantvariables, while the price of construction is lessinfluential.The CEMSIM model is composed of a series of
interconnected modules on cement consumption andproduction, international trade and capacity planning.Those variables are calculated using behavioural equa-tions. The model covers 51 regions of the world,including all 15 EU countries,4 which enables tosimulate the interactions of the different nationalemission trading markets. In the present modellingexercise the effects of three alternative policy scenariosare examined, differing in market coverage and equili-brium carbon prices.The dynamic recursive simulation model is taking into
account rich technological details. Several technologyoptions are considered concerning the future develop-ment of the industry. Feasible retrofitting options andemerging technologies are included in the technologydatabase, which contains detailed information oninvestment, variable and retrofitting costs. This data-base, and in particular the retrofitting options, providewith the foundation of the marginal abatement costcurves for the industry, which is the core element of theemission trading simulations. Emission reductions are
4Luxembourg and Belgium are merged together, while all other EU
countries are modelled individually.
not based on static abatement cost curves, as in manysimilar models, but on a dynamic system where theinteraction among price variations, international trade,technology options and economic logic drive the actionsof the market participants.This article has the following structure. Section 2
gives a short description of the cement industry andintroduces the retrofitting options for the sector. Section3 describes the main characteristics of the CEMSIMmodel. Section 4 presents the results of the reference andthe emission trading scenarios, with a detailed sensitivityanalysis. Finally, Section 5 concludes.
2. The cement industry overview
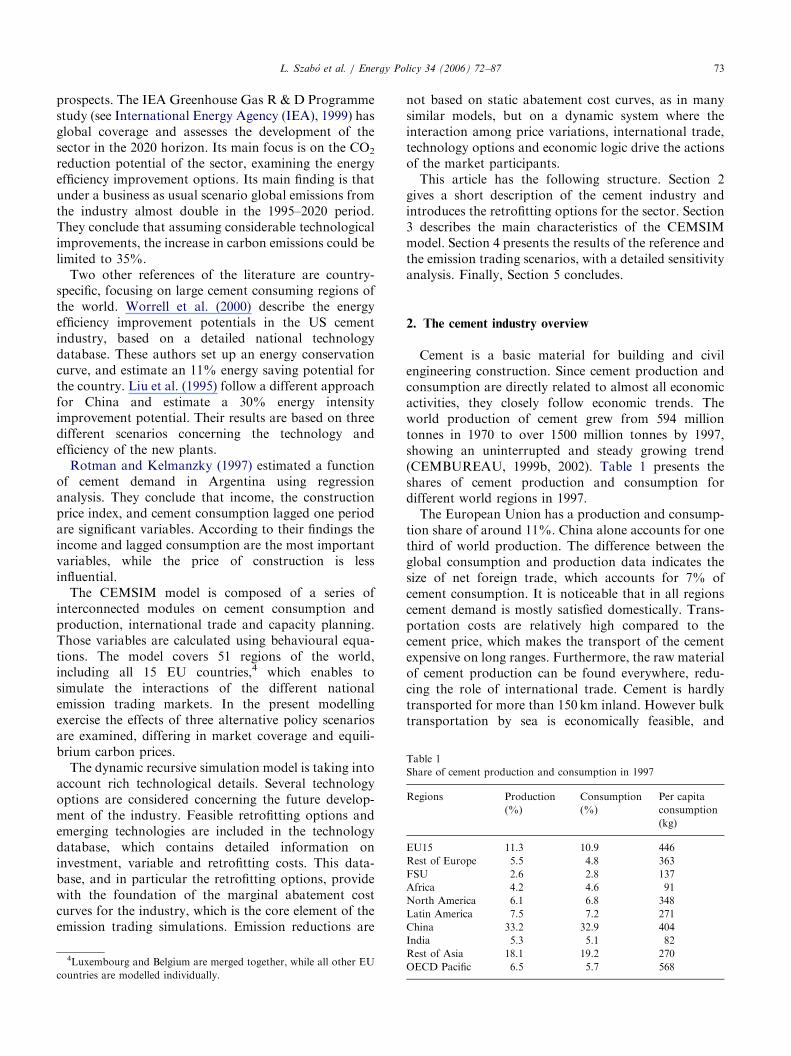
Cement is a basic material for building and civilengineering construction. Since cement production andconsumption are directly related to almost all economicactivities, they closely follow economic trends. Theworld production of cement grew from 594 milliontonnes in 1970 to over 1500 million tonnes by 1997,showing an uninterrupted and steady growing trend(CEMBUREAU, 1999b, 2002). Table 1 presents theshares of cement production and consumption fordifferent world regions in 1997.The European Union has a production and consump-
tion share of around 11%. China alone accounts for onethird of world production. The difference between theglobal consumption and production data indicates thesize of net foreign trade, which accounts for 7% ofcement consumption. It is noticeable that in all regionscement demand is mostly satisfied domestically. Trans-portation costs are relatively high compared to thecement price, which makes the transport of the cementexpensive on long ranges. Furthermore, the raw materialof cement production can be found everywhere, redu-cing the role of international trade. Cement is hardlytransported for more than 150 km inland. However bulktransportation by sea is economically feasible, and
India 5.3 5.1 82
Rest of Asia 18.1 19.2 270
OECD Pacific 6.5 5.7 568
ARTICLE IN PRESS
Table 2
Average energy consumption of the dry and wet processes (GJ/t)
Heat requirement Dry process Wet process
Chemical reactions 1.76 1.76
Evaporation of water 0 2.4
Heat lost 1.4 1.7
Total 3.2 5.8
L. Szabo et al. / Energy Policy 34 (2006) 72–8774
actually plays a growing role. Data indicate that NorthAmerica and Rest of Asia are the biggest importers,while the European Union is a net exporter of cement,together with the OECD Pacific (mainly Japan).Table 1 also presents the regional per capita cement
consumption. The OECD Pacific (568 kg) and theEuropean Union (446 kg) regions have the highestlevels. Developing regions have much smaller per capita
consumption, in the range of 91–270 kg. On the contraryChina has an exceptionally high value amongst them(404 kg).Global cement production has had an average growth
rate of 3.6% between 1970 and 1997. A wide range ofgrowth rates can be found amongst the regions. TheEU15 has been relatively stable over this period, with anaverage decline of �0.1%. Eastern Europe and theFormer Soviet Union had two distinct phases in cementproduction. Till 1988 cement production grew at arelatively modest rate of 2.3%. During the economiccrisis of transformation the production level dropped bymore than 12%. The African region had an averageincrease of 4.5% over the period, while Asia (withoutChina and India) had a growth rate of 7.5%. Chinaexperienced an average annual growth of 12% in thisperiod, while India grew at an average rate of nearly7%. These two countries are responsible for most of theworld cement production and consumption expansion.North America had a stable 0.5% average growth incement production, while Latin America had growthrates ranging between 5% and 12% in some periods, butsubsequent crises in large producing countries (e.g.Brazil and Mexico) reduced its average growth in theoverall period (CEMBUREAU, 1999b).
2.1. Energy use in cement manufacturing
The cement industry is an energy-intensive industrywith energy typically accounting for 30–40% ofproduction costs. The energy consumption is estimatedat about 2% of world total, and almost 5% of industrytotal. The fuel mix in the industry is usually carbon-intensive, and calcinating process itself produces highamounts of CO2, which means that the cement industrycontributes by 5% to global CO2 emissions (Interna-tional Energy Agency (IEA), 1999). The role of thecement industry as a source of pollution will be evenhigher in the future, taking into account the prospects ofvery fast growth rates of large developing regions, suchas China, India and South East Asia.In a sector characterised by such market expansion,
energy efficiency improvements become crucial in thefuture development of the sector from an environmentalpoint of view. In order to capture these improvementoptions, the CEMSIM model clusters the numerousavailable technology options into two main categories.One of them relates to energy efficiency improvements
to be attained by building new capacities, while theother consists of retrofitting existing plants. Hence tofully understand the modelling approach a brieftechnological description follows.The four distinguished production steps of cement
manufacturing are the following:
1.
Mining of raw materials. 2. Preparation of raw materials: homogenising andgrinding of raw material.
3. Burning of raw material to cement clinker. 4. Finish grinding of clinker and mixing with additives.The preparation of raw materials and finish grindingsteps (stages 2 and 4) consume mainly electricity. Duringthe clinker burning step (stage 3) prepared raw materialsare burned at high temperatures (with a peak of over1450 1C), first calcinating the materials. With the risingtemperature the feed material starts to form clinker. Attemperature above 900 1C, the calcinating takes place:
CaCO3 ! CaOþ CO2:
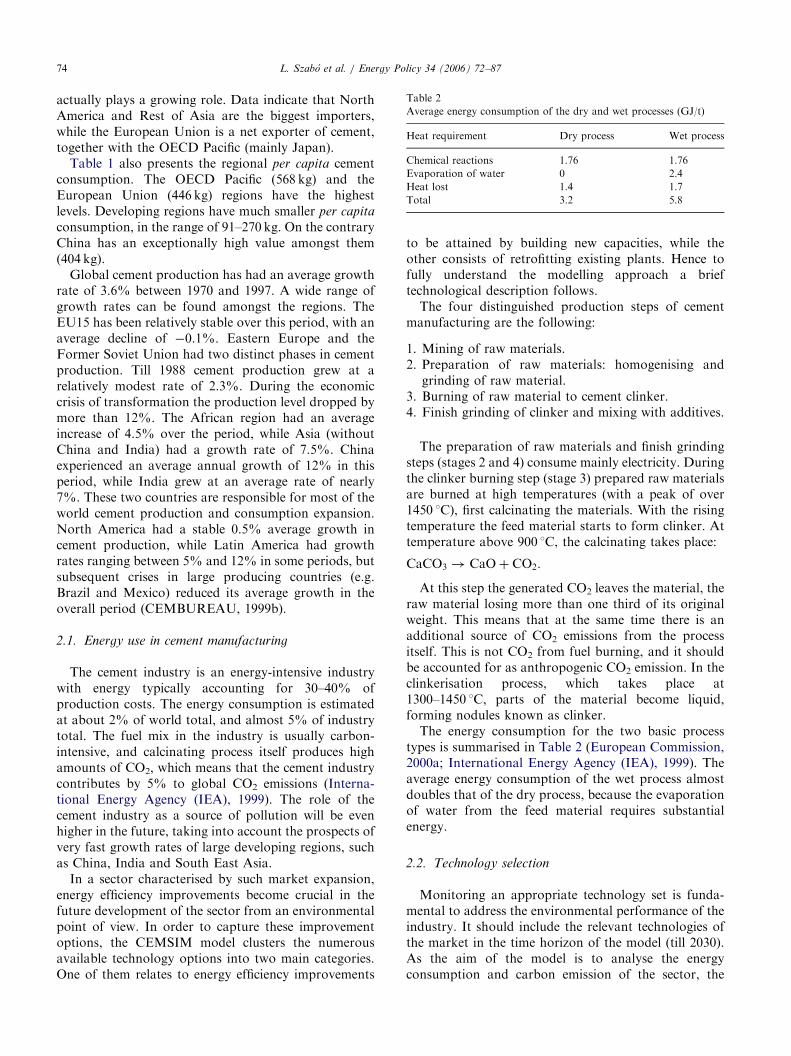
At this step the generated CO2 leaves the material, theraw material losing more than one third of its originalweight. This means that at the same time there is anadditional source of CO2 emissions from the processitself. This is not CO2 from fuel burning, and it shouldbe accounted for as anthropogenic CO2 emission. In theclinkerisation process, which takes place at1300–1450 1C, parts of the material become liquid,forming nodules known as clinker.The energy consumption for the two basic process
types is summarised in Table 2 (European Commission,2000a; International Energy Agency (IEA), 1999). Theaverage energy consumption of the wet process almostdoubles that of the dry process, because the evaporationof water from the feed material requires substantialenergy.
2.2. Technology selection
Monitoring an appropriate technology set is funda-mental to address the environmental performance of theindustry. It should include the relevant technologies ofthe market in the time horizon of the model (till 2030).As the aim of the model is to analyse the energyconsumption and carbon emission of the sector, the
ARTICLE IN PRESSL. Szabo et al. / Energy Policy 34 (2006) 72–87 75
decisive factor has been the energy required by thedifferent technologies. Seven technologies have beenchosen to be included in the model according to theclinkerisation process (kiln type):
1.
5
day
wet rotary kiln
2. semi-wet rotary kiln 3. semi-dry rotary kiln 4. dry long rotary kiln 5. dry rotary kiln with preheater 6. dry rotary kiln with preheater and pre-calciner 7. shaft kiln.The first six technologies have a common feature:their processes apply vertical rotary kilns. However,they are different in the water content of the feedmaterial, which influences the energy requirements ofthe process. The more water the feeds contain, the morehomogeneous the meal for the kiln is, resulting in a morehomogenous clinker as well. At the same time the energyconsumption is higher, as the wet material needs moreenergy to dry.Another important difference is the existence of a
preheater or pre-calciner unit. The preheater kilnsusually have multi-staged (4–6) cyclone preheaters.The raw material travels through the cyclones, witheach subsequent cyclone having higher temperature. Theenergy consumption of kilns with suspension preheatersis much smaller, than the previous categories. Theyconsume between 2.9 and 3.5GJ/t. As one part of thecalcination already takes place in the preheater, it hasbeen possible to reduce the length (and energy con-sumption) of the kiln significantly, which has consider-ably reduced the energy consumption of the wholeprocess.In case of pre-calciner kilns an extra combustion
chamber is installed between the preheater and the kiln.This pre-calciner chamber consumes 60% of the fuelused in the kiln, and 80–90% of the calcination takesplace there. There are many advantages of the pre-calcinating process. Firstly, it further decreases energyconsumption by 8–11%. Secondly combustion in thischamber is at lower temperature than in the kiln, solower grade fuel can be used (e.g. wastes, waste fuel),which diminishes the NOx emissions as well. New pre-calciner kilns could have capacities increased up to12,000 t/day, which further increase their efficiencies.5
Shaft kilns are vertical installations, where rawmaterials are travelling from the top to the bottom bygravity. Raw material is mixed with the fuel and fedfrom the top, while air is blown from the bottom. Thistechnology has the same processes as the others, namelycalcination, clinkerisation and cooling. There are certaindisadvantages of the technology. Clinker quality is
In Europe the usual kiln size is between three and five thousand t/
.
highly dependent on the homogenisation of pellets andfuel, as well as on the air supply. Inadequate air supplyor uneven air distribution makes combustion incom-plete, resulting in low quality clinker and high CO andVOC emissions. In theory, shaft kilns can almost reachthe energy efficiency of the rotary kilns, but in practicetheir energy consumption varies between 3.7 and 6.6GJ/t of clinker, with an average of 4.8GJ/t in Chinaand India.Most shaft-based technology plants are operated in
developing countries, such as China and India. They areoperated only in those countries where the lack ofinfrastructure and capital makes them viable. In Chinafor instance the regional industrialisation policy and theprohibition of entities to own chain of plants make shaftkilns widespread. In India their share is 10%, while inChina it represents over 80% of the installed capacities.Their usual size is between 20–200 t/day, and many ofthem are fully hand-operated.
2.3. Retrofitting options
One of the most important mechanisms in the modelis the possibility of retrofitting among technologies.Retrofitting in the model means the transformation ofone technology into another, provided it is technologi-cally feasible. Both investment and variable costs areconsidered to determine the economic worthiness of theoption. The possible retrofitting options are presented inTable 3. The technological feasibility has been deter-mined according to previous studies (European Com-mission, 2000a; Hendriks et al., 2000; CEMBUREAU,1999a).In the case of shaft kilns an automatic development is
built into the model, based on studies on the Chineseand Indian cement industries (Liu et al., 1995; Schu-macher and Sathaye, 1999). These studies make an in-depth analysis on the possible future development ofshaft kilns. Their conclusion is that even in the long-term, shaft kilns will continue to give substantial part ofthe cement producing capacities of China and India, butwith lower energy intensity. The assumed potential forimprovement ranges from 10% to 30% in these studies.In the model a 15% fuel efficiency gain is assumed in a30 years time horizon.
3. Model description
CEMSIM6 is a simulation model, working withinterconnected modules on cement demand (consump-tion) and supply (production), international trade,
6The CEMSIM model is fully documented in Szabo et al. (2003).
The model has been written in VENSIM 5.0 software. The data
sources appear in Appendix A.

ARTICLE IN PRESS
Table 3
Feasible retrofit options in cement processes
From/to Wet Semi-wet Semi-dry Dry long Dry preheater Dry pre-calciner
Wet O O O OSemi-wet O O OSemi-dry O ODry long O ODry preheater ODry pre-calciner
Production by region
Production by technology
Energydemand in the cement
industry
Consumption by region
International trade
COST/PRICE
Investment: -capacity planning-retrofitting
POLES energyprices
Carbon value
GDP Population
POLES final
energydemand
Carbon emissions
Fig. 1. Schematic overview of the cement model.
7Related studies are Liu et al. (1995) for cement, Van Vuuren et al.
(1999) for steel, and Mannaerts (2000) for steel, aluminium, paper and
different chemical products.
L. Szabo et al. / Energy Policy 34 (2006) 72–8776
capacity planning and energy demand. The modeloperates with behavioural equations calculating thesevariables, which are presented in this section in a non-technical way. Fig. 1 describes the functioning of thecement model. The dotted frames indicate the interfacevariables linked to the POLES model. GDP andpopulation are exogenous variables, and follow thesame dynamic path as in the POLES model. The pricesfor the various fuel uses in the cement sector come fromPOLES. The carbon emissions and final energy demandof the cement sector is to be used as an input in thePOLES model, once the two models are linked. Thevarious sub-modules are introduced in the followingpart.The model covers 51 regions of the world. Countries of
the European Union are individually modelled, whileother countries are classified together (e.g. South Amer-ican region, Middle East). In this study the 51 regionshave been further aggregated into 10 regions in order tofacilitate the presentation of the results (Table 4).The usual approach to compute cement consumption
is to link cement demand to the income level. Yet given
the multi-regional character of CEMSIM and therelatively long time-horizon, up to the year 2030, amore flexible approach has been implemented. GDPgrowth and the GDP level together determine theincome effect on cement consumption. This solution issimilar to other studies dealing with long term com-modity intensities (e.g. Gielen and Moriguchi, 2002),where the income elasticity is supplemented by anautonomous material efficiency improvement (usuallyregional- and income level-specific). In particular, themodel computes cement consumption taking intoaccount the evidence on the relationship betweencommodity intensity (defined as commodity consump-tion per unit of GDP) and per capita GDP. Thisfunction has been determined empirically for variousmaterials and countries.7 Its shape consists of an inverseU-shaped curve (also called ‘Intensity of Use hypoth-esis’). The inverted U-shape can be explained in terms of

ARTICLE IN PRESS
Table 4
Regional coverage
Aggregated regions Countries
North America US, Canada
Western Europe EU15, Rest of Western Europe (Cyprus, Malta, Norway, Switzerland)
OECD Pacific Japan, Australia, New Zealand
CEU-FSU Central and Eastern European countries, Former Soviet Union
Latin America Central and South American countries
India India
China China
SE Asia Asian countries, except India and China
Africa African countries
Middle East Middle East and Gulf countries, Turkey
Commodity Intensity
0
50
100
150
200
250
300
0 10 20 30 40GDP per capita ( /cap)
Co
mm
od
ity
inte
nsi
ty
(Mto
n/M
)∋
∋
Fig. 2. Commodity intensity curve.
L. Szabo et al. / Energy Policy 34 (2006) 72–87 77
the superposition of three different trends (Van Vuurenet al., 1999) affecting the dynamic evolution of thecommodity requirements (Fig. 2):
�
The different phases of the economic transition fromagriculture to manufacturing and construction (as percapita GDP rises, the commodity intensity increases),and then to services (per capita GDP growth isaccompanied by commodity intensity falls).
�
The substitution away from the commodity, becauseof the use of alternative materials in the differentapplications.�
8This adaptive expectations approach then does not follow the
perfect foresight approach (e.g. base the investment decision on the
discounted future overall costs). On technology dynamics see
Kouvaritakis et al. (2000b) and Jacobsen (2000).
The result of technological development.
Developing countries such as China or India would bein the left-hand side of the curve (positive slope), whereasdeveloped countries such as US or Germany would belocated in the right-hand side (negative slope). Eachcountry has its own consumption pattern, determined bytwo shape parameters estimated on 10–15 years con-sumption data. Current year cement consumption isdetermined by the last year consumption, income (GDP)and by the price change of cement. To arrive to thecountry-specific cement prices of the model, the totalproduction cost is augmented by the transport costs onthe imported cement, and a mark-up rate is used, asestimated in Martins and Scarpetta (1999).
Production of cement is determined in a two-levelhierarchy system. First, the global cement market isallocated to the producing regions, where the shares aredetermined by the previous years production and theaverage production costs, taking into account theavailability of capacities as well. Once the productionis determined in a region, the second step is to allocateproduction to the available technologies using adispatching method similar to that of the first step.From the regional cement consumption and produc-
tion, the net trading positions of the different regions arestraightforwardly calculated. Since international tradein cement accounts to 7% of world production thissimplified approach gives reasonable results. Anothercharacteristic of the international cement market is thatcountries who are net exporters have very limitedimports, and net importers have limited exports ofcement, as there is little scope for product differentia-tion. This also supports the approach of net tradecalculations.Cement capacity data by technology is available in
CEMBUREAU (2002) on a company basis, and havebeen aggregated to the regional level. New capacity canappear in the system in two ways. The first one is bybuilding new utilities, and the second is by upgrading,transforming or expanding existing capacity (retro-fitting). Retirement of capacities takes place accordingto the economic lifetime of the capacities. Capacity iskept during its entire lifetime, even if new and cheaperutilities are built.New capacity building is based on the expected
market growth, which depends on the past develop-ments of the markets8 (e.g. average production growthrate for the past ten years). If the expected production ishigher than the available capacities (total minus retiredcapacities), new capacities will be built. The shares for

ARTICLE IN PRESSL. Szabo et al. / Energy Policy 34 (2006) 72–8778
new capacities are set according to the total costs ofthese technologies, including investment costs. Invest-ment costs are annualised through the economic life ofthe investment. The core of capacity planning isretrofitting, which takes into account both investmentand variable costs. Only those technologically feasibleoptions are allowed, which have been listed in Table 3.The demand for the different fuel types is determined
by the variable fuel cost, and by a function of theinvestment cost related to the use of the fuel. Cementproduction is an energy-intensive industry. Most of theenergy (over 85%) is consumed during the clinkerisationprocess, in the kiln through burning different types offuels. The majority of the kiln technologies (except theshaft kilns) are flexible to use different fuel types (coal,coke, natural gas or oil), but storage facilities, fueltransport facilities and availability of fuels are decisive.Thus different regions have different portfolio of fuelused, mainly determined by the price and availability ofdifferent fuels.
Fig. 3. BAU cement consumption by region.
4. Model results
The model results are presented in two subsections.The tendencies concerning consumption, productionand technology developments are presented in thebusiness as usual (BAU) scenario. The second subsec-tion studies the three policy-relevant scenarios concern-ing carbon emission trading. The alternative scenariosdiffer in the geographical coverage of the emissiontrading markets (EU15, EU27 and Annex B) and, as aconsequence, in the resulting equilibrium carbon prices.The section finishes with a sensitivity analysis on themost important parameters of the model.
4.1. Reference scenario
Table 5 introduces the BAU or reference scenarioassumptions. It is assumed that there is not any tax on
Table 5
Assumptions of the BAU scenario
Time horizon 1997–2030
Carbon value Set to zero
Exogenous variables, parameters GDP (in PPP), populatio
Primary fuel prices
Price, income and activit
Endogenous variables Cement demand, product
Capacity building, retrofi
Fuel mix in primary fuel
Carbon emission
Closed assumptions Autonomous technology
No fluidised cement tech
No change in clinker/cem
carbon emissions and, therefore, the carbon value is setto zero. GDP and population growth are exogenousvariables, while energy prices come from the POLESmodel. The model computes endogenously a series ofvariables, as previously detailed. Certain additionalhypotheses have been assumed to close the model.
4.1.1. Consumption, production and carbon emissions
According to the BAU scenario cement consumptionwill grow at high rates on world level in the 2000–2030period. On global level, the 1600Mt of cementconsumption in 2000 will increase almost twofold to2880 Mt by 2030, implying an annual 2% growth rate.Fig. 3 represents the regional consumption of cement
in 10-year intervals (1997 is given in the figure as thebase year). The chart shows that most growth takesplace in the developing regions. China and Indiaexperience the highest growth. In 2030 they willconsume almost half of the world cement production.China reaches its maximum consumption by 2020 andthen its consumption remains relatively stable till 2030.This is due to the assumed behaviour of cementconsumption (the inverted U shape hypothesis). China,a country with very high growth in material intensity,will reach its peak earlier and then faces a decreasing
n
y parameters
ion, net international trade
tting and retirement by type of technology
demand
trend for shaft kilns
nology, no alternative cement product (polymer) penetrate the market
ent ratio in cement production

ARTICLE IN PRESSL. Szabo et al. / Energy Policy 34 (2006) 72–87 79
trend in total consumption, when its GDP and popula-tion growth rates gradually fall. This seems to be aplausible assumption, as after completing the majorityof infrastructure developments, the maintenance of theinfrastructure usually requires less amount of materials.Other developing regions, such as Latin America,
Africa, Middle East and Rest of Asia also show highgrowth rates in cement consumption, but not as high asin China and India. Cement consumption in developedregions (e.g. North America, Western Europe andOECD Pacific) are stagnating. This means that theseregions together with the Former Soviet Union andEastern Europe would see their share in the worldconsumption fall.Production of cement shows a similar regional picture
to that of consumption. However there are somesignificant differences. All regions show an increasingproduction trend till 2020. After 2020 only the WesternEurope, Central Europe and the FSU, and the OECDPacific regions show stabilised production. All develop-ing regions experience an uninterrupted growing trendin cement production. In the case of China productiondoes not show the U-trend seen in consumption.Production is still growing till 2030, but the productiongrowth rate gradually slows down. This means thatChina will increase its production and export to otherAsian regions, where production does not coverconsumption. According to these projections China willbe an even more dominant player not only in the Asiancement market, but also in the global market (Fig. 4).Energy consumption follows a dynamic path close to
that of production. The decomposition of the changesinto carbon and energy intensity figures reveals inter-esting trends in the sector. Energy intensities in allregions fall, showing significant and uninterruptedimprovements in energy efficiency. However carbonintensities deteriorate, indicating that carbon-intensivefuels (coal and heavy fuel oil) become even moredominant in the future in the reference case. CO2
emissions basically depend on the production level,consumption of fossil fuel and the technology mix. Thebusiness as usual scenario projects an increase of CO2
Fig. 4. Cement production by regions.
emissions of 56% in 2030 (reaching more than 2100million tons of CO2), while at the same time productionincreases 75% on world level. Therefore in the referencescenario significant CO2 abatement is expected to takeplace both through changes in the technology mix andenergy efficiency improvements.
4.1.2. International trade of cement
According to the model results, international cementtrade will significantly grow, reaching 15% of totalconsumption in 2030 (compared to a share of 7% in1997), with notable changes in the regional patterns (seeFig. 5).9 The CEU–FSU and the Western Europeanregions will intensify their exports together with NorthAmerica, which will become exporter by 2020. Howeverthe most important changes take place in China, whichwill shift in the 2010–2030 period from an importerstatus to the most important exporter between 2020 and2030. This shift could be explained by the very intensiveconsumption growth, whereas capacity expansion islagging behind up to the year 2010. The trends willcompletely change by 2030, when consumption growthslows down and the capacity is significantly expanded.The other developing regions will be cement importers.
4.1.3. Technology development
The business as usual scenario results show thedirection and the speed of the changes in the technologymix. The most advanced and less energy consuming drypre-calciner technology rapidly increases its share by2030, as depicted in Fig. 6. The dry preheater and theshaft technologies slightly increase their share until2010, and then their shares remain almost unchanged.All the other technologies—including the wet technol-ogies and the old dry technologies, which representedone quarter of the technology portfolio in 1997—areexpected to disappear by the end of the period. Theyeither are converted to semi-wet and semi-dry technol-ogies or face closure.
4.2. Emission trading scenarios
Emission trading is one of the three internationalmarket mechanisms foreseen by the Kyoto Protocol onclimate change in order to meet the GHG reductionobjectives. Emission trading is cost-effective because itguarantees the achievement of an emission target withthe lowest overall abatement costs. In the absence oftransaction costs the initial allocation of emissionpermits, while having potentially large distributionaleffects, does not change the final outcome, i.e. theemission reduction taking place in the most efficientway. The allocation of emission rights (such as grand-fathering and auctioning, see e.g. Cramton and Kerr
9The table is based on net trading positions.

ARTICLE IN PRESS
Fig. 5. International trade in the cement industry.
Fig. 6. BAU technology shares.
11The EU greenhouse gas emission reduction target in the Kyoto
Protocol is 8% by 2008–2012, from 1990 levels. This overall target has
L. Szabo et al. / Energy Policy 34 (2006) 72–8780
(2002); European Commission (2003c)) determines theeconomic burden undergone by the participants. Thissub-section studies the effects of three possible emissiontrading markets on the cement industry of each country:EU15, EU27 and Annex B (without US).10 It is assumedthat no specific emission abatement measures areundertaken outside the market boundaries.In order to simulate the emission permit markets, the
sectoral marginal abatement cost curves for the cementindustry have been calculated by introducing carbonvalues (in the range from 0 to 250 h/t CO2) into theCEMSIM model. This follows the same procedure asthat implemented in the POLES model (Kouvaritakis etal., 2000b). It should be noted that the marginalabatement costs estimated by the CEMSIM modelmeasure the efficiency losses induced by the carbontax. Computable general equilibrium models can pro-vide with a more complete analysis of the consequencesof carbon policies, in particular taking into account pre-existing distortionary taxation and the terms of tradeeffects (e.g. Babiker et al., 2003).The introduction of a carbon value (tax) reduces the
cement demand. As the carbon value increases, prices ofthe fuels used in the different processes rise according to
10In this scenario Russia determines its ‘hot air’ sales maximising its
revenues.
their carbon content, inducing fuel substitution. Coal isthe most negatively affected by the introduction of thecarbon values, while natural gas becomes the cheapestoption. Electricity price changes as well at a differentrate in each country, according to the fuel mix used forpower generation. The energy price increase translatesinto different increments in production cost for thedifferent technologies and regions. Technology changeand retrofitting speed up according to these effects, asthe fuel price will push forward to more fuel-efficienttechnologies, through new capacities or retrofitting. Theemission trade market is assumed to be perfect (i.e. nomarket distortion, and zero transaction costs), and willbe cleared at the price where all marginal cost curves areequalised.In this article the emission permit allocation to the
cement industry is based on the so-called optimalallocation approach, which ensures that the nationaltargets are achieved minimising the overall compliancecosts. National sectoral targets for the cement industryin each member state are calculated assuming that theEU Burden Sharing Agreement11 (BSA) has to befulfilled. The results from the POLES model have beenused for this purpose. The procedure is illustrated in Fig.7. POLES compute for each member state the permitprice reached under national emission trading regimes,given the national BSA target. The permit prices undernational emission trading regimes are given by theintersection between the national marginal abatementcost curves (MAC) and the BSA targets. The intersec-tions between the sectoral MACs and the nationalpermit prices give the emission allocation among all theindustries included in the trading regime. Such anallocation ensures the fulfilment of the BSA targets.Once the POLES-based national permit prices arederived, the sectoral marginal abatement cost (MAC)curves from CEMSIM are used to compute the targetsfor the cement industry in each member state.The national targets and the respective national
permit prices appear in Table 6. The EU15, EU27 andAnnex B permit prices (signed with * in the last threerows of the table) indicate the equilibrium permit pricesif full trade amongst the participating countries isallowed.The last three columns of the table present the
national permit prices that would balance the nationalcarbon markets if there were not European emissiontrading. The prices have been computed with thePOLES model. In the case of EU27 and Annex B trade,the national permit prices in the candidate countries are
been distributed on a differentiated basis to individual Member States
with an ‘EU burden sharing’ mechanism agreed upon by the Council
of Ministers in June 1998. For a detailed analysis see e.g. Eyckmans
et al. (2002).

ARTICLE IN PRESS
Fig. 7. Target setting in the policy scenarios.
Table 6
National BSA targets and permit prices from POLES
Reduction target
(%)
National permit price
EU15
National permit price
EU27
National permit price
Annex B
Austria �13 67 67 70
Belgium and
Luxembourg
�9 54 55 58
Denmark �21 135 136 140
Spain 15 35 35 36
Finland 0 210 229 225
France 0 37 37 39
United Kingdom �12.5 12 12 12
Greece 25 47 47 48
Ireland 13 89 89 90
Italy �6.5 35 35 37
Netherlands �6 158 158 160
Portugal 27 42 42 43
Germany �21 9 9 10
Sweden 4 149 149 154
Cyprus 0 0 0
Malta 0 0 0
Hungary �6 11 11
Poland �6 11 11
Czech Republic �8 11 11
Slovak Republic �8 11 11
Bulgaria �8 0 0
Romania �8 0 0
Slovenia �8 0 0
Estonia �8 0 0
Lithuania �8 0 0
Latvia �8 0 0
Russia 0 0
Ukraine 0 0
Canada �6 98
Japan �6 12
Rest of Western
Europe
�3.6 250
Australia and New
Zealand
�7.3 57
Rest of Central Europe �3 0
European Union—15
Trade
�8 28*
European Union—27
Trade
�8 18*
Annex B Trade �5 15*
L. Szabo et al. / Energy Policy 34 (2006) 72–87 81

ARTICLE IN PRESS
13In order to make the alternatives comparable, revenues from ‘hot
air’ are not included in the benefit calculation. This would also require
an additional assumption on the allocation rule of the existing ‘hot air’
to the different sectors. The sector’s revenues from the ‘hot air’ sales
L. Szabo et al. / Energy Policy 34 (2006) 72–8782
much lower than the prices in the EU15 member states,or even zero, as in the case of some Eastern European12
and Former Soviet Union states, due to their decliningeconomic output in the transition period. Their implieddeclining carbon emissions put these countries in theposition to sell carbon credits, without real abatement.At the same time zero permit price means that thecountry does not have to constrain the emissions of itsindustries, as they are able to fulfil their Kyotocommitment with their projected BAU emission.Using the marginal abatement curves the compliance
costs of fulfilling the national targets are calculated foreach region participating in the emission trading scheme(see Babiker et al., 2002; Gusbin et al. 1999). Thedifference between the compliance cost of the trade andnon-trade case gives the benefit arising from theinternational emission trading. The gains for theparticipating nations come from two sources. Thosecountries having high national permit prices (e.g.Netherlands, Denmark, Finland) are better off becausebuying permits abroad allows them to reduce theirexpensive domestic abatement effort (avoiding the highimplied costs represented by the peak of their MACcurves). Countries characterised by cheap abatementoptions can increase their abatement effort, and sell theadditional permits on the market. These benefits havebeen quantified for the three scenarios. The resultsappear in Table 7.The second column shows the estimated 1990 CO2
emissions of the sectors, while the third one is the BAUprojection by the CEMSIM model. The last six columnsshow the three alternative scenario results, the reductiontargets (effort) compared to the BAU case, and thequantified benefits for the trading countries. For thenon-participating countries these benefits and targetslogically cannot be calculated. The last three rowssummarise the impact on the entire emission tradingmarkets.The EU15-wide emission trading scheme would
reduce the compliance costs of fulfilling the Kyototarget by 50.8Mh in the cement sector (from 109Mh inthe national or isolated markets case to 58Mh in thetrading case). The cement sector would be a net buyer ofpermits at the EU-wide permit price, 28 h/t CO2. TheNetherlands (14.71 Mh), Finland (11.36Mh) andSweden (8.23Mh) would benefit most from the emissiontrading, as they have the highest compliance costs in thenon-trading case. The cement industries of Germanyand United Kingdom would receive revenues in thetrading market.The overall reduction target of the EU15 is 2.4%,
defined with respect to the 2010 BAU emissions. At the
12The Czech Republic, Hungary, Poland and the Slovak Republic
have the same permit price, as the current version of the POLES model
groups them into the same region.
level of the individual countries the reduction targetsshow high variety, ranging between 0.8% and 17.9%. Ingeneral large emitters, such as Italy, Germany, Spainand France have lower emission targets, while northerncountries face more stringent targets.The EU27-wide emission trading scheme would
increase the benefits arising from trade to 67Mh (from111Mh in the national market case to 43Mh in thetrading case). Only a smaller part of this benefit (2Mh)comes from the direct emission reduction activities ofthe accession countries.13
The reduction target compared to the 2010 BAUvaries between 0% and 19%, but on average thereduction requirement remains at a relatively low level(1.9%). The permission price compared to the EU15trading case would fall to 18 h, which implies that mostof the EU15 countries would increase their benefits fromthe widening of the emission trading market. OnlyGermany and the Great Britain would face lower benefitlevels, as the income from selling their excess allowancewould drop compared to the EU15-wide trade. Benefitswould mainly be concentrated in four northern coun-tries (Finland, Netherlands, Sweden and Denmark), asin the EU15 trade case.The Annex B emission-scheme would further increase
the benefits of international carbon trade for the cementsector to 99Mh (compliance cost reduces from 148Mh
in the national market case to 49Mh in the tradingcase). The equilibrium price further reduces to h15,according to the POLES model simulations.14
Reduction targets compared to the 2010 BAU casevaries between 0 and 18.5%, and the Annex B averagestands at 2.5%. Europe (EU27) and ROWE would bethe winners as most of the benefits are concentrated inthese regions. In those countries where the equilibriumpermit price is zero (e.g. Russia and Ukraine) the tableshows the benefits without the income from ‘hot air’ (seefootnote 13). The Russian Federation and Ukraine (andmany other transition countries as well) have astabilisation target for the first Kyoto period, but dueto their economic decline, their emissions in 2010 will bemuch below those of 1990. This implies that theseeconomies at first will be able to sell large amounts ofrights, without indeed reducing emissions, and benefit-ing from potential financial transfers.
could reach up to 120Mh in the case of the Former Soviet Union
region (mainly Russia), and 72Mh for Central and Eastern Europe.14With the participation of the US the equilibrium carbon price
would be h18, assuming that Russia sales all its available hot air. This
excess supply is overbalanced by the US demand for permits.

ARTICLE IN PRESS
Table 7
Impacts of alternative emission trading schemes on the cement sector
1990
emissions
(Mt)
2010 BAU
emissions
EU15 trade EU27 trade Annex B trade
Reduction
target compared
to BAU 2010
(%)
Benefits
(Mh)
Reduction
target compared
to BAU 2010
(%)
Benefits
(Mh)
Reduction
target compared
to BAU 2010
(%)
Benefits
(Mh)
Austria 3.51 2.91 �4.7 1.51 �4.7 2.34 �4.2 2.34
Belgiuma 5.42 8.51 �2.9 1.51 �2.9 3.01 �2.8 3.27
Denmark 1.19 1.55 �7.9 4.57 �7.7 5.38 �8.2 6.46
Spain 22.35 23.40 �2.2 0.36 �2.2 2.09 �2.0 2.01
Finland 1.20 1.01 �17.9 11.36 �19.0 14.69 �18.5 15.34
France 16.53 13.49 �2.2 0.32 �2.2 1.39 �2.0 1.50
United
Kingdom
10.54 10.79 �0.8 0.89 �0.8 0.12 �0.6 0.07
Greece 9.75 9.44 �2.2 0.81 �2.2 1.85 �1.8 1.62
Ireland 1.17 1.83 �7.9 2.81 �7.8 3.74 �6.7 3.39
Italy 30.80 29.51 �2.1 0.42 �2.1 2.45 �1.9 2.71
Netherlands 2.67 2.67 �12.5 14.71 �12.1 16.60 �10.8 16.68
Portugal 5.22 6.95 �3.2 0.51 �3.2 1.48 �2.8 1.39
Germany 23.17 26.28 �0.5 2.83 �0.5 0.63 �0.5 0.38
Sweden 1.78 1.98 �8.8 8.23 �8.6 9.34 �7.8 9.05
Cyprus 0.82 1.31 0.0 0.13 0.0 0.13
Malta 0.00 0.00 0.0 0.00 0.0 0.00
Hungary 3.19 3.64 �0.7 0.06 �0.6 0.04
Poland 13.99 12.46 �0.6 0.17 �0.4 0.10
Czech
Republic
6.31 3.99 �0.7 0.06 �0.6 0.04
Slovak
Republic
2.05 2.98 �0.4 0.03 �0.3 0.02
Bulgaria 3.94 4.70 0.0 0.26 0.0 0.12
Romania 9.47 9.52 0.0 0.99 0.0 0.36
Slovenia 1.03 0.87 0.0 0.10 0.0 0.09
Estonia 0.73 1.67 0.0 0.06 0.0 0.00
Lithuania 0.59 0.55 0.0 0.03 0.0 0.01
Latvia 2.68 3.08 0.0 0.00 0.0 0.07
Russia 65.50 58.62 0.0 1.22
Ukraine 21.28 21.61 0.0 0.22
Canada 10.24 10.46 �1.5 5.29
Japan 53.22 70.25 �0.3 0.21
Rest of
Western
Europe
4.71 4.07 �5.6 23.22
Australia
and New
Zealand
6.22 5.72 �1.5 1.14
Rest of
Central
Europe
6.93 4.28 0.0 0.49
EU15 Trade �2.4 50.83
EU27 Trade �1.9 67.00
Annex B
Trade
411.19 439.88 �2.5 98.98
aTogether with Luxemburg.
L. Szabo et al. / Energy Policy 34 (2006) 72–87 83
4.3. Carbon leakage
A generally cited disadvantage of emission tradingschemes is that part of the production of the countriessubject to the emission constraints might be relocated tocountries not participating in the trading scheme, a
phenomenon known as carbon leakage. Non-participat-ing regions might then increase their market shares, astheir production is not penalised by the carbon price.The environmental effectiveness of the regional emissiontrading market diminishes when this world perspective istaken into account. The CEMSIM model can quantify

ARTICLE IN PRESS
Fig. 8. Production leakage as a function of the EU15 emission permit
price.
L. Szabo et al. / Energy Policy 34 (2006) 72–8784
this kind of effects because it is a global model.15 In thefollowing the EU15 case is studied. Given that thismarket has the smallest geographical coverage, thecarbon leakage effect is expected to be the highest inmagnitude among the three considered scenarios. Whenmore countries are involved in the trading scheme, theleakage effect would logically decrease.Fig. 8 shows the size of the production change with
respect to the BAU scenario resulting from theintroduction of permit prices in the range of 0–50 h/tCO2. For example, at the permit price of 40 h/t CO2 theEU15 will produce 5Mt less than in the BAU case(around 3.5% of its total production), while the otherregions will increase their production, however to a lessextent. The ratio between the production increase inother region and the reduced production in the EU15 is29% at this price. The last bars (World-EU15) representthe overall production leakage effect for the regionsother than the EU15. This leakage effect rises as thepermit price increases.
4.4. Sensitivity analysis
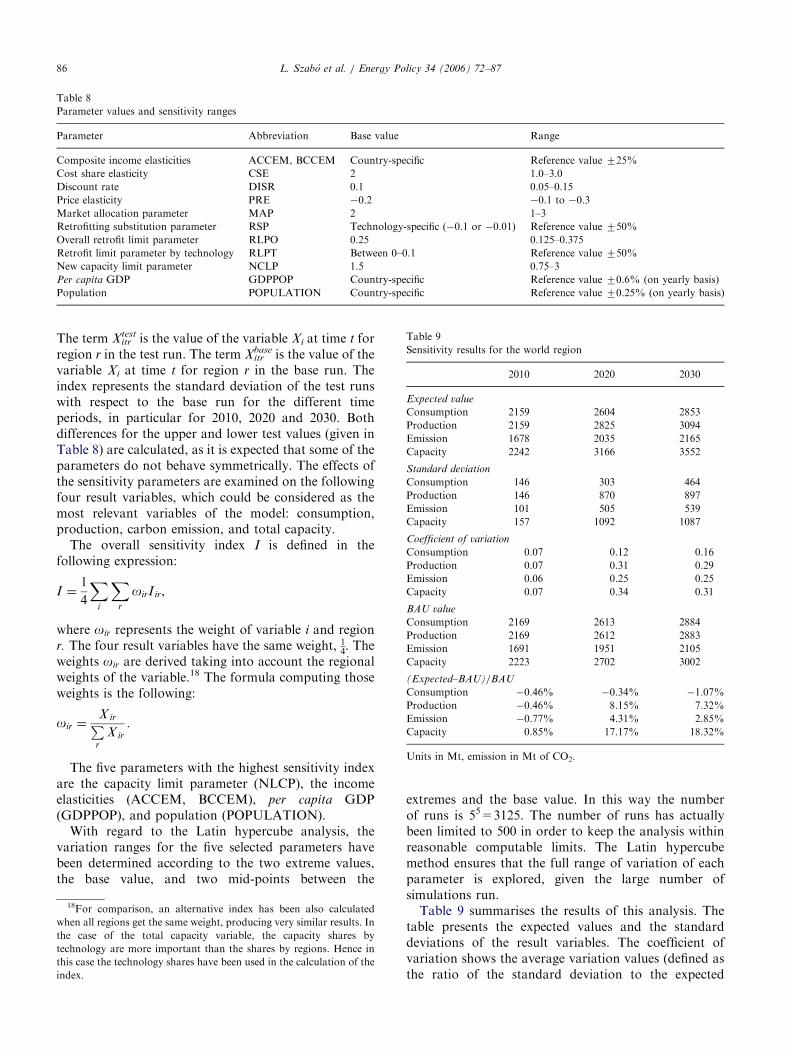
The robustness of the results to crucial assumptionsand parameters has been assessed with a detailedsensitivity analysis. A series of model runs has beenperformed with different values of some selectedparameters (mainly price (costs) and income elasticities).The analysis has been carried out following a two-stepprocedure. In a first stage, five model parameters havebeen selected among a set of 12, using a sensitivity index(introduced later) that represents the sensitivity of themodel results to these parameters. In the second stage,the Latin hypercube method has been applied to checkthe impact of the selected parameters when all dochange at the same time. 500 model runs have beenmade in this second stage.
15As the carbon value is introduced in the countries participating in
the emission trading market, the international trade flows of cement of
all the 51 CEMSIM regions do change, and are accounted for in the
model results.
Appendix B reports on the implementation of thesensitivity analysis. Given the 33 year time horizon andthe wide range in which the parameters have beenallowed to change, the sensitivity analysis results suggestthat the model BAU is relatively robust. The results alsoshow that the capacity planning module is the mostsensitive part of the model. Thus in the furtherdevelopment of the CEMSIM model this part wouldrequire more scrutiny.
5. Conclusions
This article has presented a recursive simulationmodel of the cement industry, the CEMSIM model.The model has been used to study the most importanttrends in the world cement market concerning produc-tion, technology development, energy consumption andcarbon emissions in the 2000–2030 period. The articlealso analyses the potential impact on the cement sectorderived from the implementation of new marketmechanisms aimed to fulfil the carbon reduction targetsset up by the Kyoto Protocol on climate change. Inparticular, the benefits of three potential internationalemission trading markets have been calculated (EU15,EU27 and Annex B).In the reference scenario a sharp increase in world
cement production is expected. The 1550Mt of cementproduction in 1997 is projected to reach 2800Mt by2030. This increase is due to the intensive growth ofcement consumption in developing regions, mainlyChina, South-East Asia and India, tied to their intensiveindustrialisation processes. On the contrary, developedregions, such as North America, Europe and OECDPacific, have stabilising or declining consumptionpatterns, while their cement production is expected torise slightly.International trade in cement shows an uninterrupted
growing trend. It is projected to increase from 112Mt in1997 to 450Mt in 2030, which translates into a rise inthe share of international trade in consumption from7% to 16%. Developed regions are the main exporters,while most of the developing regions import anincreasing share of their consumption. China is the onlyexception, a country projected to be the largest exporterby 2020.Concerning the evolution of the technology portfolio
the most advanced dry-preheater and dry-pre-calcinertechnologies are expected to become the most wide-spread technologies by 2030. Technologies with higherenergy consumption, such as the wet long and dry longkilns will be driven out from the market or will beretrofitted.Global CO2 emissions from the cement industry will
increase by more than 50% in the BAU scenario,reaching 2100Mt by 2030. The growth of carbon
ARTICLE IN PRESSL. Szabo et al. / Energy Policy 34 (2006) 72–87 85
emissions is less intensive than the growth in cementproduction due to the shift to cleaner technologies andthe improvements in energy efficiency. But the resultsalso suggest that the sector will continue to increase theshares of carbon-intensive fuels in both the referenceand carbon trading cases.The impacts of three different CO2 emission trading
schemes have been numerically calculated with themodel. Under the EU15-wide emission trading schemethe costs of fulfilling the Kyoto Protocol targets in thecement sector would be reduced by 50Mh. This benefitis quite concentrated in some northern Europeancountries. At the equilibrium price of 28 h/t CO2
(projected by the POLES model) the cementindustries of most of the EU-15 countries would bepermit buyers.If the trading scheme is enlarged to the EU27, the
permit price would fall (to 18 h/t CO2) and benefits forthe participating countries would increase to 67Mh.Accession countries would mainly benefit from their‘hot air’, but their projected growing cement consump-tion reduces their trading potential by 2010. An AnnexB-wide emission trading would entail a 15 h/t CO2
permit price as well, with additional benefits for theparticipants, estimated to amount to 99Mh. Thesenumbers are in accordance with the theory, as increasingthe ‘pool’ size of participating countries should decreaseoverall compliance costs and raise benefits.On the other hand, according to the model results the
sub-global coverage of emission trading does not lead tovery high carbon leakage effects till 2010 in theconsidered permit price range (0–50 h/t CO2). Howeverwith increasing permit price beyond this range theleakage effect might intensify.Finally, the quantitative results of this study do not
intend to be forecasts or predictions about the futureevolution of the cement sector. The CEMSIM modelprovides with numerical results, taking into account thecurrent available data and the relationships between themodel variables. The model results are therefore to beinterpreted in the particular proposed analytical frame-work. Undoubtedly, there remain significant dataproblems and poorly understood key relationships.The ultimate purpose of this research has been toprovide with useful insights for policymakers.
16The United Nations World Population Prospect 2002 revised
database (UN, 2003) has been used for population. The EIA Annual
Energy Outlook GDP estimates (Energy Information Administration
(EIA), 2002) have been considered as the basis for the range setting
high and low economic growth cases.17The index is constructed on the basis of Nordhaus (1994).
Acknowledgements
A preliminary version of this article was presented atthe EAERE conference held in Bilbao, June 2003. Theauthors would like to acknowledge the comments andsuggestions received from Santiago Rubio (University ofValencia), Peter Russ (IPTS), and an anonymousreferee.
Appendix A. Sources of databases
CEMBUREAU, 1999b. World Statistical Review no.18 (1913–1995) and no. 19–20 (1994–1995).CEMBUREAU, 2002. World Cement Directory 1996
& 2002.Department of Trade and Industry (UK), 2001.
Construction Statistics Annual (http://www.dti.gov.uk/construction/stats/stats2001/pdf/constat2001.pdf).European Environmental Agency, 2002. Greenhouse
gas emission trends in Europe 1990–2000. ISBN 92-9167-516-4.International Energy Agency (IEA), 2002a. Energy
Statistics of OECD Countries.International Energy Agency (IEA), 2002b. Energy
Statistics of Non-OECD Countries.International Cement Review (ICR), 1998. The Global
Cement Report (3rd Edition).United Nations Framework Convention on Climate
Change (UNFCCC), 2003. Database on GHG gases(http://unfccc.int/).United Nations Population Division (UN), 2003.
World Population Prospects: The 2002 Revision Popu-lation Database (http://esa.un.org/unpp).
Appendix B. Sensitivity analysis
This annex details the sensitivity analysis carried outin the CEMSIM model. The parameters included in theanalysis are quite different in their character andcalculation. Some of them are classical elasticityparameters (based on cost or prices), while others areauxiliary variables. Table 8 gives the base values of theparameters (those used in the reference scenario),together with the test values, used as boundaries forthe sensitivity runs. Some parameters are allowed tochange in the range of750% compared to the referencevalue. For the income elasticity parameters a smallerrange has been assumed, as they are econometricallyestimated values on the past 15-year data. For theexogenous variables (per capita GDP, population data)the range is set according to the UN and EIAestimates.16
The sensitivity index is defined in the followingexpression.17
I ir ¼X
t
ffiffiffiffiffiffiffiffiffiffiffiffiffiffiffiffiffiffiffiffiffiffiffiffiffiffiffiffiffiffiffiffiffiffiffiX test
itr � X baseitr
X baseitr
!2vuut :
ARTICLE IN PRESS
Table 8
Parameter values and sensitivity ranges
Parameter Abbreviation Base value Range
Composite income elasticities ACCEM, BCCEM Country-specific Reference value 725%
Cost share elasticity CSE 2 1.0–3.0
Discount rate DISR 0.1 0.05–0.15
Price elasticity PRE �0.2 �0.1 to �0.3
Market allocation parameter MAP 2 1–3
Retrofitting substitution parameter RSP Technology-specific (�0.1 or �0.01) Reference value 750%
Overall retrofit limit parameter RLPO 0.25 0.125–0.375
Retrofit limit parameter by technology RLPT Between 0–0.1 Reference value 750%
New capacity limit parameter NCLP 1.5 0.75–3
Per capita GDP GDPPOP Country-specific Reference value 70.6% (on yearly basis)
Population POPULATION Country-specific Reference value 70.25% (on yearly basis)
Table 9
Sensitivity results for the world region
2010 2020 2030
Expected value
Consumption 2159 2604 2853
Production 2159 2825 3094
Emission 1678 2035 2165
Capacity 2242 3166 3552
Standard deviation
Consumption 146 303 464
Production 146 870 897
Emission 101 505 539
Capacity 157 1092 1087
Coefficient of variation
Consumption 0.07 0.12 0.16
Production 0.07 0.31 0.29
Emission 0.06 0.25 0.25
Capacity 0.07 0.34 0.31
BAU value
Consumption 2169 2613 2884
Production 2169 2612 2883
Emission 1691 1951 2105
Capacity 2223 2702 3002
(Expected–BAU)/BAU
Consumption �0.46% �0.34% �1.07%
Production �0.46% 8.15% 7.32%
Emission �0.77% 4.31% 2.85%
Capacity 0.85% 17.17% 18.32%
Units in Mt, emission in Mt of CO2.
L. Szabo et al. / Energy Policy 34 (2006) 72–8786
The term Xitrtest is the value of the variable Xi at time t for
region r in the test run. The term Xitrbase is the value of the
variable Xi at time t for region r in the base run. Theindex represents the standard deviation of the test runswith respect to the base run for the different timeperiods, in particular for 2010, 2020 and 2030. Bothdifferences for the upper and lower test values (given inTable 8) are calculated, as it is expected that some of theparameters do not behave symmetrically. The effects ofthe sensitivity parameters are examined on the followingfour result variables, which could be considered as themost relevant variables of the model: consumption,production, carbon emission, and total capacity.The overall sensitivity index I is defined in the
following expression:
I ¼1
4
Xi
Xr
oirI ir;
where oir represents the weight of variable i and regionr. The four result variables have the same weight, 1
4. The
weights oir are derived taking into account the regionalweights of the variable.18 The formula computing thoseweights is the following:
oir ¼X irP
r
X ir
:
The five parameters with the highest sensitivity indexare the capacity limit parameter (NLCP), the incomeelasticities (ACCEM, BCCEM), per capita GDP(GDPPOP), and population (POPULATION).With regard to the Latin hypercube analysis, the
variation ranges for the five selected parameters havebeen determined according to the two extreme values,the base value, and two mid-points between the
18For comparison, an alternative index has been also calculated
when all regions get the same weight, producing very similar results. In
the case of the total capacity variable, the capacity shares by
technology are more important than the shares by regions. Hence in
this case the technology shares have been used in the calculation of the
index.
extremes and the base value. In this way the numberof runs is 55=3125. The number of runs has actuallybeen limited to 500 in order to keep the analysis withinreasonable computable limits. The Latin hypercubemethod ensures that the full range of variation of eachparameter is explored, given the large number ofsimulations run.Table 9 summarises the results of this analysis. The
table presents the expected values and the standarddeviations of the result variables. The coefficient ofvariation shows the average variation values (defined asthe ratio of the standard deviation to the expected
ARTICLE IN PRESSL. Szabo et al. / Energy Policy 34 (2006) 72–87 87
value). The coefficient of variation shows its peak in2020. While the standard deviation values are increas-ing, the expected values show much smaller increases,resulting in smaller coefficients. Furthermore, anotherindicator of the table measures the deviation of theexpected value with respect to the BAU value ((Ex-pected Value–BAU)/BAU). The expected value of thesensitivity runs and the BAU scenario values are ratherclose to each other, with the exception of the capacityvariable.
References
Babiker, H.M., Reilly, J.M., Viguier, L., 2002. Is international
emissions trading always beneficial? MIT Joint Program on the
Science and Policy of Global Change Report No. 93.
Babiker, H.M., Criqui, P., Ellermann, D., Reilly, J., Viguier, L., 2003.
Assessing the impact of carbon tax differentiation in the European
Union. Environmental Modeling and Assessment 8 (3), 187–197.
Capros, P., Kouvaritakis, N., Mantzos, L., 2001. Economic evaluation
of sectoral emission reduction objectives for climate change: Top-
Down analysis of Greenhouse Gas Emission possibilities in the EU’
(PRIMES). Contribution to a Study for DG Environment,
European Commission.
CEMBUREAU, 1999a. Best available techniques for the cement
industry. A contribution from the European Cement Industry to
the exchange of information and preparation of IPPC BAT
Reference Document for the cement industry (www.cembureau.-
com).
Cramton, P., Kerr, S., 2002. Tradeable carbon permit auctions: How
and why to auction not grandfather. Energy Policy 30, 333–345.
Energy Information Administration (EIA), 2002. Annual energy
outlook 2002 (http://www.eia.doe.gov/analysis/2001anal01.html).
European Commission, 1996. POLES 2.2. European Commission,
DGXII, JOULE II Programme, Science Research Development.
Ref EUR 17356 EN.
European Commission, 2000a. Best available techniques reference
document in the cement and lime manufacturing industries.
European Integrated Pollution Prevention and Control Bureau
(EIPPCB), Institute for Prospective Technological Studies, Sevilla,
Spain
European Commission, 2000b. Green paper on Greenhouse Gas
Emission trading within the European Union. COM 2000-87.
European Commission, 2003a. Directive of the European Parliament
and of the Council establishing a scheme for greenhouse gas
emission allowance trading within the Community and amending
Council directive 96/61/EC (Directive 2003/87/EC).
European Commission, 2003b. Common position of the Council on
the adoption of a Directive of the European Union and of the
Council establishing a scheme for greenhouse gas emission
allowance trading within the Community and amending Council
Directive 96/61/EC. Communication from the Commission to the
European Parliament. SEC 2003-364 Final.
European Commission, 2003c. The EU emission Trading Scheme: how
to develop a National Allocation Plan. Non Paper Second meeting
of working 3 Monitoring Mechanism Committee, April, 2003.
Eyckmans, J., Cornillie, J., Regemorter, D., 2002. Efficiency and
equity in the EU Burden Sharing Agreement. ETE Working Paper
No. 2000-02, Katholieke Universiteit Leuven.
Gielen, D.J., Moriguchi, Y, 2002. CO2 in the iron and steel industry:
an analysis of Japanese emission reduction potentials. Energy
Policy 30, 849–865.
Gusbin, D., Klaassen, G., Kouvaritakis, N., 1999. Cost of a ceiling on
Kyoto flexibility. Energy Policy 27, 833–844.
Hidalgo, I., Szabo, L., Calleja, I., Ciscar, J.C., Russ, P., Soria, A.,
2003. Energy consumption and CO2 emissions from the world iron
and steel industry. Institute for Prospective Technological Studies,
Joint Research Centre, Report EUR 20686 EN, Seville, Spain.
Hendriks, C.A., Worrell, E., Jager, D., Blok, K., Reimer, P., 2000.
Emission reduction of Greenhouse Gases from the cement
industry. Greenhouse Gas Control Technologies Conference
Paper. (www.ieagreen.org).
International Energy Agency (IEA), 1999. The reduction of green-
house gas emission from the cement industry. IEA Greenhouse Gas
R & D Programme Report No. PH3/7.
Jacobsen, H.K., 2000. Technology diffusion in energy-economy
models: the case of Danish Vintage Models. The Energy Journal
21, 43–71.
Kouvaritakis, N., Criqui, P., Thonet, C., 2000b. World post-Kyoto
scenarios: benefits from accelerated technology progress. Interna-
tional Journal of Global Energy Issues 14 (1–4), 184–203.
Liu, F., Ross, M., Wang, S., 1995. Energy efficiency of China’s cement
industry. Energy 20 (7), 669–689.
Mannaerts, H., 2000. STREAM: substance throughput related to
economic activity model: a partial equilibrium model for material
flows in the economy. CPB Research Memorandum No. 165, The
Hague, ISBN 90 5833 042 7.
Martins, O. J., Scarpetta, S., 1999. The levels and cyclical behaviour of
mark-ups across countries and market structures. OECD Econom-
ics Department Working Papers No. 213.
Nordhaus, W.D., 1994. Managing the Global Commons: The
Economics of Climate Change. The MIT Press, Cambridge, MA.
Rotman, J., Kelmanzky, D., 1997. Determinantes del consumo del
Cemento en la Argentina. Paper presented at the Annual AAEP
Conference (http://www.aaep.org.ar/espa/anales/pdf/rotman_kel-
manzky.pdf).
Schumacher, K., Sathaye, J., 1999. India’s cement industry: produc-
tivity, energy efficiency and carbon emissions. Energy Analysis
Program: Environmental Energy Technologies Division, Lawrence
Berkeley National Laboratory.
Szabo, L., Hidalgo, I., Ciscar, J.C., Soria, A., Russ, P., 2003. Energy
consumption and CO2 emissions from the world cement industry.
Institute for Prospective Technological Studies, Joint Research
Centre, Report EUR 20769 EN (http://www.jrc.es/home/publica-
tions/publication.cfm?pub=1108).
Van Vuuren, D.P., Strengers, B.J., De Vries, H.J.M., 1999. Long-term
perspectives on world metal use—a system dynamics model.
Resources Policy 25, 239–255.
Worrell, E., Martin, N., Pryce, L., 2000. Potentials for energy
efficiency improvements in the US cement industry. Energy 25,
1189–1214.
Further reading
Kouvaritakis, N., Soria, A., Isoard, S., 2000. Modelling energy
technology dinamics: methodology for adaptive expectations
models with learning by doing and learning by searching.
International Journal of Global Energy Issues 14 (1–4), 104–115.