ANNEX 1 - DEVELOPMENT EXPERIENCE ...
201
ANNEX 1
-
Upload
khangminh22 -
Category
Documents
-
view
5 -
download
0
Transcript of ANNEX 1 - DEVELOPMENT EXPERIENCE ...

ANNEX 1

Information from End-‐of-‐project Division Exit Conferences
Part 1: WSRP Best Practices
These best practices are summarized from the best practices and challenges reported by school teams during the seven division close out conferences. It is important to note the challenges that faced some implementing schools were the mirror of the best practices reported by most schools. This data informed the refinements to the program model, including the addition of a component focused on program evaluation.
WSRP Components Best Practices, 2012-‐13 1. School Reading Improvement Plan (SRIP)
Use of collaborative planning to set school-‐wide goals and activities to improve reading skills of all students and the integration of these in the School Improvement Plan (SIP).
• SRIP is formally documented and integrated in the SIP with budget allocation.
• Detailed reading improvement activities are planned in a collaborative manner by school heads and teachers.
• SRIP is supported by stakeholders. • SRIP is used for monitoring the progress of
program implementation. 2. Professional Development for Teachers and
Administrators in Teaching Reading and Writing • Training courses for all teachers in the
school on Learning to Read, Reading to Learn, and Reading-‐Writing Connections, Conducting and Using Assessments, and Reading and Writing in the higher grade content areas.
• Needs-‐ based professional development through school based learning activities for teachers.
• Use of survey and other tools (e.g. TSNA) as Training Needs Assessment to design training content.
• Inset during summer and October participated by all teachers and administrators.
• Peer-‐coaching or mentoring in school via Learning Partnership Program and School Learning Action Cells
3. Students’ Assessment and Use of Results Training of administrators and teachers to use assessment tools to diagnose and track students’ reading skills in reading, plan instruction and monitor their reading progress.
• Conduct of regular assessments and documentation of results to track progress.
• Use of assessment results in planning remediation interventions
• School budgeted for the reproduction of assessment tools.
• Teachers conduct assessments with integrity (e.g. not table work).
4. Strengthened Reading Instructional Practices in All Subject Areas Use of explicit instruction in phonics, phonemic awareness, word recognition, vocabulary development, fluency, reading comprehension and writing; integration of these strategies in teachers’ daily lesson plan for reading. Use of reading strategies as a key in teaching other subjects.
• Integration of explicit instruction around 5 components of reading + writing in one integrated lesson plan.
• Creative use of varied instructional materials developed by teachers
• Easy access to supplemental books such as those provided through BBF and National Bookstore Foundation
• Use of pre-‐reading, during reading and post reading approaches to improve comprehension skills of pupils

5. Remedial Reading Activities Structured instruction for non-‐readers and frustration-‐level readers in all grades through pull-‐out and mainstream mechanisms. Use of differentiated activities in remedial sessions conducted within the classroom.
• Use assessments to determine reading levels of students and track their process e.g. Phil-‐IRI and RARS.
• Established fixed time/schedule for remedial session and reflected in class program for institutionalization.
• Use of structured remedial reading lesson plans and journals.
• Use of varied strategies (peer reading, pair reading, use of supplementary books)
• Established pulled out system handled by a trained remedial reading teacher to selected grades to focus on non-‐readers and those reading below their grade level.
6. Enrichment Reading Activities Structured instruction for instructional and independent-‐level readers and promoting reading activities through school, district and division-‐wide activities.
• Conduct of school wide competitions in readers’ theatre, jazz chants, news casting and participated in district and division based Read A Thon activities.
• Conduct supervised and guided reading activities using supplementary reading materials and books in mini library inside the classroom and school library.
7. Instructional Materials Development and Support Provision and development of materials to support student assessment, classroom instruction, remedial and enrichment reading activities.
• Established/improved functional mini libraries and school libraries which are accessible to students and community.
• Teachers develop appropriate and locally produced IMs e.g. big books, charts, etc to supplement reading instruction inside the classroom.
• Schools have prioritized budget for materials and book procurement using SBM and MOOE grants.
8. Monitoring and Technical Support Regular monitoring of the program components and technical support through classroom observations and providing feedback by school administrators, district and division supervisors using standard monitoring and assessment tools.
• Use of a formal observation tool e.g. STAR/SCOPE for objective classroom observation, feedback giving, monitoring and sharing of best practices to other teachers.
• Classroom observations are properly documented and appropriately filed.
9. Support from Stakeholders School-‐initiated activities for parents, LGU and other stakeholders. to appreciate and understand the reading program and generate their involvement and support.
• Established good relationship with PTA, LGU and other stakeholders by allocating funds from their budget to support the reading program.
• Regular reporting to stakeholders the progress of the school reading program through PTA and barangay assemblies using education indicators, BERC, etc.
• Conducted parenting session with parents and involving them in all school activities.
10. Program Assessment and Evaluation Conduct regular assessment to determine progress of the reading program using WSRP assessment rubrics and impact through education indicators
• WSRP SRIP assessment rubric and report card used by school teams to self-‐evaluate progress

Part 2: WSRP Self-‐Assessment Rubric and Assessment Results
A. Excerpt from the Guide to Assessing Progress on the WSRP School Reading Improvement Plan:
PROCESS AND PARTICIPANTS This assessment is accomplished by going through every item and answering each through the consensus of all participants. The school head will facilitate, or may appoint a facilitator to lead the discussion. Since the results of the assessment should show the level of development of the WSRP implementation, the school head and those teachers and other staff present during the assessment must actively participate in the deliberation. The following guidance is recommended for reaching consensus on the ratings: • For each item on the assessment, discuss each of the four rating levels. Is the group clear
about the meaning of each of the four descriptors? • Each person in the group should rate the item and be prepared to describe why s/he
supports the rating by giving specific, concrete examples as evidence. • If there is no consensus among the group members about the rating for an item, discuss
the evidence that has been suggested by the group members. Is it strong enough to support the rating?
• If the group cannot reach consensus, split the difference between the two predominant ratings.
Once the group has rated all 9 items, enter the ratings on the scoring sheet, total the scores and divide by 9. This average indicates the school’s overall level of development for its reading improvement program. These results should be used to plan for the next implementation cycle of the school’s reading program. THE ASSESSMENT TOOL: THE WHOLE SCHOOL READING PROGRAM ASSESSMENT RUBRIC
These rubrics reflect the various levels of development of a WSRP school ranging from forming stage to leading to excellence stage, which illustrates the conditions of what a sound school reading program should be. These rubrics, however, do not capture all the elements that a WSRP school will need to do to establish and grow in its reading program. 1. School Reading Improvement Plan (SRIP) in the School Improvement Plan (SIP)
Rating Level of Development
Criteria
0 Forming Planning the school’s reading program has been discussed during one of the school’s meetings. However no actual planning activity has been initiated at the school and district level. School does not have a School Reading Improvement Plan in the SIP.
1 Beginning Planning for reading improvement of students is initiated by an external group or project, and is handled by the school head without consulting other teachers. A

description of the SRIP is included in the SIP. It describes program goals, activities and target results for all grades in the school.
2 Established Planning the SRIP is led by the school principal and participated in by most teachers. A description of the SRIP is included in the SIP. The SRIP includes realistic goals, activities and target results. The district and the division are provided copies of such plan.
3 Leading to Excellence
The SRIP is fully integrated with the school and district activities and plans, and is budgeted annually under the SIP. The preparation and implementation of SRIP becomes a regular undertaking within the school calendar. Results of the reading improvement plan are used to set new school-‐wide goals in reading for the next school year.
2. Teacher and Administrator Training on Reading Based on Needs Assessment
Rating Level of Development
Criteria
0 Forming The school does not have a formal process for assessing teachers’ skills and knowledge about teaching reading. Only few teachers have formal training on the teaching of reading, and this training took place more than 5 years ago. Most teachers do not have general knowledge on current approaches and strategies on the teaching of reading.
1 Beginning Teachers undergo individual needs assessment exercises e.g. Teacher Skills and Needs Assessment, STAR or SCOPE to determine their ability to teach reading and other subject areas. However, the results are not fully utilized to plan appropriate teacher development programs related to the teaching of reading. Some teachers have been trained on the teaching of beginning reading within the past 5 years.
2 Established Teacher needs assessment is done regularly to determine areas of development for teachers. Results are utilized to define interventions to improve their teaching of reading and other subjects. Most teachers have been trained within the past 5 years on researched-‐based best practices in the teaching of reading.
3 Leading to Excellence
Regular assessments of teachers are conducted to determine the level of teachers’ skills and knowledge to teach reading. The results of assessments are used to inform the design of teachers training. All teachers regardless of grade level are effective reading instructors and are able to integrate reading skill development into their subject matter. A core of group of school-‐based mentors or coaches conducts regular mentoring activities with other mentee-‐teachers, especially the new ones, in their school, district or division to improve each other’s skills in the teaching of reading.
3. Student Assessments in Reading and Use of Results
Rating Level of Development
Criteria
0 Forming There is no formal assessment activity to diagnose and track progress of students’ reading and comprehension skills. Informal assessments like asking students to read from a book are the usual way to assess the reading skills of students.
1 Beginning Students undergo regular individual assessment exercises such as Phil-‐IRI to determine their reading skills and comprehension. However, the results are not used to plan appropriate reading remediation and enrichment program for students. Assessment materials are sometimes not available or not administered.
2 Established Student assessment such as Phil-‐IRI is an integral process to determine students reading skills and comprehension. Results of such assessment are used to

identify and plan remedial reading program for children. Assessment materials are readily available and provided by the school.
3 Leading to Excellence
Regular assessment of students is conducted. Results are documented and utilized to design appropriate reading interventions. Aside from Phil-‐IRI, other assessment tools such as EGRA, RARS and locally developed tools are also used to track individual progress of children, and to inform appropriate reading program for children. Testing materials are adequately provided by the school or stakeholders.
4. Strengthening Classroom Reading Instruction
Rating Level of Development
Criteria
0 Forming Teaching of reading in most classrooms is largely unstructured and uses traditional approaches, such as: use of cartilla and rote learning/ memorization and repetition; mostly teacher talk, and less use of instructional devices. There is a lack of reading materials and/or no opportunity for students to read, talk and write. Use of explicit instructions is not or rarely evident. Classroom environment does not encourage reading activities.
1 Beginning The teaching of reading in some classrooms shows occasional evidence in use of explicit reading instruction in phonemic awareness, phonics, vocabulary development, fluency, comprehension and writing, usually with less focus on reading comprehension and writing tasks. Instructional devices are sometimes inappropriate. Classroom environment provides limited access to reading materials and activities. Little attention is paid to the different skill levels of students.
2 Established Most classrooms make use of explicit instruction in reading (phonemic awareness tasks, phonics, vocabulary development, fluency activities, comprehension and writing) – done in a differentiated activities with creative use of instructional devices. Classroom environment offers rich and varied materials for reading activities, with differentiated activities for students with weaker and stronger reading skills.
3 Leading to Excellence
Teaching of reading in all classrooms makes use of explicit and coherent instruction in reading: phonemics awareness tasks, phonics, vocabulary development, fluency activities, comprehension and writing – done in a differentiated manner that meets the needs of all students, and with creative use of instructional devices. Classroom environment offers rich and varied materials for reading activity and are easily accessible to students.
5. Remedial Reading Instruction
Rating Level of Development
Criteria
0 Forming School has allotted time for remedial reading activities for non readers and frustration level readers but these activities are not reflected in class program and schedule. Students’ progress in reading is not monitored. There are no records of students’ individual or group performance in reading.
1 Beginning There is fixed time reflected in class program for both mainstream and pull out remedial reading for students. The schedule however is not followed or monitored. Students’ progress in reading is measured using informal assessment tool. These records, however, are not updated on regular basis. Assigned reading teacher is not trained in current approaches and strategies for teaching reading.
2 Established Remedial reading classes have fixed schedule and this is reflected in the class program. Trained reading teachers are assigned to handle classes regularly. School head provides regular monitoring to the program. Students’ progress in

reading is monitored using such tools as RARS and other reading progress tracking tools developed by teachers. Documentation of assessment results is in place. Appropriate reading materials are available and easily accessible to all students.
3 Leading to Excellence
School remedial reading program is institutionalized in terms of integrating its schedule and activities in the class program and school calendar. Each remedial instruction follows a remedial reading plan approved by the school head. School now serves as a demonstration school of an effective remedial reading program in the district or division. Students’ progress in reading is monitored using formal reading tools such as RARS. Results are shared to children and their parents to further plan for school’s reading program. Appropriate reading materials are available and easily accessible to all students.
6. Enrichment Reading Instruction
Rating Level of Development
Criteria
0 Forming There are limited reading enrichment activities for students outside of their regular reading or English class. The school does not have school-‐wide reading activities that promote or encourage reading across all grade levels.
1 Beginning The school has indicated in its class program some reading enrichment activities, e.g. DEAR, but these activities are not consistently followed by students or managed by teachers. Students are usually left on their own when reading. School/district/division-‐wide reading activities are held once during the year.
2 Established The school has a well-‐managed reading enrichment program for instructional and independent students. Students’ reading activities are given fixed time and are managed and guided by teachers. School/district/division-‐wide reading activities are held twice during the year.
3 Leading to Excellence
Enrichment reading program of the school is done with regular schedule and managed well by teachers. Better students are also paired with students having difficulties in reading. Appropriate reading materials are available and easily accessible to all students. School/district/division-‐wide reading activities or competitions are held at least 3 times during the school year.
7. Instructional materials development and support
Rating Level of Development
Criteria
0 Forming The school recognizes the importance of learning materials to support reading development of children. However, it does not have a programmed support to provide reading materials to students and teachers aside from regular books that DepEd provides. Only about one-‐fourth of classrooms have reading corners.
1 Beginning The school has started to provide learning support materials for reading through material development and procurement programs. Some of these materials however are not easily available to students. No regular time is programmed for students to read and learn together. There is no sustained effort to buy and make reading materials that can be used with and by most students. Only about one-‐half of all classrooms have established reading corner.
2 Established The school has an established library where books and other reading materials are easily accessible to students. Most classroom have their mini-‐library where students are given regular time to read and learn together. Classrooms have relevant and appropriate reading materials. Teachers are skilled in developing teaching aid materials. About three-‐fourths of all classrooms have functional reading corners.
3 Leading to The school has prioritized the acquisition of books and reading materials for their

Excellence students. They have linked with other stakeholders to improve collection of learning materials. Each classroom is equipped with visual aids and learning materials developed by teachers and supported by the parents. The school library and/or all classrooms reading corners are functional.
8. Monitoring and Technical Support
Rating Level of Development
Criteria
0 Forming School head conducts informal classroom observation at least once during the school year to about one-‐third of all reading teachers; provides unstructured feedback to teachers after each observation.
1 Beginning School head conducts at least one formal classroom observations to at least one-‐half of all reading teachers, and provides post conference feedback after each observation. School head uses the STAR, SCOPE or other classroom observation tools in observing classroom instruction in reading. Observations are documented and filed for reference.
2 Established School head or his designated master teachers conduct one formal classroom observations to at least two-‐thirds of all reading teachers, and provides feedback session with them using STAR, SCOPE or other classroom observation tools. SP makes use of information to inform other teachers’ instruction in reading.
3 Leading to Excellence
School principal conducts at least 2 classroom observations to all reading teachers and provides formal feedback giving activities after an observation using observation tools like SCOPE or STAR. School principal regularly share to all teachers best practices in the teaching of reading.
9. Support from Stakeholders
Stage Level of Development
Criteria
0 Forming Parents association or local government officials and other stakeholders are aware of the school’s reading program through meetings and orientation. Pledges and support are announced. However, there are no actual materials or financial contributions given by these stakeholders to support the program.
1 Beginning Some parents or local government officials and other stakeholders have provided support to an aspect of the reading program of the school, e.g. training of teachers or parents, or development of instructional devices or allowing children to attend remedial reading activities.
2 Established Parents-‐teacher association, local government officials or other stakeholders have adopted for support some of the components of the reading program– trainings, materials, etc -‐ and have actually provided both material and financial support to its implementation.
3 Leading to Excellence
The parent-‐teacher association, local government units or other stakeholders have adopted and budgeted the school reading program for regular support to many of its components. Results of the program are regularly shared to all stakeholders.

Part 3: Score Sheet for WSRP Assessment Rubrics
Name of School: Name of Principal: District: Division: Number of Teachers: Date of Assessment: Instructions: For “Stage of Development” column, indicate the appropriate number based on the results of your self-‐assessment as follows: 0 – Forming; 1-‐ Beginning; 2 -‐ Established; 3 -‐ Leading to Excellence. Under the “Examples of Best Practices” column, list down at least 3 best practices under each dimension. Under the “Major Implementation Challenges”, list down at least 3 challenges. Please use the back of this page if more space is needed.
Dimensions of Assessment Stage of Dev’t
Examples of Best Practices
Major Implementation Challenges
1. School Reading Improvement Plan (SRIP) in the School Improvement Plan (SIP)
2. Teacher and Administrator Training on Reading Based on Needs Assessment
3. Student Assessments in Reading and Use of Results
4. Strengthening Classroom Reading Instruction
5. Remedial Reading Instruction 6. Enrichment Reading Instruction 7. Instructional materials
development and support
8. Monitoring and Technical Support 9. Support from Stakeholders Overall level of development (total score/9)
Scale of Interpretation of Results:
Scale Stages of Development Description 0-‐0.59 Stage 0 Forming Stage 0.6-‐1.59 Stage 1 Beginning Stage 1.6-‐2.59 Stage 2 Established Stage 2.6-‐3.0 Stage 3 Leading to Excellence Stage

B. Summary of WSRP Schools Self-‐Assessment Ratings, by Division
Overall Level of Development by Division (number of schools) Dimensions Zamboanga
City (8) Isabela City (6)
Cotabato City (3)
Maguindanao 2 (11)
South Cotabato (12)
Saran-‐gani (8)
Sultan Kudarat (5)
Overall By Dimension
Level of
Dev’t
SRIP in SIP 2.0 2.33 2.33 2.18 2.33 2.25 2.0 2.20 ES Teacher Training 2.0 1.83 2.0 1.90 2.17 2.0 2.6 2.07 ES
Student Assessment 2.5 2.33 2.67 2.54 2.5 2.13 2.4 2.43 ES
Reading Instruction 2.37 2.17 2.0 2.18 2.0 1.88 2.2 2.11 ES
Remedial Reading 2.0 2.33 2.67 1.82 2.08 1.88 2.4 2.16 ES
Enrichment Reading 2.0 1.50 2.0 2.0 2.25 1.5 2.0 1.89 ES
Instructional Materials 2.37 2.50 2.33 2.09 2.16 2.5 2.4 2.33 ES
Monitoring & Technical Support
2.12 2.0 2.0 1.64 2.35 2.25 2.4
2.11
ES
Support from Stakeholders
2.0
1.83
2.33
2.0
1.91 2.88 1.8 2.10 ES
Overall Rating by Division
2.15
2.10
2.29 2.03 2.19 2.14 2.24 2.16 ES

ANNEX 2

In observation of National Reading Month, Ms. Gerella’s fourth-grade students read aloud “The Blind Man’s Faith.”
Best Reading School Contest Winners» Pedro C. Dolores Elementary School in Upi, Maguindanao
» Tamnag Central Elementary School in Lutayan, Sultan Kudarat
» Krislamville Elementary School in Cotabato City
» Libi Elementary School in Malapatan, Sarangani
» Panay Elementary School in Sto. Niño, South Cotabato
» Maasin Learning Center in Zamboanga City
» Dumadalig Elementary School in Tantangan, South Cotabato
» Busay Central Elementary School in Isabela City
Whole School Reading Program Update
What Does a Best Reading School Look Like? Words like innovative, creative, and committed
come to mind. For example, at Pedro C. Dolores
Elementary School in Upi, Maguindanao, fourth-
grade teacher Estelita Geralla engages her students
in read-aloud activities to strengthen their oral
reading fluency skills. And second-grade teacher
Mary Ann Prodigo uses colorful visual materials to
help improve her students’ reading comprehension
skills.
At Tamnag Central Elementary School in Lutayan,
Sultan Kudarat, seven remedial reading teachers
work closely with struggling readers in the school’s
reading center. They spend 45–60 minutes a day
tutoring students on reading tasks to help them
become independent readers.
More than half of the 53 schools in the Whole School Reading
Program entered the contest, held by USAID’s EQuALLS2
Project and its partners Petron Foundation and National Book
Store Foundation. Each school submitted photos and lesson
plans of their remedial and enrichment reading activities.
Entries were judged on the quality of teachers’ reading
activities, variety of books and materials, and documented
evidence of promising practices. (continued)
Education Quality and Access for Learning and Livelihood SkillsEQuALLS2
» JANUARY 2013
Best Reading School Contest— Winners Announced
Last November, the Best Reading School Contest was held
to celebrate National Reading Month and to support the
Department of Education’s Every Child a Reader Program’s
(ECARP) goal to highlight the importance of reading.
Eight schools were chosen as winners among the
53 WSRP beneficiary schools.

Ms. Prodigo’s second-grade students work together to create a storyboard.
School Contest Winners (continued)
Contact information:
Marcial Salvatierra, Chief of Party ([email protected]) and Nancy Devine, Project Director ([email protected])
Education Development Center, Inc (EDC) 4th Floor ALCO Building 391 Sen Gil Puyat Ave Makati City 1200 Metro Manila Philippines
Education Quality and Access for Learning and Livelihood SkillsEQuALLS2
EQuALLS2 was launched in July 2006 to increase
access to quality education and livelihood skills in
the Philippines. With specific emphasis on poverty-
and conflict-affected areas of Mindanao, EQuALLS2
targets schools, villages, and municipalities to
strengthen formal and alternative education and to
reintegrate out-of-school youth into the economy.
Each winning school receives a library set containing 500
new and locally published picture books as well as area
mats, tables, and chairs, valued at PhP 60,000.
Whole School Reading Program
The Whole School Reading Program was designed and
implemented by the USAID EQuALLS2 project and
Education Development Center, Inc. (EDC). It is an
in-service teacher training program focusing on
improving the ability of all elementary school teachers
(regardless of grade and subject taught) to teach
reading and develop low-cost instructional reading
materials. To date, the Whole School Reading Program
has trained 945 public elementary school teachers
from 53 schools and reaches more than 38,000
students in Mindanao.
Key Partners: Petron Foundation and National Book Store Foundation
Support from the Petron Foundation (for teacher
training, assessment, and reading materials) and the
National Book Store Foundation (donated library
packages as prizes) have made it possible for the
Whole School Reading Program to explore innovative
ways to motivate and keep trained teachers and
school heads engaged and focused on improving
their students’ reading proficiency.
Jonathan
Text Box
Jonathan
Text Box
Jonathan
DepED
Jonathan
usad
Jonathan
Petron
Jonathan
NBSF
Jonathan
eq2

Whole School Reading Program UpdateEducation Quality and Access for Learning and Livelihood Skills
EQuALLS2
» MARCH 2013
Another LPCES teacher reported this:
Since we started using big books, students showed more interest in
interpreting the story. This practice also improved our students’ attitude
toward English class. They look forward to learning something new
or hearing new stories from another big book. We hear our students
imitate the way we read. It inspires us because it means that we are
able to model fluent reading well. We have become more confident in
teaching reading.
Commercially Produced Books Promote Reading for Pleasure
Students in WSRP schools are able to choose, read, and enjoy a
variety of books thanks to generous donations of materials by
Petron Foundation and National Book Store Foundation. These
EQuALLS2 partners donated locally published storybooks that
include local folktales and legends and stories about Filipino
children and families, as well as some academic content materials
PCDES teacher Ms. Mary Ann Prodigo asks her grade 2 pupil to sequence the events and retell the story using the pictures she prepared for her class.
Interesting and Varied Reading Materials Enhance Reading Instruction
It’s no surprise that students respond well to having
appropriate books to read and that teachers find
instruction is more effective when they have a range
of instructional materials to use. The Whole School
Reading Program (WSRP) helps teachers develop
their own materials, such as big books, as well as use
donated books more effectively.
Teacher-Made Materials Are Effective
Teachers at the rural Pedro C. Dolores Elementary School
(PCDES) in Upi, Maguindanao, reported that previously
they primarily used the chalkboard, flash cards, and
pictures. As part of the WSRP, they have developed
additional and more creative instructional materials,
such as big books, word walls, and word families,
wheels, and charts. Says one teacher: “Teaching is now
less stressful. Our pupils became more attentive, more
actively engaged in group activities, and excited to learn.”
At Lun Padidu Central Elementary School (LPCES) in
Malapatan, Sarangani, colorful instructional materials
motivate students, who listen more attentively and are
more eager to read. Informal assessments by teachers
indicate that students’ comprehension is improving.
For example, as one LPCES teacher explains:
Most of my learners are visual-auditory. Whenever I use
well-prepared instructional materials, I can see that my
students are learning better. They have better retention of
the lesson because they associate the concepts with the
pictures in the big book.

Students reading donated books.
Education Quality and Access for Learning and Livelihood SkillsEQuALLS2
EQuALLS2 was launched in July 2006 to increase
access to quality education and livelihood skills in the
Philippines. With specific emphasis on poverty- and
conflict-affected areas of Mindanao, EQuALLS2 targets
schools, villages, and municipalities to strengthen
formal and alternative education and to reintegrate
out-of-school youth into the economy.
Education Quality and Access for Learning and Livelihood Skills
Contact information:
Marcial Salvatierra, Chief of Party ([email protected]) and Nancy Devine, Project Director ([email protected])
Education Development Center, Inc (EDC) 4th Floor ALCO Building 391 Sen Gil Puyat Ave. Makati City 1200 Metro Manila Philippines
in English and Tagalog. In addition, U.S.-produced materials
provided by another EQuALLS2 partner, the Brothers Brother
Foundation, expand the range of reading materials available
to students, such as big books, audio books, and reading and
language worksheets.
Whether for remedial reading or enhancement purposes,
donated materials create a classroom environment that
promotes a culture of reading. Students have easy access to
books to read for pleasure during independent reading time
and to strengthen their skills during daily reading enrichment
periods, and teachers have new materials to use for classroom
reading instruction.
Whole School Reading ProgramThe Whole School Reading Program was designed and
implemented by the USAID EQuALLS2 project and Education
Development Center, Inc. (EDC). It is an in-service teacher
training program focusing on improving the ability of all
elementary school teachers (regardless of grade and subject
taught) to teach reading and develop low-cost instructional
reading materials. To date, the Whole School Reading
Program has trained 945 public elementary school
teachers from 53 schools and reaches more than 38,000
students in Mindanao.
Key Partners: Petron Foundation and National Book Store FoundationSupport from the Petron Foundation (for teacher training,
assessment, and reading materials) and the National Book
Store Foundation has made it possible for the Whole School
Reading Program to explore innovative ways to motivate and
keep trained teachers and school heads engaged and focused
on improving their students’ reading proficiency.

Using Text Messages to Support Teachers
Education Quality and Access for Learning and Livelihood SkillsEQuALLS2
» MAY 2013
saying that they felt that support via text messages was beneficial.
Of the teachers surveyed, all owned their own cell phone and used
SMS frequently, and 95 percent felt that SMS was a good method for
learning and training in general. Almost the same percentage (94)
responded that SMS is a good way to provide technical support to
teachers, and an equally high percentage found the text messages
sent by EQuALLS2 to be useful.
Linked messages
A follow-up on SMS activity in March 2013 tested sending a series
of linked, on-demand, thematic messages. Teachers could ask
for additional information, tips, or activities by requesting more
information via SMS.
Dr. Janet A. Rio, a master teacher and reading trainer from South Cotabato Division from the Philippines, receives a tip on teaching reading through a SMS message.
mLearning
In early 2013, the EQuALLS2 project in the Philippines
initiated a pilot with teachers in the Whole School
Reading Program (WSRP), to test the feasibility of
using Short Message Service (SMS) or text messages
to supplement face-to-face technical support for
improving reading instructional practices. Between
January and March, 870 WSRP teachers received text
messages that highlighted key topics in teaching
reading and writing, including developing fluency,
strengthening vocabulary, asking questions to develop
comprehension, and encouraging independent writing.
The messages were based on materials and activities
used in WSRP training sessions. A total of 11,310
messages were sent by EQuALLS2 with the FrontlineSMS
text messaging system during the 2nd quarter of 2013.
Through this short pilot, EQuALLS2 hoped that
teachers would be supported via text messages as
they incorporated best teaching practices into their
daily classroom activities. We also wanted to test a way
for projects like EQuALLS2 to measure usage of SMS
by tracking requests for more content, and to gather
examples of best practices in teaching reading self-
reported via SMS.
Mobile technology survey
EQuALLS2 conducted a technology usage survey
with 100 of the teachers who participated in this pilot
activity. When asked about technical support by mobile
phones, 95 percent of teachers responded positively,

Education Quality and Access for Learning and Livelihood SkillsEQuALLS2
EQuALLS2 was launched in July 2006 to increase
access to quality education and livelihood skills in the
Philippines. With specific emphasis on poverty- and
conflict-affected areas of Mindanao, EQuALLS2 targets
schools, villages, and municipalities to strengthen
formal and alternative education and to reintegrate
out-of-school youth into the economy.
Education Quality and Access for Learning and Livelihood Skills
Contact information until June 30, 2013:
Marcial Salvatierra, Chief of Party ([email protected]) and Nancy Devine, Project Director ([email protected]) Contact information after June 30, 2013:
Gustavo Payan, Project Director ([email protected])
Education Development Center, Inc (EDC) 4th Floor ALCO Building 391 Sen Gil Puyat Ave. Makati City 1200 Metro Manila Philippines
During story reading, draw the students’ attention to picture cues from the book that can help them answer your recall and prediction questions.
Each text message series focused on one best teaching
technique with supporting tips (one tip per SMS, with multiple
SMS messages). The messages also featured sample classroom
activities for teachers and feedback assessments by SMS to
learn if teachers were able to apply this information in the
classroom. These linked messages show promise as a relevant
and useful way to support teachers. A longer pilot is needed
to better understand how best to develop the themes and
the linked messages so that they meet the needs of teachers
engaged in improving reading skills of their students.
Next Steps
By late May 2013, DepEd Division staff will receive training in
the installation and usage of FrontlineSMS and take part in
a writing workshop to develop a bank of text messages to
use during the coming school year. This training will ensure
that staff will have the capability to continue to support the
improvement of reading instruction via text messages to all
teachers in their division.
Whole School Reading Program
The Whole School Reading Program was designed and implemented by the USAID EQuALLS2 project and Education Development Center, Inc. (EDC). It is an in-service teacher training program focusing on improving the ability of all elementary school teachers (regardless of grade and subject taught) to teach reading and develop low-cost instructional reading materials. To date, the Whole School Reading Program has trained 945 public elementary school teachers from 53 schools and reaches more than 38,000
students in Mindanao.
Sample text message: Questioning helps you know if students understand what
they read. A skillful teacher asks questions that help learners move beyond rote learning and develop higher
order thinking skills. Asking questions is an art. Want to know more? Type MORE and reply.

ANNEX 3

Case Studies of Two Schools in Mindanao
EQuALLS2December 2012
EQuALLS2 Whole School Reading Program:

1 | P a g e
Education Development Center, Inc.
EQuALLS2 Whole School Reading Program: Case studies of two schools in Mindanao
December 2012

2 | P a g e
TABLE OF CONTENTS
Introduction 3
Overview of the Whole School Reading Program 4
Whole School Reading Program Research Overview 5
Case Study Methodology 6
Case Study 1: Pedro C. Dolores Elementary School 7
Case Study 2: Lun Padidu Central Elementary School 16
Synthesis of the Case Studies 27
References 31
Annexes
Annex A: School Reading Improvement Plan 32
Annex B: Whole School Reading Program Analytical Framework 34
Annex C: Design of the Case Study 36

3 | P a g e
INTRODUCTION
In 2011, the Education Quality and Access to Learning and Livelihood Skills Phase 2 (EQuALLS2) Project piloted the Whole School Reading Program (WSRP) in which all teachers, regardless of subject and grade (from 1 to 6), focused on improving their own English reading skills and those of their students. Based on the positive assessment results of the pilot implementation,1 the Project expanded the reach of WSRP from 9 schools during the pilot phase to 53 schools for the 2012–13 academic year. Expected to benefit from improved teaching of English and reading are 900 teachers and school administrators and 35,000 students from three of the most challenged Mindanao regions in terms of education performance. Results of the Philippine Informal Reading Inventory (Phil-‐IRI)2 conducted in 53 schools in July 2012 (see Table 1) show that 85 percent of grade 1 students were non-‐readers and that more than 90 percent of students in all other grade levels in these schools are at the “frustration” level, meaning that they are reading below their grade level. TABLE 1. Reading performance of schools covered by the WSRP Grade Frustration Instructional Independent Non-‐
Reader 1 15% 0% 0% 85% 2 99% 0% 1% 0% 3 96% 1% 3% 0% 4 92% 2% 6% 0% 5 94% 3% 2% 0% 6 91% 2% 7% 0%
The 2012–13 WSRP focuses on moving students out of the frustration category by improving the capacity of teachers to teach English and by increasing students’ ability to read at grade level. Through the WSRP, EQuALLS2 is working with the Philippine Department of Education (DepED) to develop a model for educator professional development in English proficiency and reading instruction that can be potentially replicated in support of DepED’s Every Child a Reader Program.
1 See EQuALLS2 Learning Series #5 and #12 http://www.equalls2.com/resources 2 The Philippine Informal Reading Inventory identifies three levels of readers: frustration, instructional (reading at grade level), and independent. Frustration-‐level readers are those who are struggling; they withdraw from reading activities and cannot read fluently or with comprehension. Non-‐readers are those who are unable to recognize and sound out letter-‐sound connections for single consonants and for some consonant blends; to blend consonants and vowels in simple one-‐word patterns; or to distinguish among long and short vowels that follow rules. For more information, go to http://www.phil-‐iri.com/about.php.
This report examines emerging results from enhancements in the practices of two schools in the eight components of the Whole School Reading Program. It identifies the challenges that teachers and administrators face in their efforts to address students’ learning needs, particularly those who are not reading at their grade level.
4 | P a g e
This report describes in depth the instructional practices of two participating WSRP schools that are demonstrating initial results from the application of improved reading instruction strategies: (1) Pedro C. Dolores Elementary School in Upi, Maguindanao, in the Autonomous Region in Muslim Mindanao, and (2) Lun Padidu Central Elementary School in Malapatan, Sarangani Province, in Region 12. These case studies are part of the research designed to describe the outcomes of the WSRP on teaching quality and student achievement in reading. The studies examine the practices of each school and identify the challenges faced by teachers and administrators as they strive to address the learning needs of students who are not reading at grade level. The following sections provide a summary of the components of the WSRP and an overview of the research design as background to understanding the case study findings.
OVERVIEW OF THE WHOLE SCHOOL READING PROGRAM
The WSRP is a school-‐based program designed to strengthen teachers’ skills in teaching reading in order to improve students’ decoding, fluency, and comprehension skills. It involves the school administrators and all English, science, and math teachers at all grade levels (1–6) in a series of activities focused on building reading, writing, listening, speaking, and literacy skills in English classes, and further reinforcing these skills in math and science classes. The program’s eight key components are summarized in Table 2. At the core of the WSRP approach is the preparation of a School Reading Improvement Plan, a practice introduced by EQuALLS2 for schools to commit to a year-‐long reading program implementation. The School Reading Improvement Plan features the school’s planned activities regarding each component of the WSRP. The school principal leads the planning process. Teachers contribute to the planning process by providing input on the school’s overall and specific goals and by specifying strategies and a time frame for executing each component. To ensure budget and institutional support, the School Reading Improvement Plan is integrated into the School Improvement Plan. TABLE 2. Components of the WSRP
WSRP implementation started in April–May 2012 with a multi-‐day training for teachers and administrators in evidence-‐based reading instructional practices and administration of a survey of
Teacher and administrator training Courses on Learning to Read, Reading to Learn, Reading-‐Writing Connection
Student assessment Training of administrators and teachers to use assessment tools to diagnose students’ reading skill Monitoring the administration and implementation of reading related assessments Strengthening classroom reading instruction Explicit instruction on phonics, phonemic awareness, word recognition, vocabulary development, fluency, and reading comprehension, and integrating these strategies in teachers’ daily lesson plan on reading Remedial reading instruction Structured instruction for non-‐readers and frustrated readers in all grades Enrichment reading instruction Structured instruction for instructional and independent readers in all grades Instructional materials development Provision of materials to support student assessments, and mainstream, remedial, and enrichment reading instruction Monitoring and technical support Regular monitoring and technical support by DepED administrators to implement the reading program Use of the Standard Classroom Observation Protocol for Education (SCOPE) tool for literacy instruction Support from stakeholders School-‐initiated activities to generate parent involvement and support from LGUs and PTAs on the school’s reading initiatives

5 | P a g e
teachers’ beliefs and attitudes about teaching reading. As a culminating activity of this initial training, school teams developed their School Reading Improvement Plans. In July, students in the WSRP schools took the Phil-‐IRI test, in line with DepED’s national directive, and a sample of students took the Early Grade Reading Assessments (EGRA). A sample of teachers was observed using the Standard Classroom Observation Protocol for Educators for Literacy (SCOPE-‐Literacy). In the period between June and October 2012, School Reading Improvement Plans were implemented, teachers put into practice new instructional strategies, and support was provided by EQuALLS2 field staff and DepED supervisors. In October 2012, teachers and administrators participated in a second training event that focused on instructional materials development and reading-‐writing connections, geared at improving students’ reading comprehension skills. A final round of observations and assessments will be conducted before the end of the 2012–13 academic year.
OVERVIEW OF THE RESEARCH
The WSRP analytical framework (outlined in Annex A) assumes that three key components will contribute to improvements in students’ reading skills and student achievement:
• Teachers’ classroom application of skills and competencies needed for students to become autonomous readers and competent writers
• DepED administrator supervision and support • The provision of books for teaching and learning
Since the WSRP is only a 10-‐month program, it is expected to achieve only the short-‐term and immediate outcomes reflected in the framework. To document these achievements and outcomes, a pre-‐post evaluation design3 augmented by case studies was implemented to do the following:
• Examine changes in teaching quality and student achievement in grades 1–3 • Assess changes in teachers’ beliefs and attitudes about teaching reading • Compare students’ reading levels in intervention schools with students’ reading levels in
comparison schools, using the EGRA A cohort study is following the progress of the same group of teachers and students in WSRP or intervention and non-‐WSRP or comparison schools across the one school-‐year study period, using a set of student assessments (Phil-‐IRI and EGRA), teacher observations (SCOPE), and a teacher survey. Case studies will contribute to a fuller understanding of how teachers apply new instructional strategies to the teaching of reading; further document the outcomes of teacher training, instructional materials development, administrator support, provision of books, and other WSRP components; and highlight challenges and emerging best practices. Table 3 describes the timing of data collection activities.
3 A full description of the WSRP research design is available on request. The final research report will be available in June 2013.

6 | P a g e
TABLE 3. WSRP Training and Data Collection Timetable
May 2012
June July Aug. Sept. Oct. Nov. Dec. Jan. 2013
Feb. March
Teacher beliefs survey (pre)
Teacher beliefs survey (post)
Teacher training I Teacher training II
Case studies
SCOPE (pre)
SCOPE (post)
Phil-‐IRI (pre)
Phil-‐IRI (post)
EGRA (pre)
EGRA (post)
CASE STUDY METHODOLOGY
Case studies contribute to a deeper understanding of an event, program, organization, time period, or critical incident. Using structured data collection methodologies (such as observations, interviews, and focus group discussions), a case study tells a story or describes a situation in depth and detail, holistically and in context. Analysis of the resulting data identifies themes and patterns that enhance understanding of the event, program, etc. (Merriam, 1998; Patton, 2002; Ryan and Bradley, 2009). Within the overall WSRP research, a design for case studies was developed to document emerging best practices and to describe how the various components of the WSRP are contributing to outcomes. Protocols were developed for gathering qualitative data through focus group discussions (FGD) and key informant interviews (KII) with teachers and administrators to better understand the findings of the teacher beliefs survey and student reading assessment tools. Questions related to fidelity of implementation (e.g., adherence to WSRP design, program content, quality of delivery) were embedded in the FGD and KII tools. The key questions that guided the development of the case study protocols are found in Annex B.
Data-‐gathering for the case studies was planned to take place midway through the academic year, giving teachers time to incorporate new instructional practices and to benefit from ongoing technical assistance provided by DepED supervisors and WSRP Project Officers (who conduct regular school monitoring visits).
Selection of Case Study Sites
WSRP Project Officers were asked to nominate schools from each region for the case study, using the following criteria:
• The school must have indications of progress or emerging positive results brought about by the implementation of the school improvement plan.
• The school must be accessible, in order to facilitate ease of data-‐gathering and documentation. • The school must have at least one teacher who was randomly selected to be part of the sample
for the research study and who was observed for SCOPE-‐Literacy4 baseline data-‐gathering.
4 The Standards-‐Based Classroom Observation Protocol for Educators (SCOPE) Literacy tool is an EDC-‐developed assessment that has been adapted for use in the Philippines.
7 | P a g e
Data Collection
The researcher and an assigned Project Officer conducted a three-‐hour focus group discussion in each school to gather descriptive information. The principal, a representative from each grade level, and a remedial reading teacher participated in the discussion. The Upi district English supervisor and the Sarangani division English coordinator also participated in the focus group discussions. The following questions were asked relative to each of the eight components of the WSRP (listed in Table 2):
• What were teachers’ practices for teaching reading in the previous school year? • How have these practices changed after WSRP training? • What are the emerging results of the practices? • What do schools identify as their greatest challenges in implementing their School Reading
Improvement Plan? Observations of three reading classes, one each for grades 2, 3 and 4, were conducted in each of the schools. In addition to the regular reading classes, at Lun Padidu Central Elementary School the team observed a 30-‐minute remedial reading class. At both schools, the researcher, Project Officer, and principal conducted the class observations using the SCOPE-‐Literacy tool. Following the observation, the research team conducted a brief meeting with the principal (and, at Lun Padidu, with the division English coordinator) to compare observations and give feedback. Observations and reports made by Project Officers on the progress of the School Reading Improvement Plan’s implementation were used as additional information for the case studies. The resulting data have some limitations. The results of the Phil-‐IRI and EGRA post-‐tests and gains in student achievement at the end of the school year, which are not yet available, will provide quantitative results that may contribute to a more holistic picture of the school’s efforts to improve reading. Soliciting the perspectives of a representative sample of students to validate teachers’ observations was not done due to time constraints. A further limitation is that while focus group discussions included a teacher from each grade level, teachers from the upper grades were not included in classroom observations of instructional practices and materials use. The following sections present the detailed findings on the two schools.
CASE 1: PEDRO C. DOLORES ELEMENTARY SCHOOL: BUILDING BLOCKS FOR READING
The Autonomous Region in Muslim Mindanao (ARMM) has one of the lowest education performance levels in the country. During the school year 2011–12, the mean percentage scores of ARMM grade 3 and grade 6 students for English in the National Achievement Test (NAT) were 51.36 and 56.77 respectively, compared to the national averages of 54.42 and 51.8.5 While the ARMM grade 6 NAT mean percentage score was higher than the national average, it was still considerably below the passing mark of 75. Pedro C. Dolores Elementary School (PCDES) is located in a rural village, Barangay Nangi in Upi, Maguindanao, one of the most vibrant and progressive municipalities in the ARMM. The school, which currently enrolls 485 students, is able to reach most of the school-‐age children in the village. Enrollment rates ranged from 80 to 97 percent in the last five years. The average class size is 37 students, and the 5 DepED, National Education and Testing Research Center. 2011–2012 NAT Performance: National Achievement Test Results. Retrieved from http://netrc.sysportal.net/HomePage.aspx

8 | P a g e
TABLE 4. Profile of PCDES teaching staff
Characteristic Value Number of teachers 12 Master Teacher 1 Teacher III 3 Teacher I 7 Volunteer teacher 1 Male 0 Female 12 Mean number of years of teaching
16
current student-‐to-‐textbook ratio is 3:1. PCDES has been a target school of the USAID-‐EQuALLS2 Project since 2006. The PCDES principal leads the school’s staff of 12 female teachers. Seven of the teachers have bachelor’s degrees, and three have either post-‐graduate units or at least 20 years of service in the position (see Table 4). The school is demonstrating progress toward its vision of producing pupils who are literate, responsible, and disciplined, but it continues to face significant challenges. In the last five years, PCDES was able to increase its mean percentage score in the National Achievement Test in English from a very low 27.6 percent in 2007–08 to 57.4 percent in 2011–12. Based on 2011–12 data, of the 482 students tested in the Phil-‐IRI, 116 (24 percent) were non-‐readers, 48 (10 percent) were reading at their level, and 318 (66 percent) were at the frustration level. The situation improved slightly this school year, as shown in Table 5. At the beginning of the 2012–13 school year, the school had very few non-‐readers, and a relatively higher percentage of students progressed to the instructional level. However, the majority of the students remain at the frustration level.
Interventions Contributing to Reading Improvement at PCDES
What WSRP interventions did the school adopt, and what were the results? To respond to these questions, each component of the WSRP is discussed below, using data from the focus group discussion and classroom observations. Teacher and Administrator Training
As an EQuALLS2-‐assisted school for five years, PCDES has offered various training activities focused on strategies for teaching English to its teachers. Teachers acknowledge that they have developed appropriate instructional materials as a result of the many training activities they have attended. PCDES teachers shared that the WSRP training added to their array of teaching strategies and reading assessment tools, and reinforced the importance of explicit instruction of the five essential reading skills (phonemic awareness, decoding and word recognition, vocabulary knowledge, fluency, and reading comprehension). More importantly, they viewed lesson plan preparation and demonstration teaching as the elements of the training that helped them the most. These elements provided tangible templates and models for teachers to structure the numerous and varied teaching strategies that they have gained from DepED in-‐service and EQuALLS2 teacher training programs. These results, as expressed by teachers during the focus group discussions, are summarized in Table 6.
TABLE 5. Reading performance of PCDES, 2012–13 Phil-‐IRI pre-‐assessment
Grade Frustration Instructional Independent Non-‐
Reader 2 85% 14% 1% 0% 3 95% 3% 1% 1% 4 85% 15% 0% 0% 5 93% 7% 0% 0% 6 94% 5% 0% 1%

9 | P a g e
TABLE 6. Teacher-‐reported results from WSRP training compared to previous school year Previous School Year (2011–12) With WSRP (2012–13)
1. Training Activities
Beneficiary of various EQuALLS2 teacher trainings on English, science, and math, with a total of 3.31 training days per teacher per year6
WSRP five-‐day summer training institute focused on strategies for learning to read and reading to learn, and three-‐day enrichment training focused on reading-‐writing connections and lesson planning, with a total of eight training days per teacher for the year
2. Results • Developed strategies for teaching English and reading, such as teaching phonemic awareness
• Developed appropriate instructional materials
• Learned how to integrate reading into other subject areas, but were left mostly on their own to apply this learning in teaching
• Enhanced their teaching strategies in the five essential reading skills
• Used more varied instructional materials more appropriately in teaching reading
• Learned how to conduct Phil-‐IRI correctly and learned about other tools for assessing students’ progress in reading
• Applied the lesson plan preparation and demonstration teaching offered during the trainings, which showed explicitly how the reading strategies are to be applied in the classroom
Some of the changes in teachers’ knowledge and attitudes can be gleaned from their testimonies. For example:
We already have sufficient information about teaching strategies and how to make instructional materials but now, we know better how to apply these strategies and materials for teaching the five basic reading skills. We realize that we were already doing many of the strategies, but we did not know how they fit. Now the pieces are coming together. We learned in previous training that we should integrate reading in all subject areas, but teachers were on their own to figure out how to apply this in our daily lessons. We are now more confident to teach because we now have a clear direction.
The PCDES principal participated in the WSRP training with the teachers, and she shared the teachers’ observations, adding, “Teachers are now using more varied instructional materials, and they are maximizing the time allotted for the subject.” She shared the teachers’ views ahead:
Consistency in applying what we have learned from the training, and availability of resources as well as time for making instructional materials, are our greatest challenges.
Going forward, the principal committed to more frequent monitoring and supervision, while teachers will take the same actions they have done in previous years, such as using indigenous materials and even their personal funds to make instructional materials, and putting in extra time to cope with many other school activities.
6 From the EQuALLS2 Life of Project Report, December 30, 2011. http://www.equalls2.com/resources

10 | P a g e
Ms. Mary Ann Prodigo asks her grade 2 pupil to sequence the events and retell the story using the pictures she prepared for her class.
Strengthening Classroom Reading Instruction and Instructional Materials Development
WSRP focuses on developing teachers’ proficiency in teaching the five essential reading skills and in developing students’ writing skills as one way to improve reading. Teachers apply the concepts learned in training by preparing lesson plans that integrate the teaching of reading skills into pre-‐reading, reading, and post-‐reading activities. In this approach, explicit instruction of reading is supported by appropriate instructional materials. Activities are student-‐centered, and students are also engaged in authentic writing exercises. One trait of PCDES that has contributed to its progress is that teachers consistently apply the best of systems and strategies that are introduced by DepED and other programs. Teachers prepare detailed lesson plans instead of daily lesson logs, as practiced in other schools, using as references the DepED Maguindanao Reading for Beginners Made Easy (RBME), a compilation of lesson plans for teaching English for grades 1–3; the DepED national teachers’ manual; lesson guides from the Third Elementary Education Program (TEEP) and the Basic Education Assistance for Mindanao for all grade levels; and workbooks introduced by the EQuALLS2 implementing partner. PCDES teachers have a good foundation, and to an extent, they are already on track with their strategies in phonemic awareness and word recognition for grade 1 and 2 beginning readers. However, according to the teachers, “Most of our students can read, but they cannot comprehend.” This is not surprising, considering that the way reading was taught previously did not provide ample opportunities for developing comprehension (see Table 7).

11 | P a g e
TABLE 7. Some strategies used by PCDES teachers in teaching reading skills, in previous school year and with WSRP Previous School Year (SY 2011–12) With WSRP (SY 2012–13) Grade 1 • Phonemic awareness: Letter sounds, followed by
word recognition • Decoding: Dolch sight words; Fry phrases • Reading comprehension: Teacher reads the story • Writing: Copying text
• Phonemic awareness: Letter name and letter sounds; blending of letter name and sound
• Decoding: Dolch sight words; Fry phrases; other high-‐frequency words
• Reading comprehension and fluency: Teacher models fluent reading; reading by pupils
• Writing: Writing simple sentence Grade 2 • Phonemic awareness: Sounding out letter sounds
• Decoding: Dolch sight words; Fry phrases • Vocabulary: Using context clues • Reading comprehension: Teacher reads the story • Fluency: Teacher models fluent reading, but only
sometimes • Writing: Copying text
• Phonemic awareness: Letter name and letter sounds; blending of letter name and sound
• Decoding: Dolch sight words; Fry phrases; other words • Reading comprehension and fluency: Teacher models fluent reading; reading by pupils
• Writing: Original writing of simple sentences
Grade 3 • Phonemic awareness: Sounding out letter sounds • Decoding: Dolch sight words • Reading comprehension: Teacher reads the story • Fluency: Students encouraged to read from various materials
• Writing: Copying text
• Phonemic awareness: Letter name and sound and blending
• Decoding: Direct reading of words • Vocabulary: Use of sight words; text talk; synonyms and antonyms
• Reading comprehension and fluency: Teacher models fluent reading; asks three levels of questioning; word mapping; KWL chant
• Fluency: Students encouraged to read from various materials
• Writing: Authentic writing; use of prompts Grade 4 • Phonemic awareness: Read the words without
sounding the letters • Decoding: Dolch sight words • Vocabulary: Teacher gives the meaning • Reading comprehension: Teacher reads the story • Fluency: Students encouraged to read from various
materials • Writing: Copying text
• Phonemic awareness: Sounding the letters to read the words
• Decoding: Added more time • Vocabulary: Context clues; synonyms and antonyms;
suffixes and prefixes • Reading comprehension and fluency: Teacher models
fluent reading and asks three levels of questioning • Writing: Authentic writing in the first section of the
grade; using of prompts in lower sections Grade 5 • Phonemic awareness and decoding: Reading the
words only • Vocabulary: Teacher gives the meaning right away • Reading comprehension and fluency: Teacher does most of the reading and, after three pupils can’t give the right answer, gives the answer to questions
• Writing: Copying text
• Phonemic awareness: More time and focus on the letter sound
• Decoding: All pupils are given the opportunity to read • Vocabulary: Done in all parts of teaching as needed • Reading comprehension: Added more activities for pupils and ask different levels of questioning
• Fluency: Teacher models fluent reading; pupils read after the teacher; use of jazz chants and songs
• Writing: Original writing is encouraged using prompts Grade 6 • Reading comprehension: Oral or silent reading of
stories • Vocabulary: Using word in sentences • Writing: Copying text
• Fluency: Teacher models fluent reading • Reading comprehension: More activities for pupils and
different levels of questioning were added • Writing: Authentic writing

12 | P a g e
One teacher shared the following:
Before, we do most of the reading and the questions we asked were mostly literal questions, but from the WSRP training we learned that we should give more time for students to read and ask not only literal but higher level questions as well.
The changes in teachers’ practices to improve comprehension are reflected in their enhanced lesson plans and more effective delivery of the lesson (see box for excerpts from a classroom observation). One teacher added:
After the WSRP training, our lesson plans have become more structured and organized. We continued to use the RBME and TEEP lesson plans, but we have now enhanced these plans with strategies to develop the five reading skills. We have incorporated pupil-‐centered activities and colorful materials at pre-‐reading, during reading and post-‐reading stages.
In previous school years, teachers mostly used the chalkboard, flash cards, and pictures. With WSRP, teachers have developed additional and more creative instructional materials, such as big books, word walls and word families, wheels, and charts. Teachers are just beginning to use their enhanced lesson plans. The integration of authentic writing still needs to be improved since teachers continue to equate writing with copying texts (see the same excerpt). Nevertheless, teachers have been encouraged by the positive results of using well-‐prepared lesson plans and creative materials. One of the upper grade teachers who are responsible for developmental reading instruction remarked:
Teaching is now less stressful. Our pupils became more attentive, more actively engaged in group activities and excited to learn.
PCDES teachers recognize that preparing integrated lesson plans and quality instructional materials is
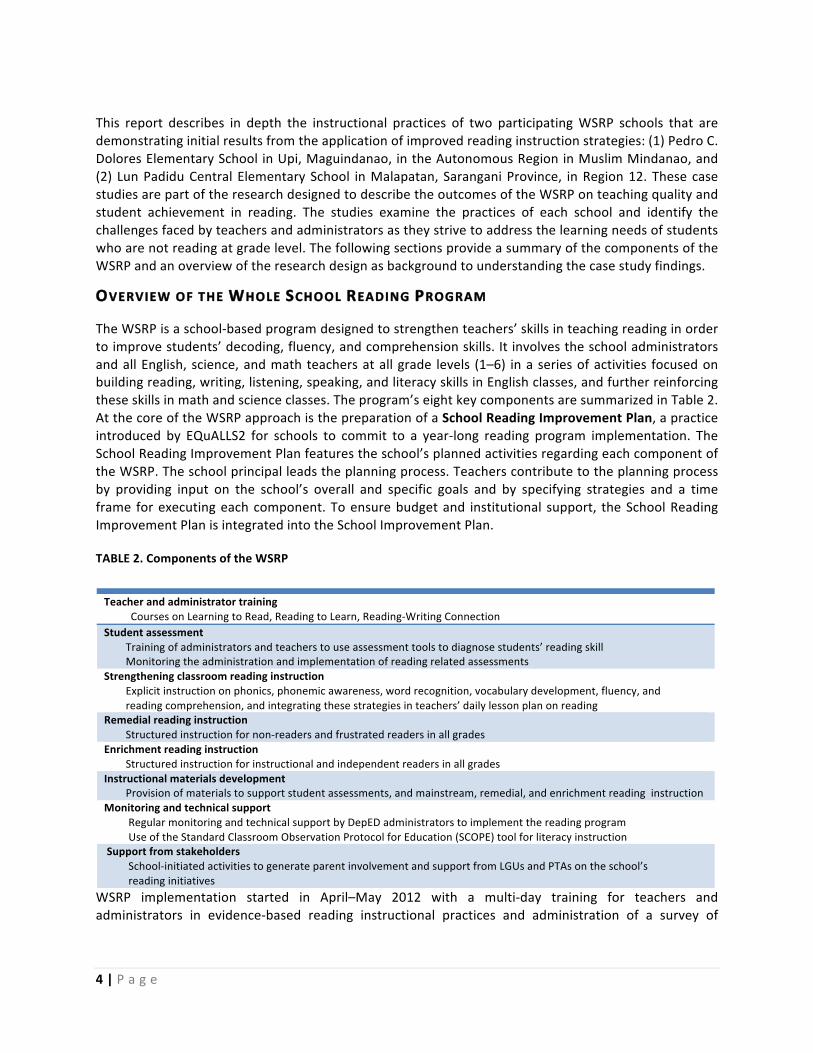
Ms. Peru wastes no time in starting up her grade 3 class. The lesson begins immediately, with the word of the day and phonemic awareness drills incorporated into the opening greetings. In unison, the grade 3 students say, “Good morning. teacher, good morning, classmates, good morning, visitors. Phonics—P-‐h-‐o-‐n-‐i-‐c-‐s—Phonics.” The students then sing an alphabet song, complete with the letter sound, the letter name, and a word beginning with that letter. The objectives of Ms. Peru’s lesson for the day are for students to identify the main idea of a selection, the poem One Big Nation, and to express their opinions on issues taken from the poem. The lesson plan and the poem were directly lifted from RBME, but Ms. Peru enriched her delivery of the lesson by integrating the teaching of the five essential reading skills. As part of her pre-‐reading activities, she asks students to spell words from the selection—nation, unity, share, arching, varied—and uses context clues for students to derive meaning and develop their vocabulary. To motivate her students, she asks: What is your dialect? How many dialects do you know? Do you know that many dialects are spoken in our country? She recites the poem first with fluency and asks students to do the same in unison and in groups after her. She checks whether her pupils understand the poem by asking students to select the best answer to a short test consisting of literal as well as interpretive questions, such as Who is speaking in the poem? What dreams do Filipino children have in common? How may we have unity and peace in the country? After reading, the class breaks into groups, and each group acts out the poem. In the discussion after the group presentations, the teacher continues to engage students in deepening their understanding of the poem by asking different levels of questions: Who are the little folks in the poem? What does “blue arching sky” refer to in the poem? If you were going to choose a dialect, what will it be and why? What do you think will happen if we speak different languages at the same time? In line with the lesson’s objective for writing, which is for students to follow the correct form of cursive writing, the teacher asks the students to copy a short paragraph on a topic related to the poem. Ms. Gladys Peru asks her students an inferential question about the poem.

13 | P a g e
time consuming, but they believe that, as a school, they will be able to address this challenge. The school English coordinator (who is also a fifth-‐grade teacher) is thinking ahead and looking for ways for teachers to have devoted time for lesson planning. She is planning to compile enhanced lesson plans as a ready reference for English teachers in the coming school years. To do her part as the administrator, the principal committed to ensuring that future school resource mobilization activities will prioritize assistance for the development of instructional materials, particularly big books. Remedial Reading Instruction
One of the goals of PCDES is to strengthen remedial reading instruction to address the high number of frustration-‐level students in the school. To determine their students’ reading levels, teachers select grade-‐appropriate materials and administer the DepEd Monitoring Report on Reading, an oral reading test, to all incoming students during enrollment. This practice provides the teachers with advance information for planning remedial reading classes. In addition to the oral reading test, the school conducts the DepED-‐mandated Phil-‐IRI as a standard tool for determining students’ reading levels at the beginning and end of the school year.7 All PCDES teachers handle remedial reading sessions. During the previous school year, the time allotted for remedial reading was quite variable. Pull-‐out sessions for non-‐readers were handled by the principal or the English coordinator. As a result of involvement with WSRP, during this school year, all remedial reading sessions are mainstreamed and conducted by all teachers daily at a specific time and with a fixed duration (see Table 8). Teachers use the same materials, such as Dolch sight words, Fry phrases, flash cards, and pictures, that they use in their regular classes to reinforce instruction in phonemic awareness and word recognition, especially for the lower grade levels. Unlike most other WSRP schools, PCDES is not using the Rapid Assessment of Reading Skills (RARS)8 for tracking and documenting the progress of students in remedial reading classes, but the school plans to do so in the coming school year. For the lower grades, teachers currently use their own assessment of their students. They record the number of students demonstrating ability to read at their level using the DepED Monitoring Report on Reading, which they submit to the district. For grades 4 to 6, the school uses a Speed and Comprehension Test. Results of these tests are validated by the Phil-‐IRI test administered toward the end of the school year. PCDES teachers describe their experience on remedial reading instruction as very challenging. One teacher reported:
We have to constantly motivate our students to attend remedial reading classes. We want to help our students, but being in a remedial reading class seems to result in [an] inferiority complex among them. Compounding our problem with our struggling readers is absenteeism. Many of our pupils have to work in their farms with their parents, or help
7 Note: For school year 2012–13, the Phil-‐IRI is not administered to grade 1 students because of the mother tongue-‐based multi-‐lingual instruction mandated by national DepED. 8 RARS is a word recognition test developed by EDC to quickly assess students’ approximate reading levels.
TABLE 8. Time and duration of daily remedial reading classes at PCDES, 2012–13
Duration Time Grade 1 30 min. 11–11:30 a.m. Grade 2 30 min. 11–11:30 a.m. Grade 3 35 min. 10:55–11:30 a.m. Grade 4 35 min. 3:40–4:15 p.m. Grade 5 35 min. 3:40–4:15 p.m. Grade 6 20 min. 11:25–11:45 a.m.

14 | P a g e
with house chores. Another problem is that some of our pupils’ parents cannot read, and are unable to help their children with their school work.
Teachers plan to revive their practice of conducting regular parenting sessions to support their remedial reading classes. For example, one session trained parents to produce the letter names and letter sounds, enabling parents to directly help their children with reading. Teachers also recognize that they need to have a tool for tracking their students’ progress. They are committed to using RARS and documenting the results in the coming school year. Enrichment Reading Instruction
Although enrichment reading instruction is not indicated as an activity in its 2012–13 School Reading Improvement Plan, PCDES still conducts these classes. Says the principal:
We agree with what we learned in the WSRP training—that all students should be given equal attention in reading. During the previous years, we did not hold enrichment reading classes. More advanced students were left on their own while the remedial reading classes were going on.
Since only a few students are at the instructional level and all teachers are handling remedial reading, enrichment reading classes are done mainstream, side by side with remedial reading. Students in enrichment reading usually work on their own in small groups. The school still needs assistance to devise a plan for developing students’ higher-‐level comprehension, critical thinking, and writing skills. In terms of the materials used, more advanced children in the lower grades are given the same time as those in the remedial session to read stories and poems, do puzzles, work on charts, and use flash cards. Grade 4, 5, and 6 activities consist of forming words, rhyming words, completing puzzles, playing dominoes or Scrabble, reading storybooks, and answering questions from storybooks. Teachers shared that they need to manage their time very well to be effective in conducting simultaneous remedial and enrichment reading classes. Notwithstanding the challenges, they noted that vocabulary and spelling abilities and comprehension skills, particularly among frustration-‐level readers, improved. These impressions are based on the teachers’ assessment and will be validated with Phil-‐IRI at the end of the school year.
Student Assessment
The next sections describe the practices, experiences, and insights of PCDES teachers regarding the student reading assessment tools used in the WSRP. Phil-‐IRI
A key learning from the pilot implementation of the WSRP is that there is wide variability in the correct administration of the Phil-‐IRI, particularly regarding the item on marking major miscues. The WSRP training package includes additional training in administering the Phil-‐IRI. The principal and teachers acknowledge that their enhanced ability to administer the test correctly gave them more confidence in using the results for identifying their pupils’ reading levels. They are challenged by the very high standard of the Phil-‐IRI in reading comprehension, specifically on the content of the passage and the higher levels of questioning. Thus, they appreciate the emphasis of WSRP on teachers’ skills in formulating higher-‐level questions.

15 | P a g e
Early Grade Reading Assessment (EGRA)
It is worthwhile sharing the experience of a grade 3 teacher from PCDES. During the WSRP training in May 2012, a short orientation on the EGRA was given. The teacher shared that the training impressed on her that the EGRA tests the basic reading skills her students should master. When classes started, she modeled her own test items to that of the test sections in EGRA. She did not expect that she would be randomly drawn as a sample intervention teacher and that her students would be tested using the EGRA tool for the research, but she was confident that her students did well because she applied in her class what she learned about EGRA from the training.
Monitoring and Technical Support
In previous school years, the principal used the STAR (Situation-‐Task-‐Action-‐Results), a DepED standard supervisory tool that is used to collect information from actual teaching observations in all grade levels. During the previous school year, the principal was able to monitor nine teachers from June to September, or about two to three teachers per month. The teaching staff held school learning action cells (SLAC) every last Friday of the month to learn teaching strategies and share experiences. As part of her technical support, the English coordinator served as demonstration teacher during SLAC sessions. Under WSRP, both the principal and teachers were oriented on the SCOPE-‐Literacy tool and had hands-‐on experience using the rating system. The principal has started using the SCOPE tool to observe some teachers. She described her experience as follows:
The tool has a clear description and rating system. It is not difficult to use, and with more practice I will be more confident in using it.
The teachers also found the tool very useful. More important, it dispelled their anxiety about being observed by the principal. Now, many if not all teachers are eager to be observed in class:
We already have an idea on how the principal rates us, and it made us aware of where to focus our teaching strategies. This tool provides a good direction to the principal as well as to us teachers.
Going forward, teachers highlighted their need for feedback from the principal on their strengths and areas for improvement after an observation. They suggested that the principal explain the rubrics for their better understanding, and that “giving and receiving feedback” should be part of the guidelines for use of the tool.
Support from Stakeholders
A distinguishing characteristic of Barangay Nangi, where PCDES is located, is the very active participation and support of barangay officials and parents in school programs and projects. Residents belong to different tribes and religious affiliations, but cultural diversity has not been a hindrance to any school initiative. Teachers themselves are residents of the barangay. The principal is a Teduray, one of the indigenous tribes in the area.

16 | P a g e
In addition to the spontaneous cooperation demonstrated by parents, barangay officials, and residents, the principal credits the Barangay Education Report Card (BERC) system introduced by EQuALLS2 for the school’s strong relationship with other stakeholders:
We have an assigned BERC coordinator who is responsible for updating the information. The BERC helps us disseminate information quickly, and as a result we are also able to mobilize resources. Last year we were able to get the LGU to support our review for the National Achievement Test. They provided snacks, reviewers, pencils, and answer sheets to our students.
This school year, the school was able to start a feeding program with the support of parents to address absenteeism. Teachers were able to obtain donations from local citizens for school supplies.
Gains from School Reading Improvement Planning
In summary, the practice of school reading improvement planning introduced by WSRP augured well for PCDES. In previous years, undertaking a reading program was a general objective in the School Improvement Plan, but there were no structured and sustained programs directed at improving reading instruction and measuring student progress. Options were given by DepED to the school for conducting reading contests, such as a read-‐a-‐thon, English quiz bee, or oral interpretive and literary contests. These types of activities were valuable in generating awareness, interest, and community support but did not necessarily account for the gains in the students’ reading levels at PCDES. The principal described the experience and the outcomes of having set for themselves a clear School Reading Improvement Plan:
We believe that teachers’ commitment and dedication, [the] openness of teachers to new learning from the WSRP, and the high level of stakeholder support greatly facilitated the emerging positive results in our school. The process of school reading improvement planning made us student-‐centered. We will be challenged with issues of sustainability [and] lack of resources, and even limited by our capacity to monitor and document our progress. But we are confident that we will be able to update our School Reading Improvement Plan after WSRP is completed. The School Reading Improvement Plan served us well as a guide.
CASE STUDY 2: LUN PADIDU CENTRAL ELEMENTARY SCHOOL: OPENNESS TO LEARNING IS KEY TO SUCCESS
Lun Padidu Central Elementary School (LPCES) is located in Barangay Lun Padidu, one of the biggest of the 12 barangays of the municipality of Malapatan in Sarangani Province, under Region 12. Malapatan is a first class municipality. The acceleration of the municipality’s economy in the last five years, and the implementation of government and donor programs to encourage indigent families to send their
“We are confident that we will be able to update our School Reading Improvement Plan after WSRP is completed. The School Reading Improvement Plan served us well as a guide.”
—Principal of PCDES

17 | P a g e
children to school, brought changes in LPCES. Enrollment increased from 1,198 students in 2005–06 to 1,656 in 2012–13. Of these students, 21 percent are Muslim, 18 percent are indigenous people, and the rest are Christian. The student participation rate increased from 68 percent in 2009–10 to 92 percent in 2011–12, and almost all of those who were enrolled stayed in school. Within the same period (2009–10 to 2010–11), the retention rate was 93–95 percent, and the dropout rate decreased from 4.8 percent to 2 percent. The school has a newly installed principal leading the school’s staff of 39 licensed professional teachers, of whom 34 are female. The school has five Master Teachers and five teachers with postgraduate units (see Table 9). The average age of teachers is 46 years. Teachers’ length of service ranges from 2 to 29 years, with 13 teachers having taught for 10 years or less. LPCES benefited from EQuALLS2 professional development training from SY 2008–09 to SY 2011–12. Within this period, the school made remarkable progress in its mean percentage score in the National Achievement Test in English: from 59.8 percent in SY 2010–11 to 81.7 percent in 2011–12. The average class size is 42 students, and the student-‐to-‐textbook ratio is 2:1. The school has progressed considerably, but it continues to face challenges. Of the 1,473 students tested at the beginning of this school year, 323 (22%) were non-‐readers, 609 (41%) were at the frustration level, 494 (34%) were reading at their level, and only 50 (3%) were reading independently (see Table 10). It is noted that there are non-‐readers even at the intermediate grade levels.
Interventions Contributing to Reading Improvement at Lun Padidu Central Elementary School
Highlighted in this section are the WSRP practices adopted by LPCES teachers and administrators in the previous school year and during this school year, 2012–13. Also presented are the emerging results and the challenges that teachers faced in implementing the various elements of the School Reading Improvement Plan. Teacher and Administrator Training
As an EQuALLS2-‐assisted school for five years, LPCES teachers have participated in various training activities focused on teaching strategies and techniques, including the development and appropriate use of instructional materials. LPCES was an active implementer of EQuALLS2’s Learning Partnership Program, a delivery mode for school-‐based professional development that promoted sharing of learning between a learning facilitator (mentor) and a learning partner (mentee). The school division English coordinator (who is also a math learning facilitator) notes that she continues to share and discuss with her co-‐teachers some topics in beginning reading.
TABLE 10. LPCES 2012 reading performance, based on results of the Phil-‐IRI English oral pre-‐test for grades 2–6 and the school reading assessment for grade 1 Grade Frustration Instructional Independent Non-‐Reader
1 34% 24% 0% 42% 2 49% 13% 0% 38% 3 47% 29% 3% 21% 4 40% 43% 4% 13% 5 40% 47% 7% 6% 6 38% 50% 8% 4%
TABLE 9. Profile of LPCES teaching staff
Teacher characteristics
Number
Number of teachers 39 Master Teacher 5 Teacher III 5 Teacher I or II 29 Male 5 Female 34

18 | P a g e
Although teachers have participated in numerous training activities in the past years, they continue to seek opportunities for learning. To equip teachers with effective instructional practices for each of the five essential reading skills tops the list of objectives in LPCES’s School Reading Improvement Plan for 2012–13. Most of the LPCES teachers attended the two training activities under WSRP, one on teaching the five essential reading skills, and the other an enhancement training on beginning and developmental reading instruction, which includes development of teaching-‐learning materials and the incorporation of authentic writing activities. An immediate result of these trainings is a change in the teachers’ views about reading and writing. One teacher summed up the group’s most significant learning:
We used to view reading and writing as separate activities, but now we realize that these should be linked. We also learned that we should encourage our students to write by giving them opportunities for authentic writing, and we should be more tolerant of the errors that they make.
Equally significant is teachers’ learning about strategies for integrating the teaching of the five essential reading skills at the pre-‐reading, reading, and post-‐reading stages of a lesson. One teacher shared the following insights:
I thought that reading was just a springboard for a language lesson. Now I know better the proper way to teach reading, step by step.
The new LPCES principal participated in the same training as the teachers. He looks forward to using the SCOPE tool introduced to administrators during the training, to observe his teachers applying their learning in the classroom. The school plans to provide resources for additional instructional materials for the effective implementation of its reading program. Strengthening Classroom Reading Instruction and Instructional Materials Development
As stated in the PCDES case study, the WSRP approach emphasizes the essential features of evidence-‐based reading instructional practices and the improvement of students’ skills in both reading and writing. Teachers are guided to apply the concepts by preparing lesson plans that integrate the teaching of the five essential reading skills (phonemic awareness, decoding and word recognition, vocabulary knowledge, fluency, and reading comprehension) into pre-‐reading, reading, and post-‐reading activities. In this approach, explicit reading instruction is supported by appropriate instructional materials. Activities are student-‐centered, and students are also engaged in authentic writing exercises. TABLE 11. LPCES teachers’ practices in lesson plan preparation Grade Previous School Year (SY 2011–12) With WSRP (SY 2012–13) 1 Referred to English lesson guide Used a detailed lesson plan, with big book and stories 2 Referred to English lesson guide and Teachers
Manual Followed steps in making a lesson plan, with big book and pre-‐reading, reading, and post-‐reading activities
3 Referred to English lesson guide, with modified learning activities
Offered pre-‐reading, reading, and post-‐reading activities
4 Referred to English lesson guide; separate lesson plans for language, reading, and writing
Anchored the language lesson on a reading lesson, and linked writing to the reading lesson
5 Referred to English lesson guide; separate lesson plans for language, reading, and writing
Integrated reading, language, and writing
6 Followed the steps in making a regular lesson plan; reading and writing are not integrated into the lesson plan
Used a detailed lesson plan; integrated reading
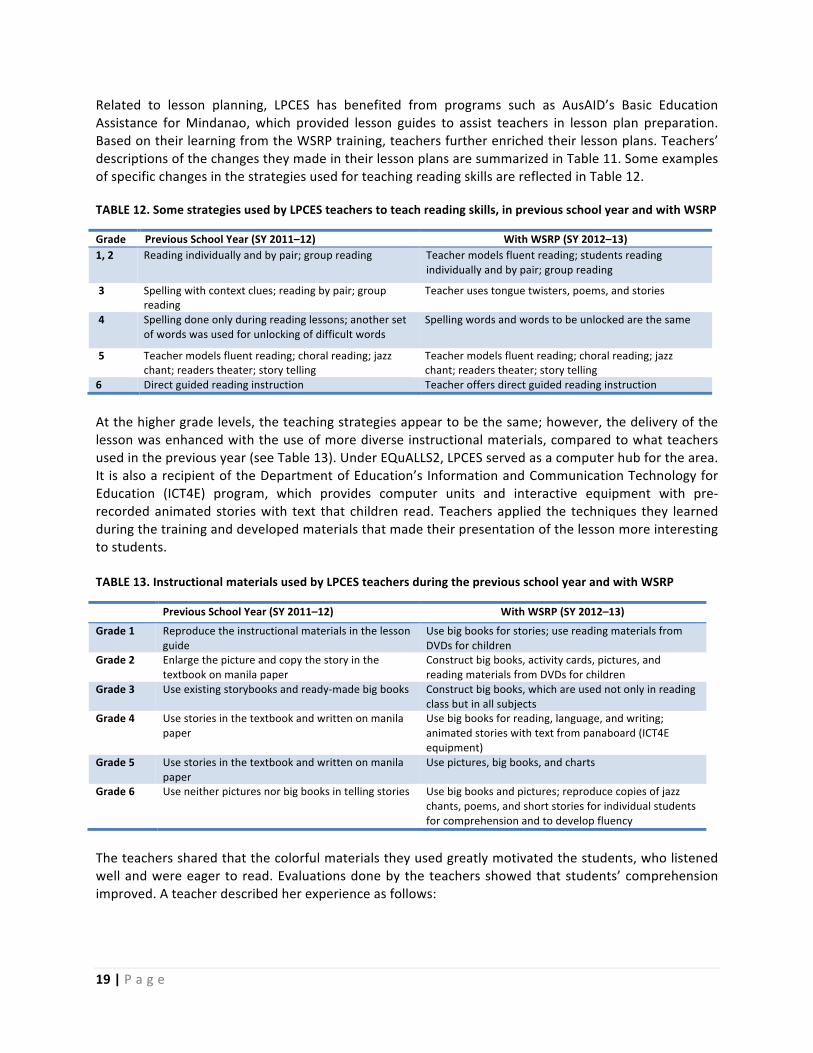
19 | P a g e
Related to lesson planning, LPCES has benefited from programs such as AusAID’s Basic Education Assistance for Mindanao, which provided lesson guides to assist teachers in lesson plan preparation. Based on their learning from the WSRP training, teachers further enriched their lesson plans. Teachers’ descriptions of the changes they made in their lesson plans are summarized in Table 11. Some examples of specific changes in the strategies used for teaching reading skills are reflected in Table 12. TABLE 12. Some strategies used by LPCES teachers to teach reading skills, in previous school year and with WSRP
Grade Previous School Year (SY 2011–12) With WSRP (SY 2012–13) 1, 2 Reading individually and by pair; group reading Teacher models fluent reading; students reading
individually and by pair; group reading
3 Spelling with context clues; reading by pair; group reading
Teacher uses tongue twisters, poems, and stories
4 Spelling done only during reading lessons; another set of words was used for unlocking of difficult words
Spelling words and words to be unlocked are the same
5 Teacher models fluent reading; choral reading; jazz chant; readers theater; story telling
Teacher models fluent reading; choral reading; jazz chant; readers theater; story telling
6 Direct guided reading instruction Teacher offers direct guided reading instruction
At the higher grade levels, the teaching strategies appear to be the same; however, the delivery of the lesson was enhanced with the use of more diverse instructional materials, compared to what teachers used in the previous year (see Table 13). Under EQuALLS2, LPCES served as a computer hub for the area. It is also a recipient of the Department of Education’s Information and Communication Technology for Education (ICT4E) program, which provides computer units and interactive equipment with pre-‐recorded animated stories with text that children read. Teachers applied the techniques they learned during the training and developed materials that made their presentation of the lesson more interesting to students. TABLE 13. Instructional materials used by LPCES teachers during the previous school year and with WSRP
Previous School Year (SY 2011–12) With WSRP (SY 2012–13)
Grade 1 Reproduce the instructional materials in the lesson guide
Use big books for stories; use reading materials from DVDs for children
Grade 2 Enlarge the picture and copy the story in the textbook on manila paper
Construct big books, activity cards, pictures, and reading materials from DVDs for children
Grade 3 Use existing storybooks and ready-‐made big books Construct big books, which are used not only in reading class but in all subjects
Grade 4 Use stories in the textbook and written on manila paper
Use big books for reading, language, and writing; animated stories with text from panaboard (ICT4E equipment)
Grade 5 Use stories in the textbook and written on manila paper
Use pictures, big books, and charts
Grade 6 Use neither pictures nor big books in telling stories Use big books and pictures; reproduce copies of jazz chants, poems, and short stories for individual students for comprehension and to develop fluency
The teachers shared that the colorful materials they used greatly motivated the students, who listened well and were eager to read. Evaluations done by the teachers showed that students’ comprehension improved. A teacher described her experience as follows:

20 | P a g e
Most of my learners are visual-‐auditory. Whenever I use well-‐prepared instructional materials, I can see that my students are learning better. They have better retention of the lesson because they associate the concepts with the pictures in the big book.
Teachers do recognize the importance of instructional materials in teaching reading but also expressed the hard work that they need to exert in preparing instructional materials. Their common reaction is that preparing instructional materials is time consuming and costly. Provision of material support to activities that promote reading across classrooms and schoolwide is a key objective of the School Reading Improvement Plan. The school has identified funds from its own operations budget as well as support from the PTA to address this challenge. Classroom observations were done to supplement and validate the information shared by teachers in the focus group discussions. These observations were intended to determine whether teachers applied the strategies and used the instructional materials they developed at the training (see Table 14). TABLE 14. Observations of a grade 2 class integrating the teaching of the five essential reading skills
The teacher, Ms. Miomio, made a big book on the selection George and Jimmy Spoke in Class, a story taken from the English 2 textbook. The objectives of her lesson were as follows:
§ For phonics and spelling: Identifying words through phoneme segmentation, spelling unfamiliar words taken from the selection, and reading unfamiliar words correctly
§ For vocabulary development: Matching a word with its meaning § For language: Use of This is __ and That is __ with a singular noun
Pre-‐Reading: The teacher conducts a spelling contest. Each group sends representatives to the front to spell on the board the words Ifugao, blanket, proud, brave, and bible. The teacher introduces a list of words that children read after her: the spelling words Ifugao, blanket, proud, brave, and bible, and the additional words weave, spoke, mountain, something, and speak, also taken from the selection. For developing her students’ vocabulary, the teacher engages her students with colorful cut-‐outs of shoes bearing each of the words used in spelling, which students will match with a sock bearing the meaning of the word.
Ms. Miomio shows the class pictures of a boy pointing to different objects near and far from him, with sentences using This is __ and That is __. The teacher asks students to make sentences of their own using This is __ or That is __. She reviews the use of a and an when some students are unable to use the articles properly in a sentence, e.g., This is a umbrella. The teacher asks students to clap and count the syllables of the words that the teacher says aloud: cabbage, strawberry, highway, kangaroo, bridge, orchid, Michaela, Francine, Norhayna.
The teacher presents a big book titled George and Jimmy Spoke in Class, and motivates her students by asking: Have you received a gift from someone you love? Who among you here have seen a bible? Pointing to the big book, she poses some motivational questions: What can you say about the cover? What do you think is the name of the boy?
Reading: The teacher reads the story first with fluency. Every two to three paragraphs, she pauses and asks questions to check if students are able to follow the story. After she reads the third paragraph, for example, she asks: What did Jimmy bring? Why did the mother give him a blanket? Why does the classmate know about the blanket? After the last two paragraphs, she asks: Who is Jimmy? Is he proud of being an Ifugao? Why did Jimmy’s grandmother give him a colorful blanket? The class reads the whole story aloud together. The teacher emphasizes the use of punctuations before asking the children to read the story by group.
Post-‐Reading: The teacher groups the students and gives each group a specific task: § Group 1: Complete the sentences That is __ and This is __ based on what they see in the pictures § Group 2: Make sentences using That is __ and This is __ corresponding to the pictures § Group 3: Write complete sentences of their own using That is __ and This is __ § Group 4: Identify the number of syllables of the underlined word
The pictures and the words used in this exercise were not taken from the story. Each group presents its output, and the teacher evaluates and grades the group. The teacher goes back to the story for a comprehension check. The following are examples of questions she asks:
§ Who are the characters in the story? When did the story happen? § What do you think was the reaction of George when his mother gave him a bible? § Why did Jimmy’s grandmother give him a colorful blanket?

21 | P a g e
The class observation depicted in Table 14 was conducted two weeks after the second WSRP training, and it is encouraging to observe that the teacher has applied many of the strategies she learned during the training. The teacher integrated the teaching of phonics, vocabulary development, fluency, and reading comprehension. She enhanced the delivery of the lesson by using a big book, illustrations, and pictures, and she used various levels of questioning before reading, during reading, and after reading the selection to reinforce comprehension. Still, there are areas for improvement. The framing of motivational questions needs to be improved to be more effective in generating student interest. The lesson also needs to provide more opportunities for authentic writing. The teacher exceeded the actual delivery of the lesson by 30 minutes, indicating the importance of time allocation and management for each stage of the reading activity. It is interesting to note that one LPCES teacher is using educational technology to teach reading. Instead of using a big book, she anchors her lesson on a pre-‐recorded animated story. The reading and writing portions of her lesson are summarized in Table 15. TABLE 15. Demonstration of the use of educational technology in reading The objectives of Ms. Pilo’s lesson for her grade 4 class are as follows:
§ For language: Use of comparative degrees of adjectives in sentences; § For reading: Inferring the feelings of characters based on situations presented § For writing: Writing a reflection paper on the moral lesson of the story
Pre-‐Reading: Before going to the multimedia room in a separate facility not very far from the classroom, the teacher starts off with a spelling drill, with students using their show-‐me board. The spelling words were village, collapse, terrified, permission, and foolish. For unlocking the meaning of the words, she asks her students to match each word used in the spelling drill, written on a picture of a cone, with its synonym, written on a picture of a scoop of ice cream, to form a sundae or an ice cream cone. The class moves to the multimedia room. To motivate her students before reading, Ms Pilo asks: Do you help your father or mother at home? What work do you usually do to help your mother or father at home? She also asks motive questions on the selection the students are about to see: What did mother ask Pilandok to do? How did Pilandok get the mangos and come home safely? Reading: The narrator in the presentation models fluent reading. To develop the students’ fluency, the teacher stop-‐starts the multimedia presentation to enable the students to read the story aloud line by line. Post-‐Reading: Working in groups, students draw the appropriate smiley (facial clues) to show the feelings of Pilandok, the character in the story, in different situations taken from scenes in the story. In the discussion that follows, the teacher asks students to answer the motive questions. She checks students’ comprehension with literal questions (What is the story about? When did the story happen?), interpretive questions (Why do you think the bridge collapsed? Why do you think Pilandok tricked the crocodiles?), and evaluation or application questions (If you were the leader of the crocodiles, will you carry Pilandok on your back across the river? Why?).
§ Does the story give us a lesson? § What possible ending of the story can you suggest?
Writing: After completing the application and evaluation parts of the lesson, the teacher gives students the assignment to write 4 sentences using This is___ and That is___.
The teacher, Ms. Miomio, engages her students with colorful cut-‐outs of shoes bearing each of the words used in spelling, which students will match with a sock bearing the meaning of the word.

22 | P a g e
Students use their show-‐me boards in a spelling drill.
An animated presentation keeps these students focused as they read aloud a story.
Writing: After a short test to evaluate the students’ overall learning, Ms. Pilo asks students to write a reflection paper on the moral lesson of the story for their homework.
The two class observations reflect the changes in the way that teachers prepare their lesson plans and the instructional strategies and materials that they use in the classroom. The animated presentation that replaced a big book clearly aided students’ listening, fluent reading, and comprehension skills. Use of educational technology may address some of the teachers’ concerns regarding the time and funds required to prepare instructional materials. However, lack of a stable power supply and inadequate training of teachers may limit its use. According to Ms. Pino:
I have to get the interactive equipment ready well ahead of time for my class. There has been recurring power interruption, but I hope that it does not happen while I am holding my reading class. The animated presentation helps me keep my students’ attention on the story. Developing fluency is easier because the students imitate the narrator in the animated presentation. I just need to be creative because the story is a continuous presentation. I use the stop-‐start button to cut the presentation into segments for practice reading.
A third observation of a lower section of a grade 3 class proved less encouraging, but it likely reflects the typical, challenging situation in other lower-‐section grade levels as well. The teacher’s lesson plan integrates both the five essential reading skills and writing into pre-‐reading, reading, and post-‐reading, but the teacher has to exert extra effort in simplifying, rephrasing, or translating to mother tongue the higher-‐order questions that children have difficulty responding to (see Table 16).
TABLE 16. Observations of a grade 3 class integrating the teaching of the five essential reading skills
Lesson Activities Remarks The objective of the lesson for the day is to give an appropriate ending to a given situation. The teacher, Mr. Cornejo, has a prepared lesson, with activities for pre-‐reading, reading, and post-‐reading laid out. Three levels of questions are also included in the lesson plan.
The class is at the last period in the morning before lunch break. Boys are grouped and so are girls, and the groups are seated in separate rows. Even before the lesson starts, the students are already restless, and many were not paying attention to the lesson.
Pre-‐Reading: The class starts with a spelling drill. The words are unharmed, protect, appeared, enemies, and frightened. The teacher says the whole word, then actually spells the word, letter by letter, then says the word again.
Only a few students are able to get a perfect score on the spelling drill, even if the teacher spelled the word. More than half the class got zero, indicating poor letter-‐name recognition and listening skills.
For unlocking of the meaning of the new words, Mr. Cornejo uses flash cards, and students match the word with its meaning.
Students have difficulty matching the word with its meaning. The teacher does not use the word in a sentence to provide context clues.
Before presenting the big book, the teacher asks: What are your favorite animals? The teacher also asks a motive question: What
The teacher does not show pictures of animals in the forest as indicated in his lesson plan. Student responses:
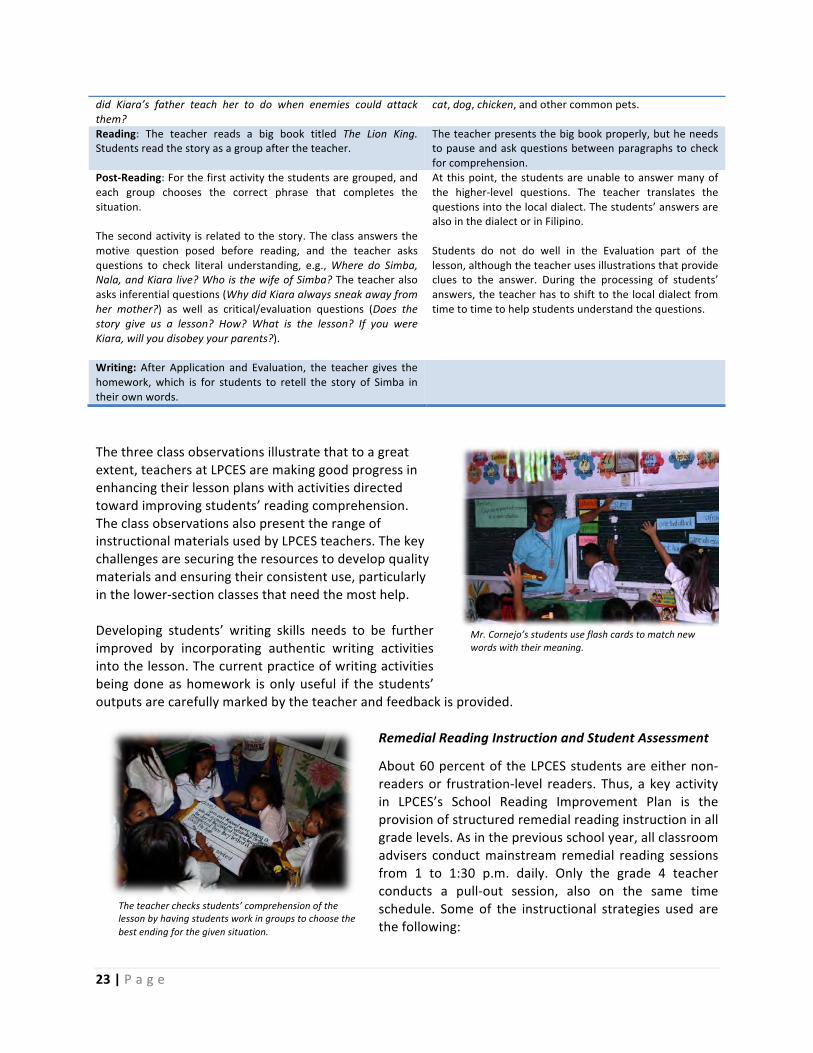
23 | P a g e
Mr. Cornejo’s students use flash cards to match new words with their meaning.
The teacher checks students’ comprehension of the lesson by having students work in groups to choose the best ending for the given situation.
did Kiara’s father teach her to do when enemies could attack them?
cat, dog, chicken, and other common pets.
Reading: The teacher reads a big book titled The Lion King. Students read the story as a group after the teacher.
The teacher presents the big book properly, but he needs to pause and ask questions between paragraphs to check for comprehension.
Post-‐Reading: For the first activity the students are grouped, and each group chooses the correct phrase that completes the situation. The second activity is related to the story. The class answers the motive question posed before reading, and the teacher asks questions to check literal understanding, e.g., Where do Simba, Nala, and Kiara live? Who is the wife of Simba? The teacher also asks inferential questions (Why did Kiara always sneak away from her mother?) as well as critical/evaluation questions (Does the story give us a lesson? How? What is the lesson? If you were Kiara, will you disobey your parents?).
At this point, the students are unable to answer many of the higher-‐level questions. The teacher translates the questions into the local dialect. The students’ answers are also in the dialect or in Filipino. Students do not do well in the Evaluation part of the lesson, although the teacher uses illustrations that provide clues to the answer. During the processing of students’ answers, the teacher has to shift to the local dialect from time to time to help students understand the questions.
Writing: After Application and Evaluation, the teacher gives the homework, which is for students to retell the story of Simba in their own words.
The three class observations illustrate that to a great extent, teachers at LPCES are making good progress in enhancing their lesson plans with activities directed toward improving students’ reading comprehension. The class observations also present the range of instructional materials used by LPCES teachers. The key challenges are securing the resources to develop quality materials and ensuring their consistent use, particularly in the lower-‐section classes that need the most help. Developing students’ writing skills needs to be further improved by incorporating authentic writing activities into the lesson. The current practice of writing activities being done as homework is only useful if the students’ outputs are carefully marked by the teacher and feedback is provided.
Remedial Reading Instruction and Student Assessment
About 60 percent of the LPCES students are either non-‐readers or frustration-‐level readers. Thus, a key activity in LPCES’s School Reading Improvement Plan is the provision of structured remedial reading instruction in all grade levels. As in the previous school year, all classroom advisers conduct mainstream remedial reading sessions from 1 to 1:30 p.m. daily. Only the grade 4 teacher conducts a pull-‐out session, also on the same time schedule. Some of the instructional strategies used are the following:

24 | P a g e
During a pull-‐out remedial reading session, the teacher, Ms. Pilo, shows a fan as she asks her students to identify the middle sound of the word fan.
• Grade 1: Letter name, letter sound, and Dolch basic words • Grade 2: Spelling, syllable counting, and word reading using flash cards • Grade 3: Word reading using flash cards and sentence strips • Grade 4: Pictures and the five essential reading skills • Grades 5 and 6: Charts and pictures
However, teachers adjust the remedial reading lesson and the materials used based on the students’ reading level, as seen in the example of a 30-‐minute, grade 4 pull-‐out remedial reading session described in Table 17. TABLE 17. A remedial reading session at LPCES
The teacher closely follows the individual progress of her students by administering the RARS tool once a week. She reports:
My students are curious when I graph the results after I administer RARS, so I tell them that the more words they are able to read, the higher the line will go. Now, they anxiously wait [to see] how their line will go every week. It is challenging to handle remedial reading. One of my students has moved back to mainstream, but the remaining three learners are frequently absent because they have to help with house chores, or to help their parents in the farm.
Other teachers administer the RARS monthly. One teacher describes the initial results after about six months of remedial reading:
The teacher uses flash cards with pictures to teach the initial sound. She asks: What is the initial sound of the word shoe? shell? sun? Where can we find the initial sound? After the students are able to identify the initial sound, the teacher moves on to the middle sound. She uses a real fan and a real baseball bat and asks the students: What is this object? What is the middle sound? She sounds out the phonemes. Students do the same and are able to say the middle sound. The teacher moves on to the final sound. She uses pictures from a donated book. She asks: What sound do you hear at the end of the word bear? flower? deer? The teacher summarizes the lesson on initial, middle, and final sounds. Still using pictures from a donated book, she gives a five-‐point evaluation. Students are to identify the initial, middle, and final sound of a word. The teacher pronounces the word as she points to a picture of fire from a reference book, or to real objects found in the room: book, shell, cup, table. One of her three students was not able to give any correct answer. The teacher reinforces the lesson through the students’ assignment, which is to give either the initial, middle, or final sound of a list of words that she provides.

25 | P a g e
Out of the 10 frustration-‐level students in my class of 53, 3 have moved to instructional. I hope I can continue to make progress in spite of conflicts in [the] schedule with other DepED activities, and the irregular attendance of our students.
Encouraged by these results, and at the same time challenged by the remaining frustrated and non-‐ readers that need to be helped, the school identified as a next step offering extra remedial reading sessions for non-‐readers after class hours. The school is thinking of proper incentives for students to attend the sessions, considering that students may feel inferior at being identified as slow learners or non-‐readers. A teacher sums up her experience thusly:
Teachers’ resourcefulness, diligence, and patience really matter in ensuring the attendance and sustaining the interest of students in remedial reading sessions.
Enrichment Reading Instruction
Enrichment reading sessions for instructional and independent level students are indicated as an activity in the LPCES 2012–13 School Reading Improvement Plan. The school’s specific objective is to provide structured enrichment instruction during a fixed and regular time, but this remains to be done because teachers give more attention to remedial reading classes. As in previous school years, more advanced
readers are often selected for classroom and school-‐level reading contests, jazz chants, and storytelling and retelling, and to represent the school in read-‐a-‐thons and district-‐level oral interpretation, story retelling, and other literary contests. Advanced readers are also assigned to be Little Reading Teachers, a peer reading model in which the advanced reader models storytelling and poses comprehension questions to the rest of the class. This model has mixed results because other students often are not attentive and the Little Reading Teacher lacks confidence. Teachers cited as challenges their limited skills and creativity as well as their limited time to prepare teaching and learning activities for enrichment reading, considering that they are already time-‐constrained in preparing for their regular and remedial reading classes. Clearly, the school needs assistance to devise a more structured plan for developing students’ higher-‐level comprehension, critical thinking, and writing skills.
Monitoring and Technical Support
As in other schools, during the previous year the principal used the STAR (Situation-‐Task-‐Action-‐Results), a DepED-‐mandated supervisory tool that is used to collect information from actual teaching observations in all grade level. Under WSRP, both the principal and teachers were oriented on the SCOPE-‐Literacy tool. The principal has started using the SCOPE tool to observe some teachers, and plans to observe eight teachers monthly to provide technical assistance. According to the new principal:
RARS student form

26 | P a g e
To make every child a reader, both principal and administrator should exercise their respective functions. It is good that we have a monitoring tool that both administrator and teachers understand.
The program is succeeding in building partnerships and gaining DepED’s support beyond the school level. The Sarangani division English supervisor is also an EQuALLS2 WSRP trainer and SCOPE administrator. She provides on-‐the-‐spot coaching to teachers and guidance to school administrators. She also conveys to the division superintendent an updated understanding of the progress of WSRP implementation at the school level, and incorporates policy and financial support for reading programs into the overall education improvement plan for the division. Her active participation has been very helpful in moving WSRP-‐related activities forward, not only in LPCES but in other WSRP-‐assisted schools in the division.
Support from Stakeholders
LPCES is a beneficiary of the Sarangani Big Brother: Reading Is Fun activity of the province’s Quality Education for Sarangani Today (QUEST) program, which works with schools to reduce the number of frustration-‐level readers, particularly among pupils in grades 2 and 3. The 15-‐day summer program taps youth volunteers to assist teachers in providing one-‐on-‐one sessions to improve children’s reading and comprehension skills. The school conducts parent mentoring sessions to complement the reading program for children. The book-‐to-‐pupil ratio for grade 2 is now 1:1 as a result of books provided under QUEST, as well as from EQuALLS2 and other book donors. This school year, the school plans to replicate the previous year’s homeroom PTA project of providing one storybook per pupil to achieve the same book-‐to-‐pupil ratio in other grade levels. Generating support from parents is a priority, as one teacher shared:
Many of our parents have limited capacity to give home support in reading, but we know they can help a lot in other ways like helping with the school’s supplementary feeding program for slow readers that we plan to hold this school year. We will recognize outstanding and active parents to serve as models to the rest of our parents.
The school also plans to provide an orientation to parents on the school’s reading program, and to invite other stakeholders, such as alumni and retirees, to establish a mini-‐library or enhance the existing one in each classroom.
Gains from School Reading Improvement Planning
To summarize the results from the various components of the WSRP, LPCES has many elements of a successful reading improvement program in place. In previous years, it benefited from EQuALLS2 professional development programs directed at teaching English and reading. The local government’s reading advocacy and financial support facilitate awareness-‐building and parental participation in reading initiatives. The school has an educational technology facility that provides a wealth of teaching and learning resources. More important, LPCES has a complement of teachers who are open to learning and are driven by results of their practices on student performance. Three teachers describe the changes in their attitudes and perspectives:

27 | P a g e
We always plan the best strategies and choosing the best stories for our big books every day. We observed that our learners are more interested to listen and read when we teach with stories.
—Grade 6 teacher WSRP helped me in making my instruction more meaningful. I am glad to see that my learners are getting higher scores in their quizzes, and have greatly improved even in their pronunciation.
—Grade 4 teacher Since we started using big books, students showed more interest in interpreting the story. This practice also improved our students’ attitude toward English class. They look forward to learning something new or hearing new stories from another big book. We hear our students imitate the way we read. It inspires us because it means that we are able to model fluent reading well. We have become more confident in teaching reading.
—Grade 3 teacher
The School Reading Improvement Plan that WSRP introduced brings together these elements to form a clear path of focused action to achieve LPCES’s goal of making every child a reader at his or her grade level. Not all schools in the district are covered by WSRP, but, encouraged by the emerging positive results at LPCES, the division English coordinator is taking steps to replicate the program:
We will institutionalize WSRP in the district. We will continue to support ongoing DepED-‐led reading programs, such as Drop Everything and Read and read-‐a-‐thon. But unlike our practice before of conducting remedial reading during free time, we will develop more structured remedial and enrichment reading programs. I am asking the principal to ensure that adequate resources for WSRP are reflected in LPCES’s school improvement plan.
SYNTHESIS OF THE CASE STUDY FINDINGS
In the WSRP intervention model, it is assumed that implementation of the eight components of the School Reading Improvement Plan collectively produce the intended outcomes: improved instructional practice and improved student achievement. In the context of the program, improved instructional practice means that teachers are effectively teaching the content, using the strategies and materials, and expressing appropriate beliefs and attitudes in regard to reading. But how does one measure or demonstrate effectiveness of education program interventions? Studies in this area show that the consistency with which program interventions are delivered directly affects the outcomes (Century, Freeman, & Rudnick, 2008; Nelson, Cordray, Hulleman, Darrow, & Sommer, 2010). These findings
The School Reading Improvement Plan that WSRP introduced brings together critical elements to form a clear path of focused action to achieve the school’s goal of making every child a reader at his or her grade level.

28 | P a g e
underscore the importance of measuring not only the impact but also the fidelity, or the degree to which program interventions are implemented as intended by program developers. Describing the integrity of implementation helps the program determine whether poor outcomes, for example, are a result of inherent inadequacies in the program design itself or are due to poor or incomplete implementation of program elements. As stated by Carroll et al. (2007), it is only by understanding and measuring whether an intervention has been implemented with fidelity that researchers and practitioners can gain a better understanding of how and why an intervention works and the extent to which outcomes can be improved. The case studies are not designed to measure the fidelity of implementation rigorously, but by contrasting previous with current practices, the studies determine which practices in the WSRP design have been adopted and how these are being applied by teachers in the classroom. Below are themes gleaned from the case studies using the primary components of WSRP as the framework of analysis.
Both schools are applying the concepts of beginning and developmental reading and are integrating the teaching of the five essential reading skills into pre-‐reading, reading, and post-‐reading activities.
The case studies demonstrate that integration of the reading skills to reinforce coherence and holistic instruction is being implemented as designed. Consistent with the knowledge and skills imparted in the second WSRP training, teachers enhanced their lesson plans by incorporating spelling drills, unlocking of new or difficult words, and activation of students’ schema into pre-‐reading activities to motivate students toward the reading material. The lesson plans also reflect modeling of fluent reading by the teacher, as well as individual and group reading by students to develop their own fluency during reading. Post-‐reading activities in the lesson plan consisted of student-‐centered discussions guided by various levels of questioning. The case studies provide evidence that based on the lesson plan content or structure and delivery, there is a good level of replication of the integrated approach in teachers’ practices. However, the formulation of higher-‐level questions, particularly for post-‐reading discussions, is an element in the integrated approach that needs further strengthening. The WSRP training design has provided training inputs for this purpose. Additional practical guides (such as Bloom’s taxonomy charts) that are readily accessible are likely to be helpful in continually building teachers’ skills in formulating higher-‐order thinking questions.9 It must be noted that both schools receive not just EQuALLS2 support but also support from other organizations and funders, such AUSAID’s Basic Education Assistance for Mindanao (BEAM) project. Multiple interventions from different donors are often thought to cause “confusion,” but these two schools are able to make all these interventions work together. This may be due to the relatively high capacity of teachers to absorb new learning and enhance existing practices, which may be the outcome of professional development that teachers have pursued or received, or due to the experience that they have gained from programs such as EQuALLS2 and BEAM. The ratio of Master Teachers and Teacher IIIs to the total number of teachers in both schools is close to 1:4 (PCDES: 4:12, LPCES: 10:39).
In both schools, explicit reading instruction is supported by instructional materials.
Teachers in both schools developed and used big books and a variety of materials, including educational technology-‐generated stories, to support the integrated approach in the teaching of reading, as
9 For example, see http://www.odu.edu/educ/roverbau/Bloom/blooms_taxonomy.htm and http://www.teachers.ash.org.au/researchskills/dalton.htm

29 | P a g e
designed by the program. Most of the teachers observed modeled the proper use of big books, although technical inputs in selecting appropriate stories and developing the teacher’s skill in storytelling are still needed. The development and use of quality instructional material is a program component that will likely have the highest variability in implementation. Notwithstanding the heightened student interest in reading generated by instructional materials, teachers in both schools are burdened by the time and funds needed to develop them. Both schools have identified the school’s maintenance and operating expenses as sources of funds, but they will need to explore other sources as well to maintain a stream of quality materials yearly.
Both schools continue to struggle with integrating writing.
An expected output from the enhancement training is teachers being able to integrate a writing activity into their reading lessons. Mixed results were noted from the class observations in both schools. In three of the six classes, writing activities consisted of copying from the board a set of sentences, or a one-‐paragraph selection in cursive form, and copying a selection from any book read in class. This practice can be attributed to teachers’ ingrained beliefs on writing that need to be changed. Results of the teacher beliefs survey, which is a component of the WSRP research study, show that 58.6 percent of the randomly selected teachers said that they ask students to write original text or sentences only sometimes or less than five times in a month. A similar proportion, 57.1 percent, said that they ask students to copy from the board texts prepared by the teacher often, or five or more times in a month. In the rest of the classes, writing consisted of forming sentences, writing a reflection paper on the moral lesson of a story, and retelling a story in the student’s own words—all practices that promote authentic writing. These activities were assigned as work to be done at home. Thus, it is important that the teacher provides feedback on students’ output in order for them to benefit from these writing tasks. Continuing guidance to teachers on integrating authentic writing activities needs to be provided.
Structuring remedial and enrichment reading instruction sessions is challenging for both schools.
There is a definite time schedule for remedial reading sessions in both schools, but due to the lack of teachers to handle the high number of frustration-‐level and non-‐readers, all teachers are mobilized to handle remedial reading sessions. The approach is mainly mainstream, with pull-‐out sessions difficult to sustain due to lack of staff. RARS is used as a tracking tool in only one school, while the other school relies on teachers’ own assessments of students’ progress. A challenge faced by teachers in both schools is students’ self-‐perception and the effect of being in a remedial reading class on their self-‐esteem. These are important considerations for refining the design of remedial reading interventions. Enrichment reading instruction is constrained by teachers’ limited skills and creativity as well as their limited time to prepare teaching and learning activities for enrichment reading, considering that they are already pressed for time preparing for their regular and remedial reading classes. Clearly, the school needs assistance to devise a more structured plan for developing instructional-‐ and independent-‐level students’ higher-‐level comprehension, critical-‐thinking, and original writing skills.

30 | P a g e
Both schools need policy and technical support to use SCOPE as a teacher assessment tool.
In terms of monitoring, both school principals had been using STAR, a tool required by DepED. The principals consider SCOPE-‐Literacy to be an objective observation tool and are now exploring its use. An explicit directive from the district-‐ or division-‐level DepED to adopt the tool, or at least an affirmation from these offices of SCOPE-‐Literacy as an alternative monitoring tool, will ensure that the principals will continue using it beyond the WSRP project term. Also needed is technical support to school principals in preparing a monitoring plan that includes the frequency of monitoring and procedures for monitoring, such as the participation of the district or division English coordinator, and the provision of feedback to teachers.
Both schools are benefiting from strong local government advocacy and support for reading but need to continue exploring meaningful ways to engage parents.
The WSRP does not provide specific training or orientation on how to engage parents and LGUs, but by including stakeholder support as a program component, it highlights to school administrators and teachers the advantages of actively engaging the community to help improve students’ reading performance. Both schools have strong linkages with their respective local governments and have been successful in mobilizing resources for achievement test reviewers and school supplies. Ideally, parents provide the necessary follow-‐through to reading lessons at home, but in both schools, the majority of parents have limited capacity to perform this role because of their low literacy levels. Teachers thus involve parents in other ways, such as helping with the school’s supplementary feeding program for slow readers and to reduce absenteeism, or donating a minimal amount for children’s books. In one school, parenting sessions include teachers teaching parents letter names, which may lead to positive results if the school is able to sustain the practice, or if it can link parents to adult literacy programs that can provide more effective and lasting learning. WSRP has no intervention in this component, thus outcomes will be largely dependent on each school’s initiative.
Both schools gained from having a School Reading Improvement Plan.
The School Reading Improvement Plan that WSRP introduced served as the schools’ framework for focused action to achieve their goal of making every child a reader at his or her grade level. The challenge for WSRP is being able to demonstrate that the good results observed in the two schools covered by this case study can also be observed in the rest of the schools covered by the program. The program needs to continue ensuring the active involvement of the DepED district and division English supervisors, who will provide continuity as overseers of the school reading improvement system introduced by WSRP beyond the project term.

31 | P a g e
REFERENCES
Carroll, C., Patterson, M., Wood, S., Booth, A., Rick, J., & Balain, S. (2007). A conceptual framework for implementation fidelity. Implementation Science 2007, 2(40). doi: 10.1186/1748-‐5908-‐2-‐40 Century, J., Freeman, C., & Rudnick, M. (2008, March 31). A framework for measuring and accumulating knowledge about fidelity of implementation (FOI) of science instructional materials. Paper presented at the National Association for Research in Science Teaching Annual Meeting, Baltimore, MD. Merriam, S. B. (1998). Qualitative research and case study applications in education. San Francisco, CA: Jossey-‐Bass. Nelson, M. C., Cordray, D. S., Hulleman, C. S., Darrow, C. L., & Sommer, E. C. (2010). A procedure for assessing fidelity of implementation in experiments testing educational interventions. Retrieved from https://www.sree.org/conferences/2010/program/.../4e-‐2nelson.pptx Patton, M. Q. (2002). Qualitative Research Evaluation Methods (3rd ed.). Thousand Oaks, CA: SAGE Publications. Ryan, K. E., & Cousins, J. B. (2009). The SAGE international handbook of educational evaluation. Thousand Oaks, CA: SAGE Publications.

32 | P a g e
ANNEX A: SCHOOL READING IMPROVEMENT PLAN
School Data:
Name of School:__________________________________________________ District:_________________________________________________________ Division_________________________________________________________ School Head:____________________________________________________ School Year: _______________________
Grade Level Number of Teachers
Number of Students
Phil IRI pre test
No. of Non-‐readers
No. of Frustration
No. of Instructional
No. of Independent
Grade 1
Grade 2
Grade 3
Grade 4
Grade 5
Grade 6
Subject Teachers
Total

33 | P a g e
II. Plans Goal Statement: To make every child a reader at his/her grade level Key Component and Task:10 ___________________________________ Objectives (What do you want to achieve for a particular component?)
Key Activities (How will you achieve your objective or what steps are to be taken?)
Time Frame (When will each of the activities happen?)
Means of Verification (What evidences support the accomplishment?)
Persons Involved (Who are responsible in carrying out the activity?)
Resources Needed from Budget
10 Use a separate sheet for each component and tasks. The 9 components and tasks are: 1) Administrator and Teacher Training, 2) Student Assessment, 3) Strengthening Classroom Reading Instruction, 4) Remedial Reading Instruction, 5) Enrichment Reading Instruction, 6) Materials Development, 7) Monitoring and Technical Support, 8) Support from Stakeholders, 9) Program Evaluation

34 | P a g e
977 educators: (i) gained knowledge on skills and competencies needed for students to become autonomous readers and competent writers (ii) gained skills in using assessment data to inform instruction and teaching (iii) established strategies to address struggling readers and writers (iv) have appropriate reading materials to teach reading in English effectively ...
ANNEX B: Analytical Framework of the EQuALLS2 Whole School Reading Program
USAID funding
Books and reference materials from BBF
Resources from Petron Foundation
1. Teachers and Principals • 5 days summer institute for school heads and all teachers
• 4 days refresher training
• Book shopping
2. Students • Classroom application
of appropriate instructional approaches
• Activities for struggling readers
• Knowledge base: Books and reference materials for student in Reading and English
INPUTS OUTPUTS Activities/Products Participation
OUTCOMES
Short term Medium term Long term
Products:
• Training session guides • Modified SCOPE Literacy
tool • School Reading
Improvement Plan that includes the following components:
-‐ Teacher and administrator training
-‐ Student assessment -‐ Strengthening classroom reading instruction
-‐ Remedial and enrichment reading instruction
-‐ Instructional materials development
-‐ Monitoring and technical support
-‐ Stakeholder support
53 schools, 38,566 students:
-‐ Improved reading instruction
-‐ Increased time on reading tasks
All teachers and principals from the 45 selected schools are integrating the teaching of reading and writing in English into their subject-‐content teaching.
Student achievement in reading in English improved.
Students maintain reading gains.
Principals and teachers are able to integrate their reading plans into their existing school improvement plans, and they follow their plans closely.
Teachers maintain good practices in teaching reading and writing in English.
Students advance in their reading comprehension skills from baseline.
Students can understand grade-‐level text.
Students are able to read and demonstrate understanding as defined by a country curriculum, standards, or national experts.
DepED time and resources on project
Trained teachers are aware of their own skill levels and know effective strategies for improving reading and writing, which is necessary to strengthen their own reading and writing skills.
DepED expands reading interventions to other schools.
DepED applies reading assessment practices to other schools.

35 | P a g e
3. DepED Administrators • Training on SCOPE Literacy administration and data analysis
• Workshop to prepare a refined and scalable model
20 division-‐level and district-‐level administrators enhance their skills in tracking improvement in reading instruction
DepED at all levels is implementing EQuALLS2-‐initiated programs that further enhance teachers’ capacity to teach reading in English.
Product: Refined and scalable model for WSRP

36 | P a g e
ANNEX C: Design of the Case Studies of the EQuALLS2 Whole School Reading Program
I. Objectives of the Case Studies To complement teacher instructional practices and student achievement assessments, EQuALLS2 is undertaking case studies of selected Whole School Reading Program (WSRP) schools. The case studies will assess the overall progress and results of WSRP implementation. Specifically, the case studies will do the following:
1. Describe how teachers are applying strategies for the teaching of reading imparted in the training activities
2. Document the outcomes of teacher training, instructional materials development, administrator support, provision of books, and other WSRP components in the School Reading Improvement Plan
3. Highlight emerging best practices, as well as challenges and lessons learned from WSRP implementation II. Case Study Areas Two (2) WSRP schools from among the intervention schools, with at least one teacher participating as a sample for this research, were selected for the case studies. The schools were selected after the first round of SCOPE-‐Literacy observation. Criteria used for selecting the schools include (i) indications of progress or emerging positive results in school improvement plan implementation, and (ii) accessibility, in order to facilitate data-‐gathering and documentation. Two schools were selected for a more focused observation of teachers’ practices and student achievement in reading:
1. Pedro C. Dolores Elementary School, Upi North District, Maguindanao (ARMM) 2. Lun Padidu Central Elementary School, Malapatan 3 District, Sarangani (Region 12)
III. Key Questions and Methods The case study will cover the dimensions and answer the questions indicated in the table below. Responses to the questions will be supported with data. The items in italics are questions relating to fidelity of implementation. Also reflected below are the data collection methods and data needed. Responses to the questions will be gathered through focus group discussions (FGD) with teachers and administrators. In addition to observing the instructional practices of the grade 3 teacher sampled for the research, one (1) English teacher each in grade levels 2 and 4 will be observed, or a total of three class observations per school. Observations will be done by the researcher with the principal or English Division Supervisor (depending on their availability) using a checklist-‐type observation tool with dimensions from the SCOPE tool. In addition to the three regular class observations, a remedial and/or enrichment reading session will also be observed. Other monitoring reports of EQuALLS2 Project Officers on the same school will be used as additional information for the case studies.

37 | P a g e
Dimension/Questions Data Collection
Method Data Needed
1. School Reading Improvement Plan (SRIP) (i) “Before” (baseline information) -‐ What was the reading performance of the school before
WSRP (last school year)? -‐ How was reading addressed in the SRIP in the previous
school year? -‐ What is the level of technical support and budget
resources provided? -‐ What reading programs were implemented last year?
What were the results?
(ii) “With WSRP” (current situation) -‐ What are the school’s key accomplishments related to
SRIP implementation? -‐ What are the results? What factors are contributing to
the positive results? -‐ What are the challenges? How are these challenges
being addressed? -‐ What are your next steps? -‐ What are your insights related to the SRIP?
§ FGD with district English supervisor, principal, and teacher representatives from each grade level, including the teacher handling remedial reading
§ SRIP status reports gathered by EQuALLS2 Project Officers will be used as the starting point of the discussions
§ SRIP 2011–12 and 2012–13
§ School NAT MPS (Mean Percentage Score) in English SY 2011–12
§ Summary result of Phil-‐IRI SY 2011–12
§ Summary result of Phil-‐IRI SY 2012–13 (beginning of school year)
§ SRIP 2012–13 § Brief municipal,
barangay, and school profiles
2. Teacher Reading Instructional Plan and Practices, Including Use of Instructional Materials (i) “Before” -‐ What were the teachers’ reading instructional practices
the previous school year? (ii) “With WSRP” -‐ What practices from the WSRP training were applied?
Which were modified or enhanced? Which were not applied, and why?
-‐ What were the results of applying or not applying the strategies?
§ FGD § Principal’s
SCOPE observations (including lesson planning aspects and use of instructional materials; the tool will have a list of guiding questions)
§ Sample lesson plans from previous school year
§ Sample lesson plan generated during and after WSRP enhancement training
3. Remedial and Enhancement Reading Practices and Materials (i) “Before” -‐ What were the teachers’ remedial and enhancement
reading strategies and materials used the previous school year?
-‐ What were the results? (ii) “With WSRP” -‐ What strategies and materials from the WSRP training
were applied? Which were modified or enhanced? Which were not applied, and why?
-‐ What were the results of applying or not applying the strategies?
§ FGD § SRIP 2012–13 § Summary results
of RARS § Documentation
of instructional materials used
2. 4. Student Assessments (i) “Before” -‐ What assessment tools for teachers’ instructional
§ FGD § SRIP 2012–13 § Same
information as in
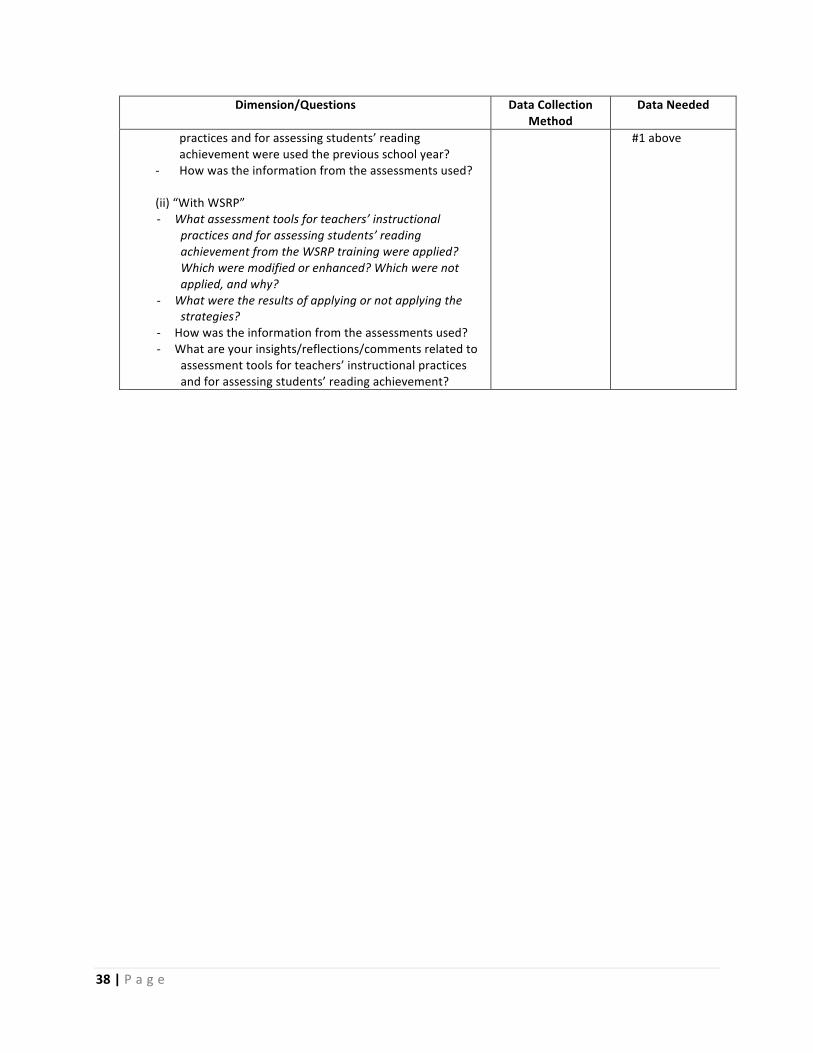
38 | P a g e
Dimension/Questions Data Collection Method
Data Needed
practices and for assessing students’ reading achievement were used the previous school year?
-‐ How was the information from the assessments used? (ii) “With WSRP” -‐ What assessment tools for teachers’ instructional
practices and for assessing students’ reading achievement from the WSRP training were applied? Which were modified or enhanced? Which were not applied, and why?
-‐ What were the results of applying or not applying the strategies?
-‐ How was the information from the assessments used? -‐ What are your insights/reflections/comments related to
assessment tools for teachers’ instructional practices and for assessing students’ reading achievement?
#1 above

Contact information:
Marcial Salvatierra, Chief of Party ([email protected]) and Nancy Devine, Project Director ([email protected])
Education Development Center, Inc (EDC) 4th Floor ALCO Building 391 Sen Gil Puyat Ave. Makati City 1200 Metro Manila Philippines

BACKGROUND
In 2011, the Education Quality and Access to Learning and Livelihood Skills Phase 2 (EQuALLS2) Project piloted the Whole School Reading Program (WSRP).
The WRSP is a school-based program designed to strengthen teachers’ skills in teaching reading, in order to improve students’ decoding, fluency, and comprehension skills. It involves the school administrators and all English, science, and math teachers at all grade levels (1 to 6) in a series of activities focused on building reading, writing, listening, speaking, and literacy skills in English classes, and further reinforcing these skills in math and science class.
At the core of the WSRP approach is the preparation of a School Reading Improvement Plan, a practice introduced by EQuALLS2 for schools to commit to a year-long reading program implementation. It features the school’s planned activities regarding each of the eight components of the WSRP (Table 1). The school principal leads the planning process. Teachers contribute to it by providing input on the school’s overall and specific goals, and by specifying strategies and timeframe for executing each component. To ensure budget and institutional support, the WSRP School Reading Improvement Plan is integrated into the School Improvement Plan.
March 2013 Volume 2 Series 1March 2013 Volume 2 Series 1March 2013 Volume 2 Series 1
LearningLearningLearning SeriesSeriesSeries EQuALLS2 EQuALLS2 EQuALLS2 Whole School Reading Program: Whole School Reading Program: Whole School Reading Program: Case studies of two schools in MindanaoCase studies of two schools in MindanaoCase studies of two schools in Mindanao
Based on the positive assessment results of the pilot implementation, the EQuALLS2 Project expanded the reach of WSRP from 9 to 53 schools for the 2012–13 academic year. The expanded program started in April 2012 with a multi-day training for teachers and administrators. As a culminating activity of this training, school teams developed their School Reading Improvement Plans in May 2012.
From June to October 2012, students were assessed, School Reading Improvement Plans were implemented, teachers put into practice new instructional strategies, and support was provided by EQuALLS2 field staff and the Department of Education’s (DepED) supervisors.
During this period, as part of the research designed to describe the outcomes of the WSRP on teaching quality and student achievement in reading, two from the participating WRSP schools were chosen as case studies. These case studies examined the practices of each school based on the eight components of WSRP and identified the challenges faced by teachers and administrators as they strive to address the learning needs of students who are not reading at grade level.
This briefer presents an overview of the research and a summary of the synthesis of results from the two schools.
For more details, a copy of the full report can be downloaded from: www.edc.org.

The WSRP analytical framework assumes that the following three key components will contribute to improvements in students’ reading skills and student achievement:
Teachers’ classroom application of skills and competencies needed for students to become autonomous readers and competent writers
DepED administrator supervision and support
The provision of books for teaching and learning
Since the WSRP is only a 10-month program, it is expected to achieve only the short-term and immediate outcomes reflected in the framework. To document preliminary outcomes, an evaluation design augmented by case studies was implemented to do the following:
Examine changes in teaching quality and student achievement in grades 1–3
Assess changes in teachers’ beliefs and attitudes about teaching reading
Compare students’ reading levels in intervention schools with students’ reading levels in comparison schools, using the Early Grade Reading Assessment (EGRA)
A cohort study follows the progress of the same group of teachers and students in WSRP (or intervention) and non-WSRP (or comparison) schools across the one school-year study period, using a set of student assessments (Phil-IRI and EGRA), teacher observations (SCOPE), and a teacher survey. Case studies will contribute to a fuller understanding of how teachers apply new instructional strategies to the teaching of reading; further document the outcomes of teacher training, instructional materials development, administrator support, provision of books, and other WSRP components; and highlight challenges and emerging best practices.
Case Study Methodology
Using structured data collection methodologies (such as observations, interviews, and focus group discussions), a case study tells a story or describes a situation in depth and detail, holistically and in context. Analysis of the resulting data identifies themes and patterns that enhance understanding of the event, program, etc. (Merriam, 1998; Patton, 2002; Ryan and Bradley, 2009).
Within the overall WSRP research, a design for case studies was developed to document emerging best practices and to describe how the various components of the WSRP are contributing to outcomes. Protocols were
Page 2
Research Design
LE AR NI NG SE RIE S
Table 1. Eight Components of the WSRP
1. Teacher and administrator training: Courses on Learning to Read, Reading to Learn, Reading-Writing Connection
2. Student assessment: Training of administrators and teachers to use assessment tools to diagnose students’ reading skill. Monitoring the administration and implementation of reading related assessments.
3. Strengthening classroom reading instruction: Explicit instruction on phonics, phonemic awareness, word recogni-tion, vocabulary development, fluency, and reading compre-hension, and integrating these strategies in teachers’ daily lesson plan on reading.
4. Remedial reading instruction: Structured instruction for non-readers and frustrated readers in all grades.
5. Enrichment reading instruction: Structured instruction for instructional and independent readers in all grades.
6. Instructional materials development: Provision of materials to support student assessments, and mainstream, remedial and enrichment reading instruction.
7. Monitoring and technical support: Regular monitoring and technical support by DepED administrators to implement the reading program. Use of the Standard Classroom Observation Protocol for Education (SCOPE) tool for literacy instruction.
8. Support from stakeholders: School-initiated activities to generate parent involvement and support from LGUs and PTAs on the school’s reading initiatives.
developed for gathering qualitative data through focus group discussions (FGD) and key informant interviews (KII) with teachers and administrators to better understand the findings of the teacher beliefs survey and student reading assessment tools. Questions related to fidelity of implementation (e.g., adherence to WSRP design, program content, quality of delivery) were embedded in the FGD and KII tools.
Data-gathering for the case studies was planned to take place midway through the academic year, giving teachers time to incorporate new instructional practices and to benefit from ongoing technical assistance provided by DepED supervisors and WSRP Project Officers (who conduct regular school monitoring visits).
For these case studies, two schools were selected: the Pedro C. Dolores Elementary School (PCDES) in Upi, Maguindanao, in the Autonomous Region in Muslim Mindanao; and Lun Padidu Central Elementary School in Malapatan, Sarangani Province, in Region XII.

M AR CH 201 3 V OLUM E 2 S ERI ES 1
Synthesis of Case Study Findings
The case studies are designed to determine which practices in the WSRP design have been adopted and how these are being applied by teachers in the classroom by contrasting previous with current practices.
The following are themes gleaned from the case studies using the primary components of WSRP as the framework of analysis.
Both schools are applying the concepts of beginning and developmental reading and are integrating the teaching of the five essential reading skills into pre-reading, reading, and post-reading activities.
The case studies demonstrate that integration of the reading skills to reinforce coherence and holistic instruction is being implemented as designed. There is evidence that there is a good level of replication of the integrated approach in teachers’ practices based on the lesson plan content and delivery. However, the formulation of higher-level questions, particularly for post-reading discussions, is an element in the integrated approach that needs further strengthening.
In both schools, explicit reading instruction is supported by instructional materials.
Teachers in both schools developed and used big books and a variety of materials, including educational technology generated stories, to support the integrated approach in the teaching of reading, as designed by the program. Most of the observed teachers modeled the proper use of big books. However, technical inputs in selecting appropriate stories and developing the teacher’s skill in story telling are still needed.
Both schools continue to struggle with integrating writing.
An expected output from the enhancement training is teachers being able to integrate a writing activity into their reading lessons. However, mixed results were noted from the class observations in both schools. In three of the six classes, writing activities consisted of copying from the board a set of sentences, or a one-paragraph selection in cursive form, and copying a selection from any book read in class. This practice may be attributed to the ingrained beliefs of many teachers that students are not able to write original texts in the early grades.
Page 3
CASE 1 - Pedro C. Dolores Elementary School (PCDES): Building Blocks for Reading
Ms. Mary Ann Prodigo asks her grade 2 pupil to sequence the events and retell the story using the pictures she prepared for her class.
LPCES has many elements of a successful reading improvement program in place. In previous years, it benefited from EQuALLS2 professional development programs directed at teaching English and reading. The local government’s reading advocacy and financial support facilitate awareness-building and parents’ participation in reading initiatives. The school has an educational technology facility that provides a wealth of teaching and learning resources. More important, LPCES has a complement of teachers who are open to learning and are driven by results of their practices on student performance.
“We are confident that we will be able to update our School Reading Improvement Plan after WSRP is
completed. The School Reading Improvement Plan served us well as a guide.” Principal of PCDES
Thus, continuing guidance to teachers on integrating authentic writing activities needs to be provided.
Structuring remedial and enrichment reading instruction sessions is challenging for both schools.
There is a definite time schedule for remedial reading sessions in both schools, but due to the lack of teachers to handle the high number of frustration-level and non-readers, all teachers are mobilized to handle remedial reading sessions. A challenge faced by teachers in both schools is students’ self-perception and the effect of being in a remedial reading class on their self-esteem. These are important considerations for refining the design of remedial reading interventions.

Synthesis of Case Study Findings
Both schools need policy and technical support to use SCOPE as a teacher assessment tool.
The principals consider SCOPE-Literacy to be an objective observation tool and are now exploring its continued use. An explicit directive from DepED to adopt the tool will ensure that the principals will continue using it beyond the WSRP project term.
Both schools are benefiting from strong local government advocacy and support for reading but need to continue exploring meaningful ways to engage parents.
The WSRP does not provide specific training or orientation on how to engage parents and LGUs, but by including stakeholder support as a program component, it highlights to school administrators and teachers the advantages of actively engaging the community to help improve students’ reading performance. Both schools have strong linkages with their respective local governments and have been successful in mobilizing resources for achievement test reviewers and school supplies.
Both schools gained from having a School Reading Improvement Plan.
The WSRP School Reading Improvement Plan served as the schools’ framework for focused action to achieve their goal of making every child a reader at his or her grade level. The challenge for WSRP is being able to demonstrate that the good results observed in the two schools covered by this case study can also be observed in the rest of the schools covered by the program. The program needs to continue ensuring the active involvement of the DepED district and division English supervisors, who will provide continuity as overseers of the school reading improvement system introduced by WSRP beyond the project term.
This publication was made possible by the generous support of the American people through the United States Agency for International Development (USAID). The contents of this publication are the sole responsibility of the Education Development Center (EDC) and do not necessarily reflect the views of USAID or the United States Government.
CASE 2 - Lun Padidu Central Elementary School (LPCES): Openness to Learning is Key to Success
The teacher checks students’ comprehension of the lesson by having students work in groups to choose the best ending for the given situation.
About 60 percent of the LPCES students are either non-readers or frustration-level readers. Thus, a key activity in LPCES’s School Reading Improvement Plan is the provision of structured remedial reading instruction in all grade levels. Teachers adjust the remedial reading lesson and the materials used based on the students’ reading level.
“To make every child a reader, both principal and
administrator should exercise their respective functions. It is good that we have a monitoring tool that both administrator and teachers understand.”
Principal of LPCES
43 Foundry Avenue Waltham, Massachusetts USA
Next Steps…
The findings will be used by teachers and administrators in DepED ARMM, Regions IX and XII as they expand and enhance Whole School Reading Program in the next school year. In addition, these qualitative findings will inform the interpretation of the quantitative results of student testing and teacher observation to give a fuller picture of school-level efforts to improve the reading skills of students.

ANNEX 4
WHOLE SCHOOL READING PROGRAM EVALUATION FINDINGS
Prepared by Dr. Elena Vinogradova and Gabriel Montero
June 2013

i
EXECUTIVE SUMMARY
The Whole School Reading Program (WSRP) is a school-based program implemented by Education Development Center’s (EDC) Education Quality and Access for Learning and Livelihoods Skills (EQuALLS2) program, a USAID-funded project in western Mindanao, Philippines. The WSRP was implemented for one school year in 53 schools in Mindanao—28 in Region 12, 14 in Region 9, and 11 in the Autonomous Region in Muslim Mindanao (ARMM)—reaching a total of 972 teachers and 38,566 students in grades 1 to 6. WSRP’s purpose is to improve students’ reading skills by strengthening teachers’ skills in teaching the five components of reading: phonological awareness, phonics, fluency, vocabulary, and comprehension. The basic program design involves school administrators and all English, science, and math teachers at all grade levels (1–6) in a series of activities focused on building reading, writing, listening, and speaking skills in English classes, while reinforcing these skills in math and science classes. As the name suggests, the project creates awareness about the importance of reading and writing skills throughout the school and encourages teachers in all grades to be cognizant of their role in supporting the acquisition of these skills. The WSRP model includes the following key components:
• Professional development courses for teachers and school administrators on teaching reading and writing, as well as on using assessment results to inform instruction, emphasizing
o Explicit instruction in phonics, phonemic awareness, word recognition, vocabulary development, fluency, and comprehension
o Technical guidance and mentoring support at the school level by school administrators and district supervisors
• Development of locally produced instructional materials
• Involvement of local stakeholders such as parents and community members in supporting school literacy initiatives
Anchoring the WSRP approach is the preparation of a School Reading Improvement Plan that sets goals for students reading below grade level, outlines activities for students reading at or above grade level, and identifies opportunities for teachers to improve their reading and writing instruction skills (Box 1).
Box 1 The Whole School Reading Program Model

ii
Evaluation Overview EDC implemented and evaluated the WSRP from June 2012 to March 2013 (one academic year in the
Philippines). The purpose of the evaluation study was to determine the effects of this one-year implementation of WSRP on teaching quality and student achievement in grades 2 and 3.1 The WSRP evaluation was designed to test whether the program was successful in effecting a positive change in student performance, teacher practices vis-à-vis reading, and teacher beliefs about literacy instruction. The evaluation addressed three global questions related to student performance, teacher performance, and teacher attitudes.
1. Was there a significant improvement in the reading skills of students in grades 2 and 3 as a
result of the intervention? 2. Did teacher instructional practice change as a result of the intervention?
3. Did teacher attitudes and beliefs about literacy instruction change as a result of the intervention?
The evaluation also looked at two questions regarding the relationships between teacher performance, teacher beliefs, and student performance.
4. Were the changes in teachers’ beliefs associated with changes in their instructional practices in teaching reading in English?
5. Were the changes in teachers’ instructional practices associated with changes in students' reading skills?
The evaluation employed a longitudinal quasi-experimental design that followed the progress of 54 teachers and their students in WSRP (intervention) schools and 39 teachers in non-WSRP (comparison) schools across seven divisions of Regions 9, 12, and the ARMM. Two tools were administered to teachers at both the intervention and comparison schools: a Teacher Belief and Practice Index (BIPI) to track self-reported changes in beliefs about teaching practice, and a modified and shortened version of the Standards-based Classroom Observation Protocol for Educators (SCOPE) in Literacy, designed to focus on literacy only. An electronic version of the Early Grade Reading Assessment (EGRA) was administered to both the intervention and comparison groups of students, comprising in all 391 second graders and 428 third graders. The SCOPE Literacy and EGRA were administered by DepEd Division supervisors who received training prior to each data collection.
Comparison schools were selected from schools in the three regions that had similar scores to the intervention schools on the National Achievement Test and the Philippines Informal Reading Inventory (Phil IRI). In general, students and teachers in the intervention group scored higher on the pretests than
1 In the 2012–2013 school year, the Philippines Department of Education implemented a K–12 curriculum, in which the mother tongue was used as the language of instruction in the first two grading periods of grade 1. Since WSRP focuses on reading in English, data were collected from grades 2 and 3 only.

iii
those in the randomly selected comparison group. Hence, for students we compared gain scores between the pre- and post-EGRA tests, while for teachers we compared gain scores between the pre- and post-administrations of the SCOPE tool and the BIPI survey.
Statistical analyses of the three datasets generally showed positive patterns of change between the pretests and posttests associated with WSRP’s interventions, although there is variability across regions. Below, we report the findings of the three tools (EGRA, SCOPE Literacy, and BIPI) and their association with the project interventions; we then discuss associations among the results of the three assessments.
Student Performance Results
EGRA is an orally administered set of subtasks designed to assess the basic literacy skills that are critical to becoming a good reader. The test administrator uses paper prompts to administer the subtests and a laptop computer to score the subtests as they are being administered. Box 2 lists the three EGRA subtests and the specific items they examine. Overall, for most subtests intervention group students showed a much larger gain from pretest to posttest than did their peers in the comparison group. Statistically, second-grade intervention group students gained significantly more from pretest to posttest in seven out of 10 subtests, whereas students from the comparison group gained more in just one subtest. Third-grade intervention group students gained significantly more in three subtests, and students from the comparison group gained significantly more in two other subtests. Table 1 shows summary results for pre-literacy subtests. Compared to the gains made by students in the comparison group, intervention group second graders gained significantly more from pretest to posttest in orientation to print and letter-naming subtests Third-grade intervention group students gained more in letter-naming and letter sounds subtests. Comparison students in both grades gained more in the initial sound identification subtest.
Table 1. Summary Results for Pre-literacy Subtests
GRADE 2 STUDENTS
Pretest Mean (St. Error)
Posttest Mean (St. Error)
Gain Score (St. Error)
Orientation to print (% correct; 3 questions)
Intervention 82.6% (1.07) 93% (0.696) 10.4%* (1.303)
Comparison 75.2% (1.285) 81.5% (1.207) 6.3% (1.533) Letters named (per minute) Intervention 48.8ǂ (0.854) 66.9 (0.944) 18.2*** (0.813) Comparison 39.7 (0.872) 52.8 (1.007) 13.1 (0.694) Letter sounds (per minute) Intervention 34.3ǂ (1.004) 42.2 (0.626) 7.7 (1.002)
Box 2 EGRA Subtests
• Pre-literacy skills o Orientation to print o Letter naming o Letter sounds o Initial sound identification
• Fluency skills o Familiar word reading o Invented word reading o Oral passage reading
• Comprehension and writing skills o Oral reading comprehension o Listening comprehension o Dictation

iv
Comparison 25.5 (1.381) 30.7 (0.753) 5.2 (1.306) Initial sound identification (% correct; 10 words)
Intervention 72.6%ǂ (1.055) 87.4% (0.742) 14.9% (0.91)
Comparison 48.5% (1.424) 66.8% (1.35) 18.4%* (1.152) GRADE 3 STUDENTS
Pretest Mean (St. Error)
Posttest Mean (St. Error)
Gain Score (St. Error)
Orientation to print (% correct; 3 questions)
Intervention 84.1% (0.848) 92.2% (0.616) 8.1% (1.005)
Comparison 83.1% (1.172) 88.2% (0.92) 5.1% (1.44) Letters named (per minute) Intervention 61.7 (0.719) 78.1 (0.694) 16.2 (0.574)** Comparison 55.2 (0.974) 68.6 (1.04) 13.3 (0.823) Letter sounds (per minute) Intervention 30.1 (0.522) 41.2 (0.522) 11 (0.573)* Comparison 30.5 (1.494) 37.9 (0.692) 7.4 (1.515) Initial sound identification (% correct; 10 words)
Intervention 73.9%ǂ (0.894) 87.6% (0.645) 13.8% (0.768)
Comparison 58.4% (1.419) 76.4% (1.134) 18% (1.11)** ǂ The group’s pretest mean score is statistically higher compared with the other group’s score, at p<.01 level. *The group’s gain score is statistically significantly higher than the other group’s at p <.05 level. **The group’s gain score is statistically significantly higher than the other group’s at p <.01 level. ***The group’s gain score is statistically significantly higher than the other group’s at p <.001 level.
Table 2 shows a summary of students’ learning gains in the EGRA fluency subtests. Although students in both groups gained substantially from pretest to posttest, second-grade students in the intervention group demonstrated statistically significantly larger gains in the speeds at which they read familiar words and an oral passage. Third-grade intervention students showed larger gains in the subtest on reading invented words.
Table 2. Summary Results for Fluency Subtests
GRADE 2 STUDENTS
Pretest Mean (St. Error)
Posttest Mean (St. Error)
Gain Score (St. Error)
Familiar word reading (words per minute)
Intervention 29.5ǂ (0.76) 40.4 (0.69) 10.8** (0.59)
Comparison 20.3 (0.83) 28.7 (0.74) 8.4 (0.67) Invented word reading (words per minute)
Intervention 26.5ǂ (0.64) 36.5 (0.59) 10 (0.44)
Comparison 20.5 (0.85) 28.9 (0.76) 8.5 (0.82) Oral passage reading (words per minute)
Intervention 34.1ǂ (0.94) 48.1 (0.91) 14.0** (0.71)
Comparison 22.9 (0.96) 33.7 (0.96) 10.8 (0.69)
GRADE 3 STUDENTS
Pretest Mean (St. Error)
Posttest Mean (St. Error)
Gain Score (St. Error)
Familiar word reading (words per minute)
Intervention 42.8 (0.80) 50.8 (0.70) 8.0 (0.78)
Comparison 35.5 (0.92) 43.9 (0.96) 8.4 (0.65) Invented word reading (words per minute)
Intervention 37 (0.59) 45.9 (0.58) 8.8* (0.48)

v
Comparison 32.1 (0.83) 39.4 (0.79) 7.3 (0.53) Oral passage reading (words per minute)
Intervention 57.8 (1.07) 63.9 (0.91) 6.1 (0.88)
Comparison 47.5 (1.37) 54.3 (1.24) 6.8 (0.84) ǂ The group’s pretest mean score is statistically higher compared with the other group’s score, at p<.01 level. * The gain score is statistically significant at p<.05 level (one-tail test). ** The gain score is statistically significant at p <.01 level (one-tail test). *** The gain score is statistically significant at p <.001 level (one-tail test).
It is important to note that although the EGRA testing showed relatively high pre-literacy and fluency skills at pretest, particularly among the third graders, students exhibited very low listening and reading comprehension skills in both grades during both rounds of testing (Table 3). A lack of direct correspondence between oral reading fluency and reading comprehension is frequently observed in countries where instruction does not occur in a native language, as is often the case in the Philippines.
Table 3. Summary Results for Comprehension and Writing Subtests
GRADE 2 STUDENTS
Pretest Mean (St. Error)
Posttest Mean (St. Error)
Gain Score (St. Error)
Reading comprehension (% correct; 6 questions)
Intervention 9.5%ǂ (0.66) 18.2% (0.88) 8.7%*** (0.69)
Comparison 3.6% (0.44) 7.8% (0.56) 4.3% (0.48) Listening comprehension (% correct; 5 questions)
Intervention 9.5%ǂ (0.64) 18.9% (0.83) 9.4%*** (0.68)
Comparison 4% (0.35) 6.7% (0.47) 2.7% (0.47) Dictation (% correct; 16 points) Intervention 25.9%ǂ (0.809) 47% (1.005) 21.1%***
(0.809) Comparison 14.1% (0.641) 29.2% (0.891) 15.1% (0.639) GRADE 3 STUDENTS
Pretest Mean (St. Error)
Posttest Mean (St. Error)
Gain Score (St. Error)
Reading comprehension (% correct; 6 questions)
Intervention 17.9% (0.78) 25.2% (0.86) 7.3% (0.65)
Comparison 12.3% (0.85) 24.5% (1.09) 12.1%*** (0.81)
Listening comprehension (% correct; 5 questions)
Intervention 12.4% (0.58) 19% (0.77) 6.7% (0.61)
Comparison 9.3% (0.63) 15.9% (0.86) 6.5% (0.63) Dictation (% correct; 16 points) Intervention 38.3% (0.836) 57.5% (0.801) 19.2% (0.607) Comparison 30.1% (1.004) 47.7% (1.103) 17.6% (0.731) ǂ The group’s pretest mean score is statistically higher compared with the other group’s score, at p<.001 level. * The gain score is statistically significant at p<.05 level (one-tail test). **The gain score is statistically significant at p <.01 level (one-tail test). *** The gain score is statistically significant at p <.001 level (one-tail test).
Second-grade intervention group students gained statistically significantly more than second-grade comparison group students, as evidenced by a comparison of means test for the average gains across all ten EGRA subtests. No statistically significant difference was found between the gains made by the third

vi
graders in the two groups (Table 4). Thus, the intervention appeared to have been particularly effective for the second-grade classrooms. The question of why the third graders did not gain as much as the second graders merits further inquiry.
Table 4. Comparison of Average EGRA Gains by Grade
GRADE 2 STUDENTS GRADE 3 STUDENTS
Mean Gains (St. Error)
t Sig. (2-tailed) Mean Gains (St. Error) t Sig. (2-tailed)
Intervention group 15.38% (.40) 4.856 .000 12.40% (.31) .521 n/s Comparison group 12.58% (.42) 12.13% (.42)
The overall improvement in achievement was more significant for female students than for male students. Intervention group girls made larger gains in more EGRA subtests than the boys did. Second-grade girls also outscored boys on both the pre- and posttest. This pattern also prevails in the data for the third graders, although in this case the difference between boys and girls is not as pronounced in some subscales. These results merit further inquiry.
Finally, a significant difference in student learning gains was found across three regions. Intervention group second graders in the ARMM region demonstrated the largest overall gains over comparison group students, while in the same region third graders in the comparison group gained significantly more than their peers in the intervention group. In Region 9, intervention group third graders gained statistically significantly more than their counterparts in the comparison group. Finally, intervention group second graders in Region 12 showed marginally larger average gains than their peers in the comparison group. Table 5 shows the results of the comparison of means analysis of the average gains across all ten EGRA subtests by region.
Table 5. Comparison of Average EGRA Gains by Grade and Region
ARMM
GRADE 2 AVERAGE GAINS GRADE 3 AVERAGE GAINS
Mean Gains (St. Error) T Sig. (2-
tailed) Mean Gains (St. Error) T Sig. (2-
tailed) Intervention group 21.86% (.87) 7.561 .000 10.06% (.80) Comparison group 12.31% (.91) 15.68% (.97) 4.474 .000
Region 9
GRADE 2 AVERAGE GAINS GRADE 3 AVERAGE GAINS
Mean Gains (St. Error) T Sig. (2-tailed) Mean Gains
(St. Error) T Sig. (2-tailed)
Intervention group 12.32% (.63) 1.419 n/s 11.59% (.44) 5.251 .000 Comparison group 10.88% (.82) 07.04% (.85)

vii
Dimension 1 Provides students with structured opportunities to develop their encoding (spelling/writing) and decoding skills
Dimension 2 Provides students with structured opportunities to increase their vocabulary in order to improve their reading comprehension and writing skills
Dimension 3 Uses diverse instructional strategies to develop students’ reading fluency
Dimension 4 Uses diverse instructional strategies to develop students’ comprehension skills
Dimension 5 Implements instruction that recognizes the importance of independent, original writing in the development of reading skills
Box 3 Five Selected Dimensions of SCOPE Literacy
Region 12
GRADE 2 AVERAGE GAINS GRADE 3 AVERAGE GAINS
Mean Gains (St. Error) T Sig. (2-tailed) Mean Gains
(St. Error) T Sig. (2-tailed)
Intervention group 15.07% (.56) 1.984 .048 13.84% (.46) .844 n/s Comparison group 13.46% (.58) 13.24% (.53)
Regression analysis also showed that the intervention was particularly effective in improving overall student achievement among second graders in ARMM (R2 = .157) and among third graders in Region 9 (R2 = .049). Regression analysis also found that the intervention had a statistically significant positive impact on achievement among second graders in Region 12, but the amount of impact was very small (R2 = .005) 2. Further research is needed to understand why the intervention had different effects across regions.
Instructional Practice Results
Teachers’ reading instructional practices in the intervention and comparison sample groups were observed twice by trained classroom observers, using an abbreviated adaptation
of SCOPE Literacy, to capture whether or not the training resulted in a measurable change at the classroom practice level. Observations focused on five dimensions of good instructional practice in literacy classrooms. Specifically, trained observers looked for the degree to which the teacher demonstrated the practices described in Box 3. Scores were determined by a five-level rubric containing multiple descriptions of performance for each level, with the lowest score being 1 and the highest 5 (a score of 1 indicates that the teacher rarely
2 R-squared is a linear regression statistic that helps understand the extent to which participation in the WSRP program explains variation in student performance improvement. Converted to percentage points, R2 of .157 means that participation in the WSPR program explained 15.7 percent of variance in the overall achievement improvement among ARMM second graders; R2 of .049 means that participation in the WSPR program explained nearly 5 percent of variance in the overall achievement improvement among District 9 third graders, and the R2 of .005 means that participation in the WSPR program explains a half of one percent of variance in the overall achievement improvement among District 12 second graders. These results show that the program made a substantial impact on the EGRA performance of ARMM second graders, moderate impact on the EGRA performance of Region 9 third graders, and small impact on the EGRA performance of Region 12 second graders.

viii
demonstrates the practices; 2, that he/she does so with limited application; 3, does so occasionally; 4, does so frequently; and 5, demonstrates consistent application of the practices related to each of the component skills of reading).
SCOPE dimension 1 focuses on providing students with explicit instruction in letter names and sounds, word recognition, and other structured phonemic awareness activities to develop their encoding (spelling/writing) and decoding skills. Based on the SCOPE scoring scale for this dimension (see Box 3), results show that at pretest, a large percentage (42.6 percent) of the intervention group teachers scored 2, while a similar proportion (38.5 percent) of the comparison group teachers scored at the same level (Figure 1). At posttest, half of the intervention group teachers improved their score to 3, while only 28.2 percent of the comparison group teachers did so (Figure 2).
Figure 1. SCOPE Literacy Dimension 1 Pretest
Figure 2. SCOPE Literacy Dimension 1 Posttest
SCOPE dimension 2 focuses on teachers’ application of strategies—for example, teaching sight words; using synonyms and antonyms, suffixes and prefixes; and identifying context clues—to introduce new or difficult words to help students increase their vocabulary. The related scoring scale is shown in Box 4.
Results showed that at pretest, about half of the intervention and a similar proportion of the comparison group scored 2 for this dimension (see Figure 3). At posttest, the percentage of teachers who scored 2 increased slightly, to 63 percent for the intervention group and 61.5 percent for the comparison group. However, compared to the non-WSRP teachers, a higher percentage of intervention group teachers improved their scores from 2 to 3—27.8 percent at pretest versus 31.5 percent at posttest (see Figure 4). The comparison of gain score, or pretest-posttest, results showed that the percentage of intervention group respondents with a score of 1 decreased by nearly 17 points (from 18.5 percent to 1.9 percent), with corresponding movement into the upper score categories, particularly for score 2, which increased by 11 percentage points. These positive changes are encouraging and
1.9%
27.8%
50.0%
20.4%
0.0%
28.2%
41.0%
28.2%
2.6% 0.0%
0%
10%
20%
30%
40%
50%
60%
Score 1 Score 2 Score 3 Score 4 Score 5
Intervention (n=54) Comparison (n=39)
14.8%
42.6%
31.5%
11.1%
0.0%
35.9% 38.5%
20.5%
5.1% 0.0%
0%
10%
20%
30%
40%
50%
60%
Score 1 Score 2 Score 3 Score 4 Score 5
Intervention (n=54) Comparison (n=39)

ix
indicate potential for continued improvement. For the comparison group respondents, the corresponding change in scores 1 and 2 represented a decrease of only 5 percent and an increase of only 7 percent respectively.
Figure 3. SCOPE Literacy Dimension 2 Pretest
Figure 4. SCOPE Literacy Dimension 2 Posttest
The SCOPE dimension 3 focuses on teachers’ application of strategies to develop students’ ability to read with speed, accuracy, and proper expression. Comprehension is difficult without fluency. A student needs to be able to recognize words automatically so that he/she can focus on understanding the text without constantly stopping to decode. Strategies such as modeling expressive reading to students, asking students to read aloud or tell stories to the class, and engaging in activities such as choral reading and peer/paired reading help develop fluency. Based on the scoring criteria, results, as shown in Figure 5, indicated that at pretest, intervention group teachers scored mostly between 2 (44 percent) and 3 (35.2 percent), while those in the comparison group scored between 1 (38.5 percent) and 2 (38.5 percent). At posttest, half of the intervention teachers scored 3, a 14.8 percent gain. The percentage of those who scored 4 also increased, to 14.8 percent (see Figure 6), a 12.9 percent gain from pretest. Teachers in the comparison group also improved at posttest, with half now scoring 2, although the percentage of those who scored 3 changed only slightly.
18.5%
51.9%
27.8%
1.9% 0.0%
35.9%
53.8%
10.3%
0.0% 0.0% 0%
10%
20%
30%
40%
50%
60%
70%
Score 1 Score 2 Score 3 Score 4 Score 5
Intervention (n=54) Comparison (n=39)
1.9%
63.0%
31.5%
3.7% 0.0%
30.8%
61.5%
7.7%
0.0% 0.0% 0%
10%
20%
30%
40%
50%
60%
70%
Score 1 Score 2 Score 3 Score 4 Score 5
Intervention (n=54) Comparison (n=39)

x
Figure 5. SCOPE Literacy Dimension 3 Pretest Figure 6. SCOPE Literacy Dimension 3 Posttest
Dimension 4 focuses on teachers’ demonstration of diverse instructional strategies to develop their students' reading comprehension skills. A teacher who demonstrates best practice, corresponding to the highest score of 5 (see Box 6) consistently models for students, before reading, how to use their prior knowledge and experiences about the topic and the associated vocabulary to better understand a text. During reading the teacher asks students to use contextual clues to infer meaning and/or confirm predictions and understanding. Comprehension questions are a blend of the literal and inferential. After reading the teacher consistently and systematically requires students to infer, express their opinion, make judgments, analyze, predict, compare, and synthesize—as well as to build connections between their life experiences and the ideas presented in that text and others.
The intervention group teachers’ scores varied widely at pretest: 20.4 percent scored 1, 53.7 percent scored 2, and 24.1 percent scored 3; the comparison group scored between 1 (48.7 percent) and 2 (38.5 percent) (see Figure 7). At posttest, 53.7 percent of the intervention group teachers improved their score to 3, while the percentage of those who scored 4 also increased, from 1.9 percent to 14.8 percent (see Figure 8). The proportion of comparison group teachers who scored 2 and 3 also increased at posttest, but their gain scores were less than those in the intervention group. Also at posttest, all of the intervention group teachers who had scored 1 improved to the next highest score, whereas 33 percent of those in the comparison group remained at score 1.
18.5%
44.4%
35.2%
1.9% 0.0%
38.5% 38.5%
23.1%
0.0% 0.0% 0%
10%
20%
30%
40%
50%
60%
Score 1 Score 2 Score 3 Score 4 Score 5
Intervention (n=54) Comparison (n=39)
1.9%
33.3%
50.0%
14.8%
0.0%
23.1%
51.3%
25.6%
0.0% 0.0% 0%
10%
20%
30%
40%
50%
60%
Score 1 Score 2 Score 3 Score 4 Score 5
Intervention (n=54) Comparison (n=39)

xi
Figure 7. SCOPE Literacy Dimension 4 Pretest
Figure 8. SCOPE Literacy Dimension 4 Posttest
In dimension 5, the best practice, corresponding to a score of 5 in the scale, is exemplified by a teacher who engages students in spontaneous writing activities on topics linked to students’ experiences, texts they have read or heard, or topics of their own choice. Incorporating short and simple writing exercises after reading a story or text is a practice that is strongly encouraged as a way to develop good writers. The teacher also consistently helps students learn from their errors and take risks with their speaking and writing. The results at pretest showed that most of the teachers—77.8 percent of the intervention and 79.5 percent of the comparison group—scored 1, that is, they limited students’ writing activities to copying or completing exercises. The rest of the teachers in both groups provided minimal, basic, and repetitive writing exercises, corresponding to a score of 2 (see Figure 9). These observations appear consistent with teachers’ beliefs that it is very difficult for young learners to learn how to write, and with the misconception that authentic writing should be introduced no earlier than grades 3 or 4.
At posttest, the percentage of intervention group teachers who scored 1 dropped from 77.8 percent to 18.5 percent while, encouragingly, the share receiving a rating of 3 grew from 1.9 percent to 27.8 percent. Many of the teachers in the comparison group remained at score 1, although about 7.7 percent improved their score to 3 (see Figure 10).
0.0%
31.5%
53.7%
14.8%
0.0%
33.3%
41.0%
25.6%
0.0% 0.0% 0%
10%
20%
30%
40%
50%
60%
Score 1 Score 2 Score 3 Score 4 Score 5
Intervention (n=54) Comparison (n=39)
20.4%
53.7%
24.1%
1.9% 0.0%
48.7%
38.5%
12.8%
0.0% 0.0% 0%
10%
20%
30%
40%
50%
60%
Score 1 Score 2 Score 3 Score 4 Score 5
Intervention (n=54) Comparison (n=39)

xii
Figure 9. SCOPE Literacy Dimension 5 Pretest
Figure 10. SCOPE Literacy Dimension 5 Posttest
Comparison of means of total SCOPE gains showed some regional differences (Table 6). Intervention group teachers in the ARMM and in District 12 gained statistically significantly more from pretest to posttest compared with the comparison group teachers (p<.05 level). Due to the small sample size in each region, however, these results need to be interpreted with caution.
Table 6. Comparison of Average SCOPE Gains by Region
ARMM Teachers
Mean Gains (St. Error) T Sig. (2-tailed) Intervention group (n=9) 3.11 (1.02) 2.90 .012 Comparison group (n=6) -1.50 (1.20)
District 9 Teachers
Mean Gains (St. Error) T Sig. (2-tailed) Intervention group (n=15) 4.47 (.70) 1.75 n/s Comparison group (n=9) 2.11 (1.30)
District 12 Teachers
Mean Gains (St. Error) T Sig. (2-tailed) Intervention group (n=29) 2.10 (.49) 2.18 .034 Comparison group (n=24) .70 (.46)
To summarize this section, the intervention group teachers scored higher on four out of five SCOPE Literacy dimensions at pretest, and higher on all five at posttest, than those in the comparison group. Both the intervention and comparison group teachers scored highest on dimension 1 of SCOPE Literacy (“Provides students with structured opportunities to develop their encoding (spelling/writing) and decoding skills”), followed by dimensions 2, 3, and 4. Both groups scored lowest on dimension 5
77.8%
20.4%
1.9% 0.0% 0.0%
79.5%
17.9%
2.6% 0.0% 0.0% 0%
10%
20%
30%
40%
50%
60%
70%
80%
90%
Score 1 Score 2 Score 3 Score 4 Score 5
Intervention (n=54) Comparison (n=39)
18.5%
53.7%
27.8%
0.0% 0.0%
74.4%
17.9%
7.7% 0.0%
0.0% 0%
10%
20%
30%
40%
50%
60%
70%
80%
90%
Score 1 Score 2 Score 3 Score 4 Score 5
Intervention (n=54) Comparison (n=39)

xiii
(“Implements instruction that recognizes the importance of independent, original writing in the development of reading skills”), although the intervention group teachers demonstrated the greatest gains in this dimension from pretest to posttest. The comparison of means showed a larger gain in all five SCOPE Literacy dimensions among teachers in the intervention group (p<.01) than among those in the comparison group. The analysis by dimension showed statistically significant improvement among intervention group teachers in three out of five SCOPE Literacy dimensions:
• Uses diverse instructional strategies to develop students' reading fluency (t = 2.10; p<.05) • Uses diverse instructional strategies to develop students' comprehension skills (t = 2.71; p<.01) • Implements instruction that recognizes the importance of independent, original writing in the
development of reading skills (t = 4.70; p<.001)
Results of linear regression analysis showed that the project was effective in improving instructional practices of teachers in both grades. For the second grade teachers, participation in the WSRP program was associated with an increase in the overall SCOPE score by 2.12 points (significant at p<.05 level). For the third grade teachers, participation in the WSRP program was associated with an increase in the overall SCOPE score by 2.32 points (significant at p<.01 level). The associated r-squared was found to be .135 for the second grade teachers, and .139 for the third grade teachers.
Teachers’ Beliefs and Self-Reported Instructional Practices
It is widely recognized that teachers’ beliefs regarding how reading and writing should be taught, together with their expectations of how students learn to read and write, impact their instructional practices (see Box 4).3 The BIPI documents teachers’ attitudes and beliefs about how students learn to read and write, as well as their perceptions of the degree to which they integrate the key practices emphasized in the training into their teaching. The BIPI consists of four sections: (A) teachers’ demographic information, (B) self-reports on frequency of use of literacy-related instructional practices in the classroom, (C) statements about beliefs relative to teaching literacy, and (D) statements about students’ abilities in relation to literacy. Pre- and posttest survey gains were compared by section for sections B and C; no changes were anticipated or looked for in section A on demographics.
To determine whether WSRP training resulted in a change in teachers' beliefs and attitudes about teaching reading and writing, a composite score for select practices was created. The gain score was computed from the pretest and posttest data (gain score = posttest composite – pretest composite) and then converted from the total number of questions in the composite into a percentage of correctly answered questions. The comparison of means analysis was conducted to determine if there was a difference in changes in the composite gain score between intervention and comparison group teachers. Overall, statistical analyses of changes in BIPI survey responses between pretest and posttest showed
3 For additional information, see Creating Effective Teaching and Learning Environments: First Results from the Teaching and Learning International Survey. OECD, 2009.

xiv
larger overall positive change in the three BIPI sections for the intervention group than for comparison group teachers.
For Section B, a comparison of means test showed a statistically significant difference in composite scores between pretest and posttest. The change was significantly larger for the intervention group at p<.01 level. For section C, comparison of means test showed a statistically significant positive change in composite scores between pretest and posttest for both intervention and comparison groups; the difference in gains between the two groups was not significant. Section D was analyzed descriptively only at the dimension level, so no comparison of means test was conducted.
In general, while positive, BIPI results were also puzzling, as the data showed fluctuations and changes in beliefs among comparison group teachers. This finding suggests that the changes we have documented might be attributable to other factors beyond WSRP. It could also indicate that teachers imputed their own meanings to the questions on the survey or misunderstood them during its administration. These issues bear further examination.
Synthesis
The WSRP project produced positive and statistically significant improvement in both student achievement and teacher practice; it also documented attitudinal movement in a positive direction among both groups. However, our evaluation questions also asked about the associations between the results we found. These are discussed below.
Teacher Performance and Student Achievement
We found a clear association between teacher performance (as measured by SCOPE Literacy) and student achievement (as measured by EGRA). Bivariate statistical analysis showed a positive association between all five SCOPE Literacy dimensions and student achievement on EGRA subtests, as measured at posttest. The relationship was found to be robust: Pearson’s r ranged between .3 and .4, which denotes
Box 4 Why are teachers’ beliefs and attitudes about reading important?
There is a general consensus from research studies that teachers hold implicit models about reading and about how students learn how to read. The beliefs underpinning these models act as “filters” through which teachers make instructional decisions.
These beliefs impact teachers’ instructional practice. Teachers who regard reading as a process of acquiring a set of rules for decoding and interpreting text place a heavy emphasis on mastery and the application of phonetical rules, whereas teachers who view reading as the creative process of negotiating meaning from text tend to include in their practices diverse reading strategies such as storytelling, writing, and the sharing of ideas.
Teachers who believe that all children can learn to read tend to promote literacy development, whereas those who believe that some children are naturally incapable of learning to read tend to create a debilitating reading instruction environment.
The ways in which teachers adapt or adopt new practices in their classroom are related to whether their beliefs match the assumptions inherent in the new programs or instructional teaching methods.
Ashton (1990); Richards, Gripe, and Thompson (1987); Hollingsworth (1989); Mumby (1984).

xv
a fairly strong association. Of five SCOPE Literacy dimensions, explicit instruction in comprehension was found to be most strongly associated with all nine EGRA subtests. Instruction in the fluency dimension was found to be strongly associated with letter sounds, initial sound identification, and dictation. Predictably, instruction in the writing dimension was found to be most strongly associated with student achievement in dictation. Finally, instruction in the decoding dimension was found to be rather strongly associated with the pre-literacy skills subtests (letter naming, letter sounds, and initial sound identification), as well as invented word reading, listening comprehension, and dictation.
Correlation analysis of improvements in SCOPE Literacy and EGRA scores from pretest to posttest did not reveal any statistically significant associations between the changes in instructional practices as captured by the SCOPE Literacy and improvements in student performance on EGRA subtests, probably because instructional practices must mature before they can have a measurable impact on student achievement.
While the correlations observed between EGRA and SCOPE Literacy scores are important and suggestive, further study is required before definitive conclusions can be drawn about a causal relationship between teacher practice, as measured by SCOPE Literacy, and student performance, as measured by EGRA.
Teacher Attitudes and Teacher Performance
Correlational analysis of BIPI results and teacher observation scores showed a positive association between the Section B composite score of the BIPI survey—which asks teachers to report on the frequency of literacy-specific classroom practices they use—and teacher observation scores on all five SCOPE Literacy dimensions. Bivariate correlation analysis also found a statistically significant positive association between the Section C composite score of the BIPI survey—which asks teachers to agree or disagree with a series of statements about teaching literacy—and SCOPE Literacy scores for three out of five dimensions. Regression analysis failed to find a statistically significant association between a change in teacher beliefs and a change in instructional practices, as captured by SCOPE Literacy.
Conclusions
The WSRP was found to be effective in improving both teacher practice and student achievement. Overall key findings include the following:
• A statistical comparison of EGRA gains in achievement between intervention and comparison schools showed that intervention group second graders gained significantly more than their comparison group counterparts.
• Regression analysis showed that the intervention was particularly effective in improving overall student achievement in second grade in ARMM and in third grade in Region 9.
• Compared with non-WSRP teachers, WSRP teachers showed statistically significant improvement in three out of five SCOPE Literacy dimensions. Improvement in teacher performance was particularly pronounced in ARMM and District 12.

xvi
• Gender comparisons revealed that female students outperformed male students both in subtest results and in the degree of improvement shown between pretest and posttest.
• WSRP teachers demonstrated statistically significant positive shifts in their beliefs about teaching literacy, as measured by the BIPI survey.
• Statistical analyses of the three datasets—BIPI, SCOPE Literacy, and EGRA—showed positive patterns of change between pretest and posttest that support the WSRP model.
The full report describes findings from the data collected and analyzed for each of the evaluation questions, which may be particularly useful for education policymakers and practitioners seeking to gain a better understanding of the process of bringing about sustained improvement in reading instruction in the Philippines.

xvii
TABLE OF CONTENTS
Executive Summary ........................................................................................................................................ i
Table of Tables ............................................................................................................................................ xix
Table of Figures ........................................................................................................................................... xxi
Introduction .................................................................................................................................................. 1
Overview of Report ................................................................................................................................... 2
Evaluation Methodology ............................................................................................................................... 2
Purpose and Questions ............................................................................................................................. 2
Evaluation Design ...................................................................................................................................... 2
Sampling Design. ................................................................................................................................... 4
Data Collection Methods ...................................................................................................................... 4
Data analysis ......................................................................................................................................... 5
Probability of Selection and Design Weight .......................................................................................... 6
Limitations ................................................................................................................................................ 6
Study Participants ......................................................................................................................................... 7
Teacher demographic characteristics ....................................................................................................... 7
Student Demographic Characteristics .................................................................................................... 10
STUDENT ASSESSMENT FINDINGS .............................................................................................................. 11
Pre-Literacy skills..................................................................................................................................... 14
Pre-literacy skills: grade 2 ................................................................................................................... 14
Pre-literacy skills: grade 3 ................................................................................................................... 20
Fluency skills ........................................................................................................................................... 26
Fluency skills: grade 2 ......................................................................................................................... 26
Fluency skills: grade 3 ......................................................................................................................... 32
Comprehension and writing skills ........................................................................................................... 38
Comprehension and writing Skills: Grade 2 ........................................................................................ 38
Comprehension and writing Skills: Grade 3 ........................................................................................ 44
EGRA Reliability analysis ............................................................................................................................. 51
TEACHER OBSERVATION FINDINGS ............................................................................................................ 52
Summary of the observation results ....................................................................................................... 52
Dimension-level descriptive analysis results .......................................................................................... 54
SCOPE Literacy Dimension 1: Encoding and Decoding ....................................................................... 54
SCOPE Literacy Dimension 2: Vocabulary ........................................................................................... 56
SCOPE Literacy Dimension 3: Reading fluency ................................................................................... 57

xviii
SCOPE Literacy Dimension 4: comprehension skills ........................................................................... 58
SCOPE Literacy Dimension 5: writing skills ......................................................................................... 58
TEACHER BELIEF SURVEY FINDINGS ............................................................................................................ 60
Section B: self-reported Frequency of instructional practices ............................................................... 60
Section C: beliefs about teaching literacy ............................................................................................... 70
Section D: Teacher beliefs about abilities of their students ................................................................... 76
Cross-dataset analyses ................................................................................................................................ 82
Discussion and Conclusions ........................................................................................................................ 87
Annexes ....................................................................................................................................................... 90
Annex A. Analytical Framework .............................................................................................................. 90
Annex B: Study of Teachers’ Classroom Practices and Perceptions With Respect to Reading And Writing (2012) ......................................................................................................................................... 92
Beliefs and Instructional Practices Inventory (BIPI) ............................................................................ 93
Annex C: SCOPE Literacy ......................................................................................................................... 99
Annex D. Early Grade Reading Assessment (EGRA) .............................................................................. 100
Annex E: Results of Regression Analysis ............................................................................................... 102
Results of regression analysis for the total EGRA gains, by Region .................................................. 102
Results of regression analysis for the total SCOPE gains .................................................................. 103
Annex F. Additional Analyses of EGRA Data ......................................................................................... 105
Pre-Literacy Subtests, Grade 2 .......................................................................................................... 105
Pre-Literacy Subtests, Grade 3 .......................................................................................................... 106
Fluency Subtests, Grade 2 ................................................................................................................. 108
Fluency Subtests, Grade 3 ................................................................................................................. 110
Comprehension and Writing Subtests, Grade 2 ............................................................................... 112
Comprehension and Writing Subtests, Grade 3 ............................................................................... 113

xix
TABLE OF TABLES
Table 1. Summary Results for Pre-literacy Subtests .................................................................................... iii Table 2. Summary Results for Fluency Subtests .......................................................................................... iv Table 3. Summary Results for Comprehension and Writing Subtests .......................................................... v Table 4. Comparison of Average EGRA Gains by Grade ............................................................................... vi Table 5. Comparison of Average EGRA Gains by Grade and Region ............................................................ vi Table 6. Comparison of Average SCOPE Gains by Region ........................................................................... xii Table 7. Sampled teachers, by grade ............................................................................................................ 4 Table 8. Data collection schedule ................................................................................................................. 5 Table 9. Student gender, by grade .............................................................................................................. 10 Table 10. EGRA summary results, by grade ................................................................................................ 11 Table 11. EGRA summary results, by grade and gender ............................................................................. 11 Table 12. Comparison of EGRA gains, by grade .......................................................................................... 12 Table 13. Comparison of average EGRA gains, by grade and region .......................................................... 13 Table 14. Results for EGRA pre-literacy skills subtests, grade 2 ................................................................. 14 Table 15. Results for EGRA pre-literacy skills subtests, grade 2, by gender ............................................... 17 Table 16. Results for EGRA pre-literacy subtests in, grade 2, by region ..................................................... 19 Table 17. Results for EGRA pre-literacy skills subtests, grade 3 ................................................................. 20 Table 18. Results for EGRA pre-literacy skills subtests, grade 3, by gender. .............................................. 23 Table 19. Results for EGRA pre-literacy subtests, grade 3, by region ......................................................... 24 Table 20. Results for EGRA fluency subtests, grade 2................................................................................. 26 Table 21. Results for EGRA fluency subtests, grade 2, by gender .............................................................. 29 Table 22. Overall results for EGRA fluency subtests, grade 2, by region .................................................... 30 Table 23. Results for EGRA fluency subtests, grade 3................................................................................. 32 Table 24. Results for EGRA fluency subtests, grade 3, by gender. ............................................................. 35 Table 25. Overall results for EGRA subscales in ARMM, grade 3 ................................................................ 36 Table 26. Overall results for EGRA subtests, grade 2.................................................................................. 39 Table 27.Results for EGRA subtests, grade 2, by gender ............................................................................ 43 Table 28. Overall results for EGRA subscales in ARMM, grade 2 ................................................................ 43 Table 29. Results for EGRA comprehension and writing subtests, grade 3 ................................................ 45 Table 30. Results for EGRA comprehension and writing subtests, grade 3, by gender. ............................. 49 Table 31. Overall results for EGRA subscales in ARMM, grade 3 ................................................................ 49 Table 32.Reliability analysis for the pre-literacy skills subtests .................................................................. 51 Table 33. Reliability analysis for the fluency skills subtests ........................................................................ 51 Table 34. Reliability analysis for the comprehension skills subtests .......................................................... 51 Table 35. Pretest and posttest teacher observation results ....................................................................... 54 Table 36. Comparison of pretest and posttest results for Section B .......................................................... 61 Table 37. Comparison of gain score means for Section B ........................................................................... 61 Table 38. Descriptive analysis of section B ................................................................................................. 63

xx
Table 39. Comparison of pretest and posttest results................................................................................ 70 Table 40: Descriptive analysis of section C ................................................................................................. 72 Table 41: Descriptive analysis of section D: Teachers’ perceptions of students’ reading and writing skills .................................................................................................................................................................... 77 Table 42. Correlations between SCOPE Literacy dimensions and BIPI composites .................................... 82 Table 43. Correlations between EGRA subtests and BIPI composites ........................................................ 83 Table 44. Correlations between SCOPE Literacy dimensions and mean student achievement on EGRA subtests, at the posttest ............................................................................................................................. 84 Table 45. Correlations between SCOPE Literacy dimensions and mean student achievement on EGRA subtests, at the posttest, Grade 2 ............................................................................................................... 84 Table 46. Correlations between SCOPE Literacy dimensions and mean student achievement on EGRA subtests, at the posttest, Grade 3 ............................................................................................................... 84 Table 47. Correlations between SCOPE Literacy dimensions and mean student achievement on EGRA subtests, at the posttest, intervention group ............................................................................................. 85 Table 48. Correlations between SCOPE Literacy dimensions and mean student achievement on EGRA subtests, at the posttest, comparison group .............................................................................................. 85 Table 49. Incorrect responses for EGRA pre-literacy skills subtests, Grade 2. ......................................... 105 Table 50.Incorrect responses for EGRA pre-literacy skills subtests, Grade 2, by gender. ........................ 105 Table 51. Distribution of frequencies for letter naming subtest, disaggregated by gender, for Grade 2.105 Table 52. Distribution of frequencies for letter sounds subtest, disaggregated by gender, for Grade 2. 106 Table 53. Distribution of frequencies for initial sound identification subtest, disaggregated by gender, for Grade 2. ..................................................................................................................................................... 106 Table 54. Incorrect responses for five EGRA subtest, Grade 3. ................................................................ 106 Table 55. Incorrect responses for five EGRA subtest, Grade 3, by gender. .............................................. 107 Table 56. Distribution of frequencies for letter naming subtest, disaggregated by gender, for Grade 3.107 Table 57. Distribution of frequencies for letter sounds subtest, disaggregated by gender, for Grade 3. 107 Table 58. Distribution of frequencies for initial sound identification subtest, disaggregated by gender, for Grade 3. ..................................................................................................................................................... 108 Table 59. Incorrect responses for EGRA fluency subtests, Grade 2. ......................................................... 108 Table 60. Incorrect responses for EGRA fluency subtests, Grade 2, by gender. ...................................... 109 Table 61. Distribution of frequencies for familiar word reading subtest, disaggregated by gender, for Grade 2. ..................................................................................................................................................... 109 Table 62. Distribution of frequencies for invented words decoding subtest, disaggregated by gender, for Grade 2. ..................................................................................................................................................... 109 Table 63. Distribution of frequencies for oral passage reading subtest, disaggregated by gender, for Grade 2. ..................................................................................................................................................... 110 Table 64. Incorrect responses for EGRA fluency subtests, Grade 3. ......................................................... 110 Table 65. Incorrect responses for five EGRA subtest, Grade 3, by gender. .............................................. 111 Table 66. Distribution of frequencies for familiar word reading subtest, disaggregated by gender, for Grade 3. ..................................................................................................................................................... 111

xxi
Table 67. Distribution of frequencies for invented words decoding subtest, disaggregated by gender, for Grade 3. ..................................................................................................................................................... 111 Table 68. Distribution of frequencies for oral passage reading subtest, disaggregated by gender, for Grade 3. ..................................................................................................................................................... 112 Table 69. Distribution of frequencies for oral passage reading comprehension subtest, disaggregated by gender, for Grade 2. .................................................................................................................................. 112 Table 70. Distribution of frequencies for listening comprehension subtest, disaggregated by gender, for Grade 2. ..................................................................................................................................................... 112 Table 71. Distribution of frequencies for dictation subtest, disaggregated by gender, for Grade 2 ....... 113 Table 72. Distribution of frequencies for oral passage reading comprehension subtest, disaggregated by gender, for Grade 3. .................................................................................................................................. 113 Table 73. Distribution of frequencies for listening comprehension subtest, disaggregated by gender, for Grade 3 ...................................................................................................................................................... 114 Table 74. Distribution of frequencies for dictation subtest, disaggregated by gender, for Grade 3 ....... 114
TABLE OF FIGURES Figure 1 SCOPE Literacy Dimension 1 Pretest ............................................................................................ viii Figure 2 SCOPE Literacy Dimension 1 Posttest .......................................................................................... viii Figure 3 SCOPE Literacy Dimension 2 Pretest .............................................................................................. ix Figure 4 SCOPE Literacy Dimension 2 Posttest ............................................................................................ ix Figure 5 SCOPE Literacy Dimension 3 Pretest ............................................................................................... x Figure 6 SCOPE Literacy Dimension 3 Posttest ............................................................................................. x Figure 7 SCOPE Literacy Dimension 4 Pretest .............................................................................................. xi Figure 8 SCOPE Literacy Dimension 4 Posttest ............................................................................................ xi Figure 9 SCOPE Literacy Dimension 5 Pretest ............................................................................................. xii Figure 10 SCOPE Literacy Dimension 5 Posttest ......................................................................................... xii Figure 11. Distribution of teachers by region ............................................................................................... 7 Figure 12. Distribution of teachers by division ............................................................................................. 7 Figure 13. Distribution of teachers by age group ......................................................................................... 8 Figure 14. Distribution of teachers by gender .............................................................................................. 8 Figure 15. Distribution of teachers by grade level taught ............................................................................ 8 Figure 16. Distribution of teachers by teaching experience ......................................................................... 9 Figure 17. Distribution of teachers by type of education ............................................................................. 9 Figure 18. Distribution of grade 2 students by region ................................................................................ 10 Figure 19. Distribution of grade 3 students by region ................................................................................ 10 Figure 20. 2nd Grade Intervention Group - Letters Naming Subtest Frequency Distribution.................... 15 Figure 21. 2nd Grade Comparison Group - Letters Naming Subtest Frequency Distribution .................... 15 Figure 22. 2nd Grade Intervention Group - Letters Sounds Subtest Frequency Distribution .................... 16 Figure 23. 2nd Grade comparison Group - Letters Sounds Subtest Frequency Distribution ..................... 16 Figure 24. 2nd Grade Intervention Group - Initial Sound Identification Subtest Frequency Distribution .. 17

xxii
Figure 25. 2nd Grade Comparison Group - Initial Sound Identification Frequency Distribution ............... 17 Figure 26. 3rd Grade Intervention Group – Letter Naming Subtest Frequency Distribution ..................... 21 Figure 27. 3rd Grade Comparison Group – Letter Naming Subtest Frequency Distribution ...................... 21 Figure 28. 3rd Grade Intervention Group – Letter Naming Subtest Frequency Distribution ..................... 22 Figure 29. 3rd Grade Comparison Group – Letter Naming Subtest Frequency Distribution ...................... 22 Figure 30. 3rd Grade Intervention Group – Initial Sound Identification Subtest Frequency Distribution . 22 Figure 31. 3rd Grade Comparison Group – Initial Sound Identification Subtest Frequency Distribution .. 22 Figure 32. 2nd Grade Intervention Group - Familiar Word Reading Subtest Frequency Distribution ....... 27 Figure 33. 2nd Grade Comparison Group - Familiar Word Reading Subtest Frequency Distribution ........ 27 Figure 34. 2nd Grade Intervention Group - Invented Word Reading Subtest Frequency Distribution ...... 28 Figure 35. 2nd Grade Comparison Group - Invented Word Reading Subtest Frequency Distribution ....... 28 Figure 36. 2nd Grade Intervention Group - Oral Passage Reading Subtest Frequency Distribution .......... 28 Figure 37. 2nd Grade Comparison Group - Oral Passage Reading Subtest Frequency Distribution .......... 28 Figure 38. 3rd Grade Intervention Group - Familiar Word Reading Frequency Distribution ..................... 33 Figure 39. 3rd Grade Comparison Group - Familiar Word Reading Frequency Distribution ...................... 33 Figure 40. 3rd Grade Intervention Group - Invented Word Reading Frequency Distribution .................... 34 Figure 41. 3rd Grade Comparison Group - Invented Word Reading Frequency Distribution .................... 34 Figure 42. 3rd Grade Intervention Group – Oral Passage Reading Frequency Distribution ....................... 34 Figure 43. 3rd Grade Comparison Group – Oral Passage Reading Frequency Distribution ....................... 34 Figure 44. 2nd Grade Intervention Group - Reading Comprehension (6 Questions) Frequency Distribution .................................................................................................................................................................... 40 Figure 45. 2nd Grade Comparison Group - Reading Comprehension (6 Questions) Frequency Distribution .................................................................................................................................................................... 40 Figure 46. 2nd Grade Intervention Group - Listening Comprehension (7 Questions) Frequency Distribution ................................................................................................................................................. 40 Figure 47. 2nd Grade Comparison Group - Listening Comprehension (7 Questions) Frequency Distribution ................................................................................................................................................. 40 Figure 48. 2nd Grade Intervention Group -Dictation Frequency Distribution ............................................ 41 Figure 49. 2nd Grade Comparison Group -Dictation Frequency Distribution ............................................ 41 Figure 50. Grade 2 Dictation Subtest: Use of Spaces .................................................................................. 42 Figure 51. Grade 2 Dictation Subtest: Direction of Test ............................................................................. 42 Figure 52. Grade 2 Dictation Subtest: Capitalization .................................................................................. 42 Figure 53. Grade 2 Dictation Subtest: Use of Full Stop ............................................................................... 42 Figure 54. 3rd Grade Intervention Group - Reading Comprehension (6 Questions) Frequency Distribution .................................................................................................................................................................... 46 Figure 55. 3rd Grade Comparison Group - Reading Comprehension (6 Questions) Frequency Distribution .................................................................................................................................................................... 46 Figure 56. 3rd Grade Intervention Group - Listening Comprehension (6 Questions) Frequency Distribution ................................................................................................................................................. 46 Figure 57. 3rd Grade Comparison Group - Listening Comprehension (6 Questions) Frequency Distribution .................................................................................................................................................................... 46

xxiii
Figure 58. 3rd Grade Intervention Group – Dictation Frequency Distribution ........................................... 47 Figure 59. 3rd Grade Comparison Group – Dictation Frequency Distribution ........................................... 47 Figure 60. Grade 3 Dictation Subtest: Use of Spaces .................................................................................. 48 Figure 61. Grade 3 Dictation Subtest: Direction of Test ............................................................................. 48 Figure 62. Grade 3 Dictation Subtest: Capitalization .................................................................................. 48 Figure 63. Grade 3 Dictation Subtest: Use of Full Stop ............................................................................... 48 Figure 64. Mean gains in SCOPE Literacy scores between pretest and posttest, by dimension ................ 53 Figure 65. SCOPE Literacy Dimension 1 Pretest .......................................................................................... 55 Figure 66. SCOPE Literacy Dimension 1 Posttest ........................................................................................ 55 Figure 67. SCOPE Literacy Dimension 2 Pretest .......................................................................................... 56 Figure 68. SCOPE Literacy Dimension 2 Posttest ........................................................................................ 56 Figure 69. SCOPE Literacy Dimension 3 Pretest .......................................................................................... 57 Figure 70. SCOPE Literacy Dimension 3 Posttest ........................................................................................ 57 Figure 71. SCOPE Literacy Dimension 4 Pretest .......................................................................................... 58 Figure 72. SCOPE Literacy Dimension 4 Posttest ........................................................................................ 58 Figure 73. SCOPE Literacy Dimension 5 Pretest .......................................................................................... 59 Figure 74. SCOPE Literacy Dimension 5 Posttest ........................................................................................ 59

1
INTRODUCTION
In 2011, EQuALLS2 piloted a whole school reading program (WSRP) in which all teachers, regardless of subject and grade, were focused on improving their own English reading skills and those of their students. Based on positive assessment results, this activity was expanded and enhanced for implementation in 53 schools in 7 divisions of Regions 9, 12 and the Autonomous Region in Muslim Mindanao (ARMM) during the 2012-13 academic year. In line with its main objectives of improving the capacity of teachers to teach in English, and increasing students' capacity to read at their grade levels, EQuALLS2 worked with the Philippine Department of Education (DepED) to develop a model for educator professional development in reading instruction that has potential replicability.
The WSRP is a school-based program designed to strengthen teachers’ skills in teaching reading in order to improve students’ decoding, fluency, and comprehension skills. It involves the school administrators and all English, science, and math teachers at all grade levels (1–6) in a series of activities focused on building reading, writing, listening, and speaking skills in English classes, and further reinforcing these skills in math and science classes. Anchoring the WSRP approach is the preparation of a School Reading Improvement Plan that sets goals for students reading below grade level as well as outlines activities for students reading at or above grade level. Key components of the WSRP model include professional development courses for teachers and school administrators in teaching reading and writing, and in using assessment results to inform instruction; strengthened classroom instruction focused on explicit teaching of phonics, phonemic awareness, word recognition, vocabulary development, fluency, and comprehension; development of locally produced instructional materials; technical guidance; and support from local stakeholders. The conceptual framework4 assumed that teachers' classroom application of skills and competencies needed for students to become autonomous readers and competent writers; DepEd administrator supervision and support; and the provision of books for teaching and learning, contribute to improvements in student reading skills and student achievement. Considering that the WSRP was implemented for only 10 months, it was expected to achieve the short-term and immediate outcomes reflected in the framework.
The evaluation design recognizes a number of mediating factors or influences that might have emerged as the program unfolded. Some of these factors were changes in the subject or grade taught by the teacher, and new, competing, or complementary programs such as the mother tongue-based multi-lingual education and the new K to12 program implemented during this school year. The study also considered that changes in the fidelity of implementation, or the way teachers deliver the core components of the reading program as intended by EQuALLS2, along with other factors such as age and gender, are potential moderating factors between the interventions and the outcomes.
4 Annex A

2
OVERVIEW OF REPORT
The report includes six main sections:
- Evaluation Methodology section - Study Participants section - Student assessment findings section - Teacher observation findings section - Teacher belief survey findings section - Cross-dataset analyses and conclusions
Extensive appendices include data collection instruments, the project’s conceptual framework, and results of additional statistical analyses that are not included in the main body of the report.
EVALUATION METHODOLOGY
PURPOSE AND QUESTIONS
The purpose of the evaluation study was to determine the outcomes of the whole school reading program on teaching quality and student achievement in grades 2 - 3. It aimed to assess changes in teachers' beliefs and attitudes on teaching reading, changes in teacher instructional practices in the classroom (using the SCOPE instrument explained below), and associated gains in students’ reading levels, using the Early Grade Reading Assessment (EGRA). Specifically, the evaluation study was designed to answer the following questions:
1. In what ways did teachers' beliefs and attitudes on teaching reading change as a result of the intervention?
2. Were the changes in beliefs associated with changes in instructional practices in teaching reading in English?
3. Were the changes in teacher beliefs associated with students' reading skills? 4. Was there a change in teachers’ practices in teaching reading in intervention schools as a result
of the intervention? 5. Was there a significant improvement in the reading skills of students in grades 2 to 3 as a result
of the intervention?
The evaluation also included case studies to document emerging good practices and outcomes of improvements in teachers’ proficiency to teach reading in English, and strategies of DepEd contributing to sustainability of WSRP initiatives.
EVALUATION DESIGN
The evaluation is a longitudinal quasi-experimental study that follows the progress of the same group of teachers and their students in WSRP (intervention) and non-WSRP (comparison) schools across the one

3
school-year study period. This evaluation design was selected since the intervention schools were already identified at the start of the project in consultation with DepED using the following criteria:
• average to medium-sized schools with number of teachers ranging from 11 – 24 teachers • must have strong leadership with demonstrated interest in supporting project objectives • located in relatively safe and accessible areas • at least 50% of its student population are struggling readers/non-readers based on the Phil-IRI
and NAT results • should be contiguous or cluster school in a district; preferably two districts per division
A total of 53 schools were selected to participate in the program using the above criteria. To guide the selection of comparison schools, the following criteria were used:
• approximately the same number of pupils and teachers as intervention schools • should have equivalent or comparable Phil-IRI or National Achievement Test (NAT) scores as
intervention schools • located within the same EQuALLS2 school division • located in a municipality with comparable socio-economic level as that of WSRP schools using
National Statistics Office data.
The duration of the study was equivalent to one school year, or 10 months. Baseline data were collected in June-July, 2012 while post-intervention data were collected in February- March, 2013. The burden of the study averaged 20 to 30 minutes per participant to complete. A small number of teachers and students were asked to be interviewed or participate in a focus group for the case study, with an additional burden of up to 2 hours.
In addition to quantitative data collection, a number of qualitative case studies were constructed. Two schools, one from Region 12 and one from ARMM (Autonomous Region of Muslim Mindanao), from among the intervention schools with at least one teacher participating in the sample, were selected for these case studies after the first round of SCOPE observations. The case studies documented emerging good practices and describe how the various components of the WSRP contributing to positive outcomes. A tool for gathering qualitative data through focus group discussions (FGD) and key informant interviews (KII) with teachers and administrators was developed to better understand the findings of the teacher belief survey and student reading assessment tools. Questions related to fidelity of implementation (e.g. adherence to WSRP design; program content and quality of delivery) were imbedded in the FGD/KII tools. These case studies are presented in a separate report5.
5 EQuALLS2 Whole School Reading Program: Case Studies of Two Schools in Mindanao

4
SAMPLING DESIGN.
All power analyses are based on a single cohort to ensure enough power for analysis of child outcomes. Using hierarchical linear modeling, we calculated the sample size needed to detect a medium effect (δ= 0.30) at statistical power = .80, statistical significance level α = .05, and intra-class correlation ρ = .075. Using Optimal Designs software (Congdon & Raudenbush, 2001), analyses revealed a needed sample size of 74 teachers with an average of 7 children per teacher (Cohen, 1977; McCartney & Rosenthal, 2000). The actual sample size was increased to 93 second and third grade teachers given possible changes in teacher classroom assignment during the school year6. Up to ten randomly selected students of each of the 93 teachers were tested assuming a much higher attrition rate than the national dropout rate of 6.29%. A total of 818 students were tested. We also conducted a sensitivity analysis for the planned linear regression analyses on teacher and classroom outcomes, in order to determine the detectable effect size, with Power = 0.80 and α= 0.05, in a post-attrition sample of 74 teachers. For multiple regression with two predictors, the detectable effect size for a change in R2 is calculated to be f2 = 0.11, based on G*Power software (Faul, Erdfelder, Lang, & Buchner, 2007). An effect size of f2 = 0.15 is considered moderate (Cohen, 1992).
The final sample size for this evaluation was a total of 93 second and third grade teachers, with 54 teachers (58%) randomly drawn from WSRP or intervention schools, and 39 teachers (42%) from non-WSRP or comparison schools selected following the criteria above. Sampling was stratified, with equal sample sizes per grade level as summarized below7.
Table 7. Sampled teachers, by grade
Grade Level No. of Teachers Intervention Comparison
Second 25 19 Third 29 20 TOTAL (93) 54 39
DATA COLLECTION METHODS
Two tools were administered to teachers of both intervention and comparison schools: (i) A Teacher Belief and Practice Index8 (see Annex B) to track self-reported changes, and (ii) a modified and
6 Teachers were selected from the second and third grades only since these are the grades in which literacy instruction becomes crucial for student’s future reading ability. 7 The final sample included 54 intervention teachers and 39 comparison group teachers; a detailed description of the sample is found in the Study Participants chapter of the report. 8 The BIPI was developed by EDC and has been administered to teachers in several countries. A comparison of BIPI results from Mali, Liberia and the Philippines was presented at CIES, 2011.

5
shortened version of SCOPE Literacy (Standards-based Classroom Observation Protocol for Educators in Literacy)9 (Annex C). For students, electronic version of Early Grade Reading Assessment (eEGRA)10 was used (Annex D). EGRA is a diagnostic instrument designed to assess the foundation skills for literacy acquisition of grades 1 to 3 pupils. Selected students were tested on a one-on-one basis by an e-EGRA trained enumerator. Administration of the teacher and student assessment took place according to the following schedule:
Table 8. Data collection schedule
Tool Dates of administration Administrators 1. Teacher Belief
and Practice Survey
• Baseline- April-May 2012 • Post-Assessment: March 2013
4 Program Officers
2. SCOPE Literacy
• 1st observation – end of July • 2nd observation – February 2013
4 Program Officers and 7 DepED supervisors*
3. e-EGRA • Pre-test - end of June to first week of July 2012
• Post-test - end of February to first week of March 2013
4 Program Officers and 8 trained DepED enumerators
*Classroom observations conducted by a Program Officer and a DepED supervisor at the same time to minimize bias and ensure validity
DATA ANALYSIS
Assessment and survey data were analyzed with Statistical Package for Social Sciences (SPSS) utilizing standard statistical methods. The results were disaggregated by sex, grade level and school type: comparison and intervention. Quantitative analyses used univariate and multivariate statistical analyses for different analytical purposes. Central tendency analysis (e.g. mean, median) were conducted for continuous demographic variables. Comparison of means statistical tests were conducted on the results of gain scores between pretests and posttests (independent samples t-test) and disaggregated by sex and grade level. Bivariate statistical analyses (e.g., correlations) were conducted to examine the relationship between different variables. Multivariate analyses (e.g., regression) were used to determine relationships between variables.
9 SCOPE Literacy is an EDC-developed tool that looks at 16 dimensions of instructional practices in literacy classrooms. It is modeled after EDC’s original SCOPE, which has been used successfully in many EDC projects around the world to document changes in teaching practices in elementary classrooms. For purposes of this study, it was shortened to five essential dimensions. 10 EGRA tests alphabetic, phonetic, and phonemic awareness (e.g. letter naming, letter-sound sound-symbol correspondence), word recognition, fluency and reading comprehension. The development of EGRA was funded by USAID and the World Bank to provide a reliable method of assessing reading skills of readers in early grades. The electronic version has been developed by EDC.

6
To compare the changes in scores between the comparison and intervention groups, a gain scores for each of the tests’ subtests was computed based on the difference of scores on posttest and pretest for each individual. An independent samples t-test was then conducted of the difference in means for each gain score for both groups. The null hypothesis is that there is no significance in gain score between the comparison and the intervention groups. The probability that the null hypothesis is true (the p-value) was determined on the basis of the t score. Finally, the p-value was compared to the predetermined .05 significance level.
PROBABILITY OF SELECTION AND DESIGN WEIGHT
Only gender weights were computed for the analysis, based on the available data. The weights were computed by calculating the inverse probability of student selection out of the classroom, computed as follows. The probability of selection for students within class by gender was the total number of students sampled by gender in the class divided by the population number of students of that gender in that class:
posjlk = #(students sampled)jk / #(population students)jk
where #(students sampled)jk was the number of students in the jth class for the kth gender and #(population students)j was the total number of students in the jth class of that gender.
The weights were applied to all student-level analysis, so the tables with student- level data do not contain references to the number of sampled students. These statistics can be found in the Study Participants section of the report.
LIMITATIONS
Since it is not possible to either randomize teachers and students into participants and non-participants to assess the true impact of the program, or to conduct multiple measurements of the same group of participants given short timeframe of the study, the attribution of the observed outcomes to the program will be limited due to the quasi-experimental nature of the study. The comparison of the pretest data overall and disaggregated by gender, grade and region showed that the comparison group students scored statistically significantly lower on nine out of ten subtests. Thus, the two groups could not be considered equivalent at the beginning of the intervention. To compensate for this, all comparisons of performance of intervention and comparison group students are made in terms of their gains between the pretest and the posttest (gainscore = posttest – pretest), and analyzed using the comparison of means of independent groups test. Another threat to validity came from observers knowing whether the teachers were "intervention" (WSRP teachers) or "comparison" (non-WSRP). It is possible that observers could be positively biased toward WSRP teachers at the posttest. And finally, the teacher belief survey has not been tested for validity and reliability so the extent to which teachers answered BIPI questions truthfully is unknown. These three potential biases could have impacted the validity and reliability of the data and skewed the results.

7
16.7%
55.6%
27.8%
15.4%
61.5%
23.1%
0%
10%
20%
30%
40%
50%
60%
70%
ARMM Region 12 Region 9
Intervention (n=54) Comparison (n=39)
STUDY PARTICIPANTS
TEACHER DEMOGRAPHIC CHARACTERISTICS
Teachers in the study sample were overwhelmingly female, at 90 of 93 of all respondents (or 97.8 percent). This was true for both the WSRP (intervention group) and non-WSRP (comparison group) teachers. Consequently, teacher-level analyses were not disaggregated by gender.
With respect to geographic distribution, the single largest proportion of respondents came from Region 12, at 57 percent, followed by Region 9 (26 percent) and ARMM (16 percent) (see figure 1 below for a breakout by comparison and intervention groups). South Cotabato was the most represented division in the sample (Figure 2).
Figure 11. Distribution of teachers by region
Figure 12. Distribution of teachers by division
The teacher respondents ranged in age from 25 and above with the majority being between the ages of 41 and 45.
11.1%
16.7%
11.1%
34.7%
13.0%
16.7%
10.3%
15.4%
12.8%
35.9%
12.8%
11.4%
0% 10% 20% 30% 40%
Isabela City
Maguindanao 2
Sarangani
South Cotabato
Sultan Kudarat
Zamboanga City
Comparison (n=39) Intervention (n=54)

8
Figure 13. Distribution of teachers by age group
Only two respondents were male and these were from the intervention group; the rest of the respondents were female.
Figure 14. Distribution of teachers by gender
Total Intervention Comparison
Male Count 2 0 3 % 3.7% 0.0% 2.2%
Female Count 52 39 90 % 96.3% 100.0% 97.8%
Total count 54 39 93
The teachers in the sample taught either of two grades, grade 2 or 3, with slightly more teaching grade 3.
Figure 15. Distribution of teachers by grade level taught
Total Intervention Comparison
Grade 2 Count 25 19 44 % 46.3% 48.7% 47.3%
Grade 3 Count 29 20 49 % 53.7% 51.3% 52.7% Total count 54 39 93
13.2%
7.5%
13.2%
24.5%
17.0% 17.0%
7.5% 10.0%
17.5% 17.5%
20.0%
10.0% 12.5%
10.0%
0%
5%
10%
15%
20%
25%
30%
25-30 31-35 36-40 41-45 46-50 51-55 Over 56
Intervention (n=54) Comparison (n=39)

9
WSRP teachers were, as a group, slightly more experienced than their non-WSRP counterparts, with 88.9 percent possessing 6 or more years of teaching experience compared to 74.4 percent for non-WSRP teachers. Regarding teacher education background, the two groups were well-matched, with the majority of teachers in both groups holding Bachelor’s in Elementary Education degree.
Figure 16. Distribution of teachers by teaching experience
Figure 17. Distribution of teachers by type of education
88.9%
1.9%
5.6%
3.7%
0.0%
5.6%
1.9%
82.1%
1.9%
5.6%
10.3%
2.6%
0.0%
10.5%
0% 20% 40% 60% 80% 100%
Bachelor of Elementary Education
Bachelor in Kindergarten Education
Bachelor of Science in Agriculture
Bachelor of Science in Education
Bachelor of Science in Fisheries
Bachelor of Technology in Education
BSAGED
Bachelor in Science in Education
Comparison (n=39)
Intervention (n=54)
1.9% 7.4%
22.2%
66.7%
23.1%
12.8%
61.5%
0%
10%
20%
30%
40%
50%
60%
70%
80%
Less than 3 years 3-5 years 6-10 years more than 10 years
Intervention (n=54) Comparison (n=39)

10
STUDENT DEMOGRAPHIC CHARACTERISTICS
After data cleaning, the final dataset of student level data contained EGRA test results for a total of 818 students, with slightly more girls than boys: 50.7 percent versus 49.3 percent for boys. Intervention group students also comprised a larger proportion of the overall sample, at, 59.5 percent of the total versus 40.5 percent for the comparison schools.
Table 9. Student gender, by grade
Grade 2 (n=391) Grade 3 (n=427) Total Intervention Comparison Intervention Comparison Girls Count 118 86 120 91 415 % 50.6% 54.4% 47.2% 52.6% 50.7% Boys Count 115 72 134 82 403 % 49.4% 45.6% 52.8% 47.4% 49.3% Total count 233 158 254 173 818
Mirroring teacher sample, the majority of the student sample came from Region 12, followed by Region 9. Less than 20 percent of the student sample came from the ARMM region.
Figure 18. Distribution of grade 2 students by region
Figure 19. Distribution of grade 3 students by region
15.2%
58.2%
26.6%
15.5%
55.4%
29.2%
0%
10%
20%
30%
40%
50%
60%
70%
ARMM Region 12 Region 9
Grade 2 Comparison (n=158)
Grade 2 Intervention (n=233)
17.3%
60.7%
22.0%
16.9%
53.9%
29.1%
0%
10%
20%
30%
40%
50%
60%
70%
ARMM Region 12 Region 9
Grade 3 Comparison (n=173)
Grade 3 Intervention (n=254)
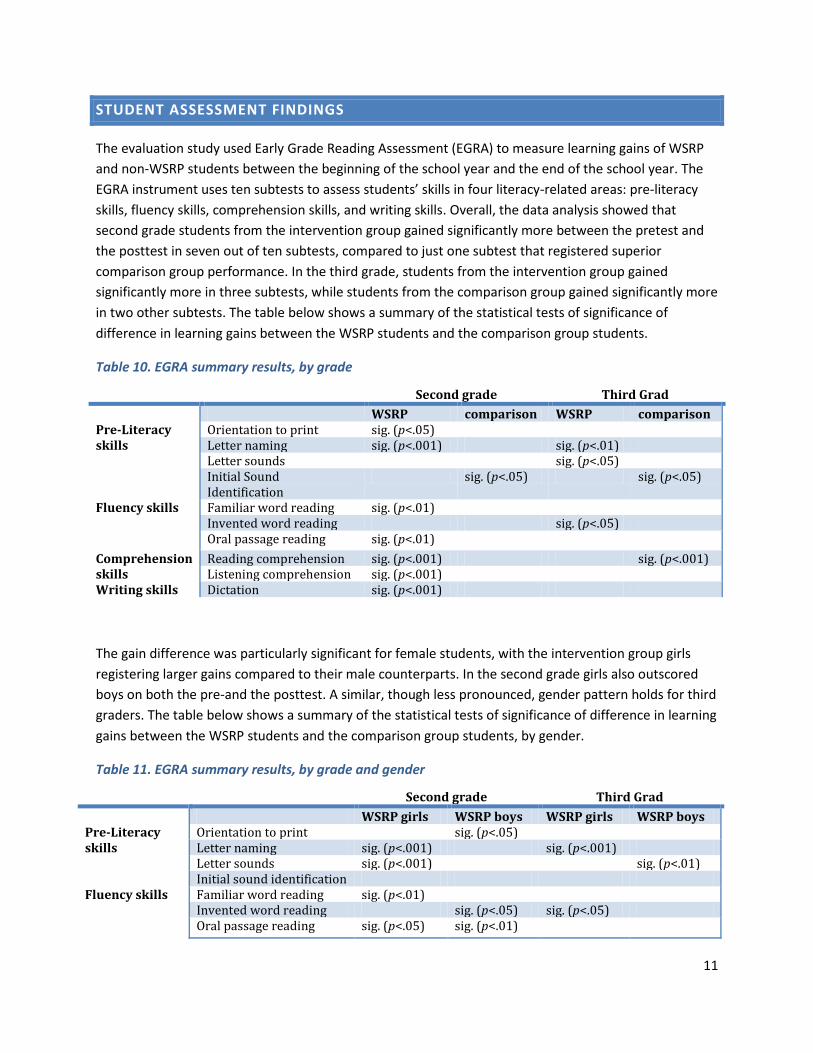
11
STUDENT ASSESSMENT FINDINGS
The evaluation study used Early Grade Reading Assessment (EGRA) to measure learning gains of WSRP and non-WSRP students between the beginning of the school year and the end of the school year. The EGRA instrument uses ten subtests to assess students’ skills in four literacy-related areas: pre-literacy skills, fluency skills, comprehension skills, and writing skills. Overall, the data analysis showed that second grade students from the intervention group gained significantly more between the pretest and the posttest in seven out of ten subtests, compared to just one subtest that registered superior comparison group performance. In the third grade, students from the intervention group gained significantly more in three subtests, while students from the comparison group gained significantly more in two other subtests. The table below shows a summary of the statistical tests of significance of difference in learning gains between the WSRP students and the comparison group students.
Table 10. EGRA summary results, by grade
Second grade Third Grad WSRP comparison WSRP comparison Pre-Literacy skills
Orientation to print sig. (p<.05) Letter naming sig. (p<.001) sig. (p<.01) Letter sounds sig. (p<.05) Initial Sound Identification
sig. (p<.05) sig. (p<.05)
Fluency skills Familiar word reading sig. (p<.01) Invented word reading sig. (p<.05) Oral passage reading sig. (p<.01)
Comprehension skills
Reading comprehension sig. (p<.001) sig. (p<.001) Listening comprehension sig. (p<.001)
Writing skills Dictation sig. (p<.001)
The gain difference was particularly significant for female students, with the intervention group girls registering larger gains compared to their male counterparts. In the second grade girls also outscored boys on both the pre-and the posttest. A similar, though less pronounced, gender pattern holds for third graders. The table below shows a summary of the statistical tests of significance of difference in learning gains between the WSRP students and the comparison group students, by gender.
Table 11. EGRA summary results, by grade and gender
Second grade Third Grad WSRP girls WSRP boys WSRP girls WSRP boys Pre-Literacy skills
Orientation to print sig. (p<.05) Letter naming sig. (p<.001) sig. (p<.001) Letter sounds sig. (p<.001) sig. (p<.01) Initial sound identification
Fluency skills Familiar word reading sig. (p<.01) Invented word reading sig. (p<.05) sig. (p<.05) Oral passage reading sig. (p<.05) sig. (p<.01)

12
Comprehension skills
Reading comprehension sig. (p<.001) sig. (p<.001) Listening comprehension sig. (p<.001) sig. (p<.001)
Writing skills Dictation sig. (p<.001) sig. (p<.01) sig. (p<.001)
Statistical analysis of the overall EGRA gains showed that second grade intervention group students gained statistically significantly more than second grade comparison group students. No statistically significant difference between the gains made by the third graders in the two groups was found. Thus, the intervention appeared to have been particularly effective for the second grade classrooms. The question of why third graders did not gain as much as the 2nd graders merits further inquiry.
Table 12. Comparison of EGRA gains, by grade
GRADE 2 Mean Gains (St. Error) t Sig. (2-tailed) Intervention Group 15.376% (.396) Comparison Group 12.580% (.418) 4.856 .000 GRADE 3 Mean Gains (St. Error) t Sig. (2-tailed) Intervention Group 12.397% (.309) Comparison Group 12.129% (.424) .521 n/s
A comparison of means test across regions revealed substantial differences, with program found to be most effective in grade 2 in the ARMM, and Region 9 in both grades.
The overall improvement in achievement was more significant for female students than male students. Intervention group girls made larger gains in more EGRA subtests than the boys. In the second grade, girls also outscored boys on both the pre- and posttest. This pattern is also observed in the data for the third graders, although the difference between boys and girls is not as pronounced in some subscales. These results merit further inquiry.
Finally, significant difference in student learning gains was found across three regions. Intervention second graders in the ARMM region demonstrated largest overall gains as compared with comparison group students, while comparison third graders in the same region gained significantly more than intervention third graders. In Region 9, intervention third graders gained statistically significantly more than their counterparts from the comparison group. Finally, intervention second graders in Region 12 showed marginally larger average gains than comparison second graders. The table below shows the results of the comparison of means analysis of the average gains across all ten EGRA subtests, by region.

13
Table 13. Comparison of average EGRA gains, by grade and region
ARMM
GRADE 2 AVERAGE GAINS GRADE 3 AVERAGE GAINS
Mean Gains (St. Error) t Sig. (2-
tailed) Mean Gains (St. Error) t Sig. (2-
tailed) Intervention Group 21.86% (.87) 7.561 .000 10.06% (.80) Comparison Group 12.31% (.91) 15.68% (.97) 4.474 .000
Region 9
GRADE 2 AVERAGE GAINS GRADE 3 AVERAGE GAINS
Mean Gains (St. Error) t Sig. (2-
tailed) Mean Gains (St. Error) t Sig. (2-
tailed) Intervention Group 12.32% (.63) 1.419 n/s 11.59% (.44) 5.251 .000 Comparison Group 10.88% (.82) 07.04% (.85)
Region 12
GRADE 2 AVERAGE GAINS GRADE 3 AVERAGE GAINS
Mean Gains (St. Error) t Sig. (2-
tailed) Mean Gains (St. Error) t Sig. (2-
tailed) Intervention Group 15.07% (.56) 1.984 .048 13.84% (.46) .844 n/s Comparison Group 13.46% (.58) 13.24% (.53)
Regression analysis also showed that the intervention was particularly effective in improving overall student achievement in second grade in ARMM (R2 = .157) and in third grade in Region 9 (R2 = .049)11. Regression analysis also found that the intervention had a statistically significant impact in improving student achievement in the second grade in Region 12, but the amount of impact was very small (R2 = .005). Further research is needed to understand why the intervention had different effect across regions.
11 R-squared is a linear regression statistic that helps understand the extent to which participation in the WSRP program explains variation in student performance improvement. Converted to percentage points, R2 of .157 means that participation in the WSPR program explained 15.7 percent of variance in the overall achievement improvement among ARMM second graders; R2 of .049 means that participation in the WSPR program explained nearly 5 percent of variance in the overall achievement improvement among District 9 third graders, and the R2 of .005 means that participation in the WSPR program explains a half of one percent of variance in the overall achievement improvement among District 12 second graders. These results show that the program made a substantial impact on the EGRA performance of ARMM second graders, moderate impact on the EGRA performance of Region 9 third graders, and small impact on the EGRA performance of Region 12 second graders. Complete results of regression analysis are found in Annex E.
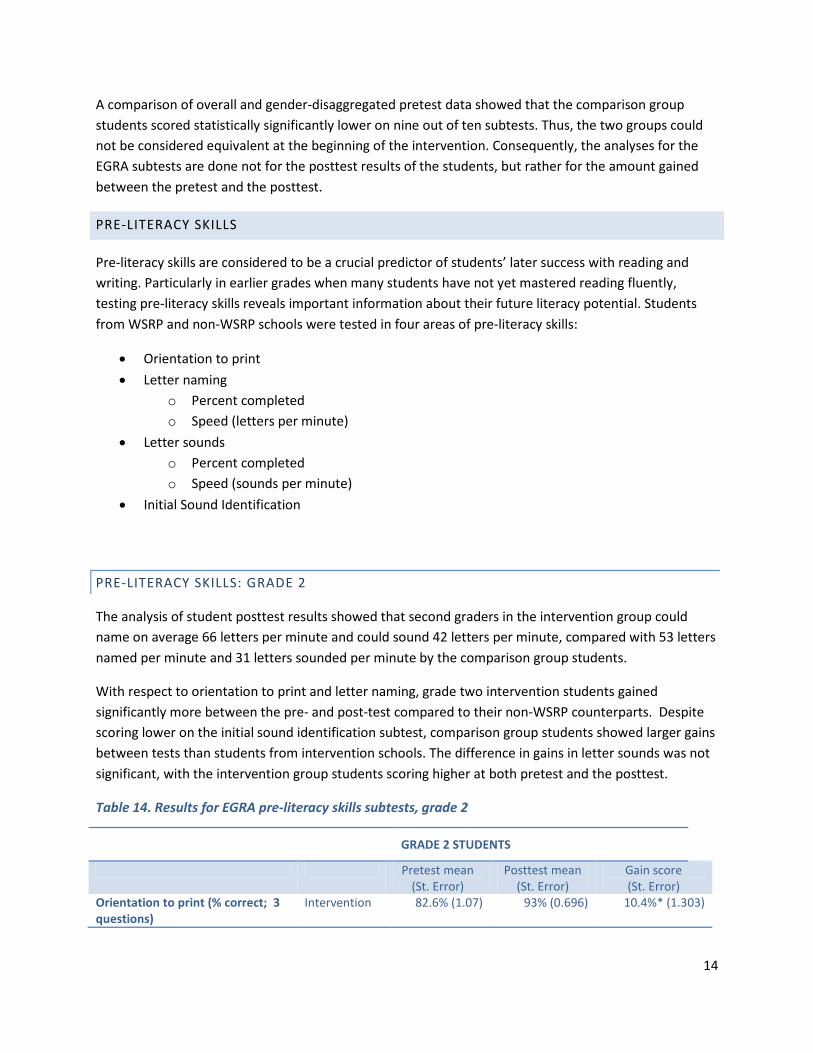
14
A comparison of overall and gender-disaggregated pretest data showed that the comparison group students scored statistically significantly lower on nine out of ten subtests. Thus, the two groups could not be considered equivalent at the beginning of the intervention. Consequently, the analyses for the EGRA subtests are done not for the posttest results of the students, but rather for the amount gained between the pretest and the posttest.
PRE-LITERACY SKILLS
Pre-literacy skills are considered to be a crucial predictor of students’ later success with reading and writing. Particularly in earlier grades when many students have not yet mastered reading fluently, testing pre-literacy skills reveals important information about their future literacy potential. Students from WSRP and non-WSRP schools were tested in four areas of pre-literacy skills:
• Orientation to print • Letter naming
o Percent completed o Speed (letters per minute)
• Letter sounds o Percent completed o Speed (sounds per minute)
• Initial Sound Identification
PRE-LITERACY SKILLS: GRADE 2
The analysis of student posttest results showed that second graders in the intervention group could name on average 66 letters per minute and could sound 42 letters per minute, compared with 53 letters named per minute and 31 letters sounded per minute by the comparison group students.
With respect to orientation to print and letter naming, grade two intervention students gained significantly more between the pre- and post-test compared to their non-WSRP counterparts. Despite scoring lower on the initial sound identification subtest, comparison group students showed larger gains between tests than students from intervention schools. The difference in gains in letter sounds was not significant, with the intervention group students scoring higher at both pretest and the posttest.
Table 14. Results for EGRA pre-literacy skills subtests, grade 2
GRADE 2 STUDENTS
Pretest mean (St. Error)
Posttest mean (St. Error)
Gain score (St. Error)
Orientation to print (% correct; 3 questions)
Intervention 82.6% (1.07) 93% (0.696) 10.4%* (1.303)

15
Comparison 75.2% (1.285) 81.5% (1.207) 6.3% (1.533) Letters named (% correct; 100 letters)
Intervention 48.2%ǂ (0.844) 66.1% (0.874) 17.9%***(0.754)
Comparison 39.6% (0.852) 52.7% (0.999) 13.1% (0.689) Letters named (letters per minute) Intervention 48.8ǂ (0.854) 66.9 (0.944) 18.2*** (0.813) Comparison 39.7 (0.872) 52.8 (1.007) 13.1 (0.694) Letter sounds (% correct; 100 letters)
Intervention 32.2%ǂ (0.64) 42.1% (0.626) 9.9% (0.641)
Comparison 21.1% (0.597) 30.7% (0.753) 9.5% (0.599) Letter sounds (letter sounds per minute)
Intervention 34.3ǂ (1.004) 42.2 (0.626) 7.7 (1.002)
Comparison 25.5 (1.381) 30.7 (0.753) 5.2 (1.306) Initial sound identification (% correct; 10 words)
Intervention 72.6%ǂ (1.055) 87.4% (0.742) 14.9% (0.91)
Comparison 48.5% (1.424) 66.8% (1.35) 18.4%* (1.152) ǂ The group’s pretest mean score is statistically higher compared with the other group’s score, at p<.01 level. *The group’s gain score is statistically significantly higher than the other group’s at p <.05 level **The group’s gain score is statistically significantly higher than the other group’s at p <.01 level ***The group’s gain score is statistically significantly higher than the other group’s at p <.001 level
Charts below illustrate frequency distributions of the main pre-literacy subtests, presented as quintiles.
Figure 20. 2nd Grade Intervention Group - Letters Naming Subtest Frequency Distribution
Figure 21. 2nd Grade Comparison Group - Letters Naming Subtest Frequency Distribution
3.8%
12.0%
23.0%
28.7%
22.5%
10.0%
2.5% 2.5%
12.3%
21.3%
26.7%
34.7%
0%
5%
10%
15%
20%
25%
30%
35%
40%
0% 1 - 20% 21-40% 41-60% 61-80% 81-100%
Pre-test Post-test
9.8%
15.5%
27.6% 29.9%
12.8%
4.4% 5.2%
10.7%
22.3% 22.8%
18.0% 21.1%
0%
5%
10%
15%
20%
25%
30%
35%
40%
0% 1 - 20% 21-40% 41-60% 61-80% 81-100%
Pre-test Post-test

16
Figure 22. 2nd Grade Intervention Group - Letters Sounds Subtest Frequency Distribution
Figure 23. 2nd Grade comparison Group - Letters Sounds Subtest Frequency Distribution
The analysis of letter naming and letter sounds distributions both in intervention and in comparison groups shows normally distributed pattern of achievement, with the majority of students falling in the middle range of the scale. Second grade students appear to have better skills in naming letters than in sounding them: very few students in both intervention and comparison group scored above 60 percent in the letter sounds test.
An analysis of the initial sound identification subtest showed a different pattern of achievement, with most students scoring either very high (intervention group), or split between very high and very low (comparison group). Very few students scored in the middle range of 20 to 60 percent. These results demonstrate the need for differentiation of instruction in the sound identification.
4.7%
22.2%
48.2%
18.6%
3.4% 2.9% 3.0%
10.5%
28.5%
41.3%
15.9%
0.7% 0%
10%
20%
30%
40%
50%
60%
0% 1 - 20% 21-40% 41-60% 61-80% 81-100%
Pre-test Post-test
25.4% 22.9%
38.0%
13.5%
0.0% 0.3%
15.8% 17.9%
35.9%
24.5%
3.9% 2.2% 0%
10%
20%
30%
40%
50%
60%
0% 1 - 20% 21-40% 41-60% 61-80% 81-100%
Pre-test Post-test

17
Figure 24. 2nd Grade Intervention Group - Initial Sound Identification Subtest Frequency Distribution
Figure 25. 2nd Grade Comparison Group - Initial Sound Identification Frequency Distribution
The data analysis by gender showed that the second grade girls significantly outperformed boys in the posttest results. Intervention group girls named on average 73 letters per minute (compared with 61 letters named by boys), and sounded 47 letters per minute (compared with 38 letters by boys). There was no such difference in the speed of letter naming and sounding between comparison group boys and girls: both of these groups averaged about 51 to 54 letters per minute in letter naming subtest, and 31 letters in letter sounds subtest. Girls scored higher than boys in the initial sound identification subtest.
Girls also made larger gains than boys between the pretest and the posttest. In the intervention group, this difference between boys and girls is statistically significant for the letter naming subtest (p<.01), letter sounding (p<.001), and in the initial sound identification (p<.001) subtests. In the comparison group, girls gained more than boys in the letter sounds per minute (p<.01) and in the initial sound identification (p<.001) subtests.
Table 15. Results for EGRA pre-literacy skills subtests, grade 2, by gender
GRADE 2 GIRLS BOYS
Pretest
mean (St. Error)
Posttest mean
(St. Error)
Gain score (St. Error)
Pretest mean
(St. Error)
Posttest mean
(St. Error)
Gain score
(St. Error) Orientation to print (% correct; 3 questions)
Intervention 84% (1.49)
92.3% (1.041)
8.2% (1.869)
81.2% (1.532)
93.7% (0.926)
12.5%* (1.814)
Comparison 78.8% (1.661)
86.3% (1.482)
7.5% (1.767)
71.3% (1.965)
76.2% (1.9)
5% (2.558)
Letters named (% Intervention 51.7%ǂ 72% 20.3%*** 44.9%ǂ 60.5% 15.6%*
7.5% 4.2% 5.8%
11.9% 17.5%
53.2%
2.8% 1.0% 2.2% 5.2%
14.7%
74.2%
0%
10%
20%
30%
40%
50%
60%
70%
80%
0% 1 - 20% 21-40% 41-60% 61-80% 81-100%
Pre-test Post-test
32.5%
5.8% 6.3% 10.4%
16.9%
28.1%
18.8%
3.8% 2.8% 4.8%
21.6%
48.2%
0%
10%
20%
30%
40%
50%
60%
70%
80%
0% 1 - 20% 21-40% 41-60% 61-80% 81-100%
Pre-test Post-test

18
correct; 100 letters) (1.073) (1.111) (1.07) (1.28) (1.29) (1.052) Comparison 39.9%
(1.215) 54.2%
(1.337) 14.3%
(0.927) 39.2%
(1.193) 51.1%
(1.491) 11.8%
(1.023) Letters named (letters per minute)
Intervention 51.8ǂ (1.095)
73.4 (1.3) 21.7*** (1.234)
45.9ǂ (1.289)
60.6 (1.302)
14.8* (1.044)
Comparison 40.1 (1.248)
54.4 (1.361)
14.3 (0.927)
39.1 (1.213)
51.1 (1.491)
11.8 (1.037)
Letter sounds (% correct; 100 letters)
Intervention 34.4%ǂ (0.85)
46.7% (0.907)
12.3%*** (0.919)
30%ǂ (0.942)
37.5% (0.809)
7.5% (0.881)
Comparison 22.6% (0.849)
30.8% (1.042)
8.2% (0.8) 19.6% (0.83)
30.5% (1.089)
11.0%* (0.893)
Letter sounds (letter sounds per minute)
Intervention 35.1ǂ (0.999)
46.7 (0.907)
11.7** (1.06)
33.6 (1.72)
37.7 (0.81)
3.9 (1.668)
Comparison 22.6 (0.849)
30.8 (1.042)
8.2 (0.8)
28.6 (2.72)
30.5 (1.089)
1.9 (2.571)
Initial sound identification (% correct; 10 words)
Intervention 77.9%ǂ (1.341)
89% (1.038)
11.1% (1.101)
67.4%ǂ (1.585)
85.9% (1.057)
18.6% (1.422)
Comparison 55.6% (1.957)
69.2% (1.822)
13.6% (1.507)
40.7% (2.005)
64.3% (1.999)
23.6%* (1.722)
ǂ The group’s pretest mean score is statistically higher compared with the other group’s score, at p<.01 level. *The group’s gain score is statistically significantly higher than the other group’s at p <.05 level **The group’s gain score is statistically significantly higher than the other group’s at p <.01 level ***The group’s gain score is statistically significantly higher than the other group’s at p <.001 level
To better understand the student performance in these subtests, a frequency distribution of all responses was grouped into quintiles is presented in Annex F which also shows the distribution of the incorrect responses on the letter naming and letter sounds subtests. Both groups showed fewer than 6 percent of incorrect answers on these two subtests, with a subsequent decrease in this proportion for both on the posttest. As the data analysis of incorrect responses by gender shows, the proportion of letters named and sounded incorrectly was rather small: between 3 and 6 percent at the posttest, with girls doing better than boys, and intervention group students doing better than comparison group students. The proportion of incorrect answers on the letter naming and letter sounds subtests by intervention and comparison group boys decreased between the pretest and the posttest by 1.4 percent. For most girls the proportion of incorrect answers also decreased at the posttest, except for girls from the comparison group who showed a slight increase in the proportion of the incorrect answers.
Disaggregation by region revealed interesting patters of student performance. At the pretest, second graders from ARMM region performed significantly better than second graders from Region 12. Achievement gains of students from Region 9 fell somewhere in the middle between the ARMM and the Region 12 students. Second graders from the ARMM also registered statistically significantly higher gains comparing to the students from Region 9. Their actual posttest achievement was also significantly higher than results from both Region 9 and Region 12.
Of the three regions, only Region 12 showed substantial differences between intervention and comparison groups during the pretest.

19
Table 16. Results for EGRA pre-literacy subtests in, grade 2, by region
ARMM GRADE 2 STUDENTS
Pretest mean (St. Error)
Posttest mean (St. Error)
Gain score (St. Error)
Orientation to print (% correct; 3 questions)
Intervention 88.2% (2.287) 96.5% (0.833) 8.4% (2.276)
Comparison 78.9% (2.665) 87% (2.11) 8.1% (3.104) Letters named (% correct; 100 letters)
Intervention 49.3% (1.746) 72.1% (1.609) 22.8%* (1.726)
Comparison 50.3% (2.2) 66.5% (2.255) 16.2% (1.869) Letters named (letters per minute) Intervention 49.3 (1.746) 72.1 (1.609) 22.8* (1.726) Comparison 51.0 (2.303) 67.1 (2.319) 16.1 (1.874) Letter sounds (% correct; 100 letters)
Intervention 34% (1.254) 55.4% (1.089) 21.4%*** (1.271)
Comparison 29.9% (1.343) 43.8% (1.831) 13.9% (1.26) Letter sounds (letter sounds per minute)
Intervention 34 (1.254) 55.4 (1.089) 21.4*** (1.271)
Comparison 39 (3.136) 43.8 (1.831) 4.8 (3.101) Initial sound identification (% correct; 10 words)
Intervention 80.5%ǂ (2.498) 94.7% (0.796) 14.2% (2.069)
Comparison 55.6% (3.17) 74% (2.764) 18.4% (2.056)
REGION 9 GRADE 2 STUDENTS
Pretest mean (St. Error)
Posttest mean (St. Error)
Gain score (St. Error)
Orientation to print (% correct; 3 questions)
Intervention 91.1%ǂ (1.238) 85.2% (1.721) -5.9% (1.953)
Comparison 77% (2.15) 76.9% (2.715) -0.1% (3.104) Letters named (% correct; 100 letters)
Intervention 47.6% (1.577) 64.2% (1.716) 16.6%** (1.377)
Comparison 42.3% (1.391) 53.2% (1.572) 10.8% (1.187) Letters named (letters per minute) Intervention 49.1 (1.575) 66.6 (2.059) 17.7** (1.653) Comparison 42.2 (1.422) 53.2 (1.572) 10.9 (1.215) Letter sounds (% correct; 100 letters)
Intervention 24% (0.789) 32.9% (0.998) 8.9%** (0.753)
Comparison 22.2% (1.041) 27.8% (1.308) 5.6% (1.011) Letter sounds (letter sounds per minute)
Intervention 29.8 (2.508) 33.2 (1.005) 3.1 (2.432)
Comparison 30.9 (4.045) 27.8 (1.308) -3.1 (3.767) Initial sound identification (% correct; 10 words)
Intervention 69.5%ǂ (1.656) 85.4% (1.33) 15.8% (1.625)
Comparison 57.4% (2.427) 70.4% (2.239) 13% (1.96)
REGION 12 GRADE 2 STUDENTS
Pretest mean (St. Error)
Posttest mean (St. Error)
Gain score (St. Error)
Orientation to print (% correct; 3 questions)
Intervention 75.6% (1.713) 96.6% (0.736) 20.9%*** (1.953)
Comparison 72.7% (1.922) 81.6% (1.62) 8.9% (2.116)
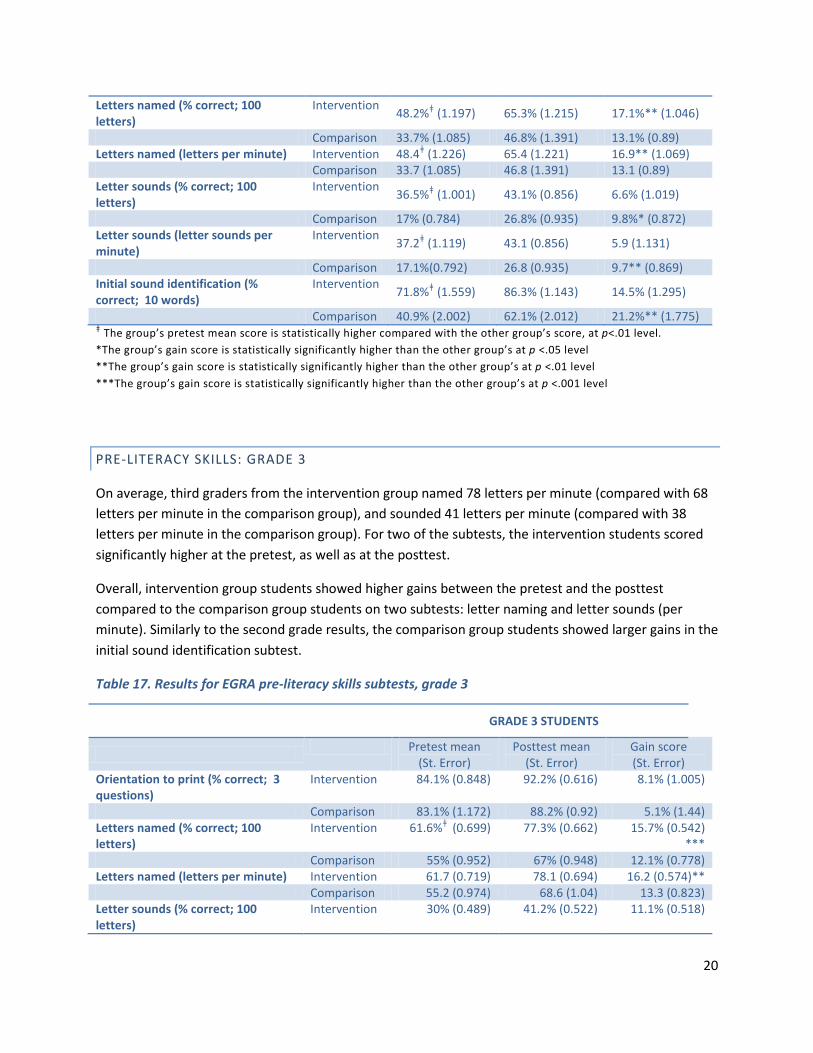
20
Letters named (% correct; 100 letters)
Intervention 48.2%ǂ (1.197) 65.3% (1.215) 17.1%** (1.046)
Comparison 33.7% (1.085) 46.8% (1.391) 13.1% (0.89) Letters named (letters per minute) Intervention 48.4ǂ (1.226) 65.4 (1.221) 16.9** (1.069) Comparison 33.7 (1.085) 46.8 (1.391) 13.1 (0.89) Letter sounds (% correct; 100 letters)
Intervention 36.5%ǂ (1.001) 43.1% (0.856) 6.6% (1.019)
Comparison 17% (0.784) 26.8% (0.935) 9.8%* (0.872) Letter sounds (letter sounds per minute)
Intervention 37.2ǂ (1.119) 43.1 (0.856) 5.9 (1.131)
Comparison 17.1%(0.792) 26.8 (0.935) 9.7** (0.869) Initial sound identification (% correct; 10 words)
Intervention 71.8%ǂ (1.559) 86.3% (1.143) 14.5% (1.295)
Comparison 40.9% (2.002) 62.1% (2.012) 21.2%** (1.775) ǂ The group’s pretest mean score is statistically higher compared with the other group’s score, at p<.01 level. *The group’s gain score is statistically significantly higher than the other group’s at p <.05 level **The group’s gain score is statistically significantly higher than the other group’s at p <.01 level ***The group’s gain score is statistically significantly higher than the other group’s at p <.001 level
PRE-LITERACY SKILLS: GRADE 3
On average, third graders from the intervention group named 78 letters per minute (compared with 68 letters per minute in the comparison group), and sounded 41 letters per minute (compared with 38 letters per minute in the comparison group). For two of the subtests, the intervention students scored significantly higher at the pretest, as well as at the posttest.
Overall, intervention group students showed higher gains between the pretest and the posttest compared to the comparison group students on two subtests: letter naming and letter sounds (per minute). Similarly to the second grade results, the comparison group students showed larger gains in the initial sound identification subtest.
Table 17. Results for EGRA pre-literacy skills subtests, grade 3
GRADE 3 STUDENTS
Pretest mean (St. Error)
Posttest mean (St. Error)
Gain score (St. Error)
Orientation to print (% correct; 3 questions)
Intervention 84.1% (0.848) 92.2% (0.616) 8.1% (1.005)
Comparison 83.1% (1.172) 88.2% (0.92) 5.1% (1.44) Letters named (% correct; 100 letters)
Intervention 61.6%ǂ (0.699) 77.3% (0.662) 15.7% (0.542) ***
Comparison 55% (0.952) 67% (0.948) 12.1% (0.778) Letters named (letters per minute) Intervention 61.7 (0.719) 78.1 (0.694) 16.2 (0.574)** Comparison 55.2 (0.974) 68.6 (1.04) 13.3 (0.823) Letter sounds (% correct; 100 letters)
Intervention 30% (0.489) 41.2% (0.522) 11.1% (0.518)
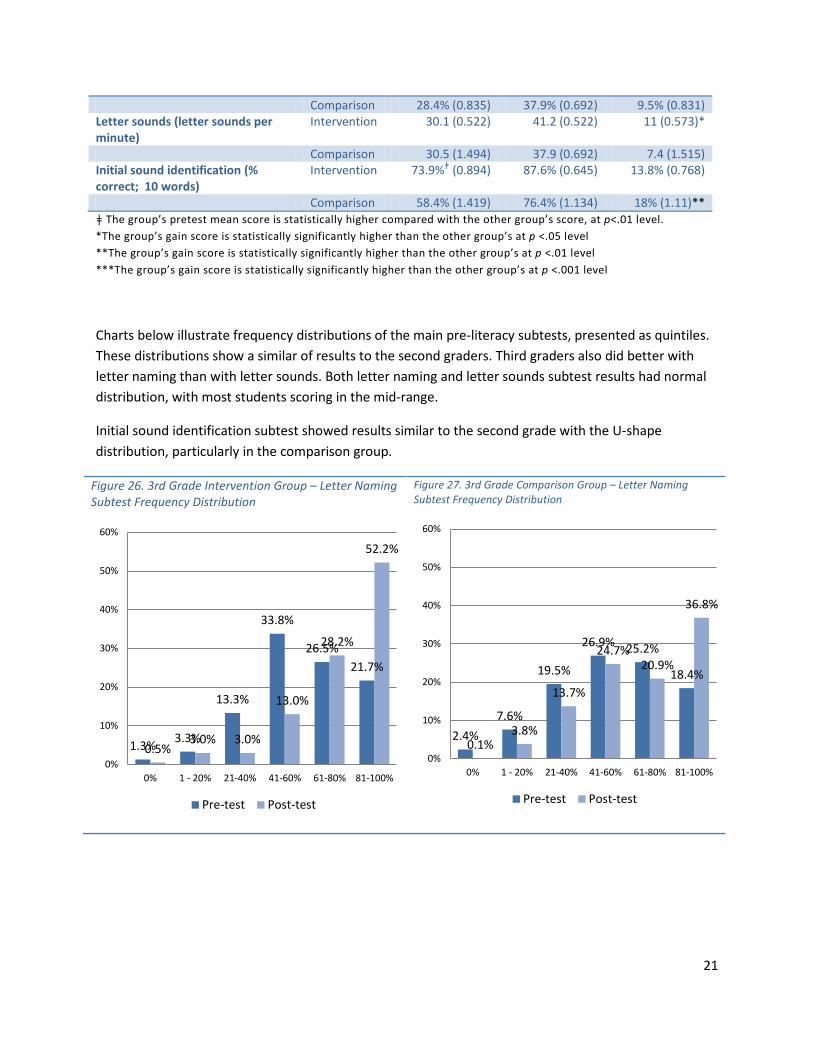
21
Comparison 28.4% (0.835) 37.9% (0.692) 9.5% (0.831) Letter sounds (letter sounds per minute)
Intervention 30.1 (0.522) 41.2 (0.522) 11 (0.573)*
Comparison 30.5 (1.494) 37.9 (0.692) 7.4 (1.515) Initial sound identification (% correct; 10 words)
Intervention 73.9%ǂ (0.894) 87.6% (0.645) 13.8% (0.768)
Comparison 58.4% (1.419) 76.4% (1.134) 18% (1.11)** ǂ The group’s pretest mean score is statistically higher compared with the other group’s score, at p<.01 level. *The group’s gain score is statistically significantly higher than the other group’s at p <.05 level **The group’s gain score is statistically significantly higher than the other group’s at p <.01 level ***The group’s gain score is statistically significantly higher than the other group’s at p <.001 level
Charts below illustrate frequency distributions of the main pre-literacy subtests, presented as quintiles. These distributions show a similar of results to the second graders. Third graders also did better with letter naming than with letter sounds. Both letter naming and letter sounds subtest results had normal distribution, with most students scoring in the mid-range.
Initial sound identification subtest showed results similar to the second grade with the U-shape distribution, particularly in the comparison group.
Figure 26. 3rd Grade Intervention Group – Letter Naming Subtest Frequency Distribution
Figure 27. 3rd Grade Comparison Group – Letter Naming Subtest Frequency Distribution
1.3% 3.3%
13.3%
33.8%
26.5% 21.7%
0.5% 3.0% 3.0%
13.0%
28.2%
52.2%
0%
10%
20%
30%
40%
50%
60%
0% 1 - 20% 21-40% 41-60% 61-80% 81-100%
Pre-test Post-test
2.4% 7.6%
19.5%
26.9% 25.2%
18.4%
0.1% 3.8%
13.7%
24.7% 20.9%
36.8%
0%
10%
20%
30%
40%
50%
60%
0% 1 - 20% 21-40% 41-60% 61-80% 81-100%
Pre-test Post-test
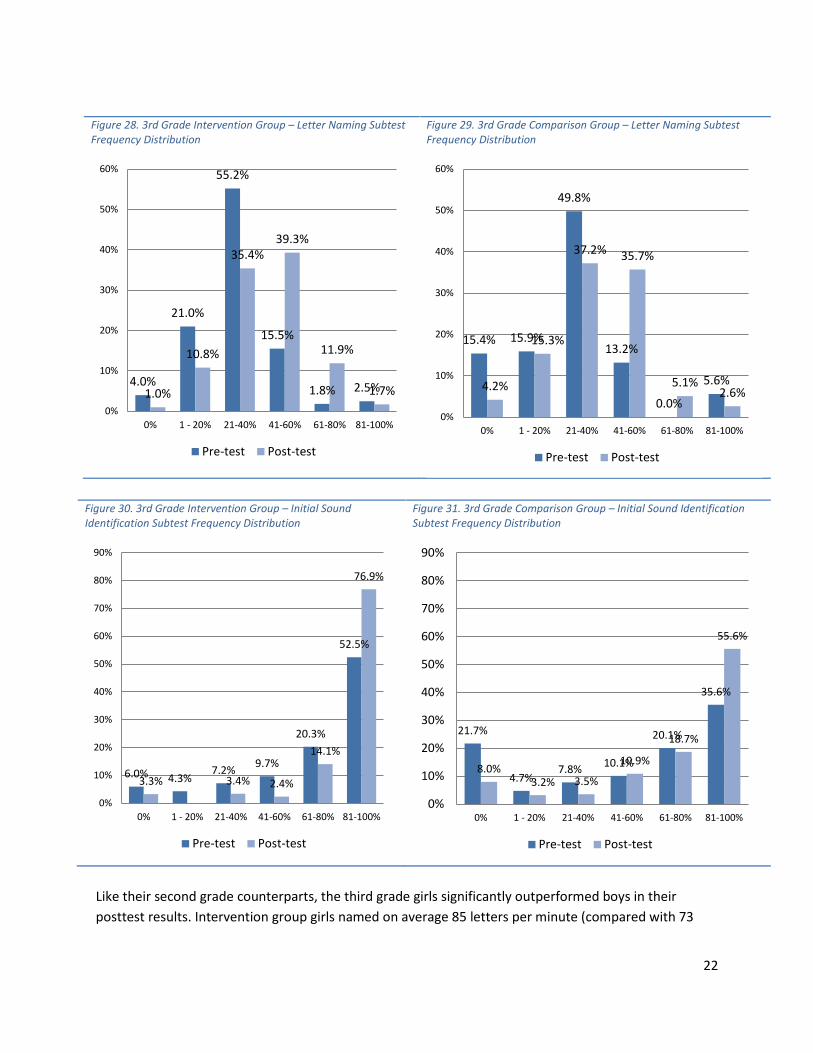
22
Figure 28. 3rd Grade Intervention Group – Letter Naming Subtest Frequency Distribution
Figure 29. 3rd Grade Comparison Group – Letter Naming Subtest Frequency Distribution
Figure 30. 3rd Grade Intervention Group – Initial Sound Identification Subtest Frequency Distribution
Figure 31. 3rd Grade Comparison Group – Initial Sound Identification Subtest Frequency Distribution
Like their second grade counterparts, the third grade girls significantly outperformed boys in their posttest results. Intervention group girls named on average 85 letters per minute (compared with 73
4.0%
21.0%
55.2%
15.5%
1.8% 2.5% 1.0%
10.8%
35.4% 39.3%
11.9%
1.7% 0%
10%
20%
30%
40%
50%
60%
0% 1 - 20% 21-40% 41-60% 61-80% 81-100%
Pre-test Post-test
15.4% 15.9%
49.8%
13.2%
0.0%
5.6% 4.2%
15.3%
37.2% 35.7%
5.1% 2.6%
0%
10%
20%
30%
40%
50%
60%
0% 1 - 20% 21-40% 41-60% 61-80% 81-100%
Pre-test Post-test
6.0% 4.3% 7.2% 9.7%
20.3%
52.5%
3.3% 3.4% 2.4%
14.1%
76.9%
0%
10%
20%
30%
40%
50%
60%
70%
80%
90%
0% 1 - 20% 21-40% 41-60% 61-80% 81-100%
Pre-test Post-test
21.7%
4.7% 7.8% 10.1%
20.1%
35.6%
8.0% 3.2% 3.5%
10.9%
18.7%
55.6%
0%
10%
20%
30%
40%
50%
60%
70%
80%
90%
0% 1 - 20% 21-40% 41-60% 61-80% 81-100%
Pre-test Post-test
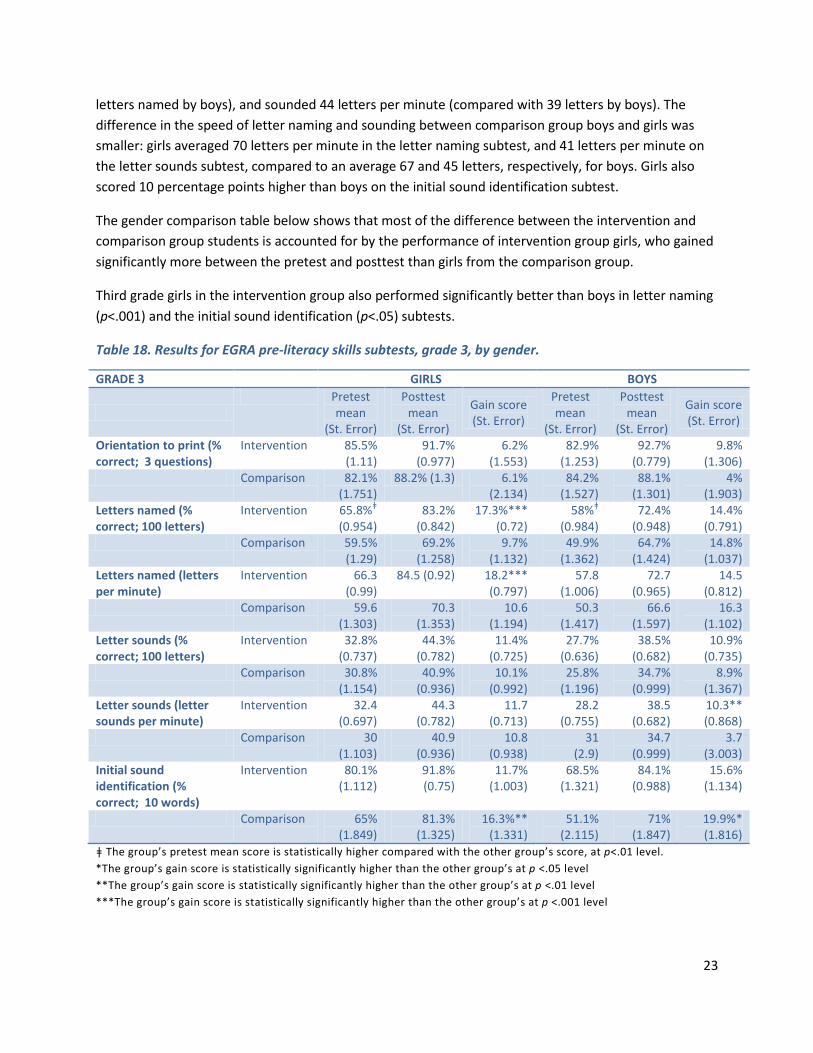
23
letters named by boys), and sounded 44 letters per minute (compared with 39 letters by boys). The difference in the speed of letter naming and sounding between comparison group boys and girls was smaller: girls averaged 70 letters per minute in the letter naming subtest, and 41 letters per minute on the letter sounds subtest, compared to an average 67 and 45 letters, respectively, for boys. Girls also scored 10 percentage points higher than boys on the initial sound identification subtest.
The gender comparison table below shows that most of the difference between the intervention and comparison group students is accounted for by the performance of intervention group girls, who gained significantly more between the pretest and posttest than girls from the comparison group.
Third grade girls in the intervention group also performed significantly better than boys in letter naming (p<.001) and the initial sound identification (p<.05) subtests.
Table 18. Results for EGRA pre-literacy skills subtests, grade 3, by gender.
GRADE 3 GIRLS BOYS
Pretest
mean (St. Error)
Posttest mean
(St. Error)
Gain score (St. Error)
Pretest mean
(St. Error)
Posttest mean
(St. Error)
Gain score (St. Error)
Orientation to print (% correct; 3 questions)
Intervention 85.5% (1.11)
91.7% (0.977)
6.2% (1.553)
82.9% (1.253)
92.7% (0.779)
9.8% (1.306)
Comparison 82.1% (1.751)
88.2% (1.3) 6.1% (2.134)
84.2% (1.527)
88.1% (1.301)
4% (1.903)
Letters named (% correct; 100 letters)
Intervention 65.8%ǂ (0.954)
83.2% (0.842)
17.3%*** (0.72)
58%ǂ (0.984)
72.4% (0.948)
14.4% (0.791)
Comparison 59.5% (1.29)
69.2% (1.258)
9.7% (1.132)
49.9% (1.362)
64.7% (1.424)
14.8% (1.037)
Letters named (letters per minute)
Intervention 66.3 (0.99)
84.5 (0.92) 18.2*** (0.797)
57.8 (1.006)
72.7 (0.965)
14.5 (0.812)
Comparison 59.6 (1.303)
70.3 (1.353)
10.6 (1.194)
50.3 (1.417)
66.6 (1.597)
16.3 (1.102)
Letter sounds (% correct; 100 letters)
Intervention 32.8% (0.737)
44.3% (0.782)
11.4% (0.725)
27.7% (0.636)
38.5% (0.682)
10.9% (0.735)
Comparison 30.8% (1.154)
40.9% (0.936)
10.1% (0.992)
25.8% (1.196)
34.7% (0.999)
8.9% (1.367)
Letter sounds (letter sounds per minute)
Intervention 32.4 (0.697)
44.3 (0.782)
11.7 (0.713)
28.2 (0.755)
38.5 (0.682)
10.3** (0.868)
Comparison 30 (1.103)
40.9 (0.936)
10.8 (0.938)
31 (2.9)
34.7 (0.999)
3.7 (3.003)
Initial sound identification (% correct; 10 words)
Intervention 80.1% (1.112)
91.8% (0.75)
11.7% (1.003)
68.5% (1.321)
84.1% (0.988)
15.6% (1.134)
Comparison 65% (1.849)
81.3% (1.325)
16.3%** (1.331)
51.1% (2.115)
71% (1.847)
19.9%* (1.816)
ǂ The group’s pretest mean score is statistically higher compared with the other group’s score, at p<.01 level. *The group’s gain score is statistically significantly higher than the other group’s at p <.05 level **The group’s gain score is statistically significantly higher than the other group’s at p <.01 level ***The group’s gain score is statistically significantly higher than the other group’s at p <.001 level

24
An analysis of incorrect responses12 on the letter naming and letter sounds subtests showed a decrease in the proportion of the incorrect answers in both intervention and comparison groups; the proportion was similar but slightly higher in the comparison group. Overall, the average rate of incorrect answer at the posttest was between 2 and 5 percent.
The data analysis of incorrect responses by gender shows that the proportion of letters named and sounded incorrectly was very small: between 1 and 6 percent at the posttest, with girls doing better than boys. The proportion of incorrect answers on letter naming and letter sounds subtests by intervention and comparison group boys and girls decreased between the pretest and the posttest by a small margin. The largest decrease was found for comparison group girls (2.4 percent).
Tables in Annex F show frequency distributions of student performance data grouped into quintiles.
Disaggregation by region showed dramatic differences between intervention and comparison groups at the pretest. While intervention groups in the ARMM and Region 12 scored significantly higher than the comparison group counterparts at the pretest, in Region 9 the situation was the reverse, with the comparison group third graders showing better results at the pretest. At the posttest, the ARMM third graders did better than counterparts from Region 12, and somewhat similar to students form Region 9. In terms of achievement gains, students from the ARMM and Region 12 gained significantly more than students from Region 9, accounting for gains made by both intervention and comparison groups.
Table 19. Results for EGRA pre-literacy subtests, grade 3, by region
ARMM GRADE 3 STUDENTS
Pretest mean (St. Error)
Posttest mean (St. Error)
Gain score (St. Error)
Orientation to print (% correct; 3 questions)
Intervention 91%ǂ (1.154) 90.9% (1.583) -0.1% (2.055)
Comparison 77.4% (3.056) 83.8% (2.178) 6.4% (3.666) Letters named (% correct; 100 letters)
Intervention 73.8%ǂ (1.433) 81.5% (1.355) 7.7% (0.69)
Comparison 46.1% (1.729) 57.4% (1.72) 11.2%** (1.172) Letters named (per minute) Intervention 74.7ǂ (1.592) 81.5 (1.355) 6.4 (0.83) Comparison 46.1 (1.729) 57.4 (1.72) 11.2** (1.172) Letter sounds (% correct; 100 letters)
Intervention 38.2%ǂ (1.355) 53.6% (1.291) 15.4% (1.144)
Comparison 17.9% (1.774) 31.5% (1.167) 13.6% (1.811) Letter sounds (per minute) Intervention 38.2 (1.355) 53.6 (1.291) 15.4** (1.144) Comparison 29.2 (6.462) 31.5 (1.167) 2.3 (6.479) Initial sound identification (% correct; 10 words)
Intervention 84.2%ǂ (1.823) 95% (0.71) 10.8% (1.847)
Comparison 34.2% (3.208) 67.9% (2.571) 33.7%*** (3.091)
12 Annex F

25
REGION 9 GRADE 3 STUDENTS
Pretest mean (St. Error)
Posttest mean (St. Error)
Gain score (St. Error)
Orientation to print (% correct; 3 questions)
Intervention 87.6% (1.287) 90.8% (1.165) 3.3%*** (1.739)
Comparison 96%ǂ (0.949) 82.8% (2.279) -13.2% (2.45) Letters named (% correct; 100 letters)
Intervention 67.3% (0.97) 83.4% (0.813) 16.1%*** (0.838)
Comparison 74.6%ǂ (1.468) 79.8% (1.699) 5.2% (1.717) Letters named (per minute) Intervention 67.4 (0.993) 85 (0.938) 17.5*** (0.916) Comparison 75.7ǂ (1.598) 85.7 (2.17) 10 (2.075) Letter sounds (% correct; 100 letters)
Intervention 25.3% (0.683) 38.4% (0.833) 13.1%*** (0.746)
Comparison 36.4%ǂ (2.113) 37% (1.054) 0.7% (2.286) Letter sounds (per minute) Intervention 24.5 (0.556) 38.4 (0.833) 13.6*** (0.714) Comparison 35.6ǂ (2.18) 37 (1.054) 1.2 (2.436) Initial sound identification (% correct; 10 words)
Intervention 70.2% (1.536) 84.9% (1.391) 14.7%* (1.284)
Comparison 67.8% (2.128) 77.4% (2.044) 9.6% (1.606) REGION 12 GRADE 3 STUDENTS
Pretest mean (St. Error)
Posttest mean (St. Error)
Gain score (St. Error)
Orientation to print (% correct; 3 questions)
Intervention 79.1% (1.416) 93.7% (0.785) 14.6% (1.461)
Comparison 79% (1.714) 92.4% (0.985) 13.3% (1.82) Letters named (% correct; 100 letters)
Intervention 53.1%ǂ (1.024) 71.7% (1.075) 18.6%* (0.892)
Comparison 48.9% (1.251) 64.5% (1.307) 15.7% (1.058) Letters named (per minute) Intervention 53.1ǂ (1.027) 72.3 (1.109) 19.1* (0.905) Comparison 48.9 (1.251) 64.5 (1.307) 15.7 (1.058) Letter sounds (% correct; 100 letters)
Intervention 30% (0.666) 38.1% (0.671) 8.2% (0.809)
Comparison 28.6% (0.871) 40.8% (1.067) 12.2%** (0.771) Letter sounds (per minute) Intervention 30.5 (0.8) 38.1 (0.671) 7.6 (0.953) Comparison 28.6 (0.87) 40.8 (1.067) 12.2** (0.773) Initial sound identification (% correct; 10 words)
Intervention 72.2% ǂ (1.316) 86.6% (0.888) 14.4% (1.113)
Comparison 62.9% (1.934) 79.1% (1.567) 16.2% (1.411) ǂ The group’s pretest mean score is statistically higher compared with the other group’s score, at p<.01 level. *The group’s gain score is statistically significantly higher than the other group’s at p <.05 level **The group’s gain score is statistically significantly higher than the other group’s at p <.01 level ***The group’s gain score is statistically significantly higher than the other group’s at p <.001 level

26
FLUENCY SKILLS
Fluency refers to a student’s speed of accurate reading of unconnected words or a connected text. Fluency is a fundamental characteristic that defines good readers, and is considered to be a skill that bridges decoding and comprehension. The section of EGRA designed to test students’ reading fluency and automaticity included three subtests:
• Familiar word reading o Percent completed o Speed (words per minute)
• Invented word reading o Percent completed o Speed (words per minute)
• Oral passage reading o Percent completed o Speed (words per minute)
These three subsets measure different skills. The familiar word reading subset integrates decoding skills and recognition of sight words (commonly used words) skills. Invented word reading tests students’ decoding abilities. Oral passage reading tests students’ ability to read a connect text and understand its meaning.
FLUENCY SKILLS: GRADE 2
The following table presents the results of fluency testing of grade 2 students in both the intervention and comparison groups. The intervention group students scored significantly higher at the pretest in all of the fluency subtests. Although students in both groups gained substantially between the pretest and the posttest, students in the intervention group demonstrated larger gains in the speed of reading of familiar words and in both percent completed and speed of the oral passage reading.
Table 20. Results for EGRA fluency subtests, grade 2
ALL GRADE 2 STUDENTS
Pretest mean (St. Error)
Posttest mean (St. Error)
Gain score (St. Error)
Familiar word reading (% correct; 50 words)
Intervention 53.5%ǂ (1.159) 74.1% (1.064) 20.6% (0.754)
Comparison 37.1% (1.285) 55.9% (1.391) 18.8% (0.856) Familiar word reading (words per minute)
Intervention 29.5ǂ (0.758) 40.4 (0.689) 10.8** (0.59)
Comparison 20.3 (0.832) 28.7 (0.737) 8.4 (0.665) Invented word reading (% correct; 50 words)
Intervention 50.7%ǂ (1.162) 70.4% (1.061) 19.6% (0.74)

27
Comparison 37% (1.345) 56.3% (1.431) 19.3% (1.091) Invented word reading (words per minute)
Intervention 26.5ǂ (0.638) 36.5 (0.591) 10 (0.439)
Comparison 20.5 (0.851) 28.9 (0.764) 8.5 (0.818) Oral passage reading (% correct; 61 words)
Intervention 50.8%ǂ (1.262) 72% (1.153) 21.2%* (0.846)
Comparison 34.9% (1.417) 53.3% (1.466) 18.4% (0.991) Oral passage reading (words per minute)
Intervention 34.1ǂ (0.938) 48.1 (0.911) 14.0** (0.71)
Comparison 22.9 (0.964) 33.7 (0.955) 10.8 (0.687) ǂ The group’s pretest mean score is statistically higher compared with the other group’s score, at p<.01 level. *The group’s gain score is statistically significantly higher than the other group’s at p <.05 level **The group’s gain score is statistically significantly higher than the other group’s at p <.01 level ***The group’s gain score is statistically significantly higher than the other group’s at p <.001 level
Charts below illustrate frequency distributions of the main pre-literacy subtests, presented as quintiles. All three distributions are U-shaped, particularly among the comparison group students, indicating a wide range of abilities among the students. Comparison group distributions show similarly high percent of students scoring zero and 100 percent, with fewer than half of third grade students falling in the middle. This type of distribution presents a huge challenge for educators, since adapting the instruction to such varied levels of skills requires additional resources.
Figure 32. 2nd Grade Intervention Group - Familiar Word Reading Subtest Frequency Distribution
Figure 33. 2nd Grade Comparison Group - Familiar Word Reading Subtest Frequency Distribution
16.0%
6.7%
14.8% 19.0%
13.1%
30.3%
5.5% 4.0% 7.1%
14.1% 12.1%
57.3%
0%
10%
20%
30%
40%
50%
60%
0% 1 - 20% 21-40% 41-60% 61-80% 81-100%
Pre-test Post-test
37.2%
6.8%
12.9% 12.6%
15.1% 15.4%
22.1%
3.3%
12.8% 15.8%
7.2%
38.8%
0%
10%
20%
30%
40%
50%
60%
0% 1 - 20% 21-40% 41-60% 61-80% 81-100%
Pre-test Post-test
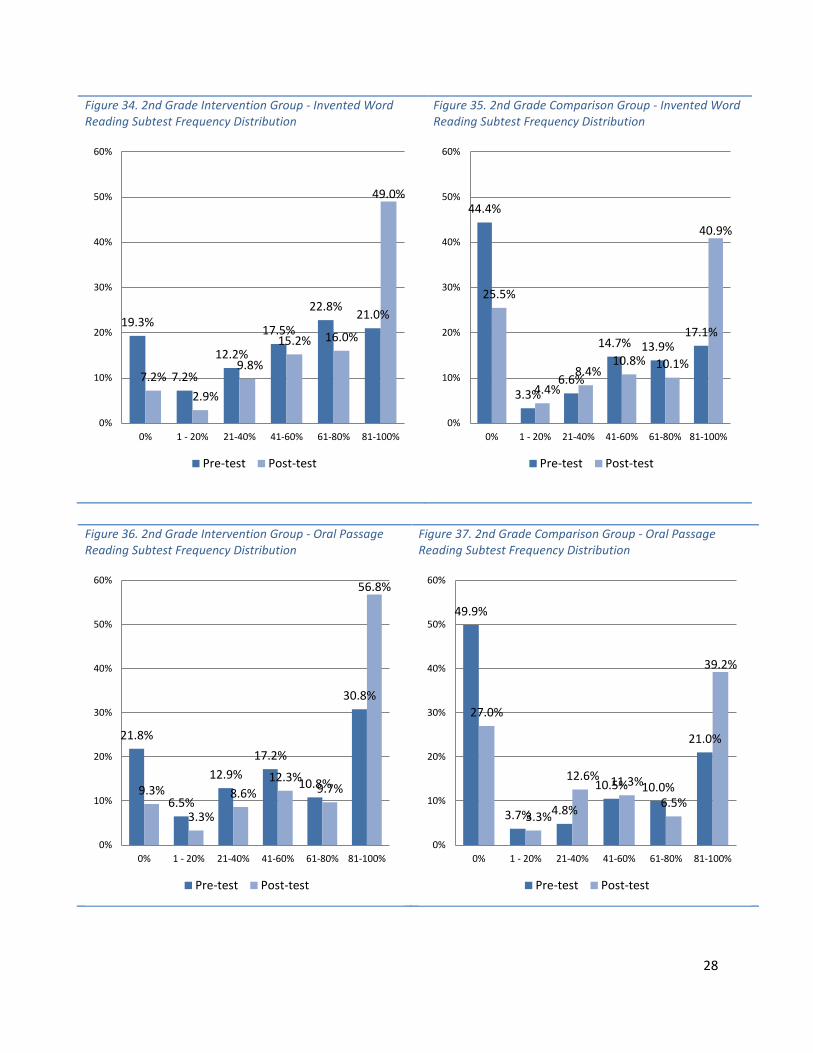
28
Figure 34. 2nd Grade Intervention Group - Invented Word Reading Subtest Frequency Distribution
Figure 35. 2nd Grade Comparison Group - Invented Word Reading Subtest Frequency Distribution
Figure 36. 2nd Grade Intervention Group - Oral Passage Reading Subtest Frequency Distribution
Figure 37. 2nd Grade Comparison Group - Oral Passage Reading Subtest Frequency Distribution
19.3%
7.2%
12.2%
17.5%
22.8% 21.0%
7.2% 2.9%
9.8%
15.2% 16.0%
49.0%
0%
10%
20%
30%
40%
50%
60%
0% 1 - 20% 21-40% 41-60% 61-80% 81-100%
Pre-test Post-test
44.4%
3.3% 6.6%
14.7% 13.9% 17.1%
25.5%
4.4% 8.4%
10.8% 10.1%
40.9%
0%
10%
20%
30%
40%
50%
60%
0% 1 - 20% 21-40% 41-60% 61-80% 81-100%
Pre-test Post-test
21.8%
6.5%
12.9% 17.2%
10.8%
30.8%
9.3%
3.3%
8.6% 12.3%
9.7%
56.8%
0%
10%
20%
30%
40%
50%
60%
0% 1 - 20% 21-40% 41-60% 61-80% 81-100%
Pre-test Post-test
49.9%
3.7% 4.8%
10.5% 10.0%
21.0%
27.0%
3.3%
12.6% 11.3%
6.5%
39.2%
0%
10%
20%
30%
40%
50%
60%
0% 1 - 20% 21-40% 41-60% 61-80% 81-100%
Pre-test Post-test

29
Turning to gender, second grade girls from both groups scored higher than their male counterparts on almost all subtests, on both the pretest and posttest. On average at the posttest, intervention group girls read 79 percent of the connected text within the allocated amount of time, read 81 percent of the familiar words subtest within the allocated amount of time, and decoded 79 percent of the invented words subtest within the allocated amount of time. Intervention group boys read 65 percent of the connected text within the allocated amount of time, read 67 percent of the familiar words subtest within the allocated amount of time, and decoded 63 percent of the invented words subtest within the allocated amount of time. Consequently, the intervention group girls read connected text faster than boys, with an average speed of 54 words per minute, compared to 42 words per minute for boys. Girls were also faster at decoding familiar words (45 words per minute, compared with 36 words per minute decoded by boys) as well as invented words (42 words per minute, compared with 32 words per minute decoded by boys).
Comparison group girls also read faster than comparison group boys. The average speed of reading a connected text for girls was 37 words per minute, compared with 30 words per minute read by boys. Comparison group girls decoded 30 familiar words per minute (compared with 27 decoded by boys), and 31 invented words per minute (compared with 27 decoded by boys).
Finally, intervention group girls gained more than boys with respect to familiar word reading speed (p<.05) and decoding of invented words speed (p<.01). In the comparison group, girls gained more than boys in the speed oral passage reading (p<.01), as well as speed and percent of decoding unfamiliar words (both subtests (p<.01).
Table 21. Results for EGRA fluency subtests, grade 2, by gender
GRADE 2 GIRLS BOYS
Pretest
mean (St. Error)
Posttest mean
(St. Error)
Gain score (St.
Error)
Pretest mean
(St. Error)
Posttest mean
(St. Error)
Gain score
(St. Error) Familiar word reading (% correct; 50 words)
Intervention 59.2%ǂ (1.539)
81.1% (1.3)
21.9%** (0.994)
48%ǂ (1.689)
67.3% (1.614)
19.3% (1.128)
Comparison 40.1% (1.847)
57.5% (1.905)
17.4% (1.315)
33.9% (1.767)
54.1% (2.033)
20.3% (1.07)
Familiar word reading (words per minute)
Intervention 32.9ǂ (1.07)
45.1 (0.934)
12.1** (0.86)
26.3ǂ (1.053)
35.9 (0.963)
9.6 (0.807)
Comparison 22.8 (1.323)
30.1 (1.055)
7.4 (1.149)
17.6 (0.958)
27.2 (1.021)
9.5 (0.602)
Invented word reading (% correct; 50 words)
Intervention 57.5%ǂ (1.573)
78.5% (1.296)
20.9% (1.001)
44.1% (1.65)
62.5% (1.585)
18.4% (1.085)
Comparison 37.2% (1.84)
59.3% (1.927)
22.1% (1.246)
36.8% (1.97)
53% (2.118)
16.2% (1.817)
Invented word reading (words per minute)
Intervention 29.9ǂ (0.855)
41.2 (0.776)
11.2 (0.608)
23.2 (0.917)
32 (0.834)
8.7* (0.627)
Comparison 20.1 (1.136)
31.2 (1.087)
11.1 (0.989)
20.9 (1.278)
26.5 (1.06)
5.6 (1.312)
Oral passage reading (% correct; 61 words)
Intervention 57.5%ǂ (1.795)
78.8% (1.524)
21.3% (1.315)
44.2%ǂ (1.719)
65.3% (1.669)
21.1%* (1.072)

30
Comparison 38.7% (2.026)
57.7% (2.028)
19% (1.185)
30.7% (1.953)
48.5% (2.098)
17.8% (1.618)
Oral passage reading (words per minute)
Intervention 39.3ǂ (1.374)
54.3 (1.337)
15.0* (1.163)
29.1ǂ (1.235)
42 (1.172)
12.9** (0.824)
Comparison 25.1 (1.353)
37.3 (1.375)
12.1 (0.829)
20.4 (1.366)
29.7 (1.291)
9.3 (1.111)
ǂ The group’s pretest mean score is statistically higher compared with the other group’s score, at p<.01 level. *The group’s gain score is statistically significantly higher than the other group’s at p <.05 level **The group’s gain score is statistically significantly higher than the other group’s at p <.01 level ***The group’s gain score is statistically significantly higher than the other group’s at p <.001 level
With respect to the three fluency subtests (familiar word reading, invented word decoding, and oral passage reading), the highest error rates at the posttest level were on reading of familiar words (around 10 percent for both groups), followed by decoding of invented words (between 7 and 9 percent), with the lowest rate in the oral reading (6 percent in both groups). Intervention and comparison groups showed a decrease of between .5 and 2 percent in words read incorrectly between the pretest and the posttest.
Gender analysis of the three fluency subtests (familiar word reading, invented word decoding, and oral passage reading) showed a similar pattern in incorrect responses across sexes. For both boys and girls, the highest error rate at the posttest level was in the reading of familiar words, followed by decoding of invented words, with the lowest rate in the oral reading. The rate of improvement between the pretest and the posttest was the highest among the intervention group girls (3.5 percent reduction in incorrect words in the oral reading passage).
To better understand student performance in these subtests, frequency distributions were grouped in quintiles and presented in Annex F.
Disaggregation by region showed substantial differences across regions. Intervention groups in Regions 9 and 12 scored significantly higher on the pretest than comparison groups, while in the ARMM region the comparison group scored significantly higher on most subtests. Posttest results showed superior achievement by the ARMM students, comparing to the Regions 9 and 12 students. In terms of overall achievement gains on fluency subtests, second graders from all three regions gained roughly similar amount.
Table 22. Overall results for EGRA fluency subtests, grade 2, by region
ARMM GRADE 2 STUDENTS
Pretest mean (St. Error)
Posttest mean (St. Error)
Gain score (St. Error)
Familiar word reading (% correct; 50 words)
Intervention 51% (2.453) 81.8% (1.915) 30.8%*** (1.556)
Comparison 59.9%ǂ (2.975) 77.4% (2.614) 17.5% (1.489)

31
Familiar word reading (per minute) Intervention 26.5 (1.379) 40.9 (0.957) 14.4* (0.942) Comparison 33ǂ (1.769) 39.5 (1.379) 6.5 (0.978) Invented word reading (% correct; 50 words)
Intervention 51.4% (2.325) 74.5% (2.056) 23.2%* (1.598)
Comparison 59.5%ǂ (2.972) 77.4% (2.544) 17.9% (1.45) Invented word reading (per minute) Intervention 25.7 (1.163) 37.3 (1.028) 11.6** (0.799) Comparison 30.8ǂ (1.595) 39.3 (1.323) 8.5 (0.776) Oral passage reading (% correct; 61 words)
Intervention 46.9% (2.662) 78.7% (2.157) 31.8%*** (1.66)
Comparison 60.6%ǂ (3.319) 72.3% (2.849) 11.7% (2.418) Oral passage reading (words per minute)
Intervention 29 (1.673) 48 (1.316) 19.1*** (1.063)
Comparison 41.4ǂ (2.393) 44.7 (1.787) 3.3 (1.773)
REGION 9 GRADE 2 STUDENTS
Pretest mean (St. Error)
Posttest mean (St. Error)
Gain score (St. Error)
Familiar word reading (% correct; 50 words)
Intervention 49.3%ǂ (2.143) 66.8% (2.064) 17.5% (1.418)
Comparison 27.8% (2.045) 49.7% (2.533) 21.9%* (1.943) Familiar word reading (per minute) Intervention 27.1ǂ (1.305) 42.3 (1.65) 15.2* (1.124) Comparison 13.9 (1.023) 26.3 (1.422) 12.4 (1.029) Invented word reading (% correct; 50 words)
Intervention 45.3% (2.063) 64.6% (2.008) 19.3% (1.338)
Comparison 37.1% (2.545) 55.2% (2.551) 18.1% (3.094) Invented word reading (per minute) Intervention 23.9 (1.101) 35.6 (1.247) 11.6* (0.847) Comparison 24.2 (2.169) 29.8 (1.554) 5.6 (2.696) Oral passage reading (% correct; 61 words)
Intervention 49.4%ǂ (2.345) 66.9% (2.268) 17.5% (1.797)
Comparison 28% (2.423) 48.8% (2.625) 20.8% (2.038) Oral passage reading (words per minute)
Intervention 33.3ǂ (1.709) 52.6 (2.213) 19.3* (1.486)
Comparison 17.2 (1.474) 32.2 (1.852) 14.9 (1.354) REGION 12 GRADE 2 STUDENTS
Pretest mean (St. Error)
Posttest mean (St. Error)
Gain score (St. Error)
Familiar word reading (% correct; 50 words)
Intervention 56.9%ǂ (1.627) 76% (1.473) 19.1% (1.019)
Comparison 32.7% (1.699) 50.3% (1.938) 17.6% (1.15) Familiar word reading (per minute) Intervention 32.1ǂ (1.142) 39.1 (0.824) 6.9 (0.826) Comparison 18.5 (1.251) 25.6 (1.007) 7.1 (1.084) Invented word reading (% correct; 50 words)
Intervention 53.8%ǂ (1.692) 72.5% (1.49) 18.7% (1.054)
Comparison 27.8% (1.676) 48.2% (2.049) 20.5% (1.212) Invented word reading (per minute) Intervention 28.3ǂ (0.961) 36.9 (0.79) 8.4 (0.617) Comparison 14.3 (0.882) 24.2 (1.035) 10 (0.629)

32
Oral passage reading (% correct; 61 words)
Intervention 52.8%ǂ (1.78) 72.8% (1.593) 19.9% (1.049)
Comparison 28% (1.799) 47.8% (2.084) 19.9% (1.226) Oral passage reading (words per minute)
Intervention 36.3ǂ (1.378) 45.3 (1.046) 9.1 (0.925)
Comparison 18.2 (1.224) 29.9 (1.334) 11.7 (0.813) ǂ The group’s pretest mean score is statistically higher compared with the other group’s score, at p<.01 level. *The group’s gain score is statistically significantly higher than the other group’s at p <.05 level **The group’s gain score is statistically significantly higher than the other group’s at p <.01 level ***The group’s gain score is statistically significantly higher than the other group’s at p <.001 level
FLUENCY SKILLS: GRADE 3
Grade 3 students demonstrated overall high levels of speed with respect to reading familiar words, decoding invented words, and reading an oral passage. At the posttest, the average percent of subtest completion within the allocated amount of time in these three subtests was between 75 and 85 percent. The average oral passage reading speed was 54 words per minute in the comparison group, and 64 words per minute in the intervention group. The average speed of decoding familiar words was 44 words per minute in the comparison group, and 51 words per minute in the intervention group. The difference in the speed of decoding invented words was similar: 40 words per minute in the comparison group, and 46 words per minute in the intervention group.
The intervention group students read faster and more accurately than their comparison group counterparts on both the pre- and the posttest, with students in both groups gaining in fluency by under 15 percent. Statistically significantly gains for the intervention group were registered on only one subtest: speed of reading of invented words. The difference in the gain score between the two groups in the remaining subtests was not significant.
Table 23. Results for EGRA fluency subtests, grade 3
ALL GRADE 3 STUDENTS
Pretest mean (St. Error)
Posttest mean (St. Error)
Gain score (St. Error)
Familiar word reading (% correct; 50 words)
Intervention 71%ǂ (0.995) 85.8% (0.789) 14.8% (0.733)
Comparison 61.8% (1.404) 75.5% (1.281) 13.7% (0.831) Familiar word reading (words per minute)
Intervention 42.8 (0.799) 50.8 (0.698) 8.0 (0.783)
Comparison 35.5 (0.921) 43.9 (0.963) 8.4 (0.645) Invented word reading (% correct; 50 words)
Intervention 68.5%ǂ (0.966) 83% (0.803) 14.5% (0.561)
Comparison 59.9% (1.446) 72.9% (1.32) 13% (0.848) Invented word reading (words per minute)
Intervention 37 (0.593) 45.9 (0.581) 8.8* (0.475)
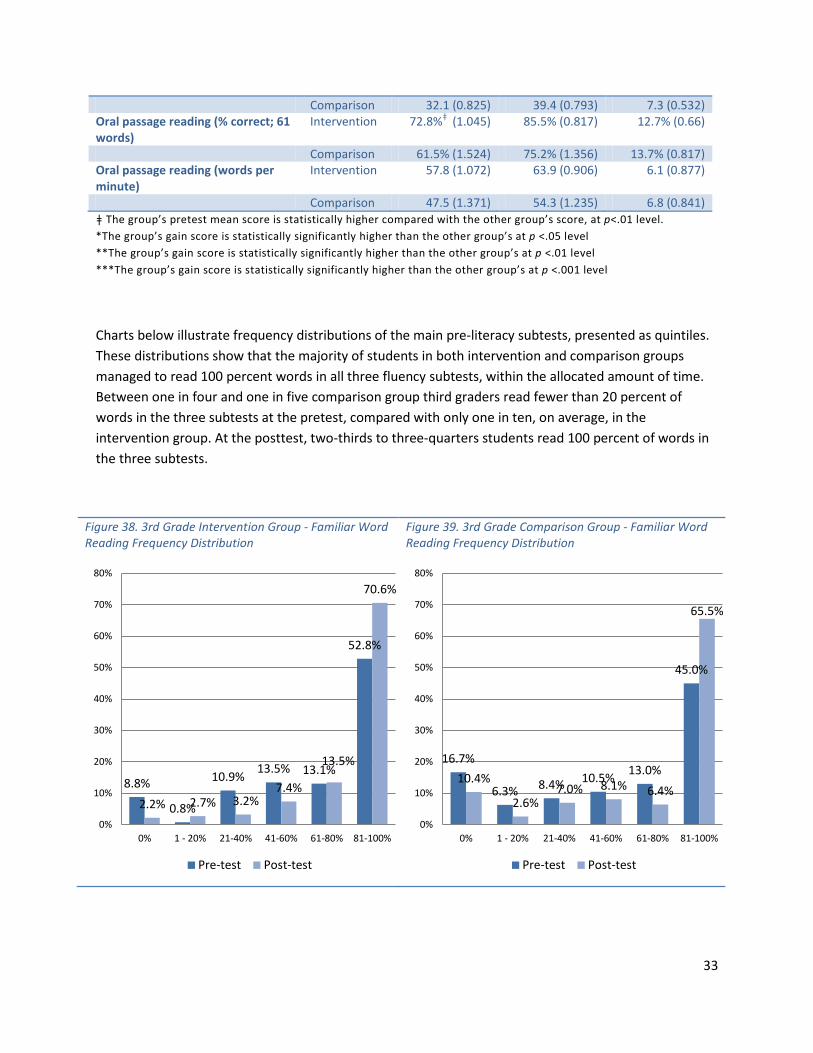
33
Comparison 32.1 (0.825) 39.4 (0.793) 7.3 (0.532) Oral passage reading (% correct; 61 words)
Intervention 72.8%ǂ (1.045) 85.5% (0.817) 12.7% (0.66)
Comparison 61.5% (1.524) 75.2% (1.356) 13.7% (0.817) Oral passage reading (words per minute)
Intervention 57.8 (1.072) 63.9 (0.906) 6.1 (0.877)
Comparison 47.5 (1.371) 54.3 (1.235) 6.8 (0.841) ǂ The group’s pretest mean score is statistically higher compared with the other group’s score, at p<.01 level. *The group’s gain score is statistically significantly higher than the other group’s at p <.05 level **The group’s gain score is statistically significantly higher than the other group’s at p <.01 level ***The group’s gain score is statistically significantly higher than the other group’s at p <.001 level
Charts below illustrate frequency distributions of the main pre-literacy subtests, presented as quintiles. These distributions show that the majority of students in both intervention and comparison groups managed to read 100 percent words in all three fluency subtests, within the allocated amount of time. Between one in four and one in five comparison group third graders read fewer than 20 percent of words in the three subtests at the pretest, compared with only one in ten, on average, in the intervention group. At the posttest, two-thirds to three-quarters students read 100 percent of words in the three subtests.
Figure 38. 3rd Grade Intervention Group - Familiar Word Reading Frequency Distribution
Figure 39. 3rd Grade Comparison Group - Familiar Word Reading Frequency Distribution
8.8%
0.8%
10.9% 13.5% 13.1%
52.8%
2.2% 2.7% 3.2% 7.4%
13.5%
70.6%
0%
10%
20%
30%
40%
50%
60%
70%
80%
0% 1 - 20% 21-40% 41-60% 61-80% 81-100%
Pre-test Post-test
16.7%
6.3% 8.4% 10.5% 13.0%
45.0%
10.4%
2.6% 7.0% 8.1% 6.4%
65.5%
0%
10%
20%
30%
40%
50%
60%
70%
80%
0% 1 - 20% 21-40% 41-60% 61-80% 81-100%
Pre-test Post-test

34
Figure 40. 3rd Grade Intervention Group - Invented Word Reading Frequency Distribution
Figure 41. 3rd Grade Comparison Group - Invented Word Reading Frequency Distribution
Figure 42. 3rd Grade Intervention Group – Oral Passage Reading Frequency Distribution
Figure 43. 3rd Grade Comparison Group – Oral Passage Reading Frequency Distribution
8.3% 3.8%
8.3% 14.2%
18.9%
46.5%
4.2% 0.0%
5.0% 9.2%
12.2%
69.5%
0%
10%
20%
30%
40%
50%
60%
70%
80%
0% 1 - 20% 21-40% 41-60% 61-80% 81-100%
Pre-test Post-test
21.4%
3.0% 8.0%
10.5% 13.7%
43.3%
14.6%
0.6% 3.7%
7.2%
19.0%
54.9%
0%
10%
20%
30%
40%
50%
60%
70%
80%
0% 1 - 20% 21-40% 41-60% 61-80% 81-100%
Pre-test Post-test
9.2% 3.6%
8.4% 10.1% 9.2%
59.4%
4.8% 0.3%
4.9% 5.7% 8.9%
75.4%
0%
10%
20%
30%
40%
50%
60%
70%
80%
0% 1 - 20% 21-40% 41-60% 61-80% 81-100%
Pre-test Post-test
24.7%
1.9% 5.2%
10.2% 9.5%
48.5%
14.4%
7.0% 4.8% 7.3%
66.4%
0%
10%
20%
30%
40%
50%
60%
70%
80%
0% 1 - 20% 21-40% 41-60% 61-80% 81-100%
Pre-test Post-test

35
Grade 3 girls in WSRP schools demonstrated high overall performance, with an average posttest score of 90 percent subtest completion in reading familiar words, decoding invented words, and reading a connected text. By contrast, boys in the intervention group completed an average 80 percent in these subtests. Both girls and boys in the comparison group completed between with 70 to 80 percent of these subtests. Girls also demonstrated a higher speed of reading. Intervention group girls read over 70 words per minute, on average, for the connected text, decoded 55 familiar words per minute, and read 50 invented words per minute. Comparable average speeds for intervention group boys were 58, 47 and 42 words per minute, respectively.
Comparison group students read much more slowly. Girls read 57 words per minute from the connected text, and decoded familiar and invented words at 45 and 42 words per minute, respectively. Comparison group boys read a connected text at 51 words per minute, and decoded familiar and invented words at 42 and 37 words per minute, respectively.
Although girls in grade 3 outperformed boys on all subtests, boys in both WSRP and non-WSRP showed comparatively larger gains between tests. In particular, intervention group boys demonstrated significantly larger gains than girls in the completion of decoding familiar words subtest (p<.001), decoding invented words (p<.05), and both speed and completion of reading the connected text (p<.001). Comparison group boys showed larger gains than girls in both speed and completion of reading familiar words subtest (p<.05), in the speed of decoding invented words (p<.05), and in the speed of reading a connected text (p<.01).
Table 24. Results for EGRA fluency subtests, grade 3, by gender.
GRADE 3 GIRLS BOYS
Pretest
mean (St. Error)
Posttest mean
(St. Error)
Gain score (St.
Error)
Pretest mean
(St. Error)
Posttest mean
(St. Error)
Gain score
(St. Error) Familiar word reading (% correct; 50 words)
Intervention 79.7%ǂ (1.217)
91.2% (0.935)
11.5% (0.961)
63.6% (1.457)
81.2% (1.193)
17.6% (1.07)
Comparison 67% (1.899)
78.9% (1.713)
11.9% (1.021)
56.1% (2.04)
71.7% (1.903)
15.6% (1.334)
Familiar word reading (words per minute)
Intervention 48.3 (1.007)
55.2 (0.956)
6.8 (1.104)
38.1 (1.172)
47.1 (0.98)
9.0 (1.103)
Comparison 38.4 (1.237)
45.0 (1.201)
6.6 (0.805)
32.3 (1.356)
42.8 (1.534)
10.5 (1.017)
Invented word reading (% correct; 50 words)
Intervention 77.2%ǂ (1.261)
90.2% (0.955)
13% (0.807)
61.1% (1.36)
76.9% (1.189)
15.8% (0.776)
Comparison 65.6% (1.91)
77.1% (1.718)
11.5% (0.962)
53.5% (2.146)
68.1% (2.003)
14.6% (1.435)
Invented word reading (words per minute)
Intervention 42 (0.81) 50.1 (0.691)
8.0 (0.713)
32.7 (0.815)
42.3 (0.874)
9.5 (0.635)
Comparison 35 (1.089)
41.2 (1.015)
6.2 (0.636)
28.7 (1.231)
37.2 (1.231)
8.5 (0.869)
Oral passage reading (% correct; 61 words)
Intervention 82.5%ǂ (1.283)
92% (0.892)
9.6% (0.808)
64.6%ǂ (1.52)
79.9% (1.266)
15.3% (0.999)
Comparison 66.6% 79.4% 12.8%* 55.9% 70.6% 14.7%

36
(2.076) (1.804) (1.119) (2.206) (2.017) (1.195) Oral passage reading (words per minute)
Intervention 67.6 (1.478)
70.8 (1.271)
3.2 (1.371)
49.5 (1.45)
58 (1.231)
8.5 (1.121)
Comparison 53.3 (1.926)
57.3 (1.647)
4 (1.249)
41.1 (1.891)
51 (1.845)
9.9 (1.083)
ǂ The group’s pretest mean score is statistically higher compared with the other group’s score, at p<.01 level. *The group’s gain score is statistically significantly higher than the other group’s at p <.05 level **The group’s gain score is statistically significantly higher than the other group’s at p <.01 level ***The group’s gain score is statistically significantly higher than the other group’s at p <.001 level
For third graders, the highest error rate among the three fluency subtests at the posttest level was in the reading of familiar words (between 9 and 10 percent for the two groups), followed by decoding of invented words (around 8 percent), and oral reading (5 percent in both groups). Intervention and comparison groups showed an improvement between 1 and 2 percent in the percent of words read incorrectly between the pretest and the posttest. (See Annex F)
Grade three students’ performance on fluency subtests (familiar word reading, invented word decoding, and oral passage reading) showed great similarity across the sexes. For both boys and girls, the highest error rate at the posttest level was in the reading of familiar words, followed by decoding of invented words, and oral reading. The rate of improvement between the pretest and the posttest was the highest among the intervention group girls (3.5 percent reduction in incorrect words in the oral reading passage).
To better understand student performance in these subtests, frequency distributions were grouped in quintiles and presented in Annex F.
Disaggregation by region showed that the intervention group in the ARMM scored significantly higher on the pretest than comparison group. The ARMM students also scored higher than Region 12 or Region 9 students Posttest results showed superior achievement by the Region 9 students who read on average 64 to 67 familiar words per minute, compared to 37 to 48 in the ARMM, and 35 to 44 in the Region 12.
Table 25. Overall results for EGRA subscales in ARMM, grade 3
ARMM GRADE 3 STUDENTS
Pretest mean (St. Error)
Posttest mean (St. Error)
Gain score (St. Error)
Familiar word reading (% correct; 50 words)
Intervention 78.3%ǂ (2.173) 89.3% (1.371) 11.1% (2.261)
Comparison 50.4% (2.895) 73.8% (2.681) 23.4%*** (1.78) Familiar word reading (per minute) Intervention 53.5ǂ (2.001) 44.7 (0.685) -8.9 (1.911) Comparison 26.1 (1.56) 37.0 (1.351) 10.9 (0.996) Invented word reading (% correct; 50 words)
Intervention 80.1%ǂ (1.708) 90.9% (1.007) 10.8% (1.483)
Comparison 46.8% (2.894) 68.3% (2.516) 21.5%*** (1.839)
Invented word reading (per minute) Intervention 46.2ǂ (1.34) 45.5 (0.503) -0.8 (1.167) Comparison 23.7 (1.491) 34.2 (1.258) 10.4*** (0.954)

37
Oral passage reading (% correct; 61 words)
Intervention 81.6%ǂ (2.144) 94.4% (1.046) 12.8% (1.961)
Comparison 48.7% (3.037) 74.5% (2.765) 25.8%*** (1.903)
Oral passage reading (words per minute)
Intervention 73.0ǂ (2.703) 58.1 (0.671) -14.9 (2.514)
Comparison 30.2 (1.888) 45.4 (1.687) 15.3*** (1.183)
REGION 9 GRADE 3 STUDENTS
Pretest mean (St. Error)
Posttest mean (St. Error)
Gain score (St. Error)
Familiar word reading (% correct; 50 words)
Intervention 78.5% (1.392) 89.7% (1.134) 11.2% (0.846)
Comparison 78.6% (2.357) 88.7% (1.857) 10.1% (1.664) Familiar word reading (per minute) Intervention 44.5 (0.997) 64.1 (1.432) 19.7 (0.835) Comparison 49.1 (1.789) 67.9 (2.176) 18.9 (1.321) Invented word reading (% correct; 50 words)
Intervention 74.1% (1.366) 88.9% (1.11) 14.8%*** (0.822)
Comparison 77.5% (2.343) 86.5% (1.798) 9% (1.58) Invented word reading (per minute) Intervention 39.7 (0.866) 55.6 (1.169) 15.9 ** (0.84) Comparison 42.6% (1.41) 54.4% (1.549) 11.8% (1.041) Oral passage reading (% correct; 61 words)
Intervention 79.6% (1.49) 91.5% (1.107) 11.9% (0.921)
Comparison 82.3% (2.257) 91% (1.744) 8.8% (1.72) Oral passage reading (per minute) Intervention 62.8 (1.661) 83.4 (1.694) 20.6 (0.967) Comparison 69.5 (2.555) 87.8 (2.514) 18.3 (1.614)
REGION 12 GRADE 3 STUDENTS
Pretest mean (St. Error)
Posttest mean (St. Error)
Gain score (St. Error)
Familiar word reading (% correct; 50 words)
Intervention 63.3% (1.544) 81.9% (1.309) 18.6%*** (1.055)
Comparison 58.1% (1.957) 69.9% (1.883) 11.7% (1.09) Familiar word reading (words per minute)
Intervention 37.5ǂ (1.224) 44.5 (0.879) 7.0** (1.156)
Comparison 32.5% (1.228) 35.1% (0.95) 2.6% (0.815) Invented word reading (% correct; 50 words)
Intervention 60.3% (1.55) 76.1% (1.356) 15.8%** (0.826)
Comparison 56.3% (2.045) 68% (2.013) 11.7% (1.157) Invented word reading (words per minute)
Intervention 31.7 (0.868) 39.7 (0.776) 8.0*** (0.552)
Comparison 30.1% (1.168) 34.1% (1.01) 3.9% (0.729) Oral passage reading (% correct; 61 words)
Intervention 65%ǂ (1.643) 78.1% (1.38) 13.1% (0.936)
Comparison 56.4% (2.185) 67.9% (2.027) 11.5% (0.967) Oral passage reading (words per minute)
Intervention 48.6 (1.471) 53.4 (1.202) 4.8*** (1.131)
Comparison 43.5% (1.883) 41.6% (1.244) -1.9% (1.1) ǂ The group’s pretest mean score is statistically higher compared with the other group’s score, at p<.01 level. *The group’s gain score is statistically significantly higher than the other group’s at p <.05 level **The group’s gain score is statistically significantly higher than the other group’s at p <.01 level ***The group’s gain score is statistically significantly higher than the other group’s at p <.001 level

38
COMPREHENSION AND WRITING SKILLS
Reading comprehension is a result of decoding skills, fluency in reading, and prior knowledge of vocabulary words. EGRA relies on two comprehension subtests to assess a student’s comprehension skills: oral reading comprehension and listening comprehension. The oral reading comprehension subtest includes six questions administered at the conclusion of the oral reading passage that relate directly to the text read. The answers to each comprehension question are scored “correct” or “incorrect”.
For the listening comprehension subtest, the test administrator reads a passage out loud to the student and then asks seven comprehension questions that directly relate to the text that the student just heard. While oral reading comprehension questions require a full range of skills (such as the ability to decode words, read fluently, and understand the meaning of words), the listening comprehension primary assesses the student’s vocabulary.
In addition to the comprehension subtests, EGRA uses a dictation exercise to test students’ writing skills. The dictation subtest was comprised of a sentence read to students by a test administrator and scored afterwards. Four words in the sentence were scored for spelling. The dictation composite included the following variables:
- Spelling of dictation words (correct spelling of a word = 2 points; partial correct spelling = 1 point; incorrect spelling = 0 points); up to 8 points total if the four scored words were spelled correctly
- Directions of the text (2 points) - Spacing between words (2 points) - Capitalization of the first word (2 points) - Full stop at the end of the sentence (2 points)
The total maximum composite score was 16. For the distribution of frequencies the total composite was converted into percentage points and grouped into quintiles.
COMPREHENSION AND WRITING SKILLS: GRADE 2
Despite relatively high performance rates on the fluency subtests, the average comprehension rate of second grade students was very low. Intervention group students answered on average only one reading comprehension question at the posttest, while the comparison group answer rate was half of that. Results for listening comprehension were similar. Students performed best on dictation, with nearly half the words written correctly on average by the intervention group students at the posttest, and 30 percent of words written correctly by the comparison group students.
Intervention group students also showed a much larger gain between the pretest and the posttest for all three subtests. Consistent with the results from the other subtests, disaggregated analysis showed that

39
girls outperformed boys in all three subtests, both in the comparison group and in the intervention group.
Table 26. Overall results for EGRA subtests, grade 2
ALL GRADE 2 STUDENTS
Pretest mean (St. Error)
Posttest mean (St. Error)
Gain score (St. Error)
Reading comprehension (% correct; 6 questions)
Intervention 9.5%ǂ (0.66) 18.2% (0.88) 8.7%*** (0.689)
Comparison 3.6% (0.437) 7.8% (0.555) 4.3% (0.479) Listening comprehension (% correct; 5 questions)
Intervention 9.5%ǂ (0.635) 18.9% (0.828) 9.4%*** (0.679)
Comparison 4% (0.353) 6.7% (0.465) 2.7% (0.469) Dictation (% correct; 16 points) Intervention 25.9%ǂ (0.809) 47% (1.005) 21.1%***
(0.809) Comparison 14.1% (0.641) 29.2% (0.891) 15.1% (0.639) ǂ The group’s pretest mean score is statistically higher compared with the other group’s score, at p<.01 level. *The group’s gain score is statistically significantly higher than the other group’s at p <.05 level **The group’s gain score is statistically significantly higher than the other group’s at p <.01 level ***The group’s gain score is statistically significantly higher than the other group’s at p <.001 level
Charts below illustrate frequency distributions of the comprehension subtests, presented as frequencies of actual number of comprehension questions answered correctly. Three-quarters of all intervention students and nearly 90 percent of all comparison students could not answer a single comprehension question after reading the text at the pretest. Although students in both groups did a little better at the posttest, only a handful of students were able to answer 5 or 6 comprehension questions.
The results for the listening comprehension were similar or worse than the result for the reading comprehension. No comparison group students were able to answer more than 3 comprehension questions after listening to a story that was read to them. Only a few students in the intervention group were able to answer more than 3 comprehension questions after listening to a story.

40
Figure 44. 2nd Grade Intervention Group - Reading Comprehension (6 Questions) Frequency Distribution
Figure 45. 2nd Grade Comparison Group - Reading Comprehension (6 Questions) Frequency Distribution
Figure 46. 2nd Grade Intervention Group - Listening Comprehension (7 Questions) Frequency Distribution
Figure 47. 2nd Grade Comparison Group - Listening Comprehension (7 Questions) Frequency Distribution
74.2%
10.0% 7.7% 2.9% 2.9% 2.3%
56.0%
14.0% 11.3% 10.0% 3.7%
2.3% 2.8% 0%
10%
20%
30%
40%
50%
60%
70%
80%
90%
100%
0 1 2 3 4 5 6
Pre-test Post-test
88.8%
6.5% 1.8% 1.3% 0.8% 0.8%
74.3%
12.0% 8.1%
3.7% 1.3% 0.5% 0%
10%
20%
30%
40%
50%
60%
70%
80%
90%
100%
0 1 2 3 4 5 6
Pre-test Post-test
71.9%
17.0%
5.7% 3.3% 1.1% 1.0%
49.0%
25.3%
15.9%
5.1% 1.4% 3.3% 2.2%
0%
10%
20%
30%
40%
50%
60%
70%
80%
90%
100%
0 1 2 3 4 5 6 7Pre-test Post-test
84.4%
11.2% 4.4%
76.0%
15.8%
7.1% 1.1%
0%
10%
20%
30%
40%
50%
60%
70%
80%
90%
100%
0 1 2 3 4 5 6 7
Pre-test Post-test

41
Charts below show distributions of the composite score for the dictation subtest, presented as quintiles. As the results of the analysis show, about half of the comparison students, and a third of intervention students scored zero at the pretest in the beginning of the second grade. By the end of the second grade, the distribution looked much more normal, with the majority of students scoring in the midrange. The intervention second graders gained significantly more on this subtest than the comparison second graders.
Figure 48. 2nd Grade Intervention Group -Dictation Frequency Distribution
Figure 49. 2nd Grade Comparison Group -Dictation Frequency Distribution
The following charts compare the writing skills of intervention and comparison group students from grade 2. As can be seen, students in both groups improved between the pretest and the posttest in their use of spaces when writing, direction of text, and capitalization.
Out of four scored characteristics of writing, the students did best in the direction of writing, with over half of all students writing with the correct direction at the pretest, and over two-thirds writing correctly at the posttest. The intervention group students did better both at the pretest and the posttest than their comparison group counterparts. Twice as many students used spaces correctly at the posttest compared to the pretest in both groups.
33.7%
22.1%
29.2%
13.1%
1.9%
13.2% 15.0%
30.6%
22.0% 19.3%
0%
5%
10%
15%
20%
25%
30%
35%
40%
45%
50%
zero 1 to 25% 26 to 50% 51 to 75% 76 to 100%
Pre-test Post-test
49.1%
29.2%
18.7%
1.6% 1.4%
25.4%
30.3%
22.3% 18.8%
3.2%
0%
5%
10%
15%
20%
25%
30%
35%
40%
45%
50%
zero 1 to 25% 26 to 50% 51 to 75% 76 to 100%
Pre-test Post-test

42
Figure 50. Grade 2 Dictation Subtest: Use of Spaces
Figure 51. Grade 2 Dictation Subtest: Direction of Test
The majority of students in both groups did not use capitalization or full stops during the pretest and the posttest. Only the intervention group second graders improved with the use of the full stop at the end of the sentence; the comparison group results were unchanged in this subtest.
Figure 52. Grade 2 Dictation Subtest: Capitalization
Figure 53. Grade 2 Dictation Subtest: Use of Full Stop
55.5% 27.6%
74.5% 49.6%
23.8%
30.3%
14.1% 27.8%
20.8%
42.1%
11.4%
22.6%
0%
10%
20%
30%
40%
50%
60%
70%
80%
90%
100%
interventionpretest
interventionposttest
comparisonpretest
comparisonposttest
incorrect partial correct correct
38.2% 16.4%
55.1% 32.0%
61.8%
83.6%
44.9%
68.0%
0%
10%
20%
30%
40%
50%
60%
70%
80%
90%
100%
interventionpretest
interventionposttest
comparisonpretest
comparisonposttest
incorrect correct
81.5%
65.4%
92.7%
76.3%
18.5%
34.6%
7.3%
23.7%
0%
10%
20%
30%
40%
50%
60%
70%
80%
90%
100%
interventionpretest
interventionposttest
comparisonpretest
comparisonposttest
incorrect correct
96.9%
79.7%
96.4%
96.5%
3.1%
20.3%
3.6%
3.5%
0%
10%
20%
30%
40%
50%
60%
70%
80%
90%
100%
interventionpretest
interventionposttest
comparisonpretest
comparisonposttest
incorrect correct

43
Gender comparisons of the comprehension subtest results showed that girls answered more questions correctly than boys, although the proportion of questions answered correctly was low for both groups. Both boys and girls in the intervention group gained more than boys and girls in the comparison group between the pretest and the posttest.
Table 27.Results for EGRA subtests, grade 2, by gender
GRADE 2 GIRLS BOYS
Pretest mean
(St. Error)
Posttest mean
(St. Error)
Gain score (St. Error)
Pretest mean
(St. Error)
Posttest mean
(St. Error)
Gain score (St.
Error) Reading comprehension (% correct; 6 questions) Intervention 13.9%ǂ
(1.111) 23.3%
(1.376) 9.4%***
(1.129) 5.2%ǂ
(0.665) 13.3%
(1.054) 8.1%***
(0.8) Comparison 5.6%
(0.779) 9.9%
(0.84) 4.3%
(0.711) 1.3%
(0.303) 5.6%
(0.698) 4.2%
(0.636) Listening comprehension (% correct; 5 questions) Intervention 11.4%ǂ
(1.005) 20.7%
(1.217) 9.3%***
(1.03) 7.7%ǂ
(0.773) 17.2%
(1.121) 9.5%***
(0.891) Comparison 4.8%
(0.548) 7.8%
(0.674) 2.9%
(0.673) 3.1%
(0.428) 5.5%
(0.633) 2.4%
(0.652) Dictation (% correct; 16 points) Intervention 29.2%ǂ
(1.196) 54.6%
(1.434) 25.4%***
(1.253) 22.7%ǂ (1.072)
39.7% (1.321)
17%** (0.991)
Comparison 17.3% (0.982)
34.2% (1.251)
16.9% (0.853)
10.7% (0.772)
23.8% (1.211)
13.1% (0.949)
ǂ The group’s pretest mean score is statistically higher compared with the other group’s score, at p<.01 level. *The group’s gain score is statistically significantly higher than the other group’s at p <.05 level **The group’s gain score is statistically significantly higher than the other group’s at p <.01 level ***The group’s gain score is statistically significantly higher than the other group’s at p <.001 level
To better understand student performance in these subtests, frequency distributions were grouped in quintiles and presented in Annex F.
When disaggregated by region, the data analysis shows similarly low comprehension scores across all three regions. Although students in all three regions demonstrated some gains in reading and listening comprehension, their gains in dictation composite score was the largest, particularly in the ARMM.
Table 28. Overall results for EGRA subscales in ARMM, grade 2
ARMM GRADE 2 STUDENTS
Pretest mean (St. Error)
Posttest mean (St. Error)
Gain score (St. Error)
Reading comprehension (% correct; 6 questions) Intervention 7.7% (1.486) 12.2% (1.408) 4.5% (1.515)
Comparison 9.7% (1.597) 14% (1.562) 4.3% (1.148) Listening comprehension (% correct; 5 questions) Intervention 9.1%ǂ (1.206) 27.6% (1.693) 18.5%***
(2.126) Comparison 3.5% (0.731) 7.3% (0.964) 3.8% (0.676)

44
Dictation (% correct; 16 points) Intervention 29.1% (1.791) 72.2% (2.043) 43.1%*** (2.261)
Comparison 27.4% (1.784) 41.7% (2.018) 14.3% (1.279)
REGION 9 GRADE 2 STUDENTS
Pretest mean (St. Error)
Posttest mean (St. Error)
Gain score (St. Error)
Reading comprehension (% correct; 6 questions) Intervention 12.6%ǂ (1.269) 25.6% (1.823) 13%*** (1.494)
Comparison 3% (0.685) 6.2% (0.916) 3.2% (0.872) Listening comprehension (% correct; 5 questions) Intervention 14.1%ǂ (1.383) 20.4% (1.596) 6.3%*** (1.04)
Comparison 7% (0.87) 4.8% (0.715) -2.2% (1.091) Dictation (% correct; 16 points) Intervention 25.7%ǂ (1.533) 39.9% (1.733) 14.2% (1.146) Comparison 9.5% (0.97) 27.1% (1.575) 17.6% (1.32)
REGION 12 GRADE 2 STUDENTS
Pretest mean (St. Error)
Posttest mean (St. Error)
Gain score (St. Error)
Reading comprehension (% correct; 6 questions)
Intervention 8.3%ǂ (0.887) 15.8% (1.168) 7.5%* (0.822)
Comparison 1.4% (0.333) 6.2% (0.685) 4.8% (0.655) Listening comprehension (% correct; 5 questions)
Intervention 6.9%ǂ (0.782) 15.2% (1.115) 8.3%** (0.875)
Comparison 2.6% (0.39) 7.4% (0.714) 4.8% (0.617) Dictation (% correct; 16 points) Intervention 25%ǂ (1.113) 43% (1.294) 18%* (0.989) Comparison 11.1% (0.728) 25.2% (1.19) 14.1% (0.875) ǂ The group’s pretest mean score is statistically higher compared with the other group’s score, at p<.01 level. *The group’s gain score is statistically significantly higher than the other group’s at p <.05 level **The group’s gain score is statistically significantly higher than the other group’s at p <.01 level ***The group’s gain score is statistically significantly higher than the other group’s at p <.001 level
COMPREHENSION AND WRITING SKILLS: GRADE 3
Like their second grade counterparts, third graders demonstrated low reading comprehension despite exhibiting high fluency rates. Both intervention and comparison group students answered on average between one and two reading comprehension question at the posttest. Comparison group students doubled their reading comprehension scores between the pretest and the posttest, which was significantly higher than about 50% improvement recorded for the intervention group students. The rate of answering listening comprehension questions correctly was even lower, and the rate of change between the pretest and the posttest was about the same for both groups.
The dictation results were the best, with an average of almost half of words written correctly by the intervention group students at the posttest, and 30 percent of words written correctly by the comparison group students.

45
Intervention group students showed a much larger gain between the pretest and the posttest for all three subtests. Consistent with the results from the other subtests, disaggregated analysis showed that girls outperformed boys in all three subtests, both in the comparison group and in the intervention group.
Table 29. Results for EGRA comprehension and writing subtests, grade 3
GRADE 3 STUDENTS
Pretest mean (St. Error)
Posttest mean (St. Error)
Gain score (St. Error)
Reading comprehension (% correct; 6 questions)
Intervention 17.9% (0.776) 25.2% (0.858) 7.3% (0.654)
Comparison 12.3% (0.851) 24.5% (1.086) 12.1%*** (0.808)
Listening comprehension (% correct; 5 questions)
Intervention 12.4% (0.576) 19% (0.77) 6.7% (0.609)
Comparison 9.3% (0.625) 15.9% (0.862) 6.5% (0.626) Dictation (% correct; 16 points) Intervention 38.3% (0.836) 57.5% (0.801) 19.2% (0.607) Comparison 30.1% (1.004) 47.7% (1.103) 17.6% (0.731) ǂ The group’s pretest mean score is statistically higher compared with the other group’s score, at p<.01 level. *The group’s gain score is statistically significantly higher than the other group’s at p <.05 level **The group’s gain score is statistically significantly higher than the other group’s at p <.01 level ***The group’s gain score is statistically significantly higher than the other group’s at p <.001 level
Charts below illustrate frequency distributions of the comprehension and writing subtests, presented as quintiles. The distributions show that at the beginning of the third grade the majority of students could not answer a single comprehension question about the short passage they just read. At the posttest at the end of the third grade almost half of students in both groups still could not answer a single comprehension question. About one in four students in both WSRP and non-WSPR schools could answer three or more comprehension questions at the posttest.

46
Figure 54. 3rd Grade Intervention Group - Reading Comprehension (6 Questions) Frequency Distribution
Figure 55. 3rd Grade Comparison Group - Reading Comprehension (6 Questions) Frequency Distribution
The results were listening comprehension were lower than for the reading comprehension. Over 50 percent of third graders in both groups could not answer even one comprehension question at the posttest. Only a handful of students answered between 3 and 5 listening comprehension questions, and no students answered 6 or 7 questions.
Figure 56. 3rd Grade Intervention Group - Listening Comprehension (6 Questions) Frequency Distribution
Figure 57. 3rd Grade Comparison Group - Listening Comprehension (6 Questions) Frequency Distribution
55.8%
16.4%
9.8% 7.4%
5.1% 4.5% 1.0%
42.2%
18.8%
11.6% 9.7% 9.8% 7.2%
0.9% 0%
10%
20%
30%
40%
50%
60%
70%
0 1 2 3 4 5 6Pre-test Post-test
69.8%
11.3% 6.2% 4.0% 4.8% 3.8%
46.2%
15.0% 11.8% 11.0%
6.5% 7.2% 2.2%
0%
10%
20%
30%
40%
50%
60%
70%
0 1 2 3 4 5 6Pre-test Post-test
61.1%
24.7%
7.3% 5.0% 1.9%
51.6%
22.3%
13.6% 7.9%
1.1% 3.5% 0%
10%
20%
30%
40%
50%
60%
70%
80%
0 1 2 3 4 5 6 7
Pre-test Post-test
70.5%
17.6%
7.3% 4.0%
0.6%
57.4%
21.1%
11.7% 6.1%
1.8% 1.9% 0%
10%
20%
30%
40%
50%
60%
70%
80%
0 1 2 3 4 5 6 7
Pre-test Post-test

47
Finally, the results for the dictation subtest showed significant improvements between the pretest and the posttest, although the WSRP third graders gained more. Over 55 percent of WSRP students scored over 50 percent at the posttest, compared with 43.3 percent of non-WSRP students.
Figure 58. 3rd Grade Intervention Group – Dictation Frequency Distribution
Figure 59. 3rd Grade Comparison Group – Dictation Frequency Distribution
The following charts compare the writing skills of intervention and comparison group students from grade 3. Although both intervention and comparison group students improved between the pretest and the posttest, the majority of students in both groups did not use capitalization and full stops correctly. Just over 20 percent of the intervention group students and 16 percent of the comparison group students used capitalization correctly at the posttest.
Similarly to the second graders, the third graders did better with the use of spaces and the direction of writing: over 90 percent of intervention group students, and 80 percent of the comparison group students, wrote with the correct direction at the posttest, and also used spaces when writing.
17.2%
22.8% 24.4%
28.8%
6.8%
2.8%
13.1%
28.6%
32.7%
22.9%
0%
5%
10%
15%
20%
25%
30%
35%
zero 1 to 25% 26 to50%
51 to75%
76 to100%
Pre-test Post-test
25.6% 25.7% 25.8%
17.9%
5.1%
11.9%
17.3%
27.5% 25.4%
17.9%
0%
5%
10%
15%
20%
25%
30%
35%
zero 1 to 25% 26 to50%
51 to75%
76 to100%
Pre-test Post-test

48
Figure 60. Grade 3 Dictation Subtest: Use of Spaces
Figure 61. Grade 3 Dictation Subtest: Direction of Test
Figure 62. Grade 3 Dictation Subtest: Capitalization
Figure 63. Grade 3 Dictation Subtest: Use of Full Stop
34.6%
14.6%
46.2% 21.6%
26.1%
24.7%
25.0%
31.0%
39.2% 60.7%
28.8%
47.4%
0%
10%
20%
30%
40%
50%
60%
70%
80%
90%
100%
interventionpretest
interventionposttest
comparisonpretest
comparisonposttest
incorrect partial correct correct
27.0% 7.3%
39.1%
20.3%
73.0%
92.7%
60.9%
79.7%
0%
10%
20%
30%
40%
50%
60%
70%
80%
90%
100%
interventionpretest
interventionposttest
comparisonpretest
comparisonposttest
incorrect correct
75.2%
62.3%
88.1%
73.1%
24.8%
37.7%
11.9%
26.9%
0%
10%
20%
30%
40%
50%
60%
70%
80%
90%
100%
interventionpretest
interventionposttest
comparisonpretest
comparisonposttest
incorrect correct
94.1%
78.6%
92.9%
84.5%
5.9%
21.4%
7.1%
15.5%
0%
10%
20%
30%
40%
50%
60%
70%
80%
90%
100%
interventionpretest
interventionposttest
comparisonpretest
comparisonposttest
incorrect correct

49
Gender comparisons showed that as with other subtests, third grade girls performed much better than boys, and they also showed larger gains between the pretest and the posttest. Comparison group girls gained more than intervention group girls on the reading comprehension subtest (p<.001), while intervention group boys gained more than their comparison group counterparts on the dictation subtest (p<.001).
Table 30. Results for EGRA comprehension and writing subtests, grade 3, by gender.
GRADE 3 GIRLS BOYS
Pretest mean
(St. Error)
Posttest mean
(St. Error)
Gain score (St.
Error)
Pretest mean
(St. Error)
Posttest mean
(St. Error)
Gain score
(St. Error)
Reading comprehension (% correct; 6 questions)
Intervention 23.7% (1.252)
31.7% (1.242)
8.1% (1.059)
12.9% (0.916)
19.6% (1.138)
6.7% (0.807)
Comparison 14.1% (1.235)
30.7% (1.604)
16.6%*** (1.176)
10.3% (1.152)
17.5% (1.348)
7.2% (1.033)
Listening comprehension (% correct; 5 questions)
Intervention 14.8% (0.959)
23.2% (1.278)
8.4% (1.054)
10.3% (0.675)
15.5% (0.897)
5.2% (0.678)
Comparison 9.4% (0.898)
17.7% (1.24)
8.2% (0.944)
9.2% (0.864)
13.9% (1.181)
4.6% (0.793)
Dictation (% correct; 16 points)
Intervention 47.1% (1.167)
64.7% (1.201)
17.5% (0.823)
30.8% (1.097)
51.4% (1.01)
20.6%*** (0.876)
Comparison 31.7% (1.39)
51.8% (1.468)
20.1% (1.092)
28.2% (1.449)
43.1% (1.628)
14.8% (0.933)
ǂ The group’s pretest mean score is statistically higher compared with the other group’s score, at p<.01 level. *The group’s gain score is statistically significantly higher than the other group’s at p <.05 level **The group’s gain score is statistically significantly higher than the other group’s at p <.01 level ***The group’s gain score is statistically significantly higher than the other group’s at p <.001 level
To better understand student performance in these subtests, frequency distributions were grouped in quintiles and presented in Annex F.
Disaggregation by region showed that at the pretest the intervention group in the ARMM scored significantly higher than the comparison group in the same region. These third graders also showed the highest overall performance at the pretest and the posttest, and they gained more on two out of three subtests than their peers from other regions.
Table 31. Overall results for EGRA subscales in ARMM, grade 3
ARMM GRADE 3 STUDENTS
Pretest mean (St. Error)
Posttest mean (St. Error)
Gain score (St. Error)
Reading comprehension (% correct; 6 questions)
Intervention 31.6%ǂ (2.271) 29.2% (2.018) -2.4% (1.423)
Comparison 1.9% (0.744) 9.2% (1.594) 7.4%*** (1.476)

50
Listening comprehension (% correct; 5 questions)
Intervention 27.7%ǂ (1.709) 38.7% (2.411) 11%*** (1.598)
Comparison 1% (0.361) 1.9% (0.482) 0.9% (0.536) Dictation (% correct; 16 points) Intervention 50.2%ǂ (2.06) 73.8% (1.881) 23.6%***
(1.353) Comparison 24.1% (1.797) 37% (1.98) 12.8% (1.583)
REGION 9 GRADE 3 STUDENTS
Pretest mean (St. Error)
Posttest mean (St. Error)
Gain score (St. Error)
Reading comprehension (% correct; 6 questions)
Intervention 21.6% (1.387) 32.7% (1.636) 11.1% (1.258)
Comparison 23.3% (2.216) 38.1% (2.101) 14.8% (1.864) Listening comprehension (% correct; 5 questions)
Intervention 12% (0.89) 14% (1.134) 2% (1.244)
Comparison 15.9% (1.472) 21.5% (1.596) 5.7% (1.466) Dictation (% correct; 16 points) Intervention 42.5% (1.343) 60.2% (1.212) 17.7% (1.073) Comparison 38.9% (1.931) 58.6% (1.749) 19.7% (1.491)
ALL GRADE 3 STUDENTS
Pretest mean (St. Error)
Posttest mean (St. Error)
Gain score (St. Error)
Reading comprehension (% correct; 6 questions)
Intervention 10.1% (0.802) 18.7% (1.077) 8.7% (0.845)
Comparison 11% (1.016) 23.6% (1.495) 12.7%** (1.055) Listening comprehension (% correct; 5 questions)
Intervention 6.6% (0.61) 14.6% (0.836) 8% (0.678)
Comparison 9.3%ǂ (0.841) 18.4% (1.301) 9% (0.876) Dictation (% correct; 16 points) Intervention 30.9% (1.132) 49.4% (1.093) 18.5% (0.869) Comparison 28% (1.422) 46.4% (1.633) 18.4% (0.976) ǂ The group’s pretest mean score is statistically higher compared with the other group’s score, at p<.01 level. *The group’s gain score is statistically significantly higher than the other group’s at p <.05 level **The group’s gain score is statistically significantly higher than the other group’s at p <.01 level ***The group’s gain score is statistically significantly higher than the other group’s at p <.001 level

51
EGRA RELIABILITY ANALYSIS
The following subtests were included in the EGRA reliability analysis:
• Pre-literacy skills o Letter naming (percent correct) o Letter sounds (percent correct) o Initial sound identification (percent correct)
• Fluency skills o Familiar word reading (correct words per minute) o Invented word reading (correct words per minute) o Oral reading passage(correct words per minute)
• Comprehension skills o Oral reading comprehension o Listening comprehension
Reliability analysis results showed strong internal reliability, with Chronbach’s alpha ranging from .859 to .963. The table below reports the results of the analysis.
Table 32.Reliability analysis for the pre-literacy skills subtests
Item Correlation Chronbach’s Alpha if item deleted Letter naming .751 .809 Letter sounds .803 .811 Initial sound identification .761 .820 Chronbach’s alpha
.867
Table 33. Reliability analysis for the fluency skills subtests
Item Correlation Chronbach’s Alpha if item deleted Familiar word reading .979 .909 Invented word decoding .948 .965 Oral passage reading .976 .962 Chronbach’s alpha
.963
Table 34. Reliability analysis for the comprehension skills subtests
Item Correlation Reading comprehension .770 Listening comprehension .770 Chronbach’s alpha
.859
Principal component analysis extracted only one factor with eigenvalues more than 1 and explaining 73.7% of variance.

52
TEACHER OBSERVATION FINDINGS
The SCOPE Literacy is based on the original Standards-Based Classroom Observation Protocol for Educators13 that includes sixteen dimensions, or areas of instructional practices. For this study, it was modified to focus on five dimensions that DepEd administrators and project staff were most interested in observing in WSRP classrooms:
1. Provides students with structured opportunities to develop their encoding (spelling/writing) and decoding skills
2. Provides students with structured opportunities to increase their vocabulary in order to improve their reading comprehension and writing skills
3. Uses diverse instructional strategies to develop students' reading fluency 4. Uses diverse instructional strategies to develop students' comprehension skills 5. Implements instruction that recognizes the importance of independent, original writing in the
development of reading skills
Teacher training under the Whole School Reading Program aimed to address these five dimensions of teacher classroom practice. Observations of intervention and comparison group teachers conducted by trained observers before the training and at the end of the project attempted to capture whether or not the training resulted in an observable change at the classroom practice level.
SUMMARY OF THE OBSERVATION RESULTS
The data analysis of the observation data focused on comparing the change in SCOPE Literacy scores between the pretest and the posttest, and between the intervention teachers and the comparison group teachers. If the training was effective in promoting a positive change in the teacher instructional practice, then the analysis will reveal higher gains for the intervention group teachers than for the comparison group teachers.
The chart below shows the results of the descriptive data analysis. Intervention group teachers scored higher on four out of five SCOPE Literacy dimensions at the pretest, and higher on all five SCOPE Literacy dimensions at the posttest. As the chart demonstrates, both intervention and comparison group teachers scored highest on the first dimension of SCOPE Literacy (“Provides students with structured opportunities to develop their encoding (spelling/writing) and decoding skills”), followed by the second, third and fourth dimensions. Both groups of teachers scored the lowest on the fifth dimension of SCOPE Literacy (“Implements instruction that recognizes the importance of independent, original writing in the development of reading skills”), although intervention group teachers demonstrated the highest gains in this dimension between the pretest and the posttest.
13 SCOPE was developed by EDC and successfully used in many EDC projects around the world.

53
Figure 64. Mean gains in SCOPE Literacy scores between pretest and posttest, by dimension
The comparison of means (independent group t-test) showed a larger than average gain in all five SCOPE Literacy dimensions among teachers in the intervention group (p<.01). The analysis by dimension showed larger improvement among intervention group teachers in three out of five SCOPE dimensions:
• Use diverse instructional strategies to develop students' reading fluency (t = 2.10; p<.05) • Use diverse instructional strategies to develop students' comprehension skills (t = 2.71; p<.01) • Implement instruction that recognizes the importance of independent, original writing in the
development of reading skills (t = 4.70; p<.001)
Results of linear regression analysis showed that the project was effective in improving overall SCOPE score of teachers in both grades. For the second grade teachers, participation in the WSRP program was associated with an increase in the overall SCOPE score by 2.12 points (significant at p<.05 level). For the third grade teachers, participation in the WSRP program was associated with an increase in the overall
2.39
1.95 2.13
1.74
2.20
1.85 2.07
1.64
1.24 1.23
0.50
0.10 0.24
0.03
0.57
0.18
0.76
0.28 0.85
0.10
0
0.5
1
1.5
2
2.5
3
3.5
pretest results gain score at the posttest
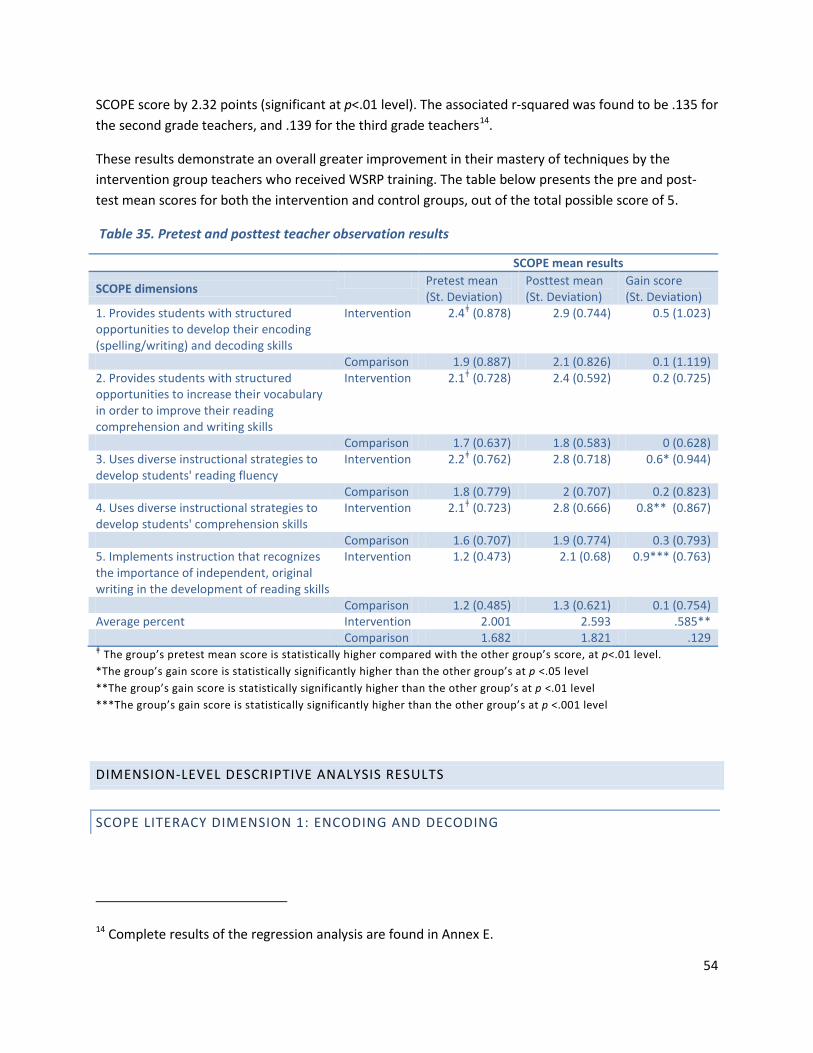
54
SCOPE score by 2.32 points (significant at p<.01 level). The associated r-squared was found to be .135 for the second grade teachers, and .139 for the third grade teachers14.
These results demonstrate an overall greater improvement in their mastery of techniques by the intervention group teachers who received WSRP training. The table below presents the pre and post-test mean scores for both the intervention and control groups, out of the total possible score of 5.
Table 35. Pretest and posttest teacher observation results
SCOPE mean results
SCOPE dimensions Pretest mean (St. Deviation)
Posttest mean (St. Deviation)
Gain score (St. Deviation)
1. Provides students with structured opportunities to develop their encoding (spelling/writing) and decoding skills
Intervention 2.4ǂ (0.878) 2.9 (0.744) 0.5 (1.023)
Comparison 1.9 (0.887) 2.1 (0.826) 0.1 (1.119) 2. Provides students with structured opportunities to increase their vocabulary in order to improve their reading comprehension and writing skills
Intervention 2.1ǂ (0.728) 2.4 (0.592) 0.2 (0.725)
Comparison 1.7 (0.637) 1.8 (0.583) 0 (0.628) 3. Uses diverse instructional strategies to develop students' reading fluency
Intervention 2.2ǂ (0.762) 2.8 (0.718) 0.6* (0.944)
Comparison 1.8 (0.779) 2 (0.707) 0.2 (0.823) 4. Uses diverse instructional strategies to develop students' comprehension skills
Intervention 2.1ǂ (0.723) 2.8 (0.666) 0.8** (0.867)
Comparison 1.6 (0.707) 1.9 (0.774) 0.3 (0.793) 5. Implements instruction that recognizes the importance of independent, original writing in the development of reading skills
Intervention 1.2 (0.473) 2.1 (0.68) 0.9*** (0.763)
Comparison 1.2 (0.485) 1.3 (0.621) 0.1 (0.754) Average percent Intervention 2.001 2.593 .585** Comparison 1.682 1.821 .129 ǂ The group’s pretest mean score is statistically higher compared with the other group’s score, at p<.01 level. *The group’s gain score is statistically significantly higher than the other group’s at p <.05 level **The group’s gain score is statistically significantly higher than the other group’s at p <.01 level ***The group’s gain score is statistically significantly higher than the other group’s at p <.001 level
DIMENSION-LEVEL DESCRIPTIVE ANALYSIS RESULTS
SCOPE LITERACY DIMENSION 1: ENCODING AND DECODING
14 Complete results of the regression analysis are found in Annex E.
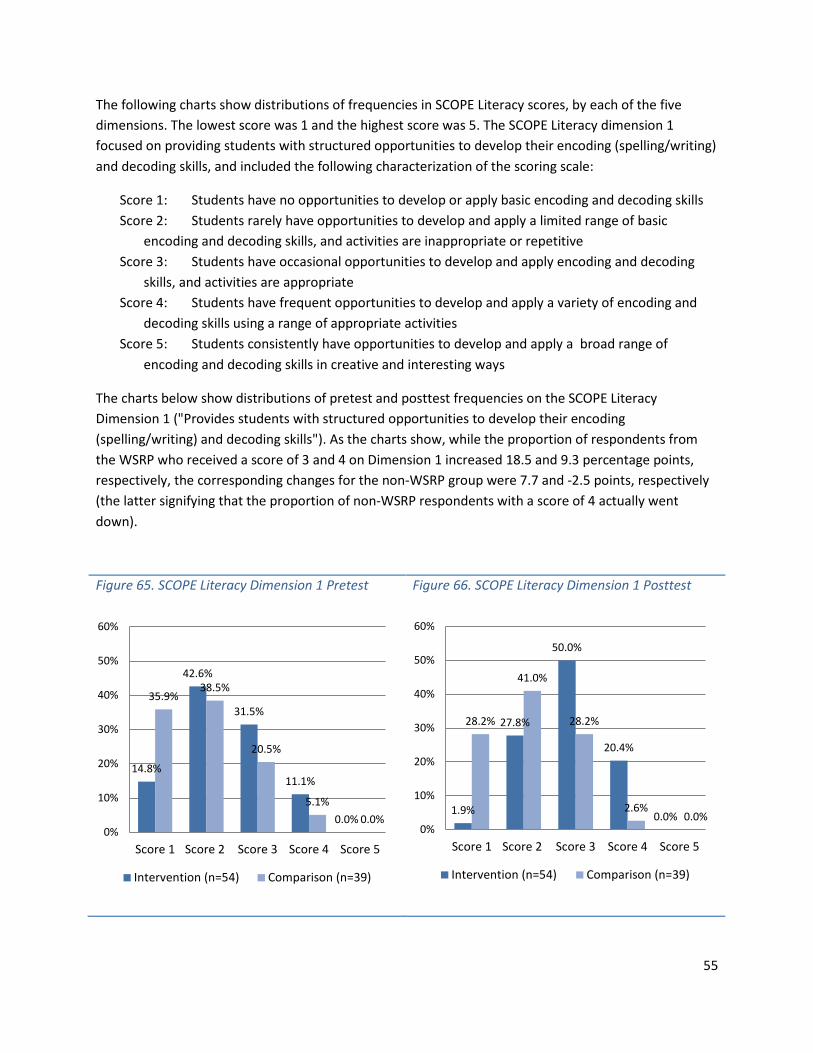
55
The following charts show distributions of frequencies in SCOPE Literacy scores, by each of the five dimensions. The lowest score was 1 and the highest score was 5. The SCOPE Literacy dimension 1 focused on providing students with structured opportunities to develop their encoding (spelling/writing) and decoding skills, and included the following characterization of the scoring scale:
Score 1: Students have no opportunities to develop or apply basic encoding and decoding skills Score 2: Students rarely have opportunities to develop and apply a limited range of basic
encoding and decoding skills, and activities are inappropriate or repetitive Score 3: Students have occasional opportunities to develop and apply encoding and decoding
skills, and activities are appropriate Score 4: Students have frequent opportunities to develop and apply a variety of encoding and
decoding skills using a range of appropriate activities Score 5: Students consistently have opportunities to develop and apply a broad range of
encoding and decoding skills in creative and interesting ways
The charts below show distributions of pretest and posttest frequencies on the SCOPE Literacy Dimension 1 ("Provides students with structured opportunities to develop their encoding (spelling/writing) and decoding skills"). As the charts show, while the proportion of respondents from the WSRP who received a score of 3 and 4 on Dimension 1 increased 18.5 and 9.3 percentage points, respectively, the corresponding changes for the non-WSRP group were 7.7 and -2.5 points, respectively (the latter signifying that the proportion of non-WSRP respondents with a score of 4 actually went down).
Figure 65. SCOPE Literacy Dimension 1 Pretest
Figure 66. SCOPE Literacy Dimension 1 Posttest
1.9%
27.8%
50.0%
20.4%
0.0%
28.2%
41.0%
28.2%
2.6% 0.0%
0%
10%
20%
30%
40%
50%
60%
Score 1 Score 2 Score 3 Score 4 Score 5
Intervention (n=54) Comparison (n=39)
14.8%
42.6%
31.5%
11.1%
0.0%
35.9% 38.5%
20.5%
5.1% 0.0%
0%
10%
20%
30%
40%
50%
60%
Score 1 Score 2 Score 3 Score 4 Score 5
Intervention (n=54) Comparison (n=39)

56
SCOPE LITERACY DIMENSION 2: VOCABULARY
The SCOPE Literacy dimension 2 focused on providing students with structured opportunities to increase their vocabulary in order to improve their reading comprehension and writing skills, and included the following characterization of the scoring scale:
Score 1: Students are not provided with opportunities to develop their vocabulary Score 2: Students are provided with limited structured opportunities to develop their vocabulary
through direct instruction that focuses on verbal definitions Score 3: Students are provided with occasional opportunities to develop their vocabulary
through direct and indirect instruction Score 4: Students are provided with frequent opportunities to develop their vocabulary through
direct and indirect instruction Score 5: Students are provided with consistent opportunities to develop their vocabulary
through an effective blend of direct and indirect instruction
The charts below show distributions of pretest and posttest frequencies on the SCOPE Literacy Dimension 2 ("Provides students with structured opportunities to increase their vocabulary in order to improve their reading comprehension and writing skills"). The comparison of pretest-posttest results showed that the proportion of WSRP respondents with a score of 1 went down nearly 17 percentage points (from 18.5 percent to 1.9 percent), with corresponding movement into the upper score categories, particularly for Score 2, which increased 11 percentage points. For non-WSRP respondents, the corresponding change in Scores 1 and 2 was a decrease of only 5 percentage points and an increase of only 7 percentage points.
Figure 67. SCOPE Literacy Dimension 2 Pretest
Figure 68. SCOPE Literacy Dimension 2 Posttest
18.5%
51.9%
27.8%
1.9% 0.0%
35.9%
53.8%
10.3%
0.0% 0.0% 0%
10%
20%
30%
40%
50%
60%
70%
Score 1 Score 2 Score 3 Score 4 Score 5
Intervention (n=54) Comparison (n=39)
1.9%
63.0%
31.5%
3.7% 0.0%
30.8%
61.5%
7.7%
0.0% 0.0% 0%
10%
20%
30%
40%
50%
60%
70%
Score 1 Score 2 Score 3 Score 4 Score 5
Intervention (n=54) Comparison (n=39)

57
SCOPE LITERACY DIMENSION 3: READING FLUENCY
The SCOPE Literacy dimension 3 focused on using diverse instructional strategies to develop students' reading fluency, and included the following characterization of the scoring scale:
Score 1: The teacher stresses recitation and memorization. Strategies to develop fluency are not manifested
Score 2: The teacher ensures students can automatically recognize words before having them read for fluency. Strategies are limited to modeling or repetition
Score 3: The teacher ensures that student can automatically recognize words in text and understand them before having them read for fluency. Some attempts are made to model expressive reading
Score 4: Students are provided with frequent modeling and frequent opportunities to develop their fluency. Expressive reading is consistently modeled and required
Score 5: Students are consistently and effectively provided with opportunities to develop fluency and expression, and the teacher employs several strategies for doing so. The teacher monitors progress and provides constructive feedback to improve fluency.
The charts below show distributions of pretest and posttest frequencies on the SCOPE Literacy Dimension 3 ("Uses diverse instructional strategies to develop students' reading fluency"). WSRP teachers showed significant improvement with respect to Dimension 3: while the majority (63 percent ) scored 1 and 2 for the pre-test, more than half (65 percent) were rated 3 or 4 on the post-test. Compare this with their non-WSRP counterparts, the majority of whom remained classified as a 1 or a 2 for both the pre-test (77 percent) and the post-test (74 percent).
Figure 69. SCOPE Literacy Dimension 3 Pretest Figure 70. SCOPE Literacy Dimension 3 Posttest
18.5%
44.4%
35.2%
1.9% 0.0%
38.5% 38.5%
23.1%
0.0% 0.0% 0%
10%
20%
30%
40%
50%
60%
Score 1 Score 2 Score 3 Score 4 Score 5
Intervention (n=54) Comparison (n=39)
1.9%
33.3%
50.0%
14.8%
0.0%
23.1%
51.3%
25.6%
0.0% 0.0% 0%
10%
20%
30%
40%
50%
60%
Score 1 Score 2 Score 3 Score 4 Score 5
Intervention (n=54) Comparison (n=39)

58
SCOPE LITERACY DIMENSION 4: COMPREHENSION SKILLS
The SCOPE Literacy dimension 4 focused on using diverse instructional strategies to develop students' comprehension skills, and included the following characterization of the scoring scale:
Score 1: The teacher focuses exclusively on repetition or recitation rather than understanding Score 2: The teacher rarely focuses on comprehension Score 3: The teacher occasionally focuses on comprehension Score 4: The teacher frequently focuses on comprehension Score 5: The teacher consistently focuses on comprehension
The charts below show distributions of pretest and posttest frequencies on the SCOPE Literacy Dimension 4 ("Uses diverse instructional strategies to develop students' comprehension skills"). For this dimension, intervention teachers moved from 74 percent in the 1-2 category to 69 percent in the 3-4 category by the time of the post-test, while their non-WSRP remained relatively stagnant, at 87.2 and 74.3 percent in the 1-2 category for both the pre- and post-test, respectively.
Figure 71. SCOPE Literacy Dimension 4 Pretest
Figure 72. SCOPE Literacy Dimension 4 Posttest
SCOPE LITERACY DIMENSION 5: WRITING SKILLS
The SCOPE dimension 5 focused on implementing instruction that recognizes the importance of independent, original writing in the development of reading skills, and included the following characterization of the scoring scale:
0.0%
31.5%
53.7%
14.8%
0.0%
33.3%
41.0%
25.6%
0.0% 0.0% 0%
10%
20%
30%
40%
50%
60%
Score 1 Score 2 Score 3 Score 4 Score 5
Intervention (n=54) Comparison (n=39)
20.4%
53.7%
24.1%
1.9% 0.0%
48.7%
38.5%
12.8%
0.0% 0.0% 0%
10%
20%
30%
40%
50%
60%
Score 1 Score 2 Score 3 Score 4 Score 5
Intervention (n=54) Comparison (n=39)

59
Score 1: The teacher limits writing opportunities to copying or completing exercises and never tolerates errors.
Score 2: The teacher limits writing activities to minimal, basic, and repetitive exercises, and rarely tolerates errors.
Score 3: The teacher occasionally provides opportunities to produce original text and occasionally tolerates errors.
Score 4: The teacher provides frequent opportunities to produce original text and frequently tolerates errors.
Score 5: The teacher consistently provides opportunities to produce original text and consistently helps students learn from their errors and take risks with their speaking and writing.
The charts below show distributions of pretest and posttest frequencies on the SCOPE Literacy Dimension 5 ("Implements instruction that recognizes the importance of independent, original writing in the development of reading skills"). For this dimension, we see similar growth on the part of WSRP teachers: while the proportion of those receiving a 1 dropped from 77.8 percent to 18.5 percent, the share receiving a 3 grew from 1.9 to 27.8 percent (see figure below). By contrast, non-WSRP teachers remained relatively stagnant, with the proportion of those receiving a 1 decreasing only slightly from 79.5 to 74.4 percent and the share of those receiving a 3 rising from only 3 to 8 percent.
Figure 73. SCOPE Literacy Dimension 5 Pretest
Figure 74. SCOPE Literacy Dimension 5 Posttest
77.8%
20.4%
1.9% 0.0% 0.0%
79.5%
17.9%
2.6% 0.0% 0.0% 0%
10%
20%
30%
40%
50%
60%
70%
80%
90%
Score 1 Score 2 Score 3 Score 4 Score 5
Intervention (n=54) Comparison (n=39)
18.5%
53.7%
27.8%
0.0% 0.0%
74.4%
17.9%
7.7% 0.0%
0.0% 0%
10%
20%
30%
40%
50%
60%
70%
80%
90%
Score 1 Score 2 Score 3 Score 4 Score 5
Intervention (n=54) Comparison (n=39)

60
TEACHER BELIEF SURVEY FINDINGS
Teacher beliefs are known to impact their instructional practice. To better understand what intervention and comparison group teachers think about their students’ abilities, the appropriateness of different instructional methods for teaching literacy to students, as well as their own classroom practice, WSRP conducted a Beliefs and Instructional Practices Inventory (BIPI) survey at both the beginning and end of the project. The survey consisted of the following sections:
Section A. Teacher’s demographic information Section B. Questions about frequency of use of literacy-related instructional practices in the
classroom Section C. Series of statements about teaching literacy Section D. Series of statements about students’ abilities in relation to literacy
Overall, statistical analyses of changes in BIPI survey responses between the pretest and the posttest showed larger overall positive change in three BIPI sections for the intervention group compared to non-WSRP teachers. For Section B, a comparison of means test showed a statistically significant difference in composite scores between the pretest and posttest. The change was significantly larger for the intervention group. For section C, comparison of means test showed a significant positive change in composite scores between the pretest and the posttest. However, the difference in change in the intervention group and in the comparison group was not statistically significant. Section D was only analyzed descriptively at the dimension level, so no comparison of means test was conducted.
The next three sections of the report present the detailed results of the statistical analysis of the survey data for sections B, C and D. The results of the demographic section of the survey can be found in the Study Participants section of this report.
SECTION B: SELF-REPORTED FREQUENCY OF INSTRUCTIONAL PRACTICES
To determine whether WSRP training resulted in a change in self-reported frequency of utilization of instructional practices emphasized in the WSRP teacher training, a composite score for select practices was created15. The gain score was computed from the pretest and posttest data (gain score = posttest composite – pretest composite) and then converted into a percent of correct answers from the total number of items included in the composite. The comparison of means analysis was conducted to determine if there is a difference in changes in the composite gain score between intervention and comparison group teachers.
15 Sixteen items from Section B (#12, 14, 18, 19, 20, 21, 22, 23, 24, 25, 28, 30, 31, 33, 34, 35) were selected for the composite, with correct responses coded and summed up to make a composite.

61
The data analysis showed that the change in teacher self-reported practices in both intervention and comparison group between the pretest and the posttest was statistically significant, at p<.001 level for the intervention group, and marginally significant for the comparison group, with p<.01, as shown in the table below.
Table 36. Comparison of pretest and posttest results for Section B
Mean Pretest (St. Deviation)
Mean Posttest (St. Deviation) t Sig. (2-tailed)
Intervention Group 43.8% (26.639) 69.4% (23.219) 6.167 .000 Comparison Group 46.8% (24.79) 54.5% (25.817) 2.021 .050
The data analysis revealed that the difference in the composite gain score between the intervention and the comparison group teachers is statistically significant, at p<.001 level:
Table 37. Comparison of gain score means for Section B
Mean Difference
Std. Error Difference t Sig. (2-tailed)
Composite Section B Gain Score 17.934% 5.696% 3.148 .002
These results show that at the posttest the WSRP teachers increased the proportion of correct answers on the BIPI survey significantly more than the comparison group teachers – despite the fact that the two groups started a very similar level, with teachers answering just under half of the questions correctly.
The following tables present results of descriptive statistical analysis for Section B items. The results are interesting in the context of the student assessment findings discussed in the previous section of the report. The majority of teachers report that they often (5 or more times a month) conduct activities that are designed to help their students understand the meaning of a word or the text they read. For instance, over half of intervention teachers said at the posttest that they frequently implement the following practices:
- Ask students to try to guess or figure out the meaning of a new word by examining how it is used in a text or a sentence (Q14)
- Show students how to try to figure out the meaning of a word by analyzing the root word and the suffixes and/or prefixes (Q15)
- Ask students to predict the content of a story by examining the title or the illustrations (Q19) - Ask students to tell you what happened in the beginning, middle or end of a story or text they
have read idea of a story or a text (Q21) - Ask students to predict the next events of a story (Q22) - Ask students to identify what they liked about a story or a text (Q23)

62
However, the students’ performance on the comprehension subtests of the EGRA was still very low. It is possible that the implementation of these teaching strategies was not as frequent or focused as some of the commonly used strategies that are not designed to teach students how to construct text’s meaning. For example, the majority of sampled teachers in both intervention and comparison groups said they frequently used the following strategies:
- Ask students to read out loud for you or for classmates (Q16) - Have students repeat after you the sentences of a text (Q17) - Ask students to copy from the board texts prepared by the teacher (Q29)
These strategies, although not helpful in teaching comprehension, would contribute to students’ reading fluency, which was found to be rather high.
The survey results also show that very few teachers in both groups asked their students to reflect and write their original thoughts. Very few intervention teachers at the pretest, and about a third at the posttest said that they frequently implemented these activities. The proportion of comparison group teachers who said they implemented these teaching strategies frequently was even lower.
- Ask students to write original texts or sentences (i.e. texts or sentences that they have composed themselves, without the support of a model) (Q27)
- Ask students to write a sentence (or more) to summarize what they learned during the day or what they liked about the day (Q28)
Finally, the WSRP literacy program emphasizes the importance of stories and relating elements of stories to children’s lives as a foundational tool for teaching children literacy. Fewer than half of surveyed teachers said they implemented these strategies frequently:
- Have students discuss with classmates what they know about the theme or subject of a text before reading it (Q18)
- Ask students to identify whether there are any similarities between the events in a story and their own life experiences (Q24)
- Invite students to tell a story to their classmates (Q35)
In examining the survey data, the movement of responses between the pretest and the posttest is promising, although more research needs to be done to fully understand the extent to which teachers implement practices that are known to be effective in building children’s literacy skills. It is also unclear to what extent the intervention contributed to improving teacher practices. Some of the changes between the pretest and the posttest may be due to teachers finding practices more appropriate to implement at the end of the grade than in the beginning.

63
Table 38. Descriptive analysis of section B
Question Answer Options Survey results (%) Intervention (n=54); Comparison (n=39)
pretest intervention
pretest comparison
posttest intervention
posttest comparison
gain score intervention
gain score comparison
Q12. Help students use their knowledge of sounds and letters to decode a new word
Often (5 or more times a month) 55.6 76.9 90.7 64.1 35.1 -12.8 Sometimes, but less than 5 times a month 38.9 20.5 9.3 30.8 -29.6 10.3
Never 0.0 0.0 0.0 0.0 0.0 0.0 This is an inappropriate activity to do with students in my grade 0.0 2.6 0.0 5.1 0.0 2.5
Missing data 5.6 0.0 0.0 0.0 -5.6 0.0
Q13. Ask students to point out periods, commas, exclamation or question marks
Often (5 or more times a month) 68.5 64.1 85.2 71.8 16.7 7.7 Sometimes, but less than 5 times a month 29.6 33.3 13.0 25.6 -16.6 -7.7
Never 0.0 0.0 1.9 0.0 0.0 -1.9 This is an inappropriate activity to do with students in my grade 1.9 2.6 0.0 2.6 -1.9 0.0
Missing data 0.0 0.0 0.0 0.0 0.0 0.0 Q14. Ask students to try to guess or figure out the meaning of a new word by examining how it is used in a text or a sentence
Often (5 or more times a month) 50.0 38.5 70.4 46.2 20.4 7.7 Sometimes, but less than 5 times a month 48.1 51.3 27.8 51.3 -20.3 0.0
Never 0.0 0.0 0.0 2.6 0.0 2.6 This is an inappropriate activity to do with students in my grade 1.9 7.7 0.0 0.0 -1.9 -7.7
Missing data 0.0 2.6
1.9 0.0 1.9 -2.6
Q15. Show students how to try to figure out
Often (5 or more times a month) 38.9 35.9 51.9 51.3 13 15.4 Sometimes, but less than 5 times a month 55.6 46.2 44.4 33.3 -11.2 -12.9

64
Question Answer Options Survey results (%) Intervention (n=54); Comparison (n=39)
pretest intervention
pretest comparison
posttest intervention
posttest comparison
gain score intervention
gain score comparison
the meaning of a word by analysing the root word and the suffixes and/or prefixes
Never 3.7 7.7 0.0 10.3 -3.7 2.6 This is an inappropriate activity to do with students in my grade 1.9 10.3 1.9 2.6 0.0 -7.7
Missing data 0.0 0.0 1.9
2.6 1.9 2.6
Q16. Ask students to read out loud for you or for classmates
Often (5 or more times a month) 85.2 82.1 90.7 89.7 5.5 7.6 Sometimes, but less than 5 times a month 13.0 10.3 7.4 7.7 -5.6 -2.6
Never 1.9 0.0 1.9 0.0 0.0 0.0 This is an inappropriate activity to do with students in my grade 0.0 5.1 0.0 2.6 0.0 -2.5
Missing data 0.0 2.6 0.0 0.0 0.0 -2.6
Q17. Have students repeat after you the sentences of a text
Often (5 or more times a month) 66.7 76.9 81.5 74.4 14.8 -2.5 Sometimes, but less than 5 times a month 27.8 20.5 18.5 23.1 -9.3 2.6
Never 3.7 0.0 0.0 0.0 -3.7 0.0 This is an inappropriate activity to do with students in my grade 1.9 2.6 0.0 2.6 -1.9 0.0
Missing data 0.0 0.0 0.0 0.0 0.0 0.0 Q18. Have students discuss with classmates what they know about the theme or subject of a text before reading it
Often (5 or more times a month) 18.5 12.8 38.9 30.8 20.4 18.0 Sometimes, but less than 5 times a month 59.3 51.3 61.1 53.8 1.8 2.5
Never 18.5 20.5 0.0 12.8 -18.5 -7.7 This is an inappropriate activity to do with students in my grade 3.7 15.4 0.0 2.6 -3.7 -12.8
Missing data 0.0 0.0 0.0 0.0 0.0 0.0 Q19. Ask students to predict the content of a story
Often (5 or more times a month) 33.3 23.1 64.8 41.0 31.5 17.9 Sometimes, but less than 5 times a month 55.6 59.0 33.3 46.2 -22.3 -12.8

65
Question Answer Options Survey results (%) Intervention (n=54); Comparison (n=39)
pretest intervention
pretest comparison
posttest intervention
posttest comparison
gain score intervention
gain score comparison
by examining the title or the illustrations
Never 7.4 0.0 0.0 5.1 -7.4 5.1 This is an inappropriate activity to do with students in my grade 1.9 15.4 0.0 7.7 -1.9 -7.7
Missing data 1.9
2.6
1.9 0.0 0.0 -2.6
Q20. Have students identify the principal idea of a story or a text
Often (5 or more times a month) 44.4 28.2 66.7 48.7 22.3 20.5 Sometimes, but less than 5 times a month 44.4 43.6 33.3 43.6 -11.1 0.0
Never 3.7 7.7 0.0 2.6 -3.7 -5.1 This is an inappropriate activity to do with students in my grade 1.9 10.3 0.0 5.1 -1.9 -5.2
Missing data 3.7
10.3 0.0 0.0 -3.7 -10.3
Q21. Ask students to tell you what happened in the beginning, middle or end of a story or text they have read idea of a story or a text
Often (5 or more times a month) 44.4 43.6 77.8 46.2 33.4 2.6 Sometimes, but less than 5 times a month 51.9 43.6 20.4 48.7 -31.5 5.1
Never 1.9 0.0 0.0 0.0 -1.9 0.0 This is an inappropriate activity to do with students in my grade 0.0 7.7 1.9 5.1 1.9 -2.6
Missing data 0.0 5.1 0.0 0.0 0.0 -5.1 Q22. Ask students to predict the next events of a story
Often (5 or more times a month) 33.3 30.8 68.5 53.8 0.0 0.0 Sometimes, but less than 5 times a month 59.3 48.7 29.6 35.9 -29.7 -12.8
Never 3.7 5.1 0.0 5.1 -3.7 0.0 This is an inappropriate activity to do with students in my grade 0.0 10.3 1.9 5.1 1.9 -5.2
Missing data 3.7 5.1 0.0 0.0 -3.7 -5.1
Q23. Ask students to identify what
Often (5 or more times a month) 51.9 61.5 81.5 61.5 29.6 0.0 Sometimes, but less than 5 44.4 33.3 18.5 33.3 -25.9 0.0

66
Question Answer Options Survey results (%) Intervention (n=54); Comparison (n=39)
pretest intervention
pretest comparison
posttest intervention
posttest comparison
gain score intervention
gain score comparison
they liked about a story or a text
times a month
Never 1.9 0.0 0.0 0.0 -1.9 0.0 This is an inappropriate activity to do with students in my grade 0.0 5.1 0.0 5.1 0.0 0.0
Missing data 1.9 0.0 0.0 0.0 -1.9 0.0 Q24. Ask students to identify whether there are any similarities between the events in a story and their own life experiences
Often (5 or more times a month) 35.2 41.0 48.7 48.7 13.5 7.7 Sometimes, but less than 5 times a month 61.1 41.0 48.7 48.7 -12.4 7.7
Never 3.7 7.7 2.6 2.6 -1.1 -5.1 This is an inappropriate activity to do with students in my grade 0.0 10.3 0.0 0.0 0.0 -10.3
Missing data 0.0 0.0 0.0 0.0 -25.9 0.0 Q25. Invite students to read texts or books they choose on their own
Often (5 or more times a month) 66.7 51.3 88.9 53.8 22.2 2.5 Sometimes, but less than 5 times a month 31.5 33.3 11.1 46.2 -20.4 12.9
Never 1.9 10.3 0.0 0.0 -1.9 -10.3 This is an inappropriate activity to do with students in my grade 0.0 2.6 0.0 0.0 0.0 -2.6
Missing data 0.0 2.6 0.0 0.0 0.0 -2.6
Q26. Invite students to read texts or stories that are NOT in their textbook
Often (5 or more times a month) 31.5 23.1 61.1 33.3 29.6 10.2 Sometimes, but less than 5 times a month 51.9 48.7 37.0 46.2 -14.9 -2.5
Never 13.0 20.5 1.9 10.3 -11.1 -10.2 This is an inappropriate activity to do with students in my grade 3.7 7.7 61.1 10.3 57.4 2.6
Missing data 0.0 0.0 0.0 0.0 0.0 0.0 Q27. Ask students to write original
Often (5 or more times a month) 18.5 5.1 33.3 17.9 14.8 12.8 Sometimes, but less than 5 59.3 56.4 53.7 61.5 -5.6 5.1

67
Question Answer Options Survey results (%) Intervention (n=54); Comparison (n=39)
pretest intervention
pretest comparison
posttest intervention
posttest comparison
gain score intervention
gain score comparison
texts or sentences (i.e. texts or sentences that they have composed themselves, without the support of a model)
times a month
Never 13.0 20.5 7.4 5.1 -5.6 -15.4 This is an inappropriate activity to do with students in my grade 9.3 17.9 5.6 15.4 -3.7 -2.5
Missing data
0.0 0.0 0.0 0.0 0.0 0.0
Q28. Ask students to write a sentence (or more) to summarize what they learned during the day or what they liked about the day
Often (5 or more times a month) 16.7 10.3 35.2 7.7 18.5 -2.6 Sometimes, but less than 5 times a month 51.9 43.6 55.6 69.2 3.7 25.6
Never 20.4 28.2 5.6 10.3 -14.8 -17.9 This is an inappropriate activity to do with students in my grade 11.1 17.9 3.7 12.8 -7.4 -5.1
Missing data 0.0 0.0 0.0 0.0 0.0 0.0 Q29.Ask students to copy from the board texts prepared by the teacher
Often (5 or more times a month) 57.4 76.9 48.1 66.7 -9.3 -10.2 Sometimes, but less than 5 times a month 35.2 17.9 44.4 30.8 9.2 12.9
Never 3.7 0.0 3.7 0.0 0.0 0.0 This is an inappropriate activity to do with students in my grade 0.0 5.1 3.7 2.6 3.7 -2.5
Missing data 3.7 0.0 0.0 0.0 -3.7 0.0
Q30. Read stories to your students
Often (5 or more times a month) 75.9 74.4 90.7 82.1 14.8 7.7 Sometimes, but less than 5 times a month 22.2 20.5 9.3 15.4 -12.9 -5.1
Never 0.0 0.0 0.0 0.0 0.0 0.0 This is an inappropriate activity to do with students in my grade 0.0 5.1 0.0 2.6 0.0 -2.5
Missing data 1.9 0.0 0.0 0.0 -1.9 0.0

68
Question Answer Options Survey results (%) Intervention (n=54); Comparison (n=39)
pretest intervention
pretest comparison
posttest intervention
posttest comparison
gain score intervention
gain score comparison
Q31. Ask students to use their textbooks, their word lists or posters in the classroom to check the spelling of new words
Often (5 or more times a month) 42.6 59.0 77.8 53.8 35.2 -5.2 Sometimes, but less than 5 times a month 50.0 30.8 20.4 43.6 -29.6 12.8
Never 3.7 2.6 1.9 2.6 -1.8 0.0 This is an inappropriate activity to do with students in my grade 3.7 7.7 0.0 0.0 -3.7 -7.7
Missing data 0.0 0.0 0.0 0.0 0.0 0.0 Q32. Ask students to look over the text of a classmate to correct spelling, grammar or punctuation errors
Often (5 or more times a month) 27.8 28.2 55.6 43.6 27.8 15.4 Sometimes, but less than 5 times a month 53.7 46.2 35.2 41.0 -18.5 -5.2
Never 16.7 17.9 9.3 10.3 -7.4 -7.6 This is an inappropriate activity to do with students in my grade 1.9 7.7 0.0 5.1 -1.9 -2.6
Missing data 0.0 0.0 0.0 0.0 0.0 0.0 Q33. Ask students to complete reading assignments at home (as homework)
Often (5 or more times a month) 61.1 69.2 75.9 76.9 14.8 7.7 Sometimes, but less than 5 times a month 37.0 23.1 22.2 17.9 -14.8 -5.2
Never 1.9 0.0 1.9 0.0 0.0 0.0 This is an inappropriate activity to do with students in my grade 0.0 7.7 0.0 5.1 0.0 -2.6
Missing data 0.0 0.0 0.0 0.0 0.0 0.0 Q34. Ask students to complete writing assignments at home (as homework)
Often (5 or more times a month) 74.1 71.8 83.3 82.1 9.2 10.3 Sometimes, but less than 5 times a month 22.2 20.5 16.7 12.8 -5.5 -7.7
Never 3.7 2.6 0.0 0.0 -3.7 -2.6 This is an inappropriate activity to do with students in my grade 0.0 5.1 0.0 5.1 0.0 0.0
Missing data 0.0 0.0 0.0 0.0 0.0 0.0

69
Question Answer Options Survey results (%) Intervention (n=54); Comparison (n=39)
pretest intervention
pretest comparison
posttest intervention
posttest comparison
gain score intervention
gain score comparison
Q35. Invite students to tell a story to their classmates
Often (5 or more times a month) 29.6 10.3 38.9 25.6 9.3 15.3 Sometimes, but less than 5 times a month 63.0 66.7 59.3 59.0 -3.7 -7.7
Never 3.7 7.7 1.9 10.3 -1.8 2.6 This is an inappropriate activity to do with students in my grade 1.9 15.4 0.0 5.1 -1.9 -10.3
Missing data 1.9 0.0 0.0 0.0 -1.9 0 Q36. Help students memorize whole words by sight, without having to sound them out.
Often (5 or more times a month) 18.5 30.8 40.7 33.3 22.2 2.5 Sometimes, but less than 5 times a month 55.6 46.2 42.6 46.2 -13 0.0
Never 24.1 15.4 14.8 17.9 -9.3 2.5 This is an inappropriate activity to do with students in my grade 1.9 7.7 1.9 2.6 0.0 -5.1
Missing data 0.0 0.0 0.0 0.0 0.0 0.0

70
SECTION C: BELIEFS ABOUT TEACHING LITERACY
To determine whether WSRP training resulted in a change in teacher beliefs and attitudes relating to teaching literacy, a composite score for select practices was created16. The gain score was computed from the pretest and posttest data (gain score = posttest composite – pretest composite) and then converted into a percent of correctly answered questions from the total number of questions in the composite. The comparison of means analysis was conducted to determine if there is a difference in changes in the composite gain score between intervention and comparison group teachers.
The data analysis showed that the change in teacher beliefs in both the intervention and the comparison between the pretest and the posttest was statistically significant, at p<.01 level for the intervention group, and marginally significant for the comparison group, with p<.01, as shown in the table below.
Table 39. Comparison of pretest and posttest results
Mean Pretest (St. Deviation)
Mean Posttest (St. Deviation) t Sig. (2-tailed)
Intervention Group 63.8% (10.655) 71.6% (12.154) 3.320 .002 Comparison Group 62% (12.146) 66.1% (12.956) 2.001 .052
The data analysis revealed no statistically significant difference in the composite gain score between the intervention and the comparison group teachers:
Mean Difference Std. Error Difference t Sig. (2-tailed)
Composite Section B Gain Score 3.573 (3.064) 3.155 1.133 .260
(not significant)
The following tables demonstrate results of descriptive statistical analysis for Section C items. Differently from self-reported instructional practices that may naturally fluctuate between different points in the academic year, teacher beliefs about teaching literacy are not expected to change without an external stimulus. Thus, we would not expect to see much difference between the pretest and the posttest responses of the comparison group teachers. The WSRP teachers, however, were expected to have changed their beliefs about fundamental principles of teaching and learning literacy.
An examination of the Section C results showed that the vast majority of all surveyed teachers believe children can learn to read and write, although between one-fourth and one-fifth of comparison group teachers disagreed that all children can learn to read. About half of teachers thought that students have
16 Fourteen items from Section C (#37,38,41,42,43,44,45,46,47,48,49,52,53,55) were selected for the composite, with correct answers coded as 1, incorrect answers coded as 0, and the total computed.

71
a lot of difficulty learning to write (Q39), and a little less than half also thought it’s hard for kids to learn to read (Q50).
Traditional approach to teaching literacy emphasized recitation and memorization, so it is not surprising that the majority of teachers think that if a student makes a spelling error when attempting to write for the first time it’s a major concern (Q41). About a third of the surveyed teachers also thought that students must be able to recite a text before they can read it (Q 42). Nearly all surveyed teachers said that it is important to correct all the errors in sentences students produce (Q47). The majority of teachers also said that learning to recite a text is a first step in learning how to read it (Q53).
However, in some areas WSRP teachers showed positive changes. The proportion of WSRP teachers who agreed with the statement that it is better to teach reading and writing as two separate subjects (Q43) dropped by half between the pretest and the posttest, likely due to the intervention, although the majority of teachers still thought that children must learn to read before they can learn to write (Q44). Encouragingly, the vast majority of teachers agreed that it is important to give students time each day to write freely on topics of their own choosing (Q46), and that reading stories to students helps them develop their reading skills (Q49).
Overall, many of the reported beliefs are in line with the traditional way of approaching instruction in literacy. While the WSRP program emphasized that the value of recitation is questioned by contemporary research on literacy, it is likely to take longer than a year to change deeply engrained beliefs of experienced teachers. The project did open a door for examining teacher practices, and many more WSRP teachers said at the posttest that they had opportunities to talk to colleagues about teaching reading and writing than comparison group teachers. Such conversations are undoubtedly beneficial for teachers’ continuous professional development.

72
Table 40: Descriptive analysis of section C
Question Answer Options Survey results (%) Intervention (n=54); Comparison (n=39)
pretest intervention
pretest comparison
posttest intervention
posttest comparison
gain score intervention
gain score comparison
Q37. All learners can learn to read
Agree 90.7 76.9 87.0 76.9 -3.7 0.0 Disagree 9.3 20.5 13.0 23.1 3.7 2.6 No opinion 0.0 2.6 0.0 0.0 0.0 -2.6 Missing data 0.0 0.0 0.0 0.0 0.0 0.0
Q38. All learners can learn to write
Agree 100.0 97.4 98.1 97.4 -1.9 0.0
Disagree 0.0 2.6 1.9 2.6 1.9 0.0 No opinion 0.0 0.0 0.0 0.0 0.0 0.0 Missing data 0.0 0.0 0.0 0.0 0.0 0.0
Q39. Students have a lot of difficulty learning to write
Agree 51.9 53.8 55.6 35.9 3.7 -17.9 Disagree 48.1 43.6 42.6 61.5 -5.5 17.9 No opinion 0.0 2.6 0.0 2.6 0.0 0.0 Missing data 0.0 0.0 1.9 0.0 1.9 0.0
Q40. If I had sufficient reading material in my classroom, I would give students time each day to read freely materials of their own choosing
Agree 96.3 89.7 98.1 94.9 1.8 5.2 Disagree 3.7 10.3 1.9 5.1 -1.8 -5.2 No opinion 0.0 0.0 0.0 0.0 0.0 0.0 Missing data 0.0 0.0 0.0 0.0 0.0 0.0
Q41. If a student makes an error spelling a word that he/she is attempting to write for the first time, it’s not a major concern.
Agree 40.7 41.0 46.2 46.2 5.5 5.2 Disagree 59.3 56.4 53.8 53.8 -5.5 -2.6 No opinion 0.0 2.6 0.0 0.0 0.0 -2.6 Missing data 0.0 0.0 0.0 0.0 0.0 0.0
Q42. Students must be able to recite a text before they can
Agree 42.6 35.9 35.2 41.0 -7.4 5.1 Disagree 53.7 56.4 57.4 53.8 3.7 -2.6

73
Question Answer Options Survey results (%) Intervention (n=54); Comparison (n=39)
pretest intervention
pretest comparison
posttest intervention
posttest comparison
gain score intervention
gain score comparison
read it No opinion 1.9 7.7 1.9 2.6 0.0 -5.1 Missing data 1.9 0.0 5.6 2.6 3.7 2.6
Q43. It is better to teach reading and writing as two separate subjects, so as to not confuse the students
Agree 50.0 48.7 25.9 43.6 -24.1 -5.1 Disagree 48.1 48.7 74.1 56.4 26 7.7 No opinion 1.9 2.6 0.0 0.0 -1.9 -2.6 Missing data 0.0 0.0 0.0 0.0 0.0 0.0
Q44. One must learn to read before one can learn to write
Agree 59.3 48.7 66.7 56.4 7.4 7.7 Disagree 38.9 46.2 33.3 38.5 -5.6 -7.7 No opinion 1.9 2.6 0.0 5.1 -1.9 2.5 Missing data 0.0 2.6 0.0 0.0 0.0 -2.6
Q45. Students can’t write an original text (ie, a sentence or short text they have composed themselves) until at least grade 3 or 4
Agree 38.5 38.5 33.3 59.0 -5.2 20.5 Disagree 53.8 53.8 64.8 38.5 11 -15.3 No opinion 5.1 5.1 1.9 2.6 -3.2 -2.5 Missing data 0.0 2.6 0.0 0.0 0.0 -2.6
Q46. It is important to give students time each day to write freely on topics of their own choosing
Agree 94.4 79.5 96.3 87.2 1.9 7.7 Disagree 3.7 20.5 1.9 10.3 -1.8 -10.2 No opinion 1.9 0.0 0.0 2.6 -1.9 2.6 Missing data 0.0 0.0 1.9 0.0 1.9 0.0
Q47. It is important to correct all the errors in sentences students produce
Agree 96.3 94.9 83.3 94.9 -13 0.0 Disagree 1.9 5.1 13.0 2.6 11.1 -2.5 No opinion 1.9 0.0 1.9 2.6 0.0 2.6 Missing data 0.0 0.0 1.9 0.0 1.9 0.0
Q48. Before having students read a text for the first time, it is important to have a discussion with them about
Agree 94.4 92.3 94.4 94.9 0.0 2.6 Disagree 5.6 5.1 1.9 2.6 -3.7 -2.5 No opinion 0.0 2.6 1.9 2.6 1.9 0.0

74
Question Answer Options Survey results (%) Intervention (n=54); Comparison (n=39)
pretest intervention
pretest comparison
posttest intervention
posttest comparison
gain score intervention
gain score comparison
what they know about the subject addressed in the text
Missing data 0.0 0.0 1.9 0.0 1.9 0.0
Q49. Reading stories to students helps them develop their reading skills
Agree 92.6 97.4 92.6 97.4 0.0 0.0 Disagree 7.4 2.6 5.6 0.0 -1.8 -2.6 No opinion 0.0 0.0 0.0 0.0 0.0 0.0 Missing data 0.0 0.0 1.9 2.6 1.9 2.6
Q50. It is very difficult for students to learn to read
Agree 40.7 38.5 20.4 41.0 -20.3 2.5 Disagree 55.6 59.0 75.9 53.8 20.3 -5.2 No opinion 3.7 2.6 3.7 5.1 0.0 2.5 Missing data 0.0 0.0 0.0 0.0 0.0 0.0
Q51. It is very difficult for students to learn to write
Agree 25.9 20.5 16.7 28.2 -9.2 7.7 Disagree 72.2 79.5 83.3 69.2 11.1 -10.3 No opinion 1.9 0.0 0.0 2.6 -1.9 2.6 Missing data 0.0 0.0 0.0 0.0 0.0 0.0
Q52. Young students must memorize a text before they can understand it
Agree 29.6 38.5 24.1 25.6 -5.5 -12.9 Disagree 70.4 61.5 75.9 69.2 5.5 7.7 No opinion 0.0 0.0 0.0 2.6 0.0 2.6 Missing data 0.0 0.0 0.0 2.6 0.0 2.6
Q53. Learning to recite a text is a first step in learning how to read it
Agree 59.3 53.8 74.1 69.2 14.8 15.4 Disagree 38.9 43.6 25.9 28.2 -13 -15.4 No opinion 1.9 2.6 0.0 2.6 -1.9 0.0 Missing data 0.0 0.0 0.0 0.0 0.0 0.0
Q54. Silent reading should be avoided, because the teacher can’t check if students are actually reading or reading correctly
Agree 55.6 76.9 64.8 46.2 9.2 -30.7 Disagree 42.6 20.5 29.6 43.6 -13 23.1 No opinion 1.9 2.6 5.6 10.3 3.7 7.7 Missing data 0.0 0.0 0.0 0.0 0.0 0.0

75
Question Answer Options Survey results (%) Intervention (n=54); Comparison (n=39)
pretest intervention
pretest comparison
posttest intervention
posttest comparison
gain score intervention
gain score comparison
Q55. A student who writes “well” is a student who does not make any grammatical or spelling mistakes
Agree 20.4 20.5 13.0 10.3 -7.4 -10.2 Disagree 77.8 76.9 87.0 84.6 9.2 7.7 No opinion 1.9 2.6 0.0 5.1 -1.9 2.5 Missing data 0.0 0.0 0.0 0.0 0.0 0.0
Q56. I have received adequate training on how to teach reading
Agree 38.9 33.3 79.6 41.0 40.7 7.7 Disagree 50.0 51.3 18.5 46.2 -31.5 -5.1 No opinion 9.3 10.3 1.9 12.8 -7.4 2.5 Missing data 1.9 5.1 0.0 0.0 -1.9 -5.1
Q57. I have received adequate training on how to teach writing
Agree 33.3 30.8 72.2 43.6 38.9 12.8 Disagree 55.6 51.3 24.1 41.0 -31.5 -10.3 No opinion 9.3 12.8 3.7 15.4 -5.6 2.6 Missing data 1.9 5.1 0.0 0.0 -1.9 -5.1
Q58. I often have opportunities to talk to colleagues about how to teach reading
Agree 66.7 66.7 90.7 69.2 24 2.5 Disagree 24.1 20.5 9.3 15.4 -14.8 -5.1 No opinion 5.6 12.8 0.0 15.4 -5.6 2.6 Missing data 3.7 0.0 0.0 0.0 -3.7 0.0
Q59. I often have opportunities to talk to colleagues about how to teach writing
Agree 70.4 69.2 88.9 69.2 18.5 0.0 Disagree 20.4 15.4 9.3 15.4 -11.1 0.0 No opinion 3.7 15.4 1.9 15.4 -1.8 0.0 Missing data 5.6 0.0 0.0 0.0 -5.6 0.0

76
SECTION D: TEACHER BELIEFS ABOUT ABILITIES OF THEIR STUDENTS
The descriptive statistical analysis of Section D of the BIPI survey showed overall positive changes between the pretest and the posttest for both intervention and comparison group teachers. While at the pretest many teachers said their students could not read or write till higher elementary grades, at the posttest more teachers said that students could have those skills at the early elementary grades, or even before the start of grade 1.
Below is a summary of the descriptive statistics in graphical format for section D. Teacher responses to this section of the survey help better understand what expectations teachers set for their students, and what skills they view as essential. For example, while 40 percent of the intervention teachers said at the posttest that students should be able to read out load a simple text before the start of grade 1 (Q60), less than a half of that said they should be able to understand the text they are reading (Q61).
The WSRP teachers demonstrated some important changes in their views of appropriate skills for different grades. For instance, at the pretest about a quarter of them said that a student should be able to infer or deduce the meaning of a new word by looking at how it is used in the sentence by the end of grade 2 (Q66), while at the posttest this point of view was expressed by more than a half of the intervention teachers. Opinions of the comparison group teachers on this question remained virtually unchanged. The intervention appeared to have a similar impact on teachers’ opinions about teaching writing: the proportion of the WSRP teachers who said students should be able to write an original text of two or more sentences by the end of grade two (Q62) doubled between the pretest and the posttest. More WSRP teachers believed that students should be able to express their opinions on a text they have read by the end of grade two or earlier at the posttest than at the pretest.
Many surveyed teachers expressed a belief that students should have fundamental literacy skills (such as knowing letters of the alphabet and being able to write them; being able to read simple text and answer simple comprehension questions; use common punctuation) in place before the start of grade 1. Without additional research, it is unclear whether teachers consider students capable of having these skills, or having these skills in place in order to do well in school. Finally, it is perhaps a manifestation of the traditional teaching approach that more teachers said that students can spell words correctly (Q64) or read text of their own choosing (Q68) before the start of grade 1, than express their opinions on a text they have read (Q67), make a prediction about a story (Q72) or explain what they liked or did not like about the story (Q73). While the core of the WSRP program is based on connecting literacy instruction to what’s meaningful in children’s lives, traditionally held beliefs that young children cannot have authentic thoughts and opinions still persist.

77
Table 41: Descriptive analysis of section D: Teachers’ perceptions of students’ reading and writing skills
Question Answer Options Survey results (%) Intervention (n=54); Comparison (n=39)
pretest intervention
pretest comparison
posttest intervention
posttest comparison
gain score intervention
gain score comparison
Q60. Read out loud, and with few errors, a simple text (2 to 3 sentences) that they have never seen before
Before the start of Grade 1 20.4 23.1 40.7 10.3 20.3 -12.8 By the end of Grade 2 61.1 59.0 53.7 74.4 -7.4 15.4 By the end of Grade 4 14.8 17.9 5.6 15.4 -9.2 -2.5 By the end of Grade 6 1.9 0.0 0.0 0.0 -1.9 0 Not an important skill 1.9 0.0 0.0 0.0 -1.9 0 Missing data 0.0 0.0 0.0 0.0 0 0
Q61. Understand texts they are reading
Before the start of Grade 1 5.6 7.7 18.5 5.1 12.9 -2.6 By the end of Grade 2 55.6 66.7 68.5 74.4 12.9 7.7 By the end of Grade 4 37.0 25.6 13.0 20.5 -24 -5.1 By the end of Grade 6 1.9 0.0 0.0 0.0 -1.9 0 Not an important skill 0.0 0.0 0.0 0.0 0 0 Missing data 0.0 0.0 0.0 0.0 0 0
Q62. Write an original text of 2 or more sentences (one they have created themselves as opposed to a text they have copied from the board or created based on a model supplied by the teacher)
Before the start of Grade 1 7.4 5.1 7.4 0.0 0 -5.1 By the end of Grade 2 33.3 28.2 70.4 43.6 37.1 15.4 By the end of Grade 4 55.6 64.1 20.4 46.2 -35.2 -17.9 By the end of Grade 6 1.9 2.6 1.9 7.7 0 5.1 Not an important skill 1.9 0.0 0.0 2.6 -1.9 2.6 Missing data 0.0 0.0 0.0 0.0 0 0
Q63. Review a classmate’s text in order to help him/her correct spelling or grammar mistakes
Before the start of Grade 1 3.7 2.6 9.3 10.3 5.6 7.7 By the end of Grade 2 31.5 35.9 50.0 53.8 18.5 17.9 By the end of Grade 4 59.3 59.0 37.0 30.8 -22.3 -28.2 By the end of Grade 6 1.9 2.6 3.7 2.6 1.8 0

78
Not an important skill 3.7 0.0 0.0 2.6 -3.7 2.6 Missing data 0.0 0.0 0.0 0.0 0 0
Q64. Spell correctly common or frequently encountered words
Before the start of Grade 1 9.3 15.4 24.1 23.1 14.8 7.7 By the end of Grade 2 57.4 53.8 66.7 51.3 9.3 -2.5 By the end of Grade 4 31.5 30.8 7.4 23.1 -24.1 -7.7 By the end of Grade 6 1.9 0.0 1.9 2.6 0 2.6 Not an important skill 0.0 0.0 0.0 0.0 0 0 Missing data 0.0 0.0 0.0 0.0 0 0
Q65. Use common punctuation (period, question mark, exclamation mark) correctly in their original productions
Before the start of Grade 1 5.6 10.3 20.4 7.7 14.8 -2.6 By the end of Grade 2 46.3 51.3 63.0 64.1 16.7 12.8 By the end of Grade 4 44.4 38.5 14.8 23.1 -29.6 -15.4 By the end of Grade 6 3.7 0.0 1.9 5.1 -1.8 5.1 Not an important skill 0.0 0.0 0.0 0.0 0 0 Missing data 0.0 0.0 0.0 0.0 0 0
Q66. Infer or deduce the meaning of a new word by looking at how it is used in the sentence
Before the start of Grade 1 1.9 2.6 18.5 7.7 16.6 5.1 By the end of Grade 2 24.1 33.3 51.9 38.5 27.8 5.2 By the end of Grade 4 68.5 64.1 24.1 43.6 -44.4 -20.5 By the end of Grade 6 3.7 0.0 5.6 10.3 1.9 10.3 Not an important skill 1.9 0.0 0.0 0.0 -1.9 0 Missing data 0.0 0.0 0.0 0.0 0 0
Q67. Express their opinions on a text they have read
Before the start of Grade 1 1.9 2.6 18.5 5.1 16.6 2.5 By the end of Grade 2 25.9 20.5 51.9 35.9 26 15.4 By the end of Grade 4 68.5 76.9 24.1 38.5 -44.4 -38.4 By the end of Grade 6 1.9 0.0 5.6 20.5 3.7 20.5 Not an important skill 1.9 0.0 0.0 0.0 -1.9 0 Missing data 0.0 0.0 0.0 0.0 0 0
Q68. Read texts of their own choosing (ie, that they
Before the start of Grade 1 3.7 5.1 24.1 12.8 20.4 7.7 By the end of Grade 2 46.3 35.9 63.0 51.3 16.7 15.4

79
have chosen themselves) By the end of Grade 4 46.3 56.4 7.4 28.2 -38.9 -28.2 By the end of Grade 6 1.9 0.0 1.9 7.7 0 7.7 Not an important skill 1.9 2.6 3.7 0.0 1.8 -2.6 Missing data 0.0 0.0 0.0 0.0 0 0
Q69. Recognize all the letters of the alphabet and the sound each letter represents
Before the start of Grade 1 61.1 56.4 81.5 76.9 20.4 20.5 By the end of Grade 2 33.3 41.0 18.5 17.9 -14.8 -23.1 By the end of Grade 4 3.7 2.6 0.0 2.6 -3.7 0 By the end of Grade 6 1.9 0.0 0.0 2.6 -1.9 2.6 Not an important skill 0.0 0.0 0.0 0.0 0 0 Missing data 0.0 0.0 0.0 0.0 0 0
Q70. Decode new words without the teachers’ help by making correct letter-associations
Before the start of Grade 1 11.1 12.8 22.2 10.3 11.1 -2.5 By the end of Grade 2 44.4 38.5 57.4 48.7 13 10.2 By the end of Grade 4 44.4 46.2 14.8 33.3 -29.6 -12.9 By the end of Grade 6 0.0 2.6 5.6 7.7 5.6 5.1 Not an important skill 0.0 0.0 0.0 0.0 0 0 Missing data 0.0 0.0 0.0 0.0 0 0
Q71. Recognize and read common or frequently encountered words.
Before the start of Grade 1 18.5 23.1 22.2 15.4 3.7 -7.7 By the end of Grade 2 53.7 56.4 64.8 71.8 11.1 15.4 By the end of Grade 4 27.8 20.5 9.3 12.8 -18.5 -7.7 By the end of Grade 6 0.0 0.0 3.7 0.0 3.7 0 Not an important skill 0.0 0.0 0.0 0.0 0 0 Missing data 0.0 0.0 0.0 0.0 0 0
Q72. Make a hypothesis or a predication about what a text or story is about by looking at the title or the illustrations
Before the start of Grade 1 1.9 5.1 13.0 28.2 11.1 23.1 By the end of Grade 2 24.1 28.2 38.9 41.0 14.8 12.8 By the end of Grade 4 74.1 66.7 35.2 15.4 -38.9 -51.3 By the end of Grade 6 0.0 0.0 13.0 2.6 13 2.6 Not an important skill 0.0 0.0 0.0 12.8 0 12.8 Missing data 0.0 0.0 0.0 0.0 0 0
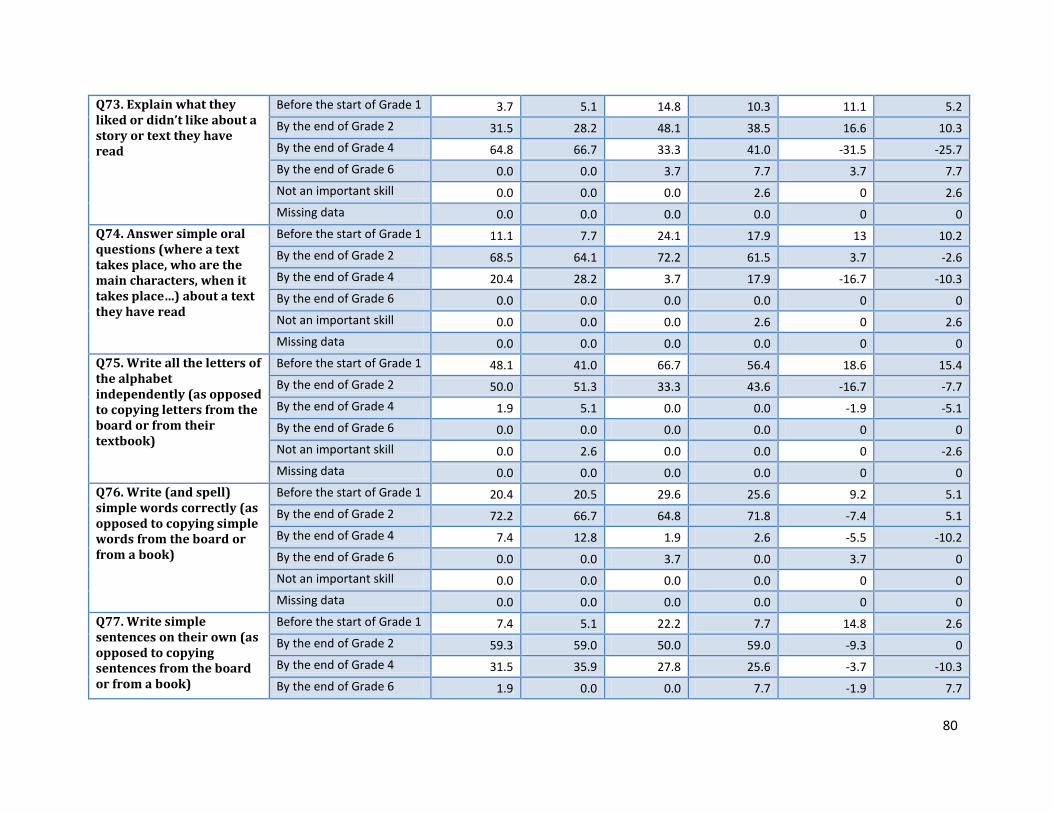
80
Q73. Explain what they liked or didn’t like about a story or text they have read
Before the start of Grade 1 3.7 5.1 14.8 10.3 11.1 5.2 By the end of Grade 2 31.5 28.2 48.1 38.5 16.6 10.3 By the end of Grade 4 64.8 66.7 33.3 41.0 -31.5 -25.7 By the end of Grade 6 0.0 0.0 3.7 7.7 3.7 7.7 Not an important skill 0.0 0.0 0.0 2.6 0 2.6 Missing data 0.0 0.0 0.0 0.0 0 0
Q74. Answer simple oral questions (where a text takes place, who are the main characters, when it takes place…) about a text they have read
Before the start of Grade 1 11.1 7.7 24.1 17.9 13 10.2 By the end of Grade 2 68.5 64.1 72.2 61.5 3.7 -2.6 By the end of Grade 4 20.4 28.2 3.7 17.9 -16.7 -10.3 By the end of Grade 6 0.0 0.0 0.0 0.0 0 0 Not an important skill 0.0 0.0 0.0 2.6 0 2.6 Missing data 0.0 0.0 0.0 0.0 0 0
Q75. Write all the letters of the alphabet independently (as opposed to copying letters from the board or from their textbook)
Before the start of Grade 1 48.1 41.0 66.7 56.4 18.6 15.4 By the end of Grade 2 50.0 51.3 33.3 43.6 -16.7 -7.7 By the end of Grade 4 1.9 5.1 0.0 0.0 -1.9 -5.1 By the end of Grade 6 0.0 0.0 0.0 0.0 0 0 Not an important skill 0.0 2.6 0.0 0.0 0 -2.6 Missing data 0.0 0.0 0.0 0.0 0 0
Q76. Write (and spell) simple words correctly (as opposed to copying simple words from the board or from a book)
Before the start of Grade 1 20.4 20.5 29.6 25.6 9.2 5.1 By the end of Grade 2 72.2 66.7 64.8 71.8 -7.4 5.1 By the end of Grade 4 7.4 12.8 1.9 2.6 -5.5 -10.2 By the end of Grade 6 0.0 0.0 3.7 0.0 3.7 0 Not an important skill 0.0 0.0 0.0 0.0 0 0 Missing data 0.0 0.0 0.0 0.0 0 0
Q77. Write simple sentences on their own (as opposed to copying sentences from the board or from a book)
Before the start of Grade 1 7.4 5.1 22.2 7.7 14.8 2.6 By the end of Grade 2 59.3 59.0 50.0 59.0 -9.3 0 By the end of Grade 4 31.5 35.9 27.8 25.6 -3.7 -10.3 By the end of Grade 6 1.9 0.0 0.0 7.7 -1.9 7.7

81
Not an important skill 0.0 0.0 0.0 0.0 0 0 Missing data 0.0 0.0 0.0 0.0 0 0
Q78. Write answers to teacher questions about what they have read or a text that has been read to them.
Before the start of Grade 1 1.9 7.7 14.8 10.3 12.9 2.6 By the end of Grade 2 40.7 38.5 61.1 43.6 20.4 5.1 By the end of Grade 4 57.4 53.8 24.1 35.9 -33.3 -17.9 By the end of Grade 6 0.0 0.0 0.0 10.3 0 10.3 Not an important skill 0.0 0.0 0.0 0.0 0 0 Missing data 0.0 0.0 0.0 0.0 0 0

82
CROSS-DATASET ANALYSES
A number of statistical analyses were performed to better understand the relationships between variables and variable composites in the three data sets discussed in this report. In order to make cross-dataset analyses possible, all three data sets were merged into a single dataset. Mean student performance for each teacher was computed and merged together with the SCOPE Literacy and BIPI results for each teacher. Thus, the final data set contained data from teacher survey (BIPI), teacher observations (SCOPE Literacy) and mean student achievement results from the classes of the teachers (EGRA).
Bivariate correlations and regression analysis were conducted to explore relationships between teacher practice as documented through SCOPE Literacy, teacher beliefs as recorded in BIPI, and student achievement in the nine subtests. While bivariate correlations do not indicate causality, they show an association between variables that can be interpreted in the context of the project.
Bivariate statistical analysis of BIPI results and SCOPE Literacy scores showed a positive association between the Section B composite score of the BIPI survey (that asks teachers to report a frequency of literacy-specific classroom practices) and SCOPE scores in all five dimensions. A bivariate analysis also found a positive association between the Section C composite score of the BIPI survey (that asks teachers to agree or disagree with a series of statements about teaching literacy) and SCOPE Literacy score in dimensions 1, 2 and 5. These results tell us that teachers who expressed opinions about teaching literacy that are consistent with the WSRP approach also had higher scores on the SCOPE dimensions. The association is statistically significant, although rather weak, with only SCOPE Dimension 4/BIPI Section B composite registering a Pearson correlation coefficient of above .3. The table below shows correlation coefficients.
Table 42. Correlations between SCOPE Literacy dimensions and BIPI composites
SCOPE D1: Decoding
SCOPE Item D2: Vocabulary
SCOPE D3: Fluency
SCOPE D4: Comprehension
SCOPE D5: Writing
BIPI Section B composite .197* .188* .179* .324** .256** BIPI Section C composite .229* .184* n/s n/s .186* N/s not significant * Statistically significant at p<.05 level (one-tail test) ** Statistically significant at p <.01 level (one-tail test) *** Statistically significant at p <.001 level (one-tail test)
Bivariate statistical analysis of BIPI results and student achievement showed a somewhat stronger association between the self-reported frequency of literacy-related instructional practices, and student scores in all nine subtests. The Pearson correlation coefficient ranges between .180 (which is rather weak) and a moderate .306. The correlation analysis between EGRA subtests and the BIPI composite for Section C (teacher beliefs about literacy) did not show strong relationships: only four out of nine subtests were found to have any association with the Section C composite, and the association between those was rather weak. What these statistics tell us is that generally teachers who report implementing

83
best practices in teaching literacy (as captured by Section B of the BIPI survey) tend to have students who score higher on the EGRA. These correlations do not indicator causality; there can be a variety of explanations for these associations, including other factors, not captured in this study.
Table 43. Correlations between EGRA subtests and BIPI composites
BIPI Section B Pearson Corr. Coef.
BIPI Section C Pearson Corr. Coef.
Letter naming .254** .180* Letter sounds .181* n/s Initial sound identification .306** n/s Familiar word reading .207* .196* Invented word decoding .252** n/s Oral reading passage .215* .185* Reading comprehension .290** .217* Listening comprehension .243* n/s Dictation .291** .233* N/s not significant * Statistically significant at p<.05 level (one-tail test) ** Statistically significant at p <.01 level (one-tail test) *** Statistically significant at p <.001 level (one-tail test)
We used bivariate correlation analysis to test the hypotheses that increase in the BIPI scores might be associated with improvements in EGRA results. The analysis did not showed significant associations between the changes in BIPI scores and the changes in the EGRA scores.
The WSRP program is based on the research and field evidence that classroom instruction in key literacy components by teachers leads to improvements in literacy achievement by students. Although bivariate correlation analysis between improvements made by the WSRP teachers, and improvements on EGRA subtests did not find any significant associations, the analysis did show a strong overall positive association between all five SCOPE dimensions and student achievement on EGRA subtests (both measured at the posttest). The relationship was found to be robust: Pearson’s r ranged between .3 and .4, which denotes strong association. That these results tell us is that teachers who display best instructional practices as measured by the SCOPE tend to have students who score higher on the EGRA.
While this association is not indicative of causal relationship between the SCOPE and the EGRA in this dataset, it does show that teachers who display better practices also have students who show better results. Of five SCOPE Literacy dimensions, the dimension that focused on explicit instruction in comprehension was found to be the most strongly associated with all nine EGRA subtests. The instruction in fluency dimension (SCOPE Literacy Dimension 3) was found to be strongly associated with letter sounds, initial sound identification, and dictation. Predictably, the instruction in writing dimension was found to be most strongly associated with student achievement in dictation. But curiously, the one dimension of SCOPE Literacy that explicitly focuses on vocabulary was found not be associated at all with either reading or listening comprehension. Finally, the instruction in decoding dimension was found to be rather strongly associated with the pre-literacy skills subtests (letter naming, letter sounds and

84
initial sound identification), as well as invented word reading, listening comprehension and dictation. The tables below show Person’s correlation coefficients and associated significance level.
Table 44. Correlations between SCOPE Literacy dimensions and mean student achievement on EGRA subtests, at the posttest
SCOPE D1: Decoding
SCOPE Item D2: Vocabulary
SCOPE D3: Fluency
SCOPE D4: Comprehension
SCOPE D5: Writing
Letter naming .317** .240* .344** .447** .351** Letter sounds .393** .296** .450** .447** .330** Initial sound identification .384** .287** .415** .505** .369** Familiar word reading .258** .235* .340** .468** .293** Invented word decoding .329** .226* .319** .465** .348** Oral reading passage .235* .247* .313** .461** .321** Reading comprehension .281* n/s .275** .433** .287** Listening comprehension .344** n/s .330** .431** .317** Dictation .386** .257* .403** .493** .434** * Statistically significant at p<.05 level (one-tail test) ** Statistically significant at p <.01 level (one-tail test) *** Statistically significant at p <.001 level (one-tail test) Comparisons between second and third grades show much stronger associations between the SCOPE and the EGRA scores at the second grade level. All correlations were found to be statistically significant, most of them with a very significant Pearson correlation coefficient of .4 or higher. More research is needed to understand why practices identified by the SCOPE associate stronger with the achievement at the second grade level than at the third grade level.
Table 45. Correlations between SCOPE Literacy dimensions and mean student achievement on EGRA subtests, at the posttest, Grade 2
SCOPE D1: Decoding
SCOPE Item D2: Vocabulary
SCOPE D3: Fluency
SCOPE D4: Comprehension
SCOPE D5: Writing
Letter naming .427** .256* .386** .498*** .462*** Letter sounds .503*** .401** .500*** .583*** .425** Initial sound identification .537*** .445*** .557*** .666*** .513*** Familiar word reading .493*** .354** .458*** .611*** .467*** Invented word decoding .441*** .333* .395** .552*** .435** Oral reading passage .476*** .346* .438*** .589*** .470*** Reading comprehension .459*** .289* .458*** .532*** .400** Listening comprehension .452*** .266* .438*** .459*** .434** Dictation .544*** .368** .515*** .586*** .577*** * Statistically significant at p<.05 level (one-tail test) ** Statistically significant at p <.01 level (one-tail test) *** Statistically significant at p <.001 level (one-tail test)
Table 46. Correlations between SCOPE Literacy dimensions and mean student achievement on EGRA subtests, at the posttest, Grade 3
SCOPE D1: Decoding
SCOPE Item D2: Vocabulary
SCOPE D3: Fluency
SCOPE D4: Comprehension
SCOPE D5: Writing
Letter naming .242* .369** .421** .441*** .285*

85
Letter sounds .269* .192 .430*** .299* .221 Initial sound identification .138 .062 .240 .277* .184 Familiar word reading .105 .172 .353** .339* .207 Invented word decoding .128 .196 .357** .333* .211 Oral reading passage .116 .231 .355** .375** .255* Reading comprehension .167 .055 .208 .392** .242 Listening comprehension .259* .113 .269* .415** .233 Dictation .249* .232 .371** .426** .339*** * Statistically significant at p<.05 level (one-tail test) ** Statistically significant at p <.01 level (one-tail test) *** Statistically significant at p <.001 level (one-tail test)
The next two tables show correlations between EGRA subtests and SCOPE dimensions in intervention group and in the comparison group. More pairs of variables were found to be significantly correlated in the intervention group than in the comparison group.
Table 47. Correlations between SCOPE Literacy dimensions and mean student achievement on EGRA subtests, at the posttest, intervention group
SCOPE D1: Decoding
SCOPE Item D2: Vocabulary
SCOPE D3: Fluency
SCOPE D4: Comprehension
SCOPE D5: Writing
Letter naming .260* .133 .404*** .456*** .352** Letter sounds .295* .150 .381** .368** .367** Initial sound identification .233* .002 .373** .408*** .243* Familiar word reading .274* .113 .373** .452*** .315** Invented word decoding .310* .159 .406*** .482*** .341** Oral reading passage .272* .195 .380** .486*** .367** Reading comprehension .372** .121 .351** .417*** .336** Listening comprehension .397*** .130 .359** .364** .285* Dictation .414*** .197 .453*** .462*** .457*** * Statistically significant at p<.05 level (one-tail test) ** Statistically significant at p <.01 level (one-tail test) *** Statistically significant at p <.001 level (one-tail test)
Table 48. Correlations between SCOPE Literacy dimensions and mean student achievement on EGRA subtests, at the posttest, comparison group
SCOPE D1: Decoding
SCOPE Item D2: Vocabulary
SCOPE D3: Fluency
SCOPE D4: Comprehension
SCOPE D5: Writing
Letter naming .095 .029 -.006 .206 -.007 Letter sounds .306* .247 .314* .346* -.084 Initial sound identification .242 .210 .218 .364* .162 Familiar word reading .080 .055 .112 .286* .032 Invented word decoding .074 .074 .076 .253 .027 Oral reading passage .099 .045 .104 .295* .050 Reading comprehension .047 -.063 .006 .413** -.008 Listening comprehension .049 -.081 .017 .386** .040 Dictation .087 -.002 .061 .308* .091 * Statistically significant at p<.05 level (one-tail test) ** Statistically significant at p <.01 level (one-tail test) *** Statistically significant at p <.001 level (one-tail test)

86
At the total sample level, neither correlation nor regression analysis found statistically significant relationships between participation in the project and the changes in teacher beliefs, instructional practices, and student performance. The pattern of data also varied across grades and groups of schools which suggests that the relationships between the EGRA and SCOPE Literacy scores are mediated by other factors, unaccounted for in the present study. For example, when disaggregated by region, regression analysis showed that the intervention was effective in improving overall student achievement in second grade in ARMM (R2 = .157) and in third grade in Region 9 (R2 = .049)17. Regression analysis also found that the intervention had a statistically significant impact in improving student achievement in the second grade in Region 12, but the amount of impact was very small (R2 = .005). Further research is needed to understand why the intervention had different effect across regions.
While the results of statistical analyses above are important and suggestive, further study will be required before definitive conclusions can be drawn concerning a causal relationship between teacher practice as measured by the SCOPE Literacy and student performance as measured by the EGRA. It may be that a common exogenous variable, such as the socio-economic milieu of particular schools, or additional teacher skills not measured by SCOPE, is driving both SCOPE Literacy and EGRA scores up. It is also possible that the instructional practices measured by SCOPE Literacy do not have direct linear relationships with the student performance as measured by the EGRA. Finally, one year of the program might not be sufficient to solidify the implementation of the practices in a way that has a strong bearing on student performance.
17 Complete results of regression analysis are found in Annex E.

87
DISCUSSION AND CONCLUSIONS The evaluation was designed to test whether the WSRP was effective in improving teacher instructional practices, teacher beliefs about literacy instruction, and student performance. The data presented in this report provided answers to the five evaluation questions stated in the Evaluation Methodology section of this report. This section provides a summary of the findings for each of the evaluation questions.
Question 1. In what ways did teachers' beliefs and attitudes on teaching reading change as a result of the intervention?
As the section on the BIPI findings described, statistical analyses of changes in BIPI survey responses between the pretest and the posttest showed that overall the intervention group teachers demonstrated larger positive change in all three BIPI sections, compared with the comparison group teacher results. For Section B, a comparison of means test showed a statistically significant difference in composite scores between the pretest and posttest. The change was significantly larger for the intervention group. For section C, a comparison of means test showed a significant positive change in composite scores between the pretest and the posttest. However, the difference in change in the intervention group and in the comparison group was not statistically significant. Section D was only analyzed descriptively at the dimension level, so no comparison of means test was conducted.
Question 2. Were the changes in beliefs associated with changes in instructional practices in teaching reading in English?
No statistically significant association between the changes in teacher beliefs and changes in instructional practices were found. However, bivariate statistical analysis of BIPI overall composite scores and SCOPE Literacy scores showed a positive association between Section B composite score of the BIPI survey (that asks teachers to report a frequency of literacy-specific classroom practices) and SCOPE Literacy scores in all five dimensions. A bivariate analysis also found a positive association between Section C composite score of the BIPI survey (that asks teachers to agree or disagree with a series of statements about teaching literacy) and SCOPE Literacy score in dimensions 1, 2 and 5. The association is statistically significant, although rather weak.
Question 3. Were the changes in teacher beliefs associated with students' reading skills?
Statistical analyses did not show an association between changes in the BIPI composite scores and improvements in student reading skills. However, bivariate statistical analysis showed a positive association between Section B BIPI composite and student achievement on all EGRA subtests. Section C BIPI composite was found to be positively associated with some, but not all EGRA subtests. The relationships were statistically significant, but not strong. Further study is needed to establish the conditions under which interventions can be result in effecting positive change in teacher beliefs and attitudes.
88
Question 4. Was there a change in teacher practices as a result of the intervention?
The WSRP teachers scored higher on four out of five SCOPE Literacy dimensions at the pretest, and higher on all five SCOPE dimensions at the posttest. Both the WSRP and comparison group teachers scored highest on the first dimension of SCOPE Literacy (“Provides students with structured opportunities to develop their encoding (spelling/writing) and decoding skills”), followed by the second, third and fourth dimensions. Both groups of teachers scored the lowest on the fifth dimension of SCOPE Literacy (“Implements instruction that recognizes the importance of independent, original writing in the development of reading skills”), although intervention group teachers demonstrated the highest gains in this dimension between the pretest and the posttest. The comparison of means showed larger gain in all five SCOPE Literacy dimensions among teachers in the intervention group (p<.01) compared with the teachers in the comparison group. The analysis by dimension showed larger improvement among intervention group teachers in three out of five SCOPE Literacy dimensions:
• Use diverse instructional strategies to develop students' reading fluency (t = 2.10; p<.05) • Use diverse instructional strategies to develop students' comprehension skills (t = 2.71; p<.01) • Implement instruction that recognizes the importance of independent, original writing in the
development of reading skills (t = 4.70; p<.001)
Results of linear regression analysis showed that the project was effective in improving overall SCOPE score of teachers in both grades. For the second grade teachers, participation in the WSRP program was associated with an increase in the overall SCOPE score by 2.12 points (significant at p<.05 level). For the third grade teachers, participation in the WSRP program was associated with an increase in the overall SCOPE score by 2.32 points (significant at p<.01 level). The associated r-squared was found to be .135 for the second grade teachers, and .139 for the third grade teachers.
Question 5. Was there a significant improvement in the reading skills of students in grades 2 to 3 as a result of the intervention?
The overall results of EGRA testing showed relatively high pre-literacy and fluency skills, particularly among the third graders, and very low listening and reading comprehension skills. A lack of linear relationships between oral reading fluency and reading comprehension is observed in many countries where the instruction does not occur in a native language.
Second grade intervention group students gained significantly more between the pretest and the posttest in seven out of ten tested subtests, compared to just one subtest in which students from comparison group gained more. Comparing to the gains made by the students in the comparison group, intervention group second graders gained significantly more between the pretest and the posttest. In the third grade, students from the intervention group gain significantly more in three subtests, and students from the comparison group gained significantly more in two other subtests. The gain difference was particularly significant for female students. The gains made by the intervention group girls were larger and for more subtests than the gains made by the boys. In the second grade girls also outscored

89
boys in both pretest and the posttest. This pattern is also observed in the data from the third graders, although the difference between boys and girls is not as pronounced in some subtests.
Regression analysis also showed that the intervention was particularly effective in improving overall student achievement in second grade in ARMM (R2 = .157) and in third grade in Region 9 (R2 = .049). Regression analysis also found that the intervention had a statistically significant impact in improving student achievement in the second grade in Region 12, but the amount of impact was very small (R2 = .005). Further research is needed to understand why the intervention had different effect across regions.

90
ANNEXES
ANNEX A. ANALYTICAL FRAMEWORK
Books and reference materials from BBF
Resources from Petron F d i
1. Teachers and Principals
• 5 days summer institute for school heads and all teachers
• 4 days refresher training
2. Students • Classroom application
of appropriate instructional approaches
• Activities for struggling readers
• Knowledge base: Books and reference materials for student in Reading and English
INPUTS OUTPUTS
Activities/Products Participation OUTCOMES
Products:
• Training session guides • Modified SCOPE Literacy
tool •School Reading
Improvement Plan that includes the following components:
- Teacher and administrator training
- Student assessment - Strengthening
classroom reading instruction
- Remedial and enrichment reading instruction
- Instructional materials development
- Monitoring and technical support
53 schools, 38,566 students:
- Improved reading instruction
-Increased time on reading tasks
All teachers and principals from the 45 selected schools are integrating the teaching of reading and writing in English into their subject-
Student achievement in reading in English
Students maintain reading gains.
Principals and teachers are able to integrate their reading plans into their existing school improvement plans, and they follow their plans closely.
Teachers maintain good practices in teaching reading and
Students advance in their reading comprehension skills from baseline.
Students can understand grade-level text.
Students are able to read and demonstrate understanding as defined by a country curriculum, standards, or
i l
DepED time and resources on project
Trained teachers are aware of their own skill levels and know effective strategies for improving reading and writing, which is necessary to strengthen their own reading and writing skills.
DepED expands reading interventions to other schools
DepED applies reading assessment practices to other schools.
91
3. DepED Administrators
• Training on SCOPE Literacy administration and data analysis
• Workshop to prepare a refined
20 division-level and district-level administrators enhance their skills in tracking improvement in
DepED at all levels is implementing EQuALLS2-initiated programs that further enhance teachers’ capacity
Product: Refined and scalable model for

92
ANNEX B: STUDY OF TEACHERS’ CLASSROOM PRACTICES AND PERCEPTIONS WITH RESPECT TO READING AND WRITING (2012)
The EDC-developed Beliefs and Instructional Practices Inventory (BIPI) is designed to provide decision makers and professional development program planners with an overview of the types of evidence-based instructional practices teachers use in their daily work, as well insights into the beliefs that teachers hold about how children learn to read and write and about what they think constitute effective instructional practices.
Having information about teachers’ perceptions of their instructional practices provides insights into the specific reading and writing skills or competencies that teachers are unlikely to incorporate into daily instruction -- either because they do not view students as being capable of mastering them, or because they do not consider the activity to be an important contributor to students’ reading and writing development for the age level in question. This is an important indicator of teachers’ perceptions of how reading and writing develops—and of the skills that can and should be developed at particular grade levels.
The BIPI also provides glimpses into the beliefs that teachers hold about how children learn to read and write, the relative difficulties boys and girls face learning to read and write, and effective reading and writing instructional strategies. Understanding the beliefs teachers bring to the reading and writing process is critical to designing an effective intervention program. Beliefs can act as pedagogical filters, encouraging teachers to assimilate strategies and activities that align with those belief structures and to either reject or distort those that do not. If teachers are presented with instructional materials and training that conflict with their own tacitly-held beliefs about how children learn to read they are unlikely to incorporate the new ideas into their instructional repertoire. They are unlikely to use the materials or activities at all, or to use them as intended, unless relevant and convincing evidence to the contrary.
The survey is a self-reported indirect measure that consists of a series of declarative statements about observable classroom practices or beliefs about how students learn. Each statement is either an evidence-based practice, or a practice that may in fact be detrimental to students’ reading development. Teachers indicate the degree to which they agree or disagree, or the frequency with which they incorporate the practice.
The BIPI is administered with the written consent of the teacher, with the clear understanding that individual data is not shared with others, and with the assurance that it is not a test. The form may be administered individually or in groups, and may be administered orally if needed. Administrators may answer teachers’ questions about the survey statements, but only in a way that does not influence their answers.
Responses are entered into an excel file for initial analysis. During analysis, different practices statements and their associated rationales are grouped into categories indicative of belief structures, in order to describe
1. teachers’ own personal literacy practices and their training in reading instruction 2. teachers’ beliefs about what contributes to effective reading instruction

93
3. the degree to which teachers integrate into their instructional program practices related to each of the components of an effective reading program (oral language development, explicit instruction of component skills, authentic writing and authentic reading)
4. teachers’ expectations of students with respect to each of these four components
BELIEFS AND INSTRUCTIONAL PRACTICES INVENTORY (BIPI)
• You have been selected to participate in this study, but you have the right not to participate if
you do not want to. • Your participation will be anonymous. Your name will not be mentioned anywhere in the
summary reports. Your responses will be combined with that of all other participants in your country and presented in the form of summary tables.
• The overall results of the study will, however, be shared with the EQuALLS2 Project and with the Department of Education in order to prepare future trainings and materials that respond better to teachers’ expressed needs and priorities.
• If you agree to complete this questionnaire, we thank you in advance. You will be asked to identify the name of your community and provide certain characteristics of your school (the number of students in the class or school, the zone in which the school is situated (rural versus urban), the status of the school or learning center, …). However, we will never communicate the results by individual school. All responses will be grouped together and presented together.
• If you prefer not to complete this questionnaire, please return it now to an EDC staff.
I accept to complete this questionnaire according to the conditions outlined above.
Yes No
Name:_____________________________________________ Date: _______________________
Education Development Center (EDC) is an international NGO that works to support literacy instruction in a number of countries including the Philippines. As an education development NGO, it is interested in gaining a better understanding of the process by which children in different countries learn to read.
The results will enable EDC to identify the aspects of reading instruction that are most challenging for teachers and students in each country, as well as those that do not seem to pose a great deal of difficulty. This will help EDC develop more responsive and effective training programs.

94
A. General information Direction : Please provide information being asked for or circle one option as appropriate.
1. School Name and District : ___________________________________________
2. Public Elementary School 1. Elementary School 2. Central Elementary School
3. Professional status 1. Holder of DepEd regular/plantilla post 2. LGU-funded (MLGU, BLGU)
3. Community-recruited and paid teacher (PTA, other stakeholders) 4. Private school teacher 5. Volunteer
4. Age: _____ years
5. Number of years teaching experience : ______ years
6. Sex 1. Male 2. Female
7. What grade level do you teach at this year? 1 = grade 1 4 = grade 4 7 = combination 2 = grade 2 5 = grade 5 8 = multi-grade 3 = grade 3 6 = grade 6
8. Where is your school located? 1. Rural 2. Urban
9. What is the highest academic degree you have received? 1 = Bachelor’s Degree or higher 3 = High school 2 = Technical/trade certificate 4 = Primary school leaving exam (A&E) 5= Other (specify) :_________________
10. e a license as a professional teacher? 1 = No 2 = Yes
11. Have you attended any in-service training or professional development sessions such as workshops on how to teach reading in the last year?
2 = Yes How many training days did you receive in total over the past year? ____ days
B. How often do you do the following activities with your class? (Put an X in the appropriate column.)
Ofte
n (5
or
mor
e tim
es a
m
onth
) So
met
imes
, but
le
ss th
an 5
tim
es a
mon
th
Nev
er
This
is a
n in
appr
opria
te
activ
ity to
do
with
stud
ents
in
my
grad
e

95
B. How often do you do the following activities with your class? (Put an X in the appropriate column.)
Ofte
n (5
or
mor
e tim
es a
m
onth
) So
met
imes
, but
le
ss th
an 5
tim
es a
mon
th
Nev
er
This
is a
n in
appr
opria
te
activ
ity to
do
with
stud
ents
in
my
grad
e
12. Help students use their knowledge of sounds and letters to decode a new word
13. Ask students to point out periods, commas, exclamation or question marks
14. Ask students to try to guess or figure out the meaning of a new word by examining how it is used in a text or a sentence
15. Show students how to try to figure out the meaning of a word by analysing the root word and the suffixes and/or prefixes
16. Ask students to read out loud for you or for classmates
17. Have students repeat after you the sentences of a text
18. Have students discuss with classmates what they know about the theme or subject of a text before reading it
19. Ask students to predict the content of a story by examining the title or the illustrations
20. Have students identify the principal idea of a story or a text 21. Ask students to tell you what happened in the beginning, middle or end of a story
or text they have read
22. Ask students to predict the next events of a story
23. Ask students to identify what they liked about a story or a text
24. Ask students to identify whether there are any similarities between the events in a story and their own life experiences
25. Invite students to read texts or books they choose on their own
26. Invite students to read texts or stories that are NOT in their textbook
27. Ask students to write original texts or sentences (i.e. texts or sentences that they have composed themselves, without the support of a model)
28. Ask students to write a sentence (or more) to summarize what they learned during the day or what they liked about the day
29. Ask students to copy from the board texts prepared by the teacher
30. Read stories to your students 31. Ask students to use their textbooks, their word lists or posters in the classroom to
check the spelling of new words

96
B. How often do you do the following activities with your class? (Put an X in the appropriate column.)
Ofte
n (5
or
mor
e tim
es a
m
onth
) So
met
imes
, but
le
ss th
an 5
tim
es a
mon
th
Nev
er
This
is a
n in
appr
opria
te
activ
ity to
do
with
stud
ents
in
my
grad
e
32. Ask students to look over the text of a classmate to correct spelling, grammar or punctuation errors
33. Ask students to complete reading assignments at home (as homework)
34. Ask students to complete writing assignments at home (as homework)
35. Invite students to tell a story to their classmates 36. Help students memorize whole words by sight, without having to sound them
out.
C. Statements
Agr
ee
Dis
agre
e
No
opin
ion
37. All learners can learn to read.
38. All learners can learn to write.
39. Students have a lot of difficulty learning to write
40. If I had sufficient reading material in my classroom, I would give students time each day to read freely materials of their own choosing
41. If a student makes an error spelling a word that he/she is attempting to write for the first time, it’s not a major concern.
42. Students must be able to recite a text before they can read it.
43. It is better to teach reading and writing as two separate subjects, so as to not confuse the students.
44. One must learn to read before one can learn to write.
45. Students can’t write an original text (ie, a sentence or short text they have composed themselves) until at least grade 3 or 4.
46. It is important to give students time each day to write freely on topics of their own choosing.
47. It is important to correct all the errors in sentences students produce.
48. Before having students read a text for the first time, it is important to have a discussion with them about what they know about the subject addressed in the text.
49. Reading stories to students helps them develop their reading skills
50. It is very difficult for students to learn to read.
51. It is very difficult for students to learn to write
52. Young students must memorize a text before they can understand it.
53. Learning to recite a text is a first step in learning how to read it.
54. Silent reading should be avoided, because the teacher can’t check if students are actually reading or reading correctly.
55. A student who writes “well” is a student who does not make any grammatical or

97
C. Statements
Agr
ee
Dis
agre
e
No
opin
ion
spelling mistakes. 56. I have received adequate training on how to teach reading
57. I have received adequate training on how to teach writing
58. I often have opportunities to talk to colleagues about how to teach reading.
59. I often have opportunities to talk to colleagues about how to teach writing.
D. Students’ reading/writing skills
Bef
ore
the
star
t of
Gra
de 1
By
the
end
of
Gra
de 2
By
the
end
of
Gra
de 4
By
the
end
of
Gra
de 6
Not
an
impo
rtant
sk
ill
60. Read out loud, and with few errors, a simple text (2 to 3 sentences) that they have never seen before
61. Understand texts they are reading 62. Write an original text of 2 or more sentences (one they
have created themselves as opposed to a text they have copied from the board or created based on a model supplied by the teacher)
63. Review a classmate’s text in order to help him/her correct spelling or grammar mistakes
64. Spell correctly common or frequently encountered words. 65. Use common punctuation (period, question mark,
exclamation mark) correctly in their original productions
66. Infer or deduce the meaning of a new word by looking at how it is used in the sentence
67. Express their opinions on a text they have read 68. Read texts of their own choosing (ie, that they have chosen
themselves)
69. Recognize all the letters of the alphabet and the sound each letter represents
70. Decode new words without the teachers’ help by making correct letter-associations
71. Recognize and read common or frequently encountered words.
72. Make a hypothesis or a predication about what a text or story is about by looking at the title or the illustrations
73. Explain what they liked or didn’t like about a story or text they have read

98
D. Students’ reading/writing skills
Bef
ore
the
star
t of
Gra
de 1
By
the
end
of
Gra
de 2
By
the
end
of
Gra
de 4
By
the
end
of
Gra
de 6
Not
an
impo
rtant
sk
ill
74. Answer simple oral questions (where a text takes place, who are the main characters, when it takes place…) about a text they have read
75. Write all the letters of the alphabet independently (as opposed to copying letters from the board or from their textbook).
76. Write (and spell) simple words correctly (as opposed to copying simple words from the board or from a book)
77. Write simple sentences on their own (as opposed to copying sentences from the board or from a book)
78. Write answers to teacher questions about what they have read or a text that has been read to them.
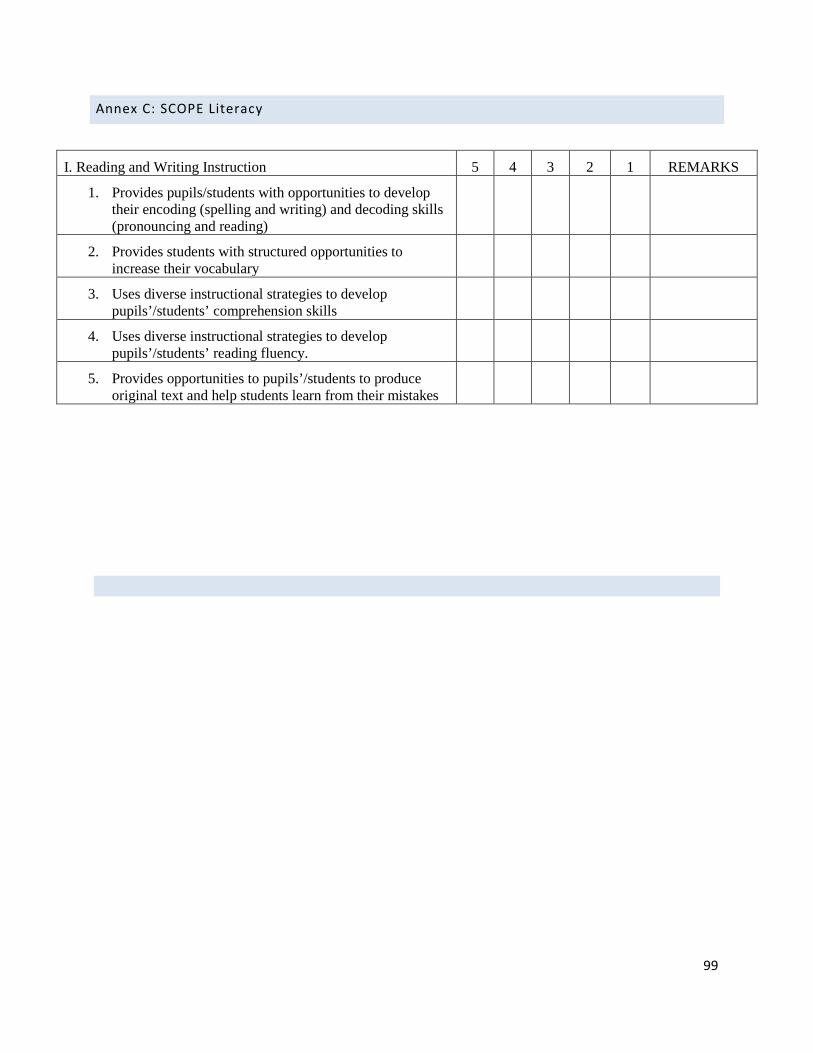
99
Annex C: SCOPE Literacy
I. Reading and Writing Instruction 5 4 3 2 1 REMARKS
1. Provides pupils/students with opportunities to develop their encoding (spelling and writing) and decoding skills (pronouncing and reading)
2. Provides students with structured opportunities to increase their vocabulary
3. Uses diverse instructional strategies to develop pupils’/students’ comprehension skills
4. Uses diverse instructional strategies to develop pupils’/students’ reading fluency.
5. Provides opportunities to pupils’/students to produce original text and help students learn from their mistakes

100
Annex D. Early Grade Reading Assessment (EGRA)
The Early Grade Reading Assessment (EGRA) is a one-on-one oral assessment requiring about 15 minutes per child. It is a simple diagnostic of individual student progress in reading. The EGRA instrument typically is adapted for use in a particular country and language. A primary use of EGRA is to establish national or regional reading performance measures. The results then can feed into policy dialogue activities to inform education stakeholders of the current status of students' reading performance and to raise awareness about the importance of reading in the early grades.18
The EGRA instrument is designed to test literacy through a series of subtests. The EGRA was conceived to be a method-independent approach to assessment and thus can be used across a variety of languages and instructional approaches. EGRA intends to measure basic skills that a learner must in order to learn to read and understand the meaning of the text. The EGRA subtests are based on research on literacy and include five fundamental components: phonemic awareness, phonics, reading fluency, vocabulary, and comprehension. EGRA is adapted to the language(s) and locality where they are administered. The version of EGRA used for the evaluation of WSRP program was in English and included the following subtests
1. Orientation to print subtest assessed children’s knowledge of how to read printed text. The children were asked to trace with the finger how they would read the text. The subtest had three items (the child puts finger on top row, left-most word; the child moves finger from left to right, and the child moves finger to left-most word of second line).
2. Letter naming subtest assessed children’s knowledge of the letters of English alphabet. Children were presented with 100 randomly placed letters which they were instructed to name. Only letter names, not the sounds that those letters made, constituted correct answers. The test was timed at 60 seconds; the result of the test was a number of letters named correctly per minute. Since some children can finish the list in less than a minute, a number of letters per minute greater than 100 was possible.
3. Letter sound knowledge assessed children’s knowledge of the letter-sound relationships critical for sounding out new words. In this timed subtask, children were shown another list of 100 random letters. Instead of providing the letter names, children were asked to tell the examiner the sound of as many letters as they could within 1 minute, yielding a score of correct letter sounds per minute.
4. Initial sound identification assessed children’s phonemic awareness (the ability to explicitly identify and manipulate the sounds of language). Phonemic awareness has been found to be one of the most robust predictors of reading acquisition and is often used to identify children at risk for reading difficulties in the primary grades in developed countries. In this subtask, children were asked to listen to a word and identify the first sound in that word.
18 https://www.eddataglobal.org/about/index.cfm

101
After two practice items, children were given 10 test items.
5. Familiar word reading assessed children’s skill at reading high-frequency words. Recognizing familiar words is critical for developing reading fluency. In this timed subtask, children were presented a chart of 50 familiar words. Children were asked to read as many words as they could. The subtest was timed within 1minute and yielded a score of correct words per minute.
6. Invented word decoding assessed children’s decoding skills to decode words they can’t have memorized. Tested children were asked to decode a list of 50 pronounceable nonsensical words that followed legal spelling patterns of English. Children were asked to decode as many invented words as they could within 1 minute.
7. Oral passage reading assessed children’s fluency in reading a passage of a simple text aloud and their ability to understand what they had read. The passage was 61-word long and children had one minute to read it.
8. Reading comprehension: After the children finished reading the oral reading passage, or the minute ended, the passage was removed and children were asked six questions about specific facts in the passage they just read. All question were inferential.
9. Listening comprehension is considered to be an important skill for reading comprehension. In this subtask, the test administrator read a passage to children. Children were then asked five questions about that passage.
10. Dictation assessed children’s skill at spelling and basic writing rules, such as capitalization, punctuation, text direction, and spacing between words. The data collector read a short sentence to the children and children attempted to write the sentence. The data collector scored the dictation results after the child was finished with the test.
Administration of the EGRA includes an “early stop” rule, when the data collector stops the tasks if the child failed to complete the first few elements of the subtests (for instance, to read the first five words of the familiar word list).
Before administering the EGRA, the test administrators obtained consent of the children to participate in the exercise.

102
ANNEX E: RESULTS OF REGRESSION ANALYSIS
RESULTS OF REGRESSION ANALYSIS FOR THE TOTAL EGRA GAINS, BY REGION Model Summary region Grade Model R R Square Adjusted R
Square Std. Error of the Estimate
ARMM second 1 .396a .157 .154 11.09549 third 1 .231a .054 .051 11.64024
Region 9 second 1 .064a .004 .002 11.18335 third 1 .221a .049 .047 9.60020
Region 12 second 1 .067a .005 .003 11.97137 third 1 .028a .001 .000 10.55853
a. Predictors: (Constant), school type (comparison group = 0; intervention group = 1) ANOVAb region Grade Model Sum of
Squares df Mean
Square F Sig.
ARMM second 1 Regression 7038.902 1 7038.902 57.176 .000a Residual 37794.726 307 123.110 Total 44833.628 308
third 1 Regression 2712.388 1 2712.388 20.018 .000a Residual 47965.322 354 135.495 Total 50677.710 355
Region 9 second 1 Regression 251.788 1 251.788 2.013 .157a Residual 61283.009 490 125.067 Total 61534.797 491
third 1 Regression 2541.632 1 2541.632 27.577 .000a Residual 49584.185 538 92.164 Total 52125.817 539
Region 12 second 1 Regression 563.915 1 563.915 3.935 .048a Residual 124253.003 867 143.314 Total 124816.918 868
third 1 Regression 79.436 1 79.436 .713 .399a Residual 103595.259 929 111.483 Total 103674.695 930
a. Predictors: (Constant), school type b. Dependent Variable: average gain in ten EGRA subtests

103
Coefficientsa
region Grade Model Unstandardized Coefficients Standardized Coefficients
t Sig.
B Std. Error Beta ARMM second 1 (Constant) 12.308 .883 13.943 .000
school_typeb 9.548 1.263 .396 7.561 .000 third 1 (Constant) 15.676 .963 16.272 .000
school_type -5.612 1.254 -.231 -4.474 .000 Region 9 second 1 (Constant) 10.881 .759 14.333 .000
school_type 1.441 1.015 .064 1.419 .157 third 1 (Constant) 7.038 .700 10.052 .000
school_type 4.554 .867 .221 5.251 .000 Region 12 second 1 (Constant) 13.459 .588 22.875 .000
school_type 1.613 .813 .067 1.984 .048 third 1 (Constant) 13.244 .532 24.898 .000
school_type .591 .700 .028 .844 .399 a. Dependent Variable: average gain in ten EGRA subtests b. School type (comparison group = 0; intervention group = 1)
RESULTS OF REGRESSION ANALYSIS FOR THE TOTAL SCOPE GAINS
Model Summary
Grade Model R R Square Adjusted R
Square
Std. Error of the
Estimate second
1 .367a .135 .114 2.76311 third
1 .373a .139 .121 2.90467 a. Predictors: (Constant), School type (comparison group = 0; intervention group = 1)
ANOVAb
Grade Model Sum of
Squares
df Mean Square F Sig.
second 1 Regression 49.975 1 49.975 6.546 .014a
Residual 320.661 42 7.635
Total 370.636 43
third 1 Regression 62.872 1 62.872 7.452 .009a
Residual 388.107 46 8.437
Total 450.979 47
a. Predictors: (Constant), School type (comparison group = 0; intervention group = 1) b. Dependent Variable: total SCOPE gains

104
Coefficientsa
Grade Model Unstandardized Coefficients Standardized
Coefficients
t Sig.
B Std. Error Beta second
1 (Constant) .368 .634
.581 .564
type_school 2.152 .841 .367 2.558 .014 third
1 (Constant) 1.000 .650
1.540 .131
type_school 2.321 .850 .373 2.730 .009 a. Dependent Variable: total SCOPE gains

105
ANNEX F. ADDITIONAL ANALYSES OF EGRA DATA
PRE-LITERACY SUBTESTS, GRADE 2
Table 49. Incorrect responses for EGRA pre-literacy skills subtests, Grade 2.
ALL GRADE 2 STUDENTS
Pretest mean (St. Error)
Posttest mean (St. Error)
Gain score (St. Error)
Percent of letters named incorrectly Intervention 3.9% (0.172) 3% (0.153) -1% (0.175) Comparison 5.6%ǂ (0.194) 4.7% (0.199) -0.9% (0.215) Percent of letters sounded incorrectly Intervention 5.7% (0.182) 4.8% (0.19) -0.9% (0.259) Comparison 6% (0.237) 5.8% (0.236) -0.3% (0.29)
ǂ The group’s pretest mean score is statistically higher compared with the other group’s score, at p<.01 level. *The group’s gain score is statistically significantly higher than the other group’s at p <.05 level **The group’s gain score is statistically significantly higher than the other group’s at p <.01 level ***The group’s gain score is statistically significantly higher than the other group’s at p <.001 level
Table 50.Incorrect responses for EGRA pre-literacy skills subtests, Grade 2, by gender.
Grade 2 GIRLS BOYS Pretest
mean (St. Error)
Posttest mean
(St. Error)
Gain score (St. Error)
Pretest mean
(St. Error)
Posttest mean
(St. Error)
Gain score (St. Error)
Percent of letters named incorrectly
Intervention 3.5% (0.237)
3% (0.256)
-0.5% (0.23)
4.4% (0.249)
2.9% (0.172)
-1.4% (0.261)
Comparison 4.8%ǂ (0.24)
4.3% (0.289)
-0.4% (0.289)
6.5%ǂ (0.304)
5.1% (0.27)
-1.4% (0.317)
Percent of letters sounded incorrectly
Intervention 5.2% (0.208)
4.9% (0.305)
-0.3%* (0.376)
6.1% (0.295)
4.7% (0.231)
-1.4% (0.357)
Comparison 4.5% (0.229)
5.3% (0.279)
0.8% (0.301)
7.7% (0.411)
6.3% (0.387)
-1.4% (0.502)
ǂ The group’s pretest mean score is statistically higher compared with the other group’s score, at p<.01 level. *The group’s gain score is statistically significantly higher than the other group’s at p <.05 level **The group’s gain score is statistically significantly higher than the other group’s at p <.01 level ***The group’s gain score is statistically significantly higher than the other group’s at p <.001 level
Table 51. Distribution of frequencies for letter naming subtest, disaggregated by gender, for Grade 2.
Grade 2 Percent of letters named correctly Zero 1 to 20% 21 to
40% 41 to 60%
61 to 80%
81 to 100% TOTAL
Intervention
Girls Pretest 1.8% 8.0% 21.4% 29.9% 29.9% 9.0% 100.0% Posttest 0% 2.1% 10.3% 16.8% 29.7% 41.1% 100.0%
Boys Pretest 5.8% 15.7% 24.6% 27.7% 15.2% 11.0% 100.0% Posttest 4.9% 2.9% 14.1% 25.6% 24.0% 28.5% 100.0%
Comparison Girls Pretest 12.2% 9.6% 29.5% 33.1% 9.8% 5.8% 100.0% Posttest 5.8% 9.4% 17.5% 22.5% 27.6% 17.3% 100.0%

106
Boys Pretest 7.3% 21.8% 25.4% 26.4% 16.1% 3.1% 100.0% Posttest 4.4% 12.2% 27.6% 22.9% 7.6% 25.3% 100.0%
Table 52. Distribution of frequencies for letter sounds subtest, disaggregated by gender, for Grade 2.
Grade 2 Percent of correct letter sounds Zero 1 to
20% 21 to 40%
41 to 60%
61 to 80%
81 to 100%
TOTAL
Intervention
Girls Pretest 3.2% 16.8% 51.7% 21.8% 4.1% 2.3% 100.0% Posttest 2.5% 7.6% 23.2% 41.6% 23.7% 1.4% 100.0%
Boys Pretest 6.3% 27.5% 44.7% 15.4% 2.7% 3.4% 100.0% Posttest 3.4% 13.5% 33.9% 40.8% 8.5% 0.0% 100.0%
Comparison Girls Pretest 23.8% 21.4% 39.7% 14.4% 0.0% .7% 100.0% Posttest 16.6% 14.2% 40.9% 23.8% 1.7% 2.9% 100.0%
Boys Pretest 27.1% 24.5% 35.9% 12.5% 0.0% 0.0% 100.0% Posttest 14.8% 21.9% 30.5% 25.0% 6.3% 1.6% 100.0%
Table 53. Distribution of frequencies for initial sound identification subtest, disaggregated by gender, for Grade 2.
Grade 2 Correct initial sound identification in 10 words Zero 1 to 2
words 2 to 4 words
4 to 6 words
6 to 8 words
8 to 10 words
TOTAL
Intervention
Girls Pretest 4.6% 4.1% 2.8% 9.9% 18.4% 60.1% 100.0% Posttest 2.1% 1.8% 1.6% 3.9% 12.9% 77.7% 100.0%
Boys Pretest 10.3% 4.3% 8.5% 13.7% 16.6% 46.5% 100.0% Posttest 3.4% 0.2% 2.7% 6.5% 16.6% 70.6% 100.0%
Comparison Girls Pretest 25.8% 5.3% 6.3% 10.8% 13.5% 38.3% 100.0% Posttest 15.4% 5.3% 2.2% 6.7% 18.3% 52.2% 100.0%
Boys Pretest 39.8% 6.3% 6.3% 9.9% 20.6% 17.2% 100.0% Posttest 22.7% 2.1% 3.4% 2.6% 25.3% 44.0% 100.0%
PRE-LITERACY SUBTESTS, GRADE 3
Table 54. Incorrect responses for five EGRA subtest, Grade 3.
ALL GRADE 3 STUDENTS
Pretest mean (St. Error)
Posttest mean (St. Error)
Gain score (St. Error)
Percent of letters named incorrectly Intervention 3.1% (0.128) 2% (0.117) -1.1% (0.151) Comparison 5.1%ǂ (0.229) 3.7% (0.202) -1.4% (0.202) Percent of letters sounded incorrectly Intervention 5.7% (0.14) 4.8% (0.152) -0.9% (0.186)*

107
Comparison 7%ǂ (0.21) 5.3% (0.199) -1.7% (0.274) ǂ The group’s pretest mean score is statistically higher compared with the other group’s score, at p<.01 level. *The group’s gain score is statistically significantly higher than the other group’s at p <.05 level **The group’s gain score is statistically significantly higher than the other group’s at p <.01 level ***The group’s gain score is statistically significantly higher than the other group’s at p <.001 level
Table 55. Incorrect responses for five EGRA subtest, Grade 3, by gender.
Grade 3 GIRLS BOYS Pretest
mean (St. Error)
Posttest mean
(St. Error)
Gain score (St. Error)
Pretest mean
(St. Error)
Posttest mean
(St. Error)
Gain score (St. Error)
Percent of letters named incorrectly
Intervention 2.4% (0.151)
1.3% (0.112)
-1.1% (0.135)
3.7%ǂ (0.196)
2.6% (0.191)
-1.1% (0.254)
Comparison 4.4%ǂ (0.291)
2.8% (0.177)
-1.6% (0.282)
5.9% (0.355)
4.6% (0.373)
-1.3% (0.288)
Percent of letters sounded incorrectly
Intervention 5.7% (0.215)
4.4% (0.227)
-1.3%* (0.288)
5.8% (0.184)
5.1% (0.204)
-0.7% (0.241)
Comparison 7.1%ǂ (0.302)
4.7% (0.236)
-2.4% (0.393)
6.8% (0.292)
5.9% (0.326)
-0.9% (0.376)
ǂ The group’s pretest mean score is statistically higher compared with the other group’s score, at p<.01 level. *The group’s gain score is statistically significantly higher than the other group’s at p <.05 level **The group’s gain score is statistically significantly higher than the other group’s at p <.01 level ***The group’s gain score is statistically significantly higher than the other group’s at p <.001 level
Table 56. Distribution of frequencies for letter naming subtest, disaggregated by gender, for Grade 3.
Grade 3 Percent of letters named correctly Zero 1 to 20% 21 to
40% 41 to 60%
61 to 80%
81 to 100%
TOTAL
Intervention
Girls Pretest 1.4% 2.2% 6.9% 29.8% 34.9% 24.9% 100.0% Posttest 0.0% 1.0% 4.0% 7.9% 22.1% 65.0% 100.0%
Boys Pretest 1.3% 4.4% 18.9% 37.0% 19.4% 19.0% 100.0% Posttest 1.0% 4.7% 2.2% 17.4% 33.4% 41.2% 100.0%
Comparison Girls Pretest 1.8% 5.5% 15.8% 23.7% 31.1% 22.1% 100.0% Posttest 0.0% 3.1% 11.8% 25.1% 19.9% 40.1% 100.0%
Boys Pretest 3.1% 10.5% 25.3% 30.6% 17.0% 13.6% 100.0% Posttest .3% 4.9% 14.8% 25.9% 23.8% 30.2% 100.0%
Table 57. Distribution of frequencies for letter sounds subtest, disaggregated by gender, for Grade 3.
Grade 3 Percent of correct letter sounds Zero 1 to
20% 21 to 40%
41 to 60%
61 to 80%
81 to 100%
TOTAL
Intervention
Girls Pretest 2.2% 19.7% 51.9% 20.5% 2.8% 3.0% 100.0% Posttest 2.2% 5.7% 32.8% 39.1% 18.2% 2.0% 100.0%
Boys Pretest 5.7% 21.9% 58.0% 11.1% 1.2% 2.0% 100.0% Posttest 0.0% 15.0% 37.6% 39.5% 6.4% 1.5% 100.0%
Comparison Girls Pretest 15.3% 10.4% 48.3% 20.3% 0.0% 5.7% 100.0%

108
Posttest 2.6% 10.1% 41.3% 35.8% 6.0% 4.2% 100.0% Boys Pretest 15.5% 22.2% 51.6% 5.2% 0.0% 5.5% 100.0%
Posttest 5.8% 21.2% 32.6% 35.5% 4.1% .9% 100.0%
Table 58. Distribution of frequencies for initial sound identification subtest, disaggregated by gender, for Grade 3.
Grade 3 Correct initial sound identification in 10 words Zero 1 to 2
words 2 to 4 words
4 to 6 words
6 to 8 words
8 to 10 words
TOTAL
Intervention
Girls Pretest 3.0% 2.6% 5.7% 6.5% 19.6% 62.6% 100.0% Posttest 2.0% 0.0% 1.6% 1.0% 7.9% 87.5% 100.0%
Boys Pretest 8.6% 5.6% 8.4% 12.5% 20.9% 44.0% 100.0% Posttest 4.4% 0.0% 4.9% 3.5% 19.4% 67.8% 100.0%
Comparison Girls Pretest 16.1% 3.6% 6.5% 11.5% 19.0% 43.2% 100.0% Posttest 4.2% 1.8% 2.1% 13.8% 17.4% 60.7% 100.0%
Boys Pretest 28.0% 5.8% 9.0% 8.7% 21.3% 27.1% 100.0% Posttest 12.5% 4.6% 5.2% 7.5% 20.3% 49.9% 100.0%
FLUENCY SUBTESTS, GRADE 2
Table 59. Incorrect responses for EGRA fluency subtests, Grade 2.
ALL GRADE 2 STUDENTS
Pretest mean (St. Error)
Posttest mean (St. Error)
Gain score (St. Error)
Percent of familiar words read incorrectly
Intervention 11.3% (0.315) 10.4% (0.299) -0.9% (0.335)
Comparison 10.2% (0.419) 10.8% (0.36) 0.5% (0.477)* Percent of invented words decoded Incorrectly
Intervention 8.8% (0.346) 8.7% (0.309) -0.1% (0.373)
Comparison 7.6% (0.388) 7% (0.289) -0.6% (0.439)
Percent of words read incorrectly in a passage
Intervention 8.1% (0.365) ǂ 6.1% (0.224) -2% (0.378)
Comparison 5.3% (0.294) 6.4% (0.272) 1.1% (0.38)***
ǂ The group’s pretest mean score is statistically higher compared with the other group’s score, at p<.001 level. *The group’s gain score is statistically significantly higher than the other group’s at p <.05 level **The group’s gain score is statistically significantly higher than the other group’s at p <.01 level ***The group’s gain score is statistically significantly higher than the other group’s at p <.001 level

109
Table 60. Incorrect responses for EGRA fluency subtests, Grade 2, by gender.
Grade 2 GIRLS BOYS Pretest
mean (St.
Error)
Posttest mean
(St. Error)
Gain score (St.
Error)
Pretest mean
(St. Error)
Posttest mean
(St. Error)
Gain score (St.
Error) Percent of familiar words read incorrectly
Intervention 11.5% (0.425)
10.4% (0.447)
-1.1% (0.512)
11.1% (0.463)
10.4% (0.399)
-0.7%* (0.436)
Comparison 10.2% (0.566)
10.3% (0.537)
0.1% (0.75)
10.4% (0.62)
11.3% (0.473)
1% (0.572)
Percent of invented words decoded Incorrectly
Intervention 8.7% (0.447)
8.4% (0.438)
-0.3% (0.479)
8.8% (0.526)
9.0% (0.437)
0.1% (0.569)
Comparison 6.9% (0.484)
7.8% (0.414)
0.9% (0.554)
8.4% (0.613)
6.2% (0.396)
-2.3%** (0.68)
Percent of words read incorrectly in a passage
Intervention 9.4%ǂ (0.637)
5.9% (0.318)
-3.5%*** (0.665)
6.9% (0.359)
6.4%ǂ (0.315)
-0.6%** (0.356)
Comparison 5.7% (0.475)
6.6% (0.38)
1% (0.589)
5% (0.334)
6.2% (0.389)
1.2% (0.469)
ǂ The group’s pretest mean score is statistically higher compared with the other group’s score, at p<.001 level. *The group’s gain score is statistically significantly higher than the other group’s at p <.05 level **The group’s gain score is statistically significantly higher than the other group’s at p <.01 level ***The group’s gain score is statistically significantly higher than the other group’s at p <.001 level
Table 61. Distribution of frequencies for familiar word reading subtest, disaggregated by gender, for Grade 2.
Grade 2 Percent of familiar words read correctly Zero 1 to 20% 21 to
40% 41 to 60%
61 to 80%
81 to 100%
TOTAL
Intervention
Girls Pretest 11.0% 4.6% 14.9% 17.4% 17.9% 34.2% 100.0% Posttest .9% 2.1% 7.1% 14.7% 8.7% 66.4% 100.0%
Boys Pretest 20.9% 8.8% 14.8% 20.4% 8.5% 26.5% 100.0% Posttest 9.9% 5.8% 7.0% 13.7% 15.2% 48.4% 100.0%
Comparison Girls Pretest 34.5% 7.0% 11.8% 11.6% 16.6% 18.6% 100.0% Posttest 20.4% 3.1% 12.7% 16.1% 5.8% 41.8% 100.0%
Boys Pretest 40.2% 6.5% 14.1% 13.6% 13.6% 12.0% 100.0% Posttest 24.0% 3.4% 12.8% 15.4% 8.9% 35.5% 100.0%
Table 62. Distribution of frequencies for invented words decoding subtest, disaggregated by gender, for Grade 2.
Grade 2 Percent of invented words decoded correctly Zero 1 to 20% 21 to
40% 41 to 60%
61 to 80%
81 to 100%
TOTAL
Intervention
Girls Pretest 12.4% 9.2% 6.2% 18.9% 28.5% 24.8% 100.0% Posttest 3.2% 1.1% 7.8% 11.5% 17.7% 58.7% 100.0%
Boys Pretest 26.0% 5.2% 17.9% 16.4% 17.3% 17.3% 100.0% Posttest 11.0% 4.7% 11.9% 18.7% 14.4% 39.3% 100.0%

110
Comparison Girls Pretest 42.9% 4.3% 6.3% 12.0% 17.6% 16.9% 100.0% Posttest 21.6% 6.3% 6.7% 10.8% 12.7% 41.8% 100.0%
Boys Pretest 45.9% 2.3% 7.0% 17.6% 9.8% 17.4% 100.0% Posttest 29.8% 2.3% 10.2% 10.7% 7.0% 39.9% 100.0%
Table 63. Distribution of frequencies for oral passage reading subtest, disaggregated by gender, for Grade 2.
Grade 2 Percent of words read correctly in an oral passage Zero 1 to
20% 21 to 40%
41 to 60%
61 to 80%
81 to 100%
TOTAL
Intervention
Girls Pretest 16.7% 5.5% 13.8% 13.5% 11.5% 39.0% 100.0% Posttest 6.7% 2.1% 7.3% 8.7% 11.7% 63.5% 100.0%
Boys Pretest 27.0% 7.4% 12.1% 20.7% 10.1% 22.7% 100.0% Posttest 11.9% 4.7% 9.7% 16.0% 7.6% 50.1% 100.0%
Comparison Girls Pretest 46.4% 3.1% 5.8% 8.2% 9.9% 26.7% 100.0% Posttest 23.6% 3.1% 13.7% 10.1% 5.0% 44.5% 100.0%
Boys Pretest 53.8% 4.2% 3.9% 13.0% 10.4% 14.8% 100.0% Posttest 30.6% 3.6% 11.4% 12.7% 8.1% 33.5% 100.0%
FLUENCY SUBTESTS, GRADE 3
Table 64. Incorrect responses for EGRA fluency subtests, Grade 3.
GRADE 3 STUDENTS
Pretest mean (St. Error)
Posttest mean (St. Error)
Gain score (St. Error)
Percent of familiar words read incorrectly
Intervention 10.5% (0.254) 9.2% (0.253) -1.3% (0.272)
Comparison 12.1%ǂ (0.409) 10.4% (0.371) -1.8% (0.359) Percent of invented words decoded Incorrectly
Intervention 9.4% (0.273) 8.1% (0.268) -1.3% (0.306)**
Comparison 10.6% (0.423) 7.8% (0.328) -2.8% (0.38) Percent of words read incorrectly in a passage
Intervention 6.6% (0.209) 4.6% (0.174) -2.1% (0.212)
Comparison 6.2% (0.286) 5% (0.246) -1.1% (0.311)* ǂ The group’s pretest mean score is statistically higher compared with the other group’s score, at p<.01 level. *The group’s gain score is statistically significantly higher than the other group’s at p <.05 level **The group’s gain score is statistically significantly higher than the other group’s at p <.01 level ***The group’s gain score is statistically significantly higher than the other group’s at p <.001 level

111
Table 65. Incorrect responses for five EGRA subtest, Grade 3, by gender.
Grade 3 GIRLS BOYS Pretest
mean (St.
Error)
Posttest mean
(St. Error)
Gain score (St.
Error)
Pretest mean
(St. Error)
Posttest mean
(St. Error)
Gain score (St.
Error) Percent of familiar words read incorrectly
Intervention 10.3% (0.412)
7.7% (0.335)
-2.6% (0.4)
10.7% (0.314)
10.4% (0.364)
-0.2% (0.366)
Comparison 12% (0.552)
8.2% (0.447)
-3.8% (0.472)
12.3% (0.609)
12.8% (0.58)
0.5% (0.522)
Percent of invented words decoded Incorrectly
Intervention 8.8% (0.405)
7.9% (0.421)
-0.8% (0.494)
10% (0.369)
8.3% (0.344)
-1.7% (0.379)
Comparison 10.6% (0.518)
7.9% (0.43)
-2.7%** (0.487)
10.6% (0.684)
7.7% (0.502)
-2.9% (0.592)
Percent of words read incorrectly in a passage
Intervention 5.9% (0.331)
3.8% (0.252)
-2% (0.364)
7.2% (0.262)
5.2% (0.238)
-2.1% (0.241)
Comparison 5.4% (0.366)
4.1% (0.292)
-1.3% (0.371)
7% (0.443)
6.1% (0.399)
-0.9%* (0.513)
ǂ The group’s pretest mean score is statistically higher compared with the other group’s score, at p<.001 level. *The group’s gain score is statistically significantly higher than the other group’s at p <.05 level **The group’s gain score is statistically significantly higher than the other group’s at p <.01 level ***The group’s gain score is statistically significantly higher than the other group’s at p <.001 level
Table 66. Distribution of frequencies for familiar word reading subtest, disaggregated by gender, for Grade 3.
Grade 3
Percent of familiar words read correctly Zero 1 to 20% 21 to
40% 41 to 60%
61 to 80%
81 to 100% TOTAL
Intervention
Girls Pretest 5.5% 0.0% 2.8% 9.7% 19.6% 62.5% 100.0% Posttest 1.4% 2.6% 0.0% 4.0% 10.1% 82.0% 100.0%
Boys Pretest 11.6% 1.5% 17.9% 16.7% 7.6% 44.7% 100.0% Posttest 2.9% 2.7% 6.0% 10.4% 16.7% 61.4% 100.0%
Comparison Girls Pretest 14.3% 3.6% 9.4% 7.3% 12.0% 53.4% 100.0% Posttest 10.7% 1.0% 4.2% 7.6% 4.5% 72.0% 100.0%
Boys Pretest 19.5% 9.3% 7.3% 14.0% 14.2% 35.8% 100.0% Posttest 9.9% 4.4% 9.9% 8.7% 8.4% 58.7% 100.0%
Table 67. Distribution of frequencies for invented words decoding subtest, disaggregated by gender, for Grade 3.
Grade 3
Percent of invented words decoded correctly Zero 1 to 20% 21 to
40% 41 to 60%
61 to 80%
81 to 100%
TOTAL
Intervention
Girls Pretest 7.3% 0.8% 2.6% 9.3% 19.9% 60.2% 100.0% Posttest 3.2% 0.0% 1.8% 2.0% 9.3% 83.8% 100.0%
Boys Pretest 9.3% 6.6% 13.2% 18.4% 18.0% 34.6% 100.0% Posttest 5.1% 0.0% 7.8% 15.3% 14.6% 57.1% 100.0%

112
Comparison Girls Pretest 17.4% 1.0% 8.3% 9.6% 11.2% 52.3% 100.0% Posttest 12.0% 1.0% 1.8% 6.3% 17.2% 61.7% 100.0%
Boys Pretest 25.9% 4.9% 7.8% 11.6% 16.6% 33.1% 100.0% Posttest 17.4% 0.0% 5.8% 8.1% 21.2% 47.4% 100.0%
Table 68. Distribution of frequencies for oral passage reading subtest, disaggregated by gender, for Grade 3.
Grade 3 Percent of invented words decoded correctly Zero 1 to 20% 21 to
40% 41 to 60%
61 to 80%
81 to 100%
TOTAL
Intervention
Girls Pretest 6.5% 0.0% 5.9% 3.8% 13.4% 70.4% 100.0% Posttest 2.6% 0.0% 1.8% 2.4% 7.7% 85.6% 100.0%
Boys Pretest 11.6% 6.7% 10.5% 15.5% 5.6% 50.1% 100.0% Posttest 6.7% 0.7% 7.6% 8.6% 9.9% 66.4% 100.0%
Comparison Girls Pretest 23.0% 0.0% 2.6% 11.7% 7.6% 55.1% 100.0% Posttest 13.6% 0.0% 2.9% 5.0% 6.8% 71.8% 100.0%
Boys Pretest 26.5% 4.1% 8.1% 8.4% 11.6% 41.3% 100.0% Posttest 15.4% 0.0% 11.6% 4.7% 7.8% 60.5% 100.0%
COMPREHENSION AND WRITING SUBTESTS, GRADE 2
Table 69. Distribution of frequencies for oral passage reading comprehension subtest, disaggregated by gender, for Grade 2.
Table 70. Distribution of frequencies for listening comprehension subtest, disaggregated by gender, for Grade 2.
Grade 2 Number of listening comprehension questions answered correctly
Grade 2 Number of reading comprehension questions answered correctly Zero One Two Three Four Five Six Total
Intervention
Girls Pretest 64.7% 11.3% 12.2% 4.1% 3.0% 4.6% 0.0% 100.0% Posttest 49.5% 10.8% 12.7% 15.4% 4.8% 3.0% 3.7% 100.0%
Boys Pretest 83.4% 8.7% 3.4% 1.8% 2.7% 0.0% 0.0% 100.0% Posttest 62.2% 17.0% 10.1% 4.7% 2.7% 1.6% 1.8% 100.0%
Comparison Girls Pretest 83.4% 9.9% 1.0% 2.4% 1.7% 1.7% 0.0% 100.0% Posttest 67.1% 17.8% 6.3% 6.5% 2.4% 0.0% 0.0% 100.0%
Boys Pretest 94.5% 2.9% 2.6% 0.0% 0.0% 0.0% 0.0% 100.0% Posttest 82.3% 5.7% 10.2% .8% 0.0% 1.0% 0.0% 100.0%

113
Zero One Two Three Four Five TOTAL
Intervention
Girls Pretest 69.5% 15.4% 7.8% 4.1% 2.3% 0.9% 100.0% Posttest 46.0% 24.6% 18.9% 5.3% 1.4% 3.9% 100.0%
Boys Pretest 74.0% 18.8% 3.6% 2.5% 0.0% 1.1% 100.0% Posttest 52.3% 25.9% 13.1% 4.7% 1.4% 2.7% 100.0%
Comparison Girls Pretest 82.0% 11.5% 6.5% 0.0% 0.0% 0.0% 100.0% Posttest 71.6% 18.5% 8.9% 1.0% 0.0% 0.0% 100.0%
Boys Pretest 86.8% 10.9% 2.3% 0.0% 0.0% 0.0% 100.0% Posttest 80.5% 12.8% 5.5% 1.3% 0.0% 0.0% 100.0%
Table 71. Distribution of frequencies for dictation subtest, disaggregated by gender, for Grade 2
COMPREHENSION AND WRITING SUBTESTS, GRADE 3
Table 72. Distribution of frequencies for oral passage reading comprehension subtest, disaggregated by gender, for Grade 3.
Grade 2 Percent of dictation points Zero 25% or less 25-50% 50-75% 75-100% TOTAL
Intervention
Girls Pretest 27.8% 20.7% 34.5% 13.1% 3.9% 100.0% Posttest 8.0% 10.8% 31.3% 20.2% 29.7% 100.0%
Boys Pretest 39.2% 23.5% 24.2% 13.0% 0.0% 100.0% Posttest 18.2% 19.3% 29.8% 23.5% 9.2% 100.0%
Comparison Girls Pretest 41.0% 30.9% 23.5% 1.7% 2.9% 100.0% Posttest 16.1% 32.2% 25.0% 21.4% 5.3% 100.0%
Boys Pretest 57.8% 27.3% 13.3% 1.6% 0.0% 100.0% Posttest 35.4% 28.4% 19.3% 16.1% 0.8% 100.0%
Grade 3 Number of reading comprehension questions answered correctly Zero One Two Three Four Five Six Total
Intervention
Girls Pretest 46.4% 15.0% 11.2% 14.8% 4.7% 5.9% 2.0% 100.0% Posttest 28.7% 19.4% 15.0% 16.0% 12.9% 6.9% 1.0% 100.0%
Boys Pretest 63.9% 17.6% 8.6% 1.2% 5.4% 3.2% 0.2% 100.0% Posttest 53.6% 18.4% 8.6% 4.2% 7.1% 7.4% 0.7% 100.0%
Comparison Girls Pretest 66.2% 12.2% 6.2% 5.2% 6.2% 3.9% 0.0% 100.0% Posttest 37.3% 16.2% 9.9% 14.1% 11.0% 7.3% 4.2% 100.0%
Boys Pretest 73.6% 10.4% 6.4% 2.6% 3.2% 3.8% 0.0% 100.0% Posttest 56.1% 13.7% 14.0% 7.8% 1.5% 7.0% 0.0% 100.0%

114
Table 73. Distribution of frequencies for listening comprehension subtest, disaggregated by gender, for Grade 3
Grade 3
Number of listening comprehension questions answered correctly Zero One Two Three Four Five TOTAL
Intervention
Girls Pretest 58.0% 23.9% 6.5% 9.1% 2.6% 0.0% 100.0% Posttest 47.7% 18.5% 17.0% 9.1% 2.0% 5.7% 100.0%
Boys Pretest 63.6% 25.3% 8.1% 1.5% 1.5% 0.0% 100.0% Posttest 54.9% 25.5% 10.6% 6.8% 0.5% 1.7% 100.0%
Comparison Girls Pretest 70.5% 19.3% 4.2% 5.0% 1.0% 0.0% 100.0% Posttest 51.9% 26.8% 8.3% 8.6% 2.1% 2.3% 100.0%
Boys Pretest 70.6% 15.7% 10.8% 2.9% 0.0% 0.0% 100.0% Posttest 63.4% 14.8% 15.4% 3.5% 1.5% 1.5% 100.0%
Table 74. Distribution of frequencies for dictation subtest, disaggregated by gender, for Grade 3
Grade 3
Percent of dictation points Zero 25% or less 25-50% 50-75% 75-100% TOTAL
Intervention
Girls Pretest 8.9% 15.8% 28.4% 35.5% 11.4% 100.0% Posttest 2.8% 6.7% 26.3% 29.2% 35.0% 100.0%
Boys Pretest 24.3% 28.8% 20.9% 23.1% 2.9% 100.0% Posttest 2.7% 18.6% 30.6% 35.6% 12.5% 100.0%
Comparison Girls Pretest 25.0% 22.4% 30.7% 16.7% 5.2% 100.0% Posttest 7.0% 20.6% 22.5% 30.3% 19.6% 100.0%
Boys Pretest 26.2% 29.4% 20.3% 19.2% 4.9% 100.0% Posttest 17.4% 13.7% 33.1% 19.8% 16.0% 100.0%