4 ANNEX B: METHODOLOGICAL AND EXPLANATORY NOTES
59
275 4 ANNEX B: METHODOLOGICAL AND EXPLANATORY NOTES
-
Upload
khangminh22 -
Category
Documents
-
view
0 -
download
0
Transcript of 4 ANNEX B: METHODOLOGICAL AND EXPLANATORY NOTES

275
4
ANNEX B: METHODOLOGICAL
AND EXPLANATORY NOTES

276
The ‘Taxation trends’ report assesses the tax system from a number of angles. The examination of
the tax structures by tax type and by level of government illustrates the relative importance of the
different tax instruments used in raising revenue and the distribution of autonomous financial
resources among the constituent elements of the state apparatus, respectively. The breakdown into
taxes on consumption, labour and capital allows an assessment of the manner in which the tax
burden is distributed among the different factors. In addition, environmental taxes and property
taxes are specifically examined, as they are subject to increased attention/scrutiny/special focus.
The implicit tax rates in turn measure the actual or effective average tax burden levied on different
types of economic income or activities.
This methodological note explains the methods of, and the reasoning behind, the calculation of the
various ratios presented in the report; approaching them in the order in which they appear in each
country table in Part 2 and in the tables in the Annex A of the report. Given that Sections A and B
(‘Tax structure by tax type’ and ‘Tax structure by level of government’) follow European System of
National and Regional Accounts (ESA 2010) classifications (30), a simple description of the aggregates
and the data sources is provided. Sections C to E (‘Tax structure by economic function’,
‘Environmental taxes’ and ‘Property taxes’) and Section F (‘Implicit tax rates’) present statistics
developed by the European Commission Directorate-General (DG) for Taxation and Customs Union
specifically for this publication, so the reasoning will be delved into in greater detail, with attention
given to both their theoretical and their practical limitations. This note concludes with an in-depth
discussion of the approaches used in calculating the split of personal income tax according to its
sources, a process critical to the creation of meaningful statistics for Sections C and F.
Data sources
The primary cut-off date for most of the data in this report was December 2021. This concerns the
national accounts data and the more disaggregated tax data submitted to Eurostat (the national tax
list or NTL) that were used for the classification of revenue according to economic functions and to
determine the level of environmental and property taxes. The data for the denominator of the ITRs
on capital and corporate income in Part 1 were downloaded on February 2022. In a very few cases,
estimates at the detailed level have been used if statistics were not available; in those cases, the
estimates were either supplied by Member State administrations or computed using proxies.
Although all Member State authorities have provided disaggregated data on their tax revenue (the
NTL), their level of detail varies. Information on the level of disaggregation used for the computation
of the indicators for each Member State can be found on the web pages of DG Taxation and Customs
Union and on Eurostat’s ‘Statistics Explained’ page. While the former presents data as it was used in
the calculations of the report, the latter is continuously updated along with updated national
accounts transmissions.
Data coverage
This publication presents time series of tax revenue (including taxes levied on behalf of the
institutions of the European Union) and tax rates for the EU Member States, Iceland and Norway.
The seven EU outermost regions — Martinique, Guadeloupe, French Guiana and Réunion, Saint-
Barthélemy, Saint-Martin, Madeira, the Azores and the Canary Islands — are covered in the tables
(30) European Commission (2013b).

277
presenting tax revenue data as part of their countries. However, they are not covered in the tables
presenting tax rates.
Data coverage and reliability have generally improved over time. The coverage of the implicit tax
rate on capital is patchy, however, as the computation is quite demanding in terms of the required
level of detail in national accounts data. For this and other reasons, the comprehensive calculation
of the ITR on capital has been temporarily suspended, but work is in progress to update the indicator
in the near future. Nevertheless, an indicative analysis of the ITR on capital and the ITR on corporate
income can be found in Part 1, along with some notes regarding the limitations of the indicators.
Ranking
In all the tables of Annex A, a ranking is given whereby the Member State with the highest ratio is
listed with number 1, the second with number 2 and so on. The ranking refers to the order of the
Member States for each specific ratio and only includes those Member States for which 2020 data
are available in the respective table. The rankings are also shown in the country tables in Part 2 of
the report. No ranking is given if more than 10 % of the data points are missing or not available.
Averages
This report computes weighted averages for three groups of countries: the EU as a whole (EU-27)
and the euro area (EA-19). The average computed for the taxes received by the State Government
refers to the Länder in Austria and Germany, the gewesten en gemeenschappen/régions et
communautés in Belgium and comunidades autónomas in Spain. The EU aggregates for state
government and social security funds are calculated over all Member States.
Ratios to GDP
Throughout the report many revenue indicators are presented as a percentage of GDP (gross
domestic product). The GDP data used for the report was extracted from Eurostat in November 2021
to be in line with the NTL data used in this report.
Totals, shares and ‘amounts assessed but unlikely to be collected’
Starting in the 2021 edition of the Taxation Trends Report, revenue have been adjusted in Section A
of the country chapters for countries reporting the item ‘Capital transfers (representing taxes
assessed but unlikely to be collected)’ (ESA code D.995). In Section C (indicators by economic
function code) the adjustment was already taking place at the level of the NTL. These adjustments
are also reflected in the equivalent indicators in Annex A. Table 27 of Annex A lists the countries for
which the component D.995 is provided (and the magnitude of this item as a share of GDP).
According to ESA, taxes and social contributions should be recorded on an accrual basis. Two
methods can be used.
(a) ‘Time-adjusted’ cash. The cash is attributed to when the activity that generated the tax liability took place or when the amount of taxes was determined in the case of some income taxes. This adjustment may be based on the average time difference between the activity and cash receipt.
(b) A method based on declarations and assessments. In this case an adjustment needs to be made for amounts assessed or declared but unlikely to be collected. These amounts have to be eliminated from government revenue, either by using a tax-specific

278
coefficient based on past experience and future expectations or by recording a capital transfer for the same adjustment (ESA 2010 code D.995) to the relevant sectors.
For the countries that (partially) use the assessment method of accrual recording (see above), a
capital transfer can be recorded from general government to other sectors of the economy. This
represents taxes and social contributions assessed but unlikely to be collected (D.995), which have
to be deducted from tax revenue in order to produce data consistent with those of countries that
use the time-adjusted cash method or that combine a method based on assessments and
declarations with coefficients. This was already the case for the main indicator on Tax burden but
not for the breakdown indicators (Indirect, Direct and Social contributions). The values of the
subcomponents of D.995 have been subtracted from the revenue of the equivalent indicators. When
data didn’t have enough granularity, a proportional reduction in relation to the revenue has been
implemented. Except in the case of Belgium where it was possible to map the components to the
specific indicators. This change in the methodology improves the accuracy of the indicators and the
cross-country comparability.
Sums by economic function do not add up for Belgium and Portugal due to the non-inclusion of
taxes — other than own resources — paid to EU institutions.
Payable tax credits
A further issue concerning the measurement of tax revenue relates to the treatment of ‘payable’ tax
credits. ‘Payable tax credits’ are credited against a tax liability, and only need to be paid out to
beneficiaries if they exceed the tax liability. A payable tax credit can be conceptually split into two
components: one component (the ‘tax expenditure component’) is used to decrease the tax liability;
the other (the ‘transfer component’) is the remainder left over if the total tax credit amount exceeds
the tax liability, and is paid directly to a recipient as a benefit payment.
A dedicated section on this subject can be found in Part 1 and in Section G of this methodological
annex. The effects on tax indicators of the two methods of treating payable tax credits — the ‘gross’
approach and the ‘split’ approach — are estimated in Part 1. The data used in this section come
predominantly from Eurostat, but in some cases OECD/national finance ministry data may be cited.
Payable tax credit data can also be found in section G of the country tables (see Part 2 of the report).

279
Section A: Tax structure by tax type
Definitions
‘Total taxes (including compulsory actual social contributions)’ are defined in this report as taxes on
production and imports (D.2), current taxes on income and wealth (D.5), capital taxes (D.91) and
compulsory actual social contributions (D.611c + D.613c), minus ‘Capital transfers (representing
taxes assessed but unlikely to be collected)’ (D.995). Indirect taxes, direct taxes and social
contributions add up to the total of taxes and compulsory actual social contributions received by the
general government and the institutions of the European Union (S13_S212).
‘Taxes (excluding social contributions)’ are defined as ‘total taxes (including compulsory actual social
contributions)’ minus actual compulsory social contributions.
‘Indirect taxes’ are defined in this report as taxes linked to production and imports (code D.2 in the
ESA 2010 system), i.e. as compulsory levies on producer units in respect of the production or
importation of goods and services or the use of factors of production. They include VAT, import
duties, excise duties and other specific taxes on services (transport, insurance etc.) and on financial
and capital transactions. They also include taxes on production (D.29) defined as ‘taxes that
enterprises incur as a result of engaging in production’, such as professional licences, taxes on land
and building and payroll taxes.
Indirect taxes are defined as the sum of the following ESA 2010 tax categories.
VAT: value added-type taxes (D.211).
Taxes and duties on imports excluding VAT (D.212).
Taxes on products, except VAT and import duties (D214).
Other taxes on production (D.29).
‘Direct taxes’ are defined as current taxes on income and wealth (D.5) plus capital taxes including
taxes such as inheritance or gift taxes (D.91). Income tax (D.51) is a subcategory that includes
personal income tax (PIT) and corporate income tax (CIT), along with capital gains taxes.
Direct taxes are defined as the sum of the following ESA categories.
Personal income tax: taxes on individual or households income including holding gains (D.51a + D.51c1).
CIT: taxes on the income or profits of corporations including holding gains (D.51b + D.51c2).
Other income and capital taxes: other taxes on income corresponding to other taxes on holding gains (D.51c3), taxes on winnings from lottery or gambling (D.51dD) and other taxes on income n.e.c. (D.51e), taxes on capital defined as other current taxes (D.59) and capital taxes (D.91).
‘Actual compulsory social contributions’ are paid by employers and employees on the basis of a work
contract, or by self- and non-employed persons. They can be split into three subcategories.
Compulsory employers’ actual social contributions (D.611c).
Compulsory employees’ social contributions (D.613ce).
Compulsory social contributions by self- and non-employed persons (D.613cs and D.613cn).
As mentioned above (in epigraph: “Totals, shares and ‘amounts assessed but unlikely to be
collected’”), indicators in this section have been adjusted, deducting amounts assessed but unlikely

280
to be collected when necessary. In the countries reporting data on the item ‘Capital transfers
(representing taxes assessed but unlikely to be collected)’ (ESA code D.995).
Different indicators of tax burden
Some indicators of tax burden take into account all actual social contributions (e.g. ESA 2010 code
D.611), which include both compulsory and voluntary contributions. Voluntary contributions vary in
their purpose (e.g. the purchase of ‘extra years’ for pensions and the wish to complete a gap in the
social contributions due to years worked abroad) and may vary in the degree to which they are
voluntary in a real economic sense. These voluntary contributions are excluded in the definition of
tax burden used in this report. In addition, employers’ ‘imputed social contributions’ (D.612), which
relate to payments made directly by the employer to their employees or former employees, are
excluded from the indicators in this report. Two other items — households’ social contribution
supplements (D.614) and social insurance scheme service charges (D.61sc) — are also excluded.
Households’ social contribution supplements (D.614) and social insurance scheme service charges
(D.61sc) represent respectively the property income attributable to social insurance policyholders,
which is reinvested in the scheme, and the output (administrative cost) of operating the social
insurance scheme. In both cases, there are counterpart entries in the national accounts. These items
are only non-zero when there are social insurance schemes (funded schemes) classified in general
government. A noticeable but small impact of these items is only present for Sweden in current
data.
The definition employed in this report thus corresponds to indicator 2 of the four indicators of
general government and European Union levies issued by Eurostat (see Box A.1).
GRAPH A.1: SENSITIVITY ANALYSIS: ROLE OF IMPUTED SOCIAL CONTRIBUTIONS AND
VOLUNTARY ACTUAL SOCIAL CONTRIBUTIONS 2020
(% of GDP)
Source: Eurostat (online data code: gov_10a_taxag)
In practice, imputed social contributions relate to governments, which do not pay actual
contributions for their employees but nevertheless guarantee them a pension upon retirement;
imputed social contributions represent the contributions the government should pay to a pension
fund in order to provide a pension of an equivalent amount to its employees. Imputed social
contributions are not therefore based on actual transactions. Including imputed social contributions
in the definition of compulsory levies would allow greater comparability over time and across
countries, given that some governments make actual contributions for their employees while others

281
simply pay social benefits to their employees as their entitlement arises. Ultimately, it is found that,
while including imputed social contributions (along with households’ social contribution
supplements and social insurance scheme service charges) in the definition of total taxes would
result in a non-negligible level shift, yielding an increase in the tax ratio for the EU-27 average of
around 0.9 percentage points (see Graph A.1), the development of the ratios over time remain
relatively stable. The inclusion of imputed social contributions does however result in a different
ranking of Member States by the size of their tax burden.
BOX A.1: INDICATORS OF GENERAL GOVERNMENT AND EUROPEAN UNION LEVIES
In 2001, the Eurostat National Accounts Working Group defined four taxation indicators for
general government and European Union levies, progressing from a narrower to a broader
definition:
Taxes on production and imports (D.2)
+ Current taxes on income, wealth, etc (D.5)
+ Capital taxes (D.91)
[- Capital transfers from general government to relevant sectors representing taxes and social
contributions assessed but unlikely to be collected (D.995)]
+ Compulsory actual social contributions (D.611c+D613c) payable to the social security funds
subsector (S.1314)
= INDICATOR 1 (Total taxes and compulsory social security contributions)
+ Compulsory actual social contributions (D.611c+D613c) payable to the central government
(S.1311), state government (S.1312), and local government (S.1313) subsectors as
employers
= INDICATOR 2 (Total taxes and compulsory actual social contributions payable to general
government, including those for government as an employer)
+ Imputed social contributions (D.612) payable to general government as an employer
+ Households' social contribution supplements (D.614)
- Social insurance scheme service charges (D.61sc)
= INDICATOR 3 (Total taxes and compulsory social contributions payable to general
government, including those for government as an employer)
+ Voluntary actual social contributions payable to the general government sector (S.13)
(D.611v+D.613v)
= INDICATOR 4 (Total taxes and social contributions payable to general government,
including voluntary contributions)
Source: Eurostat.
For the purposes of this report, voluntary actual social contributions are assumed to be zero,
whenever they cannot be distinguished from compulsory contributions.
It should also be noted that in some countries non-tax compulsory payments may be made to
private funds or schemes outside general government, and that these are not included in the
indicators of tax burden. However, it should be noted that compulsory, unrequited (something-for-
nothing) payments can only be received by general government (or EU institutions in some cases),
necessitating a rerouting through general government in certain cases, which fulfils the national
accounts purpose of bringing out the economic substance of economic transactions.

282
BOX A.2: SOCIAL CONTRIBUTIONS IN ESA 2010
Actual Social contributions
D.611 Employers’ actual social contributions
D.611c Compulsory employers’ actual social contributions D.611v Voluntary employers’ actual social contributions
D.613 Households’ actual social contributions
D.613c Compulsory households’ actual social contributions D.613ce Compulsory employees’ actual social contributions D.613cs Compulsory actual social contributions by the self-employed D.613cn Compulsory actual social contributions by the non-employed
D.613v Voluntary households’ actual social contributions Imputed Social contributions
D.612 Employers’ imputed social contributions

283
Section B: Tax structure by level of government
Definitions
‘Total taxes received by the general government and the institutions of the EU’ (institutional sector
S.13_S.212 in ESA 2010) are broken down as taxes received by:
central government (S.1311);
state (region) government for federal states (S.1312), only applicable for Belgium, Germany, Spain and Austria;
local government (S.1313);
social security funds (S.1314), not applicable for Ireland, Malta and Norway (please see below);
EU institutions (S.212).
The amount of first and second own resources recorded in the accounts of the EU institutions for a
particular country is influenced by its geographic location and its infrastructure (e.g. large ports).
This affects the overall tax burden, the level of indirect taxation and the level of taxes on
consumption. In addition, Belgium and Portugal report some revenue for PIT and social contributions
for the EU institutions (excluded from taxes by economic function).
It should be understood that data on tax revenue collected should be used with some caution in the
context of analysing the issue of government centralisation or decentralisation. In particular, the
breakdown by level of government may be different depending on whether one looks at tax-receipts
data or government expenditure data.
The organisation of the tax system may also have an effect on this breakdown: for example in
Estonia the institutional structure dealing with pension contributions is part of central government,
which partly explains the comparatively low share of the social security funds subsector.
A further issue that should be noted, which affects the classification of revenue to the EU institutions
(S.212), concerns banking levies collected by Member States and transferred to the Single Resolution
Fund (SRF). It was decided by the Committee of Monetary Financial and Balance of Payments
Statistics that this was an EU tax and that the 2015 contributions raised by the national resolution
authority/national resolution fund to be transferred to the SRF in 2016 should be recorded as an EU
tax in 2015, leading to deductions as tax refunds from the EU taxes to be paid in the period from
2016 to 2023. If a Member State had used all or part of the contributions for national resolution
measures in 2015, the 2015 contributions were still to be considered as an EU tax for the full amount
and the resolution measures are deemed to be carried out on behalf of the EU. However, not all
Member States have implemented this provision yet in their reported statistics, and there are
therefore differences between countries in the level of government classification of the related
revenue.
Country-specific information
In Hungary, since 2008, total personal income tax (D.51a+D.51c1) for the local government (S.1313)
is accounted for by the general government (S.1311) and thereafter transferred under D.7 to S.1313.
This method of recording results in a lower estimate of local government tax revenue since 2008
compared with those for the period up to 2007.

284
For Belgium, two alternative allocations of tax revenue by subsector are shown: ‘ultimately received
tax revenue’ and tax revenue as transmitted under ESA 2010 rules to Eurostat. For the purpose of
compiling the EU and euro area aggregates, the national accounts definition is used. For the rankings
and in the country table the indicators shown are based in the ‘ultimately received tax revenue’
concept. For Belgium use is made of additional data (NBB.Stat: current transfer of fiscal receipts —
withheld to fund other subsectors (see https://stat.nbb.be/) in order to provide ‘ultimately received
taxes’ by subsectors of general government.
In Estonia, the figure for local government includes only land tax and other local taxes. However,
local governments receive 70 % of personal income tax receipts (in addition to the 1.1 % share of
revenue) as a transfer from central government. Personal income tax is classified under central
government as local governments do not set the rate.
In Ireland, in 2014 the sector classification of the Social Insurance Fund (SIF) was reviewed as part of
ESA 2010 implementation. As it did not meet the institutional unit criteria it was reclassified from
S.1314 to S.1311. Subsequently, as only one other Member State did not present S.1314, Ireland was
requested by Eurostat in the 2019 Excessive Deficit Procedure (EDP) Dialogue Visit to reflect on
reporting the SIF in S.1314 in order to harmonise practices with other Member States. The Central
Statistics Office (CSO) in Ireland is in agreement with Eurostat that presenting the S.1314 subsector
would facilitate harmonisation and comparability with other Member States. With the September
2021 EDP transmission, and corresponding quarterly reporting, Ireland has implemented the
subsector with a time series beginning in Q1 2017. This change has no impact on the aggregate
data.”
285
Section C: Tax structure by type of tax base
Data sources
The calculation of ratios in Section C of the country tables in Part 2 is done on the basis of specific
assumptions and more detailed revenue data than the one published by Eurostat. Eurostat
supplements its database with the National Tax Lists (NTLs) supplied by Member States to Eurostat.
The allocation of taxes to a tax-base category (consumption, labour, capital), also called the
‘economic function code’, is applied to each tax contained in the NTL.
The detailed revenue data and the economic function code allocation for each country and each tax
are available on the ‘Economic Analysis’ website of DG Taxation and Customs Union.
In addition to the supplementary data, some specific splits/allocations have been assumed.
A split of the personal income tax into four subgroups is used.
Compulsory social contributions of the non-employed (considered as part of labour) and the self-employed (considered as part of capital), if not provided separately as D.613cs and D.613cn, are split using estimated shares. For some countries the split is either directly available in the NTLs or provided by Member States’ authorities. Where no statistics were available, the share paid by the non-employed was assumed to be negligible.
Methodology and breakdown of taxes by type of tax base
Taxes on consumption, labour and capital add up to the total of taxes received by general
government (31). The separation of taxes by type of tax base inevitably leads to simplifications and
somewhat hybrid categories. A number of borderline cases and approximations had to be taken into
account to arrive at a final classification of taxes. Tax data are not always recorded in sufficient detail
to identify individual taxes and allocate them to the corresponding tax-base categories. In addition,
some specific national features required special treatment. The degree of decomposition provided
by national statistical offices makes it sometimes difficult to identify subcategories. General
guidelines for the allocation of the taxes are given in Boxes C.1 to C.5 below. However, exceptions
are made if necessary to reflect the true nature of a tax. Borderline cases, which mainly regard the
split between taxes on stocks of capital and on consumption, are discussed with Member States.
A key methodological problem when it comes to classifying tax by type of tax base is that some taxes
relate to multiple sources of income. This holds most notably for the personal income tax. Therefore,
a method was developed to break down personal income tax revenue, in most cases using
unpublished data supplied by the national tax administrations. A breakdown of the personal income
tax according to four sources of taxable income (labour, capital, self-employment income, and social
transfers and pensions) is carried out by Member States’ authorities according to a country-specific
methodology (the ‘PIT split’). Member States use data sets of individual taxpayers (Belgium,
Denmark, Germany, France, Ireland, Luxembourg, Latvia, Malta, Netherlands, Poland, Slovenia,
Finland and Sweden) or income class data based on the data set of individual taxpayers (Bulgaria,
(31) Sums by main economic function may however not add up due to: (a) the non-inclusion of taxes — other than own
resources — paid to EU institutions in the case of Belgium and Portugal; and (b) the non-attribution of ‘revenue assessed
but unlikely to be collected’ to economic function bases for those countries using D.995.

286
Greece, Spain, Italy, Cyprus, Lithuania,) or tax receipts from withholding and income tax statistics
with certain corrections (Czechia, Estonia, Hungary, Austria, Portugal, Romania) (32).
Several Member States were not able to provide full time-series coverage for all calendar years. In
these cases, a trend has been assumed using simple linear interpolations or the fractions were
assumed to remain constant, i.e. the 2020 split was considered equal to that of 2019. Tables F.1 to
F.4 give all the details of the PIT split provided by each Member State. In some cases the number of
estimates for the PIT split still falls short of the ideal, which to a limited extent affects the accuracy
of the distribution of taxes by type of tax base and, therefore, of the implicit tax rates (ITRs).
Additional details are given in a later section of this methodological note.
Although, as a rule, taxes are classified under one single category of tax base, in some specific cases
a breakdown of revenue has also been carried out for taxes other than the PIT. For example, local
business taxes often relate to one or more sources of economic income and are allocated over the
different categories of tax base where possible. In those cases, examples of which are mentioned
below, estimates from Member States have been used to distribute their revenue across the
different groups of tax base.
The revenue from the Italian regional tax on productive activities (IRAP), for example, has been distributed between the categories ‘labour’ and ‘capital’, using data communicated by the Ministry of Finance. The tax is charged on public administrations (state, regions, municipalities, etc.), corporations, partnerships, self-employment and non-commercial bodies. The tax base is the difference between items classified in the production value and items classified in the production cost, as defined in the Civil Code. For the public administrations, the tax base is equal to the total employees’ compensation and, therefore, fully attributed to the ‘employed labour’ component. The part paid by the private bodies is divided between labour and capital by estimating the labour cost from data provided by withholding agents in the tax returns and further calculating the production value net of the estimated labour cost, thus determining the capital share of IRAP.
The French local business tax (taxe professionnelle) has been fully allocated to the category ‘stocks of capital’, as it is mostly levied on buildings and real estate, and the French government reformed the tax by phasing out the payroll component from the tax base.
In Italy, the earnings and the compulsory social contributions paid by self-employed persons working under the ‘co.co.co’ regime (coordinated and continuous collaboration) are transferred from the category ‘capital (income of self-employed)’ to ‘labour’ (partly to employers and employees).
Taxes on consumption
Taxes on consumption are defined as taxes levied on transactions between final consumers and
producers and on the final consumption goods. In the ESA classification these can be identified as
the following categories (see Box C.1).
Value-added-type taxes (D.211).
Taxes and duties on imports excluding VAT (D.212).
(32) The methodology utilised by Member States to arrive at the PIT split is described in more detail in a separate section of
this annex (see ‘Methods used to split the revenue from personal income tax’ in Section F).

287
Taxes on products except VAT and import duties (D.214), which include excise duties. Those taxes paid by companies on products used for production have been excluded from the category of consumption taxes, whenever the level of detail enabled their identification (33). Some categories have been allocated to capital, such as stamp taxes (D.214b), when they could be identified as related to the stock exchange market or real-estate investment. Taxes on financial and capital transactions (D.214c), along with some export duties and monetary compensatory amounts on exports (D.214k), have also been recorded as capital taxes.
Other taxes on production (D.29). These are typical borderline cases since this category includes several taxes or professional licences paid by companies ‘as a result of engaging in production’. Total wage bill and payroll taxes (D.29c) have been classified as a tax on labour; taxes on land, buildings and other structures (D.29a) have been classified as taxes on the stock of capital. However, taxes on international transactions (D.29d), taxes on pollution (D.29f) and the under-compensation of VAT (flat-rate system) (D.29g) have been considered as consumption taxes.
Some taxes defined as current taxes (D.5) in ESA 2010 such as poll taxes, expenditure taxes or payments by households for licences have been attributed to consumption since they are expenditures made by households to obtain specific goods and services.
BOX C.1: DEFINITION OF TAXES ON CONSUMPTION
D.211 Value added type taxes
D.212 Taxes and duties on imports excluding VAT
D.214 Taxes on products except VAT and import duties,
less:
D.214b Stamp taxes
D.214c Taxes on financial and capital transactions
D.214k Export duties and monetary compensatory amounts on exports
From D.29 Other taxes on production:
D.29d Taxes on international transactions
D.29f Taxes on pollution
D.29g Under-compensation of VAT (flat rate system)
From D.59 Other current taxes:
D.59b Poll taxes
D.59c Expenditure taxes
D.59d Payments by households for licences
Taxes on labour
Taxes on employed labour income
Taxes on employed labour comprise all taxes, directly linked to wages and mostly withheld at
source, paid by employers and employees, including actual compulsory social contributions (see
Box C.2). They include compulsory actual employers’ social contributions (D.611c) and payroll taxes
(D.29c), compulsory social contributions paid by employees (D.613ce) and the part of personal
income tax (D.51a) that is related to earned income. The personal income tax is typically levied on
different sources of income: labour income, but also social benefits, including pensions, dividend
(33) A possible breakdown of car registration taxes between those paid by companies and those paid by households would only
be available for some countries. Hence, to avoid different treatment in different Member States, all revenue from car
registration taxes has been attributed to consumption.

288
and interest income and self-employment income. The notes in Section F explain how taxpayers’
data have been used to allocate the personal income tax revenue across different sources of income.
Under the definition of taxes on employed labour income adopted in this report, the categories
‘personal income tax’ and ‘social contributions’ are used in a wide sense including all other taxes
that are susceptible to increase the cost of labour. Therefore, the recorded amount of ‘personal
income tax’ in the Nordic countries not only consists of central government income tax, but also
includes the state income tax, or municipality income tax, and sometimes also church tax. In France,
the generalised social contribution (CSG) and the contribution for the reduction in the debt of the
social security institutions (CRDS) are partially booked as income tax on labour income. In Austria,
the ‘contributions to chambers’ and the ‘promotion residential building’ are also partially booked as
tax on labour income. In Italy, part of the revenue from the IRAP tax, which is levied on a measure of
value added by enterprises, has been allocated to labour and ‘employers’ social contributions’ in
particular (and also included in the denominator of the ITR on labour). In Belgium and Portugal,
personal income taxes and social contributions paid by EU civil servants to the EU institutions were
excluded from the calculations of labour taxes, although they are included in total tax revenue.
BOX C.2: DEFINITION OF TAXES ON LABOUR
Employed labour
From D.51 Taxes on income:
D.51a+D.51c1 Taxes on individual or household income including holding gains (part raised
on labour income)
From D.29 Other current taxes:
D.29c Total wage bill and payroll taxes
From D.611 Employers' actual social contributions:
D.611c Compulsory employers' actual social contributions
From D.613 Households' actual social contributions:
D.613ce Compulsory employees' actual social contributions
Non-employed labour
From D.51 Taxes on income:
D.51A+D.51c1 Taxes on individual or household income including holding gains (part raised
on social transfers and pensions)
From D.613 Households' actual social contributions:
D.613cs+D.613cn Compulsory actual social contributions by self- and non-employed
persons (part paid by social transfer recipients)
Taxes on non-employed labour income
The category ‘labour — non-employed’ comprises all taxes and compulsory social contributions
raised on the transfer income of non-employed persons, where these could be identified. This
transfer income includes social transfers that are paid by the state (e.g. unemployment, invalidity
and healthcare benefits) and benefits from old-age pension schemes (both state and occupational
pension schemes). In this report, taxes on pension benefits are allocated to non-employed labour
income and in certain cases to capital income. Section F gives more detail on how Member States
use various estimation methods based on tax-return data in order to split tax revenue across
different sources of income.

289
Taxes on the income of the self-employed
The question arose whether part of the self-employed income should be treated as a remuneration
of labour and whether the related taxes should be included in taxes on labour. The best compromise
between economic rationale and data availability was to consider self-employment income to be
income from capital: self-employed income is genuinely an entrepreneurial income, and the self-
employed take the risk of incurring losses when exercising their activity. Personal income taxes,
along with social contributions of the self-employed are, therefore, allocated to the capital income
subcategory for the self-employed. This assumption includes the part of self-employment income
equivalent to the remuneration of self-employment own labour. For some Member States, this
assumption does not reflect the situation of some of the self-employed, whose economic status or
income does not significantly differ from those of wage earners. In Italy, for example, the National
Statistical Office (ISTAT) provides official estimates of the percentages of ‘mixed income’ that can be
attributed to labour and capital.
Taxes on capital
Capital is defined broadly, including physical capital, intangibles, and financial investment and
savings (see Box C.3). Capital taxes include taxes on business income in a broad sense: not only taxes
on profits but also taxes and levies that could be regarded as a prerequisite for entering into
production/earning profit, such as the real-estate tax, as long as owners rather than tenants are
taxed, or the recurrent motor-vehicle tax paid by enterprises. In their empirical study Desai and
Hines (2001) confirmed that these indirect taxes also influence the investment decisions of American
multinational firms. They also include taxes on capital stocks of households or their transaction (e.g.
on real estate). A distinction is drawn between taxes on capital and business income, and taxes on
capital stock.

290
BOX C.3: DEFINITION OF TAXES ON CAPITAL
Capital and business income taxes:
From D.51- Taxes on income:
D.51a+D.51c1 Taxes on individual or household income including holding gains (part
paid on capital and self-employed income)
D.51b+D.51c2 Taxes on the income or profits of corporations including holding gains
D.51c3 Other taxes on holding gains
D.51d Taxes on winnings from lottery and gambling
D.51e Other taxes on income n.e.c.
From D.613- Households actual social contributions:
D.613cs Compulsory actual social contributions by self-employed
Taxes on stocks (wealth):
From D.214- Taxes on products, except VAT and import taxes:
D.214b Stamp taxes
D.214c Taxes on financial and capital transactions
D.214k Export duties and monetary compensatory amounts on exports
From D.29- Other taxes on production:
D.29a Taxes on land, buildings or other structures
D.29b Taxes on the use of fixed assets
D.29e Business and professional licences
D.29h Other taxes on production n.e.c.
From D.59- Other current taxes:
D.59a Current taxes on capital
D.59f Other current taxes on capital n.e.c.
D.91 Capital taxes
‘Taxes on capital and business income’ that economic agents earn or receive from domestic
resources or from abroad includes taxes on income or profits of corporations (Box C.4), taxes on
income and social contributions of the self-employed, plus personal income tax raised on the capital
income of households (rents, dividends and other property income) (Box C.5). In practice this is
mainly the personal income tax paid on dividend and interest income and entrepreneurial activity
(part of D.51a + D.51c1) and CIT (D.51b + D.51c2), along with other taxes on holding gains
(D.51c3) (34). This category is further subdivided into ‘Taxes on the income of corporations’ (using
the ‘Taxes on the income or profits of corporations including holding gains’) and ‘Taxes on the
income of households’, which comprises the remaining subheadings of ‘Capital and business income
taxes’.
BOX C.4: DEFINITION OF TAXES ON THE INCOME OF CORPORATIONS
Taxes on the income of corporations
From D.51-Taxes on income:
D.51b+D.51c2 Taxes on the income or profits of corporations including holding gains
(34) In the case of France also some taxes under D29, could be classified as taxes on the income of corporations.

291
BOX C.5: DEFINITION OF TAXES ON THE CAPITAL AND BUSINESS INCOME OF HOUSEHOLDS
Taxes on capital and business income of households:
From D.51 Taxes on income:
D.51a+D.51c1 Taxes on individual or household income including holding gains (part paid on
capital and self-employed income)
D.51c3 Other taxes on holding gains
D.51d Taxes on winnings from lottery and gambling
D.51e Other taxes on income n.e.c.
From D.613 Households' actual social contributions:
D.613cs Compulsory actual social contributions by self-employed persons
‘Taxes on capital stock’ include the wealth tax (D.59a), capital taxes (D.91) including the inheritance
tax (D.91a), the real-estate tax (D.29a) and taxes on the use of fixed assets (D.29b). Professional and
business licences (D.29e) and some taxes on products (from the category D.214), and possible other
taxes and levies that could be regarded as a prerequisite for entering into production if not allocated
elsewhere, would fit in this category even if the tax base is not the stock of wealth.

292
Section D: Environmental taxes
The definition of an environmental tax in Environmental taxes — A statistical guide (European
Commission, 2013a) refers to a tax ‘whose tax base is a physical unit (or a proxy of a physical unit) of
something that has a proven, specific negative impact on the environment, and which is identified in
ESA as a tax’ (35). Details on the classification of environmental taxes can also be found in that
document. While the motivation for introducing the taxes — fiscal or environmental — is not
decisive for the classification, its impact on costs and prices is. As the statistical guide states: ‘The
definition puts emphasis on the effect of a given tax in terms of its impact on the cost of activities
and the prices of products that have a negative effect on the environment. The environmental effect
of a tax comes primarily through the impact it has on the relative prices of products and on the level
of activities, in combination with the relevant price elasticities.’
Environmental taxes comprise taxes on energy, transport, pollution and resources, but value-added-
type taxes are excluded because they are levied on all products. Environmental taxes represent a
subcategory of indirect taxes, in general consumption taxes, but may sometimes also represent
taxes on the capital stock.
In line with the definition of the statistical guideline, in this publication environmental taxes are
divided in three groups: energy taxes, transport taxes (excluding fuel) and a category combining
pollution and resource taxes. For the purposes of this report, the following should be noted.
Energy taxes include taxes on energy products used for both transport and stationary purposes (denoted ‘E’ in the NTL). The most important energy products for transport purposes are petrol and diesel. Energy products for stationary use include fuel oils, natural gas, coal and electricity. Note that CO2 taxes are included under energy taxes (rather than under pollution taxes), as it is often not possible to identify them separately in tax statistics. A further disaggregation is provided for energy taxes, namely a category giving the tax revenue stemming from the transport use of fuels. Transport fuel taxes include only those taxes that are levied on the transport use of fuels/energy products (including CO2 taxes) and hence form a subgroup of energy taxes. The derivation of these data is explained under the heading ‘Estimation of revenue from transport fuel taxes’ in the next subsection.
Transport taxes (excluding fuel) mainly include taxes related to the ownership and use of motor vehicles (denoted ‘T’ in the NTL). Taxes on other transport equipment (e.g. planes) and related transport services (e.g. duties on charter or schedule flights or air passenger tax) are also included here, when they conform to the general definition of environmental taxes. The transport taxes may be ‘one-off’ taxes related to imports or sales of the equipment or recurrent taxes such as an annual road tax. As indicated by the title, taxes on petrol, diesel and other transport fuels are not included here but are included under energy taxes.
The last group of pollution/resource taxes includes two groups of taxes (denoted ‘P’ and ‘RS respectively in the NTL). Pollution taxes are taxes on measured or estimated emissions to air and water, management of solid waste and noise — with the exception of CO2 taxes, which, as discussed above, are included under energy taxes. The second group — resource taxes — includes any tax linked to extraction or use of a natural resource. This means that licences paid for hunting, fishing and the like are classified as resource taxes, because these activities deplete natural resources. Note that as of the 2013 edition of this publication, taxes on the extraction of oil or gas are no longer booked as resource taxes, in line with the statistical guideline.
(35) See also Regulation (EU) No 691/2011 on European environmental economic accounts, which uses the same definition.

293
The taxes included as environmental taxes and their respective categories are listed in the NTL for
each Member State on the webpage of DG Taxation and Customs Union and on the Eurostat
website.
Estimation of revenue from transport fuel taxes
Transport fuel taxes are defined as taxes on energy products used for transport purposes only. This
category aims at representing the tax burden falling on transport energy products, i.e. transport
fuels.
However, the NTLs alone are generally not detailed enough to enable this breakdown of tax revenue
between transport and non-transport uses of fuel and energy taxes, and auxiliary sources detailing
revenue by fuel type and energy uses by fuel types have to be used.
The first estimation strategy is to rely on national sources. All countries have been asked to provide
data on tax revenue from mineral oils used in transport only (such as tax revenue from diesel or LPG
used for transport purposes only — or just the aggregate of overall mineral oil taxes from transport
use), and to indicate whether the data are recorded on an accrual or a cash basis. When necessary,
use is made of existing Eurostat and DG Taxation and Customs Union databases to complement the
information provided or substitute for the missing information (see Box D1).
BOX D.1: AUXILIARY SOURCES TO ATTRIBUTE FUEL TAXES REVENUE TO TRANSPORT
AND STATIONARY USES
The following data sources are available:
The National Tax Lists (NTL) which provide overall fuel tax revenue The European Commission Excise duty rates which collect information on (1) revenue and
(2) rates from “taxes on consumption (excise duties and similar charges) other than VAT
on energy products and electricity”. This information is supplied by the EU member states, but not necessarily following ESA2010 methodology. Revenue data are classified according to eight different product categories and two summary categories. Excise rates are given
following the same classification, further broken down according to sector and uses. I) Leaded petrol/Lead substitute petrol II) Unleaded petrol
III) Diesel IV) LPG and Methane V) Heavy fuel oil VI) Sum of I)-IV): VII) Total revenue from all mineral oils VIII) Natural gas IX) Coal and Coke
X) Electricity XI) Overall sum: Total revenue from all energy products & electricity
Eurostat public database: The Eurostat public database provides data on environment and energy, and in particular the energy balances from supply through transformation to final energy consumption and uses of energy products, including various oil products (nrg_cb_oil). Among the final energy uses, the final energy consumption for transport covers all transport sectors (rail, air and water) for all transport use (business, private).
Revenue from transport fuel taxes are estimated using the following principles and sources. Excise
duty (ED) data collected by the European Commission are used as a source of data on tax revenue
from mineral oil duties. Eurostat energy balances provide transport and non-transport uses in final
energy consumption. Combining consumption uses with excise rates (also available from the ED
database), revenue from transport and non-transport uses can be estimated. This proportion is then
applied to the relevant taxes in NTLs.

294
The following additional assumptions are needed for the calculations:
Data on final energy consumption uses tonnes (or toe or TJ) as a measure of the volume of liquid components, whereas excise duties for petrol and diesel are defined as euro/litre. For diesel/gas oil the ‘typical’ conversion factor suggested by Eurostat of 1 185l/1 000 kg is used.
Moreover, usually more than one tax rate is in place for a product category used for transport purposes. Tax rates on transport diesel are often differentiated according to the diesel’s sulphur or biodiesel content; LPG used for public transport is often taxed at reduced rates or tax exempt altogether. If multiple tax rates do not permit the application of the general formula ‘tax rate × amount of transport fuel in litres’, a different approach is used. Transport tax revenue are derived as the difference between total tax revenue according to the product category given by the ED data, namely (III) Diesel or (IV) LPG and methane, and the non-transport tax revenue. Calculating non-transport tax revenue by applying the general formula proved feasible as non-transport tax rates are usually less differentiated.
As the ED data do not necessarily follow the ESA 2010 methodology used in the NTL, further
adjustments have to be made to derive the amount of transport fuel taxes according to the ESA
2010 methodology. First, the shares of transport fuel taxes in mineral oil taxes and in overall energy
taxes in ED data are calculated. This is achieved by the division of the estimated transport fuel taxes
by (VI) Total revenue from all mineral oils and by (X) Total revenue from all energy products and
electricity, respectively. The resulting shares are then applied to the respective categories in the NTL.
Preferably, the ED share of transport fuel taxes to mineral oil taxes is applied to the NTL category of
mineral oil tax revenue, as the concepts for mineral oil taxes as given in the NTL and in the ED data
are usually closely linked. The application of this share hence gives a proxy of ‘tax revenue stemming
from the transport use of fuels’ according to the ESA 2010 methodology, which is the one published
in the report. In case of unavailability of the mineral oil taxes category in the NTL, the share of
transport fuel taxes to energy taxes resulting from the ED data is applied to energy taxes in the NTL.
In some cases it was necessary to apply the split between transport fuel tax revenue and other tax
revenue as provided by the Member States — mostly in cash data — to the respective category in
the NTL, to give an approximation following the ESA 2010 methodology.
While the estimation principles are comparable across countries, the extent to which the different
sources have been used varies a lot across countries and over time. The full estimation method
described above has been used when the only information available is fuel tax revenue from the
NTL. For other countries, total revenue attributed to transport fuel taxes were directly provided by
the ministry of finance. Others provided the directly usable share of the fuel tax revenue that are to
be attributed to transport fuel taxes. When data are provided on a cash basis, the share of total fuel
taxes on a cash base is calculated and applied to ESA 2010 accrual data available in the NTLs (36). In
other cases a breakdown of excise revenue was also provided by type of fuel. Each fuel was then
attributed to transport or stationary uses (possibly broken down with the help of energy balances)
(36) Although the difference is likely to be small for excise and consumption taxes.

295
Section E: Property taxes
The classification of taxes on property applied in this report follows, with some adjustments, the
approach employed in the OECD classification of taxes (2017). That approach distinguishes six
categories of property taxes: (1) recurrent taxes on immovable property; (2) recurrent taxes on net
wealth; (3) estate, inheritance and gift taxes; (4) taxes on financial and capital transactions; (5) other
non-recurrent taxes on property; and (6) other recurrent taxes on property.
The following table (Box E.1) comparing the System of National Accounts (SNA 2008) and the
European System of Accounts (ESA 2010) was used, within the current report distinguishing only
between ‘Recurrent taxes on immovable properties’ — category (1) in the above OECD
classification — and ‘Other property taxes’ for all the other five categories of property taxes
distinguished by the OECD.
BOX E.1: TAXES ON PROPERTY — CLASSIFICATION
In this publication the overall level of property taxes is thus obtained by aggregating the relevant
revenue of the following ESA categories: D.214b, D.214c, D.29a, D.59a, D.91a and D.91b. The total is
split between recurrent taxes (D.29a + D.59a (excluding wealth taxes)) on immovable property and
other property taxes (D.214b, c + D.59a + D.91a, b). D.59a appears in the two groups of property
taxes; wealth-related taxes are excluded from recurrent property taxes and included only in the
second group ‘Other property taxes’. Given the broad definition of the statistical categories some
additional adjustments were made by national statistical offices: exclusion of recurrent taxes on
motor vehicles, roads, boats, farm contributions, stamp taxes on alcohol, tobacco (from D.214b, C)
and other exclusions from D.29a and D.59a in a number of countries (Belgium, Czechia, France,
Croatia, Italy, Cyprus, Latvia, Netherlands, Austria, Portugal, Romania, Slovenia and Slovakia). The
detailed list of taxes included in the computation of property taxes for every country is available in
the NTL published online.
Possible discrepancies between results published by OECD and those presented in this report could
stem from different allocations of tax payments in the two classifications — OECD and NTL (ESA
2010) — and from different time points of data reporting.
OECD classification 2008 SNA 2010 ESA ESA2010 classification Taxation Trends report 4000 Taxes on property Taxes on property
4100 Recurrent taxes on immovable property
Recurrent taxes on immovable property 4110 Households D.59-8.63(a) D.59a Current taxes on capital
4120 Other D.29-7.97(b) D.29a Taxes on land, buildings or other structures
4200 Recurrent net wealth taxes
Other property taxes
4210 Individual D.59-8.63b D.59a Current taxes on capital
4220 Corporations D.59-8.63b D.59a Current taxes on capital
4300 Estate, inheritance and gift taxes
4310 Estate and inheritance taxes D.91-10.207b D.91a Taxes on capital transfers
4320 Gift taxes D.91-10.207b D.91a Taxes on capital transfers
4400 Taxes on financial and capital transactions
D.59-7.95d; D.214b, c
Stamp taxes
D.29-7.96e Taxes on financial and capital transactions
4500 Other non-recurrent taxes on property D.91-10.207a D.91b Capital levies
4600 Other recurrent taxes on property D.59-8.63c D.59a Current taxes on capital

296
Section F: Implicit tax rates and average effective tax rate
In this section of the methodological annex, information is given on the methodology followed for
calculating implicit tax rates, for splitting personal income tax revenue and for estimating average
effective tax rates.
The implicit tax rates are defined for each tax-base category defined in Section C. They are
computed as the ratio of total tax revenue of the category (consumption, labour, and capital) to a
proxy of the potential tax base defined using the production and income accounts of the national
accounts.
Data sources
National accounts data used in the construction of the denominator are extracted from the Eurostat
public database, with further national accounts data acquired for calculating the bases of the implicit
tax rates on capital and capital income. The numerators are taken from the ratios calculated in
Section C. In some cases, limitations in data availability may affect or prevent the calculation of the
ITR. The ITR on capital is the most complex of the ITRs and suffers from problems related to patchy
data availability. As a result, figures for the ITR on capital, an indicative analysis of the ITR on capital
and the ITR on corporate income can be found in Part 1, along with some notes regarding the
limitations of the indicators. A description of the existing methodology for the capital ITRs is
reproduced later in this section.
Methodology
The tax revenue relative to GDP statistics presented in this survey can be described as macro
backward-looking tax-burden indicators. In Annex A, Tables 39 to 78, the taxes raised on different
types of tax base are shown as percentages of total GDP and of total taxation. However, the
consideration of tax revenue as a proportion of GDP provides limited information, as no insight is
given as to whether, for example, a high share of capital taxes in GDP is a result of high tax rates or a
large capital tax base. These issues are tackled through the presentation of ITRs that do not suffer
from this shortcoming.
ITRs measure the actual or effective average tax burden directly or indirectly levied on different
types of tax base or activities that could potentially be taxed by Member States. Note, however, that
the final economic incidence of the burden of taxation can often be shifted from one taxpayer to
another through the interplay of demand and supply. A typical example is when firms increase sales
prices in response to a hike in CIT; to a certain extent the firms’ customers end up bearing part of the
increased tax burden. The ITRs cannot take these effects into account, as this can only be done
within a general equilibrium framework. Despite this limitation, ITRs allow the monitoring of tax-
burden levels over time (enabling the identification of shifts between the taxation of different types
of tax base, e.g. from capital to labour) and across countries. Alternative measures of effective tax
rates exist, which, using tax legislation, simulate the tax burden generated by a given tax, and can be
linked to individual behaviour. However, these ‘forward-looking’ effective tax rates do not allow the
comparison of the tax burden implied by different taxes; nor do they facilitate the identification of
shifts in the taxation of different economic income and activities.
The comparability of these indicators has been enhanced by the improved consistency and
harmonised computation of ESA national accounts data. However, this improvement can only be
fully exploited by using the same denominator for all countries and not accounting for country-
specific peculiarities in national tax legislation. For capital, an average tax rate is estimated by

297
dividing all taxes on capital by a broad approximation of the total capital and business income for
both households and corporations. For labour, an average tax rate is estimated by dividing direct
and indirect taxes on labour paid by employers and employees by the total compensation of
employees. The attractiveness of the approach lies in the fact that all elements of taxation are
implicitly taken into account, such as the combined effects of statutory rates, tax deductions and tax
credits. They also include the effects due to the composition of income, or companies’ profit-
distribution policies. Furthermore, the effects of tax planning, along with the tax relief available (e.g.
tax bases that are exempted below a certain threshold, non-deductible interest expenses), are also
taken implicitly into account. The advantage of the ITRs in capturing a wide set of influences on
taxation is accompanied by difficulties in interpreting the trends when a complete and precise
separation of the different forces of influence is not possible (37). In addition, any timing differences
that arise because of lags in tax payments and business-cycle effects may give rise to significant
volatility in these measures. In short, they represent a reduced model of all variables influencing
taxation, tax rates and bases.
Implicit tax rate on consumption
The ITR on consumptions aims to measure the taxes of consumption divided by the tax base. Due to
data limitations, the tax base can be only approximated. Previous versions of this methodology have
been trying to improve the estimations of the tax base.
The ITR on consumption (38) is defined, (see Box F.1), as all consumption taxes divided by:
the final consumption expenditure of private households on the economic territory (domestic concept)
intermediate consumption and social transfer in kind by the government and Non Profit Institutions Serving Households (NPISH). For more technical details on this approximation to the tax base check Box F.2 in this section.
However, some questions remain open. One of the key questions is the exclusion of government
wages from the denominator. According to OECD (39): “many government services such as education
and healthcare are also exempt from VAT when they are provided by the private sector. Therefore,
an exclusion of government wage consumption from the consumption tax base overstates the ITRs
on consumption in countries where these labour-intensive services are publicly provided, compared
to those where they are privately provided”. Another open question is the treatment of real state, as
it has an impact in the numerator but with the current definition is not part of the denominator.
(37) OECD (2000, 2002).
(38) The definition of this indicator has been updated for the 2021 edition of the Taxation Trends Report. Before the 2020
edition the denominator it was composed only by the consumption from private households. In the 2020 edition the
denominator included also consumptions from government and NIPSH, and excluding compensation of government
employees.
(39) OECD (2020).

298
BOX F.1: DEFINITION OF THE IMPLICIT TAX RATE ON CONSUMPTION
Implicit tax rate on consumption
(ESA2010)
Taxes on consumption /
(1)+(2)+(3)+(4)+(5)
Numerator: see Box C.1 – taxes on consumption
Denominator:
(1) P31_S.14dom: Final consumption expenditure of households on the economic territory
(domestic concept) [nama_10_fcs]
(2) P2_S13: Intermediate consumption of general government [gov_10a_main]
(3) P2_S15: Intermediate consumption of non-profit institutions serving households (NPISH)
[nasa_10_nf_tr]
(4) D632_S13: Social transfers in kind of general government [gov_10a_main]
(5) D632_S15: Social transfers in kind of non-profit institutions serving households (NPISH)
[nasa_10_nf_tr]
BOX F.2: APPROXIMATING THE TAX BASE OF THE NON-MARKET ECONOMY
One way to look at the economy in national accounts is to split it between market and non-market producers. Of the market producers, only the household sector (S.14) can have final consumption
expenditure (P3). The final consumption expenditure of S.14 is valued at purchasers prices (i.e. the price the consumer actually pays) and therefore includes taxes (less subsidies). Corporations (S.11 and S.12) only can have intermediate consumption (P.2) of goods and services needed as input for their production processes. For non-market producers (sectors S.13 and S.15), the calculation of final consumption expenditure is a bit more difficult as there is neither a direct user nor a market price for the services provided. Therefore, for non-market producers, two conventions are applied in national
accounts. The first convention is that non-market producers consume their own output (P.1); minus revenue from market output (P.11); minus revenue from non-market output (P.131); minus output allocated to own account capital formation (P.12) as well as social transfers in kind purchased from market producers (D.632):
𝑃.3 ≡ 𝑃.1 −𝑃.11−𝑃.12−𝑃.131+𝐷.632
The second convention is that the production (P.1) of non-market producers is valued as the sum
of its production costs. Production costs are: compensation of employees (D.1); intermediate consumption (P.2); consumption of fixed capital (national accounts’ measure of depreciation, P.51c); taxes on production, expenditure (D.29p); minus subsidies on production, revenue (D.39r) and plus net operating surplus (B.2n, normally zero or small):
𝑃.1 ≡ 𝐷.1+𝑃.2+𝑃.51𝑐+𝐷.29𝑝−𝐷.39𝑟+𝐵.2𝑛 With this in mind, the definition of P.3 for non-market producers can be written as:
𝑃.3 ≡ 𝐷.1+𝑃.2+𝑃.51𝑐+𝐷.29𝑝−𝐷.39𝑟+𝐵.2𝑛 −𝑃.11−𝑃.12−𝑃.131+𝐷.632.
For the calculation of the tax base it is necessary to eliminate the items for which no taxes on consumption are paid. No taxes on consumption are paid on:
D.1 = compensation of employees, P.51c = consumption of fixed capital (national accounts’ measure of depreciation), D.39r = subsidies on production, revenue, B.2n = net operating surplus (also small),
D.29p = taxes on production, expenditure, P.12 = own account capital formation.
Therefore, the items above should not enter the tax base approximation for both S.13 and S.15. For the remaining items (P.2, D.632, P.11 and P.131) it might be possible that taxes are levied on these items. Of these items, the revenue stemming from market output (P.11) or non-market output (P.131) are irrelevant for calculating the tax base as these are not part of government
consumption. Taxes paid on these goods and services (for example timber sold by state forests) are ultimately born by the households in their purchase (at purchaser’s price) of the final good or service. As such, these are already included in the final consumption expenditure of S.14. Therefore, only P.2 and D.632 of non-market producers are relevant for the denominator of the ITR on consumption. Despite gross capital formation (P.51g) of sectors S.13 and S.15 may be

299
subject to VAT, a big share of P.51g for those sectors is not taxed, therefore, this part of the potential tax base is not reflected in the denominator.
In the analytical section of the report (Part 1), the ITR on consumption is split into four categories
(only the numerator is broken down; the denominator remains the same for each subcategory). The
identification of the revenue is done on the basis of the NTL. The four categories are as follows.
VAT. The share of the ITR on consumption relating to VAT (D.211-type taxes).
Energy. This subcategory includes all consumption taxes on energy listed in the NTL. These cover mainly excise duties on mineral oils, duties on electricity or similar taxes. The definition may differ slightly from the one used for Tables 65 and 66 in Annex A, as the latter may also include energy taxes levied on capital or labour.
Tobacco and alcohol. These include all excise duties on alcohol and tobacco products listed in the NTL.
Residual. All remaining consumption taxes are booked in this subcategory. They are obtained as a difference from the total.
Implicit tax rate on labour
The ITR on employed labour is a summary measure that approximates an average effective tax
burden on labour income in the economy, and is defined as the sum of all direct and indirect taxes
and employees’ and employers’ social contributions levied on employed labour income divided by
the total compensation of employees working in the economic territory (see Box F.2). The ITR on
labour is calculated for employed labour only (so excluding the tax burden falling on social transfers,
including pensions). Direct taxes are defined as the revenue from personal income tax that can be
allocated to labour income. Indirect taxes on labour income, currently applied in some Member
States, are taxes such as payroll taxes paid by the employer. The compensation of employees is
defined as the total remuneration, in cash or in kind, payable by an employer to an employee in
return for work done. It consists of gross wages (in cash or in kind), and thus also the amount paid as
social insurance contributions and wage-withholding tax. In addition, employers’ social contributions
(including imputed social contributions), along with contributions to private pensions and related
schemes, are included. Personal income taxes and social contributions paid by EU civil servants to
the EU institutions are not included. The compensation of employees is thus a broad measure of the
gross economic income from employment before any charges are withheld.
BOX F.3: DEFINITION OF THE IMPLICIT TAX RATE ON LABOUR
Implicit tax rate on employed
labour
Direct taxes, indirect taxes and compulsory actual social
contributions paid by employers and employees, on
employed labour income /
(D.1 + D.29c)
Numerator: see Box C.2 – Taxes on Labour: Employed labour
Denominator:
D.1 Compensation of employees [nama_10_gdp],
D.29c Wage bill and payroll taxes [gov_10a_taxag]
A fundamental methodological problem in calculating the ITR on labour and capital is that the
personal income tax is typically broad based and relates to multiple sources of income (i.e.
employed labour, self-employed labour, income from capital and income in the form of social

300
benefits and pensions received). The note at the end of this section on the PIT split explains the
calculations for estimating the part of the revenue from personal income tax that can be attributed
to labour income and other income sources.
In this report the ITR on labour is one of two indicators used to analyse effective tax rates on labour
income, the second being the ‘tax wedge’. These two indicators are based on different
methodological approaches, and each has its own advantages and disadvantages.
As explained above, the calculation of the ITR on labour involves relating realised tax revenue to
macroeconomic variables in the national accounts. It gives an overall picture of the taxation of all
workers, and is useful for analysing the allocation of the tax base between labour, capital and
consumption. It is based on real data that reflect all of the factors that determine the amount of tax
paid, including the overall effects of deduction, exemptions, credits and taxpayers’ behaviour, along
with the effects of non-compliance. However, because it is a broad indicator, it does not allow the
exploration of important differences in effective tax rates due to the personal circumstances of
taxpayers, such as their income level or their household composition (40). Moreover, the ITR on
labour does not disentangle cyclical, structural and policy elements, which implies that the observed
changes may only partially reflect discretionary tax policy measures. For example, strong economic
growth may decrease the importance of allowances and tax credits, and therefore increase the
average tax rate or move taxpayers into higher personal income tax brackets, resulting in higher real
tax payments (bracket creep).
The second indicator used in the report to analyse effective tax rates on labour income is the ‘tax
wedge’. This is defined as the sum of personal income taxes and employee and employer social
security contributions net of family allowances, expressed as a percentage of total labour costs (the
sum of the gross wage and the social security contributions paid by the employer). The approach is
to choose a number of typical taxpayer scenarios, in terms of household composition and income
levels, and in each case to apply the tax rules of the country concerned to calculate the effective tax
rate. Thus, unlike the ITR on labour, it does not measure the overall effective rate across all workers,
but produces a set of different rates for each particular taxpayer scenario. This helps, for example,
when assessing the impact of tax reforms targeted at low-wage earners, or when analysing the
effects of taxation on supply and demand in labour markets. Because it is based on a ‘theoretical’
calculation, the tax-wedge indicator can also provide data on the effects of tax reforms before
macro-data are available. In addition, focusing on specific taxpayer situations eliminates differences
between countries that are due to income distribution or demographics.
From the above, it is clear that the two indicators are rather different in terms of their scope. The
ITR on labour measures the burden from employed labour taxes and social security contributions,
net of tax credits, allowances, exemptions and deductions, but excludes social benefits. It also
integrates the effects of taxpayer behaviour, including non-compliance. The tax wedge, however,
covers tax, social security contributions (SSC) and (universal) social benefits, but does not cover all
tax reliefs or all types of benefits, or the behavioural impacts of tax reforms. An advantage of the tax
wedge is that it allows comparisons between those countries that help families through benefits and
those that use the tax system to do so.
For both indicators there is a problem when comparing countries where certain types of benefits are
paid in cash with those where there is an in-kind provision of such services subsidised by the state. In
(40) See also Clark (2002).

301
addition, neither of the indicators takes into account non-wage income, notably income on capital,
which can be a significant component of the overall income position of high earners.
A further issue that arises relates to the adjustment of the ITR on labour for payable tax credits. The
new national accounts system, ESA 2010, adopted the ‘gross method’ of reporting, with the whole
amount of payable tax credits recorded as government expenditure. To keep the accounting of
government budget balance right, the full amount of the payable tax credits is also recorded on the
other side of the government budget, as tax revenue. This is explained in the dedicated in Section G.
A case can be made for adjusting the numerator of the ITR on labour by deducting that part of
payable tax credits that is used to reduce the tax liability (but including the part of the payable tax
credits that is actually transferred to the tax payer as a component of government expenditure).
It should be noted, however, that the tax wedge indicator deducts the total value of payable tax
credits, i.e. both the expenditure component that reduces the tax liability and the transfer
component.
Implicit tax rates on capital
The implicit tax rate on capital and its subcomponents are the most complex of the ITRs both to
construct and to interpret. A full description of the existing methodology for the capital ITR is
reproduced in this section. An indicative analysis of the ITR on capital and the ITR on corporate
income can be found in Part 1, along with some notes regarding the limitations of the indicators.
Properties of the implicit tax rate on capital
The overall implicit tax rate on capital is computed as the ratio between the revenue from all capital
taxes and all (in principle) potentially taxable capital and business income in the economy. It aims at
representing the average tax burden falling on capital income.
Our definition of taxes on capital does not stop at taxes levied on capital income streams, such as
the CIT, but includes taxes on stocks of wealth or capital assets, stemming from savings and private-
sector investments in previous periods, along with taxes on asset transactions. In other words, not
only are taxes on profits included, but also, for instance, taxes and levies that could be regarded as a
prerequisite to earn them, like the real-estate tax or the motor-vehicle tax paid by enterprises.
These kinds of taxes also have to be paid by non-profitable entities, and therefore cannot properly
be treated as taxes on income streams. Given that national accounts do not provide any indicator for
the tax base of taxes levied on capital stocks or their transactions (e.g. a harmonised measure of the
stock of capital or of asset transactions), the overall ITR on capital simply uses as a denominator
potential capital and business income. However, this publication also includes a more narrowly
defined ITR on capital and business income, which excludes taxes on wealth or the capital stock and
simply measures the average effective tax burden on private-sector investment and saving, as a ratio
between taxes paid on capital income streams and the aggregate of capital and business income.
Of the various implicit tax rates, the ITR on capital is the most complex (41). Its trend can reflect a
very wide range of factors, which can also vary for different Member States. In particular, three main
factors may distort the ITR on capital and business income in the short and medium term.
(41) The construction of this indicator and its possible sources of bias in measuring the effective tax burden on capital are
explained in detail in European Commission (2004a).

302
Time lags. Theoretical considerations as well as empirical evidence suggest that the ITR on capital income is sensitive to the business cycle. Unlike other taxes the CIT is characterised by long and variable time lags between the emergence of income and its taxation, due notably to the possibilities to defer taxation because of previously incurred losses or group taxation.
Capital gains. Expansionary phases, for example in the late 1990s, are accompanied by booming stock markets all over the EU. As a result, capital gains and the corresponding tax revenue may rise substantially. However, given that capital gains are not included in the denominator of any ITR on capital, this development clearly leads to an overestimation of the average effective tax burden on capital and business income, and partly explains the rise in the ITR for some Member States.
Structural changes in the financing of companies. For example, national accounts data show that from 1995 to 2002, in most Member States, a relative shift in financing from debt to equity occurred such that capital income consists less of interest and more of dividend payments. This happened against the background of falling interest rates. Most tax systems in the EU are not neutral concerning financing and allow interest payments to be deducted from the tax base. The shift towards higher dividend distributions results in an increase in the measured average tax burden (42) at unchanged legislation.
Furthermore, it is important to note that a cut in the statutory rate that is offset by an equivalent
widening of the tax base will leave the ITR on capital unchanged. This is not a limitation of the
indicator, but rather an advantage given that the ITR aims at measuring the effective tax burden.
This property of the indicator may contribute to explaining the relatively limited fall in the ITR on
capital over the last several years despite significant EU-wide reductions in statutory corporate tax
rates.
When interpreting the ITRs on capital one should bear in mind that the bases used for the
computation are, particularly in the new Member States, not only narrower but also more volatile
than GDP as a whole, and thus subject to wide swings. Hence, the overall volatility of this ratio is
significantly higher than that of the other ITRs. A degree of caution is, therefore, advisable when
making cross-country comparisons or comparisons of one Member State with the EU averages.
Large changes in backward-looking measures of the tax rate on capital are not unusual and are not
limited to macro indicators. Tests on Belgium and Sweden (43) report annual changes of several
percentage points for effective tax rates derived either from national accounts data or tax statistics
using microdata for companies. The calculations presented here have similar features.
(42) European Commission (2001a).
(43) Valenduc (2001), Clark (2002).

303
BOX F.4: DEFINITION OF THE IMPLICIT TAX RATE ON CAPITAL (INCOME)
Implicit tax
rate
Capital (income) taxes /
on capital
(income)
(1) + (2) + (3) + (4) - (5) + (6) - (7) + (8) - (9) + (10) - (11) + (12)
+ (13) + (14) - (15) + (16) - (17) + (18) + (19)
Numerator: see Box C.3 – taxes on capital
Denominator:
(1) B.2n_S.11-12 Net operating surplus of non-financial and financial corporations (incl.
quasi-corporations)
(2) B.2n_S.14-15 Imputed rents of private households and net operating surplus of non-
profit institutions
(3) B.3n_S.14 Net mixed income of self-employed
(4) D.41_S.11-12rec Interest received by non-financial and financial corporations
(5) D.41_S.11-
12pay
Interest paid by non-financial and financial corporations
(6) D.44_S.11-12rec Insurance property income attributed to policy holders received by non-
financial and financial corporations
(7) D.44_S.11-
12pay
Insurance property income attributed to policy holders paid by non-
financial and financial corporations
(8) D.45_S.11-12rec Rents on land received by non-financial and financial corporations
(9) D.45_S.11-
12pay
Rents on land paid by non-financial and financial corporations
(10) D.42_S.11-12rec Dividends received by non-financial and financial corporations
(11) D.42_S.11-
12pay
Dividends paid by non-financial and financial corporations
(12) D.42_S.13rec Dividends received by general government
(13) D.42_S.2rec Dividends received by rest of the world
(14) D.41_S.14-
S15rec
Interest received by households, self-employed and non-profit
organisations
(15) D.41_S.14-
S15pay
Interest paid by households, self employed and non-profit organisations
(16) D.45_S.14-
S15rec
Rents on land received by households, self employed and non-profit
organisations
(17) D.45_S.14-
S15pay
Rents on land paid by households, self employed and non-profit
organisations
(18) D.42_S.14-15rec Dividends received by private households, self-employed and non-profit
organisations
(19) D.44_S.14-15rec Insurance property income attributed to policyholders received by private
households, self-employed and non-profit organisations
Moreover, statistical issues related to the sector data used to compute the denominator of the ITRs
may also influence the results. National accounting data are in fact regularly revised. In 2006,
complying with EU legislation (44), the Member States were required to introduce a number of
important methodological revisions in their national accounts in order to improve the measurement
of GDP. In particular, the main change, as for the sector accounts, was the allocation of the financial
(44) The legal references for the definition, calculation and allocation of FISIM are Council Regulation (EC) No 448/98 of
16 February 1998 completing and amending Regulation (EC) No 2223/96 with respect to the allocation of financial
intermediation services indirectly measured (FISIM) within the European system of national and regional accounts (ESA),
and Commission Regulation (EC) No 1889/2002 of 23 October 2002 on the implementation of Council Regulation (EC)
No 448/98 completing and amending Regulation (EC) No 2223/96 with respect to the allocation of financial intermediation
services indirectly measured (FISIM) within the European System of National and Regional Accounts (ESA).
304
intermediation services indirectly measured (FISIM (45)) to user sectors/industries, instead of
intermediate consumption. Imports of FISIM have also been recorded. At certain moments several
Member States did not entirely conform to the methodological regulations. It is therefore possible
that statistical artefacts influence the time series, particularly in those points where data compiled
according to a new methodology are joined with old-series data.
The implicit tax rate on capital and the implicit tax rate on capital and
business income
The implicit tax rate is calculated for total capital taxes and for the subcategory of taxes on capital
income (which differs from capital taxes overall because it excludes taxes on the stock of capital) (46).
Both indicators have the same denominator, i.e. total profit and property income from both
corporations and households. In the case of taxes on capital income, the denominator does not
correspond to the actual tax base; it is in some ways narrower (omitting capital gains) and in other
ways broader (excluding some deductions from the tax base). As for ‘capital taxes on stocks and
wealth’, the denominator does not take into account any asset or wealth on which the tax is levied.
In addition, two additional disaggregated ITRs on corporate income (‘traditional version’ and
‘without dividends’), are computed.
Of the various implicit tax rates, those on capital are by far the most complex and, given their
limitations, should be interpreted very carefully. A first problem is that, as indicated below, the ITR
on capital is broadly based and, therefore, reflects a wide range of factors. In particular, the
definitions of the ITR denominators can only roughly approximate the worldwide capital income of a
country’s residents for domestic tax purposes. This does not mean that on the side of companies
profits of foreign affiliates are consolidated within the (domestic) parent company. National
accounts disregard the foreign ownership of subsidiaries located on the economic territory when the
generation of profits is recorded. They are simply treated as domestic companies (47). However, the
base of the ITR does not measure the actual base of tax legislation, which drives tax revenue. So in
practice it is not easy to link developments in the overall ITR on capital and business income to the
various statutory tax rates and other policy changes.
Capital and business income according to national accounts is defined as profits and property
income. Profits are defined as net operating surplus (B.2n) of the private sector, including
corporations (and quasi-corporations), private households, and non-profit institutions and mixed
income (B.3n) of the self-employed. The net operating surplus of the government sector is excluded,
because losses or profits of the government are not subject to taxation.
There is no simple way of approximating the tax base for property income (mainly interest and
dividends) for the whole private sector. A specifically defined balance of property income of the
(45) Financial intermediaries provide services for which no explicit charges are made. The estimate of this latter is known in
national accounts as financial intermediation services indirectly measured (FISIM), and is fixed by convention. Up to now
FISIM has been recorded as intermediate consumption of a notional industry, for want of relative observable variables.
(See http://europa.eu.int/estatref/info/sdds/en/na/na_changes2005.pdf for details).
(46) The methodology is described in European Commission (2004a).
(47) The profits of foreign affiliates are recorded in the distribution of income as ‘reinvested earnings on foreign direct
investment’ (D.43) between the parent and subsidiary company. The flow D.43 paid in national accounts means that subsidiaries in the host country have retained profits and this is attributed to the parents abroad in national accounts. The
flow D.43 received consists of retained profits of subsidiaries abroad attributed to the parent companies in the
investigated country. Both flows can have a negative sign in the case of losses of the subsidiaries. The solution for the ITR
tax base is not taking reinvested earnings on foreign direct investments into account. On the one hand the profit (or loss)
of a parent earned abroad is not counted. On the other hand the retained profits (or losses) of foreign subsidiaries in the
home country is not deducted from the ITR tax base.

305
private sector (received minus paid) is used. The objective for the definition of this balance was to
approximate the potentially taxable profit of a company and the taxable capital income of private
households.
Taxable profits of companies consist of net operating profit and property income received (financial
income) less certain deductible elements of property income paid. The property income deductible
from the tax base includes interest (D.41), property income attributed to insurance policyholders
(D.44) and rents on land (D.45). Dividends (part of distributed income of corporations — D.42) are
part of the financial income but they cannot be deducted to calculate the taxable base in national
tax legislation (48). For private households, the taxable capital income consists almost completely of
interest and dividend payments received and of property income attributed to policyholders
received from insurance companies and pension funds.
The balance of D.44 received minus paid usually nets off for the whole private sector. The definition
takes into account the received property income from abroad and improves the measurement of
profits from banks and insurance companies. However, for the ITR on capital several sources of bias
compared to taxable profits remain.
Since the calculation of depreciation of fixed capital in national accounts uses prices for the current period, it differs a lot from methods used in profit-and-loss accounts. Additionally, the calculation of consumption of fixed capital is not comparable across countries. This could lead to additional biases in measuring the effective tax burden on capital.
Capital gains are not part of profits in national accounts because they are not related to the production process. This important part of taxable profits of (financial) companies is disregarded in calculating the denominator and leads to an overestimation of the ITR on capital and business income as far as capital gains are taxed. The same is true as regards the capital gains of private households, which are often taxed under the personal income tax. All this is likely to affect international comparability, as some countries have a greater share of financial company profits including gains.
Central banks are part of the financial corporations sector in national accounts. The inclusion of their (non-taxable) profits in the denominator leads to an underestimation of the ITR on capital and business income.
For taxable third-pillar private pension benefits, treated as income from capital in the split of the PIT, no corresponding income flow is recorded in national accounts. Ignoring these benefits in the potentially taxable capital and business income in the denominator leads to an overestimation of the ITR.
In the Eurostat data on national accounts for the EU Member States, interest payments by households and the self-employed are not available separately. Taking the total net interest as part of the denominator accounts for tax-deductible interest payments of the self-employed but leads to an overestimation of the ITR on capital because interest payments for mortgage and consumer loans are not tax deductible in most Member States.
Unlike net operating surplus, taxable profits and tax revenue are reduced by losses carried forward, causing a cyclical mismatch with the base and cyclical fluctuation in the ITR, which sometimes makes the trend difficult to interpret. This may also distort international comparisons. In addition, the difference in the measurement of imputed rents on owner-occupied dwellings between national accounts and tax legislation is another source of bias.
(48) The ITRs for the whole private sector avoid double counting of dividends that are distributed by domestic companies out
of their operating profits by deducting dividends paid to domestic private households or other domestic companies from
the capital ITR tax base. For more details on this issue see European Commission (2004a).

306
The overall ITR on capital and business income for corporations and households is influenced through various channels. Therefore, developments of this indicator are sometimes difficult to explain.
The ITR on capital income of corporations and the ITR on capital income of households and the self-employed
The interpretation of the overall ITR on capital and business income of corporations and households
is complicated by the overlapping effects of the various channels previously described. Although
difficulties of interpretation stemming from the backward-looking character of the indicator remain,
the reading of the ratios is in fact simplified when splitting the ITR between an ITR for the corporate
sector and another ITR for the households sector. However the breakdown is not perfect as the
denominators of the two indicators partly overlap.
The numerator of the overall ITR can be split using the allocation of taxes to the categories ‘income
corporations’, ‘(capital) income households’ and ‘income self-employed’ (49). In most countries, tax
revenue raised on corporate income equal the aggregate D.51b + D.51c2 ‘Taxes on the income or
profits of corporations including holding gains’ (Box F.4). For Germany, Italy and Austria, revenue
from local or regional business taxes are added. In general, the other tax categories of the overall ITR
numerator are allocated to the households sector (Box F.5). The other two categories (‘(capital)
income households’ and ‘income self-employed’) are taken as the numerator of the ITR on capital
and business income for households. This mainly includes taxes on holding gains of households, the
share of personal income tax on capital and on the self-employed and the social contributions paid
by the latter.
The denominator includes the mixed income of the self-employed, the net operating surplus of
households, dividends and attributed insurance property income received and the difference
between received and paid interest and rents (50). The denominator for corporations consists of:
their net operating surplus.
the difference between received and paid interest and rents.
a specific definition of dividends minus property income from insurance companies and pension funds attributed to policyholders (51).
In calculating the potential taxable base of the corporate sector, interest income received by
collective investment funds is included, even though such income is generally exempt from taxation
in most EU Member States (taxation occurs at the level of the individual investor rather than at the
level of the fund). The impact of this on the calculation of implicit rates differs according to the
relative size of the funds industry as compared to the overall economy in each Member State. In
Ireland, which has a large international investment funds industry, the inclusion of this tax-exempt
income has a disproportionate impact on the calculation of implicit rates of corporate income for
that country compared to other Member States, with the resulting estimates being significantly
reduced.
(49) A detailed classification of taxes to the different categories for each Member State is available on the webpage of DG
Taxation and Customs Union.
(50) Note that, as far as rent income is concerned, the definition adopted here departs from the customary tax treatment of
property income, which in most cases is based on gross property income (possibly with some deduction of interest
expenses).
(51) Strictly speaking it is the balance of attributed property income (D.44) paid mainly to private households and received
property income attributed to insurance policyholders, because corporations and quasi-corporations can also be insurance
policyholders.

307
When splitting the ITR on capital income for (non-financial and financial) corporations and
households, the flows of property income between these two sectors are of particular importance. A
clear split can be made for the national accounts categories relating to interest payments (D.41) and
rents (D.45).
In principle, dividends are part of the taxable financial income of a company. They are subject to
double taxation because corporate taxes have been levied on the profit at the level of the
distributing company. In order to limit or offset the double taxation at the level of the shareholder
(corporation or individual), Member States apply different taxation schemes. However, most
Member States do not fully offset the double taxation. If the dividends received are part of the
potentially taxable base, the ITR on corporate income will be lower in those countries that give
greater relief for the double taxation of dividends compared to a country that fully applies the
classical system.
However, it would be deceptive to count only the dividends received by financial and non-financial
corporations. Because the net operating surplus out of which dividends are distributed is already
part of the denominator the dividends would be partly counted twice. Dividends distributed by a
company belonging to the sector for financial or non-financial corporations should not be counted.
Only dividends received from abroad should be taken into account when constructing the ITR for all
corporations.
Unfortunately, information on dividends distributed from the rest of the world to domestic
corporations is not available in the Eurostat database of national accounts. For dividends (and nearly
all other flows in national accounts) we only know what a specific sector receives from all other
sectors and what it pays to all other sectors. However, this information can be used to approximate
the dividends received by corporations from abroad. From the total sum of dividends received by
corporations (D.42rec_S11-12) we deduct the dividends distributed by domestic corporations
(D.42pay_S11-S12) in order to avoid double counting. However, this deduction is too large, as only
the dividends distributed to domestic corporations should be subtracted. Therefore, dividends
received by the government (D.42rec_S13), the rest of the world (D.42rec_S2) and households
(D.42rec_S14-15) are added to the denominator. This approximation is only fully correct under the
assumption that government and households do not receive dividends directly from abroad but
through domestic banks and insurance companies. For households it can be expected that they
receive a certain part of dividends from abroad, meaning that the dividends included in the
denominator are overestimated.

308
BOX F.5: DEFINITION OF THE IMPLICIT TAX RATE ON CORPORATE INCOME (TRADITIONAL VERSION)
Implicit tax rate Taxes on corporate income/
on corporate income (1) + (2) – (3) + (4) – (5) + (6) – (7) + (8) + (9) +
(10) + (11) – (12)
Numerator:
D.51b+D.51c2 Taxes on the income or profits of corporations including
holding gains
Denominator:
(1) B.2n_S11-12 Net operating surplus of non-financial and financial
corporations (incl. quasi-corporations)
(2) D.41_S11-12rec Interest received by non-financial and financial corporations
(3) D.41_S11-12pay Interest paid by non-financial and financial corporations
(4) D.45_S11-12rec Rents on land received by non-financial and financial
corporations
(5) D.45_S11-12pay Rents on land paid by non-financial and financial corporations
(6) D.42_S11-12rec Dividends received by non-financial and financial corporations
(7) D.42_S11-12pay Dividends paid by non-financial and financial corporations
(8) D.42_S13rec Dividends received by general government
(9) D.42_S2rec Dividends received by rest of the world
(10) D.42_S14-15rec Dividends received by households, self-employed and non-
profit institutions
(11) D.44_S11-12rec Insurance property income attributed to policyholders received
by non-financial and financial corporations
(12) D.44_S11-12pay Insurance property income attributed to policyholders paid by
non-financial and financial corporations
NB: To calculate the version of the ITR on corporate income without dividends, elements: (6),(7),(8), (9) and (10) are
excluded from the denominator
BOX F.6: DEFINITION OF THE IMPLICIT TAX RATE ON CAPITAL AND BUSINESS INCOME OF HOUSEHOLDS AND THE SELF-EMPLOYED
Implicit tax rate on capital
and business income of
households
(incl. self-employed)
Taxes on capital and business income of households /
(1) + (2) + (3) – (4) + (5) – (6) + (7) + (8)
Numerator: see Box C.5 - taxes on the capital and business income of
households
Denominator:
(1) B.2n_S14-15 Imputed rents of private households and net operating
surplus of non-profit institutions
(2) B.3n_S14 Net mixed income of self-employed
(3) D.41_S14-S15rec Interest received by households, self employed and non-
profit organisations
(4) D.41_S14-S15pay Interest paid by households, self employed and non-profit
organisations
(5) D.45_S14-S15rec Rents on land received by households, self employed and
non-profit organisations
(6) D.45_S14-S15pay Rents on land paid by households, self employed and non-
profit organisations
(7) D.42_S14-15rec Dividends received by private households, self-employed
and non-profit organisations
(8) D.44_S14-15rec Insurance property income attributed to policyholders
received by private households, self-employed and non-
profit organisations

309
Due to the double taxation of dividends at the company level and at the shareholder level these
payments (or the underlying profits) need to be included in both indicators, for corporations and for
households. With these definitions the ITRs on capital and business income for households and on
corporate income do not sum up to the overall ITR. For the overall implicit tax rate on business and
capital income the dividend payments between the corporations and the households’ sector need to
be consolidated.
However, with the ‘property income attributed to insurance policyholders (D.44)’ there exists
another income flow for distributing profits from financial corporations to private households (52).
Insurance companies and pension funds collect contributions from their insurance policies or
schemes, and after deducting their operating costs they invest them in the capital market or in other
assets. From this (financial) investment they receive property income in the form of interest,
dividends or rents, along with capital gains through trading stocks, bonds, etc. This return on
investment partly constitutes the profit of the insurance companies and partly belongs to the
insurance policyholder as laid down in the insurance contract. It is that part attributed to the
policyholders (excluding capital gains (53)) that, in national accounts, is transferred via the D.44
mainly to private households in the period when this property income accrued.
In principle, most EU Member States provide a tax exemption for this income in the hands of the
financial institution. Several methods are used. In some cases the institution is tax exempt (certain
pension funds); in other cases income is exempt or neutralised in the profit calculation by deducting
an insurance technical reserve. However, some Member States levy a withholding/capital yield tax
on this income that is not always neutralised at the level of the company.
The preliminary split of the ITR on capital income for corporations and households presented in the
2003 edition did not take the D.44 flow into account. This means that the return on investment was
fully allocated to financial corporations. It was based on the fact that there is no actual flow of
income in the period in which insurance companies earn income on behalf of policyholders. In
national accounts, income received by insurance companies or pension funds by investing their
technical reserves in financial assets or buildings is only ‘attributed’ to insurance policyholders. It is
‘re-collected’ afterwards through imputed higher insurance contributions. Because these flows are
purely imputed within national accounts, no taxes — at this stage — are raised at the level of the
insurance policyholder.
However, it seems that the tax exemption of such earnings is the dominant regime for the taxation
of pension funds and insurance companies in Europe. This means that D.44 paid by financial
corporations has to be deducted from the ITR tax base for corporate income. In those countries
where capital yield taxes are levied on these earnings and the tax revenue are allocated to
corporations, the ITR on corporations would be overestimated.
In turn, D.44 is added to the ITR tax base for the capital income of the households sector. In most
countries, private households are taxed on the benefits or distributions by pension funds or
insurance companies when the payoff period starts. This can be an amount of capital or an annuity.
For the definition of an ITR on capital income for households this means that we encounter a
(52) For the private sector as a whole, including or excluding D.44 (received minus paid) from the tax base has no major
empirical impact on the ITR on capital income since the net D.44 is close to zero and nearly exclusively represents a flow
from financial corporations to households.
(53) The capital gains are not recorded in the generation and distribution of income accounts. Some information can be found
in the revaluation accounts. Up to now we have not tested whether these data could be used for our purposes.

310
problem of periodicity. With the property income earned on behalf of the policyholder period by
period, insurance companies build up reserves (liabilities) in order to pay the benefits in later
periods. However, D.44 could be regarded as a proxy for the taxable part of pension benefits and
insurance payoffs, which would not include the initial contributions or premiums.
The corporations sector in national accounts also comprises partly unincorporated enterprises, i.e.
so-called quasi-corporations. In many countries these quasi-corporations also have to pay CIT.
However, there are some important exceptions. In Germany, partnerships (Personengesellschaften)
constitute a large number of the country’s companies, and these are treated as quasi-corporations.
Their production, profits, etc. are recorded in the corporations sector in national accounts. Because
they do not have an independent legal status, their owners are taxed under the PIT scheme. The
related tax payments are recorded within the households sector in national accounts (54). In the
classification adopted in this publication, they are reported within ‘taxes on self-employed’. This
means that tax revenue are booked in a different sector than the underlying business income.
Ignoring this booking principle by calculating ITRs on capital income for corporations or households
(including the self-employed), using the sector information of national accounts without corrections,
would lead to biased ITRs. Similar problems exist for Luxembourg, Austria, Portugal and Finland.
According to information from Statistics Finland, the bias in Finland’s ITRs is of minor importance.
The ITR on corporate income is generally lower than the statutory corporate tax rate. This can be
explained by the fact that the ITR incorporates the effect of reduced rates (e.g. for certain assets,
sectors or small profits), tax deductions affecting the base and the effects of tax planning by
corporations in order to minimise their tax payments. It should furthermore be noted that the
financial corporations described in national accounts include central banks and pension funds, while
their profits, which are included in the denominator of the ITR, are not always subject to taxation.
This is another element that explains the relatively low level of the ITRs. Making a comparison with
an ITR using microdata from tax statistics, Valenduc (2001) finds that the ITR based on macrodata
tends to underestimate the effective taxation on company profits.
It is, however, possible that the ITR on corporate income exceeds the statutory corporate tax rate.
This may depend, for instance, on the payment by corporations of taxes referring to profits earned
earlier, or on taxes paid on capital gains (which are not included in our ITR denominator owing to a
lack of statistics). A less straightforward but probably important effect is due to the impact of loss-
making companies that not only individually display a zero ITR but curiously drive up the ITR for all
profit-making companies; their own negative net operating surplus in fact offsets an equivalent but
positive net operating surplus realised by other businesses that turn a profit and pay taxes on it.
The sensitivity to the business cycle is a general feature of backward-looking indicators that measure
the average effective tax burden on economic activities. In principle, three different factors affect
the ITR on capital income in an economic recovery.
In countries with a progressive personal income tax, the ITR should rise in an upswing. If taxable income from capital and self-employment increases, the taxes raised on this income increase faster.
Corporate tax schedules are generally not progressive and, therefore, the economic cycle should not affect the ITR via that channel of influence. However, some Member States do
(54) PIT revenue are also recorded in the government sector that receives the payments.

311
apply lower rates for small and medium-sized enterprises. In an ongoing upswing some of these companies will exceed the tax legislative thresholds, resulting in a higher tax burden.
Rules on carry-forward of company losses will generally result in asymmetric effects on the ITR. First, there is an asymmetry with regards to the timing of tax payments: when relying on aggregate data from national accounts, CIT revenue appearing in the numerator of the ITR are reduced by losses incurred in prior years, while the denominator is reduced by losses in current years. The numerator effect is caused by so-called loss carry-forward provisions in the tax legislation. The denominator effect results from the inclusion of loss-making firms, with current losses from loss-making firms offsetting profits of profitable firms in the aggregation. Losses are therefore incorporated into both the numerator and the denominator, but the losses are transmitted in the ITR asymmetrically in the sense that they refer to different periods. At the beginning of an economic upswing, more firms will make profits. Initially the ITR on capital is reduced, because the resulting increase in profits is immediately reflected (in the denominator) but not fully in the tax payments (in the numerator), as losses from previous years are carried forward. However, one could expect that the latter effect diminishes over time, as loss carry-forward provisions are often restricted in time and more and more companies make profits as the upswing persists. This diminishing effect of loss carry-forward provisions should therefore lead to a gradual increase in the ITR on capital due to progressive increases in tax payments. Second, a recessionary phase will generally exert an asymmetric impact on the numerator and the denominator of the ITR: the denominator will show the full amount of the decrease in aggregate corporate profits, whereas the numerator will not reflect the full extent of the deterioration as a portion of taxpaying companies would already have shown zero profits in the preceding year and further deterioration is not taken into account (hence a greater effect on the denominator than on the numerator resulting in a slight anti-cyclical bias).
All in all, these effects are likely to offset each other to a certain extent in the initial phases of the
cycle. However, in a long-lasting economic upturn these channels of influence will most likely point
to an increase in the implicit tax rate on capital with a certain time lag.
Structural factors affecting the development of the capital implicit tax
rate
Beyond the effects of the business cycle, the changes in the ITRs may also reflect more structural
changes, in particular in the composition of income. For example, given the increase in stock market
capitalisation in the years 1995-2000, it is likely that significant capital gains were achieved by both
companies and households, resulting in an increase in financial income. This change in the
composition of income is not clearly discernible from national accounts income data, nor is it
included in the tax base of the ITR. The additional tax revenue related to this kind of income could
therefore have induced a rise in the ITRs on capital income, leading to an overestimation of the
effective tax burden on capital income of the private sector. Following the same line of reasoning,
the subsequent downturn in stock markets could be an important element in explaining the
reduction in the ITR on capital income in 2001.
Moreover, different tax provisions for different sources of income offer an additional explanation for
the increase in the ITR on corporate income. Specific tax rates or special types of tax relief apply to
different sources of income or expenditure. A common feature of corporate tax systems, for
instance, is to favour debt finance relative to the financing of new investments by issuing new
equity. For the ITR, dividend and interest payments are aggregated within the tax base. If financial
markets were to induce a shift from interest to dividend payments, the taxable base would increase.
In this case, companies would pay more taxes on capital since the deduction of interest expenditure

312
for determining taxable profits would be phased out. At the same time, however, the aggregate and
consolidated tax base of the ITR would net off all flows of dividend distributions or interest
payments between different companies (for instance between non-financial companies as borrower
and banks or insurance companies as creditor) and private households. If a shift were to occur from
interest to dividend payments, it would not show up in the denominators, and hence the capital ITR
would remain constant. The overall result of the higher tax revenue would be an increase in the ITR,
reflecting a higher effective tax burden that is caused by the effects of the tax legislation (55).
Effective average tax rate
The effective average tax rate are discussed in Part 1 of this report and can be consulted in the
Table 83 of Annex A. The methodology used for the calculation of the effective average tax rates is
set out by Devereux and Griffith (1999, 2003), and was also used in an earlier study by the European
Commission in 2001 (56). The methodology has been applied for the calculation of effective average
tax rates for large corporations in the EU Member States and other countries by ZEW on a yearly
basis (57) (58).
The basic approach proposed by Devereux and Griffith (1999, 2003) is to consider a hypothetical
incremental investment located in a specific country undertaken by a company resident either in the
same country, or – possibly – in another country. Given a post-tax real rate of return required by the
company’s shareholder, it is possible to use the tax code to compute the implied required pre-tax
real rate of return, known as the cost of capital (59). The proportionate difference between the cost
of capital and the required post-tax real rate of return is known as the effective marginal tax rate
(EMTR) (60).
This approach is based on the assumption that firms undertake all investment projects which earn at
least the required rate of return. For a given required post-tax rate of return, the more burdensome
the tax system the higher the cost of capital, and hence the less it will be for an investment project
to be undertaken.
A complementary approach is to consider discrete choices for investment, in particular regarding a
discrete location choice. If two locations are mutually exclusive, a company must choose between
them. In this case, the impact of taxation on the choice is measured by the proportion of total
(55) However, the tendency for the ITR to increase can be offset to some extent by the fact that interest is often more highly
taxed than dividends in the hands of personal investors. Only countries with classical tax systems tax interest as much as
dividends at the personal level. Others have some form of relief for double taxation of dividends. So there could be more
personal income tax on interest than on dividends, offsetting some of the effect mentioned.
(56) European Commission (2001a)
(57) For the most recent report see ZEW (2021), Effective tax levels using the Devereux/Griffith methodology, Mannheim
available at https://ec.europa.eu/taxation_customs/taxation-1/economic-analysis-taxation/economic-studies_en.
(58) The report also provides the effective marginal tax rates and cost of capital for large corporations, and computes effective
average tax rates, effective marginal tax rates and cost of capital for large corporations at the shareholder level, for three types of shareholders: zero-rate, top-rate non-qualified and top-rate qualified. Furthermore, the report also presents cost
of capital computations for incorporated SMEs and partnerships.
(59) In the absence of personal taxes, the company is assumed to be required to earn a post-tax real rate of return of 5 %.
The cost of capital is the implied required pre-tax real rate of return. The cost of capital is calculated for each of 15
different types of investment (five assets, each potentially financed from three sources).
(60) The EMTR is calculated as the proportionate difference between the cost of capital and the post-tax real rate of return of
5 %. The EMTR is not represented in the tables since, in the absence of personal taxes, it is not more informative than
the measure of the cost of capital.

313
income taken in tax in each location. Devereux and Griffith (1999, 2003) proposed a measure of an
effective average tax rate (EATR) (61) to identify the effect of taxation on such discrete location
choices.
In both cases, the hypothetical investment takes place in one period and generates a return in the
next period. Throughout that the tax system is assumed to remain unchanged over the life of the
investment. The impact of taxation depends on a number of features of the tax system, including the
statutory tax rate, capital allowances, the treatment of interest deduction, the allowance for
corporate equity, the treatment of foreign source income and wealth taxes paid by the company,
possibly along with the treatment at the corporate and personal level of dividends paid by the
company, and wealth and capital gains taxes at the personal level.
The forward-looking effective tax rates offer a convenient theoretical framework for broadly
summarising the interaction of tax rules related to capital investment. It should be noted that the
indicator should be interpreted with caution, taking into account the assumptions related to the
hypothetical investment and to the modelling specifics of the tax systems under consideration. The
measures presented here should also be distinguished from backward-looking approaches, as
derived from published data on tax payments, either from company accounting records or from tax
receipts. The latter offer the advantage of being based on real-life data, but are subject to a number
of limitations when analysing future investment decisions: informational time lags, and a lack of
framework to distinguish between economic and tax effects, and the absence of a temporal
perspective.
(A) Economic assumptions
Several assumptions need to be made in order to define the hypothetical investment project
analysed in this report, and the economic conditions under which it would take place. The following
points are assumed.
The investment is made in the manufacturing sector.
The shareholder is assumed to be able to earn a real rate of return of 5 % on an alternative investment. If the alternative investment is not taxed, this is also the post-tax return required by the shareholder on the hypothetical investment analysed. Any tax on the alternative asset reduces the required post-tax rate of return on the hypothetical investment.
The inflation rate is assumed to be 2 % in all countries.
Separate investments in five different assets are considered. They are as follows, together with the true economic depreciation rate assumed in each case: intangibles (taken for tax purposes here to be the purchase of a patent) (depreciation rate of 15.35 %); industrial buildings (3.1 %); machinery (17.5 %); financial assets (no depreciation); and inventories (no depreciation). In presenting averages over different forms of investment, the said assets are weighted equally.
Three sources of finance for investment in each asset are considered separately: retained earnings, new equity and debt. In presenting averages over different forms of investment,
(61) The effective average tax rate is the relevant rate for analysing discrete investment choices, such as where to locate. The
EATR is calculated for each of 15 different types of investment (five assets, each potentially financed from three sources).
However, in this case, the shareholder additionally requires a fixed pre-tax real rate of 20%, with the minimum required
post-tax real rate of return (in the absence of personal taxes) remaining at 5%. This generates an investment project with
a positive net present value. The EATR is a measure of the present value of taxes paid expressed as a proportion of the
net present value of the income stream (excluding the initial cost of the investment).

314
weights used are taken from OECD (1991): retained earnings are weighted by 55 %, new equity by 10 % and debt by 35 %.
(B) Description of the tax parameters
The parametrization is equal across countries for the real rate of return, the inflation rate, the true
economic depreciation on assets and the weights for investments and sources of finance. This is in
order to identify differences in effective tax rates due to tax regimes, rather than due to differences
in underlying economic conditions.
The types of parameters incorporated into the model are as follows:
statutory corporation tax rates, including surcharges and typical local tax rates on profit, along with various special rates that apply to specific forms of income or expenditure;
corporate real-estate taxes, net wealth taxes and other non-profit taxes on assets;
capital allowances for industrial buildings, machinery, intangibles (the purchase of a patent) and the tax treatment of financial assets and inventories.

315
Section G: Payable tax credits
What are payable tax credits?
Tax credits reduce tax liabilities. If the amount to be credited to the taxpayer is higher than the tax
liability, the exceeding amount is either ‘wasted’ or actually transferred by the government to the
taxpayer. The former category of tax credits is called non-payable (or ‘wastable’) tax credits, while
the latter category is called payable (or ‘non-wastable’) tax credits.
‘Payable tax credits’ are credited against a tax liability, and only need to be paid out to beneficiaries
if they exceed the tax liability. Conceptually, a payable tax credit can be split into two components:
one component (the ‘tax expenditure component’) is used to decrease the tax liability; the other
(the ‘transfer component’) is the left over if the total tax credit amount exceeds the tax liability, and
is paid directly to a recipient as a benefit payment.
The treatment of payable tax credits in the recording of tax revenue
There are two main methods for recording payable tax credits in tax revenue statistics.
The ‘gross method’, which treats payable tax credits as expenditure provisions, and consequently deducts neither the tax expenditure component nor the transfer component from recorded tax revenue. This is used in most international national accounts manuals (ESA 2010, SNA 2008 and IMF GSM 2014).
The ‘split method’, which deducts only the part of payable tax credits used to reduce the tax payer’s tax liability (the ‘tax expenditure component’ of the credit). This method was used by most countries in the past and is currently favoured by the OECD.
For those countries where tax credits are widely used, this difference in treatment is important
because it can have a significant effect on the reported tax revenue.
The ESA recently underwent a major revision, and this included a harmonisation in the way payable
tax credits are recorded. The new system, ESA 2010, adopts the ‘gross method’ of reporting —
following on from the harmonisation on the recording of tax credits introduced in the 2008 SNA and
in line with the IMF’s Government finance statistics manual 2014 — with the whole amount of
payable tax credits recorded as government expenditure (under the appropriate expenditure
transaction). To keep the accounting of government budget balance right, this means that the full
amount of the payable tax credits is also recorded on the other side of the government budget, as
tax revenue. This recording method has important implications for tax indicators since it may
increase the recorded tax revenue of those Member States that use payable tax credits.
The OECD favours another recording method (the ‘split method’). This involves deducting from tax
revenue that part of the payable tax credits that is actually used to reduce the tax liability, but
including the part of the payable tax credits that is actually transferred to the taxpayer as a
component of government expenditure.
Both methods have their own methodological rationale. The gross approach adopted under ESA
2010 clarifies an issue that was previously neither explicit nor harmonised. Under ESA 95 this left
some scope for the different ways of recording of the total tax revenue and total expenditure of
general government. The rationale for recording non-payable tax credits and tax reliefs/reductions
acting on the tax base as reducing government revenue (and the tax burden) is that these affect only
taxpayers. On the other hand, payable tax credits, by their very nature, can affect taxpayers,
households and corporations not paying taxes alike. A decision to introduce a tax credit or not have

316
a tax credit but budget an equal amount of expenditure (e.g. subsidies, social benefits, other current
transfers or capital transfers in particular investment grants) thus has the same effects on
government net lending/net borrowing. There is thus a case for such a decision to be neutral on
national accounts aggregates such as GDP, gross national income and key government aggregates.
On the other hand, the split approach aims to avoid an increase in tax revenue due to the inclusion
of amounts that are not collected. It also eliminates the distinction between payable and non-
payable tax credits that are always recorded on a ‘net’ basis, that is, only the net amount is recorded
on the revenue side of the government budget and nothing is recorded as a subsidy on the
expenditure side.
In the main graphs and tables of this report the ESA 2010 approach has been employed (gross
method), but the effects of adjusting the tax-to-GDP indicator for payable tax credits are shown in
Section G of the country tables in Part 2.

317
Special Note: Methods used to split the revenue from personal
income tax
The sources of personal income tax
Apart from the aggregate data in national accounts, additional data made available by Member
States have been used to split recorded tax revenue into more detailed categories. This is of
particular importance for the recorded personal income tax, which is typically broad based and
relates to multiple sources of income. A method had to be developed to break down revenue from
personal income tax by economic function (i.e. labour, capital and consumption). This section
describes the methods used by the Member States to generate estimates of this split of the personal
income tax from tax-return data. The methods attribute personal income tax to four main taxable
income sources (see Box F.6).
BOX SPECIAL NOTE.1: BROAD DEFINITION OF THE SELECTED INCOME SOURCES
Income source Type of taxable income components included
Employed labour
Wages and salaries
Fringe benefits in kind
Directors' remuneration
Foreign source earned income
Financial participation schemes (e.g. stock options)
Deemed income from private uses of company cars
Self-employed labour
Income from unincorporated businesses
Profits from trade or business and proceeds from independent
professional services (e.g. dividend distributions from closely held
companies)
Capital
Income from movable property (e.g. dividends, interest, distributions,
royalties)
Income from immovable property (rents earned on letting a private
dwelling, etc.)
Periodic transfers and private pensions
Taxable capital gains for some Member States
Other (e.g. rental value owner-occupied housing)
Transfers and pensions
Taxable social benefits (e.g. unemployment, health care and social
assistance benefits)
State pension benefits
Occupational pension benefits
The resulting estimates of the personal income tax revenue that could be attributed to these taxable
income sources are used in the numerators for the implicit tax rates on labour and capital (using
relevant aggregate economic incomes as denominators) and in the breakdown of taxes across the
economic functions (i.e. taxes on consumption, labour and capital, as a percentage of GDP).
The flaws of aggregate data and advantages of microdata
Under an approach using only aggregate data, total personal income tax raised in respect of labour
(capital) income is often estimated as the proportion of aggregate labour (capital) income in the
aggregate taxpayer income. Another approach is to estimate a single average effective income tax
rate on the basis of aggregate data. The total personal income tax revenue data is divided by the

318
aggregate approximation of labour and capital income in the economy to get the overall effective
personal income tax rate, which can subsequently be applied to the labour (capital) income in order
to estimate the income tax levied from labour (capital) income (62). This ignores the fact that
effective rates on personal income tax vary across different taxable income components and groups
of taxpayers. Even where, for example, labour and capital income are pooled together for tax
purposes at the individual level, such an approach may be criticised where aggregate labour income
is believed to be subject, on average across taxpayers, to a significantly different average effective
tax burden than capital income (63). A main concern associated with average effective (implicit) tax
rate analysis is the manner in which estimates are derived for the aggregate amount of personal
income tax revenue raised from different types of income included in a given country’s personal
income tax base. Under an approach using only aggregate data from national accounts, for example,
total personal income tax raised in respect of labour (or capital or other forms of personal taxable
income, for example social transfer or pension income) is often estimated as the proportion of
aggregate labour (or capital) income in the aggregate taxpayer personal income. This approach
implicitly assumes that labour and capital income (or other forms of taxable income) is subject to
one (common) average effective tax rate (64). This assumption is generally unrealistic, and could be
expected to lead to imprecise estimates of notional tax revenue raised in respect of different taxable
income types and, therefore, imprecise estimates of average effective tax rates by economic income
source (65).
Relying on micro-level data — that is, confidential tax data at the individual taxpayer level —
Member States are able to generate more accurate estimates of personal income tax revenue raised
on separate sources of income. Generally, capital income will tend to be concentrated on the right-
hand side of the Lorenz curve and, therefore, be subject to higher marginal and average tax rates as
compared to income from labour. On the other hand, special tax concessions may apply to income
from capital, so that the average tax rate for capital income may not be significantly different from
that for income from labour. For example, some Member States apply a ‘dual’ income tax system, in
which capital income is usually taxed at a relatively lower (fixed) rate as compared to other earned
taxable income. Forcing the latter assumption (of special tax concessions) on the data would
however be a shortcoming to the analysis. Also, most Member States tend to tax pension benefits or
social benefits more favourably than earned income from labour, either by way of increased tax
allowances or tax credits that are age based, or by partial exemptions from the tax base. Using
microdata sets that include separate reported figures at the taxpayer level for the items of income
on which the personal income tax is raised, it is possible to account for such effects (66).
(62) This approach was introduced by Mendoza, Razin and Tesar (1994) and was used in internal studies by the economics and
financial affairs departments of both the European Commission and the OECD. See Martinez-Mongay (2000) and Carey
and Rabesona (2002) for more details.
(63) See also OECD (2000, 2002), Clark (2002) and De Haan, Sturm and Volkerink (2002).
(64) This approach was introduced by Mendoza, Razin and Tesar (1994) and was used in internal studies by the economics and
financial affairs departments of both the European Commission and the OECD. See Martinez-Mongay (2000) and Carey
and Rabesona (2002) for more details.
(65) See also OECD (2000, 2002b) and De Haan, Sturm and Volkerink (2002).
(66) In order to illustrate the degree of precision that can be reached using microdata rather than aggregate tax-return data,
the ministries of finance and taxation in Denmark, Italy, the Netherlands and Finland performed additional calculations on
the basis of only aggregate tax-return data for some years. It appeared that the differences for the estimated amounts of income tax raised on income from employed labour were rather small. The reason is that employed labour income is by
far the most dominant income source, which means that the overall effective income tax rate (measured on the aggregate
taxable income and across all taxpayers) is strongly influenced by the average effective tax rate on labour income. The
differences were however significant for the other selected income sources. If only aggregate tax-return data were used,
generally higher fractions would be computed for capital income and income in the form of social transfers and pensions,
and generally lower fractions would be computed for income from self-employed labour.

319
The methodological approaches
Most Member States basically multiply individual income tax payments by proportions of the
selected income sources in the total taxpayer income (Belgium, Denmark, Germany, Ireland, France,
Luxembourg, the Netherlands, Finland and Sweden). This is done both by using microsimulation
models relying on samples from the total taxpayer population and by using exhaustive tax-return
data sets (e.g. Belgium and Ireland). The corresponding estimates obtained at the taxpayer level are
consequently aggregated to obtain estimates of the personal income tax raised in respect of the
selected sources of income. For example, the total amount of personal income tax raised in respect
of labour income, PIT (labour), could be estimated as follows:
j
jjj
j
jj PITwPITYWlabourPIT )/()(
where Wj measures the labour income of the j-th taxpayer in a sample of individuals (j = 1, … n) and
where PITj measures the personal income tax payment of the j-th taxpayer on his or her total taxable
income Yj. The above equation therefore measures the total personal income tax raised on labour
income as a weighted average of each individual taxpayer’s payment PIT, with the weights wj =
(Wj/Yj) attached to these individual payments reflecting the distribution of total wages and salaries
across taxpayers.
Some Member States (Greece, Spain and Italy) instead use tax-return data that are aggregated at
the level of a number of income classes or income tax brackets (j = 1, … n), but essentially make the
same calculations. The latter approach is likely to capture broadly comparable effects of the
differences in tax treatment and the distribution of income sources across different groups of
taxpayers.
Some Member States (Austria, Portugal) choose another approach, using tax-receipts data from the
wage (withholding) tax and (final) income tax statistics and applying a number of adjustments. Wage
(withholding) tax is by its very nature designed to approximate the final income tax liability for wage
earners as closely as possible, but in some cases there are certain adjustments for income tax
assessments, because the wage tax withheld is not correct (e.g. because of different jobs or pensions
during a single year). As this correction concerns only wage earners, in some cases the net amount
of the correction is deducted from the total amount of recorded wage tax, and the amount of
personal income tax is adjusted accordingly. Since wage tax can also be levied on social benefits (e.g.
unemployment benefits, widower’s benefits and invalidity benefits) or old-age pensions, the
recorded wage tax is adjusted accordingly. The (adjusted) personal income tax is further split
between income from self-employed businesses and capital income, either using aggregate
proportions or information aggregated at the level of income classes (Austria). The latter approach is
also likely to capture broadly comparable effects of the differences in tax treatment and the
distribution of income sources across different groups of taxpayers, as outlined above.
Finally, Hungary (from 2009 onwards) uses a combination of microsimulation and a correction on the
aggregate figures from the microsimulation model.
In most Member States the personal income tax system is comprehensive in the sense that all
subcategories of taxable income are pooled at the individual level, and the result is taxed at
ascending statutory tax rates. However, some Member States apply a given statutory rate on a
specific income category, as can occur under a ‘dual income tax’ system. In the Netherlands, Finland
and Sweden, for example, capital income is currently taxed at a relatively lower statutory rate as
compared to other earned income. In most cases, however, tax-receipts data are used to isolate the
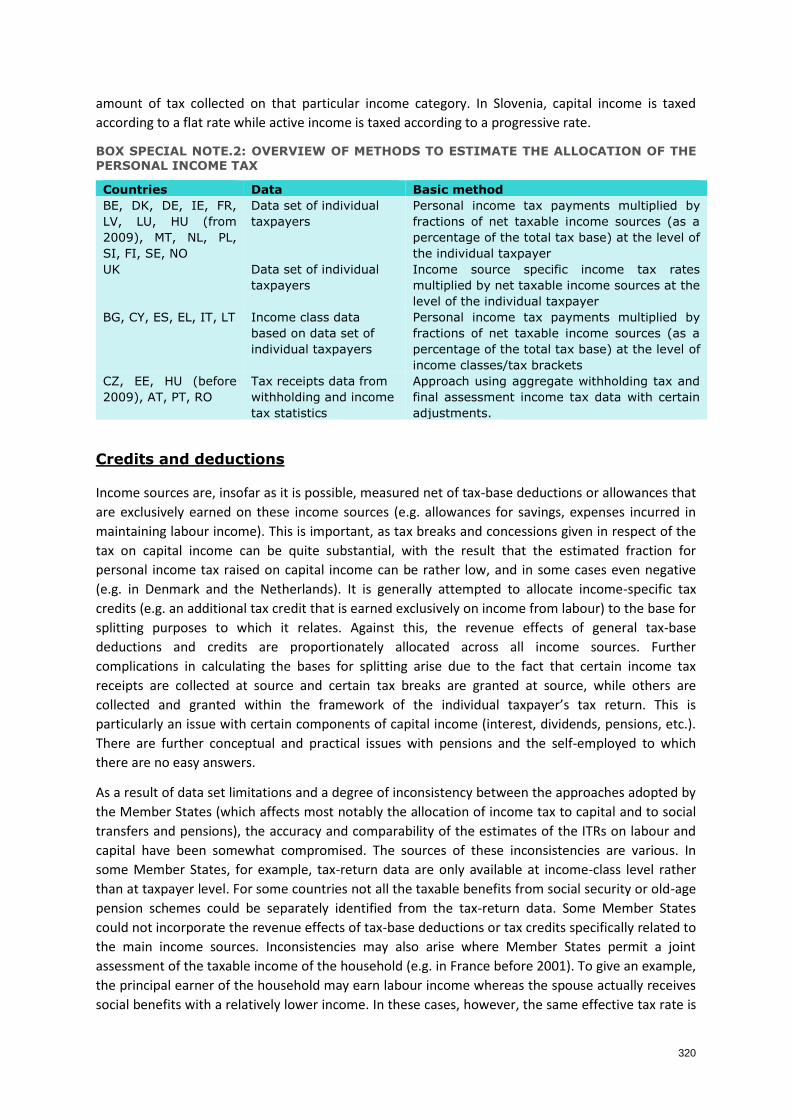
320
amount of tax collected on that particular income category. In Slovenia, capital income is taxed
according to a flat rate while active income is taxed according to a progressive rate.
BOX SPECIAL NOTE.2: OVERVIEW OF METHODS TO ESTIMATE THE ALLOCATION OF THE PERSONAL INCOME TAX
Countries Data Basic method
BE, DK, DE, IE, FR,
LV, LU, HU (from
2009), MT, NL, PL,
SI, FI, SE, NO
Data set of individual
taxpayers
Personal income tax payments multiplied by
fractions of net taxable income sources (as a
percentage of the total tax base) at the level of
the individual taxpayer
UK Data set of individual
taxpayers
Income source specific income tax rates
multiplied by net taxable income sources at the
level of the individual taxpayer
BG, CY, ES, EL, IT, LT Income class data
based on data set of
individual taxpayers
Personal income tax payments multiplied by
fractions of net taxable income sources (as a
percentage of the total tax base) at the level of
income classes/tax brackets
CZ, EE, HU (before
2009), AT, PT, RO
Tax receipts data from
withholding and income
tax statistics
Approach using aggregate withholding tax and
final assessment income tax data with certain
adjustments.
Credits and deductions
Income sources are, insofar as it is possible, measured net of tax-base deductions or allowances that
are exclusively earned on these income sources (e.g. allowances for savings, expenses incurred in
maintaining labour income). This is important, as tax breaks and concessions given in respect of the
tax on capital income can be quite substantial, with the result that the estimated fraction for
personal income tax raised on capital income can be rather low, and in some cases even negative
(e.g. in Denmark and the Netherlands). It is generally attempted to allocate income-specific tax
credits (e.g. an additional tax credit that is earned exclusively on income from labour) to the base for
splitting purposes to which it relates. Against this, the revenue effects of general tax-base
deductions and credits are proportionately allocated across all income sources. Further
complications in calculating the bases for splitting arise due to the fact that certain income tax
receipts are collected at source and certain tax breaks are granted at source, while others are
collected and granted within the framework of the individual taxpayer’s tax return. This is
particularly an issue with certain components of capital income (interest, dividends, pensions, etc.).
There are further conceptual and practical issues with pensions and the self-employed to which
there are no easy answers.
As a result of data set limitations and a degree of inconsistency between the approaches adopted by
the Member States (which affects most notably the allocation of income tax to capital and to social
transfers and pensions), the accuracy and comparability of the estimates of the ITRs on labour and
capital have been somewhat compromised. The sources of these inconsistencies are various. In
some Member States, for example, tax-return data are only available at income-class level rather
than at taxpayer level. For some countries not all the taxable benefits from social security or old-age
pension schemes could be separately identified from the tax-return data. Some Member States
could not incorporate the revenue effects of tax-base deductions or tax credits specifically related to
the main income sources. Inconsistencies may also arise where Member States permit a joint
assessment of the taxable income of the household (e.g. in France before 2001). To give an example,
the principal earner of the household may earn labour income whereas the spouse actually receives
social benefits with a relatively lower income. In these cases, however, the same effective tax rate is

321
applied to the taxpayers jointly assessed. There are further conceptual and practical problems with
the treatment of pensions for which there are no straightforward solutions.
Some Member States were not able to provide full time-series coverage for all calendar years. In
these cases a trend has been assumed using simple linear interpolations, or the fractions were
assumed to remain constant. Where the latest year was not available, the previous year’s split was
used. In reality, changes in the fractions would reflect changes either in the distribution of income or
in the tax parameters. Applying linear interpolation seems a valid method only in the absence of
major tax reforms.
Apart from certain simplifying assumptions and estimates of the share of personal income tax
limited to specific years, this new treatment of the personal income tax is a major improvement on
the methodology used prior to the 2003 edition. It is found to be vastly better than an approach
based on aggregate data in estimating the tax burden on non-wage income sources (in particular for
social transfers and pensions and for self-employment income).
Individual country approaches by type of approach
(A) Approach using micro-tax-receipts data
Belgium. The split of the personal income tax was estimated by the Ministry of Finance using detailed revenue statistics from the national tax administration based on individual tax returns. The data set covers any assessed income, and is exhaustive. In fact, the national tax administration already splits and allocates the aggregate personal income tax revenue raised on the ‘global income’ to the different income sources on a case-by-case basis, in order to derive entitlements of individual taxpayers to certain tax credits that are related to specific income sources. For example, the tax credits for pensions, sickness or unemployment are limited to the income tax that relates proportionally to the corresponding net income. This allocation of the tax revenue raised on the ‘global income’ is calculated by multiplying individual tax payments by proportions of the income types in the total taxpayer’s ‘global income’, as outlined above. The income types are measured net of tax-base deductions that are exclusively earned on these income types. Subsequently, the estimated fractions of the aggregate personal tax revenue that is raised on the selected income types depend on a proportional division of the personal income tax that is due on the ‘global income’ and the income tax due on ‘distinct income’ sources that are taxed separately. The resulting fractions are consequently applied to the sum of revenue from advance payments on earnings, advance payments of tax on self-employed persons and the amount of the final income tax assessment. The revenue from withholding tax on income from movable capital and real-estate tax is not included in the above calculations; it is directly assigned to the capital income.
Denmark. The split of the personal income tax was estimated by the Ministry of Taxation using a microsimulation model that is based on a sample of micro (taxpayer-level) data. The model incorporates the information on withholdings/prepayments and final income tax returns. The model is updated annually, and is used in planning the national tax policies and estimating policy alterations on tax revenue and on the income tax liabilities of taxpayers at different income levels. The model also covers other legislative areas, such as unemployment benefits, housing subsidies, social assistance and so on. The method basically multiplies individual tax payments by proportions of the income types in the total taxpayer income, as outlined above. The income types are measured net of tax-base deductions that are exclusively earned on these income types. By including net interest payments in the tax base of capital, for example, the Ministry of Taxation has taken into account the way the tax relief for mortgage interest payments and other interest payments on loans reduces the tax

322
base of capital. This explains why the estimated part of capital income may be lower than zero. The method takes into account that from 2001 onwards negative capital income can only be deducted in the local income taxes (and from 2007 the so-called healthcare contribution as a consequence of the municipal reform), and that from 1998 to 2001 the after-tax value of the deduction for negative capital income was gradually eroded. The so-called share income (which is taxed separately) is allocated directly to the capital income part. As regards employed labour income, it should be recognised that in 1995 and 1999 wage income was taxed as follows: on the one hand the tax base for the municipal income tax and the lower-limit central government tax was wage income less transport expenses and unemployment insurance contributions; on the other hand the tax base for the so-called middle bracket and top bracket income tax was the part of the wage income — without any reduction for expenses — that exceeded a certain amount. If one reduces the tax base with deductible ‘wage expenses’ then the part of the mean limit and an upper limit income tax that is attributed to wage income is too small, whereas if it is not taken into account the part of the municipal income tax and lower-limit central government tax that is attributed to wage income is too big. The Ministry of Taxation has chosen the latter approach as it is believed that the bias will be the smallest in this case.
Germany. The split of the personal income tax was estimated by the Federal Ministry of Finance using a microsimulation model. This model is based on a representative sample of micro (taxpayer-level) tax-return data that is used for tax-forecasting purposes and for pre-assessing the consequences of changes in income tax legislation. In addition, the model allows the assessment of the solidarity tax, child benefits, the church tax and social contributions. The simulation model incorporates the information on withholdings/prepayments and final income tax returns (in Germany nearly every private household liable to income tax must file an income tax return; employees only paying wage withholding tax are also included in the sample). The calculations do not take into account child benefits and tax-free cash grants for acquiring or constructing new occupational dwellings, which are credited against the income tax liability. These transfers are deemed to be separate transfers in the context of social policy programmes. Basically, personal income tax payments are multiplied by the selected income sources at the micro level, as outlined above. The income sources are measured net of tax-base deductions that are exclusively earned on these income sources. Germany employs a comprehensive income tax base. There are no income-specific rates such as lower flat rates on income from capital investment, as in countries with dual income tax systems, nor does Germany grant lower tax rates or tax credits on low wages. However, the tax base may be largely offset by income-specific allowances (such as the savings allowance), tax incentives or arrangements in computing income, but these effects are captured within the calculations because the average effective tax rate is multiplied by the net taxable income sources.
Ireland. The split of the personal income tax was estimated by the Inland Revenue using an exhaustive data set with micro (taxpayer-level) tax-return data. The data set covers all taxpayers for which a return was received. The method basically multiplies individual tax payments by proportions of the income types in the total taxpayer income, as outlined above. However, because there are some taxable personal income components that are taxed at a flat rate only, there is no actual split of tax revenue raised on these particular income components. The tax raised on such components is directly calculated from the tax-return data. At this stage the income types are not yet measured net of tax-base deductions that are exclusively earned on these income types. This could be done in future updates of the split of the personal income tax.
France. The split of the PIT was based on a sample of around 500 000 tax declarations (2 % of the total). The method basically multiplies individual tax payments by proportions of the income types in the total taxpayer income. The income types are measured net of tax-base

323
deductions that are exclusively earned on these income types. In addition, corrections were made for the revenue effects of tax credits that are exclusively earned on the selected income types (e.g. the payable tax credit, the prime pour l’emploi, to encourage low-paid and low-skilled workers to resume active employment). It is worth noting that France employs a joint assessment of the taxable income in the household. For example, the principal earner in the household may earn labour income whereas the spouse receives social benefits, but the total amount of personal income is jointly assessed. In the calculations for the split of the personal income tax, however, in this case the same effective tax rate is applied to the partners jointly assessed. For the 2001-2004 period data provided by the French authorities also include taxes paid on transfers. For the 1999-2000 period this was only possible if the household income included salary or self-employed labour revenue. In order to maintain comparability and consistency in the time series the split for 1999 and 2000 has been adjusted. Assuming that the changes in the shares from 2000 to 2001 are only due to the introduction of the category ‘transfers’, the absolute changes for the other three categories have been calculated accordingly and deducted from the original values provided. For the period since 2012 the PIT split computation has been further refined. The split is now computed according to the breakdown of net taxable income (and not the reported income). For example, for salaries and wages it is the amount once the deduction for business expenses is taken into account. The new ESA 2010 is applied to the split calculation, with refundable tax credits now included in public expenditure instead of lowering the PIT amount. Real-estate capital gains and the mandatory standard deduction (PFO, prélèvement forfaitaire obligatoire) are also taken into account and are directly assigned to the category “Capital tax on income of households”. Finally, in order to have a precise breakdown of D51a by economic function, a different split is computed for each tax concerned by the split (D51aa-other taxes, D51ac-CEDS, D51ad-CSG, D51af-other social levies, D51ag-personal income tax). These corrections introduce a break in the PIT series for France, notably for the shares of capital income of households and the self-employed, although the total share of capital remains almost unchanged.
Latvia. The split of the personal income tax was estimated by the Ministry of Finance. The calculations were based on data from personal income tax returns and notifications, in accordance with the individual taxpayers’ data. The notifications of personal income tax were used to calculate personal income tax revenue from the employed labour income, the tax on pension payments and the tax on capital and capital gains. Information on the personal income tax paid by the self-employed was derived from the declaration of annual income. The total PIT revenue is already shown in net form, i.e. the PIT repayments made by the State Revenue Service are already taken away.
Luxembourg. The split of the personal income tax was estimated by the National Statistical Office using detailed revenue statistics from the national tax administration (Administration des contributions directes) based on exhaustive household tax returns (in Luxembourg PIT is based on family taxation) and on withholding revenue on employed labour and transfers. For the tax returns part, the method basically multiplies individual tax payments by proportions of the income types in the total taxpayer income, as outlined above. Then the withholding revenue are considered, because it is not mandatory to compile a tax return if there is only employed labour or pension income. Since the distinction between withheld amounts raised on employed labour and pension income is not available, data from the social security organisations were used. When only the total amount withheld was available from a social security organisation, the average rate of contribution was used as a proxy.
Hungary (from 2009). The split of the personal income tax is based on a combination of a microsimulation using all individual tax returns and a correction on the aggregate figures from the microsimulation model. First the distribution of the PIT revenue attributed to the four income types is derived for each individual, then it is aggregated across all taxpayers.

324
Finally, PIT on incomes taxed at source (they include fringe benefits and most of the taxed interest income, and are not reported in the annual tax returns and were not included before 2009) is added to the relevant categories and the final PIT split is calculated from these revenue figures.
Malta. The split of the personal income tax is based on the actual data available at the local tax authorities through the individual returns. When returning their annual declarations, all taxpayers are obliged to correctly indicate the exact source of their income on their individual tax form. This information is then captured at micro level, and is used to compile the figures submitted in the national PIT questionnaire. There is no further extrapolation of the data, except in the case of withholding taxes on capital. Since the withholding tax is a flat percentage, this figure has been obtained based on the revenue generated from this particular source.
Netherlands. The split of personal income tax is estimated by the Ministry of Finance using a microsimulation model that is based on a sample with micro (taxpayer-level) data. Updates for the model based on macro data are released four times per year, while the micro data sample is updated every two or three years. The microsimulation model covers the combined tax burden of wage withholding tax, personal income tax, social contributions and wealth tax. The method multiplies individual tax payments by proportions of the income types in the total taxpayer income, as outlined above. In the Netherlands, the lowest income tax rate consists of personal income tax and social contributions; the highest two rates consist solely of personal income tax. The split has therefore been computed for both personal income tax and social contributions (which are in principle levied on all taxable personal income types). The income types are measured net of tax-base deductions that are exclusively earned on these income types. The compulsory net payments to the healthcare fund are split based on the number of people with employed labour, self-employed labour and transfers and are attributed to the social contributions. A special provision applies to the capital income of owner-occupied property. This is taxed at a notional rental value, which represents the balance of revenue and expenses connected with the use of the dwelling, and is assessed using statutory tables. As normal expenses are included in the notional rental value, no expenses other than mortgage interest and ground rent may be deducted. The deduction for mortgage interest payments explains why the estimated part of capital income is negative.
Poland. The split of the personal income tax was estimated by the Ministry of Finance. Poland has a progressive tax system, hence the estimate is obtained with a bottom-up methodology, starting from taxpayer-level data and the aggregating the results. For taxes levied as lump sums, the method used simply multiplies the individual tax due by proportions of the income types in total taxpayer income. The income types are measured net of estimated social contributions. Adjustments were made for married couples’ tax returns (their joint income was used in the calculations). Owing to an important reform in 1999, which introduced tax-deductible health insurance contributions, there are two different methodologies for the years 1995-1998 and 1999-2004. For the years after 1999, the Ministry of Finance arrives at the PIT due by subtracting the amounts due as health insurance contributions from the total revenue, and the residual then represents the amount due for the PIT. The amounts due for the health insurance contributions are then split across economic functions and reintroduced in the PIT split so that the final PIT split given is homogeneous across the entire time period.
Slovenia. The split of the personal income tax was estimated by the Ministry of Finance. The calculations were based on data sets for individual taxpayers, except in the case of pensions. As most of the PIT from pensions is only accounted for but not collected, the PIT from pensions is subtracted. Actual PIT collected from pensions is very close to prepayment of PIT

325
from pensions during the year. Therefore, these prepayments are added to PIT from the transfer and pensions category. The method multiplies PIT payments by fractions of net taxable income sources (as a percentage of the total tax base) at the level of individual taxpayers. The allowances were deducted at the individual level (except in the case of pensions). In 2006, major changes in the PIT system were introduced — a schedular system for capital income was introduced and tax prepayments became final payments. This reform resulted into two different sets of data for 2006: accrual individual data for employed labour income, self-employed income and social transfers and pensions; and cash cumulative data for capital income.
Finland. The split of the personal income tax was estimated by the Ministry of Finance using a microsimulation model that is based on a sample of micro (taxpayer-level) data. The information is collected by Statistics Finland. The model is updated annually, and is used in planning the national tax policies and estimating policy alterations on tax revenue and on the income tax liabilities of taxpayers at different income levels. The method basically multiplies individual tax payments by proportions of the income types in the total taxpayer income, as outlined above. However, because of the dual income tax system, there is no actual split of tax revenue raised on capital income. The tax raised on capital income is directly calculated from the tax-return data. The income types are measured net of tax-base deductions that are exclusively earned on these income types. The statistical information on dividend income in the model contains both the dividend income of the self-employed, which is treated as the capital part of the income, and the dividend income from investors, which is not income from self-employed labour but capital income from, for example, owning shares in a listed company. The statistical information is split into dividend income from self-employment and dividend income from savings and investments using an estimate. Since the year 2002 the method of splitting dividend income between dividends from listed companies and the dividends of the self-employed owners has been improved. Mortgage interest payments are not deducted from the capital income, since no rental value taxation of income from homeownership is applied.
Sweden. The split of the personal income tax was estimated by the Ministry of Finance using microsimulation models that are mainly based on administrative sample data. The models are updated annually, and are mainly used in planning the national tax policies and estimating policy alterations on tax revenue and on the income tax liabilities of taxpayers at different income levels. The method basically multiplies individual tax payments by proportions of the income types in the total taxpayer income, as outlined above. However, because of the dual income tax system, there is no actual split of tax revenue raised on capital income. The tax raised on capital income is directly calculated from the tax-return data. The income types are measured net of tax-base deductions that are exclusively earned on these income types. An alternative way to describe the method is to say that the individual specific average effective income tax rate is calculated to split the personal income tax across different taxable income sources. Note, however, that these average effective tax rates are computed while incorporating the revenue effects of tax credits that are exclusively earned on the selected income sources. The revenue effects of general tax credits for all taxpayers are proportionally allocated across all selected income sources.
Norway. The split of the personal income tax was estimated by the Ministry of Finance using a microsimulation model called LOTTE. The model is based on a sample from the household income statistics of Statistics Norway. The personal income tax system has two tax bases: personal income, from which no deduction may be made; and ordinary income. Ordinary income includes all types of taxable income from labour, transfers, business and capital. Certain costs and expenses, including interest paid on debt, are deductible in the computation of ordinary income. Dividends are regarded solely as capital income in the calculations. With the exception of the standard allowance, the basic allowance and the

326
allowance for gifts to voluntary organisations, all allowances are entirely allocated to one income source. The basic allowance is calculated as a certain percentage of wage and pension income with a lower and upper limit. In the calculations, the basic allowance is divided according to the size of wage and pension income, respectively, for each individual. Some basic allowance is reported separately for spouse supplementary pensions, child alimonies and pensions. These are allocated to transfer income. The allowance for gifts to voluntary organisations is a general allowance and is as such divided on all income sources. The sub-central and the central government income bracket tax are separated between the relevant income sources (labour, self-employed and transfer). The labour and transfer component in gross income is identified by the LOTTE model. Self-employed income is more difficult to identify because of some special limitation rules for this category of income included in the personal income tax base. Actual self-employed income may therefore be higher than the taxable self-employed income included in the gross personal income tax base. However, by hooking the LOTTE model to total gross personal income reported in the tax statistics, it is possible to identify the self-employed income in the tax base (by subtracting labour and transfer income from total gross personal income).
(B) Approach using tax-return data aggregated at the level of income classes or tax brackets
In some Member States tax-return data is used that is aggregated at the level of a number of income
classes or tax brackets. Basically, the recorded personal income tax payments are multiplied by the
selected income types over the sum of the taxable personal income sources at the level of income
classes or tax brackets. This approach thus implicitly assumes that a (common) average effective tax
rate applies to all selected income types at the level of the income class. The corresponding
estimates are consequently aggregated to obtain the estimate of the split of the personal income
tax. Calculations by Italy have shown that differences from using either macro-tax-return data or
microdata aggregated by income classes turn out to be significant for the taxable personal income
types that are less important from a quantitative point of view. Although the method cannot provide
the degree of accuracy of micro (taxpayer-level) data, it is believed that is likely to capture the
effects of progression of the personal income tax system and the distribution of income sources
across different groups of taxpayers.
Bulgaria. The split of the personal income tax was calculated by the Ministry of Finance using information from the tax returns filed at the National Revenue Agency, representing aggregated microdata per tax return. The tax base of the different types of income besides labour income is divided over the total tax base, and the ratio serves as a weight to measure the share of the relevant income in the total tax due. The sum of the weighted tax revenue is the tax due for all income except labour income. For employees receiving only labour income, the PIT is withheld by the employer. The share of every type of non-labour income mentioned previously is applied to the cash revenue from all types of income besides labour income. The revenue from labour income and from non-labour income form the total revenue. The share of the labour-income revenue in total PIT revenue is known, the share of the total non-labour-income revenue in total PIT revenue is also known, along with the share of each type of non-labour income within the total non-labour-income revenues. The relevant shares serve as the PIT split.
Greece. The split of the personal income tax was estimated by the Ministry of Finance in cooperation with EL.STAT and Professor Geogakopoulos from the Athens University of Economics. The calculations were based on data from personal income tax returns, which were grouped by category of income and tax bracket. Basically, the method multiplies tax payments by proportions of the income types in the total taxpayer income, as outlined

327
above, but aggregated at the level of income classes. The income types are measured as net taxable personal incomes. In order to split between income from employed labour and transfers, data from the General Secretariat of Information Systems were used. The final percentages are comprehensive of tax on savings, which is included in category D.51a in addition to tax revenue from personal income tax; the total amount of this category constitutes tax on capital and, given that this tax is not calculated on the total income of households, it was added to income tax from capital in the calculations.
Spain. The split of the personal income tax was estimated by the Ministry of Finance, and the methodology was revised as of 2010. The estimates cover not only the population of PIT taxpayers — those who submit a PIT return — but also those PIT taxpayers not directly obliged to do so but whose contribution to the tax is made only through monthly withholding taxes and advance tax payments. The allocation of tax liabilities arising from earned income — wages and social benefits — is made directly through observed advance tax-payment data files rather than by calculating the weights based on the values of such income in accordance with the Spanish national accounts, as had been done until 2010. This latter change appreciably affects the final estimates, and now reflects much more accurately the allocation of each of those income sources, since, as noted repeatedly in previous years, national accounts data overstate the tax burden of pensions and other social benefits in the PIT. This is because it is not possible to deduct those pensions exempt from the tax, and furthermore under the former methodology it was not possible to take into account the different effective tax rates applied to both salaries and pensions, given that pensions usually pile up in lower income levels and therefore their taxation is substantially lower when applying a progressive tax schedule. Therefore, as of 2010 only tax data provided by the Spanish Tax Administration is used. The methodology is divided into three basic stages: (1) the final tax liability (by income sources) from PIT filers is directly obtained from tax-data records broken down into 47 income brackets; (2) for non-PIT filers the final PIT tax liability distribution is obtained as the difference between the total amount of periodic withholding tax payments (filers and non-filers) and the advance payments of the latter obtained through annual tax returns submitted by third parties; (3) the allocation of final tax liabilities arising from earned income among wages/salaries and social benefits is directly obtained through the annual observed tax statistics covering the whole tax population (filers and non-tax filers) related to periodic withholding and advance tax payments, and according to their own weight.
Italy. The split of the personal income tax was estimated by the Ministry of Finance using a microdata set containing IRPEF tax-return data for all taxpayers. Instead of computing an average tax rate for each individual taxpayer, the information was allocated to 35 classes of gross income. Basically, the recorded personal income tax payments were multiplied by the selected net taxable income sources over the sum of the net taxable income sources at the income class level. The income types are measured net of tax-base deductions that are exclusively earned on these income types. In addition, corrections were made for the revenue effects of tax credits that are exclusively earned on the selected income types. In addition to the recorded IRPEF tax revenues, IRPEF payments received by the treasury on denominations other than IRPEF were incorporated into the calculations. These include tax on dividend distributions and dividend withholdings, which were directly allocated to the capital income category. Since 2015, the labour cost concerning permanent contract workers has not been included in the IRAP tax base. The IRAP split is estimated on the basis of tax returns, therefore taking into account the labour cost deduction. On the other hand, 2015 IRAP revenue data may not fully reflect the legislative change because of the tax advance payment system. IRAP revenues, based on time-adjusted cash figures, declined substantially in 2016, with one year delay from the tax base reduction. Therefore, the capital component

328
amount of IRAP (which is based on tax returns) is overestimated in 2015 and underestimated in 2016.
Cyprus. The split of the personal income tax was estimated by the Ministry of Finance. The calculations were based on tax-assessment data, which were grouped by category of income and by tax bracket into 26 income classes. The recorded personal income tax payments are multiplied by the taxable income sources for each class and then divided by the aggregate taxable income of the class. The income types are measured as net taxable personal incomes. All deductions have been allocated to the correct base class and category for the purposes of the split. The personal allowances have been allocated in proportion to the income sources.
Lithuania. The split of the personal income tax was estimated by the Ministry of Finance utilising data from the State Tax Inspectorate. Data coverage is very high (99.9 % to 100 % of actual payments by the different revenue group of personal income tax). Lithuania’s calculations are simplified by the existence of a dual rate system for earned and unearned income. The categorisation of income taxes allowed most elements to be allocated to their economic functions without the need for further individual or income class breakdowns. The split of personal income tax calculation breaks down the total amount of the tax refund across the various revenue groups. Payments from non-employment related or n.e.c. income were attributed to the payments from capital and income from individual activities, in proportion to the interrelation between respective incomes calculated according to tax-return data. Adaptations to the methodology were made from 2002 to 2003 as a result of changes in the legislation that allowed deductions for life-insurance and pension contributions and for certain interest payments. Note that for the year 1999 data limitations required a special estimate that was based on a different methodology.
Taxes and social contributions paid by the self-employed are allocated to the capital and business
income category (67). Italy proposed to split tax revenues from income of self-employed in 80 % and
20 %, because most of the self-employed in Italy are more comparable to dependent employed
workers. The 80 % are related to labour and the 20 % are linked to capital income of the self-
employed. The mixed income of the self-employed should be split accordingly. Social contributions
of the self-employed are attributed to labour in the Italian method.
(C) Approach using aggregate withholding tax and final assessment income tax data with certain
adjustments
In some Member States the estimates of the split of the personal income tax were computed on the
basis of aggregate statistics of withholding tax and the final personal income tax by assessment.
Czechia. The split of the personal income tax was estimated by the Ministry of Finance. Three PIT accounts exist: the first, wage tax withheld by the employer, is purely labour; the second, withholding tax, is presumed to be purely capital; and the tax paid per tax return was split. The calculations were based on data from personal income tax returns, which were grouped by category of income and by tax bracket into 20 classes. The method multiplies tax payments by proportions of the income types in the total taxpayer income, aggregated at the level of income classes. The income types are measured as net taxable personal incomes. In calculating the split between income from employed labour and transfers, it was found that almost all the transfers were tax exempt (0.001 % of the total PIT
(67) Except the income and taxes of ‘continuous and coordinated collaborations’ that are allocated to the labour category. The
income of these self-employed workers is treated, for tax purposes, as income of employed workers.

329
revenue) so all were allocated to employed labour. All deductions have been allocated to the correct base class and category for the purposes of the split.
Estonia. The split of the personal income tax was estimated by the Ministry of Finance using micro-level data from the income tax returns and withholding tax statistics. Different approaches were used for determining the PIT splits depending on data availability. Thanks to the very good quality and detail of the data for 2004, the split for that year is the most thorough. Firstly, withholding tax returns were used to derive the split in the case of resident natural persons who did not submit the 2004 income tax return. As in the case of withholding tax returns, the income is already divided between 19 different income categories; the data was grouped into income from labour, capital and transfers. Secondly, withholding tax returns where payments to non-resident natural persons are declared and divided into 11 different income sources were used, and the PIT split obtained. In both cases the permitted deductions are taken into account in finding the PIT split. In the third step, based on the income tax returns, PIT from self-employed labour was first estimated. As from 2004, the increased basic exemption in event of pension is declared on the income tax return; it was assumed that only resident natural persons who are entitled to pensions declare it and would be able to use this deduction. In the case of other income sources, i.e. income from Estonia, gains from transfer of property, other income and income from abroad, all the deductions (including the basic tax allowance) were allocated proportionally over the income sources, except the special deduction for self-employed persons in agriculture, which was allocated to their income. The split for the years 2001-2003 was made based on withholding tax returns of non-resident natural persons and on income tax returns. The estimates concerning 1996-2000 were made based solely on the income tax returns data.
Hungary (before 2009). The split of the personal income tax was estimated by the Ministry of Finance using aggregate statistical information from individual personal income tax returns and the declarations of enterprises on withholding tax. The share of the personal income tax on labour is related to the total revenue from the personal income tax by the deduction of shares pertaining to capital and to self-employed income together with a weighted proportion of the tax credits from the latter.
Austria. The split of the personal income tax was estimated by the Ministry of Finance using statistical information from the wage withholding tax and the final income tax by assessment. Taxes raised on income from employed labour are withheld by the employer at source, and the wage tax system is designed to approximate the final personal income tax as closely as possible, but in some cases certain repayments have to be made by the tax administration. This can, for example, occur if the taxpayer receives income from several jobs or pensions during a single year, or if there are different payments per month or deductions for special expenses, etc. As these repayments concern only wage taxpayers, the total net amount of the repayments was deducted from the total recorded wage tax, and the recorded income tax was adjusted accordingly. Also, the income from employment includes income in the form of social transfers and pension benefits received. The recorded revenue of the wage tax was also corrected for the relevant amount to arrive at the fraction of income tax levied on labour income. The revenue of the personal income tax by assessment largely reflects entrepreneurial income and income from capital. The (corrected) recorded revenue from the personal income was split between the two sources, using tax-return data aggregated at the level of a number of income classes, as outlined above.
Portugal. The split of the personal income tax was estimated by the Ministry of Finance using information from personal income tax returns, except for the amount of tax raised on capital income, which was estimated using information on both withholding taxes and personal income tax returns. The estimates are based on three data sets: (1) aggregate net

330
taxable incomes by category of income; (2) tax liabilities by category of income or groups of categories, depending on the type of tax returns — some households only earn income from one category of income (e.g. income from labour), so the tax liability is directly imputable to that category, but other households simultaneously earn income from more than one category (e.g. income from labour and income from self-employed labour); (3) aggregate data from withholding tax returns relating to incomes subject to a final withholding tax, which, in general, are not reported in tax returns (e.g. interest on bank deposits). The split of the personal income tax was estimated according to the following procedure. As the first step, the tax liability of households with one source of taxable personal income was directly allocated. As the second step, the net taxable incomes of households with one source of income were subtracted from the aggregates of the net taxable incomes by category of income. Third, the aggregate tax liability of households that earn more than income was split. This split was made in proportion to the aggregate taxable incomes for each category that resulted from the second step. In this step it was thus assumed that all categories of income are subject to a common average effective tax rate. Finally, the revenue from the final withholding tax was added to the relevant categories. It should be noted that this assumes that none of the income subject to a final withholding tax is reported in the tax return and so could result in double counting. However, in practice, it is believed that the amounts concerned are not of great magnitude.
Romania. The split of personal income tax was estimated by the Ministry of Finance in collaboration with the national statistical office using aggregate statistical information on the general personal income tax revenues and the afferent taxable base, divided among the relevant categories.
Estimates of the split of personal income tax
The following tables present the resulting estimates for the split of the personal income tax. Looking
at the estimates there are some noticeable differences, in particular for the income tax allocated to
capital and social transfer and pension benefits. By including net interest payments in the tax base of
capital, for example, some Member States (e.g. Denmark and the Netherlands) have taken into
account the way the tax relief for mortgage interest payments and other interest payments on loans
effectively reduces the tax base of capital. This explains why the estimated fraction for personal
income tax raised on capital income is sometimes relatively low (or even negative) for a number of
Member States. In some Member States such deductions are less significant or non-existent, while
others were unable to take the revenue effects of such specific tax-base deductions yet into account.
Also, some Member States were unable to estimate the amount of personal income tax on (taxable)
social transfers, while others could not distinguish between different types of pension benefits.
Inevitably this may have had some consequences for the implicit tax rates on labour and capital. The
estimates for the amount of personal income tax allocated to capital income and to social transfers
and pensions would benefit from future work. What is also noteworthy from the table is the fact
that the personal income tax revenue allocated to (employed) labour income appears to be
relatively low in Greece and Poland.

331
TABLE 1: PERSONAL INCOME TAX REVENUE ALLOCATED TO EMPLOYED LABOUR INCOME
(% of total revenue of personal income tax)
NB: The numbers printed in bold are the actual estimates; the numbers printed in italics represent either linear interpolation or fractions that were assumed to remain constant Source: European Commission services.
TABLE 2: PERSONAL INCOME TAX REVENUE ALLOCATED TO INCOME OF THE SELF-
EMPLOYED
(% of total revenue of personal income tax)
NB: The numbers printed in bold are the actual estimates; the numbers printed in italics represent either linear interpolation
or fractions that were assumed to remain constant.
Source: European Commission services.
2008 2009 2010 2011 2012 2013 2014 2015 2016 2017 2018 2019 2020
BE 77.6 77.9 78.0 78.1 77.3 77.0 76.1 75.3 74.0 73.5 72.7 72.8 72.8
BG 82.5 86.5 87.7 85.7 85.6 86.4 87.4 87.8 88.5 88.6 88.7 89.1 89.2
CZ 93.0 93.1 96.2 95.3 95.4 95.5 96.9 95.5 95.5 95.7 95.4 96.5 97.3
DK 75.9 75.0 71.9 71.6 71.2 69.4 68.0 67.5 68.1 68.1 68.1 68.1 68.1
DE 71.2 73.2 72.7 72.7 72.7 72.7 72.5 71.6 71.5 71.3 71.6 73.8 73.9
EE 88.5 86.7 86.1 86.8 88.2 88.4 88.5 87.7 87.8 87.9 85.6 84.8 81.1
IE 81.1 81.7 82.3 82.9 83.4 83.2 83.7 80.9 83.6 83.9 84.1 84.3 84.3
EL 50.0 50.3 50.5 47.7 50.2 50.2 50.2 50.2 50.2 50.2 50.2 50.2 50.2
ES 70.9 72.4 73.0 72.1 70.7 69.5 68.4 67.6 67.3 66.6 65.7 65.9 67.2
FR 58.1 57.8 54.2 55.5 56.8 57.8 57.9 57.8 58.1 58.4 59.2 60.2 60.1
HR 84.3 85.1 84.7 84.9 83.6 80.4 80.4 76.3 75.0 72.9 73.7 73.9 75.6
IT 55.6 55.1 54.7 54.5 55.0 54.4 53.5 53.9 53.8 54.4 54.2 55.2 55.2
CY 91.5 91.5 91.5 91.5 91.5 91.5 91.5 91.5 91.5 91.5 91.5 91.5 91.5
LV 96.3 94.4 89.0 87.1 87.1 86.8 86.1 86.4 85.7 84.5 84.5 80.6 88.0
LT 84.0 71.0 76.9 77.9 76.3 78.4 77.2 76.4 75.1 72.8 73.4 82.4 81.8
LU 74.5 73.3 73.2 72.7 72.8 73.2 72.4 72.2 71.9 72.1 74.1 74.4 74.4
HU 82.8 79.4 82.8 82.8 84.4 84.0 83.9 84.1 83.8 84.0 83.3 83.0 83.3
MT 69.7 69.3 69.7 69.8 70.3 70.2 70.4 69.7 70.3 69.8 71.4 73.5 74.2
NL 68.7 73.2 71.4 72.4 71.7 69.5 63.9 67.0 66.7 61.2 63.3 62.9 64.8
AT 63.1 62.0 61.7 62.5 62.6 62.2 61.7 61.7 60.3 60.4 60.7 59.7 61.3
PL 49.3 48.4 48.9 47.8 48.5 47.7 48.0 47.3 47.9 47.8 47.0 47.8 64.8
PT 58.9 59.1 61.2 59.1 54.8 55.6 55.4 57.3 59.0 60.0 60.5 61.3 61.3
RO 67.4 69.0 74.8 73.7 74.4 74.6 67.3 64.3 58.9 65.3 68.0 63.7 70.7
SI 83.7 87.2 87.8 87.9 86.4 89.8 88.4 87.3 88.0 86.7 85.6 83.4 83.4
SK 88.1 93.9 94.3 93.8 94.4 93.8 93.9 94.3 95.0 96.4 96.2 96.8 98.1
FI 69.1 69.1 67.3 66.7 66.4 65.5 63.5 62.3 61.8 61.0 60.6 60.6 59.2
SE 69.8 68.9 69.1 71.6 71.6 70.9 70.2 68.6 68.6 68.8 70.6 71.2 71.4
NO 74.9 73.4 72.7 73.6 73.6 73.9 73.6 68.4 70.1 71.6 72.0 72.3 72.3
2008 2009 2010 2011 2012 2013 2014 2015 2016 2017 2018 2019 2020
BE 12.0 11.8 12.1 11.9 12.0 12.2 13.0 13.2 13.7 13.7 15.7 15.6 15.6
BG 11.0 8.4 8.7 10.4 10.8 10.2 9.3 8.8 8.6 7.8 7.8 7.5 7.3
CZ 4.6 4.6 1.9 2.5 2.3 2.1 0.9 2.0 2.2 1.9 2.1 1.3 0.5
DK 4.3 4.0 4.3 4.3 4.0 4.4 4.9 4.8 4.9 4.9 4.9 4.9 4.9
DE 19.7 18.3 20.5 20.5 20.3 20.1 20.0 20.7 20.4 20.3 19.9 17.2 16.8
EE 1.3 1.0 1.1 1.6 1.3 0.9 0.8 0.8 0.7 0.7 0.8 0.7 0.6
IE 10.8 10.4 9.9 9.5 8.6 8.7 8.7 8.5 8.8 8.6 8.5 8.3 8.3
EL 19.5 17.8 16.2 20.7 15.0 15.0 15.0 15.0 15.0 15.0 15.0 15.0 15.0
ES 9.1 7.9 7.9 7.4 7.6 7.7 8.0 8.7 8.8 9.1 9.1 9.0 8.2
FR 14.8 14.2 14.9 12.7 10.5 10.4 10.2 10.3 10.1 9.7 9.5 9.5 8.9
HR 5.1 4.3 4.2 4.3 4.3 5.4 4.8 5.2 5.1 5.0 5.3 5.0 4.8
IT 16.8 15.2 15.2 15.3 15.1 14.6 14.5 14.5 14.5 14.0 14.5 12.9 12.9
CY 5.1 5.1 5.1 5.1 5.1 5.1 5.1 5.1 5.1 5.1 5.1 5.1 5.1
LV 1.7 2.0 3.2 3.3 3.1 2.7 2.9 2.6 2.7 2.7 3.0 3.0 3.1
LT 4.1 4.5 3.6 3.4 4.2 3.8 4.6 3.8 4.3 4.9 4.5 3.1 3.6
LU 6.9 9.5 8.5 8.8 7.7 8.0 8.3 7.9 8.1 8.3 6.7 8.9 8.9
HU 3.1 3.3 3.8 5.5 5.6 5.7 5.5 5.6 5.3 4.9 5.0 4.9 4.7
MT 7.9 7.9 7.6 7.4 7.3 7.2 7.3 7.7 7.9 8.1 8.5 7.9 6.9
NL 26.2 20.6 21.3 19.7 18.7 19.9 24.1 19.0 18.4 19.6 20.6 20.8 16.9
AT 15.5 16.8 16.6 15.7 15.2 15.5 15.9 16.0 18.5 18.6 18.4 19.0 17.1
PL 28.5 27.7 27.1 27.9 26.2 26.3 27.8 29.0 29.4 30.5 32.4 32.4 16.9
PT 8.3 7.6 7.4 6.2 5.8 5.7 5.6 5.6 6.0 6.2 6.3 6.2 6.2
RO 5.8 4.3 4.8 4.6 4.4 4.7 4.3 3.7 3.0 2.7 2.9 5.9 5.4
SI 6.0 4.7 4.2 4.0 3.6 3.7 4.2 4.0 3.9 4.0 4.1 4.3 4.3
SK 10.1 4.6 4.2 5.0 4.3 4.7 4.8 4.6 3.9 2.5 2.7 2.2 0.9
FI 7.2 7.2 6.9 7.5 7.5 7.3 7.8 7.1 7.2 7.5 7.4 7.4 8.2
SE 2.7 2.6 2.6 2.7 2.6 2.4 2.3 2.3 2.2 2.1 2.1 1.9 1.9
NO 7.1 6.9 6.9 7.0 6.7 6.3 6.2 5.9 6.0 6.0 5.9 5.8 5.8

332
TABLE 3: PERSONAL INCOME TAX REVENUE ALLOCATED TO SOCIAL TRANSFERS AND
PENSIONS
(% of total revenue of personal income tax)
NB: The numbers printed in bold are the actual estimates; the numbers printed in italics represent either linear interpolation
or fractions that were assumed to remain constant.
Source: European Commission services.
TABLE 4: PERSONAL INCOME TAX REVENUE ALLOCATED TO CAPITAL INCOME
(% of total revenue of personal income tax)
NB: The numbers printed in bold are the actual estimates; the numbers printed in italics represent either linear interpolation
or fractions that were assumed to remain constant .
Source: European Commission services.
2008 2009 2010 2011 2012 2013 2014 2015 2016 2017 2018 2019 2020
BE 13.5 14.1 14.2 14.5 14.6 14.1 15.0 15.4 15.8 16.1 14.4 14.9 14.9
BG 0.0 0.0 0.0 0.0 0.0 0.0 0.0 0.0 0.0 0.0 0.0 0.0 0.0
CZ 0.0 0.0 0.0 0.0 0.0 0.0 0.0 0.0 0.0 0.0 0.0 0.0 0.0
DK 22.2 25.0 24.5 25.2 25.5 25.9 26.2 25.5 25.0 25.0 25.0 25.0 25.0
DE 3.3 3.5 3.8 3.8 4.0 4.0 4.2 4.3 4.6 4.7 4.8 5.1 5.4
EE 7.2 11.0 10.9 9.3 8.8 8.8 8.7 8.8 9.2 8.9 11.1 11.1 12.5
IE 1.1 1.4 1.6 1.9 2.0 2.2 2.2 2.0 2.0 2.0 2.0 2.0 2.0
EL 19.1 20.6 22.1 19.7 23.1 23.1 23.1 23.1 23.1 23.1 23.1 23.1 23.1
ES 6.6 7.4 8.9 9.8 10.9 11.9 12.3 12.1 12.4 12.3 12.1 12.2 13.5
FR 17.7 18.5 20.0 18.5 17.0 18.4 19.0 19.3 19.7 19.6 18.9 18.2 19.3
HR 2.8 2.9 3.0 2.5 2.9 3.2 3.1 2.4 2.4 2.3 2.5 2.8 3.0
IT 22.5 24.4 24.9 25.5 26.2 27.0 28.2 28.0 28.1 28.1 27.9 28.7 28.7
CY 2.5 2.5 2.5 2.5 2.5 2.5 2.5 2.5 2.5 2.5 2.5 2.5 2.5
LV 2.0 3.6 4.7 5.2 5.3 5.3 5.6 5.7 6.0 6.1 5.7 5.5 6.5
LT 4.3 5.5 5.3 4.3 3.6 2.3 3.0 3.4 3.3 3.1 3.2 2.3 3.1
LU 11.3 11.5 11.5 12.2 12.6 12.6 12.6 12.8 12.9 11.9 11.5 11.8 11.8
HU 8.4 3.4 2.6 0.8 1.0 1.0 0.9 0.8 0.9 0.9 0.9 1.0 1.2
MT 16.3 16.8 17.2 17.3 18.0 18.2 18.6 18.7 19.1 19.7 17.9 16.9 17.5
NL 17.0 18.9 18.6 19.4 20.2 20.8 19.3 20.3 19.7 22.5 19.4 18.1 19.5
AT 18.1 18.4 19.0 19.3 19.7 19.8 20.1 20.0 18.5 18.4 18.2 18.5 19.0
PL 15.6 17.3 17.5 17.6 18.2 18.6 18.5 18.0 17.6 16.2 15.6 15.8 -1.3
PT 15.7 16.7 18.4 19.8 19.8 23.4 23.8 24.8 24.9 24.6 24.0 23.6 23.6
RO 1.9 4.5 5.8 5.3 5.5 6.4 5.7 5.5 5.3 3.1 3.3 3.6 5.5
SI 2.2 2.3 2.5 2.8 2.7 1.1 1.5 1.5 1.5 1.5 1.6 1.7 1.7
SK 0.0 0.0 0.0 0.0 0.0 0.0 0.0 0.0 0.0 0.0 0.0 0.0 0.0
FI 17.4 19.0 20.0 20.1 20.8 21.6 22.1 23.1 23.7 24.6 24.6 24.6 24.4
SE 22.9 24.1 22.5 20.9 21.4 21.6 20.5 19.9 19.9 19.6 19.1 18.8 19.5
NO 9.8 10.5 10.8 9.6 10.0 9.7 10.0 13.4 13.1 10.5 10.4 10.5 10.5
2008 2009 2010 2011 2012 2013 2014 2015 2016 2017 2018 2019 2020
BE -3.0 -3.7 -4.4 -4.5 -3.9 -3.3 -4.1 -3.8 -3.5 -3.4 -2.8 -3.4 -3.4
BG 6.5 5.0 3.6 3.9 3.6 3.3 3.3 3.3 3.0 3.6 3.5 3.4 3.5
CZ 2.4 2.3 1.9 2.2 2.3 2.4 2.1 2.6 2.3 2.3 2.5 2.1 2.2
DK -2.3 -3.9 -0.7 -1.1 -0.8 0.3 1.0 2.2 2.1 2.1 2.1 2.1 2.1
DE 5.8 5.0 3.0 3.0 3.0 3.2 3.3 3.4 3.5 3.7 3.7 3.9 3.9
EE 3.1 1.3 1.9 2.3 1.8 1.9 2.0 2.7 2.3 2.5 2.5 3.4 5.8
IE 7.0 6.6 6.1 5.7 6.0 5.9 5.4 8.6 5.6 5.5 5.4 5.4 5.4
EL 11.4 11.3 11.2 11.9 11.7 11.7 11.7 11.7 11.7 11.7 11.7 11.7 11.7
ES 13.4 12.4 10.2 10.7 10.8 10.9 11.3 11.7 11.5 11.9 13.0 12.9 11.1
FR 9.4 9.4 10.9 13.3 15.8 13.4 12.9 12.5 12.2 12.3 12.4 12.1 11.7
HR 7.7 7.6 8.2 8.3 9.2 11.0 11.8 16.1 17.5 19.8 18.5 18.3 16.7
IT 5.1 5.2 5.3 4.7 3.8 4.0 3.9 3.6 3.6 3.5 3.4 3.1 3.1
CY 0.9 0.9 0.9 0.9 0.9 0.9 0.9 0.9 0.9 0.9 0.9 0.9 0.9
LV 0.0 0.0 3.1 4.4 4.5 5.1 5.4 5.2 5.5 6.7 6.8 10.9 2.4
LT 7.7 19.1 14.2 14.4 15.9 15.5 15.1 16.5 17.3 19.2 18.9 12.2 11.4
LU 7.3 5.6 6.7 6.3 6.9 6.3 6.7 7.2 7.2 7.7 7.7 4.9 4.9
HU 5.7 13.9 10.8 10.9 9.0 9.2 9.6 9.5 10.0 10.2 10.8 11.1 10.8
MT 6.1 6.0 5.4 5.5 4.4 4.3 3.7 4.0 2.7 2.5 2.2 1.7 1.4
NL -11.9 -12.7 -11.3 -11.6 -10.6 -10.2 -7.3 -6.3 -4.8 -3.2 -3.3 -1.8 -1.3
AT 3.3 2.9 2.7 2.5 2.5 2.5 2.3 2.3 2.7 2.7 2.7 2.8 2.5
PL 6.6 6.7 6.5 6.7 7.1 7.4 5.6 5.7 5.1 5.5 5.0 4.1 19.5
PT 17.0 16.6 12.9 14.9 19.7 15.3 15.2 12.3 10.1 9.2 9.1 8.9 8.9
RO 24.8 22.2 14.6 16.4 15.7 14.4 22.7 26.4 32.8 28.9 25.8 26.8 18.5
SI 8.2 5.8 5.6 5.4 7.3 5.3 5.9 7.2 6.7 7.7 8.7 10.6 10.6
SK 1.8 1.5 1.5 1.2 1.3 1.4 1.3 1.1 1.1 1.0 1.1 1.1 1.0
FI 6.3 4.7 5.8 5.7 5.3 5.6 6.6 7.6 7.4 7.0 7.3 7.4 8.3
SE 4.6 4.4 5.7 4.7 4.4 5.1 6.9 9.2 9.4 9.6 8.2 8.1 7.1
NO 8.2 9.1 9.6 9.8 9.7 10.1 10.2 12.3 10.8 11.9 11.6 11.5 11.5

333