1. INTRODUCTION AND EXPLANATORY NOTES
18
1. INTRODUCTION AND EXPLANATORY NOTES The Shipboard Scientific Party 1 Site 398 was drilled during Leg 47B of the Deep Sea Drilling Project 20 km south of Vigo Seamount (Figure 1) which is on the southern end of the Galicia Banks on the western Iberian continental margin. A total of 1740 meters of sediment was penetrated with excellent core recovery in water depth of 3900 meters. The sequence penetrated ranged in age from Hauterivian to Recent. A complete description of the objectives and results of the drilling is reported in the Site Report, wherein informa- tion on biostratigraphic zonations and absolute age scales used throughout this volume are included. Sigal (this volume) has developed a Cretaceous foraminiferal biostratigraphy for Site 398 which is shown here in Figure 2 and described elsewhere in the volume (Sigal, this volume). Physical properties measurement methods (Moun- tain), the design and operation of the in-situ pore-water samples (Barnes), and explanatory notes are included herein. EXPLANATORY NOTES Responsibilities for Authorship The Site Report in this volume presents the basic shipboard data and discussion of the general results of drilling during Leg 47B. The authorship of the site chapter is collectively that of the shipboard scientists with ultimate responsibility lying with the co-chief scien- tists, W.B.F. Ryan and J.-C. Sibuet. Compilation and checking was by Michael Arthur with the help of the editors, Fred Laughter and Evelyn Fagerberg. The order and authorship of each section of the Site Report are shown below: Site Summary Data Background and Objectives (Ryan and Sibuet) 'William B.F. Ryan (Co-Chief Scientist), Lamont-Doherty Geo- logical Observatory, Palisades, New York; Jean-Claude Sibuet (Co- Chief Scientist), CNEXO, Brest, France; Michael A. Arthur, Prince- ton University, Princeton, New Jersey (present address: Scripps In- stitution of Oceanography, La Jolla, California); Boris G. Lopatin, Research Institute of the Geology of the Arctic, Leningrad, USSR; David G. Moore, Scripps Institution of Oceanography, La Jolla, California; Andres Maldonado, Instituto "Jaime Almera," Barcelona, Spain; Jean-Pierre Rehault, Université de Paris VI, Villefranches-sur-Mer, France; Silvia Iaccarino, University of Parma, Parma, Italy; Jacques Sigal, Institut Français du Pe'trole, Rueil- Malmaison, France; Gerald E. Morgan, University of Leeds, Leeds, United Kingdom; Gretchen Blechschmidt, University of Washington, Seattle, Washington; Carol A. Williams, Lamont-Doherty Geological Observatory, Palisades, New York; David Johnson, Exxon Produc- tion Research Company, Houston, Texas; Ross O. Barnes, Walla Walla College, Anacortes, Washington; and Daniel Habib, Queens College of the City University of New York, Flushing, New York. Operations (Ryan) Lithology (Arthur with de Graciansky, Maldanado, Mountain, Rehault, and Lopatin; Summary chart compiled by Arthur) Geochemistry (Arthur) Physical Properties (Williams and Mountain) Biostratigraphy: Nannofossils (Blechschmidt) Planktonic foraminifers (Iaccarino and Sigal) Benthic foraminifers (Sigal) Palynology (Habib) Paleomagnetism (Morgan) Correlation of Seismic Reflection Profiles With Drilling Results (Sibuet and Williams) Downhole Temperature Measurements (Ryan) Summary and Conclusions (Sibuet) Survey and Drilling Data Surveys The presite survey data, kindly supplied to the Leg 47 scientific staff by the various organizations and institu- tions active in the area and on which the site selection was based, is acknowledged in the site chapter. A shipboard precision echo-sounder, together with seismic profiling equipment, was used to determine specific site locations. These data are discussed in the sections dealing with site approach. En route between sites, continuous observations were made of depth, magnetic field intensity, and sub-bottom structure. Underway depths were recorded on a Gifft precision graphic recorder (PGR). The depths were read on the basis of an assumed 800 fathoms/s sounding velocity. The sea depth (in m) was corrected (1) according to the tables of Matthews (1939) and (2) for the depth of the hull transducer, 6 meters below sea level. In addition, any depths referred to the drilling platform have been calculated under the assumption that this level is 10 meters above the water line. The seismic profiling system aboard Glomar Challen- ger consisted of two Bolt airguns, a Scripps-designed hydrophone array, Bolt amplifiers, two bandpass filters, and two EDO recorders, usually recording at two different filter settings. Drilling Characteristics The taking of cores in a particular hole may be con- tinuous, but more often is interspersed by drilled, but uncored, intervals of variable length (spot coring). Due to circulation of water down the hole, drill cut- tings are flushed out of the hole onto the sea bed (an "open system") and cannot be examined.
Transcript of 1. INTRODUCTION AND EXPLANATORY NOTES

1. INTRODUCTION AND EXPLANATORY NOTES
The Shipboard Scientific Party1
Site 398 was drilled during Leg 47B of the Deep SeaDrilling Project 20 km south of Vigo Seamount (Figure1) which is on the southern end of the Galicia Banks onthe western Iberian continental margin. A total of 1740meters of sediment was penetrated with excellent corerecovery in water depth of 3900 meters. The sequencepenetrated ranged in age from Hauterivian to Recent. Acomplete description of the objectives and results of thedrilling is reported in the Site Report, wherein informa-tion on biostratigraphic zonations and absolute agescales used throughout this volume are included. Sigal(this volume) has developed a Cretaceous foraminiferalbiostratigraphy for Site 398 which is shown here inFigure 2 and described elsewhere in the volume (Sigal,this volume).
Physical properties measurement methods (Moun-tain), the design and operation of the in-situ pore-watersamples (Barnes), and explanatory notes are includedherein.
EXPLANATORY NOTES
Responsibilities for Authorship
The Site Report in this volume presents the basicshipboard data and discussion of the general results ofdrilling during Leg 47B. The authorship of the sitechapter is collectively that of the shipboard scientistswith ultimate responsibility lying with the co-chief scien-tists, W.B.F. Ryan and J.-C. Sibuet. Compilation andchecking was by Michael Arthur with the help of theeditors, Fred Laughter and Evelyn Fagerberg. The orderand authorship of each section of the Site Report areshown below:
Site Summary DataBackground and Objectives (Ryan and Sibuet)
'William B.F. Ryan (Co-Chief Scientist), Lamont-Doherty Geo-logical Observatory, Palisades, New York; Jean-Claude Sibuet (Co-Chief Scientist), CNEXO, Brest, France; Michael A. Arthur, Prince-ton University, Princeton, New Jersey (present address: Scripps In-stitution of Oceanography, La Jolla, California); Boris G. Lopatin,Research Institute of the Geology of the Arctic, Leningrad, USSR;David G. Moore, Scripps Institution of Oceanography, La Jolla,California; Andres Maldonado, Instituto "Jaime Almera,"Barcelona, Spain; Jean-Pierre Rehault, Université de Paris VI,Villefranches-sur-Mer, France; Silvia Iaccarino, University of Parma,Parma, Italy; Jacques Sigal, Institut Français du Pe'trole, Rueil-Malmaison, France; Gerald E. Morgan, University of Leeds, Leeds,United Kingdom; Gretchen Blechschmidt, University of Washington,Seattle, Washington; Carol A. Williams, Lamont-Doherty GeologicalObservatory, Palisades, New York; David Johnson, Exxon Produc-tion Research Company, Houston, Texas; Ross O. Barnes, WallaWalla College, Anacortes, Washington; and Daniel Habib, QueensCollege of the City University of New York, Flushing, New York.
Operations (Ryan)Lithology (Arthur with de Graciansky, Maldanado,
Mountain, Rehault, and Lopatin; Summary chartcompiled by Arthur)
Geochemistry (Arthur)Physical Properties (Williams and Mountain)Biostratigraphy:
Nannofossils (Blechschmidt)Planktonic foraminifers (Iaccarino and Sigal)Benthic foraminifers (Sigal)Palynology (Habib)
Paleomagnetism (Morgan)Correlation of Seismic Reflection Profiles With
Drilling Results (Sibuet and Williams)Downhole Temperature Measurements (Ryan)Summary and Conclusions (Sibuet)
Survey and Drilling Data
SurveysThe presite survey data, kindly supplied to the Leg 47
scientific staff by the various organizations and institu-tions active in the area and on which the site selectionwas based, is acknowledged in the site chapter.
A shipboard precision echo-sounder, together withseismic profiling equipment, was used to determinespecific site locations. These data are discussed in thesections dealing with site approach. En route betweensites, continuous observations were made of depth,magnetic field intensity, and sub-bottom structure.Underway depths were recorded on a Gifft precisiongraphic recorder (PGR). The depths were read on thebasis of an assumed 800 fathoms/s sounding velocity.The sea depth (in m) was corrected (1) according to thetables of Matthews (1939) and (2) for the depth of thehull transducer, 6 meters below sea level. In addition,any depths referred to the drilling platform have beencalculated under the assumption that this level is 10meters above the water line.
The seismic profiling system aboard Glomar Challen-ger consisted of two Bolt airguns, a Scripps-designedhydrophone array, Bolt amplifiers, two bandpassfilters, and two EDO recorders, usually recording at twodifferent filter settings.
Drilling Characteristics
The taking of cores in a particular hole may be con-tinuous, but more often is interspersed by drilled, butuncored, intervals of variable length (spot coring).
Due to circulation of water down the hole, drill cut-tings are flushed out of the hole onto the sea bed (an"open system") and cannot be examined.
INTRODUCTION AND EXPLANATORY NOTES
38"
1 6 β 1 5 β 14β
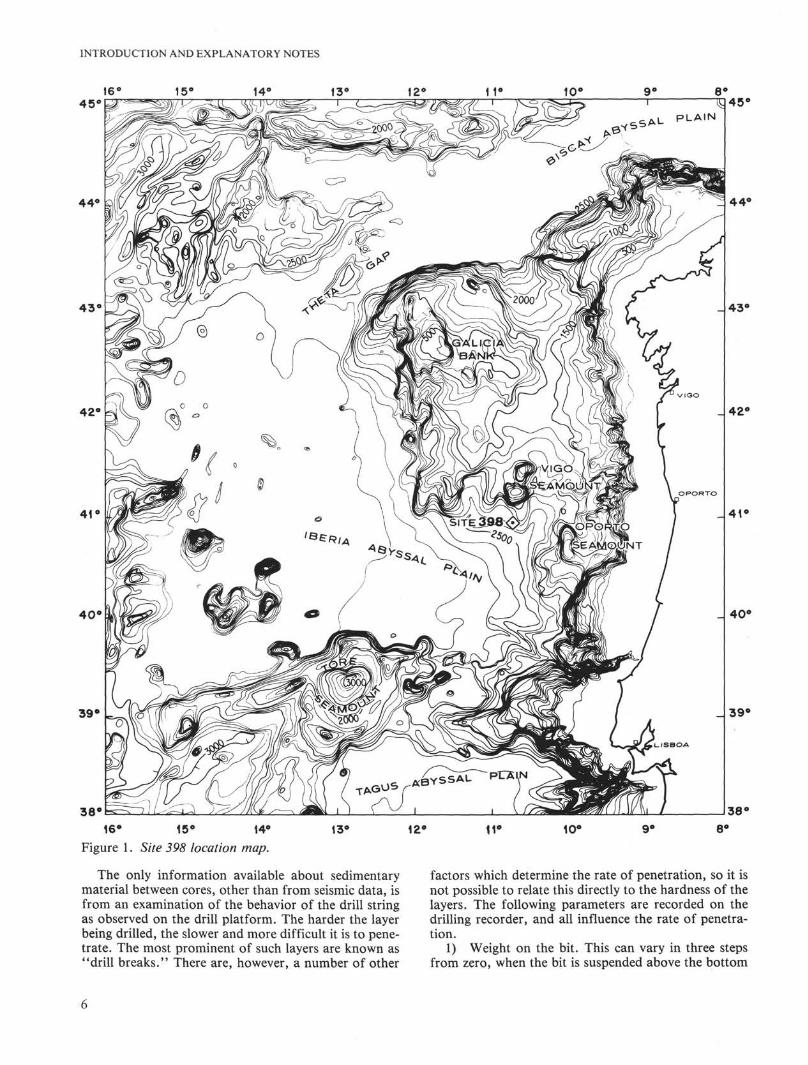
Figure 1. Site 398 location map.13
The only information available about sedimentarymaterial between cores, other than from seismic data, isfrom an examination of the behavior of the drill stringas observed on the drill platform. The harder the layerbeing drilled, the slower and more difficult it is to pene-trate. The most prominent of such layers are known as"drill breaks." There are, however, a number of other
factors which determine the rate of penetration, so it isnot possible to relate this directly to the hardness of thelayers. The following parameters are recorded on thedrilling recorder, and all influence the rate of penetra-tion.
1) Weight on the bit. This can vary in three stepsfrom zero, when the bit is suspended above the bottom

INTRODUCTION AND EXPLANATORY NOTES
MAGNETIC REVERSALS
33 a[
BABSOLUTE AGES (in connection with column Cl)
106
Ans
65
70
78-
80-
85-
INTERNATIONAL SCALEand
REGIONAL ZONATIONS
C 1 G D E
Bost.polyplacum
Hoplit.vari
Del.delawarensis
Plac.bidorsatum
ZONATION BASED ON FORAMINIFERS
MCs
Git. mayaroensis Bolli
Git. gansseri Bolli
Git. stuarti (J. de Lapparent)/
Git. falsostuarti Sigal
MCs 8Git. calcarata Cushman
Git. elevata (Brotzen)/Git. stuartiformis Dalbiez
TGit. concavata carinata Dalbiez
Git. concavata (Brotzen)
ADDITIONAL ZONATIONG
Rac.fructkosa(Egger)
Git. convexa Sandidge/Git. manaurensis Gandolfi
11Sig. deflaensis (Sigal)/Sig. carpathica Salaj
ef.| j.car.
GENERICMARKERS
H
Globotruncanas.l.
\Schackoina
| Hedbergella
Figure 2. Tentative zonationfor the Cretaceous in the Mediterranean areas basedon planktonic foraminifers, (Sigal, this volume).
of the hole to 40,000 pounds when two of the threebumper subs are collapsed and the whole bottomassembly bears on the bit. The aim of the driller is, byreference to the weight indicator, to maintain constantbit weight by lowering the drill string when necessary.However, this is extremely difficult to do in conditionsof swell, when the heave of the drill platform mayexceed the available extension (6 ft) of the bumper subs.
2) Revolutions per minute. The revolutions perminute (rpm) are related to the torque applied to the topof the drill string, and a direct analysis of the two shouldgive the resistance to drilling. However, the rpm recordis not detailed enough to do this. Nevertheless, visualobservations of the rate of drill string rotation are useful
in assessing bit behavior. In particular, it can be seenthat when the drill bit becomes jammed in very resistantrock, rotation stops, the bit becomes free and the drillstring untwists.
Drilling Disturbance
Most cores, when split and examined aboard GlomarChallenger, show signs of having been disturbed to agreater or lesser extent by the drilling process. Suchsigns are the concave downward appearance of manyoriginally horizontal bedding planes, the haphazardmixing of lumps of sediment having differing lithol-ogies, and the near fluid state of some sediments.

INTRODUCTION AND EXPLANATORY NOTES
MAGNETIC REVERSALS
ABSOLUTE AGES (in connection with column CD
Ans INTERNATIONAL SCALEand
REGIONAL ZONATIONS
C1C2 D E
ZONATION BASED ON FORAMINIFERS
ADDITIONAL ZONATIONG
GENERICMARKERS
H
95-
11O
•o
1
110-
à- o
115
g Jj g
6? J
MCs4
Git. sigαli Reichel/Git. schneegαnsi Sigal
Git. helvetica Bolli
Mam.nodosoides
Fog. superstes/Met. gestinianum
Calyc.crassum
I RotaliporaGlobigerinelloidess. str.
Hedb. paradubia(Siga\)/Git. praehelvetica (Trujillo)
Calyc.robustum Rtl. cushmani (Morrow) O. aumalensis (Sigal)/
Git. algeriana Caron
A cant,rhotomagense
Acant."praecursor'
MCs:
Mant.mantelli
1
11 J Globotruncanas. str.
Rtl. apenninica (Renz)/Rtl. montsalvensis Mornod
~~\ Farusella
Mant.martimpreyi
Rtl. globotruncanoidesRtl. brotzeni (Sigal)
Sigal/
em (Sigal)
•ALTun.hugardianus
Mart,perinflatum MCi27
Rtl. appenninica (Renz)/Plan, buxtorfi (Gandolfi)
i i
yap fbu
Mort.inflatum
Rtl.ticinensis
(Gandolfi)77c. breggiensis (Gandolfi)
Dip.cristatum i 26 I
Hop.nitidus
Hop.den tat us
Hedb. rischi Moullade/77c. primula Premoli-Silva
Douv.mamillatum
Hedb. planispira (Tappan)
MCi 24
Leym.tardefurcata
Chel. buxtorfi/Diad. nodosocos.tatum
Tic. bejaouaensis Sigal
MCi_23
Tic. praetici-lensis (Sigal)
~\ Planomalina
~~\ Ticinella
Praeglobotruncana
<iRotalipora
MCi 22 Hedb. trochoidea (Gandolfi)
subnodosocostatum WCi 4-MCi 20 Gld. ferreolensis Moullade
A co.nisus
MCi 19
Desk,deshayesi
VICi 1
Schk. cabri Sigal
Gld. maridalensis (Bolli)/Gld. bhwi (Bolli)
Deskforbesi
MC:Gld.gottisi(Chevatier)!
i 1 IGld.duboisH ChevalierlHedb. simllis Longoria |
MCi 16(=aff•/;/a;iw/;w^in Moullade)
Plan.cheniou-rensis
iFavitsella
~\Conorotalites
_ i Ticinella\Clavihedbergella s.str.
SPIano>nalina
Gld.barriB. Leit.
~\Caucasella
_}Globigerinelloides
J S 1976
Figure 2. (Continued).

INTRODUCTION AND EXPLANATORY NOTES
A MAGNETIC REVERSALS
ABSOLUTE AGES (in connection with column Cl)
106
INTERNATIONAL SCALEand
REGIONAL ZONATIONSCl C2 D E
ZONATION BASED ON FORAMINIFERS
ADDITIONAL ZONATIONG
GENERICMARKERS
115
Ml120-
121
125-
126
130-
131
Heteroceras
Ctes. aptiensis
MCi 15
(Bettenstaedt)
"zone innommée"(? zone a Ctes. intercedens (Bettenstaedt)
MCi 14 I
MCi 13
MCi 12
Pseudoth.angulicostata
Criσ. duvalilPlesiosp. ligatus/
_Bal. balearisCrit. villersianuslSubsay. sayni/Acr. meriani
eocretacea (Neagu)= aff. simplex in Moullade
, = 11970Guill. et Sigal
Hedb. sigali Moullade
Ctes. bartensteini (Bettenstaedt) s. str./ 'Gav. gr. djaffaensis Sigal-sigmoicosta ten Oa
Cauc. gr. hauterivicá\Subboüna.)• kugleri (Bolli)
Neoc.nodosoplicαtuslOlcost.jeαnnoti
Doroth. ouαchensis SigalMCi 9 i
LyticocerαswithCriocemtites
LyticocerαswithoutCriocerαtites
Hαpl vocontiαnus Moullade
iCi 8 , , 1
J^Schαkoinα
_J Clαvihedbergellα
J
Himαnt.trinodosum
Lent, ouachensis Sigal var. bartensteini MoulladeDoroth. hauteriviana Moullade
V l C i ? i l lLent.] gr. eichenbergi Baltenstein et. Brand
MCi 6 mer±-idiana Bart, Bolli et Kovatcheva
Sayn.verrucosum
Kil.campylotoxa MfCi 5.
Kil.roubaudi
Thurm.pertransiens
Lent, busnardoi Moullade
Lent, guttata ten Dam
MCi 4
Her. callisto
Pic. picteti
ler. paramimounum
Dal. dalmasi
Her. prn>asensis
Tim. subalpina
domaineméditer-ranèenmėridianal
HedbergellαConorotαlites
iCaucasella' Planctoniques
\ Calpionellidae
Tintinnopsella• carpathicadatum
_^Ca!pionellidae
Note: Explanation of abbreviations is as follows:
Acant.Acanth.Aco.Acr.Arg.HaiBan.Her.Host.Calve.Chel.
onCrit.Dal.Del.Desh.Diad.Dip-Disc.Doin:
AcanthocerasAcanthoscaphitesAconocerasAcriocerasArgonauticerosBalearitesBarroisicerasBerriasellaBostrychocerasCalycocerasChelonicerasCriocerasCrioceratitesDalmasicerasDelawarellaDeshayitesDiadochocerasDipolocerasDiscoscaphitesDouvilleiceras
Emer.Fag.Himan tHop.Hoplit.Leap.Ley in.Mam.Mant.Met.Mort.Neoc.Nick.Olcost.Pachy.Parab.Pict.Plac.Plesiosp.Pshapl.
EmericerasFagesiaHimantocerasHoplitesHoplitoplacen ticerasLeopoldiaLeymeriellaMammitesMantellicerasMetaiococerasMortanicerasNeocomitesNicklesiaOlcostephanusPachydiscusParabevahitesPictocerasPlacenticerasPlesiospitidiscusPseudohaploceras
Pseubpl.Pseudoth.Rom.Savn.SilStol.Subsay.Tex. 'Thurm.Tirn.Turr.Virg.
PseudosubplanitesPseudothurmanniaRomanicerasSaynocerasSilesitesStolitzkaiaSubsaynellaTexanitesThurmannicerasTirnovellaTurrilitoidesVirgatosphinctes
FORAMINIFERS
Cauc.Clh.Ctes.Doroth.Guv.
CaucasselaClaviheúbergellaConorotalitesDorothiaGavelinella
Gld. GlobigerinelloidesGit. GlobotruncanaHapl. HaplophragmoidesHedb. Hedbergella0. OrostellaPlan. PlanomalinaRac. RacemiguembelinaRtl. RotaliporaSchk. SchackoinaSig. SigaliaTic. Ticinella
i First occurrence of genera— Last occurrence of genera
i • Upper and lower limit =zonal extensionThe same, outsideof the zone
Figure 2. (Continued).

INTRODUCTION AND EXPLANATORY NOTES
Coring disturbance is particularly noticeable in theupper 100 meters or so of soft, unlithified sediments. Atthe other extreme, well-consolidated sedimentary andigneous rocks can also be reduced to rubble by the cor-ing process. Variations in lithology are not the only fac-tors determining the amount of coring disturbance. Dif-ferences in the type of drilling bit used and drilling tech-niques employed are also important. Clearly too, somesediment disturbance, and even some fracturing dis-played by the cores, may be original predrilling features.
Shipboard Scientific Procedures
Numbering of Sites, Holes, Cores, Samples
Drill site numbers run consecutively from the firstsite drilled by Glomar Challenger in 1968, thus each sitenumber is unique. A site refers to the hole, or holes,drilled while using one acoustic positioning beacon.Several holes may be drilled at a single locality by pull-ing the drill string above the sea floor ("mud line") andoffsetting the ship some distance (usually 100 m ormore) from the previous hole. This sometimes becomesnecessary where there is insufficient soft sediment at thefirst location to "spud in" or bury the bottom-holeassembly (BHA).
The first (or only) hole drilled at a site takes the sitenumber. Additional holes at the same site are furtherdistinguished by a letter suffix. The first hole has onlythe site number; the second has the site number withsuffix "A"; the third has the site number with suffix"B"; and so forth. For example, four holes had beendrilled at Site 398, therefore they should be referencedas Site 398 (first hole), Hole 398A (second hole), Hole398B (third hole), etc. It is important for sampling pur-poses to distinguish the holes drilled at a site, sincerecovered sediments or rocks usually do not come fromequivalent positions in the stratigraphic column at dif-ferent holes.
Cores are numbered sequentially from the top down.In the ideal case, they consist of 9 meters of sediment orrock in a 6.6-cm-diameter plastic liner. In addition, ashort sample is obtained from the core catcher (a multi-fingered device at the bottom of the core barrel whichprevents cored materials from sliding out during core-barrel recovery). This usually amounts to about 20 cmof sediment and is stored separately. This sample, fromeach core, represents the lowest stratum recovered in theparticular cored interval. The core-catcher sample isdesignated by CC (e.g., 398B-6, CC, is the core-catchersample of the sixth core taken in the second hole drilledat Hole 398B).
The cored interval is the interval in meters below thesea floor measured from the point at which coring for aparticular core was started to the point at which it wasterminated. This interval is generally 9.5 meters (nomi-nal length of a core barrel) but may be shorter if condi-tions dictate. Cores and cored intervals need not becontiguous. In soft sediment, the drill string can be"washed ahead" without recovering core by applyingsufficiently high pump pressure to wash sediment out of
the way of the bit. In a similar manner, a center bit,which fills the opening in the bit face, can replace thecore barrel if drilling ahead without coring is necessary.
When a core is brought aboard Glomar Challenger, itis labeled and the plastic liner and core cut into1.5-meter sections. A full, 9-meter core would thus con-sist of six sections, numbered from the top down, 1 to 6.(The discrepancy between the 9-meter core and9.5-meter core interval is discussed below.) Generally,somewhat less than 9 meters is recovered. In this case,the sections are still numbered starting with one at thetop, but the number of sections is the number of1.5-meter intervals needed to accommodate the lengthof core recovered; this is illustrated in Figure 3.
Thus, as shown, recovery of 3.6 meters of sedimentwould result in a core with three sections, with a void of0.9 meter at the top of the first section. By convention,and for convenience in routine data handling at theDeep Sea Drilling Project, if a core contains a length ofmaterial less than the length of the cored interval, thesections that recovered material are placed in the top ofthe cored interval, with the top of Section 1 (not alwaysthe top of the sediment) located at the top of the coredinterval. This is shown in Figure 4 for the core in theabove example.
It was noted above that a discrepancy exists betweenthe usual core interval of 9.5 meters and the 9-meterlength of core recovered. The core liners used are actu-ally 9.28 meters in length, and the core catcher accountsfor another 0.2 meter. In cases where the core liner isrecovered full to the top, the core is still cut into1.5-meter sections, measured from the top.
Samples taken from core sections are designated bythe interval in centimeters from the top of the core sec-tion from which the sample was extracted; the samplesize, in cc (cm3), is also given. Thus, a full sample desig-nation would consist of the following information:
Leg (Optional)Site(Hole, if other than first hole)Core NumberSection NumberInterval in centimeters from top of sectionSample 398B-1-2, 122-124 cm (10-cm3) designates a
10-cm3 sample taken from Section 2 of Core 1 from thesecond hole drilled at Site 398. The depth below the seafloor for this sample would then be the depth to the topof the cored interval plus 3 meters for Sections 1 and 2,plus 122 cm (depth below the top of Section 3). (Note,however, that subsequent sample requests should referto a specific interval within a core section [in cm] ratherthan level [m] below sea floor.)
Handling of Cores
The first analysis of the material recovered by anindividual core is the core catcher. Rapid paleontolog-ical and lithological analysis of this material from thebase of the cored interval is carried out to make deci-sions as to whether to drill ahead or to take anothercore.
10

INTRODUCTION AND EXPLANATORY NOTES
150 m
159,5 m•
LU
^–QLUCC
oo
floo
α
o
CO
üLUCO
150.9 m
oLUCO
oLUCO
QUJCCLU>O<JLU£T
h-
QLUCO
154 5 m
Figure 3. Position of incomplete sediment re-covery within the cored interval.
After a core is brought up to the drill platform, it iscut, sealed, and labeled before beginning its routineprogress through the shipboard analytical procedure.Often samples for organic geochemistry are taken at thisstage.
In the core laboratory on Glomar Challenger, afterphysical property measurements requiring unsplit coresare made (such as thermal conductivity and density-porosity measurements using gamma ray attenuationtechniques), the 1.5-meter sections of sediment core andliner are split lengthwise. One-half is designated the"archive" half, which is described by the shipboardsedimentologists and photographed; and the other is the"working" half, which is sampled by both the ship-board sedimentologists and paleontologists for furthershipboard and shore-based analysis.
Sampling
In the core laboratory samples for routine shore-based analysis such as grain size, X-ray mineralogy andtotal carbonate content were taken from the workinghalf, labeled, and sealed. Because of the high level ofprecruise interest in Leg 47B, samples were taken at thisstage for numerous shore-based workers, whose contri-butions can be read in this volume. In addition, sampleswere regularly taken for immediate shipboard analysis,such as total carbonate by the "carbonate bomb"method. Routine samples were taken for smear slide,carbonate and grain-size analysis. The location of thesesamples is shown on the core forms in a column usingappropriate symbols (see Sample Core Form, Figure 4).The working half was then sent to the paleontologylaboratory, where samples for both shipboard andshore-based studies of nannofossils, foraminifers, radi-olarians, diatoms, silicoflagellates, and other fossilgroups were taken.
Material obtained from core catchers, and not usedup in the initial examination, was retained (in freezerboxes) for subsequent work. Sometimes pebbles partic-ularly important to the interpretation of the site wereextracted from the core and stored separately in labeledcontainers as a measure against loss. On occasionswhere the liners contained only sediment-laden water,the water was usually collected in a bucket, allowed tosettle, and the residue was stored in freezer boxes. Allsamples are deposited in cold storage at the DSDP EastCoast Repository at Lamont-Doherty Geological Ob-servatory and are available to investigators.
Lithologic Studies
The archive half of the split section is used only fordescriptive purposes. The cut surface of each is scrapedto emphasize the sedimentary features and the color,texture, structure, and composition of the varying lith-ologies. Each section is described individually on aVisual Description Form. Smear slides are made and areexamined using the shipboard petrographic micro-scopes. These, in conjunction with the "carbonatebomb" results, provide the basic shipboard informationon lithology. The archive half is then photographed.
11

INTRODUCTION AND EXPLANATORY NOTES
SITE 398
u
2 -1 Z
UJ 3
sagr
ee)
ns d
iti
o
c
'E
is•α
10
-σ
roOcc
ses
if r
_e
antl
(par
;
o
(Me
sozo
LUCD<
o
IOZ
OIC
)
o
oa.LU
<Of UJ
•-Z
O N
BO
co
nif
era
lra
m
o
and
fsi
l
c
nan
HOLE BFOSSIL
CHARACTER
<Of
OLL.
C
Jarr
e
IICD
sII
1-
are
ccII
cc
ccEEoOli
<_>
un
da
n
<II
<
<D
nd
an
cab
umOzz<z
o
aIIα
j _
II
•DOoIIσi
ent
ell
×II13
C
tioes
erva
Q .
Q<Of
est
CORE
ZTIO
h<
LUt n
ETE
RS
2
-0.5-
mate of % CaCOg ~based on smear si des, —shipboard and —
she reu< did
2
3
4
5
-
-
-
—
_-
-_-
_-
-
—
—
-
-
-—
-
-
_
-
—
--—
laminated, rarelyhomogeneous, str ctlynon-bioturbatedMUDSTONE, grayblk. to dk. gray(N2to N3); lghter '_and slightly cal-careous be ow Core 106•
7
CC~
—
CORED INTERVAL:
LI
GRAPHIC o'•LITHOLOGY ?|
_ • i
ec-ac
see Fig. 5 forstandardlithologicsymbols
w 8 0 60 40 20 51 '
i i
>
sandylamination
siltylamination
1era
/(TTV ?
ash Esideπte lens
or nodule
sider telayer (>1 cm) ^
σ
$ *wood" orcoal-likefragment
*shellfragment
0. G.
OrganicGeochemistrysample
I.W.InterstitialWater sample
-1
•
•
m «*LU
á° ""-3 «_n Qoc- UJH-3 I Λ I Λ
ted
2 ^C 78 ^
X3C
_
Cü ^
•o o
α> «
par
alla
mir
>. çp
5 iS
S"αo"α
σi"D C§ 2BJ
imen
t<u
sio
nse
din
ci
«
ic
tio
XI
3O
| f
au
lt
öOui
Ocx•
• 3c!l<—IIΛ
- 7 4
iI
LITHOLOGIC DESCRIPTION
General Description: MARLY NANNOFOSSIL CHALK throughout.pale brown (10YR 6/3), with numerous silty
special remarks:specified interval
. section depth
^ ^ 3 - 1 5 to 4-55: abundantsilty laminae
unspecified interval
mollusc fragment
section depth
\ /Smear: 2-55
% sand, silt, clay [1,20,79]69% clay20% nannos
estimates of equal _ _ _ ^ 3% f o r a m s _ r g d s
percentage sometimes , 2",i qtz..grouped together sponge spies.
1% heavy mins.tr. pyrite
N . color code, Cores 2, 3, 4, D-3 only;/ see below
l×
1 diagenetic discolorations<?), Cores A-1 to D-56,1 ^ s . usually gray, grn., dusky yel. grn., extendingl * ^ — 7 — 1 to 10 cm above and below silty or sandy
/ laminae at base of rhythms
V1
Colors
1 ol.gray (5GY6/1)2 white (M9) GSA colors as noted above3 bl. white (5B7/1)
GRAIN SIZE
section *-3-50=tr,30,70 = % sand, silt, clay
depth
CaCOo % C o m %o org
pi i imπt i Pnmh r i n r r n ^ π n ?11 *MoarDoπaie Domu ^ ^ ^ ^ ^ ^ j π i röuπ n u o i i ^-^
i v f^r\ π iππrπ Λ orπ Λ r\i ΛI n iLECO bπUπbbAbbU 4-0/ 42 0.1
/ (s e c t i o n depth
Figure 4. Sample core form.
12

INTRODUCTION AND EXPLANATORY NOTES
Core Forms
The basic descriptive data, both lithologic and bio-stratigraphic, for each section of a particular core arecombined to produce the Core Summary Forms, whichaccompany each site chapter. These are first compiledaboard ship, but are upgraded later using postcruiseshore-based data. A sample core form is illustrated inFigure 4. Most data are symbolized, but a short descrip-tion is provided giving the essential lithologic informa-tion in the following order: Sediment or rock name,Sediment disturbance, Color name and Munsell or GSAnumber, Sedimentary structures and other special fea-tures, Composition from smear slides and bulk X-rayanalysis, Grain-size and carbonate data. Many corescontain important minor lithologies as well as a basiclithology. The description of the major lithology is soindicated in most cases; however, descriptive informa-tion for minor lithologies is included wherever possible.
As noted previously, the rotary drill-coring techniquequite often results in disturbance of the cored sediments.This is especially true of the softer unconsolidated sedi-ments. A qualitative estimate of the degree of deforma-tion is given as a symbol on the core logs.
Color names and numbers are derived by reference tothe GSA Rock Color Chart (Goddard et al., 1963). Thereader is advised that colors recorded in core barrelsummaries were determined during shipboard examina-tion immediately after splitting core sections. Experi-ence with carbonate sediments shows that many of thecolors will fade or disappear with time, after openingand storage. Colors particularly susceptible to rapidfading are purple, light and medium tints of blue, lightbluish gray, dark greenish black, light tints of green,and pale tints of orange. These colors change to white oryellowish white or pale tan.
Smear-Slide Analysis
Smear slides are prepared from minute amounts (1 or2 mm3) of sediment taken with a spatula, puddled andsmeared with distilled water on a glass slide, dried, andset under a cover-slip with Caedex. Their examinationby petrographic microscope provides a rapid means ofmineral identification. They are the basic source of lith-ologic information used onboard ship, although thinsections are used in studies of basalts and other hardrocks.
Smear-slide estimates of mineral abundances arebased on the percentage of the area of the smear slidecovered by each component. Past experience has shownthat accuracy may approach a per cent or so for verydistinctive minor constituents, but that for major con-stituents, accuracy of ± 10 per cent is considered verygood. The accuracy of this technique aboard ship ismuch enhanced when employed, as on Leg 47B, in con-junction with numerous carbonate bomb measurements(see below).
"Carbonate Bomb" Data
During Leg 47B, extensive use was made of the "car-bonate bomb" device (Müller and Gastner, 1971) as an
aid in sediment classification. All total carbonate per-centages measured by this method are recorded on thecore summary forms, as are levels of sampling (B).Accuracy to within ±5 per cent total carbonate hasbeen quoted for the device. However, postcruise shore-based studies suggest that it may be somewhat less accu-rate than this, particularly for high carbonate sedimentsor for complex mixtures of sedimentary componentswhere carbonate is low (see below). Also the "bomb"device is probably considerably less accurate wheredolomitic sediments are encountered.
When CO2 pressure readings on the carbonate bombare in the range 0.40 to 0.65, both methods (LECO andbomb) did give comparable values with a maximum dif-ference of ±5 per cent CaCO3 (weight). With CO2pressure readings on the "bomb" in the range 0 to 0.40,the LECO values were higher by 7 to 12 per cent CaCO3(weight) in the lower half of the range and by 1 to 7 percent (weight) in the upper part. With CO2 pressure read-ings on the "bomb" above 0.65 the LECO values arelower, by 1 to 13 per cent CaCO3 (weight).
The LECO method (combustion by inductive heatingin an O i atmosphere) is considered more reliable thanthe "carbonate bomb" method.
A scan of the CaCO3 values recorded on the coresummary forms for both shipboard "carbonate bomb"and DSDP shore-based LECO measurements reflectsthe conclusions arrived at above. However, it is impor-tant to note that the "carbonate bomb" device isemployed aboard Glomar Challenger primarily as anaid in the accurate naming of sediments in conjunctionwith the smear slide observations and that within thebounds of the JOIDES sediment classification, the dis-crepancies noted would not change the names given tosediments onboard ship.
Sediment Classification
The sediment classification used on Leg 47B wasdevised by the JOIDES Panel on Sedimentary Petrologyand Physical Properties, and adopted for use by theJOIDES Planning Committee in March 1974. It isreproduced in part below.
The only modification found necessary to theJOIDES classification itself was to the "TransitionalBiogenic Calcareous Sediments" category; that is, themarls and marlstones (>30 per cent CaCO3 and >30per cent silt and clay). The existing single symbol/category was split into five, taking into account dolo-mite content, and now includes: marls, marlstones,dolomitic marls, dolomitic marlstones, and dolomiticmuds and mudstones.
Lithologic Classification SchemeThe following define compositional class boundaries
and use of qualifiers in the lithologic classificationscheme:
1) Compositional Class Boundariesa) CaCO3 Content (determined by carbonate
bomb): 30 and 60 per cent. With a 5 per centprecision and given the natural frequencydistribution of CaCO3 contents in oceanic
13

INTRODUCTION AND EXPLANATORY NOTES
sediments, these boundaries can be reasonablyascertained.
b) Biogenic Opal Abundance (expressed as percent siliceous skeletal remains in smear slides):10, 30, and 50 per cent. Smear slide estimates ofidentifiable siliceous skeletal material generallyimply a significantly higher total opal abun-dance. The boundaries have been set to takethis into account.
c) Abundance of Authigenic Components (zeo-lites, Fe, and Mn micronodules, etc.), fishbones, and other indicators of very slow sedi-mentation (estimated in smear slides); semi-quantitative boundary: common 10 per cent.These components are quite conspicuous and asemiquantitative estimate is adequate. Even aminor influx of calcareous, siliceous, or ter-rigenous material will, because of the large dif-ference in sedimentation rate, dilute them to in-significance.
d) Abundance of Terrigenous Detrital Material(estimated from smear slides): 30 per cent.
e) Qualifiers: Numerous qualifiers are suggested;the options should be used freely. However,components of less than 5 per cent (in smearslide) should not be used as a qualifier except inspecial cases. The most important componentsshould be the last qualifier. No more than twoqualifiers should be used.
Description of Sediment Types
1) Pelagic Clay—Principally authigenic pelagicdeposits that accumulate at very slow rates. The class isoften termed brown clay, or red clay, but since theseterms are confusing, they are not recommended.
a) Boundary with Terrigenous Sediments: Whereauthigenic components (Fe/Mn micronodules,zeolites), fish debris, etc., become common insmear slides. NOTE: Because of largediscrepancy in accumulation rates, transitionaldeposits may be exceptional.
b) Boundary with Siliceous Sediments: 30 per centidentifiable siliceous remains.
c) Boundary with Calcareous Biogenous Sedi-ments: Generally the sequence is one passingfrom pelagic clay through siliceous ooze tocalcareous ooze, with one important exception:at the base of many oceanic sections, black,brown or red clays occur directly on basalt,overlain by or grading up into calcareoussediments. Most of the basal clayey sedimentsare rich in iron, manganese and metallic traceelements. For proper identification they requiremore elaborate geochemical work than isavailable onboard. These sediments are placedin the "Special Rock" category, but careshould be taken to distinguish them from or-dinary pelagic clays.
2) Pelagic Siliceous Biogenic Sediments—These aredistinguished from the previous category because they
have more than 30 per cent identifiable siliceous micro-fossils. They are distinguished from the following cate-gory by a CaCO3 content of less than 30 per cent. Thereare two classes: Pelagic biogenic siliceous sediments(containing less than 30 per cent silt and clay); and tran-sitional biogenic siliceous sediments (containing morethan 30 per cent silt and clay and more than 10 per centdiatoms).
a) Pelagic biogenic siliceous sediments:soft: Siliceous ooze (radiolarian ooze, diato-
maceous ooze, depending on dominantcomponent).
hard: radiolarite porcelanitediatomite chert
(i) Qualifiers:Radiolarians dominant: radiolarian oozeor radiolarite.Diatoms dominant: diatom ooze or dia-tomite.Where uncertain: siliceous (biogenic)ooze, or chert.
(ii) Qualifiers—In this group numerous qual-ifiers are possible usually based on minorconstituent, for example: glauconitic,pyritic, feldspathic.In the sand and sandstone category, con-ventional divisions such as arkose, gray-wacke, etc., are, of course, acceptable,providing the scheme is properly identi-fied. Clays, muds, silts, and sands con-taining 10 to 30 per cent CaCO3 shall becalled calcareous.
b) Volcanogenic sediments: Pyroclastic rocks aredescribed according to the textural and com-positional scheme of Wentworth and Williams(1932). The textural groups are:
Volcanic breccia > 32 mmVolcanic lapilli < 32 mmVolcanic ash (tuff, if indurated) < 4 mm
Compositionally, these pyroclastic rocks aredescribed as vitric (glass), crystal or lithic.
c) Clastic sediments of volcanic provenance aredescribed in same fashion as the terrigenoussediments, noting the dominant composition ofthe volcanic grains where possible.
5) Special rock types — The definition and nomen-clature of sediment and rock types not included in thesystem described above are left to the discretion of ship-board scientists with the recommendation that theyadhere as closely as practical to conventional terminol-ogy.
In this category fall such rocks as:Intrusive and extrusive igneous rocks; Evaporites,halite, anhydrite, gypsum (as a rock), etc.;Shallow water limestone (biostromal, biohermal,coquina, oolite, etc.);Dolomite;Gravels, conglomerates, breccias;Metalliferous brown clays;Concretions, barite, iron-manganese, phosphorite,pyrite, etc.;
14

INTRODUCTION AND EXPLANATORY NOTES
Coal, asphalt, etc.;and many others.The mandatory graphic lithology column should be
completed by shipboard staff with appropriate symbolsfor intervals containing special rock types. It is im-perative that symbols and rock nomenclature be proper-ly defined and described by shipboard staff.
Lithologic Symbols
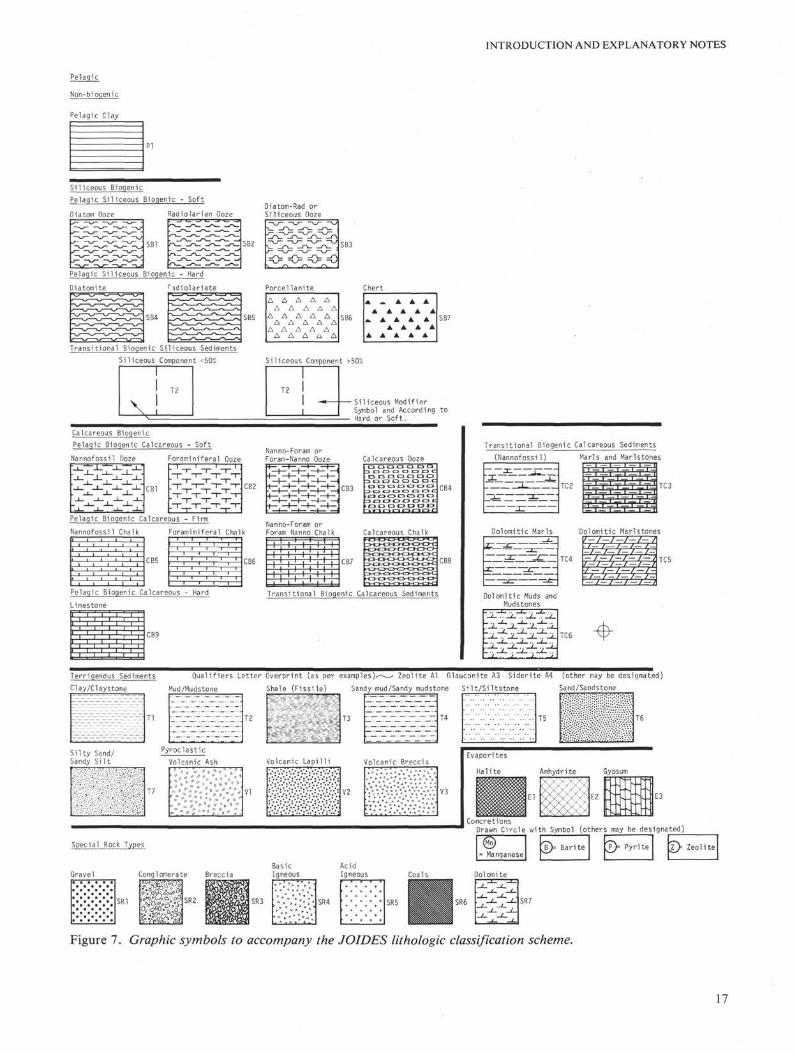
Figures 5 and 6 display the set of lithological andstructure symbols pertinent to and employed during Leg47B. These symbols are used on the Core SummaryForms. Figure 7 is the standard lithologic symbols thataccompany the JOIDES sediment classification.
Hole Summary Diagrams
For each hole a summary diagram is drawn andaccompanies each site chapter. This is primarily a com-pilation of the lithologic and biostratigraphic data dis-played on the core forms. Again these are initiallydrawn aboard ship and are later modified to take
account of shore-based data. Downhole plots of car-bonate content and X-ray mineralogical data accom-pany each diagram.
Lühostratigraphic TerminologyMany different lithologies were encountered on Leg
47B. No formal rock stratigraphic units are employed inthe site chapter. The sediments are informally dividedinto units and sub-units. For each site, these unit desig-nations are outlined in a table in the lithology sectionand also in the appropriate hole summary diagram.Boundaries between specific units and sub-units incored intervals were both sharp and gradational. If aboundary occurred between cores, it was placed in themiddle of the drilled interval, unless biostratigraphicevidence deemed otherwise.
Routine Shore-Based AnalysesIn a number of cases sediment names have been
modified from those given aboard ship to take intoaccount the shore-based data.
Siliceous Bioqenic
Pelagic Siliceous Biogenic - Soft
Radiolarian OozeDiatom-Rad orSiliceous Ooze
A A A AA A A A
SB7
Calcareous Bioqenic
Pelagic Bioqenic Calcareous - Soft
Nannofossil Ooze Foraminiferal OozeNanno-Foram orForam-Nanno Ooze Calcareous Ooze
D D DO D O
Pelagic Bioqenic Calcareous - Firm
Nannofossil Chalki i i i i
i i i ,
iPelagic B
Limestoneh I I
i i
CB5
oqenic Calcareous - Hard
' I • i • li
i i
CB9
Terrigenous Sediments
Clay/Claystone
Qualifiers Letter Overprint (as per examples)^—- Zeolite Al Glauconite A3 Siderite A4 (other may be designated)
Mud/Mudstone Sandy mud/Sandy mudstone Si It/Siltstone Sand/Sandstone
Concretions
Drawn Circle with Symbol (others may be designated)
Siderite
Φ B = Barite P Pyrite
Figure 5. Graphic symbols to accompany the lithologic classification scheme used on Leg 47B.
15

INTRODUCTION AND EXPLANATORY NOTES
BIOTURBATION
BURROWS
GRADED BED
GRADATIONAL CONTACT(hand drawn)
SHARP CONTACT(hand drawn)
PARALLELLAMINATIONS
CROSS STRATIFICATION
MASSIVE OR HOMOGENEOUS(no symbols necessary)
SEDIMENTARY CLASTSw w w » w w
SLUMP C
Figure 6. Sedimentary structure symbols.
Carbon-Carbonate AnalysesShore-based carbon-carbonate analysis was with a
LECO acid-base semi-automatic carbon determinator.Step-by-step procedures used at the DSDP La JollaLaboratory are reported in Bader et al. (1970), and adiscussion of the method, its calibration, and its preci-sion can be found in Boyce and Bode (1972).
Total carbon and organic carbon (carbon remainingafter treatment with hydrochloric acid) are determinedin terms of weight per cent, and the theoretical percent-age of calcium carbonate is calculated from the follow-ing relationship:
Per cent calcium carbonate (CaCO3) =(% total C - % C after acidification) × 8.33
However, carbonate sediments may also includemagnesium, iron, or other carbonates; this may result in"calcium" carbonate values greater than the actual con-tent of calcium carbonate. In DSDP determinations, allcarbonate is assumed to be calcium carbonate.
Precision of the determination is as follows:Total carbonate
(within 1.2 to 12%) = ± 0 . 3 % absoluteTotal carbon (within 0 to 1.2%) = ± 0.06% absoluteOrganic carbon = ±0.06% absolute
Calcium carbonate(within 10 to 100%)(within 0 to 10%)
= ±3% absolute= ± 1 % absolute
Grain-Size AnalysesThe DSDP shore-based grain-size analyses, presented
on the Core Summary Forms were derived by standardsieve and pipette techniques, as described in detail inBader et al. (1970), with modified settling times as inBoyce (1972).
Geochemical MeasurementsShipboard geochemical measurements were routinely
made during Leg 47B. The standard DSDP proceduresfor interstitial water and allied studies were employed.These are adequately described in Waterman (1970) andin Whitmarsh, Weser, Ross, et al. (1974).
Physical PropertiesPhysical property measurements of bulk wet density,
porosity, permeability, water content, compressionalvelocity, and shear strength were made during Leg 47B.The measurement techniques and sampling considera-tions have been carefully described by Boyce (1973) andwill only be outlined briefly in the following discussion.Further discussions of the routine physical propertymeasurements, centering principally on certain prob-lems with the techniques and their effects on the qualityof the data, can be found in a paper by Bennett andKeller (1973). Anyone intending to draw geologicallyrelevant conclusions based on the physical property datapresented in this volume is urged to read both papers.At drill sites where downhole temperature data wereobtained, thermal conductivity measurements weremade in order to permit calculation of the rate of heatflow through the sea floor. Methods of downhole tem-perature measurement are described in the Site Report(this volume).
Sonic Velocity Data
Measurements of compressional wave velocities insediments were made using the Hamilton frame appa-ratus (see Mountain, this volume). All measurementswere made at room temperature and pressure after thecores had reached thermal equilibrium with the labora-tory, and soon after they were opened. Most of the dataare obtained by measuring the length of time requiredfor sound to traverse a path through the sediment andplastic core liner between a 400-kHz acoustic transducerand receiver. This method assumes good acoustic con-tact between the liner and the sediment, a conditionwhich may not be fulfilled if the sediment does not com-pletely fill the core liner. Corrections must be made toaccount for the thickness of the liner and the length oftime required for the sound to pass through the liner.The corrections routinely applied presuppose liners ofconstant sound velocity and thickness. The secondparameter, thickness, is known to vary widely fromshipment to shipment and even within a given section ofliner. Thus measurements of sound velocity of materialin a split liner are subject to errors not present whenmeasurements are made directly on material consol-
16
Pelagic
Non-biogenic
Pelagic Clay
INTRODUCTION AND EXPLANATORY NOTES
Siliceous Bioqenic
Pelagic Siliceous Biogenic - Soft
Diatom Ooze Radiolarian OozeDiatom-Rad orSiliceous Ooze
S3 I
Pelagic Siliceous Biogenic - Hard
Diatomite Fadiolariate Porcellanite Chert
Δ Δ Δ Δ ΔΔ Δ Δ Δ Δ
Δ Δ Δ Δ ΔΔ Δ Δ Δ Δ
Δ Δ Δ ΔΔ Δ Δ Δ
_ A A A
A A A A A
«. A A A AA A A A
A A A A A
SB7
Transitional Biogenic Siliceous Sediments
Siliceous Component <50% Siliceous Component >50%
Siliceous ModifierSymbol and According toHard or Soft.
Calcareous Biogenic
Pelagic Biogenic Calcareous - Soft
Nannofossil Ooze Foraminiferal OozeNanno-Foram orForam-Nanno Ooze Calcareous Ooze
Pelagic Biogenic Calcareous - Firm
Nannofossil Chalk Foraminiferal ChalkNanno-Foram orForam Nanno Chalk Calcareous Chalk
1
1
1
1
1
1
1
1
1 1
1 1
1
1 1
1
CB6
i ! i ! i ! iiTTTLLiTTTTl I1
I I
Pelagic Biogenic Calcareous - Hard
Limestone
CB9
Transitional Biogenic Calcareous Sediments
1
1
1
I
_1_
1
-i-L-r-J-
1
-I-1-
Transitional Biogenic Calcareous Sediments(Nannofossil) Marls and Marlstones
^ TC3
Dolomitic Marls Dolomitic Marlstones
7 - / , - / , - / , - 4 ^ 4 TC5
— /—/ — / — 7 -
Dolomitic Muds andMudstones
Terrigenous Sediments Qualifiers Letter Overprint (as per examples)^^—- Zeolite Al Glauconite A3 Siderite A4 (other may be designated)
Clay/Claystone Mud/Mudstone Shale (Fissile) Sandy mud/Sandy mudstone Silt/Siltstone Sand/Sandstone
Silty Sand/ P
>r o c 1 a s t i c
Sandy Silt Volcanic Ash Volcanic Lapilli Volcanic Breccia
T6
Evaporites
Halite Anhydrite Gypsum
Concretions
Drawn Circle with Symbol (others may be designated)
Special Rock Types
Basic
Gravel Conglomerate Breccia Igneous
= ManganesePyrite Zeolite
Acid
Igneous Dolomite
SR7
Figure 7. Graphic symbols to accompany the JOIDES lithologic classification scheme.
17

INTRODUCTION AND EXPLANATORY NOTES
idated enough to be shaped and put between thetransducers.
Where consolidation was sufficient, the ends andsides of chunks of unsplit core were cut or shaped intoflat, parallel faces with normals parallel and perpendic-ular to the long axis of the core, taking care to minimizedisturbance to the sample. The velocity was determineddirectly on these chunks in both directions, and thehorizontal and vertical velocities could then be com-pared in order to detect the presence of seismicanisotropy.
On Leg 47B, a substantial difference was found toexist between horizontal velocities (parallel to bedding)routinely measured through the liner in split cores, andthe vertical velocities required to compute the thicknessof sedimentary layers from travel time data. Thus it isclear that neglect of acoustic anisotropy can seriouslyaffect realistic interpretation of seismic data from drill-ing results.
Gravimetric DataBulk property measurements were made on sediment
samples obtained from the central, presumably undis-turbed portion of the sediment cores using small (< 1cm3) syringe-type samplers and larger (= 20 cm3) stain-less steel cylinders of known volume. The sedimentsamples were weighed wet and again after drying at110°C for 24 hours and computations of bulk wet den-sity, porosity, and water content were made.
The extremely small volume of the syringe samplecan result in substantial errors in measuring both weightand volume differences, and the small diameter of thesyringe makes representative sampling of coarse-grained,highly porous and/or well-compacted sediments almostimpossible. Comparison of the wet bulk density datataken with the two techniques indicates that the varia-bility of the syringe data is much higher than that ofdata obtained using the cylinder-sampling technique.Further comparison of the syringe data with densitiesmeasured using the larger volume cylinder samples, aswell as with densities determined by gamma ray attenua-tion methods, suggests that the syringe density data maybe systematically low. The standard deviation of the sy-ringe data is approximately twice as large as the stan-dard deviations of the density values obtained using theother two measurement methods. Thus bulk-propertiesdetermined using syringe sampling techniques cannot beused to define any other than the most dramatic changesin sediment physical properties.
The larger volume of the samples obtained using thestainless steel cylinders permits a significant reduction inthe errors in the volume and weight measurements. Thesampling procedure was to push the sharpened end of athin-walled cylinder of known weight and volume intothe sediment until its lower end made contact with thecurved wall of the core liner and its upper end wasslightly buried beneath the surface of the freshly splitcore. Pliers were then used to gently rock the cylinderback and forth in order to break suction between the
bottom of the sediment sample and the inside of thecore liner. The cylinder was withdrawn with the sedi-ment protruding from both ends and the sediment wascarefully shaved and cut back until it was flush with theend of the cylinder. This ensured that the volume of sed-iment was the same as the previously measured internalvolume of the cylinder. The sediment-filled cylinder wasthen weighed and dried for at least 24 hr at 110 °C, afterwhich it was weighed again.
Representative sampling was difficult in coarse-grained sediments due to the tendency for the largergrains to dig into the surface of the sample as the endswere being smoothed. In poorly compacted, plastic sedi-ments the friction of the sediment plug against the insideof the cylinder tended to compress the plug or prevent itfrom entering the cylinder smoothly, thus causing somemechanical disturbance. In more compact sediments thecylinder tended to fracture the sediment before it hadbecome fully inserted, or to break the plug loose fromthe remaining sediment in such a way that the ends ofthe plug did not protrude from, or even reach, the endsof the cylinder. In these cases where the volume was notaccurately known the sample was only used to deter-mine water content.
In sediments which could be sampled effectively,plexiglass plates were fastened over the ends of thecylinder to prevent drying, and the attenuation ofgamma rays through both the plexiglas and the samplewas determined, thus permitting calculation of the wetbulk density, on the basis of gamma ray attenuationdata. In this way the bulk-wet density values obtainedusing both gravimetric and gamma ray attenuation tech-niques could be compared and the gamma ray attenua-tion technique could be calibrated using the more directgravimetric data.
GRAPE DataMeasurement of the attenuation of a pencil-sized
beam of gamma rays passing through a known thicknessof sediment (or rock) permits calculation of the bulk wetdensity and porosity of the material. The accuracy ofthe method as applied to sediment or rock is stronglydependent upon the homogeneity, consistency, anddimensional stability of the sediment as it passesthrough the gamma ray beam. Because of coring dis-turbance and the mechanical properties of the sediment,it is common for very soft or very hard sediment to onlypartially fill the core liner. Often a core of relativelyundisturbed sediment or rock will have a variable andsmaller diameter than the inner diameter of the coreliner. The length of the gamma ray path through boththe sediment and through the air, water, or slurrybetween the sediment core and the walls of the core linermust be known in order to compensate for the effects ofthe varying geometry. Furthermore, the wet bulk den-sity of the surrounding slurry, if any, must be measuredseparately using gravimetric techniques in order to cor-rect for the presence of material other than the undis-turbed portion of the core itself. All of these variables
18

INTRODUCTION AND EXPLANATORY NOTES
are difficult to estimate accurately and are time consum-ing to measure. If neglected, they can produce bothhighly variable and anomalously low values of wet bulkdensity values and high values of porosity. The mostrepresentative wet bulk density values for a particulartype of sediment are probably the maximum valuesrecorded. However, it is worth noting that the expulsionof interstitial fluids because of compaction during cor-ing can produce higher wet bulk density values than theactual in-situ density. Great care must be taken in draw-ing geological deductions from data obtained using thegamma ray attenuation technique.
Shear StrengthMeasurements of the shear strength of sediment were
made. The values were obtained by measuring thetorque required to shear the sediment as it was appliedto a four-bladed rectangular vane having known widthand height. The method is capable of providing mean-ingful quantitative data for clayey sediments. However,when used for sediment types other than clays, the inter-pretation of the data becomes much more qualitative.
OPERATION OF THE IPOD IN-SITUPORE WATER SAMPLE (Ross O. Barnes)
IntroductionA new downhole instrument designed to filter and
collect pore waters from sediments undisturbed by thedrilling operation was tested for the first time on Leg47B. The IPOD in-situ pore-water sampler will be usedto collect geochemical information not obtainable byother means.
Pore fluid samples are routinely obtained on the D/VGlomar Challenger by pressure filtration of recoveredcore sections. Chemical speciation in the pore fluids canbe altered during this procedure by a variety of mecha-nisms. Temperature and pressure changes during corerecovery can alter ion-exchange equilibria between solidand liquid phases. Reduced sediments can be partiallyoxidized by exposure to oxygenated waters and theatmosphere. Disturbance of the sediment core by thedrilling operation and the long residence time of thecore in the drill pipe may lead to significant sea watercontamination. Escape of CO2 from the core materialcan alter speciation in the carbonate system and lowerthe alkalinity of the recovered pore water. In-situcollected pore-water samples can reduce or eliminatethese disturbances, thereby providing a valuable checkon the accuracy of conventional pore-water chemicaldata.
For accurate dissolved gas concentration measure-ments, squeezed pore-water samples are not satisfactorybecause of gas loss and exchange during core recoveryand processing (Barnes, 1973). Pore-water samplesfrom Glomar Challenger drilling operations that aresuitable for dissolved gas analysis would be valuable forseveral studies. (1) Inert gas concentration profiles arerequired for investigation of crustal degassing of helium(Barnes and Bieri, 1976); possible paleotemperaturedata deduced from inert gas ratio measurements(Mazor, 1972); and investigation of the cause of
anomalous inert gas concentrations in sedimentary porewaters (Barnes, in preparation). (2) We wish to investi-gate the interrelationships of various reactions occur-ring during the biogeochemical cycling of carbon, nitro-gen, and sulfur. N2 and N2O are produced duringdevitrification and low molecular weight hydrocarbonsare produced during anoxic decomposition of organicmatter. Does the sequence and relationship of theoxidation-reduction reactions in these systems vary withthe rate of reaction? IPOD pore-water samples providea time domain not accessible to surface coring tech-niques.
Theory of Operation
To accomplish the above objectives, pore water fromsediment undisturbed by the drilling operation must befiltered from the solid-phase in situ and sealed againstgas loss and atmospheric contamination until chemicalor gas analysis is performed.
The IPOD in-situ sampler utilizes the in-situ hydro-static pressure to force pore water through a finestainless mesh filter into a 0.476 cm O.D. × 6.1 m longcoiled metal sample tube that has an internal volume of50 cm3.
The filter element utilizes the finest weave stainlesssteel mesh available and has a nominal filtering effi-ciency of about 1 micron. A more detailed descriptionof the filter's construction is given by Barnes (1973).
The upper end of the sample tube is connected to anempty overflow cylinder that maintains a low internalpressure and collects excess filtered pore water. Anadjustable spring-loaded check valve between thesample tube and overflow cylinder maintains the porefluid sample at a positive pressure of up to 40 atm toprevent formation of gas bubbles in the fluid sampleunder all conditions except when the partial pressure ofmethane exceeds the set pressure.
When the sampler is prepared for use, the fluid inlettubing and sample coil are filled with fresh water toeliminate air bubbles that could contaminate the col-lected pore-water sample. Sufficient pore fluid must befiltered to completely flush this fresh water from thesample tubing into the overflow cylinder.
The sampler takes the place of the lower half of astandard core-barrel assembly. The sampler core-barrelassembly is dropped down the drill pipe and latches intoposition above the drill bit with the filter probe extend-ing through the drill bit for about 1 meter. The drillstring is then lowered, pushing the filter probe into thebottom of the drill hole until 5000 to 15,000 lbs ofweight is resting on the bit. The sampler timer opens thesample control valve for a set time interval (5 to 10minutes) and then closes it again. The drill string israised off the bottom of the hole and the sampler core-barrel assembly is retrieved in the normal manner.
After successful recovery of a pore fluid sample, themetal sample tube is crimp-sealed at each end withrefrigeration tubing clamps and removed from thesampler. The sample tube can be further divided intosub-samples for a variety of different analyses by crimp-sealing segments of the 6.1-meter-long tube.
19

INTRODUCTION AND EXPLANATORY NOTES
Use of the in-situ sampler precludes recovery of acore during the round-trip of the inner core-barrelassembly described above. However, drilling is haltedduring this time so that little core would be lost betweenthe preceding and succeeding standard core sections.Samples of core material from the bottom of the preced-ing core section or the top of the succeeding sectionshould be squeezed for chemical comparison with thein-situ collected sample.
The use of the sampler is limited to sediments softenough to be penetrated by the probe without fracturewhich would provide conduits for sea water contamina-tion of the pore fluid sample.
Physical Description of Sampler
The working part of the sampler is illustrated inFigure 8. The numbers in the text refer to the numberedcomponents in the figure.
A stainless mesh filter element (1) is attached to theend of a filter probe that penetrates the sediment aheadof the drill bit. A motorized sampling control valve (8),when closed, prevents fluid flow into the sampler. Whenthe control valve is open, hydrostatic pressure will forcefiltered pore fluid into the sampler.
A reversible DC motor (10) is connected to the con-trol valve through a slip clutch (9) that prevents over-tightening of the needle valve (8). The valve opens andcloses in one turn. Travel is limited by a 3PDT switch(SW#3) that is actuated by a lever attached to the torquehandle. The switch limits rotation by shutting off themotor and reversing the polarity of the motor leads sothat the motor reverses direction when it is re-energizedby the timer.
A controller-timer (16) opens and closes the motor-ized valve (8) at appropriate times. A battery pack (14)supplies power to the motor and timer. A manual motoroperation switch (SW#2), mounted on the motor hous-ing, permits one to open and close the control valveindependently of the timer.
The pressure regulator (7) protects the sampler fromexcessive internal fluid pressure. The sample coil (11)collects the filtered pore fluid and is sealed and removedfrom the sampler after recovery. The check valve (12)maintains a positive pressure of several tens of atmos-pheres on the fluid in the sample coil to prevent gasbubble formation. The overflow cylinder (13) collectsexcess fluid and acts as a low pressure reservoir thatmaintains the pressure differential across the filter ele-ment. The pressure safety switch (SW#1) consists of aspring-loaded hydraulic piston that closes a pushbuttonDPDT switch when the pressure in the overflow cylinderreaches a preset amount. This switch then turns themotor on and closes the control valve independently ofthe timer.
An automotive shock absorber (5) protects the innercase assembly from excessive stress when the samplerimpacts at the drill bit.
The sampler and its operation are discussed in moredetail in the Operations Manual for the instrument thatis available at DSDP headquarters in La Jolla, Califor-nia, and on D/V Glomar Challenger.
I !
-16
-12
-10
Figure 8. Schematic block diagram (not to scale) of theIPOD in-situ pore water sampler. (1) filter element,(2) drill bit, (3) 1/16 in. O. D. S. S. fluid inlet tubing,(4) lower sampler case bulkhead, (5) shock absorber,(6) pressure case, (7) pressure regulator, (8) samplingcontrol valve, (9) torque handle, (10) D. C. gear mo-tor, (11) sample coil, (12) high-pressure check valve,(13) overflow cylinder with drain valves on each end,(14) battery pack, (15) inner case assembly, (16) timer-controller. SW # 1 = pressure safety switch, SW # 2= manual motor switch, SW # 3 = motor shut-offand reversing switch.
20
INTRODUCTION AND EXPLANATORY NOTES
The working part of the sampler above the lowerbulkhead (4) is enclosed in a pressure case with doubleO-ring seals and bulkheads at each end. The filter probeattaches to the lower end of the lower bulkhead and thethree standard lower sections of the inner core-barrelassembly screw over the probe and onto the lower bulk-head. The assembled tool is physically interchangeablewith the lower section of the inner core-barrel assembly.
Operational Tests
The major goal of this initial cruise was to test thesampler operationally, determine needed modificationsif necessary, and work out an operational procedure forthe samplers use.
The sampler was first lowered down the drill pipe ona wire cable (sand line) since we were reticent to free-falla new untried instrument, although the sampler wasconstructed to hopefully withstand the rigors of free-falling.
The first downhole run at 110 meters sub-bottomdepth in Hole 398 was successful. The sampler filtered atotal of 84 cm3 of pore water in five minutes samplingtime, of which 50 cm3 were collected in the metal sampletube.
The second downhole run at 232 meters sub-bottomdepth in Hole 398B broke the sand line when retrievalwas attempted. Fishing for the broken end of the cablewas unsuccessful, and the drill string was raised almostto the surface before the sampler was retrieved. Thiswas the second sand line to be broken, leaving bothcables too short to reach anticipated basement for thissite. The first sand line was broken in Hole 398 by theheat flow instrument during a downhole temperaturemeasurement. Apparently, wire kinks caused by excesswire slack are a not-infrequent cause of cable breakagewhen downhole instruments are lowered on the sandline. Several wire breaks during attempted retrieval ofthe sampler unintentionally tested its resistance to free-fall stresses. The sampler survived intact with nodamage except that the pore fluid sample was dilutedwith sea water and lost because a small leak suddenlydeveloped in the sample control valve (insufficient clos-ing torque). This was a minor operational adjustmentthat was rectified.
With the major geological objectives of the leg jeop-ardized because of wire breaks, the in-situ sampler wasput aside so that the major re-entry hole would not besubject to increased risk of failure.
The wire breaks during attempted retrieval demon-strated that the sampler can be dropped down the drillpipe and retrieved like a regular core barrel thus elimi-nating the extra risk of sand line breakage.
On subsequent legs, the sampler was lowered on thesand line using a different procedure than that used onLeg 47B; downhole water pumping during lowering ofthe sampler kept the sand line taut. No breaks occurredusing this procedure, hence either free-fall or loweringon a line can be used to position the sampler at the drill-ing bit. The line is preferred because of greater controlon speed of descent and less impact shock to the instru-ment.
To further test the samplers ability to operate in afree-fall mode and to check the operation of the safetysystems that prevent flooding when the sampler opens insea water with no hydraulic filtering resistance, a thirddownhole run was made after Hole 398D was termi-nated and plugged, and the drill string was pulled abovethe ocean floor. There was no probe attached to thesampler; water could enter through the open tubing con-nection on the lower bulkhead. The sampler wasallowed to free-fall down the drill pipe. To save time, itwas not recovered with the sand line, but came up as thedrill string was raised to the ship. All parts of thesampler, including the safety systems, functioned as in-tended, with no damage. It returned full of sea water.
Geochemical Tests
Barnes et al. (this volume) compare the chemicalanalyses obtained on the in-situ pore-water sample withthe analytical data for the water samples squeezed fromcore sections.
All of the sampler plumbing in contact with the col-lected sample is stainless steel (primarily type 316)except for the sample coil itself which was constructedof copper refrigeration tubing. This tubing is inexpen-sive; it can be crimp-sealed and reopened by removingthe crimping device and is not subject to diffusive gasloss through the tubing walls during storage. The lattertwo factors are important for shore-based gas concen-tration studies.
Copper reacts readily with sea water so that samplesstored in this tubing would be unsuitable for somechemical analysis. Leg 47B was primarily an operationaltrail for the in-situ sampler. There was insufficient pre-cruise time to test the copper coil for all possible chem-ical effects.
During and subsequent to Leg 47B, we investigatedthe effects of the copper coils on some of the shipboardanalytical procedures. The copper tubing as received iscleaned and sealed for refrigeration service. Analysisof sea water stored in this tubing showed apparent in-creases in alkalinity, calcium, and magnesium. Whenthe tubing was cleaned with a detergent and flushed withdistilled water, the tubing effect on the calcium andmagnesium concentrations was essentially eliminated,but alkalinity continued to show an approximate 6 percent increase.
To eliminate these undesirable chemical effects of thecopper tubing, we are now using a double sample coil.The lower 10 cm3 is constructed of teflon-coated stain-less steel and is used for chemical analysis. The 50-cm3
copper coil is attached to the upper end of the stainlesstube and is crimped off for shore-based gas studies.
Summary
We successfully tested a new in-situ pore-watersampler that should provide valuable new geochemicalinformation on subsequent legs of the IPOD program.The sampler is operational as used on Leg 47B, butseveral modifications will be made for increased mech-anical reliability and ease of use. Modifications to thesample collection coil will continue to be made to pro-
21

INTRODUCTION AND EXPLANATORY NOTES
vide more reliable chemical data and to provide foradditional analytical programs.
ACKNOWLEDGMENTS
This work was supported by NSF Grants OCE76-20151 toUniversity of California, San Diego and NSF Grant DES75-19383 to Walla Walla College. I would like to thank Joris M.Gieskes for his assistance in initiating this project. The suc-cessful use of the sampler was in large measure the product ofthe cooperation and assistance of the DSDP staff duringinstrument design and initial testing on Leg 47B.
REFERENCES
Bader, R. G. et al., 1970. Initial Reports of the Deep Sea Drill-ing Project, v. 4, Washington (U.S. Government PrintingOffice), p. 745-753.
Barnes, R. O., 1973. An in situ interstitial water sampler foruse in unconsolidated sediments, Deep-Sea Res., v. 20,p. 1125-1128.
Barnes, R. O. and Bieri, R. H., 1976. Helium flux throughmarine sediments of the northeast Pacific Ocean, EarthPlanet. Sci. Lett., v. 28, p. 331-336.
Bennett, R. H. and Keller, G. H., 1973. Physical propertiesevaluation. In van Andel, T. H., Heath, G. R., et al., Ini-tial Reports of the Deep Sea Drilling Project, v. 16: Wash-ington (U.S. Government Printing Office), p. 513-519.
Boyce, R. E., 1972. Grain size analyses, Leg 9. In Hays, J. D.et al., Initial Reports of the Deep Sea Drilling Project, v. 9:Washington (U.S. Government Printing Office), p. 779-798.
, 1973. Physical properties—methods. In Edgar, N.T., Saunders, J. B., et al., Initial Reports of the Deep SeaDrilling Project, v. 15: Washington (U.S. GovernmentPrinting Office), p. 1115-1127.
Boyce, R. E. and Bode, G. W., 1972. Carbon and carbonateanalyses, Leg 9, Deep Sea Drilling Project. In Hays, J. D.,
et al., Initial Reports of the Deep Sea Drilling Project, v. 9:Washington (U. S. Government Printing Office), p. 797-816.
Goddard, E. N., et al., 1963. Rock color chart: New York(Geol. Soc. Am.).
Hedgepeth, J. W., 1957. Classification of marine environ-ments, Geol. Soc. Am. Mem. 67, v. 1, p. 17.
Jones, J. B. and Segnit, E. R., 1971. The nature of opal, inNomenclature and constituent phases, J. Geol. Soc,Australia, v. 18, p. 57-68.
Kullenberg, B., 1952. On the salinity of the water contained inmarine sediments, Medd. Oceanografiska Inst. Goteborg,v. 21.
Matthews, D. J., 1939. Tables of the velocity of sound in purewater and in seawater: Admiralty, London (HydrographicDepartment).
Mazor, E., 1972. Paleotemperatures and other hydrologicalparameters deduced from noble gases dissolved in ground-waters; Jordan Rift Valley, Israel, Geochim. Cosmochim.Ada, v. 36, p. 1321-1336.
Müller, G. and Gastner, M., 1971. The "karbonate bombe";a simple device for the determination of the carbonatecontent in sediments, soils and other materials, N. Jb.Miner. Mh., v. 10, p. 466-469.
Waterman, L. S., 1970. Interstitial water program, ShipboardManual, Deep Sea Drilling Project Manuscript Rep., May1970: Scripps Institution of Oceanography, p. 141.
Wentworth, C. K., 1922. A scale of grade and class terms ofclastic sediments, J. Geol., v. 30, p. 377.
Wentworth, C. K. and Williams, H., 1932. The classificationand terminology of the pyroclastic rocks, Rept. Comm.Sed. Nat. Research Council, Bull. 89, p. 19-53.
Whitmarsh, R. B., Weser, O. E., and Ross, D. A., 1974. Ex-planatory notes. In Whitmarsh, R. B., Weser, O. E., Ross,D. A., et al., Initial Reports of the Deep Sea Drilling Proj-ect, v. 23: Washington (U. S. Government Printing Office),p. 20-29.
22