
ANNEX A - Filinvest Development Corporation
319
1 C O V E R S H E E T SEC Registration Number 5 1 0 4 8 C O M P A N Y N A M E F I L I N V E S T D E V E L O P M E N T C O R P O R A T I O N A N D S U B S I D I A R I E S PRINCIPAL OFFICE ( No. / Street / Barangay / City / Town / Province ) T H E B E A U F O R T , 5 T H A V E N U E C O R N E R 2 3 R D S T R E E T , B O N I F A C I O G L O B A L C I T Y , T A G U I G C I T Y , M E T R O M A N I L A Form Type Department requiring the report Secondary License Type, If Applicable 1 7 - A S E C N A C O M P A N Y I N F O R M A T I O N Company’s Email Address Company’s Telephone Number Mobile Number www.filinvestgroup.com 7798-3977 No. of Stockholders Annual Meeting (Month / Day) Fiscal Year (Month / Day) 4,039 Excluding Treasury) Every Last Friday of April Each Year 12/31 CONTACT PERSON INFORMATION The designated contact person MUST be an Officer of the Corporation Name of Contact Person Email Address Telephone Number/s Mobile Number Mr. Nelson M. Bona [email protected] 7798-3977 N/A CONTACT PERSON’s ADDRESS The Beaufort, 5th Avenue Corner 23rd Street, Bonifacio Global City, Taguig City, Metro Manila NOTE 1 : In case of death, resignation or cessation of office of the officer designated as contact person, such incident shall be reported to the Commission within thirty (30) calendar days from the occurrence thereof with information and complete contact details of the new contact person designated 2 : All Boxes must be properly and completely filled-up. Failure to do so shall cause the delay in updating the corporation’s records with the Commission and/or non-receipt of Notice of Deficiencies. Further, non-receipt of Notice of Deficiencies shall not excuse the corporation from liability for its deficiencies.
-
Upload
khangminh22 -
Category
Documents
-
view
3 -
download
0
Transcript of ANNEX A - Filinvest Development Corporation

1
C O V E R S H E E T
SEC Registration Number
5 1 0 4 8
C O M P A N Y N A M E
F I L I N V E S T D E V E L O P M E N T
C O R P O R A T I O N A N D S U B S I D I A R I E S
PRINCIPAL OFFICE ( No. / Street / Barangay / City / Town / Province )
T H E B E A U F O R T , 5 T H A V E N U E C O R N E R
2 3 R D S T R E E T , B O N I F A C I O G L O B A L
C I T Y , T A G U I G C I T Y , M E T R O M A N I L A
Form Type Department requiring the report Secondary License Type, If Applicable
1 7 - A S E C N A
C O M P A N Y I N F O R M A T I O N
Company’s Email Address Company’s Telephone Number Mobile Number
www.filinvestgroup.com 7798-3977
No. of Stockholders Annual Meeting (Month / Day) Fiscal Year (Month / Day)
4,039 Excluding Treasury)
Every Last Friday of
April Each Year
12/31
CONTACT PERSON INFORMATION
The designated contact person MUST be an Officer of the Corporation Name of Contact Person Email Address Telephone Number/s Mobile Number
Mr. Nelson M. Bona [email protected] 7798-3977 N/A
CONTACT PERSON’s ADDRESS
The Beaufort, 5th Avenue Corner 23rd Street, Bonifacio Global City, Taguig City, Metro
Manila
NOTE 1 : In case of death, resignation or cessation of office of the officer designated as contact person, such incident shall be reported to the Commission within thirty (30) calendar days from the occurrence thereof with information and complete contact details of the new contact
person designated 2 : All Boxes must be properly and completely filled-up. Failure to do so shall cause the delay in updating the corporation’s records with the Commission and/or non-receipt of Notice of Deficiencies. Further, non-receipt of Notice of Deficiencies shall not excuse the corporation from liability for its deficiencies.

2
SECURITIES AND EXCHANGE COMMISSION
SEC FORM 17-A
ANNUAL REPORT PURSUANT TO SECTION 17 OF THE SECURITIES REGULATION CODE (SRC) AND SECTION
141 OF CORPORATION CODE OF THE PHILIPPINES
1. For the calendar year ended December 31, 2019
2. Commission identification Number 51048. 3. BIR Tax Identification 000-053-167-000.
4. Exact name of registrant as specified in its charter: FILINVEST DEVELOPMENT CORPORATION
5. Philippines 6. (SEC Use Only)
Province, Country or other jurisdiction of Code Industry Classification Code:
7. The Beaufort, 5th Avenue Corner 23rd Street,
Bonifacio Global City, Taguig City, Metro Manila1634
8. 02-7798-3977
Address of principal office Registrant’s telephone number, including area code
9.
Former name, former address, and former fiscal year, if
changed since last report
10. Securities registered pursuant to Sections 8 and 12 of the SRC, or Sec. 4 and 8 of the RSA
Number of Shares of Common Stock
Title of Each Class Outstanding and Amount of Debt Outstanding
Common stock, P1.00 par value 8,648,462,987 shares
P130,221.3 million total consolidated debt
(long-term debt)
11. Are any or all of these securities listed in the Philippines Stock Exchange?
Yes [ X ] No [ ]
12. Check whether the issuer:
(a) Has filed all reports required to be filed by Section 17 of the SRC and SRC Rule 17 thereunder or Section 11 of the RSA
and RSA Rule 11(a)-1 thereunder, and Sections 26 and 141 of The Corporation Code of the Philippines during the preceding 12
months (or for such shorter period that the registrant was required to file such reports) :
Yes [ X ] No [ ]
(b) Has been subject to such filing requirements for the past 90 days.
Yes [ X ] No [ ]
13. Aggregate market value of the voting stock held by non-affiliates as of December 31, 2019.
P12.0 Billion
APPLICABLE ONLY TO ISSUERS INVOLVED IN INSOLVENCY/SUSPENSION OF PAYMENTS PROCEEDINGS
DURING THE PRECEDING FIVE YEAR:
14. Check whether the Issuer has filed all documents and reports required to be filed by Section 17 of the Code subsequent to the
distribution of securities under a plan confirmed by a court of the Commission.
Yes [ ] No [ ]
DOCUMENTS INCORPORATED BY REFERENCE
15. If any of the following documents are incorporated by reference, briefly describe them and identify the part of SEC Form 17-1
into which the document is incorporated.
a. Any annual report to security holders;
b. Any proxy or information statement filed pursuant to SRC Rule 20 and 17.1(b);
c. Any prospectus filed pursuant to SRC Rule 8.1-1
Not Applicable

3
PART I - BUSINESS AND GENERAL INFORMATION Page No.
Item 1 Business
1.1 Corporate Information, History, Developments, Form and Organization 4
1.2 Bankruptcy, Receivership or Similar Proceedings 8
1.3 Material Reclassification, Merger, Consolidation or Purchase or Sale of a Significant
Amount of Assets (not ordinary) over the past three years
8
1.4 Significant Subsidiaries, Segments and Business Groups 9
1.5 Intellectual Property of the Group 37
1.6 Government Regulations and Environmental Laws 41
1.7 Employees and Labor 44
1.8 Major Risks, Risk Management, Strengths and Strategies 45
Item 2 Properties 64
Item 3 Legal Proceedings 68
Item 4 Submission of Matters to a Vote of Security Holders 70
PART II - OPERATIONAL AND FINANCIAL INFORMATION
Item 5 5.1 Market for Registrant’s Common Equity and Related Stockholder Matters 71
5.2 Bond Issuances 71
Item 6 Management's Discussion and Analysis or Plan of Operations 72
Item 7 Financial Statements 93
Item 8 Changes in and Disagreements With Accountants on Accounting and
Financial Disclosure
93
PART III – CONTROL AND COMPENSATION INFORMATION
Item 9 Directors and Executive Officers of the Registrant 94
Item 10 Executive Compensation 97
Item 11 Security Ownership of Certain Beneficial Owners and Management 98
Item 12 Certain Relationships and Related Transactions 98
PART IV - COMPLIANCE WITH LEADING PRACTICES ON CORPORATE GOVERNANCE
Item 13 Corporate Governance 100
PART V - EXHIBITS AND SCHEDULES
Item 14 a. Exhibits 101
b. Reports on SEC Form 17-C (Current Report) 101
SIGNATURES 102

4
PART I - BUSINESS AND GENERAL INFORMATION
ITEM 1. BUSINESS
1.1 Corporate Information, History, Developments, Form and Organization
Filinvest Development Corporation (FDC or the “Parent Company”) was incorporated in the Philippines on
April 27, 1973 and has evolved from businesses established by the Gotianun Family since 1955. Originally engaged in the small-scale
financing of second-hand cars, the Gotianun Family later expanded into consumer finance in partnership with foreign institutions, such
as Chase Manhattan Bank, Westinghouse Electric Corporation and Ford Philippines. By the early 1980s, the Gotianun Family's Filinvest
Credit Corporation became one of the leading consumer finance companies in the Philippines in terms of assets. Over time, the
"Filinvest" name became established and well-recognized in the Philippines not only in financing and banking but also in real estate
development and other lines of business.
In 1967, the Gotianun Family entered the real estate business through the incorporation of Filinvest Realty Corporation, which was
engaged in the development of residential subdivisions. In 1984, the Gotianun Family consolidated their real estate interests in FDC
after divesting their shares in Family Bank and Trust Company (Family Bank) and the Insular Bank of Asia and America. By 1990,
FDC expanded its product line to include the construction and sale of low-cost and medium-cost housing units. Thereafter, the product
line was further expanded to include the development of commercial district, leisure projects such as farm estates and sports clubs, and
construction of residential and office condominiums.
Filinvest Land Inc. (FLI) was incorporated on November 24, 1989. It began commercial operations in August 1993 after FDC spun off
its real estate operations and transferred all related assets and liabilities to FLI in exchange for shares of FLI. FLI shares were listed on
the Philippine Stock Exchange (PSE) on October 25, 1993. FDC remains FLI’s largest shareholder. As of December 31, 2019, FDC
beneficially owned approximately 64.8% of FLI’s outstanding common shares and all of its issued and outstanding preferred shares,
such that FDC had a 73.5% voting ownership in FLI.
Filinvest Alabang, Inc. (FAI) was incorporated on August 25, 1993 in connection with the joint development of Filinvest City in
Alabang, Muntinlupa City. With its development of Filinvest City, the Parent Company and its subsidiaries (collectively referred to as
the “Filinvest Group” or the “Group”) started to be a central business district developer and has successfully ventured into retail, office,
high-rise residential and leisure club development. As of December 31, 2019, FDC directly owned 80.0% of FAI’s issued and
outstanding shares and FLI owned the remaining 20.0%.
In 1994, FDC decided to re-enter the banking and financial services business based on the then strengthening fundamentals of the
Philippine economy and the Gotianun Family’s prior experience in this business in the 1970s and 1980s. FDC incorporated East West
Banking Corporation (EW or the “Bank”) in March 1994. On May 7, 2012, EW was publicly listed on the PSE. As of December 31,
2019, FDC remained EW’s largest shareholder, beneficially owning 77.9% of EW’s issued and outstanding shares.
To diversify its business and position, FDC, as the Gotianun Family’s primary holding company for its investments, acquired 100.0%
of the issued and outstanding shares of Pacific Sugar Holdings Corporation (PSHC) from A.L. Gotianun, Inc. (ALGI) on June 29, 2007.
PSHC owns three (3) Mindanao-based sugar companies, Davao Sugar Central Company, Inc. (DSCC), Cotabato Sugar Central
Company, Inc. (CSCC) and High Yield Sugar Farms Corporation (HYSFC).
In 2009, the Group re-entered the power generation business through FDC Utilities, Inc. (FDCUI). In 2013, FDCUI started developing
a 3 x 135 Megawatt (MW) circulating fluidized bed (CFB) coal thermal power plant in Philippine Veterans Investment Development
Corporation (PHIVIDEC) Industrial Estate, Villanueva, Misamis Oriental, Mindanao. The plant became fully operational with
Certificate of Completion (COC) received in October 2016 for the first two (2) units and in May 2017 for the remaining third unit.
The Group's hospitality business is operated through both Chroma Hospitality, Inc. (Chroma) and Filinvest Hospitality Corporation
(FHC). Chroma, a joint venture of FDC (60.0%) and Archipelago International Pte. Ltd (AIPL) (40.0%), was established in 2008 to
manage the Group’s hospitality projects. AIPL is an affiliate of Aston International, which manages hotels, resorts, residences, spas
and villas under the Aston, Alana, Quest, Fave and Kamuela brands. Chroma’s principal purpose is to provide a comprehensive range
of design, consulting, technical, marketing, training, operations and management services for hotels, serviced apartments, villas,
condotels, and boutique resorts. In August 2011, FDC formed its wholly owned subsidiary, FHC. The primary role of FHC in
collaboration with Chroma is to evaluate, plan, develop and optimize potential and current hospitality investments. The Group’s
completed hospitality projects include Crimson Resort and Spa Mactan (CRSM) under FDC’s directly owned subsidiary Mactan
Seascapes Services, Inc. (MSSI); Quest Hotel and Conference Center Cebu (QHCC Cebu); Crimson Hotel Filinvest City Manila
(CFCM) under Entrata Hotel Services, Inc. (EHSI); QHCC Clark and Mimosa Golf, Clark under Mimosa Cityscapes, Inc. (MCI); and
Crimson Resort and Spa Boracay (CRSB) under Boracay Seascapes, Inc. (BSI). All hotels are professionally managed and operated by
Chroma under a management agreement.
With over 50 years of experience in industries that are highly sensitive to the financial crises, market downturns, and political upheaval,
the Filinvest Group has emerged as one of the few survivors in the country. The Group has carefully built and nurtured a distinguished

5
performance record in the real estate development and banking and financial services, which was recognized by international bankers,
fund managers, other global institutional investors, and the international financial community.
The Parent Company’s registered business address is at The Beaufort, 5th Avenue Corner 23rd Street, Bonifacio Global City, Taguig
City, Metro Manila, Philippines. FDC common shares were listed on the PSE on December 22, 1982.
ALGI is the ultimate parent company of FDC and its subsidiaries. ALGI’s registered business address is at The Beaufort, 5th Avenue
Corner 23rd Street, Bonifacio Global City, Taguig City, Metro Manila.
Real Estate Operations
On December 26, 2019, Cyberzone Properties, Inc. (CPI) and Filinvest Cyberparks, Inc. (FCI), wholly owned subsidiaries of FLI,
entered into a Deed of Assignment to sell its ownership in Pro-Excel Property Managers, Inc. (Pro-Excel) to FAI. The primary purpose
of Pro-Excel is to engage in the business of administration, maintenance and management of real estate development, controlled
development projects and subdivision projects.
On December 16, 2019, Spectrum Alabang Properties, Inc. (SAPI), a wholly owned subsidiary of FAI, was incorporated to engage in
the developments of real estate properties and/or managing commercial, recreational facilities and residential, office buildings and other
related activities. SAPI has not started its commercial operations as of December 31, 2019.
On October 11, 2019, ProMixers Aggregates Corp. (PMAC), a wholly owned subsidiary of Dreambuilders Pro, Inc. (DPI), was
incorporated mainly to operate concrete batching plant, manufacture and supply of pre-cast and construction equipment and rental.
PMAC has not started its commercial operations as of December 31, 2019.
On July 4, 2019, Professional Operations and Maintenance Experts Incorporated (PROMEI), a joint venture company with Engie
Services Asia Pacific Pte. Ltd. doing business as Engie Services Philippines (ENGIE) was incorporated to operate, maintain and repair
existing and future technical systems, including but not limited to heating, ventilation and air conditioning systems district cooling
systems and distributed energy systems, and implement new technologies in connection with saving energy and reducing operating costs.
PROMEI is 47.5% owned by FDC and 52.5% owned by ENGIE. PROMEI has not started its commercial operations as of December
31, 2019.
On March 18, 2019, ProOffice Works Services, Inc. (ProOffice), a wholly owned subsidiary of FLI, was incorporated to engage in the
business of administration, maintenance and management of real estate developments and projects. ProOffice started its commercial
operations in August 2019.
On July 18, 2018, the Securities and Exchange Commission (SEC) approved Timberland Sports and Nature Club, Inc.’s (TSNC or the
“Club”) application for voluntary revocation of its secondary registration which allowed TSNC to proceed with the transition to its new
business model. On November 15, 2018, TSNC’s Board of Directors (BOD) approved the amendment to change the primary purpose
of the Club from an exclusive recreational sports club to a for profit commercial facility. On July 24, 2019, TSNC submitted its Amended
Articles of Incorporation to SEC. The amendments include (a) change of the primary purpose of TSNC from that of an exclusive
recreational sports club to a real estate development Company; (b) change of TSNC’s principal address from No. 173 P. Gomez Street,
San Juan, Metro Manila to Timberland Heights, Barangay Malanday, San Mateo Rizal; (c) converting of TSNC’s capital stock from no
par value club shares to par value shares; (d) removal of provisions which characterizes TSNC as an exclusive non-profit association;
and (e) removal of paragraphs which relate to the operations of an exclusive recreational sports club. On August 1, 2019, the SEC
approved TSNC’s application on voluntary revocation of its secondary registration. On August 18, 2019, the SEC approved TSNC’s
Amended Articles of Incorporation.
On January 19, 2018, FLI entered into a Share Sale and Purchase Agreement to purchase 100% of the total outstanding shares of Gintong
Parisukat Realty and Development, Inc. (GPRDI) for a total consideration of P=1,706.4 million. The primary purpose of GPRDI is to
hold, purchase, lease, contract or otherwise acquire any and all real and personal properties. GPRDI has not started its commercial
operations as of December 31, 2019. The acquisition of GPRDI was accounted for as an asset acquisition.
On November 20, 2017, Filinvest Lifemalls Tagaytay, Inc. (FLTI), a wholly owned subsidiary of FLI, was incorporated. Its primary
purpose is to acquire by purchase, lease except financial leasing, donation or otherwise, and to own, use, improve, develop, subdivide,
sell, mortgage, exchange, lease, develop, conduct, operate and maintain the business of modernized commercial shopping centers and
all the businesses related thereto. FLTI started its commercial operations in March 2018.
On August 3, 2017, Realpros Philippines, Inc. (RPI), a wholly owned subsidiary of FLI, was incorporated. Its primary purpose is to
provide administrative support services and skills training primarily through the use of information technology, licensed software, and
systems. RPI started its commercial operations in November 2017.

6
On March 29, 2017, Proleads Philippines, Inc. (Proleads), a wholly owned subsidiary of FLI, was incorporated. Its primary purpose is
to provide management, organizational, and other administrative services and training. Proleads started its commercial operations in
November 2017.
On February 7, 2017, Property Leaders International Limited (PLIL), a company limited by shares, was registered at the territory of the
British Virgin Islands. PLIL has not started its commercial operations as of December 31, 2019.
On January 23, 2017, Filinvest Cyberzone Mimosa, Inc. (FCMI) and Filinvest Lifemalls Mimosa, Inc. (FLMI), wholly owned
subsidiaries of FLI, were incorporated, both with the primary purpose to acquire by purchase, lease except financial leasing, donation
or and hold for investment or otherwise deal in real estate of all kinds, nature, purpose and/or any interest or right therein. FCMI started
its commercial operations in May 2018. FLMI has not started its commercial operations as of December 31, 2019.
On January 11, 2017, Dreambuilders Pro, Inc. (DPI), a wholly owned subsidiary of FLI was incorporated. Its primary purpose is to
engage in and carry on a general construction business. DPI started its commercial operations in February 2017.
Hospitality Operations
On September 9, 2019, Dauin Seascapes, Inc. (DSI), a wholly owned subsidiary of FHC, was incorporated with primary purpose of
developing, administering hotels, resorts and entertainment of all kinds and related activities. DSI has not started its commercial
operations as of December 31, 2019.
On January 21, 2019, Zamboanga Cityscapes, Inc. (ZCI), a wholly owned subsidiary of FHC, was incorporated to sell, use, assign,
transfer, dispose, hold, mortgage, and lease purchased and owned real property and personal property of all kinds. ZCI has not started
its commercial operations as of December 31, 2019.
On November 30, 2018, FHC subscribed to 2.5 million common shares of EHSI. The resulting ownership interest of FHC and FAI in
EHSI after subscription is 76.9%, and 23.1%, respectively. Prior to the subscription, EHSI is 100.0% owned by FAI. Its primary
purpose is to own, lease, operate and/or manage hotels, resorts, villas, service apartments and condotels, and all adjuncts and accessories
and other related activities.
On August 24, 2018, Fora Services, Inc. (Fora Services), Fora Restaurants, Inc. (FRI), and Nature Specialists, Inc. (NSI), wholly owned
subsidiaries of FHC, were incorporated. The primary purpose of Fora Services is to develop and administer hotels, resorts and
entertainment of all kinds. FRI’s primary purpose is to maintain, operate and manage restaurants, cafes, bars, and general food catering
services while NSI’s primary purpose is to sell, use, assign, transfer, dispose, hold, mortgage, and lease purchased and owned real
property and personal property of all kinds. Fora Services and Fora Restaurants, Inc. started its commercial operations in April 2019
while NSI has not yet started commercial operations as of December 31, 2019.
On November 27, 2017, Dumaguete Cityscapes, Inc. (DCI), a wholly owned subsidiary of FHC, was incorporated to sell, use, assign,
transfer, dispose, hold, mortgage, and lease purchased and owned real property and personal property of all kinds. DCI has not started
its commercial operations as of December 31, 2019.
On June 6, 2017 and February 9, 2017, Princesa Seascapes, Inc. (PSI) and Cubao Cityscapes, Inc. (CCI), wholly owned subsidiaries of
FHC, were incorporated, respectively, with the primary purpose of developing and administering hotels, resorts and entertainment of all
kinds and related activities. PSI and CCI have not started commercial operations as of December 31, 2019.
Power Operations
On November 22, 2018, Filinvest ENGIE Renewable Energy Enterprise, Inc. (FREE), a joint venture company with ENGIE, was
incorporated to engage in the installation and operation of renewable energy facilities, particularly solar rooftop projects. FREE is
owned 60.0% by FDCUI and 40.0% by ENGIE. FREE has not started its commercial operations as of December 31, 2019.
Power operations has 3 x 135 megawatts (MW) circulating fluidized bed (CFB) coal thermal power plants located at Philippine Veterans
Investment Development Corporation (PHIVIDEC) Industrial Estate in Villanueva, Misamis Oriental.
Other Operations
On August 20, 2019, FDC and Hitachi Aqua-tech Engineering Pte. Ltd. (HAQT) entered into a joint venture agreement to form Filinvest-
Hitachi Omni Waterworks, Inc. (FLOW) to engage in operating waterworks, sewerage and sanitation systems and services.
On October 29, 2019, the SEC approved the registration of FLOW. The registered office address of FLOW is at Unit D, 11/F Cyber
Sigma Building, Lawton Avenue, Mckinley West, Barangay Fort Bonifacio, 1630 Taguig City, Metro Manila.
On February 18, 2019, Luzon International Premiere Airport Development Corp. (LIPAD Corp.) was incorporated to engage in the
operation and maintenance of airports. LIPAD Corp. is owned 42.5% by FDC, 33.0% by JG Summit Holdings Inc. (JGSHI), 15.0% by

7
Changi Airports Philippines (I) Pte. Ltd. (CAP) and 9.5% by the Philippine Airport Ground Support Solutions, Inc. (PAGSSI)
(collectively referred to as North Luzon Airport Consortium or NLAC).
On January 21, 2019, NLAC signed the contract that grants a 25-year concession to the consortium to develop the commercial assets,
operate and maintain project facilities and fit-out the new terminal in Clark.
FDC’s consolidated revenues are generated from real estate development and leasing, hospitality operations, banking and financial
services, power operations, sugar cane farming, milling and sugar trading, from subsidiaries, associate, and jointly controlled entities
engaged in various business activities, namely:
Date of Incorporation
Real Estate
FLI November 24, 1989
Filinvest AII Philippines, Inc. (FAPI) September 25, 2006
Homepro Realty Marketing, Inc. (Homepro) March 25, 1997
FCGC Corporation February 11, 2016
Filinvest BCDA Clark, Inc. March 16, 2016
CPI January 14, 2000
FCI February 4, 2014
Filinvest Asia Corporation (FAC) January 22, 1997
FCMI January 23, 2017
FLMI January 23, 2017
Filinvest Lifemalls Corporation (FLC) July 26, 2016
Property Specialist Resources, Inc. (Prosper) June 10, 2002
Pro-Excel November 28, 2001
FLTI November 20, 2017
Festival Supermall, Inc. (FSI) March 21, 1997
FSM Cinemas, Inc. (FSM Cinemas) April 23, 1998
Philippine DCS Development Corporation (PDDC) July 31, 2015
TSNC May 12, 2004
DPI January 11, 2017
Property Maximizer Professional Corp. (Promax) October 3, 1997
Leisurepro, Inc. (Leisurepro) April 21, 2004
Proleads March 29, 2017
PLIL February 7, 2017
RPI August 3, 2017
GPRDI August 18, 2006
Filinvest Mimosa, Inc. (FMI) March 31, 2016
PMAC October 11, 2019
ProOffice March 18, 2019
FAI August 25, 1993
Northgate Convergence Corporation October 14, 1999
Proplus, Inc. February 16, 2000
ParkingPro, Inc. (PPI) July 15, 2016
SAPI December 16, 2019
Hospitality Operations
FHC August 22, 2011
MSSI July 17, 2009
Quest Restaurants, Inc. (QRI) March 12, 2012
BSI December 28, 2012
Chinatown Cityscapes Hotel, Inc. (CCHI) March 22, 2013
Duawon Seascapes Resort, Inc. (DSRI) April 12, 2013
EHSI November 28, 2012
MCI May 13, 2016
CCI February 9, 2017
PSI June 6, 2017
DCI November 27, 2017
Fora Services August 24, 2018
FRI August 24, 2018
NSI August 24, 2018
Chroma November 8, 2008
DSI September 9, 2019
ZCI January 21, 2019

8
Date of Incorporation
Banking and Financial Services
EW March 22, 1994
East West Rural Bank, Inc. (EWRB) November 5, 1997
East West Insurance Brokerage, Inc. (EWIB) July 6, 2015
East West Ageas Life Insurance Corporation (EW Ageas Life) October 20, 2015
Assurance Solutions Insurance Agency (ASIA) April 10, 2012
East West Leasing and Finance Corporation (EWLFC) October 6, 2016
Quest Marketing and Integrated Services, Inc. (QMIS) July 17, 2007
FDC Forex Corporation February 17, 1997
Power Operations
FDCUI December 4, 2009
FDC Retail Electricity Sales Corporation November 16, 2009
FDC Misamis Power Corporation (FDC Misamis) November 16, 2009
FDC Danao Power Corporation March 10, 2011
FDC Camarines Power Corporation March 23, 2011
FDC Casecnan Hydro Power Corporation March 23, 2011
FDC Negros Power Corporation May 22, 2012
FDC Renewables Corporation July 17, 2012
FGS Renewable Energy, Inc.** April 23, 2015
FREE November 22, 2018
**dissolved in February 2018
Sugar Operations
PSHC June 5, 1989
DSCC October 4, 1968
CSCC March 13, 2002
HYSFC June 8, 1990
Others
Corporate Technologies Incorporated (CTI) September 11, 1998
Countrywide Water Services, Inc. (CWSI) May 18, 2012
Filinvest Development Cayman Islands (FDCI) March 12, 2013
PROMEI July 4, 2019
FLOW October 29, 2019
LIPAD Corp. February 11, 2019
1.2 Bankruptcy, Receivership or Similar Proceedings
There was no bankruptcy, receivership or similar proceedings filed by the Company and/or any of its significant subsidiaries during the
past 3 years.
1.3 Material Reclassification, Merger, Consolidation or Purchase or Sale of a Significant Amount of Assets (not ordinary) over
the past 3 years
Other than the acquisitions discussed in the preceding section, there were no material reclassifications, mergers, consolidations or
purchases or sales of significant amount of assets (not ordinary) by the Company and/or its significant subsidiaries during the past 3
years.
9
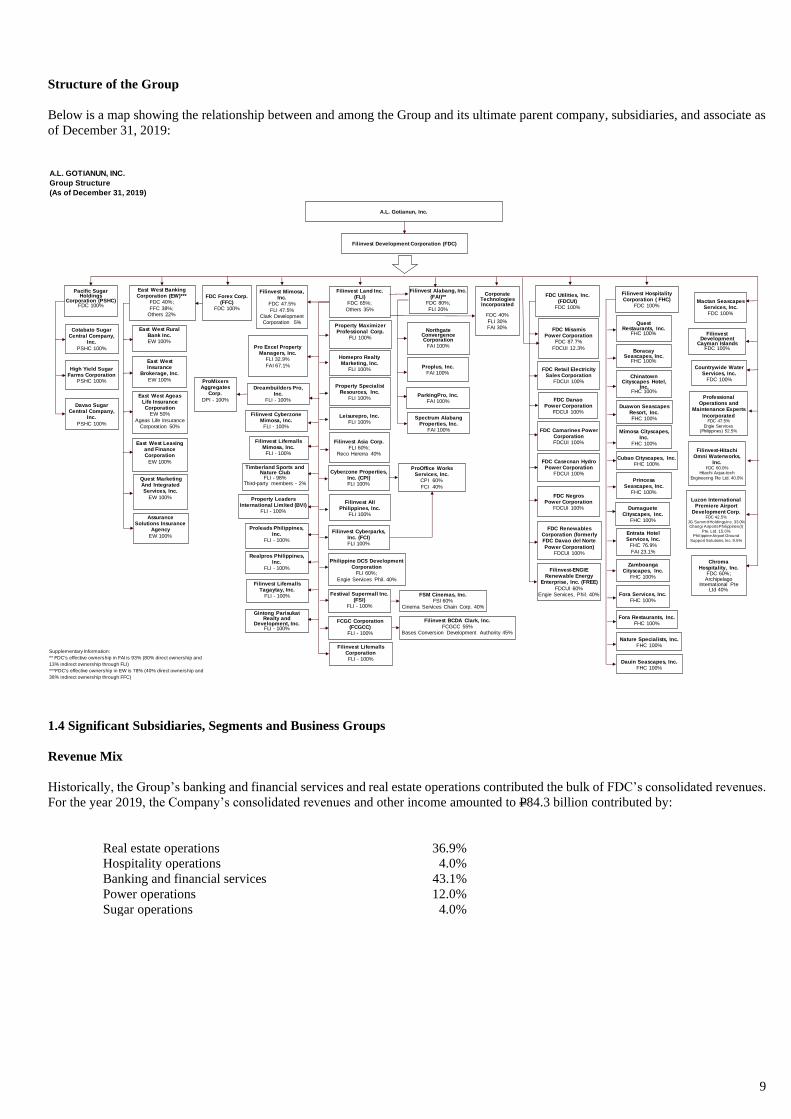
Structure of the Group
Below is a map showing the relationship between and among the Group and its ultimate parent company, subsidiaries, and associate as
of December 31, 2019:
1.4 Significant Subsidiaries, Segments and Business Groups
Revenue Mix
Historically, the Group’s banking and financial services and real estate operations contributed the bulk of FDC’s consolidated revenues.
For the year 2019, the Company’s consolidated revenues and other income amounted to P84.3 billion contributed by:
Real estate operations 36.9%
Hospitality operations 4.0%
Banking and financial services 43.1%
Power operations 12.0%
Sugar operations 4.0%
A.L. GOTIANUN, INC.
Group Structure
(As of December 31, 2019)
Supplementary Information:
** FDC's effective ownership in FAI is 93% (80% direct ownership and
13% indirect ownership through FLI)
***FDC's effective ownership in EW is 78% (40% direct ownership and
38% indirect ownership through FFC)
Mactan Seascapes Services, Inc.
FDC 100%
Filinvest HospitalityCorporation ( FHC)
FDC 100%
A.L. Gotianun, Inc.
Filinvest Development Corporation (FDC)
Quest Restaurants, Inc.
FHC 100%
Pacific Sugar Holdings
Corporation (PSHC)FDC 100%
Davao Sugar Central Company,
Inc.
PSHC 100%
Cotabato Sugar Central Company,
Inc.
PSHC 100%
High Yield Sugar Farms Corporation
PSHC 100%
FDC Utilities, Inc. (FDCUI)
FDC 100%
Corporate TechnologiesIncorporated
FDC 40%
FLI 30%FAI 30%
ChromaHospitality, Inc.
FDC 60%;Archipelago
International Pte Ltd 40%
Property Maximizer Professional Corp.
FLI 100%
Leisurepro, Inc.FLI 100%
Homepro Realty Marketing, Inc.
FLI 100%
Property Specialist Resources, Inc.
FLI 100%
Filinvest Alabang, Inc. (FAI)**
FDC 80%;
FLI 20%
Proplus, Inc.FAI 100%
Northgate Convergence Corporation
FAI 100%
Filinvest Asia Corp.FLI 60%;
Reco Hererra 40%
Cyberzone Properties, Inc. (CPI)FLI 100%
Pro Excel Property Managers, Inc.
FLI 32.9%
FAI 67.1%
Filinvest AII Philippines, Inc.
FLI 100%
East West Banking Corporation (EW)***
FDC 40%;
FFC 38%;Others 22%
East West Rural Bank Inc. EW 100%
FDC Forex Corp.(FFC)
FDC 100%
Filinvest Land Inc.(FLI)
FDC 65%;
Others 35%
Festival Supermall Inc. (FSI)
FLI - 100%
FDC Misamis Power Corporation
FDC 87.7%
FDCUI 12.3%
FDC Retail Electricity Sales Corporation
FDCUI 100%
FDC Danao Power Corporation
FDCUI 100%
FDC Camarines Power CorporationFDCUI 100%
FDC Casecnan Hydro Power Corporation
FDCUI 100%
FDC Negros Power Corporation
FDCUI 100%
FSM Cinemas, Inc.FSI 60%
Cinema Services Chain Corp. 40%
FDC Renewables Corporation (formerly FDC Davao del Norte
Power Corporation)FDCUI 100%
Boracay Seascapes, Inc.
FHC 100%
Chinatown Cityscapes Hotel,
Inc.FHC 100%
Filinvest Development
Cayman Islands FDC 100%
Duawon Seascapes Resort, Inc.FHC 100%
Filinvest Cyberparks, Inc. (FCI)FLI 100%
Countrywide Water Services, Inc.
FDC 100%
East West Insurance
Brokerage, Inc.
EW 100%
Philippine DCS Development Corporation
FLI 60%;
Engie Services Phil. 40%
East West Ageas Life InsuranceCorporation
EW 50%
Ageas Life InsuranceCorporation 50%
FCGC Corporation(FCGCC)
FLI - 100%
Filinvest BCDA Clark, Inc.FCGCC 55%
Bases Conversion Development Authority 45%
Filinvest Mimosa, Inc.
FDC 47.5%
FLI 47.5%Clark Development Corporation 5%
Mimosa Cityscapes, Inc.
FHC 100%
ParkingPro, Inc.FAI 100%
Filinvest Lifemalls CorporationFLI - 100%
East West Leasing and Finance Corporation
EW 100%
Dreambuilders Pro, Inc.
FLI - 100%
Filinvest Lifemalls Mimosa, Inc.
FLI - 100%
Filinvest Cyberzone Mimosa, Inc.
FLI - 100%
Quest Marketing And Integrated Services, Inc.
EW 100%
Assurance Solutions Insurance
Agency
EW 100%
Cubao Cityscapes, Inc.FHC 100%
Property Leaders International Limited (BVI)
FLI - 100%
Proleads Philippines, Inc.
FLI - 100%
Timberland Sports and Nature Club
FLI - 98%Third-party members - 2%
Princesa Seascapes, Inc.
FHC 100%
Realpros Philippines, Inc.
FLI - 100%
Filinvest Lifemalls Tagaytay, Inc.
FLI - 100%
Entrata Hotel Services, Inc.
FHC 76.9%
FAI 23.1%
Gintong Parisukat Realty and
Development, Inc.FLI - 100%
Dumaguete Cityscapes, Inc.
FHC 100%
Fora Services, Inc.FHC 100%
Fora Restaurants, Inc.FHC 100%
Nature Specialists, Inc.FHC 100%
Filinvest-ENGIE Renewable Energy
Enterprise, Inc. (FREE)
FDCUI 60%Engie Services, Phil. 40%
Zamboanga Cityscapes, Inc.
FHC 100%
ProOffice Works Services, Inc.
CPI 60%
FCI 40%
Luzon International Premiere Airport
Development Corp.FDC 42.5%
JG Summit Holdings Inc. 33.0%Changi Airports Philippines (I)
Pte. Ltd. 15.0%Philippine Airport Ground
Support Solutions, Inc. 9.5%
Professional Operations and
Maintenance Experts
IncorporatedFDC 47.5%
Engie Services (Philippines) 52.5%
Dauin Seascapes, Inc.FHC 100%
Filinvest-Hitachi Omni Waterworks,
Inc.FDC 60.0%
Hitachi Aqua-tech
Engineering Pte Ltd. 40.0%
ProMixers Aggregates
Corp.
DPI - 100%
Spectrum Alabang Properties, Inc.
FAI 100%

10
1.4.1 Real Estate Operations
Filinvest Land, Inc
Business
Brief Description and Recent Developments
FLI is one of the leading real estate developers in the country, providing a wide range of real estate products to residential and commercial
customers. FLI (including its predecessor’s operations) has over 50 years of real estate expertise and has developed over 2,500 hectares
of land, having provided home/home sites for over 200,000 families.
FLI is one of the largest nationwide residential developers in 45 cities and towns in 18 provinces in the Philippines. It is also one of the
largest mid-rise building (MRB) developers in the country today and a market leader in the affordable and middle-income residential
segments. It currently owns a land bank of 2,153 hectares for sustainable future growth.
To augment its traditional residential developments, FLI acquired 3 strategic investment properties, Festival Supermall, and the PBCom
Tower and business process outsourcing (BPO) office buildings through its ownership interest in FAC and CPI.
CPI owns and operates the information technology (IT) buildings in Northgate Cyberzone, a Philippine Economic Zone Authority
(PEZA) registered BPO park located on a 10-hectare parcel of land within Filinvest City. FLI generates revenues from leasable space
in 19 office buildings with a gross leasable area (GLA) of 327,555 square meters (sq.m) as of December 31, 2019.
FLI owns 60% of FAC, which owns 50% of the 52-storey, PBCom Tower located in the Makati’s business district. PBCom Tower is a
Grade A, PEZA-registered IT/office building in Ayala Avenue, Makati City, Metro Manila with approximate GLA of 35,148 sq.m.
Festival Supermall is a four (4)-storey premier shopping complex situated on a total land area of ten (10) hectares and located within
FAI’s Filinvest City development in Alabang, Muntinlupa City. FLI is leasing from FAI the 10 hectares of land on which the mall and
its adjoining structures (such as parking lots) are situated. The lease is for a term of 50 years from October 1, 2006, renewable for
another 25 years, with FLI required to pay either a minimum monthly rental in the amount of P80 per square meter, subject to five
percent (5%) escalation per annum or 10% of the gross revenues of Mall, whichever is higher.
As of this date, FLI owns and operates other retail malls, Fora located in Tagaytay City and Main Square Bacoor in Cavite. It intends
to undertake commercial and retail projects to complement its residential developments in selected areas.
In 2009, FLI signed an agreement with the Cebu City Government to develop 50.6 hectares of the South Road Properties (SRP), a 300-
hectare reclaimed land project located in Cebu City. The agreement involves purchase by FLI of the 10.6 hectares of the property to be
developed into a modern urban center consisting of residential, office, commercial, hotel and leisure buildings and a public promenade
which is a one (1) km long waterfront lifestyle strip that will offer a range of seaside leisure activities and the development of the
remaining 40 hectares of the property under a profit-sharing arrangement with the Cebu City Government. On the 40-hectare property,
FLI constructed MRBs known as San Remo and Amalfi while on the 10.6 hectare portion, it developed City de Mare and the Il Corso
Mall.
On February 4, 2014, FCI, a wholly owned subsidiary of FLI was incorporated to manage FLI’s BPO leasing operations in Cebu, Pasay
City, Quezon City and Pasig City. As of December 31, 2019, FCI had a GLA of 37,567 sq.m.
In July 2015, FLI, CPI and FAI (collectively referred to as Filinvest Consortium) won the bidding for a 19.20-hectare lot in Cebu’s SRP
(see Notes 10 and 13). Thereafter, on August 7, 2015, Filinvest Consortium entered into a Deed of Sale on Installment (DSI) with the
Cebu City Government. In a letter dated January 6, 2017, the Cebu City Mayor questioned the validity of the sale and gave the buyers
the option to withdraw from the sale at buyer’s discretion. In a letter to the Cebu City Mayor dated February 7, 2017 (the Letter),
Filinvest Consortium expressed its intention to rescind the DSI. Under the DSI, Cebu City undertook to comply with several covenants,
undertakings and obligations no later than February 7, 2016 (or 180 days from execution of the DSI). The Letter pointed out that as of
February 7, 2017, the said covenants, undertakings and obligations had not been complied with and it did not appear that these will be
complied with within a foreseeable reasonable period of time.
The rescission of the DSI shall only take effect upon return by Cebu City of the down payment and installment payments made to Cebu
City by Filinvest Consortium, plus interests, within ninety (90) days from receipt of the Letter in accordance with Section 5.7 of the
DSI. Pending receipt of such payments, the DSI shall remain valid and subsisting by and among the parties. As of February 27, 2019,
such payment has not been received and no formal and definitive legal proceeding has been undertaken by the parties on this matter.
Consequently, as of said date, the DSI remains valid and Filinvest Consortium has the sole and rightful claim over the property.
The 19.2-hectare property mentioned above is a separate property from the other two properties within the SRP which were acquired
from Cebu City: a) the 40-hectare property under a joint venture undertaking with Cebu City; and b) the 10-hectare property which was
already paid in full by FLI to Cebu City.

11
On August 2, 2019, Filinvest Consortium informed Cebu City that the payments will be judicially consigned in accordance with law
considering that to date, Cebu City had not yet returned the payments with interest, thus, the conditional rescission had already expired.
In response, Cebu City issued a letter dated October 4, 2019 to FLI Consortium and insisted that the latter no longer had any debt to
Filinvest Consortium as the DSI was effectively rescinded. Cebu City reiterated its willingness to restitute the Filinvest Consortiun of
the amount it had already paid prior to the rescission.
The Cebu City Government and Filinvest Consortium came to a resolution on January 8, 2020 with the full payment and the signing of
the Deed of Absolute Sale. The Filinvest Consortium paid on December 17, 2019 the full amount of the purchase price of the lot plus
the accumulated interest for the unpaid installments since 2017. Accordingly, the matter has been resolved.
FMI, the company formed by the consortium of FDC and FLI, registered with the SEC on March 31, 2016, has signed the lease
agreement with Clark Development Corporation (CDC) for a term of 50 years, renewable for another 25 years. FMI’s primary purpose
is to engage in and undertake the general business of developing, constructing, establishing, operating, leasing except financial leasing,
maintaining, rehabilitating and/or managing commercial and retail centers, residential, office buildings, mixed-use development,
infrastructure, utilities and tourism related activities and other allied activities. FMI is owned 47.5% by FLI, 47.5% by FDC and 5.0%
owned by CDC.
In September 2015, FLI won the bid for the right to own 55.0% of the joint venture company with the BCDA that will be tasked to
develop, market, manage and lease the first phase of Clark Green City. The first phase covers to 288 hectares of land that will form part
of the new mixed-use metropolis rising in Northern Luzon adjoining Clark Freeport Zone and Clark International Airport.
With a more diversified portfolio, FLI expects to generate stable recurring revenue from its retail and office investment properties. These
recurring revenues can, in turn, be used to provide internally generated funding for other projects. FLI is not and has never been a
subject of any bankruptcy, receivership, or similar proceedings.
Form and Date of Organization
FLI was incorporated in the Philippines on November 24, 1989 as Citation Homes, Inc. and later changed its name to FLI on July 12,
1993. It started commercial operations in August 1993 after FDC spun off its real estate operations and transferred all related assets and
liabilities to FLI in exchange for shares of stock of FLI. FLI shares were listed on the PSE on October 25, 1993. As at December 31,
2019, FDC owns 64.8% of outstanding common shares and 100% of preferred shares of FLI.
FLI Subsidiaries
The consolidated financial statements of FLI include the accounts of FLI and its subsidiaries. The nature of business and the
corresponding percentages of ownership of FLI over these entities as at December 31, 2019, 2018 and 2017 are summarized below. The
voting rights held by the Group in these subsidiaries are in proportion to its ownership interest.
Subsidiaries Nature of Business 2019 2018 2017
FAPI Real estate developer 100% 100% 100%
Homepro Real estate developer 100% 100% 100%
FCGCC Real estate developer 100% 100% 100%
FBCI 1 Real estate developer 55% 55% 55%
GPRDI Real estate developer 100% 100% –
CPI Leasing 100% 100% 100%
FCI Leasing 100% 100% 100%
FAC Leasing 60% 60% 60%
FCMI Leasing 100% 100% 100%
FLC Property management 100% 100% 100%
Prosper Property management 100% 100% 100%
FLMI Property management 100% 100% 100%
Pro-Excel 2 Property management 33% 74% 74%
FLTI Property management 100% 100% 100%
FSI Property management 100% 100% 100%
ProOffice 3 Property management 100% – –
FSM Cinemas 4 Theater operator 60% 60% 60%
PDDC District cooling systems, builder and operator 60% 60% 60%
TSNC 5 Recreational sports and natures club 98% 98% 97%
DPI Construction 100% 100% 100%
PMAC 6 Construction 100% – –
Promax Marketing 100% 100% 100%
(Forward)

12
Subsidiaries Nature of Business 2019 2018 2017
Leisurepro Marketing 100% 100% 100%
PLIL Marketing 100% 100% 100%
Proleads Marketing 100% 100% 100%
RPI Marketing 100% 100% 100% 1. FBCI is owned indirectly through FCGCC.
2. Deconsolidated in 2019. CPI and FCI sold its ownership in Pro-Excel to FAI. The effective ownership interest of FLI was reduced to 33%.
3. ProOffice is owned indirectly through CPI and FCI. 4. FSM Cinemas is owned indirectly through FSI.
5. In 2018 and 2017, the Parent Company acquired noncontrolling interest in TSNC representing additional 1% and 5% ownership interest, respectively, for a
total consideration of P=16.1 million and P=138.9 million, respectively. 6. PMAC is owned indirectly through DPI.
Detailed discussion of each subsidiary follows:
➢ Promax was incorporated on October 3, 1997.
➢ Homepro was incorporated on March 25, 1997 and started commercial operations on January 1, 2004.
➢ Leisurepro was incorporated on April 21, 2004 and started commercial operations on January 1, 2006.
➢ Prosper was incorporated on June 10, 2002 and started commercial operations on January 1, 2004.
Promax, Homepro and Leisurepro are engaged in real estate marketing business and handle the marketing and sale of residential property
development projects of FLI while Prosper is engaged in the purchase, lease and management of hotel and resort properties. Homepro
is now also engaged in real estate development as it acquired rawland in Taguig in 2015. Prosper is currently managing the condotel
operations of a high-rise condominium (Grand Cenia) and hotel project (Quest Hotel) of FLI. Prior to Prosper’s condotel and hotel
management business, Prosper was engaged in the business of real estate marketing. The SEC approved the amendment of the primary
purpose of Prosper on February 20, 2012.
CPI was incorporated on January 14, 2000 and began commercial operations on May 1, 2001. CPI was registered with the PEZA as an
Economic Zone Facilities Enterprise, which entitles CPI to certain tax benefits and non-fiscal incentives such as the 5% tax on its
modified gross income in lieu of all national income taxes. CPI is also entitled to zero percent value-added tax on sales made to other
PEZA-registered enterprises. CPI owns and operates the IT buildings in Northgate Cyberzone, located on a 10-hectare parcel of land
within Filinvest City. Its day-to-day operations are handled by FAI. CPI also leases a parcel of land measuring 2,831 sq.m. located
along Epifanio delos Santos Avenue (EDSA) on which CPI built a 5-storey BPO building with a total GLA of 7,358 sq.m.
FAPI was incorporated on September 25, 2006 to develop the TSNC and Phase 2 of Timberland Heights.
Timberland Heights is a 677-hectare township project anchored by TSNC, which was designed to be a world-class family country club
in a mountain resort setting. Timberland Heights is situated at an elevation of 320 meters above sea level and provides panoramic views
of the north of Metro Manila. The master plan for Timberland Heights includes Banyan Ridge, a middle-income subdivision; Mandala
Farm Estates; The Ranch and Banyan Crest, a high-end subdivision, The Glades, also a middle- income subdivision, The Leaf, a 4-
building 3-storey condotel development; and, a 50-hectare linear greenway that straddles the entire development which will provide a
large outdoor open space for residents.
On February 4, 2014, FCI, a wholly owned subsidiary of FLI was incorporated. Its primary purpose is to acquire by purchase, lease,
donate and/or to own, use, improve, develop, subdivide, sell, mortgage, exchange, hold for investment and deal with real estate of all
kinds.
FLI has 60.0% interest in FAC which was incorporated on January 22, 1997. As of December 31, 2019, FAC is 60.0% owned by FLI
and 40.0% owned by Reco Herrra Pte.Ltd. (RHPL). RHPL is 100.0% beneficially owned by the Government of Singapore Investment
Corporation Pte. Ltd (GIC). FAC owns 50.0% of the 52-storey PBCom Tower, which is strategically located at the corner of Ayala
Avenue and V. A. Rufino Street in the Makati City Central Business District. FAC owns about 36,000 sq.m.of leasable office space.
The remaining 50.0% of PBCom Tower is owned by the Philippine Bank of Communications.
The PBCom Tower is a PEZA-registered IT building. Consequently, tenants occupying space in PBCom Tower are entitled to avail of
certain fiscal incentives, such as a 5.0% tax on modified gross income in lieu of the regular corporate income tax of 30.0%, income tax
holidays and Value Added Tax (VAT) exemption in certain cases. Leases at the PBCom Tower are typically for periods ranging from
3 to 5 years, with the lease agreements generally requiring tenants to make a 3-month security deposit. Rent is paid on a fixed rate per
square meter basis depending on unit size and location.
On April 15, 2015, FLI and ENGIE entered into a joint venture agreement to establish PDDC. On July 31, 2015, PDDC was registered
with the SEC to engage in the business of building and operation of district cooling system within existing and future buildings at
Northgate Cyberzone Area, Filinvest City, Alabang, Muntinlupa City. PDDC is owned 60.0% by FLI and 40.0% by ENGIE.
On December 28, 2015, FLI and FAI, entered into a Deed of Assignment of Shares, wherein FAI agreed to sell its rights, title and
interests in the 249,995 common shares of FSI, with par value of P=1.0 per share and equivalent to 100.0% ownership interest, to FLI for
and in total consideration of P=0.5 million. FSI is the property manager of Festival Supermall and other commercial centers of the Group.
13
FSI also owns 60.0% equity interest in FSM Cinemas which is engaged in theater operations. The transaction was accounted for using
the pooling of interest method wherein the assets and liabilities of the combining entities are reflected in the consolidated financial
statements at their carrying amounts.
On February 11, 2016, FCGCC was incorporated to undertake the development of the Clark Green City Project under the JVA with
BCDA. On March 16, 2016, FBCI, a joint venture company with BCDA, was incorporated to handle the development of the Clark
Green City Project. FBCI is owned 55.0% by FCGCC and 45.0% by BCDA.
On March 31, 2016, FMI was incorporated to enter into an agreement with CDC for the lease of the Mimosa Leisure Estate. FMI is
owned 47.5% by FLI, 47.5% by FDC and 5% by CDC. FMI started commercial operations in June 2016.
On July 26, 2016, the SEC approved Whiluc’s application for increase in its authorized capital stock. Likewise, FLI subscribed and paid
P124.7 million to Whiluc. On the same date, the SEC also approved the amendments of its corporate name and principal business
address. Whiluc’s new corporate name is FLC. Its primary purpose is to invest in, purchase, hold, use, develop, lease, sell, assign,
transfer mortgage, enjoy or otherwise dispose of, as may be permitted by law, all properties of every kind, nature and description and
wherever situated, of any corporation.
In 2016, the Philippine Interpretations Committee (PIC) issued Question and Answer (Q&A) No. 2016-02 to clarify the accounting
treatment of club shares held by an entity. The Group has evaluated the accounting treatment of its club shares following the guidance
under the above PIC Q&A and has concluded that it exercises control over TSNC. Accordingly, TSNC was consolidated starting 2016.
TSNC was registered with the SEC on May 12, 2004 to operate as a not-for-profit corporation.
On January 11, 2017, DPI, a wholly owned subsidiary of FLI was incorporated. Its primary purpose is to engage in a general
construction business. DPI started its commercial operations in February 2017.
On January 23, 2017, FCMI and FLMI, wholly owned subsidiaries of FLI were incorporated, with the primary purpose of acquiring by
purchase, lease, donation, and/or to own, use, improve, develop, subdivide, sell, mortgage, exchange, hold for investment and deal with
real estate of all kinds. During the first quarter of 2017, FCMI started the construction of its first BPO Office, the Filinvest Cyberzone
Mimosa Building 1. FCMI started its commercial operations in May 2018. FLMI has not started its commercial operations as of
December 31, 2019.
On February 7, 2017, PLIL, a company limited by shares, was registered at the territory of the British Virgin Islands. PLIL has not
started its commercial operations as of December 31, 2019.
On March 29, 2017, Proleads, a wholly owned subsidiary of FLI was incorporated. Its primary purpose is to provide management,
organizational, and other administrative services and training, on real estate transactions to be negotiated by Philippine-licensed real
estate brokers in their personal professional capacities. PPI started its commercial operations in November 2017.
On May 18, 2017, FLI, CPI and FCI, subscribed to 53.0 million common shares of Pro-Excel. On December 26, 2019, CPI and FCI
entered into a Deed of Assignment to sell its ownership in Pro-Excel to FAI. The resulting ownership interest of FLI is 32.9%. The
primary purpose of Pro-Excel is to engage in the business of administration, maintenance and management of real estate development,
controlled development projects and subdivision projects.
On August 3, 2017, RPI, a wholly owned subsidiary of FLI was incorporated. Its primary purpose is to provide administrative support
services and skills training primarily through the use of information technology, licensed software, and systems. RPI has started its
commercial operations in November 2017.
On November 20, 2017, FLTI, a wholly owned subsidiary of FLI, was incorporated with the primary purpose of acquiring by
purchase, lease, donation and/or to own, use, improve, develop, subdivide, sell, mortgage, exchange, lease, hold for investment and
deal in real estate of all kinds. FLTI started its commercial operations in March 2018.
.
On January 19, 2018, FLI entered into a Share Sale and Purchase Agreement to purchase 100% of the total outstanding shares of GPRDI
for a total consideration of P=1.7 billion. The primary purpose of GPRDI is to hold, purchase, lease, contract of otherwise acquire any
and all real and personal properties. GPRDI has not started its commercial operations as of December 31, 2019.
On July 18, 2018, the SEC approved TSNC’s application on voluntary revocation of its secondary registration which allowed TSNC to
proceed with the transition to its new business model. On November 15, 2018, the BOD approved the amendment to change the primary
purpose of the Club from an exclusive recreational sports club to a for profit commercial facility. On July 24, 2019, TSNC submitted
its Amended Articles of Incorporation to SEC. The amendments include (a) change of the primary purpose of TSNC from that of an
exclusive recreational sports club to a real estate development Company; (b) change of TSNC’s principal address from No. 173 P.
Gomez Street, San Juan, Metro Manila to Timberland Heights, Barangay Malanday, San Mateo Rizal; (c) converting of TSNC’s capital
stock from no par value club shares to par value shares; (d) removal of provisions which characterizes TSNC as an exclusive non-profit
association; and (e) removal of paragraphs which relate to the operations of an exclusive recreational sports club. On August 1, 2019,
the SEC approved TSNC’s application on voluntary revocation of its secondary registration. On August 18, 2019, the SEC approved
TSNC’s Amended Articles of Incorporation.

14
On March 18, 2019, ProOffice, a wholly owned subsidiary of FLI, was incorporated to engage in the business of administration,
maintenance and management of real estate developments and projects. ProOffice started its commercial operations in August 2019.
On July 4, 2019, PROMEI, a joint venture company with Engie Services Asia Pacific Pte. Ltd. doing business as ENGIE was
incorporated to operate, maintain and repair existing and future technical systems, including but not limited to heating, ventilation and
air conditioning systems district cooling systems and distributed energy systems, and implement new technologies in connection with
saving energy and reducing operating costs. PROMEI is 47.5% owned by FDC and 52.5% owned by ENGIE. PROMEI has not started
its commercial operations as of December 31, 2019.
On October 11, 2019, PMAC, a wholly owned subsidiary of DPI, was incorporated mainly to operate concrete batching plant,
manufacture and supply of pre-cast and construction equipment and rental. PMAC has not started its commercial operations as of
December 31, 2019.
On December 16, 2019, SAPI, a wholly owned subsidiary of FAI, was incorporated to engage in the developments of real estate
properties and/or managing commercial, recreational facilities and residential, office buildings and other related activities. SAPI has not
started its commercial operations as of December 31, 2019.
FLI’s Equity Investment in FAI and FMI
FAI was incorporated on August 25, 1993 and started commercial operations in October 1995. FLI has a 20.0% equity interest in FAI.
FAI’s major project is the master-planned development of Filinvest City, a 244-hectare premier satellite city development project which
has been designed using modern and state of the art, ecological, urban planning with a mixed-use integrated development with office,
retail, residential, institutional, leisure and hospitality projects in southern Metro Manila. Located at the southern part of Metro Manila
and adjacent to the South Expressway, Filinvest City is approximately 16 kilometers (km) south of Makati, the central business district
in Manila and 10 km from the Ninoy Aquino International Airport. Filinvest City is surrounded by over 2,800 hectares of developed
high-end and middle-income residential subdivisions and commercial developments. The said project is under a joint venture agreement
with the Government.
FMI was incorporated on March 31, 2016 and started commercial operations in June 2016. FLI has a 47.5% equity interest in FMI.
FMI entered into a long-term lease of the Mimosa Leisure Estate after it bagged the rights to lease, develop and operate the 202-hectare
estate development. There is a hotel launched with 303 rooms and a 36-hole golf course.
Business Groups, Product Categories, Target Markets and Revenue Contribution
As a result of the recent business developments, FLI is now composed of two business segments with corresponding product categories,
target markets and revenue contributions as follows:
Real Estate Segment
FLI’s main real estate activity since it started operations has been the development and sale of residential property, primarily housing
units and subdivision lots; in certain cases, provision of financing for unit sales.
Residential Projects
FLI is able to tap the entire residential market spectrum with the following range of housing units catering to various income segments:
(a) Socialized Housing:
These developments are marketed and sold under FLI’s Pabahay brand and consist of projects where lots typically sell for
P160,000.0 or less per lot and housing units typically sell for P450,000.0 or less per unit. Buyers for these projects are eligible to
obtain financing from the Government-mandated Pag-IBIG Fund. Maximum sale prices for the Company’s specialized housing
products do not exceed the Government-mandated ceilings of P450,000.0 per unit. Any income realized from the development and
improvement of socialized housing cites are exempt from taxation.
(b) Affordable Housing:
These developments are marketed and sold under FLI’s Futura Homes brand and consist of projects where lots are typically sold at
prices ranging from P160,000.0 to P750,000.0 and housing units from above P450,000.0 to P1,500,000.0. FLI designs and
constructs homes in this sector with the capacity and structural strength to give the owner the option to build an additional storey,
which can double the available floor area. Affordable housing projects are typically located in provinces bordering Metro Manila,
including Bulacan, Laguna, Batangas and Cavite, and in key regional cities such as Tarlac, Cebu and Davao. Construction of a
house in this sector is usually completed approximately six (6) months from the completion of the required down payment.
(c) Middle-Income Housing:
These developments are marketed and sold under FLI’s Filinvest brand and consist of projects where lots are typically sold at prices
ranging from P750,000.0 to P1.2 million and housing units from P1.5 million to P4.0 million. Middle-income projects are typically

15
located within Metro Manila, nearby provinces such as Rizal, Cavite, Pampanga and Laguna, and major regional urban centers in
Cebu, Davao and Zamboanga.
(d) High-End Housing:
Marketed under Filinvest Premiere brand, these developments consist of projects where lots are sold at prices above P1.2 million
and housing units for above P4.0 million FLI’s high-end projects have been located both within Metro Manila and in areas
immediately outside Metro Manila.
Other Real Estate Projects
In order to achieve product and revenue diversification, FLI has added the following projects so as to cater to other market niches:
(a) Townships
Townships are master-planned communities to include areas reserved for the construction of anchor facilities and amenities. FLI believes
that these facilities and amenities will help attract buyers to the project and will serve as the nexus for the township’s community. Anchor
developments could include schools, hospitals, churches, commercial centers, police stations, health centers and some other government
offices.
Filinvest at New Clark City
This 288-hectare property will be transformed into a vibrant business metropolis that is in harmony with its natural setting. The
BCDA, FLI’s partner in the development, is fast-tracking the construction of access roads that will connect the project to SCTEX and
to Clark Freeport Zone. New Clark City will be built around four pillars: world center, multi-gen metropolis, eco-efficient capital and
strategic base – a cohesive fusion that creates a globally-competitive city. It will be shaped around the existing terrain, with
meandering waterways and a Loop Park to connect the pedestrian-friendly districts. Green pathwalks, bike lanes, e-transport systems
and other innovative features are expected to set the benchmark for future planning in the Philippines. The development will have 100
hectares of industrial space, 30 hectares of residential communities, 80 hectares of open spaces and the balance will be mixed
commercial establishments.
Filinvest Mimosa+ Leisure City
As the winning bidder in the privatization of the Mimosa estate in Pampanga, Filinvest is currently developing the 201-hectare
property under Filinvest Mimosa, Inc., a new company formed by the consortium of FLI and FDC. FLI will handle the retail, office
and residential components while FDC will undertake the hospitality, leisure and gaming segments. Envisioned to be a top-of-mind,
year-round business and leisure destination, the sprawling Filinvest Mimosa+ Leisure City is being transformed into a vibrant and
green central township that is home to various industries such as BPO, hospitality, retail, real estate, golf and gaming. Its location in
Clark Freeport Zone allows FLI to take advantage of the growing interest of tourists and investors in the progressing Clark City. In
addition to the renowned golf course, its components include a lifestyle and retail strip, a pavilion and grounds for events and an office
campus called Workplus. This business hub will be composed of eight mid-rise buildings with fiber-optic facilities, podium parking
and ground retail area. Also part of the design is a lovely promenade that will connect all buildings and serve as a place for employees
to enjoy the serene outdoor environment of Mimosa. To complement the business and commercial district, the Quest Hotel and
Conference Center Clark will be joined by a residential area of mid- to high-rise buildings for investment or end-use. The existing
green resort environment will be further enhanced with parks, walking paths and bike trails to encourage wellness through nature and
outdoor activities
Ciudad de Calamba
Ciudad de Calamba is a 350-hectare development located in Calamba, Laguna. This township project is anchored by the Filinvest
Technology Park-Calamba which is a PEZA-registered special economic zone. Ciudad de Calamba provides both industrial-size lots
and ready-built factories to domestic and foreign enterprises engaged in light to medium non-polluting industries. FLI also donated to
the city government of Calamba a parcel of land located within the Ciudad de Calamba, which will be used for a city health center and
police station. The Parent Company also intends to develop the Ciudad de Calamba Commercial Center as part of this township project.
Havila
Havila, or formerly, Filinvest East County is a 335-hectare township along the eastern edge of Metro Manila, which traverses the
municipalities of Taytay, Antipolo and Angono. It is anchored by two educational institutions: San Beda College – Rizal and the Rosehill
School. The master plan for Havila provides for a mix of affordable, middle-income and high-end subdivisions on rolling terrain
overlooking Metro Manila at an elevation of 200 meters above sea level.

16
Timberland Heights
Timberland Heights is a 677-hectare township project anchored by the Timberland Sports and Nature Club. It is located in the
municipality of San Mateo, which is just across the Marikina river from Quezon City, and has been designed to provide residents with
leisure facilities and resort amenities while being located near malls, hospitals and educational institutions located in Quezon City.
City di Mare
Inspired by the world’s best-loved coastal cities, City di Mare, or “City by the Sea”, spans across 50.6 hectares at Cebu’s South Road
Properties.
It is a master-planned development composed of different zones catering to a wide array of lifestyles and activities - Il Corso, the 10.6-
hectare waterfront lifestyle strip; the 40-hectare residential clusters; and The Piazza, nestled at the heart of the residential enclaves puts
lifestyle essentials such as school, church, shops, and restaurants within the neighborhood. City di Mare is envisioned to be a destination
in itself, takes full advantage of the coastal ambience featuring seaside shopping, dining, beach and water sports and more, right by the
water’s edge.
The 10.6-hectare retail development known as Il Corso shall have a gross leasable area of approximately 32,000 square meters. City di
Mare has four resort-themed residential enclaves inspired by world-class resorts, with each 10-hectare development flaunting a distinct
architectural character. With over 65% of the property allocated for wide, open areas and landscaped greens, City di Mare provides the
generous amenity of breathing space and a refreshing dose of nature throughout the site. Residences are spread out over the sprawling
development, maximizing the abundant sunlight and allowing the invigorating sea air to circulate freely.
(b) Leisure Projects
FLI’s leisure projects consist of its residential farm estate developments, private membership club and residential resort development.
1. Residential Farm Estates
FLI’s residential farm estate projects serve as alternative primary homes near Metro Manila to customers, such as retirees and farming
enthusiasts. Customers can purchase lots (with a minimum lot size of 750 square meters) on which they are allowed to build a residential
unit (using up to 25.0% of the total lot area). The remaining lot area can be used for small-scale farm development, such as fish farming
or vegetable farming. Residential farm estates are sold on a lot-only basis, with buyers being responsible for the construction of
residential units on their lots. To help attract buyers, FLI personnel are available on site to provide buyers with technical advice on
farming as well as to maintain demonstration farms.
At present, FLI has 3 residential farm estates:
• Nusa Dua Farm Estate (“Nusa Dua”) located in Cavite province just south of Metro Manila. The amenities at the Nusa Dua
development include a two-storey clubhouse and a 370 square meter swimming pool.
• Mandala Residential Farm Estate (“Mandala”) located in Rizal province as part of the FLI’s Timberland Heights township
project. It offers hobby farmers generous lot cuts and Asian-inspired homes that complement the mountain lifestyle.
• Forest Farms Residential Farm Estate (“Forest Farms”) located in Rizal province as part of Company’s Havila township
project. It is an exclusive mountain retreat and nature park, nestled between the hills of Antipolo and forested area of Angono.
2. Residential resort development
Kembali Coast on Samal Island, Davao is a beachfront residential resort development. This 50-hectare Asian-Balinese inspired island
getaway offers low-density exclusivity and comes with a 1.8 km beach line that offers unobstructed view of the sea.
Laeuna de Taal (“Laeuna”) is located in Talisay Batangas with a view of the Taal lake and a lakeside residential community, about a
t10-minute drive from the popular tourist destination of Tagaytay. Laeuna is an Asian Tropical-inspired community which offers 3
residential enclaves (Arista, Bahia and Orilla) with a range of property choices for every family. Located on the water front is the Lake
Club, a lakeside amenity designed for wellness, recreation and celebration.
(c) MRBs
MRB projects are 5-storey to 10-storey buildings clustered around a central amenity area. The buildings occupy 30% to 35% of the land
area, providing a lot of open spaces. FLI currently has the following MRB projects:.
Project Name Location
Metro Manila/ Luzon
Asiana Oasis Paranaque City
Bali Oasis Pasig City

17
Project Name Location
Metro Manila/ Luzon
Bali Oasis 2 Pasig City
Capri Oasis Pasig City
For a Tagaytay
Fortune Hill San Juan City
Futura East Cainta, Rizal
Maui Oasis Sta. Mesa, Manila
One Oasis Ortigas Pasig City
One Spatial Pasig City
Panglao Oasis Taguig
Sorrento Oasis Pasig City
The Signature Balintawak, Quezon City
Verde Spatial
Alta Spatial
Belize Oasis
Quezon City
Valenzuela City
Muntinlupa
Visayas
Amalfi Oasis City di Mare, Cebu
Marina Spatial Dumaguete
One Oasis Cebu Mabolo, Cebu City
One Spatial Iloilo Iloilo
San Remo Oasis City di Mare, Cebu
Umi Garden City di Mare, Cebu
Mindanao
Centro Spatial Davao City
Eight Spatial Maa, Davao
One Oasis Cagayan de Oro Cagayan de Oro
One Oasis Davao Davao City
Veranda Resort Condos Davao
Maldives Aspire Davao
(d) High-Rise Building (HRB)s
The Linear
The Linear, a master-planned residential and commercial hub in Makati City. Two-L-shaped towers, each 24 storeys high, comprise this
dynamic condominium community that perfectly caters to the needs of young urban professionals.
Studio City
Studio City is a community composed of 5-tower residential condominium complex within the Filinvest City to serve the demand for
housing of the growing number of professionals working within Filinvest City and in the nearby Madrigal Business Park.
Since it is located within the Filinvest City, residents will enjoy proximity to Festival Supermall, Westgate Center, Northgate Cyberzone,
Asian Hospital and Medical Center, and other commercial, educational and medical institutions. The development consists of 18-storeys
per building with commercial units at the ground floor. All residential floors will have 25 studio units per floor. Studio Tower 5 is
under construction.
The Levels
Located at one of the highest points of Filinvest City at around 23 meters above sea level, The Levels is a one-block, 4-tower residential
condominium development that features a laidback suburban living inside a fast-paced business district. The residential development
is set in a tropical landscape, with its 4 towers uniquely designed with terracing levels, giving it a castle-effect look. The high-rise
sections will be set in lush greenery, providing residents with views of the gardens. The second tower has just been launched.
Vinia Residences
Vinia Residences is a 25-storey condominium development located along EDSA in Quezon City, right across TriNoma and just steps
away from the MRT-North Avenue station. With its coveted location, it offers a world of ease and convenience to young professionals
and families looking for quality homes, as well as budding entrepreneurs who want to start a home-based business at the heart of the
city.
Studio Zen
Studio Zen is a 21-storey condominium development located along Taft Avenue in Metro Manila. Student-oriented amenities, Zen-
inspired features, and functional building facilities make it an ideal residence for students living independently and a great investment
opportunity for entrepreneurs who want to take advantage of the ready rental market in the area.

18
Studio A
Studio A is a single tower 34-storey high-rise residential condominium located in Loyola Heights in Quezon City. The project is
conveniently situated near premier universities, the LRT 2 line and other commercial establishments.
100 West
100 West is a single tower 38-storey high-rise commercial and residential condominium with office spaces located in Gen. Gil Puyat
Avenue corner Washington St. in Makati City. 100 West is in the Makati Business District and accessible to both north and south of
Metro Manila.
Studio 7
Studio 7 is a mixed-use development that will have office and residential towers complemented with retail outlets, located in Quezon
City along EDSA very close to the GMA-Kamuning MRT station. Studio 7 will have studios as well as one-bedroom residential units.
Activa
Activa is a mixed use development with residential, office, retail and hotel components. It is entrenched in the heart of Quezon City's
busiest and liveliest district, Cubao. Situated at the crossroads of two of the metro's most vital thoroughfares, Activa connects to the
north and south via EDSA, and to the east and west via Aurora Boulevard. It also has direct access to the MRT and LRT lines, and
accessible by various modes of transportation like buses and jeepneys.
Analysis of Real Estate Sales
The table below shows a comparative breakdown of FLI’s journalized real estate sales into various product categories for the years
ended December 31, 2019, 2018 and 2017 (amounts in P millions).
2019 % 2018 % 2017 %
Real estate sales by market segment
Medium income P=9,480.5 55.7% P=8,014.9 55.6% P=6,850.8 49.8%
Affordable 3,490.9 20.5% 3,280.1 22.8% 3,796.9 27.6%
Low affordable 1,924.8 11.3% 1,490.4 10.4% 1,097.2 8.0%
High-end 1,771.7 10.4% 1,344.6 9.3% 1,829.0 13.3%
Socialized 345.2 2.1% 274.2 1.9% 174.5 1.3%
P=17,013.1 100.0% P=14,404.2 100.0% P=13,748.4 100.0%
Analysis of Cost of Sales
The table below shows a comparative breakdown of FLI’s journalized cost of sales by cost component for the years ended
December 31, 2019, 2018, and 2017 (in P millions):
2019 2018 2017
Land acquisition cost 2,491.3 1,926.5 1,852.3
Land development and construction cost 7,362.6 6,412.7 6,199.1
Cost of club share sold – – 0.5
Total 9,853.9 8,339.2 8,051.9
Leasing Segment
FLI’s investment properties are categorized into retail and office leasing.
Commercial Retail Leasing Properties
Festival Mall Alabang
The landmark project, Festival Mall Alabang, carries on its position as the prime destination for recreation and retail in southern Metro
Manila. With more ‘firsts’ on its offerings and a better shopping ambiance, the mall has altered the retail experience in the south. It is
one of the country’s largest shopping malls with more than 1,500 shops.
As the existing mall continued to have major improvements undertaken for its facilities, architectural works that gave the mall a refreshed
look and modernized ambiance complementing the opening of its expansion. Festival Mall opened its doors for Decathlon, a French
sporting goods retailer with approximately 5,000.0 sq. m of leasable space, which added to the roster of anchors pulling in drove of
shoppers from catchments all over Luzon.

19
Simultaneously, the tenants of the mall expansion with over 46,000.0 sq. m of gross leasable area have gradually opened beginning 2017
bringing in a mix of fashion and food concepts. Another French sports retail giant opened the first ever Go Sport store in Southeast Asia
with an area close to 1,000.0 sq. m.
The introduction of new and unique food establishments has made Festival a gastronomic destination ushering in new markets and
strengthening traffic of its core target market. Festival Mall Expansion’s new supermarket and department store partner anchor,
Landmark, occupying around 50,000.0 sq. m of floor area, opened during the second half of 2017, further made the mall and Filinvest
City’s traffic more dynamic. Festival patrons are also enjoying the Water Garden, a distinctly refreshing outdoor amenity and
convergence zone.
Before end of 2017, two new additional malls, Fora in Tagaytay and Main Square in Bacoor, have opened which contributed more than
50,000.0 sq. m of leasable space.
Fora Mall
Conveniently located right by the city's landmark, Tagaytay Rotunda is Fora Mall, the first regional mall in the area fronting a mixed-
use leisure development consisting of a condotel and residential buildings. This prime retail destination provides about 31,000.0 sq. m
of leasable space amidst nature, open spaces, and a beautifully-landscaped amphitheater, primarily serving the strengthening local
market and burgeoning tourist influx from the city and neighboring towns. A number of local and popular food concepts, coupled with
national brands, have initially opened. A strong wellness category is also in place and junior anchors such as Ace Hardware, Abenson
and La Sedia. Super Metro, its anchor, opened in June 2017 with the first hypermarket format operating for 24 hours. The four digital
cinemas launched last November 2017 is now the locals’ go to place for recreation.
Main Square
With a smaller format of over 18,000.0 sq. m leasable area, Main Square is the first and only mall along Bacoor Blvd, close to Bacoor
City Hall and fronting Princeton Heights. Positioned as the reliable one-stop hub for neighboring gated villages of Bacoor, it provides
basic shopping, wellness, service and convenience offerings from partner brands such as Anytime Fitness, Watson’s, Ace Hardware,
Western Appliances, Japan Home, and DIY. The mall’s supermarket anchor for this development is Robinsons Supermarket, which
has become the most convenient basic shopping destination in the area.
Il Corso
Il Corso is a planned retail development with an estimated 35,000 sq. m of leasable area when fully completed. It currently has four
operating restaurants and 1 bank. The cinema has also opened. Other areas are expected to be operational within the year.
Commercial Office Properties
As of December 31, 2019, the Group owned commercial office spaces for lease to several BPO and other office locators. Primarily, they
are located in Northgate Cyberzone in Filinvest City, Alabang, Muntinlupa. Northgate is an 18-hectare PEZA zone that enjoys developer
incentives.
PBCom Tower
The PBCom Tower, is a 52-floor, Grade A, PEZA-designated IT office building in Ayala Avenue, Makati City, Metro Manila. FLI
owns part of the PBCom Tower thru FAC. FLI earns 60.0% of revenues from the 35,148 sq.m. leasable space owned by FAC in this
building. FPD Asia had been hired to provide day-to-day property management services for PBCom Tower. In addition, pursuant to a
management agreement, FAI provides the following services: general management services, accounting services, operations, legal
review and documentation, office rental services and recruitment and training services.
The Group also owns several completed office developments, in Bay City, Pasay, EDSA near Ortigas MRT station, Clark Mimosa and
Cebu IT Park. A summary of the GLA is set forth below:
Location
Number of
Buildings
GLA
(sq. m.)
Northgate Cyberzone, Filinvest City 19 327,553
Metro Manila outside of Filinvest City 7 122,668
Outside Metro Manila 4 73,697
Total 30 523,918
The office buildings of Filinvest are mainly located in business parks or in mixed-used complexes highly accessible to public transport.
The Group believes its business park model, wherein the Group builds on areas specifically suited for business and industrial
establishments supported, in certain cases, by incentives from the Government, gives it a competitive advantage as business parks are
the preferred site of major BPO tenants. Being located in a major business park allow the tenants assurance of expansion options within
close proximity thereby giving the Group an advantage over stand-alone developments.

20
Northgate Cyberzone
Northgate Cyberzone is a PEZA registered BPO IT park within Filinvest City. FLI earns revenues from approximately 327,555 sq.m.
leasable space as of December 31, 2019.
Construction is ongoing for new BPO office buildings located at Northgate Cyberzone – particularly Filinvest Axis Towers 3 and 4.
Current buildings with leases are the following:
• Plaza A: This is a 6-storey building with an approximate GFA of 11,698 sq. m. and an approximate GLA of 10,860 sq. m.
• Plaza B and Plaza C: Plaza B and Plaza C are four-storey buildings, each with an approximate GFA of 7,150 sq. m. Plaza B has an
approximate GLA of 6,488 sq. m. and Plaza C, 6,540 sq. m. for a combined GLA of 13,028 sq. m.
• Plaza D: This is a 6-storey building with the same specifications as Plaza A and with an approximate GFA of 11,698 sq. m. and an
approximate GLA of 10,860 sq. m.
• Plaza E: This is a 12-storey building, situated between Plaza A and Plaza D, with approximate GFA of 17,405 sq. m. and an
approximate GLA of 14,859 sq. m.
• Convergys Building: This is a 3-storey building with an approximate GFA of 6,467 sq. m. and an approximate GLA of 6,399 sq.
m. It was a “built-to-suit” (BTS) building to meet the requirements of Convergys.
• Capital One Building: This is another building that was constructed on a BTS basis to meet the requirements of HSBC previously.
It has an approximate GLA of 18,000 sq. m.
• IT School: This is a 3-storey building with an approximate GFA of 3,297 sq. m. and an approximate GLA of 2,594 sq. m.
• Building 5132: This is a 6-storey building with an approximate GFA of 10,309 sq. m. and an approximate GLA of 9,409 sq.m
• iHub I and iHub II: This is a two-tower complex (one with six-storey and the other with nine-storey) iHub I has an approximate
GLA of 9,480 sq. m. while iHub II has an approximate GLA of 14,181 sq. m.
• Vector One: a 14-storey building with an approximate GFA of 19,703 sq. m. and an approximate GLA of 17,764 sq. m.
• Vector Two: This building has the same configuration as with Vector One. It is also 14 storeys high with an approximate GLA of
17,889 sq. m.
• Filinvest One (formerly called AZ Building): This is a 12-storey building with a GLA of approximately 19,637 sq. m.
• Filinvest Two and Three: This is a twin-tower project located along Alabang Zapote Road. Each building has a GLA of
approximately 23,784 sq. m or a total of 47,569 sq. m. The buildings were completed in the 4th quarter of 2015.
• Vector Three with a GLA of 36,345 sq. m. was completed in 2017.
• Axis Tower One and Axis Tower Two, each with a GLA of 39,340 sq. m. are complete with a combined GLA of 78,680 sq.m.
Filinvest EDSA Wack-Wack Building
This 5-storey BPO building is located along EDSA in Mandaluyong City and have approximately 7,358 sq. m. of GLA. This is FLI’s
first BPO office building outside Northgate Cyberzone.
Other projects outside Alabang
To tap the lucrative opportunities in the BPO sector, FLI is expanding its office portfolio in more areas outside of Northgate to meet the
demands of the industry. The following are the ongoing new BPO office buildings located in various locations:
• Filinvest Cyberzone Pasay is the first development of Filinvest Cyberparks, Inc. and is the Filinvest Group’s first LEED-
certified project in Metro Manila outside of Northgate Cyberzone. Within the Bay Reclamation Area in Pasay City, it provides
a total of 66,589 GLA sq. m. of office space. It is meant to cater to the office accommodation needs of the still growing
outsourcing sector, and address retail support requirements of companies and government agencies that will set up shop in the
surrounding area.
• Filinvest Cyberzone Cebu Tower One is the first BPO building located at the 1.2 - hectare joint venture project with the
Provincial Government of Cebu. This is the first building of the four-building complex with 13 storeys and approximate GLA
of 19,937 sq. m. Tower Two is a 21-storey office building also complete and operational with an approximate GLA of
28,296 sq. m.
• Clark Mimosa Cyberzone Workplus One and Two of the planned 8 buildings have been completed with a total GLA of
18,624 sq. m. WorkPlus Four and Seven are under construction, which account for 22,315 GLA sq. m.
• Construction is underway for two sites along EDSA for the development of mixed-use complexes that both contain BPO office
spaces. Studio 7, a mixed-use project in South Triangle near GMA Network, will have a BPO office component, aside from
residential and retail facilities. Its office portion, called Studio 7 Cyberzone, will provide 36,541 sq. m. of GLA by 2020.
Another dynamic mixed-use development located at the corner of EDSA and Aurora Boulevard, which shall be called Activa,
will also play host to BPO offices by providing an estimated 53,572 sq. m. of GLA.
• Construction of One Filinvest Ortigas, which will have traditional office and retail components is currently underway. This is
located in the Ortigas Business District (former Philcomcen property) with an estimated 39,759 GLA sq. m.
• 100 West was completed as well, with office, retail and residential components. The estimated office GLA is 14,333 sq. m.

21
The Group will continue to carry out an intensive marketing campaign so to maintain high occupancy rates in its investment properties
to maximize leasing revenues.
The table below shows a breakdown of FLI’s recorded gross leasing revenues for the years ended December 31, 2019, and 2018 (amounts
in P millions):
Years ended December 31
2019 2018
Amount % to total Amount % to total
Office P=5,170.9 73.8% P=3,858.2 68.8%
Retail/Commercial 1,837.8 26.2% 1,750.1 31.2%
Total P=7,008.7 100.0% P=5,608.3 100.0%
Marketing and Sales
Real Estate Segment
FLI develops customer awareness through marketing and promotion efforts as well as referrals from satisfied customers. The Group has
a real estate marketing team and a network of sales offices located in the Philippines, Italy and Japan, as well as accredited agents in
other parts of Europe, HongKong, Singapore, and the Middle East. FLI’s marketing personnel, together with in-house sales agents and
accredited agents, gather demographic and market information to help assess the feasibility of new developments and to assist in future
marketing efforts for such developments.
FLI conducts advertising and promotional campaigns principally through print and broadcast media, including billboards, fliers, and
brochures designed specifically for its target markets. Advertising and promotional campaigns are conceptualized and conducted by
FLI’s marketing personnel and by third-party advertising companies. These campaigns are complemented by additional advertising
efforts, including booths at shopping centers, such as Festival Supermall, and other high traffic areas, to promote open houses and other
events.
FLI also believes that the Overseas Filipino Worker (OFW) population, as well as expatriate Filipinos, constitutes a significant portion
of the demand for affordable and middle-income housing either directly or indirectly by remitting funds to family members in the
Philippines to purchase such properties. As a result, FLI has appointed and accredited independent brokers in countries and regions with
large concentrations of OFWs and expatriate Filipinos, such as Italy, Japan, the United Kingdom and the Middle East. These brokers
act as the Company’s marketing and promotion agents in these territories to promote the Company and its products. The Company also
sponsors road shows to promote its projects, including road shows in Europe, targeting the OFW and Filipino expatriate markets. FLI
also markets its properties on the Internet.
Sales for FLI’s housing and land development projects are made through both in-house sales agents and independent brokers. Both
FLI’s in-house sales agents and independent brokers are compensated through commissions on sales. In-house sales agents also receive
a monthly allowance and are provided administrative support by FLI, including office space and expense allowances.
In addition to in-house sales agents and independent brokers, FLI also employs representatives who staff its sales offices and provide
customers with information about FLI’s products, including financing packages and technical development assistance. FLI also assigns
each project a sales and operations coordinator who will provide customers with assistance from the moment they make their sales
reservation, during the process of obtaining financing, and through the steps of establishing title on their new home. FLI also has
personnel who can advise customers on financing options, collecting necessary documentation and applying for a loan. FLI also helps
design down payment plans for its low-cost housing customers that are tailored to each customer’s economic situation. Further, once a
house is sold and delivered, FLI has customer service personnel who are available to respond to technical questions or problems that
may occur after delivery of the property.
Leasing Segment
Various professional, multinational commercial real estate leasing agents (including, but not limited to Jones Lang LaSalle, CB Richard
Ellis and Colliers) are accredited to scout for tenants for its office spaces. These agents work on a non-exclusive basis and earn
commissions based on the term of the lease.
FLI also maintains, through its subsidiaries, an in house sales team to market its office & commercial spaces.
Customer Financing for Real Estate Projects
The ability of customers to obtain financing for purchases of subdivision lots or housing units is a critical element in the success of
FLI’s housing and land development business. Customer financing is particularly important in relation to sales of FLI’s socialized
housing projects, where most prospective buyers require financing for up to 100.0% of the purchase price. FLI therefore assists qualified
homebuyers in obtaining mortgage financing from government-sponsored mortgage lenders, particularly for its socialized housing

22
projects, and from commercial banks. FLI also provides a significant amount of in-house financing to qualified buyers. The interest
rates charged by FLI for in-house financing typically range from 11.5% per annum to 19.0% per annum, depending on the terms of the
loan.
In-house financing
FLI offers in-house financing to buyers who choose not to avail of Government or bank financing. FLI typically finances 80.0% of the
total purchase price, which is secured primarily by a first mortgage over the property being sold. The loans are then repaid through
equal monthly installments over periods ranging from 5 to 10 years. The interest rates charged by FLI for in-house financing typically
range from 11.5% per annum to 19.0% per annum, depending on the terms of the loan.
Pag-IBIG Fund
A substantial number of buyers of FLI’s socialized housing units, as well as some affordable housing units, finance their purchasers
through the Home Development Mutual Fund or Pag-IBIG Fund. To provide a liquidity mechanism to private developers, the Pag-IBIG
Fund has instituted a take-out mechanism for conditional sales contract receivables and mortgages and repurchases receivables from
housing loans of its members.
Mortgage Loans
Mortgage loans from commercial banks are usually available to individuals who meet the credit risk criteria set by each bank and who
are able to comply with each bank’s documentary requirements. In addition to taking security over the property, a bank may also seek
repayment guarantees from the Home Guaranty Corporation. To assist prospective buyers obtain mortgage financing from commercial
banks, FLI also has arrangements with several banks to assist qualified customers to obtain financing for housing unit purchases.
Deferred Cash Purchases
In recent years, in addition to the aforementioned financing arrangements, FLI has offered so-called “deferred cash” purchases,
particularly for its high-end and leisure developments. Under this arrangement, the entire purchase price is amortized in equal
installments over a fixed period, which is typically 24 months. (Title to the property passes to the buyer only when the contract price is
paid in full or when the buyer executes a real estate mortgage in favor of FLI which can be annotated on the title to the property.)
Real Estate Development
FLI’s real estate development activities principally include the purchase of undeveloped land or entering into JVAs covering
undeveloped land, the development of such land into residential subdivisions or other types of development projects, the sale of lots,
the construction and sale of housing units and the provision of financing for some sales.
The development and construction work are contracted out to a number of qualified independent contractors on the basis of either
competitive bidding or the experience FLI has had with a contractor on prior project. FLI weighs each contractor’s experience, financial
capability, resources and track record of adhering to quality, cost and time of completion commitments. FLI maintains relationships
with over 100 independent contractors and deals with them on an arm’s length basis.
FLI does not enter into long-term arrangements with contractors and construction contracts typically cover the provision of contractor’s
services in relation to a particular project or phase of a project. FLI also provides, in certain cases financial guarantees of payment to
FLI-specified suppliers for purchases of construction materials. Progress payments are made to contractors during the course of a project
development upon the accomplishment of pre-determined project performance milestones. Generally, FLI retains 10.0% of each
progress payment in the form of a guarantee bond or cash retention for up to 1 year from the date the contracted work is completed and
accepted by FLI to meet contingency costs.
FLI is not and does not expect to be dependent upon one or a limited number of suppliers or contractors. Its agreements with its
contractors are in the nature of supply of labor and materials for the development and/or construction of its various real estate projects.
Research and Development
Although the Company engages in research and development activities focusing on the house designs, types of construction materials
to be used for its housing units, construction methodology, value-engineering for its projects and quality assurance, the expenses incurred
by the Company in connection with these activities are not material.

23
Filinvest Alabang, Inc.
FAI’s main project is the master-planned development of Filinvest City, a 244-hectare premier satellite city located in Alabang,
Muntinlupa City in the southern part of Metro Manila approximately 16 km south of Makati, the central business district in Manila and
10 km from the Ninoy Aquino International Airport. Filinvest City is a fully integrated, self-contained satellite city which serves as a
viable urban residential and business alternative to Makati for the southern Metro Manila area and a business centre for the southern
Tagalog provinces. The mixed-use development concept incorporates commercial and residential properties in a complementary manner
and provides for a balance of recurring rental income from office and retail space as well as trading income from sale of lots and
condominium units. Filinvest City is a joint venture development with Government entities, namely the Department of Environment
and Natural Resources (DENR) and the Philippine Reclamation Authority (now with Land Management Bureau), in which FAI has a
74.0% interest. Over the past few years, land sale prices in Filinvest City have risen, driven by improved accessibility and economic
growth. In particular, the completion of the Skyway extension from Sucat to Alabang in April 2011 has caused land prices in the
surrounding area to increase. As of December 31, 2019, FAI recorded a record high land sale price of P428,960 per sq.m.
The development obligations of FAI in Filinvest City have been substantially completed. Construction of the entry/exit of the Skyway
into Filinvest City was completed and opened to the public in May 2011.
Location
Set out below is a map showing the location of Filinvest City relative to the Makati, Ortigas and Bonifacio Global City.

24
Site Development
Set out below is the site development concept of Filinvest City. The model below may not necessarily represent the eventual state of the
actual property development.
Land Use
The following table shows the estimated mix of office, retail, residential, institutional and leisure properties that
Filinvest City is expected to have when the project is fully completed, as well as certain details relating to developments at Filinvest
City as of December 31, 2019. The land use and gross floor area estimates below may be adjusted as market trends develop and may
not necessarily represent the eventual state of the actual property development.
Lot area Expected gross
Land Use allocated floor area
(sq.m) (sq.m)
High-rise office and condominium 711,095 5,636,136
Commercial and mixed-use 518,794 1,499,620
Residential subdivision 49,182 49,182
Leisure/hospitality 91,475 278,140
Institutional/government 241,458 325,012
Roads and open space 835,539 —
Total 2,447,543 7,788,090
As of December 31, 2019, FAI beneficially owned 78 hectares of unsold lots in Filinvest City comprising 29 hectares of unsold lots
held through joint ventures (in which FAI beneficially owned 21 hectares) and 57 hectares of unsold lots owned directly by FAI. Of the
57 hectares, 23 hectares remain unused. 34 hectares were either rented out or being used for recurring business.
Office and Condominium Zone
The office zone is currently concentrated in two districts of Filinvest City, the Spectrum and Northgate districts. A variety of office
centres are owned and operated, or under development, by third parties in these districts. FLI’s Northgate Cyberzone, is located at
Northgate District. For details, see ‘‘— Filinvest Land, Inc. — Northgate Cyberzone.’’ FAI also develops its own buildings in the office
zone under the concept of small office-home office (SOHO). SOHO buildings are compact units designed to provide a flexible, efficient
work place and living space. The SOHO units are developed for sale rather than for lease.
Commercial and Mixed-Use Zone
A variety of major retail establishments at Filinvest City are owned and operated by third parties. In addition, FLI owns Festival
Supermall, which is located at Filinvest City. See ‘‘— Filinvest Land, Inc. — Festival Supermall.’’ FAI also develops its own retail
leasing projects.

25
Marketing and Management
The day-to-day operations in the retail zone, including leasing and general mall management, is managed by FSI pursuant to various
management contracts entered into by FSI with the owners and developers of various retail projects. The contracts are on a continuing
basis until terminated with 90-day advance notice by any of the parties.
As of December 31, 2019, FSI had approximately 239 personnel in its organization, responsible for the day-to-day operations of the
retail zone. Engineering, maintenance, security and janitorial services for the mall and other retail establishments were outsourced to
reputable third-party service providers on an annual contractual basis and reviewed annually by FSI.
Residential Zone
Filinvest City provides an urban residential alternative to the surrounding residential subdivisions. FAI is engaged in the development
of a number of high-rise residential condominiums within Filinvest City. Each condominium’s design varies according to its target
market and income segment.
Leisure and Hospitality Zone
Filinvest City includes several hotels and condotels owned and managed by third parties, in addition to CFCM, a hotel that FAI launched
in December 2012 within its mixed-use Entrata complex. CFCM has 345 rooms on 27 storeys and is managed by Chroma under the
Crimson brand. The hotel had its grand opening in March 2013.
In addition to hotels and condotels, Filinvest City is also the site of leisure projects, including the Palms Country Club. To enhance the
value of its high-end residential projects in Filinvest City and to attract buyers to these projects, FAI established its own exclusive sports
and leisure club, a 30,000-sq.m. private membership club that hosts banquets, corporate functions and other events for its members. FAI
sells individual and corporate club shares.
Institutional and Government Zone
Filinvest City has institutional establishments, including both the private sector and Government entities. Filinvest City has become a
hub for health and medical care and home to Asian Hospital, Ospital ng Muntinlupa, Food and Drug Administration and other
Government-run medical facilities.
Competition
Real Estate Segment
Real estate development and selling are very competitive. FLI believes it is strongly positioned in the affordable housing income and
middle-income residential subdivision market and in the farm estates. Success in these market segments depends on acquiring well-
located land at attractive prices often in anticipation of the direction of urban growth. FLI believes that its name and reputation it has
built in the Philippine property market contributes to its competitive edge over the other market players. On the basis of publicly available
information and its own market knowledge, FLI’s management believes that it is among the leading housing and land project developers
in the Philippines, particularly in the socialized to middle-income housing sectors. FLI’s management also believes that FLI is able to
offer competitive commissions and incentives for brokers, and that FLI is able to compete on the basis of the pricing of its products,
which encompasses products for different market sectors, as well as its brand name and its track record of successful completed quality
projects.
FLI directly competes with other major real estate companies positioned either as a full range developer or with subsidiary companies
focused on a specific market segment and geographic coverage. Its direct competitors include Ayala Land Inc., Vista Land, Robinsons
Land, DMCI and SMDC.
FLI faces significant competition in the Philippine property development market. In particular, FLI competes with other developers in
locating and acquiring, or entering into joint venture arrangements to develop, parcels of land of suitable size in locations and at attractive
prices. This is particularly true for land located in Metro Manila and its surrounding areas, as well as in urbanized areas throughout the
Philippines.
FLI’s continued growth also depends in large part on its ability either to acquire quality land at attractive prices or to enter into JVAs
with land-owning partners under terms that can yield reasonable returns. Based on FLI’s current development plans, it believes that it
has sufficient land reserves for property developments for the next several years. If the Philippine economy continues to grow and if
demand for residential properties remains relatively strong, it expects that competition among developers for land reserves that are
suitable for property development (whether through acquisitions or JVAs) will intensify and that land acquisition costs, and its cost of
sales, will increase as a result.
Leasing Segment
With regard to the Company’s acquired assets dedicated to office space leasing and shopping mall operations, the Company competes
with property companies such as Ayala Land, Inc. Robinsons Land Corporation and SM Prime Holdings, Inc. In office space leasing,

26
particularly to call centers and other BPO operators, the Company competes with companies such as Robinsons Land Corporation,
Ayala Land, Inc., Eton Properties Philippines, Inc. and Megaworld Corporation.
1.4.2 Hospitality
The Group’s hospitality business is operated through both Chroma and FHC.
The Group’s first operating property is the 5-star CRSM. The resort is directly owned by FDC through MSSI which was incorporated
on July 17, 2009. CRSM is an award-winning deluxe resort located on the island of Mactan, Cebu, Philippines. The resort features 290
guest rooms including 40 villas with private plunge pools, 5 Food and Beverage Outlets, a Gym, a Children’s play area and 2 Ballrooms.
CRSM was formally launched on October 8, 2010. The flagship Azure Beach Club was launched on October 24, 2014. The resort
completed its renovation of the infinity pool, and opened the Spanish-themed Enye restaurant in 2017. The property also launched the
3,700-sq.m. Crimzone, which features family-oriented facilities, children’s play area, dedicated pool and snack bar. MSSI is currently
constructing a 229 room expansion with additional food and beverage outlets and function spaces.
In September 2012, the Group opened its second property under the Quest Brand. QHCC Cebu is a 427-key Condotel in FLI’s Grand
Cenia Development in Cebu City. The condotel units are owned by third parties and are locked in a 25-year rental pool. The hotel is
located in the Cebu Business Park and includes 10 meeting rooms, a 300 seat capacity all-day dining restaurant and a swimming pool.
In March 2013, the Group opened its third property, CFCM in Alabang, under EHSI, which was incorporated on November 28, 2012.
The hotel is part of the Entrata Urban Complex which features 345 keys, extensive meeting facilities, 5 F&B outlets, a gym, a spa and
a swimming pool, with plans to enhance amenity areas, new ballroom spaces and food outlets.
On January 27, 2016, the Group was given a Notice of Award by the CDC for the lease, development, operation and management of
the former Mimosa Leisure Estate covering 201.6 hectares through a 50-year lease agreement, renewable for another 25 years. The
lease agreement between CDC and Filinvest Mimosa, Inc. (an entity owned by FDC (47.5%), FLI (47.5%) and CDC (5%)) was signed
on April 22, 2016. The lease agreement requires FMI to investment of at least ₱5 billion over a period of 5 years.
The property, which is located in Clark Freeport Zone approximately 100 km north of Metro Manila, includes a hotel with 303 rooms,
as well as 36-hole golf course, which are now operating as QCC Clark and Mimosa Golf, Clark under MCI which was incorporated on
May 13, 2016. MCI is a wholly owned subsidiary of FHC.
In June 2016, MCI signed a sublease agreement with FMI following the terms of lease of FMI with CDC. Over the lease period, MCI
will operate the existing hotel and golf courses of the estate and the right to develop the leased portion of the estate. During the ASEAN
Summit in November 2017, its property QHCC Clark showcased the opening of the Grand Villas, newly-refurbished hotel rooms and
event facilities.
In 2012, FDC was able to acquire a prime lot in Boracay with its own beachfront. Planning commenced in the same year and site
development started in early 2014. By mid-2015, two buildings were topped off. The resort, which is directly owned by FHC through
its wholly owned subsidiary BSI, is designed to have a total of 192 keys with 23 pool villas, meeting facilities, 4 F&B outlets, a gym,
spa and a swimming pool. CRSB started its operation in November 2018 with 100 rooms available for occupancy and ended 2019 with
149 available rooms for sale.
Competition
The Company faces significant competition in the Philippine Hospitality market. By not only developing hotel projects but also having
hotel management capability, the Company believes that it is strongly positioned to take advantage to the expected emergence of a
robust tourism market in the Philippines. The Company believes that success in the Philippine Hospitality market depends on a mix of
external factors and internal capabilities.
External factors which can greatly affect the Philippine Hospitality include political and economic stability, climate change, health
pandemic restricting travel and mobility and general security. These external factors affect the attractiveness of the Philippines for both
local and domestic, leisure and business travelers. Internally the Company is confident due to Filinvest’s background in real estate
development in its ability to acquire, lease or joint venture the right pieces of property and execute the right type of hospitality
development. Also the Company believes that it has a strong management capability gained through its partnership with Archipelago
International. Despite the short operating history of the Company, its hotel assets have been able to compete with even entrenched
players as evidenced by the strong performance of the operating hotel properties.
The Company competes with local and foreign hospitality developers, owners and operators to acquire, lease or joint-venture appropriate
hotel locations the main tourist and business destinations. Its hotel assets also compete for room and banquet business among the
hospitality or hospitality like products serving the markets where these assets are located. Major competitor includes – SM, Ayala,
Waterfront, Shangri-la, Bellevue, and Movenpick.

27
1.4.3 Banking and Financial Services
EW
EW (or the Bank) was granted authority by the Bangko Sentral ng Pilipinas (BSP) to operate as a commercial bank under Monetary
Board (MB) Resolution No. 101 dated July 6, 1994, and commenced operations on July 8, 1994. The Bank was also granted authority
by the BSP to operate an expanded foreign currency deposit unit under MB Resolution No. 832 dated August 31, 1994. Subsequently
in 2012, EW was authorized by the BSP to operate as a universal bank. As of December 31, 2019, EW was 77.9% effectively owned
by FDC.
On February 17, 2014, the SEC approved the application of EW to change its registration from a “Government Securities Eligible
Dealer” (with broker-dealer of securities functions) to an “Underwriter of Securities Engaged in Dealing Government Securities” (with
broker-dealer of securities functions), in accordance with the SRC and other applicable laws, rules and regulations. EW’s registration
as an “Underwriter of Securities Engaged in Dealing Government Securities” had an initial validity of up to December 31, 2014, and
has been extended until 2019.
The Bank’s shares were listed on the PSE on May 7, 2012.
Mergers and Acquisitions
In 2003, EW merged with Ecology Savings Bank, Inc. (“ESBI”). EW, as the surviving corporation, purchased all the outstanding capital
stock of ESBI from EBC Strategic Holdings Corp. Consequently, as set forth in the Articles of Merger dated January 31, 2003, all rights,
business, assets and liabilities of ESBI were conveyed, assigned and transferred to EW. The merger was approved by the BSP and the
SEC on August 6, 2003 and June 26, 2003, respectively.
On January 23, 2009, EW and American International Group, Inc. (“AIG”) and certain AIG subsidiaries, including AIG Philam Savings
Bank (“AIGPASB”), entered into a Share Sale Agreement for EW to acquire all of the shares of the AIGPASB and its constituent
companies. On March, 2009, a Deed of Absolute Sale of Shares was executed between EW and each of the respective sellers.
On August 19, 2011, EW entered into a deed of assignment for the purchase of a majority of the outstanding shares and control of GBI.
Consequently, GBI became a subsidiary of EW. On July 11, 2012, EW acquired an 83.17% interest in FRBI, a rural bank engaged in
the business of extending credit to farmers, tenants, and rural enterprises. EW subsequently increased its ownership in FRBI to 100.00%
through additional share acquisitions and capital contributions in 2012 and 2013. In May 2013, FRBI changed its name to East West
Rural Bank, Inc. (“EWRB”) and entered into an asset purchase agreement with GBI, effectively consolidating all of the Bank’s rural
banking business in EWRB.
On March 28 and June 5, 2014, the BSP and the SEC respectively, approved the proposed merger between EW and GBI. On
July 31, 2014, the merger between EW and GBI was completed.
On May 6, 2016, EW and SCB entered into an agreement for SCB PH retail business. Under the agreement, the credit cards, personal
loans, wealth management and deposits of SCB in the Philippines will be migrated to EW. The transaction also include the transfer of
following entities:
• ASIA, a wholly owned subsidiary of SCB which provided sales and marketing services directed exclusively to SCB PH
clients for bancassurance products; and
• QMIS (formerly Price Solutions Philippines, Inc.), a wholly owned subsidiary of SCMB Overseas Limited providing sales
and marketing services to SCB PH for credit cards and personal lending products.
In 2016, the BSP approved and confirmed the initial equity investment in EWLFC of P100.0 million. It was registered with the SEC in
October 2016 with secondary license to operate as a financing company in accordance with the Financing Company Act of 1998 and its
implementing rules and regulations. EWLFC’s registered business address is at East West Corporate Center The Beaufort, 5th Avenue
corner 23rd Street, Bonifacio Global City, Taguig City.
Securities Issuances
Debt Issuances
On July 4, 2014, the Bank completed its issuance of Basel III-compliant Tier 2 unsecured subordinated notes with a total face value of
P5.0 billion with a coupon rate of 5.5% maturing in January 2025 but callable on January 4, 2020. On January 4, 2020, the Bank
exercised its call option. The redemption was approved by the Bank’s BOD on October 31, 2019 and by the BSP on December 13,
2019.
On February 20, 2017, EW’s subsidiary, EWRB, issued 5.50% Lower Tier 2 unsecured subordinated notes with par value of
₱1.25 billion maturing on August 20, 2027 but callable on August 20, 2022.
On February 21, 2020, the Bank issued ₱3.7 billion fixed rate bonds due 2023. The bonds carry an interest rate of 4.5% per annum to
be paid quarterly for 3 years.

28
Equity Issuances
On January 29, 2015, the Bank’s BOD approved the common shares rights offering. In March 2015, the BOD approved the application
of the Bank to list up to 371,574,000 common shares with par value of ₱10.0 per share to cover its stock rights offering.
On May 8, 2015, a total of 371,574,000 common shares were listed at the PSE with ₱10.0 par value per share. The total proceeds raised
by EW from the sale of the said shares amounted to ₱8.0 billion while the net proceeds (after deduction of direct costs related to equity
issuance) amounted to ₱7.95 billion. The net proceeds were used to invest in securities allowed under BSP regulation and to fuel growth
in loans.
On July 13, 2017 and August 30, 2017, the Bank’s BOD approved and the stockholders ratified, respectively, the following (i) increase
in EW’s authorized capital stock from ₱20.0 billion to ₱50.0 billion consisting of 4.5 billion common shares with par value of ₱10.0 per
share or a total par value of ₱45.0 billion and 500 million preferred shares with par value of ₱10.0 per share or a total par value of
₱5.0 billion and (ii) declaration of 50.0% stock dividends equivalent to ₱7.5 billion from the Bank’s unrestricted retained earnings as of
December 31, 2016 to cover the required 25.0% minimum subscription and payment for the increase of authorized capital stock. The
increase in the Bank’s authorized capital stock and stock dividend declaration was subsequently approved by the BSP and SEC on
February 1, 2018 and February 28, 2018, respectively. On April 16, 2018, a total of 749,991,801 common shares were listed on the PSE.
Long-Term Negotiable Certificates of Deposit (LTNCD)
In 2017, the Bank issued 4.0% fixed coupon rate LTNCDs maturing in September 2022. The first tranche of LTNCD amounting to
P=2.7 billion was issued in March 2017. The second to fifth tranches of LTNCD aggregating P7.3 billion were issued during April to
August 2017.
In 2018, the Bank issued the first tranche of its ₱15.0 billion LTNCD program, amounting to ₱2.45 billion. The issued LTNCDs will
mature on December 7, 2023 and carries a fixed coupon of 4.625% payable quarterly.
Subsidiaries
EWRB
EWRB was incorporated and registered with the SEC on November 5, 1997 with the purpose of accumulating deposits and granting
loans to various individuals and corporate entities as well as government and private employees. It started commercial operations in
March 1998. Its principal office is located at 3rd and 4th Floors, East West Bank Building, J.P. Laurel Avenue corner Iñigo Street,
Bajada, Davao City.
EWIB
EWIB was incorporated and registered with the SEC on July 6, 2015 with the primary purpose to act as an insurance broker. On
September 23, 2015, the IC authorized EWIB to act as an insurance broker. It started commercial operations on September 24, 2015.
EWIB’s registered business address is at the Beaufort, 5th Avenue Corner 23rd Street, Bonifacio Global City, Taguig City.
EWLFC
EWLFC was incorporated and registered with the SEC on October 6, 2016 with secondary license to operate as a financing company in
accordance with the Financing Company Act of 1998 and its implementing rules and regulations. EWLFC’s registered business address
is at The Beaufort, 5th Avenue Corner 23rd Street, Bonifacio Global City, Taguig City.
QMIS
In 2016, the Bank acquired 100.0% voting shares of QMIS as part of the asset and share transfer agreement by and between SCB
Philippines and SCMB. QMIS was registered with SEC in 2007 primarily to engage in providing sales and marketing services. QMIS’
registered business address is at 7th Floor, Global Trade Center, 1024 EDSA, Quezon City.
ASIA
In 2016, the Bank acquired 100.0% voting shares of ASIA as part of the asset and share transfer agreement by and between SCB and
SCMB Overseas Limited. ASIA was registered with the SEC in 2012 primarily to engage in general insurance agency business. ASIA’s
registered business address is at 5th Floor 6788 Sky Plaza Building, Ayala Avenue, Makati City.
Investment in a Joint Venture
On May 28, 2015, EW and Ageas entered into a JVA to form EW Ageas Life, with P=2.0 billion capitalization and with EW’s ownership
interest of 50.0% less 1 share. EW’s initial investment amounted to P=500.0 million. The JVA provided certain conditions that should
be satisfied for the consummation of the agreement, which included among others, obtaining all the required regulatory approvals. In
October 2015, the SEC approved the registration of EW Ageas Life with the following primary purpose:
1. to undertake and write insurance upon the life of individuals, and every insurance appertaining thereto or connected therewith;
2. to make contracts of insurance providing for all risks, hazards, guarantees and contingencies to which life, accident, or health
insurance is applicable;
3. to indemnify against legal liability;
4. to compute endowments and grant, purchase or dispose of annuities;
5. to procure re-insurance of its risks;
6. to issue policies stipulated to be with or without participation in profits; and

29
7. to purchase for its own benefit any policy of insurance or other obligation as well as claims of policyholders
In November 2015, EW Ageas Life and EW entered into a 20-year exclusive distribution agreement. Under the distribution agreement,
EW Ageas Life will have exclusive access to the branch network of EW for the distribution of its insurance products (the exclusive
bancassurance access).
In December 2015, EW Ageas Life obtained from the Insurance Commission a license to operate life insurance business. Its registered
business address is at One World Place, 32nd Street, Bonifacio Global City, Taguig City.
In 2016, upon obtaining all the required regulatory approvals from the Insurance Commission and the BSP, the establishment of EW
Ageas Life was consummated and EW received a consideration from Ageas. The consideration attributable to the exclusive
bancassurance access was deferred and will be recognized as income over the life of the distribution agreement. The consideration
attributed to the investment transaction increased EW’s investment in EW Ageas Life by P=505.0 million and resulted in a gain on capital
transaction of P=1.0 billion.
Under the joint venture agreement, within a period of 7 years from consummation, the joint venture entity may at any time request for
additional funding from EW and Ageas. On September 6, 2018, EW and Ageas each infused additional capital to EW Ageas Life
amounting to P=250.00 million.
In 2017, EW Ageas Life requested for additional funding from Ageas aggregating to P=1,330.0 million. As half of the capital infusions
made by Ageas was for the account of EW, this increased EW’s investment in the joint venture by P=665.0 million, which was recognized
as gain on capital transaction.
In 2018, EW and Ageas each infused additional capital to EW Ageas Life amounting to P=250.0 million.
In 2019, EW and Ageas each infused additional capital to EW Ageas Life amounting to P=350.0 million.
For the years ended December 31, 2019, 2018 and 2017, share in net losses of EW Ageas Life amounted to P=339.5 million,
P=395.8 million, and P=449.1 million, respectively. There were no dividends received from EW Ageas Life in 2019, 2018 and 2017.
As of December 31, 2019 and 2018, the carrying value of investment in EW Ageas Life amounted to P=694.1 million and P=689.5 million,
respectively.
Principal Business Activities
Retail Banking
The retail banking segment mainly covers traditional branch banking products and services such as deposits, back-to-back/emerging
market loans and other over-the-counter transactions. It also caters to the needs of high net-worth clients for alternative investment
channels and cash management requirements of mid-market corporates. It includes entire transaction processing, service delivery and
infrastructure consisting of the Bank’s network of branch stores, automated teller machines (ATMs), as well as its internet banking
platform.
Deposit Products
The Bank offers a comprehensive range of deposit products consisting primarily of Peso demand, savings and time deposits. Offered
also are United States (U.S.) Dollar and third currency savings and time deposits. The Bank offers varying interest rates on its deposit
products depending on prevailing market interest rates, the rate of return on its earning assets and interest rates offered by other
commercial banks. As of December 31, 2019 and 2018, the Bank’s total deposits amounted to P304.7 billion and P288.2 billion,
respectively.
Access to Investment Products
The Bank also offers investors access to investment products such as treasury bills and bonds, fixed rate treasury notes and retail treasury
bonds. Customers can also invest in long-term fixed income debt instruments issued by public and private entities.
Cash Management Services
The Bank offers a wide range of cash management solutions to assist mid-market corporates, composed primarily of entrepreneurial and
family-owned businesses, including (i) a facility for payroll preparation and crediting, (ii) an interest-earning checking account that
provides a customized standalone check-writing facility and a comprehensive accounts payable system, (iii) an end-to-end automated
solution for the creation, disbursement and monitoring of checks, (iv) a check depot service whereby the Bank retains a corporate
customer’s post-dated checks for immediate deposit to the customer’s account on the same date indicated on the checks, (v) a bill
collection service whereby the Bank acts as a collecting agent and transmits consolidated payments to the customer online or via
electronic file transfer and (vi) deposit pickup services, in which the Bank sends an armored vehicle to pick up cash and check deposits
at the customer’s premises.

30
Consumer Lending
The Bank offers various types of consumer lending products to individuals, which consist principally of credit
cards, auto loans, residential mortgage loans and personal loans. The Bank reviews various factors in evaluating prospective clients,
including but not limited to the capacity of the borrower to repay the loan. The Bank also considers various factors in pricing its loans
such as but not limited to the delinquency rates of particular market segments, the funding costs of the portfolio, direct and indirect
expenses related to granting consumer loans and the target spread of the loan portfolio. Loan terms are differentiated according to factors
such as a customer’s financial condition, age, loan purpose, collateral and quality of relationship with the Bank. The Bank focuses its
core business towards consumer financing where it has a competitive advantage. Several product lines were launched to ascertain that
its target market is reached.
Credit Cards
In 2004, the Bank began issuing MasterCard credit cards under the name “East West Bank MasterCard” in partnership with AIG. In
2009, the Bank acquired the Philam Savings Bank, which issued Visa credit cards. After the acquisition, the Bank integrated its Visa
and MasterCard businesses into a single business unit. From an initial base of 10,000 credit cards issued during 2004, the Bank has since
grown to have issued over 1.0 million credit cards, comprising 10.8% of the total market share for credit cards in the Philippines
(excluding Banco de Oro Unibank, Inc. which ceased to be a member of the Credit Cards Association of the Philippines since 2013), as
of September 30, 2019.
Revenues from the credit card operations consist principally of annual fees paid by cardholders, interest on deferred and installment
payments, cash advance fees, interchange fees paid by service establishments and late payment charges. Annual cardholder fees range
from P1,200 to P2,800. As of December 31, 2019, the interest rate on deferred payments range from 1.9% to 3.5% per month and the
interest rate on installment payments range from zero to 2.0% per month. One-time fees for cash advances are approximately 3.0% of
the total cash advance amount or P600 whichever is higher, late fees accounting for 8.0% of the minimum amount due of late payment
accounts, and interchange fees range from 0.3% to 2.3% of the purchased amount. Revenues relating to the credit card business are
reflected in the Bank’s financial statements as interest income and other operating income from service charges, fees and commissions.
The Bank seeks to diversify its distribution channels, form alliances with merchants and manage its product portfolio in order to continue
the growth of its credit card business. The Bank currently markets and sells its credit cards directly to customers, as well as through
third party telemarketing agencies. Credit Card customers may participate in a variety of instant and loyalty based rewards programs
that allow them to redeem merchandise or gift certificates at partner establishments. The Bank attempts to identify and capitalize on
gaps in the market by offering products tailored to meet the needs of underserved markets. The Bank’s credit card products come in
different grades, from regular cards to premium class cards at different annual membership fees.
Auto Loans
The Bank’s auto loans are offered through car dealerships (including second-hand car dealers), independent sales agents and the Bank’s
branches. The Bank provides economic incentives to car dealerships and independent sales agents based on each approved auto loan
amount. A key competitive factor in the automotive loan business is the speed by which a bank can process an automotive loan, as
dealers will offer a loan to multiple banks and the Bank offers a 3-hour auto loan approval process, which the Bank believes is an
important aspect to its success in growing its auto loan portfolio. The Bank’s auto loan business also engages in strategic partnerships
with major car brands to develop exclusive programs. Additionally, the Bank cross-sells its auto loans with the products of other units
and offers special plans for existing and repeat customers.
All of the Bank’s auto loans are secured by a chattel mortgage over the car being purchased. In addition to being subject to the Bank’s
internal credit checks, the Bank generally requires the borrower to make a minimum down payment of 20.0% (or a minimum down
payment of 15.0% for long-term customers with verifiable good credit) of the purchase price. Depending on whether the car being
purchased is a new car or a second-hand car, the interest rate of the Bank’s auto loans can range from 8.5% to 18.0%, with an average
maturity of 55 months. Generally, when an installment payment falls 90 days past due, the Bank may commence foreclosure proceedings.
Foreclosed cars are generally sold by the Bank through public auction.
Residential Home Mortgage Loans
The large majority of EW’s residential mortgage loans are extended to property buyers in the Philippines who intend to occupy residential
units in the form of house and lot, townhouse or condominiums, with a small proportion being extended to individuals purchasing lots
for investment purposes or for future dwelling via house construction loans. EW’s home loan is secured by a first mortgage on the
property and each applicant undergoes a stringent credit evaluation process. EW requires its borrowers to make a minimum down
payment of 10% of the total appraised value for the various loan purposes. EW also refinances existing housing loans in the form of a
loan takeout. EW offers loans at competitive and fixed interest rates. EW uses its branch store network as a key distribution channel
and maintains marketing campaigns to attract property buyers independently from real estate developers which serve as distribution
channels for home loan providers. The average loan term of EW’s home loan is thirteen years. In line with industry practice in the
Philippines, interest rate on EW’s home loan is set at a fixed rate applicable for an initial period of between 1 and 5 years, depending on
the maturity of the loan. Upon expiry of the fixing period, the interest rate is reset at a fixed rate applicable for succeeding periods.
When a borrower falls in arrears with its mortgage payments, the buyer can either agree to a voluntary disposition of the property to
EW, or EW may commence foreclosure proceedings. EW sells mortgaged collateral that has been foreclosed, primarily in public auctions
or by brokers on behalf of EW. Foreclosure of the mortgaged collateral generally takes between 6 and 24 months.

31
EW currently offers various home financing products with differentiating features, which includes a mix of competitive interest rates
and what the Bank believes to be the longest payment term in the market of up to 30 years. As most residential mortgage loans available
in the market only allow up to a maximum payment term of 20 years, EW’s longer payment term means lower and consequently lighter
amortization payments for the borrower. EW also gives the borrowers the option to adopt a fixed-term pricing scheme to protect
borrowers against the risk of fluctuating interest rates.
EW’s home loans are available in different loan packages, tailored to fit the needs of specific markets. LotAcquire is a loan specifically
designed for the acquisition of a vacant lot. Other products offered by EW include HomeAcquire, HomeConstruct and HomeImprove.
Personal Loans
The Bank’s personal loans business provides unsecured, uncollateralized consumer loans to qualified individuals for multi-purpose
personal use. The primary distribution channels for personal loans are the Bank’s branches and third-party sales agencies. The Bank
offers personal loans to employed and self-employed individuals with annual income of at least P15,000 or basic annual income of not
less than P180,000. The monthly nominal interest rates for a personal loan ranges from 1.5% to 1.9% and is payable in fixed equal
monthly installments from 12 to 36 months. .
Corporate Banking
The Corporate Banking Group is responsible for the overall management and development of the Bank’s corporate relationships.
Although the activities of the EW group are primarily focused on the working capital, term funding and project finance requirements of
its core mid-market customer base, which is predominantly comprised of entrepreneurial or family-owned businesses, it also has
relationships with large corporate accounts. The Corporate Banking Group also offers the entire array of the Bank’s products and services
which includes cash management services, foreign exchange and deposit and investment products to its corporate customers. The Bank
believes that successfully identifying and offering holistic solutions to the banking needs of its corporate client base is essential to
placing EW at the top of its clients’ minds in their choice of a banking relationship.
Credit Products
The Bank provides a wide range of loan products and services to its corporate customers, including revolving credit lines, domestic and
foreign bills purchase, acceptances, trade finance facilities, bank guarantees and term loans. In line with its strategy to create a balanced
and diversified portfolio, the Bank’s corporate customers are engaged in various industries and located in key geographical areas in the
Philippines. Credit facilities offered to corporate customers include both secured and unsecured loan products, depending on the credit
risks associated with the customer and its business.
The Bank intends to continue to expand its corporate banking portfolio by increasing its share of its existing customers’ working capital
requirements as well as supporting their expansion projects. The Bank also aims to continue to enlarge its client base by targeting new
corporate customers through the Bank’s expanded combined customer network.
Rural Banking
To extend its reach to underserved segments of the market that have the potential for growth, the Bank has established a rural bank arm.
Backed by the strong track record of its predecessor entities, EWRB is capable of catering to the banking needs of customers outside
the urban areas in the country and provide wider access to innovative products and delivery channels. In addition to DepEd teachers’
loans, EWRB currently offers small business loans, which are intended for small to medium enterprises, with a maximum loan limit
of ₱5.0 million, and social security system (SSS) pensioners’ loans, which are intended for all SSS retirees and survivorship pensioners
whose SSS pension is directly credited to savings accounts with EWRB and EW.
As of December 31, 2019, EWRB has a network of 76 branches spread all over the country.
Treasury and Trust
Treasury
The Bank’s treasury has primary responsibility for managing the Bank’s liquidity, interest rate and foreign exchange exposures. The
Bank manages its liquidity position by regularly reviewing its cash flow position, debt maturity profiles, availability of credit facilities
and overall liquidity position to mitigate the effects of fluctuations in cash flow. The Bank’s treasury actively engages in trading for its
own proprietary account. It trades local treasury bills and bonds, foreign-currency denominated bonds and foreign exchange. The Bank
is an accredited Government Securities Eligible Dealer.
As of December 31, 2019, the Bank had ₱70.9 billion of trading and investment securities, which accounted for 17.4% of the Bank’s
total assets. As of December 31, 2019, 87.0% of the Bank’s trading and investment securities portfolio was invested in government
securities, a majority of which are Philippine Government debt instruments.

32
Trust
The Bank offers a wide range of trust products and services, including fund management, investment management services,
custodianship, administration and collateral agency services and stock and transfer agency services. In addition to offering trust services
to corporate and high net-worth individual customers (customers with a total relationship balance of P2.5 million), the Bank provides
retail customers with alternative investment opportunities through its unit investment trust funds (UITFs), which are available in Peso
and U.S. dollar-denominated UITFs. In a UITF, funds of various investors are pooled and invested in a diversified portfolio of liquid
securities, term deposits, money market instruments or stocks in accordance with the investment objectives and restrictions stated in the
Declaration of Trust. For the year ended December 31, 2019, the combined trust and managed funds of the Trust Department of EW
amounted to P=35.0 billion and income from its trust operations amounted to P=70.5 million.
Branch Store Network
Branch Network
The branch network is focused more on the Philippines’ major industrial and commercial regions in Metro Manila and has key locations
outside of Metro Manila such as Metro Cebu, Metro Davao, Northern Luzon, South Luzon Industrial Zone, Iloilo, Bacolod and
Mindanao. Within these regions, EW has strategically positioned its branches in key business and commercial centers, which are areas
that generally boast of higher per capita incomes, and have higher growth and traffic, thereby maximizing the number of transactions
and deposits per branch.
Each branch is managed by a branch head responsible for both the sales and operational functions of the branch. Each branch head
reports to a division head, which supervises 11 to 20 branches. Branches are grouped geographically and such groups include North
Luzon, South Luzon, Southern Metro Manila, Eastern Metro Manila, Northern Metro Manila, Downtown Manila, Visayas and
Mindanao.
As of December 31, 2019, the Parent Bank has 391 branches in various parts of the country, majority of which are located within Metro
Manila.
As of December 31
2019 2018 2017
Metro Manila 212 212 210
Other areas of Luzon 100 100 100
Visayas 40 39 39
Mindanao 39 39 39
Total Branches 391 390 388
ATMs 584 583 572
EWRB Branch Store Network
As of December 31, 2019, EWRB, a wholly owned subsidiary of EW, has a network of 76 branches mostly located in Visayas and
Mindanao. The table below sets out the details of EWRB’s branches and ATMs in the Philippines in operation as of the specified dates.
As of December 31
2019 2018 2017
Metro Manila 1 1 1
Other areas of Luzon 22 22 19
Visayas 22 22 16
Mindanao 31 31 22
Total Branches 76 76 58
ATM Network
EW provides 24-hour banking services through its network of 584 ATMs as of December 31, 2019, compared with 583 ATMs as of
December 31, 2018. Of these 584 ATMs, 400 are located at EW’s branches while 184 are located off-site. Customers are given access
to the ATM facilities through ATM cards and debit cards, which are available to checking and savings account holders. Customers may
likewise access ATM facilities through prepaid cards which are pre-loaded or reloadable payment cards (not linked to a checking or
savings account). Aside from ATMs, customers may likewise use Debit and Prepaid cards on purchases and other transactions done
through the internet and Point-of-Sale terminals.
The Bank also is a member of Bancnet, which is an ATM network that allows its member banks customers to use ATM terminals
operated by other Bancnet member banks. Customers of the Bank that use ATMs operated by other banks must pay a service charge
for accessing these networks.

33
Status of Publicly-Announced New Product or Service
All publicly-announced new products or services of the Bank are in commercial distribution.
Competition
The banking industry in the Philippines is composed of universal banks, commercial banks, savings banks, savings and mortgage banks,
private development banks, stock savings and loan associations, rural banks and cooperative banks.
As of March 2020, the commercial sector consisted of 46 universal and commercial banks (updated as of March 2020 on BSP’s Directory
of Banks and Non-Banks), of which 21 were universal banks and 22 were commercial banks. Of the 21 universal banks, 12 were private
domestic banks, 3 were government banks, and 6 were branches of foreign banks. Of the 25 commercial banks, 5 were private domestic
banks, 2 were subsidiaries of foreign banks, and 18 were branches of foreign banks.
Commercial banks have all the general powers incident to corporations and all powers that may be necessary to carry on the business of
commercial banking, such as the power to accept drafts and to issue letters of credit, discount and negotiate promissory notes, drafts,
bills of exchange and other evidences of indebtedness, accept or create demand deposits, receive other types of deposits and deposit
substitutes, buy and sell foreign exchange and gold and silver bullion, and lend money on a secured or unsecured basis. Universal banks
are banks that have authority, in addition to commercial banking powers, to exercise the powers of investment houses, to invest in the
equity of business not related to banking, and to own up to 100% of the equity in a thrift bank, a rural bank, or a financial allied or non-
allied enterprise. A publicly-listed universal or commercial bank may own up to 100% of the voting stock of only 1 other universal or
commercial bank.
Thrift banks primarily accumulate the savings of depositors and invest them, together with capital loans secured by bonds, mortgages
in real estate and insured improvements thereon, chattel mortgage, bonds and other forms of security or in loans for personal and
household finance, secured or unsecured, or in financing for home building and home development; in readily marketable debt securities;
in commercial papers and accounts receivables, drafts, bills of exchange, acceptances or notes arising out of commercial transactions.
Thrift banks also provide short-term working capital and medium- and long-term financing for businesses engaged in agriculture,
services, industry, and housing as well as other financial and allied services for its chosen market and constituencies, especially for small
and medium-sized enterprises and individuals. As of March 2020, there were 49 thrift banks (updated as of March 2020 on BSP’s
Directory of Banks and Non-Banks).
Rural and cooperative banks are organized primarily to make credit available and readily accessible in the rural areas on reasonable
terms. Loans and advances extended by rural banks are primarily for the purpose of meeting the normal credit needs of farmers and
fishermen, as well as the normal credit needs of cooperatives and merchants. Rural banks are privately owned and managed while
cooperative banks are owned by cooperatives or federation of cooperatives. As of March 2020, there were 455 rural and cooperative
banks (updated as of March 2020 on BSP’s Directory of Banks and Non-Banks).
During the past fifteen years, the Philippine banking industry has been marked by 2 major trends — the liberalization of the industry,
and mergers and consolidation. Foreign bank entry was liberalized in 1994, enabling foreign banks to invest in up to 60% of the voting
stock of an existing bank or a new banking subsidiary, or to establish branches with full banking authority. This led to the establishment
of 10 new foreign bank branches in 1995. The General Banking Law further liberalized the industry by providing that the MB may
authorize foreign banks to acquire up to 100% of the voting stock of one domestic bank. Under the General Banking Law, any foreign
bank, which prior to the effectiveness of the said law availed itself of the privilege to acquire up to 60% of the voting stock of a domestic
bank, may further acquire voting shares of such bank to the extent necessary for it to own 100% of the voting stock thereof.
The Bank faces competition from both domestic and foreign banks, in part, as a result of the liberalization of the banking industry by
the Government. Since 1994, a number of foreign banks, which have greater financial resources than the Bank, have been granted
licenses to operate in the Philippines. Such foreign banks have generally focused their operations on the larger corporations and selected
consumer finance products, such as credit cards. The foreign banks have not only increased competition in the corporate market, but
have as a result caused more domestic banks to focus on the commercial middle-market, placing pressure on margins in both markets.
Since September 1998, the BSP has been encouraging consolidation among banks in order to strengthen the Philippine banking system.
Mergers and consolidation result in greater competition, as a smaller group of “top tier” banks compete for business.
As of December 31, 2019, the 10 largest universal and commercial banks accounted for approximately 83.3% of total assets and 84.1%
of total deposits of the universal and commercial banking system based on published statements of condition.
Sources and Availability of Raw Materials and Names of Principal Suppliers
This is not relevant to the operations of the Bank.
Customer Concentration
The Bank has a diversified customer base and there is no concentration of business in major customer groups. As such, the Bank is not
dependent upon a single customer or a few customers.
34
Amount Spent on Research and Development Activities
The Bank’s research and development activities are mainly driven market research and process improvements. EastWest’s businesses
are heavily dependent on the ability to timely and accurately collect and process a large amount of financial and other information across
numerous and diverse markets and products at its various branches, at a time when transaction processes have become increasingly
complex with increasing volume.
The amount spent on research and development activities (in million pesos) and its percentage to revenues for the last 3 years has been
as follows:
Year Amount % of Revenue
2019 P=3.4 0.01%
2018 P=18.5 0.07%
2017 P=0.84 0.00%
1.4.4 Power Operations
The Group, through FDC Misamis, completed the construction of its 3 x 135 MW CFB clean ecoal thermal power plant in Mindanao.
Currently under operation, the plant has off-take agreements for 283 MW with 17 distribution utilities and 1 industrial customer in
Mindanao. The plant’s 3 units are fully operational with COC received in October 2016 for the first 2 units and in May 2017 for the
third unit.
To provide optimal availability and capacity and to protect the value of its asset, FDCUI has engaged the operations & maintenance
services of PIC Asia Pacific SDN (PIC) in October 2017. PIC is a world-class provider of project and plant required services and a
reliable source of highly skilled professionals. PIC is wholly owned subsidiary of Marubeni Corporation, a Fortune Global 500 company
and one of Japan’s largest companies.
Aside from its Mindanao power plant, FDCUI was awarded the appointment as an Independent Power Producer Administrator (IPPA)
by the Power Sector Assets and Liabilities Management Corporation (PSALM) of 40 strips of energy (equivalent to 40 MW) of the
Unified Leyte Geothermal Power Plant (ULGPP) in Tongonan, Leyte and the 100 MW output of the Mindanao I and II (Mt. Apo 1 and
2) Geothermal Power Plants in Kidapawan City, North Cotabato. It successfully assumed control of the power plants’ administration in
December 2014 and has effectively provided capacity allocation to all its contracted customers. The IPPA contracts for ULGPP and
Mt. Apo 1 and 2 were terminated on September 4, 2017 and December 28, 2017, respectively.
FDCUI, through its subsidiary FREE, is currently finalizing several contracts to install and operate solar rooftop facilities for various
commercial users.
Supply
As part of FDCUI’s fuel sourcing strategy, a continuous process of evaluation and inspection to pre-qualify nominated coal mine source/s
and potential suppliers is being implemented. To ensure security of supply and continuous operation of the power plant by providing
adequate and economic inventory level of quality fuel, a long term supply contract for a minimum of 5 to 10 years with suppliers to be
qualified based on its supply capability, reliability for timely delivery and track record of fulfilling their contractual obligation is being
finalized.
Retail Electricity Supply
FDCUI is also in the retail electricity supply business catering to contestable customers under the Retail Competition and Open Access
(RCOA) regime. In July 2016, FDC Retail Electricity Sales Corporation, a subsidiary of FDCUI, was awarded a Retail Electricity
Supply license from the Energy Regulation Commission (ERC), which allows it to act as an electricity supplier to consumers in the
retail market, such as hotels and other commercial businesses.
Corporate Social Responsibility (CSR) Programs
Committed to continuing the Gotianun tradition of making a difference in the lives of Filipinos, FDCUI through its subsidiary, FDC
Misamis, has been implementing social development programs in partnership with host communities. These programs promote
environmental stewardship, economic enrichment, enhanced health care initiatives, education for empowerment and help create a
positive impact on the communities surrounding the project site. These CSR activities, where employees also actively participate and
volunteer, are based on real needs of the community residents as determined through a socio-economic baseline study of the host and
affected villages.

35
Competition
The Department of Energy (DOE) is forecasting that the current oversupply situation in the country will persist in the medium term as
newly built power plants commence operation. Competition in the power industry is expected to become stiffer in the coming years
with the influx of more players, both local and foreign. The top 3 major players, which account for about 50% of the total generation
capacity in the country and have the most diverse portfolio consisting of natural gas, hydro, geothermal, coal, diesel, etc., continue to
dominate the power industry. Other large players also continue to expand their existing capacities. Nonetheless, attractive investment
opportunities remain available to FDCUI, especially for renewable energy projects, peaking as well as reserve capacities.
1.4.5 Sugar Business
FDC has a 100.0% ownership interest in PSHC which it acquired in 2007. PSHC wholly owns DSCC, which owns and operates a sugar
mill and a refinery in Guihing, Davao del Sur; CSCC, which owns and operates a sugar mill and refinery in Matalam, North Cotabato;
and HYSFC, which operates a corporate sugarcane farm in Mindanao. Sugarcane supply for DSCC and CSCC is sourced from HYSFC
and various contract farms in Mindanao. PSHC is the holding company of the sugar subsidiaries.
The following table sets forth a summary of key information of PSHC and its subsidiaries (or collectively referred to as the Sugar
Group):
Subsidiary Nature of Business Summary features
DSCC Manufacture of raw and refined sugar 6,000 tons cane per day raw sugar mill and 350 tons
day refinery
CSCC Manufacture of raw and refined sugar 5,500 tons per day raw mill and 250 tons per day
refinery
HYSFC Sugarcane farming Farms 1,105 hectares in Davao del Sur and North
Cotabato (as of October 1, 2019)
Sugar Production
Production Process and By-products
Raw sugar production process involves cane crushing, clarification and crystallization, and separation, and yields molasses and bagasse
as by-products. The molasses is sold and the bagasse is used to generate steam and electricity for the sugar production process. During
the crushing season, all of the Sugar Group’s power requirements are satisfied from bagasse it produces. The typical sugarcane material
balance is as follows: water – 73.0% to 76.0%, soluble solids 8.0% to 16.0%, recoverable sugar (sucrose) – 6.0% to 13.5%, other sugar
(fructose, glucose) – 1.5%, fibre – 11.0% to 16.0%, others – 1.0%, based on the Handbook of Cane Sugar Engineering.
Production Capacity and Output
For Crop Year (CY) 2018–19, the Sugar Group’s total sugarcane crushing capacity at its 2 sugar mills was 11,500 Tons of Cane per
Day (TCD). Sugar production is dependent on the quantity of sugarcane available for crushing and the recovery percentage of sugar
from sugarcane. Recovery percentages vary depending on the quality of the sugarcane and the efficiency of the recovery process.
PSHC’s crop year begins on October 1 of each year and ends on September 30 of the following year. Actual sugar production occurs
within this crop year. The duration of the crushing period which is based on the available cane supply generally determines the amount
of sugar that is produced.
The following table sets forth the volumes of sugarcane crushed and sugar produced at the Sugar Group’s mills for the past 3 crop years.
Sugarcane Crushed and Sugar production
DSCC CSCC Total
CY
2016-
2017
CY 2017-
2018
CY
2018-
2019
CY
2016-
2017
CY
2017-
2018
CY 2018-
2019
CY
2015-
2016
CY
2017-
2018
CY
2018-
2019
Sugarcane
Crushed
(‘000 MT)
417.0 426.3 364.5 495.1 522.5 494.0 912.1 948.8 858.5
Sugar Production
(‘000 MT)
37.6 38.0 36.2 42.6 48.6 49.7 80.2 86.6 85.9
Average Recovery
rate (% of
sugarcane
crushed)
9.1 8.7 10.0 9.1 9.2 10.1 9.1 9.0 10.0

36
The decrease in the Group’s sugarcane harvest during CY2018-19 compared with CY2017-18 was attributable mainly to the unfavorable
weather condition (El Niño) during the growing months. Most of the cane farms are not irrigated so that the lack of rains in the district
will usually result to lower farm yield.
However, the frequent rains during the milling season affected cane quality resulting to lower sugar yield. Cut canes were exposed to
elements while waiting for trucks to get into the field for hauling. Trucks had to wait for the fields to dry enough before they enter
and haul the canes. The shortage of manual canecutters aggravated the situation because the mill suffered from frequent stoppage
because volume of canes delivered cannot sustain continuous milling.
Raw and Refined Sugar Production
The Group has decided to mothball the CSCC refinery so that it can concentrate on maximizing its raw sugar efficiency and therefore
can better compete with the Bukidnon mills in attracting sugar cane planters in areas accessible to both the CSCC and the Bukidnon
mills. The depressed margin for refined sugar due to VAT and the soft demand for refined sugar due to the shift of certain major
industrial users to the cheaper high fructose corn syrup has made it more beneficial to concentrate on improving raw sugar recovery. As
there are loyal local clients for refined sugar and to maintain the skills of the refinery personnel, PSHC still want to produce refined
sugar but out of the DSCC facility only. For CY 2017-18, however, the frequent rains and the problem of canecutter shortage prevented
accumulation of enough bagasse to produce refined sugar efficiently so after producing about 4,000 bags, it decided to stop refining.
The following table sets out the breakdown of sugar sales between raw and refined sugar of the Group.
Sugar Sales (‘000 MT)
CY 2016-17 % of Total CY 2017-18 % of Total CY 2018-19 % of Total
Raw sugar 59.3 98.9% 83.8 97.0% 73.8 96.5%
Refined sugar 0.7 1.1% 2.4 3.0% 2.7 3.5%
Total 60.0 100.0% 86.2 100.0% 76.5 100%
Molasses and Bagasse Production
The yield of molasses per metric ton of sugarcane crushed is approximately 5.0%, or 47.0 kilos, most of which the Group sells to traders
in the domestic market. Molasses can be used to produce ethanol. Each metric ton of sugarcane that Sugar Segment crushes also
produces approximately 33.0%, or 330.0 kilos of bagasse, which is fed to a boiler as fuel to produce steam which is then used to generate
power necessary for the sugar production process.
Customers and Markets
The Group sells its raw and refined sugar primarily to traders who then sell sugar to end-customers in the Philippines. End customers
include wholesalers and retailers as well as food and beverage companies.
The following table sets forth the breakdown of the Group’s sales of sugar to traders and industrial users.
% of Total Sugar Sold
CY 2016-17 CY 2017-18 CY 2018-19
Traders 100.0% 100.0% 100.0%
Industrial users 0% 0% 0%
Sales and Distribution
For 2019, the Group’s revenues from sugar operations amounted to P3,367.9 million compared to P3,287.2 million for 2018.
The following table sets out the Group’s sales of sugar by destination as a percentage of total sales.
CY 2016-17 CY 2017-18 CY 2018-19
Mindanao 52% 44% 44%
Luzon 12% 4% 12%
Visayas 21% 46% 40%
Export Sales (primarily to U.S.) 15% 6% 4%
Sugar segment sells the majority of its production in the wholesale market to traders. To mitigate the risk of non-payment, sugar segment
generally dispatches orders only after it receives payment although it extends credit in limited circumstances to large customers whom
it believes have a strong credit record. Credit terms generally do not exceed 90 days. Increasingly, sugar segment does not have written
contractual agreements with its traders, and they do not sell its sugar exclusively. Customers typically obtain delivery of the sugar at the
mills and are responsible for transport, packaging and handling. In addition, Sugar segment has an internal sales team to sell and market

37
its sugar. Sugar segment also sells its sugar to industrial buyers. Sugar segment aims to increase its industrial customer base and expand
sales in the Luzon region and other areas of the country outside its core market in Southern Mindanao.
Raw Material
Sugarcane is the principal raw material used in the production of sugar. The climate and topography of the southern Philippine regions
of the Visayas and Mindanao are ideal for growing sugarcane. According to Sugar Regulatory Administration (SRA) Production
Bulletin dated August 31, 2019 Mindanao accounted for 19.8% of the Philippines’ sugarcane production in CY 2018-19.
Sugarcane is delivered by farmers to DSCC and CSCC for milling and, in return, the farmers receive a portion of the sugar produced.
As a result, DSCC and CSCC do not record any costs for the sugarcane. The Group sources approximately 90% of its sugarcane from
approximately 6,000 contract farmers within proximity to the DSCC and CSCC factories, and the remainder is supplied by PSHC’s
corporate farm, HYSFC.
Sugar segment generally enters into milling contracts with its contract farmer for terms of 15 years. Under a typical milling contract
the farmer agrees to deliver all sugarcane grown on a specified area of land to the mills during the milling season, and is obligated to
deliver a minimum volume of sugarcane or cultivate sugarcane on a minimum area of land. The time of delivery is based on a delivery
program which is determined on the basis of the age of the sugarcane crops. Typically, the farmer receives approximately 62.0% of the
raw sugar and molasses from the raw sugar produced by the mill, with the remainder being retained by the mill. The mills issue a
receipt, or quedan, to each farmer that specifies the amount of sugar or molasses that is due to the farmer. Upon presentation of the
receipt, the farmer can withdraw the sugar or molasses from the warehouses at the mill. Approximately 50.0% to 60.0% of the farmers
sell their share of sugar and molasses to the mills. Each of mills manage their sugarcane farmers through a designated cane supply office
which has crop advisors and management programs in place to train, manage and support farmers with technical advice for best farming
practices. In addition to farmer training and seminars, the cane supply office provides financial assistance programs, including subsidies
and loans for crops, cane points, fertilizer and tractors.
Insurance
Sugar segment maintains insurance covers for all its inventory of sugar, packing material, consumables, buildings, machineries and
equipment in all its mills and facilities, against fire, lightning, earthquakes, storms, floods and allied perils.
Sugar group does not anticipate having any difficulties in renewing any of its insurance policies and believes that its insurance coverage
is consistent with industry standards in the Philippines.
Competition
According to the SRA Production Bulletin dated August 31, 2019, as of CY2018-19, there were 28 operating sugar mills in the
Philippines with an aggregate raw sugar production of 2,074.1 million MT. These mills are located in the Luzon, Visayas and Mindanao
regions. There are 4 sugar mills in Mindanao, including DSCC and CSCC.
The following table below sets out the amount of sugarcane crushed and the quantity of sugar produced by PSHC compared to its main
competitors in Mindanao in CY 2018-19.
Sugarcane crushed (‘000 MT) Sugar production (‘000 MT)
PSHC 858 86
Bukidnon Sugar Central 1,646 170
Crystal Sugar Central 1,509 155
Total 4,013 411
Source: SRA Production Bulletin dated August 31, 2019
Sugar prices during CY 2018-19 were lower than in 2017-18 by P3.6/bag. Refined sugar prices were higher in CY 18-19 than in
CY 17-18 by P188.0/bag (VAT-inclusive).
1.5 Intellectual Property of the Group
Banking and Financial Services
In 1994, EW obtained a Certificate of Registration and bank license from the Philippine SEC to operate under the corporate name “East
West Banking Corporation.” EW uses a variety of names and marks, including the name “East West Banking Corporation” and EW’s
logo, in connection with its business. The Bank has registered such names and marks with the Intellectual Property Office (IPO) of the
Philippines. On January 25, 2012, the Bank obtained a certification from the BSP on a U.S.-based bank using a similar name. As
certified by the BSP, the U.S.-based bank has not been issued a license to operate as a banking institution in the Philippines. The BSP
also certified that the Bank is among the commercial banks it supervises. On October 10, 2013, the IPO of the Philippines issued a
38
decision in favor of the Bank, cancelling the mark “EAST WEST BANK & COMPASS LOGO” previously registered in the name of a
U.S.-based bank.
Real Estate
The “Filinvest” trademark was registered with the IPO on September 15, 2011. “Filinvest” is the brand FLI uses for the names of certain
real estate products and for trademarks relating to the “FLI” brand. Below are FLI service marks registered with the IPO:
TRADEMARK
DATE OF
REGISTRATION TRADEMARK
DATE OF
REGISTRATION
One Oasis 10 Dec 2009 Meridian Place 08 Sept 2016
One Oasis Ortigas 10 Dec 2009 Alta Spatial 30 Sept 2016
One Oasis Ortigas & Design 10 Dec 2009 Kembali Coast 30 Sept 2016
We Build the Filipino Dream (Slogan) 10 Dec 2009 The Tropics 30 Sept 2016
The Linear Makati & Design 12 Aug 2010 Maui Oasis 20 Oct 2016
Filinvest (New Logo) 15 Sept 2011 Ashton Fields 03 Nov 2016
Studio A 20 Dec 2012 Sandia Homes 24 Nov 2016
The Signature 17 Apr 2014 Valle Alegre 24 Nov 2016
Fortune Hill 22 May 2014 Valle Dulce 24 Nov 2016
Fora Rotunda Tagaytay 14 Aug 2014 Havila 08 Dec 2016
The Leaf 20 Nov 2014 Princeton Heights 08 Dec 2016
Vinia 20 Nov 2014 Asenso Village 29 Dec 2016
Citi di Mare 25 Dec 2014 Hampton Orchards 29 Dec 2016
One Binondo 12 Feb 2015 Tierra Vista 29 Dec 2016
I-Go 20 Feb 2015 Blue Isle 19 Jan 2017
Bali Oasis 26 Feb 2015 Palmridge 19 Jan 2017
Bali Oasis 2 26 Feb 2015 Cyberzone Properties, Inc. 16 Feb 2017
Citi di Mare (Logo and Tagline) 26 Feb 2015 Spring Heights 27 April 2017
Kembali 26 Feb 2015 The Enclave at Filinvest
Heights 27 Apr 2017
One Spatial 26 Feb 2015 Filinvest International 04 May 2017
Serulyan Mactan 26 Feb 2015 The Filinvest IT Zone 11 May 2017
Capri Oasis 05 Mar 2015 8 Spatial 22 June 2017
Timberland Heights (Horizontal
Orientation) 14 May 2015 Ciudad de Calamba 06 July 2017
Timberland Heights (Stacked
Orientation) 14 May 2015 Verde Spatial 06 July 2017
Kembali (Reversed Logo) 25 June 2015 One Filinvest 14 July 2017
The Glades 09 July 2015 Marina Town 30 July 2017
100 West 23 July 2015 The Levels 30 July 2017
Activa 13 Aug 2015 Marina Spatial 10 Aug 2017
The Veranda 27 Aug 2015 Grand Cenia Residences 17 Aug 2017
Studio 7 12 Nov 2015 Sanremo Oasis 17 Aug 2017
Umi Garden Suites 11 Feb 2016 East Spatial 24 Aug 2017
The Enclave Alabang 11 Feb 2016 Phuket Oasis 24 Aug 2017
Filinvest (Reversed Logo) 24 Mar 2016 Sorrento Oasis 24 Aug 2017
Filinvest Premiere 24 Mar 2016 Studio Zen 24 Aug 2017
Futura 24 Mar 2016 Austine Homes 14 Sept 2017
The Ranch 12 May 2016 Palm Estates 14 Sept 2017
The Prominence 26 May 2016 Filinvest Futura 07 Dec 2017
Aldea Real 07 July 2016 Filinvest Prestige 07 Dec 2017
Filinvest Technology Park 07 July 2016 Futura by Filinvest 07 Dec 2017
La Brisa Townhomes 07 July 2016 Prestige by Filinvest 07 Dec 2017
Montebello 07 July 2016 Brentville International 17 Dec 2017
Punta Altezza 07 July 2016 New Leaf 04 Jan 2018
Springfield View 07 July 2016 The Wood Estates 18 Jan 2018
The Glens 07 July 2016 Asiana Oasis 15 Feb 2018
Vista Hills 07 July 2016 Ventura Real 29 Mar 2018
Woodville 07 July 2016 Nature Grove 19 Apr 2018

39
TRADEMARK
DATE OF
REGISTRATION TRADEMARK
DATE OF
REGISTRATION
Panglao Oasis 14 July 2016 Belize Aspire 19 Apr 2018
Amare Homes 04 Aug 2016 Southwind 12 July 2018
Nusa Dua 04 Aug 2016 Centro Spatial 02 Sept 2018
Pine View 04 Aug 2016 Laeuna de Taal 14 Feb 2019
Santoso Villas 04 Aug 2016 Amalfi 14 Feb 2019
Blue Palm Estate 11 Aug 2016 Futura East 02 Sept 2018
Bluegrass County 11 Aug 2016 Futura Tierra 02 Sept 2018
Pueblo Solana 11 Aug 2016 Manna East by Filinvest 04 Oct 2018
Summerbreeze 11 Aug 2016 Futura Vinta 02 June 2019
Savannah Fields 01 Sept 2016 Belize Oasis 02 June 2019
Park Spring 02 Nov 2017 Futura Centro 16 May 2019
Aspire by Filinvest 07 Dec 2017 venti-lite 08 Feb 2020
Filinvest Aspire 07 Dec 2017 Filinvest Gaia New Clark City 08 Feb 2020
FLI has pending applications with the IPO for the following trademarks:
Eastbay Palawan
Studio City
Filinvest Cyberzone
Ecotechture
Columna
Studio N (trademark)
Studio N (tradename)
The Company has likewise filed an application with the World Intellectual Property Office (WIPO) for the international registration of
the “Filinvest” trademark under the Madrid Protocol. Accordingly, “Filinvest” is now registered in the following countries:
COUNTRY DATE REGISTERED
Malaysia 04 Mar 2015
United States of America 08 Mar 2016
Qatar 15 May 2016
Kuwait 04 Sept 2016
United Arab Emirates 22 Mar 2017
Thailand 22 May 2017
Singapore 24 August 2017
Japan 22 June 2018
Taiwan 01 July 2018
Cambodia 19 July 2018
Hong Kong 24 Aug 2018
China 21 September 2018 (Class 37);
14 October 2018 (Class 42);
28 October 2018 (Class 42);
Korea 19 Nov 2018
Statements of Certificate of Protection of the “Filinvest” trademark have also been issued by the following countries:
COUNTRY DATE
United Kingdom 14 April 2015
Australia 01 July 2015
Denmark 14 Sept 2015
Norway 16 Sept 2015
Switzerland 11 Dec 2015
Austria 16 Aug 2018
Benelux 20 Aug 2018
Sweden 14 Nov 2018

40
Hospitality
Below are the Hospitality Group’s trademarks registered with the IPO:
TRADEMARK DATE OF REGISTRATION
Crimson Hotels & Resorts -
Philippines June 24, 2010
Crimson & Design - Philippines July 22, 2010
Crimson and Device - Singapore March 21, 2012
Crimson and Device - Vietnam June 18, 2012
Crimson & Logo - Thailand October 24, 2012
Score Sports Bar November 27, 2014
Tempo November 27, 2014
Aum Spa & Wellness Center March 26, 2015
Saffron Café April 9, 2015
Azure October 8, 2015
Azure Rock Bar October 8, 2015
Azure Sky Bar October 8, 2015
Azure Sunset Bar October 8, 2015
Chroma Live Vivid November 26, 2015
Crimzone Active Kids December 3, 2015
Art Cebu January 1, 2016
Art Palawan January 1, 2016
Art Bohol January 21, 2016
Art Boracay January 21, 2016
Chroma Driven Hospitality January 21, 2016
Locale Hostel January 21, 2016
Azure Beach Club March 8, 2018
Charley’s October 27, 2016
Chroma Hospitality and Device October 27, 2016
Chroma Leisure and Device October 27, 2016
Art Banawe November 3, 2016
Art Quezon City November 10, 2016
Mimosa November 24, 2016
Azure Beach Club (Old Logo) April 13, 2017
In a Heartbeat November 9, 2017
Quest Serviced Residences November 18, 2017
Grafik November 9, 2017
Graphic February 15, 2018
Grafik Nude August 22, 2019
Alabang. in a Heartbeat March 8, 2018
Boracay. in a Heartbeat February 15, 2018
Alitaptap November 21, 2019
Azure Beach Club (New Logo) March 8, 2018
Cebu in a Heartbeat May 17, 2018
Filinvest Hospitality August 3, 2017
Mactan. in a Heartbeat March 8, 2018
Alibi Bar + Lounge April 4, 2019
Baker J March 17, 2019
Quest April 7, 2011
Manila. in a Heartbeat February 15, 2018
Azure Deck Bar August 18, 2016
Quest Plus May 23, 2019
Pulse May 23, 2019

41
The Hospitality Group has pending applications with the IPO for the following trademarks:
Art Manila Canvas - Philippines Canvas - China
Canvas - Hongkong Canvas - Thailand Canvas Hotels - Hongkong
Canvas Hotels - Philippines Canvas Hotels - Singapore Canvas Resorts - Philippines
Canvas Hotels - Thailand Canvas Hotels - China Canvas Resorts - Thailand
Canvas Resorts - Singapore Canvas Resorts - Hongkong Crimson. in a Heartbeat
Filinvest. City in a Heartbeat Art Alabang Firehouse Pizza
Grafik Hotels & Resorts Canvas - Singapore Chroma Hospitality
Balai at Dauin Crimson Resort & Spa Boracay Crimson Resort & Spa Mactan
Dive Tribe Dive Center Manila Bar ÑYE
1.6 Government Regulations and Environmental Laws
Banking and Financial Services
Need for Government Approval of Principal Products or Services
The Bank’s principal products and services are offered to customers only upon receipt of the necessary regulatory approvals or
clearances. The Bank strictly complies with the related regulatory requirements such as reserves, liquidity position, loan exposure limits,
cap on foreign exchange holdings, provision for losses, anti-money laundering provisions and other reportorial requirements.
Effect of Existing or Probable Governmental Regulations on the Business
The Bank strictly complies with the BSP requirements in terms of capitalization reserves, liquidity position, limits on loan exposure,
cap on foreign exchange holdings, provision for losses, anti-money laundering provisions and other reportorial requirements as well as
other regulatory agencies such as the SEC, PSE, Philippine Deposit Insurance Corporation and the Bureau of Internal Revenues, among
others.
Real Estate
The real estate business in the Philippines is subject to significant government regulations over, among other things, land acquisition,
development planning and design, construction and mortgage financing and refinancing.
After the project plan for subdivision is prepared, FLI applies for a development permit with the local government. If the land is
designated agricultural land, FLI applies with the Department of Agrarian Reform (DAR) for a Certificate of Conversion or Exemption,
as may be proper. A substantial majority of FLI’s existing landbank is subject to the DAR conversion process. Approval of development
plans is conditioned on, among other things, completion of the acquisition of the project site and the developer’s financial, technical and
administrative capabilities. Approvals must be obtained at both the national and local levels. Evidently, FLI’s results of operations are
expected to continue to be affected by the nature and extent of the regulation of its business, including the relative time and cost involved
in procuring approvals for each new project, which can vary for each project.
The real estate companies are also subject to the application of the Maceda Law, which gives purchasers of real property purchased on
an installment basis certain rights regarding cancellations of sales and obtaining refunds from developers.
The Group believes that the real estate business has complied with all applicable Philippine environmental laws and regulations.
Compliance with such laws, is not expected to have a material effect on FLI’s capital expenditures, earning or competitive position.
Power Business
The Electricity Power Industry Reform Act (EPIRA), which brought about the changes needed in the power industry since the
National Power Corporation (NPC) was established in 1936, is now on its 17th year of implementation. EPIRA was enacted to overhaul
the power industry. Among its goals are (1) the deregulation of the generation sector; (2) creation of a government-owned transmission
company and the eventual privatization of the operation of the transmission system; (3) unbundling of supply activities from the
regulated distribution sector; (4) elimination of cross-subsidies within and among various grids, and among various classes of consumers;
(5) Creation of an independent regulatory body ERC and a Joint Congressional Power Commission to oversee implementation of the
law. The EPIRA also called for the privatization and sale of NPC assets and contracts with Independent Power Producers (IPPs) which
would help the government pay off NPC’s debts and invite the participation of private sector in the industry, crea tion of a wholesale
electricity spot market for the trading of energy and the implementation of retail competition and open access.

42
Renewable Energy (RE) Act of 2008. The RE Law aims to accelerate the development and use of renewable energy resources and
reduce the country’s dependence on fossil fuels. The law provides for a set of incentives to RE businesses such as income tax holiday
(ITH), duty-free importation and special realty tax rates on equipment and machinery, corporate tax rate of 10% after seven years of
ITH and zero percent value added tax rate on the sale of fuel or power generated from RE.
The RE Law also creates the Renewable Portfolio Standards which sets a minimum percentage of generation from eligible RE resources
and the Feed-in Tariff System, which determines the fixed tariff to be paid to electricity from emerging RE technologies and gives
priority connection, purchase and transmission of electricity generated from RE.
ERC. The enactment of the EPIRA law created the ERC to replace the Energy Regulatory Board. The ERC is an independent regulatory
body with quasi-judicial, quasi-legislative and administrative functions in the electric industry. The primary responsibilities of the ERC
are to ensure consumer education and protection and to promote competitive operations in the electricity market.
DOE. The DOE was created under Republic Act (RA) 7638 in 1992. Its mandate is to “prepare, integrate, coordinate, supervise and
control all plans, programs, projects and activities of the Government relative to energy exploration, development, utilization,
distribution and conservation”. The DOE has developed a 10-year Philippine Energy Plan with the goal of enhancing energy
security/independence and implementing market sector reforms to enable a more efficient sector’s operation and ensure proper supply
of a growing energy demand.
Hospitality Operations
Need for Government Approvals on Services
Rules and regulations to govern the accreditation of hotels, tourists inns, motels, apartels, resorts, pension houses and other
accommodation establishments pursuant to the provisions of Executive Order (EO) 120 in relation to RA No. 7160, otherwise known
as the Local Government Code of 1991 on the devolution of Department of Tourism’s (DOT) regulatory function over tourist
establishments have promulgated governing rules and regulations.
The DOT may issue an accreditation in favor of a hotel and resort, certifying that the establishment is recognized as having complied
with the DOT’s minimum standards of operation and that the establishment will ensure the safety, comfort and convenience of tourists.
Environmental Laws
The operation of the resorts operated by the Group and any further development thereon require an Environmental Compliance
Certificate (ECC) issued by the DENR, certifying that:
(a) The proposed project will not cause significant negative environmental impact; and
(b) The project proponent has complied with all the requirements of the Environmental Impact Statement (EIS) System and has
committed to implement its approved Environmental Management Plan (EMP).
An ECC contains specific measures and conditions with which that the project proponent undertakes to comply before and during the
operation of the project, and where applicable, during the project’s abandonment phase for the purpose of mitigating the project’s impact
to the environment. An EIS is a document prepared and submitted by the project proponent or an Environmental Impact Assessment
Consultant that serves as an application for an ECC, which includes a comprehensive study of the significant environmental impact of
the project and an EMP that the project proponent will fund and implement. An EMP details the prevention, mitigation, compensation,
contingency and monitoring measures that the project proponent intends to undertake to enhance the positive impact and to minimize
the negative effect of a proposed project.
To determine whether or not a project requires an ECC, the following factors are considered: (a) the nature of the project and its potential
to cause significant negative environmental impacts, and (b) the sensitivity or the vulnerability of environmental resources in the project
area.
Any project not covered by the EIS System may be covered by a Certificate of Non-Coverage from the EMB as proof that no ECC is
required for its commencement. An ECC of a project must be implemented within 5 years from the date of issuance, reckoned from the
date of ground breaking based on the project proponent’s work plan submitted to the EMB. An ECC not implemented within said period
will be deemed expired. A new ECC must be secured by the project proponent from the EMB should the project proponent intend to
pursue the project.
In the event that the project proponent abandons a project covered by an ECC, the project proponent must inform the EMB of such
abandonment; otherwise, the project proponent must continue to comply with the conditions of the ECC. Any abandonment of or
decommissioning plan over a project covered by an ECC will be subject to the prior approval of the EMB, which plan must be submitted
to the EMB at least 6 months prior to the intended abandonment/decommissioning. The implementation of such
abandonment/decommissioning will be verified by the EMB.

43
Sugar Operations
Environment
The sugar production process generates waste such as soot and dust, water and solid materials as well as noise at various stages of the
production process. The Group aims to develop its business without compromising environmental protection. The primary waste
produced in Group’s sugar segment’s production facilities is bagasse, which is fed to a boiler as fuel to produce steam which is then
used to generate power necessary for the sugar production process. In addition, water treatment and scrubber systems are installed in
PSHC’s production facilities to control wastewater discharge and clean waste gases that are emitted during the production process.
PSHC has obtained all environmental licenses from the relevant authorities in the Philippines that are necessary to conduct its business.
The environmental licenses obtained by PSHC are annually renewed. As of this date, PSHC has not been subject to any material fines
or legal action involving non-compliance with any relevant environmental laws and regulations in the Philippines.
Sugar Regulatory Administration
In 1986, EO 18 dated May 28, 1986 created the SRA. The SRA has the following powers and functions: (i) to recommend the
establishment of a sugar production, coefficient and production quota which is attached the land for each planter; (ii) to institute
regulations for implementing, controlling and monitoring the production quotas; (iii) to establish domestic, export and reserve
allocations; (iv) to explore and expand the domestic market and foreign markets for sugar and its by-products; (v) to assure mutual
benefits to consumers and producers, to promote and maintain proper balance of production of sugar and its by-products; (vi) to institute,
implement and regulate an orderly system of Quedanning, disposition and withdrawals of various forms of sugar from warehouses; (vii)
to evaluate and recommend to the President new projects involving the production of sugar and its by-products and other products
derived from sugarcane and sugar; (viii) to issue permits and licenses and collect corresponding fees and levies on the processing and
manufacture of sugar and its by-products and other products derived from sugarcane and sugar; (ix) to enter, make and execute routine
contracts that may be necessary for, or incidental to, the attainment of its purposes between any persons, firm, public or private, and the
Government; and (x) to do all such other things, transact such other businesses and perform such functions directly or indirectly
necessary incidental or conducive to the attainment of the purposes of the SRA.
All corporate powers of the SRA are vested in, and exercised by, the Sugar Board, which has the power, among others: (i) to establish
policies pertaining to sugar and sugarcane production control and Quedanning of sugar produced; withdrawals from sugar warehouses;
issuance of permits and licenses in the processing and manufacture of raw sugar, refined and other classes of sugar; issuance of permits
and licenses and other related issues pertaining to the specific and general powers prescribed in EO 18; and (ii) to enter into contracts,
transactions, or undertakings of whatever nature which are necessary or incidental to its functions and objectives.
Under EO 338 dated January 10, 2001, the SRA became an attached agency of the DA. Under Memorandum Order No. 134 dated
February 9, 2004, the Philippine Department of Finance and its attached bureaus, particularly, the Philippine Bureau of Customs (BOC)
and the BIR, were mandated to consult and coordinate with the SRA in the determination of the appropriate classification of sugar
products for certain purposes including, but not limited to, imposing the proper import duties, and/or assessing value added or other
taxes thereon. The BOC is required to notify the SRA in case of any importation, exportation or withdrawal from customs bonded
warehouses, of sugar, and all forms thereof, prior to their release and allow the SRA to inspect the shipment or warehouse to verify
compliance with its rules and regulations. The entry to and exit from special economic zones of sugar products is also covered by
Memorandum Order No. 134.
Sugar, molasses, and muscovado traders and processors of sugar-based products for export are required to register with the SRA pursuant
to SRA Order No. 006 dated June 24, 2005. Moreover, importers and exporters are required to secure a clearance from the SRA for the
export of sugar and molasses and the importation of refined sugar, raw sugar and molasses.
The SRA periodically issues a list of sugar traders registered with the SRA for a particular crop year and only persons and entities duly
registered with the SRA as sugar traders are authorized to withdraw sugar for export and domestic use from the warehouses of mill
companies and sugar refineries in accordance with the existing rules and regulations promulgated by the SRA. Sugar producers are
allowed to withdraw their respective shares of their own sugar production from mill and refinery warehouses for domestic consumption
in the Philippines only.
The SRA also issues a listing of registered molasses and muscovado traders with the SRA for a particular crop year and only persons
and entities duly registered with the SRA as molasses traders are authorized to withdraw molasses for export and domestic use from the
storage tanks of mill companies and sugar refineries in accordance with the existing rules and regulations promulgated by the SRA.
Sugar producers are allowed to withdraw their respective shares of their own molasses production from mill and refinery warehouses
for domestic consumption in the Philippines only.

44
1.7 Employees and Labor
As of December 31, 2019, FDC’s 12,676 employees (including 26 consultants) categorized by function are as follows:
As of
December 31, 2019
Real Estate
Operations ........................................................................................................... 332
Administrative and Support ................................................................................ 1,385
Technical ............................................................................................................. 403
Marketing ............................................................................................................ 131
Total ....................................................................................................................... 2,251
Hospitality Operations
Operations .......................................................................................................... 1,554
Administrative and Support................................................................................ 231
Technical ............................................................................................................ 179
Marketing ........................................................................................................... 72
Total ....................................................................................................................... 2,036
Banking and Financial Services
Operations ........................................................................................................... 5,042
Administrative and Support ................................................................................ 204
Technical ............................................................................................................. 210
Sales and Marketing ............................................................................................ 1,942
Total ....................................................................................................................... 7,398
Sugar Operations
Operations ........................................................................................................... 436
Administrative and Support ................................................................................ 79
Technical ............................................................................................................. 56
Marketing ............................................................................................................ 3
Total ....................................................................................................................... 574
Power Operations
Operations .......................................................................................................... 20
Administrative and Support................................................................................ 64
Technical ............................................................................................................ 162
Marketing ........................................................................................................... 26
Total ....................................................................................................................... 272
Others
Operations .......................................................................................................... 68
Administrative and Support................................................................................ 56
Technical ............................................................................................................ 20
Marketing ........................................................................................................... 1
Total ....................................................................................................................... 145
FDCUI expects to increase the number of its employees to support the efficient operation of its 405 MW CFB coal plant. To support
the growing hospitality segment, FHC also expects to increase its headcount in subsequent year.
The sugar segment provides canteen facilities, medical clinic and other benefits to its employees. Sugar Group has a retirement plan for
its regular employees. Most of DSCC’s employees are members of the trade union Nagkahiusang Mamumuo sa DASUCECO, which
is affiliated with the Philippine National Federation of Labour. The collective bargaining agreement between DSCC and the National
Federation of Labour was renewed effective July 1, 2015. The current labor union has been representing DSCC’s rank and file workers
for more than 30 years and has had not experienced work disruptions even when negotiations were not proceeding smoothly. While
negotiations sometimes resulted to deadlock on the issue of wages and signing bonus, Management does not anticipate disruption in
operations. The requirement of allocating a certain volume of production for exports is also an advantage because it gives producers
governmental protection from work disruption. CSCC’s and HYSFC’s employees are not covered by trade unions or collective
bargaining agreements.

45
The Group provides managers, supervisors and general staff the opportunity to participate in both in-house and external training and
development programs which are designed to help increase efficiency and to prepare employees for future assignments. The Group has
also provided a mechanism through which managers and staff are given feedback on their job performance, which the Group believes
will help to ensure continuous development of its employees’ knowledge base. The Group also offers employee benefits and salary
packages that it believes are in line with industry standards in the Philippines and which are designed to help it compete in the
marketplace for quality employees. It is The Group’s goal to position itself as an employer of choice in the Philippines.
1.8 Major Risks, Risk Management, Strengths and Strategies
The growth and success of the Group depends on its ability to understand and respond to the challenges of an uncertain and changing
world. This uncertainty generates risk which is among the critical issues that should be undertaken in ensuring the best performance in
the organization. By understanding and managing risk, the Group provides greater certainty and confidence for all the stakeholders.
Real Estate
There are major risk factors that may affect real estate or its operations. Property values in the Philippines are influenced by the general
supply and demand of real estate as well as political and economic developments in the country. In the event new supply exceeds demand
as a result of economic uncertainty or slower growth, political instability, or increased interest rates, the financial condition and results
of operations of real estate will be materially affected.
Demand for, and prevailing prices of, developed land and house and lot units are directly related to the strength of the Philippine
economy (including overall growth levels and interest rates), the overall levels of business activity in the Philippines and the amount of
remittances received from OFWs. Demand for real estate’s housing and land developments is also affected by social trends and changing
spending patterns in the Philippines, which in turn are influenced by economic, political and security conditions in the Philippines. The
residential housing industry is cyclical and is sensitive to changes in general economic conditions in the Philippines such as levels of
employment, consumer confidence and income, availability of financing for property acquisitions, construction and mortgages, interest
rate levels, inflation and demand for housing.
The demand for real estate’s projects from OFWs and expatriate Filipinos may decrease as a result of the following possibilities, i.e.
reduction in the number of OFWs, the amount of their remittances and the purchasing power of expatriate Filipinos. Factors such as
economic performance of the countries and regions where OFWs are deployed, changes in Government regulations such as taxation on
OFWs’ income, and, imposition of restrictions by the Government/other countries on the deployment of OFWs may also affect the
demand for housing requirements.
There are risks that some projects may not attract sufficient demand from prospective buyers thereby affecting anticipated sales.
Stringent government requirements for approvals and permits of new projects may take substantial amount of time and resources. In
addition, the time and the costs involved in completing the development and construction of residential projects can be adversely affected
by many factors, including unstable prices and supply of materials and equipment and labor, adverse weather conditions, peso
depreciation, natural disasters, labor disputes with contractors and subcontractors, accidents, changes in laws or in Government priorities
and other unforeseen problems or circumstances. Further, the failure by the real estate segment to substantially complete construction
of a project to its planned specifications or schedule may result in contractual liabilities to purchasers and lower returns.
Real estate’s cost of sales is affected by volatility in the price of construction materials such as lumber, steel and cement. While real
estate, as a matter of policy, attempts to fix the cost of materials component in its construction contracts, in cases where demand for
steel, lumber and cement are high or when there are shortages in supply, the contractors it hires for construction or development work
may be compelled to raise their contract prices. As a result, rising cost of any construction materials will impact real estate’s construction
costs, and the price for its products. Any increase in prices resulting from higher construction costs could adversely affect demand for
real estate’s products and the relative affordability of such products as compared to competitors’ products. This could reduce real estate
sales.
Real estate is also exposed to risks associated with the ownership and operation of its investment properties. Financial performance of
real estate’s leasing segment, could be affected by a number of factors, including:
1. the national and international economic climate;
2. changes in the demand for call center and other BPO operations as well as gaming operations in the Philippines and around
the world;
3. trends in the Philippine retail industry, insofar as retail malls are concerned;
4. changes in laws and governmental regulations in relation to real estate, including those governing usage, zoning,
environment, taxes and government charges;
5. the inability to collect rent due to bankruptcy of tenants or otherwise;
6. competition for tenants;
7. changes in market rental rates;

46
8. the need to periodically renovate, repair and re-let space and the costs thereof;
9. the quality and strategy of management; and,
10. FLI’s ability to provide adequate maintenance and insurance.
On known trends, events or uncertainties that have had or are reasonably expected to have favorable or unfavorable impact on net
sales or revenues or income from continuing operations of real estate, the Covid-19 global pandemic which started to occur in the
Philippines in January of 2020 and accelerated by March has caused disruptions in real estate’s operations. On March 15, the
Philippine government implemented a “Community Quarantine” in Metro Manila. On March 16, 2020, the government expanded the
scope with an “Enhanced Community Quarantine” in the entire Luzon which effectively restricted movement and mandated the
temporary closure of non-essential shops and businesses. The company expects that these developments are unfavorable to real
estate’s overall financial performance as follows:
1. Decline in presales for both the domestic and the OFW market
2. Decline in revenues from our retail operations as a result of decline in foot traffic and temporary suspension of mall
operations except for outlets offering basic services like supermarkets, banks and healthcare centers, as mandated by the
government.
3. Delay in the completion of housing and office and retail buildings
4. Pre-leasing and occupancy of new buildings will be lower than expected
5. Some tenants might reduce or in worst case, pre-terminate space to adopt a work-from-home scheme or other flexible
working arrangements.
6. Possible cancellation of lease negotiations for either new space or expansion due to internal business decision of the client.
Hospitality
• Management of land bank, including area concentration within the land bank, could adversely affect margins due to changes in the
market value of land and significant changes in economic, political, security or market conditions;
• Increased competition with other developers for land has made suitable parcels of land more expensive and difficult to acquire;
• Increased competition in the hospitality industry, for example new supply in the markets within which the Company operates in or
will operate in, which could negatively affect the Group’s resort hotel’s occupancy;
• Obtaining regulatory permits, licenses and approvals can take a significant amount of time which could adversely delay or hinder
the development and operation of the projects;
• Obtaining required Government approvals and permits may take substantially more time and resources than anticipated or
construction of projects may not be completed on schedule and within budget;
• Infringement of Hospitality’s intellectual property rights;
• Success of the hospitality businesses depends on its ability to efficiently develop new hotel keys, to effectively operate and manage
hotel operations, and to compete with other hospitality offerings within the Philippines and the Asian region;
• Hospitality operations will require a substantial number of qualified managers and employees, and there is no guarantee that the
Group will be able to successfully recruit, train and retain a sufficient number of such qualified personnel;
• Changes in governmental laws and regulations, fiscal policies, and zoning ordinances and the related costs of compliance with laws
and regulations, fiscal policies, and ordinances;
• Loss of certain tax exemptions and incentives will increase tax liability and decrease any profits in the future;
• Changes in the domestic, regional, and global economies, which are affected by factors, including, but not limited to, the political
landscape, environmental conditions, and disease epidemics may require deferral of the commencement of various hospitality
projects;
• Increased threat of terrorism, terrorist events, airline strikes, hostilities between countries, or increased risk of natural disasters that
may affect travel patterns and reduce the number of business and commercial travellers and tourists;
• Increases in operating costs and occurrence of unanticipated costs due to various reasons, including inflation, labor costs, workers’
compensation and health-care related costs, utility and energy costs, property tax, advertising and promotion expenses, insurance,
environmental damage and acts of nature and their consequences;
• Changes in interest rates and in the availability, cost, and terms of debt financing and other changes in the business that adversely
affect our ability to obtain financing and comply with debt financing covenants;
• Relations between service providers, suppliers, and/or lenders and the Group;
• Difficulties in identifying hospitality assets to acquire and completing and integrating acquisitions;
• Increase in transportation or fuel costs or strikes among workers in the transportation industry, particularly in the aviation industry;
• Adverse weather patterns;
Banking and Financial Business
Risk Management
To ensure that corporate goals and objectives, and business and risk strategies are achieved, EW utilizes a risk management process that
is applied throughout the organization in executing all business activities. Employees’ functions and roles fall into one of the three
categories where risk must be managed in the business units, operating units and governance units.

47
EW’s activities are principally related to the use of financial instruments and are exposed to credit risk, liquidity risk, operational risk
and market risk, the latter being subdivided into trading and non-trading risks. Forming part of a coherent risk management system are
the risk concepts, control tools, analytical models, statistical methodologies, historical researches and market analysis, which are being
employed by EW. These tools support the key risk process that involves identifying, measuring, controlling and monitoring risks.
Risk Management Structure
a. BOD
EW’s risk culture is practiced and observed across the Group putting the prime responsibility on its BOD. It establishes the risk culture
and the risk management organization and incorporates the risk process as an essential part of the strategic plan of the Group. The BOD
approves EW’s articulation of risk appetite which is used internally to help management understand the tolerance for risk in each of the
major risk categories, its measurement and key controls available that influence EW’s level of risk taking. All risk management policies
and policy amendments, risk-taking limits such as but not limited to credit and trade transactions, market risk limits, counterparty limits,
trader’s limits and activities are based on EW’s established approving authorities which are approved by EW’s BOD. At a high level,
the BOD also approves EW’s framework for managing risk.
b. Executive Committee
This is a BOD level committee, which reviews the Bankwide credit strategy, profile and performance. It approves the credit risk-taking
activities based on EW’s established approving authorities and likewise reviews and endorses credit-granting activities, including the
Internal Credit Risk Rating System. All credit proposals beyond the credit approving limit of the Loan and Investments Committee
passes through this committee for final approval.
c. Loan and Investments Committee
This committee is headed by the Chairman of EW whose primary responsibility is to oversee EW’s credit risk-taking activities and
overall adherence to the credit risk management framework, review business/credit risk strategies, quality and profitability of EW’s
credit portfolio and recommend changes to the credit evaluation process, credit risk acceptance criteria and the minimum and target
return per credit or investment transaction. All credit risk-taking activities based on EW’s established approving authorities are evaluated
and approved by this committee. It establishes an infrastructure by ensuring business units have the right systems and adequate and
competent manpower support to effectively manage its credit risk.
d. Asset-Liability Management Committee (ALCO)
ALCO, a management level committee, meets on a weekly basis and is responsible for the over-all management of EW’s market,
liquidity, and financial position related risks. It monitors EW’s liquidity position and reviews the impact of strategic decisions on
liquidity. It is responsible for managing liquidity risks and ensuring exposures remain within established tolerance levels. The ALCO’s
primary responsibilities include, among others, (a) ensuring that EW and each business unit holds sufficient liquid assets of appropriate
quality and in appropriate currencies to meet short-term funding and regulatory requirements, (b) managing financial position and
ensuring that business strategies are consistent with its liquidity, capital and funding strategies, (c) establishing asset and/or liability
pricing policies that are consistent with the financial position objectives, (d) recommending market and liquidity risk limits to the Risk
Management Committee (RMC) and BOD and (e) approving the assumptions used in contingency and funding plans. It also reviews
cash flow forecasts, stress testing scenarios and results, and implements liquidity limits and guidelines.
e. RMC
RMC is a BOD level committee that convenes monthly and is primarily responsible to assist the BOD in managing EW’s risk taking
activities. This is performed by the committee by institutionalizing risk policies and overseeing the EW’s risk management system. It
develops and recommends risk appetite and tolerances for EW’s major risk exposures to the BOD. Risk management principles,
strategies, framework, policies, processes, and initiatives and any modifications and amendments thereto are reviewed and approved by
RMC. It oversees and reports to the BOD the effectiveness of the risk management system, overall risk profile, and compliance with
the risk appetite and tolerances that the BOD approved.
f. Risk Management Subcommittee (RMSC)
RMSC is a management level committee that convenes, at least four times in a year, and is responsible to assist RMC in fulfilling its
responsibilities in managing EW's risktaking activities. This is performed by the committee by implementing the risk management
principles, strategies, framework, policies, processes, and initiatives across the EW. It leads the effective conduct of risk and capital
management. It oversees and directs the management of the EW’s overall risk profile. The committee likewise oversees risk incidents,
control gaps, and control deficiencies and management actions in implementing the corresponding corrective actions.
48
g. Audit Committee (Audit Com)
The Audit Com assists the BOD in fulfilling its responsibilities for overseeing senior management in establishing and maintaining an
adequate, effective and efficient internal control framework. It ensures that systems and processes are designed to provide reasonable
assurance in areas including reporting, monitoring compliance with laws, regulations and internal policies, efficiency and effectiveness
of operations, and safeguarding of assets. It is tasked to discuss with management EW’s major risk exposures and ensures accountability
on the part of management to monitor and control such exposures including EW’s risk assessment and risk management policies. The
Audit Com oversees the internal audit function and is responsible for monitoring and reviewing its effectiveness while ensuring its
independence.
h. Corporate Governance and Compliance Committee (CGCC)
The CGCC leads the Bank in defining and fulfilling the corporate governance policies and attaining best practices while overseeing the
implementation of the Bank’s compliance program, money laundering and terrorist financing prevention program and ensuring that
regulatory compliance issues are resolved expeditiously. In addition to its governance role, the CGCC also assumes the nomination
function whereby it reviews and evaluates the qualifications of all persons nominated to the BOD, all direct reports of the President and
CEO, Heads of Governance Units regardless of rank, and other positions of the bank requiring appointment by the BOD. The committee
oversees the annual performance evaluation of the BOD, its committees, and individual directors and conducts an annual self-evaluation
of its performance as prescribed under and in accordance with the Corporate Governance Manual and SEC Code of Corporate
Governance for Publicly Listed Companies.
i. Related Party Transactions (RPT) Committee
The RPT Committee assists the BOD in ensuring that the transactions with related parties of EW are handled in a sound and prudent
manner, with integrity and in compliance with the applicable laws and regulations to protect the interest of depositors, creditors and
other stakeholders. It also ensures that related party transactions are conducted on an arm’s length basis and that no stakeholder is unduly
disadvantaged by such transactions.
j. Asset Impairment Committee (AIC)
AIC is a management level committee that convenes at least 2 times in a year, and shall officially represent EW’s source of experienced
credit judgment insofar as the asset impairment exercise is concerned. This experienced credit judgment is tapped to provide guidance
under the following, but not limited to, conditions: 1) The result of the calculation is assessed to be unreasonable that it is considered as
not fairly representative of EW’s historical experience, current, and prospective credit condition or other conditions deemed relevant in
reasonably determining EW’s assets’ recoverable value; 2) There is an adverse change in the prevailing or foreseen prospective
economic condition relative to the embedded presumption in the existing impairment framework; and 3) The data set in the calculation
parameters is not available or insufficient to complete the calculation.
k. Risk Management Division (RMD)
RMD performs an independent risk governance function within EW. RMD is tasked with identifying, measuring, controlling and
monitoring existing and emerging risks inherent in EW’s overall portfolio (on- or off-balance sheet). RMD develops and employs risk
assessment tools to facilitate risk identification, analysis and measurement. It is responsible for developing and implementing the
framework for policies and practices to assess and manage enterprise-wide market, credit, operational, and all other risks of the Bank.
It also develops and endorses risk tolerance limits for BOD approval, as endorsed by the RMC, and monitors compliance with approved
risk tolerance limits. Finally, it regularly apprises the BOD, through the RMC, the results of its risk monitoring.
l. Internal Audit (IA)
IA provides an independent assessment of the adequacy of EW’s internal controls, risk management, governance framework and
execution/operational practices. Internal audit activities are conducted in accordance with the International Standards for the
Professional Practice of Internal Auditing and the Code of Ethics. IA has adopted a risk assessment methodology, which provides a
sound basis in the selection of areas of coverage and frequency of audit for the preparation of the annual audit plan. IA employs a risk-
based audit approach that examines both the adequacy of the policies and the Bank’s compliance with the procedures while assuring
audit coverage of the areas identified as representing the greatest current risk. It discusses the results of assessments with management,
and reports its findings and recommendations to the Audit Com. IA’s activities are suitably designed to provide the BOD with reasonable
assurance that significant financial and operating information is materially complete, reliable and accurate; internal resources are
adequately protected; and employee performance is in compliance with the Bank’s policies, standards, procedures and applicable laws
and regulations
m. Compliance Division
Compliance Division is vested with the responsibility of overseeing the design of EW’s Compliance Program and coordinating its
effective implementation towards the sound management of Business and Compliance Risks. It also manages the implementation of
the Money Laundering and Terrorist Financing Program. Its mandate is to ensure that EW is compliant with relevant and applicable
49
laws, rules, regulations, codes of conduct and standards of good practice while avoiding an overly risk-averse environment that inhibits
business growth. It serves as EW’s central point of contact with banking regulators.
Credit Risk
Credit risk refers to the potential loss of earnings or capital arising from an obligor/s, customer/s or counterparty’s failure to perform
and/or to meet the terms of any contract with EW. Credit risks may last for the entire tenor and set at the full amount of a transaction
and in some cases, may exceed the original principal exposures. The risk may arise from lending, trade financing, trading, investments
and other activities undertaken by EW. To identify and assess this risk, EW has: 1) approval process per the borrower or business and/or
product segment; and 2) structured and standardized credit rating for corporate loans and risk acceptance criteria for consumer loans.
For large corporate credit transactions, EW has a comprehensive procedure for credit evaluation, risk assessment and well-defined
concentration limits, which are established for each type of borrower. EW’s credit risk is managed at the portfolio level, which may be
on an overall or by product perspective.
Credit concentration
Excessive concentration of lending plays a significant role in the weakening of asset quality. EW reduces this risk by diversifying its
loan portfolios across various sectors and borrowers. EW believes that good diversification across economic sectors and geographic
areas, among others, will enable it to ride through business cycles without causing undue harm to its asset quality.
EW’s loan portfolio is in line with EW’s policy of not having significant concentrations of exposure to specific industries or group of
borrowers. Management of risk concentration is by client/counterparty, by industry sector, and by geographical location. For risk
concentration monitoring purposes, the financial assets are broadly categorized into loans and receivables, loans and advances to banks,
and investment securities. EW ensures compliance with BSP’s limit on exposure to any single person or group of connected persons
by closely monitoring large exposures and top 20 borrowers for both single and group accounts.
Aside from ensuring compliance with BSP’s limit on exposures to any single person or group of connected persons, it is the bank’s
policy to keep the expected loss (determined based on the credit risk rating of the account) of large exposure accounts to, at most, one
and a half percent (1.5%) of their aggregate outstanding balance. This is to maintain the quality of the Group’s large exposures. With
this, accounts with better risk grades are given priority in terms of being granted a bigger share in EW’s loan facilities.
Aligned with the Manual of Regulations for Banks definition, EW considers its loan portfolio concentrated if it has exposures of more
than thirty percent (30.0%) to an industry.
Collateral and other credit enhancements
Collaterals are taken into consideration during the loan application process as they offer an alternative way of collecting from the client
should a default occur. The percentage of loan value attached to the collateral offered is part of EW’s lending guidelines. Such
percentages take into account safety margins for foreign exchange rate exposure/fluctuations, interest rate exposure, and price volatility.
Collaterals are valued according to existing credit policy standards and, following the latest appraisal report, serve as the basis for the
amount of the secured loan facility. Premium security items are collaterals that have the effect of reducing the estimated credit risk for
a facility. The primary consideration for enhancements falling under such category is the ease of converting them to cash. EW is not
permitted to sell or re-pledge the collateral in the absence of default by the owner of the collateral. It is EW’s policy to dispose foreclosed
assets in an orderly fashion. The proceeds of the sale of the foreclosed assets, included under Investment Properties, are used to reduce
or repay the outstanding claim. In general, EW does not occupy repossessed properties for business use.
As part of EW’s risk control on security/collateral documentation, standard documents are made for each security type and deviation
from the pro-forma documents are subject to legal review prior to implementation.
As for the computation of credit risk weights, hold-out on deposits with the Bank, Home Guaranty cover, and Philippine sovereign
guarantees are the only credit risk mitigants considered as eligible.
Internal Credit Risk Rating System
Beginning January 1, 2018, the Bank employs a credit scoring system for borrowers to assess risks relating to the borrower and the loan
exposure. Borrower risk is evaluated by considering (a) quantitative factors, such as financial condition and (b) qualitative factors, such
as management quality and industry outlook.
EW’s new rating system assesses default risk based on financial profile, management capacity, industry performance, and other factors
deemed relevant. Credit rating that exceeds the defined threshold, thus signaling significant risk, among other account-level profile and
performance factors, define whether the accounts are classified in either Stage 1, Stage 2, or Stage 3 per PFRS 9 loan impairment
standards.
The credit rating for each borrower is reviewed annually. A more frequent review is warranted in cases where the borrower has a higher
risk profile or when there are extraordinary or adverse developments affecting the borrower, the industry and/or the Philippine Economy.

50
The consumer loan portfolio of EW is composed of the following product lines: credit cards, auto, mortgage, salary, personal and branch
loans. Each of these products has established credit risk guidelines and systems for managing credit risk across all business. For credit
cards, auto and mortgage loans, application and behavioral scoring models are in place that primarily consider demographic variables
and payment behavior, respectively, for the assessment of the likelihood of default by the borrower. For the other consumer loans,
minimum risk acceptance criteria were set for each portfolio according to the nature of the product and the target market, and is used
for the evaluation of the credit quality of borrowers at origination.
For purposes of comparison of different exposure types, the credit portfolios (corporate and consumer) of the Bank are benchmarked
against marketable corporate debt securities (using the Standard & Poor’s (S&P) global study on corporate exposures) based on credit
risk rating and corresponding PDs.
The Bank assigns credit risk using the following credit score master scale:
Credit quality Description Credit rating
Investment Grade These accounts are of the highest
quality and are likely to meet
financial obligations.
AAA to AA+
AA
AA-
A+
A
A-
BBB+
BBB
Standard Grade These accounts may be vulnerable to
adverse business, financial and
economic conditions but are
expected to meet financial
obligations.
BBB-
BB+
BB
BB-
B+
B
B-
Substandard Grade These accounts are vulnerable to
non-payment but for which default
has not yet occurred.
CCC+ to C-
Non-Performing These refer to accounts which are in
default or those that demonstrate
objective evidence of impairment.
Default
Liquidity Risk
Liquidity risk is the risk that sufficient funds are unavailable to adequately meet all maturing liabilities, including demand deposits and
off-balance sheet commitments. The main responsibility of daily asset liability management lies with EW’s Treasury Group, specifically
the Liquidity Desk, which are tasked to manage the balance sheet and have thorough understanding of the risk elements involved in the
respective businesses. Only EW and EWRB are potentially exposed to liquidity risk exposures, where their liquidity risk management
are monitored by their respective ALCOs. Resulting analysis of the balance sheet along with the recommendation is presented during
the weekly ALCO meeting where deliberations, formulation of actions and decisions are made to minimize risk and maximize returns.
Discussions include actions taken in the previous ALCO meeting, economic and market status and outlook, liquidity risk, pricing and
interest rate structure, limit status and utilization. To ensure that both EW and EWRB have sufficient liquidity at all times, the respective
ALCO formulates a contingency funding plan which sets out the amount and the sources of funds (such as unutilized credit facilities)
available to both entities and the circumstances under which such funds will be used.
By way of the Maximum Cumulative Outflow limit, the Group is able to manage its long-term liquidity risks by placing a cap on the
outflow of cash on a per tenor and on a cumulative basis. The Group takes a multi-tiered approach to maintaining liquid assets. EW’s
principal source of liquidity is comprised of Cash and other cash items, Due from BSP, Due from other banks and Interbank Loans
Receivable with maturities of less than 1 year. In addition to regulatory reserves, EW maintains a sufficient level of secondary reserves
in the form of liquid assets such as short-term trading and investment securities that can be realized quickly.
The Bank manages liquidity by maintaining sufficient liquid assets in the form of cash and cash equivalents, investment securities and
loan receivables. As of December 31, 2019 and 2018, P=117.8 billion and P=96.3 billion, respectively, or 42.9% and 39.0%, respectively,
of the Bank’s total gross loans and receivables had remaining maturities of less than 1 year. The total portfolio of trading and investment
securities is comprised mostly of sovereign-issued securities that have high market liquidity. With the above presented liquidity profile,
EW remains to be inhibited from liquidity risk that it cannot adequately manage.

51
Market Risk
Market risk is the risk that the fair value or future cash flows of financial instruments will fluctuate due to changes in market variables
such as interest rates, foreign exchange rates, and equity prices. EW treats exposures to market risk as either for trading or accrual or
balance sheet exposure. The market risk for the trading portfolio is measured using Value at Risk (VaR). Interest rate risk of accrual
portfolios in the Banking Book are measured using Earnings at Risk (EaR).
Market risk in the trading book
The BOD has set limits on the level of market risk that may be accepted. VaR limits are applied at the instrument level and approved
by the BOD based on, among other things, a business unit’s capacity to manage price risks, the size and distribution of the aggregate
exposure to price risks and the expected return relative to price risks.
EW applies the VaR methodology to assess the market sensitive positions held for trading and to estimate the potential economic loss
based on parameters and assumptions. VaR is a method used in measuring market risk by estimating the potential negative change in
the market value of a portfolio at a given confidence level and over a specified time horizon.
Objectives and Limitations of the VaR Methodology
EW uses the VaR model of Bloomberg Portfolio Analytics using 1-year historical data set to assess possible changes in the market value
of the fixed income, equities, and foreign exchange trading portfolio. VaR for the U.S. treasury futures is measured using Historical
Simulation using an internally developed Excel spreadsheet. The interest rate swaps (IRS) and foreign exchange (FX) forwards (outright
and forward leg of FX Swaps) trading portfolio’s interest rate risk is measured using Monte Carlo VaR using OPICS Risk Plus. The
VaR models are designed to measure market risk in a normal market environment. The use of VaR has limitations because correlations
and volatilities in market prices are based on historical data and VaR assumes that future price movements will follow a statistical
distribution. Due to the fact that VaR relies heavily on historical data to provide information and may not clearly predict the future
changes and modifications of the risk factors, the probability of large market moves may be underestimated.
VaR may also be under or overestimated due to assumptions placed on risk factors and the relationship between such factors for specific
instruments. Even though positions may change throughout the day, VaR only represents the risk of the portfolio at the close of each
business day, and it does not account for any losses that may occur beyond the specified confidence level.
In practice, actual trading results will differ from the VaR calculation and the calculation does not provide a meaningful indication of
profits and losses in stressed market conditions. To determine the reliability of the VaR model, actual outcomes are monitored through
hypothetical and actual backtesting to test the accuracy of the VaR model.
Stress testing provides a means of complementing VaR by simulating the potential loss impact on market risk positions from extreme
market conditions, such as risk factor movements based on historical financial market stress conditions and scenarios adopted from the
uniform stress testing framework of the BSP.
VaR assumptions
The VaR that EW uses is premised on a 99.0% confidence level that this potential loss estimate is not expected to be exceeded if the
current market risk positions were to be held unchanged for a given holding period. Foreign exchange and U.S.Treasury Futures VaR
is measured using 1 day holding period while fixed income VaR has a holding period of 5 days. Furthermore, EW’s equity and IRS
trading positions are assumed to be closed out in 10 days. The use of a 99.0% confidence level means that within the set time horizon,
losses exceeding the VaR figure should occur, on average, not more than once every hundred days.
VaR is an integral part of EW’s market risk management and encompasses investment positions held for trading. VaR exposures form
part of the market risk monitoring which is reviewed daily against the limit approved by the BOD. The trading activities are controlled
through the Market Risk Limit (MRL), which is a dynamic risk limit anchored on the principle of risk and return which is adjusted by
net trading gains (added in half) or losses subtracted in whole. RMD reports compliance to the MRL and trader’s VaR limits daily. If
the MRL or individual trader’s limit is exceeded, such occurrence is promptly reported to the Treasurer, President, Chief Risk Officer
and the Chief Executive Officer, and further to the BOD through the RMC.
Foreign Currency Risk
EW holds foreign currency denominated assets and liabilities, thus, foreign exchange rate fluctuations can affect the financials and cash
flows of EW. Managing the foreign exchange exposure is important for banks with exposures in foreign currencies. For EW, this
includes purchase or sell of foreign currency to control the impact of changes in exchange rates on its financial position.
EW’s foreign currency exposures emanate from its net open spot and forward FX purchase and sell transactions, and net foreign currency
income accumulated over the years of its operations. Foreign currency-denominated deposits are generally used to fund EW’s foreign
currency-denominated loan and investment portfolios in the FCDU.
In the FCDU books, BSP requires banks to match the foreign currency assets with the foreign currency liabilities. Thus, banks are
required to maintain at all times a 100.0% cover for their currency liabilities held through FCDU.
52
Total foreign currency position is monitored through the daily BSP FX position reports, which are subject to the overbought and oversold
limits set by the BSP at 20.0% of unimpaired capital or US$50.0 million, whichever is lower. Internal limits regarding the intraday
trading and end-of-day trading positions in FX, which consider the trading desk and the branch FX transactions, are also monitored.
The analysis calculates the effect of a reasonably possible movement of the foreign currency rate against Peso, with all other variables
held constant, on the statement of income. A negative amount reflects a potential net reduction in statement of income while a positive
amount reflects a net potential increase. There is no other impact on the Bank’s equity other than those already affecting the statements
of income.
Market Risk in the Banking Book
Interest rate risk
Interest rate risk in the banking book (IRRBB) is inherent in EW’s traditional banking activities that include taking deposits to invest or
grant loans. The future cash flows from these activities are exposed to variations in interest rates, largely from mismatch in tenors and
prices, IRRBB is measured with Earnings-at-Risk (EaR) which is a measure of the net interest income movement due to changes in
prevailing interest rates and the balance sheet re-pricing profile of EW. The EaR limit is set as a function of the EW’s net interest margin
(NIM). The EaR limit preserves EW’s capital and competitive position by restricting the impact of interest rate sensitivities to NIM
within the corridor of above average and within the first quartile of its peer banks. In measuring EaR, EW’s interest re-pricing assets
and liabilities are matched by re-pricing (or maturity if non-repricing) buckets covering tenors within a 1-year horizon, and
corresponding gaps determined. If positive gap is noted, it implies that an increase in interest rates will positively affect the net interest
income. Conversely, a negative gap implies that an increase in interest rates will negatively affect the net interest income. The estimated
nominal impact to EW’s earnings is derived by multiplying the volatility of benchmark yields for each tenor bucket to the repricing gap
profile. The result is compared vs EaR limit to monitor the compliance with the limit and is reported to the RMC on a monthly basis.
Additionally, EaR limit is reviewed and updated annually to ensure its continued relevance and alignment EW’s financial targets,
strategies, and overall risk appetite.
To complement EaR and provide Management a more holistic view, EW performs forward looking scenario and sensitivity analysis as
well as stress testing activities to identify any vulnerabilities. The Bank employs 3 methodologies in the conduct of stress testing a)
economic/historical stress test which assumes a parallel shift in interest yield curves of 660.0 basis points for PhP-denominated assets
and liabilities and 270.0 basis points for USD-denominated, b) uniform stress test, a regulatory-prescribed stress test, has 3 scenarios
with assumed parallel shift in interest rates for both PhP (from 300.0 bps to 500.0 bps) and USD (from 100.0 bps to 300.0 bps), c)
reverse stress test, which primarily measures the highest swing in interest rates that can potentially wipe out the Banks targeted net
income and net interest income.
All IRRBB reports are also presented to the ALCO. The ALCO deliberates on matters pertaining to the management of the Bank’s
assets and liabilities, such as achieving optimum asset and liability mix, pricing, liquidity levels, repricing gap positions, and asset
quality. The Bank’s ALCO meets on a weekly basis.
The Bank manages its IRRBB through effective diversification of funding sources. By offering various deposit, investment and loan
products with differing maturities, the Bank is able to meet its short, medium and long-term obligations, optimize returns, and provide
options that cater to differing preferences of its target market. The Bank’s target funding mix is aligned with the Bank’s overall growth
plans. While the Bank mainly manages IRRBB through careful planning of its cashflows, it also has access to various derivative
products that provide flexibility in responding to more abrupt market developments.
EW also monitors its exposure to fluctuations in interest rates by using scenario analysis to estimate the impact of interest rate movements
on its interest income. This is done by modeling the impact to EW’s interest income and interest expenses of different parallel changes
in the interest rate curve, assuming the parallel change only occurs once and the interest rate curve after the parallel change does not
change again for the next twelve months.
Operational Risk
Operational risk is the loss resulting from inadequate or failed internal processes, people and systems or from external events. It includes
legal, compliance and reputational risks but excludes strategic risk.
Other Risk Exposures
EW’s risk exposures other than credit, market, liquidity and operational, while existent, are deemed insignificant relative to the
mentioned risks and if taken in isolation. Hence, management of these risks are instead collectively performed and made an integral
part of EW’s internal capital adequacy assessment process and enterprise risk management initiatives.
Power Operations
• Increased competition in the power industry, including competition resulting from legislative, regulatory and industry
restructuring efforts, could have a material adverse effect on FDCUI’s operations and financial performance.
• Administration and operation of power generation plants involve significant risks.
▪ The administration and/or operation of power generation plants involve significant risks, including:
53
▪ breakdown or failure of power generation equipment, transmission lines, pipelines or other equipment or processes,
leading to unplanned outages and operational issues;
▪ flaws in the equipment design or in power plant construction;
▪ issues with the quality or interruptions in the supply of key inputs, including fuel or water;
▪ material changes in legal, regulatory or licensing requirements;
▪ operator error;
▪ performance below expected levels of output or efficiency;
▪ industrial actions affecting power generation assets owned or managed by FDCUI or its contractual counterparties;
▪ pollution or environmental contamination affecting the operation of power generation assets;
▪ force majeure and catastrophic events including fires, explosions, earthquakes, volcanic eruptions, floods and
terrorist acts that could cause forced outages, suspension of operations, loss of life, severe damage and plant
destruction;
▪ planned and unplanned power outages due to maintenance, expansion and refurbishment;
• Inability to obtain or the cancellation of required regulatory, permits and approvals; and opposition from local communities
and special interest groups.
• FDCUI may experience issues with respect to its fuel costs or supply.
• FDCUI engages technical partners and third-party operators and specialized suppliers in connection with the power
generation at its power plant.
• FDCUI is exposed to credit and collection risks.
• FDCUI’s power supply agreements are subject to approval and renewal risk.
• FDCUI may not successfully implement its growth strategy in the power industry.
• The Group’s growth plans may be limited by the Philippines’ transmission infrastructure.
• The Group currently only has 1 operating generation asset.
• FDCUI faces risks relating to its future power generation projects, including risks relating to project cost, completion time
frame and development rights.
• Policy and regulatory responses to climate change may adversely affect FDCUI’s business and prospects.
• The loss of certain tax exemptions and incentives will increase FDCUI’s tax liability and decrease any profits it might have in
the future.
Sugar Operations
• Farmers are not required to grow sugarcane and may cultivate other crops.
• The Sugar Group’s business is dependent on certain principal customers who are not under any obligation to purchase the Sugar
Group’s products, and the loss of, or a significant reduction in, purchases by such customers could adversely affect the Sugar
Group’s business.
• Reduced demand for or changes in perception of end-products that use raw or refined sugar.
• Contract farmers may not repay their crop loans to PSHC.
• Adverse weather conditions, crop disease, substandard sugarcane quality and certain sugarcane crop varieties grown by farmers
may adversely affect sugarcane crop yields and sugar recovery rates for any given harvest.
• The Sugar Group may be adversely affected by price fluctuations in sugar and related markets, such as ethanol, oil and corn.
• The Sugar Group is potentially subject to price competition from illegally imported sugar.
• Because the Sugar Group’s contracts to cultivate sugarcane are based on the amount of land the farmer cultivates rather than a set
quantity or quality of sugarcane, the yield per hectare of land determines in large part the quantity of sugarcane the Sugar Group
receive and the Sugar Subsidiaries cannot guarantee that the supply their mills receive in a given year will be sufficient to meet
their needs.
• Because DSCC and CSCC contract with sugarcane farmers to cultivate sugarcane under long term contracts, DSCC and CSCC may
be obligated to mill the sugarcane produced even if they will be unable to sell the resulting sugar.
• In the event that existing barriers to the import of sugar to the Philippines are further reduced or lifted, the Sugar Group may face
increasing competition from international sugar manufacturers which may adversely affect their profitability.
• The Sugar Group’s results of operations could be adversely affected by a disruption of operations at their manufacturing facilities.
• The collective bargaining agreement which governs most DSCC employees will expire on June 30, 2020.
Competitive Strengths
The Group believes that its principal strengths are the following:
Strategically Positioned in Attractive Growth Sectors of the Philippine Economy
The Group believes its businesses are well-positioned in high growth sectors of the Philippine economy which will allow it to take
advantage of primary economic and consumption growth drivers such as OFW remittances, BPOs, and tourism, among others.

54
In real estate, the Group entered the affordable housing space in the early 1990s when most developers were still focused on the higher
end of the market, allowing the Group to benefit from the growth of OFW remittances and a housing supply shortage. In particular, the
Group primarily targets the affordable and middle-income residential markets, which together are believed by the Group to be the largest
addressable markets in residential development in the Philippines. The Group was one of the pioneers in providing projects and office
space catering to the BPO industry, which started in 2000 and quickly became a key driver for the Philippines’ strong economic growth
supported by Government incentives. As a result of this early entry into the BPO space, the Group has almost tripled its aggregate office
GLA from 175,565 sq.m. as of December 31, 2012 to 523,902 sq.m. as of December 31, 2019. In addition to traditional BPOs, recent
years have also seen the influx of Philippine Offshore Gaming Operators as tenants.
The Group has also built a track record of developing large-scale, master-planned townships, the first of which was Filinvest City, a
joint venture formed in 1992 between the Government and FAI to develop a 244-hectare CBD in southern Metro Manila when the area
was largely undeveloped. Since the Group’s entry, land prices in Filinvest City have risen significantly. The Group expects Filinvest
City’s strategic location to be further enhanced as travel times from the south of Metro Manila to Quezon City and Northern Luzon are
set to be greatly reduced with the development and completion of the road link project connecting the South Luzon Expressway and
North Luzon Expressway corridors, as well as the planned Clark to Calamba, Laguna rail development.
In 2016, the Group was one of the first developers to identify Clark, Pampanga as a significant growth area, and was the sole bidder for
the Mimosa Leisure Estate (now known as Filinvest Mimosa+ Leisure City) and the New Clark City developments. In the last 3 years,
a range of announced new projects, such as the expansion of CIA, the declaration of Clark, Pampanga as a new Government center, and
the signing of the initial agreements with the Japanese government for the development of a high speed train linking Manila to Clark,
have resulted in significant property price increases in the area according to Colliers, as well as significant growth in passengers arriving
in Clark International Airport (from passenger arrivals of 951,007 in 2016 to 4.0 million in 2019).
Complementing its core real estate expertise, the Group’s hospitality business, which currently has locations in Cebu City, Muntinlupa
City, Clark Freeport Zone, Pampanga and Boracay, is also well positioned to benefit from the growing Philippine tourism industry,
which has seen a growth in foreign visitor arrival from 2015 to 2019 at a CAGR of 11.3%.
In banking and financial services, EW entered the consumer financing business in 2004 and has built a top quartile retail banking
business with one of the highest percentage of retail loans to total loan portfolio in the industry based on EW’s estimates. EW focuses
on the high margin consumer lending segments with historically higher returns, and has grown its business through aggressive store
expansion, as well as strategic acquisitions and business partnerships in auto loans and credit cards, personal loans and bancassurance.
Based on the expected increase in consumer spending of 7.8% over the next 3 years, according to the Economist Intelligence Unit, the
Group expects its retail banking business to continue to grow to meet increased consumer demand.
The Group entered the Mindanao power market in 2009 with the development of the FDC Misamis thermal plant when the region was
experiencing a significant shortage in power supply and as a result was able to enter into power supply agreements with 17 of the
region’s distribution utilities, 14 of which are AAA rated by the NEA. The strategic location of the Group’s clean coal power plant in
Mindanao, and its other planned projects in its power business in the country positions the Group to benefit from the expected growth
in demand for electricity especially in the southern regions of the country. In addition, the Group’s sugar business benefits from the
industrialization of Luzon, which has increased Mindanao’s importance in agribusiness.
Most recently, the Group has begun development of its infrastructure business. LIPAD Corp. comprising FDC, as lead consortium
member, JG Summit Holdings Inc., Philippine Airport Ground Support Solutions Inc. and Changi Airport Philippines (I) Pte. Ltd.
(wholly owned by Changi Airports International), was awarded an operation and maintenance contract for the CIA as well as a contract
for the construction of an additional terminal. The Group is also part of a consortium of seven of the Philippines’ largest conglomerates
that submitted an unsolicited bid to upgrade, expand, operate and maintain the NAIA. The NAIA Consortium recently submitted a
revised proposal to the DoTR and the proposal is currently with the National Economic and Development Authority Board for approval.
Solid Foundation for Future Growth in Place
The Group believes it has laid the proper foundation for the future growth and monetization of its existing and newer businesses across
the Philippines. Its long history of operating successful businesses and making strategic and timely investments has resulted in the
necessary scale, experience and capability to efficiently capitalize on business opportunities in sectors of the economy and areas of the
country that it expects to drive the Group’s continued growth.
With respect to its real estate and hospitality operations, the Group’s rollout of development projects have an aggregate potential GFA
of approximately 7.6 million sq.m. of residential, office, retail, logistics, industrial and hotel buildings. The Group’s strategic
investments have resulted in the availability of a sufficient land bank spanning key regions in the Philippines to support the future
expansion of the Group’s office and retail GLA and construction of 10 additional hotels in the next 5 years, positioning the Group to
monetize its growth initiatives. As of December 31, 2019, the Group had an aggregate land bank of 1,961.1 hectares of raw land,
primarily for residential development, which includes 208.3 hectares of raw land held through joint venture arrangements and
86.0 hectares of unsold lots in Filinvest City. In October 2019, FAI signed a joint venture agreement with Japanese company Mitsubishi
Corporation for the development of a ₱15.0 billion multi-tower mixed-use complex within Filinvest City. Mitsubishi will have a 40.0%
stake in the development of a 1.7-hectare prime lot that is seen to bolster mixed-use GLA by approximately 183,000 square meters.
55
In banking, EW is actively implementing its medium-term strategy of optimizing the operations and profitability of its expanded store
network. With a view to growing its asset base, attracting low-cost deposits and increasing its deposit per store from approximately
₱700.0 million to reach the industry standard of ₱1.1 billion for banks of comparable size, EW continues to focus on deepening and
broadening relationships with, and increasing its revenues generated from, existing customers. The Group believes that the expansion
of EW’s products lines, including its recent expansion into bancassurance and wealth management, will be integral to its overall customer
offering.
In the power business, FDCUI’s 405 MW (3 x 135 MW) clean coal power plant, which has entered into power supply agreements for a
total of 302 MW, also has sufficient expansion capacity for another 2 x 135 MW to help address the expected growing demand for
power in Mindanao. The power plant is located in PHIVIDEC Industrial Estate, the first industrial estate in the Philippines established
in 1974 spanning 6,000 hectares, that currently houses major locators. The Group believes that the expected industrial developments in
the PHIVIDEC Industrial Estate and surrounding urban centers will increase demand for power in the area. According to the Department
of Energy, projected peak demand is expected to increase by 8.0% each year in 2019 and 2020, and 7.5% each year from 2021 to 2023.
FDCUI has also expanded into the retail electricity supply business, allowing it to trade electricity and cater to contestable customers
across the Philippines under the expected RCOA regime.
To complement its power generation and trading operations, the Group has also entered into strategic partnerships with Engie to develop
potential renewable energy solutions in the Philippines that provide energy cost savings to large industrial and commercial customers.
The Group believes that the partnership’s initial projects with respect to renewable energy and district cooling will position it to take
advantage of the global move towards greater sustainability. The Group also signed a joint venture agreement with Japanese company
HAQT to establish FLOW to tap into the latest developments in desalination technology in order to to tap the opportunity to offer
desalinated water in areas with scarcity of water and/or poor quality of water.
Track Record of Successfully Leveraging Profitability and Positioning
The Group has been able to successfully establish and grow a diverse and profitable business portfolio over its history with revenues
reaching ₱74.8 billion in 2019, representing approximately 14.7% CAGR from 2016 to 2018; assets reaching ₱642.2 billion as of
December 31, 2019, representing CAGR of approximately 8.8% from 2016 to December 31, 2019; and net income reaching
₱15.9 billion in 2019, representing CAGR of approximately 23.3% from 2016 to 2019. Over the years, the Group has demonstrated a
consistent ability to leverage its success in existing businesses to expand into new industries while maintaining its overall focus of
catering to the middle-income market of the Philippines.
The Group’s real estate business has grown over the last four decades to become one of the leading integrated real estate developers and
operators in the Philippines, with real estate and hospitality net income at ₱8.8 billion in 2019, increasing at a CAGR of 9.4% from 2016
to 2019. The Group complemented its initial real estate investments and developments by building a considerable recurring income
base of office and commercial leasing, primarily to the BPO industry. The Group was also one of the first developers to focus on large-
scale, master-planned townships to capitalize on its wide range of real estate offerings and enhance synergies across its growing number
of businesses. To further take advantage of its expertise in property development and diversify its recurring income stream, the Group
opened its first hospitality project in Mactan City in 2010, and, as of December 31, 2019, operated approximately 1,800 keys in Cebu,
Muntinlupa City, Clark Freeport Zone, Pampanga and Boracay.
The Group believes EW’s focus on retail and consumer lending has allowed it to quickly scale its operations in line with the strong
Philippine economic growth of the past decade. EW has established a nationwide presence of 467 stores as of December 31, 2019,
compared with 168 stores as of December 31, 2011. The Group believes that EW’s return on equity, which was 13.5% in 2019, is one
of the highest among universal and commercial banks in the Philippines while EW’s net income (gross of eliminations for intra-group
transactions) of ₱6.2 billion in 2019 represented a CAGR of 22.4% from 2016 to 2019.
In recent years, the Group believes it has successfully reinvested the returns from its core businesses; the Group re-entered the power
business through FDCUI, which recorded net income of ₱2.5 billion in 2019 after only commencing operations in late 2016. The
Group’s sugar business has also delivered steady returns.
Diversified Earnings Stream Protecting Against Volatility
With business interests in the banking and financial services, real estate, power, and sugar industries, the Group has diverse earning
streams both across and within its businesses, which helps protect the Group’s returns amidst changing industry conditions from time
to time. In 2019, the Group’s real estate, hospitality, banking and financial services, power operations, and sugar operations accounted
for 36.9%, 4.0%, 43.1%, 12.0%, and 4.0% of the Group’s consolidated revenues and other income.
With respect to its real estate businesses, the Real Estate Subsidiaries have continually broadened their earnings base in terms of product,
geographic and market segmentations, primarily through an aggressive office, retail and hotel development program. From an aggregate
380,000 sq.m. as of December 31, 2014, the Group’s office and retail leasing portfolio has more than doubled to 834,000 sq.m. as of
December 31, 2019. With its development pipeline expanding to Clark, Cebu and other areas, the Group has begun to establish a more
Philippines-wide national revenue stream, which it expects to insulate its real estate business from concentration in the Metro Manila
area. The Group has also particularly focused on its hospitality business in recent years; this segment has grown from 290 keys managed
in 2010 to approximately 1,800 as of December 31, 2019, capitalizing on strong demand from the meetings, incentives, conventions and

56
exhibitions (MICE) sector, as well as higher demand for quality resorts in line with the development of the country as a regional tourist
destination..
The Group’s banking and financial services, as part of its medium term strategy, has also begun to add to its complement of products
and services geared towards its target market of retail customers and middle-market corporate customers. EW’s recent bancassurance
joint venture with Ageas has complemented its existing products with insurance products backed by Belgium’s leading insurance
companies according to Assuralia.
Apart from its core businesses, FDC has also continued to diversify its revenue and asset base. The Sugar Subsidiaries continue to
provide the Group with a steady revenue stream with a base in Mindanao, which has proven resilient despite market fluctuations, and
has also been adaptable to the changing nature of the industry. The Group’s power business, which commenced commercial operations
towards the end of 2016, has also immediately contributed to the Group’s financial results as demand in Mindanao remains strong. The
Group has further diversified its exposure to power through new ventures in renewable energy and environment-friendly urban solutions
such as solar power, district cooling system, and water and wastewater services. In the infrastructure space, the Group also expects that
it will begin to generate revenues from its operation and maintenance contract for the CIA upon turnover of the airport. Finally, following
the award of a provisional gaming license by the Philippine Amusement and Gaming Corporation in April 2018, the Group is planning
to extend the scope of its hospitality business to include an integrated resort within the Filinvest Mimosa+ Leisure City development
comprising, among other things, a casino to be operated by a third party, a lifestyle mall, 5-star hotel and an events venue.
Disciplined and Strategic Financial Management
The Group adopts a centralized approach to capital allocation decisions across its businesses, which allows the Group to efficiently
allocate its resources to high growth opportunities and regions. The Group believes its financial strength and conservative leverage
enhances its ability to expand and further diversify its business through ready access to capital and financing at competitive rates,
allowing it the flexibility to quickly capitalize on business opportunities as they present themselves.
The Group believes each of its business segments has a strong financial position and a stable earnings base. FDC’s position of majority
ownership in the Group’s businesses, along with its leadership team committed to prudent financial management and growth, assures
that cashflow from these businesses are efficiently managed and allocated efficiently according to the Group’s requirements and strategic
objectives. The Group’s stable earnings are complemented by its relatively low leverage in its non-financial services businesses, which
provides significant capacity to take advantage of growth opportunities whether by expansion, acquisitions or other business
combinations and partnerships. FDC has taken advantage of these strong financial fundamentals by being one of the first Philippine
conglomerates to regularly tap both domestic and international debt capital markets through bond issuances. In turn, its financial
discipline and credibility has been confirmed by both investors and financial institutions such as external ratings agencies, which have
consistently assigned bond issuances of FDC and its subsidiaries PRS Aaa, the highest possible rating for a bond. The Group believes
these top-tier ratings are warranted due to the following key considerations: FDC’s steady earnings and diversified business portfolio;
maintenance and good credit standing even in times of financial crises; strong financial flexibility; established brand names and good
market position of its key subsidiaries; its subsidiaries operating in growth industries; the conservative and professional stance of
management; and FDC’s new investments (e.g., power and infrastructure) which the Group expects to significantly contribute to
profitability in the medium-term.
In June 2019, Philippine Rating Services Corporation (Philratings) has maintained a credit rating of PRS Aa Plus (corp.) to EW. A
company rated PRS Aa Plus (corp.) differs from the highest rated corporates only to a small degree, and has strong capacity to meet its
financial commitments relative to that of other Philippine Corporates.
In July 2019 Philratings has maintained the PRS Aaa Issue Credit Rating with a Stable Outlook for each of the following outstanding
bonds of FLI aggregating to P22.0 billion: (i) P4.3 billion bonds due in 2020, (ii) P5.3 billion bonds due in 2021, (iii) P7.0 billion bonds
due in 2022, (iv) P2.7 billion bonds due in 2023, (v) P1.7 billion bonds due in 2024, and (vi) P1.0 billion bonds due in 2025. Obligations
rated PRS Aaa are of the highest quality with minimal credit risk. FLI’s capacity to meet its financial commitment for its obligations is
strong. PRS Aaa is the highest rating assigned by Philratings. The rating takes into account the following key considerations: (a) FLI’s
established brand name and track record, with geographically diverse real estate products and substantial land bank for future expansion;
(b) its sound growth strategies, focused on building a balanced mix of real estate sales and recurring income; (c) its strong income
generation and positive cash flows; and (d) the continued favorable outlook for the property industry despite a slowdown in economic
growth.
In October 2019, Philratings has maintained its Issue Credit Rating of PRS Aaa, with a Stable Outlook, for FDC’s outstanding bond
issue of ₱8.8 billion. PRS Aaa is the the highest credit rating on PhilRatings’ long-term issue credit rating scale. PhilRatings identified
the following key strengths: a) FDC’s stable revenue stream from its diversified business portfolio; b) the company’s main contributing
subsidiaries, in terms of income and cash flows, have a proven track record and have established brand names; c) FDC’s conservative
and professional management; and d) growing and well-positioned businesses, particularly in real estate and banking.

57
Trusted Business Partner with History of Successful Collaborations
The Group has built a strong reputation as a trusted partner with a track record of collaborating on successful projects. In the 1990s, the
Group’s real estate business partnered with the Government on Filinvest City, a 244-hectare CBD which has provided a viable alternative
for businesses and establishments outside the greater Metro Manila area. The Group has also partnered with the Cebu City Government
for the joint venture development of a portion of the SRP, a reclaimed land project located in Cebu City. The Group holds 50.4 hectares
in the SRP, of which 40 hectares is subject to the joint venture development. In addition, the Group has also partnered with CDC and
BCDA for the development of Filinvest Mimosa+ Leisure City and New Clark City, respectively. These collaborations clearly show the
confidence of national and LGUs in the Group’s ability to add value and expertise to the significant projects.
As the Group has diversified into other product lines and businesses, it has tapped experienced international partners and strategically
outsourced to more established industry players to supplement its in-Group management team. For example, the Group has entered into
arrangements with Engie for its district cooling and solar paneling business; with Ageas for EW’s bancassurance business; PIC, a third-
party operator affiliated with Marubeni Corporation (one of the leading global trading companies), for the operation and maintenance
of the Group’s power plant; HAQT for processed water solutions across the Philippines; Mitsubishi Corporation for the development of
a multi-tower mixed-use complex within Filinvest City; and Changi Airports Philippines (I) Pte. Ltd. (wholly owned by Changi Airports
International) for the operation and maintenance of the Group’s Clark Development airport project. The Group’s Chroma has also built
a hotel management team with a significant percentage of expatriates holding GM, Executive Chef and key positions in Chroma to
ensure the Group’s hospitality properties adhere to international standards.
The Group believes that these collaborations have enhanced its reputation in the market as a viable partner for Government and
international stakeholders for their large-scale and important projects in the Philippines. On the other hand, the Group believes it has
greatly benefitted by garnering technical knowhow, best practices and operational experience from the partners it has worked with,
which it can apply to its operations and new businesses moving forward.
Experienced Management Team
The Group’s management team has extensive experience in, and in-depth knowledge of, the Philippine real estate market, the financial
and banking services industry and the sugar business. Members of the Group’s management team have an average of more than 30
years’ experience in their respective businesses, such experience spanning market downturns and volatility, financial crises and political
and global economic changes. Several members of the management team have post-graduate degrees from well-known business schools
in the United States. The Group believes its growth and strong financial performance are indicative of the capabilities of its management
team. The Group believes that the market experience and knowledge that its key members of management possess across each of the
Group’s businesses and the business relationships they have developed in the various industries in which they are involved have been,
and will continue to be an integral part of the Group’s growth strategy.
Competitive Strengths of the Group’s Operating Segments
The Group believes that the principal strengths of its operating segments are the following:
Real Estate Operations and Hospitality Operations
The Group has been active in the real estate business for over 40 years and the hospitality business for over 10 years. FLI focuses on
residential, office, industrial and retail developments, while FDC handles the leisure and hospitality, or hotel development segment.
FAI was formed primarily to develop Filinvest City, an alternative CBD in Muntinlupa City with a significant land bank available for
development, and where the Group focuses on office and commercial leasing, particularly to BPOs, as well as high-end vertical
residential developments.
Real Estate Operations
The Group believes its real estate business possesses the following principal strengths:
• Recognized brand in affordable and middle income housing.
• Extensive nationwide and international sales channels.
• A pioneer and major player in office development and leasing.
• Proven record in township and land bank value creation.
• Strong credit record and bond issuance track record.
Hospitality Operations
The Group believes its hospitality business possesses the following principal strengths:
• Full range hospitality products targeting various market segments.
• Ability to quickly build brands with strong recognition such as Crimson and Quest.
• Synergies as part of the Filinvest Group.

58
Banking and Financial Services
Since its formation in 1994, EW has experienced strong growth. The Group believes EW is well-positioned in the Philippine market
due to the following principal strengths:
• Strong focus on and growing market position in high growth consumer segments.
• Strategically located store network.
• Differentiated services tailored to mid-market corporates and retail customers.
• Prudent balance sheet management to manage a predominantly consumer loan portfolio.
Power Operations
FDC, through its wholly owned subsidiary FDCUI, re-entered the power industry in 2009 to further diversify its business. The Group
believes FDCUI’s principal strengths include:
• Largest baseload facility in Mindanao with significant capacity for expansion.
• Well-positioned to capitalize on attractive power industry growth opportunities in Mindanao, a region with high expected demand
in the medium term.
• Risk mitigated business model with predictable cash flows supported by long-term power supply agreements with distribution
utilities with high credit ratings.
• Clean coal circulating fluidized bed technology providing more environmentally sustainable energy.
• Established relationships with world-class energy players for plant construction, turbine supply, operations and maintenance, as
well as renewable energy projects.
• Diversification into other high growth sectors.
Sugar Operations
The Group’s sugar business, conducted through PSHC, believes it possesses the following principal strengths:
• Adaptable business model with vertical integration based primarily in attractive Mindanao market.
• In-house corporate farm to enhance productivity and efficiency through innovation.
• Strategic location with natural barriers to entry.
• Long-standing relationships with growers and traders.
Business Strategy of the Group
The Group’s strategy is to actively grow its business portfolio in a disciplined and systematic way and to benefit from the recent positive
economic growth and favorable social trends in the Philippines in each of its segments. Having built a strong business foundation for
growth in each of its subsidiaries, the Group plans to unlock and maximize its subsidiaries’ values through accelerated development and
greater market reach (in terms of product offerings and geographical coverage), and intends to supplement organic growth through
mergers and/or acquisitions to the extent such opportunities arise.
The Group’s specific strategies to implement these objectives are as follows:
Leverage on its Foundation for Growth to Scale-up Businesses
The Group believes that it has been successful in expanding its businesses in the last few years as a foundation for future growth, and
now aims to capitalize on such efforts in the near- to medium-term by scaling up and optimizing operations across its businesses, and
further improving cost efficiencies. Across all its businesses, the Group intends to capitalize on its nationwide presence and knowledge
of local conditions and relationships in order to maintain its growth by tapping into more markets and keeping pace with the growing
importance of the provincial areas. It will aim to optimize its current business knowhow as well as spread its base infrastructure by
introducing its products to new regions and a provincial customer base. The Group will seek to achieve these while at the same time
keeping to its broader general strategies of focusing on the continued consumption growth of the affordable and middle market sectors.
Specifically with respect to its main businesses, the Group intends to:
• Real estate and hospitality – focus on specific markets with sufficient demand and depth, such as Cebu and Clark, while diversifying
its revenue sources and broadening its product offerings to prepare it for and insulate it from changing consumer demand. The
Group’s property trading business focuses on the largest segment of the Philippine population, according to Colliers, as well as
provides products within the pricing range of the key OFW market;
• Banking and financial services – continually implement its optimization strategy across its nationwide store network, aiming to
maximize the profitability of its existing stores after having aggressively grown such network in the last 3 years. EW is also targeting
to achieve a more balanced portfolio of high-cost and low-cost deposits, which would insulate it from changing consumption
patterns and the volatility of the financial markets;

59
• Power – scale up operations and secure sufficient demand for the additional 2 x 135 MW expansion capacity of its Misamis plant.
It also intends to build its RES business within the RCOA regime; and
• Sugar – continue achieving cost reductions in its production process, which has smoothed its earnings over the past few years
despite changing market dynamics.
Accelerate Monetization of Land Bank
The Group believes it has utilized its long experience in the real estate market to build up a considerable and strategically located land
bank which features ideal geographic access, key elements, base infrastructure, all with the reputational standing of the “Filinvest”
name. One of the Group’s key objectives is to accelerate the monetization of this land bank through a combined strategy of:
• continued strong sales of land and vertical development products, increased vertical recurring income development and
monetization of assets through potential REIT opportunities; and
• minimizing land carrying cost through more interim land leases.
The Group believes that the maturity of its large-scale, master-planned townships will allow it to accelerate monetization of specific
portions of its land bank, given the property price increases in these areas brought about by the Group’s improvements and township
projects, as well as the continued economic growth of the Philippines in general.
Continue Building Up Its Investment Portfolio and Potentially Participate in the Investment Trust Markets
The Group intends to continue building up its investment portfolio in office, retail and hospitality. The Group believes that these
segments of its businesses focus on the BPO and tourism industries, which are among the key drivers of the Philippine economy. The
Group aims to take advantage of its strategically located land bank located in key regional centers across the Philippines, which will
allow it to accelerate the growth of its recurring income portfolio in line with market demand. Related to this, the Group will closely
monitor the development of the REIT market and regulations in the Philippines, as it believes its portfolio of recurring income properties
is well-suited for a REIT vehicle. The Group intends to participate in the REIT markets as the Group believes that a Government-
supported REIT market with incentives in line with other regional REIT markets would improve the Group’s financial returns from its
investment portfolio and provide it with another avenue of unlocking value from its assets for stakeholders. The Group will also aim to
develop complementary businesses arising from the REIT market, such as potential asset or property management opportunities.
Tapping Opportunities with Closer Relations and Access to China Markets
The Group believes that the current Government’s policy of increased trade and cooperation between the Philippines and China opens
up greater opportunities for most of its business sectors. It intends to seek new business or ensure its current businesses can benefit from
the expected economic growth related to stronger ties with China. For example, with respect to its core real estate business, the Group
intends to rollout projects and offerings that will cater to the expected office and residential demand from the China outsourcing segment
as it further increases its footprint in the Philippines. Consistent with the Group’s focus on tourism, the strong growth of Philippine-
bound travel from China according to Colliers is expected to present opportunities for the Group’s hospitality and airport infrastructure
businesses. Moreover, the expected increase in China-Philippines economic cooperation in areas such as infrastructure and public
works, energy, industrial park development, processing and manufacturing, among others, may impact the Group’s power operations
(which supplies primarily to locators within the PHIVIDEC Industrial Estate), as well as its industrial and logistic parks in New Clark
City.
Continue to Explore and Maximize Synergies within the Group
The Group believes that maximizing synergies across its businesses is an immediately effective means of optimizing profitability. The
Group plans to more actively explore and pursue synergies across its business lines. As a particular example, Chroma and FHC will aim
to maximize the economies of scale of the Real Estate Subsidiaries by developing and establishing hospitality projects in the Group’s
mixed-use developments. In addition, the hotel management services that Chroma provides for FLI’s condotel offerings foster customer
confidence that such developments are professionally managed in line with regional standards and best practices.
The Group has also begun to venture into new business segments through ancillary enterprises. Such focused enterprises develop
expertise in their respective areas and allow the main businesses to focus on their core competencies. Examples of these can be found
in the Group’s infrastructure business, which has established district cooling and air handling O&M businesses in partnership with
Engie; the Group’s banking and financial services business, where EW has entered into the bancassurance business in partnership with
Ageas; the Group’s power business, where FDCUI has been able to provide cheaper power to the Group through its RES subsidiary;
and also in the Group’s real estate and hospitality business, where CWSI has been providing water and waste water services.
In a broader sense, the Group will seek to maximize the benefits derived from the bulk bidding practice and volume discounts only
available to conglomerates of its scale in areas such as communications, software and other services. The Group is also exploring
potential cross-selling and loyalty initiatives across its business segments.

60
Accelerate Digital Transformation, Sustainability and Other Modernization Initiatives across its Businesses.
The Group has always strived to keep abreast of advancements in technology with respect to its businesses. It aims to continue initiatives
by EW to modernize operations primarily by updating its mobile service platforms to keep pace with the entry of FinTech competitors
and other banks in the country. In line with its sustainability programs, the Group intends to continue implementing its initiatives,
including smart and LEED® (Leadership in Energy and Environmental Design)-registered initiatives, in district cooling, water recycling,
and solar panel roofing, among others, with respect to its real estate and infrastructure developments and projects. For the hospitality
business, the Group intends to continue building on its successful online presence, and apply the same to its other businesses as relevant.
The Group will aim to complement this and its other external and client-facing technological improvements by continuing to implement
modernization initiatives with respect to its back-end and internal systems.
Continue to Selectively Pursue Acquisition and Partnership Opportunities, Particularly in Complementary and Sustainable
Businesses.
Building from its successful entry into additional business lines such as power and hospitality and leveraging its reputation as a trusted
partner for local and international companies looking to establish initial or greater presences in businesses with growth potential in the
Philippines, the Group will continue to selectively explore opportunities to acquire businesses or enter into partnerships or joint ventures,
particularly with complementary and sustainable businesses. The Group has already made inroads into the infrastructure industry with
its participation in 2 separate consortiums for large-scale development of key infrastructure projects aimed at increasing economic
growth, tourism and consumer demand in the country. In hospitality, the Group will seek to enter into specific third party management
agreements with potential partners in order to build up its portfolio without having to build new keys and to strengthen its brands in key
markets. Further, the Group is targeting to enter into partnerships with other hotel developers to acquire best practices knowhow in
unfamiliar jurisdictions and gain access to land that is uniquely situated. In power, the Group will build up its relationship with Engie
and continue to seek out strategic partnerships, especially in the sustainable and renewable energy spaces, to accelerate its development
as a key market player. In particular, the Group is exploring potential business partnerships with respect to desalination technology,
which, if successful, can be utilized across several of the Group’s business lines.
Business Strategy of the Group’s Operating Segments
The specific strategies of each of the Group’s operating segments to achieve the Group’s objectives are outlined below.
Real Estate Operations Strategy
The Real Estate Companies intend to further accelerate growth and improve their return on equity by aggressively developing their land
bank while retaining their current focus on the high-growth affordable and middle market segments where the Real Estate Companies
believe they have a competitive advantage based on their current strong position. The Real Estate Companies have the following
strategies:
• Continue product, market and geographic diversification to strengthen leadership position in the affordable and middle market
segments. In real estate trading, the Real Estate Companies plan to capitalize on their strong position in the affordable and middle
market segments to increase their market share. Driven by strong underlying demographic fundamentals with buyers representing
the largest subset of house buyers in the Philippines, and highly fragmented supply, the Real Estate Companies believe that these
segments provide favorable demand-supply dynamics and attractive margins. The Real Estate Companies plan to maintain their
strong position in the affordable and middle market segments by expanding their product offerings and land bank into selective
regional markets. In particular, the Real Estate Companies plan to offer more inner city mixed-used developments and MRB
products to capture the growing demand for these types of products in greater Metro Manila, Cebu, and Davao.
• Continue to build up recurring income streams and capitalize on Real Estate Investment Trusts (REITs) opportunities. In addition
to retaining their position as one of the leading residential house and lot developers in the Philippines, the Real Estate Companies
intend to continue to increase recurring rental income through the expansion of their commercial office and retail space leasing
operations. The Group intends to achieve this by, among other things, increasing occupancy at their newer malls and other
commercial projects, rolling out new leasing projects, enhancing their existing investment portfolio through proactive leasing and
management, and capitalizing on their extensive real estate experience, scale and access to resources. The Group also believes that
the development of REITs in the Philippines, subject to finalization of relevant regulations and incentives, will provide the Group
with new opportunities to unlock and accelerate the growth of its recurring income portfolio.
• Accelerate monetization of land bank. The Real Estate Companies believe that there is currently significant unrealized value in their
land bank based on the historical low cost carrying value of such land bank on their balance sheet. In particular, the Group believes
that the available land bank in their townships, such as Filinvest City (88 hectares) and Clark (278 hectares), has reached sufficient
maturity in its product cycle. The Group believes that it is now the opportune time to take advantage of the appreciation in value
of such land bank and accelerate monetization through land sales, or establish vertical trading developments or developments to
generate recurring income. In addition, given the current projects in their pipeline, the Real Estate Companies believe they can
benefit from the country’s strong economic fundamentals to accelerate the pace of new project launches. For their higher value raw
land portfolio, the Real Estate Companies plan to develop higher density and higher value-added projects, such as residential
buildings, office buildings and retail malls, with a view to optimizing the revenue per sq.m. generated from such land bank.
61
• Targeted vertical operations integration and digitization to improve cost efficiency. The Group plans to continue initiatives to
further integrate their operations. As an example, the Group has established a separate construction company to undertake
construction of specific projects and products, such as MRBs, to improve its cost competitiveness. Moreover, the Group has
embarked on targeted digitization processes, such as the use of building information modeling for design, as well as the acquisition
and implementation of other software for bidding and project management, all in an effort to improve both cost and process
efficiencies.
Hospitality Strategy
The Group intends to grow its hospitality business to take advantage of the Philippines’ strong economic fundamentals and travel and
tourism trends by efficiently developing and operating new hospitality products in underserved markets.
• Diversify product offerings and geographical reach. The Group intends to diversify its product offering in the hospitality sector, by
continuing to develop 3 main hospitality brands catering to distinct market segments through FHC. The Group’s Crimson brand
caters to the high end market segment while the Quest and Quest Plus brands target middle market families and business lodging
with emphasis on the MICE segment. The Group’s next brand to be launched is the Grafik brand which will cater to millennial and
other younger guests. The Group also intends to take advantage of the Philippines’ strong travel and tourism trends by building
more hotels, primarily under the Quest brand, in underserved markets in Luzon, Visayas and Mindanao, which each have an
increasing lodging demand. FHC also looks to invest in destinations with potential for upscale properties that cater to both foreign
and domestic markets.
• Enhance synergies with the Group. For its future hospitality projects, the Group will seek to maximize intra-Group synergies. FHC
also plans to invest in land and develop hospitality projects in areas where the Group’s larger mixed-use developments are located.
Alongside FHC, FDC plans to develop hotel projects through its various other subsidiaries.
• Cultivate Crimson, Grafik and Quest brand equity by optimizing hotel developments and renovations, operations and services. The
Group intends to continually optimize key facets of its hospitality business, including hotel development, asset enhancements and
operations and services to improve value to shareholders and customers and ultimately cultivate its Crimson, Grafik and Quest
brand equity. With respect to revenues, the Group will seek to continue maximizing its total revenues per available room, which
has enjoyed double digit growth over the past 2 years, by efficiently cross-selling non-room offerings, such as meetings and
convention facilities, banquet and food and beverage. The Group will also continue to invest in resources including training
programs and IT-related systems to drive guest satisfaction and enhance customer loyalty and repeat business. The Group will also
seek to implement a training infrastructure that it believes will not only encourage a culture of learning and growth but also produce
home-grown talent that will reduce the ramp up period for new hotels.
• Maximize marketing reach and distribution channels. Another key focus of the Group is to maximize its current and develop new
distribution channels for its properties and products. The Group will seek to further develop its non-traditional distribution channels,
with a particular focus on optimizing its marketing through technology. The Group is continuously working on optimizing its online
advertising placements, its search engine optimization, its mobile-friendly website and chatbot support. The Group is also
continously exploring new distribution channels as they emerge. The Group believes that online channels, in addition to helping
reduce marketing costs, are a significant avenue through which to reach and retain its hospitality customers, improve the customer
booking experience, and improve the Group’s ability to compete with local and international competitors. In 2018, approximately
30% of the Group’s hospitality customers were repeat clients, and the Group believes its online sales channels are a key driver of
this repeat business. To complement its online presence, the Company will also ensure that its traditional channels such as sales
agents effectively market the Group’s new and upcoming offerings, especially in key international markets such as China, Japan
and Korea.
• Explore third party management opportunities and joint ventures with third party hotel developers. The Group may also selectively
offer and undertake third party management arrangements and joint ventures with third party hotel developers for projects that meet
the brand’s criteria. The Group believes that selectively exploring these opportunities with local or foreign companies which have
compelling experience or technical knowhow will allow more rapid expansion of its hospitality business especially in unfamiliar
jurisdictions and gain access to land that are uniquely situated.
Banking and Financial Services Strategy
The Group intends to continue to grow EW as a significant competitor in the Philippine financial services industry. To achieve this
growth, the Bank has strategically opted to target its financial products and services to the consumer, middle-market corporate and mass
affluent market segments. The Bank believes these market segments offer significant growth opportunities while also enabling the Bank
to manage its risk exposure by maintaining a balanced portfolio mix. Given the competitive landscape of, and the Bank’s position within,
the Philippine banking industry, the Bank has identified the consumer segment as a key target market. EW envisions itself to be a leading
bank, anchored on and differentiated from its competitors through a strong focus on retail banking resulting in a healthy return on equity.
EW believes it has proven its success within the consumer market by achieving significant competitive traction in a relatively short
period of time. Over the next few years, EW’s priorities are to continue its efforts to improve the operating leverage, cost efficiencies
and overall competitiveness of the Bank. EW’s business strategies are set out below.

62
• Enhance the professional development of EW employees. EW believes that the success of its business strategies is dependent on
the ablity of its employees to execute those strategies. To this end, the Bank is focusing on developing its employees to ensure they
are equipped with the relevant competencies and skills required to perform their functions and deliver excellent customer service.
By instilling in its employees a sense of common purpose and direction, the Bank aims to develop a workforce whose values are
aligned with the corporate values of the Bank. To achieve this, the Bank will continue to provide its employees with relevant training
and development through the EastWest Bank Learning and Development Program. The Bank aims to enhance its Learning and
Development Program and institutionalize the EW Academy in order to speed up the development of EW employees. EW also
plans to further refine its performance management processes to ensure that it is able to identify, reward, and retain high-performing
employees. EW believes that its commitment to facilitate the career development, expertise and service quality of employees, as
well as its ability to develop and retain them, will enable EW to attract and retain skilled personnel and effectively support its
broader optimization and sales goals.
• Optimize existing store network. EW is focused on taking advantage of its store network by optimizing the revenues and income
generated from its customers. EW has built a nationwide network comprising 467 stores on a consolidated basis, including 391 EW
stores and 76 EWRB stores as of December 31, 2019. As more than 70% of EW’s consolidated stores were built during the Bank’s
expansion program between 2012 and 2016, such stores have yet to attain competitive productivity. EW will continue to focus on
improving store productivity, in particular, in relation to increasing customer deposits and acquiring and retaining customers,
primarily through its marketing programs and approach to customer service. The Bank plans to apply its marketing efforts to fine-
tune its market segmentation, expand its digital sales channel and improve the competitiveness of its product offerings. Relatedly,
the Bank will look to expand the range of products for its target market of mid-market corporates and consumer segments, deepening
and broadening relationships with existing customers, including generating more synergies with other businesses within the Group,
and marketing more products and services to new and existing customers, all in an effort to increase EW’s “share of wallet” from
such customers.
• Achieve balanced portfolio mix while maintaining a consumer and corporate mid-market focus. EW aims to manage its exposure
to economic risk by achieving a balanced portfolio mix of loans with relatively higher economic risk (such as consumer loans,
excluding salary loans to teachers) and loans with specific risk relative to the broader economy (such as commercial and corporate
loans). EW intends to achieve greater balance within its loan portfolio by increasing the pace of growth of middle-market corporate
loans as the country’s economy grows, while continuing to maintain the growth in its consumer loan segment. EW plans to
implement initiatives towards increasing transactions with existing customers, for example, by cross-selling products and offering
additional services tailored towards consumer and middle-market corporates as it expands its distribution networks. EW believes
that achieving a more balanced loan portfolio will enable it to improve its risk management, thus ensuring it is in a stronger position
to withstand the fluctuations of the business cycle.
• Enhance customer experience. EW is focused on differentiating itself from its competitors by providing an enhanced customer
experience. EW’s customer service efforts involve improving the customer experience through better responsiveness and
competence of the Bank’s customer-facing departments. EW also seeks to improve the accessibility and convenience of banking
services for its customers by developing its digital service channels and enhancing its operational and IT processes. EW believes
that improving the interface between the Bank and its customers, as well as the efficiency of its services will help to supplement
efforts to optimize earnings from all facets of its banking channels.
• Enhance digital efforts. EW plans to focus on improving and expanding its digital service channels in order to streamline work
processes, improve cost efficiency and improve the customer experience. EW believes it has built up a competitive IT infrastructure
as a result of placing significant emphasis on its digital projects. To continue improving and expanding its digital service channels,
EW is undertaking initiatives in four key areas: open banking, data analytics, customer interface and continuous development. The
Bank also continues to invest in its mobile and online channels. EW believes that by improving the interface between the Bank and
its customers and enhancing the efficiency of its services, EW will create a better experience for its customers and optimize its
operational costs.
• Strengthen risk management and governance framework. EW will continue to enhance its various risk monitoring and management
tools to improve its risk management capabilities and the quality of its loan portfolio by continuing to (i) improve its credit policies
and credit approval procedures, (ii) implement risk management control tools, including, among others, a centralized credit
management information system that allows it to standardize credit risk detection, quantification and management and (iii)
strengthen internal controls and legal compliance by standardizing internal policies and procedures in accordance with legal and
regulatory requirements with a view to establishing a comprehensive internal control system.
Power Operations Strategy
The Group intends to continuously develop its power generation capabilities, take advantage of the expected growth in demand, as well
as pursue other opportunities selectively.
• Capitalize on favorable regional and industry dynamics. The Group is seeking to capitalize on its strategic location in Mindanao,
which despite a current surplus of power supply, still provides opportunities due to such factors such as climate change and
63
Mindanao’s ageing hydroelectric power plants for the Group to maximize its existing power generating capacity. The Group also
believes that its location in the PHIVIDEC Industrial Estate allows it to benefit from the increasing number of industrial projects
being established there, providing it with a competitive pricing advantage vis-à-vis other power generators in the region by means
of its close proximity.
On the industry side, the expected start of commercial operation of the WESM and the implementation of the RCOA regime by
2021 as well as the interconnection of Mindanao to Visayas and Luzon by the end of 2020 will further provide long-term
opportunities for the Group to maximize its power generating capacity and grow its asset base across the Philippines. The Group
will aim to take advantage of these developments to expand the reach of its generation operations and broaden its customer base,
as it will be able to directly and more easily tap commercial and industrial customers not being served by distribution utilities to
which the Group currently supplies energy.
• Continue to build the RES business to diversify revenue streams and take advantage of open access. The Group will target to build
its RES business to complement its revenues from its power supply agreements. The commercial operation of the WESM and the
implementation of the RCOA regime in Mindanao is expected to provide opportunities for the Group to increase its participation
in this more open retail electricity market. As most industrial and commercial participants in the RCOA are expected from the major
load centers in Mindanao (namely Davao City and Cagayan De Oro City), which are currently served by distribution utilities that
are not offtakers of FDCUI, the Group expects to offer a competitive supply without affecting its current supply contracts. The
aforementioned distribution utilities likewise have the highest tariffs among Mindanao distribution utilities due to their supply
portfolio, which includes diesel gensets. In addition, with the interconnection of Mindanao to Visayas and Luzon, the Group expects
to be able to offer competitively-priced power to industrial and commercial customers in Visayas and Mindanao, which customers
will be able to source their supply from the FDC Misamis coal plant at a lower and stable price, rather than sourcing from other
generators and the WESM at market price, as is currently being practiced. By growing its electricity trading platform, the Group
believes it can establish a more nationwide presence for its power business. This will also allow the Group to diversify its revenue
streams and smoothen its earnings from its power operations.
• Continue to explore and pursue renewable energy projects. The Group will continue to pursue opportunities arising from ongoing
market changes in the power industry as outlined in the RE Act of 2008. The RE Act of 2008 provides market-based mechanisms
and specific project incentives to drive the development of renewable energy projects. Project incentives include income tax holiday,
lower duty-free importation, exemption from universal charge, cash incentive for missionary electrification and zero percent value-
added tax rate. Market-based mechanisms for renewable energy consist of the feed-in tariff, renewable portfolio standards and green
energy options. As such, the Group will seek opportunities to balance its existing portfolio by accelerating the development of
renewable energy projects such as geothermal, hydropower, biomass and solar energy. The Group has already begun these
initiatives through FREE, its joint venture company for renewable energy solutions with Engie.
• Selectively participate in the bidding for Government and private power generation assets. The Group envisions growing its power
generation capacity through both the development of greenfield projects and strategic acquisitions. The Group is seeking to gain
market share in the power generation industry by selectively participating in the acquisition of government-owned and privately-
owned power generation assets. The Group is closely monitoring all acquisition opportunities in the market, and has been conducting
due diligence in advance to prepare for any future rounds of bidding. The Group aims to participate only in those projects which
meet its internal investment goals, from both a financial and a strategic perspective.
• Pursue niche marketing and strategic partnerships. The Group plans to develop projects where it believes it has a competitive
advantage in terms of cost and reliability. The Group believes that its existing main location in the PHIVIDEC Industrial Estate
allows it to benefit from the growth in industrial projects being established in the area. The Group expects prospective industrial
locators to benefit from contracting their supply with the Company due to savings as a result of having more stable prices, as
compared to purchasing from the WESM, and reduced distribution charges as a result of the proximity of the power plant to their
facilities, which the Group believes provides it with a competitive pricing advantage vis-à-vis other power plants in the region. The
Group intends to utilize the incentives offered under the RE Act on the development of projects using renewable energy resources
such as geothermal, hydropower, biomass and solar energy. The Group plans to work with strategic partners, such as Engie Services
Philippines, which have specific interests in renewable energy development and to market FDCUI’s renewable energy expertise to
distribution utilities as well as commercial and industrial facilities.
• Enhance CSR initiatives. FDCUI, through its subsidiary, FDC Misamis, has been implementing social development programs in
partnership with host communities. These programs promote environmental stewardship, economic enrichment, enhanced health
care initiatives, education for empowerment and help create a positive impact on the communities surrounding the project site.
These CSR activities, where employees also actively participate and volunteer, are based on real needs of the community residents
as determined through a socio-economic baseline study of the host and affected villages. The Group also expects to partner with
indigenous people, local communities and LGUs in each location of its proposed projects to ensure unimpeded construction and
development.

64
Sugar Operations Strategy
Sugar Group’s main strategies are to augment cane supply, focus on cost efficiency, improve its human resources management and
pursue any opportunities available to develop its plants for power production.
• Augment cane supply by developing programs to improve farmer yields. The Group plans to continue increasing Sugar Group’s
sugar production and capacity utilization by expanding Sugar Group’s sugarcane supply from both independent farmers as well as
its own corporate farms. In particular, Sugar Group will seek to enhance its partnerships with farmers to encourage them to improve
their farm’s productivity and to plant sugarcane on agricultural land not currently being used for sugarcane production. In addition
to granting low interest crop loans, Sugar Group’s farmer assistance programs include the provision of technical advice. Since 2015,
Sugar Group has assisted planters (who decide to expand their farms) in the replanting of existing farms with new higher yielding
varieties by providing such planting materials to farmers free of charge. As the free canepoints program is a relatively recent addition
to the Group’s sugar business model, the Group expects this program to continue to accelerate the increase in cane supply for the
mills. Furthermore, Sugar Group intends to utilize technology to monitor farm activities for timely correction of deficiencies.
• Reduce production cost by enhancing plant maintenance program. A significant source of additional production cost is the
breakdown of factory facilities. In order to control recurring maintenance costs, Sugar Group intends to implement a preventive
maintenance program and condition monitoring to fix any damage to avoid long periods of downtime. Additionally, Sugar Group
will continue to implement the effective and efficient use of automation to simplify work and eliminate redundancy in the labor
effort.
• Develop human resources. Sugar Group is also focused on supporting its growth by expanding and improving its human resources.
Sugar Group plans to implement development programs primarily focused on strengthening the competencies of its employees
within: its cane supply department to improve employees’ ability to increase farm productivity, its production department in order
to ensure an efficient and trouble-free milling process, and its sales and marketing department in anticipation of increasing sugar
supplies. Sugar Group plans to leverage this stronger organizational platform to further increase its production and sales particularly
among industrial users and customers outside Southern Mindanao.
• Explore synergistic opportunities in the power sector, particularly in biomass. Sugar Group is also exploring opportunities in the
renewable power sector, including potentially upgrading its boilers and installing generators to produce power to support operation
at its facilities and excess power capacity which it can sell to the local distribution utilities. In particular, the Group is exploring
options of establishing a biomass plant to supplement sugar operations and also produce excess power.
ITEM 2. PROPERTIES
The Parent Company developed the Beaufort, a residential condominium in Bonifacio Global City, Taguig City, Metro Manila and
CRSM in Mactan Island, Cebu.
The Beaufort
FDC launched a premier residential condominium in Bonifacio Global City, Metro Manila in 2007 under the Filinvest Premiere Brand.
The condominium is located on a lot adjacent to the Manila Golf Club with 2 luxury residential towers rising atop a 6-level banking
podium, and a total of 41 storeys with 4 to 6 residential units per floor. Construction of the East and West Tower was in 2014.
2.1 Land Bank
The Group has invested in properties situated in what the Group believes are prime locations across the Philippines for existing and
future housing and land development projects. It is important for the Group to have access to a steady supply of land for future projects.
In addition to directly acquiring land for future projects, the Group has also adopted a strategy of entering into joint venture arrangements
with land owners for the development of raw land into future project sites for housing and land development projects to reduce the
capital expenditures for land and to substantially reduce the financial holding costs resulting from owning land for development.
As of December 31, 2019, FLI has a land bank of approximately 1,961.1 hectares of raw land for the development of its various projects,
including approximately 208.3 hectares of land under JVAs, which the management believes is sufficient to sustain at least several years
of development and sales. Details of FLI’s raw land inventory as of December 31, 2019 are set out in the table below (area in hectares).
Location Company Under % to
Owned Joint Ventures Total Total
Luzon Metro Manila 34.0 – 34.0 1.7%
Rizal 690.2 9.2 699.4 35.7%
Bulacan 252.1 – 252.1 12.9%

65
Location Company Under % to
Owned Joint Ventures Total Total
Bataan 12.3 – 12.3 0.6%
Pampanga – 32.1 32.1 1.6%
Tarlac 1.9 – 1.9 0.1%
Pangasinan 5.9 – 5.9 0.3%
Cavite 299.4 58.8 358.2 18.3%
Laguna 242.7 0.7 243.4 12.4%
Batangas 45.6 42.1 87.7 4.5%
Sub-total 1,584.1 142.9 1,727.0 88.1%
Visayas
Cebu 6.5 35.7 42.2 2.2%
Negro Oriental 51.0 – 51.0 2.6%
Negro Occidental 4.7 – 4.7 0.2%
Sub-total 62.2 35.7 97.9 5.0%
Mindanao Davao 5.2 29.7 34.9 1.8%
South Cotabato 101.3 0.0 101.3 5.2%
Sub-total 106.5 29.7 136.2 6.9%
Total 1,752.8 208.3 1,961.1 100.0%
% to Total 89.4% 10.6% 100.0%
2.2 Current Development Projects
The following are the most recently launched projects and projects with new phases and buildings as of December 31, 2019:
PROJECT TYPE LOCATION
Amarilyo Crest Horizontal Rizal
Pineview Horizontal Cavite
Sandia Horizontal Batangas
Tierra Vista Horizontal Bulacan
The Grove Horizontal Rizal
Savannah Place Horizontal Cavite
Futura Homes Palm Estates Horizontal Bacolod
Futura Homes Mactan Horizontal Cebu
Futura Homes Iloilo Horizontal Iloilo
Futura Homes Koronadal Horizontal South Cotabato
Anila Park Residences Horizontal Rizal
Aria at Serra Monte Horizontal Rizal
The Prominence Horizontal Quezon City
Futura Homes Davao Horizontal Davao
New Fields at Manna Horizontal Rizal
Meridian Place Horizontal Cavite
Valle Dulce Horizontal Laguna
Ventura Real Horizontal Rizal
Claremont Expansion Horizontal Pampanga
Southwinds Horizontal Laguna
Futura Zamboanga Horizontal Zamboanga
Enclave Horizontal Muntinlupa
New Leaf Horizontal Cavite
Mira Valley Horizontal Rizal
Hampton Orchard Horizontal Pampanga
Futura Mira Horizontal Calamba
Futura Plains Horizontal Rizal
One Oasis Cebu MRB Cebu
One Oasis Cagayan de Oro MRB Cagayan de Oro
Panglao Oasis MRB Taguig

66
PROJECT TYPE LOCATION
One Spatial MRB Pasig
San Remo MRB Cebu
Centro Spatial MRB Davao
One Spatial Iloilo MRB Iloilo
Marina Spatial MRB Dumaguete
8 Spatial MRB Davao
Maui Oasis MRB Manila
Alta Spatial MRB Valenzuela City
Bali Oasis MRB Pasig
Maldives Oasis MRB Davao
Sorrento Oasis MRB Pasig
Veranda MRB Davao
Futura East MRB Cainta
Centro Spatial MRB Manila
Belize MRB Muntinlupa
Activa HRB Quezon City
Levels HRB Alabang
Studio City HRB Alabang
On-going developments of the abovementioned projects are expected to require additional funds but FLI believes that it will have
sufficient financial resources for these anticipated requirements, both from debt financing and generation from operations.
FLI expects to remain focused on core residential real estate development business which includes MRB projects and high-rise
condominium projects, residential farm estates, entrepreneurial communities, and leisure developments in response to the demands of
the Philippine market. The Parent Company is also expanding its retail and office-building portfolio to generate recurring revenues.
In 2020, FLI intends to retain its dominant position as the leader in MRB projects by launching 7 new projects nationwide and 19
additional buildings of existing projects. Aside from the MRBs, FLI has pipelined 12 horizontal residential projects and 2 HRB projects.
Aside from the MRBs, FLI has pipelined 12 horizontal residential projects and 2 HRB projects.
Hospitality Operations
Currently, the Group has full scale operations in four properties located in Cebu City, Mactan, Muntinlupa City, and Clark, Pampanga.
Crimson Resort and Spa Boracay was opened in November 2018.
Its maiden project MSSI or the brand Crimson Resort and Spa Mactan is a deluxe 5-star property with 290 rooms, 40 of which are one-
bedroom villas with their own pools. Its main recreational facilities are its swimming pool and beachfront. It has 4 food and beverage
outlets and 2 ballrooms, Coral and The Hall which can cater to a total of 400 persons all at the same time. The flagship Azure Beach
Club was launched on October 24, 2014. The resort recently completed its renovation of the infinity pool, and opened the Spanish-
themed Enye restaurant in 2017. The property also launched the 3,700-sq.m. Crimzone, which features family-oriented facilities,
children’s play area, dedicated pool and snack bar. The construction of the 229-room expansion of the property with additional Food
and Beverage outlets and function spaces is on-going.
Quest Hotel and Conference Center, located in the heart of Cebu City, is a 3-star standard city hotel with 427 condotel rooms. It has an
all-day dining restaurant catering to the breakfast needs of guests and meeting requirements. Small meetings and conferences can be
hosted in its 10 meeting rooms for a total of 400 persons capacity. Not only does Quest provide for the business related needs of guests,
it also has a swimming pool for recreation.
EHSI or the brand Crimson Filinvest City Manila is a deluxe property with 345 rooms offered to guests. Strategically located in Alabang,
Muntinlupa City right across the Festival Supermall. It has a total of 3 food and beverage outlets with Café 8 as the all-day dining while
the Deck Bar is a highlight among its recreational facilities being located at near the swimming pool. Its ballroom can accommodate
events with as much as 350 participants and supported by 6 other smaller meeting rooms.
Quest Hotel and Conference Center Clark is a 4-star hotel located in the heart of Clark, Pampanga. Having been located in the beautifully
landscaped Mimosa Leisure Estate, the hotel offers everything expected from an international destination plus a 36-hole championship
golf course, a hub for duty-free shopping, nature walks & activities and a nightlife entertainment hub among others. The hotel itself has
303 newly-refurbished guestrooms, a grand ballroom, meeting rooms and an all-day Café. Its eight spacious meeting rooms can be set
up to accommodate the desired number of people. Its grand ballroom can host a total of 575 persons in a banquet set-up. Currently, the
hotel has the Café Mequeni and the Charley’s Tapas bar as its 2 food and beverage outlets.
67
Crimson Resort and Spa Boracay, one of the newest destinations in the island, is a 5-star resort situated in an exclusive location,
uniquely coined as Station Zero. With breathtaking views, pristine white sand beachfront and state-of-the-art facilities, the resort
features 192 keys inclusive of 23 villas. World-class outlets include Saffron Café, Mosaic Latin American Grill, Azure Beach Club
and J’s Pool Bar. A wide range of leisure activities and meeting facilities are offered through the Events Pavilion, Coral Ballroom,
Crimzon Kids’ Club, Aum Spa, and generous pool areas.
Quest Hotel Tagaytay will be a condotel property featuring 2 towers with 164 rooms each located along General Emilio Aguinaldo
Highway, Tagaytay City. Similar to QHCC Cebu, the condotel units are to be sold to third party buyers and will be subject to a
condotel participation agreement. The units will be operated and managed by CHI, which will distribute net income (after deducting
all expenses) to eligible unit buyers. Tower 1 began soft operations in April 2019 and was completed during the last quarter of 2019.
Construction of tower 2 is expected to commence in 2021 and tower 2 is expected to be operational in 2023.
Banking and Financial Services
The Bank’s head office is located in East West Corporate Center, The Beaufort, Fort Bonifacio Global City, Taguig City, Philippines.
The Bank believes all its facilities and properties are currently in good condition. As of date of this report, there are no liens or
encumbrances on any of the properties of EW. The Bank may consider encumbering some of its properties as part of its normal
supplementary funding operations. The Bank will continue to reconfigure the mix of its branches and adjust to the needs of its customers.
Power Operations
In 2016, FDCUI, through FDC Misamis, completed its 405 MW clean coal thermal power plant in Mindanao. The power plant is located
inside the 3,000 hectare PHIVIDEC Industrial Estate in Villanueva, Misamis Oriental and is connected to the new Villanueva Substation
of the National Grid Corporation of the Philippines. FDC Misamis signed in November 2012 a 25-year lease contract with PHIVIDEC
Industrial Authority which is exclusive of a 3-year construction period.
Sugar Operations
Milling and Refining Facilities
The annual sugarcane harvesting period in Mindanao generally begins during the dry season in November and ends in April the following
year. Once sugarcane is harvested, farmers in the vicinity of the mills are responsible for transporting the harvest directly to the mills,
generally by truck. The Sugar Group grants certain subsidies to assist most of its contract farmers with their transportation costs. The
Sugar Group monitors and coordinates harvesting and transportation operations among farmers to achieve an orderly and uninterrupted
schedule of cane supply to its sugar mills. At the beginning of each milling season, the Sugar Group surveys the size of the farmers’
crops and organizes the farmers’ harvesting and supply schedules, amounts of sugarcane delivered and payments through an electronic
database. Data is gathered for the Sugar Group’s entire production process, including data relating to sugarcane supply and the Sugar
Group’s factory operations.
Each of DSCC and CSCC has on-site packaging, distribution capabilities and inventory storage facilities. Each mill operates on the
basis of 3 eight-hour shifts during the milling season. Once every 2 weeks, DSCC shuts down the mill for about 16 hours for cleaning
of the evaporators while CSCC does not need to shut down by alternate use of its 2 sets of evaporators.
Factory Equipment
DSCC owns 1 sugar mill and 1 refinery. The sugar mill equipment includes the following: cane preparation equipment (cane knives and
shredder), 3 four-roller mills and 1 five-roller mill, boiling house equipment (heaters, clarifiers, vacuum filters, evaporators, vacuum
pans, crystallizers and centrifugals), turbo generators, 2 boilers and other accessories. The refinery equipment includes the following:
melters, affination centrifugals, talo-clarifiers, deep-bed filters, ion-exchange decolorization equipment, refinery evaporator, vacuum
pans, crytallizers, centrifugals, a dryer and cooler and other accessories. Steam and electricity are provided by 3 units of bagasse-fired
steam boilers and 3 units of turbo generators.
CSCC owns one sugar mill and a refinery. The sugar mill equipment includes the following: cane preparation equipment (cane knives
and shredder), 3 four-roller mills and 2 five-roller mills, boiling house equipment (heaters, clarifiers, vacuum filters, evaporators,
vacuum pans, crystallizers and centrifugals), 4 turbo generators, 2 boilers and other accessories. The refinery equipment includes the
following: melters, affination centrifugals, clarifiers, pressure filters, ion-exchange decolorization equipment, refinery evaporator,
vacuum pans, crystallizers, centrifugals, a dryer and cooler and other accessories. Steam and electricity are provided by 3 units of
bagasse-fired steam boilers and 3 units of turbo generators.
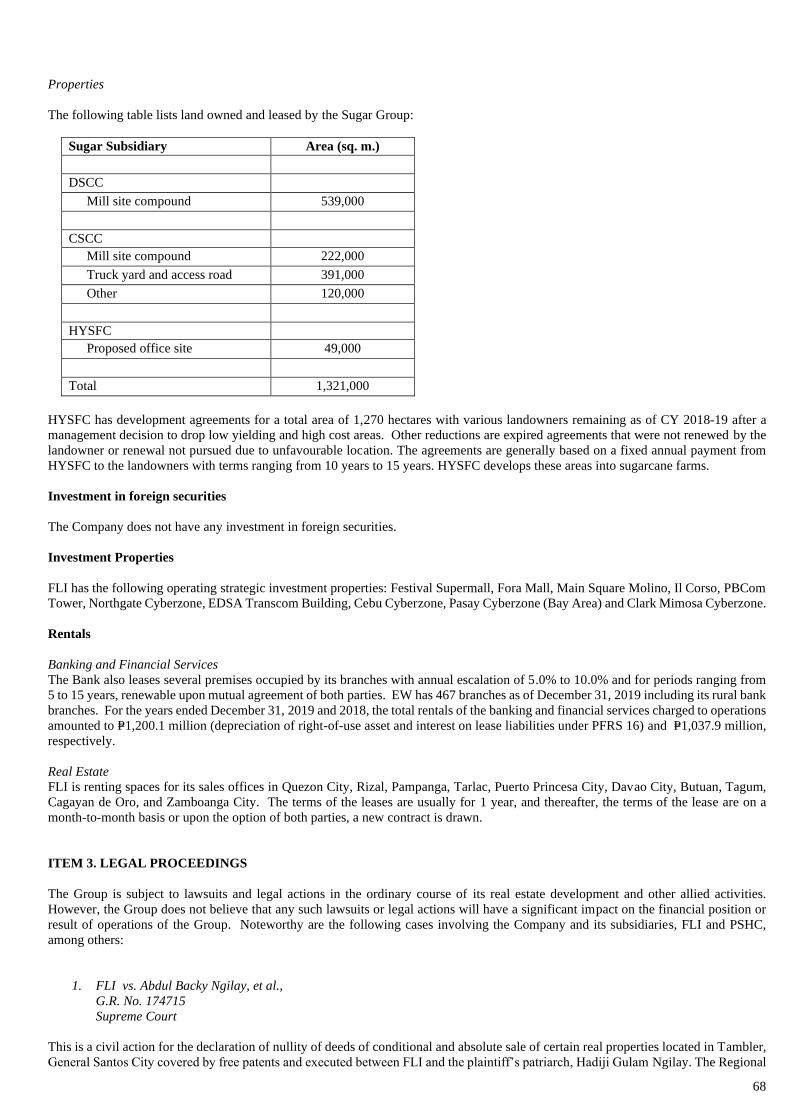
68
Properties
The following table lists land owned and leased by the Sugar Group:
Sugar Subsidiary Area (sq. m.)
DSCC
Mill site compound 539,000
CSCC
Mill site compound 222,000
Truck yard and access road 391,000
Other 120,000
HYSFC
Proposed office site 49,000
Total 1,321,000
HYSFC has development agreements for a total area of 1,270 hectares with various landowners remaining as of CY 2018-19 after a
management decision to drop low yielding and high cost areas. Other reductions are expired agreements that were not renewed by the
landowner or renewal not pursued due to unfavourable location. The agreements are generally based on a fixed annual payment from
HYSFC to the landowners with terms ranging from 10 years to 15 years. HYSFC develops these areas into sugarcane farms.
Investment in foreign securities
The Company does not have any investment in foreign securities.
Investment Properties
FLI has the following operating strategic investment properties: Festival Supermall, Fora Mall, Main Square Molino, Il Corso, PBCom
Tower, Northgate Cyberzone, EDSA Transcom Building, Cebu Cyberzone, Pasay Cyberzone (Bay Area) and Clark Mimosa Cyberzone.
Rentals
Banking and Financial Services
The Bank also leases several premises occupied by its branches with annual escalation of 5.0% to 10.0% and for periods ranging from
5 to 15 years, renewable upon mutual agreement of both parties. EW has 467 branches as of December 31, 2019 including its rural bank
branches. For the years ended December 31, 2019 and 2018, the total rentals of the banking and financial services charged to operations
amounted to P=1,200.1 million (depreciation of right-of-use asset and interest on lease liabilities under PFRS 16) and P=1,037.9 million,
respectively.
Real Estate
FLI is renting spaces for its sales offices in Quezon City, Rizal, Pampanga, Tarlac, Puerto Princesa City, Davao City, Butuan, Tagum,
Cagayan de Oro, and Zamboanga City. The terms of the leases are usually for 1 year, and thereafter, the terms of the lease are on a
month-to-month basis or upon the option of both parties, a new contract is drawn.
ITEM 3. LEGAL PROCEEDINGS
The Group is subject to lawsuits and legal actions in the ordinary course of its real estate development and other allied activities.
However, the Group does not believe that any such lawsuits or legal actions will have a significant impact on the financial position or
result of operations of the Group. Noteworthy are the following cases involving the Company and its subsidiaries, FLI and PSHC,
among others:
1. FLI vs. Abdul Backy Ngilay, et al.,
G.R. No. 174715
Supreme Court
This is a civil action for the declaration of nullity of deeds of conditional and absolute sale of certain real properties located in Tambler,
General Santos City covered by free patents and executed between FLI and the plaintiff’s patriarch, Hadiji Gulam Ngilay. The Regional

69
Trial Court (“RTC”) of Las Piñas City (Br. 253) decided the case in favor of FLI and upheld the sale of the properties. On appeal, the
Court of Appeals rendered a decision partly favorable to FLI but nullified the sale or some properties involved. FLI filed a petition for
review on certiorari to question that portion of the decision declaring as void the deeds of sale of properties covered by patents issued
in 1991. The Supreme Court affirmed the decision of the Court of Appeals but declared with finality that EU’s purchase of sales patents
issued in 1991 was void and ordered the Ngilays to return ₱l4,000,000.00 to FLI. The Regional Trial Court issued a Writ of Execution
dated February 16, 2015. To satisfy the monetary judgment in favor of FLI, four parcels of land owned by the Ngilays and covered by
Transfer Certificates of Title (“TCT”) Nos. P-6886, 147-201005034, 147-2014000465, and 147-2014000468, were levied on execution and
sold at public auction to FLI as highest bidder. The Sheriff’s Certificate of Sale over the properties was registered with the Registry
of Deeds of General Santos City. FLI filed a motion for the surrender of the certificates of titles of the Ngilays so that FLI’s
affidavit of consolidation of ownership can be annotated on the titles and new certificates of title will be issued in FLI’s name.
This motion was partially granted; 3 titles, namely Transfer Certificates of Title (“TCT”) Nos. 147-2014005034, 147-2014000465,
and 147- 2014000468, are surrendered to the Register of Deeds of General Santos City but Transfer Certificate of Title (“TCT”)
No. P-6886 was declared sale by the Sheriff invalid because the owner’s title was not one of the titles declared by the Supreme
Court as invalid. The Sheriff was ordered to look for another property of Ngilay for execution and is to issue an amended certificate
of sale for the 3 Ngilay properties in favor of FLI. We are awaiting for the approval of the Court to issue order approving amended
certificate of sale along with resolution of the Court on the Moner Ngilay’s Motion to Exclude his property from execution, with
FLI’s opposition already filed.
2. Emerlita Alvarez, et al., vs. FDC
DARAB Case No. IV-RI-010-95
Adjudication Board, Department of Agrarian Reform
On or about March 15, 1995 certain persons claiming to be beneficiaries under the Comprehensive Agrarian Reform Program (CARP)
of the National Government filed an action for annulment/cancellation of sale and transfer off titles, maintenance of peaceful possession,
enforcement of rights under CARP plus damages before the Regional Agrarian Reform Adjudicator, Adjudication Board, Department
of Agrarian Reform. The property involved, located in San Mateo Rizal, was purchased by FDC from the Estate of Alfonso Doronilla.
A motion to dismiss is still pending resolution.
3. Republic of the Philippines vs. Rolando Pascual, et al.,
G.R. No. 222949
Supreme Court
The National Government through the Office of the Solicitor General filed suit against Rolando Pascual, Rogelio Pascual, and FLI for
cancellation of title and reversion in favor of the Government of properties subject of a joint venture agreement between the said
individuals and FLI. The Government claims that the subject properties covering about 73.33 hectares are not alienable and disposable
being forest land. The case was dismissed by the RTC of General Santos City (Branch 36) on November 16, 2007 for lack of merit. On
appeal, the Court of Appeals reversed the Decision of the RTC and ordered the case to be remanded for a full-blown trial on the merits.
FLI filed a Motion for Partial Reconsideration, which was denied by the CA. On April 4, 2016, FLI filed its Petition for Review with
the Supreme Court, but the SC also affirmed the Decision of the CA remanding the case for reversion filed by the Republic of the
Philippines to the RTC of General Santos City for further proceedings. in an Order dated September 18, 2018, the hearing was reset to
March 19, 2019, the RTC set the case for Judicial Dispute Resolution on August 20, 2019. The Judicial Dispute Resolution was
terminated. (Pre-Trial is set on April 14, 2020.)
4. Antonio E. Cenon and Filinvest Land, Inc. vs. San Mateo Landfill, Mayor Rafael Diaz,
Brgy. Pintong Bukawe, Director Julian Amador and the Secretary, Department of
Environment and Natural Resources
SC-G.R. No. 251303
(CA-G.R. CV No. 107682)
Supreme Court
On February 9, 2009, FLI and its First Vice President, Engr. Antonio E. Cenon (“Plaintiffs”) filed an action (or injunction and damages
against the respondents to stop and enjoin the construction of a 19-hectare landfill in a barangay in close proximity to Timberland
Heights in San Mateo, Riz8l. Plaintiffs sought preliminary and permanent injunctive reliefs and damages and the complete and
permanent closure of the dump site. After presenting evidence, plaintiffs rested their case. Defendant San Mateo Sanitary Landfill and
defendant Mayor separately filed a Demurrer to Evidence. In an Order dated August 22, 2016, the Regional Trial Court granted both
Demurrers to Evidence and dismissed the case for insufficiency of evidence. Plaintiffs appealed to the Court of Appeals. In the Decision
dated May 31, 2019, the Court of Appeals denied the plaintiffs’ appeal. Plaintiffs filed a Motion for Reconsideration. (The Motion for
Reconsideration was denied in a Resolution of the Court of Appeals dated January 6, 2020. A Motion for Extension of Time to File
Petition for Review on Certiorari was filed by plaintiffs with the Supreme Court.)

70
5. Coca-Cola Bottlers Philippines, Inc. vs. Pacific Sugar Holdings Corporation
Civil Case No. 10-1067
Branch 146, Regional Trial Court, Makati City
On October 28, 2010, Coca-Cola Bottlers Philippines, Inc. (“Coca-Cola”) filed a civil case against Pacific Sugar Holdings Corporation
(“PSHC”) demanding the amount of ₱347,410,104.66 allegedly representing damages sustained by Coca-Cola due to the supposed
failure by PSHC to deliver certain volume of sugar products. The court issued a writ of preliminary attachment against PSHC, causing
the attachment of its personal properties to cover the amount of Coca-Cola’s claim. The writ of preliminary attachment was lifted upon
filing by PSHC of a stand-by Letter of Credit. Coca-Cola assailed the lifting of the writ by filing a petition with the Court of Appeals.
Meanwhile, PSHC accordingly filed its Answer on April 13, 2011 to refute the claims of Coca-Cola. After the parties’ presentation of
evidences, the Regional Trial Court issued its Decision dated August 11, 2017 which partially granted Coca-Cola’s Claims, ordering
PSHC to pay ₱347,410,104.66 as actual damages, ₱300,000.00 as exemplary damages, ₱1,000,000.00 as attorney’s fees, and costs of
suit. PSHC has filed an appeal with the Court of Appeals. On February 15, 2019, the Court of Appeals issues its decision, which partial
granted the appeal and modified the actual damages, which is reduced to ₱67,030,420.00 and affirmed all other judgment awards. Coca-
Cola filed a Motion for Partial Reconsideration of the said decision of the Court of Appeals. PSHC files its Comment on such Motion
on July 8, 2019. On November 12, 2019, the Court of Appeals issued a resolution denying the Motion for Partial Reconsideration filed
by Coca-Cola.
6. Manila Paper Mills International, Inc. vs. Filinvest Land, Inc., et al.,
Civil Case No. DC-721-17
Regional Trial Court
Branch 90, Dasmariñas City, Cavite
In its Complaint dated July 14, 2017, Manila Paper Mills International, Inc. (“MPMII”) claims it owns three parcels of land in
Dasmariñas City, Cavite covered by TCT Nos. T-636128, T-636130 and T-636131 with the following respective areas: 79,999 square
meters, 40,000 square meters, and 104,340 square meters, or a total area of 224,339 square meters, These areas allegedly overlap with
FLI’s lots which now form part of FLI’s project, The Glens located in San Pedro Laguna. According to MPMII, plotting for The Glens
conducted by a Licensed Geodetic Engineer through Google Maps revealed that portions of the project encroached on said MPMII
properties for a total of 208,256 square meters. The Complaint prays for the cancellation of FLI’s certificates of title that overlap with
MPMII’s as well as the payment of damages. MPMII also prayed for the issuance of a temporary restraining order or preliminary
injunction to enjoin FLI from possessing, altering, transferring ownership, or disposing of the subject properties. MPMII subsequently
amended its complaint to address issues raised by FLI in its first Motion to Dismiss. The main subject of the amendment was the change
in the plaintiff from MPMII to “Trustees and Shareholders of MPMII.”
In response to the amended complaint, FLI filed its second Motion to Dismiss, where FLI argued, among others, that: (a) the court has
no jurisdiction over the amended complaint’s prayer for injunctive relief; (b) the amended complaint should be dismissed because the
original complaint lacks cause of action (because MPM1I’s corporate personality has ceased in 2004) and may not therefore be subject
to amendment; (c) the correct filing fees were not paid and in view of its impropriety, the amendment circumvents the need for separate
filing and payment of new docket fees.
During the proceedings, the court allowed MPMII to present evidence on its prayer for injunction even before the resolution of FLI’s
motions to dismiss which raised serious grounds. The Presiding Judge proceeded with the hearing of the latter’s evidence without the
presence and participation of FLI’s counsel. Thus, FLI filed a Motion to Recuse which the Presiding Judge granted. In the meantime,
the proceedings are suspended by the assignment of the case to another judge.
The case was then assigned to an Acting Presiding Judge and a hearing was set on January 23, 2019 for the cross-examination of
MPMII’s witnesses. FLI filed an Omnibus Motion to nullify the proceedings where MPMII presented the above-said evidence/witnesses,
to resolve pending motions and to suspend further proceedings. An Order was issued which cancelled the hearing on January 23, 2019
and submitted the Motion to Dismiss for resolution.
In an Order dated May 15, 2019, the court denied the Omnibus Motion. FLI filed a Motion for Reconsideration dated July 10, 2019,
which is now pending before the court.
ITEM 4. SUBMISSION OF MATTERS TO A VOTE OF SECURITY HOLDERS
There were no matters submitted to a vote of security holders during the fourth quarter of the calendar year covered by this report.

71
PART II - OPERATIONAL AND FINANCIAL INFORMATION
ITEM 5.1 MARKET FOR REGISTRANT’S COMMON EQUITY AND RELATED STOCKHOLDER MATTERS
Cash Dividends
On April 26, 2019, the Parent Company’s BOD approved the declaration and payment of cash dividends of P=864.8 million or
P=0.10 per share for every common share of record as of May 26, 2019. This was paid on June 19, 2019.
On May 4, 2018, the Parent Company’s BOD approved the declaration and payment of cash dividends of P=661.6 million or
P=0.0765 per share for every common shares of record as of June 3, 2018. This was paid on June 28, 2018.
On April 28, 2017, the Parent Company’s BOD approved the declaration and payment of cash dividends of P=549.7 million or
P=0.059 per share for every common shares of record as of May 28, 2017. This was paid on June 21, 2017.
The payment of cash dividends depends upon the Parent Company’s earnings, cash flow, financial condition, capital investment
requirements and other factors (including certain restrictions on dividends imposed by the terms of loan agreements). Pursuant to the
loan agreements entered into by the company and certain financial institutions, the Parent Company needs the lenders’ prior consent in
cases of cash dividend declaration.
ITEM 5.2 BOND ISSUANCES
On January 24, 2014, FDC issued and listed P=8,800.0 million unsecured fixed-rate peso retail bonds due 2024 with annual coupon rate
of 6.1458%. Interest is payable quarterly in arrears starting April 24, 2014. Net proceeds from the bonds amounted to
P=8,754.9 million of which portion was used for refinancing amounting to P=4,877.1 million and the balance was used for the capital
expenditures of the Hotel and Power operations.
Market Price Information
The Shares are traded on the PSE under the symbol “FDC.” The Shares were listed on the PSE on December 22, 1982. The high and
low sales prices for the Shares as reported on the PSE for each quarter in 2017, 2018 and 2019 were as follows:
High Low Period End
2017
First Quarter ............................................................................................... 8.20 7.90 7.90
Second Quarter .......................................................................................... 8.00 7.55 7.90
Third Quarter ............................................................................................. 7.95 7.45 7.83
Fourth Quarter ........................................................................................... 8.15 7.50 7.75
2018
First Quarter ............................................................................................... 7.80 7.20 7.55
Second Quarter .......................................................................................... 7.68 7.00 7.10
Third Quarter ............................................................................................. 7.30 6.83 7.11
Fourth Quarter ........................................................................................... 13.80 7.00 11.80
2019
First Quarter ...............................................................................................
16.30
11.80
15.08
Second Quarter .......................................................................................... 15.66 12.34 14.00
Third Quarter ............................................................................................. 14.18 13.00 13.00
Fourth Quarter ........................................................................................... 13.50 12.94 13.00
As of December 31, 2019 and February 28, 2020, the closing price of the Parent Company’s shares on the PSE was P11.8 per share and
P13.7 per share, respectively. The number of shareholders of record (exclusive of treasury) as of December 31, 2019 and February 28,
2018 were 4,070 and 4,065, respectively. Total common shares issued were 9,319,872,387 and outstanding were 8,648,462,987 as of
December 31, 2018.

72
Top 20 Stockholders
As of December 31, 2019
Shareholders
Class of
Securities No. of Shares held
% to Total
Outstanding
1 A.L. Gotianun, Inc. Common 7,587,823,502 87.74%
2 PCD Nominee Corporation (Filipino) Common 899,630,763 10.40%
3 Michael Edward T. Gotianun Common 50,501,501 0.58%
4 PCD Nominee Corporation (Non-Filipino) Common 40,002,978 0.46%
5 Ricardo Alonzo Common 28,627,534 0.33%
6 Andrew Gotianun Jr. Common 3,371,995 0.04%
7 Lourdes Josephine Gotianun Yap Common 3,370,091 0.04%
8 Joseph M. &/Or Lourdes Josephine G. Yap Common 2,817,311 0.03%
9 Helen Reyes Common 2,692,544 0.03%
10 Emily Benedicto Common 2,466,400 0.03%
11 H. K. Hedinger Common 2,023,508 0.02%
12 Santiago Go Common 1,707,066 0.02%
13 Executive Optical, Inc. Common 1,023,556 0.01%
14 Ama Rural Bank of Mandaluyong, Inc. Common 616,600 0.01%
15 Manuel Benipayo Common 527,141 0.01%
16 Salud Borromeo Common 501,655 0.01%
17 Francisco Benedicto Common 493,280 0.01%
18 Edan Corporation Common 387,224 0.00%
19
Ma. Consuelo R. Medrano &/Or Victoriano
S. Medrano Common 308,300 0.00%
20 Alfonso Siy &/Or Ang Pue Tin Common 246,640 0.00%
8,629,139,589 99.78%
Recent Sale of Unregistered Securities
There are no securities sold by the Company in the past 3 years, which were not registered under the Code 2.
ITEM 6. MANAGEMENT’S DISCUSSION AND ANALYSIS OR PLAN OF OPERATIONS
RESULTS OF OPERATIONS
Year Ended December 31, 2019 Compared With Year Ended December 31, 2018
Revenues
Real Estate Operations
Sale of Lots, Condominium and Residential Units
Sale of lots, condominium and residential units grew by 5.4% or P1,090.7 million from P20,362.8 million in 2018 to P21,453.5 million
in 2019 mainly due to FLI’s increase in real estate sales attributed to higher percentage of completion for medium-rise and high-rise
buildings (or MRBs and HRBs), and higher completion of downpayments from 2018 sales.
Mall and Rental Revenues
Mall and rental revenues surged by 20.9% to P7,464.3 million in 2019 from P6,174.4 million in 2018 ascribed to the increase in lease
portfolio of office and retail buildings. Filinvest Axis Tower 2, located in Northgate Cyberzone Alabang, was completed in 2019 adding
39,341 square meters of GLA to the office portfolio. FLI now operates 31 buildings totaling 523,902 square meters. For retail, FLI has
243,215 square meters GLA in the retail portfolio in 2019 from 242,127 square meters in 2018.
Hospitality Operations
Hospitality Revenues
Hospitality revenues bagged a 24.2% growth from P2,665.5 million in 2018 to P3,311.2 million in 2019 mainly due to the full year
operation of Crimson Resort and Spa Boracay (Crimson Boracay) in 2019 and start of operations of Quest Tagaytay in April 2019. In

73
addition, there was an increase in average room rates and occupancy from other operating hotel properties, consequently the food and
beverage revenues also increased.
Banking and Financial Services
Net Interest Income
Banking and Financial Services Interest Income
The banking and financial services’ interest income rose by 22.5% or P5,344.5 million from P23,794.5 million in 2018 to
P29,139.0 million in 2019 on account of increase in lending activities, largely driven by growth in loans and investment securities.
Costs of Banking and Financial Services
Costs of banking and financial services went up by 65.3% or P3,129.9 million from P4,794.0 million in 2018 to P7,923.8 million in
2019, which primarily resulted from increasing interest rates and growth in high-cost deposits and other borrowings amidst a tight
liquidity environment during the first half of 2019.
Net Interest Income
Net interest income surged by 11.7% from P19,000.5 million in 2018 to P21,215.2 million in 2019 due to the growth in interest income
driven by higher asset base, coupled with improvement in margins.
Power Operations
Power Revenues
Power revenues jumped 17.2% or by P1,482.6 million from P8,630.5 million in 2018 to P10,113.1 million in 2019 mainly on account
of 24% improvement in energy sold.
Sugar Operations
Sugar Sales
Sugar operations’ revenues increased by 2.5% or P80.7 million from P3,287.2 million in 2018 to P3,367.9 million in 2019 attributed
mainly to higher sales volumes and improved sugar prices.
Other Income
Other Income — Real Estate Operations
Other income from real estate operations reduced by 4.2% or P93.4 million from P2,236.8 million in 2018 to P2,143.4 million in 2019
driven by the lower interest income derived from contract receivables as more buyers opt to avail of bank financing schemes instead of
in-house payment schemes.
Other Income — Hospitality Operations
Other income from hospitality operations increased by 23.9% or P9.5 million from P39.8 million in 2018 to P49.4 million in 2019 on
account of higher share in net income of a joint venture.
Other Income — Banking and Financial Services
Other income from banking and financial services showed a growth of 16.2% or P1,006.1 million from P6,212.4 million in 2018 to
P7,218.5 million in 2019 primarily due to higher securities trading gain and increase in fees and commissions driven by the growth in
consumer lending.
Other Income – Power Operations
Other income from power operations declined by 96.0% or P633.2 million from P659.3 million in 2018 to P26.1 million in 2019 on
account of the one-off income in 2018 from liquidated damages claimed against the power plant contractor for the delayed completion
of the power plant.
Other Income — Sugar Operations
Other income from sugar operations decreased by 65.2% or P58.2 million from P89.2 million in 2018 to P31.1 million in 2019 due to
lower income earned from conversion rights.
Costs
Costs of Sale of Lots, Condominium and Residential Units
Costs of sale of lots, condominium and residential units went up by 12.1% or P1,248.3 million from P10,321.9 million in 2018 to
P11,570.2 million in 2019, in line with the higher real estate sales booked during the year.

74
Costs of Mall and Rental Services
Costs of mall and rental services increased by 19.0% or P167.5 million from P880.6 million in 2018 to P1,048.1 million in 2019 on
account of higher depreciation which came from newly completed buildings and from buildings delivered in 2018 which registered full
year depreciation in 2019.
Costs of Hospitality Operations
The Group’s costs of hospitality operations increased by 23.0% or P310.0 million from P1,345.2 million in 2018 to P1,655.3 million in
2019 mainly due to the full year operation of Crimson Boracay and start of operations of Quest Tagaytay in 2019. The increase was also
contributed by higher business volume across the Group’s hotel properties at the back of higher occupancy.
Costs of Banking and Financial Services
Costs of banking and financial services was accounted for under net interest income in the “Revenues”.
Costs of Power Operations
Costs of power operations increased by 10.3% or P486.9 million from P4,733.7 million in 2018 to P5,220.6 million in 2019 primarily
on account of the 24% increase in energy sold.
Costs of Sugar Sales
Cost of sugar operations increased by 2.0% or P55.1 million from P2,768.3 million in 2018 to P2,823.5 million in 2019 related to higher
sales volume.
Costs of Other Operations
Costs of other operations increased by 11.9% or P76.1 million from P640.0 million in 2018 to P716.2 million in 2019 due to translation
adjustment of interest on foreign-currency denominated bonds payable.
Expenses
Real Estate Operations
Expenses of real estate operations increased by 19.0% from P6,153.3 million in 2018 to P7,320.2 million in 2019 due to higher
depreciation of property, plant and equipment, repairs and maintenance, insurance, and selling and marketing expenses particularly
brokers’ commissions and service fees.
Hospitality Operations
Expenses of hospitality operations increased by 31.2% or P290.5 million from P929.8 million in 2018 to P1,220.3 million in 2019
mainly due to the full year operation of Crimson Boracay and start of operations of Quest Tagaytay in 2019. The increase was also
attributed by higher operating costs such as manpower, utilities, depreciation and interest expense.
Banking and Financial Services
Expenses of banking and financial services went up by 5.8% from P19,521.0 million in 2018 to P20,657.4 million in 2019 due to increase
in compensation related expenses and higher cost of doing business including gross receipts tax, documentary stamp taxes and intensified
marketing acquisition campaigns to generate more loan and l retail deposits.
Power Operations
The expenses of power operations decreased by 2.9% or P72.7 million from P2,537.7 million in 2018 to P2,465.0 million in 2019 as a
result of adoption of the new accounting standard on leases, PFRS 16, effective January 1, 2019, which led to recognition of amortization
of right-of-use assets that was lower than the rent expense booked under the old accounting standard on leases (PAS 17) applied in
previous year.
Sugar Operations
Expenses of sugar operations decreased by 32.9% from P346.4 million in 2018 to P232.2 million in 2019 attributed to previous year’s
higher booked provision for impairment losses on certain sugar refinery assets and provision for probable losses on contingencies.
Others
Expenses of other operations decreased by 7.4% or P95.2 million from last year’s P1,292.6 million to P1,197.4 million in 2019 due to
prior year’s booking of provision for probable losses on contingencies offset by 2019’s share in net loss of an associate.
Provision for Income Tax
Provision for income tax decreased by 1.6% or P69.8 million from P4,454.7 million in 2018 to P4,384.9 million in 2019. Provision for
current income tax increased by 13.3% or P520.9 million attributed to higher taxable income of the banking and financial services as a
result of increased revenues. Provision for deferred income tax decreased by 108.0% or P590.7 million due mainly to temporary
differences between financial and taxable income arising from recognition of finance lease under the new accounting standard.
75
Net Income
As a result of the foregoing, consolidated net income increased by 18.2% or P2,449.1 million from P13,433.2 million in 2018 to
P15,882.3 million in 2019. Net income attributable to equity holders of the Parent Company increased by 22.5% or P2,201.6 million
from P9,768.7 million in 2018 to P11,970.3 million in 2018 while net income attributable to noncontrolling interest amounted from
P3,664.5 million in 2018 to P3,912.0 million in 2019.
FINANCIAL CONDITION
As at December 31, 2019 Compared with As at December 31, 2018
Assets
Total consolidated assets grew by 8.9% or P52,365.9 million from P589,789.0 million as of December 31, 2018 to P642,154.9 million
as of December 31, 2019. The movements in asset accounts were accounted as follows:
Cash and cash equivalents decreased by 23.5% or P16,025.1 million from P68,121.3 million to P52,096.2 million attributable to EW’s
lower cash level as more funds were placed in higher-yielding liquid assets and due to lower reserve on outstanding deposits as required
by the BSP.
Loans and receivables of the real estate operations increased by 20.2% from P4,261.3 million to P5,124.1 million, and contract assets
grew by 29.6% or P3,392.8 million from P11,455.4 million to P14,848.2 million, due to higher revenue for the year and higher mix of
cash sales.
Loans and receivables of the hospitality operations increased by 8.6% or P16.8 million from P196.6 million to P213.5 million attributed
to Crimson Boracay and Quest Tagaytay.
Loans and receivables of the banking and financial services grew by 9.8% or P22,576.0 million from P231,530.9 million to
P254,106.9 million principally driven by the increase in EW’s consumer loans across all segments of auto, credit cards, mortgage and
personal loans.
Loans and receivables of the power operations increased by 11.1% from P1,841.5 million to P2,045.0 million at the back of higher
power revenues.
Loans and receivables of the sugar operations decreased by 8.3% from P117.9 million to P108.1 million on account of higher allowance
for expected credit losses.
Financial assets at FVPL rose from P4,338.8 million to P16,840.7 million or by 288.1% or P12,501.9 million due to movements in the
Bank’s proprietary trading portfolio.
Financial assets at FVOCI amounting to P5,323.7 million as of December 31, 2019 posted an increase of more than 7 times the
P750.3 million balance in year-end of 2018 on account of movements in the Bank’s proprietary trading portfolio.
Investment securities at amortized cost showed a 35.3% increase from P36,510.5 million to P49,386.1 million in line with the Bank’s
strategic direction of improving liquidity profile and accrual income.
Real estate inventories decreased by 10.2% from P79,469.9 million to P71,363.5 million due to the reclassification of some portion of
land and land development costs related to the land located in Mandaluyong City and Cebu to investment property, pursuant to its current
plan for the project which are intended to be for leasing.
Coal, spare parts and other inventories increased by 1.4% or P9.8 million from P=700.6 million to P=710.3 million principally due to
higher level of spare parts and fuel inventories driven by the increased inputs needed by the power operations.
Investment properties increased by 19.4% or P=13,439.1 million from P=69,132.5 to P=82,571.6 million due the additional construction
costs of new buildings for office and commercial lease amounting to P=8.2 billion. These are primarily located in Northgate Cyberzone
in Alabang, Filinvest Mimosa, Makati City, Quezon City and Ortigas City.
Property, plant and equipment decreased by 2.9% or P=1,267.4 million from P=44,422.9 million to P=43,155.5 million mainly due to
depreciation, offset by acquisitions during the year.
Investments in joint ventures and associate grew by 36.9% or P270.7 million from P734.6 million to P1,005.3 million due to capital
infusion into the joint venture and into an associate, offset by the take-up of proportionate share in net loss.

76
Deferred tax assets increased by 25.2% or P654.7 million from P2,600.8 million to P3,255.4 million on account of EW’s provision set-
up, net of write-off during the period.
Right-of-use assets amounting to P6,994.5 million as of December 31, 2019 resulted from the adoption of PFRS 16 which became
effective January 1, 2019.
Other assets decreased by 2.6% or P597.1 million from P23,222.1 million to P22,625.0 million due to lower level of advances to
contractors and suppliers and derivative assets.
Liabilities
Total consolidated liabilities as at December 31, 2019 amounted to P510,004.9 million, 8.5% higher than P470,098.5 million balance
as at December 31, 2018. Changes in account balances were as follows:
Deposit liabilities increased by 6.7% or P17,841.8 million from P266,926.1 million to P284,767.9 million primarily due to higher level
of bank deposits pertaining to current and savings accounts (or CASA).
Bills and acceptances payable was higher by 72.2% or P12,979.8 million from P17,969.9 million to P30,949.8 million mainly from
higher volume of interbank borrowings.
Accounts payable, accrued expenses and other liabilities went up by 1.8% or P700.5 million from P39,756.0 million to P40,456.5 million
due to increase in payables to contractors and suppliers for the construction activities.
Contract liabilities decreased by 39.1% or P2,222.5 million from P5,690.7 million to P3,468.2 million mainly due to the higher contracts
with buyers that qualified for revenue recognition for the year consistent with the higher real estate sales.
Long-term debt increased by 2.3% or P2,873.7 million from P127,347.5 million to P130,221.3 million on account of newly availed bank
loans, offset by payments and amortizations.
Income tax payable was higher by 48.7% or P295.3 million from P606.5 million to P901.8 million due to higher taxable income of the
banking and financial services.
Retirement liabilities increased from P1,117.1 million to P1,139.7 million as a result of higher net defined benefit obligation from the
actuarial valuation conducted by independent actuaries.
Lease liabilities of P6,885.2 million as of December 31, 2019 resulted from the adoption of PFRS 16 which became effective
January 1, 2019.
Deferred tax liabilities increased by 5.0% or P529.9 million from P10,684.7 million to P11,214.6 million attributed to the increased
excess of real estate revenue based on financial accounting policy over real estate revenue based on tax rules.
Equity
On April 26, 2019, the Parent Company’s BOD approved the declaration and payment of cash dividends of P=864.8 million or
P=0.10 per share for every common share of record as of May 26, 2019. This was paid on June 19, 2019.
On May 4, 2018, the Parent Company’s BOD approved the declaration and payment of cash dividends of P=661.6 million or
P=0.0765 per share for every common shares of record as of June 3, 2018. This was paid on June 28, 2018.
On April 28, 2017, the Parent Company’s BOD approved the declaration and payment of cash dividends of P=549.7 million or
P=0.059 per share for every common shares of record as of May 28, 2017. This was paid on June 21, 2017.
The Group has commitments for capital expenditures for the project developments of the real estate segment, the requirement of the
sugar manufacturing subsidiaries, the development and construction of solar rooftop facilities and other utility projects, the intended
construction and management of various hotels, and the bank’s expansion and implementation of IT projects, which could be adequately
covered by the operating cash flow and availment of medium and long term loans.

77
Performance Indicators
As of And For The
Year Ended
As of And For The
Year Ended
December 31, 2019 December 31, 2018
Earnings Per Share - Basic (EPS) P1.384 /share P1.130 /share
Net Income (Attributable to Equity Holders of the Parent
Company)
Weighted Average Number of Outstanding Shares
Price Earnings Ratio (PE Ratio) 9.39 Times 10.46 Times
Closing Price (1)
EPS
Return on Revenue 19% 18%
Total Net Income
Total Revenue
Return on Equity (Average) 13% 12%
Total Net Income
Average Total Equity
Assets to Equity Ratio 4.86 :1 4.93 : 1
Total Assets
Total Equity
Debt to Equity Ratio
a) Long-term Debt 0.99 : 1 1.06 : 1
Total Equity
b) Total Liabilities Excluding Deposit
Liabilities, Bills and Acceptances Payable, Asset Retirement
Obligation and Finance Lease Liabilities 1.41 : 1 1.54 : 1
Total Equity
Current Ratio
a) Including EW
Current Assets 0.76 : 1 0.97 : 1
Current Liabilities
b) Excluding EW
Current Assets 2.17 : 1 3.19 : 1
Current Liabilities
Quick Ratio 0.52 : 1 0.78 : 1
Current Assets – Inventories
Current Liabilities
Earnings Before Interest, Taxes, Depreciation and
Amortization (EBITDA) to Total Interest Expense 6.98 Times 6.94 Times
EBITDA
Total Interest Expense (2) (1) Closing prices at December 27, 2019 and December 28, 2018.
(2) Excluding accretion expense on liability on IPPA contract and financial liability on lease contract

78
Notes to Financial Statements and Other Disclosures
1. The attached consolidated financial statements are prepared in compliance with PFRS. The accounting policies and methods of
computation followed in the financial statements for the year ended December 31, 2019 are the same as those followed in the annual
financial statements of the Company for the year ended December 31, 2018.
2. Except for the sugar business, the operating activities of the Company are carried out uniformly over the calendar year. The sugar
milling season of the Company’s sugar subsidiaries is usually from November to June of the following year. Except for this milling
season, there are no other unusual operating cycles or seasons during the year.
3. Except as disclosed in the Management’s Discussion and Analysis of Financial Condition and Results of Operation, there are no
unusual items affecting assets, liabilities, equity, net income or cash flows for the current period. There are no known trends,
demands, commitments, events or uncertainties that will have a material impact on the Company’s liquidity.
4. There are no changes in estimates of amounts reported in the previous period that have material effects in the current period.
5. Except for those discussed in the Management’s Discussion and Analysis of Financial Condition and Results of Operations, there
are no issuances, repurchases and repayments of debt and equity securities.
6. There were no other dividends paid (aggregate or per share) separately for ordinary shares and other shares during the current
period, except as discussed in the previous sections.
7. The Company derives its revenues from the following reportable segments:
Real Estate Operations
This involves acquisition of land, planning and development of large-scale fully integrated residential communities as well as the
development and sale of residential lots, housing units, medium-rise residential buildings, farm estates, industrial parks, residential
resort projects, a private membership club and condominium buildings. This segment also involves operations and management of
cinema and mall, property management and leasing of commercial and office spaces.
Hospitality Operations
This involves operation of hotels, including management of resorts, villas, golf course, service apartment and other services for the
pleasure, comfort and convenience of guests in said establishments under its management.
Banking and Financial Services
This involves a wide range of financial services to consumer and corporate clients which includes deposit-taking, loan and trade
finance, treasury, trust services, credit cards, cash management, custodial services, insurance services and leasing and finance. The
business units in this segment consist of retail banking, corporate banking, consumer banking, and treasury and trust.
Power Operations
This involves the establishment, construction, operation of power plants and supply of power to offtakers and also includes
management of power plants’ output under the IPPA contracts.
Sugar Operations
This involves operation of agricultural lands for planting and cultivating farm products, operation of a complete sugar central for
the purpose of milling or converting sugar canes to centrifugal or refined sugar and selling of sugar and by-products.
Other Operations
This involves other operations of the Parent Company including CWSI, CTI and FDCI. FDCI was incorporated to facilitate the
Group’s issuance of foreign currency-denominated bonds while CWSI was incorporated to provide maintenance, operation,
management and rehabilitation of waterworks sewerage and sanitation system and services specifically for the distribution, supply
and sale of potable water to domestic, commercial and industrial. CTI is engaged in providing computer and information technology
services including, but not limited to, general consulting, improvement systems planning, network integration, business re-
engineering services, systems integration and system development.
Financial information on the operations of these business segments as of and for the years ended December 31, 2019 and 2018 are
summarized and included in the accompanying Notes to Consolidated Financial Statements.
8. Except as discussed in the Management’s Discussion and Analysis of Financial Condition and Results of Operations, there are no
material events subsequent to December 31, 2019 up to the date of this report that have not been reflected in the financial statements
for the current period.
9. There have been no changes in the composition of the Company during the current period, such as business combination, acquisition
or disposal of subsidiaries and long-term investments, restructurings and discontinuing operations, except as discussed in the
Developments of the Company and Management’s Discussion on its Results of Operations.

79
10. There are no changes in contingent liabilities or contingent assets since December 31, 2019.
11. There are no material contingencies and any other events or transactions affecting the current period.
12. There are no known events that will trigger direct or contingent financial obligation that is material to the Company, including any
default or acceleration of an obligation.
13. There are no known material off-balance sheet transactions, arrangements, obligations including contingent liabilities, and other
relationships of the Company, with unconsolidated entities or other persons created during the reporting period.
14. There are no significant elements of income or loss, except as discussed in the Management’s Discussion on the Results of
Operations that did not arise from the Company’s continuing operations.
15. There are no known seasonal aspects that had a material effect on the financial condition or results of operations.
16. Aside from the possible material increase in interest rates on the outstanding floating – rate term loans, there are no known trends,
events or uncertainties or any material commitments that may result to any cash flow or liquidity problems of the Group within the
next 12 months. The Group is not in default or breach of any note, loan, lease or other indebtedness or financing arrangements
requiring it to make payments or any significant amount in its accounts payable that have not been paid within the stated terms.
17. On known trends, events, or uncertainties that have had or are reasonably expected to have favorable or unfavorable impact on net
sales or revenues or income from continuing operations, the Company considers the following:
Outlook for 2020 Amidst the COVID-19 Pandemic
As of this writing, the world continues to go through the biggest crisis of our generation brought about by the COVID-19 pandemic.
In a move to contain the COVID-19 pandemic in the Philippines, on March 13, 2020, the Office of the President of the Philippines
issued a Memorandum directive to impose stringent social distancing measures in the National Capital Region effective March 15,
2020. On March 16, 2020, the government expanded the scope by placing the entire Luzon region under an enhanced community
quarantine (ECQ), with major cities in Visayas and Mindanao shortly following suit. On March 24, 2020, Republic Act No. 11469
was enacted declaring the existence of a national emergency arising from the COVID-19 situation and a national policy effectively
authorizing the Philippine President, for a limited period and subject to restrictions, to exercise powers necessary and proper to
carry out the declared national policy and for other purposes. On April 1, 2020, the Implementing Rules and Regulations (IRR) of
Section 4(aa) of Republic Act No. 11469, otherwise known as the “Bayanihan to Heal As One Act”, was released. On April 7, 2020,
the Philippine President announced that the ECQ throughout the island of Luzon has been extended up to April 30, 2020. On April
24, 2020, the Philippine President extended the ECQ in Metro Manila, Central Luzon, CALABARZON and other selected high-
risk areas until May 15, 2020. The President also placed some areas in the Visayas and Mindanao under ECQ but subject to
reassessment, while provinces or areas which are considered moderate- and low-risk in the spread of COVID-19 were placed under
a general community quarantine starting on May 1, 2020. On May 15, 2020, it was announced that Metro Manila, Laguna and Cebu
City will transition from an ECQ to a modified ECQ from May 16 to May 31, 2020 while other parts of the country were placed in
less stringent states of community quarantine.
The government-mandated temporary closure of non-essential shops and businesses are expected to have material effects on the
Group’s overall financial performance in 2020. While the Group cannot ascertain at this time the full impact to its financial position,
performance and cash flows, the Group is cognizant of the following risks brought about by the disruptions:
• The Real Estate segment may face a decline in revenues following the temporary suspension of construction activities of its
residential and commercial properties, and closure of mall operations except for essential business establishments within the
malls such as supermarkets, pharmacies, healthcare centers and banks that remain open for limited operating hours. The
uncertainties may also impact the office leasing business as tenants adopt a work-from-home scheme or other flexible working
arrangements. Additional risks include the possible delays in collection of payments from residential buyers.
• The imposition of travel restrictions and quarantine measures across the globe have immediate negative effects on businesses
especially on tourism and hospitality businesses. As an operator of hotels and resorts across the Philippines, a significant decline
in occupancy rates is expected. Five out of the six hotels and resorts under the Group’s portfolio remain in operation during the
ECQ but on very limited basis to accommodate current business needs. Crimson Boracay however has temporarily ceased
operations while the entire island of Boracay is on lockdown. Quest Tagaytay is currently used as a quarantine facility for
OFWs and other returning overseas Filipinos.
• The Banking segment is running on skeletal force while under ECQ. Nevertheless, it opens as many branches feasible, ensures
cash availability in ATMs and maintains availability of various digital and online products. Following the government’s
mandate, it has provided its customers a 30-day grace period for all loans falling due within the ECQ period. Other possible
measures of forbearance are likewise being evaluated. An extended disruption to business activities may affect East West
Bank’s loan portfolio and asset quality.

80
• The Company’s 405-megawatt power plant located in Misamis Oriental, Mindanao is fully operational. While relatively less
affected because of its geographic location, it has nonetheless undertaken measures called for under the ECQ program. It has
employed a rotation setup for its work force and implemented various precautionary measures such as strict adherence to
personal hygiene, practices, mandatory temperature checks and social distancing protocols, and proper and frequent sanitation
and deep disinfection of plant premises.
The Group considers the events surrounding the outbreak as non-adjusting subsequent events, which do not impact its financial
position and performance as of and for the year ended December 31, 2019. However, the outbreak could have a material impact
on its 2020 financial results and even periods thereafter. To mitigate the risks of the COVID-19 pandemic on its operations, the
Company has undertaken several measures such as the following:
• It has reviewed its capital expenditure program and adjusted it to reflect the expected slowdown in demand as well as
construction delays of projects.
• It has put in place mitigation measures to ensure the safety of its customers, homeowners, locators and tenants through sanitation
and social distancing practices, and has carried out regular communication through digital means and work-from-home service
desks.
• It has implemented various precautionary measures for a safe workplace such as work- from-home arrangements, strict
adherence to personal hygiene practices, mandatory temperature checks and social distancing protocols, and proper and
frequent sanitation and deep disinfection of premises.
• It has cancelled large group meetings in person and instead utilize technology for remote communication. It will conduct, for
the first time, its annual shareholder’s meeting virtually with online electronic voting.
Amidst the evolving nature of this outbreak, the Company remains committed to abide by and comply with all rules and regulations
issued by the government in relation to the COVID-19 pandemic.
RESULTS OF OPERATIONS
Year Ended December 31, 2018 Compared With Year Ended December 31, 2017
Revenues
Real Estate Operations
Sale of Lots, Condominium and Residential Units
Sale of lots, condominium and residential units grew by 18.2% or P3,132.1 million from P17,230.7 million in 2017 to P20,362.8 million
in 2018, at the back of: (a) FAI’s higher sales of commercial lots and condominium units; and (b) FLI’s increased real estate sales from
middle-income projects.
Mall and Rental Revenues
Mall and rental revenues amounted to P6,174.4 million in 2018, an increase of 26.1% or by P1,277.2 million from P4,897.2 million in
2017. Filinvest Axis Tower 1, located in Northgate Cyberzone Alabang; Filinvest Cyberzone Cebu Tower 2, located in Salinas, Cebu;
and Filinvest Cyberzone Mimosa Building 1, located in Mimosa Clark, have been completed adding 76,046 square meters (sq.m) of
gross leasable area (GLA) to the office portfolio. FLI now operates 27 buildings totaling 457,970 sq.m. of GLA. For retail, FLI now has
242,127 sq.m. GLA to the retail portfolio.
Hospitality Operations
Hospitality Revenues
Hospitality revenues amounted to P2,665.5 million, a jump of 22.6% or an increase of P491.0 million from the P2,174.5 million revenues
reported in 2017. This was on account of higher room and occupancy rates, increased golf revenues, and the commencement of
operations of Crimson Resort and Spa Boracay (Crimson Boracay) in November 2018.

81
Banking and Financial Services
Net Interest Income
Banking and Financial Services Interest Income
The banking and financial services’ interest income surged by 10.7% or P2,299.8 million from P21,494.7 million in 2017 to
P23,794.5 million in 2018 primarily due to the higher volume of EW’s loans and receivables particularly in consumer loans, with growth
across EW’s auto, credit card and personal loans.
Costs of Banking and Financial Services
Costs of banking and financial services increased by 43.2% or P1,447.3 million from P3,346.7 million in 2017 to P4,794.0 million in
2018 mainly due to the effect of higher deposit rates and increased volume of high-cost time deposit liabilities, which comprised almost
half of the Bank’s total deposit liabilities as of December 31, 2018.
Net Interest Income
Net interest income increased by 4.7% from P18,148.0 million in 2017 to P19,000.5 million in 2018 due to the continued growth in
EW’s consumer portfolio, offsetting the impact of higher volume of high-cost time deposits.
Power Operations
Power Revenues
Power revenues decreased by 13.2% or P1,312.0 million from P9,942.5 million in 2017 to P8,630.5 million in 2018. The revenues
reported in previous year included the revenue contribution from Independent Power Producer Administrator (IPPA) contracts which
were terminated in the last quarter of 2017. Excluding the contributions from IPPA contracts in 2017, power revenues increased by
27.2% from P6,724.0 million to P8,555.0 million due to increased energy sales.
Sugar Operations
Sugar Sales
The Group’s sugar sales increased by 14.3% or P305.7 million from P2,143.0 million in 2017 to P2,448.7 million in 2018 on account
of higher sales volumes and improved sugar prices.
Other Income
Other Income — Real Estate Operations
Other income from real estate operations decreased by 8.2% to P2,236.8 million in 2018 from P2,437.5 million in 2017 due to lower
interest income derived from contracts receivable.
Other Income — Hospitality Operations
Other income from hospitality operations increased by 24.7% or P7.9 million to P39.8 million in 2018 from P31.9 million in 2017
mainly due to higher share in net income of a joint venture.
Other Income — Banking and Financial Services
The Group’s other income from banking and financial services decreased by 13.7% or P985.3 million from P7,197.7 million in 2017 to
P6,212.4 million in 2018. This was primarily on account of EWRB’s reduced service charges and fees earned from teachers’ loan, as a
result of the suspension by the Department of Education (DepEd) of the automatic payroll deduction arrangement starting in November
2017. In June 2018, EWRB signed the new Memorandum of Agreement with DepEd and has resumed providing new loans to public
school teachers.
Other Income – Power Operations
Other income from power operations increased by P650.2 million from P9.1 million in 2017 to P659.3 million in 2018 mainly due to
compensation received from the power plant contractor amounting P650.0 million for lost revenues due to the delay in the completion
of the power plant.
Other Income — Sugar Operations
Other income from sugar operations of P89.2 million was an increase of almost thrice as much as the reported P31.5 million other
income in 2017 due to conversion rights income.
Costs
Costs of Sale of Lots, Condominium and Residential Units
Costs of sale of lots, condominium and residential units increased by 12.9% or P1,179.2 million from P9,142.7 million to
P10,321.9 million primarily due to increase in the amount of real estate sales booked during the current period. The said increase in
82
costs of sales was lower than the 18.2% increase in the Group’s sale of lots, condominium and residential units due to a greater proportion
of FAI’s sale of commercial lots with relatively higher gross profit margin.
Costs of Mall and Rental Services
Costs of mall and rental services increased by 5.6% or P46.4 million from P834.2 million in 2017 to P880.6 million in 2018 mainly due
to depreciation of new buildings for lease that commenced operations in 2018, as mentioned above.
Costs of Hospitality Operations
The Group’s costs of hospitality operations increased by 24.9% or P268.4 million from P1,076.8 million in 2017 to P1,345.2 million in
2018, driven by higher manpower costs resulting from wage increase and additional staffing, higher food and beverage costs, salaries
and utilities, due to the commencement of operations of Crimson Boracay in 2018 and higher business volume across the Group’s other
hotel properties.
Costs of Banking and Financial Services
Costs of banking and financial services was accounted for under net interest income in the “Revenues”.
Costs of Power Operations
Costs of power operations decreased by 34.7% or P2,455.9 million from P7,069.7 million in 2017 to P4,613.7 million in 2018. The
costs of power in 2017 included the incurred costs of the IPPA contracts consisting of P2,316.6 million purchased electricity and
P1,138.6 million amortization of rights under the contracts. These initially qualified as intangible assets but were subsequently
derecognized when the IPPA contracts were terminated in 2017.
Costs of Sugar Sales
The Group’s costs of sugar sales increased by 8.5% or P151.9 million from P1,787.1 million in 2017 to P1,939.0 million in 2018.
Because of higher sales volume, the 8.5% increase in costs of sugar sales was slower than the 14.3% increase in the Group’s sugar sales
due to improved prices of raw sugar.
Costs of Other Operations
Costs of other operations increased by 5.4% or P32.5 million from P607.5 million in 2017 to P640.0 million in 2018 due to translation
adjustment of interest on foreign-currency denominated bonds payable.
Expenses
Real Estate Operations
Expenses of real estate operations increased by 22.0% from P5,045.0 million in 2017 to P6,153.3 million in 2018 attributed to (a) higher
business permits and real property taxes as a result of higher revenues and completion of more buildings during the year; (b) full
operation of DPI which resulted to higher salaries, wages and benefits; (c) service fees paid by PDDC; and (d) selling and marketing
expenses mainly for brokers’ commissions and advertising costs.
Hospitality Operations
The expenses of hospitality operations increased by 6.0% or P53.0 million from P876.8 million in 2017 to P929.8 million in 2018 on
account of higher room occupancy rates and the commencement of operations of Crimson Boracay in 2018, which led to increased
manpower cost, higher rent and credit card commission expense.
Banking and Financial Services
The expenses of banking and financial services increased by 3.3% from P18,895.7 million in 2017 to P19,521.0 million in 2018 on
account of: (a) higher tax rates, particularly the documentary stamp tax on time deposits; (b) marketing expenses due to new advertising
campaigns; and (c) training exercises for EW’s employees to be deployed at its branch stores.
Power Operations
The expenses of power operations decreased by 26.5% or P957.1 million from P3,614.7 million in 2017 to P2,657.6 million in 2018
due to (a) accretion expense on the liability on IPPA contracts, incurred only in 2017 as the contracts were terminated in the same year;
and (b) 2017 provision for probable losses on contingencies incident to the ordinary course of business operations of the power
operations segment.
Sugar Operations
Sugar operating expenses increased by 48.5% from P233.3 million in 2017 to P346.4 million in 2018 mainly due to additional allowance
for impairment losses on certain sugar refinery assets and provision for probable losses on contingencies.
Others
Expenses of other operations increased by 90.5% or P614.1 million from last year’s P678.5 million to P1,292.6 million. The expenses
reported in previous year included a one-time adjustment in borrowing costs pertaining to interest expense which should have been
capitalized as part of the cost of a constructed asset that was funded by the bonds in which the borrowing costs were incurred.

83
Provision for Income Tax
Provision for income tax increased by 8.4% or P346.3 million from P4,108.4 million in 2017 to P4,454.7 million in 2018. Provision for
current income tax increased by 20.5% or P664.6 million attributed to higher taxable income of the real estate operations as a result of
increased revenues. Provision for deferred income tax decreased by 36.8% or P318.4 million due mainly to temporary differences
between financial and taxable income.
Net Income
As a result of the foregoing, consolidated net income increased by 30.7% or P3,150.8 million from P10,273.3 million in 2017 to
P13,424.0 million in 2018. Net income attributable to equity holders of the Parent Company increased by 47.6% or P3,147.1 million
from P6,612.4 million in 2017 to P9,759.5 million in 2018 while net income attributable to noncontrolling interest amounted to
P3,664.5 million in 2018.
FINANCIAL CONDITION
As at December 31, 2018 Compared with As at December 31, 2017
Assets
Total consolidated assets as of December 31, 2018 increased by 10.8% from P532,833.6 million to P590,504.3 million. The changes in
asset accounts were accounted as follows:
Cash and cash equivalents decreased by 9.6% or P7,197.7 million from P75,319.0 million to P68,121.3 million. More funds were placed
in higher yielding liquid assets which led to lower cash balance particularly on EW’s interbank loans receivable.
Loans and receivables of the real estate operations decreased by 80.5% from P21,859.7 million to P4,261.3 million as a result of the
adoption of PFRS 15, Revenue from Contracts with Customers, wherein receivables with maturities exceeding one year were reclassified
as Contract assets. Total Receivables and Contract assets of the real estate segment decreased by 28.1% due to strong collections during
the period, the majority of which came from middle-income projects.
Loans and receivables of the hospitality operations increased by 112.5% or P104.1 million from P92.5 million to P196.6 million which
mainly came from credit card transactions.
Loans and receivables of the banking and financial services increased by 10.7% or P22,371.8 million from P209,159.1 million to
P231,530.9 million on account of the growth in EW’s consumer loans consisting of auto, personal, credit cards and mortgage loans.
Loans and receivables of the power operations increased by 3.1% or P55.5 million from P1,786.0 million to P1,841.5 million principally
due to transition adjustments of P200.0 million arising from the adoption of new accounting standards.
Loans and receivables of the sugar operations went down by 9.3% from P130.0 million to P117.9 million due to lower level of advances
to sugar planters related to sugar cane farming operations.
Financial assets at FVTPL decreased by 40.7% or P2,974.4 million from P7,313.2 million to P4,338.8 million which resulted from the
movements in EW’s proprietary trading portfolio.
Financial assets at FVTOCI increased by 85.4% or P345.5 million from P404.8 million in 2017 to P750.3 million in 2018 mainly due
to higher fair values of securities investments.
Investment securities at amortized cost amounted to P36,510.5 million which posted an increase of almost 6 times the P6,472.2 million
balance in year-end of last year, in line with EW’s business models.
Contract assets of P11,455.4 million was recognized and reclassed from Loans and receivables in compliance with PFRS 15, as
previously mentioned.
Real estate inventories went up by 22.2% from P65,599.4 million to P80,194.3 million due to rawland acquisitions including acquisition
of Cleon Properties amounting to P=4.7 billion and P=1.9 billion of GPRDI. Moreover, real estate inventories accelerated spending on
saleable real estate project costs.
Coal, spare parts and other inventories increased by 19.9% or P114.9 million from P=576.6 million to P=691.4 million principally due to
the higher level of the power segment’s coal and fuel inventory as of reporting date.
Investment properties increased by 8.9% or P=5,634.7 million from P=63,347.1 to P=68,981.8 million mainly due to the additional
construction costs of new buildings intended for office and commercial buildings for lease. These are primarily located in Northgate

84
Cyberzone in Alabang, Filinvest Cyberzone in Pasay Bay Area, Filinvest Mimosa, Fora Mall in Tagaytay, Main Square in Cavite, and
Il Corso in Cebu.
Property, plant and equipment decreased by 1.3% or P=601.4 million from P=45,024.3 million to P=44,422.9 million mainly due to
depreciation expense, offset by the additional property and equipment acquired during the year.
Investments in joint ventures decreased by 15.9% or P139.2 million from P873.8 million to P734.6 million attributed mainly to take up
of EW’s proportionate share in the net loss of its joint venture.
Deferred tax assets increased by 17.5% or P=387.7 million from P=2,213.1 million to P=2,600.8 million due to EW’s higher allowances set-
up, net of write-offs.
Other assets increased by 4.9% from P=22,281.9 million to P=23,372.8 million mainly attributed to the construction costs of the Filinvest
Cebu Cyberzone, classified under noncurrent other assets pursuant to BTO agreement with the Government of Cebu.
Liabilities
Total consolidated liabilities amounted to P470,822.9 million as at December 31, 2018, 11.1% higher than P423,704.0 million balance
as at December 31, 2017. Movements in account balances were as follows:
Deposit liabilities stood at P266,926.1 million, up by 10.6% from P241,317.2 million largely attributable to the growth of high-cost
deposits.
Bills and acceptances payable increased by 332.0% or P13,810.2 million from P4,159.7 million to P17,969.9 million due to higher
volume of interbank borrowings of EW.
Accounts payable, accrued expenses and other liabilities decreased by 0.8% or P318.1 million from P40,798.5 million to
P40,480.4 million as a result of the adoption of PFRS 15, Revenue from Contracts with Customers, wherein accounts payable with
maturities exceeding one year were reclassified as Contract liabilities. Total Accounts payable and Contract liabilities increased by
13.2% due to higher level of payables to contractors and suppliers for construction activities.
Contract liabilities of P5,690.7 million was recognized in compliance with PFRS 15, as previously mentioned.
Long-term debt increased by 1.2% or P1,531.1 million to P127,347.5 million from P125,816.4 million on account of additional loan
availments, to finance the ongoing development of the real estate and hospitality operations, partially offset by amortizations paid during
the year.
Income tax payable decreased by 15.2% from P715.1 million to P606.5 million attributable to EW’s lower taxable income, to be remitted
in 2019.
Deferred tax liabilities increased by 7.3% or P722.5 million from P9,962.2 million to P10,684.7 million due to additional capitalized
borrowing costs on long-term debt and other temporary differences of financial and taxable income.
Equity
On May 4, 2018, the Parent Company’s BOD approved the declaration and payment of cash dividends of P=661.6 million or
P=0.0765 per share for every common shares of record as of June 28, 2018 share payable on June 3, 2018.
On April 28, 2017, the Parent Company’s BOD approved the declaration and payment of cash dividends of P=549.7 million or
P=0.059 per share for every common shares of record as of May 28, 2017 share payable on June 21, 2017.
On April 29, 2016, the Parent Company’s BOD approved the declaration and payment of cash dividends of P=480.7 million or
P=0.052 per share for every common share payable on June 21, 2016 to stockholders of record as of May 27, 2016.
The Group has commitments for capital expenditures for the project developments of the real estate segment, the requirement of the
sugar manufacturing subsidiaries, the development and construction of solar rooftop facilities and other utility projects, the intended
construction and management of various hotels, and the bank’s expansion and implementation of IT projects, which could be adequately
covered by the operating cash flow and availment of medium and long term loans.

85
Performance Indicators
As of And For The
Year Ended
As of And For The
Year Ended
December 31, 2018 December 31, 2017
Earnings Per Share - Basic (EPS) P1.128 /share P0.710 /share
Net Income (Attributable to Equity Holders of the Parent
Company)
Weighted Average Number of Outstanding Shares
Price Earnings Ratio (PE Ratio) 10.46 Times 10.92 Times
Closing Price
EPS
Return on Revenue 18% 15%
Total Net Income
Total Revenue
Return on Equity (Average) 12% 10%
Total Net Income
Average Total Equity
Assets to Equity Ratio 4.93 : 1 4.88 : 1
Total Assets
Total Equity
Debt to Equity Ratio
a) Long-term Debt 1.06 : 1 1.15 : 1
Total Equity
b) Total Liabilities Excluding Deposit
Liabilities, and Bills and Acceptances Payable 1.55 : 1 1.63 : 1
Total Equity
Current Ratio
a) Including EW
Current Assets 0.95 : 1 1.00: 1
Current Liabilities
b) Excluding EW
Current Assets 5.72 : 1 3.10 : 1
Current Liabilities
Quick Ratio 1.43 : 1 1.02 : 1
Current Assets – Inventories
Current Liabilities
Earnings Before Interest, Taxes, Depreciation and
Amortization (EBITDA) to Total Interest Expense 6.94 Times 7.17 Times
EBITDA
Total Interest Expense

86
Notes to Financial Statements and Other Disclosures
1. The attached consolidated financial statements are prepared in compliance with PFRS. The accounting policies and methods of
computation followed in the financial statements for the year ended December 31, 2018 are the same as those followed in the annual
financial statements of the Company for the year ended December 31, 2017.
2. Except for the sugar business, the operating activities of the Company are carried out uniformly over the calendar year. The sugar
milling season of the Company’s sugar subsidiaries is usually from November to June of the following year. Except for this milling
season, there are no other unusual operating cycles or seasons during the year.
3. Except as disclosed in the Management’s Discussion and Analysis of Financial Condition and Results of Operation, there are no
unusual items affecting assets, liabilities, equity, net income or cash flows for the current period. There are no known trends,
demands, commitments, events or uncertainties that will have a material impact on the Company’s liquidity.
4. There are no changes in estimates of amounts reported in the previous period that have material effects in the current period.
5. Except for those discussed in the Management’s Discussion and Analysis of Financial Condition and Results of Operations, there
are no issuances, repurchases and repayments of debt and equity securities.
6. There were no other dividends paid (aggregate or per share) separately for ordinary shares and other shares during the current
period, except as discussed in the previous sections.
7. The Company derives its revenues from the following reportable segments:
Real Estate Operations
This involves acquisition of land, planning and development of large-scale fully integrated residential communities as well as the
development and sale of residential lots, housing units, medium-rise residential buildings, farm estates, industrial parks, residential
resort projects, a private membership club and condominium buildings. This segment also involves operations and management of
cinema and mall, property management and leasing of commercial and office spaces.
Hospitality Operations
This involves operation of hotels, including management of resorts, villas, golf course, service apartment and other services for the
pleasure, comfort and convenience of guests in said establishments under its management.
Banking and Financial Services
This involves a wide range of financial services to consumer and corporate clients which includes deposit-taking, loan and trade
finance, treasury, trust services, credit cards, cash management, custodial services, insurance services and leasing and finance. The
business units in this segment consist of retail banking, corporate banking, consumer banking, and treasury and trust.
Power Operations
This involves the establishment, construction, operation of power plants and supply of power to offtakers and also includes
management of power plants’ output under the IPPA contracts.
Sugar Operations
This involves operation of agricultural lands for planting and cultivating farm products, operation of a complete sugar central for
the purpose of milling or converting sugar canes to centrifugal or refined sugar and selling of sugar and by-products.
Other Operations
This involves other operations of the Parent Company including CWSI, CTI and FDCI. FDCI was incorporated to facilitate the
Group’s issuance of foreign currency-denominated bonds while CWSI was incorporated to provide maintenance, operation,
management and rehabilitation of waterworks sewerage and sanitation system and services specifically for the distribution, supply
and sale of potable water to domestic, commercial and industrial. CTI is engaged in providing computer and information technology
services including, but not limited to, general consulting, improvement systems planning, network integration, business re-
engineering services, systems integration and system development.
Financial information on the operations of these business segments as of and for the years ended December 31, 2018 and 2017 are
summarized and included in the accompanying Notes to Consolidated Financial Statements.
8. Except as discussed in the Management’s Discussion and Analysis of Financial Condition and Results of Operations, there are no
material events subsequent to December 31, 2018 up to the date of this report that have not been reflected in the financial statements
for the current period.
9. There have been no changes in the composition of the Company during the current period, such as business combination, acquisition
or disposal of subsidiaries and long-term investments, restructurings and discontinuing operations, except as discussed in the
Developments of the Company and Management’s Discussion on its Results of Operations.

87
10. There are no changes in contingent liabilities or contingent assets since December 31, 2018.
11. There are no material contingencies and any other events or transactions affecting the current period.
12. There are no known events that will trigger direct or contingent financial obligation that is material to the Company, including any
default or acceleration of an obligation.
13. There are no known material off-balance sheet transactions, arrangements, obligations including contingent liabilities, and other
relationships of the Company, with unconsolidated entities or other persons created during the reporting period.
14. There are no significant elements of income or loss, except as discussed in the Management’s Discussion on the Results of
Operations that did not arise from the Company’s continuing operations.
15. There are no known seasonal aspects that had a material effect on the financial condition or results of operations.
16. Aside from the possible material increase in interest rates on the outstanding floating – rate term loans, there are no known trends,
events or uncertainties or any material commitments that may result to any cash flow or liquidity problems of the Group within the
next 12 months. The Group is not in default or breach of any note, loan, lease or other indebtedness or financing arrangements
requiring it to make payments or any significant amount in its accounts payable that have not been paid within the stated terms.
RESULTS OF OPERATIONS
Year Ended December 31, 2017 Compared With Year Ended December 31, 2016
Revenues
Real Estate Operations
Sale of Lots, Condominium and Residential Units
Sale of lots, condominium and residential units increased by 5.0% or P823.9 million from P16,406.8 million in 2016 to
P17,230.7 million in 2017 as a result of growth in sale of commercial lots and real estate sales from middle-income projects inclusive
of MRBs and HRBs.
Mall and Rental Revenues
Mall and rental revenues reached P4,897.2 million, an increase of 27.8% or by P1,065.3 million from P3,831.9 million in 2016. Vector
Three, located in Northgate Cyberzone Alabang has been completed and turned over, adding 36,000 square meters of GLA to the office
portfolio. FLI now operates 22 buildings totaling 348,000 square meters of GLA. For retail, Fora Mall in Tagaytay and Main Square
Mall in Bacoor were completed adding 50,000 square meters GLA to the retail portfolio.
Hospitality Operations
Hospitality Revenues
Hospitality revenues climbed to P2,174.5 million in 2017 from P1,587.4 million in 2016 which posted a surge of P587.1 million or
37.0% attributed mostly to Quest Hotel and Conference Center and Mimosa Golf, Clark which begun contributing revenues in the third
quarter of last year. The increase was also backed by higher occupancy and average room rates across all hotels.
Banking and Financial Services
Net Interest Income
Banking and Financial Services Interest Income
Interest income from banking and financial services surged by 21.5% or P3,810.2 million from P17,684.5 million in 2016 to
P21,494.7 million in 2017 attributable to double-digit growth in consumer loans led by auto loans, personal loans and mortgage loans.
Costs of Banking and Financial Services
Costs of banking and financial services was higher by 28.1% or P734.0 million from P2,612.7 million in 2016 to P3,346.7 million in
2017 primarily on account of strong growth in deposits and bank’s issuance of P10.0 billion worth of LTNCDs.
Net Interest Income
As a result of the foregoing, net interest income stood at P18,148.0 million, 20.4% or P3,076.2 million higher than the P15,071.8 million
posted last year. Net interest margin remains at an industry leading level of 7.8% as EW remains one of the most consumer focused
bank in the industry.

88
Power Operations
Power Revenues
Power revenues amounted to P9,942.5 million in 2017, an increase of 32.4% or P2,432.5 million from P7,510.0 million in 2016. This
was attributable to full year operation of the FDC Misamis coal plant which started commercial operation in the last quarter of 2016.
Sugar Operations
Sugar Sales
Sugar sales in 2017 amounted to P2,143.0 million, lower by 16.4% or P419.5 million from P2,562.5 million sales in 2016 mainly caused
by decline in sugar prices.
Other Income
Other Income — Real Estate Operations
Other income from real estate operations amounted to P2,437.5 million, an increase of 3.3% or P78.6 million over the P2,358.9 million
other income of last year due to higher interest income from contracts receivable, miscellaneous income and various fees charged to
buyers and other lease-related activities.
Other Income — Hospitality Operations
Other income from hospitality operations was lower by 23.5% or by P9.9 million, from P41.8 million in 2016 to P31.9 million in 2017,
due to a one-time booking of cumulative share in net earnings of CHI in 2016.
Other Income — Banking and Financial Services
Other income from banking and financial services grew by 10.3% or P672.7 million from P6,525.0 million in 2016 to P7,197.7 million
in 2017 due to higher service charges, fees and commissions consisting mostly of consumer loan-related fees and credit card charges.
Other Income – Power Operations
Other income from power operations was lower by P26.8 million at P9.1 million in 2017 on account of forex adjustments.
Other Income — Sugar Operations
Other income from sugar operations went up by 3.6% or P1.1 million from P30.4 million in 2016 to P31.5 million in 2017 as a result of
increase in storage income.
Costs
Costs of Sale of Lots, Condominium and Residential Units
Costs of sale of lots, condominium and residential units amounting to P9,142.7 million during the year, was 3.0% or P262.8 million
higher than P 8,879.9 million of last year mainly on account of higher sales booking during the year.
Costs of Mall and Rental Services
Costs of mall and rental services went up to P834.2 million in 2017 or an increase of 43.3% or by P251.9 million from P582.3 million
of last year due to depreciation of new buildings for lease.
Costs of Hospitality Operations
Costs of hospitality operations was at P1,076.8 million in 2017, higher by 37.4% or P293.0 million from P783.8 million in 2016, because
of additional business volume from MCI’s Quest Hotel and Conference Center and Mimosa Golf, Clark as it becomes full year
operational in 2017.
Costs of Banking and Financial Services
Costs of banking and financial services was accounted for under net interest income in the “Revenues and Other Income”.
Costs of Power Operations
Costs of power operations at P7,069.7 million increased by 12.2% or P766.2 million from P6,303.5 million cost in 2016. This was due
to the full year operation costs of the coal plant.
Costs of Sugar Sales
Costs of sugar sales in 2017 amounted to P1,787.1 million, a decrease of 1.8% or P32.0 million from the P1,819.1 million cost in 2016.
The decline resulted mainly from the drop in sugar prices.
Costs of Other Operations
A reduction of 3.8% or P24.2 million in costs of other operations was posted from P631.7 million in 2016 to P607.5 million in 2017 due
to an adjustment in accrued interest payable.

89
Expenses
Real Estate Operations
Expenses of the real estate operations increased by P661.7 million or 15.1% to P5,045.0 million from P4,383.3 million in 2016 due to
higher operating expenses related to the opening of new malls and BPO buildings for lease.
Hospitality Operations
Expenses of the hospitality operations decreased by 3.7% or P33.5 million from P910.3 million in 2016 to P876.8 million in 2017 due
to capitalized rent expense for renovations made in Quest Hotel and Conference Center and Mimosa Golf, Clark.
Banking and Financial Services
Expenses of the banking and financial services increased year-on-year by 7.0% from P17,658.6 million to P18,895.7 million which
ascribed to higher manpower cost, taxes and licenses, brokerage fees, advertising and insurance, all on account of expanded business
stores and operations.
Power Operations
Expenses of the power operations doubled from P1,251.3 million in 2016 to P3,614.7 million in 2017 primarily due to the impact of the
full year operation of Misamis coal plant on depreciation and interest.
Sugar Operations
Expenses of sugar operations went up by 35.7% to P233.3 million in 2017 from P171.9 million in 2016 mainly because of the provision
for impairment of refinery assets.
Others
Expenses of other operations at P678.5 million declined by 31.2% or P307.2 million from last year’s P985.7 million as 2017 includes a
one-time adjustment in borrowing costs pertaining to interest expense which should have been capitalized as part of the cost of a
constructed asset that was funded by the bonds in which the borrowing costs were incurred.
Provision for Income Tax
Provision for income tax increased by 31.5% or P983.3 million from P3,125.1 million in 2016 to P4,108.4 million in 2017. Provision
for current income tax increased by 25.9% or P666.3 million attributed to higher taxable income of the real estate and banking and
financial services. Provision for deferred income tax also increased by 57.8% or P317.1 million due mainly to EW’s lower provision
for probable losses during the current reporting period.
Net Income
As a result of the foregoing factors, consolidated net income surged by 21.2% or P1,797.2 million from P8,476.1 million in 2016 to
P10,273.3 million in 2017. Net income attributable to equity holders of the Parent Company amounted to P6,612.4 million in 2017, a
20.2% increase from P5,502.7 million in 2016.
FINANCIAL CONDITION
As at December 31, 2017 Compared with As at December 31, 2016
Assets
Total consolidated assets stood at P532,833.6 million as at December 31, 2017, higher by 6.9% or P34,194.5 million from
P498,639.1 million as at December 31, 2016. The following were the changes in account balances:
Cash and cash equivalents increased by 18.7% or P11,840.6 million from P63,478.4 million to P75,319.0 million on account of EW’s
growth in bank deposits driven by business expansion.
Loans and receivables of the real estate operations decreased by 14.7% from P25,620.0 million to P21,859.7 million mainly due to
collections of receivables during the period.
Receivables of the hospitality operations expanded by 67.6% or P37.3 million from P55.2 million to P92.5 million mainly due to
increased volume of revenues.
Loans and receivables of the banking and financial services climbed by 11.6% or by P21,707.7 million from P187,451.4 million to
P209,159.1 million as the bank’s consumer loans grew by 16.6% year-on-year from higher business volume of customer loans on auto,
personal and mortgage loans.

90
Receivables of the power operations at P1,786.0 million was higher by 18.9% or P283.4 million than the P1,502.6 million balance as at
December 31, 2016 on account of the full year operations of the coal plant.
Receivables of the sugar segment amounted to P130.0 million, 12.3% or P14.2 million higher than P115.8 million balance in end-2016
brought by additional advances to sugar planters.
Financial assets at FVTPL posted a growth of 38.8% or P2,045.4 million from P5,267.8 million to P7,313.2 million due to movements
in EW’s proprietary trading portfolio.
Financial assets at FVTOCI decreased by 4.0% or P16.9 million from P421.7 million in 2016 to P404.8 million in 2017 on account
mainly of changes in fair values during the period.
Investment securities at amortized cost amounted to P6,472.2 million or a decrease of 41.8% or P4,657.3 million from P11,129.5 million
in line with EW’s balance sheet strategy.
Real estate inventories went up to P65,633.6 million or a growth of 16.8% or P9,428.2 million from P56,205.4 million ascribed to
additional projects launched and purchases of rawland for development.
Coal, spare parts and other inventories decreased by 15.8% or P108.6 million from P=685.2 million to P=576.6 million due to lower level
of sugar inventories and power segment’s increased consumption of coal, diesel, material supplies, spare parts and chemicals.
Investment properties and property, plant and equipment increased by 9.4% and 5.1%, respectively, due to additional costs of buildings
for lease and additional construction and development costs of Crimson Resort Boracay.
Investments in joint ventures of P873.8 million posted an increase of 34.5% or P224.0 million from P649.8 million on account of EW’s
remeasurement of shares in the joint venture offset by its proportionate share in the net loss.
Deferred tax assets went down by 5.4% or P=125.2 million from P=2,338.3 million to P=2,213.1 million on account of the termination of
power segment’s IPPA contracts.
Goodwill as of December 31, 2017 amounted to P=10,381.1 million, 26.6% or P=3,770.2 million lower than P=14,151.3 million balance as
of December 31, 2016. The decrease resulted from the amendment by way of partial rescission of the Deed of Exchange between FDC
and ALGI involving the transfer by the latter of 100% ownership in PSHC to the former in exchange for FDC shares.
IPPA rights of P=7,113.4 million as of December 31, 2016 were fully closed as of December 31, 2017 due to the termination of the IPPA
contracts for Mt. Apo 1 and 2 geothermal power plants in December 2017.
Other assets stood at P=22,281.9 million, an increase of 2.4% or P=521.2 million from P=21,760.7 million on account of construction costs
of the noncurrent assets in relation to the Build-Transfer-Operate (BTO) agreement with the Government of Cebu and hospitality
segment’s advances to contractors particularly for Crimson Hotel Boracay.
Liabilities
Total consolidated liabilities amounted to P423,704.0 million as at December 31, 2017, 7.4% higher than P394,684.2 million balance
as at December 31, 2016. Movements in account balances were as follows:
Deposit liabilities stood at P241,317.2 million, up by 8.7% from P221,979.3 million largely attributable to the growth of low cost
deposits (CASA) generated from the Bank’s expanded store network. LTNCDs aggregating P10.0 billion were also issued during the
year.
Bills and acceptances payable increased by 89.5% or P1,965.1 million from P2,194.6 million to P4,159.7 million due to higher volume
of interbank and other short term borrowings of EW.
Accounts payable, accrued expenses and other liabilities rose by 16.3% or P5,848.5 million from P35,885.0 million to P41,733.5 million
mainly due to the accrual for the purchase of rawland and payables to contractors and suppliers for project constructions.
Liability on IPPA contract of P7,530.2 million as of December 31, 2016 was closed in 2017 due to the termination of the IPPA contracts
for Mt. Apo 1 and 2 in December 2017, as previously mentioned.
Income tax payable increased by 47.0% from P486.5 million to P715.1 million attributable to current tax set-up of real estate for the
year.

91
Long-term debt totaled P125,816.4 million as of December 31, 2017, an increase of 7.1% or P8,380.4 million from the
P117,436.0 million total debt as at December 31, 2016 on account of the bond issuance by CPI and additional bank loans to finance the
ongoing projects and developments of the Group.
Deferred tax liabilities increased by 8.6% or P789.4 million from P9,172.8 million to P9,962.2 million due to additional capitalized
borrowing costs on long-term debt and other temporary differences of financial and taxable income.
Equity
On April 28, 2017, the Parent Company’s BOD approved the declaration and payment of cash dividends of P=549.7 million or
P=0.059 per share for every common shares of record as of May 28, 2017 share payable on June 21, 2017.
On April 29, 2016, the Parent Company’s BOD approved the declaration and payment of cash dividends of P=480.7 million or
P=0.052 per share for every common share payable on June 21, 2016 to stockholders of record as of May 27, 2016.
On May 15, 2015, the Parent Company’s BOD approved the declaration and payment of cash dividends of P=465.9 million or
P=0.05 per share for every common share payable on July 2, 2015 to stockholders of record as of June 10, 2015.
The Group has commitments for capital expenditures for the project developments of the real estate segment, the requirement of the
sugar manufacturing subsidiaries, the development and construction of power plant and other utility projects, the intended construction
and management of various hotels, and the bank’s expansion and implementation of IT projects, which could be adequately covered
by the operating cash flow and availment of medium and long term loans.
Performance Indicators
As of And For The
Year Ended
As of And For The
Year Ended
December 31, 2017 December 31, 2016
Earnings Per Share - Basic (EPS) P0.710 /share P0.591 /share
Net Income (Attributable to Equity Holders of the Parent
Company)
Weighted Average Number of Outstanding Shares
Price Earnings Ratio (PE Ratio) 10.92 Times 13.94 Times
Closing Price
EPS
Return on Revenue 15% 14%
Total Net Income
Total Revenue
Return on Equity (Average) 10% 8%
Total Net Income
Average Total Equity
Assets to Equity Ratio 4.88: 1 4.80: 1
Total Assets
Total Equity
Debt to Equity Ratio
a) Long-term Debt 1.15 : 1 1.13 : 1
Total Equity

92
As of And For The
Year Ended
As of And For The
Year Ended
December 31, 2017 December 31, 2016
Debt to Equity Ratio
b) Total Liabilities Excluding Deposit
Liabilities, Bills and Acceptances Payable and Liability on
IPPA Contract 1.63 : 1 1.57 : 1
Total Equity
Current Ratio
a) Including EW
Current Assets 1.00: 1 1.02 : 1
Current Liabilities*
b) Excluding EW
Current Assets 3.10 : 1 3.49 : 1
Current Liabilities*
Quick Ratio 1.02 : 1 1.08 : 1
Current Assets – Inventories
Current Liabilities*
Earnings Before Interest, Taxes, Depreciation and
Amortization (EBITDA) to Total Interest Expense 7.17 Times 7.62 Times
EBITDA
Total Interest Expense
*Excluding current portion of Liability on IPPA Contract
Notes to Financial Statements and Other Disclosures
1. The attached consolidated financial statements are prepared in compliance with PFRS. The accounting policies and methods of
computation followed in the financial statements for the year ended December 31, 2017 are the same as those followed in the annual
financial statements of the Company for the year ended December 31, 2016.
2. Except for the sugar business, the operating activities of the Company are carried out uniformly over the calendar year. The sugar
milling season of the Company’s sugar subsidiaries is usually from November to June of the following year. Except for this milling
season, there are no other unusual operating cycles or seasons during the year.
3. Except as disclosed in the Management’s Discussion and Analysis of Financial Condition and Results of Operation, there are no
unusual items affecting assets, liabilities, equity, net income or cash flows for the current period. There are no known trends,
demands, commitments, events or uncertainties that will have a material impact on the Company’s liquidity.
4. There are no changes in estimates of amounts reported in the previous period that have material effects in the current period.
5. Except for those discussed in the Management’s Discussion and Analysis of Financial Condition and Results of Operations, there
are no issuances, repurchases and repayments of debt and equity securities.
6. There were no other dividends paid (aggregate or per share) separately for ordinary shares and other shares during the current
period, except as discussed in the previous sections.
7. The Company derives its revenues from the following reportable segments:
Real Estate Operations
This involves acquisition of land, planning and development of large-scale fully integrated residential communities as well as the
development and sale of residential lots, housing units, medium-rise residential buildings, farm estates, industrial parks, residential
resort projects, a private membership club and condominium buildings. This segment also involves operations and management of
cinema and mall, property management and leasing of commercial and office spaces.

93
Hospitality Operations
This involves operation of hotels, including management of resorts, villas, golf course, service apartment and other services for the
pleasure, comfort and convenience of guests in said establishments under its management.
Banking and Financial Services
This involves a wide range of financial services to consumer and corporate clients which includes deposit-taking, loan and trade
finance, treasury, trust services, credit cards, cash management, custodial services, insurance services and leasing and finance. The
business units in this segment consist of retail banking, corporate banking, consumer banking, and treasury and trust.
Power Operations
This involves the establishment, construction, operation of power plants and supply of power to offtakers and also includes
management of power plants’ output under the IPPA contracts.
Sugar Operations
This involves operation of agricultural lands for planting and cultivating farm products, operation of a complete sugar central for
the purpose of milling or converting sugar canes to centrifugal or refined sugar and selling of sugar and by-products.
Other Operations
This involves other operations of the Parent Company including CWSI and FDCI. FDCI was incorporated to facilitate the Group’s
issuance of foreign currency-denominated bonds while CWSI was incorporated to provide maintenance, operation, management
and rehabilitation of waterworks sewerage and sanitation system and services specifically for the distribution, supply and sale of
potable water to domestic, commercial and industrial.
Financial information on the operations of these business segments as of and for the years ended December 31, 2017 and 2016 are
summarized and included in the accompanying Notes to Consolidated Financial Statements.
8. Except as discussed in the Management’s Discussion and Analysis of Financial Condition and Results of Operations, there are no
material events subsequent to December 31, 2017 up to the date of this report that have not been reflected in the financial statements
for the current period.
9. There have been no changes in the composition of the Company during the current period, such as business combination, acquisition
or disposal of subsidiaries and long-term investments, restructurings and discontinuing operations, except as discussed in the
Developments of the Company and Management’s Discussion on its Results of Operations.
10. There are no changes in contingent liabilities or contingent assets since December 31, 2017.
11. There are no material contingencies and any other events or transactions affecting the current period.
12. There are no known events that will trigger direct or contingent financial obligation that is material to the Company, including any
default or acceleration of an obligation.
13. There are no known material off-balance sheet transactions, arrangements, obligations including contingent liabilities, and other
relationships of the Company, with unconsolidated entities or other persons created during the reporting period.
14. There are no significant elements of income or loss, except as discussed in the Management’s Discussion on the Results of
Operations that did not arise from the Company’s continuing operations.
15. There are no known seasonal aspects that had a material effect on the financial condition or results of operations.
16. Aside from the possible material increase in interest rates on the outstanding floating – rate term loans, there are no known trends,
events or uncertainties or any material commitments that may result to any cash flow or liquidity problems of the Group within the
next 12 months. The Group is not in default or breach of any note, loan, lease or other indebtedness or financing arrangements
requiring it to make payments or any significant amount in its accounts payable that have not been paid within the stated terms.
ITEM 7. FINANCIAL STATEMENTS
The consolidated financial statements and schedules listed in the accompanying Index to Financial Statements and Supplementary
Schedules are filed as part of this SEC Form 17-A.
ITEM 8. CHANGES IN AND DISAGREEMENTS WITH ACCOUNTANTS ON ACCOUNTING AND FINANCIAL
DISCLOSURE
SyCip, Gorres, Velayo & Co (SGV) has been the duly appointed independent auditors for the years covered by this report.

94
FDC, in compliance with SRC Rule 68(3)(b)(iv) relative to the 5-year rotation requirement of its external auditors, has designated Mr.
Michael C. Sabado as its engagement partner starting calendar year 2019. The representatives of SGV are expected to be present at the
annual meeting where they will have the opportunity to make a statement if they desire to do so. They are expected to be available to
respond to appropriate questions at the meeting.
There has been no disagreement with FDC’s independent accountants on any matter of accounting principles or practices, financial
statement disclosure, or auditing scope or procedure.
Audit and Audit-Related Fees
The aggregate fees billed to the Group for professional services rendered by the external auditor for the examination of the annual
financial statements amounted to P11.2 million and P9.3 million, net of VAT in 2019 and 2018, respectively.
In 2019 and 2018, additional fees for other services of external auditor amounted to P27.9 million and P24.0 million, respectively.
Tax Fees
The fees billed to the Group for tax services which pertained to compliance review amounted to P8.6 million and
P6.8 million in 2019 and 2018, respectively.
All Other Fees
There are no other fees billed in each of the last 2 years for products and services provided by the external auditor, other than the services
reported under items mentioned above.
The Audit Committee based on the recommendation by the Internal Audit and management, evaluates the need for such professional
services and approves the engagement and the fees to be paid for the services.
PART III - CONTROL AND COMPENSATION INFORMATION
ITEM 9. DIRECTORS AND EXECUTIVE OFFICERS OF THE REGISTRANT
The following are the Directors and Executive Officers of FDC:
Mercedes T. Gotianun
Chairperson Emerita
Mrs. Gotianun, 91, Filipino, served as a Director of FDC from 1980 to 2019. She also served as a
Director of FLI from 1989 to 2019 and its Chief Executive Officer from 1997 to 2007. She is also a
Director of EW, a publicly-listed company, and a Director in FAI, PSHC, FDCUI and its subsidiary
power companies. She obtained her college degree from the University of the Philippines.
Jonathan T. Gotianun
Chairperson of the Board
and Director
Mr. Gotianun, 66, Filipino, was first elected as Director of FDC on 09 July 1993. He also serves as
Chairperson of the Board and Director of FLI and EW, both publicly-listed companies. He is the
President of DSCC, and CSCC, and a Director and Chairperson of the Executive Committee of
FDCUI and some of its subsidiary power companies. He served as Director and Senior Vice President
of Family Bank until 1984. He obtained his Master’s Degree in Business Administration from
Northwestern University in 1976.
L. Josephine Gotianun-
Yap
President, Chief Executive
Officer and Director
Mrs. Yap, 64, Filipino, was first elected as Director of FDC on 30 March 1990. She is also a Director,
President and Chief Executive Officer of FLI, CPI and a Director in FAI and FDCUI. She is currently
a Director in three publicly-listed companies: FDC, FLI and EW. She obtained her Master’s Degree
in Business Administration from the University of Chicago in 1977. She has been President of the
Company since 2000.
Andrew T. Gotianun Jr.
Director
Mr. Gotianun, 68, Filipino, was first elected as a Director of FDC on 31 March 1989. He is also a
Director of FAI and FDCUI. He is currently a Director in two publicly-listed companies: FDC and
FLI. He served as a Director of Family Bank from 1980 to 1984. He has been in the realty business
for more than 16 years. He obtained his Bachelor of Science (Major in Accounting) degree from the
Republican College in 1981.
Michael Edward T.
Gotianun
Vice President and Director
Mr. Gotianun, 62, Filipino, was first elected as a Director of FDC on 24 October 2017. He is also a
Director of FLI, a publicly-listed company, FAI and FSI. He served as the general manager of
Filinvest Technical Industries from 1987 to 1990 and as loans officer at Family Bank from 1979 to
1984. He obtained his Bachelor’s degree in Business Management from the University of San
Francisco in 1979. He has been serving the Company as Vice President for more than 5 years.

95
Virginia T. Obcena
Lead Independent Director
Ms. Obcena, 72, Filipino, was first elected as an independent director of FDC on 29 April 2016. She
is also an Independent Director of CPI. She is a member of the Panel of Conciliators of the
International Centre for Settlement of Investment Disputes of the World Bank. She served as
independent director and head of the Audit Committee of the Capital Markets Integrity Corporation.
She was a former partner, member of the management committee and head of quality and risk
management at SGV. She obtained her Bachelor of Science in Business Administration degree,
Magna cum Laude, at the University of the East and her Master in Business Administration degree at
the University of the Philippines. She is a certified public accountant.
Val Antonio B. Suarez
Independent Director
Mr. Suarez, 61, Filipino, is an independent director of FDC, having been first elected on 30 May
2014. He is the Managing Partner of the Suarez & Reyes Law Offices and was the former President
and Chief Executive Officer of The Philippine Stock Exchange. Mr. Suarez is also an independent
director of FLI and Lepanto Consolidated Mining Company, both publicly-listed companies, and a
member of the Integrated Bar of the Philippines (Makati Chapter) and New York Bar. He obtained
his Bachelor of Laws degree from the Ateneo de Manila University Law School and a Master of Laws
degree from Georgetown University Law Center.
Claire A. Huang
Independent Director
Ms. Huang, 57, Filipino, was first elected as an independent director of FDC on 26 April 2019. She
is a member of the board of directors for PODS and Prosper Marketplace. She also served as a director
in various U.S.-based companies such as Mirador and Scottrade. She was the Chief Marketing Officer
for J.P. Morgan Chase and Company until 2014. She obtained her Bachelor of Arts degree from De
La Salle University in 1983 and finished the Advanced Management Program in IESE Business
School in 2016. Nelson M. Bona
Treasurer, Chief Finance
Officer and Compliance
Officer
Mr. Bona, 69, Filipino, was appointed as FDC’s Treasurer and Chief Finance Officer in June 2015.
He is is a member of the BOD of EW. He is also the Compliance Officer of FLI. He was formerly an
Executive Vice President of EW and Managing Director of Millenia Broadband Communications,
Inc. and Filinvest Capital, Inc.
Daniel L. Ang Tan Chai
Deputy Chief Financial
Officer
Mr. Ang Tan Chai, 61, Filipino, has been the Deputy Chief Financial Officer of the Company since
November 2015. Prior to joining the Company, he was the Executive Vice President and Chief
Finance Officer of Philippine Bank of Communications. He also served as Senior Vice President and
Chief Finance Officer for Philippine Airlines, Air Philippines Express, First Vice President and Chief
Finance Officer of Metrobank Card Corporation, and Financial Control, Global Consumer Bank of
Citibank, N.A. – Philippines. He holds a Bachelor of Science degree, major in Industrial Engineering
from the University of the Philippines, and a Masters degree in Business Administration from the
same university.
Bernadette M. Ramos
Vice President-Marketing
Ms. Ramos, 54, Filipino, rejoined FDC as Vice President for Real Estate Marketing in 2011. She was
head of FLI’s Corporate and Creative Communications Office from 2005-2007 and Special Assistant
to the CEO for Advertising from 2002 to 2005. Prior to that, she held executive positions in various
advertising agencies and a major property developer in a career spanning over 20 years of experience
in the field.
Virginia A. Cayanga
Vice President for Risk
Management
Ms. Cayanga, 47, Filipino, is the Vice President for Risk Management of the Company starting
November 2015. Prior to joining the Company she served as the Vice President and Multinational
Client Services Leader of Marsh Philippines, Inc. for fourteen years. She holds a Bachelor of Arts
degree, major in Quantitative Economics from the University of Asia and the Pacific.
Sharon P. Pagaling-
Refuerzo
Corporate Secretary and
Corporate Information
Officer
Atty. Pagaling-Refuerzo, 40, Filipino, is concurrently Senior Assistant Vice President of the Legal
Department of FLI. She is also the Corporate Secretary of FLI, CPI, The Palms Country Club, Inc.
and TSNC, as well as various companies of the Group. Admitted to the Philippine Bar in 2006, she
holds an A.B. Philosophy degree, cum laude, from the University of the Philippines and a law degree
from San Beda College.
Renato Rex Xavier G.
Marzan
Group Chief Digital Officer
& Chief Innovation Officer/
MD of Digital Innovations
& Ventures
Mr. Marzan, 44, Filipino, is the Company’s Group Chief Digital Officer & Chief Innovation Officer/
MD of Digital Innovations & Ventures. Prior to joining FDC, Mr. Marzan served as Board Director
and President of True Money Philippines, a part of Ascend Corporation. He also served as Head of
Strategy & Corporate Development for Globe Consumer Business and Chief Executive Officer for
G-Xchange, Inc. (GCash) of Globe Telecom, Inc. He holds a Bachelor of Science degree, major in
Management Engineering from Ateneo de Manila University, and a Master’s degree in Business
Administration from The Fuqua School of Business of Duke University in North Carolina, USA.

96
Michael Louie T. Garado
Assistant Vice President for
Audit and Chief Audit
Executive
Mr. Garado, 38, Filipino, was appointed by the Board of Directors as Chief Audit Executive on May
21, 2018. Prior to joining FDC, he served as an Internal Control Area Manager for Coca-Cola FEMSA
Philippines, Inc., Statutory Reporting Manager for Coca-Cola Bottlers Phils., Inc. And Internal
Auditor - Corporate Audit of Coca Cola Far East Limited. Mr. Garado is a certified public accountant
and obtained his Bachelor of Arts degree, from San Beda University.
Patricia Carmen Pineda
Senior Assistant Vice
President/Group Investor
Relations
Ms. Pineda, 47, Filipino, is the Senior Assistant Vice President and Group Investor Relations Officer
of the Company. Prior to joining FDC in April 2019, Ms. Pineda served as the Head of Investor
Relations for Metropolitan Bank & Trust Company. She also served as the Head of Investor Relations
Concurrent Head of Controllership and Analysis for Manila Water Company, Inc. and Investor
Relations Manager for Ayala Land, Inc. She holds a Bachelor of Science degree, major in Economics
from the University of the Philippines, and a Master of Science degree in Finance from the same
university.
The members of the board committees, pursuant to appointments made during the organizational meeting of the BOD of the Company
on 26 April 2019, are as follows:
Executive Committee Jonathan T. Gotianun (Chair), L. Josephine Gotianun-Yap, Andrew T. Gotianun, Jr.
and Michael Edward T. Gotianun
Nominations Committee Val Antonio B. Suarez (Chair/Independent Director), L. Josephine Gotianun-Yap,
Jonathan T. Gotianun, Virginia T. Obcena (Independent Director) and Rizalangela L.
Reyes (ex-officio)
Audit and Risk Management
Oversight Committee
Virginia T. Obcena (Chair/Independent Director), Val Antonio B. Suarez (Independent
Director), L. Josephine Gotianun-Yap and Jonathan T. Gotianun
Compensation Committee Val Antonio B. Suarez (Chair/Independent Director), L. Josephine Gotianun Yap,
Jonathan T. Gotianun and Virginia T. Obcena (Independent Director)
Related Party Transaction and
Corporate Governance
Committee
Val Antonio B. Suarez (Chair/Independent Director), Virginia T. Obcena (Independent
Director), Claire A. Huang (Independent Director) and Andrew T. Gotianun, Jr.
Digital Committee Claire A. Huang (Chair/Independent Director), L. Josephine Gotianun-Yap and
Jonathan T. Gotianun
The directors of the Company are elected at the annual stockholders’ meeting to hold office until their respective successors have been
duly elected and qualified. Officers are appointed or elected by the BOD typically at its first meeting following the annual stockholders’
meeting, each to hold office until his successor shall have been duly elected or appointed and qualified.
The Company is not aware of any legal proceedings where its directors or executive officers have been impleaded in their capacity as
directors or executive officers of the Company.
The Company is not aware of the occurrence of any of the following events within the past 5 years up to the date of this annual report:
(a) any bankruptcy petition filed by or against any business in which any of its directors or officers was a general partner or officer either
at the time of the bankruptcy or within two years prior to that time; (b) any conviction by final judgment in a criminal proceeding,
domestic or foreign, of, or any criminal proceeding, domestic or foreign, pending against, any of its directors or officers in his capacity
as such director or officer; (c) any order, judgment or decree, not subsequently reversed, suspended or vacated, of any court of competent
jurisdiction, domestic or foreign, permanently or temporarily enjoining, barring, suspending or otherwise limiting the involvement of
any of its directors or officers in any type of business, securities, commodities or banking activities, and (d) any finding by a domestic
or foreign court of competent jurisdiction (in a civil action), the SEC or comparable foreign body, or a domestic or foreign exchange or
electronic marketplace or self-regulatory organization that any of its directors or officers has violated a securities or commodities law,
and the judgment has not been reversed, suspended or vacated, which occurred during the past 5 years.
There is no person, who is not an executive officer of the Company, who is expected to make a significant contribution to its business.
The Company, however, occasionally engages the services of consultants.
There were no transactions during the last 2 years or any proposed transactions, to which the Company was or is to be a party, in which
any director or officer, any security holder or any member of the immediate family of any of the foregoing persons had or is to have a
direct or indirect material interest.

97
ITEM 10. EXECUTIVE COMPENSATION
Information as to the aggregate compensation paid or accrued during the last 2 fiscal years and to be paid in the ensuing fiscal year to
the Group’s executive officers and other officers are as follows:
COMPENSATION OF DIRECTORS AND EXECUTIVE OFFICERS
Year Salary Bonus
Other Annual
Compensation TOTAL Name and Principal Position
Josephine G. Yap (President /CEO)
Jonathan T. Gotianun (Chairperson)
Nelson M. Bona (EVP, CFO,
Treasurer and Compliance Officer
Daniel Ang Tan Chai (SVP/Deputy
CFO)
Michael T. Gotianun (Director/VP)
CEO and top 4 highest compensated
officers
2020-
Estimated P66.1M P8.8M P74.9M
2019 P62.9M P8.4M P71.3M
2018 P54.8M P7.5M P62.3M
All officers and directors as a group
unnamed
2020-
Estimated P87.2M P12.0M P99.2M
2019 P83.0M P11.4M P94.4M
2018 P66.8M P9.3M P76.1M
Except for a per diem being paid to each non-executive director of P 50,000.00 for every Board committee meeting attended and
P100,000.00 for every Board meeting attended, there are no other arrangements for the payment of compensation or remuneration to
the directors in their capacity as such.
There are no outstanding warrants or options held by the Company’s CEO, the above-named executive officers, and all officers and
directors as a group.
ITEM 11. SECURITY OWNERSHIP OF CERTAIN BENEFICIAL OWNERS AND MANAGEMENT
(1) Security Ownership of Certain Record and Beneficial Owners
The names, addresses, citizenship, number of shares held, and percentage to total of persons owning more than five percent (5%)
of the outstanding voting shares of the Company (all common) as of December 31, 2019 are as follows:
Title of
Class
Name and Address of Record
Owner/ Relationship with
Company
Name of Beneficial
Owner/
Relationship with
Record Owner
Citizenship No. of Shares Held Percentage
Held
Common A.L. Gotianun Inc. (formerly
ALG Holdings Corporation)1
6/F The Beaufort 5th Avenue
corner 23rd Street, BGC, Taguig
City
Majority Owner of the
Company
ALGI 2 Filipino 7,587,823,502 (D)
61,976,540 (I)
87.74%
0.72%
Common PCD Nominee Corporation
(Filipino)
G/F, Philippine Stock Exchange
Tower, Ayala Avenue, Makati
City
Filipino 899,630,763 10.40%
1 Mrs. L. Josephine G. Yap are typically named by ALGI as its proxy to vote at the annual meeting of stockholders the shares owned and held by it in the Company. 2 Stockholders are the beneficial owners.

98
Except as stated above, the BOD and management of the Company have no knowledge of any person who, as of the date of the
annual report was directly or indirectly the beneficial owner of more than five percent (5%) of the Company’s outstanding shares
of common stock or who has voting power or investment power with respect to shares comprising more than 5% of the Company’s
outstanding common stock.
(2) Security Ownership of Management
The names, citizenship, number of shares held and percentage to total of persons forming part of the management of the Company
as of December 31, 2019 are as follows:
Title of Class Name Citizenship Amount and Nature of
Record/Beneficial Owner
% of Ownership
Common Mercedes T. Gotianun Filipino 1,554 (D)
0 (I)
Negligible
Common Andrew T. Gotianun, Jr. Filipino 3,371,995 (D)
0 (I)
0.04%
0.00%
Common Jonathan T. Gotianun Filipino 12 (D)
263,925 (I)*
Negligible
Common L. Josephine Gotianun-Yap Filipino 6,187,402 (D)**
9,395,522 (I)
0.07%
0.11%
Common Michael Edward T. Gotianun Filipino 50,501,501 (D)
0 (I)
0.58%
0.00%
Common Virginia T. Obcena Filipino 1 (D)
0 (I)
Negligible
Common Val Antonio B. Suarez Filipino 1 (D)
0 (I)
Negligible
Common Claire A. Huang Filipino 1 (D)
0 (I)
Negligible
Common Nelson M. Bona Filipino 24,664 (D)
0 (I)
Negligible
N.A. Daniel L. Ang Tan Chai Filipino 0 N.A.
N.A. Bernadette M. Ramos Filipino 0 N.A.
N.A. Virginia A. Cayanga Filipino 0 N.A.
N.A. Michael Louie T. Garado Filipino 0 N.A.
N.A. Sharon P. Pagaling-Refuerzo Filipino 0 N.A.
N.A. Renato Rex Xavier G. Marzan Filipino 0 N.A.
N.A. Patricia Carmen D. Pineda Filipino 0 N.A. * Includes shares of stock in FDC under the names of Berit Holdings Corp., Jabberwock Holdings, Inc. and Chriszen Holdings, Inc.
**Composed of 12 direct shares registered under the name L. Josephine Gotianun-Yap; 6,187,390 direct shares registered under the name Joseph M. Yap &/or L. Josephine Gotianun-
Yap; and 9,395,522 indirect shares registered under the name Joseph M. Yap &/or L. Josephine Gotianun-Yap.
Total ownership of all directors and officers as a group is 69,746,578 shares or 0.81% of total outstanding shares.
3) Voting, Trust Holders of 5% or more
There is no person who holds more than 5% of the common stock under any voting trust or similar agreement.
4) Changes in Control
The Company is not aware of any agreement, which may result in a change in control of the registrant.
ITEM 12. CERTAIN RELATIONSHIPS AND RELATED TRANSACTIONS
In the normal course of business, the Company and other members of the Group enter into certain related-party transactions.
There were no transactions during the last two years, or any proposed transactions, to which the Company was or is to be a party, in
which any director or executive officer, any nominee for election as a director, any security holder or any member of the immediate
family of any of the foregoing persons, had or is to have a direct or indirect material interest.
Related Party Transactions
The Group has entered into various transactions with related parties. Parties are considered to be related if one party has the ability,
directly or indirectly, to control the other party in making financial and operating decisions or the parties are subject to common
control or common significant influence (referred to as ‘Affiliates’). Related parties may be individuals or corporate entities.

99
All material Related Party Transactions (RPT) with a transaction value that reaches ten percent (10%) of the Group’s total
consolidated assets shall be subject to the review by the RPT Committee.
Transactions that were entered into with an unrelated party that subsequently becomes a related party shall be excluded from the
limits and approval of the Policy on Related Party Transactions (Policy). However, any renewal, change in the terms and conditions
or increase in exposure level, related to these transactions after a non-related party becomes a related party, shall subject it to the
provisions of the the Policy.
In the event whrein there are changes in the RPT classification from non-material to material, the material RPT shall be subject to
the provisions of the the Policy.
Outstanding balances at year-end are unsecured, interest free and require settlement in cash, unless otherwise stated. As of
December 31, 2019 and 2018, the Group has not made any provision for impairment loss relating to amounts owed by related
parties. This assessment is undertaken each financial year by examining the financial position of the related party and the market
in which the related party operates.
Significant transactions with related parties are as follows:
a. The compensation of key management personnel consists of short-term employee salaries and benefits amounting to
P=94.4 million, P=76.1 million and P=69.5 million in 2019, 2018 and 2017, respectively. Post-employment benefits of key
management personnel amounted to P=17.0 million, P=18.0 million and P=16.3 million in 2019, 2018 and 2017, respectively.
b. Other transactions with related parties include noninterest-bearing cash advances and various charges to and from non-
consolidated affiliates for management fees, rent, share of expenses and commission charges. Transactions with related parties
are normally settled in cash.
The amounts and the balances arising from the foregoing significant related party transactions are as follows:
2019
Amount/
Volume
Outstanding
Balance
Due from
(Due to) Terms Conditions
(In Thousands)
Due from related parties
Real estate operations
Ultimate Parent Company (a)
P=3,993 P=4,080
Noninterest-bearing,
collectible on
demand
Unsecured, no
impairment
Affiliates:
Share in expenses 8,072 11,564
Noninterest-bearing,
collectible on
demand
Unsecured, no
impairment
P=12,065 P=15,644
Due to related parties
Ultimate Parent Company (a, b)
Interest expense P=49,613 (P=1,189,588)
Bears 3.1% interest
per annum, payable
within 1 year Unsecured
Affiliates
Share in expenses (a) 1,533 (8,148)
Noninterest-bearing,
payable on demand Unsecured
Management fee (c)
P=51,146 (P=1,197,736)
(a) Share in Group expenses
(b) Availment of loan payable, with interest at prevailing market rate
(c) Management fee charged to hospitality operations by a joint venture.
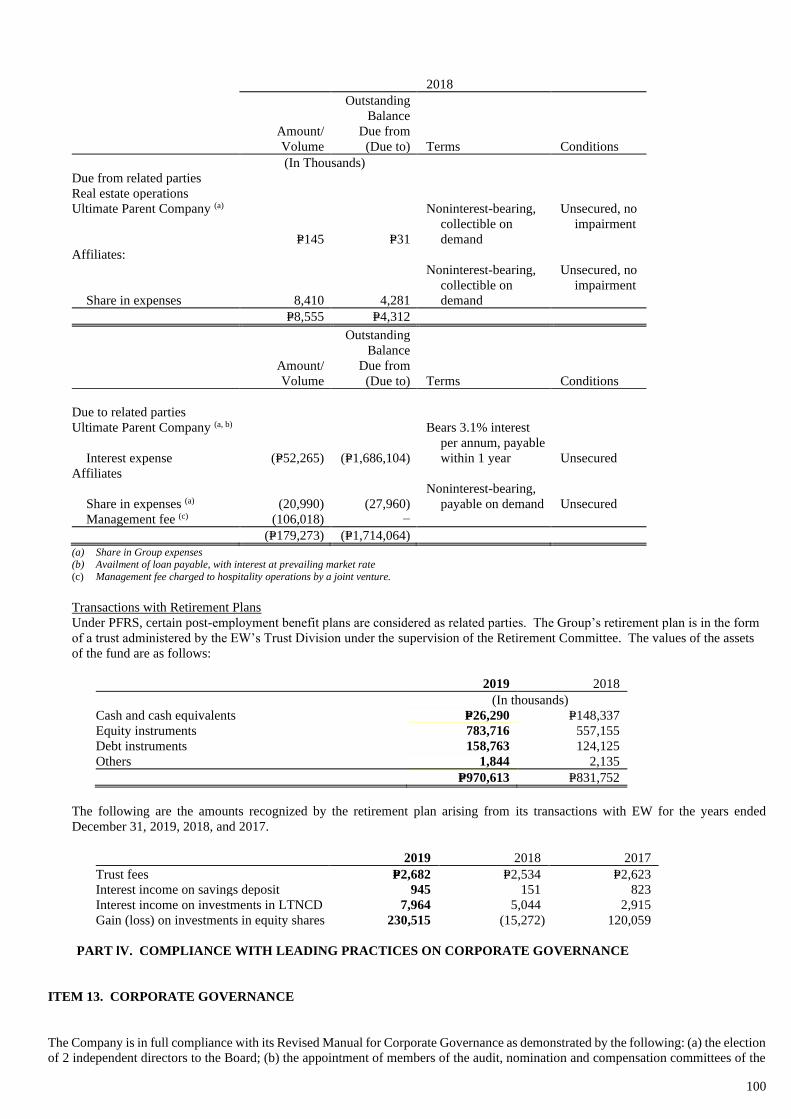
100
2018
Amount/
Volume
Outstanding
Balance
Due from
(Due to) Terms Conditions
(In Thousands)
Due from related parties
Real estate operations
Ultimate Parent Company (a)
P=145 P=31
Noninterest-bearing,
collectible on
demand
Unsecured, no
impairment
Affiliates:
Share in expenses 8,410 4,281
Noninterest-bearing,
collectible on
demand
Unsecured, no
impairment
P=8,555 P=4,312
Amount/
Volume
Outstanding
Balance
Due from
(Due to) Terms Conditions
Due to related parties
Ultimate Parent Company (a, b)
Interest expense (P=52,265) (P=1,686,104)
Bears 3.1% interest
per annum, payable
within 1 year Unsecured
Affiliates
Share in expenses (a) (20,990) (27,960)
Noninterest-bearing,
payable on demand Unsecured
Management fee (c) (106,018) −
(P=179,273) (P=1,714,064)
(a) Share in Group expenses (b) Availment of loan payable, with interest at prevailing market rate
(c) Management fee charged to hospitality operations by a joint venture.
Transactions with Retirement Plans
Under PFRS, certain post-employment benefit plans are considered as related parties. The Group’s retirement plan is in the form
of a trust administered by the EW’s Trust Division under the supervision of the Retirement Committee. The values of the assets
of the fund are as follows:
2019 2018
(In thousands)
Cash and cash equivalents P=26,290 P=148,337
Equity instruments 783,716 557,155
Debt instruments 158,763 124,125
Others 1,844 2,135
P=970,613 P=831,752
The following are the amounts recognized by the retirement plan arising from its transactions with EW for the years ended
December 31, 2019, 2018, and 2017.
2019 2018 2017
Trust fees P=2,682 P=2,534 P=2,623
Interest income on savings deposit 945 151 823
Interest income on investments in LTNCD 7,964 5,044 2,915
Gain (loss) on investments in equity shares 230,515 (15,272) 120,059
PART lV. COMPLIANCE WITH LEADING PRACTICES ON CORPORATE GOVERNANCE
ITEM 13. CORPORATE GOVERNANCE
The Company is in full compliance with its Revised Manual for Corporate Governance as demonstrated by the following: (a) the election
of 2 independent directors to the Board; (b) the appointment of members of the audit, nomination and compensation committees of the

101
Company; (c) the conduct of regular quarterly board meetings and special meetings, the faithful attendance of the directors at these
meetings and their proper discharge of duties and responsibilities as such directors; (d) the submission to the SEC of reports and
disclosures required under the Securities Regulation Code; (e) the Company’s adherence to national and local laws pertaining to its
operations; and (f) the observance of applicable accounting standards by the Company.
In order to keep itself abreast with the leading practices on corporate governance, the Company encourages the members of top-level
management and the Board to attend and participate at seminars on corporate governance initiated by accredited institutions.
The Company welcomes proposals, especially from institutions and entities such as the SEC, PSE and the Institute of Corporate
Directors, to improve corporate governance.
There is no known material deviation from the Company’s Revised Manual on Corporate Governance.
Per SEC Memorandum Circular No. 15, Series of 2017, all publicly listed companies are required to submit their Integrated Annual
Corporate Governance Report (I-ACGR) every May 30 for each year. However, in its notice dated April 22, 2020, the SEC extended
the deadline for the filing of the I-ACGR until July 30, 2020 in recognition of the impact of the 2019 Corona Virus Disease (COVID-
19) pandemic on the regular operations of corporations and to ease the regulatory burden on the business sector during these trying
times.
PART V. EXHIBITS AND SCHEDULES
ITEM 14. EXHIBITS AND REPORTS ON SEC FORM 17-C
(a) Exhibits - see accompanying Index to Exhibits
The following exhibits are filed as a separate section of this report:
The other exhibits, as indicated in the Index to Exhibits are either not applicable to the Company or require no answer.
(b) Reports on SEC Form 17-C
Reports on SEC Form 17-C were filed during the year covered by this report and are listed below:
Date
Disclosure re: Retirement of Atty. Elma Christine R. Leogardo January 2, 2019
Press Release: NLAC-New Clark Int'l Airport to Spur Economic Growth January 14, 2019
Disclosure re: Clark Airport Modernization Kicks Off with Signing of Concession Agreement January 21, 2019
Result of BOD Meeting_Approval of Schedule of Annual Stockholders Meeting 2019 January 23, 2019
Result of Special BOD Meeting_Approval of Audited FS 2018 March 1, 2019
Result of Special BOD Meeting_Approval of Equity Offering & Appointment of Atty. Sharon as Corporate
Secretary of FDC
March 12, 2019
Press Release: FDC 2018 Net income up 31% to Php13.4B March 27, 2019
Result of BOD Meeting_Declaration of Cash Dividend April 26, 2019
Result of Annual Stockholders Meeting April 26, 2019
Result of Organizational Meeting April 26, 2019
Press Release: FDC to Focus on Clark Corridor April 26, 2019
Clarification on news article re: “Filinvest plans over P20 B investments in Clark” May 9, 2019
Press Release: FDC income up 50% in 1Q 2019 May 16, 2019
Disclosure re: Resignation of Atty. Karichi E. Santos as Assistant Corporate Secretary May 31, 2019
Press Release: FDC 1H 2019 income up 19% August 14, 2019
Press Release: Clark International Airport Official Handover August 16, 2019
Disclosure re: Signing of Agreement between FDC and Hitachi Aqua-Tech Engineering Pte. Ltd. August 20, 2019
Press Release: Filinvest-Hitachi Inks Deal To Provide Overall Water Solutions August 30, 2019
Press Release: Filinvest Alabang Inc. Enters Joint Venture With Mitsubishi Corporation October 3, 2019
Disclosure re: Change in Corporate Contact Details October 7, 2019
Press Release: FDC posts 16% income growth in 9M 2019 November 14, 2019
Disclosure re: Share Purchase Agreement between FDC and Choengmon Real Estate Company Limited December 13, 2019
Clarification on news article re: “Mitsubishi-Filinvest joint venture gets PCC’s nod” December 20, 2019
Disclosure re: Promotion of FDC Officer December 30, 2019

102
SIGNATURES
Pursuant to the requirements of Section 17 of the Code and Section 141 of the Corporation Code, this report is signed on behalf of the
issuer by the undersigned duly authorized, in the City of _____________________ Metro Manila on May 19, 2020.
_________________________ _______________________
Jonathan T. Gotianun Josephine G. Yap
Chairman President and CEO
_________________________ _______________________
Nelson M. Bona Sharon P. Pagaling-Refuerzo
Treasurer and CFO Corporate Secretary
SUBSCRIBED AND SWORN to before me this ____________________ affiants exhibiting to me their competent evidence of identity
as follows:
Name ID No. Date of Issue Date of Expiry Place of Issue
Jonathan T. Gotianun Passport No. P5509919A 1/03/2018 1/02/2028 DFA Manila
Josephine G. Yap Passport No. P1463447A 1/07/2017 1/06/2022 DFA Manila
Nelson M. Bona Passport No. P4220004A 8/30/2017 8/29/2022 DFA Manila
Sharon P. Pagaling-Refuerzo Passport No. P2852223B 8/24/2019 8/23/2029 DFA NCR East
Doc No. _____
Page No._____
Book No._____
Series of 2020

103
FILINVEST DEVELOPMENT CORPORATION AND SUBSIDIARIES
(CONSOLIDATED)
INDEX TO FINANCIAL STATEMENTS AND SUPPLEMENTARY SCHEDULES
FORM 17-A, Item 8
Consolidated Financial Statements
Statement of Management’s Responsibility for Financial Statements
Report of Independent Public Accountants
Consolidated Statements of Financial Position as of December 31, 2019 and 2018
Consolidated Statements of Income for the years ended December 31, 2019, 2018, and
2017
Consolidated Statements of Comprehensive Income for the years ended December 31,
2019, 2018 and 2017
Consolidated Statements of Changes in Equity as of December 31, 2019 and 2018
Consolidated Statements of Cash Flows for the years ended December 31, 2019 and
2018 and 2017
Notes to Consolidated Financial Statements
Supplementary Schedules
A.
MARKETABLE SECURITIES - (CURRENT MARKETABLE SECURITIES AND
OTHER SHORT-TERM CASH INVESTMENTS)
*
B.
AMOUNTS RECEIVABLE FROM DIRECTORS, OFFICERS, EMPLOYEES,
RELATED PARTIES AND PRINCIPAL STOCKHOLDERS (OTHER THAN
AFFILIATES)
*
C.
NON-CURRENT MARKETABLE EQUITY SECURITIES, OTHER
LONG-TERM INVESTMENTS, AND OTHER INVESTMENTS
*
D.
INDEBTEDNESS TO UNCONSOLIDATED SUBSIDIARIES AND AFFILIATES
*
E.
PROPERTY, PLANT AND EQUIPMENT
*
F.
ACCUMULATED DEPRECIATION
*
G.
INTANGIBLE ASSETS / OTHER ASSETS
*
H.
LONG-TERM DEBT
*
I.
INDEBTEDNESS TO AFFILIATES AND RELATED PARTIES (LONG-TERM
LOANS FROM RELATED COMPANIES)
*
J.
GUARANTEES OF SECURITIES OF OTHER ISSUERS
NA
K.
CAPITAL STOCK
*
* These schedules which are required by Part IV of SRC Rule 12 are contained in the Company’s Audited Consolidated Financial
Statements, in the accompanying Notes to Consolidated Financial Statements, or in Supplementary Information and Disclosures
Required on SRC Rule 68 and 68.1 As Amended.
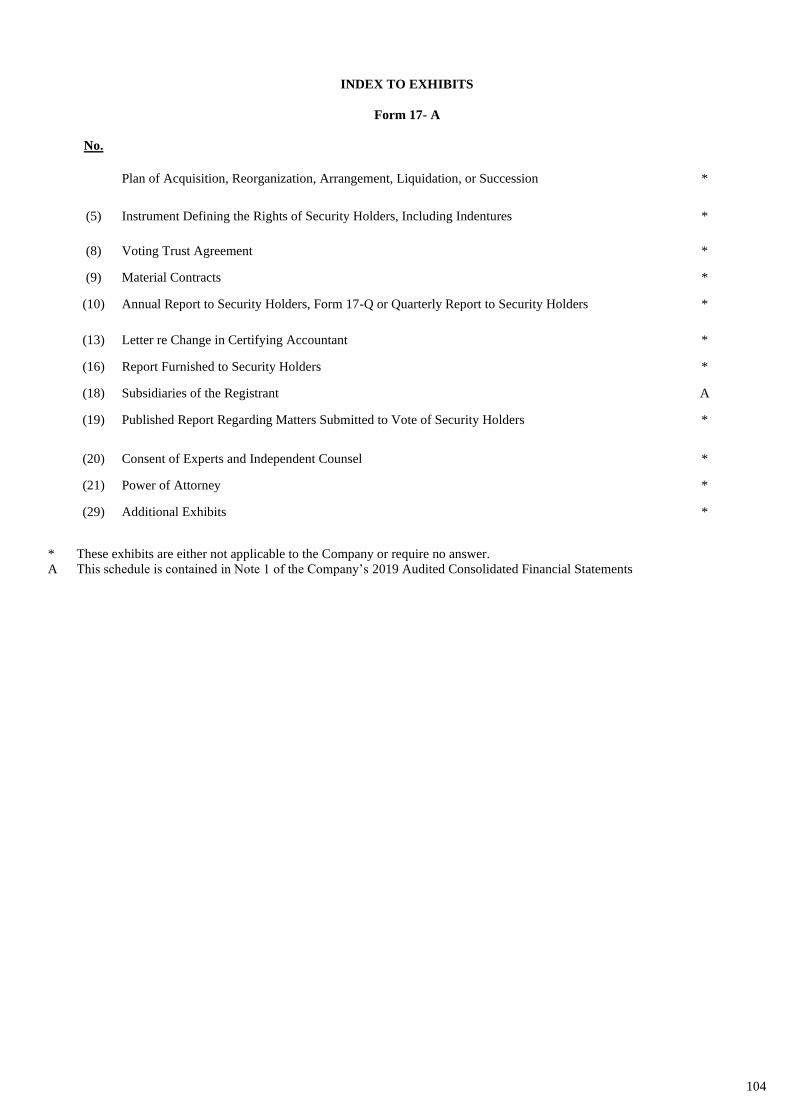
104
INDEX TO EXHIBITS
Form 17- A
No. P
a
g
e
N
o
.
(
3
)
Plan of Acquisition, Reorganization, Arrangement, Liquidation, or Succession *
(5) Instrument Defining the Rights of Security Holders, Including Indentures *
(8) Voting Trust Agreement *
(9) Material Contracts *
(10) Annual Report to Security Holders, Form 17-Q or Quarterly Report to Security Holders *
(13) Letter re Change in Certifying Accountant *
(16) Report Furnished to Security Holders *
(18) Subsidiaries of the Registrant A
(19) Published Report Regarding Matters Submitted to Vote of Security Holders *
(20) Consent of Experts and Independent Counsel *
(21) Power of Attorney *
(29) Additional Exhibits *
* These exhibits are either not applicable to the Company or require no answer.
A This schedule is contained in Note 1 of the Company’s 2019 Audited Consolidated Financial Statements

*SGVFS039395*
C O V E R S H E E Tfor
AUDITED FINANCIAL STATEMENTS
SEC Registration Number
5 1 0 4 8
C O M P A N Y N A M E
F I L I N V E S T D E V E L O P M E N T C O R P O R A T
I O N A N D S U B S I D I A R I E S
PRINCIPAL OFFICE ( No. / Street / Barangay / City / Town / Province )
T H E B E A U F O R T , 5 T H A V E N U E C O R N E
R 2 3 R D S T R E E T , B O N I F A C I O G L O B A
L C I T Y , T A G U I G C I T Y , M E T R O M A N
I L A
Form Type Department requiring the report Secondary License Type, If Applicable
A A C F S S E C N A
C O M P A N Y I N F O R M A T I O N
Company’s Email Address Company’s Telephone Number Mobile Number
www.filinvestgroup.com 7798-3959 NONE
No. of Stockholders Annual Meeting (Month / Day) Fiscal Year (Month / Day)
4,039 Last Friday of April 12/31
CONTACT PERSON INFORMATION
The designated contact person MUST be an Officer of the Corporation
Name of Contact Person Email Address Telephone Number/s Mobile Number
Mr. Nelson M. Bona [email protected] 7798-3977 N/A
CONTACT PERSON’s ADDRESS
The Beaufort, 5th Avenue Corner 23rd Street, Bonifacio Global City, Taguig City 1634,Metro Manila
NOTE 1 In case of death, resignation or cessation of office of the officer designated as contact person, such incident shall be reported to the Commission withinthirty (30) calendar days from the occurrence thereof with information and complete contact details of the new contact person designated.
2 All Boxes must be properly and completely filled-up. Failure to do so shall cause the delay in updating the corporation’s records with the Commissionand/or non-receipt of Notice of Deficiencies. Further, non-receipt of Notice of Deficiencies shall not excuse the corporation from liability for its deficiencies.


*SGVFS039395*
INDEPENDENT AUDITOR’S REPORT
The Stockholders and the Board of DirectorsFilinvest Development CorporationThe Beaufort, 5th Avenue corner 23rd StreetBonifacio Global City, Taguig City, Metro Manila
Opinion
We have audited the accompanying consolidated financial statements of Filinvest DevelopmentCorporation (FDC or the Parent Company) and its subsidiaries (collectively referred to as “the Group”),which comprise the consolidated statements of financial position as at December 31, 2019 and 2018, andthe consolidated statements of income, consolidated statements of comprehensive income, consolidatedstatements of changes in equity and consolidated statements of cash flows for each of the three years inthe period ended December 31, 2019, and notes to the consolidated financial statements, including asummary of significant accounting policies.
In our opinion, the accompanying consolidated financial statements present fairly, in all material respects,the financial position of the Group as at December 31, 2019 and 2018, and its financial performance andits cash flows for the three years in the period ended December 31, 2019 in accordance with PhilippineFinancial Reporting Standards (PFRSs).
Basis for Opinion
We conducted our audits in accordance with Philippine Standards on Auditing (PSAs). Ourresponsibilities under those standards are further described in the Auditor’s Responsibilities for the Auditof the Consolidated Financial Statements section of our report. We are independent of the Group inaccordance with the Code of Ethics for Professional Accountants in the Philippines (Code of Ethics)together with the ethical requirements that are relevant to our audit of the consolidated financialstatements in the Philippines, and we have fulfilled our other ethical responsibilities in accordance withthese requirements and the Code of Ethics. We believe that the audit evidence we have obtained issufficient and appropriate to provide a basis for our opinion.
Key Audit Matters
Key audit matters are those matters that, in our professional judgment, were of most significance in ouraudit of the consolidated financial statements of the current period. These matters were addressed in thecontext of our audit of the consolidated financial statements as a whole, and in forming our opinionthereon, and we do not provide a separate opinion on these matters. For each matter below, ourdescription of how our audit addressed the matter is provided in that context.
SyCip Gorres Velayo & Co.6760 Ayala Avenue1226 Makati CityPhilippines
Tel: (632) 891 0307Fax: (632) 819 0872ey.com/ph
BOA/PRC Reg. No. 0001, October 4, 2018, valid until August 24, 2021SEC Accreditation No. 0012-FR-5 (Group A),
November 6, 2018, valid until November 5, 2021
A member firm of Ernst & Young Global Limited
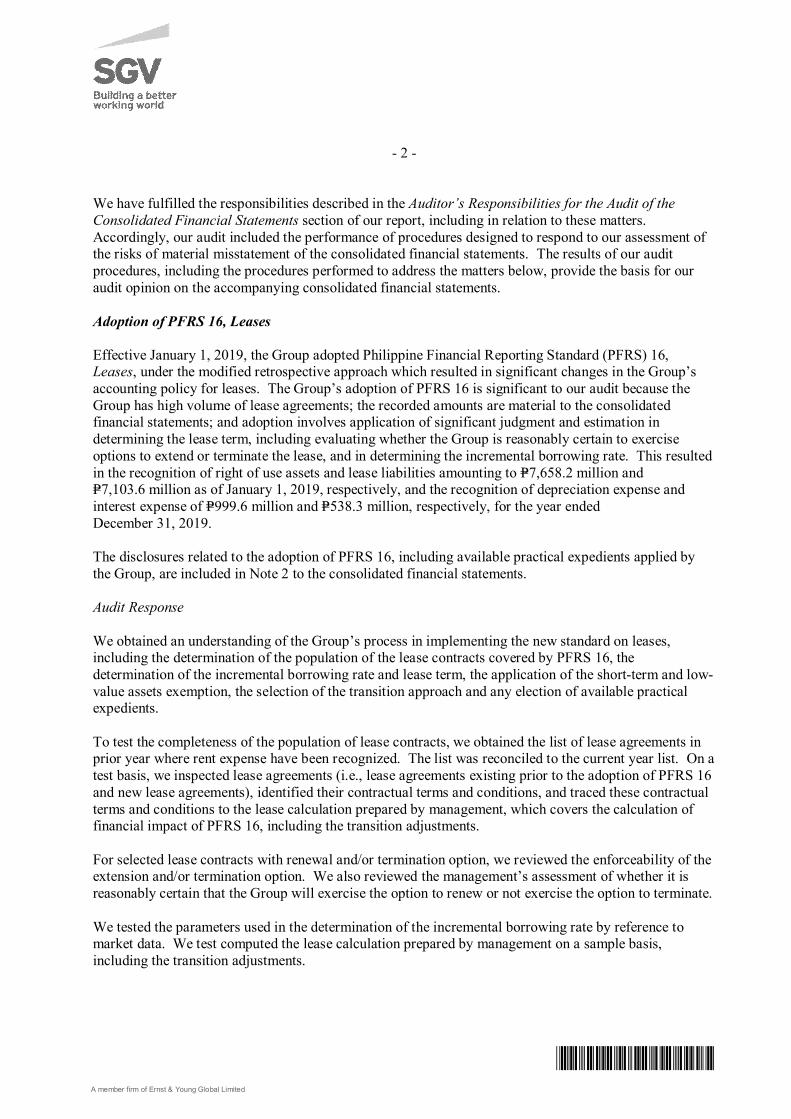
*SGVFS039395*
- 2 -
We have fulfilled the responsibilities described in the Auditor’s Responsibilities for the Audit of theConsolidated Financial Statements section of our report, including in relation to these matters.Accordingly, our audit included the performance of procedures designed to respond to our assessment ofthe risks of material misstatement of the consolidated financial statements. The results of our auditprocedures, including the procedures performed to address the matters below, provide the basis for ouraudit opinion on the accompanying consolidated financial statements.
Adoption of PFRS 16, Leases
Effective January 1, 2019, the Group adopted Philippine Financial Reporting Standard (PFRS) 16,Leases, under the modified retrospective approach which resulted in significant changes in the Group’saccounting policy for leases. The Group’s adoption of PFRS 16 is significant to our audit because theGroup has high volume of lease agreements; the recorded amounts are material to the consolidatedfinancial statements; and adoption involves application of significant judgment and estimation indetermining the lease term, including evaluating whether the Group is reasonably certain to exerciseoptions to extend or terminate the lease, and in determining the incremental borrowing rate. This resultedin the recognition of right of use assets and lease liabilities amounting to P=7,658.2 million andP=7,103.6 million as of January 1, 2019, respectively, and the recognition of depreciation expense andinterest expense of P=999.6 million and P=538.3 million, respectively, for the year endedDecember 31, 2019.
The disclosures related to the adoption of PFRS 16, including available practical expedients applied bythe Group, are included in Note 2 to the consolidated financial statements.
Audit Response
We obtained an understanding of the Group’s process in implementing the new standard on leases,including the determination of the population of the lease contracts covered by PFRS 16, thedetermination of the incremental borrowing rate and lease term, the application of the short-term and low-value assets exemption, the selection of the transition approach and any election of available practicalexpedients.
To test the completeness of the population of lease contracts, we obtained the list of lease agreements inprior year where rent expense have been recognized. The list was reconciled to the current year list. On atest basis, we inspected lease agreements (i.e., lease agreements existing prior to the adoption of PFRS 16and new lease agreements), identified their contractual terms and conditions, and traced these contractualterms and conditions to the lease calculation prepared by management, which covers the calculation offinancial impact of PFRS 16, including the transition adjustments.
For selected lease contracts with renewal and/or termination option, we reviewed the enforceability of theextension and/or termination option. We also reviewed the management’s assessment of whether it isreasonably certain that the Group will exercise the option to renew or not exercise the option to terminate.
We tested the parameters used in the determination of the incremental borrowing rate by reference tomarket data. We test computed the lease calculation prepared by management on a sample basis,including the transition adjustments.
A member firm of Ernst & Young Global Limited

*SGVFS039395*
- 3 -
We reviewed the disclosures related to the transition adjustments based on the requirements of PFRS 16and PAS 8, Accounting Policies, Changes in Accounting Estimates and Errors.
Real Estate Revenue Recogntion
The Group’s revenue recognition process, policies and procedures are significant to our audit becausethese involve application of significant judgment and estimation: (1) assessment of the probability that theentity will collect the consideration from the buyer; (2) application of the output method as the measure ofprogress in determining real estate revenue; (3) determination of the actual costs incurred as cost of sales;and (4) recognition of cost to obtain a contract.
In evaluating whether collectability of the amount of consideration is probable, the Group considers thesignificance of the buyer’s initial payments (buyer’s equity) in relation to the total contract price.Collectability is also assessed by considering factors such as past history with buyers, age of residentialand office development receivables and pricing of the property. Management regularly evaluates thehistorical sales cancellations and back-outs if it would still support its current threshold of buyer’s equitybefore commencing revenue recognition.
In measuring the progress of its performance obligation over time, the Group uses the output method.This method measures progress based on physical proportion of work done on the real estate projectwhich requires technical determination by the Group’s project engineers and managers.
In determining the actual costs incurred to be recognized as cost of sales, the Group estimates costsincurred on materials, labor and overhead which have not yet been billed by the contractor.
The Group identifies sales commission after contract inception as the cost of obtaining the contract. Forcontracts which qualified for revenue recognition, the Group capitalizes the total sales commission due tosales agent as cost to obtain contract and recognizes the related commission payable. The Group usespercentage of completion (POC) method in amortizing sales commission consistent with the Group’srevenue recognition policy.
Refer to Notes 2 and 35 to the consolidated financial statements for the disclosures on revenuerecognition.
Audit Response
We obtained an understanding of the Group’s revenue recognition process.
For the buyers’ equity, we evaluated management’s basis of the buyer’s equity by comparing this to thehistorical analysis of sales collections from buyers with accumulated payments above the collectionthreshold.
In determining revenue from real estate sales, we obtained an understanding of the Group’s processes fordetermining POC under the output method and performed tests of relevant controls. We obtainedcertified POC reports prepared by internal project engineers for mid-rise real estate development andthird-party project managers for high-rise real estate development. We assessed the competence andobjectivity of the project engineers and managers by reference to their qualifications, experience andreporting responsibilities. For selected projects, we conducted ocular inspections, made relevant inquiriesand obtained supporting details of POC reports.
A member firm of Ernst & Young Global Limited

*SGVFS039395*
- 4 -
For the cost of real estate sales, we obtained an understanding of the Group’s cost accumulation processand performed tests of relevant controls. For selected projects, we traced costs accumulated, includingthose incurred but not yet billed, to supporting documents such as project accomplishment reports andprogress billings from contractors.
For the recognition of costs to obtain a contract, we obtained an understanding of the sales commissionprocess. For selected contracts, we agreed the basis for calculating sales commission capitalized andportion recognized in profit or loss, particularly: (a) the percentage of commission due against contractswith sales agents, (b) the total commissionable amount (e.g., net contract price) against the relatedcontract to sell, and, (c) the POC against the POC used in recognizing the related revenue from real estatesales.
Adequacy of Allowance for Credit and Impairment Losses
The application of the expected credit losses (ECL) model of East West Banking Corporation (EW), asubsidiary of FDC, in calculating the allowance for credit and impairment losses is significant to our auditas it involves the exercise of significant management judgment and estimation. Key areas of judgmentinclude: segmenting the Group’ credit risk exposures; determining the method to estimate ECL; definingdefault; identifying exposures with significant deterioration in credit quality; determining assumptions tobe used in the ECL model such as the counterparty credit risk rating, the expected life of the financialasset and expected recoveries from defaulted accounts; and incorporating forward-looking information(called overlays) in calculating ECL.
Refer to Notes 2 and 3 to the consolidated financial statements for the related disclosure and details of theallowance for credit and impairment losses using the ECL model.
Audit Response
We obtained an understanding of the methodologies and models approved by the Group in determining itsdifferent credit exposures and assessed whether these considered the requirements of PFRS 9 to reflect anunbiased and probability-weighted outcome, and to consider time value of money and the best availableforward-looking information.
We (a) assessed the Group’s segmentation of its credit risk exposures based on homogeneity of credit riskcharacteristics; (b) tested the definition of default and significant increase in credit risk criteria againsthistorical analysis of accounts and credit risk management policies and practices in place, (c) tested theGroup’s application of internal credit risk rating system by reviewing the ratings of sample creditexposures; (d) assessed whether expected life is different from the contractual life by testing the maturitydates reflected in the Group’s records and considering management’s assumptions regarding futurecollections, advances, extensions, renewals and modifications; (e) tested loss given default by inspectinghistorical recoveries and related costs, write-offs and collateral valuations; (f) tested exposure at defaultconsidering outstanding commitments and repayment scheme; (g) checked the reasonableness of forward-looking information used for overlay through statistical test and corroboration using publicly availableinformation and our understanding of the Group’s lending portfolios and broader industry knowledge; and(h) tested the effective interest rate used in discounting the expected loss.
A member firm of Ernst & Young Global Limited

*SGVFS039395*
- 5 -
We checked the data used in the ECL models, such as historical analysis of defaults, and recovery data,by reconciling data from source system reports to the loss allowance analysis/models and financialreporting systems. To the extent that the loss allowance analysis is based on credit exposures that havebeen disaggregated into subsets of debt financial assets with similar risk characteristics, we traced or re-performed the disaggregation from source systems to the loss allowance analysis. We also assessed theassumptions used where there are missing or insufficient data.
We recalculated impairment provisions on a sample basis. We checked and reviewed the completeness ofthe disclosures made in the financial statements. We involved our internal specialists in the performanceof the above procedures.
Assessment of Goodwill
Under PFRS, the Group is required to test the amount of goodwill for impairment at least annually. As ofDecember 31, 2019, the Group’s goodwill attributable to the acquisition of the sugar business amountedto P=6,177.3 million, which is considered significant as it represents 59.5% of the total goodwill.Management’s assessment process requires significant judgment and use of assumptions, includinggrowth rates, gross margin and discount rates.
Refer to Notes 3 and 4 to the consolidated financial statements for the disclosures about goodwill.
Audit Response
We involved our internal specialist in evaluating the methodology and the assumptions used, includinggrowth rates, gross margin and discount rates. We compared the key assumptions used, such as growthrate and gross margin against the historical performance of the cash-generating units, industry outlook,and other relevant external data. We tested the parameters used in the determination of the discount rateagainst market data. We also reviewed the Group’s disclosures about those assumptions to which theoutcome of the impairment test is most sensitive; specifically those that have the most significant effecton the determination of the recoverable amount of goodwill.
Other Information
Management is responsible for Other Information. Other Information comprises the information includedin SEC Form 20 IS (Definitive Information Statement), SEC Form 17-A and Annual Report for the yearended December 31, 2019, but does not include the consolidated financial statements and our auditor’sreport thereon. SEC Form 20 IS (Definitive Information Statement), SEC Form 17-A and Annual Reportfor the year ended December 31, 2019 are expected to be made available to us after the date of thisauditor’s report.
Our opinion on the consolidated financial statements does not cover Other Information and we will notexpress any form of assurance conclusion thereon.
In connection with our audits of the consolidated financial statements, our responsibility is to read theOther Information identified above when it becomes available and, in doing so, consider whether suchinformation is materially inconsistent with the consolidated financial statements or our knowledgeobtained in the audits, or otherwise appears to be materially misstated.
A member firm of Ernst & Young Global Limited

*SGVFS039395*
- 6 -
Responsibilities of Management and Those Charged with Governance for the ConsolidatedFinancial Statements
Management is responsible for the preparation and fair presentation of the consolidated financialstatements in accordance with PFRSs, and for such internal control as management determines isnecessary to enable the preparation of consolidated financial statements that are free from materialmisstatement, whether due to fraud or error.
In preparing the consolidated financial statements, management is responsible for assessing the Group’sability to continue as a going concern, disclosing, as applicable, matters related to going concern andusing the going concern basis of accounting, unless management either intends to liquidate the Group orto cease operations, or has no realistic alternative but to do so.
Those charged with governance are responsible for overseeing the Group’s financial reporting process.
Auditor’s Responsibilities for the Audit of the Consolidated Financial Statements
Our objectives are to obtain reasonable assurance about whether the consolidated financial statements as awhole are free from material misstatement, whether due to fraud or error, and to issue an auditor’s reportthat includes our opinion. Reasonable assurance is a high level of assurance, but is not a guarantee that anaudit conducted in accordance with PSAs will always detect a material misstatement when it exists.Misstatements can arise from fraud or error and are considered material if, individually or in theaggregate, they could reasonably be expected to influence the economic decisions of users taken on thebasis of these consolidated financial statements.
As part of an audit in accordance with PSAs, we exercise professional judgment and maintainprofessional skepticism throughout the audit. We also:
· Identify and assess the risks of material misstatement of the consolidated financial statements,whether due to fraud or error, design and perform audit procedures responsive to those risks, andobtain audit evidence that is sufficient and appropriate to provide a basis for our opinion. The risk ofnot detecting a material misstatement resulting from fraud is higher than for one resulting from error,as fraud may involve collusion, forgery, intentional omissions, misrepresentations, or the override ofinternal control.
· Obtain an understanding of internal control relevant to the audit in order to design audit proceduresthat are appropriate in the circumstances, but not for the purpose of expressing an opinion on theeffectiveness of the Group’s internal control.
· Evaluate the appropriateness of accounting policies used and the reasonableness of accountingestimates and related disclosures made by management.
· Evaluate the overall presentation, structure and content of the consolidated financial statements,including the disclosures, and whether the consolidated financial statements represent the underlyingtransactions and events in a manner that achieves fair presentation.
A member firm of Ernst & Young Global Limited

*SGVFS039395*
- 7 -
· Obtain sufficient appropriate audit evidence regarding the financial information of the entities orbusiness activities within the Group to express an opinion on the consolidated financial statements.We are responsible for the direction, supervision and performance of the audit. We remain solelyresponsible for our audit opinion.
We communicate with those charged with governance regarding, among other matters, the planned scopeand timing of the audit and significant audit findings, including any significant deficiencies in internalcontrol that we identify during our audit.
We also provide those charged with governance with a statement that we have complied with relevantethical requirements regarding independence, and to communicate with them all relationships and othermatters that may reasonably be thought to bear on our independence, and where applicable, relatedsafeguards.
From the matters communicated with those charged with governance, we determine those matters thatwere of most significance in the audit of the consolidated financial statements of the current period andare therefore the key audit matters. We describe these matters in our auditor’s report, unless law orregulation precludes public disclosure about the matter or when, in extremely rare circumstances, wedetermine that a matter should not be communicated in our report because the adverse consequences ofdoing so would reasonably be expected to outweigh the public interest benefits of such communication.
The engagement partner on the audit resulting in this independent auditor’s report is Michael C. Sabado.
SYCIP GORRES VELAYO & CO.
Michael C. SabadoPartnerCPA Certificate No. 89336SEC Accreditation No. 0664-AR-4 (Group A), November 11, 2019, valid until November 10, 2022Tax Identification No. 160-302-865BIR Accreditation No. 08-001998-73-2018, February 26, 2018, valid until February 25, 2021PTR No. 8125294, January 7, 2020, Makati City
February 28, 2020
A member firm of Ernst & Young Global Limited

*SGVFS039395*
FILINVEST DEVELOPMENT CORPORATION AND SUBSIDIARIESCONSOLIDATED STATEMENTS OF FINANCIAL POSITION(Amounts in Thousands of Pesos)
December 31
2019
2018(As restated,
see Note 2)
ASSETS (Note 35)Cash and cash equivalents (Note 6) P=52,096,201 P=68,121,296Loans and receivables Real estate operations (Notes 7, and 26) 5,124,116 4,261,341
Hospitality operations (Notes 8 and 26) 213,490 196,645 Banking and financial services (Note 9) 254,106,944 231,530,917 Power operations (Note 10) 2,045,037 1,841,465
Sugar operations (Note 11) 108,090 117,871Financial assets at fair value through profit or loss (Note 12) 16,840,709 4,338,794Financial assets at fair value through other comprehensive income
(FVOCI) (Note 12) 5,323,670 750,287Investment securities at amortized cost (Notes 12 and 43) 49,386,071 36,510,546Contract assets (Note 13) 14,848,213 11,455,446Real estate inventories (Note 14) 71,363,524 79,469,859Coal, spare parts and other inventories (Note 15) 710,341 700,582Investment properties (Note 16) 82,571,561 69,132,494Property, plant and equipment (Note 17) 43,155,481 44,422,852Investments in joint ventures and associate (Note 18) 1,005,340 734,621Deferred tax assets - net (Notes 34) 3,255,431 2,600,752Right-of-use assets (Notes 2 and 32) 6,994,539 –Goodwill (Note 4) 10,381,152 10,381,152Other assets - net (Note 13 and 20) 22,624,965 23,222,079
P=642,154,875 P=589,788,999
LIABILITIES AND EQUITY
Liabilities (Note 35)Deposit liabilities (Note 21) P=284,767,905 P=266,926,144Bills and acceptances payable (Note 22) 30,949,753 17,969,927Accounts payable, accrued expenses and other liabilities
(Note 23) 40,456,537 39,756,004Contract liabilities (Note 13) 3,468,232 5,690,728Long-term debt (Note 24) 130,221,265 127,347,516Income tax payable (Note 34) 901,755 606,460Retirement liabilities (Notes 11, 26 and 30) 1,139,672 1,117,076Lease liabilities (Notes 2 and 32) 6,885,178 –Deferred tax liabilities - net (Note 34) 11,214,592 10,684,670 Total Liabilities P=510,004,889 P=470,098,525
(Forward)

*SGVFS039395*
- 2 -
December 31
2019
2018(As restated,
see Note 2)
EquityEquity attributable to equity holders of the Parent Company
Capital stock - P=1 par value (Note 25) Authorized common shares - 15,000,000,000 Authorized preferred shares - 2,000,000,000 Issued common shares - 9,319,872,387 P=9,319,872 P=9,319,872
Treasury shares (Notes 25 and 31) (3,614,474) (3,614,474) Additional paid-in capital (Note 25) 11,900,015 11,900,015 Retained earnings (Note 25) 82,601,866 69,979,249
Other comprehensive income - net of tax Revaluation reserve on financial assets at FVOCI
(Note 12) 373,644 118,061Remeasurement losses on retirement plans (Note 30) (61,627) (152,683)
Cash flow hedge reserve (Note 37) (72,770) 34,688 Translation adjustment 68,650 (74,899)
Share in other components of equity in joint ventures 724 724Total 100,515,900 87,510,553Noncontrolling interest (Notes 1, 2 and 5) 31,634,086 32,179,921
Total Equity 132,149,986 119,690,474P=642,154,875 P=589,788,999
See accompanying Notes to Consolidated Financial Statements.

*SGVFS039395*
FILINVEST DEVELOPMENT CORPORATION AND SUBSIDIARIESCONSOLIDATED STATEMENTS OF INCOME(Amounts in Thousands of Pesos, Except Earnings Per Share Figures)
Years Ended December 31
2019
2018(As restated,
see Note 2) 2017
REVENUES (Note 35)Real estate operations
Sale of lots, condominium and residential units P=21,453,544 P=20,362,799 P=17,230,717 Mall and rental revenues (Notes 16, 20 and 32) 7,464,297 6,174,384 4,897,200Hospitality operations 3,311,183 2,665,466 2,174,499Banking and financial services (Notes 6, 7 and 12) 29,139,017 23,794,478 21,494,677Power operations 10,113,074 8,630,461 9,942,496Sugar operations 3,367,879 3,287,221 2,143,009
74,848,994 64,914,809 57,882,598
OTHER INCOME (Notes 27 and 35)Real estate operations 2,143,350 2,236,798 2,437,502Hospitality operations 49,350 39,839 31,939Banking and financial services 7,218,485 6,212,376 7,197,714Power operations 26,071 659,299 9,149Sugar operations 31,059 89,238 31,512
9,468,315 9,237,550 9,707,816 Total Revenues and Other Income 84,317,309 74,152,359 67,590,414
COSTS (Note 28)Real estate operations
Sale of lots, condominium and residential units (Note 14) 11,570,158 10,321,891 9,142,738Mall and rental services (Notes 16 and 20) 1,048,106 880,597 834,158
Hospitality operations 1,655,265 1,345,245 1,076,838Banking and financial services (Notes 21, 22 and 24) 7,923,837 4,793,961 3,346,707Power operations 5,220,583 4,733,704 7,159,732Sugar operations 2,823,490 2,768,345 1,787,068Other operations (Note 24) 716,156 640,020 607,504
30,957,595 25,483,763 23,954,745
EXPENSES (Note 29)Real estate operations 7,320,242 6,153,344 5,045,009Hospitality operations 1,220,281 929,790 876,794Banking and financial services 20,657,422 19,520,951 18,895,707Power operations 2,465,011 2,537,670 3,524,661Sugar operations 232,239 346,359 233,287Other operations 1,197,358 1,292,572 678,506
33,092,553 30,780,686 29,253,964 Total Cost and Expenses 64,050,148 56,264,449 53,208,709
(Forward)

*SGVFS039395*
- 2 -
Years Ended December 31
2019
2018(As restated see Note 2) 2017
INCOME BEFORE INCOME TAX P=20,267,161 P=17,887,910 P=14,381,705
PROVISION FOR INCOME TAX (Note 34)Current 4,428,591 3,907,704 3,243,055Deferred (43,685) 547,007 865,372
4,384,906 4,454,711 4,108,427
NET INCOME (Note 35) P=15,882,255 P=13,433,199 P=10,273,278
Net income attributable to: Equity holders of the Parent Company (Note 31) P=11,970,302 P=9,768,663 P=6,612,443 Noncontrolling interest 3,911,953 3,664,536 3,660,835
P=15,882,255 P=13,433,199 P=10,273,278
Basic/Diluted Earnings Per Share Attributable to the EquityHolders of the Parent Company (Note 31) P=1.38 P=1.13 P=0.71
See accompanying Notes to Consolidated Financial Statements.
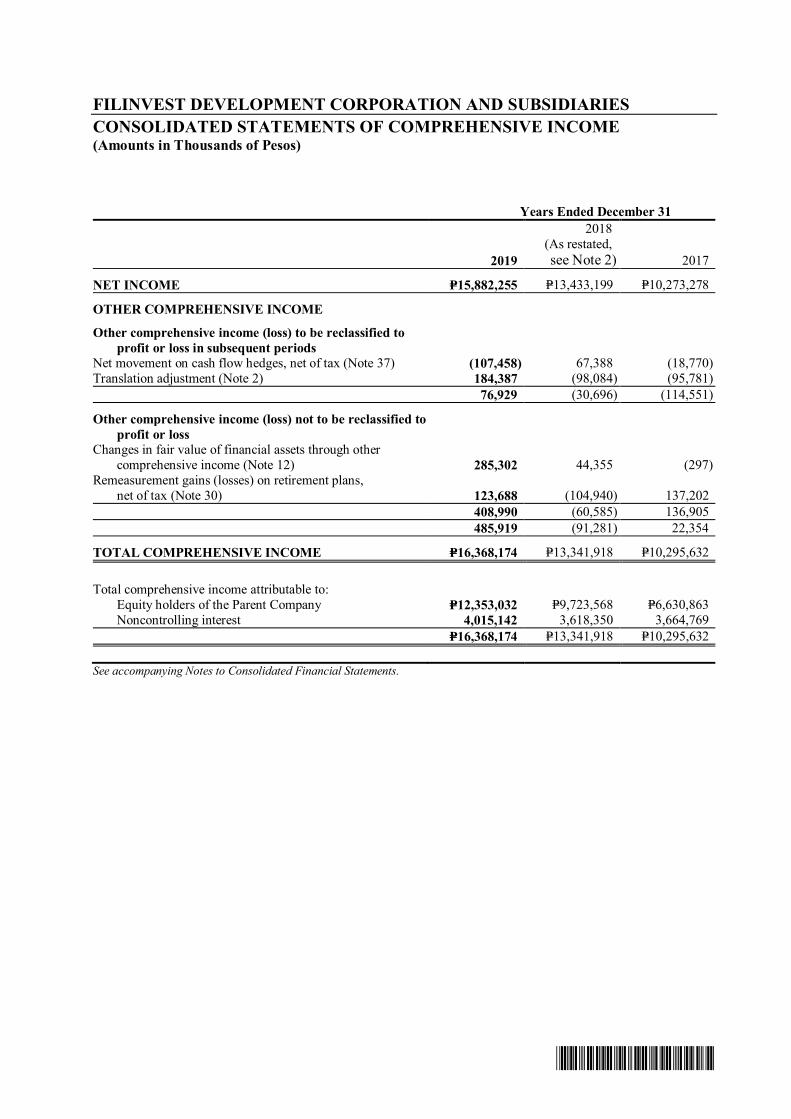
*SGVFS039395*
FILINVEST DEVELOPMENT CORPORATION AND SUBSIDIARIESCONSOLIDATED STATEMENTS OF COMPREHENSIVE INCOME(Amounts in Thousands of Pesos)
Years Ended December 31
2019
2018(As restated,see Note 2) 2017
NET INCOME P=15,882,255 P=13,433,199 P=10,273,278
OTHER COMPREHENSIVE INCOME
Other comprehensive income (loss) to be reclassified toprofit or loss in subsequent periods
Net movement on cash flow hedges, net of tax (Note 37) (107,458) 67,388 (18,770)Translation adjustment (Note 2) 184,387 (98,084) (95,781)
76,929 (30,696) (114,551)
Other comprehensive income (loss) not to be reclassified toprofit or loss
Changes in fair value of financial assets through othercomprehensive income (Note 12) 285,302 44,355 (297)
Remeasurement gains (losses) on retirement plans,net of tax (Note 30) 123,688 (104,940) 137,202
408,990 (60,585) 136,905485,919 (91,281) 22,354
TOTAL COMPREHENSIVE INCOME P=16,368,174 P=13,341,918 P=10,295,632
Total comprehensive income attributable to: Equity holders of the Parent Company P=12,353,032 P=9,723,568 P=6,630,863 Noncontrolling interest 4,015,142 3,618,350 3,664,769
P=16,368,174 P=13,341,918 P=10,295,632
See accompanying Notes to Consolidated Financial Statements.

*SGVFS039395*
FILINVEST DEVELOPMENT CORPORATION AND SUBSIDIARIESCONSOLIDATED STATEMENTS OF CHANGES IN EQUITY(Amounts in Thousands of Pesos)
Equity Attributable to Equity Holders of the Parent Company
Capital Stock(Note 25)
AdditionalPaid-inCapital
(Note 25)
RetainedEarnings(Note 25)
RevaluationReserve on
Financial Assetsat Fair Value
Through OtherComprehensive
Income(FVOCI)(Note 12)
Re-measurement
Losses onRetirement
Plans(Note 30)
Cash FlowHedge
Reserve(Note 37)
TranslationAdjustment
(Note 2)
Sharein Other
Componentsof Equity in
Joint Ventures(Note 18)
TreasuryShares
(Notes 25and 31) Total
NoncontrollingInterest(Note 5) Total
For the Year Ended December 31, 2019
Balances as at January 1, 2019, as previouslyreported P=9,319,872 P=11,900,015 P=69,979,249 P=118,061 (P=152,683) P=34,688 (P=74,899) P=724 (P=3,614,474) P=87,510,553 P=32,179,921 P=119,690,474
Effect of adoption of PFRS 16 (Note 2) – – 163,086 – – – – – – 163,086 28,125 191,211Balance as at January 1, 2019 (as restated) P=9,319,872 P=11,900,015 P=70,142,335 P=118,061 (152,683) P=34,688 (74,899) P=724 (3,614,474) P=87,673,639 P=32,208,046 P=119,881,685Net income – – 11,970,302 – – – – – – 11,970,302 3,911,953 15,882,255Other comprehensive income – – – 255,583 91,056 (107,458) 143,549 – – 382,730 103,189 485,919Total comprehensive income − − 11,970,302 255,583 91,056 (107,458) 143,549 − − 12,353,032 4,015,142 16,368,174Investment from noncontrolling interest – – – – – – – – – – 40,984 40,984Acquisition of noncontrolling interest (Note 5) – – 1,354,075 – – – – – – 1,354,075 (3,795,584) (2,441,509)Reduction in noncontrolling interest – – – – – – – – – – (9,274) (9,274)Dividends declared (Notes 5 and 25) – – (864,846) – – – – – – (864,846) (825,228) (1,690,074)
Balances as of December 31, 2019 P=9,319,872 P=11,900,015 P=82,601,866 P=373,644 (61,627) (72,770) P=68,650 P=724 (3,614,474) P=100,515,900 P=31,634,086 P=132,149,986
For the Year Ended December 31, 2018 (As restated, see Note 2)
Balances as at January 1, 2018 P=9,319,872 P=11,900,015 P=61,820,923 P=72,281 (P=70,122) (P=32,700) P=803 P=724 (P=3,614,474) P=79,397,322 P=29,732,285 P=109,129,607Effect of adoption of new accounting standards
(Note 2) − − (948,729) − − − − − − (948,729) (362,520) (1,311,249)Balance as at January 1, 2018 (as restated) 9,319,872 11,900,015 60,872,194 72,281 (70,122) (32,700) 803 724 (3,614,474) 78,448,593 29,369,765 107,818,358Net income (as restated) (Note 2) – – 9,768,663 – – – – – – 9,768,663 3,664,536 13,433,199Other comprehensive income – – – 45,780 (82,561) 67,388 (75,702) – – (45,095) (46,186) (91,281)Total comprehensive income (as restated) (Note 2) – – 9,768,663 45,780 (82,561) 67,388 (75,702) – – 9,723,568 3,618,350 13,341,918Acquisition of noncontrolling interest − − − − − − − − − − (16,093) (16,093)Dividends declared (Notes 5 and 25) – – (661,608) – – – – – – (661,608) (792,101) (1,453,709)
Balances as of December 31, 2018 (as restated) P=9,319,872 P=11,900,015 P=69,979,249 P=118,061 (P=152,683) P=34,688 (P=74,899) P=724 (P=3,614,474) P=87,510,553 P=32,179,921 P=119,690,474

22
*SGVFS039395*
- 2 -
Equity Attributable to Equity Holders of the Parent Company
Capital Stock(Note 25)
AdditionalPaid-inCapital
RetainedEarnings(Note 25)
RevaluationReserve on
Financial Assetsat Fair Value
Through OtherComprehensive
Income (FVOCI)(Note 12)
Re-measurement
Losses onRetirement
Plans(Note 30)
Cash FlowHedge
Reserve(Note 37)
TranslationAdjustment
(Note 2)
Sharein Other
Componentsof Equity in
Joint Ventures(Note 18)
TreasuryShares
(Notes 25and 31) Total
NoncontrollingInterest(Note 5) Total
For the Year Ended December 31, 2017
Balances as of January 1, 2017 P=9,319,872 P=11,900,015 P=55,872,560 P=72,581 (P=181,537) (P=13,930) P=74,728 P=724 (P=24,220) P=77,020,793 P=26,934,058 P=103,954,851Net income – – 6,612,443 – – – – – – 6,612,443 3,660,835 10,273,278Other comprehensive income – – – (300) 111,415 (18,770) (73,925) – – 18,420 3,934 22,354Total comprehensive income – – 6,612,443 (300) 111,415 (18,770) (73,925) – – 6,630,863 3,664,769 10,295,632Increase in investment from noncontrolling interest – – – – – – – – − − 21,302 21,302Acquisition of noncontrolling interest − − (114,349) − − − − − − (114,349) (24,504) (138,853)Effect of partial rescission of shares swap
(Notes 4 and 25) − − − − − − − − (3,590,254) (3,590,254) − (3,590,254)Dividends declared (Notes 5 and 25) – – (549,731) – – – – – – (549,731) (863,340) (1,413,071)
Balances as of December 31, 2017 P=9,319,872 P=11,900,015 P=61,820,923 P=72,281 (P=70,122) (P=32,700) P=803 P=724 (P=3,614,474) P=79,397,322 P=29,732,285 P=109,129,607See accompanying Notes to Consolidated Financial Statements.

*SGVFS039395*
FILINVEST DEVELOPMENT CORPORATION AND SUBSIDIARIESCONSOLIDATED STATEMENTS OF CASH FLOWS(Amounts in Thousands of Pesos)
Years Ended December 31
2019
2018(As restated,
See Note 2) 2017
CASH FLOWS FROM OPERATING ACTIVITIESIncome before income tax P=20,267,161 P=17,887,910 P=14,381,705Adjustments for: Provision for probable losses (Note 29) 4,421,260 4,595,309 4,540,117 Depreciation and amortization (Notes 16, 17, 19 and 20) 4,789,661 3,846,027 4,862,575 Interest expense (Note 29) 4,731,680 3,660,367 3,120,313 Share in net loss of joint ventures (Notes 18, 27 and 29) 358,199 364,328 426,641 Loss on asset foreclosure and dacion transactions
(Note 27) 199,991 212,896 236,352 Provision for retirement benefits, net of contribution
(Notes 30) 101,298 95,086 89,641Accretion expense on liability on Independent Power
Producer Administration (IPPA) contract andfinancial liability on lease contract (Note 29) ‒ 60,987 621,173
Loss (gain) on sale of property and equipment andinvestment properties (94,840) 23,594 (125,816)
Gain on sale of investment securities at amortized cost(Notes 12 and 27) ‒ – (317,443)
Interest income (Note 27) (580,025) (996,788) (937,295) Gain on capital transaction (Notes 18 and 27) ‒ – (665,000)Operating income before changes in operating assets
and liabilities 34,194,385 29,749,716 26,232,963 Decrease (increase) in: Loans and receivables (27,982,590) (9,440,015) (22,540,633)
Financial assets at fair value through profit and loss (12,501,915) 2,974,389 (2,045,433)Contract assets (3,392,767) (11,455,446) −
Real estate inventories 9,098,248 (12,703,702) (8,637,453)Coal, spare parts and other inventories (9,759) (124,016) 108,606
Increase (decrease) in: Deposit liabilities 17,491,760 25,361,611 19,337,896 Accounts payable, accrued expenses and
other liabilities (1,537,732) 337,914 5,395,760Contract liabilities (2,222,494) 5,690,728 −
Cash generated from operations 13,137,136 30,391,179 17,851,706Income taxes paid (4,133,296) (4,016,310) (3,014,448)Net cash provided by operating activities 9,003,840 26,374,869 14,837,258
(Forward)

22
*SGVFS039395*
- 2 -
Years Ended December 312019 2018 2017
CASH FLOWS FROM INVESTING ACTIVITIESAcquisitions of: Investment securities at amortized cost (P=12,875,525) (P=32,952,657) (P=6,835,392)
Investment properties and property and equipment(Notes 16 and 17) (19,039,563) (7,339,784) (9,155,693)
Intangible assets (Notes 19 and 20) (125,972) 311,580 (806,046)Proceeds from sale of: Investment properties and foreclosed assets 2,947,345 2,256,783 2,099,155 Investment securities at amortized cost ‒ 128,718 11,810,121 Investments in joint ventures (274,413) − −Receipts of:
Interest 580,025 996,788 937,295Dividends (Notes 12 and 18) 29,996 26,243 14,398
Net cash transferred from a business combination (Note 4) ‒ − (483,367)Decrease (increase) in: Due from related parties (11,093) 27,763 (51,505) Other assets (665,611) (4,607,044) (2,945,077)Net cash used in investing activities (29,434,811) (41,151,610) (5,416,111)
CASH FLOWS FROM FINANCING ACTIVITIESProceeds from long-term debt 17,156,631 7,142,412 13,492,154Increase (decrease) in
Bills and acceptances payable 12,979,827 13,810,232 1,965,100Due to related parties (516,328) 162 (34,347)
Payments of:Dividends (Notes 5 and 25) (1,690,074) (1,450,771) (1,415,329)Long-term debt (16,459,513) (6,468,584) (5,460,753)
Liability on IPPA Contract (Note 19) ‒ – (1,408,010)Finance lease obligation (Note 32) ‒ (60,695) (26,200)Financial liabilities on lease contract (Note 32) (1,118,715) – –Interest (3,545,427) (5,377,623) (4,575,646)
Acquisition of noncontrolling interest (Note 5) (2,441,509) (16,093) (138,853)Increase in investment from noncontrolling interest 40,984 – 21,302Net cash provided by financing activities 4,405,876 7,579,040 2,419,418
NET INCREASE (DECREASE) IN CASHAND CASH EQUIVALENTS (16,025,095) (7,197,701) 11,840,565
CASH AND CASH EQUIVALENTSAT BEGINNING OF YEAR 68,121,296 75,318,997 63,478,432
CASH AND CASH EQUIVALENTSAT END OF YEAR (Note 6) P=52,096,201 P=68,121,296 P=75,318,997
See accompanying Notes to Consolidated Financial Statements.

*SGVFS039395*
FILINVEST DEVELOPMENT CORPORATION AND SUBSIDIARIESNOTES TO CONSOLIDATED FINANCIAL STATEMENTS
1. Corporate Information
Filinvest Development Corporation (FDC or the “Parent Company”) is a stock corporationincorporated on April 27, 1973, with the expiration of its corporate life 50 years thereafter, under thelaws of the Philippines where its shares are publicly traded. The Parent Company and its subsidiaries(collectively referred to as the “Filinvest Group” or the “Group”) are engaged in real estate operationsas a developer of residential subdivisions and mixed-use urban projects, including condominiums,commercial buildings, industrial parks and farm estates. The Filinvest Group is also involved inleasing operations, hospitality operations, banking and financial services, power operations and sugarfarming and milling business. A.L. Gotianun, Inc. (ALGI) is the Group’s ultimate parent companyand was incorporated in the Philippines.
The Parent Company’s registered business address is at The Beaufort, 5th Avenue Corner 23rd Street,Bonifacio Global City, Taguig City, Metro Manila.
Real Estate OperationsOn December 26, 2019, Cyberzone Properties, Inc. (CPI) and Filinvest Cyberparks, Inc. (FCI),wholly owned subsidiaries of Filinvest Land, Inc. (FLI), entered into a Deed of Assignment to sell itsownership in Pro-Excel Property Managers, Inc. (Pro-Excel) to Filinvest Alabang, Inc. (FAI). Theprimary purpose of Pro-Excel is to engage in the business of administration, maintenance andmanagement of real estate development, controlled development projects and subdivision projects.
On December 16, 2019, Spectrum Alabang Properties, Inc. (SAPI), a wholly owned subsidiary ofFAI, was incorporated to engage in the developments of real estate properties and/or managingcommercial, recreational facilities and residential, office buildings and other related activities. SAPIhas not started commercial operations as of December 31, 2019.
On October 11, 2019, ProMixers Aggregates Corp. (PMAC), a wholly owned subsidiary ofDreambuilders Pro, Inc. (DPI), was incorporated mainly to operate concrete batching plant,manufacture and supply of pre-cast and construction equipment and rental. PMAC has not startedcommercial operations as of December 31, 2019.
On March 18, 2019, ProOffice Works Services, Inc. (ProOffice), a wholly owned subsidiary of FLI,was incorporated to engage in the business of administration, maintenance and management of realestate developments and projects. ProOffice started commercial operations in August 2019.
On July 18, 2018, the Securities and Exchange Commission (SEC) approved Timberland Sports andNature Club, Inc.’s (TSNC or the “Club”) application for voluntary revocation of its secondaryregistration which allowed TSNC to proceed with the transition to its new business model. OnNovember 15, 2018, TSNC’s Board of Directors (BOD) approved the amendment to change theprimary purpose of the Club from an exclusive recreational sports club to a for profit commercialfacility. On July 24, 2019, TSNC submitted its Amended Articles of Incorporation to SEC. Theamendments include (a) change of the primary purpose of TSNC from that of an exclusiverecreational sports club to a real estate development Company; (b) change of TSNC’s principaladdress from No. 173 P. Gomez Street, San Juan, Metro Manila to Timberland Heights, BarangayMalanday, San Mateo Rizal; (c) conversion of TSNC’s capital stock from no par value club shares topar value shares; (d) removal of provisions which characterizes TSNC as an exclusive non-profitassociation; and (e) removal of paragraphs which relate to the operations of an exclusive recreationalsports club. On August 1, 2019, the SEC approved TSNC’s application on voluntary revocation of its

- 2 -
*SGVFS039395*
secondary registration. On August 18, 2019, the SEC approved TSNC’s Amended Articles ofIncorporation.
On January 19, 2018, FLI entered into a Share Sale and Purchase Agreement to purchase 100% of thetotal outstanding shares of Gintong Parisukat Realty and Development, Inc. (GPRDI) for a totalconsideration of P=1.706.4 million. The primary purpose of GPRDI is to hold, purchase, lease,contract or otherwise acquire any and all real and personal properties. GPRDI has not startedcommercial operations as of December 31, 2019. The acquisition of GPRDI was accounted for as anasset acquisition (see Note 3).
On November 20, 2017, Filinvest Lifemalls Tagaytay, Inc. (FLTI), a wholly owned subsidiary of FLI,was incorporated. Its primary purpose is to acquire by purchase, lease except financial leasing,donation or otherwise, and to own, use, improve, develop, subdivide, sell, mortgage, exchange, lease,develop, conduct, operate and maintain the business of modernized commercial shopping centers andall the businesses related thereto. FLTI started commercial operations in March 2018.
On August 3, 2017, Realpros Philippines, Inc. (RPI), a wholly owned subsidiary of FLI, wasincorporated. Its primary purpose is to provide administrative support services and skills trainingprimarily through the use of information technology, licensed software, and systems. RPI startedcommercial operations in November 2017.
On March 29, 2017, Proleads Philippines, Inc. (Proleads), a wholly owned subsidiary of FLI, wasincorporated. Its primary purpose is to provide management, organizational, and other administrativeservices and training. Proleads started commercial operations in November 2017.
On February 7, 2017, Property Leaders International Limited (PLIL), a company limited by shares,was registered at the territory of the British Virgin Islands. PLIL has not started commercialoperations as of December 31, 2019.
On January 23, 2017, Filinvest Cyberzone Mimosa, Inc. (FCMI) and Filinvest Lifemalls Mimosa,Inc. (FLMI), wholly owned subsidiaries of FLI, were incorporated, both with the primary purpose toacquire by purchase, lease except financial leasing, donation or and hold for investment or otherwisedeal in real estate of all kinds, nature, purpose and/or any interest or right therein. FCMI startedcommercial operations in May 2018. FLMI has not started commercial operations as ofDecember 31, 2019.
On January 11, 2017, DPI, a wholly owned subsidiary of FLI was incorporated. Its primary purposeis to engage in and carry on a general construction business. DPI started commercial operations inFebruary 2017.
Hospitality OperationsOn September 9, 2019, Dauin Seascapes, Inc. (DSI), a wholly owned subsidiary of FilinvestHospitality Corporation (FHC), was incorporated with primary purpose of developing, administeringhotels, resorts and entertainment of all kinds and related activities. DSI has not started commercialoperations as of December 31, 2019.
On January 21, 2019, Zamboanga Cityscapes, Inc. (ZCI), a wholly owned subsidiary of FHC, wasincorporated to sell, use, assign, transfer, dispose, hold, mortgage, and lease purchased and ownedreal property and personal property of all kinds. ZCI has not started commercial operations as ofDecember 31, 2019.

- 3 -
*SGVFS039395*
On November 30, 2018, FHC subscribed to 2.5 million common shares of Entrata Hotel Services,Inc. (EHSI). The resulting ownership interest of FHC and FAI in EHSI after subscription is 76.9%,and 23.1%, respectively. Prior to the subscription, EHSI is 100.0% owned by FAI. Its primarypurpose is to own, lease, operate and/or manage hotels, resorts, villas, service apartments andcondotels, and all adjuncts and accessories and other related activities.
On August 24, 2018, Fora Services, Inc. (Fora Services), Fora Restaurants, Inc. (FRI), and NatureSpecialists, Inc. (NSI), wholly owned subsidiaries of FHC, were incorporated. The primary purposeof Fora Services is to develop and administer hotels, resorts and entertainment of all kinds. FRI’sprimary purpose is to maintain, operate and manage restaurants, cafes, bars, and general food cateringservices while NSI’s primary purpose is to sell, use, assign, transfer, dispose, hold, mortgage, andlease purchased and owned real property and personal property of all kinds. Fora Services and ForaRestaurants, Inc. started commercial operations in April 2019 while NSI has not started commercialoperations as of December 31, 2019.
On November 27, 2017, Dumaguete Cityscapes, Inc. (DCI), a wholly owned subsidiary of FHC, wasincorporated to sell, use, assign, transfer, dispose, hold, mortgage, and lease purchased and ownedreal property and personal property of all kinds. DCI has not started commercial operations as ofDecember 31, 2019.
On June 6, 2017 and February 9, 2017, Princesa Seascapes, Inc. (PSI) and Cubao Cityscapes, Inc.(CCI), wholly owned subsidiaries of FHC, were incorporated, respectively, with the primary purposeof developing and administering hotels, resorts and entertainment of all kinds and related activities.PSI and CCI have not started commercial operations as of December 31, 2019.
Power OperationsOn November 22, 2018, Filinvest ENGIE Renewable Energy Enterprise, Inc. (FREE), a joint venturecompany with Engie Services Asia Pacific Pte. Ltd. doing business as Engie Services Philippines(ENGIE), was incorporated to engage in the installation and operation of renewable energy facilities,particularly solar rooftop projects. FREE is owned 60.0% by FDC Utilities, Inc. (FDCUI) and 40.0%by ENGIE. FREE has not started commercial operations as of December 31, 2019.
Power operations has 3 x 135 megawatts (MW) circulating fluidized bed (CFB) coal thermal powerplants located at Philippine Veterans Investment Development Corporation (PHIVIDEC) IndustrialEstate in Villanueva, Misamis Oriental.
Approval of Consolidated Financial StatementsThe consolidated financial statements were approved and authorized for issue by the ParentCompany’s BOD on February 28, 2020.
2. Summary of Significant Accounting Policies
Basis of PreparationThe consolidated financial statements are prepared using the historical cost basis, except for financialassets at fair value through profit or loss (FVPL), financial assets at fair value through othercomprehensive income (FVOCI) and derivative financial instruments that have been measured at fairvalue. The financial statements are presented in Philippine Peso (P=) and all amounts are rounded tothe nearest thousand except when otherwise indicated.
The functional currency of the Parent Company, its subsidiaries and joint ventures is the PhilippinePeso, except for the Foreign Currency Deposit Unit (FCDU) of East West Banking Corporation

- 4 -
*SGVFS039395*
(EW). The functional currency of the FCDU is the United States Dollar (USD). For financialreporting purposes, FCDU accounts and foreign currency-denominated accounts of the Group aretranslated into their equivalents in Philippine Peso (see accounting policy on foreign currencytransactions and translations).
The consolidated financial statements provide comparative information in respect of the previousperiod.
Statement of ComplianceThe consolidated financial statements of the Group have been prepared in compliance with PhilippineFinancial Reporting Standards (PFRS), which include the availment of the relief granted by the SECunder Memorandum Circular (“SEC MC”) Nos. 4-2020, 3-2019 and 14-2018 as discussed in thesections below under “Future Changes in Accounting Policies” and “Significant AccountingPolicies”.
PFRSs include Philippine Accounting Standards (PAS) and Interpretations issued by PhilippineInterpretations Committee (PIC).
Presentation of Financial StatementsThe Group presents its consolidated statement of financial position broadly in order of liquidity. Ananalysis regarding recovery or settlement within 12 months after the statement of financial positiondate (current) and more than 12 months after the statement of financial position date (noncurrent) ispresented in Note 40 to the consolidated financial statements.
Basis of ConsolidationThe consolidated financial statements include the financial statements of the Parent Company and itssubsidiaries. All of the Parent Company’s subsidiaries were incorporated in the Philippines, exceptfor Filinvest Development Cayman Islands (FDCI), which was incorporated under the laws ofCayman Islands and PLIL, which was incorporated in British Virgin Islands.
The financial statements of the subsidiaries, joint ventures and associate are prepared for the samereporting period as the Parent Company, except for Pacific Sugar Holdings Corporation (PSHC)whose reporting period starts from October 1 and ends on September 30. Adjustments are made toeffect the significant transactions or events that occur between the reporting period of PSHC and thedate of the Group’s consolidated financial statements.
A subsidiary is an entity which the Group controls. Control is achieved when the Group is exposed,or has rights, to variable returns from its involvement with the investee and has the ability to affectthose returns through its power over the investee. Specifically, the Group controls an investee if andonly if the Group has: (a) power over the investee (i.e., existing rights that give it the current ability todirect the relevant activities of the investee); (b) exposure, or rights, to variable returns from itsinvolvement with the investee; and (c) the ability to use its power over the investee to affect itsreturns.
When the Group has less than a majority of the voting or similar rights of an investee, the Groupconsiders all relevant facts and circumstances in assessing whether it has power over an investee,including: (a) the contractual arrangement with the other vote holders of the investee; (b) rightsarising from other contractual arrangements; and (c) the Group’s voting rights and potential votingrights.
The Group re-assesses whether or not it controls an investee if facts and circumstances indicate thatthere are changes to one (1) or more of the three (3) elements of control. Consolidation of a

- 5 -
*SGVFS039395*
subsidiary begins when the Group obtains control over the subsidiary and ceases when the Grouploses control of the subsidiary. Assets, liabilities, income and expenses of a subsidiary acquired ordisposed of during the year are included in the consolidated financial statements from the date theGroup gains control until the date the Group ceases to control the subsidiary.
Profit or loss and each component of other comprehensive income (OCI) are attributed to the equityholders of the Parent Company and to the noncontrolling interests, even if this results in thenoncontrolling interests having a deficit balance. When necessary, adjustments are made to thefinancial statements of subsidiaries to bring their accounting policies in line with the Group’saccounting policies. All intra-group assets and liabilities, equity, income, expenses and cash flowsrelating to transactions between members of the Group are eliminated in full on consolidation.
A change in ownership interest of a subsidiary, without a loss of control, is accounted for as an equitytransaction. If the Group loses control over a subsidiary, it:· Derecognizes the assets (including goodwill) and liabilities of the subsidiary· Derecognizes the carrying amount of any noncontrolling interests· Derecognizes the cumulative translation differences recorded in equity· Recognizes the fair value of the consideration received· Recognizes the fair value of any investment retained· Recognizes any surplus of deficit in profit or loss· Reclassifies the parent’s share of components previously recognized in OCI to profit or loss or
retained earnings, as appropriate, as would be required if the Group had directly disposed of therelated assets or liabilities.
The consolidated financial statements include the accounts of the Parent Company and the followingsubsidiaries, with the corresponding percentages of ownership of the immediate parent company as atDecember 31. The voting rights held by the Group in these entities are in proportion to theirownership interest.
Percentage of Interest in Common Sharesof the Immediate Parent Company2019 2018 2017
Subsidiaries:EW (1) 78 77 77
East West Rural Bank, Inc. (EWRB) 100 100 100East West Insurance Brokerage, Inc. 100 100 100East West Leasing and Finance Corporation 100 100 100Quest Marketing and Integrated Services, Inc. (QMIS) 100 100 100Assurance Solutions Insurance Agency (ASIA) 100 100 100
FDC Forex Corporation (FFC) 100 100 100FLI 65 59 59
Filinvest AII Philippines, Inc. 100 100 100Homepro Realty Marketing, Inc. 100 100 100FCGC Corporation (FCGCC) 100 100 100
Filinvest BCDA Clark, Inc. (FBCI) 55 55 55CPI 100 100 100FCI 100 100 100Filinvest Asia Corporation (FAC) 60 60 60FCMI 100 100 100FLMI 100 100 100Filinvest Lifemalls Corporation 100 100 100Property Specialist Resources, Inc. 100 100 100Pro-Excel (3) 33 74 74FLTI 100 100 100Festival Supermall, Inc. 100 100 100
FSM Cinemas, Inc. 60 60 60Philippine DCS Development Corporation (PDDC) 60 60 60TSNC (2) 98 98 97
(Forward)

- 6 -
*SGVFS039395*
Percentage of Interest in Common Sharesof the Immediate Parent Company2019 2018 2017
Subsidiaries:DPI 100 100 100
PMAC 100 – –Property Maximizer Professional Corp. 100 100 100Leisurepro, Inc. 100 100 100Proleads 100 100 100PLIL 100 100 100RPI 100 100 100GPRDI 100 100 –ProOffice 100 – –
FAI (4) 93 92 92Northgate Convergence Corporation 100 100 100Proplus, Inc. 100 100 100ParkingPro, Inc. 100 100 100EHSI (5) 23 23 100SAPI 100 – –Pro-Excel (3) 67 – –
FDCUI 100 100 100FDC Casecnan Hydro Power Corporation 100 100 100FDC Retail Electricity Sales Corporation 100 100 100FDC Danao Power Corporation 100 100 100FDC Camarines Power Corporation 100 100 100FDC Misamis Power Corporation (FDC Misamis) (6) 100 100 100FDC Negros Power Corporation 100 100 100FDC Renewables Corporation 100 100 100FREE 60 60 –
PSHC 100 100 100Davao Sugar Central Company, Inc. (DSCC) 100 100 100Cotabato Sugar Central Company, Inc. (CSCC) 100 100 100High Yield Sugar Farms Corporation (HYSFC) 100 100 100
Mactan Seascapes Services, Inc. (MSSI) 100 100 100FHC 100 100 100
Quest Restaurants, Inc. 100 100 100Boracay Seascapes, Inc. (BSI) 100 100 100Chinatown Cityscapes Hotel, Inc. 100 100 100Duawon Seascapes Resort, Inc. (DSRI) 100 100 100EHSI (5) 77 77 –Mimosa Cityscapes, Inc. (MCI) 100 100 100CCI 100 100 100PSI 100 100 100DCI 100 100 100Fora Services 100 100 –FRI 100 100 –NSI 100 100 –ZCI 100 – –DSI 100 – –
Filinvest Mimosa, Inc. (FMI) (7) 95 95 95Corporate Technologies Incorporated (CTI) 100 100 100FDCI 100 100 100Countrywide Water Services, Inc. (CWSI) 100 100 1001. The percentage ownership in EW includes indirect ownership through FFC of 37.9%, 37.2%, and 37.1% as of December 31, 2019, 2018 and 2017, respectively.2. In 2018 and 2017, FLI acquired noncontrolling interest in TSNC representing additional 1.0% and 5.0% ownership interest, respectively, for a total consideration of
P=16.1 million and P=138.9 million, respectively.3. CPI and FCI sold its ownership in Pro-Excel to FAI (see Note 1). The percentage ownership includes 67.1% share in Pro-excel of FAI and 32.9% share of FLI
(see Note 1).4. The percentage ownership in FAI includes 20.0% share of FLI in FAI.5. EHSI is owned 76.9% by FHC and 23.1% by FAI in 2019 and 2018 (see Note 1).6. The percentage ownership in FDC Misamis includes 87.7% share of the Parent Company as of December 31, 2019, 2018 and 2017.7. The percentage ownership in FMI includes 47.5% share of FLI in FMI as of December 31, 2019, 2018 and 2017.

- 7 -
*SGVFS039395*
Noncontrolling InterestNoncontrolling interest represents the portion of profit or loss and net assets not owned, directly orindirectly, by the Group.
Noncontrolling interests are presented separately in the consolidated statement of income,consolidated statement of comprehensive income, and within equity in the consolidated statement offinancial position, separately from parent shareholder’s equity. Any losses applicable to thenoncontrolling interests are allocated against the interests of the noncontrolling interest even if thisresults in the noncontrolling interest having a deficit balance.
The acquisition of an additional ownership interest in a subsidiary without a change of control isaccounted for as an equity transaction. Any excess or deficit of consideration paid over the carryingamount of the noncontrolling interest is recognized in equity of the parent in transactions where thenoncontrolling interest are acquired or sold without loss of control.
Business Combination and GoodwillBusiness combinations are accounted for using the acquisition method. This involves recognizingidentifiable assets (including previously unrecognized intangible assets) and liabilities (includingcontingent liabilities and excluding future restructuring) of the acquired business at fair value. Thecost of an acquisition is measured as the aggregate of the consideration transferred, measured atacquisition date fair value and the amount of any noncontrolling interest in the acquiree.
For each business combination, the acquirer measures the noncontrolling interest in the acquireeeither at fair value or at the proportionate share of the acquiree’s identifiable net assets. Acquisitioncosts incurred are expensed in the consolidated statement of income.
When the Group acquires a business, it assesses the financial assets and financial liabilities assumedfor appropriate classification and designation in accordance with the contractual terms, economiccircumstances and pertinent conditions as at the acquisition date. This includes the separation ofembedded derivatives in host contracts by the acquiree. If the business combination is achieved instages, the acquisition date fair value of the acquirer’s previously held equity interest in the acquireeis remeasured to fair value at the acquisition date through profit or loss.
Any contingent consideration to be transferred by the acquirer will be recognized at fair value at theacquisition date. Subsequent changes to the fair value of the contingent consideration, which isdeemed to be an asset or liability, will be recognized in accordance with PFRS 9, FinancialInstruments: Classification and Measurement (effective January 1, 2018) either in profit or loss or asa change to OCI. If the contingent consideration is classified as equity, it should not be remeasureduntil it is finally settled within equity.
Under the transition provision of PFRS 3, Business Combination (as revised 2008), the standard shallbe applied prospectively to business combinations for which the acquisition date is on or after thebeginning of the first annual reporting period beginning on or after July 1, 2009. When a businesscombination agreement provides for an adjustment to the cost of the business combination contingenton future events, PFRS 3 (2007) requires the acquirer to include the amount of the adjustment in thecost of the combination at the acquisition date if the adjustment is probable and can be measuredreliably. If the future events do not occur or the estimate needs to be revised, the cost of the businesscombination is adjusted accordingly. Any subsequent adjustment in respect of such contingentconsideration is reflected in the carrying amount of goodwill.

- 8 -
*SGVFS039395*
Goodwill acquired in a business combination is initially measured at cost, being the excess of the costof the business combination over the Group’s interest in the net fair value of the acquiree’sidentifiable assets, liabilities and contingent liabilities. After initial recognition, goodwill is measuredat cost less any accumulated impairment losses. For the purpose of impairment testing, goodwillacquired in a business combination is, from the acquisition date, allocated to each of the Group’s cashgenerating units or groups of cash generating units, that are expected to benefit from the synergies ofthe combination, irrespective of whether other assets or liabilities of the Group are assigned to thoseunits or group of units.
Where goodwill forms part of a cash-generating unit (CGU; group of cash generating units) and partof the operation within that unit is disposed of, the goodwill associated with the operation disposed ofis included in the carrying amount of the operation when determining the gain or loss on disposal ofthe operation. Goodwill disposed of in this circumstance is measured based on the relative values ofthe operation disposed of and the portion of the cash-generating unit retained.
Acquisitions of noncontrolling interests are accounted for as transactions with owners in theircapacity as owners and therefore no goodwill or profit or loss is recognized as a result. Adjustmentsto noncontrolling interests arising from transactions that do not involve the loss of control are basedon a proportionate amount of the net assets of the subsidiary.
Adoption of New and Amended Accounting Standards and InterpretationsThe accounting policies adopted in the preparation of the Group’s consolidated financial statementsare consistent with those of the previous financial years, except for the adoption of the following newand amended PFRSs which became effective January 1, 2019. The nature and impact of each newstandard and amendment are described below:
· PFRS 16, Leases
PFRS 16 supersedes PAS 17, Leases, Philippine Interpretation International Financial ReportingInterpretations Committee (IFRIC) 4, Determining whether an Arrangement contains a Lease,Philippine Interpretation SIC-15, Operating Leases-Incentives and Philippine Interpretation SIC-27, Evaluating the Substance of Transactions Involving the Legal Form of a Lease. The standardsets out the principles for the recognition, measurement, presentation and disclosure of leases andrequires lessees to recognize most leases on the balance sheet.
Lessor accounting under PFRS 16 is substantially unchanged from today’s accounting underPAS 17. Lessors will continue to classify all leases using the same classification principle as inPAS 17 and distinguish between two types of leases: operating and finance leases. Therefore,PFRS 16 did not have an impact for leases where the Group is the lessor.
The Group adopted PFRS 16 using the modified retrospective approach upon adoption ofPFRS 16 in 2019 and elects to apply the standard to contracts that were previously identified asleases applying PAS 17 and Philippine Interpretation IFRIC-4. The Group will therefore notapply the standard to contracts that were not previously identified as containing a lease applyingPAS 17 and Philippine Interpretation IFRIC-4.

- 9 -
*SGVFS039395*
The effect of adopting PFRS 16 as at January 1, 2019 is as follows (amounts in thousands):
Increase (decrease)AssetsRight-of-use (ROU) assets P=7,658,244Property, plant and equipment (1,184,147)Investment properties (31,518)Deferred tax assets - net 23,397Other assets - net (800,836)
Total Assets P=5,665,140LiabilitiesAccounts payable, accrued expenses and other liabilities (P=1,696,186)Lease liabilities 7,130,249Deferred tax liabilities - net 39,866
Total Liabilities 5,473,929EquityEquity attributable to equity holders of the Parent
CompanyRetained earnings 163,086
Noncontrolling interest 28,125Total Equity 191,211
Total Liabilities and Equity P=5,665,140
Nature of the Effect of Adoption of PFRS 16The Group has lease contracts for various items of properties, machinery, vehicles and otherequipment. Before the adoption of PFRS 16, the Group classified each of its leases (as lessee) atthe inception date as either a finance lease or an operating lease. A lease was classified as afinance lease if it transferred substantially all of the risks and rewards incidental to ownership ofthe leased asset to the Group; otherwise it was classified as an operating lease. Finance leaseswere capitalized at the commencement of the lease at the inception date fair value of the leasedproperty or, if lower, at the present value of the minimum lease payments. Lease payments wereapportioned between interest (recognized as interest expenses) and reduction of financialliabilities on lease contracts. In an operating lease, the leased property was not capitalized andthe lease payments were recognized as rent expense in profit or loss on a straight-line basis overthe lease term. Any prepaid rent and accrued rent were recognized under “Other assets - net” and“Accounts payable, accrued expenses and other liabilities”, respectively.
Upon adoption of PFRS 16, the Group applied a single recognition and measurement approachfor all leases, except for short-term leases and leases of low-value assets. Refer to the accountingpolicy for leases prior to January 1, 2019. The standard provides specific transition requirementsand practical expedients, which have been applied by the Group.
Leases Previously Classified as Finance LeasesThe Group did not change the initial carrying amounts of recognized assets and liabilities at thedate of initial application for leases previously classified as finance leases (i.e., the ROU assetsand lease liabilities equal the lease assets and liabilities recognized under PAS 17). Therequirements of PFRS 16 was applied to these leases from January 1, 2019.

- 10 -
*SGVFS039395*
Leases Previously Accounted for as Operating LeasesThe Group applied a single recognition and measurement approach and recognized ROU assetsand lease liabilities for those leases previously classified as operating leases, except for short-term leases and leases of low-value assets. The ROU assets were recognized based on theamount equal to the lease liabilities, adjusted for any related prepaid and accrued lease paymentspreviously recognized. Lease liabilities were recognized based on the present value of theremaining lease payments, discounted using the incremental borrowing rate (IBR) at the date ofinitial application.
The Group also applied the available practical expedients wherein it:· Used a single discount rate to a portfolio of leases with reasonably similar characteristics· Relied on its assessment of whether leases are onerous immediately before the date of initial
application· Applied the short-term leases exemptions to leases with lease term that ends within 12
months at the date of initial application· Excluded the initial direct costs from the measurement of the ROU asset at the date of initial
application· Used hindsight in determining the lease term where the contract contains options to extend or
terminate the lease
Based on the foregoing, as at January 1, 2019:· ROU assets of P=7,658.2 million were recognized and presented separately in the consolidated
statement of financial position. This includes lease assets recognized previously underfinance leases of P1,184.1 million that were reclassified from Property, plant and equipment.
· Investment properties pertains to change in useful life resulting to a decrease ofP=31.5 million.
· Lease liabilities of P=7,130.2 million were recognized and presented separately in theconsolidated statement of financial position.
· Other assets pertaining to prepaid expenses of P=800.8 million related to previous operatingleases were reclassified to ROU.
· Accounts payable, accrued expenses and other liabilities pertaining to accrued rent amountingto P821.8 million and financial liabilities on lease contracts accounted under finance lease ofP874.4 million were reclassified to lease liabilities.
· Net deferred tax assets and net deferred tax liabilities increased by P23.4 million andP39.9 million, respectively.
· The net effect of these adjustments had been adjusted to retained earnings as atJanuary 1, 2019 which amounted to P=163.1 million and noncontrolling interest whichamounted to P=28.1 million.
The lease liabilities as at January 1, 2019 can be reconciled to the operating lease commitments asof December 31, 2018 as follows (amounts in thousands):
Operating lease commitments as at December 31, 2018 P=20,963,522Weighted average IBR at January 1, 2019 8.24%Discounted operating lease commitments at January 1, 2019 6,364,151
Less: Commitments relating to short-term leases (103,864)Less: Commitments relating to low value assets (4,442)Add: Commitments relating to leases previously classified
as finance leases (Note 32) 874,404Lease liabilities recognized as at January 1, 2019 P=7,130,249

- 11 -
*SGVFS039395*
Due to the adoption of PFRS 16, the Group’s operating profit in 2019 improved, while interestexpense increased. This is due to the change in the accounting for rent expense related to leasesthat were classified as operating leases under PAS 17.
· Philippine Interpretation on IFRIC-23, Uncertainty over Income Tax Treatments
The interpretation addresses the accounting for income taxes when tax treatments involveuncertainty that affects the application of PAS 12, Income Taxes. It does not apply to taxes orlevies outside the scope of PAS 12, nor does it specifically include requirements relating tointerest and penalties associated with uncertain tax treatments. The interpretation specificallyaddresses the following:
• Whether an entity considers uncertain tax treatments separately• The assumptions an entity makes about the examination of tax treatments by taxation
authorities• How an entity determines taxable profit (tax loss), tax bases, unused tax losses, unused tax
credits and tax rates• How an entity considers changes in facts and circumstances
The entity is required to determine whether to consider each uncertain tax treatment separately ortogether with one or more other uncertain tax treatments and use the approach that better predictsthe resolution of the uncertainty. The entity shall assume that the taxation authority will examineamounts that it has a right to examine and have full knowledge of all related information whenmaking those examinations. If an entity concludes that it is not probable that the taxationauthority will accept an uncertain tax treatment, it shall reflect the effect of the uncertainty foreach uncertain tax treatment using the method the entity expects to better predict the resolution ofthe uncertainty.
Upon adoption of the Interpretation, the Group has assessed whether it has any uncertain taxposition. The Group applies significant judgement in identifying uncertainties over its incometax treatments. The Group assessed whether the Interpretation had an impact on its consolidatedfinancial statements. The Group determined, based on its assessment, in consultation with its taxcounsel, that it is probable that its income tax treatments (including those for the subsidiaries)will be accepted by the taxation authorities. Accordingly, the Interpretation did not have animpact on the Group’s consolidated financial statements.
· PIC Q&A on Revenue Recognition Guidance for Sugar Millers
The Group adopted PFRS 15 using the modified retrospective method with the date of initialapplication of January 1, 2018. Under this method, the standard can be applied either to allcontracts at the date of initial application or only to contracts that are not completed at this date.The Group elected to apply the standard to all contracts as at January 1, 2018. Accordingly, the2018 comparative information was restated and reported under PFRS 15 (see Note 35).
Sugar OperationsWith the effectivity of PFRS 15 on January 1, 2018, as approved by Financial ReportingStandards Council, the PIC issued Q&A 2019-3, Revenue Recognition Guidance for SugarMillers, to assist companies operating in the sugar industry in the adoption of PFRS 15. PICQ&A 2019-3 states that a miller should recognize revenue arising from its sugar millingoperation under either output sharing agreement or cane purchase agreement, and that providingfree storage constitutes a separate performance obligation in the case of an output sharingagreement.

- 12 -
*SGVFS039395*
In response to concerns raised by the sugar industry on the implementation and adoption of PICQ&A 2019-3, the Philippine SEC issued MC No. 06 on April 4, 2019, allowing the deferral ofthe the application of the provisions of the above-mentioned PIC Q&A 2019-3 for a period of 1year.
Effective January 1, 2019, the Group adopted PIC Q&A 2019-3. The effect of initially applyingPFRS 15 for the recognition of revenue and cost from milling services is recognized at the date ofinitial application as of January 1, 2018 (see Note 35).
Set out below are the amounts by which each financial statement line item is affected as at andfor the years ended December 31, 2019 and 2018 as a result of the adoption of PFRS 15. Theadoption of PFRS 15 did not have a material impact on OCI or the Group’s operating, investingand financing cash flows.
The first column shows the amounts prepared under PFRS 15 and the second column shows whatthe amounts would have been had PFRS 15 not been adopted:
Consolidated Statement of Financial Position as at December 31, 2019
Amounts Prepared Under
PFRS 15 Previous PFRSIncrease
(Decrease)(In Thousands)
AssetsCoal, spare parts and other inventories P=710,341 P=705,189 P=5,152
Total Assets P=710,341 P=705,189 P=5,152Liabilities and EquityEquityEquity attributable to equity holders of the Parent Company Retained earnings P=82,592,749 P=82,587,597 P=5,152 Total Equity P=82,592,749 P=82,587,597 P=5,152 Total Liabilities and Equity P=82,592,749 P=82,587,597 P=5,152
Consolidated Statement of Financial Position as at December 31, 2018
Amounts Prepared Under
PFRS 15 Previous PFRSIncrease
(Decrease)(In Thousands)
AssetsCoal, spare parts and other inventories P=700,582 P=691,422 P=9,160
Total Assets P=700,582 P=691,422 P=9,160Liabilities and EquityEquityEquity attributable to equity holders of the Parent Company Retained earnings P=69,979,249 P=69,970,089 P=9,160 Total Equity P=69,979,249 P=69,970,089 P=9,160 Total Liabilities and Equity P=69,979,249 P=69,970,089 P=9,160

- 13 -
*SGVFS039395*
Consolidated Statement of Income for the Year Ended December 31, 2019
Amounts Prepared Under
PFRS 15 Previous PFRSIncrease
(Decrease)(In Thousands, Except EPS
Figures)Sugar Operations Revenues P=3,367,879 P=2,546,761 P=821,118
Cost 2,823,490 2,007,524 815,966Net income 15,882,255 15,877,103 5,152Net income attributable to:
Equity holders of the ParentCompany P=11,970,302 P=11,965,150 P=5,152
Noncontrolling interest 3,911,953 3,911,953 −P=15,882,255 P=15,877,103 P=5,152
Basic/Diluted EPS P=1.38 P=1.38 P=−
Consolidated Statement of Income for the Year Ended December 31, 2018
Amounts Prepared Under
PFRS 15 Previous PFRSIncrease
(Decrease)(In Thousands, Except EPS Figures)
Sugar Operations Revenues P=3,287,221 P=2,448,716 P=838,505
Cost 2,768,345 1,939,000 829,345Net income 13,433,199 13,424,039 9,160Net income attributable to:
Equity holders of the ParentCompany P=9,768,663 P=9,759,503 P=9,160
Noncontrolling interest 3,664,536 3,664,536 −P=13,433,199 P=13,424,039 P=9,160
Basic/Diluted EPS P=1.13 P=1.13 P=−
Except in the case of milling revenue, the Group determined that all contracts under PAS 18 stillqualify as contracts under PFRS 15. Before the adoption of PFRS 15, milling contracts enteredinto by the Group with the planters for the conversion of the planters’ sugar cane into raw sugarthrough an output-sharing arrangement is not considered as a revenue contract. These millingcontracts are now considered and within the scope of PFRS 15 which resulted in the recognitionof milling revenue and cost amounting to P=821.1 million and P=816.0 million for the year endedDecember 31, 2019, respectively, and P=838.5 million and P=829.3 million for the year endedDecember 31, 2018, respectively. Planters are considered customers under this arrangement andthe Group provides service to the planters in the form of conversion processes of sugar cane toraw sugar.
· Amendments to PFRS 9, Prepayment Features with Negative Compensation
Under PFRS 9, a debt instrument can be measured at amortized cost or at FVOCI, provided thatthe contractual cash flows are ‘solely payments of principal and interest on the principal amountoutstanding’ (the SPPI criterion) and the instrument is held within the appropriate business modelfor that classification. The amendments to PFRS 9 clarify that a financial asset passes the SPPI

- 14 -
*SGVFS039395*
criterion regardless of the event or circumstance that causes the early termination of the contractand irrespective of which party pays or receives reasonable compensation for the earlytermination of the contract.
These amendments had no impact on the consolidated financial statements of the Group.
· Amendments to PAS 19, Employee Benefits, Plan Amendment, Curtailment or Settlement
The amendments to PAS 19 address the accounting when a plan amendment, curtailment orsettlement occurs during a reporting period. The amendments specify that when a planamendment, curtailment or settlement occurs during the annual reporting period, an entity isrequired to:
· Determine current service cost for the remainder of the period after the plan amendment,curtailment or settlement, using the actuarial assumptions used to remeasure the net definedbenefit liability (asset) reflecting the benefits offered under the plan and the plan assets afterthat event
· Determine net interest for the remainder of the period after the plan amendment, curtailmentor settlement using: the net defined benefit liability (asset) reflecting the benefits offeredunder the plan and the plan assets after that event; and the discount rate used to remeasurethat net defined benefit liability (asset).
The amendments also clarify that an entity first determines any past service cost, or a gain or losson settlement, without considering the effect of the asset ceiling. This amount is recognized inprofit or loss. An entity then determines the effect of the asset ceiling after the plan amendment,curtailment or settlement. Any change in that effect, excluding amounts included in the netinterest, is recognized in OCI.
The amendments had no impact on the consolidated financial statements of the Group as it didnot have any plan amendments, curtailments, or settlements during the period.
· Amendments to PAS 28, Long-term Interests in Associates and Joint Ventures
The amendments clarify that an entity applies PFRS 9 to long-term interests in an associate orjoint venture to which the equity method is not applied but that, in substance, form part of the netinvestment in the associate or joint venture (long-term interests). This clarification is relevantbecause it implies that the expected credit loss (ECL) model in PFRS 9 applies to such long-terminterests.
The amendments also clarified that, in applying PFRS 9, an entity does not take account of anylosses of the associate or joint venture, or any impairment losses on the net investment,recognized as adjustments to the net investment in the associate or joint venture that arise fromapplying PAS 28, Investments in Associates and Joint Ventures.
These amendments had no impact on the consolidated financial statements as the Group does nothave long-term interests in its associate and joint venture.

- 15 -
*SGVFS039395*
· Annual Improvements to PFRSs 2015-2017 Cycle
· Amendments to PFRS 3, Business Combinations, and PFRS 11, Joint Arrangements,Previously Held Interest in a Joint Operation
The amendments clarify that, when an entity obtains control of a business that is a jointoperation, it applies the requirements for a business combination achieved in stages,including remeasuring previously held interests in the assets and liabilities of the jointoperation at fair value. In doing so, the acquirer remeasures its entire previously held interestin the joint operation.
A party that participates in, but does not have joint control of, a joint operation might obtainjoint control of the joint operation in which the activity of the joint operation constitutes abusiness as defined in PFRS 3. The amendments clarify that the previously held interests inthat joint operation are not remeasured.
An entity applies those amendments to business combinations for which the acquisition dateis on or after the beginning of the first annual reporting period beginning on or afterJanuary 1, 2019 and to transactions in which it obtains joint control on or after the beginningof the first annual reporting period beginning on or after January 1, 2019, with earlyapplication permitted. These amendments had no impact on the consolidated financialstatements of the Group as there is no transaction where joint control is obtained.
· Amendments to PAS 12, Income Tax Consequences of Payments on Financial InstrumentsClassified as Equity
The amendments clarify that the income tax consequences of dividends are linked moredirectly to past transactions or events that generated distributable profits than to distributionsto owners. Therefore, an entity recognizes the income tax consequences of dividends in profitor loss, OCI or equity according to where the entity originally recognized those pasttransactions or events.
An entity applies those amendments for annual reporting periods beginning on or afterJanuary 1, 2019, with early application is permitted. These amendments had no impact on theconsolidated financial statements of the Group because dividends declared by the Group donot give rise to tax obligations under the current tax laws.
· Amendments to PAS 23, Borrowing Costs, Borrowing Costs Eligible for Capitalization
The amendments clarify that an entity treats as part of general borrowings any borrowingoriginally made to develop a qualifying asset when substantially all of the activities necessaryto prepare that asset for its intended use or sale are complete.
An entity applies those amendments to borrowing costs incurred on or after the beginning ofthe annual reporting period in which the entity first applies those amendments. An entityapplies those amendments for annual reporting periods beginning on or after January 1, 2019,with early application permitted.
These amendments had no significant impact on the consolidated financial statements.

- 16 -
*SGVFS039395*
Future Changes in Accounting PoliciesThe Group will adopt the following standards and interpretations when these become effective.Except as otherwise stated, the Group does not expect the adoption of these standards to have asignificant impact on the consolidated financial statements.
Effective Beginning on or After January 1, 2020
· Amendments to PFRS 3, Definition of a Business
The amendments to PFRS 3 clarify the minimum requirements to be a business, remove theassessment of a market participant’s ability to replace missing elements, and narrow thedefinition of outputs. The amendments also add guidance to assess whether an acquired processis substantive and add illustrative examples. An optional fair value concentration test isintroduced which permits a simplified assessment of whether an acquired set of activities andassets is not a business.
An entity applies those amendments prospectively for annual reporting periods beginning on orafter January 1, 2020, with earlier application permitted.
These amendments will apply on future business combinations of the Group.
· Amendments to PAS 1, Presentation of Financial Statements, and PAS 8, Accounting Policies,Changes in Accounting Estimates and Errors, Definition of Material
The amendments refine the definition of material in PAS 1 and align the definitions used acrossPFRSs and other pronouncements. They are intended to improve the understanding of theexisting requirements rather than to significantly impact an entity’s materiality judgements.
An entity applies those amendments prospectively for annual reporting periods beginning on orafter January 1, 2020, with earlier application permitted.
Effective Beginning on or After January 1, 2021
· PFRS 17, Insurance Contracts
PFRS 17 is a comprehensive new accounting standard for insurance contracts coveringrecognition and measurement, presentation and disclosure. Once effective, PFRS 17 will replacePFRS 4, Insurance Contracts. This new standard on insurance contracts applies to all types ofinsurance contracts (i.e., life, non-life, direct insurance and re-insurance), regardless of the type ofentities that issue them, as well as to certain guarantees and financial instruments withdiscretionary participation features. A few scope exceptions will apply.
The overall objective of PFRS 17 is to provide an accounting model for insurance contracts thatis more useful and consistent for insurers. In contrast to the requirements in PFRS 4, which arelargely based on grandfathering previous local accounting policies, PFRS 17 provides acomprehensive model for insurance contracts, covering all relevant accounting aspects. The coreof PFRS 17 is the general model, supplemented by:
· A specific adaptation for contracts with direct participation features (the variable feeapproach)
· A simplified approach (the premium allocation approach) mainly for short-duration contracts

- 17 -
*SGVFS039395*
PFRS 17 is effective for reporting periods beginning on or after January 1, 2021, withcomparative figures required. Early application is permitted. The Group is currently assessingthe impact of adopting this standard.
Deferred Effectivity
· Amendments to PFRS 10, Consolidated Financial Statements, and PAS 28, Sale or Contributionof Assets between an Investor and its Associate or Joint Venture
The amendments address the conflict between PFRS 10 and PAS 28 in dealing with the loss ofcontrol of a subsidiary that is sold or contributed to an associate or joint venture. Theamendments clarify that a full gain or loss is recognized when a transfer to an associate or jointventure involves a business as defined in PFRS 3. Any gain or loss resulting from the sale orcontribution of assets that does not constitute a business, however, is recognized only to theextent of unrelated investors’ interests in the associate or joint venture.
On January 13, 2016, the Financial Reporting Standards Council deferred the original effectivedate of January 1, 2016 of the said amendments until the International Accounting StandardsBoard (IASB) completes its broader review of the research project on equity accounting that mayresult in the simplification of accounting for such transactions and of other aspects of accountingfor associates and joint ventures.
The Group is currently assessing the impact of adopting these amendments.
· Deferment of Implementation of IFRIC Agenda Decision on Over Time Transfer of ConstructedGoods (PAS 23, Borrowing Cost) for the Real Estate Industry
In March 2019, IFRIC published an Agenda Decision on whether borrowing costs can becapitalized on real estate inventories that are under construction and for which the related revenueis/will be recognized over time under par. 35(c) of PFRS 15. IFRIC concluded that borrowingcosts cannot be capitalized for such real estate inventories as they do not meet the definition of aqualifying asset under PAS 23 considering that these inventories are ready for their intended salein their current condition.
The IFRIC agenda decision would change the Group’s current practice of capitalizing borrowingcosts on real estate projects with pre-selling activities.
On February 21, 2020, the Philippine SEC issued MC No. 4, Series of 2020, providing relief tothe Real Estate Industry by deferring the mandatory implementation of the above IFRIC AgendaDecision until December 31, 2020. Effective January 1, 2021, the Real Estate Industry will adoptthe IFRIC agenda decision and any subsequent amendments thereto retrospectively or as the SECwill later prescribe. A real estate company may opt not to avail of the deferral and insteadcomply in full with the requirements of the IFRIC agenda decision.
For real estate companies that avail of the deferral, the SEC requires disclosure in the Notes to theFinancial Statements of the accounting policies applied, a discussion of the deferral of the subjectimplementation issues, and a qualitative discussion of the impact in the financial statements hadthe IFRIC agenda decision been adopted.

- 18 -
*SGVFS039395*
The Group opted to avail of the relief as provided by the SEC. Had the Group adopted the IFRICagenda decision, borrowing costs capitalized to real estate inventories related to projects with pre-selling activities should have been expensed out in the period incurred.
This adjustment should have been applied retrospectively and would have resulted to restatementof prior year consolidated financial statements. A restatement would have impacted interestexpense, cost of sales, provision for deferred income tax, real estate inventories, deferred taxliability and opening balance of retained earnings.
Significant Accounting Policies
Fair Value MeasurementFair value is the price that would be received to sell an asset or paid to transfer a liability in an orderlytransaction between market participants at the measurement date. The fair value measurement isbased on the presumption that the transaction to sell the asset or transfer the liability takes placeeither:
· In the principal market for the asset or liability, or,· In the absence of a principal market, in the most advantageous market for the asset or liability.
The principal or the most advantageous market must be accessible to by the Group. The fair value ofan asset or a liability is measured using the assumptions that market participants would use whenpricing the asset or liability, assuming that market participants act in their economic best interest.
A fair value measurement of a non-financial asset takes into account a market participant's ability togenerate economic benefits by using the asset in its highest and best use or by selling it to anothermarket participant that would use the asset in its highest and best use.
The Group uses valuation techniques that are appropriate in the circumstances and for whichsufficient data are available to measure fair value, maximizing the use of relevant observable inputsand minimizing the use of unobservable inputs.
All assets and liabilities for which fair value is measured or disclosed in the consolidated financialstatements are categorized within the fair value hierarchy, described as follows, based on the lowestlevel input that is significant to the fair value measurement as a whole:
· Level 1 - Quoted (unadjusted) market prices in active markets for identical assets or liabilities· Level 2 - Valuation techniques for which the lowest level input that is significant to the fair value
measurement is directly or indirectly observable· Level 3 - Valuation techniques for which the lowest level input that is significant to the fair value
measurement is unobservable
For assets and liabilities that are recognized in the consolidated financial statements on a recurringbasis, the Group determines whether transfers have occurred between Levels in the hierarchy byre-assessing categorization (based on the lowest level input that is significant to the fair valuemeasurement as a whole) at the end of each reporting period.
External valuers are involved for valuation of significant assets, such as investment properties.Involvement of external valuers is determined annually after discussion with and approval by theParent Company’s Audit Committee. Selection criteria include market knowledge, reputation,independence and whether professional standards are maintained.

- 19 -
*SGVFS039395*
The Group, in conjunction with the external valuers, also compares the change in the fair value ofeach asset and liability with relevant external sources to determine whether the change is reasonable.
For the purpose of fair value disclosures, the Group has determined classes of assets and liabilities onthe basis of the nature, characteristics and risks of the asset or liability and the level of the fair valuehierarchy, as explained above.
Financial Instruments - Initial Recognition and Subsequent MeasurementA financial instrument is any contract that gives rise to a financial asset of one entity and a financialliability or equity instrument of another entity.
Financial Assets - Initial Recognition and MeasurementFinancial assets are classified, at initial recognition, as either subsequently measured at amortizedcost, at FVOCI, or at FVPL.
The classification of financial assets at initial recognition depends on the financial asset’s contractualcash flow characteristics and the Group’s business model for managing them. With the exception oftrade receivables that do not contain a significant financing component or for which the Group hasapplied the practical expedient, the Group initially measures a financial asset at its fair value plus, inthe case of a financial asset not at FVPL, transaction costs. Trade receivables that do not contain asignificant financing component or for which the Group has applied the practical expedient aremeasured at the transaction price determined under PFRS 15. Refer to accounting policies onRevenue from contracts with customers.
In order for a financial asset to be classified and measured at amortized cost or at FVOCI, it needs togive rise to cash flows that are ‘solely payments of principal and interest’ (SPPI) on the principalamount outstanding. This assessment is referred to as the SPPI test and is performed at an instrumentlevel.
The Group’s business model for managing financial assets refers to how it manages its financialassets in order to generate cash flows. The business model determines whether cash flows will resultfrom collecting contractual cash flows, selling the financial assets, or both.
Purchases or sales of financial assets that require delivery of assets within a time frame established byregulation or convention in the market place (regular way trades) are recognized on the settlementdate, i.e., the date that an asset is delivered to or by the Group. Settlement date accounting refers to(a) the recognition of an asset on the day it is received by the Group, and (b) the derecognition of anasset and recognition of any gain or loss on disposal on the day that it is delivered by the Group.Securities transactions and related commission income and expense are recorded also on a settlementdate basis. Deposits, amounts due to banks and customers, and loans and receivables are recognizedwhen cash is received by the Group or advanced to the borrowers.
Derivatives are recognized on trade date, i.e., the date that the Group becomes a party to thecontractual provisions of the instrument. Trade date accounting refers to (a) the recognition of anasset to be received and the liability to pay for it on the trade date, and (b) derecognition of an assetthat is sold, recognition of any gain or loss on disposal and the recognition of a receivable from thebuyer for payment on the trade date.
As of December 31, 2019 and 2018, the Group’s financial assets comprise of financial assets atamortized cost, financial assets at FVPL and financial assets at FVOCI.
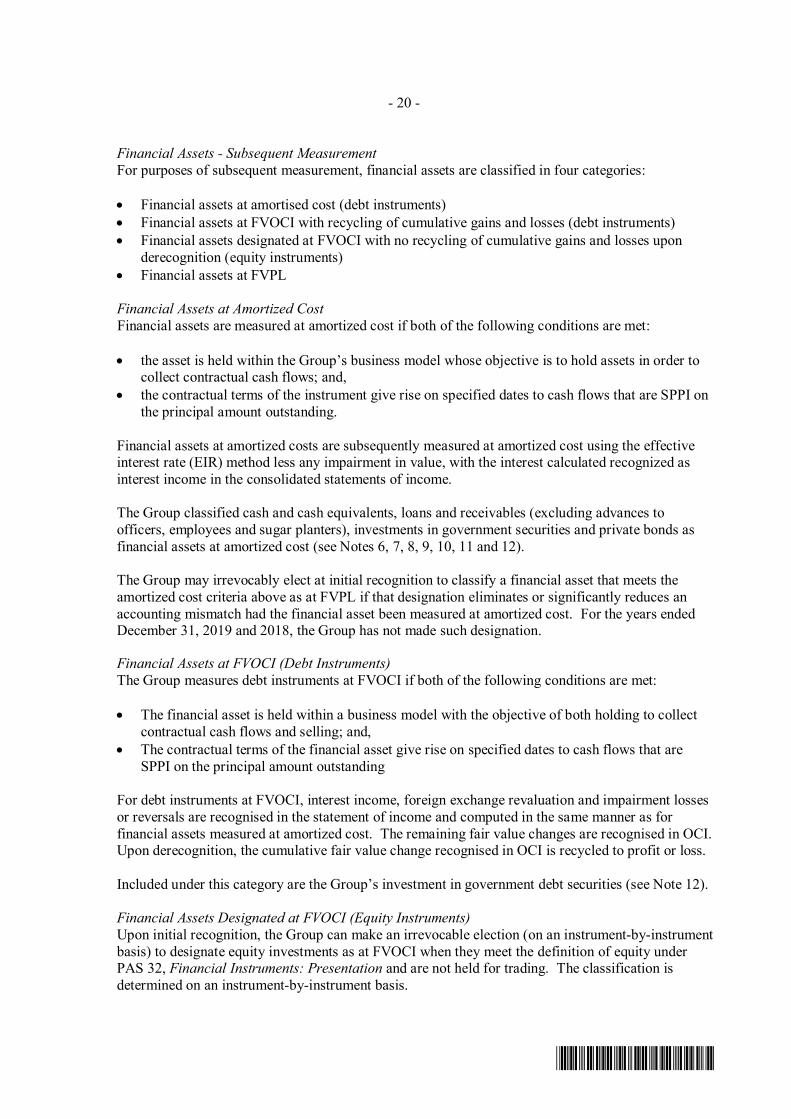
- 20 -
*SGVFS039395*
Financial Assets - Subsequent MeasurementFor purposes of subsequent measurement, financial assets are classified in four categories:
· Financial assets at amortised cost (debt instruments)· Financial assets at FVOCI with recycling of cumulative gains and losses (debt instruments)· Financial assets designated at FVOCI with no recycling of cumulative gains and losses upon
derecognition (equity instruments)· Financial assets at FVPL
Financial Assets at Amortized CostFinancial assets are measured at amortized cost if both of the following conditions are met:
· the asset is held within the Group’s business model whose objective is to hold assets in order tocollect contractual cash flows; and,
· the contractual terms of the instrument give rise on specified dates to cash flows that are SPPI onthe principal amount outstanding.
Financial assets at amortized costs are subsequently measured at amortized cost using the effectiveinterest rate (EIR) method less any impairment in value, with the interest calculated recognized asinterest income in the consolidated statements of income.
The Group classified cash and cash equivalents, loans and receivables (excluding advances toofficers, employees and sugar planters), investments in government securities and private bonds asfinancial assets at amortized cost (see Notes 6, 7, 8, 9, 10, 11 and 12).
The Group may irrevocably elect at initial recognition to classify a financial asset that meets theamortized cost criteria above as at FVPL if that designation eliminates or significantly reduces anaccounting mismatch had the financial asset been measured at amortized cost. For the years endedDecember 31, 2019 and 2018, the Group has not made such designation.
Financial Assets at FVOCI (Debt Instruments)The Group measures debt instruments at FVOCI if both of the following conditions are met:
· The financial asset is held within a business model with the objective of both holding to collectcontractual cash flows and selling; and,
· The contractual terms of the financial asset give rise on specified dates to cash flows that areSPPI on the principal amount outstanding
For debt instruments at FVOCI, interest income, foreign exchange revaluation and impairment lossesor reversals are recognised in the statement of income and computed in the same manner as forfinancial assets measured at amortized cost. The remaining fair value changes are recognised in OCI.Upon derecognition, the cumulative fair value change recognised in OCI is recycled to profit or loss.
Included under this category are the Group’s investment in government debt securities (see Note 12).
Financial Assets Designated at FVOCI (Equity Instruments)Upon initial recognition, the Group can make an irrevocable election (on an instrument-by-instrumentbasis) to designate equity investments as at FVOCI when they meet the definition of equity underPAS 32, Financial Instruments: Presentation and are not held for trading. The classification isdetermined on an instrument-by-instrument basis.
- 21 -
*SGVFS039395*
Gains and losses on these financial assets are never recycled to profit or loss. Dividends arerecognised as other income in the consolidated statement of income when the right of payment hasbeen established, except when the Group benefits from such proceeds as a recovery of part of the costof the financial asset, in which case, such gains are recorded in OCI. Equity instruments designatedat FVOCI are not subject to impairment assessment.
Included under this category are the Group’s investments in quoted and unquoted equity securities(see Notes 12 and 36).
Financial Assets at FVPLDebt instruments that do not meet the amortized cost criteria, or that meet the criteria but the Grouphas chosen to designate as at FVPL at initial recognition, are measured at FVPL.
Equity investments are classified as at FVPL, unless the Group designates an investment that is notheld for trading as at FVOCI at initial recognition.
The Group’s financial assets at FVPL include investments in government securities, private bonds,equity securities held for trading purposes and derivative assets (see Note 12).
Financial assets at FVPL are carried at fair value, and fair value gains and losses on these instrumentsare recognized as Trading and securities gain in the consolidated statement of income. Interest earnedon these investments is reported in the consolidated statement of income under Interest income whiledividend income is reported in the consolidated statement of income under Other income when theright of payment has been established. Quoted market prices, when available, are used to determinethe fair value of these financial instruments. If quoted market prices are not available, their fairvalues are estimated based on inputs provided by the Bangko Sentral ng Pilipinas (BSP) , Bureau ofTreasury and investment bankers. For all other financial instruments not listed in an active market,the fair value is determined by using appropriate valuation techniques.
The fair value of financial assets denominated in a foreign currency is determined in that foreigncurrency and translated at the Bankers Association of the Philippines or BAP closing rate at thestatement of financial position date. The foreign exchange component forms part of its fair valuegain or loss. For financial assets classified as at FVPL, the foreign exchange component isrecognized in the statement of income. For financial assets designated as at FVOCI, any foreignexchange component is recognized in OCI. For foreign currency-denominated debt instrumentsclassified at amortized cost, the foreign exchange gains and losses are determined based on theamortized cost of the asset and are recognized in the consolidated statement of income.
This category includes private bonds, government securities, equity securities held for tradingpurposes and derivative assets as of December 31, 2019 and 2018 (see Notes 12 and 20).
Reclassification of Financial AssetsThe Group can reclassify financial assets if the objective of its business model for managing thosefinancial assets changes. The Group is required to reclassify the following financial assets:· from amortized cost to FVPL if the objective of the business model changes so that the amortized
cost criteria are no longer met; and,· from FVPL to amortized cost if the objective of the business model changes so that the amortized
cost criteria start to be met and the instrument’s contractual cash flows meet the amortized costcriteria.
Reclassification of financial assets designated as FVPL at initial recognition is not permitted.

- 22 -
*SGVFS039395*
A change in the objective of the Group’s business model must be effected before the reclassificationdate. The reclassification date is the beginning of the next reporting period following the change inthe business model.
Financial Liabilities - Initial Recognition and MeasurementFinancial liabilities are classified, at initial recognition, as financial liabilities at FVPL, loans andborrowings, payables, or as derivatives designated as hedging instruments in an effective hedge, asappropriate.
All financial liabilities are recognised initially at fair value and, in the case of loans and borrowingsand payables, net of directly attributable transaction costs.
Day 1’ DifferenceWhere the transaction price in a non-active market is different from the fair value from otherobservable current market transactions in the same instrument or based on a valuation techniquewhose variables include only data from observable market, the Group recognizes the differencebetween the transaction price and fair value (a ‘Day 1’ difference) in the consolidated statement ofincome. In cases where the transaction price used is made of data which is not observable, thedifference between the transaction price and model value is only recognized in the consolidatedstatement of income when the inputs become observable or when the instrument is derecognized. Foreach transaction, the Group determines the appropriate method of recognizing the ‘Day 1’ differenceamount.
Financial Liabilities - Subsequent MeasurementFor purposes of subsequent measurement, financial liabilities are classified in two categories:
· Financial liabilities at FVPL· Financial liabilities at amortized cost (loans and borrowings)
Financial Liabilities at FVPLFinancial liabilities are classified as at FVPL when the financial liability is either held for trading or isdesignated as at FVPL.
A financial liability is held for trading if:· it has been incurred principally for the purpose of repurchasing it in the near term; or· on initial recognition, it is part of a portfolio of identified financial instruments that the Group
manages together and has evidence of a recent actual pattern of short-term profit-taking; or· it is a derivative that is not designated and effective as a hedging instrument or a financial
guarantee.
Management may designate a financial liability at FVPL upon initial recognition when the followingcriteria are met, and designation is determined on an instrument by instrument basis:
· The designation eliminates or significantly reduces the inconsistent treatment that wouldotherwise arise from measuring the liabilities or recognizing gains or losses on them on adifferent basis; or
· The liabilities are part of a group of financial liabilities which are managed and their performanceevaluated on a fair value basis, in accordance with a documented risk management or investmentstrategy; or

- 23 -
*SGVFS039395*
· The financial instrument contains an embedded derivative, unless the embedded derivative doesnot significantly modify the cash flows or it is clear, with little or no analysis, that it would not beseparately recorded.
As of December 31, 2019 and 2018, the Group’s financial liabilities at FVPL include derivativeliabilities (see Note 23).
Financial Liabilities at Amortized CostIssued financial instruments or their components, which are not designated at FVPL, are classified asfinancial liabilities at amortized cost where the substance of the contractual arrangement results in theGroup having an obligation either to deliver cash or another financial asset to the holder, or to satisfythe obligation other than by the exchange of a fixed amount of cash or another financial asset for afixed number of own equity shares. The components of issued financial instruments that contain bothliability and equity elements are accounted for separately, with the equity component being assignedthe residual amount after deducting from the instrument as a whole the amount separately determinedas the fair value of the liability component on the date of issue.
Amortized cost is calculated by taking into account any discount or premium on the issuance and feesthat are an integral part of the EIR. The EIR amortisation is included as finance costs in theconsolidated statement of income.
This category generally applies to interest-bearing loans and borrowings. As of December 31, 2019and 2018, loans and borrowings consist primarily of deposit liabilities, bills and acceptance payable,accounts payable, accrued expenses and other liabilities (excluding payables to government), leaseliabilities and long-term debt (see Notes 21, 22, 23 and 24).
Derivative Financial Instruments and Hedge AccountingInitial Recognition and Subsequent MeasurementThe Group uses derivative financial instruments, such as cross currency swaps, to hedge its foreigncurrency risks and interest rate risks. Such derivative financial instruments are initially recognized atfair value on the date on which a derivative contract is entered into and are subsequently remeasuredat fair value. Derivatives are carried as financial assets when the fair value is positive and as financialliabilities when the fair value is negative.
For the purpose of hedge accounting, hedges are classified as:
· Fair value hedges when hedging the exposure to changes in the fair value of a recognized asset orliability or an unrecognized firm commitment
· Cash flow hedges when hedging the exposure to variability in cash flows that is either attributableto a particular risk associated with a recognized asset or liability or a highly probable forecasttransaction or the foreign currency risk in an unrecognized firm commitment
· Hedges of a net investment in a foreign operation
At the inception of a hedge relationship, the Group formally designates and documents the hedgerelationship to which the Group wishes to apply hedge accounting and the risk management objectiveand strategy for undertaking the hedge.
The documentation includes identification of the hedging instrument, the hedged item, the nature ofthe risk being hedged and how the Group will assess whether the hedging relationship meets thehedge effectiveness requirements (including the analysis of sources of hedge ineffectiveness and howthe hedge ratio is determined).
- 24 -
*SGVFS039395*
A hedging relationship qualifies for hedge accounting if it meets all of the following effectivenessrequirements:
· There is ‘an economic relationship’ between the hedged item and the hedging instrument.· The effect of credit risk does not ‘dominate the value changes’ that result from that economic
relationship.· The hedge ratio of the hedging relationship is the same as that resulting from the quantity of the
hedged item that the Group actually hedges and the quantity of the hedging instrument that theGroup actually uses to hedge that quantity of hedged item.
Hedges that meet all the qualifying criteria for hedge accounting are accounted for, as describedbelow:
Cash Flow HedgesAs of December 31, 2019 and 2018, the Group has outstanding cross currency swaps, designated as acash flow hedge, that are used to hedge both the changes in foreign currency and interest rateexposures on its USD-denominated bonds payable (see Note 37).
The effective portion of the gain or loss on the hedging instrument is recognized in OCI under Cashflow hedge reserve, while any ineffective portion is recognized immediately in the consolidatedstatement of income as other operating expenses. The cash flow hedge reserve is adjusted to thelower of the cumulative gain or loss on the hedging instrument and the cumulative change in fairvalue of the hedged item.
The Group designated all of the forward contracts as hedging instrument. Any gains or losses arisingfrom changes in the fair value of derivatives were taken directly to profit or loss, except for the effective portion of cash flow hedges, which were recognised in OCI and later reclassified to profit or losswhen the hedge item affects profit or loss.
The Group designates only the spot element of forward contracts as a hedging instrument. Theforward element is recognised in OCI and accumulated in a separate component of equity under costof hedging reserve.
The amounts accumulated in OCI are accounted for, depending on the nature of the underlyinghedged transaction. If the hedged transaction subsequently results in the recognition of a non-financial item, the amount accumulated in equity is removed from the separate component of equityand included in the initial cost or other carrying amount of the hedged asset or liability. This is not areclassification adjustment and will not be recognised in OCI for the period. This also applies wherethe hedged forecast transaction of a non-financial asset or non-financial liability subsequentlybecomes a firm commitment for which fair value hedge accounting is applied.
For any other cash flow hedges, the amount accumulated in OCI is reclassified to profit or loss asa reclassification adjustment in the same period or periods during which the hedged cash flows affectprofit or loss.
If cash flow hedge accounting is discontinued, the amount that has been accumulated in OCI mustremain in accumulated OCI if the hedged future cash flows are still expected to occur. Otherwise, theamount will be immediately reclassified to profit or loss as a reclassification adjustment. Afterdiscontinuation, once the hedged cash flow occurs, any amount remaining in accumulated OCI mustbe accounted for depending on the nature of the underlying transaction as described above.

- 25 -
*SGVFS039395*
Impairment of Financial Assets and Contract Assets (Effective January 1, 2018)The Group recognises an allowance for expected credit losses (ECLs) for all debt instruments notheld at fair value through profit or loss. ECLs are based on the difference between the contractualcash flows due in accordance with the contract and all the cash flows that the Group expects toreceive, discounted at an approximation of the original EIR. The expected cash flows will includecash flows from the sale of collateral held or other credit enhancements that are integral to thecontractual terms.
The Group (Excluding Banking and Financial Services)The Group recognizes an allowance for ECLs for all debt instruments not held at FVPL. ECLs arebased on the difference between the contractual cash flows due in accordance with the contract andall the cash flows that the Group expects to receive, discounted at an approximation of the originalEIR. The expected cash flows will include cash flows from the sale of collateral held or other creditenhancements that are integral to the contractual terms.
The Group applies a simplified approach in calculating ECLs for financial assets at amortized costs.Therefore, the Group does not track changes in credit risk, but instead recognizes a loss allowancebased on lifetime ECLs at each reporting date. The Group has established a provision matrix forother receivables and a vintage analysis for contracts receivable and contract assets that is based on itshistorical credit loss experience, adjusted for forward-looking factors specific to the debtors and theeconomic environment.
The Group considers a financial asset in default when contractual payments are 90 days past due.However, in certain cases, the Group may also consider a financial asset to be in default wheninternal or external information indicates that the Group is unlikely to receive the outstandingcontractual amounts in full before taking into account any credit enhancements held by the Group.A financial asset is written off when there is no reasonable expectation of recovering the contractualcash flows.
Banking and Financial ServicesStaging AssessmentFor non-credit-impaired financial instruments:· Stage 1 is comprised of all non-impaired financial instruments which have not experienced
Significant Increase in Credit Risk (SICR) since initial recognition. The Group recognizes a 12-month ECL for Stage 1 financial instruments.
· Stage 2 is comprised of all non-impaired financial instruments which have experienced SICRsince initial recognition, evidenced by missed payments (for monthly amortizing exposures)and/or the significant increase in the likelihood of default. The Group recognizes a lifetime ECLfor Stage 2 financial instruments.
For credit-impaired financial instruments:· Financial instruments are classified as Stage 3 when there is objective evidence of impairment as
a result of one or more loss events that have occurred after initial recognition with a negativeimpact on the estimated future cash flows of the financial asset. The ECL model requires thatlifetime ECL be recognized for impaired financial instruments.
For the movement of accounts to better stages (i.e. from stage 2 or 3 to stage 1 or 2):· Financial instruments are moved to better stages when there is significant improvement to the
credit risk such that the criteria for assessment of the better stage are met and there is consistentevidence of good behavior by the borrower.

- 26 -
*SGVFS039395*
Financial assets that are credit-impaired on initial recognition are classified as purchased or originatedcredit-impaired assets. These are recorded at fair value at initial recognition and interest income issubsequently recognized based on a credit-adjusted EIR. ECL is only recognized or released to theextent that there is a subsequent change in the ECLs.
Definition of “Default” and “Cure”For the calculations of ECL, the Group defines a financial instrument as in default, which is fullyaligned with the definition of credit impaired, in all cases when the borrower becomes: 1) 91 dayspast due for amortizing exposures; or 2) upon the first missed payment for bullet-payment exposures.As a part of a qualitative assessment of whether a customer is in default, the Group also considers avariety of instances that may indicate likelihood of non-payment when an account is under litigation.When such events occur, the Group carefully considers whether the event should result in treating thecustomer as defaulted. An instrument is considered to be no longer in default (i.e., cured) when it nolonger meets any of the default criteria and there is sufficient evidence to support full collection thrupayments received for at least 6 months.
Credit Risk at Initial RecognitionThe Group has an internal credit assessment process to determine the credit risk of exposures at initialrecognition. The Group has separate models for its key portfolios in which the customers are ratedusing internal grades. The models incorporate both qualitative and quantitative information.
SICRThe Group monitors all assets subject to ECL. In order to determine whether an instrument or aportfolio of instruments is subject to 12-month ECL or lifetime ECL, the Group assesses whetherthere has been a SICR since initial recognition. A set of defined empirical-based rules and expertjudgment that discriminate good and bad credit make up the SICR model. For corporate loans andinvestments to debt-type instruments, accounts are considered to have a SICR if the equivalent PDexceeds the Group’s set threshold. The Group also considers an account to have a SICR ifcontractual payments are more than 30 days past due or the account is considered “watchlist”.
RestructuringIn certain circumstances, the Group modifies the original terms and conditions of a credit exposure tocreate a new loan agreement or payment schedule. The modifications can be given depending on theborrower’s or counterparty’s current or expected financial difficulty. The modifications may include,but are not limited to, change in interest rate and terms, principal amount, maturity date, date andamount of periodic payments and accrual of interest and charges. Accounts subjected to distressedrestructuring with indications of unlikeliness to pay are categorized as impaired accounts and areinitially moved to Stage 3.
Assessment of ECL on a Collective BasisThe Group calculates ECL either on an individual or collective basis. The Group performs collectiveimpairment by grouping exposures into smaller homogenous portfolios based on a combination ofborrower and account characteristics. Accounts with similar attributes (i.e., type of facility) arepooled together for calculating provisions based on the ECL models.
ECL Parameters and MethodologiesECL is a function of the probability of default (PD), exposure at default (EAD) and loss-given default(LGD), with the timing of the loss also considered, and is estimated by incorporating forward-lookingeconomic information and through the use of experienced credit judgment.

- 27 -
*SGVFS039395*
The PD represents the likelihood that a credit exposure will not be repaid and will go into default ineither a 12-month horizon for Stage 1 or within the remaining life of the exposure for Stage 2. ThePD for each individual instrument is modelled based on historical data and is adjusted for currentmarket conditions and reasonable and supportable information about future economic conditions.The Group segmented its credit exposures based on homogenous risk characteristics and developed acorresponding PD methodology for each portfolio. The PD methodology for each relevant portfoliois determined based on the underlying nature or characteristic of the portfolio, behavior of theaccounts and materiality of the segment as compared to the total portfolio.
EAD is modelled on historical data and represents an estimate of the outstanding amount of creditexposure at the time a default may occur. For off-balance sheet and undrawn amounts fromirrevocable committed credit lines, EAD includes an estimate of any further amounts to be drawn atthe time of default (i.e., credit conversion factor). LGD is the amount that may not be recovered inthe event of default and is modelled based on historical cash flow recoveries from collections and thesale of foreclosed assets.
Economic OverlaysThe Group incorporates economic overlays into its assessment of SICR and its measurement of ECL.A broad range of economic overlays are considered as economic inputs, such as Gross DomesticProduct growth, inflation rates, unemployment rates and interest rates. The inputs and models usedfor calculating ECL may not always capture all characteristics of the market at the date of thefinancial statements. To reflect these, quantitative adjustments or overlays are occasionally made astemporary adjustments when such differences are significantly material.
The Group’s loans and receivables consists of different portfolios, such as auto, corporate, credit cardreceivables, mortgage loans, as well as other receivables (e.g., personal, branch, emerging enterpriselending, and Department of Education (DepEd) loans). In compliance with PFRS 9, the Group hasdeveloped ECL parameters and methodologies for each portfolio, using historical data as well asforward-looking inputs and assumptions.
Undrawn Loan CommitmentsUndrawn loan commitments and letters of credit are commitments under which over the duration ofthe commitment, EW is required to provide a loan with pre-specified terms to the customer. Thenominal contractual value of undrawn loan commitments, where the loan agreed to be provided is onmarket terms, are not recorded in the statement of financial position. Starting January 1, 2018, thesecontracts are in the scope of the ECL requirements where EW estimates the expected portion of theundrawn loan commitments that will be drawn over their expected life. The ECL related to financialguarantees and loan commitments without outstanding drawn amounts is recognized in Accountspayable, accrued expenses and other liabilities.
Financial GuaranteesFinancial guarantees are initially recognized at fair value. Subsequent to initial recognition, theGroup’s liability under each financial guarantee is measured at the higher of the amount initiallyrecognized less cumulative amortization recognized in the income statement and the amount ofrelated ECL.
Impairment of Financial Assets (Prior to January 1, 2018)The Group assesses at each reporting date whether a financial asset or group of financial assets isimpaired. A financial asset or a group of financial assets is deemed to be impaired if, and only if,there is objective evidence of impairment as a result of one or more events that has occurred after theinitial recognition of the asset (an incurred ‘loss event’) and that loss event (or events) has an impacton the estimated future cash flows of the financial asset or the group of financial assets that can be
- 28 -
*SGVFS039395*
reliably estimated. Evidence of impairment may include indications that the borrower or a group ofborrowers is experiencing significant financial difficulty, default or delinquency in interest orprincipal payments, the probability that they will enter bankruptcy or other financial reorganizationand where observable data indicate that there is measurable decrease in the estimated future cashflows, such as changes in arrears or economic conditions that correlate with defaults.
For financial assets classified and measured at amortized cost such as cash and cash equivalents,loans and receivables, and investment securities at amortized cost, the Group first assesses whetherobjective evidence of impairment exists individually for financial assets that are individuallysignificant, or collectively for financial assets that are not individually significant. For individuallyassessed financial assets, the amount of the loss is measured as the difference between the asset’scarrying amount and the present value of the estimated future cash flows (excluding future creditlosses that have not been incurred). The present value of the estimated future cash flows isdiscounted at the financial asset’s original EIR. If a loan has a variable interest rate, the discount ratefor measuring any impairment loss is the current EIR, adjusted for the original credit risk premium.The calculation of the present value of the estimated future cash flows of a collateralized financialasset reflects the cash flows that may result from foreclosure less costs for obtaining and selling thecollateral, whether or not foreclosure is probable.
Financial assets that are individually assessed for impairment and for which an impairment loss is, orcontinues to be, recognized are not included in a collective assessment for impairment.
The carrying amount of the asset is reduced through use of an allowance account and the amount ofloss is charged to Provision for impairment and credit losses in the consolidated statement of income.Interest income continues to be recognized based on the original EIR of the asset. Loans, togetherwith the associated allowance accounts, are written off when there is no realistic prospect of futurerecovery and all collateral has been realized. If, in a subsequent year, the amount of the estimatedimpairment loss decreases because of an event occurring after the impairment was recognized, thepreviously recognized impairment loss is reduced by adjusting the allowance account. If a write-offis later recovered, except for credit card receivables, any amounts formerly charged are credited to theProvision for probable losses in the consolidated statement of income. For credit card receivables, ifa write-off is later recovered, any amounts previously charged to Provision for probable losses arecredited to Other income in the consolidated statement of income.
If the Group determines that no objective evidence of impairment exists for individually assessedfinancial asset, whether significant or not, it includes the asset in a group of financial assets withsimilar credit risk characteristics and collectively assesses for impairment. Those characteristics arerelevant to the estimation of future cash flows for groups of such assets by being indicative of thedebtors’ ability to pay all amounts due according to the contractual terms of the assets beingevaluated.
For the purpose of a collective evaluation of impairment, financial assets are grouped on the basis ofcredit risk characteristics such as industry, collateral type, past-due status and term. Future cashflows in a group of financial assets that are collectively evaluated for impairment are estimated on thebasis of historical loss experience for assets with similar credit risk characteristics. Historical lossexperience is adjusted on the basis of current observable data to reflect the effects of currentconditions that did not affect the period on which the historical loss experience is based and toremove the effects of conditions in the historical period that do not exist currently. Estimates ofchanges in future cash flows reflect, and are directionally consistent with changes in relatedobservable data from period to period (such as changes in property prices, payment status, or otherfactors that are indicative of incurred losses of the Group and their magnitude). The methodology
- 29 -
*SGVFS039395*
and assumptions used for estimating future cash flows are reviewed regularly by the Group to reduceany differences between loss estimates and actual loss experience.
Restructured LoansLoan restructuring may involve extending the payment arrangements and the agreement of new loanconditions. Once the terms have been renegotiated, the loan is no longer considered past due.Management continuously reviews restructured loans to ensure that all criteria are met and that futurepayments are likely to occur. The loans continue to be subjected to an individual or collectiveimpairment assessment, calculated using the loan’s original EIR. The difference between therecorded value of the original loan and the present value of the restructured cash flows, discounted atthe original EIR, is recognized in Provision for probable losses in the consolidated statement ofincome.
Derecognition of Financial Assets and Financial LiabilitiesFinancial AssetsA financial asset (or, where applicable, a part of a financial asset or part of a group of similarfinancial assets) is primarily derecognised (i.e., removed from the Group’s consolidated statement offinancial position) when:
· the rights to receive cash flows from the asset have expired;· the Group retains the right to receive cash flows from the asset, but has assumed an obligation to
pay them in full without material delay to a third party under a ‘pass-through’ arrangement; or,· the Group has transferred its rights to receive cash flows from the asset and either (a) has
transferred substantially all the risks and rewards of the asset, or (b) has neither transferred nor retained substantially all risks and rewards of the asset, but has transferred control of the asset.
Where the Group has transferred its rights to receive cash flows from an asset and has neithertransferred nor retained substantially all the risks and rewards of an asset nor transferred control ofthe asset, the asset is recognized to the extent of the Group’s continuing involvement in the asset.
Continuing involvement that takes the form of a guarantee over the transferred asset is measured atthe lower of the original carrying amount of the asset and the maximum amount of consideration thatthe Group could be required to repay.
Financial LiabilitiesA financial liability is derecognized when the obligation under the liability has expired, discharged orcancelled. Where an existing financial liability is replaced by another from the same lender onsubstantially different terms, or the terms of an existing liability are substantially modified, such anexchange or modification is treated as a derecognition of the original liability and the recognition of anew liability, and the difference in the respective carrying amounts is recognized in the consolidatedstatement of income.
Repurchase AgreementsSecurities sold under agreements to repurchase at a specified future date are not derecognized fromthe consolidated statement of financial position. The corresponding cash received, including accruedinterest, is recognized in the consolidated statement of financial position as a loan to the Group,reflecting the economic substance of such transaction.
Offsetting of Financial InstrumentsFinancial assets and financial liabilities are only offset and the net amount reported in theconsolidated statement of financial position when there is a legally enforceable right to offset the

- 30 -
*SGVFS039395*
recognized amounts and the Group intends to either settle on a net basis, or to realize the asset andsettle the liability simultaneously. This is not generally the case with master netting agreements,where the related assets and liabilities are presented at gross in the consolidated statement of financialposition.
Real Estate InventoriesProperty acquired or constructed for sale in the ordinary course of business, rather than to be held forrental or capital appreciation, is classified as real estate inventories and is measured at the lower ofcost and net realizable value (NRV).
Cost includes:
· Land acquisition cost and expenses directly related to acquisition· Amounts paid to contractors for development and construction· Borrowing costs, planning and design costs, costs of site preparation, professional fees, property
transfer taxes, construction overheads and other related costs
NRV is the estimated selling price in the ordinary course of the business, based on market prices atthe reporting date, less estimated costs of completion and the estimated costs of sale.
Real estate inventories also include land and land development which consist of properties to bedeveloped into real estate projects for sale that are carried at the lower of cost and NRV. The cost ofland and land development includes the (a) land acquisition cost, (b) costs incurred relative to theacquisition and transfer of land title in the name of the Group such as transfer taxes and registrationfees, (c) costs incurred on initial development of the raw land in preparation for future projects and(d) borrowing costs. These are transferred to subdivision lots and housing units for sale under Realestate inventories when the project plans and development and construction estimates are completedand the necessary permits are secured.
Hospitality InventoriesInventories consisting substantially of food, beverages and supplies, are valued at the lower of costand NRV. Cost is determined using the moving average method. NRV is the estimated selling pricein the ordinary course of business less estimated costs necessary to make the sale. NRV of suppliesinventory is the estimated current replacement cost. Loss on inventory write-down is recognized aspart of Expenses in the consolidated statement of income.
Coal, Fuel and Spare Parts InventoriesInventories are stated at the lower of cost and NRV. Cost is determined based on weighted averagecost for coal and fuel inventories and by first-in, first-out method for spare parts inventories. NRV isthe estimated current replacement cost. Loss on inventory write-down is recognized as part ofExpenses in the consolidated statement of income.
Sugar and Molasses InventoriesInventories are stated at the lower of cost and NRV. Cost is determined by the weighted averageproduction cost for sugar and, by the moving average method for materials and supplies. NRV is theestimated selling price in the ordinary course of business, less estimated cost of completion andexpenses necessary to consummate the sale. NRV of materials and supplies is the estimated currentreplacement cost. Loss on inventory write-down is recognized as part of Expenses in theconsolidated statement of income.

- 31 -
*SGVFS039395*
Investment PropertiesInvestment properties consist of commercial mall, land, office buildings and other properties held forlong-term rental yields and for capital appreciation. Investment properties are carried at cost lessaccumulated depreciation and any accumulated impairment losses. Land is carried at cost, lessimpairment in value, if any. Initial cost of investment properties consists of any directly attributablecosts of bringing the investment properties to its intended location and working condition, includingborrowing costs.
Foreclosed properties are recorded as Investment properties upon: (a) entry of judgment in case ofjudicial foreclosure; (b) execution of the Sheriff’s Certificate of Sale in case of extra-judicialforeclosure; or (c) notarization of the Deed of Dacion in case of dation in payment (dacion en pago).Subsequent to initial recognition, depreciable investment properties are carried at cost lessaccumulated depreciation and any impairment in value.
Constructions-in-progress are carried at cost (including borrowing costs) and transferred to the relatedinvestment property account when the construction and related activities to prepare the property forits intended use are complete.
Expenses with regard to investment properties are treated as ordinary expenses and are recognizedwhen incurred. Depreciation of investment properties are computed using the straight-line methodover the estimated useful lives of these assets as follows:
YearsBuildings 20-50Building improvements 10-20Furniture, fixtures and machineries 2-5
The useful life and the depreciation method is reviewed periodically to ensure that the period andmethod of depreciation are consistent with the expected pattern of economic benefit from items ofinvestment properties.
Investment property is derecognized when it is either disposed of or permanently withdrawn from useand there is no future economic benefit expected from its disposal or retirement. Any gains or losseson the retirement or disposal of an investment property are recognized in the consolidated statementof income in the year of retirement or disposal.
Transfers are made to investment property when there is a change in use, evidenced by ending ofowner-occupation, commencement of an operating lease to another party or ending of construction ordevelopment. Transfers are made from investment property when there is a change in use, evidencedby commencement of owner-occupation or commencement of development with a view to sell.Transfers between investment property, owner-occupied property and inventories do not change thecarrying amount of the property transferred and they do not change the cost of that property formeasurement or disclosure purposes.
Property, Plant and EquipmentProperty, plant and equipment are stated at cost, net of accumulated depreciation and accumulatedimpairment losses, if any. Such cost includes the cost of replacing part of the property, plant andequipment and borrowing cost for long-term construction projects if the recognition criteria are met.Likewise, when a major inspection is performed, its cost is recognized in the carrying amount ofproperty, plant and equipment as a replacement if the recognition criteria are satisfied. All otherrepair and maintenance costs are recognized in the consolidated statement of income as incurred.

- 32 -
*SGVFS039395*
The separate recognition of significant components of property, plant and equipment depends onwhether these components serve the same purpose as the related items of property, plant andequipment. If the corresponding components do not serve the same purpose, they must be recognizedseparately. If the component parts serve the same purpose, the need to recognize them separatelydepends on whether they have the same structure and the same normal useful life as the othercomponent parts of the asset. If the structure and normal useful life are different, the component partsmust be recognized individually insofar as they comply with the definition of the assets. Accordingly,the cost of acquisition must be allocated to the individual components over their respective usefullives. The depreciation of the component parts must be recognized for each component partseparately. The subsequent expenses for the exchange or replacement of such assets must berecognized as acquisition costs for a separate asset if it meets the asset recognition criteria and aredepreciated over their useful life.
The cost of an item of property, plant and equipment also includes the costs of its dismantling,removal or restoration, the obligation for which an entity incurs as a consequence of installing theitem.
Changes in the measurement of an existing decommissioning, restoration and similar liability thatresult from changes in the estimated timing or amount of the outflow of resources embodyingeconomic benefits required to settle the obligation, or a change in the discount rate, shall beaccounted for as follows:
a. subject to (b), changes in the liability shall be added to, or deducted from, the cost of the relatedasset in the current period.
b. the amount deducted from the cost of the asset shall not exceed its carrying amount. If a decreasein the liability exceeds the carrying amount of the asset, the excess shall be recognizedimmediately in profit or loss.
c. if the adjustment results in an addition to the cost of an asset, the entity shall consider whetherthis is an indication that the new carrying amount of the asset may not be fully recoverable. If itis such an indication, the entity shall test the asset for impairment by estimating its recoverableamount, and shall account for any impairment loss.
The adjusted depreciable amount of the asset is depreciated over its useful life. Once the related assetreached the end of its useful life, all subsequent changes in the liability shall be recognized in profitor loss as they occur.
Construction-in-progress, included in property, plant and equipment, is stated at cost. This includescost of construction and other direct costs. Construction-in-progress is not depreciated until suchtime as the relevant assets are completed and are available for use.
Depreciation is calculated on a straight-line basis over the estimated useful lives of the assets asfollows:
YearsBuildings 20-50Coal thermal power plant 10-30Machinery and equipment 5-20Transportation equipment 5Communication equipment 5Furniture and fixtures 3-5

- 33 -
*SGVFS039395*
Leasehold improvements included under Property, plant and equipment are amortized over the termof the lease or their estimated useful lives (3 to 15 years), whichever is shorter.
The useful life and depreciation and amortization method are reviewed at financial year end to ensurethat the period and method of depreciation and amortization are consistent with the expected patternof economic benefits from items of property, plant and equipment.
An item of property, plant and equipment is derecognized upon disposal or when no future economicbenefits are expected from its use or disposal. Any gain or loss arising on derecognition of the assetis included in the consolidated statement of income in the year the asset is derecognized.
Interests in Joint ArrangementsA joint arrangement may either be a joint venture or a joint operation. A joint venture is a contractualagreement whereby 2 or more parties undertake an economic activity that is subject to joint control.
Joint VentureThe Group’s investments in joint ventures are accounted for using the equity method.
Under the equity method, the investment in a joint venture is initially recognized at cost. Thecarrying amount of the investment is adjusted to recognize changes in the Group’s share of net assetsof the joint venture since the acquisition date. Goodwill relating to the joint venture is included in thecarrying amount of the investment and is neither amortized nor individually tested for impairment.
The consolidated statement of income reflects the Group’s share of the results of operations of thejoint venture. Any change in OCI of those investees is presented as part of the Group’s OCI. Inaddition, when there has been a change recognized directly in the equity of the joint venture, theGroup recognizes its share of any changes, when applicable, in the consolidated statement ofcomprehensive income and consolidated statement of changes in equity. Unrealized gains and lossesresulting from transactions between the Group and the joint venture are eliminated to the extent of theinterest in the joint venture.
The Group recognizes its share of the losses of the joint venture until its share of losses equals orexceeds the carrying value of its investment in joint venture, at which point the Group discontinuesrecognizing its share of further losses. The Group restricts the elimination to the amount required toreduce the investment to zero.
The financial statements of the joint venture are prepared for the same reporting period as the Group.When necessary, adjustments are made to bring the accounting policies in line with those of theGroup.
After application of the equity method, the Group determines whether it is necessary to recognize animpairment loss on its investment in joint venture. At each reporting date, the Group determineswhether there is objective evidence that the investment in joint venture is impaired. If there is suchevidence, the Group calculates the amount of impairment as the difference between the recoverableamount of the investment in joint venture and its carrying value, then recognizes the loss in theconsolidated statement of income.
Upon loss of joint control over the joint venture, the Group measures and recognizes any retainedinvestment at its fair value. Any difference between the carrying amount of the associate or jointventure upon loss of joint control and the fair value of the retained investment and proceeds fromdisposal is recognized in the consolidated statement of income.

- 34 -
*SGVFS039395*
Joint OperationThe Group recognizes in relation to its interest in joint operation its: (a) assets, including its share ofany assets held jointly; (b) liabilities, including its share of any liabilities incurred jointly; (c) revenuefrom sale of its share of the output arising from the joint operation; (d) share of the revenue from thesale of the output by the joint operation; and (e) expenses, including its share of any expenses jointlyincurred.
The Group’s significant investments in joint arrangements include: Chroma Hospitality, Inc. (CHI;60.0%), East West Ageas Life Insurance Corporation (EW Ageas Life; 50.0%), ProfessionalOperations and Maintenance Experts Incorporated (PROMEI; 47.5%) and Filinvest-Hitachi OmniWaterworks, Inc. (FLOW; 60.0%), Filinvest Corporate City (FCC; 74.0%) and South StationTerminal (SST; 49.0%),. Despite the Group’s interest of equal or above 50.0% on the above entities,these are treated as joint arrangements due to existence of contractual arrangements between theparties.
CHI, EW Ageas Life, PROMEI and FLOW are accounted for as joint ventures while FCC and SSTare accounted for as joint operations (see Note 18).
Investment in AssociateAn associate is an entity over which the Group has significant influence. Significant influence is thepower to participate in the financial and operating policy decisions of the investee, but is not controlor joint control over those policies.
The considerations made in determining significant influence are similar to those necessary todetermine control over subsidiaries. The Group’s investment in its associate are accounted for usingthe equity method. Under the equity method, the investment in an associate is initially recognised atcost. The carrying amount of the investment is adjusted to recognise changes in the Group’s share ofnet assets of the associate since the acquisition date.
The consolidated statement of income reflects the Group’s share of the results of operations of theassociate. Any change in OCI of those investees is presented as part of the Group’s OCI. In addition,when there has been a change recognised directly in the equity of the associate, the Group recognizesits share of any changes, when applicable, in the consolidated statement of changes in equity.Unrealised gains and losses resulting from transactions between the Group and the associate areeliminated to the extent of the interest in the associate.
The financial statements of the associate are prepared for the same reporting period as the Group.When necessary, adjustments are made to bring the accounting policies in line with those of theGroup.
After application of the equity method, the Group determines whether it is necessary to recognise animpairment loss on its investment in its associate. At each reporting date, the Group determineswhether there is objective evidence that the investment in the associate is impaired. If there is suchevidence, the Group calculates the amount of impairment as the difference between the recoverableamount of the associate and its carrying value, and then recognises the loss within share of profit ofan associate reported under “Other income” in the consolidated statement of income.
Upon loss of significant influence over the associate, the Group measures and recognizes any retainedinvestment at its fair value. Any difference between the carrying amount of the associate upon loss ofsignificant influence and the fair value of the retained investment and proceeds from disposal isrecognised in profit or loss.

- 35 -
*SGVFS039395*
GoodwillGoodwill acquired in a business combination is initially measured at cost, being the excess of theconsideration transferred over the net fair value of the acquiree’s identifiable assets, liabilities andcontingent liabilities. Following initial recognition, goodwill is measured at cost less anyaccumulated impairment losses.
Other Intangible AssetsIntangible assets include branch licenses, Build-Transfer-Operate (BTO) rights, capitalized software,customer relationship, core deposits and card acquisition cost which are presented under Other assets.Goodwill is separately presented in the consolidated statements of financial position.
Intangible assets acquired separately are measured on initial recognition at costs. The cost ofintangible assets acquired in a business combination or contracted arrangements is their fair value atthe date of acquisition. Following initial recognition, intangible assets, excluding goodwill andbranch licenses, are carried at cost, less any accumulated amortization and any accumulatedimpairment losses. The useful lives of intangible assets are assessed to be either finite or indefinite.
Intangible assets with finite lives are amortized over the economic useful life and assessed forimpairment whenever there is an indication that the intangible assets may be impaired. Theamortization period and the amortization method for an intangible asset with a finite useful life arereviewed at least at each financial year-end. Changes in the expected useful life or the expectedpattern of consumption of future economic benefits embodied in the asset is accounted for bychanging the amortization period or method, as appropriate, and treated as changes in accountingestimates. The amortization expense on intangible assets with finite lives is recognized in theconsolidated statement of income.
Intangible assets with indefinite useful lives are not amortized, but are tested for impairment annuallyor more frequently, either individually or at the CGU level. The assessment of indefinite life isreviewed annually to determine whether the indefinite life continues to be supportable. If not, thechange in useful life from indefinite to finite is made on a prospective basis.
Gains or losses arising from the derecognition of an intangible asset are measured as the differencebetween the net disposal proceeds and the carrying amount of the asset and are recognized in theconsolidated statement of income when the asset is derecognized.
Branch LicensesBranch licenses are determined to have indefinite useful lives. These are tested for impairmentannually either individually or at the CGU level. Such intangibles are not amortized. The useful lifeis reviewed annually to determine whether indefinite useful life assessment continues to besupportable. If not, the change in the useful life assessment from indefinite to finite is made on aprospective basis.
BTO RightsBTO rights pertain to the cost related to the Build, Transfer and Operate agreements entered into bythe Group. The rights provided under the BTO agreements are carried at cost less accumulatedamortization, and impairment loss, if any. This is amortized using the straight-line method over theterm of the BTO agreement (i.e., 25 years) upon conveyance of right to operate and assessed forimpairment whether there is an indication that the asset may be impaired. The amortization periodand method are reviewed at least each reporting date.

- 36 -
*SGVFS039395*
Capitalized SoftwareCapitalized software, included in Other assets, as acquired separately is measured at cost on initialrecognition. Following initial recognition, capitalized software is carried at cost less accumulatedamortization and any accumulated impairment losses. The capitalized software is amortized on astraight-line basis over its estimated useful life of five (5) to 10 years.
Customer Relationship and Core DepositCustomer relationship and core deposit included under Other assets account are intangible assetsacquired by the Group through business combination. These intangible assets are initially measuredat their fair value at the date of acquisition. The fair value of these intangible assets reflectsexpectations about the probability that the expected future economic benefits embodied in the assetwill flow to the Group.
Following initial recognition, customer relationship and core deposits are measured at cost lessaccumulated amortization and any accumulated impairment losses. Customer relationship related tothe credit cards business is amortized on a straight-line basis over its useful life of 40 years while thecustomer relationship related to the auto loans business and core deposits are amortized on a straight-line basis over its useful life of 13 and 10 years, respectively.
Card Acquisition CostsCard acquisition costs represent capitalized commissions paid to third-party brokers for successfullyoriginated credit card accounts, which are amortized over two (2) years, the average relationship lifewith customers.
Repossessed AssetsRepossessed assets comprise of repossessed vehicles which are measured at cost less accumulateddepreciation and impairment. Depreciation is calculated on a straight-line basis using the remaininguseful life from the time of acquisition of the asset. The useful life of other repossessed assets isestimated to be 5 years.
Biological AssetsThe Group’s biological assets included in the Other assets account consist of sugarcane crops. Thecosts of planting, fertilizers and other maintenance costs incurred for the sugarcane plantations priorto harvest are capitalized to biological assets and are charged to operations as the sugarcane areharvested. Biological assets are carried at cost less any significant and apparent permanent decline invalue.
The Group’s biological assets are measured at their fair value. The Group uses the future sellingprice and gross margin of finished goods less future growing costs applied to the estimated volume ofharvest as the basis of fair value.
Impairment of Nonfinancial AssetsThe carrying values of investment properties, property, plant and equipment, ROU and othernonfinancial assets are reviewed for impairment when events or changes in circumstances indicate thecarrying values may not be recoverable.
If any such indication exists and where the carrying values exceed the estimated recoverable amounts,the assets or cash-generating units are written down to their recoverable amounts. The recoverableamount of the asset is the greater of fair value less cost of disposal and value in use (VIU). Inassessing VIU, the estimated future cash flows are discounted to their present value using a pre-taxdiscount rate that reflects current market assessment of the time value of money and the risks specificto the asset. For an asset that does not generate largely independent cash inflows, the recoverable

- 37 -
*SGVFS039395*
amount is determined for the CGU to which the asset belongs. Impairment losses are recognized inthe consolidated statement of income.
A previously recognized impairment loss is reversed only if there has been a change in the estimatesused to determine the asset’s recoverable amount since the last impairment loss was recognized. Thecarrying amount of the asset is increased to its recoverable amount but the amount cannot exceed thecarrying amount that would have been determined, net of depreciation, had no impairment loss beenrecognized for the asset in prior years. Such reversal is recognized in the consolidated statement ofincome. After such a reversal, the depreciation and amortization expense is adjusted in future yearsto allocate the asset’s revised carrying amount, less any residual value, on a systematic basis over itsremaining life.
The following criteria are also applied in assessing impairment of specific assets:
Property, Plant and Equipment, Investment Properties and ROUThe carrying values of property, plant and equipment, investment properties and ROU are reviewedfor impairment when events or changes in circumstances indicate the carrying values may not berecoverable. If such indication exists and where the carrying values exceed the estimated recoverableamounts, the assets are written down to their recoverable amount.
GoodwillGoodwill is reviewed for impairment, annually or more frequently if events or changes incircumstances indicate that the carrying value may be impaired. Impairment is determined forgoodwill by assessing the recoverable amount of the CGU (or group of CGUs) to which the goodwillrelates. Where the recoverable amount of the CGU (or group of CGUs) is less than the carryingamount of the CGU (or group of CGUs) to which goodwill has been allocated, an impairment loss isrecognized immediately in the consolidated statement of income. Impairment losses relating togoodwill cannot be reversed for subsequent increases in its recoverable amount in future periods.
Branch LicensesBranch licenses are tested for impairment annually at the statement of financial position date eitherindividually or at the CGU level, as appropriate.
Other Intangible AssetsOther intangible assets such as customer relationship, core deposits, capitalized software, BTO rights,card acquisition costs and development rights are assessed for impairment whenever there is anindication that it may be impaired.
EquityCapital Stock and Additional Paid-in Capital (APIC)Capital stock is measured at par value for all shares issued. When the Group issues more than oneclass of stock, a separate account is maintained for each class of stock and the number of sharesissued.
When the shares are issued at a premium, the difference between the proceeds and the par value iscredited to APIC account. When shares are issued for a consideration other than cash, the proceedsare measured by the fair value of the consideration received.
Direct cost incurred related to the equity issuance, such as underwriting, accounting and legal fees,printing costs and taxes are charged to APIC account. In the absence of APIC, such direct costs aretreated as Other equity reserve.

- 38 -
*SGVFS039395*
Retained EarningsRetained earnings represent accumulated earnings of the Group, and any other adjustments to it asrequired by other standards, less dividends declared. The individual accumulated earnings of thesubsidiaries and joint ventures are available for dividend declaration when these are declared asdividends by the subsidiaries as approved by their respective BOD.
Dividends on common shares are deducted from retained earnings when declared and approved bythe BOD or shareholders of the Parent Company. Dividends payable are recorded as liability untilpaid. Dividends for the year that are declared and approved after the reporting date, if any, are dealtwith as an event after the reporting date and disclosed accordingly.
Treasury SharesReacquired own equity instruments are carried at cost and are deducted from consolidated equity. Nogain or loss is recognized in profit or loss on the purchase, sale, issue or cancellation of the Group’sown equity instruments. When the shares are retired, the capital stock account is reduced by its parvalue and excess of cost over par value upon retirement is charged to APIC to the extent of thespecific or average APIC when the shares were issued and to retained earnings for the remainingbalance.
Revenue Recognition (Effective January 1, 2018)Revenue from Contract with CustomersThe Group is in the business of providing banking and financial services, power supply andhospitality services. The Group is also in the business of selling real estate development projects andsugar.
Revenue from contracts with customers is recognized when control of the goods or services aretransferred to the customer at an amount that reflects the consideration to which the Group expects tobe entitled to in exchange for those goods or services. The Group has generally concluded that it isthe principal in its revenue arrangements (except when otherwise stated) because it typically controlsthe goods or services before transferring them to the customer.
The disclosures of significant accounting judgements, estimates and assumptions relating to revenuefrom contracts with customers are provided in Note 3.
The following specific recognition criteria must also be met before revenue or income is recognized:
a. Real Estate Operations
Revenue from Contracts with CustomersIn September 2019, the PIC issued additional guidance to the real estate industry on theimplementation of PFRS 15, including guidance on the recording of the difference between theconsideration received from the customer and the transferred goods to the customer (ie, measuredbased on percentage-of-completion or “POC”). The PIC allowed real estate companies torecognize the difference as either a contract asset or unbilled receivable. If presented as acontract asset, the disclosures required under PFRS 15 should be complied with. Otherwise, thedisclosures required under PFRS 9 should be provided.
The Group opted to retain its existing policy of recording the difference between theconsideration received from the customer and the transferred goods to the customer as contractasset.

- 39 -
*SGVFS039395*
On February 14, 2018, the PIC issued PIC Q&A 2018-12 (PIC Q&A) which provides guidanceon some implementation issues of PFRS 15 affecting mostly the real estate industry. OnOctober 25, 2018 and February 8, 2019, the SEC issued SEC MC No. 14 Series of 2018 and SECMC No. 3 Series of 2019, respectively, providing relief to the real estate industry by deferring theapplication of the following provisions of the above PIC Q&A for a period of 3 years untilDecember 31, 2020.
a. Exclusion of land and uninstalled materials in the determination of POC as discussed in PICQ&A No. 2018-12-E
b. Accounting for significant financing component as discussed in PIC Q&A No. 2018-12-Dc. Accounting for Common Usage Service Area (CUSA) Charges as discussed in PIC Q&A No.
2018-12-H
Under the same SEC MC No. 3 Series of 2019, the adoption of PIC Q&A No. 2018-14: PFRS 15- Accounting for Cancellation of Real Estate Sales was also deferred until December 31, 2020.
Except for the CUSA charges discussed under PIC Q&A No. 2018-12-H which applies to leasingtransactions, the remaining deferrals will only be applicable to real estate sales.
The SEC MCs also provided the mandatory disclosure requirements should anentity decide to avail of any relief. Disclosures should include:a. The accounting policies applied.b. Discussion of the deferral of the subject implementation issues in the PIC Q&A.c. Qualitative discussion of the impact in the consolidated financial statements had the
concerned application guideline in the PIC Q&A been adopted.d. Should any of the deferral options result into a change in accounting policy (e.g., when an
entity excludes land and/or uninstalled materials in the POC calculation under the previousstandard but opted to include such components under the relief provided by the circular),such accounting change will have to be accounted for under PAS 8, i.e., retrospectively,together with the corresponding required quantitative disclosures.
Effective January 1, 2021, real estate companies will adopt PIC Q&A No. 2018-12 and PIC Q&ANo. 2018-14 and any subsequent amendments thereof, retrospectively or as the SEC will laterprescribe.
Sale of Subdivision Lots and Housing Units, and Condominium Units· Revenue from Sale of Subdivision Lots and Housing Units, and Condominium Units
The Group derives its real estate revenue from sale of lots, house and lot and condominiumunits. Revenue from the sale of these real estate projects under pre-completion stage arerecognized over time during the construction period (or POC) since based on the terms andconditions of its contract with the buyers, the Group’s performance does not create an assetwith an alternative use and the Group has an enforceable right to payment for performancecompleted to date.
In measuring the progress of its performance obligation over time, the Group uses outputmethod. The Group recognizes revenue on the basis of direct measurements of the value tocustomers of the goods or services transferred to date, relative to the remaining goods orservices promised under the contract. Progress is measured using survey of performancecompleted to date.

- 40 -
*SGVFS039395*
This is based on the project accomplishment reports prepared by the third party projectmanagers for high-rise real estate developments and internal project engineers for mid-risereal estate development as approved by the project technical head which integrates thesurveys of performance to date of the construction activities of subcontractors.
Any excess of progress of work over the right to an amount of consideration that isunconditional, recognized as installment contract receivables, under Loans and receivables, isincluded in the Contract assets account in the asset section of the consolidated statement offinancial position.
Any excess of collections over the total of recognized installment contract receivables isincluded in the Contract liabilities account in the liabilities section of the consolidatedstatement of financial position.
· Cost of Sale of Subdivision Lots and Housing Units, and Condominium UnitsThe Group recognizes costs relating to satisfied performance obligations as these are incurredtaking into consideration the contract fulfillment assets such as land and connection fees.These include costs of land, land development costs, building costs, professional fees,depreciation, permits and licenses and capitalized borrowing costs. These costs are allocatedto the saleable area, with the portion allocable to the sold area being recognized as costs ofsales while the portion allocable to the unsold area being recognized as part of real estateinventories.
In addition, the Group recognizes as an asset only costs that give rise to resources that will beused in satisfying performance obligations in the future and that are expected to be recovered.
Mall and Rental RevenuesRent income from investment properties is recognized in the consolidated statement of incomeeither on a straight-line basis over the lease term, or based on a certain percentage of the grossrevenue of tenants, pursuant to the terms of the lease contracts. Leases under contingent rents arerecognized as income in the period in which they are earned.
Theater and Snack Bar Sales (included as part of ‘Mall and rental revenues’)Revenue from theater sales is recognized over time using output method when theater services arerendered. Revenue from snack bar sales is recognized at a point in time when goods are actuallysold to customers.
Income from Forfeited Reservations and CollectionsIncome from forfeited reservation and collections is recognized when the deposits from potentialbuyers are deemed nonrefundable due to prescription of the period for entering into a contractedsale. Such income is also recognized, subject to the provisions of Republic Act (RA) 6552,Realty Installment Buyer Act, upon prescription of the period for the payment of requiredamortizations from defaulting buyers.
Interest IncomeInterest income is recognized as the interest accrues taking into account the effective yield on theunderlying assets.
Dividend IncomeDividend income is recognized when the Group’s right to receive payment is established.

- 41 -
*SGVFS039395*
Other IncomeIncome from sale of services is recognized upon rendition of the service. Income from sale ofgoods is recognized upon completion of the earning process and the collectability of the salesprice is reasonably assured.
b. Hospitality Operations
Hospitality RevenuesHospitality revenues consist of revenue from room related services, sale of food and beverage,gift and souvenirs, golf operations and other operating departments. These are accounted for asfollows:· Revenue from sale of food and beverage, and gift shop is recognized at a point in time upon
delivery of the goods.· Revenue from rooms and/or golf operations is recognized over time as the related services are
rendered and/or facilities and amenities are used.· Revenue from other operating departments is recognized over time as the related services are
rendered.
Other IncomeOther income of hospitality operations consist of interest income and share in net earnings of ajoint venture which are recognized as the related income accrues.
c. Financial and Banking Services
Interest IncomeFor all financial instruments measured at amortized cost, debt instruments classified as financialassets at FVOCI and interest-bearing financial assets at FVPL, interest income is recorded at theEIR, which is the rate that exactly discounts estimated future cash payments or receipts throughthe expected life of the financial instrument or a shorter period, where appropriate, to the netcarrying amount of the financial asset or financial liability. The calculation takes into account allcontractual terms of the financial instrument (for example, prepayment options) and includes anyfees or incremental costs that are directly attributable to the instrument and are an integral part ofthe EIR, but not future credit losses. The adjusted carrying amount is calculated based on theoriginal EIR. The change in the carrying amount is recorded as interest income. Once therecorded value of a financial asset or group of similar financial assets has been reduced due to animpairment loss, interest income continues to be recognized using the original EIR applied to thenew carrying amount.
Under PFRS 9, when a financial asset becomes credit-impaired and is, therefore, regarded asStage 3, interest income is calculated by applying the EIR to the net amortized cost of thefinancial asset. If the financial asset cures and is no longer credit-impaired, the Group reverts tocalculating interest income on a gross basis. Under PAS 39, once the recorded value of afinancial asset or group of similar financial assets carried at amortized cost has been reduced dueto an impairment loss, interest income continues to be recognized using the original EIR appliedto the new carrying amount.
Service Charges and PenaltiesService charges and penalties earned over a period of time are accrued over that period as thecustomer simultaneously receives and consumes the benefits provided by the Group. Servicecharges and penalties are measured at the amount of consideration to which the Group expects to
- 42 -
*SGVFS039395*
be entitled in exchange for transferring promised services to a customer and excludes amountscollected on behalf of third parties.
Fee and Commission IncomeThe Group earns fee and commission income from a diverse range of services it provides to itscustomers. Fee income can be divided into the following categories:· Fee Income Earned from Services that are Provided Over a Certain Period of Time
Fees earned for the provision of services over a period of time are accrued over that period asthe customer simultaneously receives and consumes the benefits provided by the Group.These fees include commission income, fiduciary fees and credit related fees.
· Fee Income from Providing Transaction ServicesFees arising from negotiating or participating in the negotiation of a transaction for a thirdparty are recognized on completion of the underlying transaction. Fees or components of feesthat are linked to a certain performance are recognized after fulfilling the correspondingcriteria. Loan syndication fees are recognized in the consolidated statement of income whenthe syndication has been completed and the Group retains no part of the loans for itself orretains part at the same EIR as for the other participants.
· Bancassurance FeesNon-refundable fees are recognized on a straight-line basis over the term of the distributionagreement. Fees that are linked to a certain performance are recognized after fulfilling thecorresponding criteria.
Dividend IncomeDividend income is recognized when the Group’s right to receive payment is established.
Trading and Securities Gains and LossesTrading and securities gain represents results arising from trading activities including all gainsand losses from changes in fair value of financial assets and financial liabilities held for trading.
Commissions Earned on Credit CardsCommissions earned on credit cards are taken up as income upon receipt from memberestablishments of charges arising from credit availments by credit cardholders. Thesecommissions are computed based on certain agreed rates and are deducted from amountsremittable to member establishments.
Purchases by credit cardholders, collectible on an installment basis, are recorded at the cost of theitems purchased plus certain percentage of cost. The excess over cost is credited to Unearneddiscount and is shown as a deduction from Loans and receivables in the consolidated statement offinancial position.
The unearned discount is taken to income over the installment terms and is computed using theEIR method.
Customer Loyalty ProgrammesAward credits under customer loyalty programmes are accounted for as a separately identifiablecomponent of the transaction in which they are granted. The fair value of the considerationreceived in respect of the initial sale is allocated between the award credits and the othercomponents of the sale. Income generated from customer loyalty programmes is recognized aspart of Service charges, fees and commissions in the consolidated statement of income.

- 43 -
*SGVFS039395*
Gain on Sale of AssetsIncome from sale of assets include any gains or losses on the retirement or disposal of investmentproperties and property and equipment. The gain or loss arising from the derecognition isrecognized in the consolidated statement of income in the year of retirement or disposal.
Other IncomeIncome from sale of services or properties is recognized when the control of such services orproperties are transferred to the customer at an amount that reflects the consideration to which theGroup expects to be entitled to in exchange for those goods or services.
d. Power Operations
Power RevenuesPower revenues consist of power revenue from generation and from sale of retail electricity.Revenue is recognized overtime using output method in the period actual capacity is generatedsince the customer consumes the benefit from the performance of the related dispatched ofenergy.
As a practical expedient allowed under PFRS 15, the Group recognizes power revenue in theamount to which the Group has a right to invoice since the Group bills a fixed amount for everyMW of electricity delivered. The transaction price allocated to the remaining performanceobligation is not separately disclosed as the Group recognizes revenue from the satisfaction of theperformance obligation in the amount to which the Group has a right to invoice.
Some contracts with customers provide unspecified quantity of energy, includes provisionalEnergy Regulation Commission (ERC) rates, and volume and prompt payment discounts thatgive rise to variable consideration. The variable consideration is estimated at contract inceptionand constrained until the associated uncertainty is subsequently resolved.
Interest IncomeInterest income is recognized as the interest accrues taking into account the effective yield on theunderlying assets.
Other IncomeIncome from sale of services is recognized upon rendition of the service. Income from sale ofgoods are recognized upon completion of the earning process and the collectability of the salesprice is reasonably assured.
e. Sugar Operations
Sugar SalesRevenue from sale of sugar and molasses is recognized at the point when control of the goods istransferred to the customer through the endorsement of quedans or physical delivery of the goods.
Milling RevenueMilling revenues pertain to the income from milling and conversion of the planters’ and otherthird party’s raw sugar into refined sugar. Income is recognized when the related services arerendered.
Interest IncomeInterest income is recognized as the interest accrues taking into account the effective yield on theunderlying assets.

- 44 -
*SGVFS039395*
Other IncomeOther income includes tolling income, conversion rights income, fertilizer assistance income andstorage fees and handling income. Other income is recognized when the related services arerendered and the collectability of the sales price or charges is reasonably assured.
Contract Balances (Effective January 1, 2018)ReceivablesA receivable represents the Group’s right to an amount of consideration that is unconditional(i.e., only the passage of time is required before payment of the consideration is due).
Contract AssetsA contract asset is the right to consideration in exchange for goods or services transferred to thecustomer. If the Group performs by transferring goods or services to a customer before the customerpays consideration or before payment is due, a contract asset is recognized for the earnedconsideration that is conditional.
Contract LiabilitiesA contract liability is the obligation to transfer goods or services to a customer for which the Grouphas received consideration (or an amount of consideration is due) from the customer. If a customerpays consideration before the Group transfers goods or services to the customer, a contract liability isrecognized when the payment is made or the payment is due (whichever is earlier). Contractliabilities are recognized as revenue when the Group performs under the contract.
The contract liabilities also include payments received by the Group from the customers for whichrevenue recognition has not yet commenced.
Costs to Obtain Contract (Commission Expenses)The incremental costs of obtaining a contract with a customer are recognized as an asset if the Groupexpects to recover them. The Group has determined that commissions paid to brokers and marketingagents on the sale of pre-completed real estate units are deferred when recovery is reasonablyexpected and are charged to expense in the period in which the related revenue is recognized asearned. Commission expense determined under the POC method is included in the Expenses accountin the consolidated statement of income.
Costs incurred prior to obtaining contract with customer are not capitalized but are expensed asincurred.
Contract Fulfillment AssetsContract fulfillment costs are divided into: (i) costs that give rise to an asset; and (ii) costs that areexpensed as incurred. When determining the appropriate accounting treatment for such costs, theGroup firstly considers any other applicable standards. If those standards preclude capitalization of aparticular cost, then an asset is not recognized under PFRS 15.
If other standards are not applicable to contract fulfillment costs, the Group applies the followingcriteria which, if met, result in capitalization: (i) the costs directly relate to a contract or to aspecifically identifiable anticipated contract; (ii) the costs generate or enhance resources of the entitythat will be used in satisfying (or in continuing to satisfy) performance obligations in the future; and(iii) the costs are expected to be recovered. The assessment of this criteria requires the application ofjudgement, in particular when considering if costs generate or enhance resources to be used to satisfyfuture performance obligations and whether costs are expected to be recoverable.
The Group’s contract fulfillment assets pertain to land acquisition costs.

- 45 -
*SGVFS039395*
Amortization, De-recognition and Impairment of Contract Fulfillment Assets and Capitalized Costs toObtain a ContractIncremental costs of obtaining a contract and certain costs to fulfil a contract is required to berecognized as an asset if certain criteria are met. Any capitalized contract costs assets must beamortized on a systematic basis that is consistent with the Group’s transfer of the related goods orservices to the customer.
For real estate operations, the Group amortizes contract fulfillment assets and capitalized costs toobtain a contract over the expected construction period using POC following the pattern of real estaterevenue recognition. The amortization of contract fulfillment assets and cost to a obtain contract isincluded within Cost and Expenses, respectively.
A contract fulfillment asset or capitalized costs to obtain a contract is derecognized either when it isdisposed of or when no further economic benefits are expected to flow from its use or disposal.
At each reporting date, the Group determines whether there is an indication that the contractfulfillment asset or capitalized cost to obtain a contract maybe impaired. If such indication exists, theGroup makes an estimate by comparing the carrying amount of the assets to the remaining amount ofconsideration that the Group expects to receive less the costs that relate to providing services underthe relevant contract. In determining the estimated amount of consideration, the Group uses the sameprinciples as it does to determine the contract transaction price, except that any constraints used toreduce the transaction price will be removed for the impairment test.
Where the relevant costs or specific performance obligations are demonstrating marginal profitabilityor other indicators of impairment, judgement is required in ascertaining whether or not the futureeconomic benefits from these contracts are sufficient to recover these assets. In performing thisimpairment assessment, management is required to make an assessment of the costs to complete thecontract. The ability to accurately forecast such costs involves estimates around cost savings to beachieved over time, anticipated profitability of the contract, as well as future performance against anycontract-specific performance indicators that could trigger variable consideration, or service credits.Where a contract is anticipated to make a loss, there judgements are also relevant in determiningwhether or not an onerous contract provision is required and how this is to be measured.
Revenue Recognition (Prior to January 1, 2018)Revenue is recognized to the extent that it is probable that the economic benefits associated withtransaction will flow to the Group and the amount can be reliably measured. The Group assesses itsrevenue arrangements against specific criteria in order to determine if it is acting as principal or agent.In arrangements where the Group is acting as principal to its customers, revenue is recognized on agross basis. However, when the Group is acting as an agent to its customers, only the amount of netcommission retained is recognized as revenue.
The following specific recognition criteria must also be met before revenue or income is recognized:
a. Real Estate Operations
Sale of Subdivision Lots and Housing Units, and Condominium Units· Revenue
Revenue from sales of substantially completed residential and housing projects wherecollectability of sales price is reasonably assured is accounted for using the full accrualmethod. Sale of condominium units are accounted for under the POC method where theGroup has material obligations to complete the development of the condominium project.

- 46 -
*SGVFS039395*
Under this method, revenue is recognized as the related obligations are fulfilled, measuredprincipally on the basis of the estimated completion of a physical proportion of the contractwork.
Revenue from sale of condominium units are recognized using the POC when (a) the criteriaof percentage of collection over the total selling price is met; (b) the project is beyondpreliminary stage (i.e., engineering, design work, construction contract execution, siteclearance and preparation, excavation and the building foundation are finished); and, (c) theproject has license to sell.
When conditions for recognizing revenue are not yet met, collections are reported as depositincluded in Accounts payable, accrued expenses and other liabilities in the consolidatedstatement of financial position.
Any excess of collections over the recognized receivables are included in the Accountspayable, accrued expenses and other liabilities account in the consolidated statement offinancial position.
· CostCost of sale of subdivision lots and housing units, and condominium units is recognizedconsistent with the revenue recognition method applied. Cost of subdivision lots andresidential housing units and condominium units sold before the completion of thedevelopment is determined on the basis of the acquisition cost of the land and its fulldevelopment costs, which include estimated costs to complete development works, asdetermined by the Group’s in-house technical staff.
The cost of inventory recognized in profit or loss on disposal is determined with reference tothe specific costs incurred on the property, allocated to saleable area based on relative sizeand takes into account the POC used for revenue recognition purposes.
Mall and Rental RevenuesRent income from investment properties is recognized in the consolidated statement of incomeeither on a straight-line basis over the lease term, or based on a certain percentage of the grossrevenue of tenants, pursuant to the terms of the lease contracts. Leases under contingent rents arerecognized as income in the period in which they are earned.
Theater and Snack Bar Sales (included as part of Mall and rental revenues)Revenue from theater sales is recognized when theater services are completed and consumed.Revenue from food and beverage sale is recognized when goods are actually sold to customers.
Income from Forfeited Reservations and CollectionsIncome from forfeited reservation and collections is recognized when the deposits from potentialbuyers are deemed nonrefundable due to prescription of the period for entering into a contractedsale. Such income is also recognized, subject to the provisions of RA 6552, Realty InstallmentBuyer Act, upon prescription of the period for the payment of required amortizations fromdefaulting buyers.
Interest IncomeInterest income is recognized as the interest accrues taking into account the effective yield on theunderlying assets.

- 47 -
*SGVFS039395*
Dividend IncomeDividend income is recognized when the Group’s right to receive payment is established.
Other IncomeIncome from sale of services is recognized upon rendition of the service. Income from sale ofgoods is recognized upon completion of the earning process and the collectability of the salesprice is reasonably assured.
b. Hospitality Operations
Hospitality revenues consist of revenue from room related services, sale of food and beverage,golf operations and other operating departments. These are accounted for as follows:· Revenue from sale of food and beverage is recognized when served.· Revenue from rooms and/or golf operations is recognized when the related services are
rendered and/or facilities and amenities are used.· Revenue from other operating departments is recognized when services are rendered.
Other IncomeOther income of hospitality operations consist of interest income and share in net earnings of ajoint venture which are recognized as the related income accrues.
c. Banking and Financial Services
Interest IncomeFor all financial instruments measured at amortized cost and interest-bearing financialinstruments classified as FVPL, interest income is recorded at the EIR, which is the rate thatexactly discounts estimated future cash payments or receipts through the expected life of thefinancial instrument or a shorter period, where appropriate, to the net carrying amount of thefinancial asset or financial liability. The calculation takes into account all contractual terms of thefinancial instrument (for example, prepayment options), includes any fees or incremental coststhat are directly attributable to the instrument and are an integral part of the EIR, but not futurecredit losses. The adjusted carrying amount is calculated based on the original EIR. The changein carrying amount is recorded as interest income. Once the recorded value of a financial asset orgroup of similar financial assets has been reduced due to an impairment loss, interest incomecontinues to be recognized using the original EIR applied to the new carrying amount.
Service Charges and PenaltiesService charges and penalties are recognized only upon collection or accrued when there is areasonable degree of certainty as to its collectibility.
Fee and Commission IncomeThe Group earns fee and commission income from a diverse range of services it provides to itscustomers. Fee income can be divided into the following categories:
· Fee Income Earned from Services that are Provided Over a Certain Period of TimeFees earned for the provision of services over a period of time are accrued over that period.These fees include investment fund fees, custodian fees, fiduciary fees, commission incomeand credit related fees.

- 48 -
*SGVFS039395*
· Fee Income from Providing Transaction ServicesFees arising from negotiating or participating in the negotiation of a transaction for a thirdparty are recognized on completion of the underlying transaction. Fees or components of feesthat are linked to a certain performance are recognized after fulfilling the correspondingcriteria. Loan syndication fees are recognized in the consolidated statement of income whenthe syndication has been completed and the Group retains no part of the loans for itself orretains part at the same EIR as for the other participants.
· Bancassurance FeesNon-refundable fees are recognized on a straight-line bases over the term of the distributionagreement. Fees that are linked to a certain performance are recognized after fulfilling thecorresponding criteria.
Trading and Securities Gains (Losses) - NetTrading and securities gain (loss) represents results arising from trading activities including allgains and losses from changes in fair value for financial assets and financial liabilities held fortrading.
Commissions Earned on Credit CardsCommissions earned on credit cards are taken up as income upon receipt from memberestablishments of charges arising from credit availments by credit cardholders. Thesecommissions are computed based on certain agreed rates and are deducted from amountsremittable to member establishments.
Purchases by credit cardholders, collectible on an installment basis, are recorded at the cost of theitems purchased plus a certain percentage of cost. The excess over cost is credited to Unearneddiscount and is shown as a deduction from Loans and receivables in the consolidated statement offinancial position.
The unearned discount is taken up to income over the installment terms and is computed usingthe EIR method.
Customer Loyalty ProgrammesAward credits under customer loyalty programmes are accounted for as a separately identifiablecomponent of the transaction in which they are granted. The fair value of the considerationreceived in respect of the initial sale is allocated between the award credits and the othercomponents of the sale. Income generated from customer loyalty programmes is recognized aspart of Service charges, penalties, fees and commissions in the consolidated statement of income.
Other IncomeIncome from sale of services is recognized upon rendition of the service. Income from sale ofproperties is recognized upon completion of the earning process and the collectability of the salesprice is reasonably assured. Other income includes service charges, penalties, fees, recovery ofwritten-off assets and miscellaneous income.
d. Power Operations
Power RevenuesRevenue from power operations is recognized in the period when actual capacity is generated andtransmitted to the customers, net of related discounts.

- 49 -
*SGVFS039395*
Interest IncomeInterest income is recognized as the interest accrues taking into account the effective yield on theunderlying assets.
Other IncomeIncome from sale of services is recognized upon rendition of the service. Income from sale ofgoods is recognized upon completion of the earning process and the collectability of the salesprice is reasonably assured.
e. Sugar Operations
Sugar SalesSale is recognized when title to the goods has passed to the buyer through the endorsement ofquedans or physical delivery of the goods.
Tolling FeesTolling fees pertain to the income from milling and conversion of the planters’ and other thirdparty’s raw sugar into refined sugar. Income is recognized when the related services arerendered.
Interest IncomeInterest income is recognized as the interest accrues taking into account the effective yield on theunderlying assets.
Other IncomeOther income includes conversion rights income, fertilizer assistance income and storage fees andhandling income. Other income is recognized when the related services are rendered and thecollectability of the sales price or charges is reasonably assured.
Cost and Expense RecognitionCost and expenses are recognized in the consolidated statement of income when decrease in futureeconomic benefit related to a decrease in an asset or an increase in a liability has arisen that can bemeasured reliably. Cost and expenses are recognized in the consolidated statement of income:
· On the basis of a direct association between the costs incurred and the earning of specific items ofincome;
· On the basis of systematic and rational allocation procedures when economic benefits areexpected to arise over several accounting periods and the association can only be broadly orindirectly determined; or,
· Immediately when expenditure produces no future economic benefits or when, and to the extentthat, future economic benefits do not qualify or cease to qualify, for recognition in theconsolidated statement of financial position as an asset.
Retirement CostsThe net defined benefit liability or asset is the aggregate of the present value of the defined benefitobligation at the end of the reporting period reduced by the fair value of plan assets (if any), adjustedfor any effect of limiting a net defined benefit asset to the asset ceiling. The asset ceiling is thepresent value of any economic benefits available in the form of refunds from the plan or reductions infuture contributions to the plan.
The cost of providing benefits under the defined benefit plans is actuarially determined using theprojected unit credit method.

- 50 -
*SGVFS039395*
Defined benefit costs is comprise of the following:· Service cost· Net interest on the net defined benefit liability or asset· Remeasurements of net defined benefit liability or asset
Service costs which include current service costs, past service costs and gains or losses on non-routine settlements are recognized as expense in profit or loss. Past service costs are recognizedwhen plan amendment or curtailment occurs.
Net interest on the net defined benefit liability or asset is the change during the period in the netdefined benefit liability or asset that arises from the passage of time which is determined by applyingthe discount rate based on government bonds to the net defined benefit liability or asset. Net intereston the net defined benefit liability or asset is recognized as expense or income in the consolidatedstatement of income.
Remeasurements comprising actuarial gains and losses, return on plan assets and any change in theeffect of the asset ceiling (excluding net interest on defined benefit liability) are recognizedimmediately in OCI in the period in which they arise. Remeasurements are not reclassified to profitor loss in subsequent periods. All remeasurements recognized in OCI account Remeasurement gains(losses) on retirement plans are not reclassified to consolidated statement of income in subsequentperiods.
Plan assets are assets that are held by a long-term employee benefit fund or qualifying insurancepolicies. Plan assets are not available to the creditors of the Group, nor can they be paid directly tothe Group. Fair value of plan assets is based on market price information. When no market price isavailable, the fair value of plan assets is estimated by discounting expected future cash flows using adiscount rate that reflects both the risk associated with the plan assets and the maturity or expecteddisposal date of those assets (or, if they have no maturity, the expected period until the settlement ofthe related obligations).
The Group’s right to be reimbursed of some or all of the expenditure required to settle a definedbenefit obligation is recognized as a separate asset at fair value when and only when reimbursement isvirtually certain.
Termination BenefitTermination benefits are employee benefits provided in exchange for the termination of anemployee’s employment as a result of either an entity’s decision to terminate an employee’semployment before the normal retirement date or an employee’s decision to accept an offer ofbenefits in exchange for the termination of employment.
A liability and expense for a termination benefit is recognized at the earlier of when the entity can nolonger withdraw the offer of those benefits and when the entity recognizes related restructuring costs.Initial recognition and subsequent changes to termination benefits are measured in accordance withthe nature of the employee benefit, as either post-employment benefits, short-term employee benefits,or other long-term employee benefits.
Employee Leave EntitlementEmployee entitlements to annual leave are recognized as a liability when they are accrued to theemployees. The undiscounted liability for leave expected to be settled wholly within twelve monthsafter the end of the annual reporting period is recognized for services rendered by employees up tothe end of the reporting period.

- 51 -
*SGVFS039395*
Leases (Effective January 1, 2019)The Group assesses at contract inception whether a contract is, or contains, a lease. That is, if thecontract conveys the right to control the use of an identified asset for a period of time in exchange forconsideration.
Group as a LesseeThe Group applies a single recognition and measurement approach for all leases, except for short-term leases and leases of low-value assets. The Group recognises lease liabilities to make leasepayments and ROU assets representing the right to use the underlying assets.
ROU AssetsThe Group recognizes ROU assets at the commencement date of the lease (i.e., the date theunderlying asset is available for use). ROU assets are measured at cost, less any accumulateddepreciation and impairment losses, and adjusted for any remeasurement of lease liabilities. The costof ROU assets includes the amount of lease liabilities recognized, initial direct costs incurred, andlease payments made at or before the commencement date less any lease incentives received andestimate of costs to be incurred by the lessee in dismantling and removing the underlying asset,restoring the site on which it is located or restoring the underlying asset to the condition required bythe terms and conditions of the lease, unless those costs are incurred to produce inventories.
Unless the Group is reasonably certain to obtain ownership of the leased asset at the end of the leaseterm, the recognized ROU assets are depreciated on a straight-line basis over the shorter of itsestimated useful life and the lease term as follow.
YearsLand 8-52Building 4-47Machinery and equipment 22
ROU assets are subject to impairment. Refer to the accounting policies in Impairment of Non-financial Assets.
Lease LiabilitiesAt the commencement date of the lease, the Group recognizes lease liabilities measured at the presentvalue of lease payments to be made over the lease term. The lease payments include fixed payments(including in substance fixed payments) less any lease incentives receivable, variable lease paymentsthat depend on an index or a rate, and amounts expected to be paid under residual value guarantees.The lease payments also include the exercise price of a purchase option reasonably certain to beexercised by the Group and payments of penalties for terminating a lease, if the lease term reflects theGroup exercising the option to terminate. The variable lease payments that do not depend on anindex or a rate are recognized as expense in the period on which the event or condition that triggersthe payment occurs.
In calculating the present value of lease payments, the Group uses the IBR at the leasecommencement date if the interest rate implicit in the lease is not readily determinable. After thecommencement date, the amount of lease liabilities is increased to reflect the accretion of interest andreduced for the lease payments made. In addition, the carrying amount of lease liabilities isremeasured if there is a modification, a change in the lease term, a change in the in-substance fixedlease payments or a change in the assessment to purchase the underlying asset.

- 52 -
*SGVFS039395*
Short-Term Leases and Leases of Low-Value AssetsThe Company applies the short-term lease recognition exemption to its short-term leases ofmachinery and equipment (i.e., those leases that have a lease term of 12 months or less from thecommencement date and do not contain a purchase option). It also applies the leases of low-valueassets recognition exemption to leases of office equipment that are considered of low value. Leasepayments on short-term leases and leases of low-value assets are recognized as expense on a straight-line basis over the lease term.
Group as a LessorLeases where the Group does not transfer substantially all the risks and benefits of ownership of theasset are classified as operating leases. Rental income on operating leases is recognized on a straightline basis over the lease term. Initial direct costs incurred in negotiating an operating lease are addedto the carrying amount of the leased asset and recognized over the lease term on the same bases asrental income.
Leases (Prior to January 1, 2019)The determination of whether an arrangement is, or contains a lease is based on the substance of thearrangement and requires an assessment of whether the fulfillment of the arrangement is dependenton the use of a specific asset or assets and the arrangement conveys a right to use the asset.
A reassessment is made after inception of the lease only if one of the following applies:
(a) there is a change in contractual terms, other than a renewal or extension of the arrangement;(b) a renewal option is exercised or extension granted, unless that term of the renewal or extension
was initially included in the lease term;(c) there is a change in the determination of whether fulfillment is dependent on a specified
asset; or,(d) there is a substantial change to the asset.
Where a reassessment is made, lease accounting shall commence or cease from the date when thechange in circumstances gave rise to the reassessment for scenarios (a), (c) or (d) above, and at thedate of renewal or extension period for scenario (b).
Group as a LessorLeases where the Group does not transfer substantially all the risks and benefits of ownership of theasset are classified as operating leases. Rental income on operating leases is recognized on a straightline basis over the lease term. Initial direct costs incurred in negotiating an operating lease are addedto the carrying amount of the leased asset and recognized over the lease term on the same bases asrental income.
Group as a LesseeLease payments under operating lease are recognized as expense on a straight line basis over theterms of the lease contract.
Commission Expense (Prior to January 1, 2018)Commissions paid to sales or marketing agents on the sale of pre-completed real estate units aredeferred when recovery is reasonably expected and are charged to expense in the period in which therelated revenue is recognized as earned. Commission expense is included in the Expenses accountunder the real estate operations in the consolidated statement of income.

- 53 -
*SGVFS039395*
Income TaxesCurrent Income TaxCurrent income tax assets and liabilities for the current and prior periods are measured at the amountexpected to be recovered from or paid to the taxation authorities. The tax rates and tax laws used tocompute the amount are those that are enacted or substantively enacted at the reporting date.
Deferred Income TaxDeferred income tax is provided on all temporary differences at the reporting date between the taxbases of assets and liabilities and their carrying amounts for financial reporting purposes.Deferred income tax liabilities are recognized for all taxable temporary differences, except; (a) wheredeferred income tax liability arises from the initial recognition of goodwill or of an asset or liability ina transaction that is not a business combination and, at the time of the transaction, affects neither theaccounting profit nor taxable profit or loss; and (b) in respect of taxable temporary differencesassociated with investments in subsidiaries, associates and interests in joint ventures, where thetiming of the reversal of the temporary differences can be controlled and it is probable that thetemporary differences will not reverse in the foreseeable future.
Deferred income tax assets are recognized for all deductible temporary differences, carryforwardbenefit of the excess of minimum corporate income tax (MCIT) over regular corporate income tax(RCIT) and unused net operating loss carryover (NOLCO), to the extent that it is probable thattaxable profit will be available against which the deductible temporary differences and carryforwardof MCIT and unused NOLCO can be utilized.
The carrying amount of deferred income tax assets is reviewed at each reporting date and reduced tothe extent that it is no longer probable that sufficient taxable profit will be available to allow all orpart of the deferred income tax assets to be utilized. Unrecognized deferred income tax assets arereassessed at each reporting date and are recognized to the extent that is has become probable thatfuture taxable profit will allow the deferred tax asset to be recovered.
Deferred income tax assets and liabilities are measured at the tax rates that are expected to apply tothe year when the asset is realized or the liability is settled, based on tax rates (and tax laws) that havebeen enacted or substantively enacted at the reporting date. Income tax relating to items recognizeddirectly in other comprehensive income is recognized in OCI and not in the consolidated statement ofincome.
Deferred income tax assets and deferred income tax liabilities are offset, if a legally enforceable rightexists to offset current income tax assets against current income tax liabilities and the deferredincome taxes relate to the same taxable entity and the same taxation authority.
Borrowing CostsBorrowing costs are capitalized if they are directly attributable to the acquisition, construction orproduction of a qualifying asset. Qualifying assets are assets that necessarily take a substantial periodof time to get ready for intended use or sale. Interest and other financing costs incurred during theconstruction period on borrowings used to finance property development are capitalized as part ofdevelopment in the consolidated statement of financial position. Capitalization of borrowing costscommences when the activities to prepare the asset are in progress and expenditures and borrowingcosts are being incurred.
Capitalization of borrowing costs ceases when substantially all the activities necessary to prepare theasset for its intended sale are complete. If the carrying amount of the asset exceeds its recoverableamount, an impairment loss is recorded. All other borrowing costs are expensed as incurred.

- 54 -
*SGVFS039395*
Earnings per Share (EPS)Basic EPS amounts are calculated by dividing net income attributable to equity holders of the ParentCompany for the year by the weighted average number of ordinary shares outstanding during the yearafter giving retroactive effect for any stock dividends, stock options or reverse stock splits during theperiod.
Diluted EPS is computed by dividing net income attributable to equity holders of the Parent Companyby the weighted average number of common shares outstanding during the year, after givingretroactive effect for any stock dividends, stock splits or reverse stock splits during the year, andadjusted for the effect of dilutive options and dilutive convertible preferred shares and bonds. If therequired dividends to be declared on convertible preferred shares divided by the number of equivalentcommon shares, assuming such shares are converted would decrease the basic EPS, then suchconvertible preferred shares would be deemed dilutive. Where the effect of the assumed conversionof the preferred shares and the exercise of all outstanding options have anti-dilutive effect, basic anddiluted EPS are stated at the same amount.
Foreign Currency Transactions and TranslationsThe functional currency of each of the entities in the Group is the Philippine Peso, except for theFCDU of EW. Philippine Peso is also the presentation currency of the consolidated financialstatements. For financial reporting purposes, the monetary assets and liabilities of the FCDU and theforeign currency-denominated monetary assets and liabilities of the Group are translated in PhilippinePeso based on the closing rate prevailing at the statement of consolidated financial position date andforeign currency-denominated income and expenses, at the prevailing exchange rate at the date oftransaction. Foreign exchange differences arising from revaluation and translation of foreigncurrency-denominated assets and liabilities of the Group are credited to or charged against operationsin the period in which the rates change. Exchange differences arising from translation of the accountsof the FCDU to Philippine peso as the presentation currency are taken to the consolidated statementof comprehensive income under Translation adjustment.
Nonmonetary items that are measured in terms of historical cost are translated using the exchangerates as at the dates of the initial transactions. Nonmonetary items measured at fair value in a foreigncurrency are translated using the exchange rates at the date when the fair value was determined.
Fiduciary ActivitiesAssets and income arising from fiduciary activities together with related undertakings to return suchassets to customers are excluded from the consolidated financial statements where EW acts in afiduciary capacity such as nominee, trustee or agent.
ProvisionsA provision is recognized when the Group has a present obligation (legal or constructive) as a resultof a past event, it is probable that an outflow of resources embodying economic benefits will berequired to settle the obligation and a reliable estimate can be made of the amount of the obligation.If the effect of the time value of money is material, provisions are determined by discounting theexpected future cash flows at a pre-tax rate that reflects current market assessment of the time valueof money and, where appropriate, the risks specific to the liability.
Where discounting is used, the increase in the provision due to the passage of time is recognized asinterest expense. When the Group expects part or all of provision to be reimbursed or recovered, thereimbursement is recognized as a separate asset, but only when the reimbursement is virtually certain.

- 55 -
*SGVFS039395*
ContingenciesContingent liabilities are not recognized in the consolidated financial statements. They are disclosedunless the possibility of an outflow of resources embodying economic benefits is remote. Contingentassets are not recognized in the consolidated financial statements but are disclosed when an inflow ofeconomic benefits is probable.
Segment ReportingA business segment is a group of assets and operations engaged in providing products or services thatare subject to risks and returns that are different from those of other business segments. Ageographical segment is one that provides products or services within a particular economicenvironment that is subject to risks and returns that are different from those segments operating inother economic environments. The Group’s operations are organized according to the nature ofproducts and services provided. Two or more operating segments may be aggregated into a singleoperating segment if the segments have similar economic characteristics, and the segments are similarin each of the following respects: (a) the nature of the products and services; (b) the nature of theproduction processes; (c) the type or class of customer for their products and services; (d) themethods used to distribute their products or provide their services; and, (e) if applicable, the nature ofthe regulatory environment. Financial information on business segments is presented in Note 35.
Events After the Reporting DatePost year-end events that provide additional information about the Group’s position at the reportingdate (adjusting events) are reflected in the consolidated financial statements. Post year-end eventsthat are not adjusting events are disclosed when material in the consolidated financial statements.
3. Significant Accounting Judgments, Estimates and Assumptions
The preparation of the consolidated financial statements in compliance with PFRS requiresmanagement to make judgments, estimates and assumptions that affect the amounts reported in theconsolidated financial statements and accompanying notes. Future events may occur which can causethe assumptions used in arriving at those estimates to change.
The effects of any change in estimates are reflected in the consolidated financial statements as theybecome reasonably determinable. Estimates and judgments are continually evaluated and are basedon historical experience and other factors, including expectations of future events that are believed tobe reasonable under the circumstances.
JudgmentsIn the process of applying the Group’s accounting policies, management has made the followingjudgments, apart from those involving estimations, which have the most significant effect on theamounts recognized in the consolidated financial statements:
a. Evaluation of Business Model for Managing Financial Assets and Sale of Investment Securities atAmortized CostThe Group manages its financial assets based on business models that maintain adequate level offinancial assets to match expected cash outflows and maintain adequate level of high qualityliquid assets while maintaining a strategic portfolio of financial assets for investment and tradingactivities consistent with its risk appetite.
The Group’s business model allows for financial assets to be hold-to-collect (HTC) contractualcash flows even when sales of certain financial assets occur. PFRS 9, however, emphasizes thatif more than an infrequent sale is made out of a portfolio of financial assets carried at amortized

- 56 -
*SGVFS039395*
cost, the entity should assess whether and how such sales are consistent with the objective ofcollecting contractual cash flows. In making this judgment, EW considers the following:
· sales or derecognition of debt instrument under any of the circumstances spelled out underparagraph 7, Section 2 of BSP Circular No. 708, Series of 2011;
· sales in preparation for funding a potential aberrant behavior in the depositors’ withdrawalpattern triggered by news of massive withdrawals or massive withdrawal already experiencedby other systemically important banks in the industry;
· sales attributable to an anticipated or in reaction of major events in the local and/orinternational arena that may adversely affect the collectability of the debt instrument and seento prospectively affect adversely the behavior of deposits or creditors;
· sales attributable to a change in EW’s strategy upon completion of the other phases ofPFRS 9; and,
· sales that Asset-Liability Management Committee (ALCO) deems appropriate to beconsistent with managing EW’s balance sheet based upon, but are not limited to, the set risklimits and target ratios that have been approved by the BOD.
b. Determination of Joint Control over EW Ageas Life, FCC and SSTControl is presumed to exist when an investor is exposed, or has rights, to variable returns fromits involvement with the investee and has the ability to affect those returns through its power overthe investee. On the other hand, joint control is presumed to exist when the investorscontractually agree on the sharing of control of an arrangement, which exists only when decisionsabout the relevant activities require the unanimous consent of the parties sharing control. Basedon the provisions of the joint venture arrangements, the parties to the joint venture arrangementshave to agree in order for any resolution to be passed relating to the joint venture entity’s relevantactivities. This joint arrangement is classified as a joint venture since the parties have rights tothe net assets of the joint venture entity.
c. Lease Commitments· Determination of Lease Term of Contracts with Renewal and Termination Options - Group
as a Lessee (Effective January 1, 2019)The Group determines the lease term as the non-cancellable term of the lease, together withany periods covered by an option to extend the lease if it is reasonably certain to be exercised,or any periods covered by an option to terminate the lease, if it is reasonably certain not to beexercised.
The Group has several lease contracts that include extension and termination options. TheGroup applies judgement in evaluating whether it is reasonably certain whether or not toexercise the option to renew or terminate the lease. That is, it considers all relevant factorsthat create an economic incentive for it to exercise either the renewal or termination. After thecommencement date, the Group reassesses the lease term if there is a significant event orchange in circumstances that is within its control and affects its ability to exercise or not toexercise the option to renew or to terminate (e.g., construction of significant leaseholdimprovements or significant customization to the leased asset).
Upon adoption of PFRS 16, the Group determined that generally, the options to extend orterminate the lease to extend or terminate the lease are not included in the determination atthe lease term. These optional periods are not enforceable, as the Group cannot enforce theextension of the lease without the agreement from the lessor, and therefore, the Group doesnot have the right to use the asset beyond the non-cancellable period.

- 57 -
*SGVFS039395*
· Lease Commitments - Group as a Lessee (Prior to January 1, 2019)The Group has entered into a lease agreement with Clark Development Corporaton (CDC) forthe lease of Mimosa Leisure Estate. The Group has determined that all significant risks andrewards of ownership of the building and golf course are transferred to the Group consideringthat the lease term is for the significant part of the useful life of these assets. Therefore thesecomponents of the lease agreement which CDC are accounted for as finance lease(see Notes 17 and 32).
In addition, the Group assessed that all significant risks and rewards of ownership for the landcomponent of the lease agreement with CDC is retained by the lessor since the present valueof the minimum lease payment attributable to the land does not amount to at leasesubstantially the fair value of the land. Thus, this is accounted for as an operating lease(see Note 32).
d. Revenue Recognition of Real Estate Operation· Revenue from Sale of Lots, Condominium and Residential Units (Effective January 1, 2018)
Existence of a ContractThe Group’s primary document for a contract with a customer is a signed contract to sell. Ithas determined however, that in cases wherein contract to sell are not signed by both parties,the combination of its other signed documentation such as reservation agreement, officialreceipts, quotation sheets and other documents, would contain all the criteria to qualify ascontract with the customer under PFRS 15.
In addition, part of the assessment process of the Group before revenue recognition is toassess the probability that the Group will collect the consideration to which it will be entitledin exchange for the real estate property that will be transferred to the customer. In evaluatingwhether collectability of an amount of consideration is probable, an entity considers thesignificance of the customer’s initial payments in relation to the total contract price.Collectability is also assessed by considering factors such as past history customer, age andpricing of the property. Management regularly evaluates the historical cancellations andback-outs if it would still support its current threshold of customers’ equity beforecommencing revenue recognition.
Revenue Recognition Method and Measure of ProgressThe Group concluded that revenue from sale of lots, condominium and residential units is tobe recognized over time because (a) the Group’s performance does not create an asset withan alternative use and; (b) the Group has an enforceable right for performance completed todate. The promised property is specifically identified in the contract and the contractualrestriction on the Group’s ability to direct the promised property for another use issubstantive. This is because the property promised to the customer is not interchangeablewith other properties without breaching the contract and without incurring significant coststhat otherwise would not have been incurred in relation to that contract.
In addition, under the current legal framework, the customer is contractually obliged to makepayments to the developer up to the performance completed to date.
The Group has determined that output method used in measuring the progress of theperformance obligation faithfully depicts the Group’s performance in transferring control ofreal estate development to the customers.

- 58 -
*SGVFS039395*
· Revenue from Sale of Lots, Condominium and Residential Units (Prior to January 1, 2018)Selecting an appropriate revenue recognition method for a real estate sale transaction requirescertain judgments based on, among others:
i. Buyer’s commitment on sale which may be ascertained through the significance of thebuyer’s initial payments in relation to the total contract price; and,
ii. Stage of completion of the project development.
The Group has set a certain percentage of collection over the total selling price in determiningbuyer’s commitment on the sale. It is when the buyer’s investment is considered adequate tomeet the probability criteria that economic benefits will flow to the Group. The Group alsodetermines whether a project’s POC is already considered beyond preliminary stage based thephysical proportion of the contract of work.
e. Segment ReportingThe Group aggregates 2 or more operating segments into a single operating segment whenseparately, each operating segment has similar economic characteristics. The Group considersbanking and financial services, real estate operations, power operations, hospitality operations,sugar operations, and other operations as its operating segments and are aggregated as such basedon the source and types of revenues (see Note 35).
f. Business CombinationIn determining whether a transaction or an event is a business combination, the Group assessedwhether the assets acquired and liabilities assumed constitute a business. A business is defined asan integrated set of activities and assets that is capable of being conducted and managed for thepurpose of providing a return in the form of dividends, lower costs or other economic benefitsdirectly to investors or other owners, members or participants. Further, a business consists ofinputs and processes applied to those inputs that have the ability to create outputs.
For the acquisition of Standard Chartered Bank (SCB), based on the provisions of the Agreementbetween EW and SCB (see Notes 1 and 4), EW has identified the acquisition as a businesscombination. In making this judgment, EW has assessed the retail banking portfolio acquired ascapable of providing a return to EW in the form of revenues from lending and portfoliomanagement activities.
For the acquisition of GPRDI, based on the provisions of the Share Sale and Purchase Agreementto acquire 100% shares of GPRDI (see Note 1), FLI assessed that the acquisition does notconstitute a business. In making the judgment, FLI considered that it lacks 2 of the 3 componentsrequired to meet the definition of a business (i.e., processes and output). While FLI acquiredinputs (i.e., land), FLI did not acquire any process. As such, the transaction was accounted for asan acquisition of an asset and the entire consideration was recognized as part of real estateinventories in the consolidated statement of financial position (see Note 14).
g. ContingenciesIn the normal course of business, the Group is currently involved in various legal proceedings andassessments. The assessment of probability and estimate of the probable costs for the resolutionof the related claims has been developed in consultation with outside counsel handling thedefense in these matters and based upon analysis of potential results. The Group currently doesnot believe these proceedings will have material effect on the Group’s financial position andresults of operations. It is possible, however, that future results of operations may be affected bychanges in the assessment of probability and estimates of potential outflow or in the effectivenessof the strategies relating to these proceedings (see Note 33).
- 59 -
*SGVFS039395*
h. Significant Influence in Luzon International Premiere Airport Development Corp. (LIPAD Corp.)The Group considers that it has significant influence over investees when it has boardrepresentation which allows them to participate in the financial and operating policy decisions butis not control or joint control of those policies (see Note 18).
Management’s Use of EstimatesThe key assumptions concerning the future and other key sources of estimation uncertainty at thereporting date, that have a significant risk of causing a material adjustment to the carrying amounts ofassets and liabilities within the next financial year are discussed below:
a. Revenue Recognition and Measure of Progress for Real Estate SalesThe Group’s revenue recognition policy requires management to make use of estimates andassumptions that may affect the reported amounts of revenues and costs. The Group’s revenuefrom real estate sales recognized based on the POC are measured principally on the basis ofphysical completion of real estate project.
Sale of condominium and residential units based on POC amounted to P=17,013.1 million andP=16,751.1 million and P=10,872.7 million for the years ended December 31, 2019, 2018 and 2017,respectively.
b. Fair Value of Financial InstrumentsCertain financial assets and financial liabilities are required to be carried at fair value anddisclosure of certain fair value information, the determination of which requires the use ofaccounting estimates and judgments. While significant components of fair value measurementwere determined using verifiable objective evidence (i.e., foreign exchange rate and interest rate),the amount of changes in fair value would differ due to usage of different valuation methodology.Any change in fair value of these financial assets and financial liabilities would affect directly theconsolidated statement of income, OCI or the disclosed fair value. See Note 36 for the relatedfair values of the Group’s financial assets and financial liabilities.
c. Impairment of Loans and Receivables and Contract Assets (Effective January 1, 2018)The Group reviews its loans and receivables and contract assets at each reporting date to assesswhether an allowance for impairment should be recorded in the consolidated statements ofincome. Loans and receivables includes corporate lending, consumer lending and otherreceivables from banking and financial services; contracts receivables and other receivables fromreal estate operations; and trade receivables from power operations, sugar operations andhospitality operations.
In particular, judgment by management is required in the estimation of the amount and timing offuture cash flows when determining the level of allowance required. Such estimates are based onassumptions about a number of factors and actual results may differ, resulting in future changesto the allowance.
The measurement of credit losses under PFRS 9 requires significant judgment, in particular, theestimation of the amount and timing of future cash flows and collateral values when determiningimpairment losses and the assessment of a SICR. These estimates are driven by a number offactors, changes in which can result in different levels of allowances.
EW’s ECL calculations are outputs of complex models with a number of underlying assumptionsregarding the choice of variable inputs and interdependencies. Signicant elements of the modelsinclude, among others:· segmentation of the portfolio to determine the appropriate ECL approach to apply to each
portfolio

- 60 -
*SGVFS039395*
· the Group’s definition of default· criteria for assessing if there as been a SICR and so allowances for debt financial assets
should be measured on a lifetime ECL basis· segmentation of debt financial assets when their ECL is assessed on a collective basis· development of ECL models, including the various formulas and the choice of inputs· identification of relevant macro-economic variables to consider forward-looking information
in the ECL model
Factors considered in doing the impairment assessment are discussed further in Note 37. As ofDecember 31, 2019 and 2018, loans and receivables and contract assets amounted toP=276,445.9 million and P=249,403.7 million, respectively (see Notes 7, 8, 9, 10, 11 and 13).Allowance for impairment and credit losses amounted to P=7,532.7 million and P=7,353.3 millionas of December 31, 2019 and 2018, respectively (see Notes 7, 9, 11 and 13).
d. Impairment of Loans and Receivables (Prior to January 1, 2018)The Group reviews its loans and receivables at each reporting date to assess whether anallowance for impairment should be recorded in the consolidated statements of income. Loansand receivables includes corporate lending, consumer lending and other receivables from bankingand financial services; contracts receivables and other receivables from real estate operations; andtrade receivables from power generation operation, sugar operation and hotel operation. Inparticular, judgment by management is required in the estimation of the amount and timing offuture cash flows when determining the level of allowance required. Such estimates are based onassumptions about a number of factors and actual results may differ, resulting in future changesto the allowance.
In addition to specific allowance against individually significant loans and receivables, the Groupalso provides a collective impairment allowance against exposures which, although notspecifically identified as requiring a specific allowance, have a greater risk of default than whenoriginally granted. Factors considered in doing the impairment assessment are discussed furtherin Note 37.
As of December 31, 2017, loans and receivables amounted to P=233,027.3 million net ofallowance for impairment and credit losses amounting to P=6,497.8 million (see Notes 7, 8, 9, 10and 11).
e. Estimating NRV of Real Estate InventoriesThe Group adjusts the cost of its real estate inventories costs to NRV based on its assessment ofthe recoverability of the inventories. In determining the recoverability of the inventories,management considers whether those inventories have deteriorated or if their selling prices havedeclined. Likewise, management also considers whether the estimated costs of completion or theestimated costs to be incurred to make the sale have increased. The amount and timing ofrecorded expenses for any period would differ if different judgments were made or differentestimates were utilized.
As of December 31, 2019 and 2018, the carrying value of real estate inventories amounted toP=71,363.5 million and P=79,469.9 million, respectively (see Note 14).
f. Evaluation of Impairment of GoodwillThe Group determines whether goodwill is impaired at least on an annual basis. The Group’simpairment test for goodwill is based on VIU calculations that use a discounted cash flow model.The cash flows are derived from the forecast as approved by the BOD and do not include

- 61 -
*SGVFS039395*
restructuring activities that the Group is not yet committed to or significant future investmentsthat will enhance the asset base of the cash generating unit being tested. The recoverable amountis most sensitive to the discount rates used, as well as the expected future cash-inflows, revenuegrowth rates used and interest margin.
Goodwill From Acquisition of PSHC and Subsidiaries (Sugar Business):The projection period used was 5 years and the cash flows beyond 5 years were included in theterminal value. The pre-tax discount rates used of 5.9% and 7.3% as of December 31, 2019 and2018, respectively, were determined using capital asset pricing model. Key assumptions in VIUcalculation are most sensitive to revenue growth rates, gross margin and discount rate within andbeyond the projection period.
The Group assumed a certain growth rate within the budget period based on expected areas to beharvested and the total harvest per area. Growth rate of 1.5% were assumed after the 5-yearprojection period as of December 31, 2019 and 2018. The Group ascertains that growth ratesbeyond the projection period is not above the forecasted industry growth rate.
Goodwill from Various Bank AquisitionsFuture cash flows from CGUs were estimated based on the theoretical annual income of theCGU. Key assumptions in VIU calculation of the CGUs are most sensitive to: (a) interestmargin; (b) discount rates; (c) market share during the budget period; and (d) projected growthrates used to extrapolate cash flows beyond the budget period. The pre-tax discount rates usedwere 10.7% for American International Group, Inc. Philam Savings Bank Group (AIGPASB) and10.8% for EWRB, SCB and Ecology Savings Bank, Inc. (ESBI) in 2018 and 9.3% for AIGPASBand 9.4% for EWRB, SCB and ESBI in 2017. The average growth rate was derived from averageincrease in annual income during the last 5 years, while growth rate used to extrapolate cashflows beyond the forecast 5-year period was 5.0%.
Goodwill from Acquisition of CPIThe cash flows were derived from projection period of 10 years. Key assumptions used in VIUcalculations are most sensitive to discount rates and growth rates within the budget period andbeyond the projection period. The pre-tax discount rate used as of December 31, 2019 and 2018was 10.0%. Average growth rate was derived from the average contracted rent increases, whilethe growth rate used beyond the forecast period was 3.0%.
The Group did not recognize impairment loss on its goodwill in 2019, 2018 and 2017. The totalcarrying value of goodwill amounted to P=10,381.2 million as of December 31, 2019 and 2018(see Note 4).
g. Evaluation of Impairment of Nonfinancial Assets (other than Goodwill)The Group reviews property, plant and equipment, investment properties, ROU and othernonfinancial assets for impairment of value. This includes considering certain indications ofimpairment such as significant change in asset usage, significant decline in asset’s market value,obsolescence or physical damage of an asset, plans of discontinuing the real estate projects, andsignificant negative industry or economic trends.
If such indications are present, and where the carrying amount of the asset exceeds its recoverableamount, the asset is considered impaired and is written down to recoverable amount. Therecoverable amount is calculated as the higher of the asset’s fair value less cost to sell, or its VIU.The fair value less cost to sell is the amount to be received from the sale of an asset in an arm’slength transaction, while VIU is the present value of estimated future cash flows expected to arisefrom the nonfinancial assets.

- 62 -
*SGVFS039395*
Recoverable amounts are estimated for individual assets or, if it is not possible, for the CGU towhich the asset belongs. The carrying values of the Group’s nonfinancial assets as ofDecember 31, 2019 and 2018 are included in Notes 16, 17, 18 and 20 to the consolidatedfinancial statements.
In 2019, 2018 and 2017, the Group recognized provision for probable losses on investmentproperties amounting to P=31.3 million, P=47.9 million and P=12.8 million, respectively(see Note 16). In 2019, 2018 and 2017, the Group recognized provision for probable losses onproperty, plant and equipment amounting to P=43.5 million, P=82.4 million and P=65.3 million,respectively (see Note 17). Also, the Group recognized impairment on other assets amounting toP=404.2 million, P=74.1 million and P=322.5 million in 2019, 2018 and 2017, respectively(see Note 20).
h. Estimating Retirement ObligationThe determination of the Group’s obligation and cost for retirement benefits is dependent onselection of certain assumptions used by the actuaries in calculating such amounts. Thoseassumptions used are described in Note 30 and include among others, discount rates and rates ofsalary increase. While the Group believes that the assumptions are reasonable and appropriate,significant differences in actual experience or significant changes in assumptions materially affectretirement obligations.
As of December 31, 2019 and 2018, the Group has outstanding retirement liabilities amounting toP=1,139.7 million and P=1,117.1 million (see Note 30).
i. Recognition of Deferred Tax AssetsThe Group reviews the carrying amounts of deferred taxes at each reporting date and reducesdeferred tax assets to the extent that it is no longer probable that sufficient taxable profit will beavailable to allow all or part of the deferred tax assets to be utilized. However, there is noassurance that the Group will generate sufficient taxable profit to allow all or part of its deferredtax assets to be utilized.
As of December 31, 2019 and 2018, the Group’s deferred tax assets amounted toP=5,454.2 million and P=3,299.2 million, respectively. The tax effect of deductible temporarydifferences and carryforward benefits of NOLCO, allowance for expected credit losses,unrealized foreign exchange loss and MCIT for which no deferred tax assets were recognizedamounted to P=867.6 million and P=667.1 million as of December 31, 2019 and 2018, respectively(see Note 34).
j. Valuation of Exclusive Bancassurance Access or Distribution RightsEW entered into an exclusive distribution agreement with EW Ageas Life for a period of20 years. Under the distribution agreement, EW Ageas Life will have exclusive access to thebranch network of EW for the distribution of its insurance products (the exclusive bancassuranceaccess).
The fair value of the exclusive bancassurance access was determined based on a valuation doneby an independent third party valuer, which used as inputs recent similar transactions and thenumber of branches and customers of EW. The fair value of the exclusive bancassurance accesswas recognized as deferred revenue to be amortized over the distribution period (see Notes 13, 18and 20).

- 63 -
*SGVFS039395*
k. Estimating the IBR for LeasesThe Group cannot readily determine the interest rate implicit in the lease, therefore, it uses itsIBR to measure lease liabilities. The IBR is the rate of interest that the Group would have to payto borrow over a similar term, and with a similar security, the funds necessary to obtain an assetof a similar value to the ROU asset in a similar economic environment. The IBR thereforereflects what the Group ‘would have to pay’, which requires estimation when no observable ratesare available (such as for subsidiaries that do not enter into financing transactions) or when theyneed to be adjusted to reflect the terms and conditions of the lease (for example, when leases arenot in the subsidiary’s functional currency). The Group estimates the IBR using observableinputs (such as market interest rates) when available and is required to make certain entity-specific estimates (such as the subsidiary’s stand-alone credit rating). The IBR used by theGroups’s to measure lease liabilities ranges from 7.45% to 8.72%.
The Group’s lease liabilities amounted to P=6,885.2 million as of December 31, 2019 (see Notes 2and 32).
4. Goodwill and Business Combinations
As of December 31, 2019 and 2018, goodwill arising from business combinations in the Group’sconsolidated statement of financial position consists of (amounts in thousands):
PSHC P=6,177,310SCB Philippines’ retail banking business,
QMIS and ASIA 2,560,561EWRB and Green Bank, Inc. (GBI) 397,474CPI 326,553Other bank acquisitions 919,254
P=10,381,152
Goodwill from Acquisition of PSHC and SubsidiariesIn June 2007, the Parent Company acquired from ALGI 100.0% interest in PSHC in exchange for itsown shares. The acquisition of PSHC includes its wholly owned subsidiaries, DSCC, CSCC andHYSFC (the sugar business). The acquisition was accounted for as a business combination andresulted to recognition of goodwill amounting to P=10,083.3 million. The value assigned to the sugarbusiness was based on the valuation done by a third party professional firm, based on factors andassumptions considered relevant at that time.
The parties then understood and agreed that the valuation was conditioned on the subsequentimplementation of the planned businesses and achieving certain financial targets. As these plan andtargets did not materialize, the Parent Company exercised its right to rescind the 2007 Deed ofAssignment and Exchange (the 2007 Deed). In December 2017, the Parent Company and ALGIexecuted the Deed of Mutual Partial Rescission which entails the return of 542.5 million FDC sharesby ALGI to the Parent Company covered under the 2007 Deed, valued on date of exchange atP=3,906.0 million, plus all stock and cash dividends subsequently declared thereon of 126.5 millionshares and P=315.7 million, respectively (see Note 25).
Following PFRS 3 (2007), the resulting reduction in the consideration paid to ALGI due to the partialrescission was accounted for as a reduction of the carrying amount of goodwill. As of December 31,2019 and 2018, goodwill from the acquisition of PSHC amounted to P=6,177.3 million.

- 64 -
*SGVFS039395*
Asset and Share Transfer Agreement with SCB and SCMB Overseas LimitedOn May 6, 2016, EW entered into an Asset and Share Transfer Agreement (the Agreement) with SCBand SCMB Overseas Limited.
The acquisition was approved by the BSP on August 8, 2016. On November 25, 2016, aftersatisfying all the conditions under the Agreement, the transfer of assets and liabilities was completed.This resulted in goodwill amounting to P=2,560.6 million.
Goodwill from Acquisitions of EWRB and GBIIn 2011, the acquisition of GBI resulted in goodwill amounting to P=374.0 million. In 2012, theacquisition of EWRB resulted in goodwill amounting P=23.5 million. In October 2013, the branchescoming from GBI were combined with the branch operations of EWRB. Consequently, the goodwillfrom the acquisition of EWRB and GBI were allocated to the branch operations of EWRB, which isconsidered as a single CGU for purposes of impairment testing.
Goodwill from Acquisition of CPIIn February 2010, FLI acquired 40.0% interests in CPI from another stockholder to obtain full controlof the then joint venture. The acquisition resulted in CPI becoming wholly owned subsidiary of FLI.The acquisition of the joint venture partner’s interest was accounted for as business combination andresulted in recognition of goodwill amounting to P=326.6 million.
Goodwill from Other Bank AcquisitionsThe business combination between EW and AIGPASB in 2009 resulted in goodwill amounting toP=769.0 million, which has been allocated to the auto and credit cards lending unit acquired from theAIGPASB.
The business combination between EW and ESBI in 2003 resulted in goodwill amounting toP=172.8 million, which has been allocated to various branches acquired from ESBI. As ofDecember 31, 2019 and 2018, the carrying amount of goodwill, after impairment of P=22.6 millionrecognized in prior years, amounted to P=150.2 million.
5. Subsidiaries with Noncontrolling Interest
As of December 31, 2019, the noncontrolling interest in EW represents 22.1% (2018: 22.8%) whilethe noncontrolling interest in FLI represents 35.2% (2018: 40.6%). Other noncontrolling interestpertains to the 7.0% and 8.1% equity interest in FAI as of December 31, 2019 and 2018, respectively,and 5.0% equity interest of CDC in FMI as of December 31, 2019 and 2018.
Acquisition of Noncontrolling InterestOn March 27, May 29, June 21 and June 28, 2019, the Group purchased FLI shares amounting toP=44.8 million, P=4.8 million, P=8.7 million and P=2,231.5 million, respectively, which resulted in anincrease in the Group’s ownership interest in FLI from 59.4% to 64.8%.
On June 28, July 1, July 19 and July 22, 2019, the Group purchased EW shares amounting toP=89.4 million, P=53.8 million, P=5.2 million and P=3.3 million, respectively, which resulted in anincrease in the Group’s ownership interest in EW from 77.2% to 77.9%.
The above purchase of additional shares resulted in a reduction in noncontrolling interest and additionto retained earnings amounting to P=3,795.6 million and P=1,354.1 million, respectively.

- 65 -
*SGVFS039395*
Dividend DeclarationIn March 2019, the BOD of FAC approved the declaration and payment of cash dividends ofP=85.0 million or P=85.0 per share for every common share. This was paid on March 31, 2019.Additional declaration of cash dividends was approved on December 21, 2019 amounting toP=460.0 million or P=460.0 per share for every common share. The share of the noncontrolling interestrelated to these dividend declarations amounted to P=218.0 million.
On May 22, 2019, the BOD of FLI approved the declaration of and payment of cash dividends ofP=0.0619 per share for every common share with an aggregate amount of P=1,501.1 million. This waspaid on June 17, 2019. The share of the noncontrolling interest related to this dividend declarationamounted to P=607.2 million.
In 2018, the BOD of FAC approved quarterly distribution of cash dividends amountingP=100.0 million each on March, May and September 2018, and P=160.0 million on December 2018.These were fully paid in 2019. The share of the noncontrolling interest related to this dividenddeclaration amounted to P=184.0 million.
On April 20, 2018, the BOD of FLI approved the declaration and payment of cash dividend ofP=0.0618 per share or total of P=1.50 billion for all shareholders of record as of May 20, 2018. Thiswas also paid on June 17, 2019. The share of the noncontrolling interest related to this dividenddeclaration amounted to P=608.1 million.
The summarized financial information of EW and FLI are provided below. This information is basedon amounts after consolidation but before intercompany eliminations.
Summarized Statements of Financial Position for the Years Ended December 31, 2019 and 2018
2019 2018FLI EW FLI EW
(In Thousands)Assets:
Cash and cash equivalents P=4,773,621 P=47,837,735 P=6,419,560 P=63,763,107Loans and receivables 4,621,237 267,647,738 3,149,211 245,869,585Financial assets at FVPL − 16,840,709 − 4,338,794Financial assets at FVOCI 15,624 4,650,636 15,622 248,207Investment securities at amortized cost − 49,386,070 − 36,510,546Contract assets 13,115,742 − 10,042,105 −Real estate inventories 63,018,436 − 67,853,028 −Investment properties 61,321,185 949,138 49,867,671 921,153Property and equipment 3,288,718 2,346,369 3,833,120 2,655,809Investment in a joint venture − 694,114 − 689,466Investment in associates 4,170,682 − 4,056,019 −Deferred tax assets - net 52,435 2,821,217 85,979 2,265,962Goodwill 4,567,242 3,877,289 4,567,242 3,877,241ROU assets 5,247,802 3,090,392 − −Other assets 9,503,707 6,182,882 8,970,926 6,199,119
Liabilities:Deposit liabilities − (304,726,155) − (288,239,833)Bills and acceptance payable − (30,949,753) − (17,969,927)Accounts payable, accrued expenses
and other liabilities (23,328,957) (11,463,205) (21,876,867) (12,035,166)Contract liabilities* (1,752,406) − (3,210,176) −Retirement liabilities (512,442) − (598,403) −Income tax payable (142,736) (595,851) (109,002) (222,410)Long-term debt (63,412,920) (6,219,011) (59,782,739) (6,214,479)Lease liability (5,870,064) (3,302,981) − −Deferred tax liabilities - net (6,512,613) − (6,011,674) −
Total Equity P=72,164,293 P=49,067,333 P=67,271,622 P=42,657,174
(Forward)

- 66 -
*SGVFS039395*
2019 2018FLI EW FLI EW
(In Thousands)Attributable to:
Equity holders of the Parent Company P=52,685,168 P=38,177,626 P=46,074,051 P=32,894,034Noncontrolling interest 19,253,357 10,889,707 20,960,874 9,763,140Noncontrolling interest in subsidiaries 225,768 − 236,697 −
*Contract liabilities of EW are presented under accounts payable, accrued expenses and other liabilities
Summarized Statements of Comprehensive Income for the Years Ended December 31, 2019 and 2018:
2019 2018FLI EW FLI EW
(In Thousands)Revenues and other income P=25,271,785 P=36,988,673 P=21,668,168 P=30,577,840Equity in net income (loss) of associates
and joint venture 401,525 (339,482) 537,017 (395,816)Costs and operating expenses (14,905,577) (28,738,619) (13,234,362) (24,205,719)Interest and other finance charges (2,492,965) – (1,192,441) –Income before income tax 8,274,768 7,910,572 7,778,382 5,976,305Provision for income tax (1,754,968) (1,668,634) (1,702,509) (1,468,241)Net income 6,519,800 6,241,938 6,075,873 4,508,064Other comprehensive income 124,296 176,211 6,755 (214,453)Total comprehensive income P=6,644,096 P=6,418,149 P=6,082,628 P=4,293,611Attributable to noncontrolling interest:
Net income P=2,388,636 P=1,382,458 P=2,421,725 P=1,028,693Total comprehensive income 2,432,365 1,429,250 2,419,326 979,757
Dividends paid to noncontrolling interest 825,228 − 792,101 −
Summarized Statements of Cash Flow Information for the Years Ended December 31, 2019 and 2018:
2019 2018FLI EW FLI EW
Cash flows from (used in): (In Thousands)Operating activities P=8,925,124 (P=12,138,323) P=6,914,463 P=2,778,544Investing activities (9,088,932) (15,804,418) (4,880,416) (20,764,629)Financing activities (1,482,131) 12,017,171 (3,190,577) 13,954,232
Net decrease in cash and cash equivalents (P=1,645,939) (P=15,925,570) (P=1,156,530) (P=4,031,853)
As of December 31, 2019 and 2018, there are no significant restrictions, outside the ordinary courseof business, on the Parent Company’s ability to access or use assets and settle the liabilities of thesesubsidiaries.
6. Cash and Cash Equivalents
This account consists of:
2019 2018(In Thousands)
Cash P=10,550,179 P=10,107,369Short-term placements 1,162,912 1,436,061Due from BSP (Note 21) 34,287,302 40,481,956Due from other banks 3,403,926 10,233,240Interbank loans receivable (IBLR) 2,691,882 5,862,670
P=52,096,201 P=68,121,296

- 67 -
*SGVFS039395*
Cash includes cash on hand and in banks. Cash in banks earn interest at the respective bank depositrates. Short-term placements are made for varying periods of up to 3 months and earn interest at therespective short-term deposit rates. Interest income earned on the Group’s cash and short-termplacements amounted to P=145.8 million, P=76.8 million and P=43.0 million in 2019, 2018 and 2017,respectively (see Note 27).
Interest earned on the Group’s Due from BSP, Due from other banks and IBLR amounted toP=62.1 million, P=101.8 million and P=110.4 million in 2019, 2018 and 2017, respectively (see Note 35).
7. Loans and Receivables - Real Estate Operations
This account consists of:
2019 2018Due Within
One YearDue AfterOne Year Total
Due WithinOne Year
Due AfterOne Year Total
(In Thousands)Receivables from tenants P=1,996,515 P=− P=1,996,515 P=1,695,254 P=− P=1,695,254Contracts receivable 1,625,907 − 1,625,907 1,001,844 − 1,001,844Receivables from sale of commercial
lots 439,933 108,611 548,544 321,690 162,916 484,606Advances to officers and employees 462,328 − 462,328 410,892 − 410,892Receivable from government and other
financial institutions 192,580 − 192,580 177,437 − 177,437Receivables from buyers 139,875 − 139,875 60,919 − 60,919Receivables from homeowners
association (HOA) 139,362 − 139,362 142,029 − 142,029Due from related parties (Note 26) 15,644 − 15,644 4,312 − 4,312Others 10,274 − 10,274 333,580 − 333,580
5,022,418 108,611 5,131,029 4,147,957 162,916 4,310,873Less allowance for expected credit
losses 6,913 − 6,913 49,532 − 49,532P=5,015,505 P=108,611 P=5,124,116 P=4,098,425 P=162,916 P=4,261,341
Contracts receivables are collectible within the year. Prior to 2018, contract receivables arecollectible over varying periods ranging from 2 to 10 years. These receivables arising from realestate sales are collateralized by the corresponding real estate properties sold.
Interest income recognized on contracts receivable and others amounted to P=403.9 million,P=809.5 million and P=805.8 million in 2019, 2018 and 2017, respectively (see Note 27). Interest rateson contracts receivable range from 11.5% to 19.0% per annum in 2019, 2018 and 2017.
The Group has a mortgage insurance contract with Home Guaranty Corporation (HGC), agovernment insurance company for a retail guaranty line. As of December 31, 2019 and 2018, thecontracts (comprise of both contract receivables and contract assets at gross amount) covered by theguaranty line amounted to P=803.3 million and P=1,007.0 million, respectively. As ofDecember 31, 2019 and 2018, the remaining unutilized guaranty line amounted to P=2,061.6 millionand P=2,384.4 million, respectively.
Receivables from tenants represent charges to tenants for rentals and utilities which are normallycollectible within 1 year.
Receivable from sale of commercial lots arose from sale of commercial lots collectible over varyingperiods up to 5 years.

- 68 -
*SGVFS039395*
Advances to officers and employees are advances for project costs, marketing activities, travel andother expenses arising from the ordinary course of business which are liquidated uponaccomplishment of the purposes for which the advances were granted.
Receivables from government and other financial institutions pertain to government andbank-financed real estate sales. These are collectible within 1 year.
Receivables from HOA represent claims of the Group’s projects for the payments of expenses onbehalf of the association.
Receivables from buyers mainly pertain to advances for fit-out funds and other advances relating toinsurance and other expenses chargeable to buyers.
Others represent advances for selling, marketing and administrative expenses of international salesoffices arising from the ordinary course of business which are liquidated upon accomplishment of thepurposes for which the advances were granted.
The reconciliation of allowance for impairment losses for individually assessed receivables of the realestate operations of the Group as of December 31, 2019 and 2018 follows:
2019 2018
Receivablesfrom Tenants
and HOA
Receivablesfrom Sale ofCommercial
Lots Total
Receivablesfrom Tenants
and HOA
Receivablesfrom Sale ofCommercial
Lots Total(In Thousands)
Balances at beginning of year P=49,532 P=− P=49,532 P=77,264 P=76,336 P=153,600Provisions (Note 29) 10,514 − 10,514 3,204 − 3,204Reversal/Write-off (Note 29) (53,133) − (53,133) (30,936) (76,336) (107,272)Balances at end of year P=6,913 P=− P=6,913 P=49,532 P=− P=49,532
8. Loans and Receivables - Hospitality Operations
This account consists of:
2019 2018(In Thousands)
Trade P=206,549 P=135,707Advances to officers and employees 6,941 60,632Others (Note 26) − 306
P=213,490 P=196,645
Trade receivables pertain to receivables from credit card companies, travel agents and corporateguests, which are non-interest bearing and are collectible within 1 year.
Advances to officers and employees refer to advances for travel, sales and marketing expenses,insurance and other expenses arising from ordinary course of business. These are liquidated withinseven (7) days after actual use of the advances.

- 69 -
*SGVFS039395*
9. Loans and Receivables - Banking and Financial Services
This account consists of:
2019 2018(In Thousands)
Receivables from customers:Corporate lending P=57,366,786 P=58,758,342Consumer lending 189,806,049 166,690,714
247,172,835 225,449,056Unamortized premium 8,391,667 6,945,199
255,564,502 232,394,255Unquoted debt securities Private bonds 344,188 341,890
344,188 341,890Other receivables 5,587,470 6,086,654
261,496,160 238,822,799Less allowance for expected credit losses 7,389,216 7,291,882
P=254,106,944 P=231,530,917
Consumer lending receivables include gross credit card receivables amounting toP=35,306.4 million and P=30,940.5 million as of December 31, 2019 and 2018, respectively.
Receivables from customers consist of:
2019 2018(In Thousands)
Loans and discounts P=241,359,118 P=218,302,521Customers’ liabilities under letters of credit/trust
receipts 4,993,191 6,323,675Bills purchased (Note 23) 820,526 822,860
P=247,172,835 P=225,449,056
Interest income from these loans and receivables in 2019, 2018 and 2017 amounted toP=26,623.9 million, P=22,544.5 million and P=20,562.2 million, respectively (see Note 35).
A reconciliation of allowance for expected credit losses per class of loans and receivables follows:
2019Corporate Lending Consumer Lending Others Total
(In Thousands)At January 1 P=368,088 P=5,923,836 P=999,958 P=7,291,882Provision for probable losses (Note 29) 385,479 2,893,506 421,838 3,700,823Write-off and others − (3,329,603) (273,886) (3,603,489)At December 31 P=753,567 P=5,487,739 P=1,147,910 P=7,389,216

- 70 -
*SGVFS039395*
2018Corporate Lending Consumer Lending Others Total
(In Thousands)At January 1 P=989,868 P=5,198,207 P=146,034 P=6,334,109Transition adjustments (563,103) 1,034,808 18,786 490,491Balances at January 1, 2018, as restated 426,765 6,233,015 164,820 6,824,600Provision (recoveries) for probable
losses (Note 29) (58,677) 2,836,636 850,167 3,628,126Write-off and others − (3,145,815) (15,029) (3,160,844)At December 31 P=368,088 P=5,923,836 P=999,958 P=7,291,882
10. Loans and Receivables - Power Operations
This account consists of:
2019 2018(In Thousands)
Trade P=2,038,131 P=1,841,069Other receivables 6,906 396
P=2,045,037 P=1,841,465
Trade receivables pertain to receivables from electric cooperative for the transmitted power. Thesereceivables are non-interest bearing and are due every 25th of the month of the immediatelysucceeding billing period.
Other receivables pertain mainly to advances to officers and employees, which will be liquidated orcharged against salary.
11. Loans Receivables - Sugar Operations
This account consists of:
2019 2018(In Thousands)
Trade P=428 P=667Advances to: Sugar planters (Note 33) 125,192 123,017 Officers and employees 4,547 6,050
130,167 129,734Less allowance for expected credit losses 22,077 11,863
P=108,090 P=117,871
Advances to sugar planters are for various incentives such as fertilizers, crop loans and tractorservices. These are usually offset against the planter’s share of sales proceeds.
Advances to officers and employees represent advances for travel, marketing and other expenses,loans availed by employees and officers, including educational and car loans arising from ordinarycourse of business. These are liquidated upon the accomplishment of the purposes for which theadvances were granted or deducted from the salaries of officers and employees.

- 71 -
*SGVFS039395*
As of December 31, 2019 and 2018, loans and receivables from sugar operations are collectiblewithin 1 year.
The reconciliation of allowance for expected credit losses which pertains to the Group’s advances tosugar planters specifically identified to be impaired as of December 31, 2019 and 2018 follows:
2019 2018(In Thousands)
Balances at beginning of year P=11,863 P=10,053Provisions (Note 29) 11,355 2,802Write-off (1,141) (992)
P=22,077 P=11,863
12. Financial Assets at FVPL, Financial Assets at FVOCI and Investment Securities atAmortized Cost
Financial Assets at FVPLThis account consist of:
2019 2018(In Thousands)
Government securities P=16,768,178 P=4,286,260Private bonds 62,188 42,204Equity securities 10,343 10,330
P=16,840,709 P=4,338,794
As of December 31, 2019 and 2018, financial assets at FVPL include net unrealized loss ofP=193.3 million and P=8.4 million, respectively.
Financial Assets at FVOCIThis account consist of:
2019 2018(In Thousands)
Government debt securities P=4,650,635 P=248,206Quoted equity securities 460,100 354,019Unquoted equity securities 212,935 148,062
P=5,323,670 P=750,287
The private equity securities were designated as at FVOCI on the basis that these are not held fortrading. These include shares in a real estate company and a golf club. No dividend income wasrecognized in 2019 and 2018 for these securities.

- 72 -
*SGVFS039395*
The rollforward of revaluation reserve on financial assets at FVOCI is as follows:
2019 2018(In Thousands)
Balances at beginning of year P=134,025 P=89,670Changes in fair value of financial assets at
FVOCI 285,302 44,355Balances at end of year P=419,327 P=134,025
The cumulative unrealized gain on financial assets at FVOCI presented as Revaluation reserve onfinancial assets at FVOCI amounted to P=373.6 million and P=118.1 million as of December 31, 2019and 2018, respectively, and is net of the share of noncontrolling interest.
Investment Securities at Amortized CostThis account consist of:
2019 2018(In Thousands)
Government securities P=40,245,948 P=26,100,243Private bonds 9,142,388 10,413,198
49,388,336 36,513,441Allowance for impairment loss (2,265) (2,895)
P=49,386,071 P=36,510,546
Peso-denominated government bonds have effective interest rates ranging from 3.5% to 8.1% in2019, 4.5% to 8.1% in 2018, and effective interest rate of 4.5% in 2017. Foreign currency-denominated bonds have effective interest rates ranging from 1.6% to 7.1% in 2019, 2018 and 2017.
In 2017, EW sold securities carried at amortized cost, with aggregate carrying amount ofP=11,438.9 million, and recognized gains of P=317.4 million which were presented as ‘Gain on sale ofinvestment securities at amortized cost’ in the consolidated statement of income. Judgments maderelated to the sale of investment securities at amortized cost are disclosed in Note 3.
Interest income on trading and investment securities amounted to P=2,453.0 million, P=1,148.2 million,P=822.2 million in 2019, 2018 and 2017, respectively (see Note 35).
Trading and securities gain (loss) of the Group on financial assets at FVPL, financial assets atFVOCI, futures and interest rate swaps consist of (see Note 27):
2019 2018 2017(In Thousands)
Financial assets at FVPL P=1,095,381 (P=185,008) P=45,871Financial assets at FVOCI 11,963 (10,848) −US treasury futures (90,243) (71,913) 22,665Interest rate swaps (51,371) 31,852 (4,563)
P=965,730 (P=235,917) P=63,973

- 73 -
*SGVFS039395*
13. Contract Balances
Contract Assets and Contract LiabilitiesAs of December 31, 2019 and 2018, the Group’s contract assets amounted to P=14,848.2 million andP=11,445.4 million, respectively, while contract liabilities amounted to P=3,468.2 million andP=5,690.7 million, respectively.
Contract assets represent the right to consideration that was already delivered by the Group in excessof the amount recognized as contracts receivable. This is reclassified to contracts receivable when themonthly amortization of the customer is already due for collection.
In 2019 and 2018, FLI entered into an Agreement for Purchase of Contract Assets with a local bank.The bank agreed to buy the contract assets on a without recourse basis, and FLI agreed to sell, assign,transfer and convey to the bank all its rights, titles, and interest in and to the contracts receivables.Total proceeds from these transactions equivalent to the carrying value of the contracts receivablesold as of December 31, 2019 and 2018 amounted to P=1,539.9 million and P=1,450.0 million,respectively.
Contract liabilities amounting to P=1,967.6 million and P=3,330.2 million as of December 31, 2019 and2018, respectively, pertains to collections from real estate customers which have not reached theequity threshold to qualify for revenue recognition and excess of collections over the good andservices transferred by Group based on POC. For the years ended December 31, 2019 and 2018, theamount of revenue from real estate sales includes amount previously included in contract liabilitiesamounting to P=1,223.0 million and P=825.9 million, respectively.
Contract liabilities also include deferred credit card and loyalty point, membership fees and dues anddeferred exclusive bancassurance access fee amounting to P=1,500.7 million and P=2,360.0 million, asof December 31, 2019 and 2018, respectively.
The significant movement in contract liability is mainly due to revenue recognition of completedperformance obligations.
Performance ObligationInformation about the Group’s performance obligations are summarized below:
Real Estate Operationsa. Real estate sales
The Group entered into contracts to sell with one identified performance obligation which is thesale of the real estate unit together with the services to transfer the title to the buyer upon fullpayment of contract price. The amount of consideration indicated in the contract to sell is fixedand has no variable consideration.
The sale of real estate unit may cover either the (a) lot; (b) house and lot; and (c) condominiumunit and the Group concluded that there is one performance obligation in each of these contracts.The Group recognizes revenue from the sale of these real estate projects under pre-completedcontract over time during the course of the construction.
Payment commences upon signing of the purchase application form and the consideration ispayable in cash or under various financing schemes entered with the customer. The financingscheme would include downpayment of 20% to 30% of the contract price spread over a certainperiod (e.g., 1 to 2 years) at a fixed monthly payment with the remaining balance payable (a) infull at the end of the period either through cash or external financing; or (b) through in-house

- 74 -
*SGVFS039395*
financing which ranges from 2 to 10 years with fixed monthly payment. The amount due forcollection under the amortization schedule for each of the customer does not necessarily coincidewith the progress of construction, which results to either a contract asset or contract liability.
The performance obligation is fully satisfied upon delivery of the completed real estate unit. TheGroup provides one year warranty to repair minor defects on the delivered house and lot andcondominium unit. This is assessed by the Group as a quality assurance warranty and not treatedas a separate performance obligation.
The transaction price allocated to the remaining performance obligations (unsatisfied or partiallysatisfied) as at December 31, 2019 amounted to P=1.8 billion. Performance obligation for thetransaction price amounting to P=1.2 billion will be satisfied within one year.
The remaining performance obligations expected to be recognized within one year and in morethan one year relate to the continuous development of the Group’s real estate projects. TheGroup’s mid-rise condominium units and high rise condominium units are completed withinthree (3) and five (5) years, respectively, from start of construction while house and lots areexpected to be completed within 12 months.
b. Rental AgreementsThe Group entered into lease agreements for its mall retail spaces and office spaces with thefollowing identified performance obligations: (a) lease of space; (b) provisioning of water andelectricity; (c) provision of air conditioning and CUSA services; and (d) administration fee.
Revenue from lease of space is recognized on a straight line basis over the lease term whilerevenue for the remaining performance obligations are recognized when services are rendered.The tenant is required to settle within 7 to 20 days upon receipt of the bill. In case of delay inpayments, a penalty of 3.0% to 36.0% per annum is charged for the amount due for the durationof delay. The lease arrangement would typically require a tenant to pay advance rental equivalentto 3 months and a security deposit equivalent to 3 months rental to cover any breakages after therental period, with the excess returned to the tenant.
Hospitality OperationsThe Group’s hospitality operations deal with guests who are required to pay hotel room chargeswhich cover room services, or room services and breakfast. The Group concluded that providingroom services and selling of breakfast are 2 distinct performance obligation. The hotel room rate isfixed and has no variable consideration. In allocating the hotel room charges, the Group considers thecost plus a predetermined margin for the breakfast and assigns the remaining transaction price torevenue from room services.
Guest usually pays in advance either in full or partially to guarantee reservation. Guest are requiredto settle all outstanding bills before check-out. Corporate account and travel agencies are required topay 30 days from billing date.
Revenue from golf operations includes golf playing rights dues, green fees, golf cart rentals and otherfees. Revenue from golf operations are recognized over the period the related services are rendered.
Revenue from other operating departments include services availed by guest related to spa, sports,leisure, guest transportation, laundry and telephone and internet connections. These are recognized asrevenue when the related services are rendered.

- 75 -
*SGVFS039395*
Banking and Financial ServicesInterest income is recognized for all financial instruments measured at amortized cost and interest-bearing financial instruments classified as FVPL. Interest income is recorded at the EIR. Theadjusted carrying amount is calculated based on the original EIR. The change in carrying amount isrecorded as interest income.
Award credits under customer loyalty programmes are accounted for as a separately identifiablecomponent of the transaction in which they are granted. The fair value of the consideration receivedin respect of the initial sale is allocated between the award credits and the other components of thesale. Income generated from customer loyalty programmes is recognized as part of Service charges,penalties, fees and commissions in the consolidated statement of income.
Service charges, fees and commission income are recognized only upon collection or accrued whenthere is a reasonable degree of certainty as to its collectibility. These fees are generally payablewithin 1 year.
Power OperationsPower revenues consist of revenue from generation and from sale of retail electricity. Revenue fromgeneration is from the operation of the 3x135 MW CFB coal thermal power plant while revenue fromsale of retail electricity (non-generation) is from the sale to customers at contract price of electricitypurchased from Wholesale Electricity Spot Market (WESM) and sold to customers at contract price.
The Group entered into Electric Power Purchase Agreement (EPPA) and retail supply contracts(RSC) with 2 identified performance obligations which is to deliver electric power to customers andprovide ancillary services to customers. These 2 performance obligations are to be combined as oneperformance obligation since these are not distinct within the context of the contract as the buyercannot benefit from the contracted capacity alone without the corresponding energy and the buyercannot obtain energy without contracting a capacity. The combined performance obligation qualifiesas a series of distinct goods or services that are substantially the same and have the same pattern oftransfer. Revenue is recognized over time using output method in the period actual capacity isgenerated since the customer consumes the benefit from the performance of the related dispatched ofenergy.
As a practical expedient allowed under PFRS 15, the Group recognizes power revenue in the amountto which the Group has a right to invoice since the Group bills a fixed amount for every MW ofelectricity delivered. The transaction price allocated to the remaining performance obligation is notseparately disclosed as the Group recognizes revenue from the satisfaction of the performanceobligation in the amount to which the Group has a right to invoice.
Some contracts with customers provide unspecified quantity of energy and/or includes provisionalERC rates, and volume and prompt payment discounts that give rise to variable consideration. Thevariable consideration is estimated at contract inception and constrained until the associateduncertainty is subsequently resolved.
As indicated in the EPPA and RSC, the customer is required to settle within 25 days after the billingcut-off date. In case of delay in payments, a penalty of 3.0% per month is charged for the amount duefor the duration of delay. The RSC would typically require a customer to pay a security depositequivalent to projected highest monthly power bill for the first contract year of the contract to serveas a guarantee for payment of obligation, with the excess to be returned to the customer.

- 76 -
*SGVFS039395*
The Group assessed that it is acting as the principal in its RSC arrangements with customers. TheGroup has assessed that it has the control over the specified good or service before it is transferred tothe customers as evidenced by the Power Supply Agreement (PSA) with power suppliers. The Groupassessed that it is primarily responsible for providing the services to the customers, has the latitude inestablishing prices, and bears the customer’s credit risk for the amount of receivable from thecustomers.
Sugar OperationsThe Group enters into milling contracts with various planters, which provide for a sharing betweenthe planters and the Group for sugar and molasses produced in the sugar mill. The milling contractsare effective for a period of 15 agricultural crop years, subject to extension of another 15 crop years atthe option of the Group (see Note 33).
Revenue from processing of the planters’ sugarcane to raw sugar (milling) and planter’s and otherthird party’s raw sugar into refined sugar (tolling) is recognized over time as the customer receivesthe benefit from the performance of the related service.
Revenue from sugar sales is recognized at a point when control over the sugar and molasses aretransferred to the customer through the endorsement of quedans or physical delivery of the goods.
Cost to Obtain Contracts and Contract Fulfillment AssetsThe rollforward of the cost to obtain contract included in the other assets is as follows:
2019 2018(In Thousands)
Balance at beginning of year P=278,122 P=‒Reclassification from prepaid expense ‒ 789,574Impact of adoption of PFRS 15 ‒ (446,834)Additions 908,319 599,040Amortization (Note 29) (718,634) (663,658)Balance at end of year (Note 20) P=467,807 P=278,122
For the years ended December 31, 2019 and 2018, additions of contract fulfillment costs amounted toP=281.2 million and P=827.2 million, respectively, while amortization of contract fulfillment costsamounted to P=530.2 million and P=1,926.5 million, respectively. Contract fulfillment assets isincluded as part of Real estate inventories.
The Group undertook a review of its major contracts to identify indicators of impairment of contractfulfillment assets. The Group determined whether or not the contract fulfillment assets were impairedby comparing the carrying amount of the asset to the remaining amount of consideration that theGroup expects to receive less the costs that relate to providing services under the relevant contract.
In determining the estimated amount of consideration, the Group used the same principles as it doesto determine the contract transaction price.
In line with the Group’s accounting policy, as set out in Note 2, if a contract or specific performanceobligation exhibited marginal profitability or other indicators of impairment, judgement was appliedto ascertain whether or not the future economic benefits from these contracts were sufficient torecover these assets. In performing this impairment assessment, management is required to make anassessment of the costs to complete the contract. The ability to accurately forecast such costsinvolves estimates around cost savings to be achieved over time, anticipated profitability of the

- 77 -
*SGVFS039395*
contract, as well as future performance against any contract-specific key performance indicators thatcould trigger variable consideration, or service credits.
14. Real Estate Inventories
This account consists of:
2019 2018(In Thousands)
Real estate inventories - at cost Lots, condominium and residential units for sale P=41,037,920 P=45,868,621 Land and land development 30,325,604 33,601,238
P=71,363,524 P=79,469,859
A summary of the movement in lots, condominium and residential units for sale is set out below:
2019 2018(In Thousands)
Balances at beginning of year P=45,868,621 P=37,222,358Construction/development costs incurred 4,045,040 16,229,163Land cost transferred from land and land
development 1,321,591 1,491,054Capitalized borrowing costs (Note 24) 889,543 1,040,574Cost of inventories sold (Note 28) (11,086,875) (10,114,528)Balances at end of year P=41,037,920 P=45,868,621
Borrowing costs capitalized as project costs are interests on loans obtained to finance the Group’songoing projects. Capitalized borrowing costs amounted to P=889.5 million, P=1,040.6 million andP=779.1 million in 2019, 2018 and 2017, respectively. The capitalization rates used are 1.5% in 2019and 2.0% in 2018 and 2017.
A summary of the movements in land and land development is set out below:
2019 2018(In Thousands)
Balances at beginning of year P=33,601,238 P=27,652,612Land acquisitions 2,020,868 7,001,040Transfers to:
Lots, condominium and residential units for sale (1,321,591) (1,491,054)Investment properties - net (Note 16) (3,854,113) (286,719)
Cost of lots sold (Note 28) (483,283) (207,363)Site development and incidental costs 362,485 932,722Balances at end of year P=30,325,604 P=33,601,238
Borrowing costs capitalized as part of Real estate inventories, where activities necessary to prepare itfor its intended use is ongoing, amounted to P=102.4 million, P=126.2 million and P=146.0 million in2019, 2018 and 2017, respectively (see Note 24). Capitalization rates used range from 2.8% to 4.7%in 2019, 2.2% to 4.7% in 2018, and 2.5% to 4.8% in 2017.

- 78 -
*SGVFS039395*
Acquisition of land and land development included under cash flows used in operating activitiesamounted to P=2,894.5 million, P=2,014.8 million and P=1,859.9 million for the years endedDecember 31, 2019, 2018 and 2017, respectively.
As of December 31, 2019 and 2018, on account additions to land and land development which remainoutstanding amounted to P=3,054.9 million and P=5,690.0 million, respectively, and these arerecognized as part of Accounts payable, accrued expenses and other liabilities (see Note 23).
In February 2009, FLI signed an agreement with the Cebu City Government to develop 50.6 hectaresof the South Road Properties (SRP), a 300-hectare reclaimed land project located in Cebu City(see Note 33). The agreement involves:
(a) purchase by the Group of 10.6 hectares of the property to be developed into a modern urbancenter consisting of residential, office, commercial, hotel and leisure buildings and a publicpromenade which is a 1 kilometer long waterfront lifestyle strip that will offer a range of seasideleisure activities. The property was fully paid in 2015. Payments made to the Cebu CityGovernment in 2015 amounted to P=141.8 million.
(b) development of the remaining 40 hectares of the property under a profit-sharing arrangement withthe Cebu City Government. The profit sharing of FLI and the Cebu City Government is 90.0%and 10.0%, respectively. The 40 hectares will be developed in 4 phases over a 20-year period,with the Group contributing the development costs, as well as the marketing and managementservices.
In 2015, FLI, CPI and FAI acquired additional 19.2 hectares of SRP from Cebu City Government fora total consideration of P=3,379.1 million. The purchase transaction was completed upon full paymentof the purchase price on December 17, 2019. Lots assigned to FLI and FAI were included as part ofReal estate inventories, while lots assigned to CPI were included as part of Investment properties(see Notes 16 and 33). In 2019, portion of lots assigned to FLI and FAI were transferred from realestate inventories to investment properties as a result of the change in use of these lots.
The Group reclassified certain accounts in 2018 to conform to the 2019 presentation. PAS 1 requiresan entity to present a consolidated statement of financial position as at the beginning of the earliestperiod presented when it reclassifies items in its financial statements. Reserve development costspresented under “Accounts payable, accrued expenses and other liabilities” were reclassified to landand land development. The impact on total current assets and total current liabilities as ofDecember 31, 2018 is immaterial.
15. Coal, Spare Parts and Other Inventories
This account consists of:
2019
2018(As restated,
see Note 2)(In Thousands)
Power inventories - at cost Coal P=235,093 P=402,149
Spare parts 190,889 35,459 Fuel and others 73,894 45,423
499,876 483,031
(Forward)

- 79 -
*SGVFS039395*
2019
2018(As restated,
see Note 2)(In Thousands)
Sugar inventories Materials and supplies - at NRV P=122,606 P=143,880
Sugar and molasses - at cost 13,853 9,160136,459 153,040
Hospitality inventories - at cost Food and beverage 23,714 43,664 Others 50,292 20,847
74,006 64,511P=710,341 P=700,582
Materials and supplies at cost amounting to P=149.0 million and P=156.3 million as of December 31,2019 and 2018, respectively, were written down to net realizable value of P=122.6 million andP=143.9 million, respectively. The loss on the write down amounted to P=26.4 million andP=12.4 million in 2019 and 2018, respectively (see Note 29).
These inventories were not pledged or used as collateral to secure any obligation as of December 31,2019 and 2018.
16. Investment Properties
The rollforward of this account follows:
December 31, 2019
LandBuildings and
Improvements
Furniture,Fixtures andMachineries
Constructionin Progress Total
(In Thousands)CostBalances at beginning of year P=31,335,565 P=28,887,241 P=198,325 P=14,272,872 P=74,694,003Additions 870,185 1,495,965 25,737 8,376,525 10,768,412Transfers (Note 14) 3,854,113 ‒ ‒ ‒ 3,854,113Disposals/reclassifications
(Notes 2 and 17) (231,428) − (111,173) ‒ (342,601)Balances at end of year 35,828,435 30,383,206 112,889 22,649,397 88,973,927Accumulated depreciation and
amortizationBalances at beginning of year ‒ 5,305,963 152,180 ‒ 5,458,143Depreciation and amortization
(Notes 28 and 29) ‒ 918,415 45,692 ‒ 964,107Disposals/reclassifications
(Notes 2 and 17) ‒ − (102,835) ‒ (102,835)Balances at end of year ‒ 6,224,378 95,037 ‒ 6,319,415Accumulated impairment lossBalances at beginning of year 70,237 33,129 ‒ ‒ 103,366Provision for probable losses
(Notes 3 and 29) 26,096 5,179 ‒ ‒ 31,275Disposals/reclassifications (33,610) (18,080) ‒ ‒ (51,690)Balances at end of year 62,723 20,228 ‒ ‒ 82,951Net book value P=35,765,712 P=24,138,600 P=17,852 P=22,649,397 P=82,571,561

- 80 -
*SGVFS039395*
December 31, 2018
LandBuildings andImprovements
Furniture,Fixtures andMachineries
Constructionin Progress Total
(In Thousands)CostBalances at beginning of year P=30,974,310 P=26,305,138 P=206,926 P=10,840,566 P=68,326,940Additions (Notes 14, 17 and 39) 116,647 2,582,103 2,308 3,432,306 6,133,364Transfers (Note 14) 286,719 − − − 286,719Disposals/reclassifications (Note 17) (42,111) − (10,909) − (53,020)Balances at end of year 31,335,565 28,887,241 198,325 14,272,872 74,694,003Accumulated depreciation and
amortizationBalances at beginning of year – 4,600,110 138,109 − 4,738,219Depreciation and amortization
(Notes 28 and 29) − 727,352 14,071 − 741,423Disposals/reclassifications − (21,499) – − (21,499)Balances at end of year − 5,305,963 152,180 − 5,458,143Accumulated impairment lossBalances at beginning of year 74,667 16,275 − – 90,942Provision for probable losses
(Notes 3 and 29) 16,913 31,027 − − 47,940Disposals/reclassifications (21,343) (14,173) − − (35,516)Balances at end of year 70,237 33,129 − − 103,366Net book value P=31,265,328 P=23,548,149 P=46,145 P=14,272,872 P=69,132,494
The Group’s investment properties include land and buildings utilized in mall operations, buildingsand building improvements, land improvements acquired in settlement of loans and receivables frombanking operations, and other properties held for long-term rental yields and for capital appreciation.Land also includes SRP acquired from Cebu City Government in 2015 (see Notes 14 and 33).
As of December 31, 2019 and 2018, additions to investment properties which remain outstanding andare recognized as part of Accounts payable, accrued expenses and other liabilities amounted toP=735.6 million and P=491.5 million, respectively (see Note 23).
Borrowing costs capitalized as part of 2019 investment properties amounted to P=404.1 million,P=1,132.1 million, and P= 1,203.6 million in 2019, 2018 and 2017, respectively (see Note 24).Capitalization rates used ranges from 1.5% to 7.7% in 2019 and 2018 and 1.6% to 5.1% in 2017.
The aggregate fair value of the Group’s investment properties amounted to P=293,346.3 million andP=124,166.8 million as of December 31, 2019 and 2018, respectively. The fair values are based onthird party appraisals performed in 2019 by an SEC accredited independent appraiser andmanagement appraisal updated using current and year-end values and assumptions.
The aggregate fair value of investment properties from real estate operations was determined usingthe Income Approach based on discounted cash flow analysis for buildings and Market approach forland. In Income Approach, all expected cash flow from the use of the assets were projected anddiscounted using the appropriate discount rate reflective of the market expectations.
The aggregate fair value of investment properties from banking and financial services was determinedon the basis of recent sales of similar properties in the same areas as the investment properties, takinginto account the economic conditions prevailing at the time the valuations were made.
Rental income from investment properties amounted to P=7,464.2 million, P=6,032.0 million andP=4,780.1 million in 2019, 2018 and 2017, respectively. Cost of mall and rental services(excluding amortization of BTO rights) from investment properties amounted to P=978.6 million,P=828.8 million and P=784.6 million in 2019, 2018 and 2017, respectively (see Note 28).

- 81 -
*SGVFS039395*
The Group’s investment properties were not pledged or used as collateral to secure any obligation asof December 31, 2019 and 2018.
17. Property, Plant and Equipment
The rollforward analysis of this account follows:
December 31, 2019
Land andBuildings
Coal ThermalPower Plant
(Note 24)
Machineryand
EquipmentTransportation
Equipment
Furnitureand Fixtures &Communication
EquipmentLeasehold
ImprovementsConstruction
in Progress Total(In Thousands)
CostBalances at beginning of year P=9,126,118 P=30,423,979 P=4,699,848 P=274,882 P=4,539,765 P=3,850,392 P=3,815,615 P=56,730,599Additions 1,037,482 ‒ 590,005 44,223 654,922 188,293 565,265 3,080,190Disposals (888,870) (139,896) (181,397) (5,218) (33,089) (23,290) − (1,271,760)Reclassifications (Notes 2 and 16) (740,049) (268,264) ‒ ‒ 111,173 ‒ ‒ (897,140)Balances at end of year 8,534,681 30,015,819 5,108,456 313,887 5,272,771 4,015,395 4,380,880 57,641,889Accumulated depreciation,
amortization andimpairment loss
Balances at beginning of year 1,544,609 2,427,792 2,825,704 191,680 2,827,583 2,490,378 ‒ 12,307,746Depreciation and amortization
(Notes 28 and 29) 218,383 1,115,296 166,500 33,968 412,117 370,008 ‒ 2,316,272Disposals (12,589) (17,632) (137,423) (2,705) (29,056) (16,964) − (216,369)Reclassifications (Notes 2 and 16) (24,076) − − − 102,835 − ‒ 78,759Balances at end of year 1,726,327 3,525,456 2,854,781 222,943 3,313,479 2,843,422 ‒ 14,486,408Net book value P=6,808,354 P=26,490,363 P=2,253,675 P=90,944 P=1,959,292 P=1,171,973 P=4,380,880 P=43,155,481
December 31, 2018
Land andBuildings
Coal ThermalPower Plant
(Note 24)
Machineryand
EquipmentTransportation
Equipment
Furnitureand Fixtures &Communication
EquipmentLeasehold
ImprovementsConstruction
in Progress Total(In Thousands)
CostBalances at beginning of year P=8,957,982 P=30,284,023 P=4,268,273 P=293,067 P=4,187,930 P=3,687,789 P=3,242,352 P=54,921,416Additions 266,925 139,956 578,172 24,527 473,290 163,689 617,369 2,263,928Disposals (29,585) − (200,092) (42,712) (67,960) (1,086) (28,614) (370,049)Reclassifications (Note 16) (69,204) − 53,495 − (53,495) − (15,492) (84,696)Balances at end of year 9,126,118 30,423,979 4,699,848 274,882 4,539,765 3,850,392 3,815,615 56,730,599Accumulated depreciation,
amortization andimpairment loss
Balances at beginning of year 1,348,893 1,311,613 2,624,667 207,534 2,356,862 2,047,588 – 9,897,157Depreciation and amortization
(Notes 28 and 29) 231,307 1,116,179 148,154 26,613 566,963 443,876 − 2,533,092Impairment loss (Note 29) − − 82,353 − − − − 82,353Disposals/reclassifications
(Note 16) (35,591) − (29,470) (42,467) (96,241) (1,086) − (204,855)Balances at end of year 1,544,609 2,427,792 2,825,704 191,680 2,827,584 2,490,378 − 12,307,747Net book value P=7,581,509 P=27,996,187 P=1,874,144 P=83,202 P=1,712,181 P=1,360,014 P=3,815,615 P=44,422,852
Cost of land and building, and machinery and equipment, acquired through finance lease, amountedto P=994.4 million and P=11.6 million in 2016 (nil in 2018 and 2017; see Notes 23 and 32). Theseproperties were reclassified to ROU assets account as a result of adoption of PFRS 16(see Note 2).
Construction in progress pertains to buildings under construction which will be used in the operationsof the Group. These are not depreciated until such time as the relevant assets are completed and putinto operational use.
Capitalized borrowing cost included as part of additions to construction-in-progress amounted toP=151.3 million, P=55.8 million and P=67.2 million, in 2019, 2018 and 2017, respectively (see Note 24).The capitalization rates used are 2.8% in 2019, 5% in 2018 and 2.5% to 5.0% in 2017.
Portion of the Group’s properties, plant and equipment were used as collateral to secure loans as ofDecember 31, 2019 and 2018 (see Note 24).

- 82 -
*SGVFS039395*
18. Investments in Joint Ventures and Associate
This account consists of:
2019 2018(In Thousands)
Acquisition costBalances at beginning of year P=1,921,802 P=1,674,453Additions 658,913 250,000Return of investment ‒ (2,651)Balances at end of year 2,580,715 1,921,802
Accumulated share in net lossBalances at beginning of year (1,187,905) (801,381)Share in net loss (Notes 27 and 29) (358,199) (364,328)Dividends received (29,995) (22,196)Balances at end of year (1,576,099) (1,187,905)
Accumulated share in OCIBalances at beginning and end of year 724 724
P=1,005,340 P=734,621
Investments in Joint VenturesEW Ageas LifeOn May 28, 2015, EW and Ageas entered into a joint venture agreement to form EW Ageas Life toengage in the life insurance business with a capitalization of P=2,010.0 million and with ultimateownership interest of EW of 50.0% less 1 share. EW’s initial investment amounted toP=500.0 million. The joint venture agreement provided certain conditions that should be satisfied forthe consummation of the agreement, which include among others, obtaining all the requiredregulatory approvals. In October 2015, the SEC approved the registration of EW Ageas Life. Theregistered office address of EW Ageas Life is at One World Place, 32nd Street, Bonifacio GlobalCity, Taguig City.
In November 2015, EW Ageas Life and EW entered into a 20-year exclusive distribution agreement.Under the distribution agreement, EW Ageas Life will have exclusive access to the branch network ofEW for the distribution of its insurance products (the exclusive bancassurance access). Under thejoint venture agreement, within a period of 7 years from consummation, the joint venture entity mayat any time request for additional funding from EW and Ageas.
On April 10, 2019, EW and Ageas each infused additional capital to EW Ageas Life amounting toP=350.0 million.
On September 6, 2018, EW and Ageas each infused additional capital to EW Ageas Life amountingto P=250.0 million.
For the years ended December 31, 2019, 2018 and 2017, share in net losses of EW Ageas Lifeamounted to P=339.5 million, P=395.8 million and P=449.1 million, respectively (see Note 29). Therewere no dividends received from EW Ageas Life in 2019, 2018 and 2017.
As of December 31, 2019 and 2018, the carrying value of investment in EW Ageas Life amounted toP=700.0 million and P=689.5 million, respectively.

- 83 -
*SGVFS039395*
CHICHI is a joint venture between the Parent Company and Archipelago International Pte. Ltd. (AIPL), acorporation registered in Singapore. CHI was incorporated in the Philippines and is operating as themanagement entity of the Group’s hotels including Crimson Filinvest City Manila, Crimson Resortand Spa Mactan, Quest Hotel and Conference Center (QHCC) Cebu, QHCC Clark and Mimosa GolfClark, and Crimson Resort and Spa Boracay. The registered office address of CHI is at 8th Floor,Vector Two Building, Northgate Cyberzone, Filinvest City, Alabang, Muntinlupa City.
Cost of investment in CHI amounted to P=1.8 million as of December 31, 2019 and 2018. For theyears ended December 31, 2019, 2018 and 2017, the Group’s share in net income of CHI amounted toP=41.2 million, P=31.5 million, and P=22.4 million, respectively (see Note 27). Dividends receivedamounted to P=30.0 million, P=22.2 million and P=14.4 million in 2019, 2018 and 2017, respectively.
As of December 31, 2019 and 2018, the carrying value of investment in CHI amounted toP=56.4 million and P=45.2 million, respectively.
PROMEIOn July 4, 2019, PROMEI, a joint venture company with ENGIE was incorporated to operate,maintain and repair existing and future technical systems, including but not limited to heating,ventilation and air conditioning systems and distributed energy systems, and implement newtechnologies in connection with saving energy and reducing operating costs. PROMEI is 47.5%owned by FDC and 52.5% owned by ENGIE. PROMEI has not started commercial operations as ofDecember 31, 2019. The registered office address of PROMEI is at Unit 2103, The Orient Square,F. Ortigas, Jr. Rd. Ortigas Centre, San Antonio, Pasig city
As of December 31, 2019, the carrying value of investment in PROMEI amounted to P=12.0 million.
FLOWOn August 20, 2019, FDC and Hitachi Aqua-tech Engineering Pte. Ltd. entered into a joint ventureagreement to form FLOW to engage in operating waterwork, sewerage and sanitation systems andservices. On October 29, 2019, the SEC approved the registration of FLOW. The registered officeaddress of FLOW is at Unit D, 11/F Cyber Sigma Building, Lawton Avenue, Mckinley West,Barangay Fort Bonifacio, 1630 Taguig City, Metro Manila.
As of December 31, 2019, the carrying value of investment in FLOW amounted to P=20.6 million.
The joint venture has no contingent liabilities or capital commitments as of December 31, 2019and 2018.
Below is a summary of certain financial information concerning these individually immaterial jointventures:
2019 2018(In Thousands)
Carrying amount P=789,022 P=734,621Share in net income and total comprehensive income (298,276) (364,328)
Investment in AssociateLIPAD Corp.On February 18, 2019, LIPAD Corp. was incorporated to engage in the operation and maintenance ofairports. LIPAD Corp. is owned 42.5% by FDC, 33.0% by JG Summit Holdings Inc. (JGSHI), 15.0%by Changi Airports Philippines (I) Pte. Ltd. (CAP) and 9.5% by the Philippine Airport Ground

- 84 -
*SGVFS039395*
Support Solutions, Inc. (PAGSSI) (collectively referred to as North Luzon Airport Consortium orNLAC).
On January 21, 2019, NLAC signed the contract that grants a 25-year concession to the consortium todevelop the commercial assets, operate and maintain project facilities and fit-out the new terminal inClark.
LIPAD Corp.’s commercial operations started on August 16, 2019 upon the transfer of the operationsand maintenance of Clark International Airport (CIA). The registered office address of LIPAD Corp.is at Clark Field, Clark Freeport Zone, Andres Bonifacio Avenue, Clark Special Economic Zone,Dau, Mabalacat City, Pampanga.
For the year ended December 31, 2019, the Group’s share in net loss of LIPAD Corp. amounted toP=59.9 million (see Note 29). There were no dividends received from LIPAD Corp. in 2019.
As of December 31, 2019, the carrying value of investment in LIPAD Corp. amounted toP=216.3 million.
19. Independent Power Producer Administration (IPPA) Contracts and EPPA
In 2014, Power Sector Asset and Liabilities Management (PSALM) conducted open public biddingswherein the Group participated and was selected as the winning bidder of the following IPPAcontracts:
IPPA Contract for the Strips of Energy of the Unified Leyte Geothermal Power Plant (ULGPP)On January 29, 2014, PSALM issued the Notice of Award to FDCUI as one of the IPPA for the stripsof energy of the ULGPP located in Tongonan, Leyte expiring July 25, 2021.
IPPA Contract for output of Mt. Apo 1 and 2 Geothermal Power PlantsOn October 24, 2014, FDC Misamis won the bidding for the selection and appointment of the IPPAfor the output of the Mt. Apo 1 and 2 Geothermal Power Plants located in Kidapawan City, NorthCotabato. The IPPA contract is co-terminus with the Mt. Apo 1 and 2 Power Producer Agreements(PPAs) expiring on February 15, 2022 and June 17, 2024, respectively.
These IPPA contracts took effect on December 26, 2014. Since the effectivity of the IPPA contracts,EPPAs were signed and agreed with electric cooperatives for a period of 1 to nine 9 years.
In 2014, the Group determined that the rights under the IPPA contracts qualify as an intangible asset.The monthly fixed payment attributable to the cost of acquiring these rights has been accounted for asan intangible asset. The generation payments represent the consideration for the actual capacityreceived by the IPPA and are recognized in the consolidated statement of income when incurred.
The IPPA contracts for ULGPP and Mt. Apo 1 and 2 were terminated on September 4, 2017 andDecember 28, 2017, respectively (see Note 33). As of December 31, 2017, IPPA rights and therelated liability on IPPA contract were derecognized.
Amortization of IPPA amounted to P=1,138. 6 million in 2017 (see Note 28). Accretion expense onliability on IPPA contract amounted to P=544.8 million in 2017 (see Note 29).

- 85 -
*SGVFS039395*
20. Other Assets
This account consists of:
2019 2018(In Thousands)
Intangible assets BTO rights (Note 33) P=2,665,515 P=2,485,978 Branch licenses 2,167,600 2,167,600 Capitalized software 718,457 727,953
Customer relationship and core deposits 148,358 159,8125,699,930 5,541,343
Input taxes 4,324,115 4,633,473Advances to contractors and suppliers 2,629,635 3,600,563Creditable withholding taxes 1,769,086 1,307,209Derivative assets (Notes 36, 37 and 38) 1,534,551 2,076,533Prepaid expenses 1,372,896 1,293,372Repossessed assets 998,616 786,005Deposits 821,434 955,528Interoffice items 736,788 412,395Cost to obtain contracts (Note 13) 467,807 278,122Advances to joint venture partners 408,833 322,411Card acquisition cost 408,553 337,960Restricted cash 359,250 314,694Documentary stamps 210,060 164,225Equity on car plan 161,915 158,756Deferred costs 87,630 104,154Construction materials and supplies 82,438 83,464Biological assets (Notes 28 and 33) 68,638 61,801Short-term deposits 47,685 18,794Returned cash and other cash items 14,465 7,595Others (Note 33) 755,026 771,813
22,959,351 23,230,210Less allowance for impairment losses 334,386 8,131
P=22,624,965 P=23,222,079
a. Intangible assets includes:
BTO RightsBTO rights pertain to the cost related to the Build, Transfer and Operate agreement with theProvince of Cebu (Cebu Province) entered into on March 26, 2012. The BTO project relates tothe development, construction and operation of business process outsourcing (BPO) complex bythe Group at the land properties owned by Cebu Province located at Salinas, Lahug Cebu City(see Note 33). As of December 31, 2019 and 2018, cost of completed portion of the BTO projectamounted to P=2,665.5 million and P=1,260.0 million, respectively.
In 2019, 2018 and 2017, related amortization recognized as part of Cost of mall and rentalservices amounted to P=69.6 million, P=51.8 million and P=49.6 million, respectively (see Note 28).Related rent income amounting to P=106.5 million, P=142.4 million and P=117.1 million in 2019,2018 and 2017, respectively, was recognized as part of Mall and rental revenues in theconsolidated statement of income.

- 86 -
*SGVFS039395*
Branch LicensesBranch licenses amounting to P=2,167.6 million as of December 31, 2019 and 2018 represent:· 1 branch license acquired by EW from the BSP amounting to P=0.2 million in 2015;· 25 branch licenses acquired by EW from the BSP amounting to P=505.2 million in 2014;· 10 branch licenses acquired by EW from the BSP amounting to P=214.8 million in 2013;· 42 branch licenses acquired by EW from the BSP amounting to P=822.0 million in 2012; and· 46 branch licenses acquired by EW from the acquisition of GBI amounting to P=625.4 million
in 2011.
Capitalized SoftwareCapitalized software pertains to costs of computer software licenses and programs acquired bythe Group for its banking and power operations.
Card Acquisition CostCard acquisition costs represent capitalized commissions paid to third-party brokers forsuccessfully originated credit card accounts, which are amortized over 2 years, the averagerelationship life with customers.
Customer Relationship and Core DepositsCustomer relationship and core deposits resulted from the business combination between EW andAIGPASB in 2009 which amounted to P=154.6 million and P=40.4 million, respectively.
The rollforward analysis of the Group’s intangible assets with finite lives as of December 31follows:
2019
BTO RightsCapitalized
Software
CustomerRelationship and
Core Deposits Total(In Thousands)
CostBalances at beginning of year P=2,609,370 P=2,227,668 P=259,754 P=5,096,792Additions 249,090 125,972 – 375,062Balance at end of year 2,858,460 2,353,640 259,754` 5,471,854Accumulated amortizationBalances at beginning of year 123,392 1,499,715 99,942 1,723,049Amortization (Notes 28 and 29) 69,553 135,468 11,454 216,475Balance at end of year 192,945 1,635,183 111,396 1,939,524Net book value P=2,665,515 P=718,457 P=148,358 P=3,532,330
2018
BTO RightsCapitalized
Software
CustomerRelationship and
Core Deposits Total(In Thousands)
CostBalances at beginning of year P=2,494,046 P=2,031,408 P=259,754 P=4,785,208Additions 115,324 196,260 – 311,584Balances at end of year 2,609,370 2,227,668 259,754 5,096,792Accumulated amortizationBalances at beginning of year 71,640 1,324,778 80,813 1,477,231Amortization (Notes 28 and 29) 51,752 174,937 19,129 245,818Balances at end of year 123,392 1,499,715 99,942 1,723,049Net book value P=2,485,978 P=727,953 P=159,812 P=3,373,743
- 87 -
*SGVFS039395*
b. Input taxes represent the value-added tax (VAT) due or paid on purchases of goods and servicessubjected to VAT that the Group can claim against any future liability to the Bureau of InternalRevenue for output VAT on sale of goods and services subjected to VAT.
c. Advances to contractors and suppliers represent downpayment to contractors and suppliers whichwill be applied against future billings for development and construction contracts. As ofDecember 31, 2019 and 2018, advances to contractors and suppliers are net of allowance forprobable losses of P=3.4 million and P=3.2 million, respectively (see Note 29).
d. Creditable withholding taxes are taxes withheld by the withholding agents from payment to theGroup which are creditable against the income tax liability of the Group.
e. Prepaid expenses include commission paid to brokers, deferred rent, insurance, subscription andtaxes. As of January 1, 2018, prepaid commissions paid to brokers relating to the sale of realestate inventories which did not qualify for revenue recognition was reclassified to Cost to obtaincontracts (see Note 13).
f. Repossessed assets pertain to other foreclosed properties which do not qualify as land andbuilding. The movements in this account are as follows:
2019 2018(In Thousands)
CostAs of January 1 P=934,580 P=1,077,064Additions 2,850,155 2,477,283Disposals (2,611,128) (2,619,767)As of December 31 1,173,607 934,580Accumulated DepreciationAs of January 1 148,575 192,906Depreciation and amortization 293,233 325,698Disposals (267,017) (370,029)As of December 31 174,791 148,575Net book value, gross of impairment 998,816 786,005Accumulated impairment lossesAs of January 1 – 100,671Provisions (Note 29) 2,256 71,945Disposals (2,056) (172,616)As of December 31 200 −Net book value, net of impairment P=998,616 P=786,005
g. Deposits include EW’s refundable deposits with Master Card and Visa related to its credit cardbusiness and FLI’s deposits in escrow for payments of raw land pending finalization of contractto sell.
h. Advances to joint venture partners are advances (e.g., for property taxes and permits) which arenormally applied against the share of the joint venture partners from the sale of the joint ventureproperties.
i. Restricted cash pertains to funds intended for debt repayment and is not available to managementfor any disbursement transactions other than its specified purpose (see Note 24).

- 88 -
*SGVFS039395*
j. Deferred costs pertain to FDCUI expenditures incurred related to project development and sitepreparation.
k. Construction materials and supplies shall be used in the development and construction of theGroup’s residential subdivisions, condominiums and commercial buildings.
l. Biological assets of the Group consist of sugarcane crops. The rollforward of the Group’sbiological assets follows:
2019 2018(In Thousands)
Balances at beginning of year P=61,801 P=65,987Additions (Note 28) 118,760 114,209Costs of sales (Note 28) (111,923) (118,395)Balances at end of year P=68,638 P=61,801
The following table shows the estimated physical quantities of the Group’s biological assets andraw sugar production:
2019 2018Sugarcane crops (in metric tons) 57,764 66,606Raw sugar (in 50 kilogram bag) 109,797 124,725
There are no restrictions on the Group’s biological assets as of December 31, 2019 and 2018.
m. Short-term deposits pertain to cash placements with maturity of more than 3 months up to12 months and earn interest at prevailing market rates.
n. Others include sundry debits, interoffice floats and developmental rights amounting toP=127.3 million and P=577.7 million as of December 31, 2019 and 2018, respectively.
The movements in the allowance for impairment losses on other assets of the Group are as follows:
2019 2018(In Thousands)
Balances at beginning of year P=8,131 P=492,491Provision (recoveries) during the year (Note 29) 335,891 (74,055)Reversal of allowance from disposals − (172,616)Write-off and others (9,636) (237,689)Balances at end of year P=334,386 P=8,131
The Group recognized provision for probable losses on other assets amounting to P=335.9 million,P=74.1 million and P=322.5 million in 2019, 2018 and 2017, respectively (see Notes 3 and 29).

- 89 -
*SGVFS039395*
21. Deposit Liabilities
This account consists of:
2019 2018(In Thousands)
Time P=104,605,705 P=126,915,196Savings 98,007,003 70,733,509Demand 68,820,166 53,480,289Long-term negotiable certificates of deposit (LTNCD) 13,335,031 15,797,150
P=284,767,905 P=266,926,144
Under existing BSP regulations, non-FCDU deposit liabilities of EW are subject to unified reserverequirements equivalent to 20.0% from May 30, 2014 to March 1, 2018 (under BSP Circular 832),19.0% from March 2, 2018 to May 31, 2018 (under BSP Circular 997), and 18.0% from June 1, 2018and thereafter (under BSP Circular 1004). LTNCDs are subject to required reserves of 4.0% if issuedunder BSP Circular 304, and 7.0% if issued under BSP Circular 842.
On the other hand, EWRB is required to maintain regular reserves equivalent to 5.0% against demanddeposit and 3.0% against savings and time deposit.
As of December 31, 2019 and 2018, EW and EWRB is in compliance with such regulations. As ofDecember 31, 2019 and 2018, Due from BSP of EW (see Note 6) amounting to P=34,287.3 millionand P=40,309.0 million, respectively, were set aside as reserves for deposit liabilities, as reported to theBSP.
Of the total deposit liabilities of EW as of December 31, 2019 and 2018, about 36.6% and 46.8%,respectively, are subject to periodic interest repricing. The remaining deposit liabilities earn annualfixed interest rates ranging from 0.1% to 5.0% in 2019 and 0.1% to 5.0% in 2018 and 2017.The Group’s interest expense on deposit liabilities amounted to P=6,431.4 million, P=4,236.9 million,and P=2,938.1 million in 2019, 2018 and 2017, respectively (see Note 28).
LTNCDLTNCD issued by EW includes the following:
Series Issue DateMaturity
DateFace
ValueCoupon
Rate
AverageEffectiveInterest
RateRepayment
TermsCarrying Value2019 2018
1 11/23/2012 5/23/2018 4,650 5.000% 4.37% Quarterly P=− P=−2 12/5/2013 6/5/2019 2,484 3.250% 3.48% Quarterly − 2,4753 10/23/2014 4/24/2020 925 4.500% 4.42% Quarterly 925 9244 3/21/2017 9/21/2022 10,000 4.000% 4.10% Quarterly 9,973 9,9645 6/7/2018 12/7/2023 2,451 4.625% 4.78% Quarterly 2,437 2,434Total P=13,335 P=15,797
LTNCD Due 2018 (LTNCD Series 1)In 2013 and 2012, EW issued unsecured LTNCD which matured on May 23, 2018. This has beenreleased in tranches - first tranche amounting to P=1,534.6 million was issued at a discount onNovember 23, 2012, and the second to seventh tranches aggregating to P=3,115.4 million were issuedat a premium in February to May 2013.

- 90 -
*SGVFS039395*
LTNCD Due 2019 (LTNCD Series 2)In 2013, EW issued unsecured LTNCD which matured on June 5, 2019. The first to third tranches ofthe LTNCD Series 2 aggregating to P=748.5 million were issued in December 2013. The discount, netof debt issue costs, related to the issuance of the LTNCD Series 2 in 2013 amounted to P=8.4 million.The fourth and fifth tranches of the LTNCD Series 2 aggregating to P=1,735.7 million were issued inFebruary and April 2014, respectively. The discount, net of debt issue costs, related to the issuanceof the LTNCD Series 2 in 2014 amounted to P=85.1 million.
LTNCD Due 2020 (LTNCD Series 3)In 2014, EW issued unsecured LTNCD maturing on April 24, 2020. The first tranche of the LTNCDSeries 3 amounting to P=925.0 million was issued in October 2014. The discount, net of debt issuecosts, related to the issuance of the LTNCD Series 3 in 2014 amounted to P=4.6 million.
LTNCD Due 2022 (LTNCD Series 4)In 2017, EW issued unsecured LTNCD maturing on September 21, 2022. The first tranche of theLTNCD amounting to P=2,703.9 million was issued in March 2017. The second to fifth tranches ofthe LTNCD aggregating to P=7,296.1 million were issued in April to August 2017. The debt issuecosts related to the issuance of the LTNCD in 2017 amounted to P=49.9 million.
LTNCD Due 2023 (LTNCD Series 5)In 2018, EW issued unsecured LTNCD maturing on December 7, 2023. The first tranche of theLTNCD amounting to P=2,451.0 million was issued in June 7, 2018. The debt issue costs related tothe issuance of the LTNCD in 2018 amounted to P=18.4 million.
As of December 31, 2019 and 2018, current portion of deposit liabilities amounted toP=271,270.8 million and P=237,797.8 million, respectively.
The movements in unamortized net discount as of December 31, 2019 and 2018 follow:
2019 2018(In Thousands)
Balances at beginning of year P=62,660 P=67,845Discount of issuance during the year 9,840 18,380Amortization during the year (12,181) (23,565)Balances at end of year P=60,319 P=62,660
22. Bills and Acceptances Payable
This account consists of borrowings from:
2019 2018(In Thousands)
Banks and other financial institutions P=30,912,930 P=17,939,215Outstanding acceptances 36,823 30,712
P=30,949,753 P=17,969,927
As of December 31, 2019 and 2018, P=30.9 billion and P=15.9 billion, respectively, of bills andacceptances payable are secured, P=18.1 billion and P=9.3 billion, respectively, are collateralized byinvestment in government securities with face value of P=26.7 billion and P=12.8 billion, respectively,and fair value of P=31.0 billion and P=12.4 billion, respectively, and P=11.2 billion are collateralized by
- 91 -
*SGVFS039395*
private securities with face value and fair value of P=1.5 million and P=1.8 billion, respectively as ofDecember 31, 2019 and with face value and fair value of P=7.0 billion as of December 31, 2018.
Bills payable to the BSP, other banks and other financial institutions are subject to annual interestrates ranging from 1.9% to 4.4% in 2019, 2.7% to 5.4% in 2018, and 1.5% to 3.5% in 2017.
The Group’s interest expense on bills and acceptances payable amounted to P=873.7 million,P=204.1 million and P=44.1 million in 2019, 2018 and 2017, respectively (see Note 28).
23. Accounts Payable, Accrued Expenses and Other Liabilities
The details of this account follow:
2019 2018Due Within
One YearDue AfterOne Year Total
Due WithinOne Year
Due AfterOne Year Total
(In Thousands)Accounts payable (Notes 14 and 16) P=10,633,523 P=9,154,300 P=19,787,823 P=13,077,079 P=5,784,460 P=18,861,539Deposits from tenants 1,854,119 2,570,466 4,424,585 3,677,749 1,001,678 4,679,427Retention fee payable 1,832,835 1,451,501 3,284,336 2,602,394 1,191,172 3,793,566Accrued expenses 5,188,504 − 5,188,504 3,315,641 − 3,315,641Accrued interest (Note 24) 1,550,104 − 1,550,104 2,061,777 − 2,061,777Due to related parties (Note 26) 1,197,736 − 1,197,736 1,714,064 − 1,714,064Deposits for registration 147,924 1,141,478 1,289,402 − 1,059,970 1,059,970Financial liability on lease contract
(Notes 2 and 32) − − − 42,574 832,239 874,813Bills purchased - contra (Note 9) 542,664 − 542,664 551,467 − 551,467Asset retirement obligation (ARO) − 416,612 416,612 – 522,581 522,581Provision for unused credit lines
(Note 37) 683,425 − 683,425 449,748 − 449,748Payment orders payable 135,461 − 135,461 173,498 − 173,498Derivative liabilities (Notes 37 and 38) 128,004 − 128,004 146,548 − 146,548Other payables 420,309 1,407,572 1,827,881 924,986 626,379 1,551,365
P=24,314,608 P=16,141,929 P=40,456,537 P=28,737,525 P=11,018,479 P=39,756,004
a. Accounts payable include the balance of the purchase price for raw land, investment propertiesand property, plant and equipment acquired by the Group and payable upon completion of certainrequirements and on agreed scheduled payment date.
The Group reclassified certain accounts payable previously classified as due within one year(current) in 2018 to due after one year (noncurrent) to conform to the 2019 presentation. PAS 1requires an entity to present a consolidated statement of financial position as at the beginning ofthe earliest period presented when it reclassifies items in its financial statements. The impact ontotal liabilities, total current liabilities and total noncurrent liabilities as of December 31, 2018 isimmaterial.
b. Deposits from tenants are advance payments received for rentals, utilities and other fees. Thesewill be applied against rental obligations of tenants once due.
c. Retention fee payable represents portions deducted from the contractors’ and suppliers’ billingsfor the construction and development of the projects of the Group which are normally payable 1year from the date of acceptance of the work.
d. Accrued expenses pertain to various operating expenses incurred by the Group in the course ofbusiness such as unbilled construction cost related to ongoing projects amounting toP=785.9 million and P=444.5 million, interest expense amounting to P=671.1 million and

- 92 -
*SGVFS039395*
P=752.7 million, fines and penalties amounting to P=553.7 million and P=334.4 million, rent expenseamounting to P=550.9 million and P=1,126.9 million, manpower expenses amounting toP=310.7 million and P=236.1 million, output tax amounting to P=243.0 million and P=639.9 million,professional fees amounting to P=202.1 million and P=65.0 million and advertising and publicityamounting to P=153.9 million and P=72.8 million, among others, as of December 31, 2019and 2018, respectively. Others accruals pertain to accruals for travel expense, repairs andmaintenance expense, securities and janitorial expense, bonuses, insurance expense and bankingfees.
e. Financial liability on lease contract pertains to the present value of the fixed monthly payments toCDC throughout the 50-year term of the lease contract pertaining to the building and golf course .As a result of adoption of PFRS 16, the amount was reclassified to Lease liabilities (see Notes 2and 32).
f. Deposits for registration pertain to amounts collected from buyers for payment of registration ofreal estate properties.
g. ARO pertains to the asset retirement obligation of the Group as provided under FDC Misamis’lease agreement with PHIVIDEC to restore the property (where its coal thermal power plant issituated) to its original condition and to bear the cost of dismantling and restoration at the end ofthe lease term. ARO is accreted over the lease term and the related interest expense recognizedamounted to P=34.0 million , P=36.3 million and P=33.8 million in 2019, 2018 and 2017,respectively.
h. Provision for unused credit lines pertains to ECL related to loan commitments withoutoutstanding drawn amounts.
i. Other payables include withholding taxes, output VAT payables, interest on restructured loansand deferred rental income.
24. Long-term Debt
This account consists of the following respective borrowings of the Group and their contractualsettlement dates:
2019 2018 Collateral (In Thousands)
Parent Companya. Fixed-rate 10-year bonds with aggregate principal amount of
P=8,800.0 million issued on January 24, 2014 with interest rate of 6.1%per annum payable quarterly in arrears. P=8,756,887 P=8,747,882 Clean
b. Fixed-rate 5-year loan obtained on October 7, 2015 with interest rateof 4.5% per annum payable quarterly in arrears. 2,967,474 2,964,331 Clean
c. Fixed-rate 5-year loan obtained on April 15, 2016 with interest rate of4.0% per annum payable quarterly in arrears. 1,497,905 1,496,361 Clean
d. Fixed-rate 5-year loan obtained on June 20, 2016 with interest rate of4.3% per annum payable quarterly in arrears. 998,408 997,386 Clean
e. Fixed-rate 5-year loan obtained on September 9, 2016 with interestrate of 3.8% per annum payable quarterly in arrears. 798,554 797,697 Clean
f. Fixed-rate 5-year loan obtained on December 18, 2019 with interestrate of 4.8% per annum payable quarterly in arrears. 148,875 − Clean
15,168,103 15,003,657
(Forward)

- 93 -
*SGVFS039395*
2019 2018 Collateral (In Thousands)
FLIg. Fixed-rate bonds consisting of i) aggregate principal amount of
P=7,000.0 million comprised of P=4,300.0 million 7-year bonds andP=2,700.0 million 10-year bonds issued on November 8, 2013; ii)aggregate principal amount of P=7,000.0 million issued on December 4,2014 comprised of P=5,300.0 million 7-year bonds and P=1,700.0million 10-year bonds; iii) aggregate principal amount of P=8,000.0million issued on August 20, 2015 comprised of P=7,000.0 million 7-year bonds and P=1,000.0 million 10-year bonds; and iv) P=6,000.0million 5.5-year bonds issued on July 7, 2017. P=35,528,233 P=34,834,266 Clean
h. Developmental loans from local banks will mature on various dates upto 2025. These Peso-denominated loans bear floating interest ratesequal to 91-day Bloomberg Valuation (BVAL) rate, plus a spread ofup to 1.0% per annum, or fixed interest rates of 3.8% to 7.7% perannum. 27,884,687 P=24,948,473 Clean
63,412,920 59,782,739FAI
i. Fixed-rate 5-year loan granted on August 3, 2015 with interest rate of5.0% per annum payable quarterly in arrears. 850,000 850,000 Clean
j. 5-year loan granted on January 22, 2018 with interest rate equivalentto BVAL plus a spread of 1.0% per annum payable quarterly inarrears. 50% of the loan is payable in equal quarterly amortizations tocommence at the end of the 2-year grace period and 50% is payable atmaturity. 600,000 600,000 Clean
k. Fixed-rate 5-year loan granted on June 29, 2017 with interest rate of5.0% per annum payable quarterly in arrears. Fifty percent (50%) ofthe loan is payable in equal quarterly amortizations to commence atthe end of the 2-year grace period and 50% is payable at maturity. 545,454 600,000 Clean
l. Fixed-rate 7-year loan obtained on August 23, 2017 with interest rateequivalent to BVAL rate plus a spread of 1.0% per annum payableafter 2-year grace period from date of initial borrowing. 4% of theloan is payable in equal annual amortizations to commence at the endof the 2nd year and 96% is payable at maturity. 400,000 400,000 Clean
m. Fixed-rate 5-year loan granted on July 28, 2016 with interest rate of3.8% per annum payable quarterly in arrears. 50% of the loan ispayable in equal quarterly amortizations to commence at the end of the2-year grace period and 50% is payable at maturity. 356,250 431,250 Clean
n. Fixed-rate 5-year loan granted on September 28, 2015 with interestrate of 4.5% per annum payable quarterly in arrears. 50% of the loanis payable in equal quarterly amortizations to commence at the end of2-year grace period and 50% is payable at maturity. 312,500 395,833 Clean
o. Fixed-rate 5-year loan granted on June 28, 2016 with interest rate of3.9% per annum payable quarterly in arrears. 50% of the loan ispayable in equal quarterly amortizations to commence at the end of thesecond year and 50% is payable at maturity. 300,000 366,667 Clean
p. Fixed-rate 7-year loan granted on September 5, 2013 with interest rateof 4.8%, payable quarterly in arrears. 50% of the loan is payable in 20equal quarterly amortizations and 50% is payable at maturity. 287,500 337,500 Clean
q. Fixed-rate 5-year loan granted on February 18, 2016 with interest rateof 4.6% per annum payable quarterly in arrears. 50% of the loan ispayable in equal quarterly amortizations to commence at the end of thesecond year and 50% is payable at maturity. 212,500 262,500 Clean
r. Fixed-rate 5-year loan granted on March 3, 2015 with interest rate of4.3% per annum, fixed for 3 years subject to repricing at the end of the3rd year, payable in equal quarterly amortizations to commence at theend of the 2-year grace period and 50% is payable at maturity. 100,000 133,333 Clean
(Forward)

- 94 -
*SGVFS039395*
2019 2018 Collateral (In Thousands)
s. Fixed-rate 5-year loan granted on December 15, 2014 with interest rateof 4.5% per annum payable in arrears. 50% of the loan is payable inequal quarterly amortizations to commence at the end of the 2-yeargrace period and 50% is payable at maturity. P=− P=125,000 Clean
t. 7-year loan granted on March 30, 2012, subject to floating interest rateset every 90 days, payable in arrears. 50% of the loan is payable inequal quarterly amortizations to commence at the end of the 2-yeargrace period and 50% is payable at maturity. − 105,000 Clean
3,964,204 4,607,083FHC
u. Fixed-rate 12-year loan granted on December 27, 2016 with interestrate of 5.5% per annum, repriceable at the end of 7th year, payablequarterly in arrears. The 50% is payable in 36 equal quarterlyamortization to start on the 13th quarter from initial drawdown and50% is payable at maturity. 995,993 995,000
Clean
v. Fixed-rate 12-year loans granted by a local bank amounting toP=160.0 million, P=60.0 million, P=270.0 million and P=165.0 million onJune 28, 2016, July 21, 2016, August 24, 2016 and December 14,2016, respectively, with interest rates of 4.25%, 4.25%, 4.10% and4.1% per annum, repriceable at the end of 5th year, in the same orderas above. The 50% is payable in 36 equal quarterly amortization tostart on the 13th quarter from initial drawdown and 50% is payable atmaturity. 634,525 652,171 Clean
w. Fixed-rate 8-years and 6 months loan granted on December 23, 2019with interest rate of 4.9% per annum, repriceable, at the end of the 5thyear. 50% of the principal shall be payable in 36 equal quarterlypayments starting September 28, 2019 and remaining 50% payable atmaturity 587,530 − Clean
x. Fixed-rate 12-year loan granted on December 20,2019, with interestrate of 4.9% per annum, repriceable at the end of 5th year, payablequarterly in arrears. 50% is payable in 36 equal quarterly amortizationto commence on March 20, 2023 and remaining balance is payable atmaturity. 516,112 − Clean
y. Fixed-rate 7-year loan of P=400.0 million availed on August 31, 2017with interest rate of 5.3% per annum, payable quarterly in arrears.50% is payable in 16 equal quarterly amortization to start at the end ofthe 13th quarter from initial drawdown and 50% is payable at maturity. 398,544 398,562 Clean
z. Fixed-rate 12-year loan granted on August 9, 2017 with interest rate of5.5% per annum, repriceable at the end of 5th year, payable quarterlyin arrears. 50% is payable in 36 equal quarterly amortization to start onthe 13th quarter from initial drawdown and 50% is payable at maturity 387,361 398,089 Clean
aa. Fixed-rate 12-year loan granted on March 27, 2017 with interest rateof 5.1% per annum, repriceable at the end of 5th year, payablequarterly in arrears. 50% is payable in 36 equal quarterly amortizationto start on the 13th quarter from initial drawdown and 50% is payableat maturity. 325,431 334,460 Clean
bb. Fixed-rate loan granted on September 5, 2018 with interest rate of6.8% per annum, repriceable at the end of 5th year, payable quarterlyin arrears. 50% of principal payable in 36 equal quarterly amortizationto commence at the end of 13th quarter from the initial drawdown dateand 50% is payable at maturity.from the initial drawdown date and50% is payable at maturity. 298,053 300,000 Clean
cc. Fixed-rate 12-year loan granted on September 26, 2017 with interestrate of 5.2% per annum, repriceable at the end of 7th year, payablequarterly in arrears. 50% of the principal is payable in 36 equalquarterly amortization to start on the 13th quarter from initialdrawdown date and 50% is payable at maturity. 298,470 298,544 Clean
(Forward)
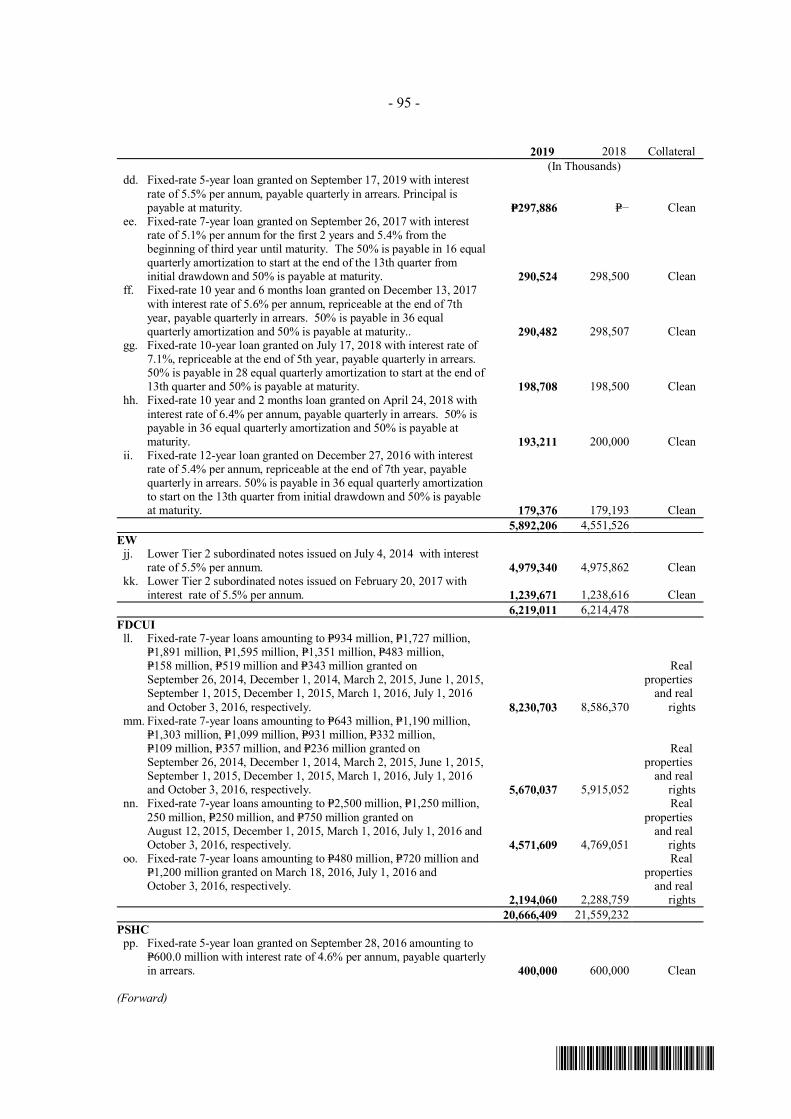
- 95 -
*SGVFS039395*
2019 2018 Collateral (In Thousands)
dd. Fixed-rate 5-year loan granted on September 17, 2019 with interestrate of 5.5% per annum, payable quarterly in arrears. Principal ispayable at maturity. P=297,886 P=− Clean
ee. Fixed-rate 7-year loan granted on September 26, 2017 with interestrate of 5.1% per annum for the first 2 years and 5.4% from thebeginning of third year until maturity. The 50% is payable in 16 equalquarterly amortization to start at the end of the 13th quarter frominitial drawdown and 50% is payable at maturity. 290,524 298,500 Clean
ff. Fixed-rate 10 year and 6 months loan granted on December 13, 2017with interest rate of 5.6% per annum, repriceable at the end of 7thyear, payable quarterly in arrears. 50% is payable in 36 equalquarterly amortization and 50% is payable at maturity.. 290,482 298,507 Clean
gg. Fixed-rate 10-year loan granted on July 17, 2018 with interest rate of7.1%, repriceable at the end of 5th year, payable quarterly in arrears.50% is payable in 28 equal quarterly amortization to start at the end of13th quarter and 50% is payable at maturity. 198,708 198,500 Clean
hh. Fixed-rate 10 year and 2 months loan granted on April 24, 2018 withinterest rate of 6.4% per annum, payable quarterly in arrears. 50% ispayable in 36 equal quarterly amortization and 50% is payable atmaturity. 193,211 200,000 Clean
ii. Fixed-rate 12-year loan granted on December 27, 2016 with interestrate of 5.4% per annum, repriceable at the end of 7th year, payablequarterly in arrears. 50% is payable in 36 equal quarterly amortizationto start on the 13th quarter from initial drawdown and 50% is payableat maturity. 179,376 179,193 Clean
5,892,206 4,551,526EW
jj. Lower Tier 2 subordinated notes issued on July 4, 2014 with interestrate of 5.5% per annum. 4,979,340 4,975,862 Clean
kk. Lower Tier 2 subordinated notes issued on February 20, 2017 withinterest rate of 5.5% per annum. 1,239,671 1,238,616 Clean
6,219,011 6,214,478FDCUI
ll. Fixed-rate 7-year loans amounting to P=934 million, P=1,727 million,P=1,891 million, P=1,595 million, P=1,351 million, P=483 million,P=158 million, P=519 million and P=343 million granted onSeptember 26, 2014, December 1, 2014, March 2, 2015, June 1, 2015,September 1, 2015, December 1, 2015, March 1, 2016, July 1, 2016and October 3, 2016, respectively. 8,230,703 8,586,370
Realproperties
and realrights
mm. Fixed-rate 7-year loans amounting to P=643 million, P=1,190 million,P=1,303 million, P=1,099 million, P=931 million, P=332 million,P=109 million, P=357 million, and P=236 million granted onSeptember 26, 2014, December 1, 2014, March 2, 2015, June 1, 2015,September 1, 2015, December 1, 2015, March 1, 2016, July 1, 2016and October 3, 2016, respectively. 5,670,037 5,915,052
Realproperties
and realrights
nn. Fixed-rate 7-year loans amounting to P=2,500 million, P=1,250 million,250 million, P=250 million, and P=750 million granted onAugust 12, 2015, December 1, 2015, March 1, 2016, July 1, 2016 andOctober 3, 2016, respectively. 4,571,609 4,769,051
Realproperties
and realrights
oo. Fixed-rate 7-year loans amounting to P=480 million, P=720 million andP=1,200 million granted on March 18, 2016, July 1, 2016 andOctober 3, 2016, respectively.
2,194,060 2,288,759
Realproperties
and realrights
20,666,409 21,559,232PSHC
pp. Fixed-rate 5-year loan granted on September 28, 2016 amounting toP=600.0 million with interest rate of 4.6% per annum, payable quarterlyin arrears. 400,000 600,000 Clean
(Forward)

- 96 -
*SGVFS039395*
2019 2018 Collateral (In Thousands)
FDCIqq. Fixed-rate 7-year bonds with principal amount of USD286.5 million
issued on April 2, 2013 with interest rate of 4.3% per annum. P=14,498,412 P=15,028,801 CleanP=130,221,265 P=127,347,516
Below are the current and noncurrent portion of the long-term debt:
2019 2018(In Thousands)
Current P=32,345,410 P=10,283,212Noncurrent 97,875,855 117,064,304
P=130,221,265 P=127,347,516
The other details on foregoing long-term debt of the Group follow:
FLIg. Fixed-rate Bonds
On June 8, 2012, FLI issued bonds with aggregate principal amount of P=7,000.0 million and termof 7 years due in 2019. The fixed interest rate is 6.3% per annum, payable quarterly in arrearsstarting on September 8, 2012. This was fully paid in 2019.
On November 8, 2013, FLI issued bonds with principal amount of P=7,000.0 million comprised ofP=4,300.0 million 7-year bonds with interest of 4.9% per annum due in 2020 and P=2,700.0 million10-year bonds with interest rate of 5.4% per annum due in 2023.
On December 4, 2014, FLI issued bonds with an aggregate principal amount of P=7,000.0 millioncomprising of P=5,300.0 million 7-year bonds due in 2021 and P=1,700.0 million 10-year bonds duein 2024. The 7-year and 10-year bonds carry a fixed rate of 5.4% and 5.6% per annum,respectively.
On August 20, 2015, FLI issued bonds with an aggregate principal amount of P=8,000.0 millioncomprised of P=7,000.0 million 7-year bonds due in 2021 and P=1,000.0 million, 10-year bonds duein 2025. The 7-year bonds carry a fixed rate of 5.4% and 5.7% per annum, respectively.
On July 7, 2017, CPI issued unsecured fixed rate bonds with an aggregate principal amount ofP=6,000.0 million and term of 5.5 years due in 2023. The bonds carry a fixed rate of 5.1% perannum, payable quarterly in arrears starting on October 7, 2017.
Unamortized debt issuance cost on bonds payable amounted to P=115.4 million andP=165.73 million as of December 31, 2019 and 2018, respectively. Accretion included as part ofInterest expense amounted to P=50.4 million in 2019, P=58.6 million in 2018 and P=51.8 million in2017 (see Note 29).
h. Developmental LoansDevelopmental loans will mature on various dates up to 2025. These Peso-denominated loansbear floating interest rates equal to 91-day BVAL rate plus a spread of up to 1.0% per annum,prevailing market rate, or fixed interest rates of 3.8% to 7.7% per annum. Additional loansavailed in 2019, 2018 and 2017 amounted to P=15,400.0 million, P=5,500.0 million andP=3,225.0 million, respectively. Principal payments made in 2019, 2018 and 2017 amounted toP=4,840.0 million, P=3,840.0 million and P=4,370.2 million, respectively.

- 97 -
*SGVFS039395*
FAIThe fixed-rate loans availed by FAI bear interest ranging from 3.8% to 5.8% per annum. Theterm loans availed by FAI that are subject to floating interest set every 90-days payable in arrearshas a one-time option to change interest to fixed rate anytime during the life of the loan.
EWjj. Lower Tier 2 Unsecured Subordinated Notes Due in 2025
On July 4, 2014, EW issued 5.5% coupon rate Lower Tier 2 unsecured subordinated note(the 2025 Notes) with par value of P=5,000.0 million, maturing on January 4, 2025, but callable onJanuary 4, 2020. The 2025 Notes qualify as Tier 2 capital pursuant to BSP Circular No. 781(Basel III), BSP Circular No. 826 on risk disclosure requirements for the loss absorption featuresof capital instruments, and other related circulars and issuances of the BSP.
Unless the 2025 Notes are previously redeemed, the 2025 Notes are repayable to the Noteholdersat 100.0% of their face value or at par on the maturity date of January 4, 2025.
From and including the issue date to, but excluding the optional redemption date ofJanuary 4, 2020, the 2025 Notes bear interest at the rate of 5.5% per annum and shall be payablequarterly in arrears on January 4, April 4, July 4, and October 4 of each year, which commencedon October 4, 2014. Unless the 2025 Notes are previously redeemed, the interest rate will bereset at the equivalent of the prevailing 5-year BVAL at reset date plus initial spread (i.e. thedifference between the initial interest rate and the prevailing 5-year BVAL at the pricing date ofthe initial tranche), commencing on January 4, 2020.
The 2025 Notes are redeemable at the option of EW, in whole but not in part, on the call optiondate at 100.0% of the face value plus accrued but unpaid interest, subject to the followingconditions:
a. EW has obtained prior written approval and complied with the requirements of the BSP priorto redemption of the 2025 Notes,
b. the 2025 Notes are replaced with capital of the same or better quality and the replacement ofthis capital is done at conditions which are sustainable for the income capacity of EW, or
c. EW demonstrates that its capital position is above the minimum capital requirements afterredemption is exercised,
d. EW is not in breach of (and would not, following such redemption, be in breach) ofapplicable regulatory capital requirements (including regulatory capital buffers),
e. EW is solvent at the time of redemption of the 2025 Notes and immediately thereafter.
Furthermore, upon the occurrence of a Tax Redemption Event or a Regulatory RedemptionEvent, EW may, subject to compliance with BSP rules and BSP approval, and upon priorapproval of the BSP and with prior written notice to the Noteholders on record, redeem all andnot less than all of the outstanding 2025 Notes prior to the stated maturity by paying theNoteholder the Redemption Option Amount which, (a) in the case of a Tax Redemption Event isan amount equal to 100.0% of the face value of the 2025 Notes plus accrued interest at theinterest rate relating to the then current interest period up to but excluding the date of suchredemption, and (b) in the case of a Regulatory Redemption Event is an amount equal to 100.0%of the face value of the 2025 Notes plus accrued interest at the interest rate relating to the thencurrent interest period up to but excluding the date of such redemption (the “Redemption OptionDate”).

- 98 -
*SGVFS039395*
The 2025 Notes have a loss absorption feature which means that the 2025 Notes are subject to aNon-Viability Write-Down in case of a Non-Viability Event. Non-viability is defined as adeviation from a certain level of Common Equity Tier 1 (CET1) Ratio or inability of EW tocontinue business (closure) or any other event as determined by the BSP, whichever comesearlier. A Non-Viability Event is deemed to have occurred when EW is considered non-viable asdetermined by the BSP.
Upon the occurrence of a Non-Viability Event, EW shall write-down the principal amount of the2025 Notes to the extent required by the BSP, which could go to as low as zero. AdditionalTier 1 (AT1) capital instruments shall be utilized first before Tier 2 capital instruments arewritten-down, until the viability of the Issuer is re-established. In the event EW does not haveAT1 capital instruments, then the write-down shall automatically apply to Tier 2 capital.
Loss absorption measure is subject to the following conditions:a. the principal amount of all series of Tier 1 Loss Absorbing Instruments outstanding having
been Written-Down to zero or converted into common equity of EW (where possible)irrevocably, in accordance with, and to the extent possible pursuant to, their terms (the “Tier1 Write-Down”)
b. the Tier 1 Write-Down having been insufficient to cure the Non-Viability Eventc. EW giving the relevant Non-Viability Notice to the Public Trustee and the Registrar and
Paying Agent
Each Noteholder irrevocably agrees and acknowledges that it may not exercise or claim any rightof set-off in respect of any amount owed to it by EW arising under or in connection with the 2025Notes and it shall, to the fullest extent permitted by applicable law, waive and be deemed to havewaived all such rights of set-off.
On October 21, 2019, the BOD of EW approved to exercise the call option on its P=5.00 BillionLower Tier 2 (LT2), 5.50% Coupon rate, Unsecured Subordinated notes, with optionalredemption date of January 04, 2020 due on January 24, 2025.
kk. Lower Tier 2 Unsecured Subordinated Notes Due 2027On February 20, 2017, EWRB issued 5.5% coupon rate Lower Tier 2 unsecured subordinatednote (the 2027 Notes) with par value of P=1,250.0 million, maturing on August 20, 2027 butcallable on August 20, 2022.
Unless the 2027 Notes are previously redeemed, the 2027 Notes are repayable to the Noteholdersat 100.0% of their face value or at par on the maturity date of August 20, 2027.
From and including the issue date to, but excluding the optional redemption date ofAugust 20, 2022, the 2027 Notes bear interest at the rate of 5.5% per annum and shall be payablequarterly in arrears on February 20, May 20, August 20, and November 20 of each year, whichcommenced on February 20, 2017. Unless the 2027 Notes are previously redeemed, the interestrate will be reset at the equivalent of the prevailing 5-year BVAL at reset date plus initial spread(i.e., the difference between the initial interest rate and the prevailing 5-year BVAL at the pricingdate of the initial tranche), commencing on August 20, 2022.
- 99 -
*SGVFS039395*
The 2027 Notes are redeemable at the option of EWRB, in whole but not in part, on the calloption date at 100.0% of the face value plus accrued but unpaid interest, subject to the followingconditions:a. EWRB has obtained prior written approval and complied with the requirements of the BSP
prior to redemption of the 2027 Notes;b. the 2027 Notes are replaced with capital of the same or better quality and the replacement of
this capital is done at conditions which are sustainable for the income capacity of EWRB, orc. EWRB demonstrates that its capital position is above the minimum capital requirements after
redemption is exercised;d. EWRB is not in breach of (and would not, following such redemption, be in breach) of
applicable regulatory capital requirements (including regulatory capital buffers);e. EWRB is solvent at the time of redemption of the 2027 Notes and immediately thereafter.
Furthermore, upon the occurrence of a Tax Redemption Event or a Regulatory RedemptionEvent, the EWRB may, subject to compliance with BSP rules and BSP approval, and upon priorapproval of the BSP and with prior written notice to the Noteholders on record, redeem all andnot less than all of the outstanding 2027 Notes prior to the stated maturity by paying theNoteholder the Redemption Option Amount which, (a) in the case of a Tax Redemption Event isan amount equal to 100.0% of the face value of the 2027 Notes plus accrued interest at theinterest rate relating to the then current interest period up to but excluding the date of suchredemption, and (b) in the case of a Regulatory Redemption Event is an amount equal to 100.0%of the face value of the 2027 Notes plus accrued interest at the interest rate relating to the thencurrent Interest Period up to but excluding the date of such redemption (the “Redemption OptionDate”).
The 2027 Notes have a loss absorption feature which means that the 2027 Notes are subject to aNon-Viability Write-Down in case of a Non-Viability Event. Non-viability is defined as adeviation from a certain level of Common Equity Tier 1 (CET1) Ratio or inability of the EWRBto continue business (closure) or any other event as determined by the BSP, whichever comesearlier. A Non-Viability Event is deemed to have occurred when EWRB is considered non-viableas determined by the BSP.
Upon the occurrence of a Non-Viability Event, EWRB shall write-down the principal amount ofthe 2025 Notes to the extent required by the BSP, which could go to as low as zero. AdditionalTier 1 (AT1) capital instruments shall be utilized first before Tier 2 capital instruments arewritten-down, until the viability of the Issuer is re-established. In the event EWRB does not haveAT1 capital instruments, then the write-down shall automatically apply to Tier 2 capital.
Loss absorption feature is subject to the following conditions:a. the principal amount of all series of Tier 1 Loss Absorbing Instruments outstanding
having been Written-Down to zero or converted into common equity of EW (where possible)irrevocably, in accordance with, and to the extent possible pursuant to, their terms (the “Tier1 Write-Down”)
b. the Tier 1 Write-Down having been insufficient to cure the Non-Viability Eventc. EW giving the relevant Non-Viability Notice to the Public Trustee and the Registrar
and Paying Agent

- 100 -
*SGVFS039395*
Each Noteholder irrevocably agrees and acknowledges that it may not exercise or claim any rightof set-off in respect of any amount owed to it by EWRB arising under or in connection with the2027 Notes and it shall, to the fullest extent permitted by applicable law, waive and be deemed tohave waived all such rights of set-off.
The Group’s interest expense on subordinated debt amounted to P=346.0 million, P=345.9 millionand P=333.3 million in 2019, 2018 and 2017, respectively (see Note 28).
FDCUIFDC Misamis entered into loan facility agreements with local financial institutions to partiallyfinance the construction and operation of the 405 MW CFB coal thermal power plant locatedinside the PHIVIDEC Industrial Estate in Villanueva, Misamis Oriental.
These loan facility agreements provide for a scheduled loan availments within a certain period.These loans are payable in 42 quarterly variable payments. The first installment will be due42 months from initial availment date or six (6) months from the project completion date,whichever comes first. These loans bear interest of 7-year BVAL (subject to repricing on the 7thyear from initial availment date), plus applicable credit spread.
These loans are secured with real properties and real rights, inclusive of FDC Misamis’ buildingsand other improvements amounting to P=26,872.3 million and P=28,392.2 million as ofDecember 31, 2019 and 2018, respectively, and its rights provided under certain agreements(e.g., EPPAs, insurance and lease contracts), chattels, movables and personal properties.
These loans bear interest from 4.7% to 6.4% per annum, subject to repricing after the 7th frominitial loan availment until maturity date. Interest is payable quarterly in arrears to start at the endof the first quarter from the date of the release of the loan.
FDCIqq. USD300.0 Million Fixed-rate Bonds
On April 2, 2013, the Group issued through FDCI fixed-rate 7-year bonds with original issuanceamount of USD300.0 million. The bonds bear a fixed interest rate of 4.3% per annum, payablesemi-annually in arrears.
In 2013, the Group repurchased USD13.5 million (P=577.3 million) of the USD300.0 millionfixed-rate bonds at a discount. As of December 31, 2019 and 2018, unamortized debt issuancecost on the bonds amounted to USD0.2 million (P=8.5 million) and USD0.7 million(P=35.4 million), respectively.
The Group’s long-term debt are unsecured and no assets are held as collateral for these debts, exceptfor the loans of FDC Misamis. The agreements covering the abovementioned loans requiremaintaining certain financial ratios including debt-to-equity ratio of 2.0x to 4.0x; debt servicecoverage ratio of 1.0x to 1.1x; interest coverage ratio of 2.0x to 3.0x; and minimum current ratio of2.0x.
As of December 31, 2019 and 2018, the Group has complied with these contractual agreements andhas not been cited as in default on its outstanding loan obligation.

- 101 -
*SGVFS039395*
Total interest on these long-term debt, including capitalized borrowing costs, and amortization oftransaction costs follow:
2019 2018 2017(In Thousands)
Interest expense Real estate operations (Note 29) P=1,923,921 P=1,290,791 P=1,073,097 Hospitality operations (Note 29) 194,891 187,628 163,391 Banking and financial services (Note 28) 345,970 345,930 333,320 Power operations (Note 29) 1,167,669 1,298,304 1,318,993 Sugar operations (Note 29) 43,695 34,420 34,929 Other operations (Notes 28 and 29) 1,543,198 1,452,935 1,119,276
5,219,344 4,610,008 4,043,006Total capitalized borrowing costs (Notes 14, 16 and 17) 1,547,355 2,354,656 2,124,339
P=6,766,699 P=6,964,664 P=6,167,345
25. Equity
Capital Stock and APICOn December 22, 1982, the SEC approved the registration of 5.3 million shares, divided into5.2 million Class A shares, and 100,000 class B shares with par value of P=10.0 per share.
On April 13, 1992, the SEC approved the registration of 144,575,000 common shares with par valueof P=10.0 per share.
On March 10, 1993, the SEC approved the reduction of par value from P=10.0 to P=5.0 per share of theParent Company’s common shares which at that time consisted of P=1.5 billion authorized commonstocks divided into 90,000,000 shares of Class “A” common shares and 60,000,000 shares of Class“B” common shares.
On December 20, 1993, the stockholders approved the reduction of the par value per share fromP=5.0 to P=1.0 and to unclassify the Parent Company’s capital stock.
On October 15, 2010, the stockholders and BOD of the Parent Company approved the increase in itsauthorized capital stock from P=10.0 billion, consisting of 10.0 billion common shares with par valueof P=1.0 per share to P=17.0 billion, consisting of 15.0 billion common shares with par value of P=1.0 pershare and 2.0 billion non-voting and redeemable preferred shares with par value of P=1.0 per share.Article Seven of the Amended Articles of Incorporation of the Parent Company was amended toeffect the increase in the authorized capital stock of the Parent Company.
On August 19, 2011, the SEC approved the increase in the authorized capital stock of the ParentCompany.
The preferred shares have the following features:a) not entitled to any voting right or privilege, except in those cases expressly provided by law;b) redeemable subject to the terms and conditions to be fixed by the BOD;c) entitled to dividends at the rate to be determined by the BOD prior to the issuance of shares, to be
payable out of the surplus profits of the Corporation so long as the preferred shares areoutstanding; and,
d) may be subject to such other additional terms and conditions to be fixed by the BOD.

- 102 -
*SGVFS039395*
As of December 31, 2019 and 2018, authorized capital stock of the Parent Company is 15.0 billioncommon shares with par value of P=1.0 per share and 2.0 billion non-voting redeemable preferredshares with par value of P=1.0 per share.
As discussed in Note 4, in December 2017, the Parent Company and ALGI executed the Deed ofMutual Partial Rescission which partially rescinded the 2007 Deed of Exchange. The partialrescission entails the return of 542.5 million FDC shares by ALGI to the Parent Company, includingsubsequently declared stock dividend thereon of 126.5 million shares. As a result, the Grouprecognized additional 669.0 million treasury shares or equivalent to P=3,590.3 million.
Below is the summary of the Group’s track record of registration of securities with the SEC as ofDecember 31, 2019:
Numberof Shares
Registered(In Thousands)
Numberof holders
of securitiesas of year end
December 31, 2016 9,317,474 4,124Movements (669,011) (32)December 31, 2017 8,648,463 4,092Movements – (22)December 31, 2018 8,648,463 4,070Movements – (31)December 31, 2019 8,648,463 4,039Note: Exclusive of 671,409,400 treasury shares (see Note 31) as of December 31, 2019 and 2018.
Treasury SharesThere was no movement in treasury shares for the years ended December 31, 2019 and 2018. For theyear ended December 31, 2017, changes in treasury shares are as follows:
Numberof shares
Amount(In Thousands)
Balances as of January 1, 2017 2,398,400 P=24,220Effect of partial rescission of shares swap (Note 4) 669,011,000 3,590,254Balances as of December 31, 2017 671,409,400 P=3,614,474
Dividend DeclarationOn April 26, 2019, the Parent Company’s BOD approved the declaration and payment of cashdividends of P=864.8 million or P=0.10 per share for every common share of record as of May 26, 2019.This was paid on June 19, 2019.
On May 4, 2018, the Parent Company’s BOD approved the declaration and payment of cashdividends of P=661.6 million or P=0.0765 per share for every common shares of record as ofJune 3, 2018. This was paid on June 28, 2018.
On April 28, 2017, the Parent Company’s BOD approved the declaration and payment of cashdividends of P=549.7 million or P=0.059 per share for every common shares of record as ofMay 28, 2017. This was paid on June 21, 2017.
- 103 -
*SGVFS039395*
Retained EarningsRetained earnings include undistributed earnings representing accumulated equity in net earnings ofsubsidiaries and joint ventures, which are not available for dividend declaration until received in theform of dividends from such subsidiaries and associates.
Retained earnings are further restricted for the payment of dividends to the extent of the cost of theshares held in treasury and unrealized income recognized amounting P=5,490.0 million andP=4,996.2 million as of December 31, 2019 and 2018.
After reconciling items, the Parent Company’s retained earnings available for dividend declaration asof December 31, 2019, 2018 and 2017 amounted to P=7,573.7 million, P=7,117.9 million andP=4,862.1 million, respectively.
Capital ManagementThe Group monitors its capital and cash positions and manages its expenditures and disbursements.Furthermore, the Group may also, from time to time seek other sources of funding, which mayinclude debt or equity issues depending on its financing needs and market conditions.
The primary objective of the Group’s capital management is to ensure that it maintains a strong creditrating and healthy capital ratios in order to support its business and maximize shareholder value. Nochanges were made in capital management objectives, policies or processes for the years endedDecember 31, 2019, 2018 and 2017.
The Group monitors capital using debt-to-equity ratio, which is the long-term debt divided by totalequity. The Group’s policy is to keep the debt to equity ratio not to exceed 2:1.
2019 2018(In Thousands)
Long-term debt (Note 24) P=130,221,265 P=127,347,516Total equity 132,149,986 119,690,474Debt-to-equity ratio 0.99:1.00 1.06:1.00
26. Related Party Transactions
The Group has entered into various transactions with related parties. Parties are considered to berelated if one party has the ability, directly or indirectly, to control the other party in making financialand operating decisions or the parties are subject to common control or common significant influence(referred to as ‘Affiliates’). Related parties may be individuals or corporate entities.
All material Related Party Transactions (“RPT”) with a transaction value that reaches ten percent(10%) of the Group’s total consolidated assets shall be subject to the review by the RPT Committee.
Transactions that were entered into with an unrelated party that subsequently becomes a related partyshall be excluded from the limits and approval of the Policy on Related Party Transactions (“Policy”).However, any renewal, change in the terms and conditions or increase in exposure level, related tothese transactions after a non-related party becomes a related party, shall subject it to the provisionsof the the Policy.
In the event whrein there are changes in the RPT classification from non-material to material, thematerial RPT shall be subject to the provisions of the the Policy.

- 104 -
*SGVFS039395*
Outstanding balances at year-end are unsecured, interest free and require settlement in cash, unlessotherwise stated. As of December 31, 2019 and 2018, the Group has not made any provision forimpairment loss relating to amounts owed by related parties. This assessment is undertaken eachfinancial year by examining the financial position of the related party and the market in which therelated party operates.
Significant transactions with related parties are as follows:
a. The compensation of key management personnel consists of short-term employee salaries andbenefits amounting to P=94.4 million, P=76.1 million and P=69.5 million in 2019, 2018 and 2017,respectively. Post-employment benefits of key management personnel amounted toP=17.0 million, P=18.0 million and P=16.3 million in 2019, 2018 and 2017, respectively.
b. Other transactions with related parties include noninterest-bearing cash advances and variouscharges to and from non-consolidated affiliates for management fees, rent, share of expenses andcommission charges. Transactions with related parties are normally settled in cash.
The amounts and the balances arising from the foregoing significant related party transactions are asfollows:
2019
Amount/Volume
OutstandingBalance
Due from(Due to) Terms Conditions
(In Thousands)Due from related partiesReal estate operations (Note 7)Ultimate Parent Company (a)
P=3,993 P=4,080Noninterest-bearing,
collectible on demandUnsecured, no
impairmentAffiliates: (Notes 7 and 8)
Share in expenses 8,072 11,564Noninterest-bearing,
collectible on demandUnsecured, no
impairmentP=12,065 P=15,644
Due to related parties (Note 23)Ultimate Parent Company (a, b)
Interest expense P=49,613 (P=1,189,588)
Bears 3.1% interestper annum, payablewithin 1 year Unsecured
Affiliates
Share in expenses (a) 1,533 (8,148)Noninterest-bearing,
payable on demand UnsecuredManagement fee (c)
P=51,146 (P=1,197,736)(a) Share in Group expenses(b) Availment of loan payable, with interest at prevailing market rate(c) Management fee charged to hospitality operations by a joint venture.
- 105 -
*SGVFS039395*
2018
Amount/Volume
OutstandingBalance
Due from(Due to) Terms Conditions
(In Thousands)Due from related partiesReal estate operations (Note 7)Ultimate Parent Company (a)
P=145 P=31Noninterest-bearing,
collectible on demandUnsecured, no
impairmentAffiliates: (Notes 7 and 8)
Share in expenses 8,410 4,281Noninterest-bearing,
collectible on demandUnsecured, no
impairmentP=8,555 P=4,312
Due to related parties (Note 23)Ultimate Parent Company (a, b)
Interest expense (P=52,265) (P=1,686,104)
Bears 3.1% interestper annum, payablewithin 1 year Unsecured
Affiliates
Share in expenses (a) (20,990) (27,960)Noninterest-bearing,
payable on demand UnsecuredManagement fee (c) (106,018) −
(P=179,273) (P=1,714,064)(a) Share in Group expenses(b) Availment of loan payable, with interest at prevailing market rate(c) Management fee charged to hospitality operations by a joint venture.
Transactions with Retirement PlansUnder PFRS, certain post-employment benefit plans are considered as related parties. The Group’sretirement plan is in the form of a trust administered by the EW’s Trust Division under thesupervision of the Retirement Committee. The values of the assets of the fund are as follows(see Note 30):
2019 2018(In Thousands)
Cash and cash equivalents P=26,290 P=148,337Equity instruments 783,716 557,155Debt instruments 158,763 124,125Others 1,844 2,135
P=970,613 P=831,752
The following are the amounts recognized by the retirement plan arising from its transactions withEW for the years ended December 31, 2019, 2018 and 2017.
2019 2018 2017Trust fees P=2,682 P=2,534 P=2,623Interest income on savings deposit 945 151 823Interest income on investments in
LTNCD 7,964 5,044 2,915Gain (loss) on investments in equity
shares 230,515 (15,272) 120,059

- 106 -
*SGVFS039395*
27. Other Income
Other income from real estate operations consist of:
2019 2018 2017(In Thousands)
Interest income on cash and cash equivalents,contract receivables and others(Notes 6 and 7) P=553,905 P=987,489 P=927,929
Forfeited reservations and payments 367,151 326,853 442,978Water supply income 270,362 145,356 115,837Processing fees 192,643 62,634 12,704Sewer treatment services 135,394 63,631 51,320Management fees 129,635 114,451 99,628Service income 196,705 252,127 189,333Income from amusement centers, parking
and other lease related activities 83,556 105,777 84,428Parking fees 75,114 74,886 60,895Slot rental fees 12,037 10,432 14,476Others 126,848 93,162 437,974
P=2,143,350 P=2,236,798 P=2,437,502
Others include membership and maintenance dues, parking fees, late payment charges, gain on sale orexchange of properties and slot rental fees.
Other income from hospitality operations consist of:
2019 2018 2017(In Thousands)
Share in net income of a joint venture (Note 18) P=41,207 P=31,489 P=22,409Others 8,143 8,350 9,530
P=49,350 P=39,839 P=31,939
Others include insurance fees, bagging fees, and other miscellaneous income.
Other income - net from banking and financial services consist of:
2019 2018 2017(In Thousands)
Service charges, penalties, fees andcommissions P=5,236,443 P=4,888,450 P=5,342,776
Recovery on written-off assets 526,853 739,285 436,658Foreign currency exchange gains - net 427,050 738,597 378,705Gain on sale of assets 94,840 139,087 55,892Trust income (Note 43) 70,535 51,333 46,759Trading and securities gain (loss) - net
(Note 12)Financial assets at FVPL, futures
and swaps 965,730 (235,917) 63,973 Investment securities at amortized cost − − 317,443
(Forward)

- 107 -
*SGVFS039395*
2019 2018 2017(In Thousands)
Loss on asset foreclosure and daciontransactions (P=199,991) (P=212,896) (P=236,352)
Gain on capital transaction (Note 18) − − 665,000Others 97,025 104,437 126,860
P=7,218,485 P=6,212,376 P=7,197,714
Others include referral income earned on insurance premiums charged through credit cards.
Other income from power operations consist of:
2019 2018 2017(In Thousands)
Interest income (Note 6) P=25,713 P=9,299 P=9,149Income from liquidated damages − 650,000 −Others 358 − −
P=26,071 P=659,299 P=9,149
Income from liquidated damages represents the amount of the Group’s recovery of lost revenue fromthe delay in the completion of the power plant. This was applied against retention fees payable tocontractor (see Note 23).
Other income from sugar operations consist of:
2019 2018 2017(In Thousands)
Fertilizers assistance income P=15,211 P=17,251 P=18,744Diesel mark-up 6,505 6,928 2,714Handling income - net 2,772 1,427 1,565Storage income 1,329 1,924 1,781Conversion rights − 42,224 −Tolling fees − − 1,117Interest income − − 217Others 5,242 19,484 5,374
P=31,059 P=89,238 P=31,512
Fertilizer assistance income and diesel mark-up pertain to income from sale of fertilizer and diesel toplanters of sugarcane.
Storage and handling income pertains to income from sugar storage and handling services provided toplanters of sugarcane.
Conversion rights income pertain to reclassification of rights over issued quedans as directed by theSugar Regulatory Administration.
Others include insurance fees, bagging fees and other miscellaneous income from bidding of quedans.

- 108 -
*SGVFS039395*
28. Costs
Cost of sale of lots, condominium and residential units consists of:
2019 2018 2017(In Thousands)
Subdivision lots, condominium andresidential units (Note 14) P=11,086,875 P=10,114,528 P=9,007,057
Land and land development costs (Note 14) 483,283 207,363 135,681P=11,570,158 P=10,321,891 P=9,142,738
Cost of mall and rental services consists of:
2019 2018 2017(In Thousands)
Depreciation (Note 16) P=572,382 P=619,981 P=451,146Mall operations 347,525 142,171 254,755Amortization of BTO Rights (Note 20) 69,553 51,752 49,600Others 58,646 66,693 78,657
P=1,048,106 P=880,597 P=834,158
Cost of hospitality operations consists of:
2019 2018 2017(In Thousands)
Salaries, wages and employee benefits P=392,328 P=272,550 P=229,786Food and beverage (Note 15) 348,125 303,144 226,780Depreciation and amortization (Note 17) 329,413 207,986 191,728Utilities 259,935 236,129 182,155Contract services 53,718 70,551 68,233Guest amenities 38,722 32,826 18,248Guest transportation 35,808 48,733 33,863Cleaning supplies 34,597 11,315 8,386Guest laundry and linen 30,312 19,398 18,126Kitchen fuels 14,265 16,775 11,087Complimentary food and services 12,782 6,165 4,712Equipment rental 5,422 7,244 10,213Business entertainment 2,960 4,650 4,384Others 96,878 107,779 69,137
P=1,655,265 P=1,345,245 P=1,076,838
Others include dive shop operating expenses, spa expenses, office supplies, banquet expenses,landscaping, cable services and other various expenses for the operations of the other operatingdepartments of the hotel.
Cost of banking and financial services consists of:
2019 2018 2017(In Thousands)
Interest on: Deposit liabilities (Note 21) P=6,431,376 P=4,236,888 P=2,938,105 Subordinated debt, bills payable and other borrowings (Notes 22 and 24) 1,492,461 557,073 408,602
P=7,923,837 P=4,793,961 P=3,346,707

- 109 -
*SGVFS039395*
Cost of power operations consists of:
2019 2018 2017(In Thousands)
Coal and fuel cost (Note 15) P=2,565,484 2,555,724 P=2,218,537Depreciation and amortization (Note 17) 1,133,317 1,130,371 1,107,443Purchase of electricity (Note 19) 737,200 517,597 2,316,634Distribution and wheeling fees 309,345 257,208 120,079Material cost 201,507 120,523 112,492Salaries, wages and employee benefits 100,525 98,950 82,981Maintenance cost 79,297 52,348 7,076Outside services 69,349 773 −Amortization of IPPA rights (Note 19) – – 1,138,555Others 24,559 210 55,935
P=5,220,583 P=4,733,704 P=7,159,732
Cost of sugar operations consists of:
2019
2018(As restated,
see Note 2) 2017(In Thousands)
Costs of sugarcane purchases P=1,496,229 P=1,429,710 P=1,164,712Milling cost 618,482 626,413 –Materials and supplies (Note 15) 180,647 171,254 156,443Salaries, wages and employee benefits 149,888 145,985 144,666Depreciation and amortization (Note 17) 119,663 122,319 123,353Cane hauling 77,189 88,105 81,117Outside services 53,970 73,509 58,094Taxes and licenses 45,365 45,716 39,976Repairs and maintenance 25,987 7,791 8,047Communications, light and water 20,927 20,166 17,919Development costs 9,584 8,062 11,823Liens 8,479 8,490 8,118Trucking and handling charges 7,048 6,602 10,121Rent (Note 32) 2,483 144 527Others 33,308 9,893 32,807Cost of goods manufactured 2,849,249 2,764,159 1,857,723Decrease (increase) in: Sugar and molasses inventories (18,922) – (79,331) Biological assets (Note 20) (6,837) 4,186 8,676
P=2,823,490 P=2,768,345 P=1,787,068
Cost of other operations pertains to FDCI’s interest expense on fixed-rate dollar bonds amounting toP=716.2 million, P=640.0 million and P=607.5 million in 2019, 2018 and 2017, respectively(see Note 24).
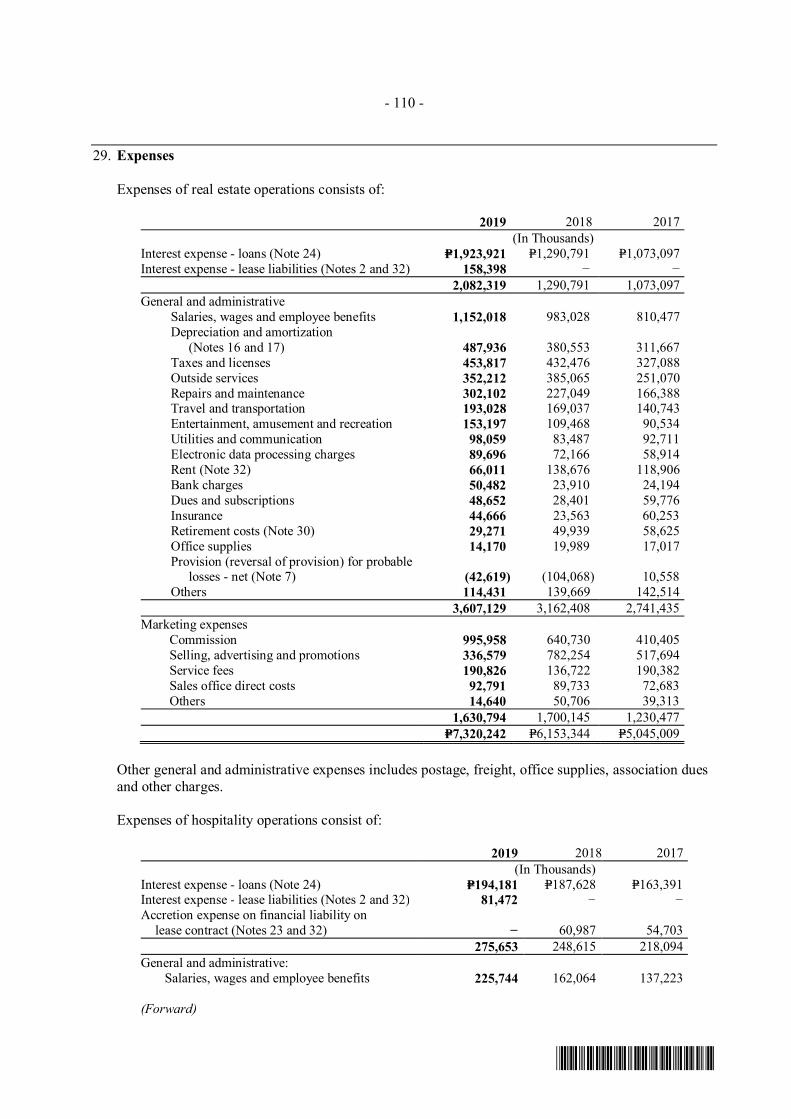
- 110 -
*SGVFS039395*
29. Expenses
Expenses of real estate operations consists of:
2019 2018 2017(In Thousands)
Interest expense - loans (Note 24) P=1,923,921 P=1,290,791 P=1,073,097Interest expense - lease liabilities (Notes 2 and 32) 158,398 − −
2,082,319 1,290,791 1,073,097General and administrative
Salaries, wages and employee benefits 1,152,018 983,028 810,477Depreciation and amortization
(Notes 16 and 17) 487,936 380,553 311,667Taxes and licenses 453,817 432,476 327,088Outside services 352,212 385,065 251,070Repairs and maintenance 302,102 227,049 166,388Travel and transportation 193,028 169,037 140,743Entertainment, amusement and recreation 153,197 109,468 90,534Utilities and communication 98,059 83,487 92,711Electronic data processing charges 89,696 72,166 58,914Rent (Note 32) 66,011 138,676 118,906Bank charges 50,482 23,910 24,194Dues and subscriptions 48,652 28,401 59,776Insurance 44,666 23,563 60,253Retirement costs (Note 30) 29,271 49,939 58,625Office supplies 14,170 19,989 17,017Provision (reversal of provision) for probable
losses - net (Note 7) (42,619) (104,068) 10,558Others 114,431 139,669 142,514
3,607,129 3,162,408 2,741,435Marketing expenses Commission 995,958 640,730 410,405 Selling, advertising and promotions 336,579 782,254 517,694 Service fees 190,826 136,722 190,382 Sales office direct costs 92,791 89,733 72,683 Others 14,640 50,706 39,313
1,630,794 1,700,145 1,230,477P=7,320,242 P=6,153,344 P=5,045,009
Other general and administrative expenses includes postage, freight, office supplies, association duesand other charges.
Expenses of hospitality operations consist of:
2019 2018 2017(In Thousands)
Interest expense - loans (Note 24) P=194,181 P=187,628 P=163,391Interest expense - lease liabilities (Notes 2 and 32) 81,472 − −Accretion expense on financial liability on lease contract (Notes 23 and 32) − 60,987 54,703
275,653 248,615 218,094General and administrative:
Salaries, wages and employee benefits 225,744 162,064 137,223
(Forward)

- 111 -
*SGVFS039395*
2019 2018 2017(In Thousands)
Utilities P=182,278 P=45,913 P=53,944Management fees (Note 26) 131,472 101,694 85,660Credit card commission 43,930 35,122 20,895Repairs and maintenance 43,183 31,519 34,633Association dues 37,783 38,684 38,872Depreciation and amortization (Note 17) 34,898 13,868 11,832Outside services 34,727 42,037 42,439Taxes and licenses 24,394 19,105 16,537Travel and transportation 23,413 16,391 12,619Corporate office reimbursable 20,224 4,047 5,465Insurance 16,032 11,120 6,754Representation and entertainment 11,001 9,639 6,320Pre-operating expense 5,201 – 31,037Rent (Note 32) 2,294 75,257 55,274Others 38,886 13,803 10,983
875,460 620,263 570,487Marketing expenses 69,168 60,912 88,213
P=1,220,281 P=929,790 P=876,794
Expenses of banking and financial services consist of:
2019 2018 2017(In Thousands)
General and administrativeSalaries, wages and employee benefits P=5,468,362 P=4,845,815 P=4,479,693Taxes and licenses 2,655,618 2,326,683 1,980,710Depreciation and amortization
(Notes 16, 17 and 20) 1,812,369 1,077,209 1,056,715Outside services 935,685 753,488 756,648Advertising 708,158 825,272 601,700Service charges, fees and commission 707,180 601,022 405,979Insurance 714,434 687,122 623,093Brokerage fees 683,167 647,502 658,021Technological fees 492,652 502,011 410,618Postage, telephone and telegraph 432,738 386,541 392,715Utilities 214,164 217,159 202,957Travel and transportation 204,156 212,526 231,722Repairs and maintenance 155,909 124,018 124,641Retirement costs (Note 30) 155,682 140,987 129,053Amortization of capitalized software,
customer relationships and core deposits(Note 20) 146,676 188,061 339,874
Stationery and supplies 136,361 109,978 115,396Rent (Note 32) 107,121 1,037,898 952,335Entertainment, amusement and recreation 42,621 46,208 48,807Others 502,415 489,706 471,713
16,275,468 15,219,206 13,982,390Provision for probable losses (Notes 9, 16 and 20) 4,042,472 3,905,928 4,464,267Share in net losses of a joint venture (Note 18) 339,482 395,817 449,050
P=20,657,422 P=19,520,951 P=18,895,707
Others include payments for subscriptions, membership fees, trainings, donations and contributions,delivery and freight expenses, fines, penalties, other charges and clearing fees.

- 112 -
*SGVFS039395*
Expenses of power operations consist of:
2019 2018 2017(In Thousands)
Interest expense - loans (Note 24) P=1,167,669 P=1,298,304 P=1,318,993Interest expense - lease liabilities (Notes 2 and 32) 48,532 − −Accretion expense on ARO (Note 23) 36,911 36,309 33,786Accretion expense on liability on IPPA contract
(Note 19) − − 544,7871,253,112 1,334,613 1,897,566
General and administrativeProvision for probable losses (Note 33) 314,000 199,671 624,936Taxes and licenses 297,207 294,773 228,653Salaries, wages and employee benefits 168,076 167,336 168,428Outside services 107,799 85,792 126,795Insurance 93,953 97,912 85,922Depreciation and amortization
(Notes 17 and 20) 66,469 42,168 55,606Professional fee 26,069 88,719 41,064Travel and transportation 23,420 12,862 19,745Representation and entertainment 10,466 15,053 17,738Retirement costs (Note 30) 9,631 4,958 4,958Utilities 9,591 12,689 12,420Repairs and maintenance 6,343 13,655 9,526Marketing 5,811 5,364 3,398Rent 3,513 98,799 82,197Bank charges 2,655 2,448 6,529Others 66,896 60,858 139,180
1,211,899 1,203,057 1,627,095P=2,465,011 P=2,537,670 P=3,524,661
Others include office supplies, freight and handling costs, contribution and donation, dues andsubscription and financial assistance to host communities.
Expenses of sugar operations consist of:
2019 2018 2017(In Thousands)
Interest expense - loans (Note 24) P=43,695 P=34,420 P=34,929General and administrative Provision for impairment loss (Note 17) 43,485 82,353 65,292
Salaries, wages and employee benefits 34,924 36,394 38,018Write-off of receivable 19,773 − −Outside services 13,019 21,253 24,514Taxes and licenses 12,515 22,355 19,442Depreciation and amortization (Note 17) 11,961 4,454 5,884Travel and transportation 8,695 8,294 3,721Repairs and maintenance 4,752 4,021 2,985Supplies 3,754 3,863 3,596Communication 3,701 2,496 2,585Entertainment, amusement and recreation 755 5,300 5,450Retirement costs (Note 30) − 7,800 6,543
(Forward)

- 113 -
*SGVFS039395*
2019 2018 2017(In Thousands)
Provision for probable losses (Notes 11) P=11,355 P=107,358 P=765Others 19,855 5,998 19,563
188,544 311,939 198,358P=232,239 P=346,359 P=233,287
Expenses of other operations consists of:
2019 2018 2017(In Thousands)
Interest expense (Note 24) P=827,042 P=812,915 P=511,772General and administrative
Salaries, wages, and employee benefits 127,178 88,254 51,260Outside services 47,255 − −Bank charges 28,469 20,497 31,385Travel and transportation 27,295 14,886 8,499Retirement cost 26,153 17,682 9,831Entertainment, amusement and recreation 19,629 14,673 12,036Taxes and licenses 15,138 15,961 10,822Repairs and maintenance 10,767 − −Depreciation and amortization (Note 16) 4,780 1,304 878Rent 3,729 4,919 3,234Provision for probable losses (Note 33) − 300,000 −Others − 1,481 38,789
310,393 479,657 166,734Share in net loss of an associate (Note 18) 59,923 − −
P=1,197,358 P=1,292,572 P=678,506
30. Retirement Plan
The Group has a funded, noncontributory defined benefit retirement plan (the “Plan”) coveringsubstantially all of its officers and regular employees. Under the Plan, all covered officers andemployees are entitled to cash benefits after satisfying certain age and service requirements. Theretirement plan provides retirement benefits equivalent to 70% to 125% of the final monthly salaryfor every year of service. The funds are administered by the Group’s Treasurer under the supervisionof the Board of Trustees of the Plan and are responsible for investment strategy of the Plan. RA 7641requires a provision for retirement pay to qualified private sector employees provided that theemployee’s retirement benefits under any collective bargaining and other agreements shall not be lessthan those provided under the law. The law does not require minimum funding of the plan. TheGroup updates the actuarial valuation every year by hiring the services of a third party professionallyqualified actuary.

- 114 -
*SGVFS039395*
Changes to the net retirement liabilities recognized in the consolidated statements of financialposition are as follows:
2019Present Value OfDefined Benefit
Obligations
Fair Value OfPlan Assets
(Note 26)
Net DefinedBenefit Liabilities
(Notes 20 and 23)(In Thousands)
Balances as at January 1, 2019 P=1,948,828 P=831,752 P=1,117,076Net benefit costs in profit or loss Current service cost 194,371 − 194,371 Net interest 118,226 91,860 26,366
312,597 91,860 220,737Remeasurements in other comprehensive income
Return on plan assets (excluding amountincluded in net interest) (143,449) − (143,449)
Actuarial changes arising from experienceadjustments (73,773) − (73,773)
Actuarial changes arising from changes infinancial assumptions 130,834 90,309 40,525
(86,388) 90,309 (176,697)Benefits paid (137,736) (85,000) (52,736)Contributions 72,984 41,692 31,292Balances as of December 31, 2019 P=2,110,285 P=970,613 P=1,139,672
2018Present Value OfDefined Benefit
Obligations
Fair Value OfPlan Assets
(Note 26)
Net DefinedBenefit Liabilities(Notes 20 and 23)
(In Thousands)Balances as at January 1, 2018 P=1,875,161 P=1,002,645 P=872,516Net benefit costs in profit or loss Current service cost 272,305 − 272,305 Net interest 84,938 38,550 46,388
357,243 38,550 318,693Remeasurements in other comprehensive income Return on plan assets (excluding amount
included in net interest) (53,270) (302,053) 248,783 Actuarial changes arising from experience
adjustments (36,229) − (36,229) Actuarial changes arising from changes in
financial assumptions (63,351) − (63,351)(152,850) (302,053) 149,203
Benefits paid (55,262) − (55,262)Contributions (75,464) 92,610 168,074Balances as of December 31, 2018 P=1,948,828 P=831,752 P=1,117,076
The fair value of plan assets by each class are as follows:
2019 2018(In Thousands)
Cash and cash equivalents P=26,290 P=148,337Debt instruments:
Private securities 79,775 72,508 Government securities 78,988 51,617
(Forward)

- 115 -
*SGVFS039395*
2019 2018(In Thousands)
Equity instruments: Financial services P=778,715 P=552,154 Real estate 5,001 5,001
Holding −Others 1,844 2,135Fair value of plan assets P=970,613 P=831,752
The Group’s plan assets are carried at fair value. The fair value of investments in equity and debtsecurities are based on quoted price in the active market. The fair value of other assets and liabilities,which include deposits in banks, accrued interest and other receivables, and trust fee payables,approximate their carrying amount due to the short-term nature of these accounts.
The plan assets are diversified investments and are not exposed to concentration risk.
Each year, an Asset-Liability Matching Study (ALMS) is performed with the result being analyzed interms of risk-and-return profiles. As of December 31, 2019 and 2018, the Parent Company’sinvestment strategy consists of 82.00% of equity instruments, 8.00% of debt instruments, 3.00% cashand 67.00% of equity instruments, 15.00% of debt instruments, and 18.00% cash, respectively.
EW expects to contribute P=149.8 million to the plan in 2019.
The cost of defined benefit retirement plans as well as the present value of the benefit obligation aredetermined using actuarial valuations. The actuarial valuation involves making various assumptions.The actuarial valuation involves making various assumptions. The principal assumptions used indetermining pension benefits includes discount rates of 4.9% to 7.4% and salary increase of 5.0% to6.5% in 2019, 2018 and 2017.
If the discount rate would be 100 basis points lower, the defined benefit obligation would increase byP=114.4 million and P=90.0 million in 2019 and 2018, respectively. If the discount rate would be 100basis points higher, the defined benefit obligation would decrease by P=96.6 million and P=76.8 millionin 2019 and 2018, respectively.
Each sensitivity analysis on the significant actuarial assumptions was prepared by remeasuring theDefined Benefit Obligation (DBO) at the reporting date after first adjusting one of the currentassumptions according to the applicable sensitivity increment or decrement (based on changes in therelevant assumption that were reasonably possible at the valuation date) while all other assumptionsremained unchanged. The sensitivities were expressed as the corresponding change in the DBO.
Shown below is the maturity analysis of the undiscounted benefit payments of the Group:
2019 2018 (In Thousands)
Less than 1 year P=415,294 P=403,357More than 1 year and up to 5 years 895,545 881,543More than 5 years and up to 10 years 2,841,861 2,971,633
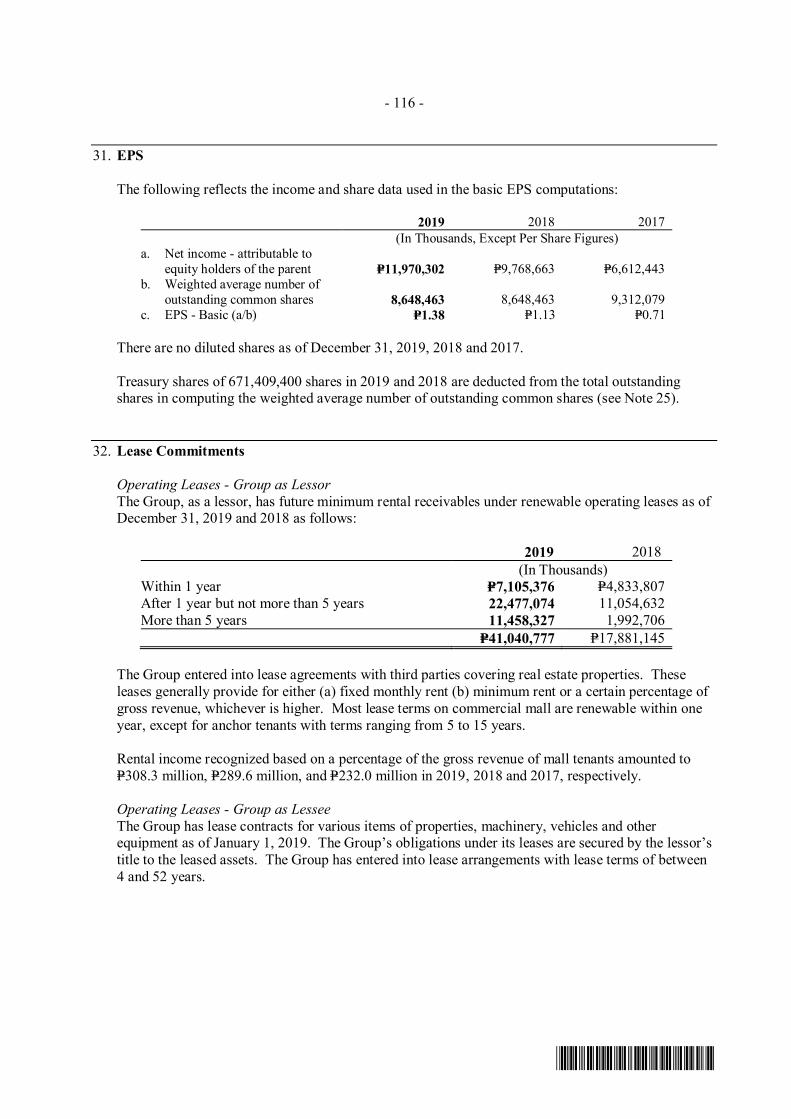
- 116 -
*SGVFS039395*
31. EPS
The following reflects the income and share data used in the basic EPS computations:
2019 2018 2017(In Thousands, Except Per Share Figures)
a. Net income - attributable toequity holders of the parent P=11,970,302 P=9,768,663 P=6,612,443
b. Weighted average number ofoutstanding common shares 8,648,463 8,648,463 9,312,079
c. EPS - Basic (a/b) P=1.38 P=1.13 P=0.71
There are no diluted shares as of December 31, 2019, 2018 and 2017.
Treasury shares of 671,409,400 shares in 2019 and 2018 are deducted from the total outstandingshares in computing the weighted average number of outstanding common shares (see Note 25).
32. Lease Commitments
Operating Leases - Group as LessorThe Group, as a lessor, has future minimum rental receivables under renewable operating leases as ofDecember 31, 2019 and 2018 as follows:
2019 2018(In Thousands)
Within 1 year P=7,105,376 P=4,833,807After 1 year but not more than 5 years 22,477,074 11,054,632More than 5 years 11,458,327 1,992,706
P=41,040,777 P=17,881,145
The Group entered into lease agreements with third parties covering real estate properties. Theseleases generally provide for either (a) fixed monthly rent (b) minimum rent or a certain percentage ofgross revenue, whichever is higher. Most lease terms on commercial mall are renewable within oneyear, except for anchor tenants with terms ranging from 5 to 15 years.
Rental income recognized based on a percentage of the gross revenue of mall tenants amounted toP=308.3 million, P=289.6 million, and P=232.0 million in 2019, 2018 and 2017, respectively.
Operating Leases - Group as LesseeThe Group has lease contracts for various items of properties, machinery, vehicles and otherequipment as of January 1, 2019. The Group’s obligations under its leases are secured by the lessor’stitle to the leased assets. The Group has entered into lease arrangements with lease terms of between4 and 52 years.

- 117 -
*SGVFS039395*
Set out below are the carrying amounts of ROU assets recognized and the movements as of and forthe year ended December 31, 2019:
Land Building Machinery TotalCostAt January 1, as previously reported P=− P=− P=− P=−Effect of adoption of PFRS 16 (Note 2) 3,190,832 4,299,563 167,849 7,658,244At January 1, as restated 3,190,832 4,299,563 167,849 7,658,244Additions ‒ 335,871 ‒ 335,871At December 31 3,190,832 4,635,434 167,849 7,994,115Accumulated AmortizationAt January 1 − − − −Amortization (Notes 17, 18, 28 and 29) 95,488 896,669 7,419 999,576At December 31 95,488 896,669 7,419 999,576Net Book Value P=3,095,344 P=3,738,765 P=160,430 P=6,994,539
As at December 31, 2019, the rollforward analysis of lease liabilities follows (amounts in thousands):
At January 1, as previously reported P=−Effect of adoption of PFRS 16 (Note 2) 7,130,249At January 1, as restated 7,130,249Additions 335,382Accretion of interest expense (Notes 28 and 29) 538,262Payments (1,118,715)As at December 31, 2019 P=6,885,178Lease liabilities - current portion P=1,406,807Lease liabilities - net of current portion P=5,478,371
The following are the amounts recognized in the consolidated statement of income for the year endedDecember 31, 2019 (amounts in thousands):
Amortization expense of ROU assets (Notes 2, 28 and 29) P=999,576Interest expense on lease liabilities (Notes 2, 28 and 29) 538,262Rent expense - short-term leases 165,483Rent expense - low-value assets 480Rent expense - variable lease payments 8,586Variable lease payments (included in cost of sales) ‒
The Group has lease contracts for land that contains variable payments based on a certain percentageof gross rental income of the commercial centers. These terms are negotiated by management forcertain commercial spaces without steady customer demand. Management’s objective is to align thelease expense with the revenue earned. The following provides information on the Group’s variablelease payments, including the magnitude in relation to fixed payments:
FixedPayments
VariablePayments Total
(In Thousands)Fixed P=105,219 P=− P=105,219Variable rent with minimum payment − 8,586 8,586Variable rent only − ‒ ‒At December 31 P=105,219 P=8,586 P=113,805

- 118 -
*SGVFS039395*
The significant leases entered into by the Group are as follows:
EW leases several premises occupied by its head office and branches. Some leases are subject toannual escalation of 5.0% to 10.0% and for periods ranging from 5 to 15 years, renewable uponmutual agreement of both parties.
FDC Misamis entered into a noncancellable lease agreement with PHIVIDEC Industrial Authority(PIA) for the lease of undivided parcel of lands containing an aggregate area of 844,921 squaremeters to be used for its business of power generation, supply and distribution with a term of 25years, exclusive of 3-year construction period. Construction period and lease period commenced onAugust 18, 2013 and August 18, 2016, respectively. The lease agreement can be renewed for another25 years upon expiration at the option of FDC Misamis subject to mutually agreed terms andconditions.
In 2016, FMI entered into a 50-year lease agreement with CDC (see Note 1) for the lease of201.6 hectares of land and hotel properties (the Mimosa Leisure Estate), renewable for another25 years. Land component of the lease is accounted for as an operating lease (see Note 3). As aresult of adoption of PFRS 16, the land component is accounted same as hotel properties (see Note 2).
33. Contingencies and Commitments
ContigenciesThe Group is involved in various legal actions, claims and contingencies incident to its ordinarycourse of the business. Management believes that any amount the Group may have to pay inconnection with any of these matters would not have a material adverse effect on the Group’sfinancial position or operating results. The information normally required by PAS 37 is not disclosedas it may prejudice the outcome of the proceedings.
PSHCIn connection with an ongoing case, PSHC has posted a standby letter of credit issued by a reputablebank to be the security for any judgment in the case. In August 2017, the Regional Trial Court (RTC)issued a decision in favor of the plaintiff.
On February 15, 2019, the Court of Appeals issued a decision which partially granted the appeal andmodified the actual damages in favor of the plaintiff. The plaintiff has filed a Motion for PartialReconsideration of the said decision of Court of Appeals. PSHC filed its Comment on such Motionon July 8, 2019. On November 12, 2019, the Court of Appeals issued a resolution denying theMotion for Partial Reconsideration filed by Coca-Cola.
FDCUIIn relation to the termination of IPPA contracts, certain liabilities arose, the settlement of which iscurrently under negotiation. The potential outcome of the said negotiation cannot be reliablydetermined.
CommitmentsEWEW has several loan related suits and claims that remain unsettled. It is not practicable to estimatethe potential financial impact of these contingencies. However, in the opinion of the management,the suits and claims, if decided adversely, will not involve sums having a material effect on theconsolidated financial statements.

- 119 -
*SGVFS039395*
The following is a summary of contingencies and commitments of EW at their Peso-equivalentcontractual amounts arising from off-balance sheet items of EW:
2019 2018(In Thousands)
Unused credit line - credit cards P=65,702,553 P=54,315,720Trust department accounts (Note 30) 35,044,324 24,470,187Spot exchange bought 5,721,431 4,889,915Spot exchange sold 5,721,431 4,889,355Outstanding guarantees 6,427,055 4,649,566Unused commercial letters of credit 4,300,936 4,323,703Forward exchange bought 3,229,841 2,940,079Forward exchange sold 3,211,557 2,917,193Treasurer/cashier/manager’s checks 1,392,247 2,248,574Financial futures sold 1,208,990 −Inward bills for collection 639,754 2,765,184Outward bills for collection 280,721 2,944,194Late deposits/payments received 280,721 51,461Items held for safekeeping 1,721 481Others 4,677 109
FLIBTO Agreement with Cebu ProvinceIn connection with the BTO Agreement with the Cebu Province, the Group is committed to developand construct a BPO Complex on the properties owned by Cebu Province located at Salinas, Lahug,Cebu City and transfer the ownership of the BPO Complex to the Cebu Province upon completion inexchange for the right to operate and manage the BPO Complex for the entire term of the agreementand its renewal (see Note 20).
Assignment of Development Rights under a BTO AgreementOn June 26, 2015, FLI and a third party entered into an agreement whereby the latter agreed to assignits project development rights and benefits under its BTO Agreement with Cebu Province to FLI. Inconsideration of this assignment, FLI paid upfront fee amounting to P=50.0 million and P=150.0 millionin 2016 and 2015, respectively. As of December 31, 2019, project construction has not started andthe upfront fee is recorded as part of Other assets in the consolidated statement of financial position(see Note 20).
Development Agreement with BCDAIn 2015, FLI won the contract to develop a 288-hectare area in Clark Green City in Pampanga andpaid 10% of the bid premium as bid security which amounted to P=16.0 million. On January 8, 2016,the Joint Venture Agreement with BCDA was signed, and pursuant to the terms of the developmentof the project, FLI paid the P=160.0 million bid premium representing the right to own 55.0% of theequity on the joint venture company to be formed with BCDA.
On February 11, 2016, FLI incorporated FCGCC and FBCI, the entities that will handle thedevelopment of the Clark Green City Project (see Note 1).

- 120 -
*SGVFS039395*
On March 16, 2016, FCGC and BCDA incorporated FBCI with an initial authorized capital stock ofP=1.0 million divided into 1.0 million common shares with par value of P=1.0 per share.
On March 29, 2017 and May 17, 2017, FBCI’s BOD and stockholders, respectively, approved theapplication for the increase in the authorized capital stock. On September 28, 2018, the SECapproved the increase in the authorized capital stock of FBCI from P=1.0 million divided into1.0 million shares at P=1.00 par value per share to P=1.0 billion divided into 1.0 billion shares atP=1.00 par value per share. FCGC subscribed 282,880,000 shares at par value amounting toP=282.9 million, out of which P=267.3 million shares at is still unpaid.
On the other hand, BCDA subscribed 231,000,000 shares amounting P=231.0 million and paid itssubscription thru the assignment of a 50-year DUR over the parcel of land where the CGC projectwill be developed. The value of the DUR approved by the SEC amounted to P=231.0 million, which isequal to BCDA’s subscription on the increase in authorized capital stock. FCGCC and BCDAsubscribed pro rata on the increase in authorized capital stock based on their existing ownershipinterest. The DUR was recorded in FBCI’s books in 2018 under investment properties.
PSHCMilling ContractsDSCC and CSCC (Millers) have milling contracts with various planters which provide for a certainsharing ratio between the Millers and the planters for the resulting sugar and molasses produced intheir respective sugar mills. The milling contracts are effective for a period of 15 agricultural cropyears, subject to an extension of another 15 crop years at the option of the Millers.
Development AgreementsHYSFC entered into several Development Agreements (the Agreements) with various landowners forthe development and cultivation of certain parcels of agricultural land for sugarcane production. TheAgreements are effective for periods of 15 agricultural crop years and renewable for such additionalperiods under conditions mutually agreed upon by the parties. Under the Agreements, HYSFC shallhave the rights and authority to enter into possession of the properties, and to do all acts, deeds,matter and things necessary for its proper and profitable development, cultivation and improvementas viable sugarcane plantation.
Other provisions of the Agreements follow:· HYSFC shall furnish necessary management expertise, equipment and technology for the
agricultural development and cultivation;· Parties shall be entitled to receive from the income derived from the property during the
effectivity of the Agreements;· HYSFC shall advance to the other party in the Agreements a portion of the latter’s share in the
profits from the Agreements;· After satisfying the advance in full, the succeeding annual share in the profits of the other party in
the Agreements shall be paid on the first day of the crop year following complete deduction ofadvances made; and
· The remaining amount in the income from the property shall pertain to the HYSFC as its share inthe income on the agricultural development undertaken.
Impacted by the development agreements are the advances to planters and biological assets recordedin the consolidated statements of financial position. The carrying values of the Group’s advances tosugar planters (included in Loans and receivables - sugar operations, see Note 11) and biologicalassets (included in Other assets account, see Note 20) in the consolidated statements of financial
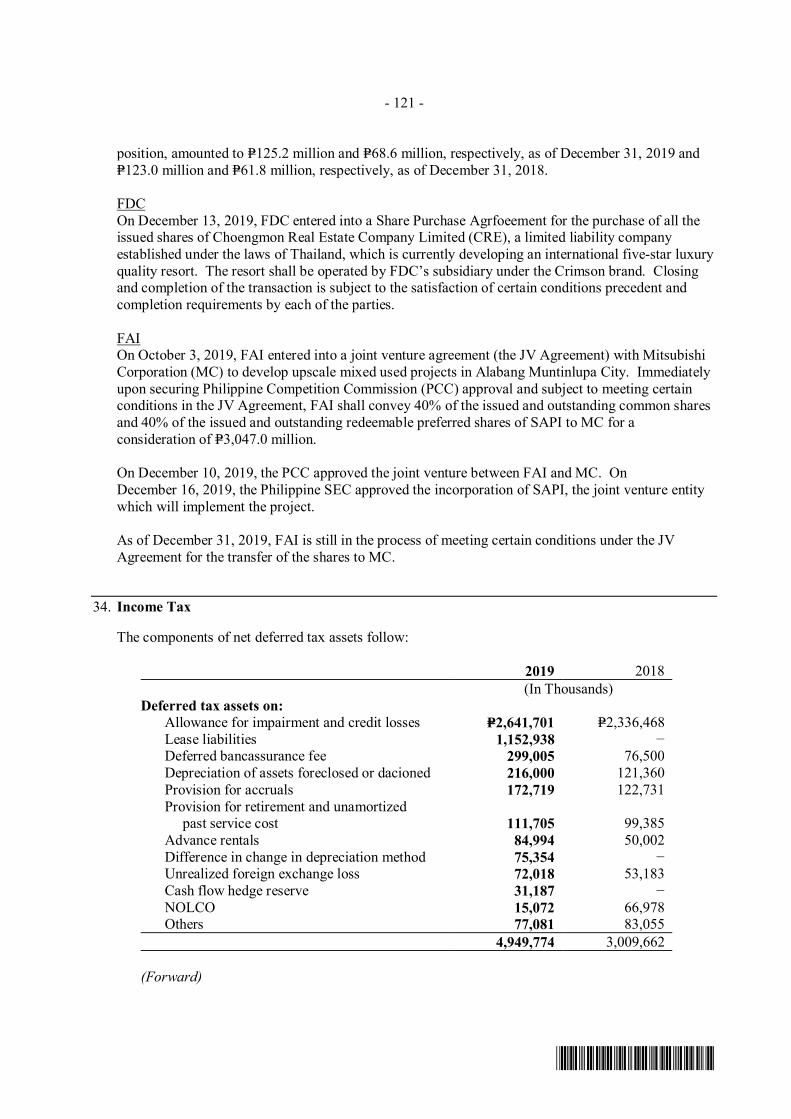
- 121 -
*SGVFS039395*
position, amounted to P=125.2 million and P=68.6 million, respectively, as of December 31, 2019 andP=123.0 million and P=61.8 million, respectively, as of December 31, 2018.
FDCOn December 13, 2019, FDC entered into a Share Purchase Agrfoeement for the purchase of all theissued shares of Choengmon Real Estate Company Limited (CRE), a limited liability companyestablished under the laws of Thailand, which is currently developing an international five-star luxuryquality resort. The resort shall be operated by FDC’s subsidiary under the Crimson brand. Closingand completion of the transaction is subject to the satisfaction of certain conditions precedent andcompletion requirements by each of the parties.
FAIOn October 3, 2019, FAI entered into a joint venture agreement (the JV Agreement) with MitsubishiCorporation (MC) to develop upscale mixed used projects in Alabang Muntinlupa City. Immediatelyupon securing Philippine Competition Commission (PCC) approval and subject to meeting certainconditions in the JV Agreement, FAI shall convey 40% of the issued and outstanding common sharesand 40% of the issued and outstanding redeemable preferred shares of SAPI to MC for aconsideration of P=3,047.0 million.
On December 10, 2019, the PCC approved the joint venture between FAI and MC. OnDecember 16, 2019, the Philippine SEC approved the incorporation of SAPI, the joint venture entitywhich will implement the project.
As of December 31, 2019, FAI is still in the process of meeting certain conditions under the JVAgreement for the transfer of the shares to MC.
34. Income Tax
The components of net deferred tax assets follow:
2019 2018(In Thousands)
Deferred tax assets on:Allowance for impairment and credit losses P=2,641,701 P=2,336,468Lease liabilities 1,152,938 −Deferred bancassurance fee 299,005 76,500Depreciation of assets foreclosed or dacioned 216,000 121,360Provision for accruals 172,719 122,731Provision for retirement and unamortized past service cost 111,705 99,385Advance rentals 84,994 50,002Difference in change in depreciation method 75,354 −Unrealized foreign exchange loss 72,018 53,183Cash flow hedge reserve 31,187 −NOLCO 15,072 66,978Others 77,081 83,055
4,949,774 3,009,662
(Forward)

- 122 -
*SGVFS039395*
2019 2018(In Thousands)
Deferred tax liabilities on:Right-of-use assets (P=1,045,265) P=−Gain on asset foreclosure and dacion
transactions (219,415) (18,950)Branch license acquired from business
combination (187,620) (187,620)Remeasurement of EW Ageas Life shares (100,750) (100,750)Revaluation increment in land (38,173) −Unrealized trading gains (34,551) −Excess of fair value over cost of investment
property and property and equipmentacquired in business combination (34,196) (34,196)
Unrealized foreign exchange gain (53) (52,528)Cash flow hedge reserve − (14,866)Others (34,320) −
(1,694,343) (408,910)P=3,255,431 P=2,600,752
The components of the net deferred tax liabilities follow:
2019 2018(In Thousands)
Deferred tax liabilities on:Capitalized borrowing costs P=4,839,445 P=4,799,433Deemed cost revaluation increment in investment
properties and property, plant and equipment 4,020,905 4,058,529Excess of real estate revenue based on financial
accounting policy over revenue based on taxrules 2,528,659 1,892,334
Right-of-use assets 312,669 −Excess of fair value over cost of investment
property and property and equipment acquiredin business combination − 118,063
Others 17,312 105,82111,718,990 10,974,180
Deferred tax assets on:Lease liabilities (233,368)Remeasurement losses on retirement plan (57,778) (92,732)
Allowance for expected credit losses (23,381) (14,034) Provision for retirement and unamortized
past service cost (10,512) (17,531)Unrealized foreign exchange loss (1,830) (237)
Others (177,529) (164,976)(504,398) (289,510)
P=11,214,592 P=10,684,670

- 123 -
*SGVFS039395*
The Group did not recognize deferred tax assets on the following temporary differences, NOLCO,allowance for expected credit losses, unrealized foreign exchange loss and MCIT since managementbelieves that their carryforward benefits may not be realized.
2019 2018(In Thousands)
NOLCO P=2,646,870 P=2,034,146Allowance for expected credit losses 58,294 −Unrealized foreign exchange loss − −Excess MCIT over RCIT 56,041 56,822
Details of the Group’s NOLCO and MCIT are as follows:
Year Incurred NOLCO MCIT Expiry Date(In Thousands)
2019 P=1,063,066 P=9,638 December 31, 20222018 619,910 13,322 December 31, 20212017 1,014,134 33,726 December 31, 2020
P=2,697,110 P=56,686
The following are the movements in NOLCO and MCIT:
NOLCO MCIT2019 2018 2019 2018
(In Thousands)Balances at beginning of year P=2,257,406 P=2,060,694 P=56,822 P=55,127Additions 1,063,066 619,910 9,638 13,322Expired/applied (623,362) (423,198) (9,774) (11,627)Balances at end of year P=2,697,110 P=2,257,406 P=56,686 P=56,822
The reconciliation of the provision for income tax computed at the statutory tax rate to the actualprovision for income tax follows:
2019 2018 2017(In Thousands)
Income tax at statutory rate P=6,080,148 P=5,366,373 P=4,314,512Adjustments for: Nondeductible expenses 570,788 575,371 336,318
Movements in unrecognized deferred taxassets 469,145 162,561 800,705
Expired MCIT 965 − −Income tax holiday availed (997,186) (738,630) (494,131)FCDU income (720,111) (420,040) (345,774)
Rent income covered by PhilippineEconomic Zone Authority (PEZA) (446,960) (307,634) (234,918)
Nontaxable income (381,406) (172,761) (167,421) Income subjected to final tax (251,855) (78,017) (40,176) Tax-exempt realized gross profit on sold
socialized housing units (14,292) (2,314) (7,090) Others 75,670 69,802 (53,598)
P=4,384,906 P=4,454,711 P=4,108,427

- 124 -
*SGVFS039395*
Under Philippine tax laws, the regular banking unit of EW is subject to percentage and other taxes(presented as taxes and licenses in the cost of banking and financial services in the consolidatedstatements of income) as well as income taxes. Percentage and other taxes consist principally ofgross receipt tax and documentary stamp taxes.
35. Segment Information
Operating segments are components of an enterprise about which separate financial information isavailable that is evaluated regularly by the chief operating decision-maker in deciding how to allocateresources and in assessing performance. Generally, financial information is required to be reportedon the basis that is used internally for evaluating segment performance and deciding how to allocateresources to segments.
Management monitors the operating results of its business units separately for the purpose of makingdecisions about resource allocation and performance assessment. Segment performance is evaluatedbased on profit or loss, which in certain respects, are measured similarly as net income in theconsolidated financial statements.
The chief operating decision-maker has been identified as the Executive Committee. This committeereviews the Group’s internal reports in order to assess performance and allocate resources.Management has determined the operating segments based on these reports. The Group does notreport its results based on geographical segments because the Group currently operates only in thePhilippines.
The Group derives its revenues from the following reportable segments:
Real Estate OperationsThis involves acquisition of land, planning and development of large-scale fully integrated residentialcommunities as well as the development and sale of residential lots, housing units, medium-riseresidential buildings, farm estates, industrial parks, residential resort projects, a private membershipclub and condominium buildings. This segment also involves operations and management of cinemaand mall, property management and leasing of commercial and office spaces.
Hospitality OperationsThis involves operation of hotels, including management of resorts, villas, golf course, serviceapartment and other services for the pleasure, comfort and convenience of guests in saidestablishments under its management.
Banking and Financial ServicesThis involves a wide range of financial services to consumer and corporate clients which includesdeposit-taking, loan and trade finance, treasury, trust services, credit cards, cash management,custodial services, insurance services and leasing and finance. The business units in this segmentconsist of retail banking, corporate banking, consumer banking, and treasury and trust.
Power OperationsThis involves the establishment, construction, operation of power plants and supply of power toofftakers and also includes retail electricity supply operations.

- 125 -
*SGVFS039395*
Sugar OperationsThis involves operation of agricultural lands for planting and cultivating farm products, operation of acomplete sugar central for the purpose of milling or converting sugar canes to centrifugal or refinedsugar and selling of sugar.
Other OperationsThis involves other operations of the Parent Company including CWSI, CTI, FDCI. FDCI wasincorporated to facilitate the Group’s issuance of foreign currency-denominated bonds while CWSIwas incorporated to provide maintenance, operation, management and rehabilitation of waterworkssewerage and sanitation system and services specifically for the distribution, supply and sale ofpotable water to domestic, commercial and industrial. CTI is engaged in providing computer andinformation technology services including, but not limited to, general consulting, improvementsystems planning, network integration, business re-engineering services, systems integration andsystem development.
The financial information on the operations of these business segments as shown below are based onthe measurement principles that are similar with those used in measuring the assets, liabilities, incomeand expenses in the consolidated financial statements which is in accordance with PFRS, except forthe adjusted Earnings Before Interest, Taxes, Depreciation and Amortization (EBITDA).

- 126 -
*SGVFS039395*
December 31, 2019
Real EstateOperations
HospitalityOperations
Banking andFinancialServices
PowerOperations
SugarOperations
OtherOperations Combined
EliminatingEntries Consolidated
(In Thousands)Revenues External customers P=28,917,841 P=3,311,183 P=29,139,017 P=10,113,074 P=3,367,879 P=– P=74,848,994 P=– P=74,848,994 Inter-segment 719,286 − 618,926 821,910 2,384,149 – 4,544,271 (4,544,271) –
29,637,127 3,311,183 29,757,943 10,934,984 5,752,028 – 79,393,265 (4,544,271) 74,848,994Other income 2,143,350 49,350 7,218,485 26,071 31,059 1,788,582 11,256,897 (1,788,582) 9,468,315
P=31,780,477 P=3,360,533 P=36,976,428 P=10,961,055 P=5,783,087 P=1,788,582 P=90,650,162 (P=6,332,853) P=84,317,309
Adjusted EBITDA P=15,435,157 P=794,435 P=9,941,365 P=4,965,235 P=500,834 P=972,558 P=32,609,584 (P=3,359,341) P=29,250,243
Net income P=8,859,468 P=40,800 P=6,241,906 P=2,352,276 P=281,252 P=17,334 P=17,793,036 (P=1,910,781) P=15,882,255AssetsOperating assets P=273,584,213 P=12,593,558 P=414,035,280 P=39,397,240 P=2,463,373 P=11,667,134 P=753,740,798 (P=111,585,923) P=642,154,875Less deferred tax asset 52,921 8,155 2,829,207 128,861 114,556 8,840 3,142,540 112,891 3,255,431Net operating assets P=273,531,292 P=12,585,403 P=411,206,073 P=39,268,379 P=2,348,817 P=11,658,294 P=750,598,258 (P=111,698,814) P=638,899,444
LiabilitiesOperating liabilities P=145,755,684 P=10,053,470 P=357,449,639 P=29,404,594 P=1,225,267 P=14,712,742 P=558,601,396 (P=48,596,507) P=510,004,889Less deferred tax liabilities 11,201,678 14,911 − 816 16,555 6,903 11,240,863 (26,271) 11,214,592Net operating liabilities P=134,554,006 P=10,038,559 P=357,449,639 P=29,403,778 P=1,208,712 P=14,705,839 P=547,360,533 (P=48,570,236) P=498,790,297
December 31, 2018 (As restated, see Note 2)
Real EstateOperations
HospitalityOperations
Banking andFinancialServices
PowerOperations
SugarOperations
OtherOperations Combined
EliminatingEntries Consolidated
(In Thousands)Revenues External customers P=26,537,183 P=2,665,466 P=23,794,478 P=8,630,461 P=3,287,221 P=– P=64,914,809 P=− P=64,914,809 Inter-segment 793,251 – 563,633 681,762 2,569,278 – 4,607,924 (4,607,924) –
27,330,434 2,665,466 24,358,111 9,312,223 5,856,499 – 69,522,733 (4,607,924) 64,914,809Other income 2,236,798 39,839 6,212,376 659,299 89,238 5,015,661 14,253,211 (5,015,661) 9,237,550
P=29,567,232 P=2,705,305 P=30,570,487 P=9,971,522 P=5,945,737 P=5,015,661 P=83,775,944 (P=9,623,585) P=74,152,359Adjusted EBITDA P=14,414,175 P=546,486 P=7,241,568 P=4,594,725 P=411,472 P=3,469,785 P=30,678,211 (P=5,284,908) P=25,393,303Net income P=9,143,351 P=133,857 P=4,508,062 P=1,866,963 P=147,708 P=2,377,842 P=18,177,783 (P=4,744,584) P=13,433,199Forward

- 127 -
*SGVFS039395*
December 31, 2018 (As restated, see Note 2)
Real estateOperations
HospitalityOperations
Banking andFinancialServices
PowerOperations
SugarOperations
OtherOperations Combined
EliminatingEntries Consolidated
(In Thousands)AssetsOperating assets P=257,158,903 P=9,602,327 P=374,845,176 P=37,942,945 P=2,676,305 P=12,329,533 P=694,555,189 (P=104,766,190) P=589,788,999Less deferred tax asset 104,921 – 2,265,962 37,770 48,698 48 2,457,399 143,353 2,600,752Net operating assets P=257,053,982 P=9,602,327 P=372,579,214 P=37,905,175 P=2,627,607 P=12,329,485 P=692,097,790 (P=104,909,543) P=587,188,247
LiabilitiesOperating liabilities P=135,885,785 P=7,851,979 P=324,707,284 P=29,957,346 P=1,655,395 P=15,214,199 P=515,271,988 (P=45,173,463) P=470,098,525Less deferred tax liabilities 10,742,612 − − 4,600 19,091 − 10,766,303 (81,633) 10,684,670Net operating liabilities P=125,143,173 P=7,851,979 P=324,707,284 P=29,952,746 P=1,636,304 P=15,214,199 P=504,505,685 (P=45,091,830) P=459,413,855
December 31, 2017
Real EstateOperations
HospitalityOperations
Banking andFinancialServices
PowerOperations
SugarOperations
OtherOperations Combined
EliminatingEntries Consolidated
(In Thousands)Revenues External customers P=22,127,917 P=2,174,499 P=21,494,677 P=9,942,496 P=2,143,009 P=– P=57,882,598 P=– P=57,882,598 Inter-segment 614,712 525,332 474,127 1,687,440 – 3,301,611 (3,301,611) –
22,742,629 2,174,499 22,020,009 10,416,623 3,830,449 – 61,184,209 (3,301,611) 57,882,598Other income 2,437,502 31,939 7,197,714 9,149 31,512 2,789,162 12,496,978 (2,789,162) 9,707,816
P=25,180,131 P=2,206,438 P=29,217,723 P=10,425,772 P=3,861,961 P=2,789,162 P=73,681,187 (P=6,090,773) P=67,590,414
Adjusted EBITDA P=11,840,557 P=480,129 8,139,116 P=2,972,774 P=303,760 P=2,156,151 P=25,892,487 (P=3,527,894) P=22,364,593
Net income (loss) P=7,763,221 P=5,295 P=5,050,700 (P=1,150,352) P=119,483 P=1,080,231 P=12,868,578 (P=2,595,300) P=10,273,278

- 126 -
*SGVFS039395*
The Group’s chief operating decision-maker also use net income per segment after elimination inassessing performance of the identified reportable segments, as follows:
Net Income(Loss) Before
EliminationEliminating
Entries
Net Income(Loss) AfterElimination
(In Thousands)December 31, 2019Real estate operations P=8,859,468 (P=427,435) P=8,432,033Hospitality operations 40,800 359,835 400,635Banking and financial services 6,241,906 (138,094) 6,103,812Power operations 2,352,276 166,115 2,518,391Sugar operations 281,252 17,694 298,946Other operations 17,334 (1,888,896) (1,871,562)
P=17,793,036 (P=1,910,781) P=15,882,255December 31, 2018Real estate operations P=9,143,351 (P=633,358) P=8,509,993Hospitality operations 133,857 222,906 356,763Banking and financial services 4,508,062 (284,336) 4,223,726Power operations 1,866,963 228,558 2,095,521Sugar operations 147,708 11,476 159,184Other operations 2,377,842 (4,289,830) (1,911,988)
P=18,177,783 (P=4,744,584) P=13,433,199December 31, 2017Real estate operations P=7,763,221 (P=400,276) P=7,362,945Hospitality operations 5,295 229,118 234,413Banking and financial services 5,050,700 (307,895) 4,742,805Power operations (1,150,352) 268,912 (881,440)Sugar operations 119,483 21,217 140,700Other operations 1,080,231 (2,406,376) (1,326,145)
P=12,868,578 (P=2,595,300) P=10,273,278
The following table shows a reconciliation of the total adjusted EBITDA to total income beforeincome tax:
2019 2018 2017(In Thousands)
Adjusted EBITDA for reportable segments P=29,250,243 P=25,393,303 P=22,364,593Depreciation and amortization (4,789,663) (3,846,026) (4,862,575)Operating profit 24,460,580 21,547,277 17,502,018Interest expense * (4,193,419) (3,660,367) (3,120,313)Income before income tax P=20,267,161 P=17,886,910 P=14,381,705* Excluding accretion expense on liability on IPPA contract and financial liability on lease contract (see Note 29).

- 127 -
*SGVFS039395*
Disaggregated Revenue Information:The Group derives revenue from the transfer of goods and services over time and at a point in time, indifferent product types and other geographical location within the Philippines.
Real Estate OperationsDisaggregation of each sources of revenue from contracts with customers are presented below:
2019 2018 2017(In Thousands)
Real Estate Sales by Product Type Condominium and residential units P=19,471,168 P=17,194,590 P=15,313,566 Commercial lots 1,666,703 2,938,297 1,724,961 Others 315,673 229,912 192,190
21,453,544 20,362,799 17,230,717Cinema Operations by Type of Goods or
Services (included as part of Mall andrental revenue)
Theater sales 150,565 129,333 100,288 Snack bar sales 22,526 16,201 12,370
173,091 145,534 112,658Total Revenue from Contracts with
Customers 21,626,635 20,508,333 17,343,375Rental and related services Office leasing 5,170,892 3,862,758 2,840,796 Mall and retail 1,810,698 2,077,415 1,806,393
Land lease 309,616 88,677 137,3537,291,206 6,028,850 4,784,542
Total Revenue P=28,917,841 P=26,537,183 P=22,127,917
The Group’s real estate sales and theater sales are revenue from contracts with customers recognizedover time while revenue from snack bar sales is recognized at a point in time.
Hospitality OperationsDisaggregation of each sources of revenue from contracts with customers are presented below:
2019 2018 2017(In Thousands)
Hospitality Operations by Type of Services Rooms services P=1,842,294 P=1,400,300 P=1,136,815
Golf operations related services 257,305 352,291 234,143 Other operating departments 175,985 65,265 99,727
2,275,584 1,817,856 1,470,685Sale of Goods by Product Type Food and beverage 1,035,599 845,619 696,851
Souvenirs − 1,991 5,990 Others − − 973
1,035,599 847,610 703,814Total Revenue from Contracts with Customers P=3,311,183 P=2,665,466 P=2,174,499

- 128 -
*SGVFS039395*
The Group recognizes revenue from room services and services of other operating department overtime while revenue from sale of food and beverage, souvenirs and others are recognized at a point intime.
Banking and Financial ServicesDisaggregation of each sources of revenue from banking and financial services are presentedbelow:
2019 2018 2017(In Thousands)
Interest IncomeLoans and receivables (Note 9) P=26,623,945 P=22,544,540 P=20,562,166Financial assets at FVOCI and
investment securities at amortizedcost (Note 12) 2,037,981 1,029,352 507,051
Financial assets as FVPL (Note 12) 414,970 118,827 315,107Due from other banks and interbank
loans receivables (Note 6) 62,121 101,759 110,353Total Interest Income P=29,139,017 P=23,794,478 P=21,494,677
Power OperationsDisaggregation of each sources of revenue from contracts with customers are presented below:
2019 2018 2017(In Thousands)
Revenue by Type of Services Generated power P=9,872,754 P=8,510,726 P=6,694,187 Retail electricity supply 240,320 119,735 29,770 IPPA – – 3,218,539Total Revenue from Contracts with Customers P=10,113,074 P=8,630,461 P=9,942,496
The Group’s revenue from generated power, retail electricity supply and IPP administration isrecognized over time.
Sugar OperationsDisaggregation of each sources of revenue from contracts with customers are presented below:
2019
2018As restated,(see Note 2)
2017
(In Thousands)By Product Type Raw sugar P=2,246,274 P=2,285,467 P=1,851,326
Milling revenues (Note 2) 821,118 838,505 – Molasses 211,580 135,674 220,791 Refined sugar 88,907 27,575 70,892Total Revenue from Contracts with
Customers P=3,367,879 P=3,287,221 P=2,143,009
The Group’s revenue from raw sugar, refined sugar and molasses is recognized at the point whencontrol of the goods is transferred to customers.

- 129 -
*SGVFS039395*
36. Fair Value Measurement
The following table sets forth the fair value hierarchy of the Group’s assets and liabilities measured atfair value and those for which fair values are required to be disclosed:
2019Fair Value
CarryingValue Total
Quoted Pricesin Active
Market(Level 1)
SignificantObservable
Inputs(Level 2)
SignificantUnobservable
Inputs(Level 3)
(In Thousands)Assets measured at fair valueFinancial assetsFinancial assets at FVPL (Note 12) Government securities P=16,768,178 P=16,768,178 P=16,768,178 P=− P=− Private bonds 62,188 62,188 62,188 − − Equity securities 10,343 10,343 10,343 − −
16,840,709 16,840,709 16,840,709 − −Derivative assets (Note 20) 1,534,551 1,534,551 − 1,534,551 −Financial assets at FVOCI (Note 12)
Government debt securities 4,650,635 4,650,635 4,650,635 − − Quoted equity securities including club shares 475,133 475,133 14,903 460,230 − Unquoted equity securities 197,902 197,902 ‒ ‒ 197,902
5,323,670 5,323,670 4,665,538 460,230 197,902Assets for which fair values are disclosedFinancial assetsInvestment securities at amortized cost (Note 12) Government securities 40,243,683 44,358,323 44,358,323 − − Private bonds 9,142,388 10,060,963 10,060,963 − −
49,386,071 54,419,286 54,419,286 − −Loans and receivables
Banking and financial services (Note 9) Corporate lending 57,366,786 56,112,036 − − 56,112,036 Consumer lending 189,806,049 193,211,159 − − 193,211,159 Unquoted debt securities 344,188 344,188 − − 344,188
247,517,023 249,667,383 − − 249,667,383Real estate operations (Note 7)
Contracts receivable 1,625,907 1,625,907 − − 1,625,907 Receivables from tenants 1,996,515 1,996,515 − − 1,996,515
3,622,422 3,622,422 − − 3,622,422Nonfinancial assets
Investment properties (Note 16) 82,571,561 293,346,285 ‒ ‒ 293,346,285Total assets P=406,796,007 P=624,754,306 P=75,925,533 P=1,994,781 P=546,833,992Liabilities measured at fair value
Financial liabilitiesDerivative liabilities (Note 23) P=128,004 P=128,004 P=− P=128,004 P=−Liabilities for which fair values are disclosed
Financial liabilities at amortized costsDeposit liabilities (Note 21) Time 104,605,705 105,580,442 − − 105,580,442 LTNCD 13,335,031 13,398,560 − − 13,398,560
117,940,736 118,979,002 − − 118,979,002 Accounts payable, accrued expenses and other
liabilities (Note 23) Accounts payable 19,787,823 18,833,441 − − 18,833,441 Retention fee payable 3,284,336 3,180,668 − − 3,180,668 Deposits for registration 1,289,402 1,289,402 − − 1,289,402
24,361,561 23,303,511 − − 23,303,511Lease liabilities (Note 32) 6,885,178 7,645,772 − − 7,645,772Long-term debt (Note 24) 130,221,265 144,265,477 − − 144,265,477
P=279,536,744 P=294,321,766 P=‒ P=128,004 P=294,193,762

- 130 -
*SGVFS039395*
2018Fair Value
CarryingValue Total
Quoted Pricesin Active
Market(Level 1)
SignificantObservable
Inputs(Level 2)
SignificantUnobservable
Inputs(Level 3)
(In Thousands)Assets measured at fair valueFinancial assetsFinancial assets at FVPL (Note 12) Government securities P=4,286,259 P=4,286,259 P=4,286,259 P=– P=– Private bonds 42,204 42,204 42,204 − – Equity securities 10,330 10,330 10,330 − –
4,338,793 4,338,793 4,338,793 – –Derivative assets (Note 20) 2,076,533 2,076,533 − 2,076,533 –Financial assets at FVOCI (Note 12) Government debt securities 248,206 248,206 248,206 – – Quoted equity securities including club shares 354,019 354,019 94,576 259,443 − Unquoted equity securities 148,062 148,062 − − 148,062
750,287 750,287 342,782 259,443 148,062Assets for which fair values are disclosedFinancial assetsInvestment securities at amortized cost (Note 12) Government securities 26,100,243 25,659,808 25,659,808 − − Private bonds 10,413,198 9,856,548 9,856,548 − −
36,513,441 35,516,356 35,516,356 − −Loans and receivables
Banking and financial services (Note 9) Corporate lending 58,758,342 63,036,884 − − 63,036,884 Consumer lending 166,690,714 158,964,154 − − 158,964,154 Unquoted debt securities 341,890 345,086 − − 345,086
225,790,946 222,346,124 − − 222,346,124Real estate operations (Note 7)
Contracts receivable 1,001,844 1,001,844 − − 1,001,844 Receivables from tenants 1,695,254 1,695,254 − − 1,695,254
2,697,098 2,697,098 − − 2,697,098Nonfinancial assets
Investment properties (Note 16) 68,981,794 124,166,787 − − 124,166,787Total assets P=341,148,892 P=391,891,978 P=40,197,931 P=2,335,976 P=349,358,071Liabilities measured at fair value
Financial liabilitiesDerivative liabilities P=146,548 P=146,548 P=– P=146,548 P=–Liabilities for which fair values are disclosed
Financial liabilities at amortized costsDeposit liabilities (Note 21) Time 126,915,196 127,649,516 − − 127,649,516 LTNCD 15,797,150 16,848,703 − − 16,848,703
142,712,346 144,498,219 − − 144,498,219 Accounts payable, accrued expenses and other
liabilities (Note 23) Accounts payable 18,861,539 17,010,138 − − 17,010,138 Retention fee payable 3,793,566 3,676,638 − − 3,676,638 Financial liability on lease contract 874,813 874,813 − − 874,813 Deposits for registration 1,059,970 1,014,649 − − 1,014,649
24,589,888 22,576,238 − − 22,576,238Long-term debt (Note 24) 127,347,516 122,420,652 − − 122,420,652
P=294,796,298 P=289,641,657 P=− P=146,548 P=289,495,109
The methods and assumptions used by the Group in estimating the fair value of the financialinstruments are:
· Financial Assets at FVPL: Fair value is based on quoted prices as of reporting dates.
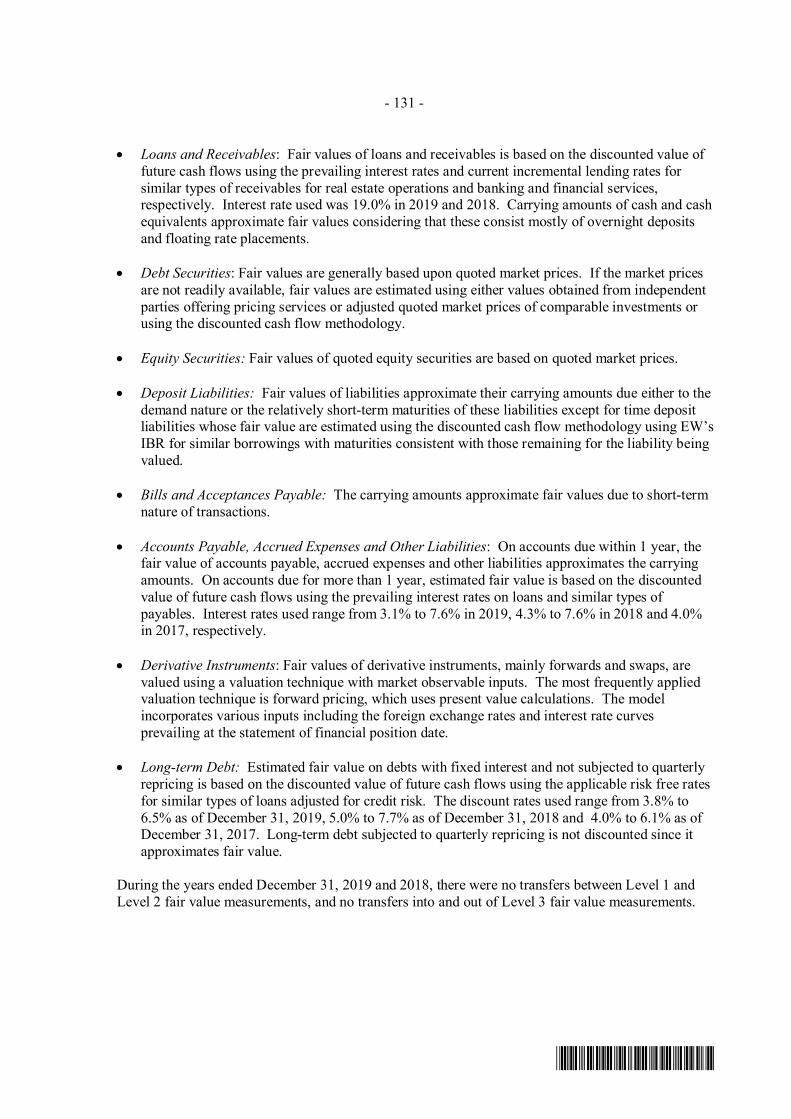
- 131 -
*SGVFS039395*
· Loans and Receivables: Fair values of loans and receivables is based on the discounted value offuture cash flows using the prevailing interest rates and current incremental lending rates forsimilar types of receivables for real estate operations and banking and financial services,respectively. Interest rate used was 19.0% in 2019 and 2018. Carrying amounts of cash and cashequivalents approximate fair values considering that these consist mostly of overnight depositsand floating rate placements.
· Debt Securities: Fair values are generally based upon quoted market prices. If the market pricesare not readily available, fair values are estimated using either values obtained from independentparties offering pricing services or adjusted quoted market prices of comparable investments orusing the discounted cash flow methodology.
· Equity Securities: Fair values of quoted equity securities are based on quoted market prices.
· Deposit Liabilities: Fair values of liabilities approximate their carrying amounts due either to thedemand nature or the relatively short-term maturities of these liabilities except for time depositliabilities whose fair value are estimated using the discounted cash flow methodology using EW’sIBR for similar borrowings with maturities consistent with those remaining for the liability beingvalued.
· Bills and Acceptances Payable: The carrying amounts approximate fair values due to short-termnature of transactions.
· Accounts Payable, Accrued Expenses and Other Liabilities: On accounts due within 1 year, thefair value of accounts payable, accrued expenses and other liabilities approximates the carryingamounts. On accounts due for more than 1 year, estimated fair value is based on the discountedvalue of future cash flows using the prevailing interest rates on loans and similar types ofpayables. Interest rates used range from 3.1% to 7.6% in 2019, 4.3% to 7.6% in 2018 and 4.0%in 2017, respectively.
· Derivative Instruments: Fair values of derivative instruments, mainly forwards and swaps, arevalued using a valuation technique with market observable inputs. The most frequently appliedvaluation technique is forward pricing, which uses present value calculations. The modelincorporates various inputs including the foreign exchange rates and interest rate curvesprevailing at the statement of financial position date.
· Long-term Debt: Estimated fair value on debts with fixed interest and not subjected to quarterlyrepricing is based on the discounted value of future cash flows using the applicable risk free ratesfor similar types of loans adjusted for credit risk. The discount rates used range from 3.8% to6.5% as of December 31, 2019, 5.0% to 7.7% as of December 31, 2018 and 4.0% to 6.1% as ofDecember 31, 2017. Long-term debt subjected to quarterly repricing is not discounted since itapproximates fair value.
During the years ended December 31, 2019 and 2018, there were no transfers between Level 1 andLevel 2 fair value measurements, and no transfers into and out of Level 3 fair value measurements.
- 132 -
*SGVFS039395*
37. Financial Risk Management Objectives and Policies
The Group’s principal financial instruments are composed of cash and cash equivalents, financialassets at FVPL, financial assets at FVOCI and investment securities at amortized cost, loans fromfinancial institutions, mortgage and contracts receivables and other receivables. The main purpose ofthese financial instruments is to raise financing for the Group’s operations. The main objectives ofthe Group’s financial risk management are as follows:
· To identify and monitor such risks on an ongoing basis;· To minimize and mitigate such risks; and,· To provide a degree of certainty about costs.
Banking and Financial OperationsRisk ManagementTo ensure that corporate goals and objectives and business and risk strategies are achieved, EWutilizes a risk management process that is applied throughout the organization in executing allbusiness activities. Employees’ functions and roles fall into 1 of the 3 categories where risk must bemanaged in the business units, operating units and governance units.
EW’s activities are principally related to the use of financial instruments and are exposed to creditrisk, liquidity risk, operational risk and market risk, the latter being subdivided into trading and non-trading risks. Forming part of a coherent risk management system are the risk concepts, control tools,analytical models, statistical methodologies, historical researches and market analysis, which arebeing employed by EW. These tools support the key risk process that involves identifying,measuring, controlling and monitoring risks.
Risk Management Structurea. BOD
EW’s risk culture is practiced and observed across EW putting the prime responsibility on theBOD. It establishes the risk culture and the risk management organization and incorporates therisk process as an essential part of the strategic plan of EW. The BOD approves EW’sarticulation of risk appetite which is used internally to help management understand the tolerancefor risk in each of the major risk categories, its measurement and key controls available thatinfluence EW’s level of risk taking. All risk management policies and policy amendments, risk-taking limits such as but not limited to credit and trade transactions, market risk limits,counterparty limits, trader’s limits and activities are based on EW’s established approvingauthorities which are approved by EW’s BOD. At a high level, the BOD also approves EW’sframework for managing risk.
b. Executive CommitteeThis is a board level committee, which reviews the bank-wide credit strategy, profile andperformance. It approves the credit risk-taking activities based on EW’s established approvingauthorities and likewise reviews and endorses credit-granting activities, including the InternalCredit Risk Rating System. All credit proposals beyond the credit approving limit of the Loanand Investments Committee passes through this committee for final approval.
c. Loan and Investments CommitteeThis committee is headed by the Chairman of EW whose primary responsibility is to overseeEW’s credit risk-taking activities and overall adherence to the credit risk managementframework, review business/credit risk strategies, quality and profitability of EW’s credit

- 133 -
*SGVFS039395*
portfolio and recommend changes to the credit evaluation process, credit risk acceptance criteriaand the minimum and target return per credit or investment transaction.
All credit risk-taking activities based on EW’s established approving authorities are evaluatedand approved by this committee. It establishes an infrastructure by ensuring business units havethe right systems and adequate and competent manpower support to effectively manage its creditrisk.
d. ALCOALCO, a management level committee, meets on a weekly basis and is responsible for the over-all management of EW’s market, liquidity, and financial position related risks. It monitors EW’sliquidity position and reviews the impact of strategic decisions on liquidity. It is responsible formanaging liquidity risks and ensuring exposures remain within established tolerance levels. TheALCO’s primary responsibilities include, among others, (a) ensuring that EW and each businessunit holds sufficient liquid assets of appropriate quality and in appropriate currencies to meetshort-term funding and regulatory requirements, (b) managing financial position and ensuringthat business strategies are consistent with its liquidity, capital and funding strategies, (c)establishing asset and/or liability pricing policies that are consistent with the financial positionobjectives, (d) recommending market and liquidity risk limits to the Risk ManagementCommittee and BOD and I approving the assumptions used in contingency and funding plans. Italso reviews cash flow forecasts, stress testing scenarios and results, and implements liquiditylimits and guidelines.
e. Risk Management Committee (RMC)RMC is a board level committee that convenes monthly and is primarily responsible to assist theBoard in managing the EW’s risk taking activities. This is performed by the committee byinstitutionalizing risk policies and overseeing EW’s risk management system. It develops andrecommends risk appetite and tolerances for the EW’s major risk exposures to the Board. Riskmanagement principles, strategies, framework, policies, processes, and initiatives and anymodifications and amendments thereto are reviewed and approved by RMC. It oversees andreports to the Board the effectiveness of the risk management system, overall risk profile, andcompliance with the risk appetite and tolerances that the Board approved.
f. Risk Management Subcommittee (RMSC)RMSC is a management level committee that convenes, at least four times in a year, and isresponsible to assist RMC in fulfilling its responsibilities in managing EW’s risk taking activities.This is performed by the committee by implementing the risk management principles, strategies,framework, policies, processes, and initiatives across EW. It leads the effective conduct of riskand capital management. It oversees and directs the management of EW’s overall risk profile.The committee likewise oversees risk incidents, control gaps, and control deficiencies andmanagement actions in implementing the corresponding corrective actions.
g. Audit Committee (Audit Com)The Audit Com assists the BOD in fulfilling its responsibilities for overseeing seniormanagement in establishing and maintaining an adequate, effective and efficient internal controlframework. It ensures that systems and processes are designed to provide reasonable assurance inareas including reporting, monitoring compliance with laws, regulations and internal policies,efficiency and effectiveness of operations, and safeguarding of assets. It is tasked to discuss withmanagement EW’s major risk exposures and ensures accountability on the part of management tomonitor and control such exposures including EW’s risk assessment and risk managementpolicies. The Audit Com oversees the internal audit function and is responsible for monitoringand reviewing its effectiveness while ensuring its independence.

- 134 -
*SGVFS039395*
h. Corporate Governance and Compliance Committee (CGCC)The CGCC leads the Parent Company in defining and fulfilling the corporate governance policiesand attaining best practices while overseeing the implementation of EW’s compliance program,money laundering and terrorist financing prevention program and ensuring that regulatorycompliance issues are resolved expeditiously. In addition to its governance role, the CGCC alsoassumes the nomination function whereby it reviews and evaluates the qualifications of allpersons nominated to the BOD, all direct reports of the President and Chief Executive Officer(CEO), Heads of Governance Units regardless of rank, and other positions of EW requiringappointment by the BOD. The committee oversees the annual performance evaluation of theBOD, its committees, and individual directors and conducts an annual self-evaluation of itsperformance as prescribed under and in accordance with the Corporate Governance Manual andSEC Code of Corporate Governance for Publicly Listed Companies.
i. RPT CommitteeThe RPT Committee assists the BOD in ensuring that the transactions with related parties of EWare handled in a sound and prudent manner, with integrity and in compliance with the applicablelaws and regulations to protect the interest of depositors, creditors and other stakeholders. It alsoensures that related party transactions are conducted on an arm’s length basis and that nostakeholder is unduly disadvantaged by such transactions.
j. Asset Impairment Committee (AIC)AIC is a management level committee that convenes at least 2 times in a year, and shall officiallyrepresent EW’s source of experienced credit judgement insofar as the asset impairment exerciseis concerned. This experienced credit judgment is tapped to provide guidance under thefollowing, but not limited to, conditions: 1) The result of the calculation is assessed to beunreasonable that it is considered as not fairly representative of EW’s historical experience,current, and prospective credit condition or other conditions deemed relevant in reasonablydetermining EW’s assets’ recoverable value; 2) There is an adverse change in the prevailing orforeseen prospective economic condition relative to the embedded presumption in the existingimpairment framework; and 3) The data set in the calculation parameters is not available orinsufficient to complete the calculation.
k. Risk Management Division (RMD)RMD performs an independent risk governance function within EW. RMD is tasked withidentifying, measuring, controlling and monitoring existing and emerging risks inherent in EW’soverall portfolio (on- or off-balance sheet). RMD develops and employs risk assessment tools tofacilitate risk identification, analysis and measurement. It is responsible for developing andimplementing the framework for policies and practices to assess and manage enterprise-widemarket, credit, operational, and all other risks of EW.
It also develops and endorses risk tolerance limits for BOD approval, as endorsed by the RMC,and monitors compliance with approved risk tolerance limits. Finally, it regularly apprises theBOD, through the RMC, the results of its risk monitoring.
l. Internal Audit Division (IAD)IAD provides an independent assessment of the adequacy of EW’s internal controls, riskmanagement, governance framework and execution/operational practices. Internal audit activitiesare conducted in accordance with the International Standards for the Professional Practice ofInternal Auditing (ISPPIA) and the Code of Ethics. IAD has an adopted a risk assessmentmethodology, which provides a sound basis in the selection of areas of coverage and frequency ofaudit for the preparation of the annual audit plan. IAD employs a risk-based audit approach thatexamines both the adequacy of the policies and EW’s compliance with the procedures while

- 135 -
*SGVFS039395*
assuring audit coverage of the areas identified as representing the greatest current risk. Itdiscusses the results of assessments with management, and reports its findings andrecommendations to the Audit Com. IAD’s activities are suitably designed to provide the BODwith reasonable assurance that significant financial and operating information is materiallycomplete, reliable and accurate; internal resources are adequately protected; and employeeperformance is in compliance with EW’s policies, standards, procedures and applicable laws andregulations.
m. Compliance DivisionCompliance Division is vested with the responsibility of overseeing the design of EW’sCompliance Program and coordinating its effective implementation towards the soundmanagement of Business and Compliance Risks. It also manages the implementation of theMoney Laundering and Terrorist Financing Program. Its mandate is to ensure that EW iscompliant with relevant and applicable laws, rules, regulations, codes of conduct and standards ofgood practice while avoiding an overly risk-averse environment that inhibits business growth. Itserves as EW’s central point of contact with banking regulators.
Credit RiskCredit risk refers to the potential loss of earnings or capital arising from an obligor/s, customer/s orcounterparty’s failure to perform and/or to meet the terms of any contract with EW. Credit risks maylast for the entire tenor and set at the full amount of a transaction and, in some cases, may exceed theoriginal principal exposures. The risk may arise from lending, trade financing, trading, investmentsand other activities undertaken by EW. To identify and assess this risk, EW has: 1) approval processper borrower or business and/or product segment; 2) structured and standardized credit rating forcorporate, credit cards, auto and mortgage loans, and risk acceptance criteria for other consumerloans. For large corporate credit transactions, EW has a comprehensive procedure for creditevaluation, risk assessment and well-defined concentration limits, which are established for each typeof borrower. EW’s credit risk is managed at the portfolio level, which may be on an overall or byproduct perspective.
Credit ConcentrationExcessive concentration of lending plays a significant role in the weakening of asset quality.EW reduces this risk by diversifying its loan portfolio across various sectors and borrowers.EW believes that good diversification across economic sectors and geographic areas, among others,will enable it to ride through business cycles without causing undue harm to its asset quality.
EW’s loan portfolio is in line with EW’s policy of not having significant concentrations of exposureto specific industries or group of borrowers. Management of concentration of risk is byclient/counterparty, by industry sector and by geographical location. For risk concentrationmonitoring purposes, the financial assets are broadly categorized into loans and receivables, loans andadvances to banks, and investment securities. EW ensures compliance with BSP’s limit on exposureto any single person or group of connected persons by closely monitori ng large exposures and top 20borrowers for both single and group accounts.
Aside from ensuring compliance with BSP’s limit on exposures to any single person or group ofconnected persons, it is EW’s policy to keep the expected loss (determined based on the credit riskrating of the account) of large exposure accounts to, at most, 1.5% of their aggregate outstandingbalance. This is to maintain the quality of EW’s large exposures. With this, accounts with better riskgrades are given priority in terms of being granted a bigger share in EW’s loan facilities.
Aligned with the Manual of Regulations for Banks definition, EW considers its loan portfolioconcentrated if it has exposures of more than thirty percent (30.0%) to an industry.

- 136 -
*SGVFS039395*
Credit Concentration Profile as of December 31, 2019 and 2018Maximum Exposure to Credit RiskThe following table shows EW’s maximum exposure to credit risk without taking into account anycollateral held or other credit enhancements:
2019 2018Maximum
Exposure toCredit Risk
[A]
Fair Valueof Collateral
[B]
Financial Effectof Collateral
[C]Net Exposure
[D] = [A] – [C]
MaximumExposure toCredit Risk
[A]
Fair Valueof Collateral
[B]
Financial Effectof Collateral
[C]Net Exposure
[D] = [A] – [C]: (In Millions)Loans and receivables Receivables from
customers* Corporate lending P=70,659 P=58,920 P=9,687 P=60,972 P=72,933 P=24,959 P=8,173 P=64,760 Consumer lending 190,054 126,481 98,515 91,539 166,855 95,420 70,161 96,694
P=260,713 P=185,401 P=108,202 P=152,511 P=239,788 P=120,379 P=78,334 P=161,454
*Excludes unamortized premium
For off-balance sheet items, the figures presented below as reported to BSP summarize EW’smaximum exposure to credit risk:
2019 2018
NotionalPrincipalAmount
CreditConversion
Factor
CreditEquivalent
Amount
CreditRisk
MitigationNet CreditExposure
NotionalPrincipa
lAmount
CreditConversion
Factor
CreditEquivalent
Amount
CreditRisk
Mitigation
NetCredit
Exposure(In Millions)
Off-balance sheet items* Direct credit substitutes P=889 100% P=889 P=− P=889 P=762 100% P=762 P=− P=762 Transaction-related contingencies 2,338 50% 1,169 − 1,169 2,075 50% 1,038 − 1,038 Trade-related contingencies
arising from movement ofgoods and commitments withan original maturity of up to1year
Guarantees 5,637 20% 1,127 − 1,127 4,010 20% 802 − 802Letters of credit 1,865 20% 373 − 373 2,249 20% 450 − 450
P=10,729 P=3,558 P=− P=3,558 P=9,096 P=3,052 P=− P=3,052*For all other off-balance sheet exposures, credit conversion factor is 0.00%.
Collateral and other credit enhancementsCollaterals are taken into consideration during the loan application process as they offer an alternativeway of collecting from the client should a default occur. The percentage of loan value attached to thecollateral offered is part of EW’s lending guidelines. Such percentages take into account safetymargins for foreign exchange rate exposure/fluctuations, interest rate exposure, and price volatility.
Collaterals are valued according to existing credit policy standards and, following the latest appraisalreport, serve as the basis for the amount of the secured loan facility. Premium security items arecollaterals that have the effect of reducing the estimated credit risk for a facility. The primaryconsideration for enhancements falling under such category is the ease of converting them to cash.
EW is not permitted to sell or re-pledge the collateral in the absence of default by the owner of thecollateral. It is EW’s policy to dispose foreclosed assets in an orderly fashion. The proceeds of thesale of the foreclosed assets, included under ‘Investment Properties’, are used to reduce or repay theoutstanding claim. In general, EW does not occupy repossessed properties for business use.As part of EW’s risk control on security/collateral documentation, standard documents are made foreach security type and deviation from the pro-forma documents are subject to legal review prior toimplementation.

- 137 -
*SGVFS039395*
Credit collaterals profileThe table below provides the collateral profile of the outstanding loan portfolio of EW:
2019 2018Gross Amount % Gross Amount %
Loans secured by:Chattel P=97,766,172 36.33 P=76,929,965 31.18Real Estate 29,913,466 11.12 26,084,403 10.57Others* 7,213,909 2.68 17,354,964 7.04
134,893,547 50.13 120,369,332 48.79134,211,748 49.87 126,363,591 51.21
Unsecured P=269,105,295 100.00 P=246,732,923 100.00*Consists of government securities, corporate bonds, shares of stock, hold-out on deposits, assignment of receivables etc.
As for the computation of credit risk weights, hold-out on deposits with EW, Home Guaranty cover,and Philippine sovereign guarantees are the only credit risk mitigants considered as eligible.
Large Exposures and Top 20 BorrowersThe table below summarizes the top 20 borrowers and large exposures of EW:
2019Top 20 Borrowers Large Exposures*
SingleBorrowers
GroupBorrowers
SingleBorrowers
GroupBorrowers
Aggregate Exposure (In Billions) P=30.00 P=35.00 P=17.66 P=23.16Composite Risk Rating 2.95 3.24 2.07 2.54Total Expected Loss/Aggregate Exposure 1.09% 1.19% 0.83% 0.94%*Large exposures refer to exposures to a counterparty or a group of related counterparties equal to or greater than 5.00% of EW’s qualifying capital.
2018Top 20 Borrowers Large Exposures
SingleBorrowers
GroupBorrowers
SingleBorrowers
GroupBorrowers
Aggregate Exposure (In Billions) P=30.83 P=36.06 P=17.99 P=25.07Composite Risk Rating 2.92 3.19 1.93 2.64Total Credit Loss/Aggregate Exposure 0.97% 1.08% 0.29% 0.84%*Large exposures refer to exposures to a counterparty or a group of related counterparties equal to or greater than 5.00% of EW’s qualifying capital.
The credit exposures, after due consideration of the allowed credit enhancements of EW, are allcompliant with the regulatory single borrower’s limit and considered to be the maximum creditexposure to any client or counterparty.
Concentration by IndustryAn industry sector analysis of the financial assets of EW follows:
2019Loans and Receivables Loans and
Advances toBanks*
InvestmentSecurities**
Other FinancialAssets*** TotalAmount %
Private households with employed persons P=143,790,034 55.15 P=– P=– P=– P=143,790,034Government and foreign sovereign – 0.00 – 58,794,838 – 58,794,838Financial intermediaries 10,873,160 4.17 40,383,203 402,301 – 51,658,664Wholesale and retail trade, repair of motor vehicles 41,179,879 15.80 – – – 41,179,879Real estate, renting and business activity 28,079,403 10.77 – 22,007 – 28,101,410Electricity, gas, steam and air-conditioning supply 7,327,647 2.81 – 9,403,667 – 16,731,314Manufacturing 9,098,860 3.49 – 130 – 9,098,990Accommodation and food service activities 3,245,335 1.24 – – – 3,245,335Transportation and storage 2,663,253 1.02 – – – 2,663,253Construction 2,120,126 0.81 – – – 2,120,126Other service activities 1,726,380 0.66 – – – 1,726,380Holding – 0.00 – 1,736,451 – 1,736,451
(Forward)

- 138 -
*SGVFS039395*
2019Loans and Receivables Loans and
Advances toBanks*
InvestmentSecurities**
Other FinancialAssets*** TotalAmount %
Agriculture, fisheries and forestry P=895,037 0.34 P=– P=– P=– P=895,037Administrative and support service activities 742,479 0.28 – – – 742,479Others**** 8,972,035 3.44 – 520,286 471,074 9,963,395
260,713,628 100.00 40,383,203 70,879,680 471,074 372,447,585Allowance for credit losses 6,241,306 93 2,265 – 6,243,664Total P=254,472,322 P=40,383,110 P=70,877,415 P=471,074 P=366,203,921* Includes Due from BSP, Due from Other Banks and IBLR.** Includes financial assets at FVTPL, financial assets at FVOCI and investment securities at amortized cost.*** Includes other financial assets presented under ‘Other assets’ and commitments and contingent accounts**** Includess Arts and recreation activities, mining and quarrying, human healh and social activities, education, and information and communication.
2018Loans and Receivables Loans and
Advances toBanks*
InvestmentSecurities**
Other FinancialAssets*** TotalAmount %
Private households with employed persons P=149,908,516 62.52 P=– P=– P=– P=149,908,516Government and foreign sovereign – 0.00 – 27,292,353 – 27,292,353Financial intermediaries 9,123,464 3.80 56,578,064 422,666 – 66,124,194Real estate, renting and business activity 25,621,211 10.68 – – – 25,621,211Wholesale and retail trade, repair of motor vehicles 23,878,879 9.96 – – – 23,878,879Electricity, gas, steam and air-conditioning supply 8,289,398 3.46 – 10,862,162 – 19,151,560Manufacturing 9,064,981 3.78 – – – 9,064,981Accommodation and food service activities 2,836,975 1.18 – – – 2,836,975Transportation and storage – 0.00 – – – –Construction 2,789,923 1.16 – – – 2,789,923Other service activities 1,981,153 0.83 – 18,401 – 1,999,554Holding – 0.00 – 1,978,060 – 1,978,060Agriculture, fisheries and forestry 1,039,881 0.43 – – – 1,039,881Administrative and support service activities 1,059,402 0.44 – – – 1,059,402Others**** 4,193,941 1.75 – 526,800 497,659 5,218,400
239,787,724 100.00 56,578,064 41,100,442 497,659 337,963,889Allowance for credit losses 5,926,031 198 2,895 5,929,124
P=233,861,693 P=56,577,866 P=41,097,547 P=497,659 P=332,034,765* Includes Due from BSP, Due from Other Banks and IBLR.** Includes financial assets at FVTPL, financial assets at FVOCI and investment securities at amortized cost.*** Includes other financial assets presented under ‘Other assets’ and commitments and contingent accounts**** Includess Arts and recreation activities, mining and quarrying, human healh and social activities, education, and information and communication.
Geographic SegmentationThe distribution of EW’s financial assets and credit commitment items by geographic region as ofDecember 31, 2019 and 2018 follows:
2019
Loans andReceivables
Loans andAdvances to
Banks*Investment
Securities**Other Financial
Assets*** TotalPhilippines P=260,713,628 P=37,142,557 P=50,453,061 P=371,620 P=348,680,866Asia (excluding Philippines) – 346,745 15,677,122 – 16,023,867Australia – 82,377 – – 82,377Europe – 297,885 404,213 99,454 801,552North America – – 2,364,038 – 2,364,038South America – – – – –USA – 2,513,639 1,981,246 – 4,494,885
260,713,628 40,383,203 70,879,680 471,074 372,447,585Allowance for credit losses 6,241,306 93 2,265 – 6,243,664
P=254,472,322 P=40,383,110 P=70,877,415 P=471,074 P=366,203,921* Includes Due from BSP, Due from Other Banks and IBLR.** Includes financial assets at FVTPL, financial assets at FVOCI and investment securities at amortized cost.*** Includes other financial assets presented under ‘Other assets’ and commitments and contingent accounts
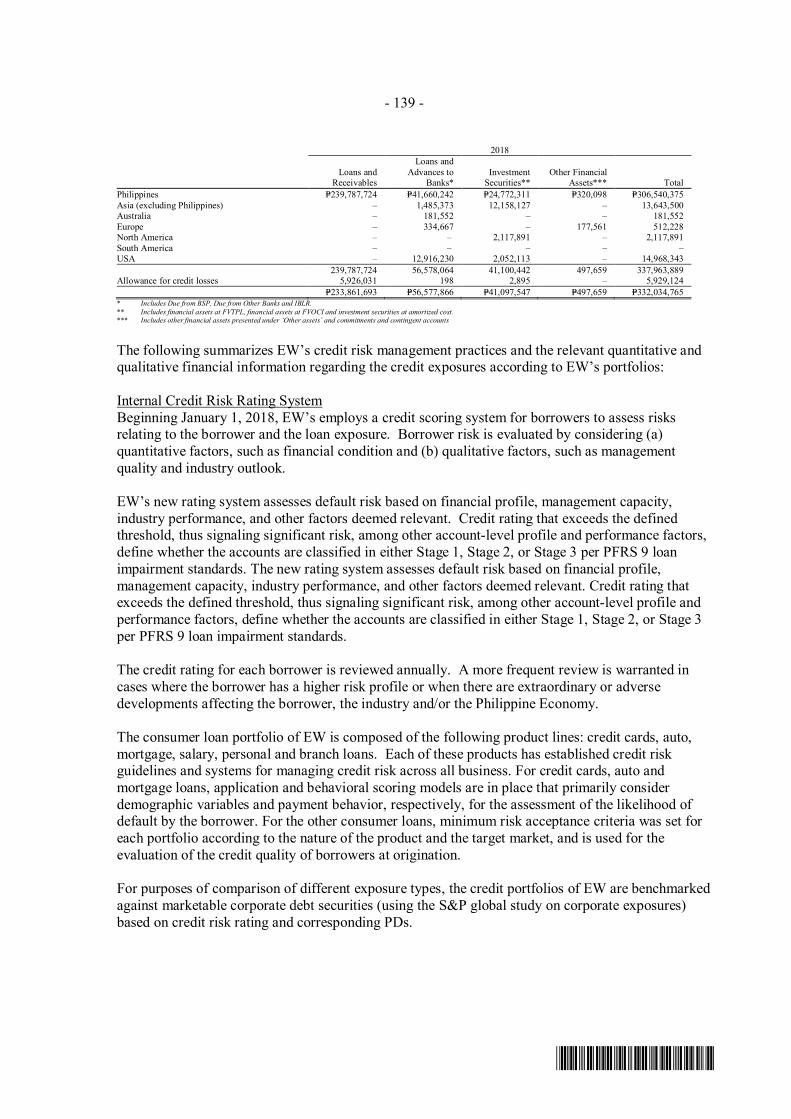
- 139 -
*SGVFS039395*
2018
Loans andReceivables
Loans andAdvances to
Banks*Investment
Securities**Other Financial
Assets*** TotalPhilippines P=239,787,724 P=41,660,242 P=24,772,311 P=320,098 P=306,540,375Asia (excluding Philippines) – 1,485,373 12,158,127 – 13,643,500Australia – 181,552 – – 181,552Europe – 334,667 – 177,561 512,228North America – – 2,117,891 – 2,117,891South America – – – – –USA – 12,916,230 2,052,113 – 14,968,343
239,787,724 56,578,064 41,100,442 497,659 337,963,889Allowance for credit losses 5,926,031 198 2,895 – 5,929,124
P=233,861,693 P=56,577,866 P=41,097,547 P=497,659 P=332,034,765* Includes Due from BSP, Due from Other Banks and IBLR.** Includes financial assets at FVTPL, financial assets at FVOCI and investment securities at amortized cost.*** Includes other financial assets presented under ‘Other assets’ and commitments and contingent accounts
The following summarizes EW’s credit risk management practices and the relevant quantitative andqualitative financial information regarding the credit exposures according to EW’s portfolios:
Internal Credit Risk Rating SystemBeginning January 1, 2018, EW’s employs a credit scoring system for borrowers to assess risksrelating to the borrower and the loan exposure. Borrower risk is evaluated by considering (a)quantitative factors, such as financial condition and (b) qualitative factors, such as managementquality and industry outlook.
EW’s new rating system assesses default risk based on financial profile, management capacity,industry performance, and other factors deemed relevant. Credit rating that exceeds the definedthreshold, thus signaling significant risk, among other account-level profile and performance factors,define whether the accounts are classified in either Stage 1, Stage 2, or Stage 3 per PFRS 9 loanimpairment standards. The new rating system assesses default risk based on financial profile,management capacity, industry performance, and other factors deemed relevant. Credit rating thatexceeds the defined threshold, thus signaling significant risk, among other account-level profile andperformance factors, define whether the accounts are classified in either Stage 1, Stage 2, or Stage 3per PFRS 9 loan impairment standards.
The credit rating for each borrower is reviewed annually. A more frequent review is warranted incases where the borrower has a higher risk profile or when there are extraordinary or adversedevelopments affecting the borrower, the industry and/or the Philippine Economy.
The consumer loan portfolio of EW is composed of the following product lines: credit cards, auto,mortgage, salary, personal and branch loans. Each of these products has established credit riskguidelines and systems for managing credit risk across all business. For credit cards, auto andmortgage loans, application and behavioral scoring models are in place that primarily considerdemographic variables and payment behavior, respectively, for the assessment of the likelihood ofdefault by the borrower. For the other consumer loans, minimum risk acceptance criteria was set foreach portfolio according to the nature of the product and the target market, and is used for theevaluation of the credit quality of borrowers at origination.
For purposes of comparison of different exposure types, the credit portfolios of EW are benchmarkedagainst marketable corporate debt securities (using the S&P global study on corporate exposures)based on credit risk rating and corresponding PDs.
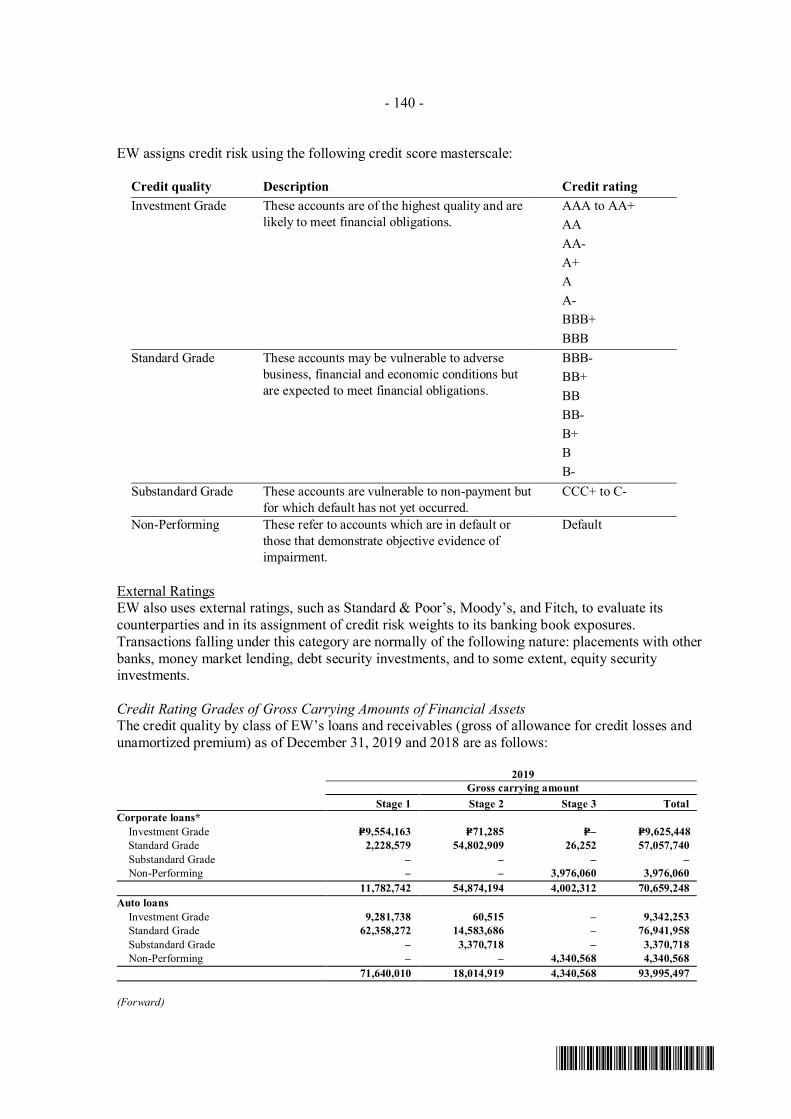
- 140 -
*SGVFS039395*
EW assigns credit risk using the following credit score masterscale:
Credit quality Description Credit ratingInvestment Grade These accounts are of the highest quality and are
likely to meet financial obligations.AAA to AA+AAAA-A+AA-BBB+BBB
Standard Grade These accounts may be vulnerable to adversebusiness, financial and economic conditions butare expected to meet financial obligations.
BBB-BB+BBBB-B+BB-
Substandard Grade These accounts are vulnerable to non-payment butfor which default has not yet occurred.
CCC+ to C-
Non-Performing These refer to accounts which are in default orthose that demonstrate objective evidence ofimpairment.
Default
External RatingsEW also uses external ratings, such as Standard & Poor’s, Moody’s, and Fitch, to evaluate itscounterparties and in its assignment of credit risk weights to its banking book exposures.Transactions falling under this category are normally of the following nature: placements with otherbanks, money market lending, debt security investments, and to some extent, equity securityinvestments.
Credit Rating Grades of Gross Carrying Amounts of Financial AssetsThe credit quality by class of EW’s loans and receivables (gross of allowance for credit losses andunamortized premium) as of December 31, 2019 and 2018 are as follows:
2019Gross carrying amount
Stage 1 Stage 2 Stage 3 TotalCorporate loans*
Investment Grade P=9,554,163 P=71,285 P=– P=9,625,448Standard Grade 2,228,579 54,802,909 26,252 57,057,740Substandard Grade – – – –Non-Performing – – 3,976,060 3,976,060
11,782,742 54,874,194 4,002,312 70,659,248Auto loans
Investment Grade 9,281,738 60,515 – 9,342,253Standard Grade 62,358,272 14,583,686 – 76,941,958Substandard Grade – 3,370,718 – 3,370,718Non-Performing – – 4,340,568 4,340,568
71,640,010 18,014,919 4,340,568 93,995,497
(Forward)

- 141 -
*SGVFS039395*
2019Gross carrying amount
Stage 1 Stage 2 Stage 3 TotalCredit cards
Investment Grade P=6,879,207 P=7,870 P=– P=6,887,077Standard Grade 18,017,352 6,562,449 – 24,579,801Substandard Grade 218,026 2,189,419 – 2,407,445Non-Performing – – 1,389,553 1,389,553
25,114,585 8,759,738 1,389,553 35,263,876Mortgage loans
Investment Grade – – – –Standard Grade 17,430,632 3,060,111 – 20,490,743Substandard Grade – 812,807 – 812,807Non-Performing – – 970,893 970,893
17,430,632 3,872,918 970,893 22,274,443Other Consumer Loans**
Investment Grade 189,825 1,889 – 191,714Standard Grade 31,688,818 1,986,460 – 33,675,278Substandard Grade 1,733,997 91,727 – 1,825,724Non-Performing – – 2,827,848 2,827,848
33,612,640 2,080,076 2,827,848 38,520,564Unquoted Debt Securities
Non-Performing – – 344,188 344,188– – 344,188 344,188
Other receivables***Investment Grade 441,122 1,560 – 442,682Standard Grade 1,146,002 1,401,154 – 2,547,156Substandard Grade 86,083 621,618 – 707,701Non-Performing – – 1,889,932 1,889,932
1,673,207 2,024,332 1,889,932 5,587,471Total P=161,253,816 P=89,626,177 P=15,765,294 P=266,645,287
*Include Corporate loans and emerging enterprise loans**Include Branch loans, DepEd loans, Employee loans, Salary loans, Personal loans***Include Accrued interest receivables, Accounts receivables and Sales contract receivables.
2018Gross carrying amount
Stage 1 Stage 2 Stage 3 TotalCorporate loans*
Investment Grade P=43,915,940 P=2,411,668 P=– P=46,327,608Standard Grade 583,449 25,314,187 – 25,897,636Substandard Grade – – – –Non-Performing – – 708,121 708,121
44,499,389 27,725,855 708,121 72,933,365Auto loans
Investment Grade 6,720,140 537,268 – 7,257,408Standard Grade 47,873,590 14,389,374 – 62,262,964Substandard Grade 1,109,281 4,020,393 – 5,129,674Non-Performing – – 3,147,676 3,147,676
55,703,011 18,947,035 3,147,676 77,797,722Credit cards
Investment Grade 355,076 5,937 – 361,013Standard Grade 19,521,196 4,656,198 – 24,177,394Substandard Grade 670,295 4,477,202 – 5,147,497Non-Performing – – 1,254,595 1,254,595
20,546,567 9,139,337 1,254,595 30,940,499Mortgage loans
Standard Grade 16,015,679 2,668,758 – 18,684,437Substandard Grade 9,611 865,060 – 874,671
(Forward)
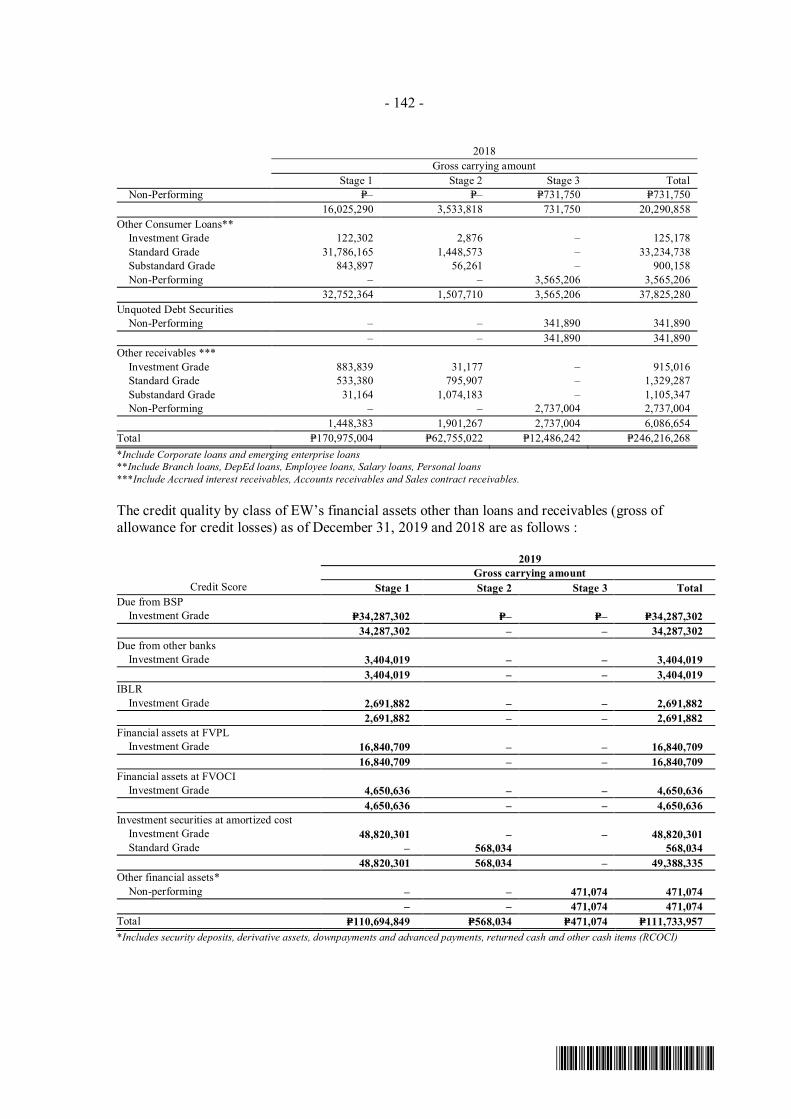
- 142 -
*SGVFS039395*
2018Gross carrying amount
Stage 1 Stage 2 Stage 3 TotalNon-Performing P=– P=– P=731,750 P=731,750
16,025,290 3,533,818 731,750 20,290,858Other Consumer Loans**
Investment Grade 122,302 2,876 – 125,178Standard Grade 31,786,165 1,448,573 – 33,234,738Substandard Grade 843,897 56,261 – 900,158Non-Performing – – 3,565,206 3,565,206
32,752,364 1,507,710 3,565,206 37,825,280Unquoted Debt Securities
Non-Performing – – 341,890 341,890– – 341,890 341,890
Other receivables ***Investment Grade 883,839 31,177 – 915,016Standard Grade 533,380 795,907 – 1,329,287Substandard Grade 31,164 1,074,183 – 1,105,347Non-Performing – – 2,737,004 2,737,004
1,448,383 1,901,267 2,737,004 6,086,654Total P=170,975,004 P=62,755,022 P=12,486,242 P=246,216,268*Include Corporate loans and emerging enterprise loans**Include Branch loans, DepEd loans, Employee loans, Salary loans, Personal loans***Include Accrued interest receivables, Accounts receivables and Sales contract receivables.
The credit quality by class of EW’s financial assets other than loans and receivables (gross ofallowance for credit losses) as of December 31, 2019 and 2018 are as follows :
2019Gross carrying amount
Credit Score Stage 1 Stage 2 Stage 3 TotalDue from BSP
Investment Grade P=34,287,302 P=– P=– P=34,287,30234,287,302 – – 34,287,302
Due from other banksInvestment Grade 3,404,019 – – 3,404,019
3,404,019 – – 3,404,019IBLR
Investment Grade 2,691,882 – – 2,691,8822,691,882 – – 2,691,882
Financial assets at FVPLInvestment Grade 16,840,709 – – 16,840,709
16,840,709 – – 16,840,709Financial assets at FVOCI
Investment Grade 4,650,636 – – 4,650,6364,650,636 – – 4,650,636
Investment securities at amortized costInvestment Grade 48,820,301 – – 48,820,301Standard Grade – 568,034 568,034
48,820,301 568,034 – 49,388,335Other financial assets*
Non-performing – – 471,074 471,074– – 471,074 471,074
Total P=110,694,849 P=568,034 P=471,074 P=111,733,957*Includes security deposits, derivative assets, downpayments and advanced payments, returned cash and other cash items (RCOCI)

- 143 -
*SGVFS039395*
2018Gross carrying amount
Credit Score Stage 1 Stage 2 Stage 3 TotalDue from BSP
Investment Grade P=40,481,956 P=– P=– P=40,481,95640,481,956 – – 40,481,956
Due from other banksInvestment Grade 10,118,636 – – 10,118,636Standard Grade 78,635 36,167 – 114,802
10,197,271 36,167 10,233,438IBLR
Investment Grade 5,862,670 – – 5,862,6705,862,670 – – 5,862,670
Financial assets at FVPLInvestment Grade 4,338,794 – – 4,338,794
4,338,794 – – 4,338,794Financial assets at FVOCI
Investment Grade 248,207 – – 248,207248,207 – – 248,207
Investment securitiesat amortized cost
Investment Grade 4,161,409 – – 4,161,409Standard Grade 31,911,062 440,970 – 32,352,032
36,072,471 440,970 – 36,513,441Other financial assets&
Non-Performing – – 497,659 497,659– – 497,659 497,659
Total P=97,201,369 P=477,137 P=497,659 P=98,176,165*Includes security deposits, derivative assets, downpayments and advanced payments, returned cash and other cash items (RCOCI)
Analysis of Movements of Gross Carrying AmountsThe movements in the EW’s total loans and receivables (excluding unamortized premium andallowance for credit and impairment losses) in 2019 and 2018 follow:
2019Stage 1 Stage 2 Stage 3 Total
Balance at beginning of year P=170,975,004 P=62,755,022 P=12,486,242 P=246,216,268Newly originated assets that remained in
Stage 1 as at December 31, 2019 88,804,240 – – 88,804,240Newly originated assets that moved to Stage 2
and Stage 3 as at December 31, 2019 – 39,585,980 4,928,556 44,514,536Movements in receivable balance (69,623,600) (35,070,326) (4,789,223) (109,483,149)Write-offs – – (3,386,116) (3,386,116)Transfers from Stage 1 (37,073,103) 32,893,909 4,179,194 –Transfers from Stage 2 7,863,069 (10,879,365) 3,016,296 –Transfers from Stage 3 308,206 340,957 (649,163) –Others – – (20,492) (20,492)Balance at end of year P=161,253,816 P=89,626,177 P=15,765,294 P=266,645,287
2018Stage 1 Stage 2 Stage 3 Total
Balance at beginning of year P=140,993,732 P=66,080,465 P=12,576,416 P=219,650,613Newly originated assets that remained in
Stage 1 as at December 31, 2018 102,241,678 – – 102,241,678Newly originated assets that moved to Stage 2
and Stage 3 as at December 31, 2018 – 38,247,884 4,364,206 42,612,090Movements in receivable balance (71,598,288) (39,848,063) (4,461,058) (115,907,409)Write-offs – – (3,309,482) (3,309,482)Transfers from Stage 1 (17,632,389) 16,080,572 1,551,817 –
(Forward)

- 144 -
*SGVFS039395*
2018Stage 1 Stage 2 Stage 3 Total
Transfers from Stage 2 P=16,372,451 (P=18,131,531) P=1,759,080 P=–Transfers from Stage 3 597,820 325,695 (923,515) –Others – – 928,778 928,778Balance at end of year P=170,975,004 P=62,755,022 P=12,486,242 P=246,216,268
The breakdown of the total gross carrying amounts of the EW is as follows:
2019Gross carrying amount
Stage 1 Stage 2 Stage 3 TotalCorporate loans*Balances at beginning of year P=44,499,389 P=27,725,855 P=708,121 P=72,933,365Newly originated assets that remained in Stage
1 as at December 31, 2019 9,661,527 – – 9,661,527Newly originated assets that moved to Stage 2
and Stage 3 as at December 31, 2019 – 32,310,377 1,019,914 33,330,291Movements in receivable balance (23,201,266) (21,976,984) (87,685) (45,265,935)Write-offs – – – –Transfers from Stage 1 (19,677,647) 17,442,939 2,234,708 –Transfers from Stage 2 500,739 (628,412) 127,673 –Transfers from Stage 3 – 419 (419) –Balances at end of year 11,782,742 54,874,194 4,002,312 70,659,248Auto loansBalances at beginning of year 55,703,011 18,947,035 3,147,676 77,797,722Newly originated assets that remained in Stage
1 as at December 31, 2019 37,045,472 – – 37,045,472Newly originated assets that moved to Stage 2
and Stage 3 as at December 31, 2019 – 2,974,896 685,001 3,659,897Movements in receivable balance (15,244,675) (7,571,699) (1,347,740) (24,164,114)Write-offs – – (343,480) (343,480)Transfers from Stage 1 (11,946,498) 11,312,699 633,799 –Transfers from Stage 2 6,054,127 (7,652,763) 1,598,636 –Transfers from Stage 3 28,573 4,751 (33,324) –Balances at end of year 71,640,010 18,014,919 4,340,568 93,995,497Credit cardsBalances at beginning of year 20,546,567 9,139,337 1,254,595 30,940,499Newly originated assets that remained in Stage
1 as at December 31, 2019 8,438,224 – – 8,438,224Newly originated assets that moved to Stage 2
and Stage 3 as at December 31, 2019 – 2,399,833 2,517,334 4,917,167Movements in receivable balance (2,727,506) (3,320,805) (687,780) (6,736,091)Write-offs – – (2,295,923) (2,295,923)Transfers from Stage 1 (1,240,877) 895,888 344,989 –Transfers from Stage 2 90,831 (356,770) 265,939 –Transfers from Stage 3 7,346 2,255 (9,601) –Balances at end of year 25,114,585 8,759,738 1,389,553 35,263,876Mortgage loansBalances at beginning of year 16,025,290 3,533,818 731,750 20,290,858Newly originated assets that remained in Stage
1 as at December 31, 2019 4,640,968 – – 4,640,968Newly originated assets that moved to Stage 2
and Stage 3 as at December 31, 2019 – 61,303 10,552 71,855Movements in receivable balance (1,945,746) (555,659) (227,808) (2,729,213)Write-offs – – (25) (25)Transfers from Stage 1 (2,337,252) 2,233,310 103,942 –Transfers from Stage 2 995,831 (1,406,797) 410,966 –Transfers from Stage 3 51,541 6,943 (58,484) –Balances at end of year 17,430,632 3,872,918 970,893 22,274,443
(Forward)

- 145 -
*SGVFS039395*
2019Gross carrying amount
Stage 1 Stage 2 Stage 3 TotalOther consumer loans**Balances at beginning of year P=32,752,364 P=1,507,710 P=3,565,206 P=37,825,280Newly originated assets that remained in Stage
1 as at December 31, 2019 27,516,265 – – 27,516,265Newly originated assets that moved to Stage 2
and Stage 3 as at December 31, 2019 – 1,606,616 406,197 2,012,813Movements in receivable balance (25,444,991) (1,338,294) (1,317,940) (28,101,225)Write-offs – – (732,569) (732,569)Transfers from Stage 1 (1,506,687) 673,657 833,030 –Transfers from Stage 2 110,607 (402,734) 292,127 –Transfers from Stage 3 185,082 33,121 (218,203) –Balances at end of year 33,612,640 2,080,076 2,827,848 38,520,564Unquoted debt securities classified as loans
and receivables – – 341,890 341,890Balances at beginning of year – – – –Newly originated assets that remained in Stage
1 as at December 31, 2019 – – – –Newly originated assets that moved to Stage 2
and Stage 3 as at December 31, 2019 – – – –Movements in receivable balance – – 2,298 2,298Write-offs – – – –Transfers from Stage 1 – – – –Transfers from Stage 2 – – – –Transfers from Stage 3 – – – –Balances at end of year – – 344,188 344,188Other receivables***Balances at beginning of year 1,448,383 1,901,267 2,737,004 6,086,654
Newly originated assets that remained inStage 1 as at December 31, 2019 1,501,784 – – 1,501,784
Newly originated assets that moved to Stage2 and Stage 3 as at December 31, 2019 – 232,955 289,558 522,513
Movements in receivable balance (1,059,416) (306,885) (1,122,568) (2,488,869)Write-offs – – (14,119) (14,119)Transfers from Stage 1 (364,142) 335,416 28,726 –Transfers from Stage 2 110,934 (431,889) 320,955 –Transfers from Stage 3 35,664 293,468 (329,132) –Others 35,664 – (20,492) (20,492)Balances at end of year 1,673,207 2,024,332 1,889,932 5,587,471
P=161,253,816 P=89,626,177 P=15,765,294 P=266,645,287*Include Corporate loans and emerging enterprise loans**Include Branch loans, DepEd loans, Employee loans, Salary loans, Personal loans***Include Accrued interest receivables, Accounts receivables and Sales contract receivables.
2018Gross carrying amount
Stage 1 Stage 2 Stage 3 TotalCorporate loans*Balances at beginning of year P=23,094,858 P=38,681,901 P=563,051 P=62,339,810Newly originated assets that remained in
Stage 1 as at December 31, 2018 28,055,547 – – 28,055,547Newly originated assets that moved to Stage 2
and Stage 3 as at December 31, 2018 – 22,333,323 229,913 22,563,236Movements in receivable balance (18,606,280) (21,013,856) (405,092) (40,025,228)Write-offs – – – –Transfers from Stage 1 (662,812) 486,024 176,788 –Transfers from Stage 2 12,618,076 (12,761,537) 143,461 –Balances at end of year 44,499,389 27,725,855 708,121 72,933,365
(Forward)
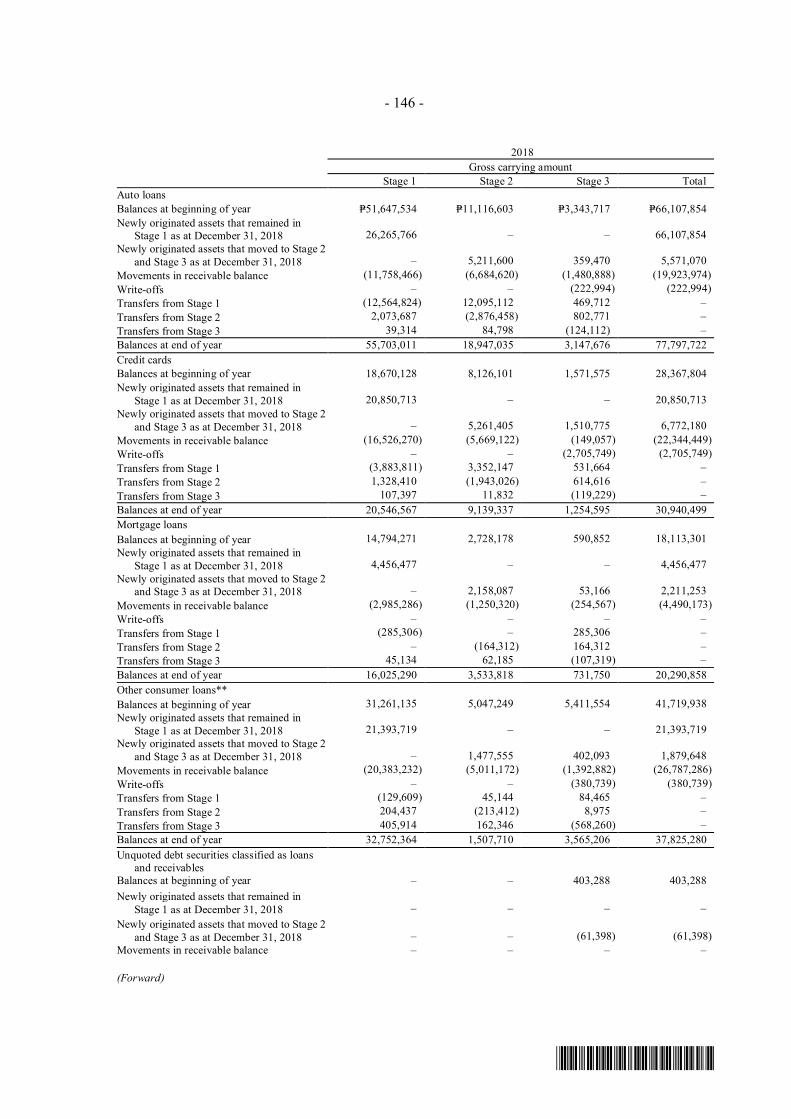
- 146 -
*SGVFS039395*
2018Gross carrying amount
Stage 1 Stage 2 Stage 3 TotalAuto loansBalances at beginning of year P=51,647,534 P=11,116,603 P=3,343,717 P=66,107,854Newly originated assets that remained in
Stage 1 as at December 31, 2018 26,265,766 – – 66,107,854Newly originated assets that moved to Stage 2
and Stage 3 as at December 31, 2018 – 5,211,600 359,470 5,571,070Movements in receivable balance (11,758,466) (6,684,620) (1,480,888) (19,923,974)Write-offs – – (222,994) (222,994)Transfers from Stage 1 (12,564,824) 12,095,112 469,712 –Transfers from Stage 2 2,073,687 (2,876,458) 802,771 –Transfers from Stage 3 39,314 84,798 (124,112) –Balances at end of year 55,703,011 18,947,035 3,147,676 77,797,722Credit cardsBalances at beginning of year 18,670,128 8,126,101 1,571,575 28,367,804Newly originated assets that remained in
Stage 1 as at December 31, 2018 20,850,713 – – 20,850,713Newly originated assets that moved to Stage 2
and Stage 3 as at December 31, 2018 – 5,261,405 1,510,775 6,772,180Movements in receivable balance (16,526,270) (5,669,122) (149,057) (22,344,449)Write-offs – – (2,705,749) (2,705,749)Transfers from Stage 1 (3,883,811) 3,352,147 531,664 –Transfers from Stage 2 1,328,410 (1,943,026) 614,616 –Transfers from Stage 3 107,397 11,832 (119,229) –Balances at end of year 20,546,567 9,139,337 1,254,595 30,940,499Mortgage loansBalances at beginning of year 14,794,271 2,728,178 590,852 18,113,301Newly originated assets that remained in
Stage 1 as at December 31, 2018 4,456,477 – – 4,456,477Newly originated assets that moved to Stage 2
and Stage 3 as at December 31, 2018 – 2,158,087 53,166 2,211,253Movements in receivable balance (2,985,286) (1,250,320) (254,567) (4,490,173)Write-offs – – – –Transfers from Stage 1 (285,306) – 285,306 –Transfers from Stage 2 – (164,312) 164,312 –Transfers from Stage 3 45,134 62,185 (107,319) –Balances at end of year 16,025,290 3,533,818 731,750 20,290,858Other consumer loans**Balances at beginning of year 31,261,135 5,047,249 5,411,554 41,719,938Newly originated assets that remained in
Stage 1 as at December 31, 2018 21,393,719 – – 21,393,719Newly originated assets that moved to Stage 2
and Stage 3 as at December 31, 2018 – 1,477,555 402,093 1,879,648Movements in receivable balance (20,383,232) (5,011,172) (1,392,882) (26,787,286)Write-offs – – (380,739) (380,739)Transfers from Stage 1 (129,609) 45,144 84,465 –Transfers from Stage 2 204,437 (213,412) 8,975 –Transfers from Stage 3 405,914 162,346 (568,260) –Balances at end of year 32,752,364 1,507,710 3,565,206 37,825,280Unquoted debt securities classified as loans
and receivablesBalances at beginning of year – – 403,288 403,288Newly originated assets that remained in
Stage 1 as at December 31, 2018 – – – –Newly originated assets that moved to Stage 2
and Stage 3 as at December 31, 2018 – – (61,398) (61,398)Movements in receivable balance – – – –
(Forward)

- 147 -
*SGVFS039395*
2018Gross carrying amount
Stage 1 Stage 2 Stage 3 TotalWrite-offs P=– P=– P=– P=–Transfers from Stage 1 – – – –Transfers from Stage 2 – – – –Transfers from Stage 3 – – – –Balances at end of year 341,890 341,890Other receivables***Balances at beginning of year 1,525,806 380,433 692,379 2,598,618Newly originated assets that remained in
Stage 1 as at December 31, 2019 1,219,456 – – 1,219,456Newly originated assets that moved to Stage 2
and Stage 3 as at December 31, 2019 – 1,805,914 1,808,789 3,614,703Movements in receivable balance (1,338,754) (218,973) (717,174) (2,274,901)Write-offs – – – –Transfers from Stage 1 (106,027) 102,145 3,882 –Transfers from Stage 2 147,841 (172,786) 24,945 –Transfers from Stage 3 61 4,534 (4,595) –Others – – 928,778 928,778Balances at end of year 1,448,383 1,901,267 2,737,004 6,086,654Total P=170,975,004 P=62,755,022 P=12,486,242 P=246,216,268*Include Corporate loans and emerging enterprise loans**Include Branch loans, DepEd loans, Employee loans, Salary loans, Personal loans***Include Accrued interest receivables, Accounts receivables and Sales contract receivables.
Credit risk weighting as of December 31, 2019 and 2018Total Credit Risk Exposure after Risk MitigationThe table below shows the different credit risk exposures of EW after credit risk mitigation, by riskweight applied in accordance with BSP Circular No. 538:
2019Capital
DeductionRisk Buckets
Total0% 20% 50% 75% 100% 150%Credit risk exposure after risk
mitigationOn-balance sheet assets P=11,609,246 P=57,435,164 P=6,210,279 P=39,773,465 P=14,761,346 P=235,077,023 P=9,593,811 P=362,851,088Off-balance sheet assets – – – – – 3,557,318 – 3,557,318Counterparty in the banking book
(derivatives and repo-styletransactions) – – – 6,765,843 – – – 6,765,843
Counterparty in the trading book(derivatives and repo-styletransactions) – – – – – – – –
Credit-linked notes in the bankingbook – – – – – – – –
Securitization exposures – – – – – – – –11,609,246 57,435,164 6,210,279 46,539,308 14,761,346 238,634,341 9,593,811 373,174,249
Credit Risk Weighted Assets P=– P=– P=1,242,056 P=23,269,654 P=11,071,010 P=238,634,341 P=14,390,717 P=288,607,778
2018Capital
DeductionRisk Buckets
Total0% 20% 50% 75% 100% 150%Credit risk exposure after risk
mitigationOn-balance sheet assets P=10,081,365 P=54,696,997 P=13,560,929 P=32,978,620 P=12,814,255 P=216,587,746 P=8,695,975 P=339,334,522Off-balance sheet assets – – – – – – – –Counterparty in the banking book
(derivatives and repo-styletransactions) – – – – – – – –
Counterparty in the trading book(derivatives and repo-styletransactions) – – – – – – – –
Credit-linked notes in the bankingbook – – – – – – – –
Securitization exposures – – – – – – – –10,081,365 54,696,997 13,56,0929 32,978,620 12,814,255 216,587,746 8,695,975 339,334,522
Credit Risk Weighted Assets P=– P=– P=2,712,186 P=16,489,310 P=9,610,691 P=216,587,746 P=13,043,963 P=258,443,896

- 148 -
*SGVFS039395*
Liquidity RiskLiquidity risk is the risk that sufficient funds are unavailable to adequately meet all maturingliabilities, including demand deposits and off-balance sheet commitments. The main responsibility ofdaily asset liability management lies with EW’s Treasury Group, specifically the Liquidity Desk,which are tasked to manage the balance sheet and have thorough understanding of the risk elementsinvolved in the respective businesses. Only EW and EWRB are potentially exposed to liquidity riskexposures, where their liquidity risk management are monitored by their respective ALCOs.Resulting analysis of the balance sheet along with the recommendation is presented during the weeklyALCO meeting where deliberations, formulation of actions and decisions are made to minimize riskand maximize EW returns. Discussions include actions taken in the previous ALCO meeting,economic and market status and outlook, liquidity risk, pricing and interest rate structure, limit statusand utilization. To ensure both EW and EWRB have sufficient liquidity at all times, the respectiveALCO formulates a contingency funding plan which sets out the amount and the sources of funds(such as unutilized credit facilities) available to both entities and the circumstances under which suchfunds will be used.
By way of the Maximum Cumulative Outflow (MCO) limit, EW is able to manage its long-termliquidity risks by placing a cap on the outflow of cash on a cumulative basis. EW takes a multi-tieredapproach to maintaining liquid assets. EW’s principal source of liquidity is comprised of cash andother cash items (COCI), due from BSP, due from other banks and IBLR with maturities of less thanone year. In addition to regulatory reserves, EW maintains a sufficient level of secondary reserves inthe form of liquid assets such as short-term trading and investment securities that can be realizedquickly.
Analysis of Financial Assets and Liabilities by Remaining Contractual MaturitiesThe table below shows the maturity profile of the financial assets and liabilities of EW, based on itsinternal methodology that manages liquidity based on combined behavioral assumptions andcontractual undiscounted cash flows:
2019
On demandUp to
1 month>1 to 3
months>3 to 6
months>6 to 12months
Beyond 1year Total
Financial AssetsCash and cash equivalents* P=47,930,735 P=– P=– P=– P=– P=– P=47,930,735Investments and trading
securities** – 16,798,853 4,767,752 965,046 1,917,694 76,637,754 101,087,099Loans and receivables*** – 38,312,283 28,706,658 25,139,779 36,810,868 176,038,512 305,008,100Other assets – 202,744 – – – 268,330 471,074
P=47,930,735 P=55,313,880 P=33,474,410 P=26,104,825 P=38,728,562 P=252,944,596 P=454,497,008Financial LiabilitiesDeposit liabilities**** P=186,785,419 P=41,474,984 P=33,948,750 P=3,016,758 P=10,414,946 P=50,579,214 P=326,220,071Bills and acceptances payable 36,823 29,950,625 979,817 – – – 30,967,265Subordinated debt – 5,000,000 17,188 17,188 34,375 1,714,063 6,782,814Lease liability – 95,882 181,290 269,204 506,353 2,834,572 3,887,301Other liabilities 135,461 642,712 – – 4,138,426 42,570 4,959,169Contingent liabilities***** – 2,620,104 662,157 929,804 1,828,252 – 6,040,317
P=186,957,703 P=79,784,307 P=35,789,202 P=4,232,954 P=16,922,352 P=55,170,419 P=378,856,937* Consist of cash and cash other items, due from BSP, due from other banks and IBLR*** Consist of financial assets at FVPL, investment securities at amortized cost, financial assets at FVOCI and interest receivables from investment securities
at amortized cost*** Consist of loans and receivables, sales contract receivables, bills purchased, accrued interest receivables, accounts receivables, and unearned discounts
classified as financial assets**** Consist of demand and savings deposit, time certificate of deposit, long term negotiable certificates of deposit and interest payable for these deposit
liabilities***** Consists of stand-by letters of credit and forecasted utilization from credit cards lines
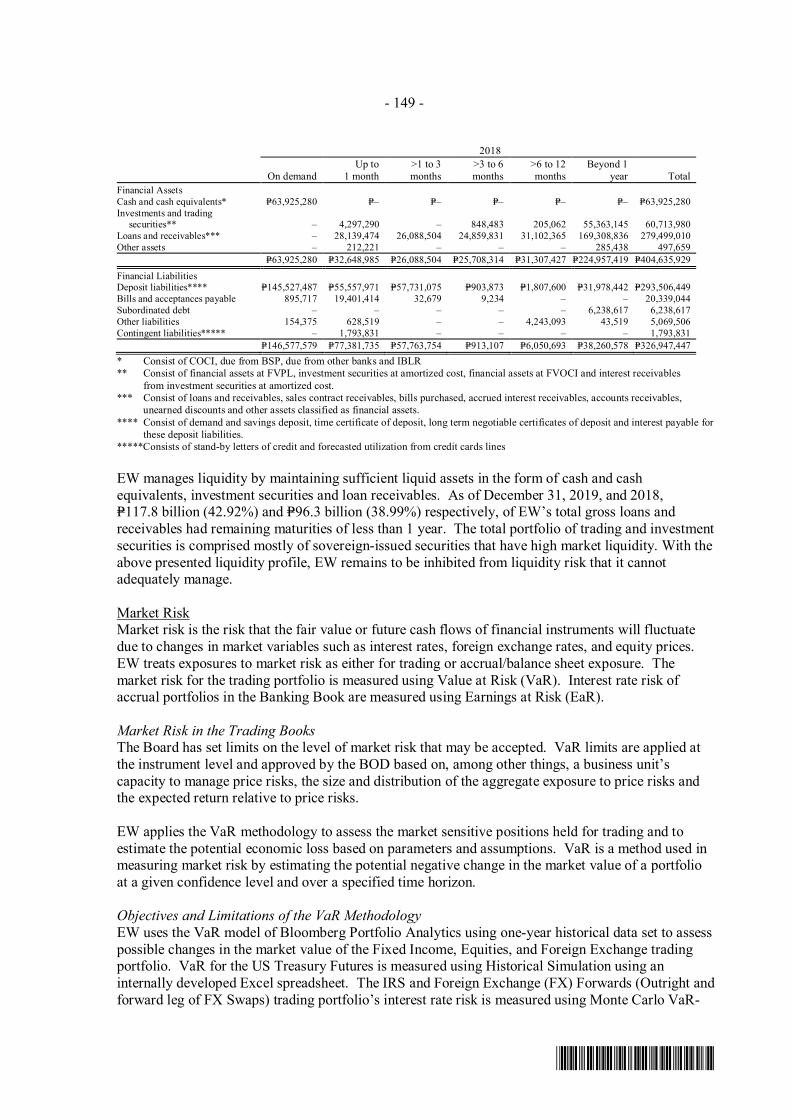
- 149 -
*SGVFS039395*
2018
On demandUp to
1 month>1 to 3months
>3 to 6months
>6 to 12months
Beyond 1year Total
Financial AssetsCash and cash equivalents* P=63,925,280 P=– P=– P=– P=– P=– P=63,925,280Investments and trading
securities** – 4,297,290 – 848,483 205,062 55,363,145 60,713,980Loans and receivables*** – 28,139,474 26,088,504 24,859,831 31,102,365 169,308,836 279,499,010Other assets – 212,221 – – – 285,438 497,659
P=63,925,280 P=32,648,985 P=26,088,504 P=25,708,314 P=31,307,427 P=224,957,419 P=404,635,929Financial LiabilitiesDeposit liabilities**** P=145,527,487 P=55,557,971 P=57,731,075 P=903,873 P=1,807,600 P=31,978,442 P=293,506,449Bills and acceptances payable 895,717 19,401,414 32,679 9,234 – – 20,339,044Subordinated debt – – – – – 6,238,617 6,238,617Other liabilities 154,375 628,519 – – 4,243,093 43,519 5,069,506Contingent liabilities***** – 1,793,831 – – – – 1,793,831
P=146,577,579 P=77,381,735 P=57,763,754 P=913,107 P=6,050,693 P=38,260,578 P=326,947,447*** Consist of COCI, due from BSP, due from other banks and IBLR*** Consist of financial assets at FVPL, investment securities at amortized cost, financial assets at FVOCI and interest receivables from investment securities at amortized cost.*** Consist of loans and receivables, sales contract receivables, bills purchased, accrued interest receivables, accounts receivables, unearned discounts and other assets classified as financial assets.**** Consist of demand and savings deposit, time certificate of deposit, long term negotiable certificates of deposit and interest payable for these deposit liabilities.*****Consists of stand-by letters of credit and forecasted utilization from credit cards lines
EW manages liquidity by maintaining sufficient liquid assets in the form of cash and cashequivalents, investment securities and loan receivables. As of December 31, 2019, and 2018,P=117.8 billion (42.92%) and P=96.3 billion (38.99%) respectively, of EW’s total gross loans andreceivables had remaining maturities of less than 1 year. The total portfolio of trading and investmentsecurities is comprised mostly of sovereign-issued securities that have high market liquidity. With theabove presented liquidity profile, EW remains to be inhibited from liquidity risk that it cannotadequately manage.
Market RiskMarket risk is the risk that the fair value or future cash flows of financial instruments will fluctuatedue to changes in market variables such as interest rates, foreign exchange rates, and equity prices.EW treats exposures to market risk as either for trading or accrual/balance sheet exposure. Themarket risk for the trading portfolio is measured using Value at Risk (VaR). Interest rate risk ofaccrual portfolios in the Banking Book are measured using Earnings at Risk (EaR).
Market Risk in the Trading BooksThe Board has set limits on the level of market risk that may be accepted. VaR limits are applied atthe instrument level and approved by the BOD based on, among other things, a business unit’scapacity to manage price risks, the size and distribution of the aggregate exposure to price risks andthe expected return relative to price risks.
EW applies the VaR methodology to assess the market sensitive positions held for trading and toestimate the potential economic loss based on parameters and assumptions. VaR is a method used inmeasuring market risk by estimating the potential negative change in the market value of a portfolioat a given confidence level and over a specified time horizon.
Objectives and Limitations of the VaR MethodologyEW uses the VaR model of Bloomberg Portfolio Analytics using one-year historical data set to assesspossible changes in the market value of the Fixed Income, Equities, and Foreign Exchange tradingportfolio. VaR for the US Treasury Futures is measured using Historical Simulation using aninternally developed Excel spreadsheet. The IRS and Foreign Exchange (FX) Forwards (Outright andforward leg of FX Swaps) trading portfolio’s interest rate risk is measured using Monte Carlo VaR-

- 150 -
*SGVFS039395*
using OPICS Risk Plus. The VaR models are designed to measure market risk in a normal marketenvironment. The use of VaR has limitations because correlations and volatilities in market pricesare based on historical data and VaR assumes that future price movements will follow a statisticaldistribution.
Due to the fact that VaR relies heavily on historical data to provide information and may not clearlypredict the future changes and modifications of the risk factors, the probability of large market movesmay be underestimated.
VaR may also be under or overestimated due to assumptions placed on risk factors and therelationship between such factors for specific instruments. Even though positions may changethroughout the day, VaR only represents the risk of the portfolio at the close of each business day,and it does not account for any losses that may occur beyond the specified confidence level.
In practice, actual trading results will differ from the VaR calculation and the calculation does notprovide a meaningful indication of profits and losses in stressed market conditions. To determine thereliability of the VaR model, actual outcomes are monitored through hypothetical and actualbacktesting to test the accuracy of the VaR model.
Stress testing provides a means of complementing VaR by simulating the potential loss impact onmarket risk positions from extreme market conditions, such as risk factor movements based onhistorical financial market stress conditions and scenarios adopted from the uniform stress testingframework of the BSP.
VaR AssumptionsThe VaR that EW use is premised on a 99.0% confidence level that this potential loss estimate is notexpected to be exceeded if the current market risk positions were to be held unchanged for a givenholding period. Foreign exchange and US Treasury Futures, VaR is measured using 1 day holdingperiod while fixed income VaR has a holding period of 5 days. Furthermore, EW’s equity and IRStrading positions are assumed to be closed out in 10 days. The use of a 99.0% confidence levelmeans that within the set time horizon, losses exceeding the VaR figure should occur, on average, notmore than once every hundred days.
VaR is an integral part of EW’s market risk management and encompasses investment positions heldfor trading. VaR exposures form part of the market risk monitoring which is reviewed daily againstthe limit approved by the Board. The trading activities are controlled through the Market Risk Limit(MRL), which is a dynamic risk limit anchored on the principle of risk and return which is adjustedby net trading gains (added in half) or losses (subtracted in whole). RMD reports compliance to theMRL and trader’s VaR limits daily. If the MRL or individual trader’s limit is exceeded, suchoccurrence is promptly reported to the Treasurer, Chief Operating Officer, Chief Risk Officer and thePresident, and further to the Board through the RMC.
The table below pertains to interest rate risk of EW’s fixed income trading portfolio.
2019 2018(In Thousands)
Year-end VaR P=773,557 P=72,773Average VaR 321,085 58,052Highest VaR 880,070 145,351Lowest VaR 16,371 11,735

- 151 -
*SGVFS039395*
The year-end VaR for 2019 was based on EW’s fixed income trading book valued at P=21.4 billionwith average yields of 4.66% and 3.15% for the peso and foreign currency denominated bonds,respectively. Its average maturities are 9 years and 8 months for the peso portfolio and 18 years and 9months for the foreign currency portfolio.
The year-end VaR for 2018 was based on EW’s fixed income trading book valued at P=4.5 billion withaverage yields of 6.56% and 4.86% for the Peso and Foreign currency denominated bonds,respectively. Its average maturities are 5 years and 1 month for the Peso portfolio and 19 years and 2months for the foreign currency portfolio.
The market risk in EW’s US Treasury Futures trading positions is shown in the table below:
2019 2018Year-end VaR P=5,576 P=12,890Average VaR 6,471 3,822Highest VaR 58,042 29,154Lowest VaR 3,126 731
The market risk in EW’s IRS trading positions is shown in the table below:
2019 2018Year-end VaR P=11,799 P=10,740Average VaR 9,766 14,028Highest VaR 12,318 16,602Lowest VaR 7,695 10,529
EW’s end-2019 and end-2018 IRS positions have a notional amount of USD$20.0 million where it paysfixed rate and receives floating rate interest.
The interest rate risk in EW’s FX forwards positions is shown in the table below:
2019 2018Year-end VaR P=735 P=1,371Average VaR 582 361Highest VaR 1,849 2,781Lowest VaR 80 41
Foreign Currency RiskEW holds foreign currency denominated assets and liabilities, thus, fluctuations on the foreignexchange rate fluctuations can affect the financials and cash flows of EW. Managing the foreignexchange exposure is important for banks with exposures in foreign currencies. This includespurchase or sell of foreign currency to control the impact of changes in exchange rates on its financialposition.
The table below pertains to foreign exchange risk of EW:
2019 2018Year-end VaR P=7,229 P=4,335Average VaR 8,022 5,574Highest VaR 17,889 19,359Lowest VaR 1,807 33

- 152 -
*SGVFS039395*
EW’s foreign currency exposures emanate from its net open spot and forward FX purchase and selltransactions, and net foreign currency income accumulated over the years of its operations. Foreigncurrency-denominated deposits are generally used to fund EW’s foreign currency-denominated loanand investment portfolio in the FCDU.
In the FCDU books, BSP requires banks to match the foreign currency assets with the foreigncurrency liabilities. Thus, banks are required to maintain at all times a 100.0% cover for theircurrency liabilities held through FCDU.
Total foreign currency position is monitored through the daily BSP FX position reports, which aresubject to the overbought and oversold limits set by the BSP at 20.0% of unimpaired capital orUS$50.0 million, whichever is lower. Internal limits regarding the intraday trading and end-of-daytrading positions in FX, which consider t the trading desk and the branch FX transactions, are alsomonitored.
The tables below summarize the exposure to foreign currencies of EW as of December 31, 2019 and2018:
2019
USD SGD JPY HKDOther
Currencies* TotalAssetsGross FX assets $1,167,384 $967 $5,759 $5,338 $6,492 $1,185,940Contingent FX assets 61,550 – – – 15,003 76,553
1,228,934 967 5,759 5,338 21,495 1,262,493LiabilitiesGross FX liabilities 1,120,216 1,501 8,217 6,710 22,315 1,158,959Contingent FX liabilities 116,067 – 37 – – 116,104
1,236,283 1,501 8,254 6,710 22,315 1,275,063Net exposure ($7,348) ($534) ($2,495) ($1,372) ($820) ($12,570)*Other currencies include GBP, HKD, AUD, CNY and NZD
2018
USD SGD JPY HKDOther
Currencies* TotalAssetsGross FX assets $1,063,028 $14,890 $4,626 $518 $16,018 $1,099,080Contingent FX assets 52,500 – – – 15,948 68,448
1,115,528 14,890 4,626 518 31,966 1,167,528LiabilitiesGross FX liabilities 1,019,322 16,368 3,431 1,681 34,930 1,075,732Contingent FX liabilities 95,867 – – – – 95,867
1,115,189 16,368 3,431 1,681 34,930 1,171,599Net exposure $339 ($1,478) $1,195 ($1,163) ($2,964) ($4,071)*Other currencies include GBP, HKD, AUD, CNY and NZD
EW’s positions in other currencies are not individually significant.
The tables below indicate the sensitivity of the currencies which EW had significant exposures as ofDecember 31, 2019 and 2018:
Foreign currency appreciates 2019 (depreciates) USD SGD JPY EUR+10.00% (P=37,209) (P=2,704) (P=12,634) (P=6,948)-10.00% P=37,209 P=2,704 P=12,634 P=6,948

- 153 -
*SGVFS039395*
Foreign currency appreciates 2018 (depreciates) USD SGD JPY HKD+10.00% P=1,790 (P=7,773) P=6,282 (P=6,112)-10.00% (P=1,790) 7,773 (6,282) 6,112
The analysis calculates the effect of a reasonably possible movement of the foreign currency rateagainst Peso, with all other variables held constant on the statement of income. A negative amountreflects a potential net reduction in statement of income while a positive amount reflects a netpotential increase. There is no other impact on EW’s equity other than those already affecting thestatements of income.
Market Risk in the Banking Book
Interest Rate RiskInterest rate risk in the banking book (IRRBB) is inherent in EW’s traditional banking activities thatinclude taking deposits to invest or grant loans. The future cash flows from these activities areexposed to variations in interest rates, largely from mismatch in tenors and prices, IRRBB ismeasured with Earnings-at-Risk (EaR) which is a measure of the net interest income movement dueto changes in prevailing interest rates and the balance sheet re-pricing profile of EW. The EaR limitis set as a function of EW’s net interest margin (NIM). The EaR limit preserves EW’s capital andcompetitive position by restricting the impact of interest rate sensitivities to NIM within the corridorof above average and within the first quartile of its peer banks. In measuring EaR, EW’s interest re-pricing assets and liabilities are matched by re-pricing (or maturity if non-repricing) buckets coveringtenors within a one-year horizon, and corresponding gaps determined. If positive gap is noted, itimplies that an increase in interest rates will positively affect the net interest income. Conversely, anegative gap implies that an increase in interest rates will negatively affect the net interest income.The estimated nominal impact to the Bank’s earnings is derived by multiplying the volatility ofbenchmark yields for each tenor bucket to the repricing gap profile. The result is compared vs EaRlimit to monitor the compliance with the limit and is reported to the RMC on a monthly basis.Additionally, EaR limit is reviewed and updated annually to ensure its continued relevance andalignment with EW’s financial targets, strategies, and overall risk appetite.
To complement EaR and provide Management a more holistic view, EW performs forward lookingscenario and sensitivity analysis as well as stress testing activities to identify any vulnerabilities.EW employs 3 methodologies in the conduct of stress testing a) economic/historical stress test whichassumes a parallel shift in interest yield curves of 660.0 basis points for PhP-denominated assets andliabilities and 270.0 basis points for USD-denominated, b) uniform stress test, a regulatory-prescribedstress test, has 3 scenarios with assumed parallel shift in interest rates for both PhP (from 300.0 bps to500.0 bps) and USD (from 100.0 bps to 300.0 bps), c) reverse stress test, which primarily measuresthe highest swing in interest rates that can potentially wipe out EW targeted net income and netinterest income.
All IRRBB reports are also presented to the ALCO. The ALCO deliberates on matters pertaining tothe management of EW’s assets and liabilities, such as achieving optimum asset and liability mix,pricing, liquidity levels, repricing gap positions, and asset quality. EW’s ALCO meets on a weeklybasis.
EW manages its IRRBB through effective diversification of funding sources. By offering variousdeposit, investment and loan products with differing maturities, EW is able to meet its short, mediumand long-term obligations, optimize returns, and provide options that cater to differing preferences ofits target market. EW’s target funding mix is aligned with the Bank’s overall growth plans. While

- 154 -
*SGVFS039395*
EW mainly manages IRRBB through careful planning of its cashflows, it also has access to variousderivative products that provide flexibility in responding to more abrupt market developments.
The following tables provide for the average interest rates by period of re-pricing (or by period ofmaturity if there is no re-pricing) of EW as of December 31, 2019 and 2018:
2019Up to
1 month>1 month
to 3 months>3 months
to 6 months>6 months
to 12 months >12 monthsRBUFinancial assets:
Cash and cash equivalents* 4.02% − − − −Investment securities** 6.02% − − − 6.08%Loans and receivables 6.43% 7.37% 5.84% 11.04% 16.91%
Financial liabilities:Deposit liabilities 3.05% 3.31% 3.67% 3.17% 3.73%Bills payable 4.50%Subordinated debt 5.50% − − − 5.50%
FCDUFinancial assets:
Cash and cash equivalents* 1.55% − − − −Investment securities** 3.83% 3.95% − − 5.23%Loans and receivables 2.91% 3.75% 4.81% 4.00% 7.31%
Financial liabilities:Deposit liabilities 1.71% 1.86% 2.38% 2.19% 2.49%Bills payable 2.23% 2.21% − − −
*Pertain to Due from BSP, Due from other banks, IBLR**Pertain to financial assets at FVTPL, financial assets at FVOCI and investment securities at amortized cost
2018Up to
1 month>1 month
to 3 months>3 months
to 6 months>6 months
to 12 months >12 monthsRBUFinancial assets:
Cash and cash equivalents* 2.17% − − − −Investment securities** 4.20% − − − 5.48%Loans and receivables 5.99% 6.58% 7.58% 10.10% 11.96%
Financial liabilities:Deposit liabilities 1.73% 4.22% 3.34% 2.30% 3.47%Bills payable 5.26% − − − −Subordinated debt − − − − 5.50%
FCDUFinancial assets:
Cash and cash equivalents* 2.20% − − − −Investment securities** 6.57% − 7.25% 4.25% 5.48%Loans and receivables 3.14% 6.20% 3.14% − 7.25%
Financial liabilities:Deposit liabilities 1.07% 1.93% 1.51% 1.50% 2.71%Bills payable 2.80% − − − −
*Pertain to Due from BSP, Due from other banks, IBLR**Pertain to financial assets at FVTPL, financial assets at FVOCI and investment securities at amortized cost
The following tables provide for the interest rate re-pricing gap of EW as of December 31, 2019and 2018:
2019Up to
1 month> 1 to
3 months> 3 to
6 months>6 to
12 months >12 months TotalFinancial assets
Cash and cash equivalents P=2,691,882 P=− P=− P=− P=− P=2,691,882Investment securities 16,799,979 434,286 − − 54,219,537 71,453,802Loans and receivables 37,841,333 4,446,187 10,453,784 6,476,761 154,111,407 213,329,472Contingent assets * − 759,525 253,175 − − 1,012,700
Total financial assets 57,333,194 5,639,998 10,706,959 6,476,761 208,330,944 288,487,856
(Forward)

- 155 -
*SGVFS039395*
2019Up to
1 month> 1 to
3 months> 3 to
6 months>6 to
12 months >12 months TotalFinancial liabilities
Deposit liabilities P=83,447,163 P=47,388,399 P=16,084,590 P=2,193,420 P=13,828,598 P=162,942,170Bills and acceptances payable 29,950,625 962,306 − − − 30,912,931Subordinated debt 5,000,000 − − − 1,250,000 6,250,000Contingent liabilities ** − − − − 1,012,700 1,012,700
Total financial liabilities 118,397,788 48,350,705 16,084,590 2,193,420 16,091,298 201,117,801Asset-liability gap (P=61,064,594) (P=42,710,707) (P=5,377,631) P=4,283,341 P=192,239,646 P=87,370,055* Consist of interest rate swap receivables***Consist of interest rate swap payables
2018
Up to1 month
> 1 to3 months
> 3 to6 months
>6 to12 months >12 months Total
Financial assetsCash and cash equivalents P=5,862,670 P=− P=− P=− P=− P=5,862,670Investment securities 4,286,960 − 848,483 205,062 33,270,550 38,611,055Loans and receivables 39,375,802 5,435,804 5,213,752 6,096,906 151,158,971 207,281,235Contingent assets* − 1,051,600 − − − 1,051,600
Total financial assets 49,525,432 6,487,404 6,062,235 6,301,968 184,429,521 252,806,560Financial liabilities
Deposit liabilities 126,883,754 8,344,245 3,790,783 740,204 21,092,865 160,851,851Bills payable 17,939,215 − − − − 17,939,215Subordinated debt − − − − 6,250,000 6,250,000Contingent liabilities** − − − − 1,051,600 1,051,6000
Total financial liabilities 144,822,969 8,344,245 3,790,783 740,204 28,394,465 186,092,666Asset-liability gap (P=95,297,537) (P=1,856,841) P=2,271,452 P=5,561,764 P=156,035,056 P=66,713,894*** Consist of interest rate swap receivables****Consist of interest rate swap payables
EW also monitors its exposure to fluctuations in interest rates by using scenario analysis to estimatethe impact of interest rate movements on its interest income. This is done by modeling the impact toEW’s interest income and interest expenses of different parallel changes in the interest rate curve,assuming the parallel change only occurs once and the interest rate curve after the parallel changedoes not change again for the next twelve months.
The following table sets forth, for the period indicated, the impact of changes in interest rates onEW’s non-trading net interest income. There is no other impact on EW’s equity other than thosealready affecting the statements of income.
Change in basis points 2019 2018 +100.00 bps (P=964,027) (P=900,641)
-100.00 bps 964,027 900,641
Market Risk Weighting as of December 31, 2019 and 2018The table below shows the different market risk weighted assets of EW using the standardizedapproach which is based on the standard weight per segment or asset class:
Type of Market Risk Exposure 2019 2018Interest rate exposures P=13,388,521 P=2,275,757Foreign exchange exposures 286,768 220,046
P=13,675,289 P=2,495,803

- 156 -
*SGVFS039395*
Operational RiskOperational risk is the loss resulting from inadequate or failed internal processes, people and systemsor from external events. It includes legal, compliance and reputational risks but excludes strategicrisk.
Adopting the Basic Indicator Approach below, where computation is based on the 15.0% of theaverage gross income for the past 3 years, it shows the total operational risk-weighted assets of EW.
2019 2018Group P=44,636,287 38,959,219
Other Risk ExposuresEW risk exposures other than credit, market, liquidity and operational, while existent, are deemedinsignificant relative to the mentioned risks and if taken in isolation. Hence, management of theserisks are instead collectively performed and made an integral part of EW’s internal capital adequacyassessment process (ICAAP) and enterprise risk management initiatives.
Banking and Financial Services Capital ManagementEW actively manages its capital to comply with regulatory requirements, enable growth targets,withstand plausible stress events and be at par with EW peers. The primary objective of EW’s capitalmanagement is to ensure that it maintains adequate capital to cover risks inherent to its bankingactivities without prejudice to optimizing shareholders’ value.
Regulatory Qualifying CapitalUnder existing BSP regulations, the determination of EW’s compliance with regulatory requirementsand ratios is based on the amount of EW’s ‘unimpaired capital’ (regulatory net worth) reported to theBSP, which is determined on the basis of regulatory policies. In addition, the risk-based CapitalAdequacy Ratio (CAR) of a bank, expressed as a percentage of qualifying capital to risk-weightedassets, should not be less than 10.0% for both solo basis (head office and branches) and consolidatedbasis (EW and subsidiaries engaged in financial allied undertakings). Qualifying capital and risk-weighted assets are computed based on BSP regulations.
Effective January 1, 2014, EW complied with BSP issued Circular No. 781, Basel III ImplementingGuidelines on Minimum Capital Requirements, which provides the implementing guidelines on therevised risk-based capital adequacy framework particularly on the minimum capital and disclosurerequirements for universal banks and commercial banks, as well as their subsidiary banks and quasi-banks, in accordance with the Basel III standards. The Circular sets out a minimum Common EquityTier 1 (CET1) ratio of 6.0% and Tier 1 capital ratio of 7.5%. It also introduces a capital conservationbuffer of 2.5% comprised of CET1 capital. The BSP’s existing requirement for Total CAR remainsunchanged at 10.0% and these ratios shall be maintained at all times.
Further, existing capital instruments as of December 31, 2010 which do not meet the eligibilitycriteria for capital instruments under the revised capital framework shall no longer be recognized ascapital. Capital instruments issued under BSP Circular Nos. 709 and 716 (the circulars amending thedefinition of qualifying capital particularly on Hybrid Tier 1 and Lower Tier 2 capitals), and beforethe effectivity of BSP Circular No. 781, shall be recognized as qualifying capital only untilDecember 31, 2015. In addition to changes in minimum capital requirements, this Circular alsorequires various regulatory adjustments in the calculation of qualifying capital.
On June 27, 2014, the BSP issued Circular No. 839, REST Limit for Real Estate Exposures whichprovides the implementing guidelines on the prudential REST limit for universal, commercial, andthrift banks on their aggregate real estate exposures. EW should maintain CET1 and CAR levels at

- 157 -
*SGVFS039395*
the regulatory prescribed minimums, on a solo and consolidated basis, even after the simulated resultsof a 25.0% write-off to EW’s real estate exposures. These shall be complied with at all times.
The capital-to-risk assets ratio reported to the BSP as of December 31, 2019 and 2018 are shown inthe table below:
2019 2018CET1 capital ratio 10.37% 10.29%Tier 1 capital ratio 10.37% 10.29%Total capital ratio 12.95% 12.76%
The composition of the qualifying capital of EW is shown below:
2019 2018(In Millions)
Qualifying capitalTier 1 capital P=47,963 P=41,918CET1 capital 47,963 41,918Less: Required deductions 11,609 10,081Net Tier 1 capital 36,354 31,837Tier 2 capital 9,036 7,622
Total qualifying capital P=45,390 P=39,459
The capital requirements of EW as of December 31, 2019 and 2018 are shown below:
2019 2018(In Millions)
Capital requirements: Credit risk P=292,232 P=267,828
Market risk 13,675 2,496 Operational risk 44,636 38,959Total capital requirements P=350,543 P=309,283
Qualifying capital and risk-weighted assets (RWA) are computed based on BSP regulations.
Under Basel III, the regulatory Gross Qualifying Capital of EW consists of Tier 1 (core) and Tier 2(supplementary) capital. Tier 1 comprises share capital, surplus (including current year profit), andother comprehensive income (cumulative foreign currency translation and net unrealized gains onfinancial assets at FVOCI). Required deductions include goodwill, intangible assets, investments inequity, deferred tax assets, defined benefit pension assets and unsecured credit accommodations toDOSRI and subsidiaries.
Tier 2 capital comprise of unsecured subordinated debts and general loan loss provision.
Risk-weighted assets are determined by assigning defined risk weights to the statement of financialposition exposure and to the credit equivalent amounts of off-balance sheet exposures. Certain itemsare deducted from risk-weighted assets, such as the excess of general loan loss provision over theamount permitted to be included in Tier 2 capital. The risk weights vary from 0.0% to 150.0%depending on the type of exposure, with the risk weights of off-balance sheet exposures beingsubjected further to credit conversion factors.

- 158 -
*SGVFS039395*
Below is a summary of risk weights and selected exposure types:
Risk weight Exposure/Asset type*0.0% Cash on hand; claims collateralized by securities issued by the national
government, BSP; loans covered by the Trade and Investment DevelopmentCorporation of the Philippines; real estate mortgages covered by the HomeGuarantee Corporation
20.0% Cash and other cash items, claims guaranteed by Philippine incorporatedbanks/quasi-banks with the highest credit quality; claims guaranteed by foreignincorporated banks with the highest credit quality; loans to exporters to the extentguaranteed by Small Business Guarantee and Finance Corporation
50. 0% Housing loans fully secured by first mortgage on residential property; LocalGovernment Unit (LGU) bonds which are covered by Deed of AssignmentofInternal Revenue allotment of the LGU and guaranteed by the LGU GuaranteeCorporation
75.0% Direct loans of defined Small Medium Enterprise (SME) and microfinance loansportfolio; non-performing housing loans fully secured by first mortgage
100. 0% All other assets (e.g., real estate assets) excluding those deducted from capital(e.g., deferred income tax)
150.0% All non-performing loans (except non-performing housing loans fully secured byfirst mortgage) and all non-performing debt securities
* Not all inclusive
With respect to off-balance sheet exposures, the exposure amount is multiplied by a credit conversionfactor (CCF), ranging from 0.0% to 100.0%, to arrive at the credit equivalent amount, before the riskweight factor is multiplied to arrive at the risk-weighted exposure. Direct credit substitutes (e.g.,guarantees) have a CCF of 100.0%, while items not involving credit risk has a CCF of 0.0%.
In the case of derivatives, the credit equivalent amount (against which the risk weight factor ismultiplied to arrive at the risk-weighted exposure) is generally the sum of the current credit exposureor replacement cost (the positive fair value or zero if the fair value is negative or zero) and anestimate of the potential future credit exposure or add-on. The add-on ranges from 0.0% to 1.5%(interest rate-related) and from 1.0% to 7.5% (exchange rate-related), depending on the residualmaturity of the contract. For credit-linked notes and similar instruments, the risk-weighted exposureis the higher of the exposure based on the risk weight of the issuer’s collateral or the reference entityor entities.
The risk-weighted CAR is calculated by dividing the sum of its Tier 1 and Tier 2 capital, as definedunder BSP regulations, by its risk-weighted assets. The risk-weighted assets, as defined by the BSPregulations, consist of all of the assets on the balance sheet at their respective book values, togetherwith certain other off-balance sheet items, weighted by certain percentages depending on the risksassociated with the type of assets. The determination of compliance with regulatory requirements andratios is based on the amount of EW’s ‘unimpaired capital’ (regulatory net worth) as reported to theBSP, which is determined on the basis of regulatory accounting practices which differ from PFRS insome respects.
EW has taken into consideration the impact of the foregoing requirements to ensure that theappropriate level and quality of capital are maintained on an ongoing basis.

- 159 -
*SGVFS039395*
The Group (Excluding EW)Interest Rate RiskThe Group’s exposure to the risk for changes in market interest rates relates primarily to the Group’slong-term debt obligations with a floating interest rate. The Group’s interest rate exposuremanagement policy centers on reducing the Group’s overall interest expense and exposure to changesin interest rates. The Group’s policy is to manage its interest cost using a mix of fixed and floatinginterest-rate debts. The Group regularly monitors available loans in the market which is of cheaperinterest rate and substitutes high-rate debts of the Group.
The Group’s long-term debt with floating interest rate usually mature after 3 to 5 years from the dateof availment, while fixed term-loans mature after 5 to 10 years.
The following table demonstrates the sensitivity to a reasonably possible change in interest rates, withall other variables held constant, of the Group’s profit before tax and equity (through the impact onfloating rate borrowings). There is no other impact on the Group’s OCI other than those alreadyaffecting the profit and loss.
Increase(Decrease)
in Bps
Effect on IncomeBefore Income Tax
(In Thousands)2019 +200 (P=31,734)
-200 31,7342018 +200 (P=12,117)
-200 12,117
The following table sets out the carrying amount by maturity, of the Group’s long-term debts that areexposed to interest rate risk:
91-Day Treasury Bills/91-Day BVAL plus 1% to 2% marginBelow 1 Year 1 to2 Years >2 to3 Years >3 to 4 Years Over 4 Years Total
(In Thousands)As of December 31, 2019 P=1,086,764 P=− P=− P=− P=500,000 P=1,586,764As of December 31, 2018 287,895 317,966 − − − 605,861
Liquidity RiskThe Group seeks to manage its liquidity profile to be able to finance capital expenditures and servicematuring debts. To cover its financing requirements, the Group uses internally generated funds andavailable long-term and short-term credit facilities.
As part of its liquidity risk management, the Group regularly evaluates its projected and actual cashflows. It also continuously assesses conditions in the financial markets for opportunities to pursuefund raising activities, in case any requirements arise. Fund raising activities may include bank loansand capital market issues. Accordingly, its loan maturity profile is regularly reviewed to ensureavailability of funding through an adequate amount of credit facilities with financial institutions.
Overall, the Group’s funding arrangements are designed to keep an appropriate balance betweenequity and debt, to give financing flexibility while continuously enhancing the Group’s businesses.

- 160 -
*SGVFS039395*
The following table summarizes the maturity profile of the Group’s financial assets and contractassets held to manage liquidity as of December 31, 2019 and 2018 based on contractual undiscountedpayments:
December 31, 2019
On demandLess than3 months
3 monthsto 1 year
> 1 yearto 3 years
>3 yearsto 5 years Over 5 years Total
(In Thousands)Financial assets at amortized costReal Estate Operations Cash and cash equivalents P=1,488,785 P=1,152,679 P=− P=− P=− P=− P=2,641,464 Contracts receivable 1,625,907 − − − − − 1,625,907 Receivable from tenants 1,996,515 ‒ ‒ ‒ ‒ ‒ 1,996,515 Receivable sale of commercial lots ‒ 133,124 306,809 108,611 − − 548,544
Receivable from buyers 139,875 − − − − − 139,875 Receivable from government and other
financial institutions 192,580 − − − − − 192,580 Receivable from HOA 139,362 − − − − − 139,362 Due from related parties 15,404 − − − − − 15,404 Others 10,514 ‒ ‒ ‒ − ‒ 10,514
5,608,942 1,285,803 306,809 108,611 − ‒ 7,310,165Hospitality Operations Cash in bank 107,665 − − − − − 107,665 Trade receivables 206,549 − − − − − 206,549 Due from related parties 6,941 − − − − − 6,941
321,155 − − − − − 321,155Power Operations Cash in bank 1,501,321 − − − − − 1,501,321 Trade receivables − 1,930,544 − − − − 1,930,544
1,501,321 1,930,544 − − − − 3,431,865Sugar Operations Cash in bank 5,475 − − − − − 5,475 Trade receivables 428 − − − − − 428 Others 107,662 − − − − − 107,662
113,565 − − − − − 113,565Others Cash in bank 2,531 − − − − − 2,531
7,547,514 3,216,347 306,809 108,611 20 ‒ 11,179,281Financial Assets at FVOCIInvestment in shares of stocks:
Quoted ‒ 204,034 − − − − 204,034Unquoted − 496,005 − − − − 496,005
‒ 700,039 − − − − 700,039Total financial assets 7,547,514 3,916,386 306,809 108,611 20 ‒ 11,879,320Contract assets ‒ 2,970,401 4,957,073 3,794,439 1,440,424 1,685,876 14,848,213
P=7,547,514 P=6,886,787 P=5,263,882 P=3,903,050 P=1,440,444 P=1,685,876 P=26,727,533
December 31, 2018
On demandLess than3 months
3 monthsto 1 year
> 1 yearto 3 years
>3 yearsto 5 years Over 5 years Total
(In Thousands)Financial assets at amortized costReal Estate Operations Cash and cash equivalents P=1,800,851 P=1,430,509 P=– P=– P=– P=– P=3,231,360 Contracts receivable 1,001,844 – – – – – 1,001,844 Receivable from tenants 1,597,071 69,840 28,343 − – – 1,695,254 Receivable sale of commercial lots 484,606 – – – – – 484,606
Receivable from buyers 60,919 − − − − − 60,919 Receivable from government and other
financial institutions 177,437 – – – – – 177,437
Receivable from HOA 142,029 – – – – – 142,029 Due from related parties 4,312 – – – – – 4,312 Others 323,811 1,275 2,938 3,970 1,586 – 333,580
5,592,880 1,501,624 31,281 3,970 1,586 – 7,131,341Hospitality Operations Cash in bank 41,878 − − − − − 41,878 Trade receivables 135,707 − − − − − 135,707 Others 60,938 − − − − − 60,938
238,523 − − − − − 238,523Power Operations Cash in bank 1,058,754 − − − − − 1,058,754 Trade receivables − 1,841,465 − − − − 1,841,465
1,058,754 1,841,465 − − − − 2,900,219Sugar Operations Cash in bank 23,568 − − − − − 23,568
Other receivables 667 − − − − − 66724,235 − − − − − 24,235
Others Cash in bank 2,628 − − − − − 2,628
6,917,020 3,343,089 31,281 3,970 1,586 − 10,296,946
(Forward)
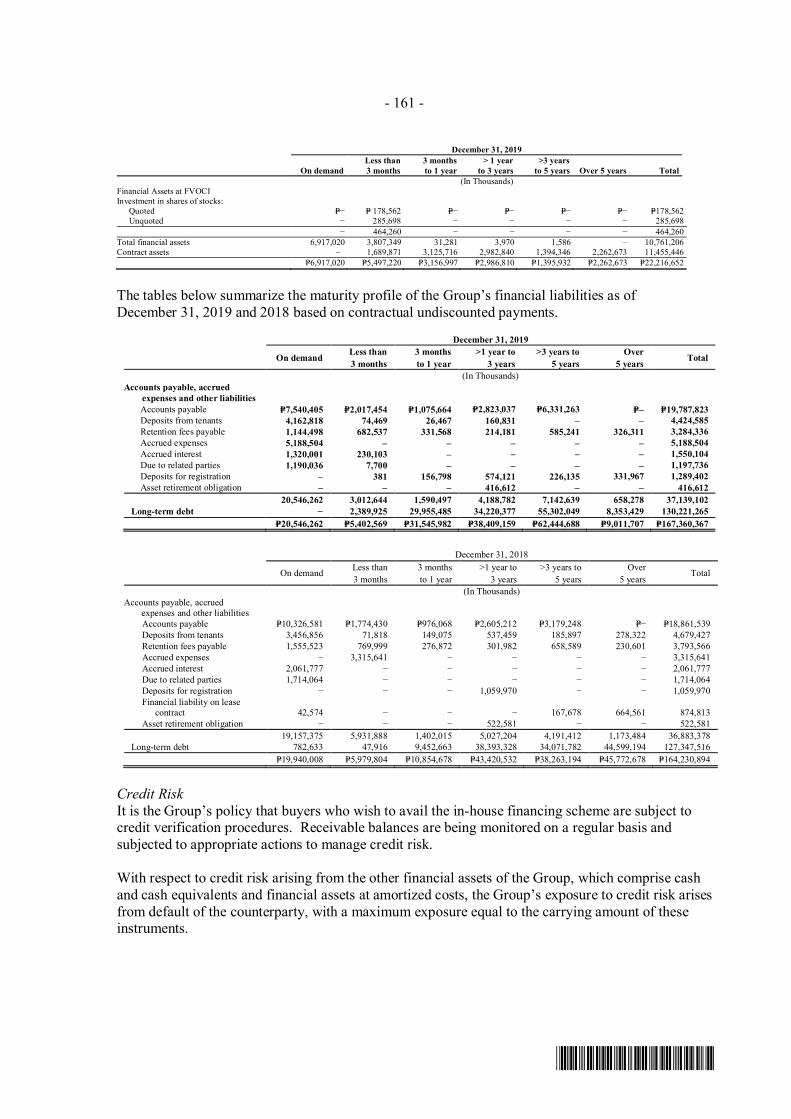
- 161 -
*SGVFS039395*
December 31, 2019
On demandLess than3 months
3 monthsto 1 year
> 1 yearto 3 years
>3 yearsto 5 years Over 5 years Total
(In Thousands)Financial Assets at FVOCIInvestment in shares of stocks:
Quoted P=− P= 178,562 P=− P=− P=− P=− P=178,562Unquoted − 285,698 − − − − 285,698
− 464,260 − − − − 464,260Total financial assets 6,917,020 3,807,349 31,281 3,970 1,586 − 10,761,206Contract assets – 1,689,871 3,125,716 2,982,840 1,394,346 2,262,673 11,455,446
P=6,917,020 P=5,497,220 P=3,156,997 P=2,986,810 P=1,395,932 P=2,262,673 P=22,216,652
The tables below summarize the maturity profile of the Group’s financial liabilities as ofDecember 31, 2019 and 2018 based on contractual undiscounted payments.
December 31, 2019
On demand Less than 3 months >1 year to >3 years to Over Total3 months to 1 year 3 years 5 years 5 years(In Thousands)
Accounts payable, accrued expenses and other liabilities
Accounts payable P=7,540,405 P=2,017,454 P=1,075,664 P=2,823,037 P=6,331,263 P=‒ P=19,787,823Deposits from tenants 4,162,818 74,469 26,467 160,831 ‒ ‒ 4,424,585Retention fees payable 1,144,498 682,537 331,568 214,181 585,241 326,311 3,284,336Accrued expenses 5,188,504 ‒ ‒ ‒ ‒ ‒ 5,188,504Accrued interest 1,320,001 230,103 ‒ ‒ ‒ ‒ 1,550,104Due to related parties 1,190,036 7,700 ‒ ‒ ‒ ‒ 1,197,736Deposits for registration ‒ 381 156,798 574,121 226,135 331,967 1,289,402Asset retirement obligation ‒ ‒ ‒ 416,612 ‒ ‒ 416,612
20,546,262 3,012,644 1,590,497 4,188,782 7,142,639 658,278 37,139,102Long-term debt − 2,389,925 29,955,485 34,220,377 55,302,049 8,353,429 130,221,265
P=20,546,262 P=5,402,569 P=31,545,982 P=38,409,159 P=62,444,688 P=9,011,707 P=167,360,367
December 31, 2018
On demand Less than 3 months >1 year to >3 years to Over Total3 months to 1 year 3 years 5 years 5 years
(In Thousands)Accounts payable, accrued
expenses and other liabilitiesAccounts payable P=10,326,581 P=1,774,430 P=976,068 P=2,605,212 P=3,179,248 P=− P=18,861,539Deposits from tenants 3,456,856 71,818 149,075 537,459 185,897 278,322 4,679,427Retention fees payable 1,555,523 769,999 276,872 301,982 658,589 230,601 3,793,566Accrued expenses − 3,315,641 − − − − 3,315,641Accrued interest 2,061,777 − − − − − 2,061,777Due to related parties 1,714,064 − − − − − 1,714,064Deposits for registration − − − 1,059,970 − − 1,059,970Financial liability on lease
contract 42,574 − − − 167,678 664,561 874,813Asset retirement obligation − − − 522,581 − − 522,581
19,157,375 5,931,888 1,402,015 5,027,204 4,191,412 1,173,484 36,883,378Long-term debt 782,633 47,916 9,452,663 38,393,328 34,071,782 44,599,194 127,347,516
P=19,940,008 P=5,979,804 P=10,854,678 P=43,420,532 P=38,263,194 P=45,772,678 P=164,230,894
Credit RiskIt is the Group’s policy that buyers who wish to avail the in-house financing scheme are subject tocredit verification procedures. Receivable balances are being monitored on a regular basis andsubjected to appropriate actions to manage credit risk.
With respect to credit risk arising from the other financial assets of the Group, which comprise cashand cash equivalents and financial assets at amortized costs, the Group’s exposure to credit risk arisesfrom default of the counterparty, with a maximum exposure equal to the carrying amount of theseinstruments.

- 162 -
*SGVFS039395*
The table below shows the comparative summary of maximum credit risk exposure on assets as ofDecember 31, 2019 and 2018.
2019 2018(In Thousands)
Loans and ReceivablesReal Estate Operations
Cash and cash equivalents P=2,641,464 P=3,231,360Contracts receivable 1,625,907 1,001,844Receivable from tenants 1,996,515 1,695,254Receivable from sale of commercial lots 548,544 484,606Receivable from buyers 192,580 177,437Receivable from government and other financial
institutions 139,875 60,919Receivables from HOA - net 139,362 142,029Due from related parties 15,404 4,312Others 10,514 333,580
7,310,165 7,131,341Hospitality Operations Cash and cash equivalents 107,665 41,878 Trade receivables 206,549 135,707
Others 6,941 60,938321,155 238,523
Power OperationsCash and cash equivalents 1,501,321 1,058,754Trade receivables 1,930,544 1,841,465
3,431,865 2,900,219Sugar Operations
Cash 5,475 23,568Trade receivables 428 667Others 107,662 117,204
113,565 141,439Other Operations
Cash and cash equivalents 2,531 2,628Financial assets at FVOCI
Quoted equity securities 204,034 178,562 Unquoted equity securities 496,005 285,698
700,039 464,260P=11,879,320 P=10,878,410
The loans and receivable of sugar, hospitality, power and other operations are neither past due norimpaired and are considered high grade.

- 163 -
*SGVFS039395*
The succeeding table shows the credit quality by class of asset for loan-related statement of financialposition lines, based on the real estate operation’s credit rating system as of December 31, 2019 and2018, based on the Group’s credit rating system.
2019Neither Past Due nor Impaired Past Due or
IndividuallyImpaired TotalHigh Grade
StandardGrade
(In Thousands)Cash and cash equivalents P=2,641,464 P=− P=− P=2,641,464Contract assets 1,732,471 13,115,742 ‒ 14,848,213Loans and receivables ‒ Receivables from tenants 273,900 1,702,442 20,173 1,996,515 Contracts receivable 140,846 1,485,061 ‒ 1,625,907
Receivables from sale of commercial lots 548,544 ‒ ‒ 548,544 Receivable from government and other financial
institutions 192,580 ‒ ‒ 192,580 Receivables from buyers ‒ 139,875 ‒ 139,875 Receivables from homeowners’ association ‒ 123,498 15,864 139,362 Due from related parties 15,644 ‒ ‒ 15,644 Others 10,274 ‒ ‒ 10,274
P=5,555,723 P=16,566,618 P=36,037 P=22,158,378
2018Neither Past Due nor Impaired Past Due or
IndividuallyImpaired TotalHigh Grade
StandardGrade
(In Thousands)Cash and cash equivalents P=3,231,360 P=− P=− P=3,231,360Contract assets 1,413,341 10,042,105 − 11,455,446Loans and receivables Receivables from tenants 356,516 1,313,609 25,129 1,695,254 Contracts receivable 146,981 520,184 334,679 1,001,844 Receivable from sale of commercial lots 484,606 − − 484,606 Receivable from government and other financial
institutions 177,437 − − 177,437 Receivables from homeowners’ association − 126,165 15,864 142,029 Receivables from buyers 60,919 – – 60,919 Due from related parties 4,312 − − 4,312 Others 333,580 − − 333,580
P=6,209,052 P=12,002,063 P=375,672 P=18,586,787
The analysis of financial assets as of December 31, 2019 and 2018 is as follows:
2019Neither past
due norimpaired
Past due but not impairedLess than
30 days30 to
60 days61 to
90 days91to
120 daysOver
120 days Subtotal Impaired Total(In Thousands)
Cash and cash equivalents P=2,641,464 P=‒ P=‒ P=‒ P=‒ P=‒ P=2,641,464 P=‒ P=2,641,464Contract assets 14,848,213 ‒ ‒ ‒ ‒ ‒ 14,848,213 ‒ 14,848,213Loans and receivables Contracts receivable 1,976,342 ‒ ‒ ‒ ‒ ‒ 1,976,342 20,173 1,996,515 Receivables from tenants 140,846 1,485,061 ‒ ‒ ‒ ‒ 1,625,907 ‒ 1,625,907
Receivables from sale ofcommercial lots 548,544 ‒ ‒ ‒ ‒ ‒ 548,544 ‒ 548,544
Receivable from government andother financial institutions 192,580 ‒ ‒ ‒ ‒ ‒ 192,580 ‒ 192,580
Receivables from buyers 139,875 ‒ ‒ ‒ ‒ ‒ 139,875 ‒ 139,875Receivables from homeowners’
association 123,498 ‒ ‒ ‒ ‒ ‒ 123,498 15,864 139,362 Due from related parties 15,644 ‒ ‒ ‒ ‒ ‒ 15,644 ‒ 15,644 Others 10,274 ‒ ‒ ‒ ‒ ‒ 10,274 ‒ 10,274
P=20,637,280 P=1,485,061 P=‒ P=‒ P=‒ P=‒P=22,122,341 P=36,037 P=22,158,378

- 164 -
*SGVFS039395*
2018Neither past
due norimpaired
Past due but not impairedLess than
30 days30 to
60 days61 to
90 days91to
120 daysOver
120 days Subtotal Impaired Total(In Thousands)
Cash and cash equivalents P=3,231,360 P=− P=− P=− P=− P=− P=3,231,360 P=− P=3,231,360Contract assets 11,455,446 − − − − − 11,455,446 − 11,455,446Loans and receivables Receivables from tenants 1,670,125 − − − − − 1,670,125 25,129 1,695,254 Contracts receivable 667,165 334,679 − − − − 1,001,844 − 1,001,844
Receivable from sale ofcommercial lots 484,606 − − − − − 484,606 − 484,606
Receivable from government andother financial institutions 177,437 − − − − − 177,437 − 177,437
Receivables from homeowners’association 126,165 − − − − − 126,165 15,864 142,029
Receivable from buyers 60,919 − − − − − 60,919 − 60,919 Due from related parties 4,312 − − − − − 4,312 − 4,312 Others 333,580 − − − − − 333,580 − 333,580
P=18,211,115 P=334,679 P=− P=− P=− P=− P=18,545,794 P=40,993 P=18,586,787
The Group’s high-grade receivables pertain to receivables from related parties and third partieswhich, based on experience, are highly collectible or collectible on demand, and of which exposure tobad debt is not significant. Receivables assessed to be of standard grade are those which had passed acertain set of credit criteria, and of which the Group has not noted any extraordinary exposure whichcalls for a substandard grade classification.
Real Estate Operation Capital ManagementReal estate operation’s primary objective is to maintain its current sound financial condition andstrong debt service capabilities as well as to continuously implement a prudent financial managementprogram.
Real estate operation manage their capital structure and makes adjustments to it, in light of changes ineconomic conditions. It closely monitors its capital and cash positions and carefully manages itscapital expenditures such as land acquisitions, constructions and project developments and fixedcharges. Real estate operation prefers to enter into joint venture arrangements with landowners todevelop land rather than purchasing land outright, which reduces its capital requirements and canincrease returns. Furthermore, real estate operation may also, from time to time, seek other sources offunding, which may include debt or equity issues depending on its financing needs and marketconditions.
Real estate operation continues to fund its project developments using medium to long-termfinancing, which can help mitigate any negative effects of a sudden downturn in the Philippineeconomy or a sudden rise in interest rates.
Hospitality Operations Capital ManagementHospitality operation’s primary objective is to improve the profitability and continuously implement aprudent financial management program. Capital and cash positions are closely monitored andexpenditures and disbursements are carefully managed. Hospitality operation considers total equityas capital.
As of December 31, 2019, MSSI is not subject to externally imposed capital requirements.
Power OperationPower operation’s primary objective is to effectively manage its cash flow position. Cash flows aremanaged by ensuring that billings are prepared and delivered promptly and by working closely withelectric cooperatives to ensure timely collection of receivables.

- 165 -
*SGVFS039395*
Sugar Operation Capital ManagementSugar operation manages their capital structure and makes adjustments to it in light of changes ineconomic conditions. It closely monitors its capital and cash positions and carefully manages itsexpenditures and disbursements. Furthermore, sugar operation also, from time to time seeks othersources of funding, which may include internal or external borrowings depending on its financingneeds and market conditions.
Sugar operation monitors capital using a gearing ratio which is total debt divided by total equity.Debt includes accounts payable, accrued expenses and other liabilities, income tax payable, due torelated parties, short-term and long-term debt. The policy is to keep the gearing ratio not to exceed2.0:1.0.
Derivative Financial InstrumentsThe Group’s freestanding derivative financial instruments, which mainly consist of foreign currencyforward contracts and swaps, and interest rate swaps, are transactions not designated as hedges.
The table below sets out information about the Group’s derivative financial instruments and therelated fair value as of December 31, 2019 and 2018:
Foreign Currency Forward Contracts and Swaps 2019 2018(In Thousands)
Notional amount USD194,699 USD163,000Derivative assets (Note 20) P=1,438,339 P=1,905,552Derivative liabilities (Note 23) 5,177 9,953
Futures 2019 2018(In Thousands)
Notional amount USD23,877 USD−Derivative assets (Note 20) P=− −Derivative liabilities (Note 23) 7,832 −
Interest Rate Swaps 2019 2018(In Thousands)
Notional amount USD20,000 USD20,000Derivative assets (Note 20) P=96,212 P=170,981Derivative liabilities (Note 23) 114,995 136,595
The net movements in fair value changes of all derivative instruments are as follows:
2019 2018(In Thousands)
Balances at beginning of year P=1,929,985 P=1,362,240Net changes in fair value of derivatives Designated as accounting hedges (445,262) 493,768
Not designated as accounting hedges 53,697 28,6851,538,420 1,884,693
Fair value of settled instruments Not designated as accounting hedges (124,041) 45,292Balances at end of year P=1,414,379 P=1,929,985

- 166 -
*SGVFS039395*
Fair value changes of foreign currency forwards and swaps (not designated as accounting hedge) arerecognized as Foreign exchange gain while fair value changes of interest rate swaps are recognized asTrading and securities gain as part of Other income from the financial banking and services.
Derivatives Designated as Accounting HedgesIn 2013, the Parent Company entered into two 7-year cross currency swaps (CCS) with an aggregatenotional amount of USD150.0 million to hedge its foreign currency risk arising from the USD286.5million fixed rate bonds issued by FDCI. The Group applies hedge accounting treatment on thesecross currency swaps after complying with hedge accounting requirements, specifically on hedgedocumentation designation and effectiveness testing.
Under the CCS agreements, the Parent Company receives fixed interest of USD at the rate of 4.3% ofthe USD150.0 million total notional amount and pay fixed interest in Philippine Peso at 6.0% and5.8% of P=2.1 billion and P=4.1 billion, respectively, semi-annually on a 30/360 day count basis. Thenotional amount of the cross-currency swap equals that of the debt, and all cash flows dates andinterest rates coincide between the debt and the CCS.
The maturity date of the CCS contracts coincides with the maturity date of the hedged bonds.
Pertinent details of the CCS are as follows (amounts in millions):
Notional amount Trade date Effective date Maturity date Swap rateUSD100.0 April 3 2013 April 4, 2013 April 2, 2020 40.9
USD50.0 May17, 2013 May 20, 2013 April 2, 2020 41.2
As of December 31, 2019 and 2018, the fair value of the cross currency swaps designated as hedginginstruments amounted to P=1,534.6 million and P=2,076.5 million, respectively, presented as Derivativeassets under Other assets in the consolidated statement of financial position (see Note 20). The netmovement on cash flow hedges amounted to P=107.5 million loss, net of deferred tax of P=46.1 million,P=67.4 million gain, net of deferred tax of P=28.9 million, andP=18.8 million loss, net of deferred tax of P=8.1 million in 2019, 2018 and 2017, respectively, and ispresented in the consolidated statements of comprehensive income.
Hedge Effectiveness ResultsSince the critical terms of the hedged bonds and the CCS match, except for 1 to 2 days timingdifference on the interest dates, the hedges were assessed to be highly effective. As such, theaggregate fair value changes on these CCS amounting to P=46.1 million, P=67.4 million, andP=18.8 million in 2019, 2018 and 2017, respectively, were recognized by the Group under Netmovement on cashflow hedges, net of tax account in the consolidation statements of comprehensiveincome.
No ineffectiveness was recognized in the Group’s consolidated statements of income in 2019, 2018and 2017.

- 167 -
*SGVFS039395*
38. Offsetting of Financial Assets and Financial Liabilities
The amendments to PFRS 7, which is effective January 1, 2013, require the Group to discloseinformation about rights of offset and related arrangements (such as collateral posting requirements)for financial instruments subject to enforceable master netting agreements or similar arrangements.The effects of these arrangements are disclosed in the succeeding tables.Financial Assets
December 31, 2019
Financial assetsrecognized at
end of reportingperiod by type
Gross carryingamounts (before
offsetting)
Gross amountsoffset in
accordance withthe offsetting
criteria
Net amountpresented in the
consolidatedstatements of
financialposition
[a-b]
Effect of remaining rights of set-off(including rights to set off financialcollateral) that do not meet PAS 32
offsetting criteria
Net exposure[c-d]
Financialinstruments
Fair value offinancialcollateral
[a] [b] [c] [d] [e](In Thousands)
Derivative assets (Note 20) P=1,534,551 P=– P=1,534,551 P=– P=– P=1,534,551
December 31, 2018
Financial assetsrecognized at
end of reportingperiod by type
Gross carryingamounts (before
offsetting)
Gross amountsoffset in
accordance withthe offsetting
criteria
Net amountpresented in the
consolidatedstatements of
financialposition
[a-b]
Effect of remaining rights of set-off(including rights to set off financialcollateral) that do not meet PAS 32
offsetting criteria
Net exposure[c-d]
Financialinstruments
Fair value offinancialcollateral
[a] [b] [c] [d] [e](In Thousands)
Derivative assets (Note 20) P=2,076,533 P=– P=2,076,533 P=– P=– P=2,076,533
Financial Liabilities
December 31, 2019
Financial liabilitiesrecognized at
end of reportingperiod by type
Gross carryingamounts (before
offsetting)
Gross amountsoffset in
accordance withthe offsetting
criteria
Net amountpresented in the
consolidatedstatements of
financialposition
[a-b]
Effect of remaining rights of set-off(including rights to set off financialcollateral) that do not meet PAS 32
offsetting criteria
Net exposure[c-d]
Financialinstruments
Fair value offinancialcollateral
[a] [b] [c] [d] [e](In Thousands)
Derivative liabilities (Note 23) P=128,004 P=– P=128,004 P=114,995 P=– P=13,009
December 31, 2018
Financial liabilitiesrecognized at
end of reportingperiod by type
Gross carryingamounts (before
offsetting)
Gross amountsoffset in
accordance withthe offsetting
criteria
Net amountpresented in the
consolidatedstatements of
financialposition
[a-b]
Effect of remaining rights of set-off(including rights to set off financialcollateral) that do not meet PAS 32
offsetting criteria
Net exposure[c-d]
Financialinstruments
Fair value offinancialcollateral
[a] [b] [c] [d] [e](In Thousands)
Derivative liabilities (Note 23) P=146,548 P=– P=146,548 P=– P=– P=146,548
The amounts disclosed in column (d) include those rights to set-off amounts that are only enforceableand exercisable in the event of default, insolvency or bankruptcy. This includes amounts related tofinancial collateral both received and pledged, whether cash or non-cash collateral, excluding theextent of over-collateralization.

- 168 -
*SGVFS039395*
39. Notes to Statement of Cash Flows
Changes in Liabilities Arising from Financing Activities
For the Year Ended December 31, 2019
January 1, 2019 Cashflows
Foreign ExchangeMovement
NoncashMovement
December 31,2019
(In Thousands)Long-term debt P=127,347,516 P=697,118 (P=530,389) P=2,707,020 P=130,221,265Bills and acceptance payable 17,969,926 12,979,827 − − 30,949,753Finance lease obligation 874,521 − − (874,521) −Lease liabilities 7,130,249 (1,118,715) − 873,644 6,885,178Accrued interest 2,061,777 (3,545,427) − 3,033,754 1,550,104Dividends payable 23,974 (1,690,074) 1,690,074 23,974Due to related parties 1,714,064 (516,328) − − 1,197,736Total liabilities from financing activities P=157,122,027 P=6,806,401 (P=530,389) P=7,429,971 P=170,828,010
Noncash movements include the effects of declaration of dividends, amortization of debt issuancecosts, and accretion of lease liabilities (see Notes 24, 25 and 32).
For the Year Ended December 31, 2018
January 1, 2018 Cashflows
Foreign ExchangeMovement
NoncashMovement
December 31,2018
(In Thousands)Long-term debt P=125,816,419 P=674,616 P=782,633 P=73,848 P=127,347,516Bills and acceptance payable 4,159,695 13,810,231 − − 17,969,926Finance lease obligation 874,521 (60,339) − 60,631 874,813Accrued interest 1,499,014 (5,439,399) − 6,002,162 2,061,777Dividends payable 21,036 (1,450,771) − 1,453,709 23,974Due to related parties 1,713,902 162 − − 1,714,064Total liabilities from financing activities P=134,084,587 P=7,534,500 P=782,633 P=7,590,350 P=149,992,070
Noncash movements include the effects of declaration of dividends, amortization of debt issuancecosts, termination of IPPA contract, accretion of liability under finance lease, and offsetting ofamounts receivable from ALGI as a result of the partial rescission against outstanding due to relatedparties (see Notes 24, 25, 26 and 32).
Noncash Transactions Affecting Investing ActivitiesTransfers from loans and receivables to investment properties as a result of foreclosures amounted toP=179.3 million, P=142.5 million and P=170.4 million in 2019, 2018 and 2017, respectively, for EW (seeNote 16). Transfers from loans and receivables to other repossessed assets as a result of foreclosuresamounted to P=3.0 billion, P=1.0 billion and P=2.7 billion in 2019, 2018 and 2017 respectively, for EW.Amounts mentioned are exclusive of loss on asset foreclosure and dacion transactions amounting toP=200.0 million, P=212.9 million and P=236.4 million in 2019, 2018 and 2017, respectively.
Land and land developments previously presented under inventories were reclassified to investmentproperty amounting to P=2.0 billion for FLI (see Note 14). Reclassification from property andequipment to investment properties amounting to P=781.6 million for FLI. Purchases of inventoriesand investment properties which remain unpaid amounted to P=2,894.5 million andP=735.6 million, respectively (see Notes 14 and 16).

- 169 -
*SGVFS039395*
40. Maturity Analysis of Assets and Liabilities
The following tables show an analysis of assets and liabilities analyzed according to whether they areexpected to be recovered or settled within 1 year and beyond 1 year from the statement of financialposition date:
2019 2018Less than
12 months*Over
12 months TotalLess than
12 months**Over
12 months Total(In Thousands)
AssetsCash and other cash items P=52,096,201 P=− P=52,096,201 P=68,121,296 P=− P=68,121,296Loans and receivables - net Real estate operations 5,015,505 108,611 5,124,116 4,098,425 162,916 4,261,341 Hospitality operations 213,490 − 213,490 196,645 − 196,645 Banking and financial services 107,964,043 146,142,901 254,106,944 97,953,032 133,577,885 231,530,917 Power operations 2,045,037 − 2,045,037 1,841,465 − 1,841,465 Sugar operations 108,090 − 108,090 117,871 − 117,871Financial assets at FVPL 16,840,709 − 16,840,709 4,338,794 − 4,338,794Financial assets at FVOCI − 5,323,670 5,323,670 15,069 735,218 750,287Investment securities at amortized cost 392,088 48,993,983 49,386,071 13,896,211 22,614,335 36,510,546Contract assets 7,362,914 7,485,299 14,848,213 5,212,172 6,243,274 11,455,446Real estate inventories 71,363,524 − 71,363,524 79,469,859 − 79,469,859Coal, spare parts and other inventories 710,341 − 710,341 700,582 − 700,582Investment properties - net − 82,571,561 82,571,561 − 69,132,494 69,132,494Property and equipment - net − 43,155,481 43,155,481 − 44,422,852 44,422,852Investment in joint ventures − 1,005,340 1,005,340 − 734,621 734,621Deferred tax assets - net − 3,255,431 3,255,431 − 2,600,752 2,600,752ROU assets − 6,994,539 6,994,539 − − −Goodwill − 10,381,152 10,381,152 − 10,381,152 10,381,152Other assets 11,815,670 10,809,295 22,624,965 12,136,961 11,085,118 23,222,079
P=275,927,612 P=366,227,263 P=642,154,875 P=288,098,382 P=301,690,617 P=589,788,999LiabilitiesDeposit liabilities P=271,270,806 P=13,497,099 P=284,767,905 P=237,797,831 P=29,128,313 P=266,926,144Bills and acceptances payable 30,949,753 − 30,949,753 17,969,927 − 17,969,927Accounts payable and accrued
expenses 24,314,608 16,141,929 40,456,537 28,737,525 11,018,479 39,756,004Contract liabilities 1,174,174 2,294,058 3,468,232 2,922,437 2,768,291 5,690,728Long-term debt 32,345,410 97,875,855 130,221,265 10,283,212 117,064,304 127,347,516Income tax payable 901,755 − 901,755 606,460 − 606,460Retirement liabilities − 1,139,672 1,139,672 − 1,117,076 1,117,076Lease liabilities 1,406,807 5,478,371 6,885,178 − − −Deferred tax liabilities - net − 11,214,592 11,214,592 − 10,684,670 10,684,670
P=362,363,313 P=147,641,576 P=510,004,889 P=298,317,392 P=171,781,133 P=470,098,525*Includes current assets and current liabilities of EW amounting to P=181,322,440 and P=318,702,861 as of December 31, 2019,respectively.**Includes current assets and current liabilities of EW amounting to P=181,780,202 and P=264,947,971 as of December 31, 2018,respectively.
41. Registrations with the PEZA and CSEZ
On February 20, 2017, June 1, 2016, and April 21, 2016, respectively, FCMI, MCI and FMI wereregistered and granted a Permit-to-Operate as a Clark Freeport enterprises in Clark Clark-SubicEconomic Zone (CSEZ). As a registered enterprise, FMI is entitled to a special tax rate of 5% ofgross income and tax exemption and duty-free importation in certain purchases directly related to itsbusiness activities as approved by CDC.

- 170 -
*SGVFS039395*
On December 15, 2015, PDDC was registered with PEZA as an Ecozone Facilities Enterprise. As aregistered enterprise, PDDC is entitled to certain tax and non-tax benefits such as exemption frompayment of national and local taxes and instead a special tax rate of 5% of gross income.FAC, CPI and PDDC are also entitled to zero percent (0%) VAT for sales to ECOZONE enterprises.
On February 13, 2002, FLI, FAC and CPI were registered with PEZA pursuant to the provisions ofthe RA No. 7916 as the Ecozone Developer/Operator to lease, sell, assign, mortgage, transfer orotherwise encumber the area designated as a Special Economic Zone (Ecozone) to be known asFilinvest Technology Park-Calamba.
Under the registration, FLI shall enjoy 5% preferential tax privilege on income generated from theEcozone as opposed to the regular income tax rate.
On June 11, 2001, FAC was registered with PEZA as the developer/operator of PBCom Tower and assuch it will not be entitled to any incentives, however, IT enterprises which shall locate in PBComTower shall be entitled to tax incentives pursuant to RA No. 7916.
On June 6, 2000, CPI was registered with PEZA as an Ecozone Facilities Enterprise. As a registeredenterprise, it is also entitled to certain tax and non-tax benefits such as exemption from payment ofnational and local taxes and instead a special tax rate of 5% of gross income.
42. Registration with the BOI
The Group has registered the following New Developer of Low-Cost Mass Housing Projectswith the BOI under the Omnibus Investments Code of 1987 (Executive Order No. 226) as ofDecember 31, 2019:
Name Reg. No. Date RegisteredStudio A 2016-008 01/08/2016Bali Oasis 2 Banjar 2016-031 02/05/2016Meridian Place 1 2016-030 02/05/2016Anila Park Townhomes 2016-052 03/07/2016Futura Homes San Pedro 2016-053 03/07/2016One Spatial Iloilo 2 2016-243 12/01/2016One Spatial Richmond 2016-244 12/01/2016Futura Homes Mactan 2016-270 12/27/2016One Spatial Victoria 2017-030 01/27/2017Studio 7 2017-031 01/27/20178 Spatial Davao Bldg 1 & 2 2017-047 02/28/20178 Spatial Davao Bldg 3 2017-130 05/23/20178 Spatial Davao Bldg 4 2017-131 05/23/2017Marina Spatial Bldg 1 2017-129 05/23/2017One Oasis CDO 2 2017-184 06/20/2017Ventura Real Ph 01 2017-298 11/08/2017Meridian Place 2 2017-354 12/22/2017Savanna Fields 1 2017-355 12/22/2017Savanna Fields 4A 2017-357 12/27/2017Valle Dulce Ph 2 2017-356 12/27/2017
(Forward)

- 171 -
*SGVFS039395*
Name Reg. No. Date Registered
New Fields 2018-016 01/22/2018Futura Homes Palm Estates Ph 1 2018-156 07/20/2018Futura Homes Zamboanga Ph1A 2018-200 09/24/2018New Leaf 2019-054 03/20/2019Sandia Homes 2 2019-136 07/25/20198 Spatial Davao Bldg 5 2019-182 09/26/2019Marina Spatial Bldg 2 2019-259 12/02/2019
On December 12, 2018, DSRI was registered with BOI as New Operator of Tourist AccommodationFacility under the Omnibus Investment Code of 1987 (Certificate of Registration No. 2013-123).
On September 2, 2014, BSI’s registration was upgraded from Non-Pioneer status to Pioneer status inwhich ITH entitled period wasa increased from 4 years to 6 years starting December 2017 or actualstart of commercial operations, whichever is earlier, but in no case earlier than the date ofregistration.
On August 30, 2013, the Group’s 405 MW Misamis Power Plant was registered as New Operator ofCoal Fired Power Project with the BOI under the Omnibus Investment Code of 1987 (ExecutiveOrder No. 226).
On June 7, 2013, BSI was registered with BOI as New Operator of Tourist Accommodation Facilityunder Modernization Program on a Non-Pioneer status (Certificate of Registration No. 2013-123)under Omnibus Investment Code. Under the terms of the Non-Pioneer status with BOI, BSI isentitled to an income tax holiday (ITH) for a period of 4 years from December 2017 or actual start ofcommercial operations, whichever is earlier than the date of registration.
As a registered enterprise, the Group is entitled to certain tax and nontax incentives, subject to certainconditions.
43. Trust Operations
Securities and other properties held by EW in fiduciary or agency capacity for clients andbeneficiaries are not included in the accompanying consolidated statements of financial position sincethese are not assets of EW. The combined trust and managed funds operated by the Trust Departmentof EW amounted to P=35.0 billion and P=24.9 billion as of December 31, 2019 and 2018, respectively.
Government securities with a total face value of P=355.0 million and P=245.0 million as ofDecember 31, 2019 and 2018, respectively, are deposited with the BSP in compliance with currentbanking regulations related to EW’s trust functions. These government securities are recorded as partof investment securities at amortized costs as of December 31, 2019 and 2018.
In accordance with BSP regulations, 10.0% of the profits realized by EW from its trust operations areappropriated to surplus reserves. The yearly appropriation is required until the surplus reserves fortrust operations amounts to 20.0% of EW’s authorized capital stock.
- 172 -
*SGVFS039395*
EW’s income from its trust operations amounted P=70.5 million, P=51.3 million, and P=46.8 million in2019, 2018 and 2017, respectively (see Note 27).
44. Events After Reporting Period
Redemption of Lower Tier 2 unsecured subordinated notes due 2025On January 4, 2020, EW exercised its redemption option to pre-terminate its P=5,000.0 million LowerTier 2, 5.5% coupon rate, unsecured subordinated notes issued on July 4, 2014 and due 2025.
Issuance of fixed-rate bonds due 2023On February 21, 2020, EW issued P=3,700.0 million fixed rate bonds due 2023. The bonds carry aninterest rate of 4.5% per annum to be paid quarterly for 3 years.

*SGVFS039395*
INDEPENDENT AUDITORS’ REPORTON SUPPLEMENTARY SCHEDULES
The Stockholders and the Board of DirectorsFilinvest Development CorporationThe Beaufort, 5th Avenue corner 23rd StreetBonifacio Global City, Taguig City, Metro Manila
We have audited in accordance with Philippine Standards on Auditing, the consolidated financialstatements of Filinvest Development Corporation and its subsidiaries (the Group), as at December 31,2019 and 2018 and for each of the three years in the period ended December 31, 2019 and have issued ourreport thereon dated February 28, 2020. Our audits were made for the purpose of forming an opinion onthe basic consolidated financial statements taken as a whole. The schedules listed in the Index toConsolidated Financial Statements and Supplementary Schedules are the responsibility of FilinvestDevelopment Corporation’s management. These schedules are presented for purposes of complying withthe Revised Securities Regulation Code Rule 68, and are not part of the basic consolidated financialstatements. These schedules have been subjected to the auditing procedures applied in the audit of thebasic consolidated financial statements and, in our opinion, fairly state in all material respects, thefinancial data required to be set forth therein in relation to the basic consolidated financial statementstaken as a whole.
SYCIP GORRES VELAYO & CO.
Michael C. SabadoPartnerCPA Certificate No. 89336SEC Accreditation No. 0664-AR-4 (Group A), November 11, 2019, valid until November 10, 2022Tax Identification No. 160-302-865BIR Accreditation No. 08-001998-73-2018, February 26, 2018, valid until February 25, 2021PTR No. 8125294, January 7, 2020, Makati City
February 28, 2020
SyCip Gorres Velayo & Co.6760 Ayala Avenue1226 Makati CityPhilippines
Tel: (632) 891 0307Fax: (632) 819 0872ey.com/ph
BOA/PRC Reg. No. 0001, October 4, 2018, valid until August 24, 2021SEC Accreditation No. 0012-FR-5 (Group A),
November 6, 2018, valid until November 5, 2021
A member firm of Ernst & Young Global Limited

*SGVFS039395*
INDEPENDENT AUDITOR’S REPORT ONCOMPONENTS OF FINANCIAL SOUNDNESS INDICATORS
The Stockholders and the Board of DirectorsFilinvest Development CorporationThe Beaufort, 5th Avenue corner 23rd StreetBonifacio Global City, Taguig City, Metro Manila
We have audited in accordance with Philippine Standards on Auditing, the consolidated financialstatements of Filinvest Development Corporation and its subsidiaries (the Group) as atDecember 31, 2019 and 2018 and for each of the three years in the period ended December 31, 2019, andhave issued our report thereon dated February 28, 2020. Our audits were made for the purpose of formingan opinion on the basic consolidated financial statements taken as a whole. The Supplementary Scheduleon Financial Soundness Indicators, including their definitions, formulas, calculation, and theirappropriateness or usefulness to the intended users, are the responsibility of Filinvest DevelopmentCorporation’s management. These financial soundness indicators are not measures of operatingperformance defined by Philippine Financial Reporting Standards (PFRS) and may not be comparable tosimilarly titled measures presented by other companies. This schedule is presented for the purpose ofcomplying with the Revised Securities Regulation Code Rule 68 issued by the Securities and ExchangeCommission, and is not a required part of the basic consolidated financial statements prepared inaccordance with PFRS. The components of these financial soundness indicators have been traced to theGroup’s consolidated financial statements as at December 31, 2019 and 2018, and for each of the threeyears in the period ended December 31, 2019 and no material exceptions were noted.
SYCIP GORRES VELAYO & CO.
Michael C. SabadoPartnerCPA Certificate No. 89336SEC Accreditation No. 0664-AR-4 (Group A), November 11, 2019, valid until November 10, 2022Tax Identification No. 160-302-865BIR Accreditation No. 08-001998-73-2018, February 26, 2018, valid until February 25, 2021PTR No. 8125294, January 7, 2020, Makati City
February 28, 2020
SyCip Gorres Velayo & Co.6760 Ayala Avenue1226 Makati CityPhilippines
Tel: (632) 891 0307Fax: (632) 819 0872ey.com/ph
BOA/PRC Reg. No. 0001, October 4, 2018, valid until August 24, 2021SEC Accreditation No. 0012-FR-5 (Group A),
November 6, 2018, valid until November 5, 2021
A member firm of Ernst & Young Global Limited

FILINVEST DEVELOPMENT CORPORATION AND SUBSIDIARIESINDEX TO CONSOLIDATED FINANCIAL STATEMENTSAND SUPPLEMENTARY SCHEDULES
SUPPLEMENTARY SCHEDULES
Independent Auditor’s Report on Supplementary Schedules
Independent Auditor’s Report on Components of Financial Soundness Indicators
Group Supplementary Information and Disclosures Required on Revised Securities Regulation CodeRule 68
Schedule Contents
A Financial Assets
B Amounts Receivable from Directors, Officers, Employees, Related Parties, andPrincipal Stockholders (Other than Related parties)
C Amounts Receivable from Related Parties which are Eliminated during theConsolidation of Financial Statements
D Long-Term Debt
E Indebtedness to Related Parties
F Guarantees of Securities of Other Issuers
G Capital Stock
H Bond Issuances - Securities Offered to the Public
Annex 68-D - Reconciliation of Retained Earnings Available for Dividend Declaration
Annex 68-E - Financial Soundness Indicators
Map Showing the Relationships Between and Among the Companies in the Group, its Ultimate ParentCompany and Co-subsidiaries

SCHEDULE A
FILINVEST DEVELOPMENT CORPORATION AND SUBSIDIARIESSUPPLEMENTARY SCHEDULE ON FINANCIAL ASSETSDECEMBER 31, 2019
Below is the schedule of financial assets in equity securities of the Group as of December 31, 2019:
Name of Issuing Entity and Associationof Each Issue
Number ofShares/Principal
Amount ofBonds and Notes
Amount Shownin the Statement
of Financial Position
Value Basedon Market
Quotation atEnd of Year
IncomeReceived and
Accrued (In Thousands)
Financial Assets at Fair Value ThroughProfit or Loss
Debt SecuritiesFixed Rate Treasury Notes (FXTN) 9,544,468 P=10,907,618 P=10,907,618 P=241,658Republic of the Philippines (ROP) 3,499,334 3,984,932` 3,984,932 60,066Retail Treasury Bond (RTB) 1,100,376 1,210,197 1,210,197 92,339Treasury Bills 355,000 349,650 349,650 45Saudi Arabian Bonds (KSA) 253,175 315,378 315,378 5,170
Ayala Land, Inc 24,000 22,219 22,219 203Bureau of Treasury 430 403 403 12Republic of Indonesia (INDON) − − − 10,187Petroleos Mexicanos (PEMEX) − − − 4,549Rizal Commercial Banking Corp.
(RCBC) − − − 453Mexican Global Bonds (MEX) − − − 235
Brazilian Government InternationalBond (BRAZIL) − − − 41
Ayala Corporation − − − 5Metrobank − − − 4Aboitiz Equity Ventures − − − 2ROP Warrants − − − −Citibank Manila 73 39,969 39,969 n/a
16,830,366 16,830,366 414,969Equity Securities
LGU Guarantee Corporation 10,212 10,214 10,214 –Victoria Milling Corporation 129 129 129 –
10,343 10,343 –P=16,840,709 P=16,840,709 P=414,969

Name of Issuing Entity and Associationof Each Issue
Number ofShares/Principal
Amount ofBonds and Notes
Amount Shownin the Statement
of Financial Position
Value Basedon Market
Quotation atEnd of Year
IncomeReceived and
Accrued (In Thousands)
Financial assets at Fair Value ThroughOther Comprehensive IncomeEquity Securities
FXTN 2,621,801 P=3,106,518 P=3,106,518 P=50,878RTB 1,366,217 1,544,118 1,544,118 22,150PEMEX − − − 1,792
4,650,636 4,650,636 74,820Quoted
The Palms Country Club 206 271,100 271,100 –Manila Golf 2 152,000 152,000 –Manila Polo Club 1 26,000 26,000 –Sta Elena Properties Inc. 2 11,000 11,000 –
460,100 460,100 –Unquoted −
The Palms Country Club 1,104 170,007 170,007 −H.B. Fuller 1,903,767 19,040 19,040 –Manila Electric Company 1,153,694 8,908 8,908 –Cebu Country Club 1 6,017 6,017 –Alabang Country Club 1 2,200 2,200 –Philippine Long Distance Telephone
Company 26,100 914 914 –Riviera Golf 1 130 130 –Pilipino Telephone Corp. 1,800 8 8 –Others − 5,710 5,710 –
212,934 212,934 –P=5,323,670 P=5,323,670 P=74,820
Investment Securities at Amortized CostROP 17,029,968 P=19,133,101 P=20,974,121 P=567,027INDON 4,632,242 5,801,387 6,394,054 217,798FXTN 4,875,399 4,996,596 5,529,533 254,222Perusahaan Listrik Negara 3,139,370 3,431,027 3,907,932 189,344Pertamina Persero 2,430,480 2,502,375 2,833,415 135,954KSA 2,278,575 2,382,890 2,701,299 83,824SMIC 1,707,412 1,736,451 1,808,884 84,220Qatar Bonds 1,519,050 1,559,696 1,765,247 64,312US Treasury Notes 1,519,050 1,461,194 1,489,856 31,534PEMEX 1,589,939 1,440,345 1,523,253 102,051MEX 1,012,700 923,693 1,091,589 47,860Power Sector Asset and Liabilities
Management 700,485 839,851 870,205 32,576National Power Corporation 448,373 629,696 664,130 25,737Energy Development Corporation 546,858 560,373 572,648 23,737Verizon Communication Inc. 506,350 520,074 545,405 18,432BRAZIL 455,715 406,062 514,657 27,024RTB 509,150 404,125 486,609 29,655Security Bank Corporation 383,256 383,625 384,207 11,148ROP Global Peso Notes 290,330 267,312 353,770 16,459RCBC 8,456 8,463 8,472 245Allowance for expected credit losses − (2,265) − −
P=49,386,071 P=54,419,286 P=1,963,159

SCHEDULE B
FILINVEST DEVELOPMENT CORPORATION AND SUBSIDIARIESSUPPLEMENTARY SCHEDULE OF AMOUNTS RECEIVABLE FROMDIRECTORS, OFFICERS, EMPLOYEES, RELATED PARTIES, ANDPRINCIPAL STOCKHOLDERS (OTHER THAN RELATED PARTIES)DECEMBER 31, 2019
There are no advances to employees with balances above P=1.0 million as of December 31, 2019.

SCHEDULE C
FILINVEST DEVELOPMENT CORPORATION AND SUBSIDIARIESSUPPLEMENTARY SCHEDULE OF AMOUNTS RECEIVABLE FROMRELATED PARTIES WHCH ARE ELIMINATED DURING THECONSOLIDATION OF FINANCIAL STATEMENTSDECEMBER 31, 2019
Below is the schedule of receivables (payables) with related parties which are eliminated in theconsolidated financial statements as of December 31, 2019 (amounts in thousands):
Volume of Transactions Receivable (Payable) Terms
Pacific Sugar Holdings Corporation(PSHC) Share in expenses P=– P=651,772
Non-interest bearingand to be settled
within 1 year
Davao Sugar Central Company, Inc.(DSCC) – 25,702
Non-interest bearingand to be settled
within 1 year
FDC Forex Corporation(FFC) Share in expenses 151,775 187,276
Non-interest bearingand to be settled
within 1 year
Mactan Seascapes Services, Inc.(MSSI)
Share in expensesRental income 286,263 92,281
Non-interest bearingand to be settled
within 1 year
Filinvest Land, Inc. (FLI)Share in expensesDividend income 937,264 19,483
Non-interest bearingand to be settled
within 1 year
Filinvest Hospitality Corporation(FHC) Share in expenses 27,897 5,469
Non-interest bearingand to be settled
within 1 year
Boracay Seascapes, Inc. (BSI) Rental income 37,372 9,475
Non-interest bearingand to be settled
within 1 year
Entrata Hotel Services, Inc. (EHSI) Share in expenses 61 61
Non-interest bearingand to be settled
within 1 year
FDC Utilities, Inc. (FDCUI) Share in expenses 11,963 4,986
Non-interest bearingand to be settled
within 1 year
Corporate Technologies, Inc. (CTI) Share in expenses 1,402 1,402
Non-interest bearingand to be settled
within 1 year
Countrywide Water Services Inc.(CWSI) Share in expenses 2,829 647
Non-interest bearingand to be settled
within 1 year
Festival Supermall Inc. (FSI) Share in expenses – 21
Non-interest bearingand to be settled
within 1 year
Filinvest Alabang, Inc. (FAI)
Share in expensesManagement feeDividend income 285,618 59,845
Non-interest bearingand to be settled
within 1 year except forsale of lots*
Filinvest Development CaymanIslands (FDCI) Forex gain/loss 490,574 (4,039,437)
Non-interest bearingand to be settled
within 1 year
East West Banking Corporation (EW) Share in expenses 31,694 (5,609,459)
Non-interest bearingand to be settled
within 1 year except forloan**
P=2,264,712 (P=8,590,476) * Interest-bearing receivable from sale of lots to FAI with equal quarterly amortizations until December 31, 2022.
** Interest-bearing advances with interest rate per annum equivalent to 7.4% fixed payable monthly.*** Interest-bearing loan with interest rate per annum equivalent to 3.9% fixed payable semi-annually.
Principal is due on March 31, 2020.

Balances atBeginning
of YearAdditions/
ReclassificationsCollections/
ReclassificationBalances at
End of YearPSHC P=751,772 P=– (P=100,000) P=651,772DSCC 8,179 17,523 – 25,702FFC 25,454 161,822 – 187,276MSSI 46,912 286,263 (240,894) 92,281FLI 19,135 943,656 (943,308) 19,483FHC 605,440 29 (600,000) 5,469BSI – 37,372 (27,897) 9,475EHSI – 61 – 61FDCUI 2,332 11,963 (9,309) 4,986CTI – 1,402 – 1,402CWSI – 2,829 (2,182) 647FSI – 21 – 21FAI 64,369 284,967 (289,491) 59,845FDCI (4,530,011) 490,574 − (4,039,437)EW (5,605,308) 31,694 (35,845) (5,609,459)
(P=8,611,726) P=2,270,176 (P=2,248,926) (P=8,590,476)
The intercompany transactions between FDC and the subsidiaries pertain to share in expenses, rentalcharges, dividend income and management fee. There were no amounts written off during the year and allamounts are expected to be settled within the year except for; (a) FAI, which is inclusive of receivablesfrom sale of lots with equal quarterly amortizations until December 31, 2022, and with interest equivalentto 90-day Bloomberg Valuation (BVAL) plus a spread of 1.0% per annum, subject to quarterly repricing;and (b) EW, which pertains to interest-bearing loans with interest rate per annum equivalent to 3.9% fixedpayable semi-annually. Principal is due on March 31, 2020.
Related Party TransactionsDue From Related PartiesBelow is the list of outstanding receivables from related parties of the Group presented in theconsolidated statements of financial position as of December 31, 2019 (amounts in thousands):
Relationship NatureBalances at
End of YearChroma Hospitality, Inc. Joint Venture b P=5,692A.L. Gotianun, Inc. (ALGI) Ultimate Parent a 4,080GCK Realty Corporation Affliate a, c 240The Palms Country Club Affliate a 85Team Gladiola, Inc. Affliate a 2Others 5,547
P=15,646
Nature of Intercompany TransactionsThe nature of the intercompany transactions with the related parties is described below:
(a) Expenses – these pertain to the share of the Group’s related parties in various common sellingand marketing and general and administrative expenses.
(b) Management and marketing fee(c) Reimburseable commission expense
The outstanding balances of intercompany transactions are due and demandable as of December 31, 2019.
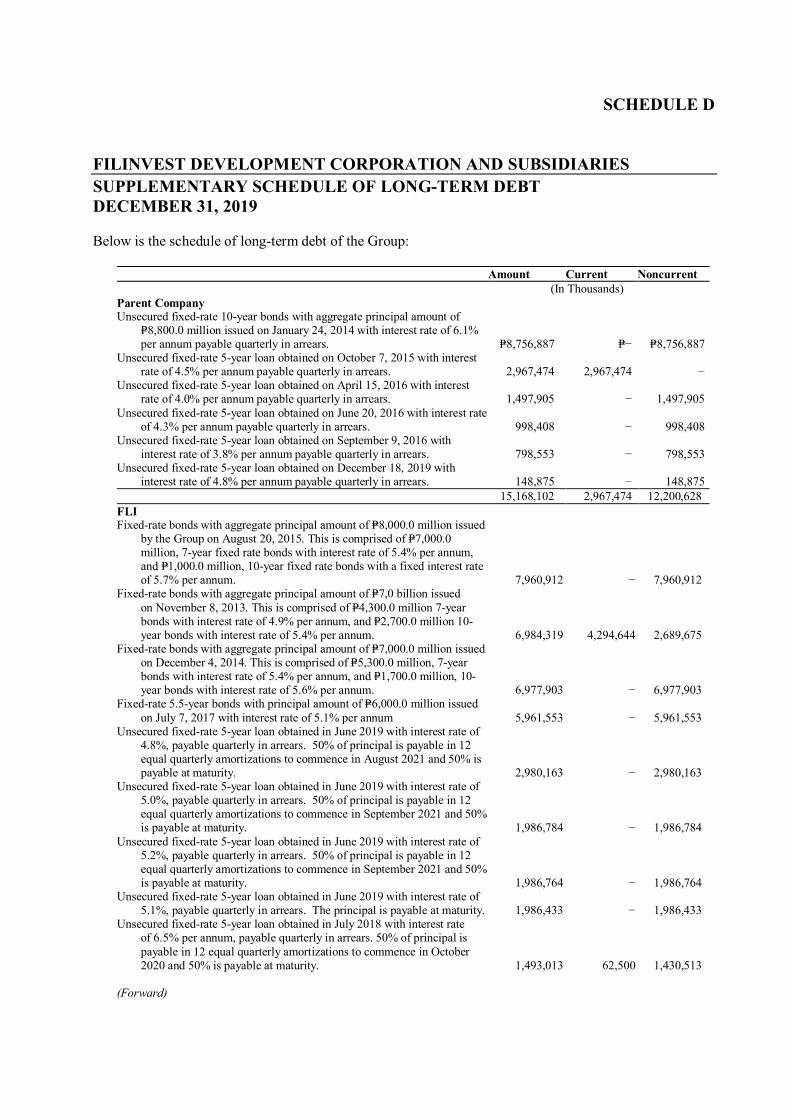
SCHEDULE D
FILINVEST DEVELOPMENT CORPORATION AND SUBSIDIARIESSUPPLEMENTARY SCHEDULE OF LONG-TERM DEBTDECEMBER 31, 2019
Below is the schedule of long-term debt of the Group:
Amount Current Noncurrent (In Thousands)
Parent CompanyUnsecured fixed-rate 10-year bonds with aggregate principal amount of
P=8,800.0 million issued on January 24, 2014 with interest rate of 6.1%per annum payable quarterly in arrears. P=8,756,887 P=− P=8,756,887
Unsecured fixed-rate 5-year loan obtained on October 7, 2015 with interestrate of 4.5% per annum payable quarterly in arrears. 2,967,474 2,967,474 −
Unsecured fixed-rate 5-year loan obtained on April 15, 2016 with interestrate of 4.0% per annum payable quarterly in arrears. 1,497,905 − 1,497,905
Unsecured fixed-rate 5-year loan obtained on June 20, 2016 with interest rateof 4.3% per annum payable quarterly in arrears. 998,408 − 998,408
Unsecured fixed-rate 5-year loan obtained on September 9, 2016 withinterest rate of 3.8% per annum payable quarterly in arrears. 798,553 − 798,553
Unsecured fixed-rate 5-year loan obtained on December 18, 2019 withinterest rate of 4.8% per annum payable quarterly in arrears. 148,875 − 148,875
15,168,102 2,967,474 12,200,628FLIFixed-rate bonds with aggregate principal amount of P=8,000.0 million issued
by the Group on August 20, 2015. This is comprised of P=7,000.0million, 7-year fixed rate bonds with interest rate of 5.4% per annum,and P=1,000.0 million, 10-year fixed rate bonds with a fixed interest rateof 5.7% per annum. 7,960,912 − 7,960,912
Fixed-rate bonds with aggregate principal amount of P=7,0 billion issuedon November 8, 2013. This is comprised of P=4,300.0 million 7-yearbonds with interest rate of 4.9% per annum, and P=2,700.0 million 10-year bonds with interest rate of 5.4% per annum. 6,984,319 4,294,644 2,689,675
Fixed-rate bonds with aggregate principal amount of P=7,000.0 million issuedon December 4, 2014. This is comprised of P=5,300.0 million, 7-yearbonds with interest rate of 5.4% per annum, and P=1,700.0 million, 10-year bonds with interest rate of 5.6% per annum. 6,977,903 − 6,977,903
Fixed-rate 5.5-year bonds with principal amount of P=6,000.0 million issuedon July 7, 2017 with interest rate of 5.1% per annum 5,961,553 − 5,961,553
Unsecured fixed-rate 5-year loan obtained in June 2019 with interest rate of4.8%, payable quarterly in arrears. 50% of principal is payable in 12equal quarterly amortizations to commence in August 2021 and 50% ispayable at maturity. 2,980,163 − 2,980,163
Unsecured fixed-rate 5-year loan obtained in June 2019 with interest rate of5.0%, payable quarterly in arrears. 50% of principal is payable in 12equal quarterly amortizations to commence in September 2021 and 50%is payable at maturity. 1,986,784 − 1,986,784
Unsecured fixed-rate 5-year loan obtained in June 2019 with interest rate of5.2%, payable quarterly in arrears. 50% of principal is payable in 12equal quarterly amortizations to commence in September 2021 and 50%is payable at maturity. 1,986,764 − 1,986,764
Unsecured fixed-rate 5-year loan obtained in June 2019 with interest rate of5.1%, payable quarterly in arrears. The principal is payable at maturity. 1,986,433 − 1,986,433
Unsecured fixed-rate 5-year loan obtained in July 2018 with interest rateof 6.5% per annum, payable quarterly in arrears. 50% of principal ispayable in 12 equal quarterly amortizations to commence in October2020 and 50% is payable at maturity. 1,493,013 62,500 1,430,513
(Forward)

Amount Current Noncurrent (In Thousands)
Unsecured fixed-rate 5-year loan obtained in June 2018 with interest rateof 6.2% per annum. The principal is payable at maturity. P=1,491,858 P=− P=1,491,858
Unsecured fixed-rate 7-year loan obtained in October 2016 with interest rateof 4.2% per annum, payable quarterly in arrears. The 50% of principalis payable in 20 equal quarterly amortizations to commence in January2019 and 50% is payable at maturity. 1,169,282 130,000 1,039,282
Unsecured fixed-rate 5-year loan obtained in November 2019 with interestrate equal to 5.0% per annum, payable quarterly in arrears. Theprincipal is payable at maturity. 1,000,000 − 1,000,000
Unsecured fixed-rate 5-year loan obtained in February 2015 with interest rateof 5.0% per annum, repriceable at the end of 3rd year, payable quarterlyin arrears. The principal is payable at maturity. 999,905 999,905 −
Unsecured fixed-rate 5-year loan obtained in May 2016 with interest rateof 4.3% per annum, payable quarterly in arrears. The principal ispayable at maturity. 998,526 − 998,526
Unsecured fixed-rate 5-year loan obtained in June 2016 with interest rateof 3.9% per annum, payable quarterly in arrears. The principal ispayable at maturity. 998,432 − 998,432
Unsecured fixed-rate 5-year loan obtained in October 2016 with interest rateof 4.3% per annum, payable quarterly in arrears. The principal ispayable at maturity. 998,102 − 998,102
Unsecured fixed-rate 5-year loan obtained in September 2019 with interestrate equal to 5.3% per annum, payable quarterly in arrears. Theprincipal is payable at maturity. 992,855 − 992,855
Unsecured fixed-rate 5-year loan obtained in September 2019 with interestrate equal to 5.1% per annum, payable quarterly in arrears. Theprincipal is payable at maturity. 992,885 − 992,885
Unsecured fixed-rate 5-year loan obtained in June 2017 with interest rateof 5.1% per annum, payable quarterly in arrears. The 3% principal ispayable in 3 annual amortizations to commence in June 2019 and 97%is payable at maturity. 987,406 10,000 977,406
Unsecured fixed-rate 5-year loan obtained in September 2016 with interestrate of 3.9% per annum, payable quarterly in arrears. The 50% ofprincipal is payable in 12 equal quarterly amortizations to commence inDecember 2018 and 50% is payable at maturity. 632,222 133,333 498,888
Unsecured fixed-rate 7-year loan obtained in October 2016 with interest rateof 4.5% per annum, payable quarterly in arrears. The 50% of principalis payable in 20 equal quarterly amortizations to commence in January2019 and 50% is payable at maturity. 629,687 70,000 559,687
Unsecured fixed-rate 5-year loan obtained in September 2015 with interestrate of 4.7% per annum, payable quarterly in arrears. The principal ispayable at maturity. 600,000 600,000 −
Unsecured fixed-rate 7-year loan obtained in August 2013 with interest rateof 4.2% per annum, payable quarterly in arrears. The 50% of principalis payable in 20 equal quarterly installments starting November 2015and the remaining 50% is payable. 574,685 574,685 −
Unsecured fixed-rate 5-year loan obtained in October 2019 with interest rateequal to 5.2% per annum, payable quarterly in arrears. The 50%principal is payable in 12 equal installments starting January 2022 andthe reamining 50% balance is payable at maturity. 500,000 − 500,000
Unsecured 5-year loan obtained in June 2019 with interest rate equal to 91-day BVAL plus margins, payable quarterly in arrears. The 50%principal is payable in 12 equal quarterly amortizations to commence onSeptember 2021 and 50% payable at maturity. 500,000 − 500,000
Unsecured fixed-rate 7-year loan obtained in November 2016 with interestrate of 5.2% per annum, payable quarterly in arrears. The 50% ofprincipal is payable in 16 equal quarterly amortizations to commence inFebruary 2020 and 50% is payable at maturity. 499,780 62,500 437,280
(Forward)

Amount Current Noncurrent (In Thousands)
Unsecured fixed-rate 5-year loan obtained in December 2016 with interestrate of 4.9% per annum, payable quarterly in arrears. The principal ispayable at maturity. P=498,929 P=− P=498,929
Unsecured fixed-rate 7-year loan obtained in June 2017 with interest rateof 5.8% per annum, payable quarterly in arrears. The 50% of principalis payable in 15 equal quarterly amortizations to commence inSeptember 2020 and 50% is payable at maturity. 498,463 33,333 465,130
Unsecured fixed-rate 5-year loan obtained in June 2018 with interest rateof 6.4% per annum. 6% of the principal balance is payable at 12 equalquarterly amortization to commence in September 2020 and 94% ispayable maturity. 497,438 5,000 492,438
Unsecured loan obtained in August 2019 with interest rate equal to 91 dayBVAL payable quarterly in arrears. The principal is payable uponmaturity on August 2020. 496,546 496,546 −
Unsecured fixed-rate 5-year loan obtained in October 2019 with interest rateequal to 5.0% per annum, payable quarterly in arrears. The principal ispayable at maturity. 496,374 − 496,374
Unsecured fixed-rate 7-year loan obtained in July 2014 with interest rateof 4.9% per annum, payable quarterly in arrears. The 50% of principalis payable in 20 equal quarterly amortizations to commence in October2016 and 50% is payable at maturity. 472,500 70,000 402,500
Unsecured fixed-rate 5-year loan obtained in March 2017 with interest rateof 5.0% per annum. The 50% principal is payable in 12 equalamortization to commence in June 2019 and 50% is payable at maturity. 436,375 83,333 353,042
Unsecured fixed-rate 5-year loan obtained in February 2015 with interest rateof 4.7% per annum, payable quarterly in arrears. The 20% of principalis payable in 4 equal annual amortizations to commence in February2016, and 80% is payable at maturity. 425,000 425,000 −
Unsecured fixed-rate 7-year loan obtained in July 2014 with interest rateof 4.9% per annum, payable quarterly in arrears. The 50% of principalis payable in 20 equal quarterly amortizations to commence in October2016 and 50% is payable at maturity. 405,000 60,000 345,000
Unsecured fixed-rate 7-year loan obtained in December 2013 with interestrate of 4.6% per annum, payable quarterly in arrears. The 50% ofprincipal is payable in 20 equal quarterly amortizations to commence inDecember 2015 and 50% is payable at maturity. 402,500 402,500 −
Unsecured fixed-rate 7-year loan obtained in November 2016 with interestrate of 4.8% per annum, payable quarterly in arrears. The 50% ofprincipal is payable in 16 equal quarterly amortizations to commence inFebruary 2020 and 50% is payable at maturity. 400,000 50,000 350,000
Unsecured fixed-rate 5-year loan obtained in December 2017 with interestrate of 5.5% per annum. The 50% of principal balance is payable in 12equal quarterly amortizations to commence in March 2020 and 50% ispayable at maturity. 398,800 66,667 332,133
Unsecured fixed-rate 5-year loan obtained in June 2016 with interest rateof 3.9% per annum, payable quarterly in arrears. The 50% of principalis payable in 12 equal installments starting September 2018 and theremaining 50% balance is payable at maturity. 375,000 83,333 291,667
Unsecured fixed-rate 5-year loan obtained in February 2015 with interest rateof 4.7% per annum, payable quarterly in arrears. The 20% of principalis payable in 4 equal annual amortizations to commence in February2016, and 80% is payable at maturity. 374,831 374,831 −
Unsecured loan obtained in October 2013 with interest rate equal to 91-dayBVAL plus margins, plus GRT, payable quarterly in arrears. The 50%of principal is payable in 19 equal quarterly amortizations to commencein January 2016 and 50% is payable at maturity. 318,241 318,241 −
(Forward)

Amount Current Noncurrent (In Thousands)
Unsecured fixed-rate loan obtained in September 2015 with interest rate of4.5% per annum. The 50% of principal balance is payable in 12 equalquarterly amortizations to commence in December 2017 and 50% ispayable at maturity in September 2020. P=312,500 P=312,500 P=−
Unsecured fixed-rate 5-year loan obtained in December 2019 with interestrate equal to 5.1% per annum, payable quarterly in arrears. The 50%principal is payable in 12 equal installments starting March 2022 andthe reamining 50% balance is payableat maturity. 300,000 − 300,000
Unsecured fixed-rate 5-year loan obtained in September 2019 with interestrate of 5.2% per annum, payable quarterly in arrears. The 50%principal is payable in 12 equal installments starting December 2021and the reamining 50% is payable at maturity. 300,000 − 300,000
Unsecured fixed-rate 5-year loan obtained in May 2015 with interest rateof 4.5% per annum, payable quarterly in arrears. The 50% of principalpayable in 12 equal quarterly amortizations to commence in August2017 and 50% is payable at maturity. 291,667 291,667 −
Unsecured fixed-rate 5-year loan obtained in April 2015 with interest rateof 4.1% per annum, payable quarterly in arrears. The 50% of principalis payable in 12 equal quarterly amortizations to commence in July2017 and 50% is payable at maturity. 291,566 291,566 −
Unsecured fixed-rate 5-year loan obtained in May 2016 with interest rateof 4.4% per annum. The 50% of principal is payable in 12 equalamortization to commence in August 2018 and 50% is payable atmaturity. 299,467 66,667 232,800
Unsecured fixed-rate 7-year loan obtained in August 2013 with interest rateof 4.2% per annum, payable quarterly in arrears. The 50% balance ofprincipal is payable in 20 equal quarterly installments startingNovember 2015 and the remaining 50% balance is payable. 287,500 287,500 −
Unsecured fixed-rate 5-year loan obtained in July 2016 with interest rateof 3.8% per annum, payable quarterly in arrears. The 50% of principalis payable in 12 equal quarterly amortization to commence in October2018 and 50% is payable at maturity. 277,083 58,333 218,750
Unsecured fixed-rate 5-year loan obtained in March 2017 with interest rateof 4.9% per annum. The 50% of principal balance is payable in 12equal quarterly amortization to commence in June 2019 and 50% ispayable at maturity in March 2022. 218,207 41,417 176,790
Unsecured fixed-rate 7-year loan obtained in December 2016 with interestrate of 5.4% per annum, payable quarterly in arrears. The 50% principalis payable in 16 equal amortizations to commence in March 2020 and50% is payable at maturity. 199,476 25,000 174,476
Unsecured fixed-rate 5-year loan obtained in May 2015 with interest rateof 4.5%per annum, payable quarterly in arrears. The 50% of principal ispayable in 12 equal quarterly amortizations to commence in August2017 and 50% is payable at maturity. 175,000 175,000 −
Unsecured fixed-rate 5-year loan obtained in July 2017 with interest rateof 4.9% per annum. The 50% of principal is payable in 12 equalquarterly amortization to commence in October 2019 and 50% ispayable at maturity. 167,271 28,992 138,279
Unsecured fixed-rate 7-year loan obtained in March 2016 with interest rateof 5.7% per annum. The 50% of principal balance is payable in 20 equalquarterly amortizations to commence in June 2018 and 50% is payableat maturity. 164,547 19,857 144,690
Unsecured 5-year loan obtained in January 2015 with interest rate of 5.0%per annum, payable quarterly in arrears. The 50% of principal ispayable in 12 equal quarterly amortizations to commence in January2017 and 50% is payable at maturity. 150,000 150,000 −
(Forward)

Amount Current Noncurrent (In Thousands)
Unsecured fixed-rate 5-year loan obtained in December 2016 with interestrate of 4.9% per annum, payable quarterly in arrears. The principal ispayable at maturity. P=149,683 P=− P=149,683
Unsecured fixed-rate 5-year loan obtained in February 2016 with interest rateof 5.1% per annum. The 50% of principal balance is payable in 12 equalquarterly amortizations to commence in May 2018 and 50% is payableat maturity. 141,450 33,333 108,117
Unsecured fixed-rate 5-year loan obtained in February 2017 with interest rateof 4.7% per annum. The 50% of principal is payable in 12 equalquarterly amortization to commence in May 2019 and 50% is payable atmaturity. 87,292 16,567 70,725
Unsecured fixed-rate 5-year loan obtained in April 2015 with interest rateof 4.3% per annum, payable quarterly in arrears. The 50% of principalis payable in 11 equal quarterly installments starting June 2017 andremaining 50% is payable at maturity. 78,788 78,788 −
Unsecured fixed-rate 5-year loan obtained in September 2016 with interestrate of 3.8% per annum. The 50% of principal is payable in 12 equalquarterly amortization to commence in December 2018 and 50% ispayable at maturity. 59,250 12,425 46,825
Unsecured fixed-rate 5-year loan obtained in May 2015 with interest rateof 4.5% per annum, payable quarterly in arrears. The 50% of principalis payable in 12 equal quarterly amortizations to commence in May2017 and 50% is payable at maturity. 51,458 51,458 −
Unsecured fixed-rate 5-year loan obtained in August 2015 with interest rateof 5.1% per annum. The 50% of principal is payable in 12 equalquarterly amortizations to commence in November 2017 and 50% ispayable at maturity. 31,250 31,250 −
63,412,921 11,378,671 52,034,249FAIUnsecured fixed-rate 5-year loan granted on August 3, 2015 with interest
rate of 5.0% per annum, payable quarterly in arrears. 850,000 850,000 −Unsecured 5-year loan granted on January 22, 2018 with interest rate
equivalent to BVAL plus a spread of 1.0% per annum payable quarterlyin arrears. The 50% of pincipal is payable in equal quarterlyamortizations to commence at the end of the 2-year grace period and50% is payable at maturity. 600,000 81,818 518,182
Unsecured fixed-rate 5-year loan granted on June 29, 2017 with interest rateof 5.0% per annum, payable quarterly in arrears. The 50% of principalis payable in equal quarterly amortizations to commence at the end ofthe 2-year grace period and 50% is payable at maturity. 545,454 109,091 436,363
Unsecured fixed-rate 7-year loan obtained on August 23, 2017 with interestrate equivalent to BVAL rate plus a spread of 1.0% per annum payableafter 2-year grace period from date of initial borrowing. The 4% ofprincipal is payable in equal annual amortizations to commence at theend of the 2nd year and 96% is payable at maturity. 400,000 4,000 396,000
Unsecured fixed-rate 5-year loan granted on July 28, 2016 with interest rateof 3.8% per annum, payable quarterly in arrears. The 50% of principalis payable in equal quarterly amortizations to commence at the end ofthe 2-year grace period and 50% is payable at maturity. 356,250 75,000 281,250
Unsecured fixed-rate 5-year loan granted on September 28, 2015 withinterest rate of 4.5% per annum, payable quarterly in arrears. The 50%of principal is payable in equal quarterly amortizations to commence atthe end of 2-year grace period and 50% is payable at maturity. 312,500 312,500 −
Unsecured fixed-rate 5-year loan granted on June 28, 2016 with interest rateof 3.9% per annum payable quarterly in arrears. 50% of the loan ispayable in equal quarterly amortizations to commence at the end of thesecond year and 50% is payable at maturity. 300,000 66,667 233,333
(Foward)

Amount Current Noncurrent (In Thousands)
Unsecured fixed-rate 7-year loan granted on September 5, 2013 with interestrate of 4.8%, payable quarterly in arrears. The 50% of principal ispayable in 20 equal quarterly amortizations and 50% is payable atmaturity. P=287,500 P=287,500 P=−
Unsecured fixed-rate 5-year loan granted on February 18, 2016 with interestrate of 4.6% per annum, payable quarterly in arrears. The 50% ofprincipal is payable in equal quarterly amortizations to commence at theend of the second year and 50% is payable at maturity. 212,500 50,000 162,500
Unsecured fixed-rate 5-year loan granted on March 3, 2015 with interest rateof 4.3% per annum, repriceable at the end of the 3rd year. 50% ispayable in equal quarterly amortizations to commence at the end of the2-year grace period and 50% is payable at maturity. 100,000 100,000 −
3,964,204 1,936,576 2,027,628FHCUnsecured fixed-rate 12-year loan granted on December 27, 2016 with
interest rate of 5.5% per annum, repriceable at the end of 7th year. The50% is payable in 36 equal quarterly amortization to start on the 13th
quarter from initial drawdown and 50% is payable at maturity. 995,993 55,556 940,437Unsecured fixed-rate 12-year loans amounting to P=160.0 million, P=60.0
million, P=270.0 million, and P=165.0 million granted on June 26, 2016,July 21, 2016, August 24, 2016, and December 14, 2016, respectively,with interest rates of 4.2%, 4.2%, 4.1%, and 5.4% per annum,repriceable at the end of 5th year, in the same order as above. The 50%is payable in 36 equal quarterly amortization to start on the 13th quarterfrom initial drawdown and 50% is payable at maturity. 634,525 36,079 598,446
Unsecured fixed-rate 8 year 6 months loan granted on December 23, 2019with interest rate of 4.9% per annum, repreciable at the end of the 5th
year. 50% of the principal shall be payable in 36 equal quarterlypayments starting September 28, 2019 and remaining 50% payable atmaturity. 587,530 33,221 554,309
Unsecured fixed-rate 12-year loan granted on December 20,2019, withinterest rate of 4.9% per annum, repriceable at the end of 5th year,payable quarterly in arrears. 50% is payable in 36 equal quarterlyamortization to commence on March 20, 2023 and remaining balance ispayable at maturity. 516,112 − 516,112
Unsecured fixed-rate 7-year loan availed on August 31, 2017 with interestrate of 5.3% per annum. The 50% is payable in 16 equal quarterlyamortization to start at the end of the 13th quarter from initial drawdownand 50% is payable at maturity. 398,544 16,667 381,877
Unsecured fixed-rate 12-year loan granted on August 9, 2017 with interestrate of 5.5% per annum, repriceable at the end of the 5th year, payablequarterly in arrears. The 50% is payable in 36 equal quarterlyamortization to start on the 13th quarter from initial drawdown and 50%is payable at maturity. 387,361 22,019 365,342
Unsecured fixed-rate 12-year loan granted on March 27, 2017 with interestrate of 5.1% per annum, repriceable at the end of 5th year, payablequarterly in arrears. 50% is payable in 36 equal quarterly amortizationto start on the 13th quarter from initial drawdown and 50% is payable atmaturity. 325,431 18,501 306,930
Unsecured fixed-rate 12-year loan granted on September 5, 2018 withinterest rate of 6.8% per annum, repriceable at the end of 5th year,payable quarterly in arrears. The 50% of principal payable in 36 equalquarterly amortization to commence at the end of 13th quarter from theinitial drawdown date and 50% is payable at maturity. 298,053 − 298,053
Unsecured fixed-rate 12-year loan granted on September 26, 2017 withinterest rate of 5.2% per annum, repriceable at the end of 7th year,payable quarterly in arrears. The 50% of the principal is payable in 36equal quarterly amortization to start on the 13th quarter from initialdrawdown date and 50% is payable at maturity. 298,470 9,375 289,095
(Forward)

Amount Current Noncurrent (In Thousands)
Unsecured 5-year fixed-rate loan granted on September 17, 2019 withinterest rate of 5.5% per annum, payable quarterly in arrears. Principalis payable at maturity. P=297,886 P=− P=297,886
Unsecured fixed-rate 7-year loan granted on September 26, 2017 withinterest rate of 5.1% per annum for the first 2 years and 5.4% from thebeginning of third year until maturity. The 50% is payable in 16 equalquarterly amortization to start at the end of the 13th quarter from initialdrawdown and 50% is payable at maturity. 290,524 16,514 274,010
Unsecured 12-year loan granted on December 13, 2017 with interest rate of5.6% per annum, fixed for 5 years repriceable at the end of 5th year.The 50% is payable in 36 equal quarterly amortization and 50% ispayable at maturity. 290,482 16,510 273,972
Unsecured fixed-rate 10-year loan granted on July 17, 2018 with interest rateof 7.1% per annum, fixed for 5 years repriceable at the end of 5th year,payable quarterly in arrears. The 50% is payable in 28 equal quarterlyamortization to start at the end of 13th quarter and 50% is payable atmaturity. 198,708 − 198,708
Unsecured fixed-rate 10 years and 2 months loan granted on April 24, 2018with interest rate of 6.4% per annum, repriceable at the end of 5th year,payable quarterly in arrears. The 50% is payable in 36 equal quarterlyamortization and 50% is payable at maturity. 193,211 10,950 182,261
Unsecured fixed-rate 12-year loan granted on December 27, 2016 withinterest rate of 5.4% per annum, repriceable at the end of the 7th year,payable quarterly in arrears. The 50% is payable in 36 equal quarterlyamortization to start on the 13th quarter from initial drawdown and 50%is payable at maturity. 179,376 10,000 169,376
5,892,206 245,392 5,646,814EWLower Tier 2 subordinated notes issued on July 4, 2014 with interest rate of
5.5% per annum. 4,979,340 − 4,979,340Lower Tier 2 subordinated notes issued on February 20, 2017 with interest
rate of 5.5% per annum. 1,239,671 − 1,239,6716,219,011 − 6,219,011
FDCUIUnsecured fixed-rate 7-year loans amounting to P=934 million, P=1,727
million, P=1,891 million, P=1,595 million, P=1,351 million, P=483 million,P=158 million, P=519 million and P=343 million granted on September 26,2014, December 1, 2014, March 2, 2015, June 1, 2015, September 1,2015, December 1, 2015, March 1, 2016, July 1, 2016 and October 3,2016, respectively. 8,230,703 445,691 7,785,012
Unsecured fixed-rate 7-year loans amounting to P=643 million, P=1,190million, P=1,303 million, P=1,099 million, P=931 million, P=332 million,P=109 million, P=357 million, and P=236 million granted on September 26,2014, December 1, 2014, March 2, 2015, June 1, 2015, September 1,2015, December 1, 2015, March 1, 2016, July 1, 2016 and October 3,2016, respectively. 5,670,037 307,031 5,363,006
Unsecured fixed-rate 7-year loans amounting to P=2,500 million, P=1,250million, P=250 million, P=250 million, and P=750 million granted onAugust 12, 2015, December 1, 2015, March 1, 2016, July 1, 2016 andOctober 3, 2016, respectively. 4,571,609 247,452 4,324,157
Unsecured fixed-rate 7-year loans amounting to P=480 million,P=720 millionand P=1,200 million granted on March 18, 2016, July 1, 2016 andOctober 3, 2016, respectively. 2,194,060 118,711 2,075,349
20,666,409 1,118,885 19,547,524
(Forward)

Amount Current Noncurrent (In Thousands)
PSHCUnsecured fixed-rate 5-year term loan granted on September 28, 2016
with interest rate of 4.6% per annum, payable quarterly in arrears.Principal is payable in 12 equal amortizations 400,000 200,000 200,000
FDCIFixed-rate 7-year bonds with principal amount of USD286.5 million issued
on April 2, 2013 with interest rate of 4.3% per annum. 14,498,412 14,498,412 −P=130,221,265 P=32,345,410 P=97,875,855
Amounts are presented net of unamortized deferred costs.
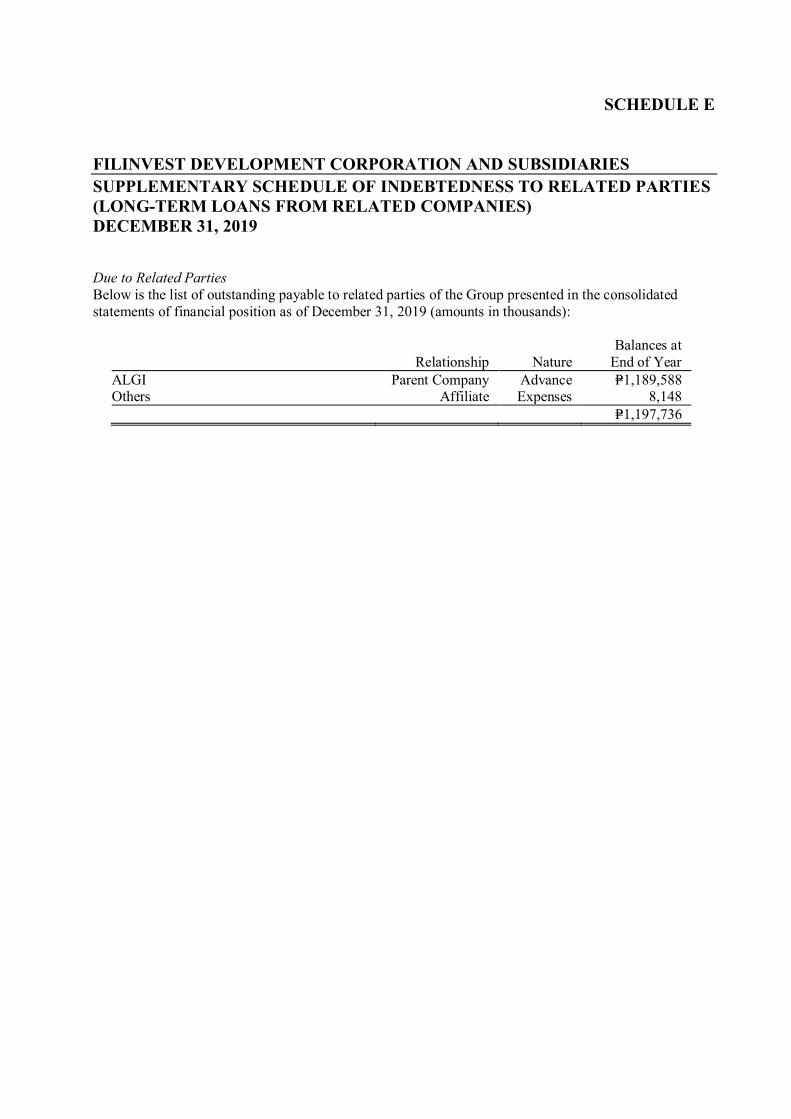
SCHEDULE E
FILINVEST DEVELOPMENT CORPORATION AND SUBSIDIARIESSUPPLEMENTARY SCHEDULE OF INDEBTEDNESS TO RELATED PARTIES(LONG-TERM LOANS FROM RELATED COMPANIES)DECEMBER 31, 2019
Due to Related PartiesBelow is the list of outstanding payable to related parties of the Group presented in the consolidatedstatements of financial position as of December 31, 2019 (amounts in thousands):
Relationship NatureBalances at
End of YearALGI Parent Company Advance P=1,189,588Others Affiliate Expenses 8,148
P=1,197,736

SCHEDULE F
FILINVEST DEVELOPMENT CORPORATION AND SUBSIDIARIESSUPPLEMENTARY SCHEDULE OF GUARANTEES OF SECURITIES OFOTHER ISSUERSDECEMBER 31, 2019
The Group does not have guarantees of securities of other issuers as of December 31, 2019.

SCHEDULE G
FILINVEST DEVELOPMENT CORPORATION AND SUBSIDIARIESSUPPLEMENTARY SCHEDULE OF CAPITAL STOCKDECEMBER 31, 2019
Title of Issue
Number ofShares
Authorized
Number ofShares Issued
andOutstanding
as ShownUnder RelatedBalance Sheet
Caption
Number ofShares
Reserved forOptions,
Warrants,Conversion
and OtherRights
Number ofShares Held
by RelatedParties
Directors,Officers andEmployees Others
(In Thousands)Common Shares 15,000,000 8,648,463 − 7,653,635 69,746 925,082Preferred Shares 2,000,0000 − − − − −

SCHEDULE H
FILINVEST DEVELOPMENT CORPORATION AND SUBSIDIARIESSUPPLEMENTARY SCHEDULE OF BOND ISSUANCES – SECURITIESOFFERED TO THE PUBLICDECEMBER 31, 2019
On January 24, 2014, FDC issued and listed P=8,800.0 million unsecured fixed-rate peso retail bonds due2024 with annual coupon rate of 6.1458%. Interest is payable quarterly in arrears startingApril 24, 2014.
I. ProceedsGross proceeds P=8,800.0Net proceeds 8,754.9
II. UtilizationRefinancing of debt obligations 4,877.1Capital expenditures for:
Hotel projectsPower project
321.53,556.3
III. Balance as of December 31, 2019 P=−

FILINVEST DEVELOPMENT CORPORATION AND SUBSIDIARIESANNEX 68-D - RECONCILIATION OF RETAINED EARNINGS AVAILABLEFOR DIVIDEND DECLARATIONDECEMBER 31, 2019
Items Amount
Unappropriated Retained Earnings, Beginning P=69,979,249
Adjustments:Equity in net income of subsidiaries, associate and joint ventures (58,991,117)Unrealized mark-to-market gain on derivative assets (46,331)Deferred tax assets recognized in prior years (291,516)Effect of adoption of new accounting standards 163,086
Unappropriated Retained Earnings, as Adjusted, Beginning 10,813,371
Net Income Based on the Face of AFS 11,970,302
Less: Non-actual/Unrealized Income Net of TaxEquity in net income of subsidiaries, associate and joint ventures (10,730,632)Fair value adjustments (M2M gains) −Deferred income tax assets that reduced the amount of provision for
income tax −
Add: Non-actual LossesDeferred income tax liabilities that increased the amount of provision for
income tax −Net Income Actual/Realized 1,239,670
Less:Dividend declarations during the period (864,846)Appropriations during the year −Treasury shares (3,614,474)
TOTAL RETAINED EARNINGS, END AVAILABLE FOR DIVIDENDDECLARATION P=7,573,721

FILINVEST DEVELOPMENT CORPORATIONANNEX 68-E - COMPONENTS OF FINANCIAL SOUNDNESS INDIDCATORSDECEMBER 31, 2019Below are the financial ratios that are relevant to the Group as of and for the years endedDecember 31, 2019 and 2018.
As of and For The YearEnded December 31, 2019
As of and For The YearEnded December 31, 2018Performance Indicators
Earnings Per Share (EPS)
Net Income Attributable toEquity Holders
Weighted Average Number ofOutstanding Shares 1.384 /share 1.130 /share
Price Earnings Ratio
Closing Price (1)
EPS 9.39 Times 10.46 Times
Return on Revenues
Net IncomeTotal Revenues and Other Income 19% 18%
Return on Equity (average)
Net IncomeAverage Equity 13% 12%
Long-term Debt to Equity Ratio
Long-term DebtTotal Stockholders’ Equity 0.99 : 1 1.06 : 1
Total Liabilities to Equity Ratio
Total Liabilities (2)
Total Stockholders’ Equity 1.41 : 1 1.54 : 1
Earnings Before Interest, Taxes, Depreciation andAmortization (EBITDA) to Total Interest Expense
EBITDATotal Interest Expense (3) 6.98 Times 6.94 Times
Current Ratio
a. Including EWCurrent Assets
Current Liabilities 0.76 :1 0.97 :1
b. Excluding EWCurrent Assets
Current Liabilities 2.17 :1 3.19 :1
Quick Ratio - Excluding EW
Current Asset - InventoriesCurrent Liabilities 0.52 :1 0.78 :1
Asset to Equity Ratio
Total AssetsTotal Equity 4.86 :1 4.93 :1
(1) Closing prices at December 27, 2019 and December 28, 2018.(2) Excluding deposit liabilities, bills and acceptances payable, asset retirement obligation and finance lease liabilities.(3) Excluding accretion expense on liability on IPPA contract and financial liability on lease contract
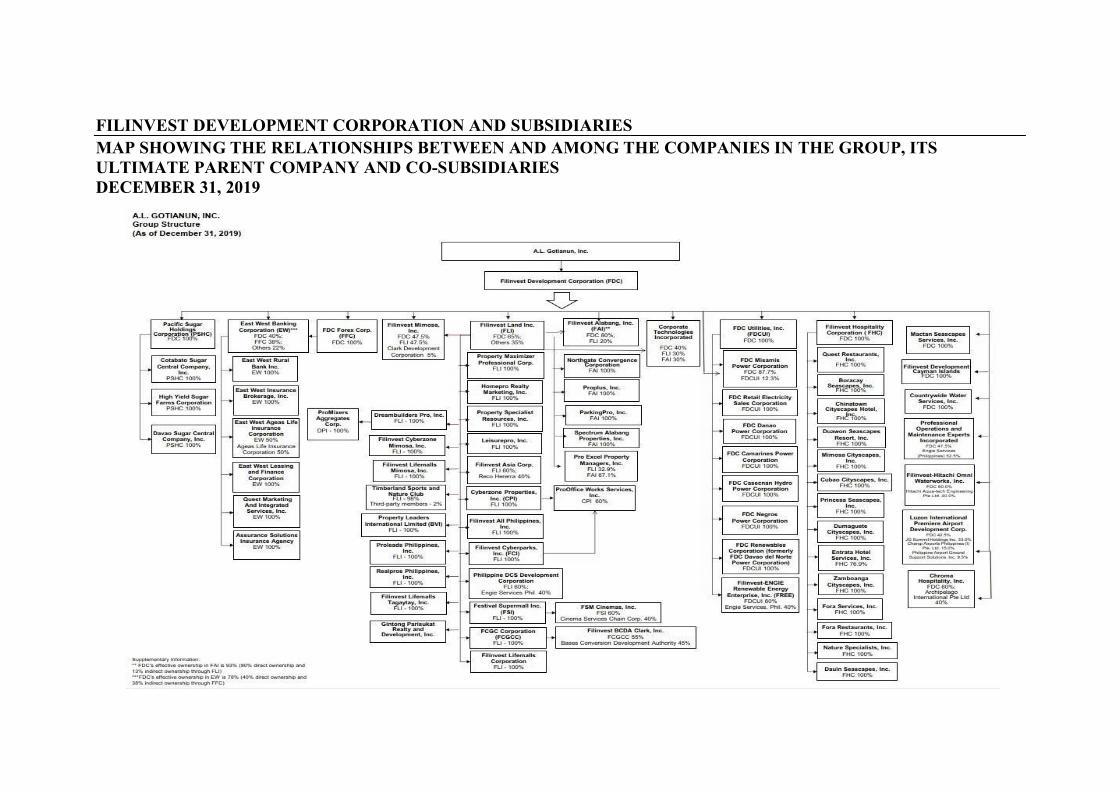
FILINVEST DEVELOPMENT CORPORATION AND SUBSIDIARIESMAP SHOWING THE RELATIONSHIPS BETWEEN AND AMONG THE COMPANIES IN THE GROUP, ITSULTIMATE PARENT COMPANY AND CO-SUBSIDIARIESDECEMBER 31, 2019