ANNEX A - Filinvest Development Corporation
380
1 C O V E R S H E E T SEC Registration Number 5 1 0 4 8 C O M P A N Y N A M E F I L I N V E S T D E V E L O P M E N T C O R P O R A T I O N A N D S U B S I D I A R I E S PRINCIPAL OFFICE ( No. / Street / Barangay / City / Town / Province ) T H E B E A U F O R T , 5 T H A V E N U E C O R N E R 2 3 R D S T R E E T , B O N I F A C I O G L O B A L C I T Y , T A G U I G C I T Y , M E T R O M A N I L A Form Type Department requiring the report Secondary License Type, If Applicable 1 7 - A S E C N A C O M P A N Y I N F O R M A T I O N Company’s Email Address Company’s Telephone Number Mobile Number www.filinvestgroup.com 7798-3977 No. of Stockholders Annual Meeting (Month / Day) Fiscal Year (Month / Day) 4,035 Excluding Treasury) Every Last Friday of April Each Year 12/31 CONTACT PERSON INFORMATION The designated contact person MUST be an Officer of the Corporation Name of Contact Person Email Address Telephone Number/s Mobile Number Mr. Nelson M. Bona [email protected] 7798-3977 N/A CONTACT PERSON’s ADDRESS The Beaufort, 5th Avenue Corner 23rd Street, Bonifacio Global City, Taguig City, Metro Manila NOTE 1 : In case of death, resignation or cessation of office of the officer designated as contact person, such incident shall be reported to the Commission within thirty (30) calendar days from the occurrence thereof with information and complete contact details of the new contact person designated 2 : All Boxes must be properly and completely filled-up. Failure to do so shall cause the delay in updating the corporation’s records with the Commission and/or non-receipt of Notice of Deficiencies. Further, non-receipt of Notice of Deficiencies shall not excuse the corporation from liability for its deficiencies.
-
Upload
khangminh22 -
Category
Documents
-
view
2 -
download
0
Transcript of ANNEX A - Filinvest Development Corporation

1
C O V E R S H E E T
SEC Registration Number
5 1 0 4 8
C O M P A N Y N A M E
F I L I N V E S T D E V E L O P M E N T
C O R P O R A T I O N A N D S U B S I D I A R I E S
PRINCIPAL OFFICE ( No. / Street / Barangay / City / Town / Province )
T H E B E A U F O R T , 5 T H A V E N U E C O R N E R
2 3 R D S T R E E T , B O N I F A C I O G L O B A L
C I T Y , T A G U I G C I T Y , M E T R O M A N I L A
Form Type Department requiring the report Secondary License Type, If Applicable
1 7 - A S E C N A
C O M P A N Y I N F O R M A T I O N
Company’s Email Address Company’s Telephone Number Mobile Number
www.filinvestgroup.com 7798-3977
No. of Stockholders Annual Meeting (Month / Day) Fiscal Year (Month / Day)
4,035 Excluding Treasury)
Every Last Friday of
April Each Year
12/31
CONTACT PERSON INFORMATION
The designated contact person MUST be an Officer of the Corporation Name of Contact Person Email Address Telephone Number/s Mobile Number
Mr. Nelson M. Bona [email protected] 7798-3977 N/A
CONTACT PERSON’s ADDRESS
The Beaufort, 5th Avenue Corner 23rd Street, Bonifacio Global City, Taguig City, Metro
Manila
NOTE 1 : In case of death, resignation or cessation of office of the officer designated as contact person, such incident shall be reported to the Commission within thirty (30) calendar days from the occurrence thereof with information and complete contact details of the new contact
person designated 2 : All Boxes must be properly and completely filled-up. Failure to do so shall cause the delay in updating the corporation’s records with the Commission and/or non-receipt of Notice of Deficiencies. Further, non-receipt of Notice of Deficiencies shall not excuse the corporation from liability for its deficiencies.

2
SECURITIES AND EXCHANGE COMMISSION
SEC FORM 17-A
ANNUAL REPORT PURSUANT TO SECTION 17
OF THE SECURITIES REGULATION CODE (SRC) AND SECTION 141
OF THE CORPORATION CODE OF THE PHILIPPINES
1. For the calendar year ended December 31, 2020
2. Commission identification Number 51048. 3. BIR Tax Identification 000-053-167-000.
4. Exact name of registrant as specified in its charter: FILINVEST DEVELOPMENT CORPORATION
5. Philippines
6. (SEC Use Only)
Province, Country or other jurisdiction of incorporation or
organization
Industry Classification Code:
7. The Beaufort, 5th Avenue Corner 23rd Street, Bonifacio Global City, Taguig City, Metro Manila 1634
Address of principal office Postal Code
8. 02-7798-3977
Issuer’s telephone number, including area code
9.
Former name, former address, and former fiscal year, if changed since last report
10. Securities registered pursuant to Sections 8 and 12 of the SRC, or Sec. 4 and 8 of the RSA
Number of Shares of Common Stock
Title of Each Class Outstanding and Amount of Debt Outstanding
Common stock, P1.00 par value 8,648,462,987 shares
P136,192.2 million total consolidated debt
(long-term and short-term debt)
11. Are any or all of these securities listed in the Philippines Stock Exchange?
Yes [ X ] No [ ]
12. Check whether the issuer:
(a) has filed all reports required to be filed by Section 17 of the SRC and SRC Rule 17.1 thereunder or Section 11 of the RSA
and RSA Rule 11(a)-1 thereunder, and Sections 26 and 141 of The Corporation Code of the Philippines during the preceding
twelve (12) months (or for such shorter period that the registrant was required to file such reports);
Yes [ X ] No [ ]
(b) has been subject to such filing requirements for the past 90 days.
Yes [ X ] No [ ]
13. State the aggregate market value of the voting stock held by non-affiliates of the registrant. The aggregate market value shall be
computed by reference to the price at which the stock was sold, or the average bid and asked prices of such stock, as of a
specified date within sixty (60) days prior to the date of filing. If a determination as to whether a particular person or entity is an
affiliate cannot be made without involving unreasonable effort and expense, the aggregate market value of the common stock
held by non-affiliates may be calculated on the basis of assumptions reasonable under the circumstances, provided the
assumptions are set forth in this Form. (See definition of "affiliate" in “Annex B”).
Shares Held by Non-Affiliates as of
March 31, 2021
Market Value per Share as of
March 31, 2021
Total Market Value
as of March 31, 2021
928,453,683 shares P8.67 P8.0 Billion

3
APPLICABLE ONLY TO ISSUERS INVOLVED IN INSOLVENCY/SUSPENSION OF PAYMENTS PROCEEDINGS
DURING THE PRECEDING FIVE YEAR:
14. Check whether the Issuer has filed all documents and reports required to be filed by Section 17 of the Code subsequent to the
distribution of securities under a plan confirmed by a court of the Commission.
Yes [ ] No [ ]
DOCUMENTS INCORPORATED BY REFERENCE
15. If any of the following documents are incorporated by reference, briefly describe them and identify
the part of SEC Form 17-A into which the document is incorporated
(a) Any annual report to security holders;
(b) Any information statement filed pursuant to SRC Rule 20;
(c) Any prospectus filed pursuant to SRC Rule 8.1.
Not Applicable
4
TABLE OF CONTENTS
PART I – BUSINESS AND GENERAL INFORMATION Page No.
Item 1 Business
1.1 Corporate Information, History, Developments, Form and Organization 5
1.2 Bankruptcy, Receivership or Similar Proceedings 10
1.3 Material Reclassification, Merger, Consolidation or Purchase or Sale of a Significant
Amount of Assets (not ordinary) over the past three years
10
1.4 Significant Subsidiaries, Segments and Business Groups 11
1.5 Intellectual Property of the Group 41
1.6 Government Regulations and Environmental Laws 45
1.7 Employees and Labor 48
1.8 Major Risks, Risk Management, Strengths and Strategies 49
Item 2 Properties 70
Item 3 Legal Proceedings 75
Item 4 Submission of Matters to a Vote of Security Holders 77
PART II – OPERATIONAL AND FINANCIAL INFORMATION
Item 5 5.1 Market for Issuer’s Common Equity and Related Stockholder Matters 77
5.2 Bond Issuances 79
Item 6 Management's Discussion and Analysis or Plan of Operations 80
Item 7 Financial Statements 101
Item 8 Changes in and Disagreements With Accountants on Accounting and
Financial Disclosure
102
PART III – CONTROL AND COMPENSATION INFORMATION
Item 9 Directors and Executive Officers of the Issuer 102
Item 10 Executive Compensation 104
Item 11 Security Ownership of Certain Beneficial Owners and Management 105
Item 12 Certain Relationships and Related Transactions 107
PART IV – CORPORATE GOVERNANCE
Item 13 Corporate Governance 109
PART V – EXHIBITS AND SCHEDULES
Item 14 a. Exhibits 109
b. Reports on SEC Form 17-C 109
SIGNATURES 111
5
PART I - BUSINESS AND GENERAL INFORMATION
ITEM 1. BUSINESS
1.1 Corporate Information, History, Developments, Form and Organization
Filinvest Development Corporation (FDC or the “Parent Company”) was incorporated in the Philippines on April 27, 1973 and has
evolved from businesses established by the Gotianun Family since 1955. Originally engaged in the small-scale financing of second-
hand cars, the Gotianun Family later expanded into consumer finance in partnership with foreign institutions, such as Chase Manhattan
Bank, Westinghouse Electric Corporation and Ford Philippines. By the early 1980s, the Gotianun Family's Filinvest Credit Corporation
became one of the leading consumer finance companies in the Philippines in terms of assets. Over time, the "Filinvest" name became
established and well-recognized in the Philippines not only in financing and banking but also in real estate development and other lines
of business.
In 1967, the Gotianun Family entered the real estate business through the incorporation of Filinvest Realty Corporation, which was
engaged in the development of residential subdivisions. In 1984, the Gotianun Family consolidated their real estate interests in FDC
after divesting their shares in Family Bank and Trust Company (Family Bank) and the Insular Bank of Asia and America. By 1990,
FDC expanded its product line to include the construction and sale of low-cost and medium-cost housing units. Thereafter, the product
line was further expanded to include the development of commercial district, leisure projects such as farm estates and sports clubs, and
construction of residential and office condominiums.
Filinvest Land Inc. (FLI) was incorporated on November 24, 1989. It began commercial operations in August 1993 after FDC spun off
its real estate operations and transferred all related assets and liabilities to FLI in exchange for shares of FLI. FLI shares were listed on
the Philippine Stock Exchange (PSE) on October 25, 1993. FDC remains FLI’s largest shareholder. As of December 31, 2020, FDC
beneficially owned approximately 64.9% of FLI’s outstanding common shares and all of its issued and outstanding preferred shares,
such that FDC had a 73.6% voting ownership in FLI.
Filinvest Alabang, Inc. (FAI) was incorporated on August 25, 1993 in connection with the joint development of Filinvest City in
Alabang, Muntinlupa City. With its development of Filinvest City, the Parent Company and its subsidiaries (collectively referred to as
the “Filinvest Group” or the “Group”) started to be a central business district developer and has successfully ventured into retail, office,
high-rise residential and leisure club development. As of December 31, 2020, FDC directly owned 80.0% of FAI’s issued and
outstanding shares, with FLI holding the remaining 20.0%, and beneficially owned approximately 92.98% of FAI’s issued and
outstanding shares.
In 1994, FDC decided to re-enter the banking and financial services business based on the then strengthening fundamentals of the
Philippine economy and the Gotianun Family’s prior experience in this business in the 1970s and 1980s. FDC incorporated East West
Banking Corporation (EW or the Bank) in March 1994. On May 7, 2012, EW was publicly listed on the PSE. As of December 31, 2020,
including its 37.9% indirect ownership through FDC Forex Corporation (FDC Forex), FDC beneficially owns 77.9% of EW’s issued
and outstanding shares.
To diversify its business and position, FDC, as the Gotianun Family’s primary holding company for its investments, acquired 100.0%
of the issued and outstanding shares of Pacific Sugar Holdings Corporation (PSHC) from A.L. Gotianun, Inc. (ALGI) on June 29, 2007.
PSHC owns three (3) Mindanao-based sugar companies, Davao Sugar Central Company, Inc. (DSCC), Cotabato Sugar Central
Company, Inc. (CSCC) and High Yield Sugar Farms Corporation (HYSFC).
During the Philippine power crisis in 1995, the Group acquired a 25% interest in East Asia Power Corp. In 1998, the Group also acquired
100.0% of East Asia Utilities Corp. and Cebu Power Corp., each of which was divested in 2000 as part of the Group’s deleverag ing
activities during the Asian financial crisis. In 2007, FDC partnered with International Power Plc to bid for the Government’s 60%
controlling stake in Energy Development Corporation (EDC). While the FDC consortium’s bid was shortlisted, the bid ultimately did
not succeed.
In 2009, the Group re-entered the power generation business through FDC Utilities, Inc. (FDCUI). FDCUI operates a 405 megawatts (3
x 135 MW) power plant with circulating fluidized bed (CFB) clean coal technology in the Philippine Veterans Investment Development
Corporation (PHIVIDEC) Industrial Estate, Villanueva, Misamis Oriental, Mindanao. FDCUI started developing the power plant in
2013 and received the certificate of compliance (COC) for the first two (2) units of the plant in October 2016, and the COC for the third
unit in May 2017. The Group has also entered into joint ventures with respect to the development of renewable energy projects, such as
solar rooftops, and the development of a district cooling system. In addition, the Group is looking to develop a 26 MW hydropower
plant in the Pampang River in Luzon, a biomass cogeneration plant and a 30 MW solar farm.
The Group is also involved in the development, operation and management of hotels and resorts that cater to various market segments.
In 2008, FDC entered into a joint venture with Archipelago International Pte. Ltd (AIPL) and created Chroma Hospitality, Inc. (Chroma)
to manage and operate the Group’s hospitality projects. Chroma is is 60% owned by FDC and 40% owned by AIPL. In August 2011,

6
FDC formed its wholly owned subsidiary Filinvest Hospitality Corporation (formerly FDC Hotels Corporation) (FHC) to serve as the
primary developer and owners’ representative of Group-owned properties.
Following the award of a provisional gaming license to MCI by the Philippine Amusement and Gaming Corporation (“PAGCOR”) in
April 2018, the Group is planning to extend its hospitality offering to include an integrated resort and casino within the Filinvest
Mimosa+ Leisure City development. The Group intends to outsource the operation of the casino to an established third party gaming
operator. The construction of the integrated resort is still in the planning stage and the timing of the development is expected to be within
the next five years. The Company has conducted initial discussions with several operating partners for the integrated resort development.
However, any further discussions have been delayed due to the ongoing COVID-19 pandemic.
As part of the Group’s continued expansion, in January 2019, as part of the North Luzon Airport Consortium (NLAC), FDC entered
into a 25-year concession agreement for the operation and maintenance of the Clark International Airport (CIA) passenger terminal and
the fit-out and operation and maintenance of a new terminal building. In August 2019, the consortium took over the operation and
maintenance of the existing terminal. The consortium is expected to take over the operation and maintenance of the new CIA terminal
in October 2020. The 25-year concession agreement will run from the date of the handover of the new terminal.
The Group has also been involved in the water supply business since 2012 through its subsidiary Countrywide Water Services, Inc.
(CWSI), which provides water and wastewater services. Its water services include the supply and distribution of potable water to
domestic, commercial and industrial users whiles its wastewater services include the treatment of domestic and commercial sewage.
The Group also signed a joint venture agreement with Japanese company, Hitachi Aqua-Tech Engineering Pte Ltd. (HAQT), to establish
Filinvest-Hitachi Omni Waterworks, Inc. (FLOW) to tap into the latest developments in water technology such as desalination.
In October 2019, FAI signed a joint venture agreement with Japanese company Mitsubishi Corporation (MC) for the development of a
P15-billion multi-tower mixed-use complex within Filinvest City. Mitsubishi will have a 40% stake in the development of a 1.7-hectare
prime lot that is seen to bolster mixed-use GLA by approximately 183,000 square meters.
With over 50 years of experience in industries that are highly sensitive to the financial crises, market downturns, and political upheaval,
the Filinvest Group has emerged as one of the few survivors in the country. The Group has carefully built and nurtured a distinguished
performance record in the real estate development and banking and financial services, which was recognized by international bankers,
fund managers, other global institutional investors, and the international financial community.
The Parent Company’s registered business address is at The Beaufort, 5th Avenue Corner 23rd Street, Bonifacio Global City, Taguig
City, Metro Manila, Philippines. FDC common shares were listed on the PSE on December 22, 1982.
ALGI is the ultimate parent company of FDC and its subsidiaries. ALGI’s registered business address is at The Beaufort, 5th Avenue
Corner 23rd Street, Bonifacio Global City, Taguig City, Metro Manila.
Real Estate Operations
On December 23, 2020, Cyberzone Properties, Inc. (CPI) entered into a Deed of Assignment to sell its interest in ProOffice Works
Services, Inc. (ProOffice) to FLI for a total consideration of P=17.2 million. The resulting ownership interest of FLI and Filinvest
Cyberparks Inc. (FCI) in ProOffice after the transfer is 75.0% and 25.0%, respectively. The transaction has no impact on the
consolidated financial statements. ProOffice, which was incorporated on March 18, 2019 to engage in the business of administration,
maintenance and management of real estate developments and projects, started its commercial operations in August 2019.
On December 21, 2020, FDC subscribed to 110.0 million common shares of Dreambuilders Pro, Inc. (DPI). The resulting ownership
interest of FDC and FLI in DPI after the subscription is 55.0% and 45.0%, respectively. Prior to the subscription, DPI was 100.0%
owned by FLI. This change in ownership interest without loss of control is treated as an equity transaction and resulted in adjustments
to retained earnings and noncontrolling interest amounting to P=25.3 million. DPI, which was incorporated on January 11, 2017 to engage
in a general construction business started its commercial operations in February 2017.
On December 16, 2020, FLI subscribed to 382,500 shares (120,000 common shares and 262,500 preferred shares) both with par value
of P=100.0 per share for total consideration of P=47.3 million of Nature Specialists, Inc. (NSI). The resulting ownership interest of FLI
and FHC in NSI after the subscription is 75.0% and 25.0%, respectively. Prior to the subscription, NSI was 100.0% owned by FHC.
There is no change in control over NSI at the consolidated level. NSI was incorporated on August 24, 2018 to conduct real estate
activities primarily focusing on hotels, inns, resorts, lodging houses and all adjunct accessories thereto, including restaurants, cafes, bars,
stores, and offices. NSI has not started commercial operations as of December 31, 2020.

7
On June 24, 2020, the deed of absolute sale of Spectrum Alabang Properties, Inc. (SAPI) shares from FAI to Mitsubishi Corporation
(MC) was executed upon satisfaction of the conditions under the joint venture agreement. As a result, FAI conveyed 40% of the issued
and outstanding common shares and 40% of the issued and outstanding redeemable preferred shares of SAPI to MC which resulted to
deconsolidation of SAPI from FAI. SAPI, which is now accounted as investment in joint venture, was incorporated on
December 16, 2019 to engage in the developments of real estate properties and/or managing commercial, recreational facilities and
residential, office buildings and other related activities. SAPI has not started commercial operations as of December 31, 2020.
On December 26, 2019, CPI and FCI, wholly owned subsidiaries of FLI, entered into a Deed of Assignment to sell its ownership in Pro-
Excel Property Managers, Inc. (Pro-Excel) to FAI. The primary purpose of Pro-Excel is to engage in the business of administration,
maintenance and management of real estate development, controlled development projects and subdivision projects.
On October 11, 2019, ProMixers Aggregates Corp. (PMAC), a wholly owned subsidiary of DPI, was incorporated mainly to operate
concrete batching plant, manufacture and supply of pre-cast and construction equipment and rental. PMAC has not started its commercial
operations as of December 31, 2020.
On July 18, 2018, the Securities and Exchange Commission (SEC) approved Timberland Sports and Nature Club, Inc.’s (TSNC or the
“Club”) application for voluntary revocation of its secondary registration which allowed TSNC to proceed with the transition to its new
business model. On November 15, 2018, TSNC’s Board of Directors (BOD) approved the amendment to change the primary purpose
of the Club from an exclusive recreational sports club to a for profit commercial facility. On July 24, 2019, TSNC submitted its Amended
Articles of Incorporation to SEC. The amendments include (a) change of the primary purpose of TSNC from that of an exclusive
recreational sports club to a real estate development Company; (b) change of TSNC’s principal address from No. 173 P. Gomez Street,
San Juan, Metro Manila to Timberland Heights, Barangay Malanday, San Mateo Rizal; (c) converting of TSNC’s capital stock from no
par value club shares to par value shares; (d) removal of provisions which characterizes TSNC as an exclusive non-profit association;
and (e) removal of paragraphs which relate to the operations of an exclusive recreational sports club. On August 1, 2019, the SEC
approved TSNC’s application on voluntary revocation of its secondary registration. On August 18, 2019, the SEC approved TSNC’s
Amended Articles of Incorporation.
On January 19, 2018, FLI entered into a Share Sale and Purchase Agreement to purchase 100% of the total outstanding shares of Gintong
Parisukat Realty and Development, Inc. (GPRDI) for a total consideration of P=1,706.4 million. The primary purpose of GPRDI is to
hold, purchase, lease, contract or otherwise acquire any and all real and personal properties. GPRDI has not started commercial
operations as of December 31, 2020. The acquisition of GPRDI was accounted for as an asset acquisition.
Hospitality Operations
On May 4, 2020, Halo Halo Hospitality Pte. Ltd (Halo Halo) and Samui Seascapes Pte. Ltd. (Samui Seascapes), wholly owned
subsidiaries of FHC, were incorporated. Halo Halo and Samui Seascapes, which are private companies limited by shares under the
Singapore Companies Act, with registered offices situated in the Republic of Singapore, have not started commercial operations as of
December 31, 2020.
On March 12, 2020, Cebu IT Park Cityscapes, Inc (CIPCI) and Gensan Cityscapes, Inc. (GCI), wholly owned subsidiaries of FHC, were
incorporated to sell, use, assign, transfer, dispose, hold, mortgage, and lease purchased and owned real property and personal property
of all kinds. CIPCI and GCI have not started commercial operations as of December 31, 2020.
On September 9, 2019, Dauin Seascapes, Inc. (DSI), a wholly owned subsidiary of FHC, was incorporated with primary purpose of
developing, administering hotels, resorts and entertainment of all kinds and related activities. DSI has not started its commercial
operations as of December 31, 2020.
On January 21, 2019, Zamboanga Cityscapes, Inc. (ZCI), a wholly owned subsidiary of FHC, was incorporated to sell, use, assign,
transfer, dispose, hold, mortgage, and lease purchased and owned real property and personal property of all kinds. ZCI has not started
its commercial operations as of December 31, 2020.
On November 30, 2018, FHC subscribed to 2.5 million common shares of EHSI. The resulting ownership interest of FHC and FAI in
EHSI after subscription is 76.9%, and 23.1%, respectively. Prior to the subscription, EHSI is 100.0% owned by FAI. Its primary
purpose is to own, lease, operate and/or manage hotels, resorts, villas, service apartments and condotels, and all adjuncts and accessories
and other related activities.
On August 24, 2018, Fora Services, Inc. (Fora Services) and Fora Restaurants, Inc. (FRI), wholly owned subsidiaries of FHC, were
incorporated. The primary purpose of Fora Services is to purchase and own real properties and personal property of all kinds, to sell,
lease, maintain and manage while FRI’s primary purpose is to maintain, operate and manage restaurants, cafes, bars, and general food
catering services. Fora Services and FRI started commercial operations in April 2019.

8
Power Operations
On September 8, 2020, the SEC approved the amended Articles of Incorporation of FDC Danao Power Corporation, a wholly owned
subsidiary of FDCUI, to change its corporate name to FDC Water Utilities, Inc. (FDC Water) and its primary purpose to carry on general
business of operating waterworks, sewerage and sanitation system.
On November 22, 2018, Filinvest ENGIE Renewable Energy Enterprise, Inc. (FREE), a joint venture company with Engie Services
Asia Pacific Pte. Ltd. doing business as Engie Services Philippines (ENGIE), was incorporated to engage in the installation and operation
of renewable energy facilities, particularly solar rooftop projects. FREE is owned 60.0% by FDCUI and 40.0% by ENGIE. FREE has
not started commercial operations as of December 31, 2020.
Power operations has 3 x 135 MW CFB coal thermal power plants located at PHIVIDEC Industrial Estate in Villanueva, Misamis
Oriental.
Other Operations
On November 10, 2020, SharePro, Inc. (SharePro), a wholly owned subsidiary of FDC, was incorporated to engage primarily in the
business of providing technical, management, administrative, business process and consultancy services. SharePro has not started
commercial operations as of December 31, 2020.
On October 19, 2020, f(dev) Digital Innovations and Ventures, Inc. (FDEV), a wholly owned subsidiary of FDC, was incorporated to
engage primarily in the business of a holding company and invest, purchase and acquire any shares or interest in corporations,
associations, partnerships or any other technology-based business entity.
On May 6, 2020, Investree Philippines, Inc. (Investree), a joint venture company with Investree Singapore Pte. Ltd. (Investree SG), was
incorporated to engage primarily in the business of software integration and providing IT solutions. Investree is 50.0% owned by
Investree SG and 50.0% owned by FDC. Investree started commercial operations on October 1, 2020.
On October 29, 2019, FLOW, a joint venture company with HAQT was incorporated to carry on the business of operating waterworks,
sewerage and sanitation systems and services. FLOW is 60% owned by FDC and 40% owned by HAQT. FLOW started commercial
operations on January 1, 2020.
On July 4, 2019, Professional Operations and Maintenance Experts Incorporated (PROMEI), a joint venture company with ENGIE was
incorporated to operate, maintain and repair existing and future technical systems, including but not limited to heating, ventilation and
air conditioning systems and distributed energy systems, and implement new technologies in connection with saving energy and reducing
operating costs. PROMEI is 47.5% owned by FDC and 52.5% owned by ENGIE. PROMEI has not started its commercial operations as
of December 31, 2020.
On February 18, 2019, Luzon International Premiere Airport Development Corp. (LIPAD Corp.) was incorporated to engage in the
operation and maintenance of airports. LIPAD Corp. is owned 42.5% by FDC, 33.0% by JG Summit Holdings Inc. (JGSHI), 15.0% by
Changi Airports Philippines (I) Pte. Ltd. (CAP) and 9.5% by the Philippine Airport Ground Support Solutions, Inc. (PAGSSI)
(collectively referred to as NLAC). LIPAD Corp. is accounted as an investment in an associate.
On January 21, 2019, NLAC signed the contract that grants a 25-year concession to the consortium to develop the commercial assets,
operate and maintain project facilities and fit-out the new terminal in Clark. LIPAD Corp. started commercial operations on August 16,
2019 upon the transfer of the operations and maintenance of Clark International Airport (CIA). The registered office address of LIPAD
Corp. is at Clark Field, Clark Freeport Zone, Andres Bonifacio Avenue, Clark Special Economic Zone, Dau, Mabalacat City, Pampanga.
FDC’s consolidated revenues are generated from real estate development and leasing, hospitality operations, banking and financial
services, power operations, sugar cane farming, milling and sugar trading, from subsidiaries, associate, and jointly controlled entities
engaged in various business activities, namely:
Date of Incorporation
Real Estate
FLI November 24, 1989
Filinvest AII Philippines, Inc. (FAPI) September 25, 2006
Homepro Realty Marketing, Inc. (Homepro) March 25, 1997
FCGC Corporation (FCGCC) February 11, 2016
Filinvest BCDA Clark, Inc. (FBCI) March 16, 2016
CPI January 14, 2000
FCI February 4, 2014
Filinvest Asia Corporation (FAC) January 22, 1997
FCMI January 23, 2017
FLMI January 23, 2017
Filinvest Lifemalls Corporation (FLC) July 26, 2016

9
Date of Incorporation Property Specialist Resources, Inc. (Prosper) June 10, 2002 FLTI November 20, 2017 Festival Supermall, Inc. (FSI) March 21, 1997 FSM Cinemas, Inc. (FSM Cinemas) April 23, 1998 Philippine DCS Development Corporation (PDDC) July 31, 2015 TSNC May 12, 2004 Property Maximizer Professional Corp. (Promax) October 3, 1997 Real Estate Leisurepro, Inc. (Leisurepro) April 21, 2004 Proleads Philippines, Inc. (Proleads) March 29, 2017 Property Leaders International Limited (BVI) (PLIL) February 7, 2017 Realpros Philippines, Inc. (RPI) August 3, 2017 GPRDI August 18, 2006 Filinvest Mimosa, Inc. (FMI) March 31, 2016 ProOffice March 18, 2019 NSI August 24, 2018 DPI January 11, 2017 PMAC October 11, 2019 FAI August 25, 1993 Northgate Convergence Corporation October 14, 1999 Proplus, Inc. February 16, 2000 ParkingPro, Inc. (PPI) July 15, 2016 Pro-Excel November 28, 2001 SAPI December 16, 2019 Hospitality Operations FHC August 22, 2011 MSSI July 17, 2009 Quest Restaurants, Inc. March 12, 2012 BSI December 28, 2012 Chinatown Cityscapes Hotel, Inc. March 22, 2013 Duawon Seascapes Resort, Inc. April 12, 2013 EHSI November 28, 2012 MCI May 13, 2016 Cubao Cityscapes, Inc. February 9, 2017 Princesa Seascapes, Inc. June 6, 2017 Dumaguete Cityscapes, Inc. November 27, 2017 Fora Services August 24, 2018 FRI August 24, 2018 Chroma November 8, 2008 DSI September 9, 2019 ZCI January 21, 2019 Halo Halo May 4, 2020 Samui Seascapes May 5, 2020 CIPCI March 12, 2020 GCI March 12, 2020 Banking and Financial Services EW March 22, 1994 East West Rural Bank, Inc. (EWRB) November 5, 1997 East West Insurance Brokerage, Inc. (EWIB) July 6, 2015 East West Ageas Life Insurance Corporation (EW Ageas Life) October 20, 2015 Assurance Solutions Insurance Agency (ASIA) February 29, 2012 East West Leasing and Finance Corporation (EWLFC) October 6, 2016 Quest Marketing and Integrated Services, Inc. (QMIS) July 17, 2007 FDC Forex February 17, 1997

10
Power Operations
FDCUI December 4, 2009
FDC Retail Electricity Sales Corporation (FDC RES) November 16, 2009
FDC Misamis Power Corporation (FDC Misamis) November 16, 2009
FDC Water March 10, 2011
FDC Camarines Power Corporation March 23, 2011
FDC Casecnan Hydro Power Corporation March 23, 2011
FDC Negros Power Corporation May 22, 2012
FDC Renewables Corporation July 17, 2012
FGS Renewable Energy, Inc.** April 23, 2015
**dissolved in February 2018
Power Operations
FREE November 22, 2018
Sugar Operations
PSHC June 5, 1989
DSCC October 4, 1968
CSCC March 13, 2002
HYSFC June 8, 1990
Others
Corporate Technologies Incorporated (CTI) September 11, 1998
CWSI May 18, 2012
Filinvest Development Cayman Islands (FDCI) March 12, 2013
FDEV October 19,2020
SharePro November 10, 2020
PROMEI July 4, 2019
FLOW October 29, 2019
LIPAD Corp. February 18, 2019
Investree May 6, 2020
1.2 Bankruptcy, Receivership or Similar Proceedings
There was no bankruptcy, receivership or similar proceedings filed by the Company and/or any of its significant subsidiaries during the
past 3 years.
1.3 Material Reclassification, Merger, Consolidation or Purchase or Sale of a Significant Amount of Assets (not ordinary) over
the past 3 years
Other than the acquisitions discussed in the preceding section, there were no material reclassifications, mergers, consolidations or
purchases or sales of significant amount of assets (not ordinary) by the Company and/or its significant subsidiaries during the past 3
years.

11
Structure of the Group
Below is a map showing the relationship between and among the Group and its ultimate parent company, subsidiaries, and associate as
of December 31, 2020:
1.4 Significant Subsidiaries, Segments and Business Groups
Revenue Mix
Historically, the Group’s banking and financial services and real estate operations contributed the bulk of FDC’s consolidated revenues
and other income. For the year 2020, the Company’s consolidated revenues and other income amounted to P72.0 billion contributed
by:
Real estate operations 29.8%
Hospitality operations 1.7%
Banking and financial services 51.6%
Power operations 11.8%
Sugar operations 5.1%
A.L. GOTIANUN, INC.
MAP SHOWING THE RELATIONSHIP BETWEEN AND AMONG THE COMPANIES IN THE GROUP, ITS ULTIMATE PARENT, CO-SUBSIDIARIES, JOINT VENTURES AND ASSOCIATES
(As of December 31, 2020)
Supplementary Information:
** FDC's effective ownership in FAI is 93% (80% direct ownership and
13% indirect ownership through FLI)
***FDC's effective ownership in EW is 78% (40% direct ownership and
38% indirect ownership through FFC)
Mactan Seascapes Services, Inc.
FDC 100%
Filinvest HospitalityCorporation ( FHC)
FDC 100%
A.L. Gotianun, Inc. (ALGI)
Filinvest Development Corporation (FDC)ALGI - 87.74%
Others - 12.26%
Quest Restaurants, Inc.
FHC 100%
Pacific Sugar Holdings
Corporation (PSHC)FDC 100%
Davao Sugar Central Company,
Inc.
PSHC 100%
Cotabato Sugar Central Company,
Inc.
PSHC 100%
High Yield Sugar Farms Corporation
PSHC 100%
FDC Utilities, Inc. (FDCUI)
FDC 100%
Corporate TechnologiesIncorporated
FDC 40%
FLI 30%FAI 30%
Chroma Hospitality, Inc.
FDC 60%;Archipelago International
Property Maximizer Professional Corp.
FLI 100%
Leisurepro, Inc.FLI 100%
Homepro Realty Marketing, Inc.
FLI 100%
Property Specialist Resources, Inc.
FLI 100%
Filinvest Alabang, Inc. (FAI)**
FDC 80%;
FLI 20%
Proplus, Inc.FAI 100%
Northgate Convergence Corporation
FAI 100%
Filinvest Asia Corp.FLI 60%;
Reco Hererra 40%
Cyberzone Properties, Inc. (CPI)FLI 100%
Pro Excel Property Managers, Inc.
FLI 32.9%
FAI 67.1%
Filinvest AII Philippines, Inc.
FLI 100%
East West Banking Corporation (EW)***
FDC 40%;
FFC 38%;Others 22%
East West Rural Bank Inc. EW 100%
FDC Forex Corp.(FFC)
FDC 100%
Filinvest Land Inc.(FLI)
FDC 65%;
Others 35%
Festival Supermall Inc. (FSI)
FLI - 100%
FDC Misamis Power Corporation
FDC 87.7%
FDCUI 12.3%
FDC Retail Electricity Sales Corporation
FDCUI 100%
FDC Water Utilities, Inc.
FDCUI 100%
FDC Camarines Power CorporationFDCUI 100%
FDC Casecnan Hydro Power Corporation
FDCUI 100%
FDC Negros Power Corporation
FDCUI 100%
FSM Cinemas, Inc.FSI 60%
Cinema Services Chain Corp. 40%
FDC Renewables Corporation (formerly FDC Davao del Norte
Power Corporation)FDCUI 100%
Boracay Seascapes, Inc.
FHC 100%
Chinatown Cityscapes Hotel,
Inc.FHC 100%
Filinvest Development
Cayman Islands FDC 100%
Duawon Seascapes Resort, Inc.FHC 100%
Filinvest Cyberparks, Inc. (FCI)FLI 100%
Countrywide Water Services, Inc.
FDC 100%
East West Insurance
Brokerage, Inc.
EW 100%
Philippine DCS Development Corporation
FLI 60%;
Engie Services Phil. 40%
East West Ageas Life InsuranceCorporation
EW 50%
Ageas Life InsuranceCorporation 50%
FCGC Corporation(FCGCC)
FLI - 100%
Filinvest BCDA Clark, Inc.FCGCC 55%
Bases Conversion Development Authority 45%
Filinvest Mimosa, Inc.
FDC 47.5%
FLI 47.5%Clark Development Corporation 5%
Mimosa Cityscapes, Inc.
FHC 100%
ParkingPro, Inc.FAI 100%
Filinvest Lifemalls CorporationFLI - 100%
East West Leasing and Finance Corporation
EW 100%
Dreambuilders Pro, Inc.
FDC - 55%
FLI - 45%
Filinvest Lifemalls Mimosa, Inc.
FLI - 100%
Filinvest Cyberzone Mimosa, Inc.
FLI - 100%
Quest Marketing And Integrated Services, Inc.
EW 100%
Assurance Solutions Insurance
Agency
EW 100%
Cubao Cityscapes, Inc.FHC 100%
Property Leaders International Limited (BVI)
FLI - 100%
Proleads Philippines, Inc.
FLI - 100%
Timberland Sports and Nature Club
FLI - 98%Third-party members - 2%
Princesa Seascapes, Inc.
FHC 100%
Realpros Philippines, Inc.
FLI - 100%
Filinvest Lifemalls Tagaytay, Inc.
FLI - 100%
Entrata Hotel Services, Inc.
FHC 76.9%
FAI 23.1%
Gintong Parisukat Realty and
Development, Inc.FLI - 100%
Dumaguete Cityscapes, Inc.
FHC 100%
Fora Services, Inc.FHC 100%
Fora Restaurants, Inc.FHC 100%
Nature Specialists, Inc.FLI 75%
FHC 25%
Filinvest-ENGIE Renewable Energy
Enterprise, Inc. (FREE)
FDCUI 60%Engie Services, Phil. 40%
Zamboanga Cityscapes, Inc.
FHC 100%
ProOffice Works Services, Inc.
FLI 60%
FCI 40%
Luzon International Premiere Airport
Development Corp.FDC 42.5%
JG Summit Holdings Inc. 33.0%Changi Airports Philippines (I)
Pte. Ltd. 15.0%Philippine Airport Ground
Support Solutions, Inc. 9.5%
Professional Operations and
Maintenance Experts
IncorporatedFDC 47.5%
Engie Services (Philippines) 52.5%
Dauin Seascapes, Inc.FHC 100%
Filinvest-Hitachi Omni Waterworks,
Inc.FDC 60.0%
Hitachi Aqua-tech
Engineering Pte Ltd. 40.0%
ProMixers Aggregates
Corp.
DPI - 100%
Spectrum Alabang Properties, Inc.
FAI 60%
Mitsubishi 40%
Gensan Cityscapes, Inc.FHC 100%
Cebu IT Park Cityscapes, Inc.
Halo Halo Hospitality Pte. Ltd. (Halo Halo)
FHC 100%
Samui Seascapes Pte. Ltd.Halo Halo 100%
Investree PhilippinesFDC 50%
Investree Singapore Pte.,
Ltd. 50%
f(dev) Digital Innovations and
Ventures, Inc.
SharePro, Inc. FDC 100%

12
1.4.1 Real Estate Operations
Filinvest Land, Inc
Business
Brief Description and Recent Developments
FLI is one of the leading real estate developers in the country, providing a wide range of real estate products to residential and commercial
customers. FLI (including its predecessor’s operations) has over 50 years of real estate expertise and has developed over 2,500 hectares
of land, having provided home/home sites for over 200,000 families.
FLI is one of the largest nationwide residential developers in in 55 cities and towns in 22 provinces in the Philippines in the Philippines.
It is also one of the largest mid-rise building (MRB) developers in the country today and a market leader in the affordable and middle-
income residential segments. It currently owns a land bank of 1,650 hectares and has joint ventures arrangement for another 691 hectares,
totaling 2,341 hectares under its control and management for sustainable future growth..
To augment its traditional residential developments, FLI acquired 3 strategic investment properties, Festival Supermall, and the PBCom
Tower and business process outsourcing (BPO) office buildings through its ownership interest in FAC and CPI.
CPI owns and operates the information technology (IT) buildings in Northgate Cyberzone, a Philippine Economic Zone Authority
(PEZA) registered BPO park located on a 10-hectare parcel of land within Filinvest City. FLI generates revenues from leasable space
in 31 office buildings totaling 523,904 square meters (sq.m) as of December 31, 2020.
FLI owns 60% of FAC, which owns 50% of the 52-storey, PBCom Tower located in the Makati’s business district. PBCom Tower is a
Grade A, PEZA-registered IT/office building in Ayala Avenue, Makati City, Metro Manila with approximate GLA of 35,148 sq.m.
Festival Supermall is a four-story shopping complex located within FAI’s Filinvest City development. The mall has a GLA of 170,000
sq.m. FLI is leasing from FAI the 10 hectares of land on which the mall and its adjoining structures (such as parking lots) are situated.
The lease is for a term of 50 years from 2006, renewable for another 25 years. The Landmark department store has leased one hectare
of land from FAI for a term of 24 years from 2014.
As of this date, FLI owns and operates other retail malls and developments, Fora located in Tagaytay City, Main Square Bacoor in
Cavite and Il Corso in Cebu City. It intends to undertake commercial and retail projects to complement its residential developments in
selected areas.
In 2009, FLI signed an agreement with the Cebu City Government to develop 50.6 hectares of the South Road Properties (SRP), a 300-
hectare reclaimed land project located in Cebu City. The agreement involves purchase by FLI of the 10.6 hectares of the property to be
developed into a modern urban center consisting of residential, office, commercial, hotel and leisure buildings and a public promenade
which is a one (1) km long waterfront lifestyle strip that will offer a range of seaside leisure activities and the development of the
remaining 40 hectares of the property under a profit-sharing arrangement with the Cebu City Government. On the 40-hectare property,
FLI constructed MRBs known as San Remo and Amalfi while on the 10.6 hectare portion, it developed City de Mare and Il Corso.
On February 4, 2014, FCI, a wholly owned subsidiary of FLI was incorporated to manage FLI’s BPO leasing operations in Cebu, Pasay
City, Quezon City and Pasig City.
In July 2015, FLI, CPI and FAI (collectively referred to as Filinvest Consortium) won the bidding for a 19.20-hectare lot in Cebu’s SRP.
Thereafter, on August 7, 2015, Filinvest Consortium entered into a Deed of Sale on Installment (DSI) with the Cebu City Government.
In a letter dated January 6, 2017, the Cebu City Mayor questioned the validity of the sale and gave the buyers the option to withdraw
from the sale at buyer’s discretion. In a letter to the Cebu City Mayor dated February 7, 2017 (the Letter), Filinvest Consortium expressed
its intention to rescind the DSI. Under the DSI, Cebu City undertook to comply with several covenants, undertakings and obligations no
later than February 7, 2016 (or 180 days from execution of the DSI). The Letter pointed out that as of February 7, 2017, the said
covenants, undertakings and obligations had not been complied with and it did not appear that these will be complied with within a
foreseeable reasonable period of time.
The rescission of the DSI shall only take effect upon return by Cebu City of the down payment and installment payments made to Cebu
City by Filinvest Consortium, plus interests, within ninety (90) days from receipt of the Letter in accordance with Section 5.7 of the
DSI. Pending receipt of such payments, the DSI shall remain valid and subsisting by and among the parties. As of February 27, 2019,
such payment has not been received and no formal and definitive legal proceeding has been undertaken by the parties on this matter.
Consequently, as of said date, the DSI remains valid and Filinvest Consortium has the sole and rightful claim over the property.
The 19.2-hectare property mentioned above is a separate property from the other two properties within the SRP which were acquired
from Cebu City: a) the 40-hectare property under a joint venture undertaking with Cebu City; and b) the 10-hectare property which was
already paid in full by FLI to Cebu City.

13
On August 2, 2019, Filinvest Consortium informed Cebu City that the payments will be judicially consigned in accordance with law
considering that to date, Cebu City had not yet returned the payments with interest, thus, the conditional rescission had already expired.
In response, Cebu City issued a letter dated October 4, 2019 to FLI Consortium and insisted that the latter no longer had any debt to
Filinvest Consortium as the DSI was effectively rescinded. Cebu City reiterated its willingness to restitute the Filinvest Consortiun of
the amount it had already paid prior to the rescission.
The Cebu City Government and Filinvest Consortium came to a resolution on January 8, 2020 with the full payment and the signing of
the Deed of Absolute Sale. The Filinvest Consortium paid on December 17, 2019 the full amount of the purchase price of the lot plus
the accumulated interest for the unpaid installments since 2017. Accordingly, the matter has been resolved.
FMI, the company formed by the consortium of FDC and FLI, registered with the SEC on March 31, 2016, has signed the lease
agreement with Clark Development Corporation (CDC) for a term of 50 years, renewable for another 25 years. FMI’s primary purpose
is to engage in and undertake the general business of developing, constructing, establishing, operating, leasing except financial leasing,
maintaining, rehabilitating and/or managing commercial and retail centers, residential, office buildings, mixed-use development,
infrastructure, utilities and tourism related activities and other allied activities. FMI is owned 47.5% by FLI, 47.5% by FDC and 5.0%
owned by CDC.
In September 2015, FLI won the bid for the right to own 55.0% of the joint venture company with the Bases Conversion and
Development Authority (BCDA) that will be tasked to develop, market, manage and lease the first phase of Clark Green City. The first
phase covers to 288 hectares of land that will form part of the new mixed-use metropolis rising in Northern Luzon adjoining Clark
Freeport Zone and Clark International Airport.
With a more diversified portfolio, FLI expects to generate stable recurring revenue from its retail and office investment properties. These
recurring revenues can, in turn, be used to provide internally generated funding for other projects. FLI is not and has never been a
subject of any bankruptcy, receivership, or similar proceedings.
Form and Date of Organization
FLI was incorporated in the Philippines on November 24, 1989 as Citation Homes, Inc. and later changed its name to FLI on July 12,
1993. It started commercial operations in August 1993 after FDC spun off its real estate operations and transferred all related assets and
liabilities to FLI in exchange for shares of stock of FLI. FLI shares were listed on the PSE on October 25, 1993. As at December 31,
2020, FDC owns 64.9% of outstanding common shares and 100% of preferred shares of FLI.
FLI Subsidiaries
The consolidated financial statements of FLI include the accounts of FLI and its subsidiaries. The nature of business and the
corresponding percentages of ownership of FLI over these entities as at December 31, 2020, 2019 and 2018 are summarized below. The
voting rights held by the FLI in these subsidiaries are in proportion to its ownership interest.
Subsidiaries Nature of Business 2020 2019 2018
FAPI Real estate developer 100% 100% 100%
Homepro Real estate developer 100% 100% 100%
FCGCC Real estate developer 100% 100% 100%
FBCI 1 Real estate developer 55% 55% 55%
GPRDI Real estate developer 100% 100% 100%
CPI Leasing 100% 100% 100%
FCI Leasing 100% 100% 100%
FAC Leasing 60% 60% 60%
FCMI Leasing 100% 100% 100%
FLC Property management 100% 100% 100%
Prosper Property management 100% 100% 100%
FLMI Property management 100% 100% 100%
Pro-Excel 2 Property management 33% 33% 74%
FLTI Property management 100% 100% 100%
FSI Property management 100% 100% 100%
ProOffice 3 Property management 100% 100% –
FSM Cinemas 4 Theater operator 60% 60% 60%
PDDC District cooling systems, builder and operator 60% 60% 60%
TSNC 5 Recreational sports and natures club 98% 98% 98%
NSI Recreational sports and natures club 75% – –
DPI 6 Construction 45% 100% 100%
PMAC 7 Construction 100% 100% –
Promax Marketing 100% 100% 100%

14
Subsidiaries Nature of Business 2020 2019 2018
Leisurepro Marketing 100% 100% 100%
PLIL Marketing 100% 100% 100%
Proleads Marketing 100% 100% 100%
RPI Marketing 100% 100% 100% 1. FBCI is owned indirectly through FCGCC.
2. Deconsolidated in 2019. CPI and FCI sold its ownership in Pro-Excel to FAI. The effective ownership interest of FLI was reduced to 33%.
3. CPI assigned its 60% interest in ProOffice to FLI. 40% remaining interest is owned by FCI. Effectively, FLI owns 100% of ProOffice. 4. FSM Cinemas is owned indirectly through FSI.
5. In 2018 and 2017, the FLI acquired noncontrolling interest in TSNC representing additional 1% and 5% ownership interest, respectively, for a total
consideration of P=16.1 million and P=138.9 million, respectively. 6. Deconsolidated in 2020
7. PMAC is a wholly owned subsidiary of DPI.
8. Filinvest Cyberzone Mimosa, Inc. (FCMI) was renamed Filinvest Clark Mimosa Inc. on February 15, 2021.
Detailed discussion of each subsidiary follows:
➢ Promax was incorporated on October 3, 1997.
➢ Homepro was incorporated on March 25, 1997 and started commercial operations on January 1, 2004.
➢ Leisurepro was incorporated on April 21, 2004 and started commercial operations on January 1, 2006.
➢ Prosper was incorporated on June 10, 2002 and started commercial operations on January 1, 2004.
Promax, Homepro and Leisurepro are engaged in real estate marketing business and handle the marketing and sale of residential property
development projects of FLI while Prosper is engaged in the purchase, lease and management of hotel and resort properties. Homepro
is now also engaged in real estate development as it acquired rawland in Taguig in 2015. Prosper is currently managing the condotel
operations of a high-rise condominium (Grand Cenia) and hotel project (Quest Hotel) of FLI. Prior to Prosper’s condotel and hotel
management business, Prosper was engaged in the business of real estate marketing. The SEC approved the amendment of the primary
purpose of Prosper on February 20, 2012.
CPI was incorporated on January 14, 2000 and began commercial operations on May 1, 2001. CPI was registered with the PEZA as an
Economic Zone Facilities Enterprise, which entitles CPI to certain tax benefits and non-fiscal incentives such as the 5% tax on its
modified gross income in lieu of all national income taxes. CPI is also entitled to zero percent value-added tax on sales made to other
PEZA-registered enterprises. CPI owns and operates the IT buildings in Northgate Cyberzone, located on a 10-hectare parcel of land
within Filinvest City. Its day-to-day operations are handled by FAI. CPI also leases a parcel of land measuring 2,831 sq.m. located
along Epifanio delos Santos Avenue (EDSA) on which CPI built a 5-storey BPO building with a total GLA of 7,358 sq.m.
FAPI was incorporated on September 25, 2006 to develop the TSNC and Phase 2 of Timberland Heights.
Timberland Heights is a 677-hectare township project anchored by TSNC, which was designed to be a world-class family country club
in a mountain resort setting. Timberland Heights is situated at an elevation of 320 meters above sea level and provides panoramic views
of the north of Metro Manila. The master plan for Timberland Heights includes Banyan Ridge, a middle-income subdivision; Mandala
Farm Estates; The Ranch and Banyan Crest, a high-end subdivision, The Glades, also a middle- income subdivision, The Leaf, a 4-
building 3-storey condotel development; and, a 50-hectare linear greenway that straddles the entire development which will provide a
large outdoor open space for residents.
On February 4, 2014, FCI, a wholly owned subsidiary of FLI was incorporated. Its primary purpose is to acquire by purchase, lease,
donate and/or to own, use, improve, develop, subdivide, sell, mortgage, exchange, hold for investment and deal with real estate of all
kinds.
FLI has 60.0% interest in FAC which was incorporated on January 22, 1997. As of December 31, 2020, FAC is 60.0% owned by FLI
and 40.0% owned by Reco Herrra Pte.Ltd. (RHPL). RHPL is 100.0% beneficially owned by the Government of Singapore Investment
Corporation Pte. Ltd (GIC). FAC owns 50.0% of the 52-storey PBCom Tower, which is strategically located at the corner of Ayala
Avenue and V. A. Rufino Street in the Makati City Central Business District. FAC owns about 36,000 sq.m.of leasable office space.
The remaining 50.0% of PBCom Tower is owned by the Philippine Bank of Communications.
The PBCom Tower is a PEZA-registered IT building. Consequently, tenants occupying space in PBCom Tower are entitled to avail of
certain fiscal incentives, such as a 5.0% tax on modified gross income in lieu of the regular corporate income tax of 30.0%, income tax
holidays and Value Added Tax (VAT) exemption in certain cases. Leases at the PBCom Tower are typically for periods ranging from
3 to 5 years, with the lease agreements generally requiring tenants to make a 3-month security deposit. Rent is paid on a fixed rate per
square meter basis depending on unit size and location.
On April 15, 2015, FLI and ENGIE entered into a joint venture agreement to establish PDDC. On July 31, 2015, PDDC was registered
with the SEC to engage in the business of building and operation of district cooling system within existing and future buildings at
Northgate Cyberzone Area, Filinvest City, Alabang, Muntinlupa City. PDDC is owned 60.0% by FLI and 40.0% by ENGIE.

15
On December 28, 2015, FLI and FAI, entered into a Deed of Assignment of Shares, wherein FAI agreed to sell its rights, title and
interests in the 249,995 common shares of FSI, with par value of P=1.0 per share and equivalent to 100.0% ownership interest, to FLI for
and in total consideration of P=0.5 million. FSI is the property manager of Festival Supermall and other commercial centers of the Group.
FSI also owns 60.0% equity interest in FSM Cinemas which is engaged in theater operations. The transaction was accounted for using
the pooling of interest method wherein the assets and liabilities of the combining entities are reflected in the consolidated financial
statements at their carrying amounts.
On February 11, 2016, FCGCC was incorporated to undertake the development of the Clark Green City Project under the JVA with
BCDA. On March 16, 2016, FBCI, a joint venture company with BCDA, was incorporated to handle the development of the Clark
Green City Project. FBCI is owned 55.0% by FCGCC and 45.0% by BCDA.
On March 31, 2016, FMI was incorporated to enter into an agreement with CDC for the lease of the Mimosa Leisure Estate. FMI is
owned 47.5% by FLI, 47.5% by FDC and 5% by CDC. FMI started commercial operations in June 2016.
On July 26, 2016, the SEC approved Whiluc’s application for increase in its authorized capital stock. Likewise, FLI subscribed and paid
P124.7 million to Whiluc. On the same date, the SEC also approved the amendments of its corporate name and principal business
address. Whiluc’s new corporate name is FLC. Its primary purpose is to invest in, purchase, hold, use, develop, lease, sell , assign,
transfer mortgage, enjoy or otherwise dispose of, as may be permitted by law, all properties of every kind, nature and description and
wherever situated, of any corporation.
In 2016, the Philippine Interpretations Committee (PIC) issued Question and Answer (Q&A) No. 2016-02 to clarify the accounting
treatment of club shares held by an entity. The Group has evaluated the accounting treatment of its club shares following the guidance
under the above PIC Q&A and has concluded that it exercises control over TSNC. Accordingly, TSNC was consolidated starting 2016.
TSNC was registered with the SEC on May 12, 2004 to operate as a not-for-profit corporation.
On January 11, 2017, DPI, a wholly owned subsidiary of FLI was incorporated. Its primary purpose is to engage in a general
construction business. DPI started its commercial operations in February 2017.
On January 23, 2017, FCMI and FLMI, wholly owned subsidiaries of FLI were incorporated, with the primary purpose of acquiring by
purchase, lease, donation, and/or to own, use, improve, develop, subdivide, sell, mortgage, exchange, hold for investment and deal with
real estate of all kinds. During the first quarter of 2017, FCMI started the construction of its first BPO Office, the Filinvest Cyberzone
Mimosa Building 1. FCMI started its commercial operations in May 2018. FLMI has not started its commercial operations as of
December 31, 2020.
On February 7, 2017, PLIL, a company limited by shares, was registered at the territory of the British Virgin Islands. PLIL has not
started its commercial operations as of December 31, 2020.
On March 29, 2017, Proleads, a wholly owned subsidiary of FLI was incorporated. Its primary purpose is to provide management,
organizational, and other administrative services and training, on real estate transactions to be negotiated by Philippine-licensed real
estate brokers in their personal professional capacities. PPI started its commercial operations in November 2017.
On May 18, 2017, FLI, CPI and FCI, subscribed to 53.0 million common shares of Pro-Excel. On December 26, 2019, CPI and FCI
entered into a Deed of Assignment to sell its ownership in Pro-Excel to FAI. The resulting ownership interest of FLI is 32.9%. The
primary purpose of Pro-Excel is to engage in the business of administration, maintenance and management of real estate development,
controlled development projects and subdivision projects.
On August 3, 2017, RPI, a wholly owned subsidiary of FLI was incorporated. Its primary purpose is to provide administrative support
services and skills training primarily through the use of information technology, licensed software, and systems. RPI has started its
commercial operations in November 2017.
On November 20, 2017, FLTI, a wholly owned subsidiary of FLI, was incorporated with the primary purpose of acquiring by
purchase, lease, donation and/or to own, use, improve, develop, subdivide, sell, mortgage, exchange, lease, hold for investment and
deal in real estate of all kinds. FLTI started its commercial operations in March 2018.
.
On January 19, 2018, FLI entered into a Share Sale and Purchase Agreement to purchase 100% of the total outstanding shares of GPRDI
for a total consideration of P=1.7 billion. The primary purpose of GPRDI is to hold, purchase, lease, contract of otherwise acquire any
and all real and personal properties. GPRDI has not started its commercial operations as of December 31, 2020.
On July 18, 2018, the SEC approved TSNC’s application on voluntary revocation of its secondary registration which allowed TSNC to
proceed with the transition to its new business model. On November 15, 2018, the BOD approved the amendment to change the primary
purpose of the Club from an exclusive recreational sports club to a for profit commercial facility. On July 24, 2019, TSNC submitted
its Amended Articles of Incorporation to SEC. The amendments include (a) change of the primary purpose of TSNC from that of an
exclusive recreational sports club to a real estate development Company; (b) change of TSNC’s principal address from No. 173 P.
Gomez Street, San Juan, Metro Manila to Timberland Heights, Barangay Malanday, San Mateo Rizal; (c) converting of TSNC’s capital

16
stock from no par value club shares to par value shares; (d) removal of provisions which characterizes TSNC as an exclusive non-profit
association; and (e) removal of paragraphs which relate to the operations of an exclusive recreational sports club. On August 1, 2019,
the SEC approved TSNC’s application on voluntary revocation of its secondary registration. On August 18, 2019, the SEC approved
TSNC’s Amended Articles of Incorporation.
On March 18, 2019, ProOffice, a wholly owned subsidiary of FLI, was incorporated to engage in the business of administration,
maintenance and management of real estate developments and projects. ProOffice started its commercial operations in August 2019.
On July 4, 2019, PROMEI, a joint venture company with Engie Services Asia Pacific Pte. Ltd. doing business as ENGIE was
incorporated to operate, maintain and repair existing and future technical systems, including but not limited to heating, ventilation and
air conditioning systems district cooling systems and distributed energy systems, and implement new technologies in connection with
saving energy and reducing operating costs. PROMEI is 47.5% owned by FDC and 52.5% owned by ENGIE. PROMEI has not started
its commercial operations as of December 31, 2020.
On October 11, 2019, PMAC, a wholly owned subsidiary of DPI, was incorporated mainly to operate concrete batching plant,
manufacture and supply of pre-cast and construction equipment and rental. PMAC has not started its commercial operations as of
December 31, 2020.
On June 24, 2020, the deed of absolute sale of SAPI shares from FAI to MC was executed upon satisfaction of the conditions under the
joint venture agreement. As a result, FAI conveyed 40% of the issued and outstanding common shares and 40% of the issued and
outstanding redeemable preferred shares of SAPI to MC which resulted to deconsolidation of SAPI from FAI. SAPI, which is now
accounted as investment in joint venture, was incorporated on December 16, 2019 to engage in the developments of real estate properties
and/or managing commercial, recreational facilities and residential, office buildings and other related activities. SAPI has not started
commercial operations as of December 31, 2020.
On December 16, 2020, FLI subscribed to 382,500 shares (120,000 common shares and 262,500 preferred shares) both with par value
of P=100.0 per share for total consideration of P=47.3 million of NSI. The resulting ownership interest of FLI and FHC in NSI after the
subscription is 75.0% and 25.0%, respectively. Prior to the subscription, NSI was 100.0% owned by FHC. There is no change in control
over NSI at the consolidated level. NSI was incorporated on August 24, 2018 to conduct real estate activities primarily focusing on
hotels, inns, resorts, lodging houses and all adjunct accessories thereto, including restaurants, cafes, bars, stores, and offices. NSI has
not started commercial operations as of December 31, 2020.
On December 21, 2020, FDC subscribed to 110.0 million common shares of DPI. The resulting ownership interest of FDC and FLI in
DPI after the subscription is 55.0% and 45.0%, respectively. Prior to the subscription, DPI was 100.0% owned by FLI. This change in
ownership interest without loss of control is treated as an equity transaction and resulted in adjustments to retained earnings and
noncontrolling interest amounting to P=25.3 million. DPI, which was incorporated on January 11, 2017 to engage in a general construction
business started its commercial operations in February 2017.
On December 23, 2020, CPI entered into a Deed of Assignment to sell its interest in ProOffice to FLI for a total consideration of
P=17.2 million. The resulting ownership interest of FLI and FCI in ProOffice after the transfer is 75.0% and 25.0%, respectively. The
transaction has no impact on the consolidated financial statements. ProOffice, which was incorporated on March 18, 2019 to engage in
the business of administration, maintenance and management of real estate developments and projects, started its commercial operations
in August 2019.
FLI’s Equity Investment in CTI, Pro-excel, FAI, FMI and DPI
CTI
FLI has 30% interest in CTI which is accounted as an investment in an associate. CTI is primarily involved in information technology
service management.
Pro-Excel
On December 26, 2019, CPI and FCI, wholly owned subsidiaries of the Parent, entered into a Deed of Assignment to sell ownership in
Pro-Excel to FAI. The sale resulted to a loss of control in Pro-Excel and deconsolidation by the Group. As of December 31, 2019, the
remaining ownership of the Parent Company in Pro-Excel is 33%. No significant transaction transpired between the date of sale and
reporting date resulting in no share in net earnings of Pro-Excel for the year ended December 31, 2019. Pro-Excel is engaged in the
business of administration, maintenance and management of real estate development, controlled development projects and subdivision
projects.

17
FAI
FAI was incorporated on August 25, 1993 and started commercial operations in October 1995. FLI has a 20.0% equity interest in FAI.
FAI’s major project is the master-planned development of Filinvest City, a 244-hectare premier satellite city development project which
has been designed using modern and state of the art, ecological, urban planning with a mixed-use integrated development with office,
retail, residential, institutional, leisure and hospitality projects in southern Metro Manila. Located at the southern part of Metro Manila
and adjacent to the South Expressway, Filinvest City is approximately 16 kilometers (km) south of Makati, the central business district
in Manila and 10 km from the Ninoy Aquino International Airport. Filinvest City is surrounded by over 2,800 hectares of developed
high-end and middle-income residential subdivisions and commercial developments. The said project is under a joint venture agreement
with the Government.
FMI
FMI was incorporated on March 31, 2016 and started commercial operations in June 2016. FLI has a 47.5% equity interest in FMI.
FMI entered into a long-term lease of the Mimosa Leisure Estate after it bagged the rights to lease, develop and operate the 202-hectare
estate development. There is a hotel launched with 303 rooms and a 36-hole golf course.
DPI
DPI was incorporated on January 11, 2017 to engage in and carry on a general construction business. DPI started its commercial
operations in February 2017. DPI was deconsolidated from the Group and became associate effective December 17, 2020.
Business Groups, Product Categories, Target Markets and Revenue Contribution
As a result of the recent business developments, FLI is now composed of two business segments with corresponding product categories,
target markets and revenue contributions as follows:
Real Estate Segment
FLI’s main real estate activity since it started operations has been the development and sale of residential property, primarily housing
units and subdivision lots; in certain cases, provision of financing for unit sales.
Landed Residential Housing
Since it began commercial operations, FLI’s core business has been developing and selling residential subdivisions and housing units
in the Philippines. In the 1990s, FLI started developing affordable housing units in the Philippines. Since then, the Group has ventured
into the development of other real estate products, such as MRBs and HRBs. FLI’s residential projects include houses, lots, MRBs and
HRBs, which are offered in the socialized, affordable, middle income and high end housing segments.
Socialized Housing
These developments are marketed and sold under FLI’s Pabahay brand and consist of projects where lots typically sell for
P160,000.0 or less per lot and housing units typically sell for P580,000.0 or less per unit. Buyers for these projects are eligible to
obtain financing from the Government-mandated Pag-IBIG Fund. Maximum sale prices for the Company’s specialized housing
products do not exceed the Government-mandated ceilings of P580,000.0 per unit. Any income realized from the development and
improvement of socialized housing cites are exempt from taxation.
Affordable/Middle-Income Housing
Affordable housing is marketed and sold under FLI’s Futura Homes brand and consist of projects where lots are typically sold at
prices ranging from P160,000.0 to P750,000.0 and housing units from above P450,000.0 to P1,500,000.0. FLI designs and
constructs homes in this sector with the capacity and structural strength to give the owner the option to build an additional storey,
which can double the available floor area. Affordable housing projects are typically located in provinces bordering Metro Manila,
including Rizal, Pampanga, Bulacan, Laguna, Batangas and Cavite, and in key regional cities such as Tarlac, Cebu, Iloilo, Cotabato,
Palawan, Negros, Zamboanga and Davao. Construction of a house in this sector is usually completed approximately six (6) months
from the receipt date of the final installment of the required down payment.
Middle-income housing is marketed and sold under FLI’s Filinvest Aspire brand, with lot-only prices ranging from P750,000.0 to
P1.2 million and housing units from P1.5 million to P4.0 million. Middle-income projects are typically located within Metro
Manila, nearby providences such as Rizal, Tarlac, Cavite, Pampanga and Laguna, and major regional urban centers in Cebu,
Palawan, Butuan, Cagayan de Oro, Davao, and Zamboanga. A typical home in the middle-income projects has 2 stories. Houses
in this sector are designed and constructed with the capacity and structural strength to allow the owner to add extensions to the
existing structure. Construction of a house is usually completed approximately nine (9) to twelve (12) months from the receipt date
of the final installment of the required down payment.
High-End Housing
Marketed under Filinvest Prestige brand, these developments consist of projects where lots are sold at prices above P1.2 million
and housing units for above P4.0 million. FLI also markets high-end housing projects under the Filigree brand for its more exclusive
developments. FLI’s high-end housing developments are typically located within Metro Manila and in areas immediately outside
Metro Manila and in major regional urban centers in Cebu. A typical home in a high-end housing project has 2 stories. Homes in
this sector are designed and constructed with the capacity and structural strength to allow the owner to add extensions to the existing

18
structure. Construction of a house is usually completed approximately 9 to 12 months from the receipt date of the final installment
of the required down payment.
Vertical Residential Housing
Medium-Rise Buildings
MRB projects are designed in clusters of buildings that surround amenities with the intention of providing a quiet environment within
an urban setting. MRBs are typically five (5) stories with an elevator and include studio, one bedroom and 2 bedroom units. The FLI’s
policy is to commence construction of an MRB building when at least 50.0% of the units in the building has been sold. From a
developer’s perspective, MRBs offer several benefits compared to high-rise developments. MRBs can generally be constructed in less
than one year once all approvals have been obtained, which reduces the risk borne by FLI between the launch and delivery of a project.
The lower height of MRBs also reduces construction costs compared with high-rises which require extra reinforcement to protect against
earthquake damage.
MRBs are marketed under FLI’s Oasis brand for the middle-income market and under FLI’s Spatial brand for the affordable housing
market. MRBs under the Oasis brand typically have per-unit prices ranging from ₱2.0 million to ₱4.4 million depending on the size of
the unit, while MRBs under the Spatial brand typically have per-unit prices ranging from ₱1.7 million to ₱3.6 million. MRBs offer low-
density development and lower association dues compared with high-rise condominium buildings, in addition to a lower price per sq.m.
MRBs are generally located in prime urban zones. Further, MRBs are developed to maximize open space, with buildings typically
occupying 30.0% to 35.0% of the development’s land area. In contrast with its other developments, which generally require the down
payment to be paid within 12 months, FLI generally allows MRB purchasers to pay the down payment in installments over a 24-month
period.
As of December 31, 2020, FLI has 30 MRB projects with more than 100 buildings throughout Luzon, Visayas and Mindanao.
FLI currently has the following MRB projects:
Project Name Location
Metro Manila/ Luzon
Asiana Oasis Paranaque City
Bali Oasis Pasig City
Bali Oasis 2 Pasig City
Capri Oasis Pasig City
Fora Tagaytay
Fortune Hill San Juan City
Futura East Cainta, Rizal
Maui Oasis Sta. Mesa, Manila
One Oasis Ortigas Pasig City
One Spatial Pasig City
Panglao Oasis Taguig
Sorrento Oasis Pasig City
The Signature Balintawak, Quezon City
Verde Spatial
Alta Spatial
Centro Spatial
Belize Oasis
Quezon City
Valenzuela City
Manila
Muntinlupa
Visayas
Amalfi Oasis City di Mare, Cebu
Marina Spatial Dumaguete
One Oasis Cebu Mabolo, Cebu City
One Spatial Iloilo Iloilo
San Remo Oasis City di Mare, Cebu
Umi Garden City di Mare, Cebu
Mindanao
Centro Spatial Davao City
Eight Spatial Maa, Davao
One Oasis Cagayan de Oro Cagayan de Oro
One Oasis Davao Davao City
Veranda Resort Condos
Maldives Aspire
Futura Vinta
Davao
Davao
Zamboanga

19
High-Rise Buildings (HRBs)
FLI develops HRBs in prime areas. HRBs are at least 18 stories, with various floor plans and designs depending upon the demographics
of the target market for each building. FLI’s policy is to commence construction of a HRB when at least 50% of the units in the building
has been sold. From a development perspective, HRBs generally can be constructed in 2 years once all Government approvals have
been obtained.
The Linear
The Linear, a master-planned residential and commercial hub in Makati City. 2 L-shaped towers, each twenty-four (24) storeys high,
comprise this dynamic condominium community that perfectly caters to the needs of young urban professionals.
Studio City
Studio City is a community composed of a five-tower residential condominium complex within the Filinvest City to serve the demand for
housing of the growing number of professionals working within Filinvest City and in the nearby Madrigal Business Park.
Since it is located within the Filinvest City, residents will enjoy proximity to Festival Supermall, Westgate Center, Northgate Cyberzone,
Asian Hospital and Medical Center, and other commercial, educational and medical institutions. The development consists of eighteen
(18) storeys per building with commercial units at the ground floor. All residential floors will have twenty-five (25) studio units per floor.
Studio Tower 5 is under construction.
The Levels
Located at one of the highest points of Filinvest City at around 23 meters above sea level, The Levels is a one-block, four (4)-tower
residential condominium development that features laidback suburban living inside a fast-paced business district. The residential
development is set in a tropical landscape, with four (4) towers uniquely designed with terracing levels, giving it a castle-effect look. The
high-rise sections will be set in lush greenery, providing residents with views of the gardens. The second tower has just been launched.
Vinia Residences
Vinia is a 25-storey condominium development located along EDSA in Quezon City, right across TriNoma and just steps away from the
MRT-North Avenue station. With its coveted location, it offers a world of ease and convenience to yuppies and families looking for quality
homes, as well as budding entrepreneurs who want to start a home-based business at the heart of the city.
Studio Zen
Studio Zen is a 21-storey condominium development located along Taft Avenue in Metro Manila. Student-oriented amenities, Zen-inspired
features, and functional building facilities makes it an ideal residence for students living independently and a great investment opportunity
for entrepreneurs who want to take advantage of the ready rental market in the area.
Studio A
Studio A is a single tower 34-storey hi-rise residential condominium located in Loyola Heights in Quezon City. A community conveniently
situated near premier universities, the LRT 2 line and other commercial establishments.
100 West
100 West is a single tower 38-storey high-rise commercial and residential condominium with office spaces located in Gen. Gil Puyat
Avenue corner Washington St. in Makati City. 100 West is in the Makati Business District and accessible to both north and south of Metro
Manila.
Studio 7
Studio 7 is a mixed-use development that will have office and residential towers complemented with retail outlets, located in Quezon City
along EDSA very close to the GMA-Kamuning MRT station. Studio 7 will have studios as well as one-bedroom residential units.
Activa
Activa is a mixed-use development with residential, office, and retail components. It is entrenched in the heart of Quezon City's busiest
and liveliest district, Cubao. Situated at the crossroads of 2 of the metro's most vital thoroughfares. Activa connects to the north and south
via EDSA, and to the east and west via Aurora Boulevard. It also has direct access to the MRT and LRT lines, and accessible by various
modes of transportation like buses and jeepneys.
FLI expects to remain focused on core residential real estate development business which includes landed housing, MRBs and high-rise
condominium projects, residential farm estates, entrepreneurial communities, and leisure developments in response to the demands of the
Philippine market.
In 2021, FLI intends to retain its dominant position as the leader in MRB projects by launching five (5) new projects nationwide and
eleven (11) additional buildings of existing projects. Aside from the MRBs, FLI has pipelined eleven (11) horizontal residential projects
and 2 HRB projects.

20
Analysis of Real Estate Sales
The table below shows a comparative breakdown of FLI’s journalized real estate sales into various product categories for the years
ended December 31, 2020, 2019 and 2018 (amounts in P millions).
2020 % 2019 % 2018 %
Real estate sales by market segment
Medium income P=7,332.0 74.5% P=9,480.5 55.7% P=8,014.9 55.6%
Affordable 605.9 6.2% 3,490.9 20.5% 3,280.1 22.8%
Low affordable 769.4 7.8% 1,924.8 11.3% 1,490.4 10.4%
High-end 1,027.5 10.5% 1,771.7 10.4% 1,344.6 9.3%
Socialized 102.3 1.0% 345.2 2.1% 274.2 1.9%
P=9,837.1 100.0% P=17,013.1 100.0% P=14,404.2 100.0%
Analysis of Cost of Sales
The table below shows a comparative breakdown of FLI’s journalized cost of sales by cost component for the years ended
December 31, 2020, 2019, and 2018 (in P millions):
2020 2019 2018
Land acquisition cost 839.2 2,491.3 1,926.5
Land development and construction cost 4,747.6 7,362.6 6,412.7
Total 5,586.8 9,853.9 8,339.2
Leisure Projects
The Group’s leisure projects consist of its condotels, residential farm estates, residential resort developments private membership
clubs. The Group is also considering expanding its leisure offerings to include complementary ventures, such as diving and golfing.
Condotels
FLI developed the 25-storey Grand Cenia Condotel and Residences, which is strategically located across the Cebu Business Park, a joint
venture project of FLI, as developer, and Gotianun Family-owned GCK Realty Corporation, as landowner. Under the terms of the joint
venture agreement, GCK Realty Corporation contributed 4,211 sq.m. of land to be developed in accordance with a master development
plan in exchange for an 8% interest in the joint venture. The condotel units are targeted to business travelers, returning OFWs and
expatriate Filipinos. Owners of individual condotel units are required to place their units in a rental pool that will be operated as a
business hotel. Owners are entitled to use the unit for14 days annually. The units were handed over to the condotel buyers for preparation
for hospitality operations. In 2012, the hotel started operating as the Quest Hotel and Conference Center, Cebu, a three-star hotel with
business and conference facilities.
In April 2019, the Group opened the 10-storey, 164-room Quest Hotel Tagaytay located in the FLI mixed-used development Tagaytay.
Quest Hotel Tagaytay is strategically located across the Filinvest FORA Lifestyle Mall and is within easy access to all the major
Tagaytay attractions. Quest Hotel Tagaytay is targeted to those looking for a hassle-free second home, returning OFWs and expatriate
Filipinos. Quest Hotel Tagaytay will be the first condotel in the country to be registered with the SEC. Registration has been filed in
August 2020.
Residential Farm Estates
FLI began marketing its residential farm estate projects to customers in 2003, after FLI’s in-house market research indicated that there
was demand among customers, such as retirees and farming enthusiasts, for leisure farms that can serve as alternative primary homes
near Metro Manila. To help attract buyers, the Company maintains demonstration farms in its farm estate projects and also has personnel
on site to provide buyers with technical advice on farming. Customers can purchase lots (with a minimum lot size of 750 sq.m.) on
which they are allowed to build a residential unit (using up to 25.0% of the total lot area). The remaining lot area can be used for small-
scale farming, such as fish farming or vegetable farming. Residential farm estates are sold on a lot-only basis, with buyers responsible
for the construction of residential units on their lots.
As of December 31, 2020 FLI has three (3) residential farm estates under FLI, Nusa Dua Farm Estate, Mandala Residential Farm Estate
and Forest Farms Residential Farm Estate. Nusa Dua Farm Estate is located in Cavite, just south of Metro Manila. Mandala Residential
Farm Estate (Mandala) is located in Rizal province and integrated in FLI’s Timberland Heights township project. Forest Farms
Residential Farm Estate (Forest Farms) is also located in Rizal province as part of FLI’s Havila township project. It is an exclusive
mountain retreat and nature park, located between the hills of Antipolo and the forested area of Angono, Rizal.
Residential Resort Development
FLI entered the high-end residential resort market in 2007 with the launching of the Laeuna de Taal project located along Tagaytay
Ridge, Batangas and the Kembali Coast project and Veranda Resort Condominium in Samal Island, Davao. The residential resorts

21
capture the growing demand for second homes and leisure and retirement destinations of the high-end market segment. Laeuna de Taal,
provides scenic views of the Taal lake, and offers three (3) residential enclaves: Arista, Bahia, and Orilla. Located on the water from of
Laeuna de Taal is the Lake Club, a lakeside amenity designed for wellness, recreation and events. Kembali Coast is an Asian-Balinese
inspired beachfront residential development with a 1.8 kilometer beach, providing seaside resort-style living in the Mindanao area.
Kembali has a total land area of 50 hectares while the Laeuna de Taal project has a total land area of 60 hectares.
Townships
The Group is applying its expertise from the development in Filinvest City to new projects across the country to create more sustainable
and future-ready townships. The Group is in the forefront of developing the Clark Special Economic Zone as one of its largest landlords
with two major township developments, including the 288-hectare logistics and industrial park and mixed-use development at New
Clark City, a joint venture with the Bases Conversion Development Authority, and Filinvest Mimosa+ Leisure City, a 201-hectare
project with residential, office and entertainment developments. The Group identified Clark early on as a growth corridor. FDC and FLI
were the sole bidders in two government bids, which enabled the Group to obtain two large parcels of township land when their
consortium was formally announced as the winning bidder to develop, manage and operate the former Mimosa Leisure Estate on
January 29, 2016. When the Duterte Administration announced in 2018 its Build Build Build program, there were major infrastructure
projects clustered around the Clark area, and surrounding land prices increased significantly. The Government’s infrastructure projects
within the Clark area include the expansion of the CIA, and the Manila-Clark and the Clark-Subic rail projects, with both railways
leading to the New Clark City, which was the site of the 2019 South East Asian Games.
Industrial and Commercial Townships
The Group intends to continue expanding its service offering by allocating a portion of its commercial land bank to the development of
industrial parks. The following townships of the Group integrate primarily industrial and commercial elements in the community.
Filinvest at New Clark City (previously known as Clark Green City)
In September 2015, FLI won the bid for the right to own 55.0% of a joint venture company with the BCDA, which joint venture company
would be tasked with the development, marketing, management and leasing of the first phase of New Clark City. New Clark City is a
residential, commercial and office mixed-use development anchored by a logistics and industrial park in Central Luzon that covers 288
hectares of land adjoining Clark Freeport Zone and CIA. In 2016, FLI and BCDA established their joint venture company, FBCI, which
engaged Broadway Malyan as the master planner of the township development at New Clark City.
Filinvest Mimosa+ Leisure City in Clark
In 2016, together with FDC and the Clark Development Corporation, FLI formed FMI, which entered into a 50-year lease (renewable
for another 25 years) with the CDC for the development, management and operation of Filinvest Mimosa+ Leisure City. Filinvest
Mimosa+ Leisure City covers 201 hectares in the Clark Special Economic Zone and is intended to be a premier lifestyle destination in
Central Luzon which combines residential, commercial and entertainment areas. The city is envisaged to be a leisure metropolis that is
future-ready and nature-inspired. Through its redevelopment master plan, the Group is aiming to establish Filinvest Mimosa+ Leisure
City as a key tourism and commerce destination to encourage growth and innovation within the Clark region. With its prime location in
the Clark Freeport Zone, Filinvest Mimosa+ Leisure City aims to provide investors and entrepreneurs a place in which they can grow
and expand their business.
City di Mare in South Road Properties, Cebu
City di Mare or “City by the Sea”, is a 50-hectare master-planned development located in South Road Properties, Cebu, and is the largest
mixed-use development in South Road Properties. City di Mare was developed as a joint venture project with the Government with a
view to creating a new location for businesses and investors to expand and for economic and lifestyle activities to thrive. It is composed
of three different zones, including residential, commercial and entertainment, with a view to catering to a wide array of lifestyles and
activities in line with the Group’s “live, work, play” concept.
Residential Townships
The Group also has the following townships, which are primarily residential, complemented by retail and public services such as schools,
health centers and churches. These townships are being developed in phases and, as such, have certain ongoing developments, as
described in the table below:
Havila
Havila is master-planned as a mix of affordable, middle-income and high-end subdivisions in Rizal province overlooking Metro Manila.
With its 306-hectare development, the township offered three major communities such as Mission Hills, Highlands Pointe and Forest
Farm interconnected by linkroad of Antipolo, Taytay and Angono Rizal. New developments in Havila are Mira Valley,Amarilyo Crest
and Amarilyo Residences.
Ciudad de Calamba
Ciudad de Calamba is a 350-hectare Modern Filipino-Hispanic Township development in the gracious City of Calamba, Laguna. It is a
master-planned affordable and middle-income township with an industrial component.

22
Timberland Heights
Timberland Heights, a sprawling 677-hectare premier mountain suburban township development located in the highest peaks of San
Mateo Rizal. It captures the essence of a mountain hideaway, a sporting and leisure paradise and a luxurious country resort in a premier
township development.
Manna East
Manna East, a 60-hectare modern Filipino themed affordable and middle-income community in Teresa, Rizal. Housing construction is
on-going for New Fields Phase 1 (launched Jan 2018). The construction of all amenity areas for New Fields Phase 1 is also expected to
be completed by 3Q 2021. Land development has also commenced in Futura Plains (launched July 2019). FLI is currently planning the
expansion for New Fields and is projecting to launch Phase 2 in 2021. affordable and middle- income community in the eastern Metro
Manila suburbs.
Palm Estates
Palm Estates, 51-hectare township development designed to be a city within Talisay City. The first residential project was launched in
the last quarter of 2016. Land Development works of the 1st phase was completed on September 2020 and construction of housing in
units commenced on March 2021.
Leasing Segment
The Group has a significant leasing portfolio comprising mostly commercial office and retail developments, including 31 office and
BPO buildings, its flagship mall, the Festival Supermall in Filinvest City, and three other community malls located outside Filinvest
City. As of December 31, 2020, the Group has a portfolio of approximately 523,904 sq.m. of leased office space. In addition, the Group
leases commercial lots to other parties mainly in Filinvest City, with a total area of 287,615 sq.m.
The table below shows a breakdown of Group’s recorded gross leasing revenues for the years ended December 31, 2020, and 2019
(amounts in P millions):
Years ended December 31
2020 2019
Amount % to total Amount % to total
Office leasing P=5,319.2 80.0% P=5,170.9 70.9%
Mall and retail 1,110.8 16.7% 1,810.7 24.8%
Land lease 217.1 3.3% 309.6 4.3%
Total P=6,647.1 100.0% P=7,291.2 100.0%
The following table shows the historical GLA of the Group’s commercial properties as of December 31, 2020 and 2019.
2020 2019
(sq.m.)
Office leasing 523,904 523,902
Mall and retail 330,702 317,089
Land lease 287,615 257,317
Total 1,142,221 1,098,308
Commercial Office Properties
As of December 31, 2020, the Group owns commercial office spaces for lease to several BPO and other office locators. Primarily, they
are located in Northgate Cyberzone in Filinvest City, Alabang, Muntinlupa. Northgate is an 18.7-hectare PEZA zone that enjoys
developer incentives. Among the Group’s portfolio is the PBCom tower where FLI owns 60.0% through a FAC, which owns 50.0% of
the 52-storey PBCom Tower in the Makati CBD. PBCom Tower is a Grade A, PEZA-registered, IT/office building on Ayala Avenue,
Makati City with a GLA of 35,148 sq.m. The Group also owns several completed office developments, in Bay City, Pasay, EDSA near
Ortigas MRT station, Clark Mimosa and Cebu IT Park. A summary of the GLA as of December 31, 2020 is set forth below:
Location
Number of
Buildings
GLA
(sq. m.)
Northgate Cyberzone, Filinvest City 19 334,912
Metro Manila outside of Filinvest City 7 116,070
Outside Metro Manila 5 72,922
Total 31 523,904

23
The office buildings of Filinvest are mainly located in business parks or in mixed-used complexes highly accessible to public transport.
The Group believes its business park model, wherein the Group builds on areas specifically suited for business and industrial
establishments supported, in certain cases, by incentives from the Government, gives it a competitive advantage as business parks are
the preferred site of major BPO tenants. Being located in a major business park allow the tenants assurance of expansion options within
close proximity thereby giving the Group an advantage over stand-alone developments.
• Northgate Cyberzone, an 18-hectare, PEZA-registered IT park located in Filinvest City in Alabang. The office buildings of the
Group sit within the 10-hectare parcel of land in the Northgate district owned by FLI.
• Mimosa Workplus, an office village that is comprised of eight buildings set amidst the lush natural environment of the Filinvest
Mimosa+ Leisure City.
• Cyberzone Cebu and Filinvest IT Park are two distinct developments on two separate Build-Transfer-Operate (BTO) arrangements
with the Cebu Province. The two parcels of land totaling 2.9 hectares are in close proximity to the city center located along Banilad
and Salinas Avenue in Cebu. Together these comprise 7 office towers, a mall and a hotel development. The office and mall portions
are pre-certified LEED Gold rating.
• Filinvest Cyberzone Bay City, a 4-tower office complex in the bustling section of the Bay Area. Its four towers are already
completed and operating, and fully leased by POGOs. The complex is also certified LEED Silver rating.
• 100 West is part of a mixed used building in the Makati Central Business District. Office space allocated is approximately
14,333 sq. m.
Ongoing Construction
• Activa is a 1.37 hectare mixed use development at the corner of EDSA and Aurora Boulevard and lies in close proximity to the
Cubao LRT and Cubao MRT Stations. The development will have the following: BPO office tower, a traditional office tower,
residential tower, hotel and a retail mall. The designs for the BPO office and mall portions are pre-certified with LEED Gold rating.
• Studio 7 is a two (2)-tower mixed-use complex comprising of residential and office buildings on a retail and parking podium.
Located along major thoroughfare EDSA in Quezon City, it is strategically located close to the GMA Kamuning Metro Rail
Transit 3 Station and is a pre-certified LEED Silver rating.
Existing Retail Spaces for Lease
The Group’s retail development is carried by its Filinvest Lifemalls brand. Filinvest Lifemalls are entertainment and lifestyle-oriented
malls that complement the Group’s CBD and township developments. As of December 31, 2020, the Group has 330,702 sq.m. of GLA
from retail developments, the flagship of which is the Festival Supermall. The Group’s Festival Supermall and other Filinvest Lifemalls
are described below. In addition to the malls described below, the Group’s retail developments also include other retail spaces with an
aggregate of 18,000 sq.m. of GLA.
Festival Supermall
Festival Supermall is a four-story shopping complex located within FAI’s Filinvest City development. The mall has a GLA of 170,931
sq.m. FLI is leasing from FAI the 10 hectares of land on which the mall and its adjoining structures (such as parking lots) are situated.
The lease is for a term of 50 years from 2006, renewable for another 25 years. The Landmark department store has leased one hectare
of land from FAI for a term of 24 years from 2014. Designed as a lifestyle mall, the development features digital and Festival Gold
cinemas, theme parks, religious centers, health and dental clinics, exhibit and trade halls, and a river park (with al fresco dining options)
that overlooks the soon-to-be-completed Marian Chapel. The mall also has an amusement attraction train which traverses the mall from
one end to the other. Festival Supermall has approximately 1,500 local and global tenants. The mall has four anchor stores: Robinson
Department Store, Save More Supermarket, Landmark Supermarket and Department Store and Shopwise Supermarket, and four mini-
anchor stores: H&M, Decathlon Concept Store, Handy Man Do It Best of Robinson’s Retail and Ace Hardware. In 2017, the Group
completed its expansion of Festival Mall, which increased the land area occupied by the mall to 18 hectares and the total GLA to 170,931
sq.m from 124,087 sq.m. The expanded Festival Mall features open and green spaces, including a water garden that serves as the main
outdoor entertainment area of the expansion wing.
Mall Location GLA (sq.m.) Features
Fora Mall Tagaytay Rotunda 26,000 • 24-hour super metro anchor store
• Four digital cinemas
• Open air amphitheater and forest landing
feature with canopy walk
• Beside Quest Hotel
Main Square Bacoor, Cavite 18,000 • Robinsons Supermarket
• Watsons, Ace Hardware, Western
Appliances, DIY

24
Mall Location GLA (sq.m.) Features
• Anytime Fitness
• Starbucks, Coffee Bean & Tea Leaf
• Beside Bacoor City Hall
Il Corso City di Mare, Cebu 34,000 • Seaside waterfront boardwalk with al
fresco dining
• Central piazza with dancing fountain
• Fully-functional lighthouse and battleship
playground for children
• Cebuano Home-Grown Food Concepts
(LagunaCafé Group,Chikaan, Fishes, etc)
Westgate Filinvest City 53,000 • Popular dining establishments
• Car showrooms
• Residential havens and urban home
essential shops
• Wellness centers
• S&R and first standalone
• Uniqlo building
South Station Filinvest City 12,000 • Main transport hub of Filinvest City
• Several retail outlets
The Group will continue to carry out an intensive marketing campaign so to maintain high occupancy rates in its investment properties
to maximize leasing revenues.
Marketing and Sales
Real Estate Segment
FLI develops customer awareness through marketing and promotion efforts as well as referrals from satisfied customers. The Group has
a real estate marketing team and a network of sales offices located in the Philippines, Italy and Japan, as well as accredited agents in
other parts of Europe, HongKong, Singapore, and the Middle East. FLI’s marketing personnel, together with in-house sales agents and
accredited agents, gather demographic and market information to help assess the feasibility of new developments and to assist in future
marketing efforts for such developments.
FLI conducts advertising and promotional campaigns principally through print and broadcast media, including billboards, fliers, and
brochures designed specifically for its target markets. Advertising and promotional campaigns are conceptualized and conducted by
FLI’s marketing personnel and by third-party advertising companies. These campaigns are complemented by additional advertising
efforts, including booths at shopping centers, such as Festival Supermall, and other high traffic areas, to promote open houses and other
events.
FLI also believes that the Overseas Filipino Worker (OFW) population, as well as expatriate Filipinos, constitutes a significant portion
of the demand for affordable and middle-income housing either directly or indirectly by remitting funds to family members in the
Philippines to purchase such properties. As a result, FLI has appointed and accredited independent brokers in countries and regions with
large concentrations of OFWs and expatriate Filipinos, such as Italy, Japan, the United Kingdom and the Middle East. These brokers
act as the Company’s marketing and promotion agents in these territories to promote the Company and its products. The Company also
sponsors road shows to promote its projects, including road shows in Europe, targeting the OFW and Filipino expatriate markets. FLI
also markets its properties on the Internet.
Sales for FLI’s housing and land development projects are made through both in-house sales agents and independent brokers. Both
FLI’s in-house sales agents and independent brokers are compensated through commissions on sales. In-house sales agents also receive
a monthly allowance and are provided administrative support by FLI, including office space and expense allowances.
In addition to in-house sales agents and independent brokers, FLI also employs representatives who staff its sales offices and provide
customers with information about FLI’s products, including financing packages and technical development assistance. FLI also assigns
each project a sales and operations coordinator who will provide customers with assistance from the moment they make their sales
reservation, during the process of obtaining financing, and through the steps of establishing title on their new home. FLI also has
personnel who can advise customers on financing options, collecting necessary documentation and applying for a loan. FLI also helps
design down payment plans for its low-cost housing customers that are tailored to each customer’s economic situation. Further, once a
house is sold and delivered, FLI has customer service personnel who are available to respond to technical questions or problems that
may occur after delivery of the property.

25
Leasing Segment
Various professional, multinational commercial real estate leasing agents (including, but not limited to Jones Lang LaSalle, CB Richard
Ellis and Colliers) are accredited to scout for tenants for its office spaces. These agents work on a non-exclusive basis and earn
commissions based on the term of the lease.
FLI also maintains, through its subsidiaries, an in-house sales team to market its office & commercial spaces.
Customer Financing for Real Estate Projects
The ability of customers to obtain financing for purchases of subdivision lots or housing units is a critical element in the success of
FLI’s housing and land development business. Customer financing is particularly important in relation to sales of FLI’s socialized
housing projects, where most prospective buyers require financing for up to 100.0% of the purchase price. FLI therefore assists qualified
homebuyers in obtaining mortgage financing from government-sponsored mortgage lenders, particularly for its socialized housing
projects, and from commercial banks. FLI also provides a significant amount of in-house financing to qualified buyers. The interest
rates charged by FLI for in-house financing typically range from 11.5% per annum to 19.0% per annum, depending on the terms of the
loan.
In-house financing
FLI offers in-house financing to buyers who choose not to avail of Government or bank financing. FLI typically finances 80.0% of the
total purchase price, which is secured primarily by a first mortgage over the property being sold. The loans are then repaid through
equal monthly installments over periods ranging from 5 to 10 years. The interest rates charged by FLI for in-house financing typically
range from 11.5% per annum to 19.0% per annum, depending on the terms of the loan.
Pag-IBIG Fund
A substantial number of buyers of FLI’s socialized housing units, as well as some affordable housing units, finance their purchasers
through the Home Development Mutual Fund or Pag-IBIG Fund. To provide a liquidity mechanism to private developers, the Pag-IBIG
Fund has instituted a take-out mechanism for conditional sales contract receivables and mortgages and repurchases receivables from
housing loans of its members.
Mortgage Loans
Mortgage loans from commercial banks are usually available to individuals who meet the credit risk criteria set by each bank and who
are able to comply with each bank’s documentary requirements. In addition to taking security over the property, a bank may also seek
repayment guarantees from the Home Guaranty Corporation. To assist prospective buyers obtain mortgage financing from commercial
banks, FLI also has arrangements with several banks to assist qualified customers to obtain financing for housing unit purchases.
Deferred Cash Purchases
In recent years, in addition to the aforementioned financing arrangements, FLI has offered so-called “deferred cash” purchases,
particularly for its high-end and leisure developments. Under this arrangement, the entire purchase price is amortized in equal
installments over a fixed period, which is typically 24 months. (Title to the property passes to the buyer only when the contract price is
paid in full or when the buyer executes a real estate mortgage in favor of FLI which can be annotated on the title to the property.)
Real Estate Development
FLI’s real estate development activities principally include the purchase of undeveloped land or entering into JVAs covering
undeveloped land, the development of such land into residential subdivisions or other types of development projects, the sale of lots,
the construction and sale of housing units and the provision of financing for some sales.
The development and construction work are contracted out to a number of qualified independent contractors on the basis of either
competitive bidding or the experience FLI has had with a contractor on prior project. FLI weighs each contractor’s experience, financial
capability, resources and track record of adhering to quality, cost and time of completion commitments. FLI maintains relationships
with over 100 independent contractors and deals with them on an arm’s length basis.
FLI does not enter into long-term arrangements with contractors and construction contracts typically cover the provision of contractor’s
services in relation to a particular project or phase of a project. FLI also provides, in certain cases financial guarantees of payment to
FLI-specified suppliers for purchases of construction materials. Progress payments are made to contractors during the course of a project
development upon the accomplishment of pre-determined project performance milestones. Generally, FLI retains 10.0% of each
progress payment in the form of a guarantee bond or cash retention for up to 1 year from the date the contracted work is completed and
accepted by FLI to meet contingency costs.

26
FLI is not and does not expect to be dependent upon one or a limited number of suppliers or contractors. Its agreements with its
contractors are in the nature of supply of labor and materials for the development and/or construction of its various real estate projects.
Research and Development
Although the Company engages in research and development activities focusing on the house designs, types of construction materials
to be used for its housing units, construction methodology, value-engineering for its projects and quality assurance, the expenses incurred
by the Company in connection with these activities are not material.
Filinvest Alabang, Inc.
FAI’s main project is the master-planned development of Filinvest City, a 244-hectare premier satellite city located in Alabang,
Muntinlupa City in the southern part of Metro Manila approximately 16 km south of Makati, the central business district in Manila and
10 km from the Ninoy Aquino International Airport. Filinvest City is a fully integrated, self-contained satellite city which serves as a
viable urban residential and business alternative to Makati for the southern Metro Manila area and a business centre for the southern
Tagalog provinces. The mixed-use development concept incorporates commercial and residential properties in a complementary manner
and provides for a balance of recurring rental income from office and retail space as well as trading income from sale of lots and
condominium units. Filinvest City is a joint venture development with Government entities, namely the Department of Environment
and Natural Resources (DENR) and the Philippine Reclamation Authority (now with Land Management Bureau), in which FAI has a
74.0% interest. Over the past few years, land sale prices in Filinvest City have risen, driven by improved accessibility and economic
growth. In particular, the completion of the Skyway extension from Sucat to Alabang in April 2011 has caused land prices in the
surrounding area to increase. As of December 31, 2020, FAI recorded a record high land sale price of P428,960 per sq.m.
The development obligations of FAI in Filinvest City have been substantially completed. Construction of the entry/exit of the Skyway
into Filinvest City was completed and opened to the public in May 2011.
Location
Set out below is a map showing the location of Filinvest City relative to the Makati, Ortigas and Bonifacio Global City.

27
Site Development
Set out below is the site development concept of Filinvest City. The model below may not necessarily represent the eventual state of the
actual property development.
Land Use
The following table shows the estimated mix of office, retail, residential, institutional and leisure properties that
Filinvest City is expected to have when the project is fully completed, as well as certain details relating to developments at Filinvest
City as of December 31, 2020. The land use and gross floor area estimates below may be adjusted as market trends develop and may
not necessarily represent the eventual state of the actual property development.
Lot area Expected gross
Land Use allocated floor area
(sq.m) (sq.m)
High-rise office and condominium 711,095 5,636,136
Commercial and mixed-use 518,794 1,499,620
Residential subdivision 49,182 49,182
Leisure/hospitality 91,475 278,140
Institutional/government 241,458 325,012
Roads and open space 835,539 —
Total 2,447,543 7,788,090
As of December 31, 2020, FAI beneficially owns 77 hectares of unsold lots in Filinvest City comprising 29 hectares held through joint
ventures (in which FAI beneficially owns 21 hectares) and 55 hectares owned directly by FAI. Of the 55 hectares, 22 hectares remain
unused. 34 hectares is rented out or being used for recurring business.
Office and Condominium Zone
The office zone is currently concentrated in two districts of Filinvest City, the Spectrum and Northgate districts. A variety of office
centres are owned and operated, or under development, by third parties in these districts. FLI’s Northgate Cyberzone, is located at
Northgate District. For details, see ‘‘— Filinvest Land, Inc. — Northgate Cyberzone.’’ FAI also develops its own buildings in the office
zone under the concept of small office-home office (SOHO). SOHO buildings are compact units designed to provide a flexible, efficient
work place and living space. The SOHO units are developed for sale rather than for lease.
Commercial and Mixed-Use Zone
A variety of major retail establishments at Filinvest City are owned and operated by third parties. In addition, FLI owns Festival
Supermall, which is located at Filinvest City. See ‘‘— Filinvest Land, Inc. — Festival Supermall.’’ FAI also develops its own retail
leasing projects.

28
Marketing and Management
The day-to-day operations in the retail zone, including leasing and general mall management, is managed by FSI pursuant to various
management contracts entered into by FSI with the owners and developers of various retail projects. The contracts are on a continuing
basis until terminated with 90-day advance notice by any of the parties.
As of December 31, 2020, FSI had approximately 239 personnel in its organization, responsible for the day-to-day operations of the
retail zone. Engineering, maintenance, security and janitorial services for the mall and other retail establishments were outsourced to
reputable third-party service providers on an annual contractual basis and reviewed annually by FSI.
Residential Zone
Filinvest City provides an urban residential alternative to the surrounding residential subdivisions. FAI is engaged in the development
of a number of high-rise residential condominiums within Filinvest City. Each condominium’s design varies according to its target
market and income segment.
Leisure and Hospitality Zone
Filinvest City includes several hotels and condotels owned and managed by third parties, in addition to CFCM, a hotel that FAI launched
in December 2012 within its mixed-use Entrata complex. CFCM has 345 rooms on 27 storeys and is managed by Chroma under the
Crimson brand. The hotel had its grand opening in March 2013.
In addition to hotels and condotels, Filinvest City is also the site of leisure projects, including the Palms Country Club. To enhance the
value of its high-end residential projects in Filinvest City and to attract buyers to these projects, FAI established its own exclusive sports
and leisure club, a 30,000-sq.m. private membership club that hosts banquets, corporate functions and other events for its members. FAI
sells individual and corporate club shares.
Institutional and Government Zone
Filinvest City has institutional establishments, including both the private sector and Government entities. Filinvest City has become a
hub for health and medical care and home to Asian Hospital, Ospital ng Muntinlupa, Food and Drug Administration and other
Government-run medical facilities.
Competition
Real Estate Segment
Real estate development and selling are very competitive. FLI believes it is strongly positioned in the affordable housing income and
middle-income residential subdivision market and in the farm estates. Success in these market segments depends on acquiring well-
located land at attractive prices often in anticipation of the direction of urban growth. FLI believes that its name and reputation it has
built in the Philippine property market contributes to its competitive edge over the other market players. On the basis of publicly available
information and its own market knowledge, FLI’s management believes that it is among the leading housing and land project developers
in the Philippines, particularly in the socialized to middle-income housing sectors. FLI’s management also believes that FLI is able to
offer competitive commissions and incentives for brokers, and that FLI is able to compete on the basis of the pricing of its products,
which encompasses products for different market sectors, as well as its brand name and its track record of successful completed quality
projects.
FLI directly competes with other major real estate companies positioned either as a full range developer or with subsidiary companies
focused on a specific market segment and geographic coverage. Its direct competitors include Ayala Land Inc., Vista Land, Robinsons
Land, DMCI and SMDC.
FLI faces significant competition in the Philippine property development market. In particular, FLI competes with other developers in
locating and acquiring, or entering into joint venture arrangements to develop, parcels of land of suitable size in locations and at attractive
prices. This is particularly true for land located in Metro Manila and its surrounding areas, as well as in urbanized areas throughout the
Philippines.
FLI’s continued growth also depends in large part on its ability either to acquire quality land at attractive prices or to enter into JVAs
with land-owning partners under terms that can yield reasonable returns. Based on FLI’s current development plans, it believes that it
has sufficient land reserves for property developments for the next several years. If the Philippine economy continues to grow and if
demand for residential properties remains relatively strong, it expects that competition among developers for land reserves that are
suitable for property development (whether through acquisitions or JVAs) will intensify and that land acquisition costs, and its cost of
sales, will increase as a result.
Leasing Segment
With regard to the Company’s acquired assets dedicated to office space leasing and shopping mall operations, the Company competes
with property companies such as Ayala Land, Inc. Robinsons Land Corporation and SM Prime Holdings, Inc. In office space leasing,

29
particularly to call centers and other BPO operators, the Company competes with companies such as Robinsons Land Corporation,
Ayala Land, Inc., Eton Properties Philippines, Inc. and Megaworld Corporation.
1.4.2 Hospitality
The Group’s hospitality business is operated through both Chroma and FHC.
The Group’s first operating property is the 5-star CRSM. The resort is directly owned by FDC through MSSI which was incorporated
on July 17, 2009. CRSM is an award-winning deluxe resort located on the island of Mactan, Cebu, Philippines. The resort features 290
guest rooms including 40 villas with private plunge pools, 5 Food and Beverage Outlets, a Gym, a Children’s play area and 2 Ballrooms.
CRSM was formally launched on October 8, 2010. The flagship Azure Beach Club was launched on October 24, 2014. The resort
completed its renovation of the infinity pool, and opened the Spanish-themed Enye restaurant in 2017. The property also launched the
3,700-sq.m. Crimzone, which features family-oriented facilities, children’s play area, dedicated pool and snack bar. MSSI is currently
constructing a 229 room expansion with additional food and beverage outlets and function spaces.
In September 2012, the Group opened its second property under the Quest Brand. QHCC Cebu is a 427-key Condotel in FLI’s Grand
Cenia Development in Cebu City. The condotel units are owned by third parties and are locked in a 25-year rental pool. The hotel is
located in the Cebu Business Park and includes 10 meeting rooms, a 300 seat capacity all-day dining restaurant and a swimming pool.
In March 2013, the Group opened its third property, CFCM in Alabang, under EHSI, which was incorporated on November 28, 2012.
The hotel is part of the Entrata Urban Complex which features 345 keys, extensive meeting facilities, 5 F&B outlets, a gym, a spa and
a swimming pool, with plans to enhance amenity areas, new ballroom spaces and food outlets.
On January 27, 2016, the Group was given a Notice of Award by the CDC for the lease, development, operation and management of
the former Mimosa Leisure Estate covering 201.6 hectares through a 50-year lease agreement, renewable for another 25 years. The
lease agreement between CDC and Filinvest Mimosa, Inc. (an entity owned by FDC (47.5%), FLI (47.5%) and CDC (5%)) was signed
on April 22, 2016. The lease agreement requires FMI to investment of at least ₱5 billion over a period of 5 years.
The property, which is located in Clark Freeport Zone approximately 100 km north of Metro Manila, includes a hotel with 303 rooms,
as well as 36-hole golf course, which are now operating as QCC Clark and Mimosa Golf, Clark under MCI which was incorporated on
May 13, 2016. MCI is a wholly owned subsidiary of FHC.
In June 2016, MCI signed a sublease agreement with FMI following the terms of lease of FMI with CDC. Over the lease period, MCI
will operate the existing hotel and golf courses of the estate and the right to develop the leased portion of the estate. During the ASEAN
Summit in November 2017, its property QHCC Clark showcased the opening of the Grand Villas, newly-refurbished hotel rooms and
event facilities.
In 2012, FDC was able to acquire a prime lot in Boracay with its own beachfront. Planning commenced in the same year and site
development started in early 2014. By mid-2015, two buildings were topped off. The resort, which is directly owned by FHC through
its wholly owned subsidiary BSI, is designed to have a total of 192 keys with 23 pool villas, meeting facilities, 4 F&B outlets, a gym,
spa and a swimming pool. CRSB started its operation in November 2018 with 100 rooms available for occupancy and ended 2019 with
149 available rooms for sale.
In April 2019, the Group opened Quest Hotel Tagaytay located along General Emilio Aguinaldo Highway, Tagaytay City, which was
incorporated on August 24, 2018. The hotel is a 10-storey 164-room hotel of which is strategically located across the Filinvest FORA
Lifestyle Mall and is within easy access to all the major Tagaytay attractions.
Competition
The Company faces significant competition in the Philippine Hospitality market. By not only developing hotel projects but also having
hotel management capability, the Company believes that it is strongly positioned to take advantage to the expected emergence of a
robust tourism market in the Philippines. The Company believes that success in the Philippine Hospitality market depends on a mix of
external factors and internal capabilities.
External factors which can greatly affect the Philippine Hospitality include political and economic stability, climate change, health
pandemic restricting travel and mobility and general security. These external factors affect the attractiveness of the Philippines for both
local and domestic, leisure and business travelers. Internally the Company is confident due to Filinvest’s background in real estate
development in its ability to acquire, lease or joint venture the right pieces of property and execute the right type of hospitality
development. Also the Company believes that it has a strong management capability gained through its partnership with Archipelago
International. Despite the short operating history of the Company, its hotel assets have been able to compete with even entrenched
players as evidenced by the strong performance of the operating hotel properties.

30
The Company competes with local and foreign hospitality developers, owners and operators to acquire, lease or joint-venture appropriate
hotel locations the main tourist and business destinations. Its hotel assets also compete for room and banquet business among the
hospitality or hospitality like products serving the markets where these assets are located. Major competitor includes – SM, Ayala,
Waterfront, Shangri-la, Bellevue, and Movenpick.
1.4.3 Banking and Financial Services
EW
EW (or the Bank) was granted authority by the Bangko Sentral ng Pilipinas (BSP) to operate as a commercial bank under Monetary
Board (MB) Resolution No. 101 dated July 6, 1994, and commenced operations on July 8, 1994. The Bank was also granted authority
by the BSP to operate an expanded foreign currency deposit unit under MB Resolution No. 832 dated August 31, 1994. Subsequently
in 2012, EW was authorized by the BSP to operate as a universal bank. As of December 31, 2020, EW was 77.9% effectively owned
by FDC.
On February 17, 2014, the SEC approved the application of EW to change its registration from a “Government Securities Eligible
Dealer” (with broker-dealer of securities functions) to an “Underwriter of Securities Engaged in Dealing Government Securities” (with
broker-dealer of securities functions), in accordance with the SRC and other applicable laws, rules and regulations. EW’s registration
as an “Underwriter of Securities Engaged in Dealing Government Securities” had an initial validity of up to December 31, 2014, and
has been extended until 2019.
The Bank’s shares were listed on the PSE on May 7, 2012.
Mergers and Acquisitions
In 2003, EW merged with Ecology Savings Bank, Inc. (“ESBI”). EW, as the surviving corporation, purchased all the outstanding capital
stock of ESBI from EBC Strategic Holdings Corp. Consequently, as set forth in the Articles of Merger dated January 31, 2003, all rights,
business, assets and liabilities of ESBI were conveyed, assigned and transferred to EW. The merger was approved by the BSP and the
SEC on August 6, 2003 and June 26, 2003, respectively.
On January 23, 2009, EW and American International Group, Inc. (“AIG”) and certain AIG subsidiaries, including AIG Philam Savings
Bank (“AIGPASB”), entered into a Share Sale Agreement for EW to acquire all of the shares of the AIGPASB and its constituent
companies. On March, 2009, a Deed of Absolute Sale of Shares was executed between EW and each of the respective sellers.
On August 19, 2011, EW entered into a deed of assignment for the purchase of a majority of the outstanding shares and control of GBI.
Consequently, GBI became a subsidiary of EW. On July 11, 2012, EW acquired an 83.17% interest in FRBI, a rural bank engaged in
the business of extending credit to farmers, tenants, and rural enterprises. EW subsequently increased its ownership in FRBI to 100.00%
through additional share acquisitions and capital contributions in 2012 and 2013. In May 2013, FRBI changed its name to East West
Rural Bank, Inc. (“EWRB”) and entered into an asset purchase agreement with GBI, effectively consolidating all of the Bank’s rural
banking business in EWRB.
On March 28 and June 5, 2014, the BSP and the SEC respectively, approved the proposed merger between EW and GBI. On
July 31, 2014, the merger between EW and GBI was completed.
On May 6, 2016, EW and SCB entered into an agreement for SCB PH retail business. Under the agreement, the credit cards, personal
loans, wealth management and deposits of SCB in the Philippines will be migrated to EW. The transaction also include the transfer of
following entities:
• ASIA, a wholly owned subsidiary of SCB which provided sales and marketing services directed exclusively to SCB PH
clients for bancassurance products; and
• QMIS (formerly Price Solutions Philippines, Inc.), a wholly owned subsidiary of SCMB Overseas Limited providing sales
and marketing services to SCB PH for credit cards and personal lending products.
In 2016, the BSP approved and confirmed the initial equity investment in EWLFC of P100.0 million. It was registered with the SEC in
October 2016 with secondary license to operate as a financing company in accordance with the Financing Company Act of 1998 and its
implementing rules and regulations. EWLFC’s registered business address is at East West Corporate Center The Beaufort, 5th Avenue
corner 23rd Street, Bonifacio Global City, Taguig City.
On July 13, 2017, the BOD approved the following: (1) the Bank’s increase in authorized capital stock from P20.0 billion to
P50.0 billion and (2) the subsequent declaration of a 50% Stock Dividend or 750,000,000 common shares to cover the minimum required
subscription and payment for the said increase in authorized capital stock. On April 16, 2018, a total of 749,991,801 common shares
were listed at the PSE.
On June 19, 2019, the Philippine Competition Commission (“PCC”) approved the Bank’s purchase of the dealer-generated auto-lending
portfolio held by Philippine Bank of Communications (“PBCom”).

31
Securities Issuances
Debt Issuances
On July 4, 2014, the Bank completed its issuance of Basel III-compliant Tier 2 unsecured subordinated notes with a total face value of
P5.0 billion with a coupon rate of 5.5% maturing in January 2025 but callable on January 4, 2020. On January 4, 2020, the Bank
exercised its call option. The redemption was approved by the Bank’s BOD on October 31, 2019 and by the BSP on
December 13, 2019.
On February 20, 2017, EW’s subsidiary, EWRB, issued 5.50% Lower Tier 2 unsecured subordinated notes with par value of
₱1.25 billion maturing on August 20, 2027 but callable on August 20, 2022.
On February 10, 2020, EW issued 4.50% fixed-rate bonds with issue price at 100.00% face value. The bonds will bear interest at the
rate of 4.50% per annum from and including February 21, 2020 to but excluding: (a) February 21, 2023, such date being the maturity
date (if the pre-termination option is not exercised); or (b) the pre-termination date (if the pre-termination option is exercised), and the
interest will be payable quarterly in arrears at the end of each interest period on February 21, August 21 and November 21 of each year
commencing on 2020.
Equity Issuances
On January 29, 2015, the Bank’s BOD approved the common shares rights offering. In March 2015, the BOD approved the application
of the Bank to list up to 371,574,000 common shares with par value of ₱10.0 per share to cover its stock rights offering.
On May 8, 2015, a total of 371,574,000 common shares were listed at the PSE with ₱10.0 par value per share. The total proceeds raised
by EW from the sale of the said shares amounted to ₱8.0 billion while the net proceeds (after deduction of direct costs related to equity
issuance) amounted to ₱7.95 billion. The net proceeds were used to invest in securities allowed under BSP regulation and to fuel growth
in loans.
On July 13, 2017 and August 30, 2017, the Bank’s BOD approved and the stockholders ratified, respectively, the following (i) increase
in EW’s authorized capital stock from ₱20.0 billion to ₱50.0 billion consisting of 4.5 billion common shares with par value of ₱10.0 per
share or a total par value of ₱45.0 billion and 500 million preferred shares with par value of ₱10.0 per share or a total par value of
₱5.0 billion and (ii) declaration of 50.0% stock dividends equivalent to ₱7.5 billion from the Bank’s unrestricted retained earnings as of
December 31, 2016 to cover the required 25.0% minimum subscription and payment for the increase of authorized capital stock. The
increase in the Bank’s authorized capital stock and stock dividend declaration was subsequently approved by the BSP and SEC on
February 1, 2018 and February 28, 2018, respectively. On April 16, 2018, a total of 749,991,801 common shares were listed on the PSE.
Long-Term Negotiable Certificates of Deposit (LTNCD)
In 2017, the Bank issued 4.0% fixed coupon rate LTNCDs maturing in September 2022. The first tranche of LTNCD amounting to
P=2.7 billion was issued in March 2017. The second to fifth tranches of LTNCD aggregating P7.3 billion were issued during April to
August 2017.
In 2018, the Bank issued the first tranche of its ₱15.0 billion LTNCD program, amounting to ₱2.45 billion. The issued LTNCDs will
mature on December 7, 2023 and carries a fixed coupon of 4.625% payable quarterly.
Subsidiaries
EWRB
EWRB was incorporated and registered with the SEC on November 5, 1997 with the purpose of accumulating deposits and granting
loans to various individuals and corporate entities as well as government and private employees. It started commercial operations in
March 1998. Its principal office is located at 3rd and 4th Floors, East West Bank Building, J.P. Laurel Avenue corner Iñigo Street,
Bajada, Davao City.
EWIB
EWIB was incorporated and registered with the SEC on July 6, 2015 with the primary purpose to act as an insurance broker. On
September 23, 2015, the IC authorized EWIB to act as an insurance broker. It started commercial operations on September 24, 2015.
EWIB’s registered business address is at the Beaufort, 5th Avenue Corner 23rd Street, Bonifacio Global City, Taguig City.
EWLFC
EWLFC was incorporated and registered with the SEC on October 6, 2016 with secondary license to operate as a financing company in
accordance with the Financing Company Act of 1998 and its implementing rules and regulations. EWLFC’s registered business address
is at The Beaufort, 5th Avenue Corner 23rd Street, Bonifacio Global City, Taguig City.
QMIS
In 2016, the Bank acquired 100.0% voting shares of QMIS as part of the asset and share transfer agreement by and between SCB
Philippines and SCMB. QMIS was registered with SEC on July 17, 2007 primarily to engage in providing sales and marketing services.
QMIS’ registered business address is at 7th Floor, Global Trade Center, 1024 EDSA, Quezon City.

32
ASIA
In 2016, the Bank acquired 100.0% voting shares of ASIA as part of the asset and share transfer agreement by and between SCB and
SCMB Overseas Limited. ASIA was registered with the SEC in 2012 primarily to engage in general insurance agency business. ASIA’s
registered business address is at 5th Floor 6788 Sky Plaza Building, Ayala Avenue, Makati City.
Investment in a Joint Venture
On May 28, 2015, EW and Ageas entered into a JVA to form EW Ageas Life, with P=2.0 billion capitalization and with EW’s ownership
interest of 50.0% less 1 share. EW’s initial investment amounted to P=500.0 million. The JVA provided certain conditions that should
be satisfied for the consummation of the agreement, which included among others, obtaining all the required regulatory approvals. In
October 2015, the SEC approved the registration of EW Ageas Life with the following primary purpose:
1. to undertake and write insurance upon the life of individuals, and every insurance appertaining thereto or connected therewith;
2. to make contracts of insurance providing for all risks, hazards, guarantees and contingencies to which life, accident, or health
insurance is applicable;
3. to indemnify against legal liability;
4. to compute endowments and grant, purchase or dispose of annuities;
5. to procure re-insurance of its risks;
6. to issue policies stipulated to be with or without participation in profits; and
7. to purchase for its own benefit any policy of insurance or other obligation as well as claims of policyholders
In November 2015, EW Ageas Life and EW entered into a 20-year exclusive distribution agreement. Under the distribution agreement,
EW Ageas Life will have exclusive access to the branch network of EW for the distribution of its insurance products (the exclusive
bancassurance access).
In December 2015, EW Ageas Life obtained from the Insurance Commission a license to operate life insurance business. Its registered
business address is at One World Place, 32nd Street, Bonifacio Global City, Taguig City.
In 2016, upon obtaining all the required regulatory approvals from the Insurance Commission and the BSP, the establishment of EW
Ageas Life was consummated and EW received a consideration from Ageas. The consideration attributable to the exclusive
bancassurance access was deferred and will be recognized as income over the life of the distribution agreement. The consideration
attributed to the investment transaction increased EW’s investment in EW Ageas Life by P=505.0 million and resulted in a gain on capital
transaction of P=1.0 billion.
Under the joint venture agreement, within a period of 7 years from consummation, the joint venture entity may at any time request for
additional funding from EW and Ageas. On September 6, 2018, EW and Ageas each infused additional capital to EW Ageas Life
amounting to P=250.00 million.
In 2017, EW Ageas Life requested for additional funding from Ageas aggregating to P=1,330.0 million. As half of the capital infusions
made by Ageas was for the account of EW, this increased EW’s investment in the joint venture by P=665.0 million, which was recognized
as gain on capital transaction.
Under the joint venture agreement, within a period of seven (7) years from consummation, the joint venture entity may at any time
request for additional funding from EW and Ageas. EW and Ageas each infused additional capital to EW Ageas Life amounting to
₱250.00 million in 2020 and ₱350.00 million in 2019.
For the years ended December 31, 2020 and 2019, share in net losses of EW Ageas Life amounted to P=300.6 million and
P=339.5 million, respectively. There were no dividends received from EW Ageas Life in 2020, 2019 and 2018. The joint venture has
no contingent liabilities or capital commitments as of December 31, 2020 and 2019.
Principal Business Activities
Retail Banking
The retail banking segment mainly covers traditional branch banking products and services such as deposits, back-to-back/emerging
market loans and other over-the-counter transactions. It also caters to the needs of high net-worth clients for alternative investment
channels and cash management requirements of mid-market corporates. It includes entire transaction processing, service delivery and
infrastructure consisting of the Bank’s network of branch stores, automated teller machines (ATMs), as well as its internet banking
platform.
Deposit Products
The Bank offers a comprehensive range of deposit products consisting primarily of Peso demand, savings and time deposits. Offered
also are United States (U.S.) Dollar and third currency savings and time deposits. The Bank offers varying interest rates on its deposit
products depending on prevailing market interest rates, the rate of return on its earning assets and interest rates offered by other

33
commercial banks. As of December 31, 2020 and 2019, the Bank’s total deposits amounted to P329.1 billion and P304.7 billion,
respectively.
Access to Investment Products
The Bank also offers investors access to investment products such as treasury bills and bonds, fixed rate treasury notes and retail treasury
bonds. Customers can also invest in long-term fixed income debt instruments issued by public and private entities.
Cash Management Services
The Bank offers a wide range of cash management solutions to assist mid-market corporates, composed primarily of entrepreneurial and
family-owned businesses, including (i) a facility for payroll preparation and crediting, (ii) an interest-earning checking account that
provides a customized standalone check-writing facility and a comprehensive accounts payable system, (iii) an end-to-end automated
solution for the creation, disbursement and monitoring of checks, (iv) a check depot service whereby the Bank retains a corporate
customer’s post-dated checks for immediate deposit to the customer’s account on the same date indicated on the checks, (v) a bill
collection service whereby the Bank acts as a collecting agent and transmits consolidated payments to the customer online or via
electronic file transfer and (vi) deposit pickup services, in which the Bank sends an armored vehicle to pick up cash and check deposits
at the customer’s premises.
Consumer Lending
The Bank offers various types of consumer lending products to individuals, which consist principally of credit cards, auto loans,
residential mortgage loans and personal loans. The Bank reviews various factors in evaluating prospective clients, including but not
limited to the capacity of the borrower to repay the loan. The Bank also considers various factors in pricing its loans such as but not
limited to the delinquency rates of particular market segments, the funding costs of the portfolio, direct and indirect expenses related to
granting consumer loans and the target spread of the loan portfolio. Loan terms are differentiated according to factors such as a
customer’s financial condition, age, loan purpose, collateral and quality of relationship with the Bank. The Bank focuses its core business
towards consumer financing where it has a competitive advantage. Several product lines were launched to ascertain that its target market
is reached.
Credit Cards
In 2004, the Bank began issuing MasterCard credit cards under the name “East West Bank MasterCard” in partnership with AIG. In
2009, the Bank acquired the Philam Savings Bank, which issued Visa credit cards. After the acquisition, the Bank integrated its Visa
and MasterCard businesses into a single business unit. From an initial base of 10,000 credit cards issued during 2004, the Bank has since
grown to have issued over 1.0 million credit cards, comprising 10.9% of the total market share for credit cards in the Philippines as of
December 31, 2020 based on data from the Credit Card Association of the Philippines.
Revenues from the credit card operations consist principally of annual fees paid by cardholders, interest on deferred and installment
payments, cash advance fees, interchange fees paid by service establishments and late payment charges. Annual cardholder fees range
from P1,200 to P5,000. As of December 31, 2020, the interest rate on deferred payments range from 2.0% per month and the interest
rate on installment payments range from zero to maximum add-on rate of 1.0% per month. Other relevant fee income includes cash
advances fees of ₱200 per availment; late fees accounting for 8.0% of the minimum amount due, and interchange fees ranging from
0.25% to 2.33% of the retail purchase or cash advance amount. Revenues relating to the credit card business are reflected in the Bank’s
financial statements as interest income and other operating income from service charges, fees and commissions.
The Bank seeks to diversify its distribution channels, form alliances with merchants and manage its product portfolio in order to continue
the growth of its credit card business. The Bank currently markets and sells its credit cards directly to customers, as well as through
third party telemarketing agencies. Credit Card customers may participate in a variety of instant and loyalty based rewards programs
that allow them to redeem merchandise or gift certificates at partner establishments. The Bank attempts to identify and capitalize on
gaps in the market by offering products tailored to meet the needs of underserved markets. The Bank’s credit card products come in
different grades, from regular cards to premium class cards at different annual membership fees.
Auto Loans
The Bank’s auto loans are offered through car dealerships (including second-hand car dealers), independent sales agents and the Bank’s
branches. The Bank provides economic incentives to car dealerships and independent sales agents based on each approved auto loan
amount. A key competitive factor in the automotive loan business is the speed by which a bank can process an automotive loan, as
dealers will offer a loan to multiple banks and the Bank offers a 3-hour auto loan approval process, which the Bank believes is an
important aspect to its success in growing its auto loan portfolio. The Bank’s auto loan business also engages in strategic partnerships
with major car brands to develop exclusive programs. Additionally, the Bank cross-sells its auto loans with the products of other units
and offers special plans for existing and repeat customers.
All of the Bank’s auto loans are secured by a chattel mortgage over the car being purchased. In addition to being subject to the Bank’s
internal credit checks, the Bank generally requires the borrower to make a minimum down payment of 20.0% to 30.0% of the purchase
price. Depending on whether the car being purchased is new or second-hand, the interest rate of the Bank’s auto loans can range from
8.5% to 18.0%, with an average maturity of 55 months. Generally, when an installment payment falls 90 days past due, the Bank may
commence foreclosure proceedings. Foreclosed cars are generally sold by the Bank through public auction.

34
Residential Home Mortgage Loans
The large majority of EW’s residential mortgage loans are extended to property buyers in the Philippines who intend to occupy residential
units in the form of house and lot, townhouse or condominiums, with a small proportion being extended to individuals purchasing lots
for investment purposes or for future dwelling via house construction loans. All of EW’s home mortgage loans are secured by a first
mortgage on the property and each applicant undergoes a stringent credit evaluation process. EW requires its borrowers to make a
minimum down payment of 20% of the total contract price, or appraised value for the various loan purposes. EW also refinances existing
housing loans. EW offers loans at fixed interest rates. EW uses its store network as a key distribution channel and maintains marketing
campaigns to attract property buyers independently from real estate developers, which serve as distribution channels for mortgage loan
providers. The average maturity of EW’s home mortgage loans is fifteen years. In line with industry practice in the Philippines, interest
rate on EW’s home mortgage loan portfolio is set at a fixed rate applicable for an initial period of between one and five years, depending
on the maturity of the loan. Upon expiry of the initial period, the interest rate is reset at a fixed annual rate.
When a borrower falls in arrears with its mortgage payments, the buyer can either agree to a voluntary disposition of the property to
EW, or EW may commence foreclosure proceedings. EW sells mortgaged collateral that has been foreclosed, primarily in public auctions
or by brokers on behalf of EW. Foreclosure of the mortgaged collateral generally takes between 6 and 24 months.
EW currently offers various home financing products with differentiating features, which includes a mix of competitive interest rates
and what the Bank believes to be the longest payment term in the market of up to 30 years. As most residential mortgage loans available
in the market only allow up to a maximum payment term of 20 years, EW’s longer payment term means lower and consequently lighter
amortization payments for the borrower. EW also gives the borrowers the option to adopt a fixed-term pricing scheme to protect
borrowers against the risk of fluctuating interest rates.
EW’s home loans are available in different loan packages, tailored to fit the needs of specific markets. LotAcquire is a loan specifically
designed for the acquisition of a vacant lot. Other products offered by EW include HomeAcquire, HomeConstruct and HomeImprove.
Personal Loans
The Bank’s personal loans business provides unsecured, uncollateralized consumer loans to qualified individuals for multi-purpose
personal use. The primary distribution channels for personal loans are the Bank’s branches and third-party sales agencies. The Bank
offers personal loans to employed and self-employed individuals with annual income of at least P15,000 or basic annual income of not
less than P180,000. The monthly nominal interest rates for a personal loan ranges from 1.5% to 1.9% and is payable in fixed equal
monthly installments from 12 to 36 months.
Corporate Banking
The Corporate Banking Group is responsible for the overall management and development of the Bank’s corporate relationships.
Although the activities of the EW group are primarily focused on the working capital, term funding and project finance requirements of
its core mid-market customer base, which is predominantly comprised of entrepreneurial or family-owned businesses, it also has
relationships with large corporate accounts. The Corporate Banking Group also offers the entire array of the Bank’s products and services
which includes cash management services, foreign exchange and deposit and investment products to its corporate customers. The Bank
believes that successfully identifying and offering holistic solutions to the banking needs of its corporate client base is essential to
placing EW at the top of its clients’ minds in their choice of a banking relationship.
Credit Products
The Bank provides a wide range of loan products and services to its corporate customers, including revolving credit lines, domestic and
foreign bills purchase, acceptances, trade finance facilities, bank guarantees and term loans. In line with its strategy to create a balanced
and diversified portfolio, the Bank’s corporate customers are engaged in various industries and located in key geographical areas in the
Philippines. Credit facilities offered to corporate customers include both secured and unsecured loan products, depending on the credit
risks associated with the customer and its business.
The Bank intends to continue to expand its corporate banking portfolio by increasing its share of its existing customers’ working capital
requirements as well as supporting their expansion projects. The Bank also aims to continue to enlarge its client base by targeting new
corporate customers through the Bank’s expanded combined customer network.
Rural Banking
To extend its reach to underserved segments of the market that have the potential for growth, the Bank has established a rural bank arm.
Backed by the strong track record of its predecessor entities, EWRB is capable of catering to the banking needs of customers outside
the urban areas in the country and provide wider access to innovative products and delivery channels. In addition to DepEd teachers’
loans, EWRB currently offers small business loans, which are intended for small to medium enterprises, with a maximum loan limit
of ₱5.0 million, and social security system (SSS) pensioners’ loans, which are intended for all SSS retirees and survivorship pensioners
whose SSS pension is directly credited to savings accounts with EWRB and EW.
As of December 31, 2020, EWRB has a network of 76 branches spread all over the country.

35
Treasury and Trust
Treasury
The Bank’s treasury has primary responsibility for managing the Bank’s liquidity, interest rate and foreign exchange exposures. The
Bank manages its liquidity position by regularly reviewing its cash flow position, debt maturity profiles, availability of credit facilities
and overall liquidity position to mitigate the effects of fluctuations in cash flow. The Bank’s treasury actively engages in trading for its
own proprietary account. It trades local treasury bills and bonds, foreign-currency denominated bonds and foreign exchange. The Bank
is an accredited Government Securities Eligible Dealer.
As of December 31, 2020, the Bank had ₱57.9 billion of trading and investment securities, which accounted for 14.2% of the Bank’s
total assets. As of December 31, 2020, 88.7% of the Bank’s trading and investment securities portfolio was invested in government
securities, a majority of which are Philippine Government debt instruments.
Trust
The Bank offers a wide range of trust products and services, including fund management, investment management services,
custodianship, administration and collateral agency services and stock and transfer agency services. In addition to offering trust services
to corporate and high net-worth individual customers (customers with a total relationship balance of P2.5 million), the Bank provides
retail customers with alternative investment opportunities through its unit investment trust funds (UITFs), which are available in Peso
and U.S. dollar-denominated UITFs. In a UITF, funds of various investors are pooled and invested in a diversified portfolio of liquid
securities, term deposits, money market instruments or stocks in accordance with the investment objectives and restrictions stated in the
Declaration of Trust. For the year ended December 31, 2020, the combined trust and managed funds of the Trust Department of EW
amounted to P=39.0 billion and income from its trust operations amounted to P=79.3 million.
Branch Store Network
Branch Network
The branch network is focused more on the Philippines’ major industrial and commercial regions in Metro Manila and has key locations
outside of Metro Manila such as Metro Cebu, Metro Davao, Northern Luzon, South Luzon Industrial Zone, Iloilo, Bacolod and
Mindanao. Within these regions, EW has strategically positioned its branches in key business and commercial centers, which are areas
that generally boast of higher per capita incomes, and have higher growth and traffic, thereby maximizing the number of transactions
and deposits per branch.
A branch’s sales function is managed by a branch head. Each branch head reports to a division head, which supervises 9 to 18 branches.
The operations function is under an area operations head. Each area operations head supervises 13 to 32 branches and reports to a
regional operations head. Branches are grouped geographically and such groups include North Luzon, South Luzon, Southern Metro
Manila, Eastern Metro Manila, Northern Metro Manila, Downtown Manila, Visayas and Mindanao.
EW’s products and services are made available across multiple distribution and delivery channels. As of December 31, 2020, the Parent
Bank has 392 branches in various parts of the country, majority of which are located within Metro Manila.
As of December 31
2020 2019 2018
Metro Manila 213 212 212
Other areas of Luzon 100 100 100
Visayas 40 40 39
Mindanao 39 39 39
Total Branches 392 391 390
ATMs 586 584 583
EWRB Branch Store Network
As of December 31, 2020, EWRB, a wholly owned subsidiary of EW, has a network of 76 branches mostly located in Visayas and
Mindanao. The table below sets out the details of EWRB’s branches and ATMs in the Philippines in operation as of the specified dates.
As of December 31
2020 2019 2018
Metro Manila 1 1 1
Other areas of Luzon 22 22 22
Visayas 22 22 22
Mindanao 31 31 31
Total Branches 76 76 76

36
ATM Network
EW provides 24-hour banking services through its network of 586 ATMs as of December 31, 2020, compared with 584 ATMs as of
December 31, 2019. Of these 586 ATMs, 400 are located at EW’s branches while 186 are located off-site. Customers are given access
to the ATM facilities through ATM cards and debit cards, which are available to checking and savings account holders. Customers may
likewise access ATM facilities through prepaid cards which are pre-loaded or reloadable payment cards (not linked to a checking or
savings account). Aside from ATMs, customers may likewise use Debit and Prepaid cards on purchases and other transactions done
through the internet and Point-of-Sale terminals.
The Bank also is a member of Bancnet, which is an ATM network that allows its member banks customers to use ATM terminals
operated by other Bancnet member banks. Customers of the Bank that use ATMs operated by other banks must pay a service charge
for accessing these networks.
Status of Publicly-Announced New Product or Service
All publicly-announced new products or services of the Bank are in commercial distribution.
Competition
The banking industry in the Philippines is composed of universal banks, commercial banks, savings banks, savings and mortgage banks,
private development banks, stock savings and loan associations, rural banks and cooperative banks.
As of March 2021, the banking sector consisted of 46 universal and commercial banks (updated as of March 2021 on BSP’s Directory
of Banks and Non-Banks), of which 21 were universal banks and 25 were commercial banks. Of the 21 universal banks, 12 were private
domestic banks, 3 were government banks, and 6 were branches of foreign banks. Of the 25 commercial banks, 5 were private domestic
banks, 2 were subsidiaries of foreign banks, and 18 were branches of foreign banks.
Commercial banks have all the general powers incident to corporations and all powers that may be necessary to carry on the business of
commercial banking, such as the power to accept drafts and to issue letters of credit, discount and negotiate promissory notes, drafts,
bills of exchange and other evidences of indebtedness, accept or create demand deposits, receive other types of deposits and deposit
substitutes, buy and sell foreign exchange and gold and silver bullion, and lend money on a secured or unsecured basis. Universal banks
are banks that have authority, in addition to commercial banking powers, to exercise the powers of investment houses, to invest in the
equity of business not related to banking, and to own up to 100% of the equity in a thrift bank, a rural bank, or a financial allied or non-
allied enterprise. A publicly-listed universal or commercial bank may own up to 100% of the voting stock of only 1 other universal or
commercial bank.
Thrift banks primarily accumulate the savings of depositors and invest them, together with capital loans secured by bonds, mortgages
in real estate and insured improvements thereon, chattel mortgage, bonds and other forms of security or in loans for personal and
household finance, secured or unsecured, or in financing for home building and home development; in readily marketable debt securities;
in commercial papers and accounts receivables, drafts, bills of exchange, acceptances or notes arising out of commercial transactions.
Thrift banks also provide short-term working capital and medium- and long-term financing for businesses engaged in agriculture,
services, industry, and housing as well as other financial and allied services for its chosen market and constituencies, especially for small
and medium-sized enterprises and individuals. As of March 2021, there were 48 thrift banks (updated as of March 2021 on BSP’s
Directory of Banks and Non-Banks).
Rural and cooperative banks are organized primarily to make credit available and readily accessible in the rural areas on reasonable
terms. Loans and advances extended by rural banks are primarily for the purpose of meeting the normal credit needs of farmers and
fishermen, as well as the normal credit needs of cooperatives and merchants. Rural banks are privately owned and managed while
cooperative banks are owned by cooperatives or federation of cooperatives. As of March 2021, there were 434 rural and cooperative
banks (updated as of March 2021 on BSP’s Directory of Banks and Non-Banks).
Specialized government banks are organized to serve a particular purpose. The existing specialized banks are the Development Bank of
the Philippines (“DBP”), Land Bank of the Philippines (“LBP”), and Al-Amanah Islamic Investment Bank of the Philippines (“AAIIB”).
DBP was organized primarily to provide banking services catering to the medium and long-term needs of agricultural and industrial
enterprises, particularly in rural areas and preferably for mid-market corporates. LBP primarily provides financial support in all phases
of the Philippines’ agrarian reform program. In addition to their special functions, DBP and LBP are allowed to operate as un iversal
banks. AAIIB was organized to promote and accelerate the socio-economic development of the Autonomous Region in Muslim
Mindanao through banking, financing and investment operations and to establish and participate in agricultural, commercial and
industrial ventures based on Islamic banking principles and rulings.
During the past fifteen years, the Philippine banking industry has been marked by 2 major trends — the liberalization of the industry,
and mergers and consolidation.
Foreign bank entry was liberalized in 1994, enabling foreign banks to invest in up to 60% of the voting stock of an existing bank or a
new banking subsidiary, or to establish branches with full banking authority. This led to the establishment of 10 new foreign bank
37
branches in 1995. The General Banking Law further liberalized the industry by providing that the MB may authorize foreign banks to
acquire up to 100% of the voting stock of one domestic bank. Under the General Banking Law, any foreign bank, which prior to the
effectiveness of the said law availed itself of the privilege to acquire up to 60% of the voting stock of a domestic bank, may further
acquire voting shares of such bank to the extent necessary for it to own 100% of the voting stock thereof.
The Bank faces competition from both domestic and foreign banks, in part, as a result of the liberalization of the banking industry by
the Government. Since 1994, a number of foreign banks, which have greater financial resources than the Bank, have been granted
licenses to operate in the Philippines. Such foreign banks have generally focused their operations on the larger corporations and selected
consumer finance products, such as credit cards. The foreign banks have not only increased competition in the corporate market, but
have as a result caused more domestic banks to focus on the commercial middle-market, placing pressure on margins in both markets.
Since September 1998, the BSP has been encouraging consolidation among banks in order to strengthen the Philippine banking system.
Mergers and consolidation result in greater competition, as a smaller group of “top tier” banks compete for business.
As of December 31, 2020, the 10 largest universal and commercial banks accounted for approximately 83.4% of total assets and 84.0%
of total deposits of the universal and commercial banking system based on published statements of condition.
Certain factors arising from the 1997 Asian crisis and the 2008 global financial crisis also resulted in greater competition and exert
downward pressure on margins. Banks instituted more restrictive lending policies as they focused on asset quality and reduction of their
NPLs, which resulted in increasing liquidity. As Philippine economic growth further accelerates and banks apply such liquidity in the
lending market, greater competition for corporate, commercial and consumer loans is expected.
As of December 31, 2020, the ten largest universal and commercial banks account for approximately 84.8% of the net customer loan
portfolio of the universal and commercial banking system, based on published statements of condition.
Sources and Availability of Raw Materials and Names of Principal Suppliers
This is not relevant to the operations of the Bank.
Customer Concentration
The Bank has a diversified customer base and there is no concentration of business in major customer groups. As such, the Bank is not
dependent upon a single customer or a few customers.
Patents, Trademarks, Copyrights, Licenses, Franchises, Concessions and Royalty Agreements Held
In 1994, EW obtained a Certificate of Registration and bank license from the Philippine SEC to operate under the corporate name “East
West Banking Corporation”.
EW uses a variety of names and marks, including the name “East West Banking Corporation” and EW’s logo, in connection with its
business. The Bank has registered such names and marks with the Intellectual Property Office of the Philippines.
On January 25, 2012, the Bank obtained a certification from the BSP on a US-based bank using a similar name. As certified by BSP,
the US-based bank has not been issued a license to operate as a banking institution in the Philippines. The BSP also certified that the
Bank is among the commercial banks it supervises. On October 10, 2013, the Intellectual Property Office of the Philippines issued a
decision in favor of the Bank, cancelling the mark “EAST WEST BANK & COMPASS LOGO” previously registered in the name of
a US-based bank.
Need for Government Approval of Principal Products or Services
The Bank’s principal products and services are offered to customers only upon receipt of the necessary regulatory approvals or
clearances. The Bank strictly complies with the related regulatory requirements such as reserves, liquidity position, loan exposure limits,
cap on foreign exchange holdings, provision for losses, anti-money laundering provisions and other reportorial requirements.
Effect of Existing or Probable Governmental Regulations on the Business
The Bank strictly complies with the BSP requirements in terms of capitalization reserves, liquidity position, limits on loan exposure,
cap on foreign exchange holdings, provision for losses, anti-money laundering provisions and other reportorial requirements as well as
other regulatory agencies such as the Securities and Exchange Commission, Philippine Stock Exchange, Philippine Deposit Insurance
Corporation and the Bureau of Internal Revenues, among others.
Amount Spent on Research and Development Activities
The Bank’s research and development activities are mainly driven market research and process improvements. EastWest’s businesses
are heavily dependent on the ability to timely and accurately collect and process a large amount of financial and other information across

38
numerous and diverse markets and products at its various branches, at a time when transaction processes have become increasingly
complex with increasing volume.
The amount spent on research and development activities (in million pesos) and its percentage to revenues for the last 3 years has been
as follows:
Year Amount % of Revenue
2020 P=3.2 0.01%
2019 P=3.4 0.01%
2018 P=18.5 0.07%
1.4.4 Power Operations
The Group, through FDC Misamis, completed the construction of its 3 x 135 MW CFB clean ecoal thermal power plant in Mindanao.
Currently under operation, the plant has off-take agreements for 283 MW with 17 distribution utilities and 1 industrial customer in
Mindanao. The plant’s 3 units are fully operational with COC received in October 2016 for the first 2 units and in May 2017 for the
third unit.
To provide optimal availability and capacity and to protect the value of its asset, FDCUI has engaged the operations & maintenance
services of PIC Asia Pacific SDN (PIC) in October 2017. PIC is a world-class provider of project and plant required services and a
reliable source of highly skilled professionals. PIC is wholly owned subsidiary of Marubeni Corporation, a Fortune Global 500 company
and one of Japan’s largest companies.
Aside from its Mindanao power plant, FDCUI was awarded the appointment as an Independent Power Producer Administrator (IPPA)
by the Power Sector Assets and Liabilities Management Corporation (PSALM) of 40 strips of energy (equivalent to 40 MW) of the
Unified Leyte Geothermal Power Plant (ULGPP) in Tongonan, Leyte and the 100 MW output of the Mindanao I and II (Mt. Apo 1 and
2) Geothermal Power Plants in Kidapawan City, North Cotabato. It successfully assumed control of the power plants’ administration in
December 2014 and has effectively provided capacity allocation to all its contracted customers. The IPPA contracts for ULGPP and
Mt. Apo 1 and 2 were terminated on September 4, 2017 and December 28, 2017, respectively.
FDCUI, through its subsidiary FREE, is currently finalizing several contracts to install and operate solar rooftop facilities for various
commercial users.
Supply
As part of FDCUI’s fuel sourcing strategy, a continuous process of evaluation and inspection to pre-qualify nominated coal mine source/s
and potential suppliers is being implemented. To ensure security of supply and continuous operation of the power plant by providing
adequate and economic inventory level of quality fuel, a long term supply contract for a minimum of 5 to 10 years with suppliers to be
qualified based on its supply capability, reliability for timely delivery and track record of fulfilling their contractual obligation is being
finalized.
Retail Electricity Supply
FDCUI is also in the retail electricity supply business catering to contestable customers under the Retail Competition and Open Access
(RCOA) regime. In July 2016, FDC RES, a subsidiary of FDCUI, was awarded a Retail Electricity Supply license from the Energy
Regulation Commission (ERC), which allows it to act as an electricity supplier to consumers in the retail market, such as hotels and
other commercial businesses.
Corporate Social Responsibility (CSR) Programs
Committed to continuing the Gotianun tradition of making a difference in the lives of Filipinos, FDCUI through its subsidiary, FDC
Misamis, has been implementing social development programs in partnership with host communities. These programs promote
environmental stewardship, economic enrichment, enhanced health care initiatives, education for empowerment and help create a
positive impact on the communities surrounding the project site. These CSR activities, where employees also actively participate and
volunteer, are based on real needs of the community residents as determined through a socio-economic baseline study of the host and
affected villages.
Competition
The Department of Energy (DOE) is forecasting that the current oversupply situation in the country will persist in the medium term as
newly built power plants commence operation. Competition in the power industry is expected to become stiffer in the coming years
with the influx of more players, both local and foreign. The top 3 major players, which account for about 50% of the total generation
capacity in the country and have the most diverse portfolio consisting of natural gas, hydro, geothermal, coal, diesel, etc., continue to

39
dominate the power industry. Other large players also continue to expand their existing capacities. Nonetheless, attractive investment
opportunities remain available to FDCUI, especially for renewable energy projects, peaking as well as reserve capacities.
1.4.5 Sugar Business
FDC has a 100.0% ownership interest in PSHC which it acquired in 2007. PSHC wholly owns DSCC, which owns and operates a sugar
mill and a refinery in Guihing, Davao del Sur; CSCC, which owns and operates a sugar mill and refinery in Matalam, North Cotabato;
and HYSFC, which operates a corporate sugarcane farm in Mindanao. Sugarcane supply for DSCC and CSCC is sourced from HYSFC
and various contract farms in Mindanao. PSHC is the holding company of the sugar subsidiaries.
The following table sets forth a summary of key information of PSHC and its subsidiaries (or collectively referred to as the Sugar
Group):
Subsidiary Nature of Business Summary features
DSCC Manufacture of raw and refined sugar 6,000 tons cane per day raw sugar mill and 350 tons
day refinery
CSCC Manufacture of raw and refined sugar 5,500 tons per day raw sugar mill and 250 tons per
day refinery
HYSFC Sugarcane farming Farms 1,003 hectares in Davao del Sur and North
Cotabato (as of October 1, 2020)
Sugar Production
Production Process and By-products
Raw sugar production process involves cane crushing, clarification and crystallization, and separation, and yields molasses and bagasse
as by-products. The molasses is sold and the bagasse is used to generate steam and electricity for the sugar production process. During
the crushing season, all of the Sugar Group’s power requirements are satisfied from bagasse it produces. The typical sugarcane material
balance is as follows: water – 73.0% to 76.0%, soluble solids 8.0% to 16.0%, recoverable sugar (sucrose) – 6.0% to 13.5%, other sugar
(fructose, glucose) – 1.5%, fibre – 11.0% to 16.0%, others – 1.0%, based on the Handbook of Cane Sugar Engineering.
Production Capacity and Output
For Crop Year (CY) 2019–20, the Sugar Group’s total sugarcane crushing capacity at its 2 sugar mills was 11,500 Tons of Cane per
Day (TCD). Sugar production is dependent on the quantity of sugarcane available for crushing and the recovery percentage of sugar
from sugarcane. Recovery percentages vary depending on the quality of the sugarcane and the efficiency of the recovery process.
PSHC’s crop year begins on October 1 of each year and ends on September 30 of the following year. Actual sugar production occurs
within this crop year. The duration of the crushing period which is based on the available cane supply generally determines the amount
of sugar that is produced.
The following table sets forth the volumes of sugarcane crushed and sugar produced at the Sugar Group’s mills for the past 3 crop years.
Sugarcane Crushed and Sugar production
DSCC CSCC Total
CY
2017-
2018
CY 2018-
2019
CY
2019-
2020
CY
2017-
2018
CY
2018-
2019
CY 2019-
2020
CY
2017-
2018
CY
2018-
2019
CY
2019-
2020
Sugarcane
Crushed
(‘000 MT)
426.3 364.5 322.6 522.5 494.0 574.9 948.8 858.5 897.5
Sugar Production
(‘000 MT)
38.0 36.2 30.8 48.6 49.7 56.8 86.6 85.9 87.6
Average Recovery
rate (% of
sugarcane
crushed)
8.7 10.0 9.5 9.2 10.1 9.9 9.0 10.0 9.8
The increase in the Group’s sugarcane harvest during CY2019-20 compared with CY2018-19 was attributable mainly to better weather
during the growing months and additional planted areas in Cotabato. However, Davao area suffered from extended drought resulting to
lower farm yields which partially offset the gain in the Cotabato area. Most of the cane farms are not irrigated so weather is a major
factor in farm yields.

40
Raw and Refined Sugar Production
The Group has decided to mothball the CSCC refinery so that it can concentrate on maximizing its raw sugar efficiency and therefore
can better compete with the Bukidnon mills in attracting sugar cane planters in areas accessible to both the CSCC and the Bukidnon
mills. The depressed margin for refined sugar due to VAT and the soft demand for refined sugar due to the shift of certain major
industrial users to the cheaper high fructose corn syrup has made it more beneficial to concentrate on improving raw sugar recovery. As
there are loyal local clients for refined sugar and to maintain the skills of the refinery personnel, PSHC still want to produce refined
sugar but out of the DSCC facility only. For CY 2019-20, DSCC produced 42,390 bags.
The following table sets out the breakdown of sugar sales between raw and refined sugar of the Group.
Sugar Sales (‘000 MT)
CY 2017-18 % of Total CY 2018-19 % of Total CY 2019-20 % of Total
Raw sugar 83.8 97.0% 73.8 96.5% 79.8 97.4%
Refined sugar 2.4 3.0% 2.7 3.5% 2.1 2.6%
Total 86.2 100.0% 76.5 100% 81.9 100.0%
Molasses and Bagasse Production
The yield of molasses per metric ton of sugarcane crushed is approximately 5.0%, or 47.0 kilos, most of which the Group sells to traders
in the domestic market. Molasses can be used to produce ethanol. Each metric ton of sugarcane that Sugar Segment crushes also
produces approximately 33.0%, or 330.0 kilos of bagasse, which is fed to a boiler as fuel to produce steam which is then used to generate
power necessary for the sugar production process.
Customers and Markets
The Group sells its raw and refined sugar primarily to traders who then sell sugar to end-customers in the Philippines. End customers
include wholesalers and retailers as well as food and beverage companies.
The following table sets forth the breakdown of the Group’s sales of sugar to traders and industrial users.
% of Total Sugar Sold
CY 2017-18 CY 2018-19 CY 2019-20
Traders 100.0% 100.0% 100.0%
Industrial users 0% 0% 0%
Sales and Distribution
For 2020, the Group’s revenues from sugar operations amounted to P3,666.2 million compared to P3,367.9 million for 2019.
The following table sets out the Group’s sales of sugar by destination as a percentage of total sales.
CY 2017-18 CY 2018-19 CY 2019-20
Mindanao 44% 44% 52%
Luzon 4% 12% 9%
Visayas 46% 40% 35%
Export Sales (primarily to U.S.) 6% 4% 4%
Sugar segment sells the majority of its production in the wholesale market to traders. To mitigate the risk of non-payment, sugar segment
generally dispatches orders only after it receives payment although it extends credit in limited circumstances to large customers whom
it believes have a strong credit record. Credit terms generally do not exceed 90 days. Increasingly, sugar segment does not have written
contractual agreements with its traders, and they do not sell its sugar exclusively. Customers typically obtain delivery of the sugar at the
mills and are responsible for transport, packaging and handling. In addition, Sugar segment has an internal sales team to sell and market
its sugar. Sugar segment also sells its sugar to industrial buyers. Sugar segment aims to increase its industrial customer base and expand
sales in the Luzon region and other areas of the country outside its core market in Southern Mindanao.
Raw Material
Sugarcane is the principal raw material used in the production of sugar. The climate and topography of the southern Philippine regions
of the Visayas and Mindanao are ideal for growing sugarcane. According to Sugar Regulatory Administration (SRA) Production
Bulletin dated August 31, 2020 Mindanao accounted for 20.27% of the Philippines’ sugarcane production in CY 2019-20.
Sugarcane is delivered by farmers to DSCC and CSCC for milling and, in return, the farmers receive a portion of the sugar produced.
As a result, DSCC and CSCC do not record any costs for the sugarcane. The Group sources approximately 90% of its sugarcane from

41
approximately 6,000 contract farmers within proximity to the DSCC and CSCC factories, and the remainder is supplied by PSHC’s
corporate farm, HYSFC.
Sugar segment generally enters into milling contracts with its contract farmer for terms of 15 years. Under a typical milling contract
the farmer agrees to deliver all sugarcane grown on a specified area of land to the mills during the milling season, and is obligated to
deliver a minimum volume of sugarcane or cultivate sugarcane on a minimum area of land. The time of delivery is based on a delivery
program which is determined on the basis of the age of the sugarcane crops. Typically, the farmer receives approximately 62.0% of the
raw sugar and molasses from the raw sugar produced by the mill, with the remainder being retained by the mill. The mills issue a
receipt, or quedan, to each farmer that specifies the amount of sugar or molasses that is due to the farmer. Upon presentation of the
receipt, the farmer can withdraw the sugar or molasses from the warehouses at the mill. Approximately 50.0% to 60.0% of the farmers
sell their share of sugar and molasses to the mills. Each of mills manage their sugarcane farmers through a designated cane supply office
which has crop advisors and management programs in place to train, manage and support farmers with technical advice for best farming
practices. In addition to farmer training and seminars, the cane supply office provides financial assistance programs, including subsidies
and loans for crops, cane points, fertilizer and tractors.
Insurance
Sugar segment maintains insurance covers for all its inventory of sugar, packing material, consumables, buildings, machineries and
equipment in all its mills and facilities, against fire, lightning, earthquakes, storms, floods and allied perils.
Sugar group does not anticipate having any difficulties in renewing any of its insurance policies and believes that its insurance coverage
is consistent with industry standards in the Philippines.
Competition
According to the SRA Production Bulletin dated August 31, 2020, as of CY2019-20, there were 27 operating sugar mills in the
Philippines with an aggregate raw sugar production of 2,146.0 million MT. These mills are located in the Luzon, Visayas and Mindanao
regions. There are 4 sugar mills in Mindanao, including DSCC and CSCC.
The following table below sets out the amount of sugarcane crushed and the quantity of sugar produced by PSHC compared to its main
competitors in Mindanao in CY 2019-20.
Sugarcane crushed (‘000 MT) Sugar production (‘000 MT)
PSHC 898 88
Bukidnon Sugar Central 1,914 195
Crystal Sugar Central 1,590 153
Total 4,402 436
Source: SRA Production Bulletin dated August 31, 2020
Sugar prices during CY 2019-20 were higher than in CY 2018-19.
1.5 Intellectual Property of the Group
Banking and Financial Services
In 1994, EW obtained a Certificate of Registration and bank license from the Philippine SEC to operate under the corporate name “East
West Banking Corporation.” EW uses a variety of names and marks, including the name “East West Banking Corporation” and EW’s
logo, in connection with its business. The Bank has registered such names and marks with the Intellectual Property Office (IPO) of the
Philippines. On January 25, 2012, the Bank obtained a certification from the BSP on a U.S.-based bank using a similar name. As
certified by the BSP, the U.S.-based bank has not been issued a license to operate as a banking institution in the Philippines. The BSP
also certified that the Bank is among the commercial banks it supervises. On October 10, 2013, the IPO of the Philippines issued a
decision in favor of the Bank, cancelling the mark “EAST WEST BANK & COMPASS LOGO” previously registered in the name of a
U.S.-based bank.

42
Real Estate
The “Filinvest” trademark was registered with the IPO on September 15, 2011. “Filinvest” is the brand FLI uses for the names of certain
real estate products and for trademarks relating to the “FLI” brand. Below are FLI service marks registered with the IPO:
TRADEMARK
DATE OF
REGISTRATION TRADEMARK
DATE OF
REGISTRATION
One Oasis 10 Dec 2009 Maui Oasis 20 Oct 2016
One Oasis Ortigas 10 Dec 2009 Ashton Fields 03 Nov 2016
We Build the Filipino Dream
(Slogan) 10 Dec 2009 Sandia Homes 24 Nov 2016
The Linear Makati & Design 12 Aug 2010 Valle Alegre 24 Nov 2016
Filinvest (New Logo) 15 Sept 2011 Valle Dulce 24 Nov 2016
Studio A 20 Dec 2012 Havila 08 Dec 2016
The Signature 17 Apr 2014 Princeton Heights 08 Dec 2016
Fortune Hill 22 May 2014 Asenso Village 29 Dec 2016
Fora Rotunda Tagaytay 14 Aug 2014 Hampton Orchards 29 Dec 2016
The Leaf 20 Nov 2014 Tierra Vista 29 Dec 2016
Vinia 20 Nov 2014 Blue Isle 19 Jan 2017
Citi di Mare 25 Dec 2014 Palmridge 19 Jan 2017
One Binondo 12 Feb 2015 Cyberzone Properties, Inc. 16 Feb 2017
I-Go 20 Feb 2015 Spring Heights 27 Apr 2017
Bali Oasis 26 Feb 2015 The Enclave at Filinvest Heights 27 Apr 2017
Bali Oasis 2 26 Feb 2015 Filinvest International 04 May 2017
Citi di Mare (Logo and Tagline) 26 Feb 2015 The Filinvest IT Zone 11 May 2017
Kembali 26 Feb 2015 8 Spatial 22 June 2017
One Spatial 26 Feb 2015 Ciudad de Calamba 06 July 2017
Serulyan Mactan 26 Feb 2015 Verde Spatial 06 July 2017
Capri Oasis 05 Mar 2015 One Filinvest 14 July 2017
Timberland Heights (Horizontal
Orientation) 14 May 2015 Marina Town 30 July 2017
Timberland Heights (Stacked
Orientation) 14 May 2015 The Levels 30 July 2017
Kembali (Reversed Logo) 25 June 2015 Studio City 29 Dec 2019
The Glades 09 July 2015 Marina Spatial 10 Aug 2017
100 West 23 July 2015 Grand Cenia Residences 17 Aug 2017
Activa 13 Aug 2015 Sanremo Oasis 17 Aug 2017
The Veranda 27 Aug 2015 East Spatial 24 Aug 2017
Studio 7 12 Nov 2015 Phuket Oasis 24 Aug 2017
Umi Garden Suites 11 Feb 2016 Sorrento Oasis 24 Aug 2017
The Enclave Alabang 11 Feb 2016 Studio Zen 24 Aug 2017
Filinvest (Reversed Logo) 24 Mar 2016 Austine Homes 14 Sept 2017
Filinvest Premiere 24 Mar 2016 Eastbay Palawan 07 Mar 2020
Futura 24 Mar 2016 Palm Estates 14 Sept 2017
The Ranch 12 May 2016 Filinvest Futura 07 Dec 2017
The Prominence 26 May 2016 Filinvest Prestige 07 Dec 2017
Aldea Real 07 July 2016 Futura by Filinvest 07 Dec 2017
Filinvest Technology Park 07 July 2016 Prestige by Filinvest 07 Dec 2017
La Brisa Townhomes 07 July 2016 Brentville International Community 17 Dec 2017
Montebello 07 July 2016 New Leaf 04 Jan 2018
Punta Altezza 07 July 2016 The Wood Estates 18 Jan 2018
Springfield View 07 July 2016 Asiana Oasis 15 Feb 2018
The Glens 07 July 2016 Ventura Real 29 Mar 2018
Vista Hills 07 July 2016 Nature Grove 19 Apr 2018
Woodville 07 July 2016 Belize Aspire 19 Apr 2018
Panglao Oasis 14 July 2016 Southwind 12 July 2018
Amare Homes 04 Aug 2016 Centro Spatial 02 Sept 2018
Nusa Dua 04 Aug 2016 Laeuna de Taal 14 Feb 2019
Pine View 04 Aug 2016 Amalfi 14 Feb 2019

43
TRADEMARK
DATE OF
REGISTRATION TRADEMARK
DATE OF
REGISTRATION
Santoso Villas 04 Aug 2016 Futura East 02 Sept 2018
Blue Palm Estate 11 Aug 2016 Futura Tierra 02 Sept 2018
Bluegrass County 11 Aug 2016 Manna East by Filinvest 04 Oct 2018
Pueblo Solana 11 Aug 2016 Futura Vinta 02 June 2019
Summerbreeze 11 Aug 2016 Belize Oasis 02 June 2019
Savannah Fields 01 Sept 2016 Futura Centro 16 May 2019
Park Spring 02 Nov 2017 venti-lite 08 Feb 2020
Aspire by Filinvest 07 Dec 2017 Filinvest Gaia New Clark City 08 Feb 2020
Filinvest Aspire 07 Dec 2017 Columna 20 Nov 2020
Meridian Place 08 Sept 2016 Studio N 11 Sept 2020
Alta Spatial 30 Sept 2016 Studio N (Tradename) 11 Sept 2020
Kembali Coast 30 Sept 2016 Futura One Fora Dagupan 10 Jan 2021
The Tropics 30 Sept 2016 Perth Oasis City Di Mare 10 Jan 2021
FLI has pending applications with the IPO for the following trademarks:
Brentville International Community
Filinvest Cyberzone
The Company has likewise filed an application with the World Intellectual Property Office (WIPO) for the international registration of
the “Filinvest” trademark under the Madrid Protocol. Accordingly, “Filinvest” is now registered in the following countries:
COUNTRY DATE REGISTERED
Malaysia 04 March 2015
United States of America 08 March 2016
Qatar 15 May 2016
Kuwait 04 September 2016
United Arab Emirates 22 March 2017
Thailand 22 May 2017
Singapore 24 August 2017
Japan 22 June 2018
Taiwan 01 July 2018
Cambodia 19 July 2018
Hong Kong 24 August 2018
China
21 September 2018 (Class 37);
14 October 2018 (Class 42);
28 October 2018 (Class 42);
Korea 19 November 2018
Statements of Certificate of Protection of the “Filinvest” trademark have also been issued by the following countries:
COUNTRY DATE
United Kingdom 14 Apr 2015
Australia 01 July 2015
Denmark 14 Sept 2015
Norway 16 Sept 2015
Switzerland 11 Dec 2015
Austria 16 Aug 2018
Benelux 20 Aug 2018
Sweden 14 Nov 2018

44
Hospitality
Below are the Hospitality Group’s trademarks registered with the IPO:
TRADEMARK DATE OF REGISTRATION
Crimson Hotels & Resorts -
Philippines June 24, 2010
Crimson & Design - Philippines July 22, 2010
Score Sports Bar November 27, 2014
Tempo November 27, 2014
Aum Spa & Wellness Center March 26, 2015
Saffron Café April 9, 2015
Azure October 8, 2015
Crimzone Active Kids December 3, 2015
Chroma Driven Hospitality January 21, 2016
Charley’s October 27, 2016
Chroma Hospitality and Device October 27, 2016
Mimosa November 24, 2016
Azure Beach Club (Old Logo) April 13, 2017
In a Heartbeat November 9, 2017
Quest Serviced Residences November 18, 2017
Grafik November 9, 2017
Graphic February 15, 2018
Grafik Nude August 22, 2019
Alabang. in a Heartbeat March 8, 2018
Boracay. in a Heartbeat February 15, 2018
Alitaptap November 21, 2019
Azure Beach Club (New Logo) March 8, 2018
Cebu in a Heartbeat May 17, 2018
Filinvest Hospitality August 3, 2017
Mactan. in a Heartbeat March 8, 2018
Alibi Bar + Lounge April 4, 2019
Baker J March 17, 2019
Quest April 7, 2011
Manila. in a Heartbeat February 15, 2018
Quest Plus May 23, 2019
Pulse May 23, 2019
Canvas Resorts December 14, 2020
Canvas December 14, 2020
Balai at Dauin April 6, 2020
Dive Tribe Dive Center December 14, 2020
Crimson Resort & Spa Boracay September 27, 2020
Crimson Resort & Spa Mactan
Cebu September 27, 2020
The Hospitality Group has pending applications with the IPO for the following trademarks:
Manila Bar
Crimzone
Firehouse Pizza

45
The following trademarks were registered under the Madrid Protocol:
TRADEMARK DATE OF
REGISTRATION COUNTRY
Crimson and Device March 21, 2012 Singapore
Crimson and Device June 18, 2012 Vietnam
Crimson & Logo October 24, 2012 Thailand
The International Bureau of the World Intellectual Property Organization pursuant to the Madrid Agreement and Protocol, has issued
a Certificate of Registration for the following marks:
TRADEMARK DESIGNATIONS UNDER THE MADRID PROTOCOL
Crimson and Design Brunei Darussalam, Cambodia, China, Indonesia, Japan, Lao
People’s Democratic Republic, Singapore, Thailand, USA, Vietnam
Crimson Hotels & Resorts Brunei Darussalam, Cambodia, China, Indonesia, Japan, Lao
People’s Democratic Republic, Singapore, Thailand, USA, Vietnam
Here below are the pending international trademark applications filed under the Madrid Protocol:
TRADEMARK DESIGNATION UNDER THE MADRID PROTOCOL
Canvas Hongkong, Thailand, China, Singapore
Canvas Hotels Hongkong, Thailand, China, Singapore
Canvas Resorts Hongkong, Thailand, China, Singapore
1.6 Government Regulations and Environmental Laws
Banking and Financial Services
Need for Government Approval of Principal Products or Services
The Bank’s principal products and services are offered to customers only upon receipt of the necessary regulatory approvals or
clearances. The Bank strictly complies with the related regulatory requirements such as reserves, liquidity position, loan exposure limits,
cap on foreign exchange holdings, provision for losses, anti-money laundering provisions and other reportorial requirements.
Effect of Existing or Probable Governmental Regulations on the Business
The Bank strictly complies with the BSP requirements in terms of capitalization reserves, liquidity position, limits on loan exposure,
cap on foreign exchange holdings, provision for losses, anti-money laundering provisions and other reportorial requirements as well as
other regulatory agencies such as the SEC, PSE, Philippine Deposit Insurance Corporation and the Bureau of Internal Revenues, among
others.
Real Estate
The real estate business in the Philippines is subject to significant government regulations over, among other things, land acquisition,
development planning and design, construction and mortgage financing and refinancing.
After the project plan for subdivision is prepared, FLI applies for a development permit with the local government. If the land is
designated agricultural land, FLI applies with the Department of Agrarian Reform (DAR) for a Certificate of Conversion or Exemption,
as may be proper. A substantial majority of FLI’s existing landbank is subject to the DAR conversion process. Approval of development
plans is conditioned on, among other things, completion of the acquisition of the project site and the developer’s financial, technical and
administrative capabilities. Approvals must be obtained at both the national and local levels. Evidently, FLI’s results of operations are
expected to continue to be affected by the nature and extent of the regulation of its business, including the relative time and cost involved
in procuring approvals for each new project, which can vary for each project.
The real estate companies are also subject to the application of the Maceda Law, which gives purchasers of real property purchased on
an installment basis certain rights regarding cancellations of sales and obtaining refunds from developers.
The Group believes that the real estate business has complied with all applicable Philippine environmental laws and regulations.
Compliance with such laws, is not expected to have a material effect on FLI’s capital expenditures, earning or competitive position.

46
Power Business
The Electricity Power Industry Reform Act (EPIRA), which brought about the changes needed in the power industry since the
National Power Corporation (NPC) was established in 1936, is now on its 17th year of implementation. EPIRA was enacted to overhaul
the power industry. Among its goals are (1) the deregulation of the generation sector; (2) creation of a government-owned transmission
company and the eventual privatization of the operation of the transmission system; (3) unbundling of supply activities from the
regulated distribution sector; (4) elimination of cross-subsidies within and among various grids, and among various classes of consumers;
(5) Creation of an independent regulatory body ERC and a Joint Congressional Power Commission to oversee implementation of the
law. The EPIRA also called for the privatization and sale of NPC assets and contracts with Independent Power Producers (IPPs) which
would help the government pay off NPC’s debts and invite the participation of private sector in the industry, creation of a wholesale
electricity spot market for the trading of energy and the implementation of retail competition and open access.
Renewable Energy (RE) Act of 2008. The RE Law aims to accelerate the development and use of renewable energy resources and
reduce the country’s dependence on fossil fuels. The law provides for a set of incentives to RE businesses such as income tax holiday
(ITH), duty-free importation and special realty tax rates on equipment and machinery, corporate tax rate of 10% after seven years of
ITH and zero percent value added tax rate on the sale of fuel or power generated from RE.
The RE Law also creates the Renewable Portfolio Standards which sets a minimum percentage of generation from eligible RE resources
and the Feed-in Tariff System, which determines the fixed tariff to be paid to electricity from emerging RE technologies and gives
priority connection, purchase and transmission of electricity generated from RE.
ERC. The enactment of the EPIRA law created the ERC to replace the Energy Regulatory Board. The ERC is an independent regulatory
body with quasi-judicial, quasi-legislative and administrative functions in the electric industry. The primary responsibilities of the ERC
are to ensure consumer education and protection and to promote competitive operations in the electricity market.
DOE. The DOE was created under Republic Act (RA) 7638 in 1992. Its mandate is to “prepare, integrate, coordinate, supervise and
control all plans, programs, projects and activities of the Government relative to energy exploration, development, utilization,
distribution and conservation”. The DOE has developed a 10-year Philippine Energy Plan with the goal of enhancing energy
security/independence and implementing market sector reforms to enable a more efficient sector’s operation and ensure proper supply
of a growing energy demand.
Hospitality Operations
Need for Government Approvals on Services
Rules and regulations to govern the accreditation of hotels, tourists inns, motels, apartels, resorts, pension houses and other
accommodation establishments pursuant to the provisions of Executive Order (EO) 120 in relation to RA No. 7160, otherwise known
as the Local Government Code of 1991 on the devolution of Department of Tourism’s (DOT) regulatory function over tourist
establishments have promulgated governing rules and regulations.
The DOT may issue an accreditation in favor of a hotel and resort, certifying that the establishment is recognized as having complied
with the DOT’s minimum standards of operation and that the establishment will ensure the safety, comfort and convenience of tourists.
Environmental Laws
The operation of the resorts operated by the Group and any further development thereon require an Environmental Compliance
Certificate (ECC) issued by the DENR, certifying that:
(a) The proposed project will not cause significant negative environmental impact; and
(b) The project proponent has complied with all the requirements of the Environmental Impact Statement (EIS) System and has
committed to implement its approved Environmental Management Plan (EMP).
An ECC contains specific measures and conditions with which that the project proponent undertakes to comply before and during the
operation of the project, and where applicable, during the project’s abandonment phase for the purpose of mitigating the project’s impact
to the environment. An EIS is a document prepared and submitted by the project proponent or an Environmental Impact Assessment
Consultant that serves as an application for an ECC, which includes a comprehensive study of the significant environmental impact of
the project and an EMP that the project proponent will fund and implement. An EMP details the prevention, mitigation, compensation,
contingency and monitoring measures that the project proponent intends to undertake to enhance the positive impact and to minimize
the negative effect of a proposed project.

47
To determine whether or not a project requires an ECC, the following factors are considered: (a) the nature of the project and its potential
to cause significant negative environmental impacts, and (b) the sensitivity or the vulnerability of environmental resources in the project
area.
Any project not covered by the EIS System may be covered by a Certificate of Non-Coverage from the EMB as proof that no ECC is
required for its commencement. An ECC of a project must be implemented within 5 years from the date of issuance, reckoned from the
date of ground breaking based on the project proponent’s work plan submitted to the EMB. An ECC not implemented within said period
will be deemed expired. A new ECC must be secured by the project proponent from the EMB should the project proponent intend to
pursue the project.
In the event that the project proponent abandons a project covered by an ECC, the project proponent must inform the EMB of such
abandonment; otherwise, the project proponent must continue to comply with the conditions of the ECC. Any abandonment of or
decommissioning plan over a project covered by an ECC will be subject to the prior approval of the EMB, which plan must be submitted
to the EMB at least 6 months prior to the intended abandonment/decommissioning. The implementation of such
abandonment/decommissioning will be verified by the EMB.
Sugar Operations
Environment
The sugar production process generates waste such as soot and dust, water and solid materials as well as noise at various stages of the
production process. The Group aims to develop its business without compromising environmental protection. The primary waste
produced in Group’s sugar segment’s production facilities is bagasse, which is fed to a boiler as fuel to produce steam which is then
used to generate power necessary for the sugar production process. In addition, water treatment and scrubber systems are installed in
PSHC’s production facilities to control wastewater discharge and clean waste gases that are emitted during the production process.
PSHC has obtained all environmental licenses from the relevant authorities in the Philippines that are necessary to conduct its business.
The environmental licenses obtained by PSHC are annually renewed. As of this date, PSHC has not been subject to any material fines
or legal action involving non-compliance with any relevant environmental laws and regulations in the Philippines.
Sugar Regulatory Administration
In 1986, EO 18 dated May 28, 1986 created the SRA. The SRA has the following powers and functions: (i) to recommend the
establishment of a sugar production, coefficient and production quota which is attached the land for each planter; (ii) to institute
regulations for implementing, controlling and monitoring the production quotas; (iii) to establish domestic, export and reserve
allocations; (iv) to explore and expand the domestic market and foreign markets for sugar and its by-products; (v) to assure mutual
benefits to consumers and producers, to promote and maintain proper balance of production of sugar and its by-products; (vi) to institute,
implement and regulate an orderly system of Quedanning, disposition and withdrawals of various forms of sugar from warehouses; (vii)
to evaluate and recommend to the President new projects involving the production of sugar and its by-products and other products
derived from sugarcane and sugar; (viii) to issue permits and licenses and collect corresponding fees and levies on the processing and
manufacture of sugar and its by-products and other products derived from sugarcane and sugar; (ix) to enter, make and execute routine
contracts that may be necessary for, or incidental to, the attainment of its purposes between any persons, firm, public or private, and the
Government; and (x) to do all such other things, transact such other businesses and perform such functions directly or indirectly
necessary incidental or conducive to the attainment of the purposes of the SRA.
All corporate powers of the SRA are vested in, and exercised by, the Sugar Board, which has the power, among others: (i) to establish
policies pertaining to sugar and sugarcane production control and Quedanning of sugar produced; withdrawals from sugar warehouses;
issuance of permits and licenses in the processing and manufacture of raw sugar, refined and other classes of sugar; issuance of permits
and licenses and other related issues pertaining to the specific and general powers prescribed in EO 18; and (ii) to enter into contracts,
transactions, or undertakings of whatever nature which are necessary or incidental to its functions and objectives.
Under EO 338 dated January 10, 2001, the SRA became an attached agency of the DA. Under Memorandum Order No. 134 dated
February 9, 2004, the Philippine Department of Finance and its attached bureaus, particularly, the Philippine Bureau of Customs (BOC)
and the BIR, were mandated to consult and coordinate with the SRA in the determination of the appropriate classification of sugar
products for certain purposes including, but not limited to, imposing the proper import duties, and/or assessing value added or other
taxes thereon. The BOC is required to notify the SRA in case of any importation, exportation or withdrawal from customs bonded
warehouses, of sugar, and all forms thereof, prior to their release and allow the SRA to inspect the shipment or warehouse to verify
compliance with its rules and regulations. The entry to and exit from special economic zones of sugar products is also covered by
Memorandum Order No. 134.
Sugar, molasses, and muscovado traders and processors of sugar-based products for export are required to register with the SRA pursuant
to SRA Order No. 006 dated June 24, 2005. Moreover, importers and exporters are required to secure a clearance from the SRA for the
export of sugar and molasses and the importation of refined sugar, raw sugar and molasses.

48
The SRA periodically issues a list of sugar traders registered with the SRA for a particular crop year and only persons and entities duly
registered with the SRA as sugar traders are authorized to withdraw sugar for export and domestic use from the warehouses of mill
companies and sugar refineries in accordance with the existing rules and regulations promulgated by the SRA. Sugar producers are
allowed to withdraw their respective shares of their own sugar production from mill and refinery warehouses for domestic consumption
in the Philippines only.
The SRA also issues a listing of registered molasses and muscovado traders with the SRA for a particular crop year and only persons
and entities duly registered with the SRA as molasses traders are authorized to withdraw molasses for export and domestic use from the
storage tanks of mill companies and sugar refineries in accordance with the existing rules and regulations promulgated by the SRA.
Sugar producers are allowed to withdraw their respective shares of their own molasses production from mill and refinery warehouses
for domestic consumption in the Philippines only.
1.7 Employees and Labor
As of December 31, 2020, FDC’s 11,778 employees (including 28 consultants) categorized by function are as follows:
As of
December 31, 2020
Real Estate
Operations ........................................................................................................... 358
Administrative and Support ................................................................................ 1,334
Technical ............................................................................................................. 662
Marketing ............................................................................................................ 108
Total ....................................................................................................................... 2,462
Hospitality Operations
Operations .......................................................................................................... 806
Administrative and Support................................................................................ 212
Technical ............................................................................................................ 93
Marketing ........................................................................................................... 75
Total ....................................................................................................................... 1,186
Banking and Financial Services
Operations ........................................................................................................... 4,895
Administrative and Support ................................................................................ 198
Technical ............................................................................................................. 200
Sales and Marketing ............................................................................................ 1,876
Total ....................................................................................................................... 7,169
Sugar Operations
Operations ........................................................................................................... 412
Administrative and Support ................................................................................ 76
Technical ............................................................................................................. 52
Marketing ............................................................................................................ 2
Total ....................................................................................................................... 542
Power Operations
Operations .......................................................................................................... 127
Administrative and Support................................................................................ 61
Technical ............................................................................................................ 76
Marketing ........................................................................................................... 14
Total ....................................................................................................................... 278
Others
Operations .......................................................................................................... 58
Administrative and Support................................................................................ 65
Technical ............................................................................................................ 18
Marketing ........................................................................................................... 0
Total ....................................................................................................................... 141

49
The sugar segment provides canteen facilities, medical clinic and other benefits to its employees. Sugar Group has a retirement plan for
its regular employees. Most of DSCC’s employees are members of the trade union Nagkahiusang Mamumuo sa DASUCECO, which
is affiliated with the Philippine National Federation of Labour. The collective bargaining agreement between DSCC and the National
Federation of Labour expired on June 30, 2020 but Management and the union agreed to defer negotiations by one year due to the effect
of Covid19 pandemic. Negotiations for a new 5-year collective bargaining agreement will commence on July 1, 2021. CSCC’s and
HYSFC’s employees are not covered by trade unions or collective bargaining agreements. The current labor union has been representing
DSCC’s rank and file workers for more than 30 years and has had not experienced work disruptions even when negotiations were not
proceeding smoothly. While negotiations sometimes resulted to deadlock on the issue of wages and signing bonus, Management does
not anticipate disruption in operations. The requirement of allocating a certain volume of production for exports is also an advantage
because it gives producers governmental protection from work disruption. CSCC’s and HYSFC’s employees are not covered by trade
unions or collective bargaining agreements.
The Group provides managers, supervisors and general staff the opportunity to participate in both in-house and external training and
development programs which are designed to help increase efficiency and to prepare employees for future assignments. The Group has
also provided a mechanism through which managers and staff are given feedback on their job performance, which the Group believes
will help to ensure continuous development of its employees’ knowledge base. The Group also offers employee benefits and salary
packages that it believes are in line with industry standards in the Philippines and which are designed to help it compete in the
marketplace for quality employees. It is The Group’s goal to position itself as an employer of choice in the Philippines.
1.8 Major Risks, Risk Management, Strengths and Strategies
The growth and success of the Group depends on its ability to understand and respond to the challenges of an uncertain and changing
world. This uncertainty generates risk which is among the critical issues that should be undertaken in ensuring the best performance in
the organization. By understanding and managing risk, the Group provides greater certainty and confidence for all the stakeholders.
Real Estate
There are major risk factors that may affect real estate or its operations. Property values in the Philippines are influenced by the general
supply and demand of real estate as well as political and economic developments in the country. In the event new supply exceeds demand
as a result of economic uncertainty or slower growth, political instability, or increased interest rates, the financial condition and results
of operations of real estate will be materially affected.
Demand for, and prevailing prices of, developed land and house and lot units are directly related to the strength of the Philippine
economy (including overall growth levels and interest rates), the overall levels of business activity in the Philippines and the amount of
remittances received from OFWs. Demand for real estate’s housing and land developments is also affected by social trends and changing
spending patterns in the Philippines, which in turn are influenced by economic, political and security conditions in the Philippines. The
residential housing industry is cyclical and is sensitive to changes in general economic conditions in the Philippines such as levels of
employment, consumer confidence and income, availability of financing for property acquisitions, construction and mortgages, interest
rate levels, inflation and demand for housing.
The demand for real estate’s projects from OFWs and expatriate Filipinos may decrease as a result of the following possibilities, i.e.
reduction in the number of OFWs, the amount of their remittances and the purchasing power of expatriate Filipinos. Factors such as
economic performance of the countries and regions where OFWs are deployed, changes in Government regulations such as taxation on
OFWs’ income, and, imposition of restrictions by the Government/other countries on the deployment of OFWs may also affect the
demand for housing requirements.
There are risks that some projects may not attract sufficient demand from prospective buyers thereby affecting anticipated sales.
Stringent government requirements for approvals and permits of new projects may take substantial amount of time and resources. In
addition, the time and the costs involved in completing the development and construction of residential projects can be adversely affected
by many factors, including unstable prices and supply of materials and equipment and labor, adverse weather conditions, peso
depreciation, natural disasters, labor disputes with contractors and subcontractors, accidents, changes in laws or in Government priorities
and other unforeseen problems or circumstances. Further, the failure by the real estate segment to substantially complete construction
of a project to its planned specifications or schedule may result in contractual liabilities to purchasers and lower returns.
Real estate’s cost of sales is affected by volatility in the price of construction materials such as lumber, steel and cement. While real
estate, as a matter of policy, attempts to fix the cost of materials component in its construction contracts, in cases where demand for
steel, lumber and cement are high or when there are shortages in supply, the contractors it hires for construction or development work
may be compelled to raise their contract prices. As a result, rising cost of any construction materials will impact real estate’s construction
costs, and the price for its products. Any increase in prices resulting from higher construction costs could adversely affect demand for
real estate’s products and the relative affordability of such products as compared to competitors’ products. This could reduce real estate
sales.
50
Real estate is also exposed to risks associated with the ownership and operation of its investment properties. Financial performance of
real estate’s leasing segment, could be affected by a number of factors, including:
1. the national and international economic climate;
2. changes in the demand for call center and other BPO operations as well as gaming operations in the Philippines and around
the world;
3. trends in the Philippine retail industry, insofar as retail malls are concerned;
4. changes in laws and governmental regulations in relation to real estate, including those governing usage, zoning,
environment, taxes and government charges;
5. the inability to collect rent due to bankruptcy of tenants or otherwise;
6. competition for tenants;
7. changes in market rental rates;
8. the need to periodically renovate, repair and re-let space and the costs thereof;
9. the quality and strategy of management; and,
10. FLI’s ability to provide adequate maintenance and insurance.
On known trends, events or uncertainties that have had or are reasonably expected to have favorable or unfavorable impact on net sales
or revenues or income from continuing operations of FLI, the Covid-19 global pandemic which started to occur in the Philippines in
January of 2020. In a move to contain the COVID-19 pandemic in the Philippines, on March 13, 2020, the Office of the President of the
Philippines issued a Memorandum directive to impose stringent social distancing measures in the National Capital Region (NCR)
effective March 15, 2020. On March 16, 2020, Presidential Proclamation No. 929 was issued, declaring a State of Calamity throughout
the Philippines for a period of six (6) months and imposed an ECQ throughout the island of Luzon until April 12, 2020, which was
subsequently extended to April 30, 2020 and further extended to May 15, 2020. The ECQ shifted to modified enhanced community
quarantine (MECQ) until May 31, 2020 and to general community quarantine (GCQ) for NCR and certain provinces until the first part
of the third quarter. Subsequently, MECQ was once again imposed on select areas including Metro Manila and a few other provinces in
the National Capital Region from August 4 to 18, 2020 then back again to GCQ until December 31, 2020. On January 1, 2021, the
Office of the President issued a Memorandum from the Executive Secretary placing the NCR and other highly urbanized cities and
independence component cities under GCQ and MGCQ until January 31, 2021, which was further extended until February 28, 2021 and
March 31, 2021 for certain parts of the country, including the NCR.
The company expects that these developments are unfavorable to the company’s overall financial performance as follows:
1. Decline in presales for both the domestic and the OFW market
2. Decline in revenues from our retail operations as a result of decline in foot traffic and temporary suspension of mall
operations except for outlets offering basic services like supermarkets, banks and healthcare centers, as mandated by the
government.
3. Delay in the completion of housing and office and retail buildings
4. Pre-leasing and occupancy of new buildings will be lower than expected
5. Some tenants might reduce or in worst case, pre-terminate space to adopt a work-from-home scheme or other flexible
working arrangements.
6. Possible cancellation of lease negotiations for either new space or expansion due to internal business decision of the client.
Hospitality
• Management of land bank, including area concentration within the land bank, could adversely affect margins due to changes in the
market value of land and significant changes in economic, political, security or market conditions;
• Increased competition with other developers for land has made suitable parcels of land more expensive and difficult to acquire;
• Increased competition in the hospitality industry, for example new supply in the markets within which the Company operates in or
will operate in, which could negatively affect the Group’s resort hotel’s occupancy;
• Obtaining regulatory permits, licenses and approvals can take a significant amount of time which could adversely delay or hinder
the development and operation of the projects;
• Obtaining required Government approvals and permits may take substantially more time and resources than anticipated or
construction of projects may not be completed on schedule and within budget;
• Infringement of Hospitality’s intellectual property rights;
• Success of the hospitality businesses depends on its ability to efficiently develop new hotel keys, to effectively operate and manage
hotel operations, and to compete with other hospitality offerings within the Philippines and the Asian region;
• Hospitality operations will require a substantial number of qualified managers and employees, and there is no guarantee that the
Group will be able to successfully recruit, train and retain a sufficient number of such qualified personnel;
• Changes in governmental laws and regulations, fiscal policies, and zoning ordinances and the related costs of compliance with laws
and regulations, fiscal policies, and ordinances;
• Loss of certain tax exemptions and incentives will increase tax liability and decrease any profits in the future;
51
• Changes in the domestic, regional, and global economies, which are affected by factors, including, but not limited to, the political
landscape, environmental conditions, and disease epidemics may require deferral of the commencement of various hospitality
projects;
• Increased threat of terrorism, terrorist events, airline strikes, hostilities between countries, or increased risk of natural disasters that
may affect travel patterns and reduce the number of business and commercial travellers and tourists;
• Increases in operating costs and occurrence of unanticipated costs due to various reasons, including inflation, labor costs, workers’
compensation and health-care related costs, utility and energy costs, property tax, advertising and promotion expenses, insurance,
environmental damage and acts of nature and their consequences;
• Changes in interest rates and in the availability, cost, and terms of debt financing and other changes in the business that adversely
affect our ability to obtain financing and comply with debt financing covenants;
• Relations between service providers, suppliers, and/or lenders and the Group;
• Difficulties in identifying hospitality assets to acquire and completing and integrating acquisitions;
• Increase in transportation or fuel costs or strikes among workers in the transportation industry, particularly in the aviation industry;
• Adverse weather patterns;
Banking and Financial Business
Risk Management
To ensure that corporate goals and objectives, and business and risk strategies are achieved, EW utilizes a risk management process that
is applied throughout the organization in executing all business activities. Employees’ functions and roles fall into one of the three
categories where risk must be managed in the business units, operating units and governance units.
EW’s activities are principally related to the use of financial instruments and are exposed to credit risk, liquidity risk, operational risk
and market risk, the latter being subdivided into trading and non-trading risks. Forming part of a coherent risk management system are
the risk concepts, control tools, analytical models, statistical methodologies, historical researches and market analysis, which are being
employed by EW. These tools support the key risk process that involves identifying, measuring, controlling and monitoring risks.
Risk Management Structure
a. BOD
EW’s risk culture is practiced and observed across the Group putting the prime responsibility on its BOD. It establishes the risk culture
and the risk management organization and incorporates the risk process as an essential part of the strategic plan of the Group. The BOD
approves EW’s articulation of risk appetite which is used internally to help management understand the tolerance for risk in each of the
major risk categories, its measurement and key controls available that influence EW’s level of risk taking. All risk management policies
and policy amendments, risk-taking limits such as but not limited to credit and trade transactions, market risk limits, counterparty limits,
trader’s limits and activities are based on EW’s established approving authorities which are approved by EW’s BOD. At a high level,
the BOD also approves EW’s framework for managing risk.
b. Executive Committee
This is a BOD level committee, which reviews the bankwide credit strategy, profile and performance. It approves the credit risk-taking
activities based on the Bank’s established approving authorities and likewise reviews and endorses credit-granting activities, including
the Internal Credit Risk Rating System.
c. Loan and Investments Committee
This committee is headed by the Chairman of EW whose primary responsibility is to oversee EW’s credit risk-taking activities and
overall adherence to the credit risk management framework, review business/credit risk strategies, quality and profitability of EW’s
credit portfolio and recommend changes to the credit evaluation process, credit risk acceptance criteria and the minimum and target
return per credit or investment transaction. All credit risk-taking activities based on EW’s established approving authorities are evaluated
and approved by this committee. It establishes an infrastructure by ensuring business units have the right systems and adequate and
competent manpower support to effectively manage its credit risk.
d. Asset-Liability Management Committee (ALCO)
ALCO, a management level committee, meets on a weekly basis and is responsible for the over-all management of EW’s market,
liquidity, and financial position related risks. It monitors EW’s liquidity position and reviews the impact of strategic decisions on
liquidity. It is responsible for managing liquidity risks and ensuring exposures remain within established tolerance levels. The ALCO’s
primary responsibilities include, among others, (a) ensuring that EW and each business unit holds sufficient liquid assets of appropriate
quality and in appropriate currencies to meet short-term funding and regulatory requirements, (b) managing financial position and
ensuring that business strategies are consistent with its liquidity, capital and funding strategies, (c) establishing asset and/or liability
pricing policies that are consistent with the financial position objectives, (d) recommending market and liquidity risk limits to the Risk

52
Management Committee (RMC) and BOD and (e) approving the assumptions used in contingency and funding plans. It also reviews
cash flow forecasts, stress testing scenarios and results, and implements liquidity limits and guidelines.
e. RMC
RMC is a BOD level committee that convenes monthly and is primarily responsible to assist the BOD in managing EW’s risk taking
activities. This is performed by the committee by institutionalizing risk policies and overseeing the EW’s risk management system. It
develops and recommends risk appetite and tolerances for EW’s major risk exposures to the BOD. Risk management principles,
strategies, framework, policies, processes, and initiatives and any modifications and amendments thereto are reviewed and approved by
RMC. It oversees and reports to the BOD the effectiveness of the risk management system, overall risk profile, and compliance with
the risk appetite and tolerances that the BOD approved.
f. Risk Management Subcommittee (RMSC)
RMSC is a management level committee that convenes, at least four times in a year, and is responsible to assist RMC in fulfilling its
responsibilities in managing EW's risktaking activities. This is performed by the committee by implementing the risk management
principles, strategies, framework, policies, processes, and initiatives across the EW. It leads the effective conduct of risk and capital
management. It oversees and directs the management of the EW’s overall risk profile. The committee likewise oversees risk incidents,
control gaps, and control deficiencies and management actions in implementing the corresponding corrective actions.
g. Audit Committee (Audit Com)
The Audit Com assists the BOD in fulfilling its responsibilities for overseeing senior management in establishing and maintaining an
adequate, effective and efficient internal control framework. It ensures that systems and processes are designed to provide reasonable
assurance in areas including reporting, monitoring compliance with laws, regulations and internal policies, efficiency and effectiveness
of operations, and safeguarding of assets. It is tasked to discuss with management EW’s major risk exposures and ensures accountability
on the part of management to monitor and control such exposures including EW’s risk assessment and risk management policies. The
Audit Com oversees the internal audit function and is responsible for monitoring and reviewing its effectiveness while ensuring its
independence.
h. Corporate Governance and Compliance Committee (CGCC)
The CGCC leads the Bank in defining and fulfilling the corporate governance policies and attaining best practices while overseeing the
implementation of the Bank’s compliance program, money laundering and terrorist financing prevention program and ensuring that
regulatory compliance issues are resolved expeditiously. In addition to its governance role, the CGCC also assumes the nomination
function whereby it reviews and evaluates the qualifications of all persons nominated to the BOD, all direct reports of the President and
CEO, Heads of Governance Units regardless of rank, and other positions of the bank requiring appointment by the BOD. The committee
oversees the annual performance evaluation of the BOD, its committees, and individual directors and conducts an annual self-evaluation
of its performance as prescribed under and in accordance with the Corporate Governance Manual and SEC Code of Corporate
Governance for Publicly Listed Companies.
i. Related Party Transactions (RPT) Committee
The RPT Committee assists the BOD in ensuring that the transactions with related parties of EW are handled in a sound and prudent
manner, with integrity and in compliance with the applicable laws and regulations to protect the interest of depositors, creditors and
other stakeholders. It also ensures that related party transactions are conducted on an arm’s length basis and that no stakeholder is unduly
disadvantaged by such transactions.
j. Asset Impairment Committee (AIC)
AIC is a management level committee that convenes at least 2 times in a year, and shall officially represent EW’s source of experienced
credit judgment insofar as the asset impairment exercise is concerned. This experienced credit judgment is tapped to provide guidance
under the following, but not limited to, conditions: 1) The result of the calculation is assessed to be unreasonable that it is considered as
not fairly representative of EW’s historical experience, current, and prospective credit condition or other conditions deemed relevant in
reasonably determining EW’s assets’ recoverable value; 2) There is an adverse change in the prevailing or foreseen prospective
economic condition relative to the embedded presumption in the existing impairment framework; and 3) The data set in the calculation
parameters is not available or insufficient to complete the calculation.
k. Risk Management Division (RMD)
RMD performs an independent risk governance function within EW. RMD is tasked with identifying, measuring, controlling and
monitoring existing and emerging risks inherent in EW’s overall portfolio (on- or off-balance sheet). RMD develops and employs risk
assessment tools to facilitate risk identification, analysis and measurement. It is responsible for developing and implementing the
framework for policies and practices to assess and manage enterprise-wide market, credit, operational, and all other risks of the Bank.

53
It also develops and endorses risk tolerance limits for BOD approval, as endorsed by the RMC, and monitors compliance with approved
risk tolerance limits. Finally, it regularly apprises the BOD, through the RMC, the results of its risk monitoring.
l. Internal Audit (IA)
IA provides an independent assessment of the adequacy of EW’s internal controls, risk management, governance framework and
execution/operational practices. Internal audit activities are conducted in accordance with the International Standards for the
Professional Practice of Internal Auditing and the Code of Ethics. IA has adopted a risk assessment methodology, which provides a
sound basis in the selection of areas of coverage and frequency of audit for the preparation of the annual audit plan. IA employs a risk-
based audit approach that examines both the adequacy of the policies and the Bank’s compliance with the procedures while assuring
audit coverage of the areas identified as representing the greatest current risk. It discusses the results of assessments with management,
and reports its findings and recommendations to the Audit Com. IA’s activities are suitably designed to provide the BOD with reasonable
assurance that significant financial and operating information is materially complete, reliable and accurate; internal resources are
adequately protected; and employee performance is in compliance with the Bank’s policies, standards, procedures and applicable laws
and regulations.
m. Compliance Division
Compliance Division is vested with the responsibility of overseeing the design of EW’s Compliance Program and coordinating its
effective implementation towards the sound management of Business and Compliance Risks. It also manages the implementation of
the Money Laundering and Terrorist Financing Program. Its mandate is to ensure that EW is compliant with relevant and applicable
laws, rules, regulations, codes of conduct and standards of good practice while avoiding an overly risk-averse environment that inhibits
business growth. It serves as EW’s central point of contact with banking regulators.
Credit Risk
Credit risk refers to the potential loss of earnings or capital arising from an obligor/s, customer/s or counterparty’s failure to perform
and/or to meet the terms of any contract with EW. Credit risks may last for the entire tenor and set at the full amount of a transaction
and in some cases, may exceed the original principal exposures. The risk may arise from lending, trade financing, trading, investments
and other activities undertaken by EW. To identify and assess this risk, EW has: 1) approval process per the borrower or business and/or
product segment; and 2) structured and standardized credit rating for corporate loans and risk acceptance criteria for consumer loans.
For large corporate credit transactions, EW has a comprehensive procedure for credit evaluation, risk assessment and well-defined
concentration limits, which are established for each type of borrower. EW’s credit risk is managed at the portfolio level, which may be
on an overall perspective or according to product type.
Credit concentration
Excessive concentration of lending plays a significant role in the weakening of asset quality. EW reduces this risk by diversifying its
loan portfolios across various sectors and borrowers. EW believes that good diversification across economic sectors and geographic
areas, among others, will enable it to ride through business cycles without causing undue harm to its asset quality.
EW’s loan portfolio is in line with EW’s policy of not having significant concentrations of exposure to specific industries or group of
borrowers. Management of risk concentration is by client/counterparty, by industry sector, and by geographical location. For risk
concentration monitoring purposes, the financial assets are broadly categorized into loans and receivables, loans and advances to banks,
and investment securities. EW ensures compliance with BSP’s limit on exposure to any single person or group of connected persons
by closely monitoring large exposures and top 20 borrowers for both single and group accounts.
Aside from ensuring compliance with BSP’s limit on exposures to any single person or group of connected persons, it is the bank’s
policy to keep the expected loss (determined based on the credit risk rating of the account) of large exposure accounts to, at most, one
and a half percent (1.5%) of their aggregate outstanding balance. This is to maintain the quality of the Group’s large exposures. With
this, accounts with better risk grades are given priority in terms of being granted a bigger share in EW’s loan facilities.
Aligned with the Manual of Regulations for Banks definition, EW considers its loan portfolio concentrated if it has exposures of more
than thirty percent (30.0%) to an industry.
Collateral and other credit enhancements
Collaterals are taken into consideration during the loan application process as they offer an alternative way of collecting from the client
should a default occur. The percentage of loan value attached to the collateral offered is part of EW’s lending guidelines. Such
percentages take into account safety margins for foreign exchange rate exposure/fluctuations, interest rate exposure, and price volatility.
Collaterals are valued according to existing credit policy standards and, following the latest appraisal report, serve as the basis for the
amount of the secured loan facility. Premium security items are collaterals that have the effect of reducing the estimated credit risk for
a facility. The primary consideration for enhancements falling under such category is the ease of converting them to cash. EW is not

54
permitted to sell or re-pledge the collateral in the absence of default by the owner of the collateral. It is EW’s policy to dispose foreclosed
assets in an orderly fashion. The proceeds of the sale of the foreclosed assets, included under Investment Properties, are used to reduce
or repay the outstanding claim. In general, EW does not occupy repossessed properties for business use.
As part of EW’s risk control on security/collateral documentation, standard documents are made for each security type and deviation
from the pro-forma documents are subject to legal review prior to implementation.
Internal Credit Risk Rating System
The Bank employs a credit scoring system for borrowers to assess risks relating to the borrower and the loan exposure. Borrower risk
is evaluated by considering (a) quantitative factors, such as financial condition and (b) qualitative factors, such as management quality
and industry outlook.
Prior to the 2nd quarter of 2020
For corporate loans, the Bank’s rating system assesses default risk based on financial profile, management capacity, industry
performance, and other factors deemed relevant. Credit rating that exceeds the defined threshold, thus signaling significant risk, among
other account-level profile and performance factors, define whether the accounts are classified in either Stage 1, Stage 2, or Stage 3 per
PFRS 9 loan impairment standards.
Beginning the 2nd quarter of 2020
For corporate loans, the financial condition assessment focuses on profitability, liquidity, working capital management, and leverage.
Management quality determination is based on the borrower’s strategies, management competence and skills, and management of
banking relationship while industry outlook is evaluated based on its importance to the economy, growth, industry structure and relevant
government policies. Based on these factors, each borrower is assigned a Borrower Risk Rating (BRR), that ranges from 1 to 6. A
borrower may be downgraded when it exhibits the characteristics of a classified account described below, in which case it will be
assigned a risk rating ranging from 7 to 10. Consideration is also given to security arrangements in computing for the final BRR.
Depending on certain requisites, an account secured by real estate mortgages and hold-out on deposits or guarantees may be upgraded
to better risk classifications.
The BRR for each borrower is reviewed annually. A more frequent review is warranted in cases where the borrower has a higher risk
profile or when there are extraordinary or adverse developments affecting the borrower, the industry and/or the Philippine economy.
The following is a brief explanation of the Bank’s risk grades:
Rating Description Account/Borrower Characteristics
1 Excellent • low probability of going into default within the coming year; very high
debt service capacity and balance sheets show no sign of any weakness
• has ready access to adequate funding sources
• high degree of stability, substance and diversity
• of the highest quality under virtual economic conditions
2 Strong • low probability of going into default in the coming year
• access to money markets is relatively good
• business remains viable under normal market conditions
• strong market position with a history of successful financial performance
• financials show adequate cash flows for debt servicing and generally
conservative balance sheets
3 Good • sound but may be susceptible, to a limited extent, to cyclical changes in
the markets in which they operate
• financial performance is good and capacity to service debt remains
comfortable
• cash flows remain healthy and critical balance sheet ratios are at par with
industry norms
• reported profits in the past three years and expected to sustain
profitability in the coming year
4 Satisfactory • clear risk elements exist and probability of going into default is
somewhat greater, as reflected in the volatility of earnings and overall
performance
• normally have limited access to public financial markets
• able to withstand normal business cycles, but expected to deteriorate
beyond acceptable levels under prolonged unfavorable economic period
• combination of reasonably sound asset and cash flow protection

55
Rating Description Account/Borrower Characteristics
5 Acceptable • risk elements for the Bank are sufficiently pronounced, but would still be
able to withstand normal business cycles
• immediate deterioration beyond acceptable levels is expected given
prolonged unfavorable economic period
• there is sufficient cash flow either historically or expected in the future
in spite of economic downturn combined with asset protection
5B Acceptable • financial condition hard to ascertain due to weak validation of financial
statements coupled by funding leakages to other business interests whose
financial condition is generally unknown
• continuous decline in revenues and margins due to competition
• substantial or unexplained build-up in borrowings with banks financing
bulk of working capital and capex requirements coupled by substantial
dividends pay-outs
• chronically tight cash flows with operating income negative or barely
enough for debt servicing
• with past record of past due loans with other banks, cancelled credit
cards and court cases
6 Watchlist • with identified disruptions that may negatively affect performance but are
likely to be resolved within the year
• deteriorating revenue, net income, margins, leverage which may lead to
loss on credit exposure if trends are not reversed
• thin margin business with high debt burden with increase in debt level
not commensurate to growth in revenues and funding requirements
7 Special
Mention • not meeting expectations on business projections and/or repayment
schedule
• experienced sudden and unexpected adverse event which is likely to affect
business operations and eventually loan repayment
• maxed out lines with banks and availments evergreen with minimal
payments made over time
• some payment defaults but with probability to revert to current
• loan has been restructured but conditions that fully met
• litigation is being contemplated
8 Substandard • net loss for the last 2 years that have eroded capital substantially with no
clear prospects of a turnaround or capital infusion from owners
• evergreen for 2 years with lines with all creditors maxed-out and no clear
source of repayment due to chronic tightness in cashflows
• recurring past due status due to cashflow problems with no definite
commitment to pay or restructure
• restructured but not complied
• with serious flaws in Type A documentation that have surfaced after loan
release
• collection case filed
9 Doubtful • continuing losses that have totally wiped out equity
• business viability uncertain due to adverse business conditions such as
substantial loss of market share, unsalable products due to obsolescence,
competition, and influx of cheap substitutes
• business is bankrupt but may have pending recovery plans such as merger
or acquisition, capital infusion and refinancing plans that classification to
loss is deferred
• with assets for liquidation but full recovery of principal uncertain due to
marketability and outstanding claims
10 Loss • business is non-operational and loans are considered absolutely
uncollectible due to presence of fraud and major build-up of claims and
litigation
• borrower's whereabouts unknown or insolvent or earning power-
impaired and guarantors are insolvent or guarantee not financially
supported
56
It is the Bank’s policy to maintain accurate and consistent risk ratings across the corporate credit portfolio. This facilitates a focused
management of the applicable risk and the comparison of credit exposures across all lines of businesses, geographic regions, and
products. The rating system is supported by a variety of financial analytics, combined with processed market information to provide the
main inputs for the measurement of counterparty risk. All internal risk ratings are tailored to the various categories and are derived in
accordance with the Bank’s rating policy. The risk ratings are assessed and updated regularly.
The consumer loan portfolio of the Bank is composed of the following product lines: credit cards, auto, mortgage, salary, personal and
branch loans. Each of these products has established credit risk guidelines and systems for managing credit risk across all businesses.
For credit cards, auto and mortgage loans, application and behavioral scoring models are in place that primarily consider demographic
variables and payment behavior, respectively, for the assessment of the likelihood of default by the borrower. For the other consumer
loans, minimum risk acceptance criteria were set for each portfolio according to the nature of the product and the target market and is
used for the evaluation of the credit quality of borrowers at origination.
For purposes of comparison of different exposure types, the credit portfolios (corporate and consumer) of the Bank are benchmarked
against marketable corporate debt securities (using the Standard & Poor’s (S&P) global study on corporate exposures) based on credit
risk rating and corresponding PDs.
The Bank assigns credit risk using the following credit score master scale:
Credit quality Description Credit rating
Investment Grade These accounts are of the highest
quality and are likely to meet
financial obligations.
AAA to AA+
AA
AA-
A+
A
A-
BBB+
BBB
Standard Grade These accounts may be
vulnerable to adverse business,
financial and economic
conditions but are expected to
meet financial obligations.
BBB-
BB+
BB
BB-
B+
B
B-
Substandard Grade These accounts are vulnerable to
non-payment but for which
default has not yet occurred.
CCC+ to C-
Non-Performing These refer to accounts which are
in default or those that
demonstrate objective evidence
of impairment.
Default
Liquidity Risk
Liquidity risk is the risk that sufficient funds are unavailable to adequately meet all maturing liabilities, including demand deposits and
off-balance sheet commitments. The main responsibility of daily asset liability management lies with EW’s Treasury Group, specifically
the Liquidity Desk, which are tasked to manage the balance sheet and have thorough understanding of the risk elements involved in the
respective businesses. Only EW and EWRB are potentially exposed to liquidity risk exposures, where their liquidity risk management
are monitored by their respective ALCOs. Resulting analysis of the balance sheet along with the recommendation is presented during
the weekly ALCO meeting where deliberations, formulation of actions and decisions are made to minimize risk and maximize returns.
Discussions include actions taken in the previous ALCO meeting, economic and market status and outlook, liquidity risk, pricing and
interest rate structure, limit status and utilization. To ensure that both EW and EWRB have sufficient liquidity at all times, the respective
ALCO formulates a contingency funding plan which sets out the amount and the sources of funds (such as unutilized credit facilities)
available to both entities and the circumstances under which such funds will be used.
By way of the Maximum Cumulative Outflow limit, the Group is able to manage its long-term liquidity risks by placing a cap on the
outflow of cash on a per tenor and on a cumulative basis. The Group takes a multi-tiered approach to maintaining liquid assets. EW’s
principal source of liquidity is comprised of Cash and other cash items, Due from BSP, Due from other banks and Interbank Loans
Receivable with maturities of less than 1 year. In addition to regulatory reserves, EW maintains a sufficient level of secondary reserves
in the form of liquid assets such as short-term trading and investment securities that can be realized quickly.

57
Market Risk
Market risk is the risk that the fair value or future cash flows of financial instruments will fluctuate due to changes in market variables
such as interest rates, foreign exchange rates, and equity prices. EW treats exposures to market risk as either for trading or accrual or
balance sheet exposure. The market risk for the trading portfolio is measured using Value at Risk (VaR). Interest rate risk of accrual
portfolios in the Banking Book are measured using Earnings at Risk (EaR).
Market risk in the trading book
The BOD has set limits on the level of market risk that may be accepted. VaR limits are applied at the instrument level and approved
by the BOD based on, among other things, a business unit’s capacity to manage price risks, the size and distribution of the aggregate
exposure to price risks and the expected return relative to price risks.
EW applies the VaR methodology to assess the market sensitive positions held for trading and to estimate the potential economic loss
based on parameters and assumptions. VaR is a method used in measuring market risk by estimating the potential negative change in
the market value of a portfolio at a given confidence level and over a specified time horizon.
Objectives and Limitations of the VaR Methodology
EW uses the VaR model of Bloomberg Portfolio Analytics using 1-year historical data set to assess possible changes in the market value
of the fixed income, equities, and foreign exchange trading portfolio. VaR for the U.S. treasury futures is measured using Historical
Simulation using an internally developed Excel spreadsheet. The interest rate swaps (IRS) and foreign exchange (FX) forwards (outright
and forward leg of FX Swaps) trading portfolio’s interest rate risk is measured using Monte Carlo VaR using OPICS Risk Plus. The
VaR models are designed to measure market risk in a normal market environment. The use of VaR has limitations because correlations
and volatilities in market prices are based on historical data and VaR assumes that future price movements will follow a statistical
distribution. Due to the fact that VaR relies heavily on historical data to provide information and may not clearly predict the future
changes and modifications of the risk factors, the probability of large market moves may be underestimated.
VaR may also be under or overestimated due to assumptions placed on risk factors and the relationship between such factors for specific
instruments. Even though positions may change throughout the day, VaR only represents the risk of the portfolio at the close of each
business day, and it does not account for any losses that may occur beyond the specified confidence level.
In practice, actual trading results will differ from the VaR calculation and the calculation does not provide a meaningful indication of
profits and losses in stressed market conditions. To determine the reliability of the VaR model, actual outcomes are monitored through
hypothetical and actual backtesting to test the accuracy of the VaR model.
Stress testing provides a means of complementing VaR by simulating the potential loss impact on market risk positions from extreme
market conditions, such as risk factor movements based on historical financial market stress conditions and scenarios adopted from the
uniform stress testing framework of the BSP.
VaR assumptions
The VaR that EW uses is premised on a 99.0% confidence level that this potential loss estimate is not expected to be exceeded if the
current market risk positions were to be held unchanged for a given holding period. Foreign exchange and U.S.Treasury Futures VaR
is measured using 1 day holding period while fixed income VaR has a holding period of 5 days. Furthermore, EW’s equity and IRS
trading positions are assumed to be closed out in 10 days. The use of a 99.0% confidence level means that within the set time horizon,
losses exceeding the VaR figure should occur, on average, not more than once every hundred days.
VaR is an integral part of EW’s market risk management and encompasses investment positions held for trading. VaR exposures form
part of the market risk monitoring which is reviewed daily against the limit approved by the BOD. The trading activities are controlled
through the Market Risk Limit (MRL), which is a dynamic risk limit anchored on the principle of risk and return which is adjusted by
net trading gains (added in half) or losses subtracted in whole. RMD reports compliance to the MRL and trader’s VaR limits daily. If
the MRL or individual trader’s limit is exceeded, such occurrence is promptly reported to the Treasurer, President, Chief Risk Officer
and the Chief Executive Officer, and further to the BOD through the RMC.
Foreign Currency Risk
EW holds foreign currency denominated assets and liabilities, thus, foreign exchange rate fluctuations can affect the financials and cash
flows of EW. Managing the foreign exchange exposure is important for banks with exposures in foreign currencies. For EW, this
includes purchase or sell of foreign currency to control the impact of changes in exchange rates on its financial position.
EW’s foreign currency exposures emanate from its net open spot and forward FX purchase and sell transactions, and net foreign currency
income accumulated over the years of its operations. Foreign currency-denominated deposits are generally used to fund EW’s foreign
currency-denominated loan and investment portfolios in the FCDU.
In the FCDU books, BSP requires banks to match the foreign currency assets with the foreign currency liabilities. Thus, banks are
required to maintain at all times a 100.0% cover for their currency liabilities held through FCDU.

58
Total foreign currency position is monitored through the daily BSP FX position reports, which are subject to the overbought and oversold
limits set by the BSP at 20.0% of unimpaired capital or US$50.0 million, whichever is lower. Internal limits regarding the intraday
trading and end-of-day trading positions in FX, which consider the trading desk and the branch FX transactions, are also monitored.
The analysis calculates the effect of a reasonably possible movement of the foreign currency rate against Peso, with all other variables
held constant, on the statement of income. A negative amount reflects a potential net reduction in statement of income while a positive
amount reflects a net potential increase. There is no other impact on the Bank’s equity other than those already affecting the statements
of income.
Market Risk in the Banking Book
Interest rate risk
Interest rate risk in the banking book (IRRBB) is inherent in EW’s traditional banking activities that include taking deposits to invest or
grant loans. The future cash flows from these activities are exposed to variations in interest rates, largely from mismatch in tenors and
prices, IRRBB is measured with Earnings-at-Risk (EaR) which is a measure of the net interest income movement due to changes in
prevailing interest rates and the balance sheet re-pricing profile of EW. The EaR limit is set as a function of the EW’s net interest margin
(NIM). The EaR limit preserves EW’s capital and competitive position by restricting the impact of interest rate sensitivities to NIM
within the corridor of above average and within the first quartile of its peer banks. In measuring EaR, EW’s interest re-pricing assets
and liabilities are matched by re-pricing (or maturity if non-repricing) buckets covering tenors within a 1-year horizon, and
corresponding gaps determined. If positive gap is noted, it implies that an increase in interest rates will positively affect the net interest
income. Conversely, a negative gap implies that an increase in interest rates will negatively affect the net interest income. The estimated
nominal impact to EW’s earnings is derived by multiplying the volatility of benchmark yields for each tenor bucket to the repricing gap
profile. The result is compared vs EaR limit to monitor the compliance with the limit and is reported to the RMC on a monthly basis.
Additionally, EaR limit is reviewed and updated annually to ensure its continued relevance and alignment EW’s financial targets,
strategies, and overall risk appetite.
To complement EaR and provide Management a more holistic view, EW performs forward looking scenario and sensitivity analysis as
well as stress testing activities to identify any vulnerabilities. The Bank employs 3 methodologies in the conduct of stress testing a)
economic/historical stress test which assumes a parallel shift in interest yield curves of 660.0 basis points for PhP-denominated assets
and liabilities and 270.0 basis points for USD-denominated, b) uniform stress test, a regulatory-prescribed stress test, has 3 scenarios
with assumed parallel shift in interest rates for both PhP (from 300.0 bps to 500.0 bps) and USD (from 100.0 bps to 300.0 bps), c)
reverse stress test, which primarily measures the highest swing in interest rates that can potentially wipe out the Banks targeted net
income and net interest income.
All IRRBB reports are also presented to the ALCO. The ALCO deliberates on matters pertaining to the management of the Bank’s
assets and liabilities, such as achieving optimum asset and liability mix, pricing, liquidity levels, repricing gap positions, and asset
quality. The Bank’s ALCO meets on a weekly basis.
The Bank manages its IRRBB through effective diversification of funding sources. By offering various deposit, investment and loan
products with differing maturities, the Bank is able to meet its short, medium and long-term obligations, optimize returns, and provide
options that cater to differing preferences of its target market. The Bank’s target funding mix is aligned with the Bank’s overall growth
plans. While the Bank mainly manages IRRBB through careful planning of its cashflows, it also has access to various derivative
products that provide flexibility in responding to more abrupt market developments.
EW also monitors its exposure to fluctuations in interest rates by using scenario analysis to estimate the impact of interest rate movements
on its interest income. This is done by modeling the impact to EW’s interest income and interest expenses of different parallel changes
in the interest rate curve, assuming the parallel change only occurs once and the interest rate curve after the parallel change does not
change again for the next twelve months.
Operational Risk
Operational risk is the loss resulting from inadequate or failed internal processes, people and systems or from external events. It includes
legal, compliance and reputational risks but excludes strategic risk.
Other Risk Exposures
EW’s risk exposures other than credit, market, liquidity and operational, while existent, are deemed insignificant relative to the
mentioned risks and if taken in isolation. Hence, management of these risks are instead collectively performed and made an integral
part of EW’s internal capital adequacy assessment process and enterprise risk management initiatives.
Power Operations
• Increased competition in the power industry, including competition resulting from legislative, regulatory and industry
restructuring efforts, could have a material adverse effect on FDCUI’s operations and financial performance.
• Administration and operation of power generation plants involve significant risks.
▪ The administration and/or operation of power generation plants involve significant risks, including:

59
▪ breakdown or failure of power generation equipment, transmission lines, pipelines or other equipment or processes,
leading to unplanned outages and operational issues;
▪ flaws in the equipment design or in power plant construction;
▪ issues with the quality or interruptions in the supply of key inputs, including fuel or water;
▪ material changes in legal, regulatory or licensing requirements;
▪ operator error;
▪ performance below expected levels of output or efficiency;
▪ industrial actions affecting power generation assets owned or managed by FDCUI or its contractual counterparties;
▪ pollution or environmental contamination affecting the operation of power generation assets;
▪ force majeure and catastrophic events including fires, explosions, earthquakes, volcanic eruptions, floods and
terrorist acts that could cause forced outages, suspension of operations, loss of life, severe damage and plant
destruction;
▪ planned and unplanned power outages due to maintenance, expansion and refurbishment;
• Inability to obtain or the cancellation of required regulatory, permits and approvals; and opposition from local communities
and special interest groups.
• FDCUI may experience issues with respect to its fuel costs or supply.
• FDCUI engages technical partners and third-party operators and specialized suppliers in connection with the power
generation at its power plant.
• FDCUI is exposed to credit and collection risks.
• FDCUI’s power supply agreements are subject to approval and renewal risk.
• FDCUI may not successfully implement its growth strategy in the power industry.
• The Group’s growth plans may be limited by the Philippines’ transmission infrastructure.
• The Group currently only has 1 operating generation asset.
• FDCUI faces risks relating to its future power generation projects, including risks relating to project cost, completion time
frame and development rights.
• Policy and regulatory responses to climate change may adversely affect FDCUI’s business and prospects.
• The loss of certain tax exemptions and incentives will increase FDCUI’s tax liability and decrease any profits it might have in
the future.
Sugar Operations
• Farmers are not required to grow sugarcane and may cultivate other crops.
• The Sugar Group’s business is dependent on certain principal customers who are not under any obligation to purchase the Sugar
Group’s products, and the loss of, or a significant reduction in, purchases by such customers could adversely affect the Sugar
Group’s business.
• Reduced demand for or changes in perception of end-products that use raw or refined sugar.
• Contract farmers may not repay their crop loans to PSHC.
• Adverse weather conditions, crop disease, substandard sugarcane quality and certain sugarcane crop varieties grown by farmers
may adversely affect sugarcane crop yields and sugar recovery rates for any given harvest.
• The Sugar Group may be adversely affected by price fluctuations in sugar and related markets, such as ethanol, oil and corn.
• The Sugar Group is potentially subject to price competition from illegally imported sugar.
• Because the Sugar Group’s contracts to cultivate sugarcane are based on the amount of land the farmer cultivates rather than a set
quantity or quality of sugarcane, the yield per hectare of land determines in large part the quantity of sugarcane the Sugar Group
receive and the Sugar Subsidiaries cannot guarantee that the supply their mills receive in a given year will be sufficient to meet
their needs.
• Because DSCC and CSCC contract with sugarcane farmers to cultivate sugarcane under long term contracts, DSCC and CSCC may
be obligated to mill the sugarcane produced even if they will be unable to sell the resulting sugar.
• In the event that existing barriers to the import of sugar to the Philippines are further reduced or lifted, the Sugar Group may face
increasing competition from international sugar manufacturers which may adversely affect their profitability.
• The Sugar Group’s results of operations could be adversely affected by a disruption of operations at their manufacturing facilities.
• The collective bargaining agreement which governs most DSCC employees will expire on June 30, 2020.
Competitive Strengths
The Group believes that its principal strengths are the following:
Strategically Positioned in Attractive Growth Sectors of the Philippine Economy
The Group believes its businesses are well-positioned in high growth sectors of the Philippine economy which will allow it to take
advantage of primary economic and consumption growth drivers such as OFW remittances, BPOs, and tourism, among others.

60
In real estate, the Group entered the affordable housing space in the early 1990s when most developers were still focused on the higher
end of the market, allowing the Group to benefit from the growth of OFW remittances and a housing supply shortage. In particular, the
Group primarily targets the affordable and middle-income residential markets, which together are believed by the Group to be the largest
addressable markets in residential development in the Philippines. The Group was one of the pioneers in providing projects and office
space catering to the BPO industry, which started in 2000 and quickly became a key driver for the Philippines’ strong economic growth
supported by Government incentives. As a result of this early entry into the BPO space, the Group has almost tripled its aggregate office
GLA from 175,565 sq.m. as of December 31, 2012 to 523,904 sq.m. as of December 31, 2020. In addition to traditional BPOs, recent
years have also seen the influx of Philippine Offshore Gaming Operators as tenants.
The Group has also built a track record of developing large-scale, master-planned townships, the first of which was Filinvest City, a
joint venture formed in 1992 between the Government and FAI to develop a 244-hectare CBD in southern Metro Manila when the area
was largely undeveloped. Since the Group’s entry, land prices in Filinvest City have risen significantly. The Group expects Filinvest
City’s strategic location to be further enhanced as travel times from the south of Metro Manila to Quezon City and Northern Luzon are
set to be greatly reduced with the development and completion of the road link project connecting the South Luzon Expressway and
North Luzon Expressway corridors, as well as the planned Clark to Calamba, Laguna rail development.
In 2016, the Group was one of the first developers to identify Clark, Pampanga as a significant growth area, and was the sole bidder for
the Mimosa Leisure Estate (now known as Filinvest Mimosa+ Leisure City) and the New Clark City developments. In the last 3 years,
a range of announced new projects, such as the expansion of CIA, the declaration of Clark, Pampanga as a new Government center, and
the signing of the initial agreements with the Japanese government for the development of a high speed train linking Manila to Clark,
have resulted in significant property price increases in the area according to Colliers, as well as significant growth in passengers arriving
in Clark International Airport (from passenger arrivals of 951,007 in 2016 to 4.0 million in 2019).
Complementing its core real estate expertise, the Group’s hospitality business, which currently has locations in Cebu City, Muntinlupa
City, Clark Freeport Zone, Pampanga and Boracay, is also well positioned to benefit from the growing Philippine tourism industry,
which has seen a growth in foreign visitor arrival from 2015 to 2019 at a CAGR of 11.3%.
In banking and financial services, EW entered the consumer financing business in 2004 and has built a top quartile retail banking
business with one of the highest percentage of retail loans to total loan portfolio in the industry based on EW’s estimates. EW focuses
on the high margin consumer lending segments with historically higher returns, and has grown its business through aggressive store
expansion, as well as strategic acquisitions and business partnerships in auto loans and credit cards, personal loans and bancassurance.
Based on the expected increase in consumer spending of 7.8% over the next 3 years, according to the Economist Intelligence Unit, the
Group expects its retail banking business to continue to grow to meet increased consumer demand.
The Group entered the Mindanao power market in 2009 with the development of the FDC Misamis thermal plant when the region was
experiencing a significant shortage in power supply and as a result was able to enter into power supply agreements with 17 of the
region’s distribution utilities, 14 of which are AAA rated by the NEA. The strategic location of the Group’s clean coal power plant in
Mindanao, and its other planned projects in its power business in the country positions the Group to benefit from the expected growth
in demand for electricity especially in the southern regions of the country. In addition, the Group’s sugar business benefits from the
industrialization of Luzon, which has increased Mindanao’s importance in agribusiness.
Most recently, the Group has begun development of its infrastructure business. LIPAD Corp. comprising FDC, as lead consortium
member, JG Summit Holdings Inc., Philippine Airport Ground Support Solutions Inc. and Changi Airport Philippines (I) Pte. Ltd.
(wholly owned by Changi Airports International), was awarded an operation and maintenance contract for the CIA as well as a contract
for the construction of an additional terminal.
Solid Foundation for Future Growth in Place
The Group believes it has laid the proper foundation for the future growth and monetization of its existing and newer businesses across
the Philippines. Its long history of operating successful businesses and making strategic and timely investments has resulted in the
necessary scale, experience and capability to efficiently capitalize on business opportunities in sectors of the economy and areas of the
country that it expects to drive the Group’s continued growth.
With respect to its real estate and hospitality operations, the Group’s rollout of development projects have an aggregate potential GFA
of approximately 7.6 million sq.m. of residential, office, retail, logistics, industrial and hotel buildings. The Group’s strategic
investments have resulted in the availability of a sufficient land bank spanning key regions in the Philippines to support the future
expansion of the Group’s office and retail GLA and construction of 10 additional hotels in the next 5 years, positioning the Group to
monetize its growth initiatives. As of December 31, 2020, the Group had an aggregate land bank of 1,851.1 hectares of raw land,
primarily for residential development, which includes 201.0 hectares of raw land held through joint venture arrangements, and
512.1 hectares of commercial land bank. In October 2019, FAI signed a joint venture agreement with Japanese company Mitsubishi
Corporation for the development of a ₱15.0 billion multi-tower mixed-use complex within Filinvest City. Mitsubishi will have a 40.0%
stake in the development of a 1.7-hectare prime lot that is seen to bolster mixed-use GLA by approximately 183,000 square meters.

61
In banking, EW is actively implementing its medium-term strategy of optimizing the operations and profitability of its expanded store
network. With a view to growing its asset base, attracting low-cost deposits and increasing its deposit per store from approximately
₱700.0 million to reach the industry standard of ₱1.1 billion for banks of comparable size, EW continues to focus on deepening and
broadening relationships with, and increasing its revenues generated from, existing customers. The Group believes that the expansion
of EW’s products lines, including its recent expansion into bancassurance and wealth management, will be integral to its overall customer
offering.
In the power business, FDCUI’s 405 MW (3 x 135 MW) clean coal power plant, which has entered into power supply agreements for a
total of 302 MW, also has sufficient expansion capacity for another 2 x 135 MW to help address the expected growing demand for
power in Mindanao. The power plant is located in PHIVIDEC Industrial Estate, the first industrial estate in the Philippines established
in 1974 spanning 6,000 hectares, that currently houses major locators. The Group believes that the expected industrial developments in
the PHIVIDEC Industrial Estate and surrounding urban centers will increase demand for power in the area. According to the Department
of Energy, projected peak demand is expected to increase by 8.0% each year in 2019 and 2020, and 7.5% each year from 2021 to 2023.
FDCUI has also expanded into the retail electricity supply business, allowing it to trade electricity and cater to contestable customers
across the Philippines under the expected RCOA regime.
To complement its power generation and trading operations, the Group has also entered into strategic partnerships with Engie to develop
potential renewable energy solutions in the Philippines that provide energy cost savings to large industrial and commercial customers.
The Group believes that the partnership’s initial projects with respect to renewable energy and district cooling will position it to take
advantage of the global move towards greater sustainability. The Group also signed a joint venture agreement with Japanese company
HAQT to establish FLOW to tap into the latest developments in desalination technology in order to to tap the opportunity to offer
desalinated water in areas with scarcity of water and/or poor quality of water.
Track Record of Successfully Leveraging Profitability and Positioning
The Group has been able to successfully establish and grow a diverse and profitable business portfolio over its history with revenues
reaching ₱60.7 billion in 2020, representing approximately 5.19% CAGR from 2016 to 2020; assets reaching ₱648.0 billion as of
December 31, 2020, representing CAGR of approximately 6.8% from 2016 to December 31, 2020; and net income reaching
₱11.5 billion in 2020, representing CAGR of approximately 7.9% from 2016 to 2020. Over the years, the Group has demonstrated a
consistent ability to leverage its success in existing businesses to expand into new industries while maintaining its overall focus of
catering to the middle-income market of the Philippines.
The Group’s real estate business has grown over the last four decades to become one of the leading integrated real estate developers and
operators in the Philippines, with real estate and hospitality net income at ₱5.3 billion in 2020. The Group complemented its initial real
estate investments and developments by building a considerable recurring income base of office and commercial leasing, primarily to
the BPO industry. The Group was also one of the first developers to focus on large-scale, master-planned townships to capitalize on its
wide range of real estate offerings and enhance synergies across its growing number of businesses. To further take advantage of its
expertise in property development and diversify its recurring income stream, the Group opened its first hospitality project in Mactan
City in 2010, and, as of December 31, 2020, operated approximately 1,800 keys in Cebu, Muntinlupa City, Tagaytay City, Clark Freeport
Zone, Pampanga and Boracay.
The Group believes EW’s focus on retail and consumer lending has allowed it to quickly scale its operations in line with the strong
Philippine economic growth of the past decade. EW has established a nationwide presence of 468 stores as of December 31, 2020,
compared with 168 stores as of December 31, 2011. The Group believes that EW’s return on equity, which was 12.3% in 2020, is one
of the highest among universal and commercial banks in the Philippines while EW’s net income (gross of eliminations for intra-group
transactions) of ₱6.5 billion in 2020 represented a CAGR of 24.1% from 2016 to 2020.
In recent years, the Group believes it has successfully reinvested the returns from its core businesses; the Group re-entered the power
business through FDCUI, which recorded net income of ₱1.9 billion in 2020 after only commencing operations in late 2016. The
Group’s sugar business has also delivered steady returns.
Diversified Earnings Stream Protecting Against Volatility
With business interests in the banking and financial services, real estate, power, and sugar industries, the Group has diverse earning
streams both across and within its businesses, which helps protect the Group’s returns amidst changing industry conditions from time
to time. In 2020, the Group’s real estate, hospitality, banking and financial services, power operations, and sugar operations accounted
for 29.8%, 1.7%, 51.6%, 11.8%, and 5.1% of the Group’s consolidated revenues and other income.
With respect to its real estate businesses, the Real Estate Subsidiaries have continually broadened their earnings base in terms of product,
geographic and market segmentations, primarily through an aggressive office, retail and hotel development program. From an aggregate
380,000 sq.m. as of December 31, 2014, the Group’s office and retail leasing portfolio has more than doubled to 854,606 sq.m. as of
December 31, 2020. With its development pipeline expanding to Clark, Cebu and other areas, the Group has begun to establish a more
Philippines-wide national revenue stream, which it expects to insulate its real estate business from concentration in the Metro Manila
area. The Group has also particularly focused on its hospitality business in recent years; this segment has grown from 290 keys managed
62
in 2010 to approximately 1,800 as of December 31, 2020, capitalizing on strong demand from the meetings, incentives, conventions and
exhibitions (MICE) sector, as well as higher demand for quality resorts in line with the development of the country as a regional tourist
destination..
The Group’s banking and financial services, as part of its medium term strategy, has also begun to add to its complement of products
and services geared towards its target market of retail customers and middle-market corporate customers. EW’s recent bancassurance
joint venture with Ageas has complemented its existing products with insurance products backed by Belgium’s leading insurance
companies according to Assuralia.
Apart from its core businesses, FDC has also continued to diversify its revenue and asset base. The Sugar Subsidiaries continue to
provide the Group with a steady revenue stream with a base in Mindanao, which has proven resilient despite market fluctuations, and
has also been adaptable to the changing nature of the industry. The Group’s power business, which commenced commercial operations
towards the end of 2016, has also immediately contributed to the Group’s financial results as demand in Mindanao remains strong. The
Group has further diversified its exposure to power through new ventures in renewable energy and environment-friendly urban solutions
such as solar power, district cooling system, and water and wastewater services. In the infrastructure space, the Group also expects that
it will begin to generate revenues from its operation and maintenance contract for the CIA upon turnover of the airport. Finally, following
the award of a provisional gaming license by the Philippine Amusement and Gaming Corporation in April 2018, the Group is planning
to extend the scope of its hospitality business to include an integrated resort within the Filinvest Mimosa+ Leisure City development
comprising, among other things, a casino to be operated by a third party, a lifestyle mall, 5-star hotel and an events venue.
Disciplined and Strategic Financial Management
The Group adopts a centralized approach to capital allocation decisions across its businesses, which allows the Group to efficiently
allocate its resources to high growth opportunities and regions. The Group believes its financial strength and conservative leverage
enhances its ability to expand and further diversify its business through ready access to capital and financing at competitive rates,
allowing it the flexibility to quickly capitalize on business opportunities as they present themselves.
The Group believes each of its business segments has a strong financial position and a stable earnings base. FDC’s position of majority
ownership in the Group’s businesses, along with its leadership team committed to prudent financial management and growth, assures
that cashflow from these businesses are efficiently managed and allocated efficiently according to the Group’s requirements and strategic
objectives. The Group’s stable earnings are complemented by its relatively low leverage in its non-financial services businesses, which
provides significant capacity to take advantage of growth opportunities whether by expansion, acquisitions or other business
combinations and partnerships. FDC has taken advantage of these strong financial fundamentals by being one of the first Philippine
conglomerates to regularly tap both domestic and international debt capital markets through bond issuances. In turn, its financial
discipline and credibility has been confirmed by both investors and financial institutions such as external ratings agencies, which have
consistently assigned bond issuances of FDC and its subsidiaries PRS Aaa, the highest possible rating for a bond. The Group believes
these top-tier ratings are warranted due to the following key considerations: FDC’s steady earnings and diversified business portfolio;
maintenance and good credit standing even in times of financial crises; strong financial flexibility; established brand names and good
market position of its key subsidiaries; its subsidiaries operating in growth industries; the conservative and professional stance of
management; and FDC’s new investments (e.g., power and infrastructure) which the Group expects to significantly contribute to
profitability in the medium-term.
Philippine Rating Services Corporation (Philratings) has maintained a credit rating of PRS Aa Plus (corp.) to EW. A company rated
PRS Aa Plus (corp.) differs from the highest rated corporates only to a small degree, and has strong capacity to meet its financial
commitments relative to that of other Philippine Corporates.
Philratings has maintained the PRS Aaa for FLI’s outstanding bonds (i) ₱4.3 billion bonds due in 2020, (ii) ₱2.7 billion bonds due in
2023, (iii) ₱5.3 billion bonds due in 2021, and (iv) ₱1.7 billion bonds due in 2024, (v) ₱7.0 billion bonds due in 2022,(vi) ₱1.0 billion
bonds due in 2025, (vii) ₱6.3 billion due in 2023 and (viii) ₱1.8 billion due in 2026. PRS Aaa rating is also maintained for the ₱6.0
billion bond of CPI maturing in 2023 Obligations rated PRS Aaa are of the highest quality with minimal credit risk. FLI’s capacity to
meet its financial commitment for its obligations is strong. PRS Aaa is the highest rating assigned by Philratings. The rating takes into
account the following key considerations: (a) FLI’s established brand name and track record, with geographically diverse real estate
products and substantial land bank for future expansion; (b) its sound growth strategies, focused on building a balanced mix of real
estate sales and recurring income; (c) its strong income generation and positive cash flows; and (d) the continued favorable outlook for
the property industry despite a slowdown in economic growth.
Philratings has maintained its Issue Credit Rating of PRS Aaa, with a Stable Outlook, for FDC’s outstanding bond issue of ₱8.8 billion.
PRS Aaa is the the highest credit rating on PhilRatings’ long-term issue credit rating scale. PhilRatings identified the following key
strengths: a) FDC’s stable revenue stream from its diversified business portfolio; b) the company’s main contributing subsidiaries, in
terms of income and cash flows, have a proven track record and have established brand names; c) FDC’s conservative and professional
management; and d) growing and well-positioned businesses, particularly in real estate and banking.

63
Trusted Business Partner with History of Successful Collaborations
The Group has built a strong reputation as a trusted partner with a track record of collaborating on successful projects. In the 1990s, the
Group’s real estate business partnered with the Government on Filinvest City, a 244-hectare CBD which has provided a viable alternative
for businesses and establishments outside the greater Metro Manila area. The Group has also partnered with the Cebu City Government
for the joint venture development of a portion of the SRP, a reclaimed land project located in Cebu City. The Group holds 50.4 hectares
in the SRP, of which 40 hectares is subject to the joint venture development. In addition, the Group has also partnered with CDC and
BCDA for the development of Filinvest Mimosa+ Leisure City and New Clark City, respectively. These collaborations clearly show the
confidence of national and LGUs in the Group’s ability to add value and expertise to the significant projects.
As the Group has diversified into other product lines and businesses, it has tapped experienced international partners and strategically
outsourced to more established industry players to supplement its in-Group management team. For example, the Group has entered into
arrangements with Engie for its district cooling and solar paneling business; with Ageas for EW’s bancassurance business; PIC, a third-
party operator affiliated with Marubeni Corporation (one of the leading global trading companies), for the operation and maintenance
of the Group’s power plant; HAQT for processed water solutions across the Philippines; Mitsubishi Corporation for the development of
a multi-tower mixed-use complex within Filinvest City; and Changi Airports Philippines (I) Pte. Ltd. (wholly owned by Changi Airports
International) for the operation and maintenance of the Group’s Clark Development airport project. The Group’s Chroma has also built
a hotel management team with a significant percentage of expatriates holding GM, Executive Chef and key positions in Chroma to
ensure the Group’s hospitality properties adhere to international standards.
The Group believes that these collaborations have enhanced its reputation in the market as a viable partner for Government and
international stakeholders for their large-scale and important projects in the Philippines. On the other hand, the Group believes it has
greatly benefitted by garnering technical knowhow, best practices and operational experience from the partners it has worked with,
which it can apply to its operations and new businesses moving forward.
Experienced Management Team
The Group’s management team has extensive experience in, and in-depth knowledge of, the Philippine real estate market, the financial
and banking services industry and the sugar business. Members of the Group’s management team have an average of more than 30
years’ experience in their respective businesses, such experience spanning market downturns and volatility, financial crises and political
and global economic changes. Several members of the management team have post-graduate degrees from well-known business schools
in the United States. The Group believes its growth and strong financial performance are indicative of the capabilities of its management
team. The Group believes that the market experience and knowledge that its key members of management possess across each of the
Group’s businesses and the business relationships they have developed in the various industries in which they are involved have been,
and will continue to be an integral part of the Group’s growth strategy.
Competitive Strengths of the Group’s Operating Segments
The Group believes that the principal strengths of its operating segments are the following:
Real Estate Operations and Hospitality Operations
The Group has been active in the real estate business for over 40 years and the hospitality business for over 10 years. FLI focuses on
residential, office, industrial and retail developments, while FDC handles the leisure and hospitality, or hotel development segment.
FAI was formed primarily to develop Filinvest City, an alternative CBD in Muntinlupa City with a significant land bank available for
development, and where the Group focuses on office and commercial leasing, particularly to BPOs, as well as high-end vertical
residential developments.
Real Estate Operations
The Group believes its real estate business possesses the following principal strengths:
• Recognized brand in affordable and middle income housing.
• Extensive nationwide and international sales channels.
• A pioneer and major player in office development and leasing.
• Proven record in township and land bank value creation.
• Strong credit record and bond issuance track record.
Hospitality Operations
The Group believes its hospitality business possesses the following principal strengths:
• Full range hospitality products targeting various market segments.
• Ability to quickly build brands with strong recognition such as Crimson and Quest.
• Synergies as part of the Filinvest Group.
64
Banking and Financial Services
Since its formation in 1994, EW has experienced strong growth. The Group believes EW is well-positioned in the Philippine market
due to the following principal strengths:
• Strong focus on and growing market position in high growth consumer segments.
• Strategically located store network.
• Differentiated services tailored to mid-market corporates and retail customers.
• Prudent balance sheet management to manage a predominantly consumer loan portfolio.
Power Operations
FDC, through its wholly owned subsidiary FDCUI, re-entered the power industry in 2009 to further diversify its business. The Group
believes FDCUI’s principal strengths include:
• Largest baseload facility in Mindanao with significant capacity for expansion.
• Well-positioned to capitalize on attractive power industry growth opportunities in Mindanao, a region with high expected demand
in the medium term.
• Risk mitigated business model with predictable cash flows supported by long-term power supply agreements with distribution
utilities with high credit ratings.
• Clean coal circulating fluidized bed technology providing more environmentally sustainable energy.
• Established relationships with world-class energy players for plant construction, turbine supply, operations and maintenance, as
well as renewable energy projects.
• Diversification into other high growth sectors.
Sugar Operations
The Group’s sugar business, conducted through PSHC, believes it possesses the following principal strengths:
• Adaptable business model with vertical integration based primarily in attractive Mindanao market.
• In-house corporate farm to enhance productivity and efficiency through innovation.
• Strategic location with natural barriers to entry.
• Long-standing relationships with growers and traders.
Business Strategy of the Group
The Group’s strategy is to actively grow its business portfolio in a disciplined and systematic way and to benefit from the recent positive
economic growth and favorable social trends in the Philippines in each of its segments. Having built a strong business foundation for
growth in each of its subsidiaries, the Group plans to unlock and maximize its subsidiaries’ values through accelerated development and
greater market reach (in terms of product offerings and geographical coverage), and intends to supplement organic growth through
mergers and/or acquisitions to the extent such opportunities arise.
The Group’s specific strategies to implement these objectives are as follows:
Leverage on its Foundation for Growth to Scale-up Businesses
The Group believes that it has been successful in expanding its businesses in the last few years as a foundation for future growth, and
now aims to capitalize on such efforts in the near- to medium-term by scaling up and optimizing operations across its businesses, and
further improving cost efficiencies. Across all its businesses, the Group intends to capitalize on its nationwide presence and knowledge
of local conditions and relationships in order to maintain its growth by tapping into more markets and keeping pace with the growing
importance of the provincial areas. It will aim to optimize its current business knowhow as well as spread its base infrastructure by
introducing its products to new regions and a provincial customer base. The Group will seek to achieve these while at the same time
keeping to its broader general strategies of focusing on the continued consumption growth of the affordable and middle market sectors.
Specifically with respect to its main businesses, the Group intends to:
• Real estate and hospitality – focus on specific markets with sufficient demand and depth, such as Cebu and Clark, while diversifying
its revenue sources and broadening its product offerings to prepare it for and insulate it from changing consumer demand. The
Group’s property trading business focuses on the largest segment of the Philippine population, according to Colliers, as well as
provides products within the pricing range of the key OFW market;
• Banking and financial services – continually implement its optimization strategy across its nationwide store network, aiming to
maximize the profitability of its existing stores after having aggressively grown such network in the last 3 years. EW is also targeting
to achieve a more balanced portfolio of high-cost and low-cost deposits, which would insulate it from changing consumption
patterns and the volatility of the financial markets;

65
• Power – scale up operations and secure sufficient demand for the additional 2 x 135 MW expansion capacity of its Misamis plant.
It also intends to build its RES business within the RCOA regime; and
• Sugar – continue achieving cost reductions in its production process, which has smoothed its earnings over the past few years
despite changing market dynamics.
Accelerate Monetization of Land Bank
The Group believes it has utilized its long experience in the real estate market to build up a considerable and strategically located land
bank which features ideal geographic access, key elements, base infrastructure, all with the reputational standing of the “Filinvest”
name. One of the Group’s key objectives is to accelerate the monetization of this land bank through a combined strategy of:
• continued strong sales of land and vertical development products, increased vertical recurring income development and
monetization of assets through potential REIT opportunities; and
• minimizing land carrying cost through more interim land leases.
The Group believes that the maturity of its large-scale, master-planned townships will allow it to accelerate monetization of specific
portions of its land bank, given the property price increases in these areas brought about by the Group’s improvements and township
projects, as well as the continued economic growth of the Philippines in general.
Continue Building Up Its Investment Portfolio and Potentially Participate in the Investment Trust Markets
The Group intends to continue building up its investment portfolio in office, retail and hospitality. The Group believes that these
segments of its businesses focus on the BPO and tourism industries, which are among the key drivers of the Philippine economy. The
Group aims to take advantage of its strategically located land bank located in key regional centers across the Philippines, which will
allow it to accelerate the growth of its recurring income portfolio in line with market demand. Related to this, the Group will closely
monitor the development of the REIT market and regulations in the Philippines, as it believes its portfolio of recurring income properties
is well-suited for a REIT vehicle. The Group intends to participate in the REIT markets as the Group believes that a Government-
supported REIT market with incentives in line with other regional REIT markets would improve the Group’s financial returns from its
investment portfolio and provide it with another avenue of unlocking value from its assets for stakeholders. The Group will also aim to
develop complementary businesses arising from the REIT market, such as potential asset or property management opportunities.
Tapping Opportunities with Closer Relations and Access to China Markets
The Group believes that the current Government’s policy of increased trade and cooperation between the Philippines and China opens
up greater opportunities for most of its business sectors. It intends to seek new business or ensure its current businesses can benefit from
the expected economic growth related to stronger ties with China. For example, with respect to its core real estate business, the Group
intends to rollout projects and offerings that will cater to the expected office and residential demand from the China outsourcing segment
as it further increases its footprint in the Philippines. Consistent with the Group’s focus on tourism, the strong growth of Philippine-
bound travel from China according to Colliers is expected to present opportunities for the Group’s hospitality and airport infrastructure
businesses. Moreover, the expected increase in China-Philippines economic cooperation in areas such as infrastructure and public
works, energy, industrial park development, processing and manufacturing, among others, may impact the Group’s power operations
(which supplies primarily to locators within the PHIVIDEC Industrial Estate), as well as its industrial and logistic parks in New Clark
City.
Continue to Explore and Maximize Synergies within the Group
The Group believes that maximizing synergies across its businesses is an immediately effective means of optimizing profitability. The
Group plans to more actively explore and pursue synergies across its business lines. As a particular example, Chroma and FHC will aim
to maximize the economies of scale of the Real Estate Subsidiaries by developing and establishing hospitality projects in the Group’s
mixed-use developments. In addition, the hotel management services that Chroma provides for FLI’s condotel offerings foster customer
confidence that such developments are professionally managed in line with regional standards and best practices.
The Group has also begun to venture into new business segments through ancillary enterprises. Such focused enterprises develop
expertise in their respective areas and allow the main businesses to focus on their core competencies. Examples of these can be found
in the Group’s infrastructure business, which has established district cooling and air handling O&M businesses in partnership with
Engie; the Group’s banking and financial services business, where EW has entered into the bancassurance business in partnership with
Ageas; the Group’s power business, where FDCUI has been able to provide cheaper power to the Group through its RES subsidiary ;
and also in the Group’s real estate and hospitality business, where CWSI has been providing water and waste water services.

66
In a broader sense, the Group will seek to maximize the benefits derived from the bulk bidding practice and volume discounts only
available to conglomerates of its scale in areas such as communications, software and other services. The Group is also exploring
potential cross-selling and loyalty initiatives across its business segments.
Accelerate Digital Transformation, Sustainability and Other Modernization Initiatives across its Businesses.
The Group has always strived to keep abreast of advancements in technology with respect to its businesses. It aims to continue initiatives
by EW to modernize operations primarily by updating its mobile service platforms to keep pace with the entry of FinTech competitors
and other banks in the country. In line with its sustainability programs, the Group intends to continue implementing its initiatives,
including smart and LEED® (Leadership in Energy and Environmental Design)-registered initiatives, in district cooling, water recycling,
and solar panel roofing, among others, with respect to its real estate and infrastructure developments and projects. For the hospitality
business, the Group intends to continue building on its successful online presence, and apply the same to its other businesses as relevant.
The Group will aim to complement this and its other external and client-facing technological improvements by continuing to implement
modernization initiatives with respect to its back-end and internal systems.
Continue to Selectively Pursue Acquisition and Partnership Opportunities, Particularly in Complementary and Sustainable
Businesses.
Building from its successful entry into additional business lines such as power and hospitality and leveraging its reputation as a trusted
partner for local and international companies looking to establish initial or greater presences in businesses with growth potential in the
Philippines, the Group will continue to selectively explore opportunities to acquire businesses or enter into partnerships or joint ventures,
particularly with complementary and sustainable businesses. The Group has already made inroads into the infrastructure industry with
its participation in 2 separate consortiums for large-scale development of key infrastructure projects aimed at increasing economic
growth, tourism and consumer demand in the country. In hospitality, the Group will seek to enter into specific third party management
agreements with potential partners in order to build up its portfolio without having to build new keys and to strengthen its brands in key
markets. Further, the Group is targeting to enter into partnerships with other hotel developers to acquire best practices knowhow in
unfamiliar jurisdictions and gain access to land that is uniquely situated. In power, the Group will build up its relationship with Engie
and continue to seek out strategic partnerships, especially in the sustainable and renewable energy spaces, to accelerate its development
as a key market player. In particular, the Group is exploring potential business partnerships with respect to desalination technology,
which, if successful, can be utilized across several of the Group’s business lines.
Business Strategy of the Group’s Operating Segments
The specific strategies of each of the Group’s operating segments to achieve the Group’s objectives are outlined below.
Real Estate Operations Strategy
The Real Estate Companies intend to further accelerate growth and improve their return on equity by aggressively developing their land
bank while retaining their current focus on the high-growth affordable and middle market segments where the Real Estate Companies
believe they have a competitive advantage based on their current strong position. The Real Estate Companies have the following
strategies:
• Continue product, market and geographic diversification to strengthen leadership position in the affordable and middle market
segments. In real estate trading, the Real Estate Companies plan to capitalize on their strong position in the affordable and middle
market segments to increase their market share. Driven by strong underlying demographic fundamentals with buyers representing
the largest subset of house buyers in the Philippines, and highly fragmented supply, the Real Estate Companies believe that these
segments provide favorable demand-supply dynamics and attractive margins. The Real Estate Companies plan to maintain their
strong position in the affordable and middle market segments by expanding their product offerings and land bank into selective
regional markets. In particular, the Real Estate Companies plan to offer more inner city mixed-used developments and MRB
products to capture the growing demand for these types of products in greater Metro Manila, Cebu, and Davao.
• Continue to build up recurring income streams and capitalize on Real Estate Investment Trusts (REITs) opportunities. In addition
to retaining their position as one of the leading residential house and lot developers in the Philippines, the Real Estate Companies
intend to continue to increase recurring rental income through the expansion of their commercial office and retail space leasing
operations. The Group intends to achieve this by, among other things, increasing occupancy at their newer malls and other
commercial projects, rolling out new leasing projects, enhancing their existing investment portfolio through proactive leasing and
management, and capitalizing on their extensive real estate experience, scale and access to resources. The Group also believes that
the development of REITs in the Philippines, subject to finalization of relevant regulations and incentives, will provide the Group
with new opportunities to unlock and accelerate the growth of its recurring income portfolio.
• Accelerate monetization of land bank. The Real Estate Companies believe that there is currently significant unrealized value in their
land bank based on the historical low cost carrying value of such land bank on their balance sheet. In particular, the Group believes
that the available land bank in their townships, such as Filinvest City (88 hectares) and Clark (278 hectares), has reached sufficient

67
maturity in its product cycle. The Group believes that it is now the opportune time to take advantage of the appreciation in value
of such land bank and accelerate monetization through land sales, or establish vertical trading developments or developments to
generate recurring income. In addition, given the current projects in their pipeline, the Real Estate Companies believe they can
benefit from the country’s strong economic fundamentals to accelerate the pace of new project launches. For their higher value raw
land portfolio, the Real Estate Companies plan to develop higher density and higher value-added projects, such as residential
buildings, office buildings and retail malls, with a view to optimizing the revenue per sq.m. generated from such land bank.
• Targeted vertical operations integration and digitization to improve cost efficiency. The Group plans to continue initiatives to
further integrate their operations. As an example, the Group has established a separate construction company to undertake
construction of specific projects and products, such as MRBs, to improve its cost competitiveness. Moreover, the Group has
embarked on targeted digitization processes, such as the use of building information modeling for design, as well as the acquisition
and implementation of other software for bidding and project management, all in an effort to improve both cost and process
efficiencies.
Hospitality Strategy
The Group intends to grow its hospitality business to take advantage of the Philippines’ strong economic fundamentals and travel and
tourism trends by efficiently developing and operating new hospitality products in underserved markets.
• Diversify product offerings and geographical reach. The Group intends to diversify its product offering in the hospitality sector, by
continuing to develop 3 main hospitality brands catering to distinct market segments through FHC. The Group’s Crimson brand
caters to the high end market segment while the Quest and Quest Plus brands target middle market families and business lodging
with emphasis on the MICE segment. The Group’s next brand to be launched is the Grafik brand which will cater to millennial and
other younger guests. The Group also intends to take advantage of the Philippines’ strong travel and tourism trends by building
more hotels, primarily under the Quest brand, in underserved markets in Luzon, Visayas and Mindanao, which each have an
increasing lodging demand. FHC also looks to invest in destinations with potential for upscale properties that cater to both foreign
and domestic markets.
• Enhance synergies with the Group. For its future hospitality projects, the Group will seek to maximize intra-Group synergies. FHC
also plans to invest in land and develop hospitality projects in areas where the Group’s larger mixed-use developments are located.
Alongside FHC, FDC plans to develop hotel projects through its various other subsidiaries.
• Cultivate Crimson, Grafik and Quest brand equity by optimizing hotel developments and renovations, operations and services. The
Group intends to continually optimize key facets of its hospitality business, including hotel development, asset enhancements and
operations and services to improve value to shareholders and customers and ultimately cultivate its Crimson, Grafik and Quest
brand equity. With respect to revenues, the Group will seek to continue maximizing its total revenues per available room, which
has enjoyed double digit growth over the past 2 years, by efficiently cross-selling non-room offerings, such as meetings and
convention facilities, banquet and food and beverage. The Group will also continue to invest in resources including training
programs and IT-related systems to drive guest satisfaction and enhance customer loyalty and repeat business. The Group will also
seek to implement a training infrastructure that it believes will not only encourage a culture of learning and growth but also produce
home-grown talent that will reduce the ramp up period for new hotels.
• Maximize marketing reach and distribution channels. Another key focus of the Group is to maximize its current and develop new
distribution channels for its properties and products. The Group will seek to further develop its non-traditional distribution channels,
with a particular focus on optimizing its marketing through technology. The Group is continuously working on optimizing its online
advertising placements, its search engine optimization, its mobile-friendly website and chatbot support. The Group is also
continously exploring new distribution channels as they emerge. The Group believes that online channels, in addition to helping
reduce marketing costs, are a significant avenue through which to reach and retain its hospitality customers, improve the customer
booking experience, and improve the Group’s ability to compete with local and international competitors. In 2018, approximately
30% of the Group’s hospitality customers were repeat clients, and the Group believes its online sales channels are a key driver of
this repeat business. To complement its online presence, the Company will also ensure that its traditional channels such as sales
agents effectively market the Group’s new and upcoming offerings, especially in key international markets such as China, Japan
and Korea.
• Explore third party management opportunities and joint ventures with third party hotel developers. The Group may also selectively
offer and undertake third party management arrangements and joint ventures with third party hotel developers for projects that meet
the brand’s criteria. The Group believes that selectively exploring these opportunities with local or foreign companies which have
compelling experience or technical knowhow will allow more rapid expansion of its hospitality business especially in unfamiliar
jurisdictions and gain access to land that are uniquely situated.

68
Banking and Financial Services Strategy
The Group intends to continue to grow EW as a significant competitor in the Philippine financial services industry. To achieve this
growth, the Bank has strategically opted to target its financial products and services to the consumer, middle-market corporate and mass
affluent market segments. The Bank believes these market segments offer significant growth opportunities while also enabling the Bank
to manage its risk exposure by maintaining a balanced portfolio mix. Given the competitive landscape of, and the Bank’s position within,
the Philippine banking industry, the Bank has identified the consumer segment as a key target market. EW envisions itself to be a leading
bank, anchored on and differentiated from its competitors through a strong focus on retail banking resulting in a healthy return on equity.
EW believes it has proven its success within the consumer market by achieving significant competitive traction in a relatively short
period of time. Over the next few years, EW’s priorities are to continue its efforts to improve the operating leverage, cost efficiencies
and overall competitiveness of the Bank. EW’s business strategies are set out below.
• Enhance the professional development of EW employees. EW believes that the success of its business strategies is dependent on
the ablity of its employees to execute those strategies. To this end, the Bank is focusing on developing its employees to ensure they
are equipped with the relevant competencies and skills required to perform their functions and deliver excellent customer service.
By instilling in its employees a sense of common purpose and direction, the Bank aims to develop a workforce whose values are
aligned with the corporate values of the Bank. To achieve this, the Bank will continue to provide its employees with relevant training
and development through the EastWest Bank Learning and Development Program. The Bank aims to enhance its Learning and
Development Program and institutionalize the EW Academy in order to speed up the development of EW employees. EW also
plans to further refine its performance management processes to ensure that it is able to identify, reward, and retain high-performing
employees. EW believes that its commitment to facilitate the career development, expertise and service quality of employees, as
well as its ability to develop and retain them, will enable EW to attract and retain skilled personnel and effectively support its
broader optimization and sales goals.
• Optimize existing store network. EW is focused on taking advantage of its store network by optimizing the revenues and income
generated from its customers. EW has built a nationwide network comprising 467 stores on a consolidated basis, including 392 EW
stores and 76 EWRB stores as of December 31, 2020. As more than 70% of EW’s consolidated stores were built during the Bank’s
expansion program between 2012 and 2016, such stores have yet to attain competitive productivity. EW will continue to focus on
improving store productivity, in particular, in relation to increasing customer deposits and acquiring and retaining customers,
primarily through its marketing programs and approach to customer service. The Bank plans to apply its marketing efforts to fine-
tune its market segmentation, expand its digital sales channel and improve the competitiveness of its product offerings. Relatedly,
the Bank will look to expand the range of products for its target market of mid-market corporates and consumer segments, deepening
and broadening relationships with existing customers, including generating more synergies with other businesses within the Group,
and marketing more products and services to new and existing customers, all in an effort to increase EW’s “share of wallet” from
such customers.
• Achieve balanced portfolio mix while maintaining a consumer and corporate mid-market focus. EW aims to manage its exposure
to economic risk by achieving a balanced portfolio mix of loans with relatively higher economic risk (such as consumer loans,
excluding salary loans to teachers) and loans with specific risk relative to the broader economy (such as commercial and corporate
loans). EW intends to achieve greater balance within its loan portfolio by increasing the pace of growth of middle-market corporate
loans as the country’s economy grows, while continuing to maintain the growth in its consumer loan segment. EW plans to
implement initiatives towards increasing transactions with existing customers, for example, by cross-selling products and offering
additional services tailored towards consumer and middle-market corporates as it expands its distribution networks. EW believes
that achieving a more balanced loan portfolio will enable it to improve its risk management, thus ensuring it is in a stronger position
to withstand the fluctuations of the business cycle.
• Enhance customer experience. EW is focused on differentiating itself from its competitors by providing an enhanced customer
experience. EW’s customer service efforts involve improving the customer experience through better responsiveness and
competence of the Bank’s customer-facing departments. EW also seeks to improve the accessibility and convenience of banking
services for its customers by developing its digital service channels and enhancing its operational and IT processes. EW believes
that improving the interface between the Bank and its customers, as well as the efficiency of its services will help to supplement
efforts to optimize earnings from all facets of its banking channels.
• Enhance digital efforts. EW plans to focus on improving and expanding its digital service channels in order to streamline work
processes, improve cost efficiency and improve the customer experience. EW believes it has built up a competitive IT infrastructure
as a result of placing significant emphasis on its digital projects. To continue improving and expanding its digital service channels,
EW is undertaking initiatives in four key areas: open banking, data analytics, customer interface and continuous development. The
Bank also continues to invest in its mobile and online channels. EW believes that by improving the interface between the Bank and
its customers and enhancing the efficiency of its services, EW will create a better experience for its customers and optimize its
operational costs.
• Strengthen risk management and governance framework. EW will continue to enhance its various risk monitoring and management
tools to improve its risk management capabilities and the quality of its loan portfolio by continuing to (i) improve its credit policies

69
and credit approval procedures, (ii) implement risk management control tools, including, among others, a centralized credit
management information system that allows it to standardize credit risk detection, quantification and management and (iii)
strengthen internal controls and legal compliance by standardizing internal policies and procedures in accordance with legal and
regulatory requirements with a view to establishing a comprehensive internal control system.
Power Operations Strategy
The Group intends to continuously develop its power generation capabilities, take advantage of the expected growth in demand, as well
as pursue other opportunities selectively.
• Capitalize on favorable regional and industry dynamics. The Group is seeking to capitalize on its strategic location in Mindanao,
which despite a current surplus of power supply, still provides opportunities due to such factors such as climate change and
Mindanao’s ageing hydroelectric power plants for the Group to maximize its existing power generating capacity. The Group also
believes that its location in the PHIVIDEC Industrial Estate allows it to benefit from the increasing number of industrial projects
being established there, providing it with a competitive pricing advantage vis-à-vis other power generators in the region by means
of its close proximity.
On the industry side, the expected start of commercial operation of the WESM and the implementation of the RCOA regime by
2021 as well as the interconnection of Mindanao to Visayas and Luzon by the end of 2020 will further provide long-term
opportunities for the Group to maximize its power generating capacity and grow its asset base across the Philippines. The Group
will aim to take advantage of these developments to expand the reach of its generation operations and broaden its customer base,
as it will be able to directly and more easily tap commercial and industrial customers not being served by distribution utilities to
which the Group currently supplies energy.
• Continue to build the RES business to diversify revenue streams and take advantage of open access. The Group will target to build
its RES business to complement its revenues from its power supply agreements. The commercial operation of the WESM and the
implementation of the RCOA regime in Mindanao is expected to provide opportunities for the Group to increase its participation
in this more open retail electricity market. As most industrial and commercial participants in the RCOA are expected from the major
load centers in Mindanao (namely Davao City and Cagayan De Oro City), which are currently served by distribution utilities that
are not offtakers of FDCUI, the Group expects to offer a competitive supply without affecting its current supply contracts. The
aforementioned distribution utilities likewise have the highest tariffs among Mindanao distribution utilities due to their supply
portfolio, which includes diesel gensets. In addition, with the interconnection of Mindanao to Visayas and Luzon, the Group expects
to be able to offer competitively-priced power to industrial and commercial customers in Visayas and Mindanao, which customers
will be able to source their supply from the FDC Misamis coal plant at a lower and stable price, rather than sourcing from other
generators and the WESM at market price, as is currently being practiced. By growing its electricity trading platform, the Group
believes it can establish a more nationwide presence for its power business. This will also allow the Group to diversify its revenue
streams and smoothen its earnings from its power operations.
• Continue to explore and pursue renewable energy projects. The Group will continue to pursue opportunities arising from ongoing
market changes in the power industry as outlined in the RE Act of 2008. The RE Act of 2008 provides market-based mechanisms
and specific project incentives to drive the development of renewable energy projects. Project incentives include income tax holiday,
lower duty-free importation, exemption from universal charge, cash incentive for missionary electrification and zero percent value-
added tax rate. Market-based mechanisms for renewable energy consist of the feed-in tariff, renewable portfolio standards and green
energy options. As such, the Group will seek opportunities to balance its existing portfolio by accelerating the development of
renewable energy projects such as geothermal, hydropower, biomass and solar energy. The Group has already begun these
initiatives through FREE, its joint venture company for renewable energy solutions with Engie.
• Selectively participate in the bidding for Government and private power generation assets. The Group envisions growing its power
generation capacity through both the development of greenfield projects and strategic acquisitions. The Group is seeking to gain
market share in the power generation industry by selectively participating in the acquisition of government-owned and privately-
owned power generation assets. The Group is closely monitoring all acquisition opportunities in the market, and has been conducting
due diligence in advance to prepare for any future rounds of bidding. The Group aims to participate only in those projects which
meet its internal investment goals, from both a financial and a strategic perspective.
• Pursue niche marketing and strategic partnerships. The Group plans to develop projects where it believes it has a competitive
advantage in terms of cost and reliability. The Group believes that its existing main location in the PHIVIDEC Industrial Estate
allows it to benefit from the growth in industrial projects being established in the area. The Group expects prospective industrial
locators to benefit from contracting their supply with the Company due to savings as a result of having more stable prices, as
compared to purchasing from the WESM, and reduced distribution charges as a result of the proximity of the power plant to their
facilities, which the Group believes provides it with a competitive pricing advantage vis-à-vis other power plants in the region. The
Group intends to utilize the incentives offered under the RE Act on the development of projects using renewable energy resources
such as geothermal, hydropower, biomass and solar energy. The Group plans to work with strategic partners, such as Engie Services

70
Philippines, which have specific interests in renewable energy development and to market FDCUI’s renewable energy expertise to
distribution utilities as well as commercial and industrial facilities.
• Enhance CSR initiatives. FDCUI, through its subsidiary, FDC Misamis, has been implementing social development programs in
partnership with host communities. These programs promote environmental stewardship, economic enrichment, enhanced health
care initiatives, education for empowerment and help create a positive impact on the communities surrounding the project site.
These CSR activities, where employees also actively participate and volunteer, are based on real needs of the community residents
as determined through a socio-economic baseline study of the host and affected villages. The Group also expects to partner with
indigenous people, local communities and LGUs in each location of its proposed projects to ensure unimpeded construction and
development.
Sugar Operations Strategy
Sugar Group’s main strategies are to augment cane supply, focus on cost efficiency, improve its human resources management and
pursue any opportunities available to develop its plants for power production.
• Augment cane supply by developing programs to improve farmer yields. The Group plans to continue increasing Sugar Group’s
sugar production and capacity utilization by expanding Sugar Group’s sugarcane supply from both independent farmers as well as
its own corporate farms. In particular, Sugar Group will seek to enhance its partnerships with farmers to encourage them to improve
their farm’s productivity and to plant sugarcane on agricultural land not currently being used for sugarcane production. In addition
to granting low interest crop loans, Sugar Group’s farmer assistance programs include the provision of technical advice. Since 2015,
Sugar Group has assisted planters (who decide to expand their farms) in the replanting of existing farms with new higher yielding
varieties by providing such planting materials to farmers free of charge. As the free canepoints program is a relatively recent addition
to the Group’s sugar business model, the Group expects this program to continue to accelerate the increase in cane supply for the
mills. Furthermore, Sugar Group intends to utilize technology to monitor farm activities for timely correction of deficiencies.
• Reduce production cost by enhancing plant maintenance program. A significant source of additional production cost is the
breakdown of factory facilities. In order to control recurring maintenance costs, Sugar Group intends to implement a preventive
maintenance program and condition monitoring to fix any damage to avoid long periods of downtime. Additionally, Sugar Group
will continue to implement the effective and efficient use of automation to simplify work and eliminate redundancy in the labor
effort.
• Develop human resources. Sugar Group is also focused on supporting its growth by expanding and improving its human resources.
Sugar Group plans to implement development programs primarily focused on strengthening the competencies of its employees
within: its cane supply department to improve employees’ ability to increase farm productivity, its production department in order
to ensure an efficient and trouble-free milling process, and its sales and marketing department in anticipation of increasing sugar
supplies. Sugar Group plans to leverage this stronger organizational platform to further increase its production and sales particularly
among industrial users and customers outside Southern Mindanao.
• Explore synergistic opportunities in the power sector, particularly in biomass. Sugar Group is also exploring opportunities in the
renewable power sector, including potentially upgrading its boilers and installing generators to produce power to support operation
at its facilities and excess power capacity which it can sell to the local distribution utilities. In particular, the Group is exploring
options of establishing a biomass plant to supplement sugar operations and also produce excess power.
ITEM 2. PROPERTIES
The Parent Company developed the Beaufort, a residential condominium in Bonifacio Global City, Taguig City, Metro Manila and
CRSM in Mactan Island, Cebu.
The Beaufort
FDC launched a premier residential condominium in Bonifacio Global City, Metro Manila in 2007 under the Filinvest Premiere Brand.
The condominium is located on a lot adjacent to the Manila Golf Club with 2 luxury residential towers rising atop a 6-level banking
podium, and a total of 41 storeys with 4 to 6 residential units per floor. Construction of the East and West Tower was in 2014.
2.1 Land Bank
The Group has invested in properties situated in what the Group believes are prime locations across the Philippines for existing and
future housing and land development projects. It is important for the Group to have access to a steady supply of land for future projects.
In addition to directly acquiring land for future projects, the Group has also adopted a strategy of entering into joint venture arrangements
with land owners for the development of raw land into future project sites for housing and land development projects to reduce the
capital expenditures for land and to substantially reduce the financial holding costs resulting from owning land for development.

71
As of December 31, 2020, the Group has a land bank of approximately 1,851.1 hectares of raw land for the development of its various
projects, including approximately 201.0 hectares of land under JVAs, which the management believes is sufficient to sustain at least
several years of development and sales.
The table below sets forth the locations of the Group’s raw land inventory as of December 31, 2020, including land directly owned by
the Group and land for which joint venture agreements have been executed with the land owners. The table also identifies the Group’s
commercial land bank. (area in hectares).
Location Company Under
Owned Joint Ventures Total
RESIDENTIAL LAND BANK
Luzon Metro Manila 35.7 – 35.7
Rizal 690.9 9.2 700.1
Bulacan 252.0 – 252.1
Bataan 12.3 – 12.3
Pampanga – 24.9 24.9
Camarines Sur 1.9 – 1.9
Pangasinan 3.5 – 3.5
Cavite 299.5 58.8 358.3
Laguna 226.7 0.7 227.4
Batangas 45.6 42.1 87.7
Sub-total 1,568.1 135.7 1,703.8
Visayas
Cebu 1.5 35.7 37.2
Negros Occidental 4.7 – 4.7
Sub-total 6.2 35.7 41.9
Mindanao Davao 5.5 29.6 35.1
South Cotabato 70.3 – 70.3
Sub-total 75.8 29.6 105.4
Total Residential Land Bank 1,650.1 208.2 1,851.1
COMMERCIAL LAND BANK Filinvest City 56.0 22.5 78.5
Other Metro Manila Locations 3.0 – 3.0
Cebu 5.0 – 5.0
Filinvest Mimosa1 – 201.6 201.6
New Clark City – 288.0 288.0
Total Commercial Land Bank 64.0 512.1 576.1
Total Land Bank 1,714.1 713.1 2,427.2
1Represents total inventory of land owned by the Group, held under joint venture or leased pursuant to a long-term lease.

72
2.2 Current Development Projects
The following are the most recently launched projects and projects with new phases and buildings as of December 31, 2020:
PROJECT LOCATION PROJECT LOCATION
HORIZONTAL MRB
Amarilyo Crest Rizal One Oasis Cebu Cebu
Pineview Cavite One Oasis Cagayan de Oro Cagayan de Oro
Sandia Batangas Panglao Oasis Taguig
Tierra Vista Bulacan One Spatial Pasig
The Grove Rizal San Remo Cebu
Savannah Place Cavite Centro Spatial Davao
Futura Homes Palm Estates Bacolod One Spatial Iloilo Iloilo
Futura Homes Mactan Cebu Marina Spatial Dumaguete
Futura Homes Iloilo Iloilo 8 Spatial Davao
Futura Homes Koronadal South Cotabato Maui Oasis Manila
Anila Park Residences Rizal Alta Spatial Valenzuela City
Aria at Serra Monte Rizal Bali Oasis Pasig
The Prominence Quezon City Maldives Oasis Davao
Futura Homes Davao Davao Sorrento Oasis Pasig
New Fields at Manna Rizal Veranda Davao
Meridian Place Cavite Futura East Cainta
Valle Dulce Laguna Centro Spatial Manila
Ventura Real Rizal Belize Muntinlupa
Claremont Expansion Pampanga Futura Vinta Zamboanga
Southwinds Laguna HRB
Futura Zamboanga Zamboanga Activa Quezon City
Enclave Muntinlupa Levels Alabang
New Leaf Cavite Studio City Alabang
Mira Valley Rizal Studio N (Block 50) Alabang
Hampton Orchard Pampanga
Futura Mira Calamba
Futura Plains Rizal
Tropics 4 Cainta
On-going developments of the abovementioned projects are expected to require additional funds but FLI believes that it will have
sufficient financial resources for these anticipated requirements, both from debt financing and generation from operations.
FLI expects to remain focused on core residential real estate development business which includes MRB projects and high-rise
condominium projects, residential farm estates, entrepreneurial communities, and leisure developments in response to the demands of
the Philippine market. The Parent Company is also expanding its retail and office-building portfolio to generate recurring revenues.
In 2021, FLI intends to retain its dominant position as the leader in MRB projects by launching 5 new projects nationwide and 11
additional buildings of existing projects. Aside from the MRBs, FLI has pipelined 11 horizontal residential projects and 2 HRB projects.
Hospitality Operations
Currently, the Group has full scale operations in four properties located in Cebu City, Mactan, Muntinlupa City, and Clark, Pampanga.
Crimson Resort and Spa Boracay was opened in November 2018.
Its maiden project MSSI or the brand Crimson Resort and Spa Mactan is a deluxe 5-star property with 290 rooms, 40 of which are one-
bedroom villas with their own pools. Its main recreational facilities are its swimming pool and beachfront. It has 4 food and beverage
outlets and 2 ballrooms, Coral and The Hall which can cater to a total of 400 persons all at the same time. The flagship Azure Beach
Club was launched on October 24, 2014. The resort recently completed its renovation of the infinity pool, and opened the Spanish-

73
themed Enye restaurant in 2017. The property also launched the 3,700-sq.m. Crimzone, which features family-oriented facilities,
children’s play area, dedicated pool and snack bar. The construction of the 229-room expansion of the property with additional Food
and Beverage outlets and function spaces is on-going.
Quest Hotel and Conference Center, located in the heart of Cebu City, is a 3-star standard city hotel with 427 condotel rooms. It has an
all-day dining restaurant catering to the breakfast needs of guests and meeting requirements. Small meetings and conferences can be
hosted in its 10 meeting rooms for a total of 400 persons capacity. Not only does Quest provide for the business related needs of guests,
it also has a swimming pool for recreation.
EHSI or the brand Crimson Filinvest City Manila is a deluxe property with 345 rooms offered to guests. Strategically located in Alabang,
Muntinlupa City right across the Festival Supermall. It has a total of 3 food and beverage outlets with Café 8 as the all-day dining while
the Deck Bar is a highlight among its recreational facilities being located at near the swimming pool. Its ballroom can accommodate
events with as much as 350 participants and supported by 6 other smaller meeting rooms.
Quest Hotel and Conference Center Clark is a 4-star hotel located in the heart of Clark, Pampanga. Having been located in the beautifully
landscaped Mimosa Leisure Estate, the hotel offers everything expected from an international destination plus a 36-hole championship
golf course, a hub for duty-free shopping, nature walks & activities and a nightlife entertainment hub among others. The hotel itself has
303 newly-refurbished guestrooms, a grand ballroom, meeting rooms and an all-day Café. Its eight spacious meeting rooms can be set
up to accommodate the desired number of people. Its grand ballroom can host a total of 575 persons in a banquet set-up. Currently, the
hotel has the Café Mequeni and the Charley’s Tapas bar as its 2 food and beverage outlets.
Crimson Resort and Spa Boracay, one of the newest destinations in the island, is a 5-star resort situated in an exclusive location,
uniquely coined as Station Zero. With breathtaking views, pristine white sand beachfront and state-of-the-art facilities, the resort
features 192 keys inclusive of 23 villas. World-class outlets include Saffron Café, Mosaic Latin American Grill, Azure Beach Club
and J’s Pool Bar. A wide range of leisure activities and meeting facilities are offered through the Events Pavilion, Coral Ballroom,
Crimzon Kids’ Club, Aum Spa, and generous pool areas.
Quest Hotel Tagaytay will be a condotel property featuring 2 towers with 164 rooms each located along General Emilio Aguinaldo
Highway, Tagaytay City. Similar to QHCC Cebu, the condotel units are to be sold to third party buyers and will be subject to a
condotel participation agreement. The units will be operated and managed by CHI, which will distribute net income (after deducting
all expenses) to eligible unit buyers. Tower 1 began soft operations in April 2019 and was completed during the last quarter of 2019.
Construction of tower 2 is expected to commence in 2021 and tower 2 is expected to be operational in 2023.
Banking and Financial Services
The Bank’s head office is located in East West Corporate Center, The Beaufort, Fort Bonifacio Global City, Taguig City, Philippines.
The Bank believes all its facilities and properties are currently in good condition. As of date of this report, there are no liens or
encumbrances on any of the properties of EW. The Bank may consider encumbering some of its properties as part of its normal
supplementary funding operations. The Bank will continue to reconfigure the mix of its branches and adjust to the needs of its customers.
Power Operations
In 2016, FDCUI, through FDC Misamis, completed its 405 MW clean coal thermal power plant in Mindanao. The power plant is located
inside the 3,000 hectare PHIVIDEC Industrial Estate in Villanueva, Misamis Oriental and is connected to the new Villanueva Substation
of the National Grid Corporation of the Philippines. FDC Misamis signed in November 2012 a 25-year lease contract with PHIVIDEC
Industrial Authority which is exclusive of a 3-year construction period.
Sugar Operations
Milling and Refining Facilities
The annual sugarcane harvesting period in Mindanao generally begins during the dry season in November and ends in April the following
year. Once sugarcane is harvested, farmers in the vicinity of the mills are responsible for transporting the harvest directly to the mills,
generally by truck. The Sugar Group grants certain subsidies to assist most of its contract farmers with their transportation costs. The
Sugar Group monitors and coordinates harvesting and transportation operations among farmers to achieve an orderly and uninterrupted
schedule of cane supply to its sugar mills. At the beginning of each milling season, the Sugar Group surveys the size of the farmers’
crops and organizes the farmers’ harvesting and supply schedules, amounts of sugarcane delivered and payments through an electronic
database. Data is gathered for the Sugar Group’s entire production process, including data relating to sugarcane supply and the Sugar
Group’s factory operations.

74
Each of DSCC and CSCC has on-site packaging, distribution capabilities and inventory storage facilities. Each mill operates on the
basis of 3 eight-hour shifts during the milling season. Once every 2 weeks, DSCC shuts down the mill for about 16 hours for cleaning
of the evaporators while CSCC does not need to shut down by alternate use of its 2 sets of evaporators.
Factory Equipment
DSCC owns 1 sugar mill and 1 refinery. The sugar mill equipment includes the following: cane preparation equipment (cane knives and
shredder), 3 four-roller mills and 1 five-roller mill, boiling house equipment (heaters, clarifiers, vacuum filters, evaporators, vacuum
pans, crystallizers and centrifugals), turbo generators, 2 boilers and other accessories. The refinery equipment includes the following:
melters, affination centrifugals, talo-clarifiers, deep-bed filters, ion-exchange decolorization equipment, refinery evaporator, vacuum
pans, crytallizers, centrifugals, a dryer and cooler and other accessories. Steam and electricity are provided by 3 units of bagasse-fired
steam boilers and 3 units of turbo generators.
CSCC owns one sugar mill and a refinery. The sugar mill equipment includes the following: cane preparation equipment (cane knives
and shredder), 3 four-roller mills and 2 five-roller mills, boiling house equipment (heaters, clarifiers, vacuum filters, evaporators,
vacuum pans, crystallizers and centrifugals), 4 turbo generators, 2 boilers and other accessories. The refinery equipment includes the
following: melters, affination centrifugals, clarifiers, pressure filters, ion-exchange decolorization equipment, refinery evaporator,
vacuum pans, crystallizers, centrifugals, a dryer and cooler and other accessories. Steam and electricity are provided by 3 units of
bagasse-fired steam boilers and 3 units of turbo generators.
Properties
The following table lists land owned and leased by the Sugar Group:
Sugar Subsidiary Area (sq. m.)
DSCC
Mill site compound 539,000
CSCC
Mill site compound 222,000
Truck yard and access road 391,000
Other 120,000
HYSFC
Proposed office site 49,000
Total 1,321,000
HYSFC has development agreements for a total area of 1,003 hectares with various landowners remaining as of CY 2019-20 after a
management decision to drop low yielding and high cost areas. Other reductions are expired agreements that were not renewed by the
landowner or renewal not pursued due to unfavourable location. The agreements are generally based on a fixed annual payment from
HYSFC to the landowners with terms ranging from 10 years to 15 years. HYSFC develops these areas into sugarcane farms.
Investment in foreign securities
The Company does not have any investment in foreign securities.
Investment Properties
FLI has the following operating strategic investment properties: Festival Supermall, Fora Mall, Main Square Molino, Il Corso, PBCom
Tower, Northgate Cyberzone, EDSA Transcom Building, Cebu Cyberzone, Pasay Cyberzone (Bay Area) and Clark Mimosa Cyberzone.
Rentals
Banking and Financial Services
The Bank also leases several premises occupied by its branches with annual escalation of 5.0% to 10.0% and for periods ranging from
5 to 15 years, renewable upon mutual agreement of both parties. EW has 468 branches as of December 31, 2020 including its rural bank
branches. For the years ended December 31, 2020 and 2019, the total rentals of the banking and financial services charged to operations
amounted to P=90.8 million and P=107.1 million, respectively.

75
Real Estate
FLI is renting spaces for its sales offices in Quezon City, Rizal, Pampanga, Tarlac, Puerto Princesa City, Davao City, Butuan, Tagum,
Cagayan de Oro, and Zamboanga City. The terms of the leases are usually for 1 year, and thereafter, the terms of the lease are on a
month-to-month basis or upon the option of both parties, a new contract is drawn.
ITEM 3. LEGAL PROCEEDINGS
The Group is subject to lawsuits and legal actions in the ordinary course of its real estate development and other allied activities.
However, the Group does not believe that any such lawsuits or legal actions will have a significant impact on the financial position or
result of operations of the Group. Noteworthy are the following cases involving the Company and its subsidiaries, FLI and PSHC,
among others:
1. FLI vs. Abdul Backy Ngilay, et al.,
G.R. No. 174715
Supreme Court
This is a civil action for the declaration of nullity of deeds of conditional and absolute sale of certain real properties located in Tambler,
General Santos City covered by free patents and executed between FLI and the plaintiff’s patriarch, Hadiji Gulam Ngilay. The Regional
Trial Court (“RTC”) of Las Piñas City (Br. 253) decided the case in favor of FLI and upheld the sale of the properties. On appeal, the
Court of Appeals rendered a decision partly favorable to FLI but nullified the sale or some properties involved. FLI filed a petition for
review on certiorari to question that portion of the decision declaring as void the deeds of sale of properties covered by patents issued
in 1991. The Supreme Court affirmed the decision of the Court of Appeals but declared with finality that EU’s purchase of sales patents
issued in 1991 was void and ordered the Ngilays to return ₱l4,000,000.00 to FLI. The Regional Trial Court issued a Writ of Execution
dated February 16, 2015. To satisfy the monetary judgment in favor of FLI, four parcels of land owned by the Ngilays and covered by
Transfer Certificates of Title (“TCT”) Nos. P-6886, 147-201005034, 147-2014000465, and 147-2014000468, were levied on execution
and sold at public auction to FLI as highest bidder. The Sheriff’s Certificate of Sale over the properties was registered with the Registry
of Deeds of General Santos City. FLI filed a motion for the surrender of the certificates of titles of the Ngilays so that FLI’s affidavit of
consolidation of ownership can be annotated on the titles and new certificates of title will be issued in FLI’s name. This motion was
partially granted; 3 titles, namely Transfer Certificates of Title (“TCT”) Nos. 147-2014005034, 147-2014000465, and 147- 2014000468,
are surrendered to the Register of Deeds of General Santos City but Transfer Certificate of Title (“TCT”) No. P-6886 was declared sale
by the Sheriff invalid because the owner’s title was not one of the titles declared by the Supreme Court as invalid. The Sheriff was
ordered to look for another property of Ngilay for execution and is to issue an amended certificate of sale for the 3 Ngilay properties in
favor of FLI. We are awaiting for the approval of the Court to issue order approving amended certificate of sale along with resolution
of the Court on the Moner Ngilay’s Motion to Exclude his property from execution, with FLI’s opposition already filed.
2. Emerlita Alvarez, et al., vs. FDC, et al.,
DARAB Case No. 16469 (IV-RI-010-95)
Adjudication Board, Department of Agrarian Reform
On or about March 15, 1995 certain persons claiming to be beneficiaries under the Comprehensive Agrarian Reform Program (CARP)
of the National Government filed an action for annulment/cancellation of sale and transfer off titles, maintenance of peaceful possession,
enforcement of rights under CARP plus damages before the Regional Agrarian Reform Adjudicator, Adjudication Board, Department
of Agrarian Reform. The property involved, located in San Mateo Rizal, was purchased by FDC from the Estate of Alfonso Doronilla.
A Joint Decision (order) dated March 15, 2005 was issued by the Provincial Agrarian Reform Adjudicator dismissing the complaint for
lack of merit. On July 2, 2009, the petitioner filed its Memorandum on Appeal to the Department of Agrarian Reform Adjudication
Board (“DARAB”). On December 26, 2019, DARAB issued its Decision denying the Memorandum on Appeal. On June 10, 2020, the
Intervenors submitted their Motion for Reconsideration. On December 11, 2020, we received a copy of the Resolution dated November
3, 2020 denying the Motion for Reconsideration of the intervenor-movants of the Order dismissing the case for lack of jurisdiction.
3. Republic of the Philippines vs. Rolando Pascual, et al.,
G.R. No. 222949
Supreme Court
The National Government through the Office of the Solicitor General filed suit against Rolando Pascual, Rogelio Pascual, and FLI for
cancellation of title and reversion in favor of the Government of properties subject of a joint venture agreement between the said
individuals and FLI. The Government claims that the subject properties covering about 73.33 hectares are not alienable and disposable
being forest land. The case was dismissed by the RTC of General Santos City (Branch 36) on November 16, 2007 for lack of merit. On
appeal, the Court of Appeals reversed the Decision of the RTC and ordered the case to be remanded for a full-blown trial on the merits.
FLI filed a Motion for Partial Reconsideration, which was denied by the CA. On April 4, 2016, FLI filed its Petition for Review with
the Supreme Court, but the SC also affirmed the Decision of the CA remanding the case for reversion filed by the Republic of the

76
Philippines to the RTC of General Santos City for further proceedings. in an Order dated September 18, 2018, the hearing was reset to
March 19, 2019, the RTC set the case for Judicial Dispute Resolution on August 20, 2019. The Judicial Dispute Resolution was
terminated.
On February 13, 2020, FLI filed its Amended Answer incorporating its cross-claim against defendant Rodel Land, Inc. The pre-trial set
on April 14, 2020 was cancelled in light of the COVID-19 pandemic and was reset to March 18, 2021.
4. Antonio E. Cenon and Filinvest Land, Inc. vs. San Mateo Landfill, Mayor Rafael Diaz,
Brgy. Pintong Bukawe, Director Julian Amador and the Secretary, Department of
Environment and Natural Resources
SC-G.R. No. 251303
Supreme Court
On February 9, 2009, FLI and its First Vice President, Engr. Antonio E. Cenon (“Plaintiffs”) filed an action (or injunction and damages
against the respondents to stop and enjoin the construction of a 19-hectare landfill in a barangay in close proximity to Timberland
Heights in San Mateo, Riz8l. Plaintiffs sought preliminary and permanent injunctive reliefs and damages and the complete and
permanent closure of the dump site. After presenting evidence, plaintiffs rested their case. Defendant San Mateo Sanitary Landfill and
defendant Mayor separately filed a Demurrer to Evidence. In an Order dated August 22, 2016, the Regional Trial Court granted both
Demurrers to Evidence and dismissed the case for insufficiency of evidence. Plaintiffs appealed to the Court of Appeals. In the Decision
dated May 31, 2019, the Court of Appeals denied the plaintiffs’ appeal. Plaintiffs filed a Motion for Reconsideration. The Motion for
Reconsideration was denied in a Resolution of the Court of Appeals dated January 6, 2020. A Petition for Review on Certiorari was
filed by the plaintiffs with the Supreme Court on March 6, 2020. On July 13, 2020, the Supreme Court issued a Resolution denying the
Petition. Plaintiffs filed a Motion for Reconsideration on November 25, 2020, which is pending before the Supreme Court.
5. Coca-Cola Bottlers Philippines, Inc. vs. Pacific Sugar Holdings Corporation
Civil Case No. 10-1067, Branch 146, Regional Trial Court, Makati City; G.R. No. 241333 (CA-G.R. SP No. 143593);
G.R. No. 250454 (CA-G.R. CV No. 109827); G.R. No. 233580
On October 28, 2010, Coca-Cola Bottlers Philippines, Inc. (“Coca-Cola”) filed with the Regional Trial Court of Makati (“RTC”) a civil
case against Pacific Sugar Holdings Corporation (“PSHC”) demanding the amount of ₱347,410,104.66 allegedly representing damages
sustained by Coca-Cola due to the supposed failure by PSHC to deliver certain volume of sugar products. The court issued a writ of
preliminary attachment against PSHC, causing the attachment of its personal properties to cover the amount of Coca-Cola’s claim. The
writ of preliminary attachment was lifted upon filing by PSHC of a stand-by Letter of Credit.
G.R. No. 241333 (CA-G.R. SP No. 143593)
Coca-Cola assailed the lifting of the writ by filing a petition for certiorari with the Court of Appeals (“CA”) docketed as CA-G.R. SP
No. 143593. The CA dismissed the petition and denied the motion for reconsideration filed by Coca-Cola which prompted the latter to
file a petition for review with the Supreme Court (“SC”) docketed as G.R. No. 241333. This petition is still pending with the SC.
G.R. No. 250454 (CA-G.R. CV No. 109827)
Meanwhile, PSHC accordingly filed its Answer on April 13, 2011 to refute the claims of Coca-Cola. After trial on the merits, the RTC
rendered a decision on August 11, 2017 ordering PSHC to pay Coca-Cola the amounts of ₱347,410,104.66 as actual damages,
₱300,000.00 as exemplary damages, ₱1,000,000.00 as attorney’s fees, and costs of suit. PSHC filed an appeal with the CA docketed as
CA-G.R. CV No. 109827. The CA rendered a decision on February 15, 2019 partially granting the appeal, reducing the actual damages
to ₱67,030,420.00, and affirming all other judgment awards. Coca-Cola filed a Motion for Partial Reconsideration of the decision but
the same was denied by the CA in its resolution issued on November 12, 2019. Coca-Cola then filed a petition for review with the SC
docketed as G.R. No. 250454 to assail the CA decision.
In the proceedings before the SC, a motion for the consolidation of this petition with G.R. No. 233580 also filed by Coca-Cola was
allegedly granted by the SC on June 8, 2020 but neither PSHC nor its counsel received a copy of such order/resolution. To date, PSHC
has not received any order or resolution directing it to file its comment on Coca-Cola’s petition.
G.R. No. 233580
Coca-Cola also filed another petition for review with the SC asking for the partial modification of the RTC Decision in Civil Case No.
10-1067 by imposing the payment of 6% interest per annum reckoned from the extrajudicial demand by Coca-Cola on PSHC on March
26, 2010. On September 1, 2020, PSHC moved for the dismissal of this petition for being moot and academic in light of the prayer of
Coca-Cola for the imposition of 6% interest per annum in its petition in G.R. No. 250454. PSHC’s motion to dismiss has not been
resolved to date.

77
6. Manila Paper Mills International, Inc. vs. Filinvest Land, Inc., et al.,
Civil Case No. DC-721-17
Regional Trial Court
Branch 90, Dasmariñas City, Cavite
In its Complaint dated July 14, 2017, Manila Paper Mills International, Inc. (“MPMII”) claims it owns three parcels of land in
Dasmariñas City, Cavite covered by TCT Nos. T-636128, T-636130 and T-636131 with the following respective areas: 79,999 square
meters, 40,000 square meters, and 104,340 square meters, or a total area of 224,339 square meters. These areas allegedly overlap with
FLI’s lots which now form part of FLI’s project, The Glens located in San Pedro Laguna. According to MPMII, plotting for The Glens
conducted by a Licensed Geodetic Engineer through Google Maps revealed that portions of the project encroached on said MPMII
properties for a total of 208,256 square meters. The Complaint prays for the cancellation of FLI’s certificates of title that overlap with
MPMII’s as well as the payment of damages. MPMII also prayed for the issuance of a temporary restraining order or preliminary
injunction to enjoin FLI from possessing, altering, transferring ownership, or disposing of the subject properties. MPMII subsequently
amended its complaint to address issues raised by FLI in its first Motion to Dismiss. The main subject of the amendment was the change
in the plaintiff from MPMII to “Trustees and Shareholders of MPMII”.
In response to the amended complaint, FLI filed its second Motion to Dismiss, where FLI argued, among others, that: (a) the court has
no jurisdiction over the amended complaint’s prayer for injunctive relief; (b) the amended complaint should be dismissed because the
original complaint lacks cause of action (because MPM1I’s corporate personality has ceased in 2004) and may not therefore be subject
to amendment; (c) the correct filing fees were not paid and in view of its impropriety, the amendment circumvents the need for separate
filing and payment of new docket fees.
During the proceedings, the court allowed MPMII to present evidence on its prayer for injunction even before the resolution of FLI’s
motions to dismiss which raised serious grounds. The Presiding Judge proceeded with the hearing of the latter’s evidence without the
presence and participation of FLI’s counsel. Thus, FLI filed a Motion to Recuse which the Presiding Judge granted. In the meantime,
the proceedings are suspended by the assignment of the case to another judge.
The case was then assigned to an Acting Presiding Judge and a hearing was set on January 23, 2019 for the cross-examination of
MPMII’s witnesses. FLI filed an Omnibus Motion to nullify the proceedings where MPMII presented the above-said evidence/witnesses,
to resolve pending motions and to suspend further proceedings. An Order was issued which cancelled the hearing on January 23, 2019
and submitted the Motion to Dismiss for resolution.
In an Order dated May 15, 2019, the court denied the Omnibus Motion. FLI filed a Motion for Reconsideration dated July 10, 2019. On
November 3, 2020, the Court issued an Order, which, among others, denied the Motion for Reconsideration, admitted the Amended
Complaint of MPMII, directed MPMII to submit the current tax declarations on its supposed properties, and set again the hearing on
MPMII’s prayer for injunction. An Urgent Motion to Dismiss was filed by FLI on February 2, 2021 grounded on the failure of MPMII
to submit the said tax declarations. In the hearing of March 5, 2021 set for the hearing on the Urgent Motion to Dismiss and on MPMII’s
prayer for injunction, the Court dismissed the case and granted FLI’s Urgent Motion to Dismiss for MPMII’s failure to timely submit
the said tax declarations.
ITEM 4. SUBMISSION OF MATTERS TO A VOTE OF SECURITY HOLDERS
There were no matters submitted to a vote of security holders during the fourth quarter of the calendar year covered by this report.
PART II - OPERATIONAL AND FINANCIAL INFORMATION
ITEM 5.1 MARKET FOR ISSUER’S COMMON EQUITY AND RELATED STOCKHOLDER MATTERS
Cash Dividends
On June 22, 2020, FDC’s Board of Directors (BOD) approved the declaration and payment of cash dividends of P=1,196.9 million or
P=0.1384 per share for every common share of record as of July 22, 2020. This was paid on August 17, 2020.
On April 26, 2019, the Parent Company’s BOD approved the declaration and payment of cash dividends of P=864.8 million or
P=0.10 per share for every common share of record as of May 26, 2019. This was paid on June 19, 2019.
On May 4, 2018, the Parent Company’s BOD approved the declaration and payment of cash dividends of P=661.6 million or
P=0.0765 per share for every common shares of record as of June 3, 2018. This was paid on June 28, 2018.
The payment of cash dividends depends upon the Parent Company’s earnings, cash flow, financial condition, capital investment
requirements and other factors (including certain restrictions on dividends imposed by the terms of loan agreements). Pursuant to the
loan agreements entered into by the company and certain financial institutions, the Parent Company needs the lenders’ prior consent in
cases of cash dividend declaration.

78
ITEM 5.2 BOND ISSUANCES
On January 24, 2014, FDC issued and listed P=8,800.0 million unsecured fixed-rate peso retail bonds due 2024 with annual coupon rate
of 6.1458%. Interest is payable quarterly in arrears starting April 24, 2014. Net proceeds from the bonds amounted to
P=8,754.9 million of which portion was used for refinancing amounting to P=4,877.1 million and the balance was used for the capital
expenditures of the Hotel and Power operations.
Market Price Information
The Shares are traded on the PSE under the symbol “FDC.” The Shares were listed on the PSE on December 22, 1982. The high and
low sales prices for the Shares as reported on the PSE for each quarter in 2018, 2019 and 2020 were as follows:
High Low Period End
2018
First Quarter ............................................................................................... 7.80 7.20 7.55
Second Quarter .......................................................................................... 7.68 7.00 7.10
Third Quarter ............................................................................................. 7.30 6.83 7.11
Fourth Quarter ........................................................................................... 13.80 7.00 11.80
2019
First Quarter ...............................................................................................
16.30
11.80
15.08
Second Quarter .......................................................................................... 15.66 12.34 14.00
Third Quarter ............................................................................................. 14.18 13.00 13.00
Fourth Quarter ........................................................................................... 13.50 12.94 13.00
2020
First Quarter ...............................................................................................
13.48
6.50
8.40
Second Quarter .......................................................................................... 9.88 7.62 7.90
Third Quarter ............................................................................................. 9.12 7.80 8.60
Fourth Quarter ........................................................................................... 10.10 8.51 9.44
As of December 31, 2020 and March 31, 2021, the closing price of the Parent Company’s shares on the PSE was P9.4 per share and
P8.7 per share, respectively. The number of shareholders of record (exclusive of treasury) as of December 31, 2020 and
March 31, 2021 were 4,035 and 4,026, respectively. Total common shares issued were 9,319,872,387 and outstanding were
8,648,462,987 as of December 31, 2020.
Top 20 Stockholders
As of December 31, 2020
Shareholders
Class of
Securities No. of Shares held
% to Total
Outstanding
1 A.L. Gotianun, Inc. Common 7,587,823,502 87.74%
2 PCD Nominee Corporation (Filipino) Common 901,179,482 10.42%
3 Michael Edward T. Gotianun Common 50,501,501 0.58%
4 PCD Nominee Corporation (Non-Filipino) Common 38,518,137 0.45%
5 Ricardo Alonzo Common 28,627,534 0.33%
6 Andrew Gotianun Jr. Common 3,371,995 0.04%
7 Lourdes Josephine Gotianun Yap Common 3,370,091 0.04%
8 Joseph M. &/Or Lourdes Josephine G. Yap Common 2,817,311 0.03%
9 Helen Reyes Common 2,692,544 0.03%
10 Emily Benedicto Common 2,466,400 0.03%
11 H. K. Hedinger Common 2,023,508 0.02%
12 Santiago Go Common 1,707,066 0.02%
13 Executive Optical, Inc. Common 1,023,556 0.01%
14 Ama Rural Bank of Mandaluyong, Inc. Common 616,600 0.01%
15 Manuel Benipayo Common 527,141 0.01%
16 Salud Borromeo Common 501,655 0.01%
17 Francisco Benedicto Common 493,280 0.01%
18 Edan Corporation Common 387,224 0.00%
19
Ma. Consuelo R. Medrano &/Or Victoriano
S. Medrano Common 308,300 0.00%
20 Alfonso Siy &/Or Ang Pue Tin Common 246,640 0.00%

79
Shareholders
Class of
Securities No. of Shares held
% to Total
Outstanding
8,629,203,467 99.78%
Recent Sale of Unregistered Securities
There are no securities sold by the Company in the past 3 years, which were not registered under the Code 2.
ITEM 6. MANAGEMENT’S DISCUSSION AND ANALYSIS OR PLAN OF OPERATIONS
RESULTS OF OPERATIONS
Year Ended December 31, 2020 Compared With Year Ended December 31, 2019
Revenues
Real Estate Operations
Sale of Lots, Condominium and Residential Units
Sale of lots, condominium and residential units declined by 51.3% or P11,000.2 million from P21,453.5 million in 2019 to P10,453.3
million in 2020 generally because of lower construction percentage of completion due to temporary suspension of construction
activities, and decreased collections reaching the required threshold for revenue recognition, as a result of extension of payment due
dates in compliance with Bayanihan Act in response to the COVID-19 pandemic.
Mall and Rental Revenues
Mall and rental revenues amounted to P6,667.9 million in 2020, a decrease of 10.7% or P796.4 million from P7,464.3 million in 2019
mainly ascr ibed to the lower rental income from malls and other commercial centers which decl ined due to their closure
and limited operations during quarantine period imposed to control the spread of COVID -19 pandemic. This was partially
offset by the increase in office leasing revenue which continued to be 100% operational during the quarantine period.
Hospitality Operations
Hospitality Revenues
Hospitality revenues amounted to P1,235.5 million in 2020, a decrease of 62.7% or P2,075.7 million from the P3,311.2 million
revenues reported in 2019. This was on account of lower occupancy rates upon imposition of travel restrictions and quarantine
measures brought by the COVID-19 pandemic.
Banking and Financial Services
Net Interest Income
Banking and Financial Services Interest Income
The banking and financial services’ interest income grew by 3.9% or P1,127.7 million from P29,139.0 million in 2019 to
P30,266.7 million in 2020, due to higher interest earned from loans and receivables and cash and cash equivalents consisting
of due from BSPand interbank loans and receivables.
Costs of Banking and Financial Services
Costs of banking and financial services dropped by 49.5% or P3,924.4 million from P7,923.8 million in 2019 to P3,999.5
million in 2020 mainly due to decreasing interest rates on t ime d ep o s i t s an d o the r b o r ro win g s and growth in low-cost
deposits.
Net Interest Income
Net interest income surged by 23.8% or P5,052.0 million from P21,215.2 million in 2019 to P26,267.2 million in 2020 as net interest
margins increased to 8.1% from 6.9%.

80
Power Operations
Power Revenues
Power revenues dropped by 16.7% or P1,685.3 million from P10,113.1 million in 2019 to P8,427.7 million in 2020. This was
mainly due to the decreased volume of energy sold resulting from the pandemic.
Sugar Operations
Sugar Revenues
The Group’s sugar revenues increased by 8.9% or P298.3 million from P3,367.9 million in 2019 to P3,666.2 million in 2020
attributed mainly to higher sales volumes and improved sugar prices.
Other Income
Other Income — Real Estate Operations
Other income from real estate operations increased by 101.6% or P2,177.9 million to P4,321.3 million in 2020 from P2,143.4
million in 2019. The increase was due to the P2,900.4 million gain on deconsolidation recognized by the Group when Spectrum
Alabang Properties, Inc. (SAPI), a previously wholly owned subsidiary of Filinvest Alabang, Inc. (FAI), became a joint venture
company after FAI sold 40% of SAPI shares to Mitsubishi Corporation (Mitsubishi).
Other Income — Hospitality Operations
Other income from hospitality operations decreased by 95.1% or P46.9 million from P49.4 million in 2019 to P2.4 million in 2020 due
to the share in net earnings of a joint venture earned in 2019 compared with the share in net loss in 2020 reported under Expenses of
hospitality operations.
Other Income — Banking and Financial Services
The Group’s other income from banking and financial services went down by 4 . 8 % or P344.5 million from P7,218.5 million
in 2019 to P6,874.0 million in 2020 as a result of the decrease in fees and commissions due to lower level of transactions from loan
portfolio, and the decline on miscellaneous income due to the impact of losses from the modified payment schemes brought about by
Bayanihan Acts 1 and 2.
Other Income – Power Operations
Other income from power operations increased by 96.3% or P25.1 million from P26.1 million in 2019 to P51.2 million in 2020 mainly
due to reversal of excess provision for contingencies related to settlement with the Power Sector Asset and Liabilities Management
(PSALM).
Other Income — Sugar Operations
Other income from sugar operations increased by 29.6% or P9.2 million from P31.1 million in 2019 to P40.2 million in 2020
due to higher diesel mark-up and farmers assistance income.
Costs
Costs of Sale of Lots, Condominium and Residential Units
Costs of sale of lots, condominium and residential units decreased by 4 9 . 4 % or P5,712.6 million from
P11,570.2 million in 2019 to P5,857.6 million in 2020, primarily due to lower real estate revenues booked during the period.
Costs of Mall and Rental Services
Costs of mall and rental services decreased by 20.9% or P219.1 million from P1,048.1 million in 2019 to P829.0 million in
2020 on account of lower costs from the interruption of mall operations.
Costs of Hospitality Operations
The Group’s costs of hospitality operations decreased by 38.9% or P643.8 million from P1,655.3 million in 2019 to P1,011.4
million in 2020 mainly attributable to lower business volume as a result of COVID-19 pandemic.
Costs of Banking and Financial Services
Costs of banking and financial services was accounted for under net interest income in the “Revenues”.
Costs of Power Operations
Costs of power operations decreased by 17.8% or P928.7 million from P5,220.6 million in 2019 to P4,291.9 million in 2020
primarily due to the decrease in energy sold during the period.

81
Costs of Sugar Operations
The Group’s costs of sugar operations increased by 8.9% or P251.4 million from P2,823.5 million in 2019 to P3,074.9 million
in 2020 related to the increase in sugar sales volume.
Costs of Other Operations
Costs of other operations decreased by 62.6% or P448.4 million from P716.2 million in 2019 to P267.8 million in 2020 primarily due
to lower level of outstanding dollar bonds.
Expenses
Real Estate Operations
Expenses of real estate operations went up by 10.3% or P755.6 million from P7,320.2 million in 2019 to P8,075.8 million in 2020
because of higher interest expense as the level of outstanding loans increased, offset by the decline in general and administrative
expenses and selling and marketing expenses as a result of lower spending and limited selling activities brought about by quarantine
measures.
Hospitality Operations
Expenses of the hospitality operations decreased by 22.6% or P276.3 million from P1,220.3 million in 2019 to P944.0 million in 2020
attributable to lower utilities, sales and marketing expenses, and other guest-related expenses, which were all related to lower occupancy
as a result of COVID-19 pandemic, as aforementioned.
Banking and Financial Services
Expenses of the banking and financial services of the Group increased by 27.2% or P5,608.7 million from P20,657.4 million in 2019
to P26,266.2 million in 2020 primarily due to higher provisions for losses in anticipation of the uncertainties brought by the COVID-
19 pandemic.
Power Operations
Expenses of the power operations decreased by 2.8% or P70.2 million from P2,465.0 million in 2019 to P2,394.8 million in 2020 on
account of lower expenses particularly outside services and travel expenses and decline in interest expense at the back of reduced level
of loans.
Sugar Operations
Expenses of sugar operations decreased by 13.0% or P30.3 million from P232.2 million in 2019 to P202.0 million in 2020 mainly as a
result of lower provision for probable losses on contingencies and interest expense due to reduced debt level.
Others
Expenses of other operations went up by 70.3% or P841.6 million from P1,197.4 million in 2019 to P2,039.0 million in 2020 due to
increase in interest expense from higher level of outstanding loans and recognition of provision for probable losses on some
contingencies.
Provision for Income Tax
Provision for income tax decreased by P3,137.6 million or 71.60% from P4,384.9 million in 2019 to P1,247.3 million in 2020. Provision
for deferred income tax decreased by P2,465.8 million mainly due to the recognition of tax benefit on EW’s provisions for losses.
Provision for current income tax also decreased by 15.2% or P671.8 million due mainly to lower taxable income.
Net Income
As a result of the foregoing, consolidated net income decreased by 27.6% or P4,377.0 million from P15,882.3 million in 2019 to
P11,505.2 million in 2020. Net income attributable to equity holders of FDC decreased by 29.3% or P3,509.4 million from P11,970.3
million in 2019 to P8,460.9 million in 2020 while net income attributable to noncontrolling interest amounted from P3,912.0 million in
2019 to P3,044.3 million in 2020.

82
FINANCIAL CONDITION
As at December 31, 2020 Compared with As at December 31, 2019
Assets
Total consolidated assets grew slightly by 0.9% or P5,860.1 million from P642,154.9 million as of December 31, 2019 to P648,015.0
million as of December 31, 2020. The movements in asset accounts were accounted as follows:
Cash and cash equivalents increased by 74.4% or P38,762.7 million from P52,096.2 million as of December 31, 2019 to P90,858.9
million as of December 31, 2020 attributable to EW’s higher cash level due to liquidity build-up given the timing of the year-end
holidays, increased reserve on higher deposit volume as required by the BSP, and placement of excess funds in BSP’s overnight deposit
facility for liquidity management.
Loans and receivables of the real estate operations increased by 70.8% or P3,627.2 million from P5,124.1 million as of December 31,
2019 to P8,751.4 million as of December 31, 2020 due to lower collections as a result of payment extension granted to buyers in
accordance with the Bayanihan Act.
Loans and receivables of the hospitality operations decreased by 13.0% or P27.7 million from P213.5 million as of December 31, 2019
to P185.8 million as of December 31, 2020 primarily on account of lower business volume.
Loans and receivables of the banking and financial services declined by 9.2% or P23,344.7 million from P254,106.9 million as of
December 31, 2019 to P230,762.2 million as of December 31, 2020 due to maturities, changes to credit policies resulting from pandemic
response, and lower demand as businesses and households held off borrowing. Business loans accounted for a bigger share of the decline,
attributable mainly to contractual maturities and pay-offs. Allowance for probable losses also went up as the Bank anticipate booking
of possible losses due to pandemic.
Loans and receivables of the power operations decreased by 20.9% or P427.4 million from P2,045.0 million as of December 31, 2019
to P1,617.6 million as of December 31, 2020 at the back of lower energy sold to other power companies and recognition of provision
for probable losses.
Loans and receivables of the sugar operations decreased by 13.1% from P108.1 million as of December 31, 2019 to P93.9 million as of
December 31, 2020 primarily on account of lower level of advances to sugar planters.
Financial assets at fair value through profit or loss was lower by 55.3% or P9,317.1 million from P16,840.7 million as of December 31,
2019 to P7,523.6 million as of December 31, 2020 due to movements in the banking segment’s proprietary trading portfolio.
Financial assets at fair value through other comprehensive income increased by more than 5 times the P5,323.7 million balance in year-
end of 2019 to P30,068.4 million as of December 31, 2020, mainly from the movements in proprietary trading portfolio.
Investment securities at amortized cost decreased by 57.7% or P28,486.4 million from P49,386.1 million as of December 31, 2019 to
P20,899.7 million as of December 31, 2020 due to sale of investment securities to build capital buffers for the challenges of the pandemic.
Contract assets was lower by 36.7% or P5,456.4 million from P14,848.2 million as of December 31, 2019 to P9,391.8 million as of
December 31, 2020 on account mainly of lower revenues.
Real estate inventories increased by 3.6% from P71,363.5 million as of December 31, 2019 to P73,953.1 million as of December 31,
2020 attributable to lower recognized cost of real estate sales as a result of decline in revenues, and additional spending for development
costs.
Coal, spare parts and other inventories increased by 33.6% or P238.7 million from P=710.3 million as of December 31, 2019 to P=949.1
million as of December 31, 2020 due to the continued build-up of critical spare parts for plant maintenance as of reporting date.
Investment properties increased by 3.5% or P=3,048.7 million from P=85,990.3 million as of December 31, 2019 to
P=89,039.0 million as of December 31, 2020 on account of additional construction costs of new buildings for office and commercial
lease.
Property, plant and equipment decreased by 1.3% or P=563.0 million from P=43,155.5 million as of December 31, 2019 to P=42,592.5
million as of December 31, 2020 mainly due to depreciation, offset by acquisitions during the year.
Investments in joint ventures and associate posted an increase of 38.8% or P389.6 million from P1,005.3 million as of December 31,
2019 to P1,394.9 million as of December 31, 2020 as SAPI was deconsolidated and the related investment was recognized as a joint
venture after FAI sold 40% of shares to Mitsubishi.

83
Deferred tax assets increased by 78.2% or P2,547.0 million from P3,255.4 million as of December 31, 2019 to P5,802.4 million as of
end of 2020 related to the take-up of provision for probable losses by EW, net of write-offs during the period.
Right-of-use assets posted a slight movement of 0.4% or P13.7 million from P3,575.8 million as of December 31, 2019 to P3,589.6 as
of December 31, 2020.
Other assets decreased by 10.9% or P2,464.9 million from P22,625.0 million as of December 31, 2019 to P20,160.1 million as of
December 31, 2020 on account of matured derivative assets and loan related settlements.
Liabilities
Total consolidated liabilities as at December 31, 2020 amounted to P506,408.2 million, a slight 0.7% decrease from P510,004.9 million
balance as of December 31, 2019, with changes in accounts as follows:
Deposit liabilities grew by 7.5% or P21,434.1 million from P284,767.9 million as of December 31, 2019 to P306,202.0 million as of
December 31, 2020 driven by increased volume of demand and savings deposit, partially offset by decrease in time deposits.
Bills and acceptances payable dropped by 88.5% or P27,381.0 million from P30,949.8 million as of December 31, 2019 to P3,568.8
million as of December 31, 2020 mainly from reduced volume of interbank borrowings and repo borrowings.
Accounts payable, accrued expenses and other liabilities decreased by 11.6% or P4,679.4 million from P40,456.5 million as of
December 31, 2019 to P35,777.1 million as of December 31, 2020 due to lower level of payables to contractors and suppliers.
Contract liabilities increased by 7.4% or P255.2 million from P3,468.2 million as of December 31, 2019 to P3,723.5 million as of
December 31, 2020 attributable to the increased contracts with buyers where realized real estate sales was lower than collections as a
result of lower incremental percentage-of-completion due to suspension of construction activities during quarantine periods.
Long-term and short-term debt went up by 4.6% or P5.970.9 million from P130,221.3 million as of December 31, 2019 to P136,192.2
million as of December 31, 2020 primarily due to additional bank loans availed, offset by principal amortizations and repayments during
the period.
Income tax payable decreased by 44.5% or P401.1 million from P901.8 million as of December 31, 2019 to P500.6 million as of
December 31, 2020 mainly on account of lower taxable income.
Retirement liabilities increased by 49.4% or P562.9 million from P1,139.7 million as of December 31, 2019 to P1,702.6 million as of
December 31, 2020 primarily due to actuarial valuation adjustment of retirement obligation.
Lease liabilities went up by 6.9% or P471.9 million from P6,885.2 million as of December 31, 2019 to P7,357.1 million as of
December 31, 2020 which resulted from EW’s contract renewals.
Deferred tax liabilities was slightly higher by 1.5% or P169.8 million from P11,214.6 million as of December 31, 2019 to P11,384.4
million as of December 31, 2020.
Equity
On June 22, 2020, FDC’s Board of Directors (BOD) approved the declaration and payment of cash dividends of
P=1,196.9 million or P=0.1384 per share for every common share of record as of July 22, 2020. This was paid on August 17, 2020.
On April 26, 2019, the Parent Company’s BOD approved the declaration and payment of cash dividends of P=864.8
million or P=0.10 per share for every common share of record as of May 26, 2019. This was paid on June 19, 2019.
On May 4, 2018, the Parent Company’s BOD approved the declaration and payment of cash dividends of P=661.6
million or P=0.0765 per share for every common shares of record as of June 3, 2018. This was paid on June 28, 2018.
The Group has commitments for capital expenditures for the project developments of the real estate segment, the requirement of the
sugar manufacturing subsidiaries, the development and construction of solar rooftop facilities and other utility projects, the intended
construction and management of various hotels, and the bank’s expansion and implementation of IT projects, which could be adequately
covered by the operating cash flow and availment of medium and long term loans.
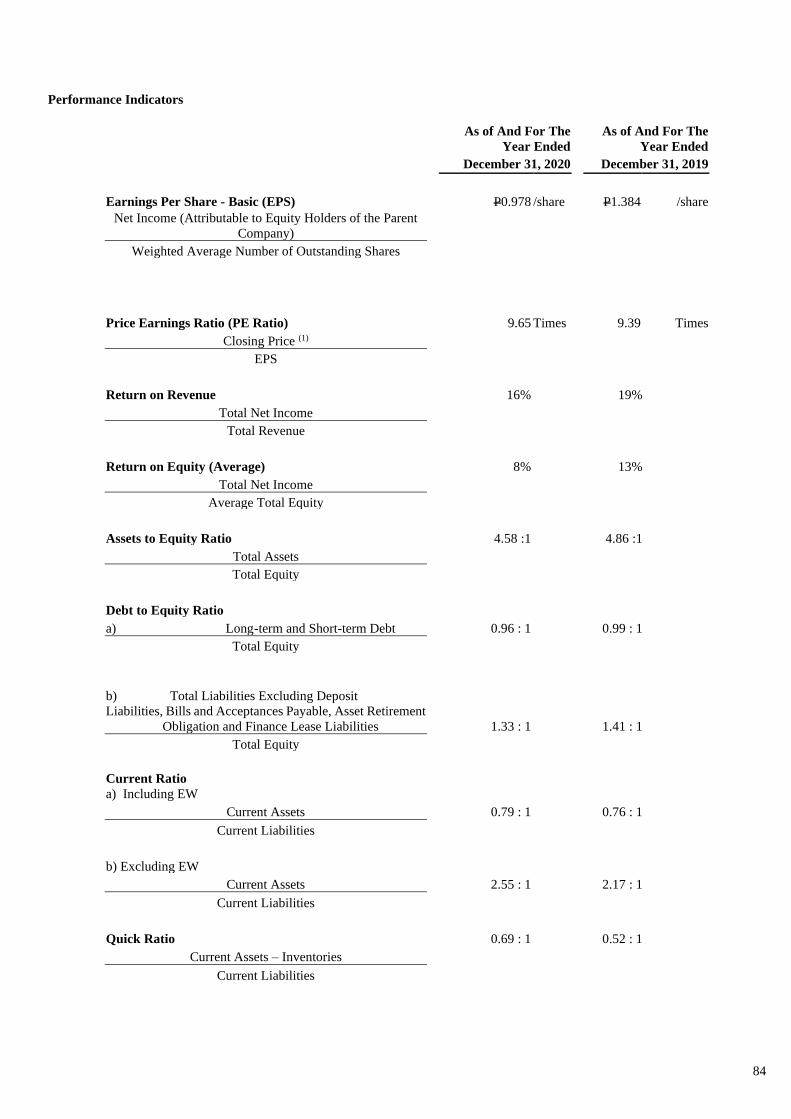
84
Performance Indicators
As of And For The
Year Ended
As of And For The
Year Ended
December 31, 2020 December 31, 2019
Earnings Per Share - Basic (EPS) P0.978 /share P1.384 /share
Net Income (Attributable to Equity Holders of the Parent
Company)
Weighted Average Number of Outstanding Shares
Price Earnings Ratio (PE Ratio) 9.65 Times 9.39 Times
Closing Price (1)
EPS
Return on Revenue 16% 19%
Total Net Income
Total Revenue
Return on Equity (Average) 8% 13%
Total Net Income
Average Total Equity
Assets to Equity Ratio 4.58 :1 4.86 :1
Total Assets
Total Equity
Debt to Equity Ratio
a) Long-term and Short-term Debt 0.96 : 1 0.99 : 1
Total Equity
b) Total Liabilities Excluding Deposit
Liabilities, Bills and Acceptances Payable, Asset Retirement
Obligation and Finance Lease Liabilities 1.33 : 1 1.41 : 1
Total Equity
Current Ratio
a) Including EW
Current Assets 0.79 : 1 0.76 : 1
Current Liabilities
b) Excluding EW
Current Assets 2.55 : 1 2.17 : 1
Current Liabilities
Quick Ratio 0.69 : 1 0.52 : 1
Current Assets – Inventories
Current Liabilities

85
As of And For The
Year Ended
As of And For The
Year Ended
December 31, 2020 December 31, 2019
Earnings Before Interest, Taxes, Depreciation and
Amortization (EBITDA) to Total Interest Expense 4.36 Times 6.98 Times
EBITDA
Total Interest Expense (2) (1) Closing prices at December 29, 2020 and December 27, 2019.
(2) Excluding financial liabilities on lease contract
Notes to Financial Statements and Other Disclosures
1. The attached consolidated financial statements are prepared in compliance with PFRS. The accounting policies and methods of
computation followed in the financial statements for the year ended December 31, 2020 are the same as those followed in the annual
financial statements of the Company for the year ended December 31, 2019.
2. Except for the sugar business, the operating activities of the Company are carried out uniformly over the calendar year. The sugar
milling season of the Company’s sugar subsidiaries is usually from November to June of the following year. Except for this milling
season, there are no other unusual operating cycles or seasons during the year.
3. Except as disclosed in the Management’s Discussion and Analysis of Financial Condition and Results of Operation, there are no
unusual items affecting assets, liabilities, equity, net income or cash flows for the current period. There are no known trends,
demands, commitments, events or uncertainties that will have a material impact on the Company’s liquidity.
4. There are no changes in estimates of amounts reported in the previous period that have material effects in the current period.
5. Except for those discussed in the Management’s Discussion and Analysis of Financial Condition and Results of Operations, there
are no issuances, repurchases and repayments of debt and equity securities.
6. There were no other dividends paid (aggregate or per share) separately for ordinary shares and other shares during the current
period, except as discussed in the previous sections.
7. The Company derives its revenues from the following reportable segments:
Real Estate Operations
This involves acquisition of land, planning and development of large-scale fully integrated residential communities as well as the
development and sale of residential lots, housing units, medium-rise residential buildings, farm estates, industrial parks, residential
resort projects, a private membership club and condominium buildings. This segment also involves operations and management of
cinema and mall, property management and leasing of commercial and office spaces.
Hospitality Operations
This involves operation of hotels, including management of resorts, villas, golf course, service apartment and other services for the
pleasure, comfort and convenience of guests in said establishments under its management.
Banking and Financial Services
This involves a wide range of financial services to consumer and corporate clients which includes deposit-taking, loan and trade
finance, treasury, trust services, credit cards, cash management, custodial services, insurance services and leasing and finance. The
business units in this segment consist of retail banking, corporate banking, consumer banking, and treasury and trust.
Power Operations
This involves the establishment, construction, operation of power plants and supply of power to offtakers and also includes
management of power plants’ output under the IPPA contracts.
Sugar Operations
This involves operation of agricultural lands for planting and cultivating farm products, operation of a complete sugar central for
the purpose of milling or converting sugar canes to centrifugal or refined sugar and selling of sugar and by-products.
Other Operations
This involves other operations of the Parent Company including CWSI, CTI and FDCI. FDCI was incorporated to facilitate the
Group’s issuance of foreign currency-denominated bonds while CWSI was incorporated to provide maintenance, operation,
management and rehabilitation of waterworks sewerage and sanitation system and services specifically for the distribution, supply
and sale of potable water to domestic, commercial and industrial. CTI is engaged in providing computer and information technology

86
services including, but not limited to, general consulting, improvement systems planning, network integration, business re-
engineering services, systems integration and system development.
Financial information on the operations of these business segments as of and for the years ended December 31, 2020 and 2019 are
summarized and included in the accompanying Notes to Consolidated Financial Statements.
8. Except as discussed in the Management’s Discussion and Analysis of Financial Condition and Results of Operations, there are no
material events subsequent to December 31, 2020 up to the date of this report that have not been reflected in the financial statements
for the current period.
9. There have been no changes in the composition of the Company during the current period, such as business combination, acquisition
or disposal of subsidiaries and long-term investments, restructurings and discontinuing operations, except as discussed in the
Developments of the Company and Management’s Discussion on its Results of Operations.
10. There are no changes in contingent liabilities or contingent assets since December 31, 2020.
11. There are no material contingencies and any other events or transactions affecting the current period.
12. There are no known events that will trigger direct or contingent financial obligation that is material to the Company, including any
default or acceleration of an obligation.
13. There are no known material off-balance sheet transactions, arrangements, obligations including contingent liabilities, and other
relationships of the Company, with unconsolidated entities or other persons created during the reporting period.
14. There are no significant elements of income or loss, except as discussed in the Management’s Discussion on the Results of
Operations that did not arise from the Company’s continuing operations.
15. There are no known seasonal aspects that had a material effect on the financial condition or results of operations.
16. Aside from the possible material increase in interest rates on the outstanding floating – rate term loans, there are no known trends,
events or uncertainties or any material commitments that may result to any cash flow or liquidity problems of the Group within the
next 12 months. The Group is not in default or breach of any note, loan, lease or other indebtedness or financing arrangements
requiring it to make payments or any significant amount in its accounts payable that have not been paid within the stated terms.
17. On known trends, events, or uncertainties that have had or are reasonably expected to have favorable or unfavorable impact on net
sales or revenues or income from continuing operations, the Company considers the following:
COVID-19 Pandemic
In a move to contain the COVID-19 pandemic in the Philippines, on March 13, 2020, the Office of the President of the Philippines
issued a Memorandum directive to impose stringent social distancing measures in the National Capital Region (NCR) effective
March 15, 2020. On March 16, 2020, Presidential Proclamation No. 929 was issued, declaring a State of Calamity throughout the
Philippines for a period of six (6) months and imposed an ECQ throughout the island of Luzon until April 12, 2020, which was
subsequently extended to April 30, 2020 and further extended to May 15, 2020. The ECQ shifted to modified enhanced community
quarantine (MECQ) until May 31, 2020 and to general community quarantine (GCQ) for NCR and certain provinces until the first
part of the third quarter. Subsequently, MECQ was once again imposed on select areas including Metro Manila and a few other
provinces in the National Capital Region from August 4 to 18, 2020 then back again to GCQ until December 31, 2020. On January
1, 2021, the Office of the President issued a Memorandum from the Executive Secretary placing the NCR and other highly urbanized
cities and independence component cities under GCQ and MGCQ until January 31, 2021, which was further extended until February
28, 2021 and March 31, 2021 for certain parts of the country, including the NCR.
The Group continues to abide by and comply with all rules and regulations issued by the government in relation to the COVID-19
pandemic. In line with applicable rules and regulations, the said risks are mitigated by business continuity strategies set in place by
the Group. Measures currently undertaken by the Group to mitigate the risks of COVID-19 pandemic on its operations include
workfrom-home arrangements, proper and frequent sanitation of office premises, cancellation of large group meetings in person,
an internal ban on foreign business travel, and the practice of social distancing through remote communication, among others.
The quarantine restrictions and recent social distancing guidelines limit the operations of malls and construction completion.
Despite the challenges, the Group prioritized easing the burden of its customers by providing payment grace periods or rental relief.
Past efforts in process improvement and digitalization allowed the company to operate efficiently and effectively to continue to
serve customers.

87
Year Ended December 31, 2019 Compared With Year Ended December 31, 2018
Revenues
Real Estate Operations
Sale of Lots, Condominium and Residential Units
Sale of lots, condominium and residential units grew by 5.4% or P1,090.7 million from P20,362.8 million in 2018 to P21,453.5 million
in 2019 mainly due to FLI’s increase in real estate sales attributed to higher percentage of completion for medium-rise and high-rise
buildings (or MRBs and HRBs), and higher completion of downpayments from 2018 sales.
Mall and Rental Revenues
Mall and rental revenues surged by 20.9% to P7,464.3 million in 2019 from P6,174.4 million in 2018 ascribed to the increase in lease
portfolio of office and retail buildings. Filinvest Axis Tower 2, located in Northgate Cyberzone Alabang, was completed in 2019 adding
39,341 square meters of GLA to the office portfolio. FLI now operates 31 buildings totaling 523,902 square meters. For retail , FLI has
243,215 square meters GLA in the retail portfolio in 2019 from 242,127 square meters in 2018.
Hospitality Operations
Hospitality Revenues
Hospitality revenues bagged a 24.2% growth from P2,665.5 million in 2018 to P3,311.2 million in 2019 mainly due to the full year
operation of Crimson Resort and Spa Boracay (Crimson Boracay) in 2019 and start of operations of Quest Tagaytay in April 2019. In
addition, there was an increase in average room rates and occupancy from other operating hotel properties, consequently the food and
beverage revenues also increased.
Banking and Financial Services
Net Interest Income
Banking and Financial Services Interest Income
The banking and financial services’ interest income rose by 22.5% or P5,344.5 million from P23,794.5 million in 2018 to
P29,139.0 million in 2019 on account of increase in lending activities, largely driven by growth in loans and investment securities.
Costs of Banking and Financial Services
Costs of banking and financial services went up by 65.3% or P3,129.9 million from P4,794.0 million in 2018 to P7,923.8 million in
2019, which primarily resulted from increasing interest rates and growth in high-cost deposits and other borrowings amidst a tight
liquidity environment during the first half of 2019.
Net Interest Income
Net interest income surged by 11.7% from P19,000.5 million in 2018 to P21,215.2 million in 2019 due to the growth in interest income
driven by higher asset base, coupled with improvement in margins.
Power Operations
Power Revenues
Power revenues jumped 17.2% or by P1,482.6 million from P8,630.5 million in 2018 to P10,113.1 million in 2019 mainly on account
of 24% improvement in energy sold.
Sugar Operations
Sugar Sales
Sugar operations’ revenues increased by 2.5% or P80.7 million from P3,287.2 million in 2018 to P3,367.9 million in 2019 attributed
mainly to higher sales volumes and improved sugar prices.
Other Income
Other Income — Real Estate Operations
Other income from real estate operations reduced by 4.2% or P93.4 million from P2,236.8 million in 2018 to P2,143.4 million in 2019
driven by the lower interest income derived from contract receivables as more buyers opt to avail of bank financing schemes instead of
in-house payment schemes.
88
Other Income — Hospitality Operations
Other income from hospitality operations increased by 23.9% or P9.5 million from P39.8 million in 2018 to P49.4 million in 2019 on
account of higher share in net income of a joint venture.
Other Income — Banking and Financial Services
Other income from banking and financial services showed a growth of 16.2% or P1,006.1 million from P6,212.4 million in 2018 to
P7,218.5 million in 2019 primarily due to higher securities trading gain and increase in fees and commissions driven by the growth in
consumer lending.
Other Income – Power Operations
Other income from power operations declined by 96.0% or P633.2 million from P659.3 million in 2018 to P26.1 million in 2019 on
account of the one-off income in 2018 from liquidated damages claimed against the power plant contractor for the delayed completion
of the power plant.
Other Income — Sugar Operations
Other income from sugar operations decreased by 65.2% or P58.2 million from P89.2 million in 2018 to P31.1 million in 2019 due to
lower income earned from conversion rights.
Costs
Costs of Sale of Lots, Condominium and Residential Units
Costs of sale of lots, condominium and residential units went up by 12.1% or P1,248.3 million from P10,321.9 million in 2018 to
P11,570.2 million in 2019, in line with the higher real estate sales booked during the year.
Costs of Mall and Rental Services
Costs of mall and rental services increased by 19.0% or P167.5 million from P880.6 million in 2018 to P1,048.1 million in 2019 on
account of higher depreciation which came from newly completed buildings and from buildings delivered in 2018 which registered full
year depreciation in 2019.
Costs of Hospitality Operations
The Group’s costs of hospitality operations increased by 23.0% or P310.0 million from P1,345.2 million in 2018 to P1,655.3 million in
2019 mainly due to the full year operation of Crimson Boracay and start of operations of Quest Tagaytay in 2019. The increase was also
contributed by higher business volume across the Group’s hotel properties at the back of higher occupancy.
Costs of Banking and Financial Services
Costs of banking and financial services was accounted for under net interest income in the “Revenues”.
Costs of Power Operations
Costs of power operations increased by 10.3% or P486.9 million from P4,733.7 million in 2018 to P5,220.6 million in 2019 primarily
on account of the 24% increase in energy sold.
Costs of Sugar Sales
Cost of sugar operations increased by 2.0% or P55.1 million from P2,768.3 million in 2018 to P2,823.5 million in 2019 related to higher
sales volume.
Costs of Other Operations
Costs of other operations increased by 11.9% or P76.1 million from P640.0 million in 2018 to P716.2 million in 2019 due to translation
adjustment of interest on foreign-currency denominated bonds payable.
Expenses
Real Estate Operations
Expenses of real estate operations increased by 19.0% from P6,153.3 million in 2018 to P7,320.2 million in 2019 due to higher
depreciation of property, plant and equipment, repairs and maintenance, insurance, and selling and marketing expenses particularly
brokers’ commissions and service fees.
Hospitality Operations
Expenses of hospitality operations increased by 31.2% or P290.5 million from P929.8 million in 2018 to P1,220.3 million in 2019
mainly due to the full year operation of Crimson Boracay and start of operations of Quest Tagaytay in 2019. The increase was also
attributed by higher operating costs such as manpower, utilities, depreciation and interest expense.

89
Banking and Financial Services
Expenses of banking and financial services went up by 5.8% from P19,521.0 million in 2018 to P20,657.4 million in 2019 due to increase
in compensation related expenses and higher cost of doing business including gross receipts tax, documentary stamp taxes and intensified
marketing acquisition campaigns to generate more loan and l retail deposits.
Power Operations
The expenses of power operations decreased by 2.9% or P72.7 million from P2,537.7 million in 2018 to P2,465.0 million in 2019 as a
result of adoption of the new accounting standard on leases, PFRS 16, effective January 1, 2019, which led to recognition of amortization
of right-of-use assets that was lower than the rent expense booked under the old accounting standard on leases (PAS 17) applied in
previous year.
Sugar Operations
Expenses of sugar operations decreased by 32.9% from P346.4 million in 2018 to P232.2 million in 2019 attributed to previous year’s
higher booked provision for impairment losses on certain sugar refinery assets and provision for probable losses on contingencies.
Others
Expenses of other operations decreased by 7.4% or P95.2 million from last year’s P1,292.6 million to P1,197.4 million in 2019 due to
prior year’s booking of provision for probable losses on contingencies offset by 2019’s share in net loss of an associate.
Provision for Income Tax
Provision for income tax decreased by 1.6% or P69.8 million from P4,454.7 million in 2018 to P4,384.9 million in 2019. Provision for
current income tax increased by 13.3% or P520.9 million attributed to higher taxable income of the banking and financial services as a
result of increased revenues. Provision for deferred income tax decreased by 108.0% or P590.7 million due mainly to temporary
differences between financial and taxable income arising from recognition of finance lease under the new accounting standard.
Net Income
As a result of the foregoing, consolidated net income increased by 18.2% or P2,449.1 million from P13,433.2 million in 2018 to
P15,882.3 million in 2019. Net income attributable to equity holders of the Parent Company increased by 22.5% or P2,201.6 million
from P9,768.7 million in 2018 to P11,970.3 million in 2018 while net income attributable to noncontrolling interest amounted from
P3,664.5 million in 2018 to P3,912.0 million in 2019.
FINANCIAL CONDITION
As at December 31, 2019 Compared with As at December 31, 2018
Assets
Total consolidated assets grew by 8.9% or P52,365.9 million from P589,789.0 million as of December 31, 2018 to P642,154.9 million
as of December 31, 2019. The movements in asset accounts were accounted as follows:
Cash and cash equivalents decreased by 23.5% or P16,025.1 million from P68,121.3 million to P52,096.2 million attributable to EW’s
lower cash level as more funds were placed in higher-yielding liquid assets and due to lower reserve on outstanding deposits as required
by the BSP.
Loans and receivables of the real estate operations increased by 20.2% from P4,261.3 million to P5,124.1 million, and contract assets
grew by 29.6% or P3,392.8 million from P11,455.4 million to P14,848.2 million, due to higher revenue for the year and higher mix of
cash sales.
Loans and receivables of the hospitality operations increased by 8.6% or P16.8 million from P196.6 million to P213.5 million attributed
to Crimson Boracay and Quest Tagaytay.
Loans and receivables of the banking and financial services grew by 9.8% or P22,576.0 million from P231,530.9 million to
P254,106.9 million principally driven by the increase in EW’s consumer loans across all segments of auto, credit cards, mortgage and
personal loans.
Loans and receivables of the power operations increased by 11.1% from P1,841.5 million to P2,045.0 million at the back of higher
power revenues.
Loans and receivables of the sugar operations decreased by 8.3% from P117.9 million to P108.1 million on account of higher allowance
for expected credit losses.
90
Financial assets at FVPL rose from P4,338.8 million to P16,840.7 million or by 288.1% or P12,501.9 million due to movements in the
Bank’s proprietary trading portfolio.
Financial assets at FVOCI amounting to P5,323.7 million as of December 31, 2019 posted an increase of more than 7 times the
P750.3 million balance in year-end of 2018 on account of movements in the Bank’s proprietary trading portfolio.
Investment securities at amortized cost showed a 35.3% increase from P36,510.5 million to P49,386.1 million in line with the Bank’s
strategic direction of improving liquidity profile and accrual income.
Real estate inventories decreased by 10.2% from P79,469.9 million to P71,363.5 million due to the reclassification of some portion of
land and land development costs related to the land located in Mandaluyong City and Cebu to investment property, pursuant to its current
plan for the project which are intended to be for leasing.
Coal, spare parts and other inventories increased by 1.4% or P9.8 million from P=700.6 million to P=710.3 million principally due to
higher level of spare parts and fuel inventories driven by the increased inputs needed by the power operations.
Investment properties increased by 19.4% or P=13,439.1 million from P=69,132.5 to P=82,571.6 million due the additional construction
costs of new buildings for office and commercial lease amounting to P=8.2 billion. These are primarily located in Northgate Cyberzone
in Alabang, Filinvest Mimosa, Makati City, Quezon City and Ortigas City.
Property, plant and equipment decreased by 2.9% or P=1,267.4 million from P=44,422.9 million to P=43,155.5 million mainly due to
depreciation, offset by acquisitions during the year.
Investments in joint ventures and associate grew by 36.9% or P270.7 million from P734.6 million to P1,005.3 million due to capital
infusion into the joint venture and into an associate, offset by the take-up of proportionate share in net loss.
Deferred tax assets increased by 25.2% or P654.7 million from P2,600.8 million to P3,255.4 million on account of EW’s provision set-
up, net of write-off during the period.
Right-of-use assets amounting to P6,994.5 million as of December 31, 2019 resulted from the adoption of PFRS 16 which became
effective January 1, 2019.
Other assets decreased by 2.6% or P597.1 million from P23,222.1 million to P22,625.0 million due to lower level of advances to
contractors and suppliers and derivative assets.
Liabilities
Total consolidated liabilities as at December 31, 2019 amounted to P510,004.9 million, 8.5% higher than P470,098.5 million balance
as at December 31, 2018. Changes in account balances were as follows:
Deposit liabilities increased by 6.7% or P17,841.8 million from P266,926.1 million to P284,767.9 million primarily due to higher level
of bank deposits pertaining to current and savings accounts (or CASA).
Bills and acceptances payable was higher by 72.2% or P12,979.8 million from P17,969.9 million to P30,949.8 million mainly from
higher volume of interbank borrowings.
Accounts payable, accrued expenses and other liabilities went up by 1.8% or P700.5 million from P39,756.0 million to P40,456.5 million
due to increase in payables to contractors and suppliers for the construction activities.
Contract liabilities decreased by 39.1% or P2,222.5 million from P5,690.7 million to P3,468.2 million mainly due to the higher contracts
with buyers that qualified for revenue recognition for the year consistent with the higher real estate sales.
Long-term debt increased by 2.3% or P2,873.7 million from P127,347.5 million to P130,221.3 million on account of newly availed bank
loans, offset by payments and amortizations.
Income tax payable was higher by 48.7% or P295.3 million from P606.5 million to P901.8 million due to higher taxable income of the
banking and financial services.
Retirement liabilities increased from P1,117.1 million to P1,139.7 million as a result of higher net defined benefit obligation from the
actuarial valuation conducted by independent actuaries.
Lease liabilities of P6,885.2 million as of December 31, 2019 resulted from the adoption of PFRS 16 which became effective
January 1, 2019.

91
Deferred tax liabilities increased by 5.0% or P529.9 million from P10,684.7 million to P11,214.6 million attributed to the increased
excess of real estate revenue based on financial accounting policy over real estate revenue based on tax rules.
Equity
On April 26, 2019, the Parent Company’s BOD approved the declaration and payment of cash dividends of P=864.8 million or
P=0.10 per share for every common share of record as of May 26, 2019. This was paid on June 19, 2019.
On May 4, 2018, the Parent Company’s BOD approved the declaration and payment of cash dividends of P=661.6 million or
P=0.0765 per share for every common shares of record as of June 3, 2018. This was paid on June 28, 2018.
On April 28, 2017, the Parent Company’s BOD approved the declaration and payment of cash dividends of P=549.7 million or
P=0.059 per share for every common shares of record as of May 28, 2017. This was paid on June 21, 2017.
The Group has commitments for capital expenditures for the project developments of the real estate segment, the requirement of the
sugar manufacturing subsidiaries, the development and construction of solar rooftop facilities and other utility projects, the intended
construction and management of various hotels, and the bank’s expansion and implementation of IT projects, which could be adequately
covered by the operating cash flow and availment of medium and long term loans.
Performance Indicators
As of And For The
Year Ended
As of And For The
Year Ended
December 31, 2019 December 31, 2018
Earnings Per Share - Basic (EPS) P1.384 /share P1.130 /share
Net Income (Attributable to Equity Holders of the Parent
Company)
Weighted Average Number of Outstanding Shares
Price Earnings Ratio (PE Ratio) 9.39 Times 10.46 Times
Closing Price (1)
EPS
Return on Revenue 19% 18%
Total Net Income
Total Revenue
Return on Equity (Average) 13% 12%
Total Net Income
Average Total Equity
Assets to Equity Ratio 4.86 :1 4.93 : 1
Total Assets
Total Equity
Debt to Equity Ratio
a) Long-term Debt 0.99 : 1 1.06 : 1
Total Equity
b) Total Liabilities Excluding Deposit
Liabilities, Bills and Acceptances Payable, Asset Retirement
Obligation and Finance Lease Liabilities 1.41 : 1 1.54 : 1
Total Equity

92
As of And For The
Year Ended
As of And For The
Year Ended
December 31, 2019 December 31, 2018
Current Ratio
a) Including EW
Current Assets 0.76 : 1 0.97 : 1
Current Liabilities
b) Excluding EW
Current Assets 2.17 : 1 3.19 : 1
Current Liabilities
Quick Ratio 0.52 : 1 0.78 : 1
Current Assets – Inventories
Current Liabilities
Earnings Before Interest, Taxes, Depreciation and
Amortization (EBITDA) to Total Interest Expense 6.98 Times 6.94 Times
EBITDA
Total Interest Expense (2) (1) Closing prices at December 27, 2019 and December 28, 2018.
(2) Excluding accretion expense on liability on IPPA contract and financial liability on lease contract
Notes to Financial Statements and Other Disclosures
1. The attached consolidated financial statements are prepared in compliance with PFRS. The accounting policies and methods of
computation followed in the financial statements for the year ended December 31, 2019 are the same as those followed in the annual
financial statements of the Company for the year ended December 31, 2018.
2. Except for the sugar business, the operating activities of the Company are carried out uniformly over the calendar year. The sugar
milling season of the Company’s sugar subsidiaries is usually from November to June of the following year. Except for this milling
season, there are no other unusual operating cycles or seasons during the year.
3. Except as disclosed in the Management’s Discussion and Analysis of Financial Condition and Results of Operation, there are no
unusual items affecting assets, liabilities, equity, net income or cash flows for the current period. There are no known trends,
demands, commitments, events or uncertainties that will have a material impact on the Company’s liquidity.
4. There are no changes in estimates of amounts reported in the previous period that have material effects in the current period.
5. Except for those discussed in the Management’s Discussion and Analysis of Financial Condition and Results of Operations, there
are no issuances, repurchases and repayments of debt and equity securities.
6. There were no other dividends paid (aggregate or per share) separately for ordinary shares and other shares during the current
period, except as discussed in the previous sections.
7. The Company derives its revenues from the following reportable segments:
Real Estate Operations
This involves acquisition of land, planning and development of large-scale fully integrated residential communities as well as the
development and sale of residential lots, housing units, medium-rise residential buildings, farm estates, industrial parks, residential
resort projects, a private membership club and condominium buildings. This segment also involves operations and management of
cinema and mall, property management and leasing of commercial and office spaces.
Hospitality Operations
This involves operation of hotels, including management of resorts, villas, golf course, service apartment and other services for the
pleasure, comfort and convenience of guests in said establishments under its management.

93
Banking and Financial Services
This involves a wide range of financial services to consumer and corporate clients which includes deposit-taking, loan and trade
finance, treasury, trust services, credit cards, cash management, custodial services, insurance services and leasing and finance. The
business units in this segment consist of retail banking, corporate banking, consumer banking, and treasury and trust.
Power Operations
This involves the establishment, construction, operation of power plants and supply of power to offtakers and also includes
management of power plants’ output under the IPPA contracts.
Sugar Operations
This involves operation of agricultural lands for planting and cultivating farm products, operation of a complete sugar central for
the purpose of milling or converting sugar canes to centrifugal or refined sugar and selling of sugar and by-products.
Other Operations
This involves other operations of the Parent Company including CWSI, CTI and FDCI. FDCI was incorporated to facilitate the
Group’s issuance of foreign currency-denominated bonds while CWSI was incorporated to provide maintenance, operation,
management and rehabilitation of waterworks sewerage and sanitation system and services specifically for the distribution, supply
and sale of potable water to domestic, commercial and industrial. CTI is engaged in providing computer and information technology
services including, but not limited to, general consulting, improvement systems planning, network integration, business re-
engineering services, systems integration and system development.
Financial information on the operations of these business segments as of and for the years ended December 31, 2019 and 2018 are
summarized and included in the accompanying Notes to Consolidated Financial Statements.
8. Except as discussed in the Management’s Discussion and Analysis of Financial Condition and Results of Operations, there are no
material events subsequent to December 31, 2019 up to the date of this report that have not been reflected in the financial statements
for the current period.
9. There have been no changes in the composition of the Company during the current period, such as business combination, acquisition
or disposal of subsidiaries and long-term investments, restructurings and discontinuing operations, except as discussed in the
Developments of the Company and Management’s Discussion on its Results of Operations.
10. There are no changes in contingent liabilities or contingent assets since December 31, 2019.
11. There are no material contingencies and any other events or transactions affecting the current period.
12. There are no known events that will trigger direct or contingent financial obligation that is material to the Company, including any
default or acceleration of an obligation.
13. There are no known material off-balance sheet transactions, arrangements, obligations including contingent liabilities, and other
relationships of the Company, with unconsolidated entities or other persons created during the reporting period.
14. There are no significant elements of income or loss, except as discussed in the Management’s Discussion on the Results of
Operations that did not arise from the Company’s continuing operations.
15. There are no known seasonal aspects that had a material effect on the financial condition or results of operations.
16. Aside from the possible material increase in interest rates on the outstanding floating – rate term loans, there are no known trends,
events or uncertainties or any material commitments that may result to any cash flow or liquidity problems of the Group within the
next 12 months. The Group is not in default or breach of any note, loan, lease or other indebtedness or financing arrangements
requiring it to make payments or any significant amount in its accounts payable that have not been paid within the stated terms.
17. On known trends, events, or uncertainties that have had or are reasonably expected to have favorable or unfavorable impact on net
sales or revenues or income from continuing operations, the Company considers the following:
Outlook for 2020 Amidst the COVID-19 Pandemic
As of this writing, the world continues to go through the biggest crisis of our generation brought about by the COVID-19 pandemic.
In a move to contain the COVID-19 pandemic in the Philippines, on March 13, 2020, the Office of the President of the Philippines
issued a Memorandum directive to impose stringent social distancing measures in the National Capital Region effective March 15,
2020. On March 16, 2020, the government expanded the scope by placing the entire Luzon region under an enhanced community
quarantine (ECQ), with major cities in Visayas and Mindanao shortly following suit. On March 24, 2020, Republic Act No. 11469
was enacted declaring the existence of a national emergency arising from the COVID-19 situation and a national policy effectively
authorizing the Philippine President, for a limited period and subject to restrictions, to exercise powers necessary and proper to

94
carry out the declared national policy and for other purposes. On April 1, 2020, the Implementing Rules and Regulations (IRR) of
Section 4(aa) of Republic Act No. 11469, otherwise known as the “Bayanihan to Heal As One Act”, was released. On April 7, 2020,
the Philippine President announced that the ECQ throughout the island of Luzon has been extended up to April 30, 2020. On April
24, 2020, the Philippine President extended the ECQ in Metro Manila, Central Luzon, CALABARZON and other selected high-
risk areas until May 15, 2020. The President also placed some areas in the Visayas and Mindanao under ECQ but subject to
reassessment, while provinces or areas which are considered moderate- and low-risk in the spread of COVID-19 were placed under
a general community quarantine starting on May 1, 2020. On May 15, 2020, it was announced that Metro Manila, Laguna and Cebu
City will transition from an ECQ to a modified ECQ from May 16 to May 31, 2020 while other parts of the country were placed in
less stringent states of community quarantine.
The government-mandated temporary closure of non-essential shops and businesses are expected to have material effects on the
Group’s overall financial performance in 2020. While the Group cannot ascertain at this time the full impact to its financial position,
performance and cash flows, the Group is cognizant of the following risks brought about by the disruptions:
• The Real Estate segment may face a decline in revenues following the temporary suspension of construction activities of its
residential and commercial properties, and closure of mall operations except for essential business establishments within the
malls such as supermarkets, pharmacies, healthcare centers and banks that remain open for limited operating hours. The
uncertainties may also impact the office leasing business as tenants adopt a work-from-home scheme or other flexible working
arrangements. Additional risks include the possible delays in collection of payments from residential buyers.
• The imposition of travel restrictions and quarantine measures across the globe have immediate negative effects on businesses
especially on tourism and hospitality businesses. As an operator of hotels and resorts across the Philippines, a significant decline
in occupancy rates is expected. Five out of the six hotels and resorts under the Group’s portfolio remain in operation during the
ECQ but on very limited basis to accommodate current business needs. Crimson Boracay however has temporarily ceased
operations while the entire island of Boracay is on lockdown. Quest Tagaytay is currently used as a quarantine facility for
OFWs and other returning overseas Filipinos.
• The Banking segment is running on skeletal force while under ECQ. Nevertheless, it opens as many branches feasible, ensures
cash availability in ATMs and maintains availability of various digital and online products. Following the government’s
mandate, it has provided its customers a 30-day grace period for all loans falling due within the ECQ period. Other possible
measures of forbearance are likewise being evaluated. An extended disruption to business activities may affect East West
Bank’s loan portfolio and asset quality.
• The Company’s 405-megawatt power plant located in Misamis Oriental, Mindanao is fully operational. While relatively less
affected because of its geographic location, it has nonetheless undertaken measures called for under the ECQ program. It has
employed a rotation setup for its work force and implemented various precautionary measures such as strict adherence to
personal hygiene, practices, mandatory temperature checks and social distancing protocols, and proper and frequent sanitation
and deep disinfection of plant premises.
The Group considers the events surrounding the outbreak as non-adjusting subsequent events, which do not impact its financial
position and performance as of and for the year ended December 31, 2019. However, the outbreak could have a material impact
on its 2020 financial results and even periods thereafter. To mitigate the risks of the COVID-19 pandemic on its operations, the
Company has undertaken several measures such as the following:
• It has reviewed its capital expenditure program and adjusted it to reflect the expected slowdown in demand as well as
construction delays of projects.
• It has put in place mitigation measures to ensure the safety of its customers, homeowners, locators and tenants through sanitation
and social distancing practices, and has carried out regular communication through digital means and work-from-home service
desks.
• It has implemented various precautionary measures for a safe workplace such as work- from-home arrangements, strict
adherence to personal hygiene practices, mandatory temperature checks and social distancing protocols, and proper and
frequent sanitation and deep disinfection of premises.
• It has cancelled large group meetings in person and instead utilize technology for remote communication. It will conduct, for
the first time, its annual shareholder’s meeting virtually with online electronic voting.
Amidst the evolving nature of this outbreak, the Company remains committed to abide by and comply with all rules and regulations
issued by the government in relation to the COVID-19 pandemic.
95
RESULTS OF OPERATIONS
Year Ended December 31, 2018 Compared With Year Ended December 31, 2017
Revenues
Real Estate Operations
Sale of Lots, Condominium and Residential Units
Sale of lots, condominium and residential units grew by 18.2% or P3,132.1 million from P17,230.7 million in 2017 to P20,362.8 million
in 2018, at the back of: (a) FAI’s higher sales of commercial lots and condominium units; and (b) FLI’s increased real estate sales from
middle-income projects.
Mall and Rental Revenues
Mall and rental revenues amounted to P6,174.4 million in 2018, an increase of 26.1% or by P1,277.2 million from P4,897.2 million in
2017. Filinvest Axis Tower 1, located in Northgate Cyberzone Alabang; Filinvest Cyberzone Cebu Tower 2, located in Salinas, Cebu;
and Filinvest Cyberzone Mimosa Building 1, located in Mimosa Clark, have been completed adding 76,046 square meters (sq.m) of
gross leasable area (GLA) to the office portfolio. FLI now operates 27 buildings totaling 457,970 sq.m. of GLA. For retail, FLI now has
242,127 sq.m. GLA to the retail portfolio.
Hospitality Operations
Hospitality Revenues
Hospitality revenues amounted to P2,665.5 million, a jump of 22.6% or an increase of P491.0 million from the P2,174.5 million revenues
reported in 2017. This was on account of higher room and occupancy rates, increased golf revenues, and the commencement of
operations of Crimson Resort and Spa Boracay (Crimson Boracay) in November 2018.
Banking and Financial Services
Net Interest Income
Banking and Financial Services Interest Income
The banking and financial services’ interest income surged by 10.7% or P2,299.8 million from P21,494.7 million in 2017 to
P23,794.5 million in 2018 primarily due to the higher volume of EW’s loans and receivables particularly in consumer loans, with growth
across EW’s auto, credit card and personal loans.
Costs of Banking and Financial Services
Costs of banking and financial services increased by 43.2% or P1,447.3 million from P3,346.7 million in 2017 to P4,794.0 million in
2018 mainly due to the effect of higher deposit rates and increased volume of high-cost time deposit liabilities, which comprised almost
half of the Bank’s total deposit liabilities as of December 31, 2018.
Net Interest Income
Net interest income increased by 4.7% from P18,148.0 million in 2017 to P19,000.5 million in 2018 due to the continued growth in
EW’s consumer portfolio, offsetting the impact of higher volume of high-cost time deposits.
Power Operations
Power Revenues
Power revenues decreased by 13.2% or P1,312.0 million from P9,942.5 million in 2017 to P8,630.5 million in 2018. The revenues
reported in previous year included the revenue contribution from Independent Power Producer Administrator (IPPA) contracts which
were terminated in the last quarter of 2017. Excluding the contributions from IPPA contracts in 2017, power revenues increased by
27.2% from P6,724.0 million to P8,555.0 million due to increased energy sales.
Sugar Operations
Sugar Sales
The Group’s sugar sales increased by 14.3% or P305.7 million from P2,143.0 million in 2017 to P2,448.7 million in 2018 on account
of higher sales volumes and improved sugar prices.

96
Other Income
Other Income — Real Estate Operations
Other income from real estate operations decreased by 8.2% to P2,236.8 million in 2018 from P2,437.5 million in 2017 due to lower
interest income derived from contracts receivable.
Other Income — Hospitality Operations
Other income from hospitality operations increased by 24.7% or P7.9 million to P39.8 million in 2018 from P31.9 million in 2017
mainly due to higher share in net income of a joint venture.
Other Income — Banking and Financial Services
The Group’s other income from banking and financial services decreased by 13.7% or P985.3 million from P7,197.7 million in 2017 to
P6,212.4 million in 2018. This was primarily on account of EWRB’s reduced service charges and fees earned from teachers’ loan , as a
result of the suspension by the Department of Education (DepEd) of the automatic payroll deduction arrangement starting in November
2017. In June 2018, EWRB signed the new Memorandum of Agreement with DepEd and has resumed providing new loans to public
school teachers.
Other Income – Power Operations
Other income from power operations increased by P650.2 million from P9.1 million in 2017 to P659.3 million in 2018 mainly due to
compensation received from the power plant contractor amounting P650.0 million for lost revenues due to the delay in the completion
of the power plant.
Other Income — Sugar Operations
Other income from sugar operations of P89.2 million was an increase of almost thrice as much as the reported P31.5 million other
income in 2017 due to conversion rights income.
Costs
Costs of Sale of Lots, Condominium and Residential Units
Costs of sale of lots, condominium and residential units increased by 12.9% or P1,179.2 million from P9,142.7 million to
P10,321.9 million primarily due to increase in the amount of real estate sales booked during the current period. The said increase in
costs of sales was lower than the 18.2% increase in the Group’s sale of lots, condominium and residential units due to a greater proportion
of FAI’s sale of commercial lots with relatively higher gross profit margin.
Costs of Mall and Rental Services
Costs of mall and rental services increased by 5.6% or P46.4 million from P834.2 million in 2017 to P880.6 million in 2018 mainly due
to depreciation of new buildings for lease that commenced operations in 2018, as mentioned above.
Costs of Hospitality Operations
The Group’s costs of hospitality operations increased by 24.9% or P268.4 million from P1,076.8 million in 2017 to P1,345.2 million in
2018, driven by higher manpower costs resulting from wage increase and additional staffing, higher food and beverage costs, salaries
and utilities, due to the commencement of operations of Crimson Boracay in 2018 and higher business volume across the Group’s other
hotel properties.
Costs of Banking and Financial Services
Costs of banking and financial services was accounted for under net interest income in the “Revenues”.
Costs of Power Operations
Costs of power operations decreased by 34.7% or P2,455.9 million from P7,069.7 million in 2017 to P4,613.7 million in 2018. The
costs of power in 2017 included the incurred costs of the IPPA contracts consisting of P2,316.6 million purchased electricity and
P1,138.6 million amortization of rights under the contracts. These initially qualified as intangible assets but were subsequently
derecognized when the IPPA contracts were terminated in 2017.
Costs of Sugar Sales
The Group’s costs of sugar sales increased by 8.5% or P151.9 million from P1,787.1 million in 2017 to P1,939.0 million in 2018.
Because of higher sales volume, the 8.5% increase in costs of sugar sales was slower than the 14.3% increase in the Group’s sugar sales
due to improved prices of raw sugar.
Costs of Other Operations
Costs of other operations increased by 5.4% or P32.5 million from P607.5 million in 2017 to P640.0 million in 2018 due to translation
adjustment of interest on foreign-currency denominated bonds payable.

97
Expenses
Real Estate Operations
Expenses of real estate operations increased by 22.0% from P5,045.0 million in 2017 to P6,153.3 million in 2018 attributed to (a) higher
business permits and real property taxes as a result of higher revenues and completion of more buildings during the year; (b) full
operation of DPI which resulted to higher salaries, wages and benefits; (c) service fees paid by PDDC; and (d) selling and marketing
expenses mainly for brokers’ commissions and advertising costs.
Hospitality Operations
The expenses of hospitality operations increased by 6.0% or P53.0 million from P876.8 million in 2017 to P929.8 million in 2018 on
account of higher room occupancy rates and the commencement of operations of Crimson Boracay in 2018, which led to increased
manpower cost, higher rent and credit card commission expense.
Banking and Financial Services
The expenses of banking and financial services increased by 3.3% from P18,895.7 million in 2017 to P19,521.0 million in 2018 on
account of: (a) higher tax rates, particularly the documentary stamp tax on time deposits; (b) marketing expenses due to new advertising
campaigns; and (c) training exercises for EW’s employees to be deployed at its branch stores.
Power Operations
The expenses of power operations decreased by 26.5% or P957.1 million from P3,614.7 million in 2017 to P2,657.6 million in 2018
due to (a) accretion expense on the liability on IPPA contracts, incurred only in 2017 as the contracts were terminated in the same year;
and (b) 2017 provision for probable losses on contingencies incident to the ordinary course of business operations of the power
operations segment.
Sugar Operations
Sugar operating expenses increased by 48.5% from P233.3 million in 2017 to P346.4 million in 2018 mainly due to additional allowance
for impairment losses on certain sugar refinery assets and provision for probable losses on contingencies.
Others
Expenses of other operations increased by 90.5% or P614.1 million from last year’s P678.5 million to P1,292.6 million. The expenses
reported in previous year included a one-time adjustment in borrowing costs pertaining to interest expense which should have been
capitalized as part of the cost of a constructed asset that was funded by the bonds in which the borrowing costs were incurred.
Provision for Income Tax
Provision for income tax increased by 8.4% or P346.3 million from P4,108.4 million in 2017 to P4,454.7 million in 2018. Provision for
current income tax increased by 20.5% or P664.6 million attributed to higher taxable income of the real estate operations as a result of
increased revenues. Provision for deferred income tax decreased by 36.8% or P318.4 million due mainly to temporary differences
between financial and taxable income.
Net Income
As a result of the foregoing, consolidated net income increased by 30.7% or P3,150.8 million from P10,273.3 million in 2017 to
P13,424.0 million in 2018. Net income attributable to equity holders of the Parent Company increased by 47.6% or P3,147.1 million
from P6,612.4 million in 2017 to P9,759.5 million in 2018 while net income attributable to noncontrolling interest amounted to
P3,664.5 million in 2018.
FINANCIAL CONDITION
As at December 31, 2018 Compared with As at December 31, 2017
Assets
Total consolidated assets as of December 31, 2018 increased by 10.8% from P532,833.6 million to P590,504.3 million. The changes in
asset accounts were accounted as follows:
Cash and cash equivalents decreased by 9.6% or P7,197.7 million from P75,319.0 million to P68,121.3 million. More funds were placed
in higher yielding liquid assets which led to lower cash balance particularly on EW’s interbank loans receivable.
Loans and receivables of the real estate operations decreased by 80.5% from P21,859.7 million to P4,261.3 million as a result of the
adoption of PFRS 15, Revenue from Contracts with Customers, wherein receivables with maturities exceeding one year were reclassified
as Contract assets. Total Receivables and Contract assets of the real estate segment decreased by 28.1% due to strong collections during
the period, the majority of which came from middle-income projects.

98
Loans and receivables of the hospitality operations increased by 112.5% or P104.1 million from P92.5 million to P196.6 million which
mainly came from credit card transactions.
Loans and receivables of the banking and financial services increased by 10.7% or P22,371.8 million from P209,159.1 million to
P231,530.9 million on account of the growth in EW’s consumer loans consisting of auto, personal, credit cards and mortgage loans.
Loans and receivables of the power operations increased by 3.1% or P55.5 million from P1,786.0 million to P1,841.5 million principally
due to transition adjustments of P200.0 million arising from the adoption of new accounting standards.
Loans and receivables of the sugar operations went down by 9.3% from P130.0 million to P117.9 million due to lower level of advances
to sugar planters related to sugar cane farming operations.
Financial assets at FVTPL decreased by 40.7% or P2,974.4 million from P7,313.2 million to P4,338.8 million which resulted from the
movements in EW’s proprietary trading portfolio.
Financial assets at FVTOCI increased by 85.4% or P345.5 million from P404.8 million in 2017 to P750.3 million in 2018 mainly due
to higher fair values of securities investments.
Investment securities at amortized cost amounted to P36,510.5 million which posted an increase of almost 6 times the P6,472.2 million
balance in year-end of last year, in line with EW’s business models.
Contract assets of P11,455.4 million was recognized and reclassed from Loans and receivables in compliance with PFRS 15, as
previously mentioned.
Real estate inventories went up by 22.2% from P65,599.4 million to P80,194.3 million due to rawland acquisitions including acquisition
of Cleon Properties amounting to P=4.7 billion and P=1.9 billion of GPRDI. Moreover, real estate inventories accelerated spending on
saleable real estate project costs.
Coal, spare parts and other inventories increased by 19.9% or P114.9 million from P=576.6 million to P=691.4 million principally due to
the higher level of the power segment’s coal and fuel inventory as of reporting date.
Investment properties increased by 8.9% or P=5,634.7 million from P=63,347.1 to P=68,981.8 million mainly due to the additional
construction costs of new buildings intended for office and commercial buildings for lease. These are primarily located in Northgate
Cyberzone in Alabang, Filinvest Cyberzone in Pasay Bay Area, Filinvest Mimosa, Fora Mall in Tagaytay, Main Square in Cavite, and
Il Corso in Cebu.
Property, plant and equipment decreased by 1.3% or P=601.4 million from P=45,024.3 million to P=44,422.9 million mainly due to
depreciation expense, offset by the additional property and equipment acquired during the year.
Investments in joint ventures decreased by 15.9% or P139.2 million from P873.8 million to P734.6 million attributed mainly to take up
of EW’s proportionate share in the net loss of its joint venture.
Deferred tax assets increased by 17.5% or P=387.7 million from P=2,213.1 million to P=2,600.8 million due to EW’s higher allowances set-
up, net of write-offs.
Other assets increased by 4.9% from P=22,281.9 million to P=23,372.8 million mainly attributed to the construction costs of the Filinvest
Cebu Cyberzone, classified under noncurrent other assets pursuant to BTO agreement with the Government of Cebu.
Liabilities
Total consolidated liabilities amounted to P470,822.9 million as at December 31, 2018, 11.1% higher than P423,704.0 million balance
as at December 31, 2017. Movements in account balances were as follows:
Deposit liabilities stood at P266,926.1 million, up by 10.6% from P241,317.2 million largely attributable to the growth of high-cost
deposits.
Bills and acceptances payable increased by 332.0% or P13,810.2 million from P4,159.7 million to P17,969.9 million due to higher
volume of interbank borrowings of EW.
Accounts payable, accrued expenses and other liabilities decreased by 0.8% or P318.1 million from P40,798.5 million to
P40,480.4 million as a result of the adoption of PFRS 15, Revenue from Contracts with Customers, wherein accounts payable with
99
maturities exceeding one year were reclassified as Contract liabilities. Total Accounts payable and Contract liabilities increased by
13.2% due to higher level of payables to contractors and suppliers for construction activities.
Contract liabilities of P5,690.7 million was recognized in compliance with PFRS 15, as previously mentioned.
Long-term debt increased by 1.2% or P1,531.1 million to P127,347.5 million from P125,816.4 million on account of additional loan
availments, to finance the ongoing development of the real estate and hospitality operations, partially offset by amortizations paid during
the year.
Income tax payable decreased by 15.2% from P715.1 million to P606.5 million attributable to EW’s lower taxable income, to be remitted
in 2019.
Deferred tax liabilities increased by 7.3% or P722.5 million from P9,962.2 million to P10,684.7 million due to additional capitalized
borrowing costs on long-term debt and other temporary differences of financial and taxable income.
Equity
On May 4, 2018, the Parent Company’s BOD approved the declaration and payment of cash dividends of P=661.6 million or
P=0.0765 per share for every common shares of record as of June 28, 2018 share payable on June 3, 2018.
On April 28, 2017, the Parent Company’s BOD approved the declaration and payment of cash dividends of P=549.7 million or
P=0.059 per share for every common shares of record as of May 28, 2017 share payable on June 21, 2017.
On April 29, 2016, the Parent Company’s BOD approved the declaration and payment of cash dividends of P=480.7 million or
P=0.052 per share for every common share payable on June 21, 2016 to stockholders of record as of May 27, 2016.
The Group has commitments for capital expenditures for the project developments of the real estate segment, the requirement of the
sugar manufacturing subsidiaries, the development and construction of solar rooftop facilities and other utility projects, the intended
construction and management of various hotels, and the bank’s expansion and implementation of IT projects, which could be adequately
covered by the operating cash flow and availment of medium and long term loans.
Performance Indicators
As of And For The
Year Ended
As of And For The
Year Ended
December 31, 2018 December 31, 2017
Earnings Per Share - Basic (EPS) P1.128 /share P0.710 /share
Net Income (Attributable to Equity Holders of the Parent
Company)
Weighted Average Number of Outstanding Shares
Price Earnings Ratio (PE Ratio) 10.46 Times 10.92 Times
Closing Price(1)
EPS
Return on Revenue 18% 15%
Total Net Income
Total Revenue
Return on Equity (Average) 12% 10%
Total Net Income
Average Total Equity
Assets to Equity Ratio 4.93 : 1 4.88 : 1
Total Assets
Total Equity

100
As of And For The
Year Ended
As of And For The
Year Ended
December 31, 2018 December 31, 2017
Debt to Equity Ratio
a) Long-term Debt 1.06 : 1 1.15 : 1
Total Equity
b) Total Liabilities Excluding Deposit
Liabilities, and Bills and Acceptances Payable 1.55 : 1 1.63 : 1
Total Equity
Current Ratio
a) Including EW
Current Assets 0.95 : 1 1.00: 1
Current Liabilities
b) Excluding EW
Current Assets 5.72 : 1 3.10 : 1
Current Liabilities
Quick Ratio 1.43 : 1 1.02 : 1
Current Assets – Inventories
Current Liabilities
Earnings Before Interest, Taxes, Depreciation and
Amortization (EBITDA) to Total Interest Expense 6.94 Times 7.17 Times
EBITDA
Total Interest Expense
(1) Closing prices at December 28, 2018 and December 29, 2017.
Notes to Financial Statements and Other Disclosures
1. The attached consolidated financial statements are prepared in compliance with PFRS. The accounting policies and methods of
computation followed in the financial statements for the year ended December 31, 2018 are the same as those followed in the annual
financial statements of the Company for the year ended December 31, 2017.
2. Except for the sugar business, the operating activities of the Company are carried out uniformly over the calendar year. The sugar
milling season of the Company’s sugar subsidiaries is usually from November to June of the following year. Except for this milling
season, there are no other unusual operating cycles or seasons during the year.
3. Except as disclosed in the Management’s Discussion and Analysis of Financial Condition and Results of Operation, there are no
unusual items affecting assets, liabilities, equity, net income or cash flows for the current period. There are no known trends,
demands, commitments, events or uncertainties that will have a material impact on the Company’s liquidity.
4. There are no changes in estimates of amounts reported in the previous period that have material effects in the current period.
5. Except for those discussed in the Management’s Discussion and Analysis of Financial Condition and Results of Operations, there
are no issuances, repurchases and repayments of debt and equity securities.
6. There were no other dividends paid (aggregate or per share) separately for ordinary shares and other shares during the current
period, except as discussed in the previous sections.
7. The Company derives its revenues from the following reportable segments:
Real Estate Operations
This involves acquisition of land, planning and development of large-scale fully integrated residential communities as well as the
development and sale of residential lots, housing units, medium-rise residential buildings, farm estates, industrial parks, residential

101
resort projects, a private membership club and condominium buildings. This segment also involves operations and management of
cinema and mall, property management and leasing of commercial and office spaces.
Hospitality Operations
This involves operation of hotels, including management of resorts, villas, golf course, service apartment and other services for the
pleasure, comfort and convenience of guests in said establishments under its management.
Banking and Financial Services
This involves a wide range of financial services to consumer and corporate clients which includes deposit-taking, loan and trade
finance, treasury, trust services, credit cards, cash management, custodial services, insurance services and leasing and finance. The
business units in this segment consist of retail banking, corporate banking, consumer banking, and treasury and trust.
Power Operations
This involves the establishment, construction, operation of power plants and supply of power to offtakers and also includes
management of power plants’ output under the IPPA contracts.
Sugar Operations
This involves operation of agricultural lands for planting and cultivating farm products, operation of a complete sugar central for
the purpose of milling or converting sugar canes to centrifugal or refined sugar and selling of sugar and by-products.
Other Operations
This involves other operations of the Parent Company including CWSI, CTI and FDCI. FDCI was incorporated to facilitate the
Group’s issuance of foreign currency-denominated bonds while CWSI was incorporated to provide maintenance, operation,
management and rehabilitation of waterworks sewerage and sanitation system and services specifically for the distribution, supply
and sale of potable water to domestic, commercial and industrial. CTI is engaged in providing computer and information technology
services including, but not limited to, general consulting, improvement systems planning, network integration, business re-
engineering services, systems integration and system development.
Financial information on the operations of these business segments as of and for the years ended December 31, 2018 and 2017 are
summarized and included in the accompanying Notes to Consolidated Financial Statements.
8. Except as discussed in the Management’s Discussion and Analysis of Financial Condition and Results of Operations, there are no
material events subsequent to December 31, 2018 up to the date of this report that have not been reflected in the financial statements
for the current period.
9. There have been no changes in the composition of the Company during the current period, such as business combination, acquisition
or disposal of subsidiaries and long-term investments, restructurings and discontinuing operations, except as discussed in the
Developments of the Company and Management’s Discussion on its Results of Operations.
10. There are no changes in contingent liabilities or contingent assets since December 31, 2018.
11. There are no material contingencies and any other events or transactions affecting the current period.
12. There are no known events that will trigger direct or contingent financial obligation that is material to the Company, including any
default or acceleration of an obligation.
13. There are no known material off-balance sheet transactions, arrangements, obligations including contingent liabilities, and other
relationships of the Company, with unconsolidated entities or other persons created during the reporting period.
14. There are no significant elements of income or loss, except as discussed in the Management’s Discussion on the Results of
Operations that did not arise from the Company’s continuing operations.
15. There are no known seasonal aspects that had a material effect on the financial condition or results of operations.
16. Aside from the possible material increase in interest rates on the outstanding floating – rate term loans, there are no known trends,
events or uncertainties or any material commitments that may result to any cash flow or liquidity problems of the Group within the
next 12 months. The Group is not in default or breach of any note, loan, lease or other indebtedness or financing arrangements
requiring it to make payments or any significant amount in its accounts payable that have not been paid within the stated terms.
ITEM 7. FINANCIAL STATEMENTS
The consolidated financial statements and schedules listed in the accompanying Index to Financial Statements and Supplementary
Schedules are filed as part of this SEC Form 17-A.

102
ITEM 8. CHANGES IN AND DISAGREEMENTS WITH ACCOUNTANTS ON ACCOUNTING AND FINANCIAL
DISCLOSURE
SyCip, Gorres, Velayo & Co (SGV) has been the duly appointed independent auditors for the years covered by this report.
FDC, in compliance with SRC Rule 68(3)(b)(iv) relative to the 5-year rotation requirement of its external auditors, has designated Mr.
Michael C. Sabado as its engagement partner starting calendar year 2019. The representatives of SGV are expected to be present at the
annual meeting where they will have the opportunity to make a statement if they desire to do so. They are expected to be available to
respond to appropriate questions at the meeting.
There has been no disagreement with FDC’s independent accountants on any matter of accounting principles or practices, financial
statement disclosure, or auditing scope or procedure.
Audit and Audit-Related Fees
The aggregate fees billed to the Group for professional services rendered by the external auditor for the examination of the annual
financial statements amounted to P11.3 million and P11.2 million, net of VAT in 2020 and 2019, respectively.
In 2020 and 2019, additional fees for other services of external auditor amounted to P21.6 million and P27.9 million, respectively.
Tax Fees
The fees billed to the Group for tax services which pertained to compliance review amounted to P9.8 million and
P8.6 million in 2020 and 2019, respectively.
All Other Fees
There are no other fees billed in each of the last 2 years for products and services provided by the external auditor, other than the services
reported under items mentioned above.
The Audit Committee based on the recommendation by the Internal Audit and management, evaluates the need for such professional
services and approves the engagement and the fees to be paid for the services.
PART III - CONTROL AND COMPENSATION INFORMATION
ITEM 9. DIRECTORS AND EXECUTIVE OFFICERS OF THE ISSUER
The following are the Directors and Executive Officers of FDC:
Mercedes T. Gotianun
Chairperson Emerita
Mrs. Gotianun, 92, Filipino, served as a Director of FDC from 1980 to 2019. She also served as a
Director of FLI from 1989 to 2019 and its Chief Executive Officer from 1997 to 2007. She is also a
Director of EW, a publicly-listed company, and a Director in PSHC, FDCUI and its subsidiary power
companies. She obtained her college degree from the University of the Philippines.
Jonathan T. Gotianun
Chairperson of the Board
and Director
Mr. Gotianun, 67, Filipino, was first elected as Director of FDC on 09 July 1993. He also serves as
Chairperson of the Board and Director of FLI and EW, both publicly-listed companies. He is the
President of DSCC and CSCC and a Director and Chairperson of the Board of Directors of FDCUI
and its subsidiary power companies. He served as Director and Senior Vice President of Family Bank
until 1984. He obtained his Master’s Degree in Business Administration from Northwestern
University in 1976.
L. Josephine Gotianun-
Yap
President, Chief Executive
Officer and Director
Mrs. Yap, 65, Filipino, was first elected as Director of FDC on 30 March 1990. She is also a Director,
President and Chief Executive Officer of FLI, CPI and a Director in FAI and FDCUI, as well as
various other companies within the Group. She is currently a Director in three publicly-listed
companies: FDC, FLI and EW. She obtained her Master’s Degree in Business Administration from
the University of Chicago in 1977. She has been President of the Company since 2000.
Michael Edward T.
Gotianun
Vice President and Director
Mr. Gotianun, 63, Filipino, was first elected as a Director of FDC on 24 October 2017. He is also a
Director of FLI, a publicly-listed company, FAI and FSI. He served as the general manager of
Filinvest Technical Industries from 1987 to 1990 and as loans officer at Family Bank from 1979 to
1984. He obtained his Bachelor’s degree in Business Management from the University of San
Francisco in 1979. He has been serving the Company as Vice President for more than 5 years.

103
Nelson M. Bona
Executive Vice-President,
Treasurer, Chief Financial
Officer and Director
Mr. Bona, 70, Filipino, is FDC’s Executive Vice-President, Treasurer and Chief Financial Officer. He
is currently a Director of EW and FLI, both publicly-listed companies, FAC, TSNC and other
companies in the Group. He also serves as Chairman of the Board of FDC Forex. He was formerly
an Executive Vice President of EW and Managing Director of Millenia Broadband Communications,
Inc. and Filinvest Capital, Inc. He obtained his Bachelor of Arts in Commerce degree from the
University of Sto. Tomas. He also earned units towards an MBA from the De La Salle University
and attended the Advance Finance Program of Harvard Business School.
Virginia T. Obcena
Lead Independent Director
Ms. Obcena, 73, Filipino, was first elected as an independent director of FDC on 29 April 2016. She
is also an Independent Director of CPI. She is a member of the Panel of Conciliators of the
International Centre for Settlement of Investment Disputes of the World Bank. She served as
independent director and head of the Audit Committee of the Capital Markets Integrity Corporation.
She was a former partner, member of the management committee and head of quality and risk
management at SGV. She obtained her Bachelor of Science in Business Administration degree,
Magna cum Laude, at the University of the East and her Master in Business Administration degree at
the University of the Philippines. She is a certified public accountant.
Val Antonio B. Suarez
Independent Director
Mr. Suarez, 62, Filipino, is an independent director of FDC, having been first elected on 30 May
2014. He is the Managing Partner of the Suarez & Reyes Law Offices and was the former President
and Chief Executive Officer of the Philippine Stock Exchange. Mr. Suarez is also an independent
director of FLI and Lepanto Consolidated Mining Company, both publicly-listed companies, as well
as Independent Director of CPI. He is a member of the Integrated Bar of the Philippines (Makati
Chapter) and New York Bar. He obtained his Bachelor of Laws degree from the Ateneo de Manila
University Law School and a Master of Laws degree from Georgetown University Law Center.
Claire A. Huang
Independent Director
Ms. Huang, 58, Filipino, was first elected as an independent director of FDC on 26 April 2019. She
is a member of the board of directors for PODS and Prosper Marketplace. She also served as a director
in various U.S.-based companies such as Mirador and Scottrade. She was the Chief Marketing Officer
for J.P. Morgan Chase and Company until 2014. She obtained her Bachelor of Arts degree from De
La Salle University in 1983 and finished the Advanced Management Program in IESE Business
School in 2016. Daniel L. Ang Tan Chai
Senior Vice-President,
Deputy Chief Financial
Officer and Compliance
Officer
Mr. Ang Tan Chai, 62, Filipino, has been the Deputy Chief Financial Officer of the Company since
November 2015. He was appointed as Compliance Officer of the Company in June 2020. Prior to
joining the Company, he was Executive Vice President and Chief Finance Officer of Philippine Bank
of Communications. He also served as Senior Vice President and Chief Finance Officer for Philippine
Airlines, Air Philippines Express, First Vice President and Chief Finance Officer of Metrobank Card
Corporation, and Financial Control, Global Consumer Bank of Citibank, N.A. – Philippines. He
holds a Bachelor of Science degree, major in Industrial Engineering from the University of the
Philippines, and a Masters degree in Business Administration from the same university.
Renato Rex Xavier G.
Marzan
Group Chief Digital Officer
& Chief Innovation Officer/
MD of Digital Innovations
& Ventures
Mr. Marzan, 45, Filipino, is the Company’s Group Chief Digital Officer & Chief Innovation Officer/
MD of Digital Innovations & Ventures. Prior to joining FDC, Mr. Marzan served as Board Director
and President of True Money Philippines, a part of Ascend Corporation. He also served as Head of
Strategy & Corporate Development for Globe Consumer Business and Chief Executive Officer for
G-Xchange, Inc. (GCash) of Globe Telecom, Inc. He holds a Bachelor of Science degree, major in
Management Engineering from Ateneo de Manila University, and a Master’s degree in Business
Administration from the Fuqua School of Business of Duke University in North Carolina, USA.
Virginia A. Cayanga
Vice President for Risk
Management
Ms. Cayanga, 48, Filipino, is the Vice President for Risk Management of the Company starting
November 2015. Prior to joining the Company she served as the Vice President and Multinational
Client Services Leader of Marsh Philippines, Inc. for fourteen years. She holds a Bachelor of Arts
degree, major in Quantitative Economics from the University of Asia and the Pacific.
Sharon P. Pagaling-
Refuerzo
Corporate Secretary and
Corporate Information
Officer
Atty. Pagaling-Refuerzo, 41, Filipino, is concurrently Vice-President – Corporate Advisory Services
and Tax Head of FLI. She is also the Corporate Secretary of FLI, CPI, The Palms Country Club, Inc.
and TSNC, as well as Corporate Secretary of various companies of the Group. Admitted to the
Philippine Bar in 2006, she holds an A.B. Philosophy degree from the University of the Philippines
and a law degree from San Beda College.

104
Patricia Carmen D. Pineda
Senior Assistant Vice
President/Group Investor
Relations
Ms. Pineda, 48, Filipino, is the Senior Assistant Vice President and Group Investor Relations Officer
of the Company. Prior to joining FDC in April 2019, Ms. Pineda served as the Head of Investor
Relations for Metropolitan Bank & Trust Company. She also served as the Head of Investor Relations
Concurrent Head of Controllership and Analysis for Manila Water Company, Inc. and Investor
Relations Manager for Ayala Land, Inc. She holds a Bachelor of Science degree, major in Economics
from the University of the Philippines, and a Master of Science degree in Finance from the same
university.
Michael Louie T. Garado
Assistant Vice President for
Audit and Chief Audit
Executive
Mr. Garado, 39, Filipino, was appointed by the Board of Directors as Chief Audit Executive on May
21, 2018. Prior to joining FDC, he served as an Internal Control Area Manager for Coca-Cola FEMSA
Philippines, Inc., Statutory Reporting Manager for Coca-Cola Bottlers Phils., Inc. And Internal
Auditor - Corporate Audit of Coca Cola Far East Limited. Mr. Garado is a certified public accountant
and obtained his Bachelor of Arts degree, from San Beda University.
The members of the board committees, pursuant to appointments made during the organizational meeting of the BOD of the Company
on June 22, 2020, are as follows:
Executive Committee Jonathan T. Gotianun (Chair), L. Josephine Gotianun-Yap, Andrew T. Gotianun, Jr.
and Michael Edward T. Gotianun
Audit and Risk Management
Oversight Committee
Virginia T. Obcena (Chair/Independent Director), Val Antonio B. Suarez (Independent
Director), L. Josephine Gotianun-Yap and Jonathan T. Gotianun
Compensation Committee Val Antonio B. Suarez (Chair/Independent Director), L. Josephine Gotianun Yap,
Jonathan T. Gotianun and Virginia T. Obcena (Independent Director)
Corporate Governance
Committee
Val Antonio B. Suarez (Chair/Independent Director), Claire A. Huang (Independent
Director), Virginia T. Obcena (Independent Director) and Jonathan T. Gotianun
Related Party Transaction
Committee
Val Antonio B. Suarez (Chair/Independent Director), Virginia T. Obcena (Independent
Director), Claire A. Huang (Independent Director) and Jonathan T. Gotianun
Digital Committee Claire A. Huang (Chair/Independent Director), L. Josephine Gotianun-Yap and
Jonathan T. Gotianun
The directors of the Company are elected at the annual stockholders’ meeting to hold office until their respective successors have been
duly elected and qualified. Officers are appointed or elected by the BOD typically at its first meeting following the annual stockholders’
meeting, each to hold office until his successor shall have been duly elected or appointed and qualified.
The Company is not aware of any legal proceedings where its directors or executive officers have been impleaded in their capacity as
directors or executive officers of the Company.
The Company is not aware of the occurrence of any of the following events within the past 5 years up to the date of this annual report:
(a) any bankruptcy petition filed by or against any business in which any of its directors or officers was a general partner or officer either
at the time of the bankruptcy or within two years prior to that time; (b) any conviction by final judgment in a criminal proceeding,
domestic or foreign, of, or any criminal proceeding, domestic or foreign, pending against, any of its directors or officers in his capacity
as such director or officer; (c) any order, judgment or decree, not subsequently reversed, suspended or vacated, of any court of competent
jurisdiction, domestic or foreign, permanently or temporarily enjoining, barring, suspending or otherwise limiting the involvement of
any of its directors or officers in any type of business, securities, commodities or banking activities, and (d) any finding by a domestic
or foreign court of competent jurisdiction (in a civil action), the SEC or comparable foreign body, or a domestic or foreign exchange or
electronic marketplace or self-regulatory organization that any of its directors or officers has violated a securities or commodities law,
and the judgment has not been reversed, suspended or vacated, which occurred during the past 5 years.
There is no person, who is not an executive officer of the Company, who is expected to make a significant contribution to its business.
The Company, however, occasionally engages the services of consultants.
There were no transactions during the last 2 years or any proposed transactions, to which the Company was or is to be a party, in which
any director or officer, any security holder or any member of the immediate family of any of the foregoing persons had or is to have a
direct or indirect material interest.
ITEM 10. EXECUTIVE COMPENSATION
Information as to the aggregate compensation paid or accrued during the last 2 fiscal years and to be paid in the ensuing fiscal year to
the Group’s executive officers and other officers are as follows:

105
COMPENSATION OF DIRECTORS AND EXECUTIVE OFFICERS
Year Salary Bonus
Other Annual
Compensation TOTAL Name and Principal Position
Josephine G. Yap (President /CEO)
Jonathan T. Gotianun (Chairperson)
Nelson M. Bona (EVP, CFO,
Treasurer and Compliance Officer
Daniel Ang Tan Chai (SVP/Deputy
CFO)
Renato Rex Xavier G. Marzan
(SVP/Digital Head)
CEO and top 4 highest compensated
officers
2021-
Estimated P58.0M P8.7M P66.7M
2020 P55.2M P8.3M P63.5M
2019 P62.9M P8.4M P71.3M
All officers and directors as a group
unnamed
2021-
Estimated P78.5M P10.7M P89.2M
2020 P74.7M P10.2M P84.9M
2019 P83.0M P11.4M P94.4M
Non-executive director and/or independent director receive a per diem of P 50,000.00 for every Board committee meeting attended and
P100,000.00 for every Board meeting attended.
For the year 2020, the total per diem for each of the non-executive director and independent directors is as follows:
Name of Director Amount
Jonathan T. Gotianun* P–
Lourdes Josephine Gotianun-Yap* –
Michael Edward T. Gotianun* –
Nelson M. Bona* –
Virginia T. Obcena 1,450,000.00
Val Antonio B. Suarez 1,450,000.00
Claire A. Huang 1,250,000.00
Total P 4,150,000.00
* These directors do not receive per diem in their capacity as directors of the Company.
Other than as discussed in the Information Statement, there are no other existing arrangements for the payment of compensation or
remuneration to the directors in their capacity as such, but the Company may, without any obligation, grant additional compensation if
certain performance driven goals are met, subject to such approvals as may be required by law.
There are no outstanding warrants or options held by the Company’s CEO, the above-named executive officers, and all officers and
directors as a group which are subject to the approval by the stockholders at the annual stockholders’ meeting.
There is no action to be taken at the annual meeting of the stockholders on 30 April 2021 with respect to any bonus, profit sharing or
other compensation plan, contract or arrangement, and pension or retirement plan, in which any director, nominee for election as a
director, or executive officer of the Company will participate which are subject to the approval by the stockholders at the annual
stockholders’ meeting. Neither is there any proposed grant or extension to any such persons of any option, warrant or right to purchase
any securities of the Company which are subject to the approval by the stockholders at the annual stockholders’ meeting.
ITEM 11. SECURITY OWNERSHIP OF CERTAIN BENEFICIAL OWNERS AND MANAGEMENT
(1) Security Ownership of Certain Record and Beneficial Owners
The names, addresses, citizenship, number of shares held, and percentage to total of persons owning more than five percent (5%)
of the outstanding voting shares of the Company (all common) as of December 31, 2020 are as follows:

106
Title of
Class
Name and Address of Record
Owner/ Relationship with
Company
Name of Beneficial
Owner/
Relationship with
Record Owner
Citizenship No. of Shares Held Percent
age
Held
Common A.L. Gotianun Inc. (formerly
ALG Holdings Corporation)1
6/F The Beaufort 5th Avenue
corner 23rd Street, BGC, Taguig
City
Majority Owner of the
Company
ALGI 2 Filipino 7,587,823,502 (D)
61,976,540 (I)
87.74%
0.72%
Common PCD Nominee Corporation
(Filipino)
G/F, Philippine Stock Exchange
Tower, Ayala Avenue, Makati
City
Filipino 901,179,482 10.42%
Except as stated above, the BOD and management of the Company have no knowledge of any person who, as of the date of the
annual report was directly or indirectly the beneficial owner of more than five percent (5%) of the Company’s outstanding shares
of common stock or who has voting power or investment power with respect to shares comprising more than 5% of the Company’s
outstanding common stock.
(2) Security Ownership of Management
The names, citizenship, number of shares held and percentage to total of persons forming part of the management of the Company
as of December 31, 2020 are as follows:
Title of Class Name Citizenship Amount and Nature of
Record/Beneficial Owner
% of Ownership
Common Mercedes T. Gotianun Filipino 1,554 (D)
0 (I)
Negligible
Common Jonathan T. Gotianun Filipino 12 (D)
263,925 (I)*
Negligible
Common L. Josephine Gotianun-Yap Filipino 6,187,402 (D)**
9,395,522 (I)
0.07%
0.11%
Common Michael Edward T. Gotianun Filipino 50,501,501 (D)
0 (I)
0.58%
0.00%
Common Nelson M. Bona Filipino 24,664 (D)
0 (I)
Negligible
Common Virginia T. Obcena Filipino 1 (D)
0 (I)
Negligible
Common Val Antonio B. Suarez Filipino 1 (D)
0 (I)
Negligible
Common Claire A. Huang Filipino 1 (D)
0 (I)
Negligible
N.A. Daniel L. Ang Tan Chai Filipino 0 N.A.
N.A. Renato Rex Xavier G. Marzan Filipino 0 N.A.
N.A. Virginia A. Cayanga Filipino 0 N.A.
N.A. Michael Louie T. Garado Filipino 0 N.A.
N.A. Patricia Carmen D. Pineda Filipino 0 N.A.
N.A. Sharon P. Pagaling-Refuerzo Filipino 0 N.A. * Includes shares of stock in FDC under the names of Berit Holdings Corp., Jabberwock Holdings, Inc. and Chriszen Holdings, Inc. **Composed of 12 direct shares registered under the name L. Josephine Gotianun-Yap; 6,187,390 direct shares registered under the name Joseph M. Yap &/or L.
Josephine Gotianun-Yap; and 9,395,522 indirect shares registered under the name Joseph M. Yap &/or L. Josephine Gotianun-Yap.
Total ownership of all directors and officers as a group is 69,746,578 shares or 0.81% of total outstanding shares.
3) Voting, Trust Holders of 5% or more
1 Mrs. L. Josephine G. Yap is typically named by ALGI as its proxy to vote at the annual meeting of stockholders the shares owned and held by it in the Company. 2 Stockholders are the beneficial owners.

107
There is no person who holds more than 5% of the common stock under any voting trust or similar agreement.
4) Changes in Control
The Company is not aware of any agreement, which may result in a change in control of the registrant.
ITEM 12. CERTAIN RELATIONSHIPS AND RELATED TRANSACTIONS
In the normal course of business, the Company and other members of the Group enter into certain related-party transactions.
There were no transactions during the last two years, or any proposed transactions, to which the Company was or is to be a party, in
which any director or executive officer, any nominee for election as a director, any security holder or any member of the immediate
family of any of the foregoing persons, had or is to have a direct or indirect material interest.
Related Party Transactions
The Group has entered into various transactions with related parties. Parties are considered to be related if one party has the ability,
directly or indirectly, to control the other party in making financial and operating decisions or the parties are subject to common
control or common significant influence (referred to as ‘Affiliates’). Related parties may be individuals or corporate entities.
All material Related Party Transactions (RPT) with a transaction value that reaches ten percent (10%) of the Group’s total
consolidated assets shall be subject to the review by the RPT Committee.
Transactions that were entered into with an unrelated party that subsequently becomes a related party shall be excluded from the
limits and approval of the Policy on Related Party Transactions (Policy). However, any renewal, change in the terms and conditions
or increase in exposure level, related to these transactions after a non-related party becomes a related party, shall subject it to the
provisions of the the Policy.
In the event whrein there are changes in the RPT classification from non-material to material, the material RPT shall be subject to
the provisions of the the Policy.
Outstanding balances at year-end are unsecured, interest free and require settlement in cash, unless otherwise stated. As of
December 31, 2020 and 2019, the Group has not made any provision for impairment loss relating to amounts owed by related
parties. This assessment is undertaken each financial year by examining the financial position of the related party and the market
in which the related party operates.
Significant transactions with related parties are as follows:
a. The compensation of key management personnel consists of short-term employee salaries and benefits amounting to
P=84.9 million, P=94.4 million and P=76.1 million in 2020, 2019 and 2018, respectively. Post-employment benefits of key
management personnel amounted to P=23.2 million, P=17.0 million and P=18.0 million in 2020, 2019 and 2018, respectively.
b. Other transactions with related parties include noninterest-bearing cash advances and various charges to and from non-
consolidated affiliates for management fees, rent, share of expenses and commission charges. Transactions with related parties
are normally settled in cash.
The amounts and the balances arising from the foregoing significant related party transactions are as follows:
2020
Amount/
Volume
Outstanding
Balance
Due from
(Due to) Terms Conditions
(In Thousands)
Due from related parties
Real estate operations
Ultimate Parent Company (a)
P=4,388 P=3,171
Noninterest-bearing,
collectible on demand
Unsecured, no
impairment
Affiliates:
Share in expenses 175,540 83,257
Noninterest-bearing,
collectible on demand
Unsecured, no
impairment
P=179,928 P=86,428

108
Amount/
Volume
Outstanding
Balance
Due from
(Due to) Terms Conditions
Due to related parties
Ultimate Parent Company (a, b)
Interest expense P=58,112 (P=−)
Bears 3.1% interest
per annum, payable
within 1 year Unsecured
Affiliates
Share in expenses (a) 85 (2,465)
Noninterest-bearing,
payable on demand Unsecured
P=58,197 (P=2,465)
(a) Share in Group expenses
(b) Availment of loan payable, with interest at prevailing market rate
(c) Management fee charged to hospitality operations by a joint venture.
2019
Amount/
Volume
Outstanding
Balance
Due from
(Due to) Terms Conditions
(In Thousands)
Due from related parties
Real estate operations
Ultimate Parent Company (a)
P=3,993 P=4,080
Noninterest-bearing,
collectible on
demand
Unsecured, no
impairment
Affiliates:
Share in expenses 8,072 11,564
Noninterest-bearing,
collectible on
demand
Unsecured, no
impairment
P=12,065 P=15,644
Due to related parties
Ultimate Parent Company (a, b)
Interest expense P=49,613 (P=1,189,588)
Bears 3.1% interest
per annum, payable
within 1 year Unsecured
Affiliates
Share in expenses (a) 1,533 (8,148)
Noninterest-bearing,
payable on demand Unsecured
Management fee (c)
P=51,146 (P=1,197,736)
(a) Share in Group expenses
(b) Availment of loan payable, with interest at prevailing market rate (c) Management fee charged to hospitality operations by a joint venture.
Transactions with Retirement Plans
Under PFRS, certain post-employment benefit plans are considered as related parties. The Group’s retirement plan is in the form
of a trust administered by the EW’s Trust Division under the supervision of the Retirement Committee. The values of the assets
of the fund are as follows:
2020 2019
(In thousands)
Cash and cash equivalents P=124,482 P=26,290
Equity instruments 760,080 782,064
Debt instruments 171,100 158,763
Others 1,857 1,844
P=1,057,519 P=968,961
109
The following are the amounts recognized by the retirement plan arising from its transactions with EW for the years ended
December 31, 2020, 2019, and 2018.
2020 2019 2018
Trust fees P=2,775 P=2,682 P=2,534
Interest income on savings deposit 318 945 151
Interest income on investments in LTNCD 10,485 7,964 5,044
Gain (loss) on investments in equity shares (46,776) 230,515 (15,272)
PART lV. COMPLIANCE WITH LEADING PRACTICES ON CORPORATE GOVERNANCE
ITEM 13. CORPORATE GOVERNANCE
The Company is in full compliance with its Revised Manual for Corporate Governance as demonstrated by the following: (a) the election
of 2 independent directors to the Board; (b) the appointment of members of the audit, nomination and compensation committees of the
Company; (c) the conduct of regular quarterly board meetings and special meetings, the faithful attendance of the directors at these
meetings and their proper discharge of duties and responsibilities as such directors; (d) the submission to the SEC of reports and
disclosures required under the Securities Regulation Code; (e) the Company’s adherence to national and local laws pertaining to its
operations; and (f) the observance of applicable accounting standards by the Company.
In order to keep itself abreast with the leading practices on corporate governance, the Company encourages the members of top-level
management and the Board to attend and participate at seminars on corporate governance initiated by accredited institutions.
The Company welcomes proposals, especially from institutions and entities such as the SEC, PSE and the Institute of Corporate
Directors, to improve corporate governance.
There is no known material deviation from the Company’s Revised Manual on Corporate Governance.
Per SEC Memorandum Circular No. 15, Series of 2017, the Integrated Annual Corporate Governance Report for 2020 shall be
submitted to the SEC on or before May 30, 2021.
PART V. EXHIBITS AND SCHEDULES
ITEM 14. EXHIBITS AND REPORTS ON SEC FORM 17-C
(a) Exhibits - see accompanying Index to Exhibits
The following exhibits are filed as a separate section of this report:
The other exhibits, as indicated in the Index to Exhibits are either not applicable to the Company or require no answer.
(b) Reports on SEC Form 17-C
Reports on SEC Form 17-C were filed during the year covered by this report and are listed below:
Date
Result of BOD Meeting_Approval of Bond Issuance January 10, 2020
Result of BOD Meeting_Approval of Schedule of Annual Stockholders Meeting 2020 January 29, 2020
Clarification on news article re: “Gotianun eyes P26-MW hydro power project in 2 provinces” February 4, 2020
Result of Special BOD Meeting_Approval of Audited FS 2019 February 28, 2020
Clarification on news article re: “SEC okays P15-B FDC bond offering” March 12, 2020
Disclosure re: Filing of Current Report under Section 17 of the Securities Regulation Code amid COVID-
19 Pandemic
March 16, 2020
Result of BOD Meeting_Approval of the New Schedule of Annual Stockholders Meeting 2020 May 19, 2020
Press Release: FDC 2019 net income rises 23% to P12B May 19, 2020
Press Release: FDC posts 1Q20 net income growth of 8% to P3.0B May 28, 2020
Result of BOD Meeting_Declaration of Cash Dividend June 22, 2020
Result of Annual Stockholders Meeting June 22, 2020
Result of Organizational Meeting June 22, 2020
Press Release: Filinvest Development explores tapping offshore debt market June 22, 2020

110
Date
Press Statement NAIA Unsolicited Proposal July 7, 2020
Disclosure re: Manila International Airport Authority notification letter to the NAIA Consortium July 13, 2020
Result of BOD Meeting_FDC Planned Issuance of USD-denominated Bonds July 29, 2020
Disclosure re: Update on the Company's disclosure on December 13, 2019 regarding the Share Purchase
Agreement between FDC and Choengmon Real Estate Company Limited
August 4, 2020
Press Release: FDC net income grows by 24% in 1H20 to P7.2B August 7, 2020
Disclosure re: FDC plans to issue Reg-S only USD-denominated Senior Unsecured Notes September 3, 2020
Press Release: Filinvest Development Corporation successfully completes its issuance of US$200 million
4.125% 5-year Senior Unsecured Fixed Rate Notes ("Notes")
September 11, 2020
Press Release: Notice to the public that FDC and all its subsidiaries and affiliates are not in any way related
to Filinvest Trust Bank
October 15, 2020
Press Release: FDC net income grows by 3% in 9M20 to P8.9B November 13, 2020
Clarification on news article re: “Filinvest putting up 200-room hotel in Camp John Hay” December 10, 2020

Coleen Alminanza
Typewritten Text
111
Coleen Alminanza
Typewritten Text
Coleen Alminanza
Typewritten Text


112
FILINVEST DEVELOPMENT CORPORATION AND SUBSIDIARIES
(CONSOLIDATED)
INDEX TO FINANCIAL STATEMENTS AND SUPPLEMENTARY SCHEDULES
FORM 17-A, Item 8
Consolidated Financial Statements
Statement of Management’s Responsibility for Financial Statements
Report of Independent Public Accountants
Consolidated Statements of Financial Position as of December 31, 2020 and 2019
Consolidated Statements of Income for the years ended December 31, 2020, 2019 and
2018
Consolidated Statements of Comprehensive Income for the years ended December 31,
2020, 2019 and 2018
Consolidated Statements of Changes in Equity as of December 31, 2020 and 2019
Consolidated Statements of Cash Flows for the years ended December 31, 2020, 2019
and 2018
Notes to Consolidated Financial Statements
Supplementary Schedules
A.
MARKETABLE SECURITIES - (CURRENT MARKETABLE SECURITIES AND
OTHER SHORT-TERM CASH INVESTMENTS)
*
B.
AMOUNTS RECEIVABLE FROM DIRECTORS, OFFICERS, EMPLOYEES,
RELATED PARTIES AND PRINCIPAL STOCKHOLDERS (OTHER THAN
AFFILIATES)
*
C.
NON-CURRENT MARKETABLE EQUITY SECURITIES, OTHER
LONG-TERM INVESTMENTS, AND OTHER INVESTMENTS
*
D.
INDEBTEDNESS TO UNCONSOLIDATED SUBSIDIARIES AND AFFILIATES
*
E.
PROPERTY, PLANT AND EQUIPMENT
*
F.
ACCUMULATED DEPRECIATION
*
G.
INTANGIBLE ASSETS / OTHER ASSETS
*
H.
LONG-TERM DEBT
*
I.
INDEBTEDNESS TO AFFILIATES AND RELATED PARTIES (LONG-TERM
LOANS FROM RELATED COMPANIES)
*
J.
GUARANTEES OF SECURITIES OF OTHER ISSUERS
NA
K.
CAPITAL STOCK
*
* These schedules which are required by Part IV of SRC Rule 12 are contained in the Company’s Audited Consolidated Financial
Statements, in the accompanying Notes to Consolidated Financial Statements, or in Supplementary Information and Disclosures
Required on SRC Rule 68 and 68.1 As Amended.

113
INDEX TO EXHIBITS
Form 17- A
No. P
a
g
e
N
o
.
(
3
)
Plan of Acquisition, Reorganization, Arrangement, Liquidation, or Succession *
(5) Instrument Defining the Rights of Security Holders, Including Indentures *
(8) Voting Trust Agreement *
(9) Material Contracts *
(10) Annual Report to Security Holders, Form 17-Q or Quarterly Report to Security Holders *
(13) Letter re Change in Certifying Accountant *
(16) Report Furnished to Security Holders *
(18) Subsidiaries of the Registrant A
(19) Published Report Regarding Matters Submitted to Vote of Security Holders *
(20) Consent of Experts and Independent Counsel *
(21) Power of Attorney *
(29) Additional Exhibits *
Sustainability Report
* These exhibits are either not applicable to the Company or require no answer.
A This schedule is contained in Note 1 of the Company’s 2020 Audited Consolidated Financial Statements


2
Table of Contents
About this Section ........................................................................................................................................................ 3
Scope ................................................................................................................................................................................ 3
Materiality ....................................................................................................................................................................... 4
Our Approach to Sustainability ..................................................................................................................................... 5
Corporate Governance ..................................................................................................................................................... 6 Audit and Risk Management Oversight ....................................................................................................................... 7 Compliance with Laws and Anti-Corruption ............................................................................................................... 8
Sustainability Governance ................................................................................................................................................ 8
Our People ................................................................................................................................................................. 10
Head Office Employee Profile ........................................................................................................................................ 10
Group Employee Profile ................................................................................................................................................. 11
Hiring and Benefits ......................................................................................................................................................... 11
Learning and Development ............................................................................................................................................ 12
Diversity and Inclusion ................................................................................................................................................... 13
Employee Engagement .................................................................................................................................................. 13
Health, Safety, and Wellbeing ........................................................................................................................................ 13
Our Customers............................................................................................................................................................ 16
Protecting Privacy .......................................................................................................................................................... 17
Providing Superior Service .............................................................................................................................................. 16
Our Communities ....................................................................................................................................................... 19
Our Environmental Impact ......................................................................................................................................... 22
Environmental Profile ..................................................................................................................................................... 24
Our Suppliers .............................................................................................................................................................. 26
SEC Content Index ...................................................................................................................................................... 27

3
About this Section Filinvest Development Corporation (FDC, the Company or the Group) welcomes this opportunity to publish its second environmental, social, and governance (ESG) report. To be read as part of its 2020 Annual Report, this section details FDC’s non-financial performance across the economic, environmental, and social aspects of our business for the reporting period from January 1, 2020 through December 31, 2020. This section satisfies the "comply or explain" provisions in accordance with the Sustainability Reporting Guidelines for Publicly Listed Companies (ESG Guidelines) issued by the Philippine Security and Exchange Commission (SEC) and outlined in SEC Memorandum Circular No. 4, series of 2019. It was prepared with reference to the Global Reporting Initiative (GRI) Standards Reporting Guidelines.
Scope
FDC is a holding company, which operates primarily through its subsidiaries with established businesses in the property and real estate, banking and financial services, hospitality, power, sugar, water, and infrastructure sectors.
The scope of this section focuses on the FDC head office1 (Head Office) and its major operating
subsidiaries across four sectors (together, the Group).2
• Real Estate: Filinvest Land, Inc. (FLI), Filinvest Alabang, Inc. (FAI)
• Hospitality: Filinvest Hospitality Corporation and its subsidiaries (together, FHC)
• Banking and Financial Services: EastWest Banking Corporation (EW) and subsidiaries
• Power and Utilities: FDC Utilities, Inc. and its subsidiaries (together, FDCUI) This year, as in 2019, FLI and EW have respectively included ESG Sections as part of their Annual Reports for 2020. FDC’s subsidiaries in the sugar, water, and infrastructure sectors have been omitted from the scope of this section due to their small size within the Company’s overall operations. As these subsidiaries grow and the Company strengthens its Group-wide data collection systems, it plans to expand the scope of its reporting to include these subsidiaries in the future. For additional information on FDC’s subsidiaries, please refer to the Joint Chairman and President & CEO's Message and Operational Highlights in the Annual Report.
1 Our head office is located at 6th Floor, The Beaufort, 5th Avenue Corner 23rd Street, Bonifacio Global City, Taguig City 1634 Metro Manila, Philippines. 2 A full list of FDC’s subsidiaries can be found on the Company website in the Audited Consolidated Financial Statements and 2020 SEC Form 17-A, available on the Edge website of the Philippine Stock Exchange (http://edge.pse.com.ph).

4
Materiality
In accordance with the ESG Guidelines, the content of this section is informed by the principle of materiality and focuses on the economic, environmental, and social impacts of the Group’s operations and activities in the Philippines. Moving forward, we intend to conduct a materiality assessment that will enable us to focus our energies and resources on a sustainability agenda in a direction that is strategic to our businesses, promotes growth, manages impacts and minimizes risks, and contributes to sustainable development across our Group.
5
Responsible Leadership in Challenging Times 2020 presented an exceptionally challenging operating environment for our Group and for many of our stakeholders. The Taal Volcano eruption in January, typhoons Rolly and Ulysses in November, and of course the COVID-19 pandemic throughout the year have disrupted lives and livelihoods at an unprecedented level. In times like these, it is more important than ever that everything we do is built on a solid foundation of integrity, strong corporate governance and accountability to our stakeholders. With teamwork, technology and a proactive mindset, we have kept the business running and even thriving in this most testing year. Our COVID response was three-pronged: the safety and livelihood of our corporate family, the physical and financial security of our customers and business partners, and the public health of the communities where we operate. Our employees adapted quickly to working remotely, while those subsidiaries where remote working was not possible, such as FLI, FHC and FDCUI, introduced new policies and procedures to keep employees safe onsite. Special payments and incentives were introduced to thank EastWest branch staff for their service after returning to work, while we continued to invest in training and developing our teams, moving many of our training programs online. Despite the practical challenges, we continued to deliver vital services to our customers this year, while further enhancing our reputation for excellent customer service. Our ongoing digitization drive across the Group paid dividends as we were able to move more of our services online, particularly for our banking customers. Across the Group, we are incredibly proud of our employees’ efforts to serve our local communities at a time when their support was needed most. From providing food and assistance to communities impacted by the Taal eruption, to donating PPE, medical equipment and food for the coronavirus response, and even converting our Filinvest Tent at Filinvest City into a 108-bed mega quarantine center. Our commitment to greening our business did not falter, despite these other diverse challenges. We are especially proud of the recognition given to our Filinvest City development in the south of Metro Manilla. Among these, Filinvest City was awarded the prestigious LEED Gold certification, making it one of the largest green-certified developments in Southeast Asia.
Our Approach to Sustainability
From humble beginnings in 1955, FDC has grown into one of the Philippines’ leading conglomerates with a diversified range of businesses in real estate and hospitality, banking and financial services, sugar, and power and utilities. In line with our vision to empower Filipinos to attain their dreams,

6
we aim to provide excellent services to the underserved middle market while creating sustainable value for our stakeholders. We do this by focusing on what we believe matter most and seeking excellence in all that we do. This includes cultivating an entrepreneurial mindset that is open to new opportunities and focuses on innovation, while providing superior value to our customers through cost efficiencies, without compromising safety, quality, or service. We do all this while doing our best to minimize negative impacts on the environment. Our approach to sustainability is informed by our core values of integrity, teamwork, professionalism, innovation, customer service, and cost-effectiveness. We recognize that our investors and other stakeholders have increasing expectations about the environmental and social performance of our business. We are committed to improving our overall sustainability performance without compromising our economic performance and our record of creating value for our stakeholders. Although the concept of sustainability has long informed our approach to business, formalized sustainability reporting is still relatively new to our organization. We are working to strengthen our Group-wide data collection systems to enable us to better understand and manage our collective environmental and social impacts. Moving forward, we intend to establish strategic priorities and better performance indicators for sustainability across FDC, to help inform our strategic and operational decision-making. At EastWest, work is underway to establish its first Sustainable Finance Framework in 2021, in line with the Bangko Sentral ng Pilipinas’ Circular No. 1085. We welcome feedback on this section and any matter concerning the ESG performance of our business at [email protected].
Corporate Governance
Responsible corporate governance – built on principles of integrity, transparency, and accountability – is central to our business. Our Board of Directors (the Board) is committed to upholding the highest standards and best practices in corporate governance and ensuring compliance with applicable laws, regulations, and ethical business practices across the Group. The Board is ably supported by five committees in the performance of its functions, namely: 1. Audit and Risk Management Oversight Committee (ARMOC) 2. Compensation Committee 3. Nomination Committee 4. Related Party and Corporate Governance Committee 5. Digital Committee

7
The Related Party and Corporate Governance Committee works closely with the Board in overseeing the implementation of the Company’s corporate governance framework, including periodic reviews to consider the growing complexity of the Company’s business operations, changes in the regulatory environment, and new business strategies adopted. The Nomination Committee and Compensation Committee handle the nomination and election process for directors, including review of remuneration packages. The Company’s corporate governance policies – including its Code of Business Conduct and Ethics (Code of Conduct), Revised Corporate Governance Manual, Conflict of Interest Policy, Insider Trading Policy, and Related Party Transactions (RPT) Policy – are observed across the Group. The Related Party and Corporate Governance Committee is also responsible for implementing the RPT Policy and evaluating and monitoring relations among counterparties to ensure that any related party transactions are conducted on an arm’s length basis. In 2020, no incidents of fraud or misconduct were reported by employees, shareholders or other stakeholders that would have a significant effect on FDC’s financial statements or operations. No Directors within the Group were removed or disciplined for corruption. For specific information and disclosures on anti-corruption within EW and FLI, please refer to the respective EW and FLI Sustainability Reports. Anti-corruption data for FAI, FHC and FDCUI are not available at this time; however, we will work to expand our disclosures in this area for future reporting periods. Group-wide training on corporate governance was provided again in 2020, attended by 148 Directors and Officers from across FDC Group Topics included Fraud and Financial Crimes Amidst the Pandemic; Planning for the Complexities of an Uncertain Future; Ani-bribery and Anti-corruption; and Cybersecurity.
Audit and Risk Management Oversight
ARMOC is responsible for the Company’s financial reporting and internal control systems and procedures, and is assisted by the Chief Audit Executive and its staff. Throughout the year, the internal audit group performs onsite visits and reviews, discusses audit findings, and follows through with remediation actions. In addition, ARMOC is responsible for coordinating with external auditors regarding audit scope, timetable and requirements. ARMOC also reviews and approves the Company’s annual audited financial statements before their submission to the Board. At FDC, we recognize that risk is an inherent part of doing business and that the successful management of risks is a critical factor in growing our business and optimizing stakeholder value. The Company has a Chief Risk Officer tasked to review, discuss, and document the enterprise risk management plan of the industry segments of the Group with appropriate guidance from the ARMOC.
8
Moving forward, we intend to integrate sustainability considerations into our Group-wide Enterprise Risk Management (ERM) program, in order to strengthen our understanding of ESG risks and opportunities, improve our sustainability management, and enhance overall business performance.
Compliance with Laws and Anti-Corruption
FDC is committed to ensuring compliance with all relevant laws and regulations, as well as ethical business practices, across the Group. The Company’s Compliance Officer monitors, reviews, evaluates, and ensures compliance by the Company, its officers and directors with the relevant laws, rules and regulations, and the provisions and requirements of the Revised Corporate Governance Manual. We recognize that bribery and corruption are particular ESG risks that can undermine trust in a company and have direct impacts on its performance. We take corruption seriously and are committed to ensuring compliance with applicable laws and regulations on anti-corruption, anti-bribery, and money laundering, among others. We also adhere to standards of conduct to prevent or regulate the offer or receipt of gifts or other advantages that may induce dishonest, improper or illegal conduct, or which may create an actual or potential conflict of interest. Our Code of Conduct provides a framework for all of FDC’s operations and sets out standards of behavior for all employees, including day-to-day business conduct and customer service interactions. It is also published on our Company website. FDC’s Human Relations and Administrative Services Department is responsible for implementing and monitoring compliance with the Code of Conduct, and is supported by the Compliance Officer and business units. All employees and members of our senior management team are provided with copies of the Code of Conduct and promptly notified of any updates or revisions, ensuring that they fully understand the Company’s ethical standards. Implementation of the Code of Conduct’s guidance on anti-bribery and anti-corruption is supported by our RPT Policy, Code of Discipline, Employee Manual, Insider Trading Policy, Conflict of Interest Policy and, Whistle-Blowing Policy, which are observed across the Group. Additional information on these policies may be found on the Company website.
Sustainability Governance
FDC is committed to responsible corporate governance based on integrity and accountability to our stakeholders. We maintain strong governance practices to ensure proper monitoring of risk management, internal controls, and other compliance matters. The Board is responsible for setting the Group’s overall approach to ESG matters, evaluating ESG-related risks and opportunities, implementing sustainability initiatives, and measuring their impacts. It is supported by our senior management team, including our Chief Risk Officer and Chief Audit Executive, who implement risk management and internal control systems.

9
FDC is working to strengthen its sustainability governance structure and mechanisms, in order to integrate economic, social, and environmental considerations into business decision-making processes at all levels across the Group.

10
Our People Developing the best in our people is one of our core values. We work to build up a team that is both entrepreneurial and intrapreneurial, guided by the timeless philosophies of our founder, Andrew Gotianun. We strive to be a good corporate citizen for our team, our neighbors, our community, our country, and the world. Our employees are essential to the success of our business and we deeply value their contributions. We encourage all of our subsidiaries to cultivate a work environment where employees are healthy, engaged, and productive. To accomplish this, we focus on investing in our employees by rewarding performance, promoting wellbeing and productivity, and fostering a culture of mutual respect and inclusion.
Head Office Employee Profile
As of December 31, 2020, we employed 38 people in our Head Office, up slightly from 36 in 2019.3 Most of our people are employed full-time on a permanent basis. Twenty are employed at the executive level, and more than half of our Head Office team are women. For the Head Office, the attrition rate in 2020 was 0%.4 KPI: Head Office Employees, by gender
Category As of Dec 31, 2020 As of Dec 31, 2019
Male 17 16
Female 21 20
Total 38 36
KPI: Head Office Employees, by employment type
Category As of Dec 31, 2020 As of Dec 31, 2019
Executive 20 19
Manager 9 8
Supervisor 1 1
Rank and File 7 7
Consultant 1 1
Total 38 36
3 This figure reflects our permanent full-time employees and consultants. 4 This figure reflects only the positions that were dissolved due to job discontinuation and retiring employees. New hires were excluded from this computation as these were a result from filling in newly created roles from business expansion. This figure does not consider cross-posting employees and those transferred to other FDC subsidiaries. Moving forward, the Company will track this indicator across the group for consistency and comparability.

11
Group Employee Profile
As of December 31, 2020, the Group employed a further 10,269 people across its 5 subsidiaries.5 The majority of these were employed in EW in the supervisory and rank and file levels. KPI: Employees by gender, 2020
Male Female Total
EW1 2,505 4,657 7,162
FLI2 514 748 1,262
FAI 144 237 381
FHC 741 445 1,186
FDCUI 206 72 278
Total 4,110 6,159 10,269
Percentage 40% 60% 100% 1 Covers EW and its subsidiary, East West Insurance Brokerage, Inc. EW subsidiary East West Rural Bank, Inc. and EW affiliate East West Ageas Life Insurance Corporation are omitted. 2 FLI subsidiaries omitted.
KPI: Employees by Employment Type, 2020
EW FLI FAI FHC FDCUI Total
Executive 246 57 18 57 7 385
Manager 2,012 235 73 210 21 2,551
Supervisor 855 255 81 261 105 1,557
Rank & File 4,042 715 209 658 140 5,764
Consultant 7 0 0 0 5 12
Total 7,162 1,262 381 1,186 278 10,269
Hiring and Benefits
We have set Group-wide requirements and expectations through our Employee Handbook and various Human Resources policies, to ensure that all aspects of employment – including fair hiring practices, compensation and dismissal, working hours, rest periods, anti-discrimination, and employee welfare – meet or exceed local legal requirements. To attract and retain talent, all full-time employees across the Group receive competitive remuneration packages with benefits including medical care, group life and accident insurance, and retirement benefits. In addition, subsidiaries within the Group provide additional benefits, ranging from paid leave for vacation, illness, maternity and paternity, change of civil status, birthday, bereavement and calamity leave, car financing assistance, and housing assistance, among others. The Company offers Health Maintenance Organization (HMO) coverage for all regular employees. We invest in our employees and, with respect to hiring, it is our preference to promote from within before expanding our search outside the Company. This lends itself to fostering a workplace culture
5 This figure reflects permanent full-time employees.

12
in which strong bonds are formed between individuals with a keen awareness of our business and customer needs. There are no collective bargaining agreements in place within the Group.
Learning and Development
We believe that cultivating a highly skilled workforce and supporting employees’ long-term career goals is an integral part of sustaining and strengthening our economic performance. Within our Head Office, we encourage our employees to take part in external training programs or seminars relevant to the performance of their duties. We encourage our subsidiaries within the Group to invest time and resources in nurturing talent through training and development, to ensure that their employees have the knowledge, skills and experience required to fulfill their potential and meet their business performance goals. In addition, our subsidiaries within the Group regularly assess employee training needs to improve productivity and efficiency, as well as to enhance professional and personal growth. In 2020, across our subsidiaries we provided more than 250,000 hours of training to 10,269 employees – an average of 24 hours per employee. Training programs cover a wide variety of topics ranging from new employee orientation and skills enhancement to career development, customer service and environmental standards and certification. Examples in 2020 included:
Training Program Description Strategic Planning and Thinking
A three-hour course designed to help FLI employees understand the importance of thinking strategically in business and apply the tools to come up with successful strategies to meet their individual and group goals.
How to Cope with Change: Making Sense of the "New Normal"
A series of 2-hour training sessions designed to support FLI employees as they learn to cope with change and make sense of the new normal after the pandemic. Participants learn tips and exercises to manage their mental health and emotions during the pandemic.
Change at Play: Engaging Millennials in a Rapidly Transforming World
A soft-skills behavioral training course for FLI employees on how to engage well with millennials, as they make up the majority of our customer base.
New Employees Orientation Program (NEOP)
A 3-day orientation for new EastWest employees designed to introduce to them the Bank, its vision, mission and core values, and equip them with the fundamental knowledge needed to perform their tasks.

13
Service Manager’s Development Program (SeMDP)
A program that provides EastWest candidates with targeted training in customer service and management to prepare them for the Service Manager position.
Account Officer Development Program
A program that aims to equip EastWest Account Associates with the knowledge and skills necessary for career development. Includes eight part-time study modules focused on tailored skills development.
Beyond training, all regular employees across the Group take part in an annual performance evaluation.
Diversity and Inclusion
FDC is committed to ensuring that employees across the Group are treated with dignity and respect in the workplace. The Company does not discriminate on the basis of gender, age, and ethnic, political, religious, or cultural backgrounds and does not tolerate harassment of any kind or child labor. Pursuant to FDC’s Revised Manual on Corporate Governance, the Company’s Nomination Committee works to ensure that members of the Board are diverse in terms of age, culture, gender, and expertise. We are proud of our record of valuing and supporting diversity throughout the Company, with female employees representing 55% of our Head Office team. In addition, 3 out of 7 Directors on our Board of Directors are women, representing 43% of our Board. This reflects our strong commitment to gender diversity and fair hiring practices. Additional information about our Board members can be found in the Corporate Governance section of this Annual Report.
Employee Engagement
We deeply value our employees and encourage our subsidiaries across the Group to engage their employees through a variety of events and activities in and out of the office to encourage personal development and foster teamwork. These events not only contribute to employee wellbeing, they also create stronger connections between colleagues and increase employee satisfaction and productivity. For additional information on employee engagement programs within EW and FLI, please refer to the EW and FLI Sustainability Reports, respectively.
Health, Safety, and Wellbeing
We value our employees’ health and wellbeing and are committed to providing all employees across the Group with a safe and secure working environment. This has proven particularly important at a time of heightened caution due to COVID-19.

14
Spotlight: Keeping our people safe during a global pandemic
During the pandemic and Enhanced Community Quarantine (ECQ), many of our employees across the Group, including our Head Office team, were able to work from home, thus ensuring business continuity while protecting their safety. We also conducted our Annual Stakeholders’ Meeting online for the first time. A major enabler of these changes was our digitization drive, detailed in the following section of this report. However, many of our business activities cannot be delivered remotely. We responded diligently, so that our employees could continue to provide vital services to our customers and communities, while providing for themselves and their families. At FLI, a number of working groups and committees were formed, facilitating a safe transition back to work as restrictions began to ease. These included: a Social Distancing Group, to ensure compliance with national social distancing policies, including by revising office floor plans; a Sanitation Group, which set up sanitation stations, distributed sanitation kits to employees, and led weekly office deep cleaning; and a B2B Construction Group, which developed the Filinvest Manual for Back-to-Business in Construction, as well as exhaustive checklists, guidelines and dashboards to ensure that project sites conform to the shifting policies of various government agencies and local government units. FDCUI’s Misamis power plant in Mindanao is a critical part of the local infrastructure. Businesses and households depend upon our energy to keep their lives and businesses running, yet having employee onsite during ECQ presented challenges in terms of keeping their family and the community safe. To ensure that those working at the plant did not need to mix with other households, FDCUI provided employees with quarantine housing, as well as food supplies. Employee health, safety, and welfare policies applicable to our Head Office are described in the Company’s Safety Manual, which provides clear standards and guidance on occupational and workplace safety, employee health, fire safety and prevention, as well as an emergency action plan. It also details procedures for incident reporting and investigation mechanisms to address health and safety issues and prevent recurrence. Our subsidiaries within the Group each develop and implement appropriate occupational health and safety (OHS) policies and programs, in compliance with local regulatory requirements, to continuously improve safety performance within their workplaces. Across the Group, more than 6 million safe man-hours of work were delivered in 2020 (excluding EastWest, for which data was not available). Across our Head Office and all of our major subsidiaries, there were no work-related fatalities or instances of work-related ill-health. FHC recorded eight instances of work-related injury.

15
For additional information on health, safety, and wellbeing programs within EW and FLI, please refer to the EW and FLI Sustainability Reports, respectively. Health and safety data for FAI and FHC is not available at this time; however, we are working to expand our disclosures in these areas for future reporting periods.

16
Our Customers Providing superior value to our customers is one of our core values. We do this cost-efficiently, and without sacrificing safety, quality or the environment. We recognize that conducting our business with integrity and high standards is central to our long-term success and underpins the Group’s ability to serve and retain customers. With no direct customers at the Head Office level, our subsidiaries consider their most important stakeholders to be their customers and place great importance on continuously delivering excellent service and driving stakeholder value. To ensure superior service, each operating company within our Group implements a suite of policies and procedures that cover customer privacy and data protection, service quality improvement processes, customer satisfaction, and complaints.
Always Serving our Customers
The pandemic presented unprecedented challenges for business and service continuity. However, we recognize how vital our services are to our customers and communities in their everyday lives – from electricity, to banking, to housing – and worked hard to ‘keep the lights on’ throughout this difficult period. As we highlighted in the previous section, our office-based employees quickly adapted to remote working. In addition, special training enabled our employees to continue to deliver excellent customer service. At FLI, technical training was provided for staff in customer-facing positions about the different options and offerings they could provide to clients in compliance with the Bayanihan Heal as One Act.
Spotlight: Digitization pays dividends
In 2020, the value of our continued investments in upgrading our digital infrastructure and governance came sharply into focus. We recognize the increasingly central role that digital plays in delivering smooth and efficient services, and in our customers’ everyday lives. It proved timely that in 2020 we established a new Digital Committee at Board level to oversee our digital transformation across the Group. The Digital Committee’s responsibilities include keeping abreast of emerging technologies and trends; providing guidance on the development and implementation of the Group’s highest impact digital initiatives; monitoring the quality and progress of the overall technology portfolio and projects; and reviewing proposals for significant technology investments. As well as enabling our employees to efficiently switch from office-based to remote working, our ongoing digitization drive paid dividends as it enabled us to continue to provide high-quality services to our customers even throughout the quarantine. For example, our banking subsidiary launched the EastWest System Tech Assistant (ESTA) chatbot, enabling customers to view real-time

17
credit card balances and transactions, request credit limit increases, apply for loans, convert rewards points to cash rebates, report lost cards, change contact details, enroll in electronic Statement of Account (e-SOA), and much more. By the end of 2020, more than 105,000 customers had signed up to ESTA. Also in 2020, we established f(dev), a new digital venture builder and transformation engine within FDC. One of its main pillars is building digital-first businesses in underserved market segments. For example, through a partnership with leading SME lender Investree Indonesia, f(dev) has secured a license for Filinvest to establish Investree Philippines; this will be the country’s first SEC-approved crowdfunding portal geared towards providing financing for small and medium enterprises. We pride ourselves on excellent customer service and place great importance on listening to our customers. We aim to ensure customers across the Group are treated fairly and respectfully and provided with accessible, fair, accountable, timely and efficient means for resolving complaints. We have established a Customer Care Unit to address customer complaints or suggestions, conduct customer satisfaction surveys and communicate with customers via effective channels, including our website, social media, direct interaction, a customer service hotline, e-mail and SMS, among others. Across the Group, our subsidiaries aim to create a culture of courtesy and service, and instill best practices in their employees to enable them to deliver superior service to their customers. Examples of programs within the Group include regular training on topics such as improving listening and verbal and written communication skills, and problem-solving and conflict resolution. In addition, subsidiaries within the Group seek customer feedback through customer satisfaction surveys and other means so that they can better understand their customers and address their needs. Mindful of the risks posed by the rapidly evolving digital environment, we encourage subsidiaries within the Group to educate and empower their customers to be more risk-aware and to provide them with requisite skills and know-how to avoid fraud, scams, and cybercrimes when using their products and services. For additional information on customer service programs within EW and FLI, please refer to the respective EW and FLI Sustainability Reports.
Protecting Privacy
We value our customers’ trust and strive to protect their personal data, information, and privacy. Our Privacy Policy, observed across the Group, outlines our commitment to respecting and protecting customer privacy and personal information in accordance with Republic Act No. 10173 or the Data Privacy Act of 2012, its Implementing Rules and Regulations, and other issuances of the National Privacy Commission. In 2018, we created the role of Data Protection Officer (DPO), who is responsible for the implementation and oversight of a centralized data protection program with a team of supporting
18
officers from each operating company across the Group. The program includes education and awareness initiatives, training of personnel directly involved in the processing of personal information, and privacy impact assessments for new projects or processes, as well as internal privacy compliance audits. To assist the DPO and support implementation, each of our subsidiaries within the Group has an associate DPO who is responsible for sending regular notifications and reminders on data protection policies and procedures to concerned employees. To further strengthen privacy protocols within our Head Office, FDC is currently developing a Privacy Manual that will provide specific procedures to prevent and mitigate data breaches. EW, which handles sensitive customer information due to the nature of its business as a bank, has a robust Consumer Protection Program, that sets forth a framework for ensuring that risks associated with consumer protection are identified, assessed, monitored, mitigated and controlled in compliance with the Financial Consumer Protection program of the Bangko Sentral ng Pilipinas (BSP Circular No. 857 (2014)). Our commitment privacy extends to safeguarding customer data and records and securing our operational and e-commerce systems against cyber-security threats. The Group runs two data centers that house all proprietary and third-party software of the Group, together with underlying license agreements. To ensure continued operation in the event of natural disaster, the data centers are located more than 20 kilometers from each other and are backed up daily. Systems are also in place to protect the Group’s IT systems against breaches or computer hacks, including secured network perimeter, active directory authentication, access and privilege rights management, and workstation patch updating. To our knowledge, during the reporting period, there were no data breaches across the Group that resulted in a material loss of data. For additional information on privacy and data protection programs within EW and FLI, please refer to the respective EW and FLI Sustainability Reports.

19
Serving our Communities At FDC, we are proud of our longstanding commitment to giving back to the communities in which we operate. We recognize that the Group’s business activities have significant economic, social, and environmental impacts on local communities, and we aspire to make a positive impact that contributes to their long-term prosperity. Last year brought many challenges for our communities, from the Taal Volcano eruption in January, to typhoons Rolly and Ulysses in November, and of course the COVID-19 pandemic throughout the year. As well as continuing to provide our vital services during these difficult times, we also leveraged our resources, finances and manpower, providing practical help to communities and those in need.
Our COVID-19 Community Response
At the onset of the pandemic, Filinvest Group set aside a Php100 million COVID war chest towards various initiatives, including support for LGUs, the medical sector, and the national government. We have since gone over and beyond the pledged amount as a manifestation of our commitment in the Philippines’ fight against COVID-19. We joined and actively participated in Task Force T3 (Test, Trace, and Treat), a public-private group led by the Department of Health (DOH) and Testing Czar Vince Dizon, together with partners from the private sector. Filinvest assisted in the development of COVID Kaya, a COVID-19 case information and contact tracing system called COVID Kaya for use in all healthcare and testing facilities nationwide the system as well as the creation and roll out of the user training program nationwide. Our most important project in the fight against COVID-19 was making data available to the country’s key decision-makers. Filinvest worked with the Department of Health and Department of Science and Technology to-fast track the development of a dashboard for the Inter-Agency Task Force on Emerging Infectious Diseases by sponsoring the data warehouse and data analytics needed to get it up with timely and accurate data. Filinvest recognizes the sacrifices of our frontliners in service of our kababayans. As a way to honor their valuable contribution to the country’s continued fight against the virus, part of the Php 100 million pledge went into the provision of medical supplies, including PPE, rapid test kits, ventilators, a biomedical freezer and relief goods to various hospitals and government units nationwide, such as the Malacanang, Regional Institute for Tropical Medicine, Philippine General Hospital, Lung Center of the Philippines, San Mateo City, Cebu Province, Cebu City, Misamis Oriental, Davao City, and Lapu-lapu City. At the start of the enhanced community quarantine in Luzon, The Palms Country Club, was among the first to open its doors to health care frontliners, with workers at the Research Institute for Tropical Medicines being provided with temporary shelter that was accessible to their place of

20
work. The Palms Country Club provided the accommodation, while Filinvest pledged to shoulder utility charges during this period, including power and water. We also partnered with Temasek Foundation, one of the largest government-owned and funded organizations in Singapore, for the export of medical equipment and PPE to the Philippines. FDC covered the cost of shipping 400 Bi-level Pap Machines, 39 Dialysis Machines and 100 surgical masks, as well as distribution of the surgical masks.
Spotlight: Our COVID-19 quarantine center
We believe that serving our communities effectively requires quick thinking in the face of adversity – rapidly deploying resources that can help meet the needs of the day. As the number of coronavirus cases in Manila rose, and with it demand for quarantine facilities, we realized that we could help. In ordinary times, the Filinvest Tent is a conference center within Filinvest City, in the south of the Manila. With the conference calendar suspended, this facility was under-utilized. Our colleagues at FAI coordinated with the relevant local government units and converted the tent into a 108-bed mega quarantine center. Filinvest Corporate City Foundation, Inc. and Filinvest Alabang, Inc. funded the required construction materials, while EEI Corporation, a leading construction company, provided manpower.
As demand continued to increase, we deployed further resources to support the COVID-19 response. Utilizing outdoor space in the Filinvest Tent parking area, from December 2020 we annexed 132 container home units, providing additional quarantine capacity for 128 affected individuals.
Further Community Service Initiatives in 2020
Subsidiaries within the Group have implemented further community service and engagement initiatives focused on key areas including education, environmental protection and health. We share some highlights below.
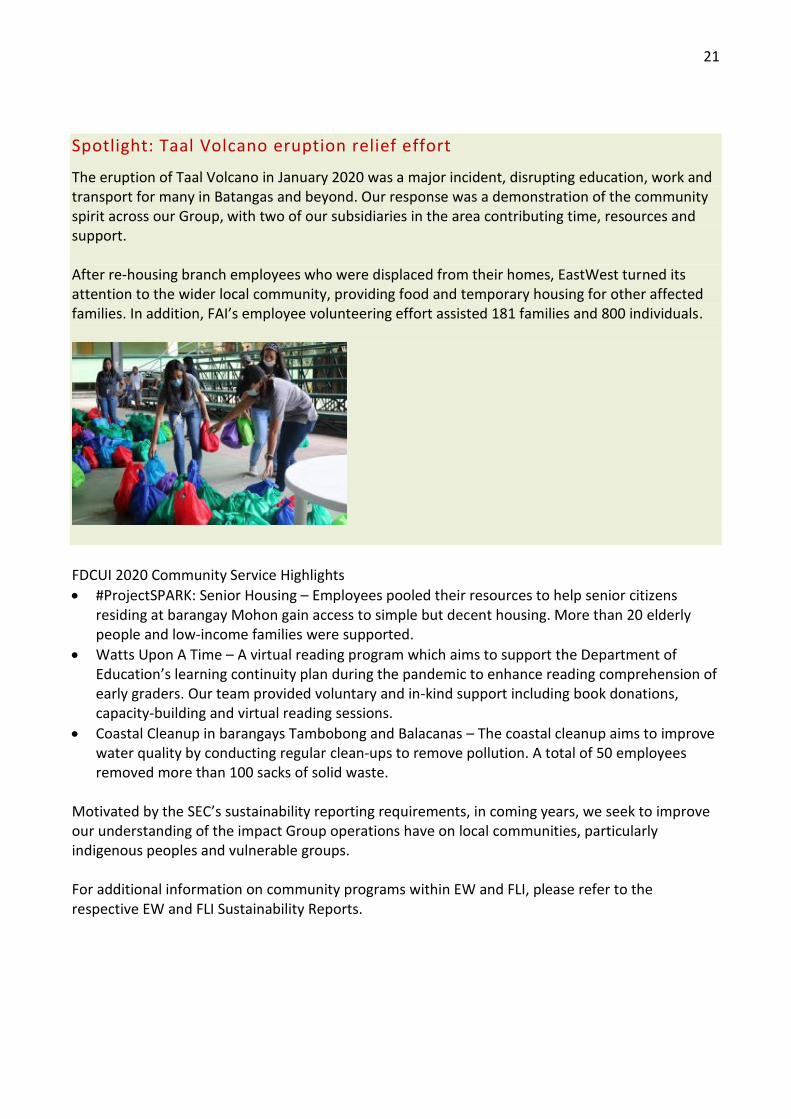
21
Spotlight: Taal Volcano eruption relief effort
The eruption of Taal Volcano in January 2020 was a major incident, disrupting education, work and transport for many in Batangas and beyond. Our response was a demonstration of the community spirit across our Group, with two of our subsidiaries in the area contributing time, resources and support. After re-housing branch employees who were displaced from their homes, EastWest turned its attention to the wider local community, providing food and temporary housing for other affected families. In addition, FAI’s employee volunteering effort assisted 181 families and 800 individuals.
FDCUI 2020 Community Service Highlights
• #ProjectSPARK: Senior Housing – Employees pooled their resources to help senior citizens residing at barangay Mohon gain access to simple but decent housing. More than 20 elderly people and low-income families were supported.
• Watts Upon A Time – A virtual reading program which aims to support the Department of Education’s learning continuity plan during the pandemic to enhance reading comprehension of early graders. Our team provided voluntary and in-kind support including book donations, capacity-building and virtual reading sessions.
• Coastal Cleanup in barangays Tambobong and Balacanas – The coastal cleanup aims to improve water quality by conducting regular clean-ups to remove pollution. A total of 50 employees removed more than 100 sacks of solid waste.
Motivated by the SEC’s sustainability reporting requirements, in coming years, we seek to improve our understanding of the impact Group operations have on local communities, particularly indigenous peoples and vulnerable groups. For additional information on community programs within EW and FLI, please refer to the respective EW and FLI Sustainability Reports.

22
Our Environmental Impact We believe that efficient management of resources across the Group is an essential part of creating stakeholder value. We are working toward identifying and managing our environmental impacts across the Group, including in the areas of energy, water and waste, through the implementation of energy and resource-efficient practices. We encourage subsidiaries within the Group to identify and manage their environmental impacts and integrate ESG considerations into their decision-making processes. Given the nature of their businesses, FLI and FDCUI have environmental policies and robust environmental management programs in place to help them minimize their impacts on the environment and manage resources more efficiently. FDCUI has environmental management programs as part of its compliance to Environmental Compliance Certificate (ECC) conditions. As one of the largest property development firms in the Philippines - with a portfolio of more than 25 million square meters under management – Filinvest Land, Inc. is particularly focused on minimizing negative environmental impacts in the built environment through both the services it provides to its clients and its operations. FLI’s Environmental Compliance Policy aims to provide effective environmental programs for the prevention of pollution, preservation of natural resources, and solid waste management, in compliance with relevant local and national environmental laws and regulations. The policy mandates compliance to local environmental laws and regulations (such as DENR and the National Building Code of the Philippines), environmental impact planning, and measures to mitigate the potentially negative impact that a new building or community development project can create for both the pre-construction and construction/operations phases. As part of its management approach to identifying and managing significant impacts of its buildings on the environment and natural resources, FLI employs sustainable building practices and strives to achieve certification for its buildings under relevant environmental building assessment schemes, such as LEED,6 which provide benchmarks and objective standards against which it can measure its performance. For additional information on environmental impact and resource management within FLI, please refer to the ESG section in the FLI Sustainability Report.
Environmental Initiatives
We continue to implement a number of specific green initiatives and partnerships, which seek to enhance our environmental performance in areas of particular relevant to our business operations, products and services.
6 LEED® stands for Leadership in Energy & Environmental Design, which is an internationally recognized green building standard established by the United States Green Building Council. Official website: www.usgbc.org/leed

23
Spotlight: Recognition for Filinvest City’s green credentials
FAI’s Filinvest City is a visionary township within Muntinlupa, Metro Manila. It is designed to provide modern conveniences in harmony with nature: a residential haven, business central, leisure destination, learning and education zone, and medical and wellness hub amid lush, green landscapes in a modern urban development. It was always our ambition for Filinvest City to be an exemplar of environmental best practice within an urban setting. In 2020, this dream was realized as the neighborhood became the first central business district in the Philippines to be awarded the prestigious LEED Gold certification, making it one of the largest green-certified developments in Southeast Asia.
Filinvest City also won a Silver Award at the inaugural Mobility Awards, as one of the most bike-friendly workplaces in the National Capital Region (NCR). This highlighted our efforts to enable sustainable travel within the City, in particular through the integration of dedicated bike lanes. This proved especially valuable when COVID-19 led to the temporary suspension of public transport, forcing commuters to seek alternative modes of travel to and from work. Given that Manila did not have a bike-riding culture previously, Filinvest City has become a model for other communities to emulate. Furthermore, FAI’s Botanika residential development, located at Filinvest City, has received multiple awards for its green leadership. In 2020, these included the Asia Pacific Property Awards’ Five-star Sustainable Residential Development for the Philippines; the Philippine Green Building Council’s Leadership in Sustainable Design and Performance Award; and the Department of Energy’s Recognition Awards for Energy Efficient Green Buildings. To reduce the carbon footprint of our power generation, in 2018 FDC Utilities, Inc. entered into a 60:40 joint venture with Engie Services Philippines (Engie), bringing solar energy solutions to large industrial and commercial customers across the Philippines. Further, to offset emissions from our fossil-fuel powered plants, we are talks with local NGOs to explore how to expand our carbon sink programs in Misamis Oriental province. In 2017, Filinvest Land, Inc. also partnered with Engie in a joint venture to develop the Philippines’ largest district cooling system (DCS) at Northgate Cyberzone within Filinvest City. The 12,000-ton

24
centralized DCS plant caters to 15 buildings through a 3.4km underground distribution network of steel pipes, with a lifespan of 20 years. The system provides numerous benefits including reduced CO2 emissions, 30-40% lower energy consumption, reduced water consumption, and noise reduction.
Environmental Profile
We recognize that growing stakeholder demands for transparency have led to more stringent environmental reporting requirements, including the SEC ESG Guidelines. We are working to further develop and strengthen our data collection procedures and adopt a systematic approach to data collection across the Group in the coming years to enable us to better identify, disclose, and manage our environmental impacts. In addition, we are exploring strategies to assess ESG-related risks and opportunities in order to address air quality, climate change, resource management, and waste. Because the activities and operations of our Head Office are largely office-based, with only 37 employees, resource consumption and environmental impacts are limited and environmental performance data is not included for this reporting period. Nevertheless, we are working toward monitoring our environmental performance with the aim of our minimizing impacts and disclosing them in the future. Our most significant energy and emissions impacts within the Group arise in our real estate and power businesses and, to a lesser extent, our hotel business. The following tables provide environmental performance data during the reporting period for the following subsidiaries within the Group: FLI, FAI, FHC, and FDCUI. As would be expected, our energy consumption and emissions fell this year, with many of our business operations restricted due to coronavirus. For example, FAI consumed 3,998 MWh of electricity in 2020, compared to 5,147 MWh the previous year. FDCUI burned 832,785 liters of diesel in 2020, a sharp drop from 1,442,669 liters in 2019. Of our total electricity consumption in 2020, 92 kWh were from renewable sources. KPI: Energy Consumption, 2020
Unit FLI FAI FHC FDCUI Total
Gasoline Liters 134,9945 90 0 0 135,085
Liquefied Natural Gas / LPG cbm 0 0 48,636 0 48,636
Diesel Liters 453,300 687,356 190,865 832,785 2,164,306
Electricity kWh 133,332,429 3,997,636 18,328,267 197,196,405 352,854,737
Coal Tonnes 0 0 0 949,061 949,061

25
KPI: Air Emissions – Green House Gases, 2020
Unit FLI FAI FHC FDCUI Total
Direct (Scope 1) GHG Emissions CO2e 1,489 1,787 496 2,165 5,937
Energy indirect (Scope 2) GHG Emissions CO2e 94,960 2,847 13,053 140,443 251,303
For water consumption and waste generated, the reductions were even more dramatic. For example, FLI consumed just 44,376m³ of water in 2020, compared to 158,585m³ the previous year. FHC produced 1,879 tonnes of residual/landfilled waste in 2020, down from 2,795 tonnes the previous year. However, we also saw large increases in the volume of hazardous waste generated in 2020. Our efforts to integrate environmental best practices into our property portfolio began to show results this year. In 2019, just 16 tonnes of waste from FLI estates was composted, while in 2020 that figure increased significantly, to more than 500 tonnes. KPI: Water consumption, 2020
Unit FLI FAI FHC FDCUI Total
Water withdrawal CBM 2,220,118 98,878 421,589 507,059,417 509,800,003
Water discharged CBM 1,540,546 54,502 295,113 506,681,177 508,571,338
Water recycled and reused CBM 70,627 0 21,753 567,722 660,102
Water consumption CBM 679,572 44,376 126,477 378,240 1,228,665
KPI: Waste, 2020
Non-hazardous waste (tonnes) Unit FLI FAI FHC FDCUI Total
Reusable Tonnes 33 <1 0 <1 34
Recyclable Tonnes 17,318 1,218 38 0 18,573
Composted Tonnes 508 <1 310 0 819
Residuals/landfilled Tonnes 3,034 143 1,879 69 5,124
Hazardous waste (kg) Unit FLI FAI FHC FDCUI Total
Total weight of hazardous waste generated kg 26,866 1,279 12,269 15,990 56,404
Total weight of hazardous waste transported kg 7,919 0 8,765 5,200 21,884
To our knowledge, FDC and its subsidiaries across the Group comply with all applicable local environmental laws and regulations. The Group takes full responsibility for the environmental impacts of its operations and manages any foreseeable consequences with an eye toward minimizing impacts. In 2020, minimal fines arose due to non-compliance with environmental laws and/or regulations.

26
Our Suppliers FDC encourages subsidiaries within the Group to support local enterprises and local supply chains by investing in the local Philippine market. This involves building strategic relationships and partnerships with suppliers and through our championing of small and medium enterprises. Our centralized Supply Chain Management division handles procurement on behalf of the Group and oversees the implementation of our Supplier Accreditation Program, which was established in 2015. The program outlines ways in which the Group can maintain quality management by checking for various ISO, DENR, and OSHA certifications or programs in place (such as ISO 9000/9002 and 14000 or equivalent environment programs) and by requesting data on the sources of raw materials (percentage of local/international). Regular reviews and assessments are also conducted to ensure our supply chain partners comply with local laws and our requirements. In 2020, 94.4% of our 1,338 suppliers across the Group were Philippines-based and 5.6% were from other countries. By measuring our progress and enhancing transparency in our supply chain decisions, we are working to shape a value chain that positively influences the market and encourages the industries in which the Group operates toward more sustainable operations. In coming years, we seek to improve our understanding of the impact our operations have on our supply chain and suppliers. We will also assess ESG related risks and opportunities as related to the relationships and impacts we have on our suppliers and overall value chain. For additional information on suppliers and supply management within EW and FLI, please refer to the ESG sections in the respective EW and FLI Sustainability Reports.

27
SEC Content Index
Disclosures Reporting location Remarks/ explanation
Company details
Name of Organization
Content Index About this Section
Filinvest Development Corporation
Location of Headquarters 6th Floor, The Beaufort, 5th Avenue Corner 23rd Street, Bonifacio Global City, Taguig City 1634 Metro Manila, Philippines
Location of Operations Philippines
Report Boundary: Legal entities included in this report
East West Banking Corporation (EW), Filinvest Land, Inc. (FLI), Filinvest Alabang, Incorporated (FAI), Filinvest Hospitality Corporation (FHC), and FDC Utilities, Inc. (FDCUI)]
Business Model Conglomerate
Reporting Period January 1 – December 31, 2020
Highest Ranking Person for this report Patricia Carmen D. Pineda
SAVP - Group Investor Relations Officer
A. Economic disclosures Reporting location Remarks/ explanation
Economic Performance
Direct Economic Value Generated and Distributed
General Disclosures
Management Approach
The Impact and Where it Occurs About this Section
Stakeholders Affected ESG Risks and Opportunities
KPIs Direct economic value generated (Revenue) Annual Report Direct economic value distributed Annual Report
Climate-Related Risks and Opportunities

28
Disclosures Reporting location Remarks/ explanation
General Disclosures
Governance
-- Omitted – Data not available at time of
reporting.
Strategy
Risk Management
Metrics and Targets
Procurement Practices
Proportion of Spending on Local Suppliers
General Disclosures
Management Approach
The Impact and Where it Occurs Our Suppliers
Stakeholders Affected ESG Risks and Opportunities Our Suppliers
KPI Percentage of procurement budget used for significant locations of operations that is spent on local suppliers
-- Omitted – Data not available at time of reporting.
Anti-Corruption
Training on Anti-Corruption Policies and Procedures
General Disclosures
Management Approach
The Impact and Where it Occurs About this Section/ Our Approach to Sustainability
Stakeholders Affected ESG Risks and Opportunities
KPIs
Percentage of employees who have received written communication about corporate anti-corruption policies and procedures
Our Approach to Sustainability
Percentage of business partners who have received written communication about corporate anti-corruption policies and procedures
Omitted – Data not available at time of reporting.
Percentage of directors and management who have received anti-corruption training Our Approach to
Sustainability
Percentage of employees who have received anti-corruption training

29
Disclosures Reporting location Remarks/ explanation
Incidents of Corruption
General Disclosures
Management Approach
The Impact and Where it Occurs Our Approach to Sustainability
Stakeholders Affected ESG Risks and Opportunities
KPIs
Number of incidents in which directors were removed or disciplined for corruption
Our Approach to Sustainability
Number of incidents in which employees were dismissed or disciplined for corruption
Omitted – Data not available at time of reporting.
Number of incidents when contracts with business partners were terminated due to corruption
Omitted – Data not available at time of reporting.
B. Environment Disclosures7 Reporting location Remarks/ explanation
Resource Management
Energy consumption within the organization and Reduction of Energy Consumption
General Disclosures
Management Approach About this Section/Our Environmental Impact
The Impact and Where it Occurs Our Environmental Impact
Stakeholders Affected ESG Risks and Opportunities
Environmental Profile
KPIs Energy consumption - by fuel type Energy reduction - by fuel type
Water consumption within the organization
General Disclosures
Management Approach
The Impact and Where it Occurs Our Environmental Impact
Stakeholders Affected ESG Risks and Opportunities
Environmental Profile KPIs Water consumption within the organization
7 Except for electricity, we do not currently collect environmental data for our operations so this data is not available for disclosure.

30
Disclosures Reporting location Remarks/ explanation
Water withdrawal Water consumption Water recycled and reused
Materials Used by the Organization
General Disclosures
Management Approach
The Impact and Where it Occurs Our Environmental Impact
Stakeholders Affected ESG Risks and Opportunities
KPIs
Materials used by weight or volume -- Omitted – Data not available at time of
reporting. Percentage of recycled input materials used to manufacture the organization’s primary products and services
-- Omitted – Data not available at time of reporting.
Ecosystems and Biodiversity
General Disclosures
Management Approach
The Impact and Where it Occurs Our Environmental
Impact
Stakeholders Affected
ESG Risks and Opportunities
-- Omitted – Data not available at time of
reporting. KPIs
Operational sites owned, leased in, or adjacent to, protected areas and areas of high biodiversity value outside protected areas
Habitats protected or restored
IUCN Red List species and national conservation list species with habitats in areas affected by operations
Environmental Impact Management
Air Emissions - Green House Gasses (GHG)
General Disclosures Management Approach

31
Disclosures Reporting location Remarks/ explanation
The Impact and Where it Occurs Our Environmental Impact
Stakeholders Affected ESG Risks and Opportunities
KPIs
Direct (Scope 1) GHG Emissions Environmental Profile
Energy indirect (Scope 2) GHG Emissions
Emissions of ozone-depleting substances (ODS) -- Omitted – Data not available at time of
reporting.
Air Pollutants
General Disclosures
Management Approach
The Impact and Where it Occurs Our Environmental
Impact Stakeholders Affected
ESG Risks and Opportunities
KPIs
Nitrogen oxides (NOx)
-- Omitted – Data not available at time of
reporting.
Omitted – Data not available at time of reporting.
Sulfur oxides (SOx)
Persistent organic pollutants (POPs)
Volatile organic compounds (VOCs)
-- Hazardous air pollutants (HAPs)
Particulate matter (PM)
Solid Waste
General Disclosures
Management Approach
The Impact and Where it Occurs Our Environmental Impact
Stakeholders Affected ESG Risks and Opportunities
KPI Total solid waste generated - by type Environmental Profile
Hazardous Waste
General Disclosures Management Approach
The Impact and Where it Occurs

32
Disclosures Reporting location Remarks/ explanation
Stakeholders Affected Our Environmental
Impact ESG Risks and Opportunities
KPIs Total weight of hazardous waste generated
Environmental Profile Total weight of hazardous waste transported
Effluents
General Disclosures
Management Approach
The Impact and Where it Occurs Our Environmental Impact
Stakeholders Affected ESG Risks and Opportunities
KPIs Total volume of water discharges
Environmental Profile Percent of wastewater recycled
Environmental Compliance
Non-compliance with environmental laws and regulations
General Disclosures
Management Approach
The Impact and Where it Occurs Our Environmental Impact
Stakeholders Affected ESG Risks and Opportunities
Our Environmental Impact
KPIs
Total amount of monetary fines for non-compliance with environmental laws and/or regulations
Number of non-monetary sanctions for non-compliance with environmental laws and/or regulations
Number of cases resolved through a dispute resolution mechanism
C. Social Disclosures Reporting location Remarks/ explanation
Employee Management
Employee Hiring and Benefits

33
Disclosures Reporting location Remarks/ explanation
General Disclosures
Management Approach
The Impact and Where it Occurs About this Section/Social ESG Risks and Opportunities
KPIs
Total number of employees Our People/Employee
Profile
Attrition rate Our People/Employee
Profile
Ratio of lowest paid employee against minimum wage Our People/Employee
Profile
List of employee benefits Our People/Hiring and
Benefits Employee Training and Development
General Disclosures
Management Approach
The Impact and Where it Occurs About this Section/Social ESG Risks and Opportunities
KPIs
Total training hours provided to employees (by male/female)
--
Omitted – Data not available at time of reporting.
Average training hours provided to employees (by male/female)
Our People/Learning and Development
Labor Management Relations
General Disclosures
Management Approach
The Impact and Where it Occurs About this Section/Social ESG Risks and Opportunities
KPIs
% of employees covered by Collective Bargaining Agreements
Our People/Hiring and Benefits
Number of consultations conducted with employees concerning employee-related policies
-- Omitted – Data not available at time of
reporting.
Diversity and Equal Opportunity

34
Disclosures Reporting location Remarks/ explanation
General Disclosures
Management Approach
The Impact and Where it Occurs About this Section/Our
People ESG Risks and Opportunities
KPIs
% of female workers in the workforce Our People/Employee
Profile --
% of male workers in the workforce
Number of employees from indigenous communities and/or vulnerable sector
Omitted – Data not available at time of reporting.
Workplace Conditions, Labor Standards, and Human Rights Occupational Health and Safety
General Disclosures
Management Approach
The Impact and Where it Occurs About this Section/Our
People ESG Risks and Opportunities
KPIs
Safe Man-Hours
Our People/Health, Safety and Wellbeing
No. of work-related injuries
No. of work-related fatalities
No. of work-related ill-health
No. of safety drills
Labor Laws and Human Rights
General Disclosures
Management Approach
The Impact and Where it Occurs About this Section/Our
People ESG Risks and Opportunities
KPIs
Policies that explicitly disallow violations of labor laws and human rights (e.g. harassment, bullying) in the workplace
Our People
No. of legal actions or employee grievances involving forced or child labor
-- Omitted – Data not available at time of reporting.
Supply Chain Management

35
Disclosures Reporting location Remarks/ explanation
Supplier Accreditation and Screening
General Disclosures
Management Approach
The Impact and Where it Occurs Our Suppliers ESG Risks and Opportunities
Our Suppliers
KPIs Supplier Accreditation Policy Sustainability Topics Considered When Selecting/Screening Suppliers
Relationship with Community
Significant Impacts on Local Communities
General Disclosures Management Approach
ESG Risks and Opportunities
KPIs
Operations with significant impacts on local communities (by location, vulnerable group/indigenous people (IPs))
Omitted – Data not available at time of reporting.
Mitigating measures (if negative) or enhancement measures (if positive) For operations affecting IPs, total number of Free and Prior Informed Consent (FPIC) consultations and Certification Preconditions (CPs) secured
Customer Management
Customer Satisfaction
General Disclosures
Management Approach
The Impact and Where it Occurs Our Customers ESG Risks and Opportunities
KPI Customer Satisfaction Score(s) -- Omitted – Data not available at time of
reporting.
Health and Safety
General Disclosures Management Approach
The Impact and Where it Occurs Our People

36
Disclosures Reporting location Remarks/ explanation
ESG Risks and Opportunities
KPIs
Number of substantiated complaints on product or service health and safety
-- Omitted – Data not available at time of
reporting.
Number of complaints addressed
Marketing and Labelling
General Disclosures
Management Approach
The Impact and Where it Occurs -- Omitted – Data not available at time of
reporting.
ESG Risks and Opportunities
KPIs
Number of substantiated complaints on marketing and labelling
-- Omitted – Data not available at time of
reporting.
Number of complaints addressed
Customer Privacy
General Disclosures
Management Approach
The Impact and Where it Occurs Our Customers ESG Risks and Opportunities
KPIs
Number of substantiated complaints on customer privacy -- Omitted – Data not available at time of
reporting.
Number of complaints addressed
Number of customers, users and account holders whose information is used for secondary purposes
Omitted - Data not available at time of reporting
Data Security
General Disclosures
Management Approach
The Impact and Where it Occurs Our Customers ESG Risks and Opportunities
KPI No. of data breaches, including leaks, thefts and losses of data
Our Customers

37
Performance Metrics
A. Economic disclosures
Economic Performance 2020 2019
Direct Economic Value Generated and Distributed Total (in Php
‘000) Total (in Php
‘000)
Direct economic value generated (Revenue) 72,006,456 84,317,309
Direct economic value distributed
Procurement Practices
Proportion of Spending on Local Suppliers %
Percentage of procurement budget used for significant locations of operations that is spent on local suppliers
-- 95%
Anti-Corruption
Training on Anti-Corruption Policies and Procedures %
Percentage of employees who have received written communication about corporate anti-corruption policies and procedures
-- --
Percentage of business partners who have received written communication about corporate anti-corruption policies and procedures
-- --
Percentage of directors and management who have received anti-corruption training
100% --
Percentage of employees who have received anti-corruption training
100% --
Incidents of Corruption Number
Number of incidents in which directors were removed or disciplined for corruption
0 --
Number of incidents in which employees were dismissed or disciplined for corruption
0 --
Number of incidents when contracts with business partners were terminated due to corruption
0 --
B. Environment Disclosures 2020 2019 Resource Management Unit Amount Amount
Energy consumption within the organization and Reduction of Energy Consumption
Energy consumption - by fuel type - Gasoline Liters 90.00 208,994.00
Energy consumption - by fuel type - Diesel Liters 1,711,006.26 2,674,884.00
Energy consumption - by fuel type - Electricity kwh 219,522,307.73 424,539,528.00 Energy reduction - by fuel type - Gasoline Liters 0 -- Energy reduction - by fuel type - Diesel Liters -376,307.32 --

38
Energy reduction - by fuel type - Electricity kwh -21,462,816.00 --
Water consumption within the organization
Water withdrawal
507,579,884.84 568,234,078.00
Water consumption 549,101.38 --
Water recycled and reused CBM 589,475.00 6,560,051.00
Materials Used by the Organization
Materials used by weight or volume - rebar kg 2,419,800.33 --
Materials used by weight or volume - cement Kg 2,443,855.26 --
Percentage of recycled input materials used to manufacture the organization’s primary products and services
% 0.00% --
Ecosystems and Biodiversity
Operational sites owned, leased in, or adjacent to, protected areas and areas of high biodiversity value outside protected areas
0 --
Habitats protected or restored 0 --
IUCN Red List species and national conservation list species with habitats in areas affected by operations
0 --
Environmental Impact Management
Air Emissions - Green House Gasses (GHG) Unit Amount
Direct (Scope 1) GHG Emissions Tonnes CO2e
4,448.00 2,192,915.00
Energy indirect (Scope 2) GHG Emissions Tonnes CO2e
156,343.00 281,021.00
Emissions of ozone-depleting substances (ODS)
Air Pollutants
Nitrogen oxides (NOx) g/Ncm 2,907.00 --
Sulfur oxides (SOx) g/Ncm 195.00 --
Persistent organic pollutants (POPs) g/Ncm 16.00 --
Volatile organic compounds (VOCs) g/Ncm 16.00 --
Hazardous air pollutants (HAPs) g/Ncm 16.00 --
Particulate matter (PM) g/Ncm 19.00 --
Solid Waste
Reusable Kg 0.47 58.00 Recyclable Kg 1,255.14 50.00
Composted Kg 310.63 16.00 Residuals/Landfilled Tonnes 2,090.40 104,080.00
Hazardous Waste
Total weight of hazardous waste generated
KG
29,538.18 23,164.00 Total weight of hazardous waste transported 13,965.00 5,260.00
TOTAL 43,503.18 28,424.00

39
Effluents
Total volume of water discharges CBM 507,051,897.87 571,854,986.00 Percent of wastewater recycled % 2.49% --
Environmental Compliance
Non-compliance with environmental laws and regulations
Total amount of monetary fines for non-compliance with environmental laws and/or regulations
Php ₱0.00 --
C. Social Disclosures
Employee Management 2020 2019
Employee Hiring and Benefits Total Female Male Total Female Male
Total number of employees 38 21 17 36 20 16
Attrition rate 0% 13%
Ratio of lowest paid employee against minimum wage
-- --
Employee Training and Development
Total training hours provided to employees (by male/female)
4537.5 2919.5 1618 -- -- --
Average training hours provided to employees (by male/female)
41.39 22.57 18.82 -- -- --
Labor Management Relations
% of employees covered by Collective Bargaining Agreements
0.00%
--
Number of consultations conducted with employees concerning employee-related policies
11.00
--
Diversity and Equal Opportunity Total Female Male Total Female Male
% of workers in the workforce by gender 38 21 17 36 20 16
Number of employees from indigenous communities and/or vulnerable sector
0 0
Workplace Conditions, Labor Standards, and Human Rights Occupational Health and Safety
Safe Man-Hours 3,624,131.05 --
No. of work-related injuries 8.00 0
No. of work-related fatalities 0.00 0
No. of work-related ill-health 0.00 0
No. of safety drills -- --
Labor Laws and Human Rights
Policies that explicitly disallow violations of labor laws and human rights (e.g. harassment, bullying) in the workplace
At least 4 --

40
No. of legal actions or employee grievances involving forced or child labor
0 --
Relationship with Community
Significant Impacts on Local Communities
For operations affecting IPs, total number of Free and Prior Informed Consent (FPIC) consultations and Certification Preconditions (CPs) secured
-- --
Customer Management
Customer Satisfaction
Customer Satisfaction Score(s) -- --
Health and Safety
Number of substantiated complaints on product or service health and safety
-- --
Number of complaints addressed -- --
Marketing and Labelling
Number of substantiated complaints on marketing and labelling
-- --
Number of complaints addressed -- --
Customer Privacy
Number of substantiated complaints on customer privacy
1 --
Number of complaints addressed 1 --
Number of customers, users and account holders whose information is used for secondary purposes
0 --
Data Security
No. of data breaches, including leaks, thefts and losses of data
-- --


FILINVEST DEYELOI'MENT CORPORATION AND SUBSIDIARIES CONSOLIDATED STATEMENTS OF FINANCIAL POSITION . , .. , ~ ... ~. (Amounts in Thousands of Pesos)
\ i: I' ~...., 1 11
ASSETS (Note 35) Cash and cash equivalents (Note 6) Loans and receivables
Real estate operations (Notes 7. and 26) Hospitality operations (Notes 8 and 26) Banking and financia1 services (Note 9) Power opemtions (Noles 10 and 26) Sugar operations (Note 11)
Financial assets at fair value through profit or loss (Note 12) Financial assets at fair value through other comprehensive income
(FVOCI) (Note 12) Investment securities at amortized cost (Note 12) Contract assets (Note 13) Real estate inventories (Note 14) Coal, spare parts and other inventories (Note 15) Investment properties (Note 16) Property. plant and equipment (Note 17) Investments in joint ventures and associate (Note 18) Deferred tax assets - net (Notes 34) Right-or-use assets (Note 32) Goodwill (Note 4) Other assets - net (Notes 13 and 20)
LIABILITIES AND EQUITY
Liabilities (Note 35) Deposit liabilities (Note 21) Bills and acceptances payable (Note 22)
•
Accounts payable, accrued expenses and other liabilities (Note 23) Contract liabilities (Note 13) Long-term and short-term debt (Note 24) Income tax payable (Note 34) R.etirement liabilities (Notes 26 and 30) Lease liabilities (Note 32) Deferred tax liabilities - net (Note 34)
Total Liabilities
(Forward)
ecembcr. 31
202 2019
1'90,858,87
8,751,353 185,750
230,762,200 1,617,610
93,913 7,523,592
30,068,3S0 20,899,699 9,391,817
73,953,136 949,078
89,039,002 42,592,468
1,394,910 5,802,412 3,589,554
10,381,152 20,160,114
1'648,014,985
1'306,201,960 3,568,803
35,777,125 3,723,474
136,192,164 500,609
1,702,616 7,357,058
11,384,354 1"506,408,163
P52,096,201
5, 124, 116 213,490
254,106,944 2,045,037
108,090 16,840,709
5,323,670 49,386,071 14,848,2 13 71,363,524
710,341 85,990,286 43,155,481
1,005,340 3,255,431 3,575,814
10,38 1,152 22,624,965
1'642,154,875
1'284,767,905 30,949,753 40,456,537
3,468,232 130,221,265
901,755 1,139,672 6,885,178
11,214,592 1'510,004,889