does it matter to farmers? A study of the dairy sector in Punjab ...
14
Give to AgEcon Search The World’s Largest Open Access Agricultural & Applied Economics Digital Library This document is discoverable and free to researchers across the globe due to the work of AgEcon Search. Help ensure our sustainability. AgEcon Search http://ageconsearch.umn.edu [email protected] Papers downloaded from AgEcon Search may be used for non-commercial purposes and personal study only. No other use, including posting to another Internet site, is permitted without permission from the copyright owner (not AgEcon Search), or as allowed under the provisions of Fair Use, U.S. Copyright Act, Title 17 U.S.C.
-
Upload
khangminh22 -
Category
Documents
-
view
1 -
download
0
Transcript of does it matter to farmers? A study of the dairy sector in Punjab ...
Give to AgEcon Search
The World’s Largest Open Access Agricultural & Applied Economics Digital Library
This document is discoverable and free to researchers across the globe due to the work of AgEcon Search.
Help ensure our sustainability.
AgEcon Search http://ageconsearch.umn.edu
Papers downloaded from AgEcon Search may be used for non-commercial purposes and personal study only. No other use, including posting to another Internet site, is permitted without permission from the copyright owner (not AgEcon Search), or as allowed under the provisions of Fair Use, U.S. Copyright Act, Title 17 U.S.C.
1
Multinationals or cooperatives: does it matter to farmers?
A study of the dairy sector in Punjab (India)
ANNELEEN VANDEPLAS
LICOS, Centre for Institutions and Economic Performance
Faculty of Business and Economics, K.U.Leuven, Belgium
Paper prepared for presentation at the EAAE 2011 Congress
Change and Uncertainty Challenges for Agriculture,
Food and Natural Resources
August 30 to September 2, 2011 ETH Zurich, Zurich, Switzerland
Copyright 2011 by Anneleen Vandeplas. All rights reserved. Readers may make verbatim copies of this
document for non-commercial purposes by any means, provided that this copyright notice appears on all
such copies.

2
1. Introduction
In the past decades, successive waves of liberalization all over the world have led to the increased
inflow of foreign direct investment in developing and transition countries. This development has not gone
unnoticed by researchers, policy makers, and civil society. In particular, a lively debate has ensued regarding
the vices and virtues of the presence of multinationals in developing countries. While supporters argue that
foreign direct investment is the best road to economic growth and development through the creation of
employment and the transfer of technologies and know-how; critics argue that multinationals locate their
production processes in developing countries mainly to exploit cheap labour and lax environmental
standards, while hardly contributing to local development because of various kinds of tax exemptions and
repatriation of profits.1 Further concerns are that the benefits brought by foreign direct investment may
accrue disproportionally to those who are wealthy already (e.g. skilled rather than unskilled labour),
reinforcing societal imbalances and leaving the poor worse off.
In the view of increased globalization of agrifood supply chains, several concerns have also been
highlighted in the academic literature, especially with regard to the stringent food quality and safety norms
which are imposed by foreign companies operating locally and/or by overseas consumers on agricultural
producers in developing countries. In particular, it is argued that these quality and safety standards would
result in excessive transaction costs or capital requirements for smallholders who face important credit
market imperfections (e.g. Key and Runsten, 1999; Okello et al. 2007). This would lead to the exclusion of
small farmers from these high-standard supply chains and prevent them from benefiting from any surpluses
that can be created within these supply chains. Furthermore, even if small farmers are included in high-value
supply chains, it has been argued that large agrifood companies may be able to extract all the additional
value created through their bargaining power in the chain, such that their suppliers hardly benefit from
inclusion (e.g. Reardon and Berdegué, 2002; Warning and Key, 2002). However, the empirical evidence in
this field is mixed, and there are studies which provide counterevidence to both arguments, by showing that
small farmers can participate in high-value chains, and moreover importantly benefit from this participation
(e.g. Maertens and Swinnen, 2009; Minten et al., 2009). Still, most of these studies focus on high-value
products which are produced for export markets, and some critics have argued that these cases offer limited
scope for scaling up.
This paper focuses on the dairy sector in India, which is the second largest food market in the world,2
and almost exclusively focused on supplying the domestic market. Dairy is a high-value product as well, and
moreover, it is strongly embedded in local agricultural traditions in India, and even more so in Punjab, the
state in the North of India which is the subject of our case study and which has the highest milk production
per capita in India. In 2002, it was estimated that more than 70 million rural households derive direct income
or employment from the dairy sector (Sharma et al., 2002). Not surprisingly, the Indian government has kept
a strong hold on the dairy market for many decades.
A study of the Punjab dairy market is of particular interest in the debate on foreign direct investment
in developing countries, as the Punjab formal dairy market is currently dominated by two players: on the one
hand Nestle India, a subsidiary of Nestle SA. Nestle India set up its first plant in Moga (Punjab) in 1961. On
the other hand there is Milkfed, the cooperative which received extensive government support during
Operation Flood, a large scale public dairy development program in the 1970s and 1980s.. Next to the
formal dairy market, there is a particularly lively informal market, which is mainly focused on delivering
raw milk directly to consumers, without processing.
We use a unique dataset of 1000 households, collected in 2008 and representative of the rural
population of Punjab, to explore the micro-level differences between supplying a powerful dairy
multinational, supplying a cooperative, owned and managed by dairy farmers, and supplying traditional
channels. We first investigate whether there is any selection bias in the choice of dairy marketing channel, in
other words whether the often-heard claim that multinationals prefer to work with farmers which are richer,
better educated, or have a larger dairy herd size on average is supported by our data; then we look at the
1 For a more detailed review of the arguments and the empirical evidence, see Colen et al. (2009). 2 The dairy market in India is the second largest food market in the world with a value of 41 billion US$ in 2008 (after the Chinese
pork sector which amounted to almost 48 billion US$ in 2008) (FAO, 2007), which is similar to the combined output value of rice
and wheat, the two major crops in India, taken together. India produces around 100 million MT of milk per year (FAO, 2007), and
is projected to reach 113 million MT in 2010-2011.
3
impact of marketing channel choice on the performance of dairy farmers in terms of productivity,
profitability, and dairy investment.
The structure of the paper is as follows. We first briefly describe the policy and market context of the
dairy sector in India, then we describe the current dairy market structure in Punjab, the state we have
selected for our study. Section 4 describes the process of data collection, and section 5 provides some
descriptive statistics of our data. Section 6 investigates the determinants of marketing channel choice for
dairy farmers, and section 7 looks into the impacts of this choice on dairy farm performance. Section 8
concludes.
2. The dairy sector in India
After India’s independence in 1947, the Indian government’s policy regarding food production was
based on import-substitution and protectionism (Prasad, 1988). The central government imposed
quantitative restrictions on imports and exports; and imports of various food products, including milk
powder and butter oil were monopolized by (or “canalized” through) parastatals (Sharma, 2004). Moreover,
the dairy sector was stiffly regulated through a licensing system under the 1951 Industrial Development and
Regulation Act, deterring entry for most private companies (World Bank, 1999; Jha, 2004).
In the 1970s and the 1980s the Government of India implemented “Operation Flood”, a large scale
dairy sector development program with as main objectives (a) to make India self-sufficient in milk, by
introducing new technologies to increase productivity, (b) to link rural milk suppliers to urban markets
through the development of an extensive network of dairy marketing cooperatives, and (c) to eventually
reduce poverty, as dairy development was seen as an effective tool to give landless farmers access to an
income-generating activity which does not require huge investments.
Operation Flood was a great success in increasing India’s milk production, and the same period is
often referred to as India’s “White Revolution”.3 Its impact is considered to be comparable to the Green
Revolution in India, increasing growth of milk production from an annual 0.7% to 4.3%, and it has been
applauded nationally and internationally for being “one of the world’s largest rural development programs”,
bringing huge benefits to small and poor farmers (Singh, 2009). Shukla and Brahmankar (1999) voice the
common belief at that time that “the very existence of a cooperative strengthens the position of a village milk
seller.”
In December 1991, the dairy sector was “delicensed”, as a part of an important series of
liberalization reforms in response to a dramatic balance-of-payment crisis in India (Aghion et al., 2008),
implying that private plants did no longer need to obtain a license from the Central Government to establish
a plant. However, the subsequent massive entry by the private sector into dairy processing triggered major
concerns about survival of the dairy cooperative system which had been painstakingly built up with
substantial government support.
In response to these claims, the government reintroduced regulation in the form of the Milk and Milk
Produce Order (MMPO) in 1992. The major implication of this Order was that companies which wanted to
set up a new dairy plant, or expand the capacity of existing plants had to provide convincing survey-based
evidence that the region they would procure their milk from had sufficient milk surplus to justify the
creation of new processing capacity, and based on that, the government would demarcate a geographical
area whereas the dairy plant was allowed to collect milk (Punjabi, 2010). This restriction on competition
helped existing dairy processors to protect the returns to investments in their milk procurement sheds. This
example illustrates to a certain extent the protectionist stand the government of India has been taking with
regard to the cooperative dairy sector in the past decades, and the distrust towards private investment in a
sector which was considered so crucial to the Indian agricultural economy and its poor.
3 Operation Flood consisted in establishing milk producers’ cooperatives in villages all over India (but especially in
irrigated areas), set up following the model of the “Amul” cooperative in Gujarat, which resulted from collective action by dairy
farmers and turned out to be extremely successful in improving marketing options for local farmers, as well as in substantially
increasing milk production in Gujarat. The National Dairy Development Board (NDDB) was founded in 1970 to coordinate
Operation Flood. The necessary funds to expand and re-organize existing local cooperatives to replicate the Amul-model were
obtained from the sales of skimmed milk powder and butter oil, gifted by the European Economic Community to India through
the World Food Program, and sold at commercial prices in the domestic market (World Bank, 1998). Productivity increases were
mostly brought about by crossbreeding local (“desi”) cows with high productivity breeds from Europe (e.g. Jersey, Holstein).

4
However, the restrictions on competition also had a depressing impact on milk prices and dairy
profitability, and this was used as a major argument for abolishing these restrictions in 2002 through an
amendment of the MMPO. While processing capacity has been on the rise since the 1990s, so far no
structural shift in this growth rate has been observed after 2002.
3. The dairy market in Punjab
Within India, Punjab boasts the highest per capita milk production (0.898 kg per capita per day
against a national average of 0.231 kg per capita per day in 2004 (Gupta, 2007). Part of this is due to a very
high demand for milk by consumers, part of it is due to the extensive government support that went to dairy
sector development in Punjab during Operation Flood.
As has been mentioned before, the major channels for marketing raw milk in Punjab are first the
informal market, which is made up by informal traders, which either sell the milk on to hotels, restaurants,
sweetshops or consumers (without processing), or to private domestic milk processors (possibly through one
or more intermediary traders). Dairy farmers are largely unaware of the final destination of their milk when
it is marketed through these informal traders. Second, there is the formal market, where milk goes for
processing, either by cooperative processing plants, or by Nestle. According to our estimates, the informal
market has the largest market share in Punjab, procuring 65% of the milk surplus in the state, followed by
the cooperative (26%) and Nestle (9%). Interestingly, only half of the total milk production is sold, which
reveals the fact that most rural households produce first for their own subsistence, and only sell whatever is
left after that.
When going into slightly more detail about Nestle’s history in Punjab, it is remarkable that in an era
where hardly any (even domestic) private investment was authorized in the dairy sector, Nestle, the second
dairy company in the world after Danone (Euromonitor, 2007), obtained a government license for
establishing an Indian subsidiary, allowing it to set up a dairy plant in Moga (Punjab) in 1961. Anecdotal
evidence suggests that Nestle obtained this license upon the promise that the company would take the lead in
development of its milk shed by introducing improved dairy farming methods and technology, increasing
yields, and facilitating dairy farmers’ access to credit.4 Interestingly, the strict government regulations which
prevented other private companies from venturing into the dairy business, also protected Nestle from
competition, and allowed it to establish a strong village-level procurement network of collection centers to
source from. In 2008, Nestle India had a capacity of around 1.2 million liters of milk per day (LPD),
constituting around one third of the total officially registered private dairy processing capacity of 3.7 million
LPD (DAHD, 2008) and equivalent to 75 % of the officially registered cooperative processing capacity of
1.6 million LPD in Punjab.
Nestle has historically suffered a rather negative reputation regarding philantropy, mainly because of
its controversial marketing campaigns of infant food, which resulted in an international boycott between
1977 and 1984. Nestle’s reputation with respect to its marketing strategies had negative spillovers on their
reputation with respect to its procurement strategies. For example, George (1987) notes: “Nestle frequently
notes its loans to farmers for purchases of one kind or another, repayment being „deducted from milk
purchases‟ by the company. It is not clear whether a Nestle supplier must accept all „improvements‟
proposed by the company. However, one may assume that farmers, large or small, are probably not in a
position to refuse such loans, once the company has become the only possible customer for milk and other
produce.”
This reflects a more general negative attitude of policymakers and of civil society in India towards
foreign investment, dating as far back as from the “Quit India” movement started by Gandhi in 1942 in a
quest to convince the British colonizers to leave India. For example, Vandana Shiva, a leading Indian
environmental philosopher, strongly opposes to the investment by multinationals in developing countries
and advocates protection of farmers against multinationals, as dependence on multinationals would
“increase the cost of agriculture manifold”. In one of her manifests, Shiva (2007) also argues that agrifood
and retail companies should not be allowed to source directly from farmers, as poor farmers stand to be
exploited by large corporations with strong bargaining power. In general, many restrictions on foreign direct
4 Under the FERA (Foreign Exchange Regulation Act), Nestle S.A. had to reduce its foreign equity in Nestle India from 69% to
40% FDI in the 1970s, but after 1991 the cap on foreign equity in food processing companies was gradually lifted and currently
the share of foreign ownership in Nestle India amounts to 61%.
5
investment (FDI) remained in vigor in India until the 2000s – and until today, FDI is not allowed in e.g.
agricultural production (except for tea plantations) and multi-brand retail.
The cooperative channel under consideration is the Punjab State Cooperative Milk Producers
Federation Ltd. (Milkfed).5 It was founded in 1973 under the Punjab State Cooperative Act, and was
integrated in the national dairy cooperative framework established during Operation Flood in 1983. All dairy
cooperative plants in Punjab are part of the same state-level Cooperative Federation, which overlooks the 11
district-level milk unions, which in turn coordinate the village-level milk producers’ societies. Milkfed
currently reports to have a network of almost 6500 milk collection centres in the state of Punjab, whereas
they procure from around 365 000 milk suppliers (Milkfed, 2010). Some milk unions are said to perform
better than others, notably the Ludhiana and Ropar milk unions.
4. Data and methodology
The data used for this study were collected in the summer of 2008. One thousand households were
interviewed in 50 rural villages dispersed over 5 districts in Punjab. Punjab was divided in 5 regions: the
North-West (Amritsar and Gurdaspur), the North East (Hoshiarpur, Jalandhar, Kapurthala and
Nawanshahar) and in each of these regions one district was selected (at random, whereas the probability of
selection was proportional to its rural population share within that region).
All villages in these districts were stratified according to the marketing channels present based on (a)
their appearance in a list of procurement villages provided by Nestle and (b) their appearance in a list of
procurement villages provided by district-level cooperatives if available and otherwise on their proximity to
cooperative sector chilling plants. Based on this categorization, we selected at random 15 “Nestle” villages,
15 “cooperative” villages, 5 villages where both companies were assumed to operate, and 15 villages where
none of them were assumed to operate. These 50 villages were spread over the 5 selected districts, resulting
in a final selection of 6 villages in the district of Amritsar, 6 in Hoshiarpur, 14 in Ludhiana, 18 in Ferozpur,
and 6 in Mansa.
In each village, 20 households were selected and surveyed in detail about their general
characteristics, their income generating activities and expenditures, and in particular on dairy production
practices, and use of input and output markets. The selection was commensurate with a random stratification
strategy based on a prior village census of dairy farm size and milk marketing channel, mostly to allow
oversampling of Nestle and cooperative suppliers and of large and medium-size dairy farmers (with more
than 10 female adult dairy animals (DA) and between 3 and 10 DA respectively) – as the majority of milk
suppliers in Punjab have less than 3 DA.
5. Descriptive statistics
Notwithstanding Punjab’s high per capita milk production, the dairy sector in Punjab is still largely a
matter of backyard production: as everywhere in India, most of the milk suppliers keep only 1 or 2 female
dairy animals (DA) on their inner courtyard, of which the first litres of production are meant for home
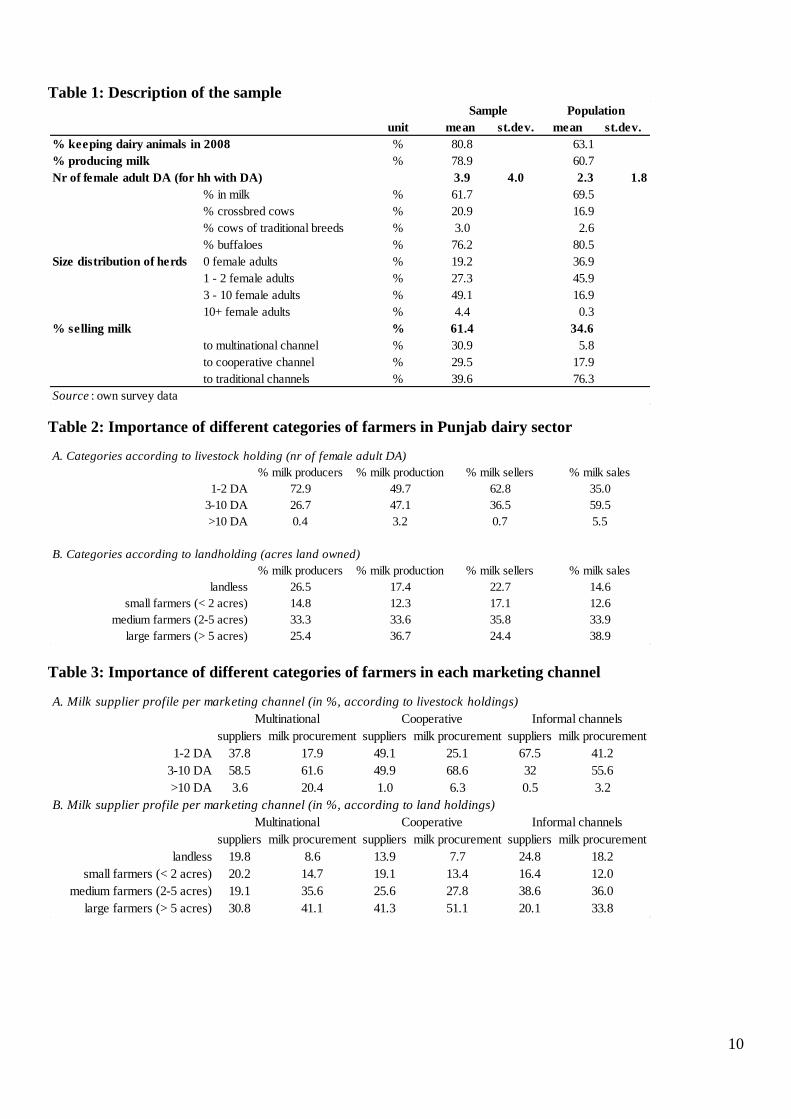
consumption in the (often extended) family. Table 1 shows some basic descriptives of our sample, and how
it relates to the population under study, which consists of all rural households in Punjab. The first major
observation is that 63% of the population under study keeps at least 1 DA.6 Almost half of the population
(46%) holds 1-2 DA, while a little over 17% keeps more than 2 female adult DA. As a result, the average
number of female adult DA amongst households which own DA is 2.3. Most of the (female) bovine herd in
rural Punjab is constituted of buffaloes (80.5 %); next come crossbred cows (16.9 %) and finally cows of
traditional breeds (2.6%).
Interestingly, while more than 60% of rural households are producing milk, only 34.6% are selling
milk. This means that more than 40% of the milk-producing households are doing so merely for their own
subsistence. When considering the profile of a typical milk seller (see Table 2), our data reveal that almost
63% of the milk selling households have only 1-2 DA. Moreover, 50% of the milk produced and 35% of the
milk sold in the population under study is produced by households with only 1-2 DA. Only 5.5% of the milk
sold comes from households with more than 10 DA, who constitute only 0.7% of the milk sellers.
5 Milkfed is often also referred to by its brand name, Verka. 6 This is roughly in line with what data from the Indian Human Development Survey 2005 suggest, namely that 57% of the rural
households hold at least one milch animal.
6
Our data show that the bulk of the sales are still into unorganized channels: almost 76% of the milk-
selling households continue to supply unorganized dairy marketing channels, consisting of direct sales to
consumer or to traditional milk middle-men. These traditional milk middle-men may sell the milk on to
formal dairy processors, but most farmers are not aware of what these traders do with the milk they procure.
Only 24% of the milk-selling households are supplying to organized dairy marketing channels, of which
roughly one quarter goes to Nestle; and the remainder goes into the cooperative channel.
Next, as it is often argued that multinational companies are more inclined towards working with
larger and/or more resource-rich farmers, we look into the descriptive statistics on channel choice. A first
observation is that small milk suppliers do not seem to be excluded anywhere: while they are more
represented in informal channels (67.5% of total suppliers) and in the cooperative channel (49.1% of total
suppliers), even the multinational channel counts 38% of suppliers in the category of 1-2 DA. Only 3.6% of
the multinational suppliers have more than 10 DA; however, this is relatively high as this category only
constitutes 0.7% of the general population of milk sellers (see Table 2).
Further, we also look at the level of asset ownership of the suppliers, as it is often argued that even if
modern marketing channels do work with very small farmers, they would usually select the most resource-
rich amongst the small farmers (e.g. Maertens and Swinnen, 2009). Surprisingly, the lower part of Table 3
shows that the landless rural households – which are usually considered as the poorest of all – have a
stronger representation amongst the multinational suppliers than amongst the cooperative channel suppliers,
and rural households with larger landholdings have a stronger representation amongst cooperative channel
suppliers than in any other dairy marketing channel. Moreover, the majority of total milk procured in the
cooperative channel seems to be coming from farmers owning more than 5 acres of land.
These descriptive statistics seem to suggest that there might be some selection based on dairy herd
size into the multinational channel, but for the same reasoning also into the cooperative channel. Similarly,
there could be some selection into the cooperative channel based on asset ownership, in the sense that
landless households are underrepresented in the cooperative channel. The true extent of this selection can
however only be verified through a treatment model estimation, which allows us to control for other
characteristics, such as some regional variables.
6. Exclusion of small farmers? The determinants of channel choice
There is a broad range of economic literature on the determinants of channel choice. We can
distinguish buyer-driven selection on the one hand – implying that the buyer chooses a certain type of
suppliers to work with (e.g. the ones that have lower transaction costs to deal with, better access to capital to
do the required complementary investments, or even a lower bargaining power such that lower procurement
prices can be applied). On the other hand, there may be self-selection by the supplier, implying that the
supplier chooses his marketing channel based on his own perceptions on the benefits he can get out of each
marketing channel. Especially the latter aspects often gives rise to endogeneity problems in assessing the
impact of marketing channel choice on several performance indicators such as productivity, profitability,
and investment by suppliers in their agricultural enterprise. If we want to assess this impact, we must in a
first stage determine the major factors driving channel selection, and in a second stage use estimate the
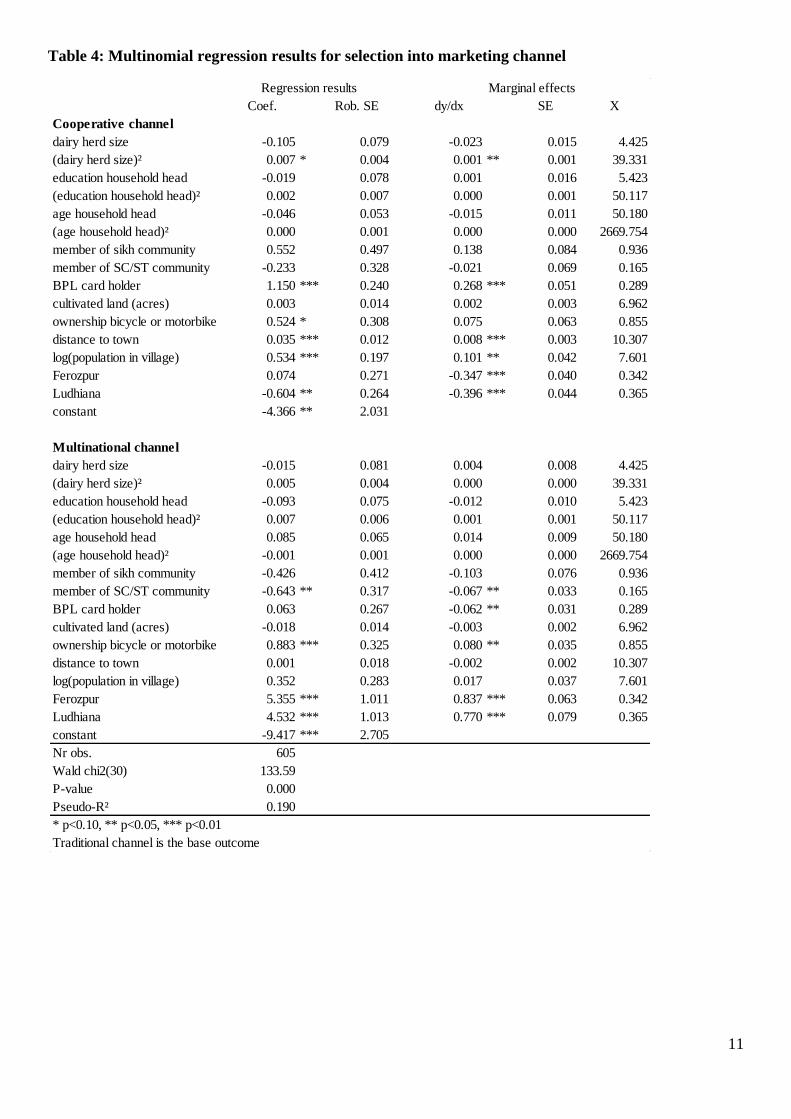
impact on performance, while correcting for the identified selection bias. Table 4 shows the first-stage
multinomial regression for channel choice. The three channels we distinguish are (a) the multinational,
Nestle; (b) the cooperative dairy, Milkfed; (c) the traditional channels. In the regression, we control for (a)
productive capital (dairy herd size and its square, to allow for potential nonlinearities); (b) household human
capital characteristics (the household head’s education level and age and their respective square terms), (c)
household social capital characteristics (a dummy for whether the household belongs to the sikh community,
which is the dominant religion in Punjab; a dummy indicating whether the household belongs to a scheduled
caste or a scheduled tribe, which are the population groups which have historically been suppressed by other
groups, and this is still reflected in social relationships in the village today; and finally whether the
household carries a BPL card or not. This is a card which entitles the household to subsidized food, and
rather than a measure of poverty, today it should probably be rather interpreted as a measure of local
political connections) We also include (d) a measure for household alternative productive assets (acres of
land under cultivation), (e) a measure for household short-distance mobility (a dummy for whether the
7
household owns a bicycle or a motorbike) and (f) some village level characteristics (distance to the nearest
town, the log of total village population, and district dummies).
The major factors driving the choice for the cooperative marketing channel, seem to be ownership of
a BPL card – reflecting political connections at the village level; and two village level characteristics,
namely the distance to the nearest town and the log of total population. This suggests that the cooperative is
more successful in procuring from relatively larger villages which are further away from the larger towns.
This may be related to the presence of a higher milk surplus, as the density of dairy farmers is assumed to be
higher and less milk is channelled through the nearby towns, where the prospect of direct sales of raw milk
to consumers may offer better prices than sales to a milk collection center for industrial processing. As far as
herd size is concerned, the size of the coefficients suggest a convex relationship between dairy herd size and
the likelihood of supplying the cooperative channel. However, the first order term is insignificant; and the
second order term is statistically significant but its economic significance is rather weak. As a result, our
data do not allow for a conclusive statement on the impact of herd size on participation in a cooperative
channel. Bicycle or motorbike ownership has a weak positive impact on participation in the cooperative
channel. Bike ownership is expected to increase participation in formal channels, as these do not usually
offer the service of milk collection at the doorstep, while traditional channels often do. Contrary to what has
been argued by Basu and Chakraborty (2008), we do not find evidence from selection on land size.
Conversely, the major factors driving participation into the multinational channel are district
dummies, ownership of a bicycle or a motorbike; and kinship to the a scheduled tribe or scheduled caste.
The impact of the district dummies is overarching, and this can be explained by the fact that amongst the
sample districts, Nestle is mostly procuring in Ferozpur and Ludhiana. As argued before, bike ownership can
be associated with higher mobility, and lower dependence on doorstep collection by traditional milkmen.
Finally, there is the connection to a scheduled caste or tribe, which has a negative impact on selection into
the multinational channels. This might reflect a historically recognized discrimination of this social group,
whereas milk consumers were quite suspicious of drinking milk which had been procured from lower caste
groups, most probably based on hygienic grounds. Though of a considerably smaller size order than the
district dummies, the marginal effects of the two latter factors are far from negligible (resp. 55% and -46%
of the mean of the independent variable). Interestingly, there does not seem to be any impact of herd size;
hence our data do not support the often-heard claim that multinationals work exclusively with large farmers.
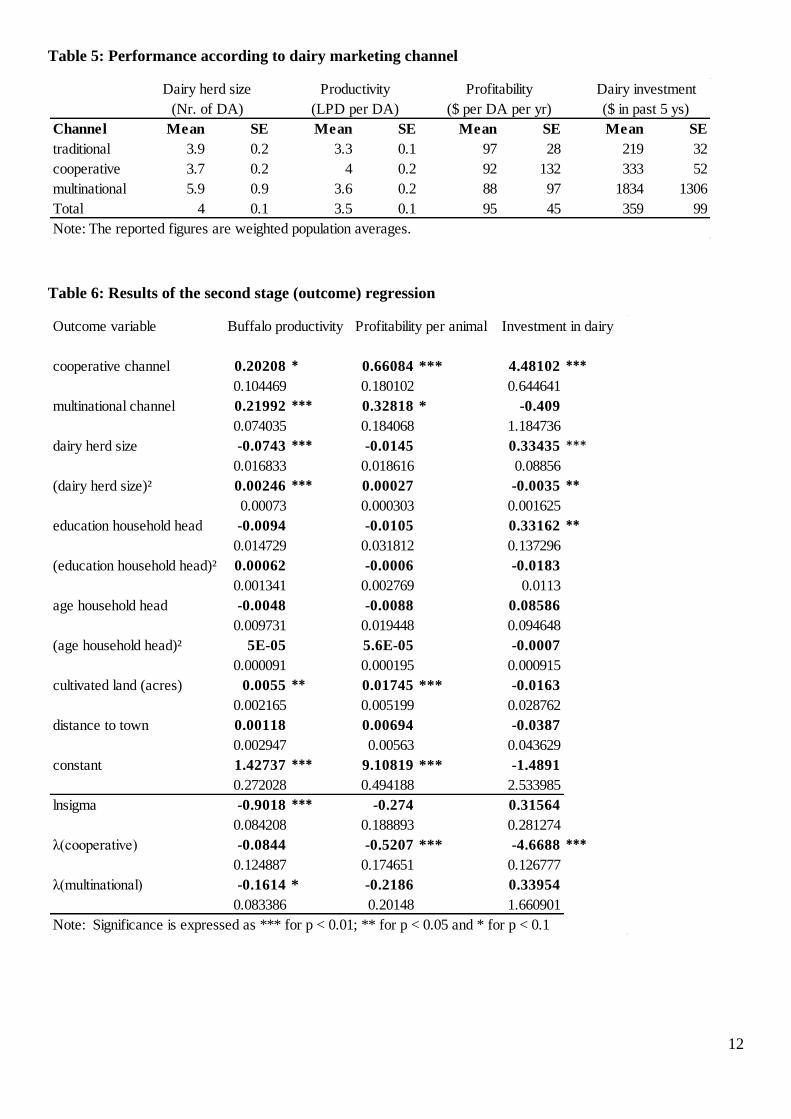
7. Impact of channel choice on performance
Next, we consider the impact of channel choice on a series of performance variables, in particular
productivity (the log of yield per buffalo in liters of milk per day produced), profitability (the log of net
income per dairy animal),7 and investment in dairy enterprise (log of total dairy-related investment in the
past 5 years, including cattle sheds, livestock, equipment). The descriptive statistics provided in Table 5
suggest that productivity and investment in formal channels are higher; but profitability not necessarily. It is
also remarkable that overall, yields and profitability levels are dramatically low. In particular, the average
yield per female adult buffalo per day is 3.5 L, and the average profit per female adult DA is as low as 95
US$ per year. This average figure covers a lot of negative figures, especially for households with only 1-2
DA. While average dairy investment is much higher in the multinational channel, the observed standard
errors are very high as well, pointing at a large variation between individual suppliers.
In order to formally disentangle the impact of channel choice on the considered performance
indicators, we make use of an estimation framework proposed by Deb and Trivedi (2006) and allows for the
estimation of a continuous outcome equation with endogenous selection on a multinomial treatment
variable. We also perform some robustness checks with a series of common propensity score matching
techniques. On the one hand, we use as propensity scores the estimated probabilities coming out of the
multinomial logit channel choice model estimation (MNLP); on the other hand we use propensity scores
which are calculated through binary probit estimation for each respective channel (BPP). According to
Lechner (2002), these two methods to calculate propensity scores should produce similar results. For both
types of propensity scores, we apply two types of matching: Mahalanobis matching (MM, through the stata
7 Note that net income is the value of total milk production per day per animal, minus the production costs (averaged out over the
year).
8
command psmatch2) and kernel matching with bootstrapped standard errors (KM, through the stata
command attk). The results are reported in Table 7 and Table 8 respectively.
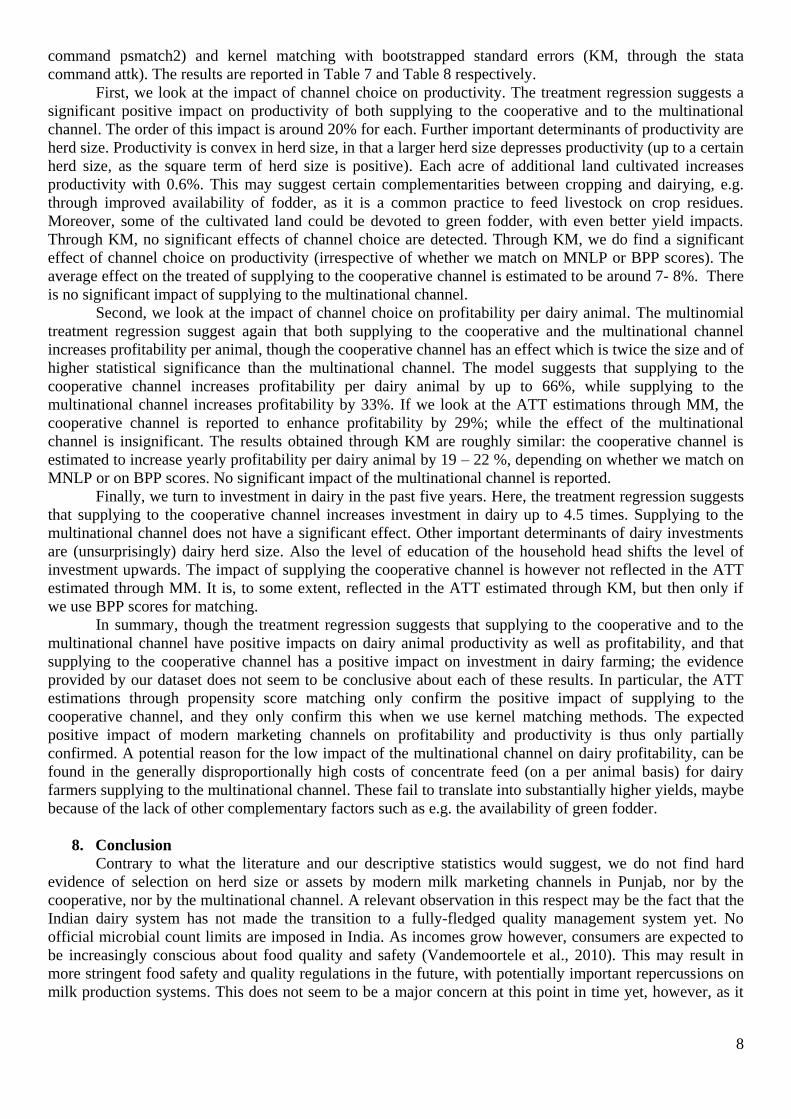
First, we look at the impact of channel choice on productivity. The treatment regression suggests a
significant positive impact on productivity of both supplying to the cooperative and to the multinational
channel. The order of this impact is around 20% for each. Further important determinants of productivity are
herd size. Productivity is convex in herd size, in that a larger herd size depresses productivity (up to a certain
herd size, as the square term of herd size is positive). Each acre of additional land cultivated increases
productivity with 0.6%. This may suggest certain complementarities between cropping and dairying, e.g.
through improved availability of fodder, as it is a common practice to feed livestock on crop residues.
Moreover, some of the cultivated land could be devoted to green fodder, with even better yield impacts.
Through KM, no significant effects of channel choice are detected. Through KM, we do find a significant
effect of channel choice on productivity (irrespective of whether we match on MNLP or BPP scores). The
average effect on the treated of supplying to the cooperative channel is estimated to be around 7- 8%. There
is no significant impact of supplying to the multinational channel.
Second, we look at the impact of channel choice on profitability per dairy animal. The multinomial
treatment regression suggest again that both supplying to the cooperative and the multinational channel
increases profitability per animal, though the cooperative channel has an effect which is twice the size and of
higher statistical significance than the multinational channel. The model suggests that supplying to the
cooperative channel increases profitability per dairy animal by up to 66%, while supplying to the
multinational channel increases profitability by 33%. If we look at the ATT estimations through MM, the
cooperative channel is reported to enhance profitability by 29%; while the effect of the multinational
channel is insignificant. The results obtained through KM are roughly similar: the cooperative channel is
estimated to increase yearly profitability per dairy animal by 19 – 22 %, depending on whether we match on
MNLP or on BPP scores. No significant impact of the multinational channel is reported.
Finally, we turn to investment in dairy in the past five years. Here, the treatment regression suggests
that supplying to the cooperative channel increases investment in dairy up to 4.5 times. Supplying to the
multinational channel does not have a significant effect. Other important determinants of dairy investments
are (unsurprisingly) dairy herd size. Also the level of education of the household head shifts the level of
investment upwards. The impact of supplying the cooperative channel is however not reflected in the ATT
estimated through MM. It is, to some extent, reflected in the ATT estimated through KM, but then only if
we use BPP scores for matching.
In summary, though the treatment regression suggests that supplying to the cooperative and to the
multinational channel have positive impacts on dairy animal productivity as well as profitability, and that
supplying to the cooperative channel has a positive impact on investment in dairy farming; the evidence
provided by our dataset does not seem to be conclusive about each of these results. In particular, the ATT
estimations through propensity score matching only confirm the positive impact of supplying to the
cooperative channel, and they only confirm this when we use kernel matching methods. The expected
positive impact of modern marketing channels on profitability and productivity is thus only partially
confirmed. A potential reason for the low impact of the multinational channel on dairy profitability, can be
found in the generally disproportionally high costs of concentrate feed (on a per animal basis) for dairy
farmers supplying to the multinational channel. These fail to translate into substantially higher yields, maybe
because of the lack of other complementary factors such as e.g. the availability of green fodder.
8. Conclusion
Contrary to what the literature and our descriptive statistics would suggest, we do not find hard
evidence of selection on herd size or assets by modern milk marketing channels in Punjab, nor by the
cooperative, nor by the multinational channel. A relevant observation in this respect may be the fact that the
Indian dairy system has not made the transition to a fully-fledged quality management system yet. No
official microbial count limits are imposed in India. As incomes grow however, consumers are expected to
be increasingly conscious about food quality and safety (Vandemoortele et al., 2010). This may result in
more stringent food safety and quality regulations in the future, with potentially important repercussions on
milk production systems. This does not seem to be a major concern at this point in time yet, however, as it
9
seems demand for milk is currently outperforming supply in terms of growth, and eliminating small dairy
farmers would leave an insurmountable gap between demand and supply of milk.
We do find some evidence of selection through social capital indicators, which is unsurprising in the
Indian context, where the selection of trade partners is still very often driven by trust and based on existing
social networks. Further, we find some evidence that supplying to the cooperative channel increases dairy
productivity, profitability and investment in dairy business. There is some evidence that supplying to the
multinational channel increases dairy productivity and profitability as well, but these effects are not robust to
any of the alternative treatment effects estimation methods we use.
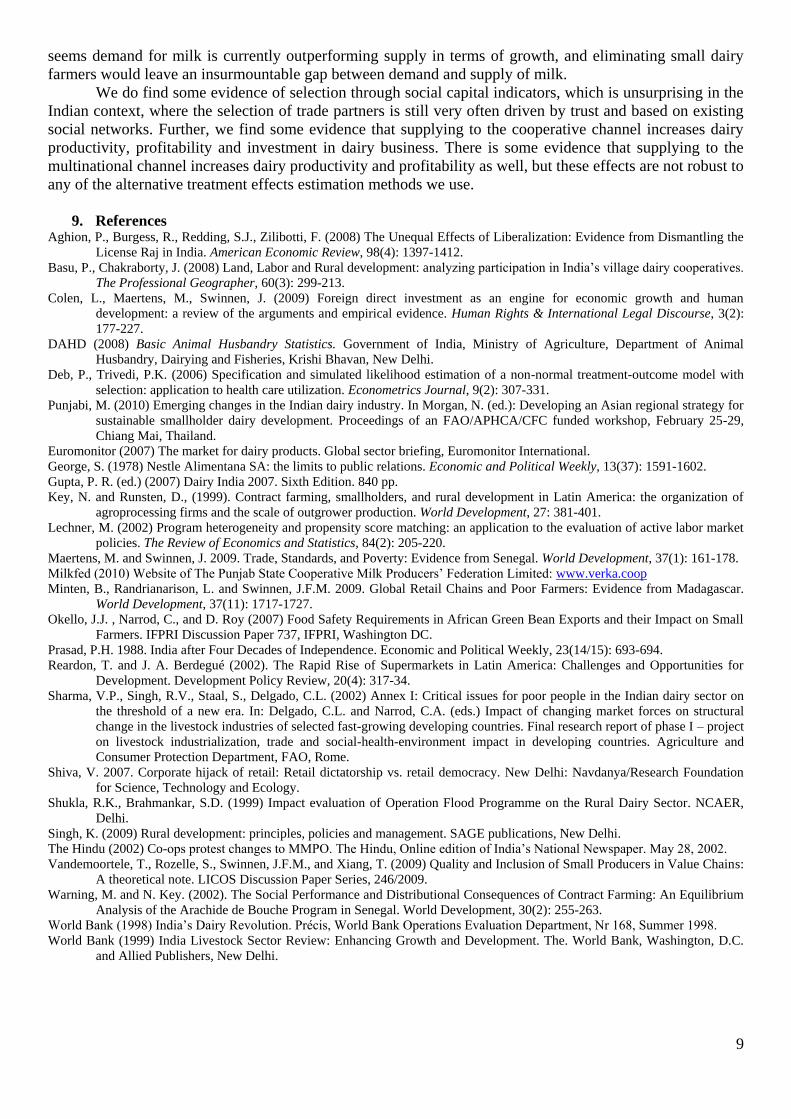
9. References
Aghion, P., Burgess, R., Redding, S.J., Zilibotti, F. (2008) The Unequal Effects of Liberalization: Evidence from Dismantling the
License Raj in India. American Economic Review, 98(4): 1397-1412.
Basu, P., Chakraborty, J. (2008) Land, Labor and Rural development: analyzing participation in India’s village dairy cooperatives.
The Professional Geographer, 60(3): 299-213.
Colen, L., Maertens, M., Swinnen, J. (2009) Foreign direct investment as an engine for economic growth and human
development: a review of the arguments and empirical evidence. Human Rights & International Legal Discourse, 3(2):
177-227.
DAHD (2008) Basic Animal Husbandry Statistics. Government of India, Ministry of Agriculture, Department of Animal
Husbandry, Dairying and Fisheries, Krishi Bhavan, New Delhi.
Deb, P., Trivedi, P.K. (2006) Specification and simulated likelihood estimation of a non-normal treatment-outcome model with
selection: application to health care utilization. Econometrics Journal, 9(2): 307-331.
Punjabi, M. (2010) Emerging changes in the Indian dairy industry. In Morgan, N. (ed.): Developing an Asian regional strategy for
sustainable smallholder dairy development. Proceedings of an FAO/APHCA/CFC funded workshop, February 25-29,
Chiang Mai, Thailand.
Euromonitor (2007) The market for dairy products. Global sector briefing, Euromonitor International.
George, S. (1978) Nestle Alimentana SA: the limits to public relations. Economic and Political Weekly, 13(37): 1591-1602.
Gupta, P. R. (ed.) (2007) Dairy India 2007. Sixth Edition. 840 pp.
Key, N. and Runsten, D., (1999). Contract farming, smallholders, and rural development in Latin America: the organization of
agroprocessing firms and the scale of outgrower production. World Development, 27: 381-401.
Lechner, M. (2002) Program heterogeneity and propensity score matching: an application to the evaluation of active labor market
policies. The Review of Economics and Statistics, 84(2): 205-220.
Maertens, M. and Swinnen, J. 2009. Trade, Standards, and Poverty: Evidence from Senegal. World Development, 37(1): 161-178.
Milkfed (2010) Website of The Punjab State Cooperative Milk Producers’ Federation Limited: www.verka.coop
Minten, B., Randrianarison, L. and Swinnen, J.F.M. 2009. Global Retail Chains and Poor Farmers: Evidence from Madagascar.
World Development, 37(11): 1717-1727.
Okello, J.J. , Narrod, C., and D. Roy (2007) Food Safety Requirements in African Green Bean Exports and their Impact on Small
Farmers. IFPRI Discussion Paper 737, IFPRI, Washington DC.
Prasad, P.H. 1988. India after Four Decades of Independence. Economic and Political Weekly, 23(14/15): 693-694.
Reardon, T. and J. A. Berdegué (2002). The Rapid Rise of Supermarkets in Latin America: Challenges and Opportunities for
Development. Development Policy Review, 20(4): 317-34.
Sharma, V.P., Singh, R.V., Staal, S., Delgado, C.L. (2002) Annex I: Critical issues for poor people in the Indian dairy sector on
the threshold of a new era. In: Delgado, C.L. and Narrod, C.A. (eds.) Impact of changing market forces on structural
change in the livestock industries of selected fast-growing developing countries. Final research report of phase I – project
on livestock industrialization, trade and social-health-environment impact in developing countries. Agriculture and
Consumer Protection Department, FAO, Rome.
Shiva, V. 2007. Corporate hijack of retail: Retail dictatorship vs. retail democracy. New Delhi: Navdanya/Research Foundation
for Science, Technology and Ecology.
Shukla, R.K., Brahmankar, S.D. (1999) Impact evaluation of Operation Flood Programme on the Rural Dairy Sector. NCAER,
Delhi.
Singh, K. (2009) Rural development: principles, policies and management. SAGE publications, New Delhi.
The Hindu (2002) Co-ops protest changes to MMPO. The Hindu, Online edition of India’s National Newspaper. May 28, 2002.
Vandemoortele, T., Rozelle, S., Swinnen, J.F.M., and Xiang, T. (2009) Quality and Inclusion of Small Producers in Value Chains:
A theoretical note. LICOS Discussion Paper Series, 246/2009.
Warning, M. and N. Key. (2002). The Social Performance and Distributional Consequences of Contract Farming: An Equilibrium
Analysis of the Arachide de Bouche Program in Senegal. World Development, 30(2): 255-263.
World Bank (1998) India’s Dairy Revolution. Précis, World Bank Operations Evaluation Department, Nr 168, Summer 1998.
World Bank (1999) India Livestock Sector Review: Enhancing Growth and Development. The. World Bank, Washington, D.C.
and Allied Publishers, New Delhi.
10
Table 1: Description of the sample
Table 2: Importance of different categories of farmers in Punjab dairy sector
Table 3: Importance of different categories of farmers in each marketing channel
unit mean st.dev. mean st.dev.
% keeping dairy animals in 2008 % 80.8 63.1
% producing milk % 78.9 60.7
Nr of female adult DA (for hh with DA) 3.9 4.0 2.3 1.8
% in milk % 61.7 69.5
% crossbred cows % 20.9 16.9
% cows of traditional breeds % 3.0 2.6
% buffaloes % 76.2 80.5
Size distribution of herds 0 female adults % 19.2 36.9
1 - 2 female adults % 27.3 45.9
3 - 10 female adults % 49.1 16.9
10+ female adults % 4.4 0.3
% selling milk % 61.4 34.6
to multinational channel % 30.9 5.8
to cooperative channel % 29.5 17.9
to traditional channels % 39.6 76.3
Source : own survey data
Sample Population
Table 1: Importance of different categories of farmers in total Punjab milk production and sales
A. Categories according to livestock holding (nr of female adult DA)
% milk producers % milk production % milk sellers % milk sales
1-2 DA 72.9 49.7 62.8 35.0
3-10 DA 26.7 47.1 36.5 59.5
>10 DA 0.4 3.2 0.7 5.5
B. Categories according to landholding (acres land owned)
% milk producers % milk production % milk sellers % milk sales
landless 26.5 17.4 22.7 14.6
small farmers (< 2 acres) 14.8 12.3 17.1 12.6
medium farmers (2-5 acres) 33.3 33.6 35.8 33.9
large farmers (> 5 acres) 25.4 36.7 24.4 38.9
Table 2: Importance of different categories of farmers in each marketing channel
A. Milk supplier profile per marketing channel (in %, according to livestock holdings)
suppliers milk procurement suppliers milk procurement suppliers milk procurement
1-2 DA 37.8 17.9 49.1 25.1 67.5 41.2
3-10 DA 58.5 61.6 49.9 68.6 32 55.6
>10 DA 3.6 20.4 1.0 6.3 0.5 3.2
B. Milk supplier profile per marketing channel (in %, according to land holdings)
suppliers milk procurement suppliers milk procurement suppliers milk procurement
landless 19.8 8.6 13.9 7.7 24.8 18.2
small farmers (< 2 acres) 20.2 14.7 19.1 13.4 16.4 12.0
medium farmers (2-5 acres) 19.1 35.6 25.6 27.8 38.6 36.0
large farmers (> 5 acres) 30.8 41.1 41.3 51.1 20.1 33.8
Multinational Cooperative Informal channels
Multinational Cooperative Informal channels
11
Table 4: Multinomial regression results for selection into marketing channel
Coef. Rob. SE dy/dx SE X
Cooperative channel
dairy herd size -0.105 0.079 -0.023 0.015 4.425
(dairy herd size)² 0.007 * 0.004 0.001 ** 0.001 39.331
education household head -0.019 0.078 0.001 0.016 5.423
(education household head)² 0.002 0.007 0.000 0.001 50.117
age household head -0.046 0.053 -0.015 0.011 50.180
(age household head)² 0.000 0.001 0.000 0.000 2669.754
member of sikh community 0.552 0.497 0.138 0.084 0.936
member of SC/ST community -0.233 0.328 -0.021 0.069 0.165
BPL card holder 1.150 *** 0.240 0.268 *** 0.051 0.289
cultivated land (acres) 0.003 0.014 0.002 0.003 6.962
ownership bicycle or motorbike 0.524 * 0.308 0.075 0.063 0.855
distance to town 0.035 *** 0.012 0.008 *** 0.003 10.307
log(population in village) 0.534 *** 0.197 0.101 ** 0.042 7.601
Ferozpur 0.074 0.271 -0.347 *** 0.040 0.342
Ludhiana -0.604 ** 0.264 -0.396 *** 0.044 0.365
constant -4.366 ** 2.031
Multinational channel
dairy herd size -0.015 0.081 0.004 0.008 4.425
(dairy herd size)² 0.005 0.004 0.000 0.000 39.331
education household head -0.093 0.075 -0.012 0.010 5.423
(education household head)² 0.007 0.006 0.001 0.001 50.117
age household head 0.085 0.065 0.014 0.009 50.180
(age household head)² -0.001 0.001 0.000 0.000 2669.754
member of sikh community -0.426 0.412 -0.103 0.076 0.936
member of SC/ST community -0.643 ** 0.317 -0.067 ** 0.033 0.165
BPL card holder 0.063 0.267 -0.062 ** 0.031 0.289
cultivated land (acres) -0.018 0.014 -0.003 0.002 6.962
ownership bicycle or motorbike 0.883 *** 0.325 0.080 ** 0.035 0.855
distance to town 0.001 0.018 -0.002 0.002 10.307
log(population in village) 0.352 0.283 0.017 0.037 7.601
Ferozpur 5.355 *** 1.011 0.837 *** 0.063 0.342
Ludhiana 4.532 *** 1.013 0.770 *** 0.079 0.365
constant -9.417 *** 2.705
Nr obs. 605
Wald chi2(30) 133.59
P-value 0.000
Pseudo-R² 0.190
* p<0.10, ** p<0.05, *** p<0.01
Traditional channel is the base outcome
Marginal effectsRegression results
12
Table 5: Performance according to dairy marketing channel
Table 6: Results of the second stage (outcome) regression
Channel Mean SE Mean SE Mean SE Mean SE
traditional 3.9 0.2 3.3 0.1 97 28 219 32
cooperative 3.7 0.2 4 0.2 92 132 333 52
multinational 5.9 0.9 3.6 0.2 88 97 1834 1306
Total 4 0.1 3.5 0.1 95 45 359 99
Note: The reported figures are weighted population averages.
Dairy herd size Productivity Profitability Dairy investment
(LPD per DA) ($ per DA per yr) ($ in past 5 ys)(Nr. of DA)
Outcome variable Buffalo productivity Profitability per animal Investment in dairy
cooperative channel 0.20208 * 0.66084 *** 4.48102 ***
0.104469 0.180102 0.644641
multinational channel 0.21992 *** 0.32818 * -0.409
0.074035 0.184068 1.184736
dairy herd size -0.0743 *** -0.0145 0.33435 ***
0.016833 0.018616 0.08856
(dairy herd size)² 0.00246 *** 0.00027 -0.0035 **
0.00073 0.000303 0.001625
education household head -0.0094 -0.0105 0.33162 **
0.014729 0.031812 0.137296
(education household head)² 0.00062 -0.0006 -0.0183
0.001341 0.002769 0.0113
age household head -0.0048 -0.0088 0.08586
0.009731 0.019448 0.094648
(age household head)² 5E-05 5.6E-05 -0.0007
0.000091 0.000195 0.000915
cultivated land (acres) 0.0055 ** 0.01745 *** -0.0163
0.002165 0.005199 0.028762
distance to town 0.00118 0.00694 -0.0387
0.002947 0.00563 0.043629
constant 1.42737 *** 9.10819 *** -1.4891
0.272028 0.494188 2.533985
lnsigma -0.9018 *** -0.274 0.31564
0.084208 0.188893 0.281274
λ(cooperative) -0.0844 -0.5207 *** -4.6688 ***
0.124887 0.174651 0.126777
λ(multinational) -0.1614 * -0.2186 0.33954
0.083386 0.20148 1.660901
Note: Significance is expressed as *** for p < 0.01; ** for p < 0.05 and * for p < 0.1

13
Table 7: Results ATT estimation through Mahalanobis matching (MM)
1. Impact on log(daily productivity per dairy animal)
Sample Treated Controls Difference S.E. T-stat
Cooperative Unmatched 1.31332608 1.20003644 0.11328964 0.04299941 2.63
MNLP ATT 1.31332608 1.25493626 0.05838982 0.06870805 0.85
BPP ATT 1.31332608 1.26753627 0.04578981 0.05951675 0.77
Multinational Unmatched 1.25469281 1.22373824 0.03095456 0.04259165 0.73
MNLP ATT 1.25469281 1.26337553 -0.00868272 0.06765431 -0.13
BPP ATT 1.25469281 1.3263767 -0.07168390 0.06499797 -1.10
2. Impact on log(yearly profitability per dairy animal)
Sample Treated Controls Difference S.E. T-stat
Cooperative Unmatched 9.3483115 9.09262461 0.255686893 0.099692243 2.56
MNLP ATT 9.3483115 9.16277478 0.185536724 0.162167937 1.14
BPP ATT 9.3483115 9.0625847 0.285726804 0.144285767 1.98
Multinational Unmatched 9.16789314 9.17224507 -0.00435193 0.100886345 -0.04
MNLP ATT 9.16789314 9.24536356 -0.07747042 0.155724919 -0.50
BPP ATT 9.16789314 9.26362106 -0.09572792 0.146695443 -0.65
3. Impact on log(investment in dairy in past 5 years)
Sample Treated Controls Difference S.E. T-stat
Cooperative Unmatched 4.61029004 3.52987783 1.08041221 0.42753193 2.53
MNLP ATT 4.61029004 4.68712905 -0.07683902 0.69733329 -0.11
BPP ATT 4.61029004 3.73560205 0.87468799 0.67522749 1.30
Multinational Unmatched 3.24400304 4.13197619 -0.88797315 0.42246666 -2.10
MNLP ATT 3.24400304 3.65711095 -0.41310791 0.64776432 -0.64
BPP ATT 3.24400304 3.52547076 -0.28146772 0.64459331 -0.44
Note: S.E. does not take into account that the propensity score is estimated.
Table 8: Results ATT estimation with the kernel matching method (KM)
N treatm. N contr. ATT SE T-stat
1. Impact on log(daily productivity per dairy animal)
Cooperative MNLP 181 424 0.072 0.040 1.802
BPP 181 424 0.083 0.041 2.036
Multinational MNLP 190 415 0.020 0.050 0.397
BPP 190 415 0.030 0.044 0.686
2. Impact on log(yearly profitability per dairy animal)
Cooperative MNLP 181 424 0.186 0.107 1.736
BPP 181 424 0.219 0.098 2.224
Multinational MNLP 190 415 0.047 0.113 0.412
BPP 190 415 0.068 0.119 0.571
3. Impact on log(investment in dairy in past 5 years)
Cooperative MNLP 181 424 0.150 0.552 0.272
BPP 181 424 0.840 0.453 1.854
Multinational MNLP 190 415 -0.539 0.468 -1.152
BPP 190 415 -0.626 0.616 -1.016