Measuring the Efficiency of the Primary Cooperatives in the Federation of Davao Dairy Farmers...
16
MEASURING THE EFFICIENCY OF THE PRIMARY COOPERATIVES IN THE FEDERATION OF DAVAO DAIRY FARMERS COOPERATIVES [1] Ricalde, Ruby Grace J., Legaspi, Luyjilene V., Morales, Dianne D. Bachelor of Science in Agribusiness Economics School of Management University of the Philippines Mindanao ABSTRACT The Philippines is an agricultural country and the dairy farming is one of the industries which provide vigor to the economy. The Federation of Davao Dairy Farmers Cooperatives (FEDDAFC) is one of the producers of fresh cow’s milk in the Philippines and the only one in Davao City. All the eight dairy cooperatives under the FEDDAFC were considered. This study aims to measure the technical efficiency of the primary cooperatives under FEDDAFC; identify which among the cooperatives is/are the most technically efficient and inefficient; examine the potential of milk production if dairy farms could operate efficiently; and provide recommendations to improve the production of every cooperative. The technical efficiency was measured through the output- oriented model using Data Envelopment Analysis Program (DEAP) to obtain the most efficient cooperative using the inputs, namely grass, cow, farmer, and water, and output (milk) in terms of liters. Results show that the mean values of technical efficiencies under Constant Returns to Scale (CRS) and Variable Returns to Scale (VRS) which are 0.693 and 0.855, respectively. Calinan Dairy Farmers Cooperative (CDFC) is the most efficient with CRS and VRS of 1 because of the efficient allocation of inputs. It is followed by Malagos Dairy Cooperative (MDC), Aklat Dairy Cooperative (ADC) and Riverside Dairy Farmers Cooperative (RIDAFCO). Wangan Dairy Farmers Cooperative (WADAC), Cadalian Dairy Farmers Cooperative (CADAFCO), Biao Joaquin Dairy Farmers Cooperative (BJDAFCO) and Tacunan Dairy Farmers Cooperative (TADAFCO) are the inefficient cooperatives. Therefore, it implies that these inefficient cooperatives can further increase their outputs by undertaking their opportunities and proper usage of their resources by allocating their inputs proportionally. Results show that WADAC should mimic the practices of CDFC and ADC; BJDAFCO and TADAFCO should follow CDFC, ADC, and RIDAFCO; and CADAFCO should also follow CDFC, MDC and RIDAFCO to operate efficiently within the FEDDAFC. Given that these inefficient cooperatives will implement these changes, their outputs will increase from 11 to 37 percent. [1] A research paper in ABE 134: Applied Linear Programming for Economists under Prof. Jon Marx Sarmiento, Second Semester of Academic Year 2014-2015
Transcript of Measuring the Efficiency of the Primary Cooperatives in the Federation of Davao Dairy Farmers...

MEASURING THE EFFICIENCY OF THE PRIMARY COOPERATIVES IN THE
FEDERATION OF DAVAO DAIRY FARMERS COOPERATIVES [1]
Ricalde, Ruby Grace J., Legaspi, Luyjilene V., Morales, Dianne D.
Bachelor of Science in Agribusiness Economics
School of Management
University of the Philippines Mindanao
ABSTRACT
The Philippines is an agricultural country and the dairy farming is one of the
industries which provide vigor to the economy. The Federation of Davao Dairy
Farmers Cooperatives (FEDDAFC) is one of the producers of fresh cow’s milk
in the Philippines and the only one in Davao City. All the eight dairy
cooperatives under the FEDDAFC were considered. This study aims to measure
the technical efficiency of the primary cooperatives under FEDDAFC; identify
which among the cooperatives is/are the most technically efficient and
inefficient; examine the potential of milk production if dairy farms could
operate efficiently; and provide recommendations to improve the production of
every cooperative. The technical efficiency was measured through the output-
oriented model using Data Envelopment Analysis Program (DEAP) to obtain
the most efficient cooperative using the inputs, namely grass, cow, farmer, and
water, and output (milk) in terms of liters. Results show that the mean values
of technical efficiencies under Constant Returns to Scale (CRS) and Variable
Returns to Scale (VRS) which are 0.693 and 0.855, respectively. Calinan Dairy
Farmers Cooperative (CDFC) is the most efficient with CRS and VRS of 1
because of the efficient allocation of inputs. It is followed by Malagos Dairy
Cooperative (MDC), Aklat Dairy Cooperative (ADC) and Riverside Dairy
Farmers Cooperative (RIDAFCO). Wangan Dairy Farmers Cooperative
(WADAC), Cadalian Dairy Farmers Cooperative (CADAFCO), Biao Joaquin
Dairy Farmers Cooperative (BJDAFCO) and Tacunan Dairy Farmers
Cooperative (TADAFCO) are the inefficient cooperatives. Therefore, it implies
that these inefficient cooperatives can further increase their outputs by
undertaking their opportunities and proper usage of their resources by allocating
their inputs proportionally. Results show that WADAC should mimic the
practices of CDFC and ADC; BJDAFCO and TADAFCO should follow CDFC,
ADC, and RIDAFCO; and CADAFCO should also follow CDFC, MDC and
RIDAFCO to operate efficiently within the FEDDAFC. Given that these
inefficient cooperatives will implement these changes, their outputs will
increase from 11 to 37 percent.
[1] A research paper in ABE 134: Applied Linear Programming for Economists under Prof.
Jon Marx Sarmiento, Second Semester of Academic Year 2014-2015
2
INTRODUCTION
BACKGROUND OF THE STUDY
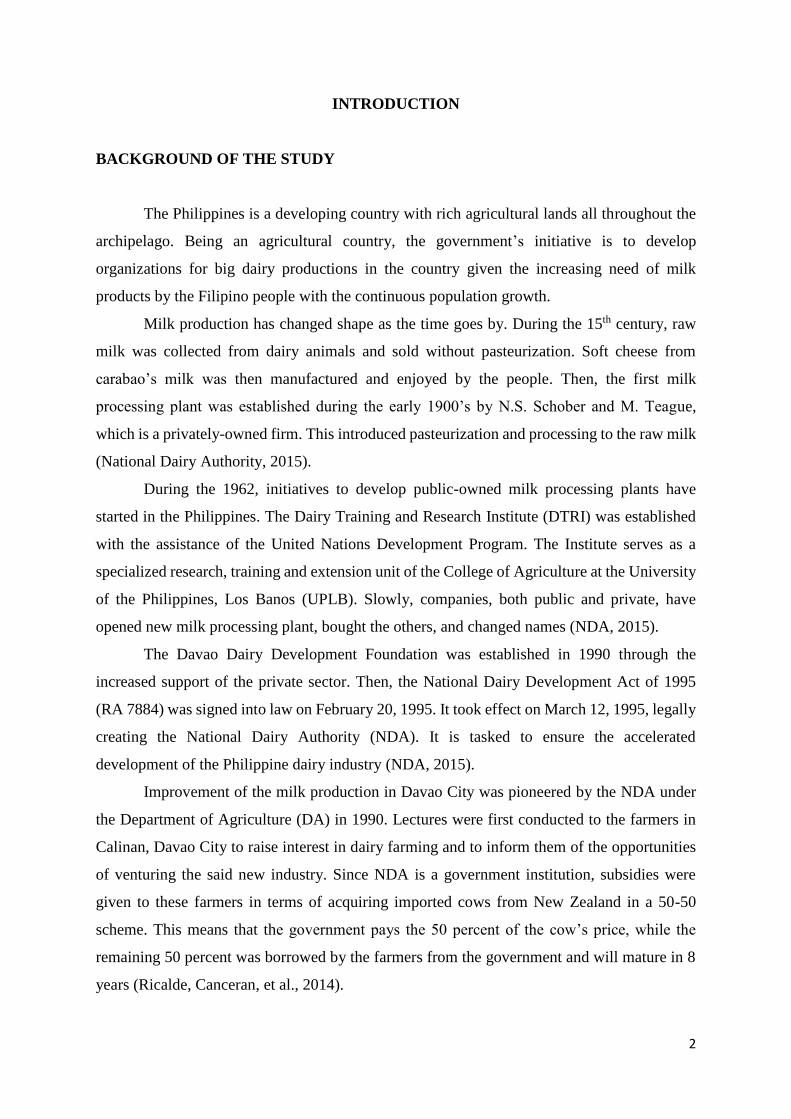
The Philippines is a developing country with rich agricultural lands all throughout the
archipelago. Being an agricultural country, the government’s initiative is to develop
organizations for big dairy productions in the country given the increasing need of milk
products by the Filipino people with the continuous population growth.
Milk production has changed shape as the time goes by. During the 15th century, raw
milk was collected from dairy animals and sold without pasteurization. Soft cheese from
carabao’s milk was then manufactured and enjoyed by the people. Then, the first milk
processing plant was established during the early 1900’s by N.S. Schober and M. Teague,
which is a privately-owned firm. This introduced pasteurization and processing to the raw milk
(National Dairy Authority, 2015).
During the 1962, initiatives to develop public-owned milk processing plants have
started in the Philippines. The Dairy Training and Research Institute (DTRI) was established
with the assistance of the United Nations Development Program. The Institute serves as a
specialized research, training and extension unit of the College of Agriculture at the University
of the Philippines, Los Banos (UPLB). Slowly, companies, both public and private, have
opened new milk processing plant, bought the others, and changed names (NDA, 2015).
The Davao Dairy Development Foundation was established in 1990 through the
increased support of the private sector. Then, the National Dairy Development Act of 1995
(RA 7884) was signed into law on February 20, 1995. It took effect on March 12, 1995, legally
creating the National Dairy Authority (NDA). It is tasked to ensure the accelerated
development of the Philippine dairy industry (NDA, 2015).
Improvement of the milk production in Davao City was pioneered by the NDA under
the Department of Agriculture (DA) in 1990. Lectures were first conducted to the farmers in
Calinan, Davao City to raise interest in dairy farming and to inform them of the opportunities
of venturing the said new industry. Since NDA is a government institution, subsidies were
given to these farmers in terms of acquiring imported cows from New Zealand in a 50-50
scheme. This means that the government pays the 50 percent of the cow’s price, while the
remaining 50 percent was borrowed by the farmers from the government and will mature in 8
years (Ricalde, Canceran, et al., 2014).

3
The Federation of Davao Dairy Farmers Cooperative (FEDDAFC) is a secondary
cooperative located at Barangay Malagos, Baguio District. It started out as a single cooperative
known as the Wangan Dairy Cooperative (WADAC) located at Barangay Wangan, Calinan
District, in 1990. WADAC initially had 25 members and 75 cows (human-cow ratio was 1:3).
The NDA helped the farmers in establishing the cooperative through providing them seminars
and workshops that supplemented their knowledge in managing the herd and basic treatments
for few animal diseases. The Philippines-Australia Community Assistance Program (PACAP)
also helped the cooperative through its technical assistance, dairy cow management and loan
services. In addition, the Dairy Development Foundation of the Philippines (DDFI) also offered
dispersal program to the cooperative. The availability of the dispersal is achieved after a series
of trainings offered by the DDFPI and PACAP, which includes organizational training,
technical training, and leadership training to be applied in the cooperative (Oracion, Estacio, et
al., 2013).
FEDDAFC then expanded to 3 other members namely: the Calinan Dairy Farmers
Cooperative (CDFC) in Barangay Calinan Poblacion, Calinan District; Malagos Dairy
Cooperative (MDC) in Barangay Malagos, Baguio District; and the Riverside Dairy Farmers
Cooperative (RIDAFCO) in Barangay Riverside, Calinan District. Since then, it has expanded
further, adding five more cooperatives: Biao-Joaquin Dairy Farmers Cooperative (BJDAFCO)
in Barangay Biao-Joaquin, Calinan District; Cadalian Dairy Farmers Cooperative
(CADAFCO) in Barangay Cadalian, Baguio District; Tacunan Dairy Farmers Cooperative
(TADAFCO) in Barangay Tacunan, Tugbok District; Aklat Dairy Cooperative (ADC) in
Barangay Tamugan, Baguio District; and Dacudao Dairy Farmers Cooperative (DDFC) in
Barangay Dacudao, Calinan District. Currently, FEDDAFC has the total of eight primary
cooperatives: CDFC, MDC, RIDAFCO, BJDAFCO, CADAFCO, TADAFCO and ADC,
eliminating the DDFC since it now merged with CDFC.
The FEDDAFC serves as the main plant wherein the cow’s milk gathered from these
different cooperatives are delivered for processing, value-adding and marketing.
STATEMENT OF THE PROBLEM
According to the Board of Investments (2011), there is an average 2% increase in the
local consumption of milk annually. Whereas, data from NDA shows that Philippine local milk
production as a whole is projected to increase in the succeeding years (Ang, 2013). There has

4
been also a consistent increase of dairy animals by 5% since 2010. However, it did not translate
to a consistent 11% increase in production. This means that even though the number of dairy
animals had increased, their milk producing capabilities have not been optimized as reflected
in the inconsistency of local production increase (Gines, n.d.).
The inefficiency of the dairy cooperatives, which are the biggest contributors to the
local production, is the main reason why the average Philippine milk production per animal (8
liters/day) remains low (Gines, n.d.). Dairy cooperatives, like the cooperatives under the
FEDDAFC, are not able to optimize the milking ability of the animals, and the usage of the
other inputs, making their outputs inconsistent. In addition to this, according to Acting Officer
In-charge of FEDDAFC, farmers inclined with the cooperatives are slowly losing interest in
the dairy milk production due to differences in the traditional and efficient way of milk
production. Figure 1 shows the irregular trend of the milk outputs of FEDDAFC (in Liters)
from January 2014 to April 2015.
Figure 1. Trend of monthly milk outputs of FEDDAFC (in Liters) from January 2014 to April 2015
SIGNIFICANCE OF THE STUDY
The results of the study have important implications in terms of adapting new practices
and techniques, eliminating technical inefficiencies, and combining proper inputs to improve
milk production of the cooperatives. Also, this study will serve as a primary step in improving
dairy milk production in the future.
0.00
5000.00
10000.00
15000.00
20000.00
25000.00
30000.00
35000.00
Jan Feb Mar Apr May Jun Jul Aug Sep Oct Nov Dec Jan Feb Mar Apr
MIL
K IN
LIT
ERS
MONTH
5
OBJECTIVES OF THE STUDY
This study aims to:
1. Measure the technical efficiency of the primary cooperatives under FEDDAFC;
2. Identify which among the cooperatives is/are the most technically efficient;
3. Identify which among the cooperatives is/are technically inefficient;
4. Examine the potential of milk production, if dairy farms could operate efficiently; and
5. Provide recommendations to improve the production of every cooperative.
SCOPE AND LIMITATIONS
This study only accounts for the output and inputs of milk production in measuring all
the efficiency indices of FEDDAFC. It does not consider other factors such as the social and
intellectual characteristics of the farmers, farm practices of each farmer, the volume of milk
rejects due to microbial count, the breed of the cow each farmer in the cooperative owns and
other factors that likely affect the efficiency of milk production. Also, other inputs like the
costs on feeds, medicines, vitamins, artificial insemination and other related inputs were not
considered due to lack of data available.
The major limitation in this study is that it only uses the non-parametric approach in
which it is conceptually difficult to separate the effects of uncontrollable environmental
variables and error measurements from the effect of differences in farm management and the
presence of outliers.
METHODOLOGY
DATA
The main material of the study consists of the data, specifically the inputs and outputs
of milk production in each primary cooperative, were gathered through personal interview with
the Acting Officer-in-charge of FEDDAFC and the Quality Management assistant of NDA –
Mindanao. All the eight (8) primary cooperative-members of FEDDAFC were considered.
Some of the dairy farmer-members per cooperative were also interviewed.

6
VARIABLES
One output and four input variables are used. These variables are listed below.
Output – average quantity of the milk in Liters produced by each primary cooperatives
that are delivered to FEDDAFC per month
Cows – number of milk-producing cattle per cooperative
Farmers – number of cooperative members that are engaged into dairy farming which
are treated as the total labor involved
Grass – approximated area of grassland in hectares per cooperative that are used to
feed the cows
Water – approximated volume of water in Liters used by the cows in liters per
cooperative per month
Data gathered were tabularized in Table 1.
Table 1. Monthly Outputs and Inputs of the primary cooperatives in FEDDAFC from January
2014 to April 2015.
Output Inputs
Milk
delivered
Cows Farmers grass Water
DMU Cooperative (in L/month) (in ha) (in L)
1 CDFC 7708 62 28 13.40 68820
2 MDC 4018 55 17 10.10 61050
3 WADAC 3908 45 26 12.80 49950
4 CADAFCO 3199 47 16 9.80 52170
5 BJDAFCO 2933 41 17 10.10 45510
6 ADC 2267 25 16 9.80 27750
7 RIDAFCO 2176 40 12 8.60 44400
8 TADAFCO 1036 34 16 9.80 37740

7
METHOD
In this study, the efficiency of the dairy cooperatives under FEDDAFC were measured
through Data Envelopment Analysis (DEA) software version 2.1 developed by Coelli (1996),
a non-parametric measurement method to measure the relative efficiency of economical
decision making units (DMUs) similar to one another in terms of goods and services they
produce. DEA uses linear programming as an efficiency measurement technique based on the
combinations of inputs and outputs that are greater than 1 (Uzmay, et al., 2009). DEA focuses
on the individual farm performance to discover the best practices in farm management. Advice
for the individual cooperatives, regarding how technical inefficiencies can be eliminated, can
be provided by identifying benchmark peers for farms of different scale (Carter, 2004). A
relative measure, the technical efficiency (TE) of a primary cooperative relative to others in the
sample, is derived. TE measures by how much each input can be reduced (or output increased)
to produce an efficient outcome. TE can be decomposed to determine the contribution of pure
technical factors (PTE) and scale efficiency (SE) to the overall level of efficiency (Fraiser,
2005).
The output-oriented DEA model is used to obtain separate estimates of TE and SE using
the Variable Returns to Scale (VRS) and Constant Returns to Scale (CRS) assumptions. This
is because the output-oriented DEA model maximizes the proportional increase in output while
remaining within the production possibility set. The proportional increase in output is obtained
when output slack is zero. This method considers the observed production relative to the
corresponding potential production, given the quantities of the inputs used (Theodoridis &
Psychoudakis, n.d,).

8
RESULTS AND DISCUSSION
In this section, the measures of technical efficiency obtained using output-oriented VRS
and CRS DEA models are discussed. The technical scores of the primary cooperatives are
reported in Table 2. Results show that the mean values of technical efficiencies under CRS and
VRS are 0.693 and 0.855. This means that on the average, the cooperatives under FEDDAFC
are relatively inefficient with a mean SE at 0.802.
Table 2. Mean Technical Efficiency of the primary cooperatives.
DMU Cooperative CRS VRS SE
1 CDFC 1.000 1.000 1.000
2 MDC 0.859 1.000 0.859
3 WADAC 0.699 0.750 0.931
4 CADAFCO 0.726 0.894 0.813
5 BJDAFCO 0.627 0.830 0.755
6 ADC 0.730 1.000 0.730
7 RIDAFCO 0.659 1.000 0.659
8 TADAFCO 0.245 0.366 0.671
Mean 0.693 0.855 0.802
Note: CRS = technical efficiency from CRS DEA
VRS = technical efficiency from VRS DEA
SE = scale efficiency = CRS / VRS
The mean TE of the cooperatives under VRS frontier at 0.855 indicates that the
cooperatives are using their resources efficiently but can further improve their opportunities by
increasing their output of milk delivery to the FEDDAFC with the same proportion of their
inputs. However, as seen in Table 2, MDC, WADAC, CADAFCO, BJDAFCO, ADC,
RIDAFCO, and TADAFCO has an SE that is less than 1 which means scale inefficiencies.
These scale inefficiencies can either be due to the cooperative is relatively smaller compared
to the other cooperatives and is operating in increasing returns to scale or the cooperative is
relatively larger and is operating in a decreasing returns to scale. Thus, the result of the study

9
show that these said cooperatives are operating in an increasing returns to scale since the
cooperatives’ SE is less than 1.
CDFC, MDC, ADC and RIDAFCO are the most efficient cooperatives among the 8
cooperatives since these four cooperatives have a TE of 1 under the VRS frontier. In line with
this, only CDFC is operating efficiently under the CRS frontier while the other 7 cooperatives
exhibits an increasing returns to scale. Moreover, only CDFC is the model cooperative among
the cooperatives operating under FEDDAFC with SE of 1. This is because CDFC has the
greatest volume of milk produced, maximizing the use of its amounts of inputs. One of the
factors for the efficiency of CDFC is the merger with DDFC.
On the other hand, it implies that MDC, WADAC, ADC, TADAFCO, RIDAFCO,
CADAFCO, and BJDAFCO can further increase their outputs by undertaking their
opportunities and proper usage of their resources. Thus, results show that WADAC should
follow the practices of CDFC and ADC; BJDAFCO of CDFC, ADC and RIDAFCO; and
CADAFCO of CDFC, MDC and RIDAFCO to operate efficiently within the FEDDAFC (See
Appendix – Summary of Peers).
Furthermore, the suggested number of inputs per cooperative that would give the
cooperatives their better output is summarized in the Table 3 below. Input slacks were observed
for WADAC for farmer and grass inputs with 3.514 and 1.054, respectively (See Appendix –
Summary of Input Slacks). This suggests that WADAC is not using its resources properly and
can still produce more with their proportion of inputs.
Table 3. Suggested number of inputs per cooperative under FEDDAFC per month.
DMU Cooperative Cows Farmers Grass
(in hectares)
Water
(in Liters)
1 CDFC 62 28 13.4 68820 2 MDC 55 17 10.10 61050 3 WADAC 45 22 11.75 49950 4 CADAFCO 47 16 9.80 52170 5 BJDAFCO 41 17 10.10 45510 6 ADC 25 16 9.80 27750 7 RIDAFCO 40 12 8.60 44400 8 TADAFCO 34 16 9.80 37740
This means that the farmer input of WADAC should be reduced by 4. Also, grass input
of the same cooperative should be reduced by 1.05 hectares. This means that WADAC is not
using these inputs efficiently and proportionally. Thus, these inputs are neglected. Therefore,

10
the right combination of inputs as shown in Table 3 (See also Appendix – Summary of Input
Targets) must be implemented in order for the FEDDAFC to operate efficiently as a whole.
Thus, if the ideal combination of inputs per cooperative is implemented, there would
be a significant increase in the outputs of WADAC by 25 percent, CADAFCO by 11 percent,
BJDAFCO by 17 percent, and TADAFCO by 37 percent as shown in Table 4. Hence, making
these inefficient firms operate efficiently.
Table 4. The difference between the ideal and actual outputs of milk per liter per cooperative.
DMU Cooperative Ideal
Output (IO)
Actual Output
(RO)
Difference of
IO and AO
Percentage
Increase
1 CDFC 7708.29 7708.29 0 0
2 MDC 4018.99 4018.99 0 0
3 WADAC 5208.63 3908.01 1300.62 25
4 CADAFCO 3580.45 3199.63 380.82 11
5 BJDAFCO 3535.03 2933.78 601.25 17
6 ADC 2267.86 2267.86 0 0
7 RIDAFCO 2176.49 2176.49 0 0
8 TADAFCO 2834.90 1036.54 1798.36 37
The TE estimated for the CRS and VRS, which are 0.693 and 0.855 is consistent with
the theory that VRS frontier is more flexible and captures the data in a more well-rounded way
than of the CRS. The mean TE of the cooperatives under the FEDDAFC indicates that the
cooperatives are relatively inefficient. Only CDFC is fully technically efficient under CRS
while CDFC, MDC, ADC, and RIDAFCO are fully technically efficient under VRS.

11
SUMMARY AND CONCLUSION
Due to the decreasing number of farmers engaging in milk production under the
FEDDAFC and with the increasing demand of milk in Davao City, there is a threat that the
proceeding supply of milk can no longer meet the increasing demand of the consumers. Thus,
FEDDAFC is faced with the dilemma of finding the solution for this problem. As the main
producers of milk under FEDDAFC, the eight member cooperatives, CFDC, MDC, WADAC,
ADC, TADAFCO, RIDAFCO, CADAFCO, and BJDAFCO were subjected to output-oriented
VRS DEA to assess whether they are operating efficiently or not and as to suggest the ideal
output per cooperative given their respective inputs.
Results show that FEDDAFC is currently operating inefficiently with a mean technical
efficiency under VRS of 0.855. However, there is still an opportunity wherein it could operate
efficiently since the inefficient firms exhibits an increasing returns to scale. In addition, CFDC
is the model cooperative among the 8 cooperatives under FEDDAFC with a scale efficiency of
1, while CFDC, MDC, ADC, and RIDAFCO are operating efficiently relative to the other 4
cooperatives under the VRS frontier.
Thus, the results of the study also show that WADAC should follow the practices of
CDFC and ADC; BJDAFCO and TADAFCO of CDFC, ADC and RIDAFCO; and CADAFCO
of CDFC, MDC and RIDAFCO to operate efficiently leading to an increase of their outputs of
milk delivered to the FEDDAFC plant.
Moreover, if the above changes are to be implemented, the increase in the outputs of
the 4 inefficient cooperatives will range from 11 to 37 percent. These changes in the outputs of
the cooperatives will surely benefit not only FEDDAFC but also the milk products and by-
products consumers in Davao City.

12
RECOMMENDATIONS
Based on the results of the study, the MDC, WADAC, ADC, TADAFCO, RIDAFCO,
CADAFCO, and BJDAFCO should produce more outputs of milk per liter delivered to the
FEDDAFC since these cooperatives inhibits increasing returns to scale with the same
proportion of their inputs. Also, WADAC should follow the outputs of CDFC and ADC,
BJDAFCO should follow the outputs of CDFC, ADC, and RIDAFCO, and CADAFCO should
follow the outputs of CDFC, MDC, and RIDAFCO to be technically efficient under the
FEDDAFC.
The increasing demand for fresh cow’s milk and the inefficiency of the individual
cooperatives show that more actions and efforts should be exerted in order to support the
cooperatives to be efficient. NDA should provide more assistance through imposing policies
and giving advices to the farmers regarding proper farm management and allocation of inputs.
An effective plan that involves exponentially increasing the number of small scale farmers and
cooperatives is needed to increase the production sufficiency ratio. Increasing the physical
number of dairy animals and the per head milk productivity through breeding and selection
will also play a part. Encouraging more farmers to engage into dairy farming should also be
done. Conducting more research is also necessary to further analyze the situation and provide
solutions and recommendations for the betterment of the dairy industry.
On the other hand, the dairy farmers of the eight member cooperatives under
FEDDAFC, should allow the NDA and other institutions to intervene with them through
embracing the policies, programs and advices being introduced to them. As cited by Gines
(n.d.), Stanton, E. & Stanton, S. (2011) said that efforts of the government to create projects
and campaigns for the betterment of the dairy industry have been put to waste. It is either
because of the facilitating agencies have not been concentrating in fully spreading, teaching
and implementing these practices; or because of the dairy farmers who are still sticking to their
traditional practices. Further studies and series of trials were done before these policies and
courses are introduced. Institutions like the NDA are there to provide assistance and support.
Unfortunately, mostly of the dairy farmers are not willing to adopt to some of the
recommendations because they still stick to their own traditional practices.
For future researchers, qualitative data such as the farm practices of each cooperative,
age bracket and educational background of the farmers, etc. should be considered in assessing
the technical efficiency of the cooperatives. Other inputs, like the amount of feeds, cow breeds,
volume of milk rejects due to microbial count, etc. should also be used to come up with better

13
results and conclusion. Moreover, allocative and cost efficiencies of each cooperative can also
be derived through getting the costs of each inputs used. Future researchers can also use other
methods, such as the parametric Stochastic Frontier Approach (SFA), which is a more reliable
method in agricultural applications because it can measure the error, missing variables and
weather that are likely to play a significant role in agriculture (Coelli, 1995), to compare with
the results of this study. For the efficiency of FEDDAFC as a whole, future researchers are also
recommended to take into account the privately-owned dairy farms, other than the cooperatives
involved in this study, that also contribute to the milk supply of FEDDAFC.

14
REFERENCES
Ang, P. (2013). Philippine dairy and products annual situation and outlook. USDA Foreign
Agricultural Service Global Agricultural Information Report.
Board of Investments. (2011). Philippine Dairy Industry. Retrieved May 2015.
Carter, A. (2004). Investigating technical and scale efficiency of dairy farms in south-western
Victoria: a non-parametric approach.
Coelli T.J. (1995). Recent Developments in Frontier Modelling and Efficiency Measurement,
Australian Journal of Agricultural Economics 39: 219-245.
Coelli, T. (1996). A Guide to DEAP Version 2.1: A data envelopment analysis computer
program. CEPA Working Paper 96/08, Centre for Efficiency and Productivity
Analysis. University of New England.
Fraiser, I. & Graham, M. (2005). Efficiency measurement of Australian dairy farms: national
and regional performance. Australasian Agribusiness Review, 13 (ISSN 1442-6951)
University of Melbourne. Retrieved May 2015 from
http://www.agrifood.info/review/2005/Fraser_Graham.html
Gines, K.A. (n.d.). The dairy industry: a chemical process industry report. Retrieved May
2015 from https://www.academia.edu/11996734/The_Dairy_Industry_A_Chemical_
Process_Industry_Report_with_focus_on_drinking_milk_cheese_and_ice_cream
National Dairy Authority (2015). Retrieved May 2015 from http://gwhs
stg01.i.gov.ph/~ndagovph/index.php?option=com_content&view=article&id=51&Ite
mid=211&lang=en
Oracion, A.M., Estacio, E.M., et al. (2013). Supply chain of milk bar. ABE 102 term paper
class of 2012-2013, University of the Philippines Mindanao.
Ricalde, R.G.J., Canceran, D.C., et al. (2014). Analysis on the supply chain of milk in davao city.
Retrieved May 2015 from
https://www.academia.edu/12406492/Analysis_on_the_Supply_Chain_of_Milk_in_Dava
o_City
Theodoridis, A.M. & Psychoudakis, A. (n.d,). Efficiency measurement in Greek dairy farms:
stochastic frontier vs. data envelopment analysis. International Journal of Economic
Sciences and Applied Research 1 (2): 53-6.

15
Uzmay, A., Koyunbenbe, N., et al. (2009). Measurement of efficiency using data
envelopment analysis (DEA) and social factors affecting the technical efficiency in
dairy cattle farms within the province of Izmir, Turkey. Journal of Animal and
Veterinary Advances 8 (6): 1110-1115, 2009.

16
APPENDIX
Results from DEAP Version 2.1
Instruction file = f-ins.txt
Data file = f-dta.txt
Output orientated DEA
Scale assumption: VRS
Slacks calculated using multi-stage method
SUMMARY OF OUTPUT SLACKS:
firm output: 1
1 0.000
2 0.000
3 0.000
4 0.000
5 0.000
6 0.000
7 0.000
8 0.000
mean 0.000
SUMMARY OF INPUT SLACKS:
firm input: 1 2 3 4
1 0.000 0.000 0.000 0.000
2 0.000 0.000 0.000 0.000
3 0.000 3.514 1.054 0.000
4 0.000 0.000 0.000 0.000
5 0.000 0.000 0.000 0.000
6 0.000 0.000 0.000 0.000
7 0.000 0.000 0.000 0.000
8 0.000 0.000 0.000 0.000
mean 0.000 0.439 0.132 0.000
SUMMARY OF PEERS:
firm peers:
1 1
2 2
3 1 6
4 1 7 2
5 1 7 6
6 6
7 7
8 1 6 7
SUMMARY OF PEER WEIGHTS:
(in same order as above)
firm peer weights:
1 1.000
2 1.000
3 0.541 0.459
4 0.192 0.623 0.185
5 0.241 0.473 0.287
6 1.000
7 1.000
8 0.110 0.561 0.329
PEER COUNT SUMMARY:
(i.e., no. times each firm is a peer for another)
firm peer count:
1 4
2 1
3 0
4 0
5 0
6 3
7 3
8 0
SUMMARY OF OUTPUT TARGETS:
firm output: 1
1 7708.290
2 4018.990
3 5208.633
4 3580.452
5 3535.030
6 2267.860
7 2176.490
8 2834.895
SUMMARY OF INPUT TARGETS:
firm input: 1 2 3 4
1 62.000 28.000 13.400 68820.000
2 55.000 17.000 10.100 61050.000
3 45.000 22.486 11.746 49950.000
4 47.000 16.000 9.800 52170.000
5 41.000 17.000 10.100 45510.000
6 25.000 16.000 9.800 27750.000
7 40.000 12.000 8.600 44400.000
8 34.000 16.000 9.800 37740.000